Central Alberta Tourism Alliance Accommodation Study
137
CENTRAL ALBERTA TOURISM ALLIANCE ACCOMMODATION STUDY: FINAL REPORT CBRE File No.:17-APPRHOTELS-0133 Date: January 31, 2018 Prepared for: Ms. Liz Taylor, Executive Director Tourism Red Deer, Alberta Email: [email protected]
-
Upload
khangminh22 -
Category
Documents
-
view
0 -
download
0
Transcript of Central Alberta Tourism Alliance Accommodation Study

CENTRAL ALBERTA TOURISM ALLIANCE ACCOMMODATION STUDY: FINAL REPORT CBRE File No.:17-APPRHOTELS-0133 Date: January 31, 2018
Prepared for: Ms. Liz Taylor, Executive Director Tourism Red Deer, Alberta Email: [email protected]

CBRE Valuation & Advisory Services CBRE Tourism & Leisure Group
CBRE Limited Valuation & Advisory Services
145 King St. W. Suite 1100 Toronto, ON, M5H 1J8
416.362.2244 Tel 416.362.8085 Fax
www.cbre.ca CBRE File No. : 17-APPRHOTELS-0133
January 31, 2018 Ms. Liz Taylor, Executive Director Tourism Red Deer, Alberta Email: [email protected] RE: Central Alberta Tourism Alliance Accommodation Study – Final Report
Dear Ms. Taylor,
In accordance with the terms of our engagement, CBRE Limited is pleased to submit our Final Report in conjunction with an Accommodation Study for the Central Alberta Tourism Alliance.
The report, in its entirety, including all assumptions and limiting conditions, is an integral part of, and inseparable from, this letter. The intended use and user of our report are specifically identified in our report as agreed upon in our contract for services and/or reliance language found in the report. No other use or user of the report is permitted by any other party for any other purpose. Dissemination of this report by any party to non-client, non-intended users does not extend reliance to any other party and CBRE will not be responsible for unauthorized use of the report, its conclusions or contents used partially or in its entirety.
It has been a pleasure to assist you in this assignment. If you have any questions concerning the analysis, or if CBRE can be of further service, please contact us.
Respectfully submitted,
Fran Hohol, CMC Rebecca Godfrey, CMC, MBA Senior Director Director CBRE Tourism & Leisure Group CBRE Tourism & Leisure Group Valuation & Advisory Services Valuation & Advisory Services Phone: 647-943-3743 Phone: 647-943-3744 Email: [email protected] Email: [email protected]


Table of Contents
Introduction ........................................................................................... 1 Study Purpose 1 Study Tasks 2 Limiting Conditions 5
Defining the Central Alberta Region .......................................................... 6 Provincial Market and Economic Overview 7 Central Alberta Region Market and Economic Overview 9 Central Alberta Region Community Profiles 14 Summary & Implications 21
Defining the Visitor Markets for the Central Alberta Region ........................ 22 Central Alberta Resident & Visitor Market Profile 23
Central Alberta Fixed Roof Accommodation Market Analysis ...................... 36 Introduction on Property Types/Classifications of Markets 37 Measuring Accommodation Performance 38 Provincial Market Performance and Trends 39 Regional Competitive Supply & Historic Market Performance 41 Regional Competitive Supply & Historic Market Performance by County 46 Projected Market Performance 66 Strategic Implications 71
Central Alberta Non-Fixed Roof Accommodation Market Analysis .............. 73 Introduction on Property Types/Classifications of Markets 74 Provincial Market Performance 74 Regional Competitive Campground Supply & Market Performance 78 Strategic Implications 102
Central Alberta Accommodation Strategic Framework ............................. 104 Introduction 105 Strategic Context 105 Action Plan by Objective and Accommodation Grouping 107
ADDENDUM “A” ...................................................................................... PRIZM5 Target Group Maps i
ADDENDUM “B” ...................................................................................... Assumptions and Limiting Conditions i
Introduction
Cen
tra
l A
lber
ta T
ou
rism
Alli
an
ce A
cco
mm
od
atio
n S
tud
y


Tourism Red Deer Date: January 31, 2018
CENTRAL ALBERTA TOURISM ALLIANCE ACCOMMODATION STUDY
1
VALUATION & ADVISORY SERVICES
Study Background
In 2014, a Steering Committee comprised of various community leaders was established to determine how to best develop, market and manage Central Alberta as a distinct tourist destination. This group, which became known as the Central Alberta Tourism Alliance, completed a Destination Management Plan (DMP) in 2015 that identified a business case for enhancing the tourism capacity of the region. The DMP defines the region’s selling proposition as follows: “Central Alberta brings together all of the diverse experiences for which Alberta is known, within a region that is unspoiled, uncrowded, welcoming and ready to be explored.”
Upon completion, the DMP identified 120 initiatives and 10 key strategies for the Central Alberta Tourism Alliance to undertake in the next 5 to 10 years. One of the key strategies was to “Provide the Right Mix of Places to Stay in the Right Locations”, which the subject study was initiated to address. Some of the primary concerns that the Alliance identified were the fact that the Region’s campgrounds are approaching capacity in the peak summer months, with a lack of supply to accommodate winter camping in the West County, and that increased or enhanced fixed roof accommodations might help to extend visitation year-round, particularly given concerns with declining demand from traditional corporate markets.
The prolonged downturn in prices in the energy sector has substantially reinforced the need for the Province to diversify its economic base. Currently the accommodation sector is faced with the same challenge. Corporate demand aside, much of the leisure, meeting/conference and government demand for hotels has been tied back to the oil and gas sector. Central Alberta has not traditionally pursued the tourist market in to the same extent as other Alberta markets, such as Calgary, Edmonton and the resort areas. As such, it will be important to develop an accommodation strategy that considers opportunities to drive tourist demand, diversification of corporate activity, and meetings and conferences.
The Central Alberta Tourism Alliance retained the services of CBRE’s Tourism & Leisure Group to not only address opportunities for new development and opportunities to enhance existing facilities to balance identified supply/demand issues, but also to educate both operators and public-sector partners about the accommodation market and how to best meet market expectations.
Study Purpose The purpose of the subject study is to assess the opportunity of enhancing existing facilities and developing new fixed roof and non-fixed roof accommodations, which have the potential to strengthen Central Alberta’s position as a significant year-round tourism destination and prime location for small business events in the next 10 to 15 years. The Study Objectives include:
• To assess the existing supply – existing accommodation supply and proposed new supply in each community;
• To analyse current demand – existing levels and patterns of demand in the region;
• To project future demand – based on tourism trends and existing/proposed tourism product in the region;

2 CENTRAL ALBERTA TOURISM ALLIANCE ACCOMMODATION STUDY
Tourism Red Deer Date: January 31, 2018
VALUATION & ADVISORY SERVICES
• To project future supply requirements – identification of accommodation requirements based on existing supply and future demand for fixed roof accommodations only in relevant partner communities;
• To identify development opportunities – for fixed roof accommodations only based on future supply
requirements at the community level (not site-specific); and
• To develop a strategic implementation plan – including the roles and requirements of partner municipalities and other catalyst organizations in moving forward with the strategic plan.
Study Tasks The subject study has been split into two phases, as follows:
• Phase 1: Market Analysis and Identification of Accommodation Sector Enhancements • Phase 2: Strategic Plan Development
In meeting the study objectives, CBRE has completed the following tasks:
• Met with the CATA Steering Committee to discuss regional market opportunities, sources of overnight demand for accommodations, potential development locations and/or sites for accommodations, and expected study outcomes;
• Undertook extensive stakeholder engagement in each of the 11 partner communities within the Central Alberta region, as summarized in the following chart:
STAKEHOLDER DISCUSSION LIST
Community Type Company / Organization Contact Name Date Interviewed
Blackfalds Developer Elkay Developments Rick Friesen 16-Aug-17, 1-Dec-17
Attraction Operator Abbey Centre Rick Kreklewich 24-Aug-17
Major Employer Eagle Builders Jesse Hawiuk 03-Aug-17
Economic Development Town of Blackfalds Jennifer Hartigh 19-Jul-17, 1-Nov-17
Non-Fixed Roof Accommodation Burbank Park Campground Jen Oster 29-Aug-17
City of Lacombe
Attraction Operator Lacombe & District Historical Society (Museums in Lacombe); City of Lacombe
Jennifer Kirchner 15-Aug-17
Economic Development City of Lacombe Guy Lapointe 22-Aug-17, 10-Nov-17
DMO Lacombe Regional Tourism Marie Peron 20-Jul-17, 8-Nov-17
Local Government City of Lacombe Recreation Dept Calvin Bennefield 20-Jul-17
Fixed Roof Accommodation Lacombe Best Western Plus Inn & Suites
Jacquie Corkery 20-Jul-17
Fixed Roof Accommodation Greenway Inn Tammy N/A 07-Sep-17
Innisfail Economic Development Innisfail Amy McMurtrie 21-Jul-17, 2-Nov-17
Attraction Operator / Councillor Discovery Wildlife Centre Town of Innisfail
Doug Bos 21-Jul-17
Economic Development Innisfail Stuart Fullarton 2-Nov-17

Tourism Red Deer Date: January 31, 2018
CENTRAL ALBERTA TOURISM ALLIANCE ACCOMMODATION STUDY
3
VALUATION & ADVISORY SERVICES
Community Type Company / Organization Contact Name Date Interviewed
Lacombe County
Local Government Lacombe County Tim Timmons 28-Aug-17
Local Government Lacombe County Dale Freitag 31-Jul-17
Local Government Lacombe County Nicole Plewis 8-Nov-17
Non-Fixed Roof Accommodation Watipi Campground Susanne Kuhnen 22-Aug-17
Non-Fixed Roof Accommodation Aspen Beach Provincial Park Campground
Ron Heaslip 03-Aug-17
Non-Fixed Roof Accommodation Sunset Legion Campground Carol Teeves 29-Aug-17
Non-Fixed Roof Accommodation Summerland Leisure Park Lynn Henkel 21-Jul-17
Attraction Operator Kraay Family Farm Rachel Kraay 27-Jul-17
Mountain View County
Non-Fixed Roof Accommodation Water Valley Campground Scott Davies 23-Aug-17
Fixed Roof Accommodation Back to Nature Retreat Stan Masters 01-Aug-17
Non-Fixed Roof Accommodation Schott's Lake Campground Kimberly Verkerk 29-Aug-17
Non-Fixed Roof Accommodation Anderson Ranch Riding and Campground
Louis Anderson 29-Aug-17
Economic Development Mountain View County Adena Malyk 21-Jul-17
Local Government Mountain View County Maureen Easton 3-Nov-17
Olds Fixed Roof Accommodation Pomeroy Inn & Suites @ Olds College
Doug Parcells 09-Aug-17
Fixed Roof Accommodation Campus Housing Olds College (CHOC)
Tanya Kure 28-Aug-17
Educational Institution Tourism & Hospitality Instructor Bob Van Someren
09-Aug-17
Sport Tourism Olds College Trina Radcliffe 08-Aug-17
Economic Development Olds Institute for Community & Regional Development
Mitch Thomson 21-Jul-17, 3-Nov-17
Local Government Town of Olds Doug Wagstaff 3-Nov-17
Local Government Town of Olds Michael Merritt 3-Nov-17
Local Government Town of Olds Larry Wright 3-Nov-17
City of Red Deer
DMO Tourism Red Deer Liz Taylor 19-Jul-17, 7-Nov-17
Local Government City of Red Deer Deb Comfort 26-Jul-17
Economic Development City of Red Deer Michelle Zeggil 19-Jul-17
Accommodations Black Knight Inn Ken Mandrusiak 19-Jul-17
Non-Fixed Roof Accommodation Lions Campground and Westerner Campground
Chris Demers 19-Jul-17
Red Deer County
Accommodations Hampton Inn & Suites Barry Lewis 23-Aug-17
Airport Red Deer Regional Airport Graham Ingham 23-Aug-17
Economic Development Red Deer County Sandra Badry 03-Aug-17, 7-Nov-17
Rocky Mountain House / Clearwater County
Attraction Operator Rocky Mountain House National Historic Site
Melissa Reis 14-Aug-17
Local Government Clearwater County Matt Martinson 22-Aug-17
Local Government Clearwater County Jerry Pratt 20-Jul-17, 3-Nov-17
Tour Outfitters Rocky River Rats Chris Melanson 23-Aug-17
Fixed Roof Accommodation Canalta Hotels Jolene Hallock 21-Aug-17
Fixed Roof Accommodation Walking Eagle Inn and Lodge Colleen Dwyer 20-Jul-17
Fixed Roof Accommodation Best Western Rocky Mountain House Inn & Suites
Cindy French 20-Jul-17

4 CENTRAL ALBERTA TOURISM ALLIANCE ACCOMMODATION STUDY
Tourism Red Deer Date: January 31, 2018
VALUATION & ADVISORY SERVICES
Community Type Company / Organization Contact Name Date Interviewed
Fixed Roof Accommodation New Old Town Cottages Audrey Williams 20-Jul-17
Non-Fixed Roof Accommodation Riverview Campground Johan Feddema 14-Aug-17
Non-Fixed Roof Accommodation Wilderness Village Ron Webster 21-Aug-17
Non-Fixed Roof Accommodation Cow Lake Recreation Area Eana S 29-Aug-17
Economic Development Town of Rocky Mountain House Dean Schweder 20-Jul-17, 8-Nov-17
Sylvan Lake
Fixed Roof Accommodation Best Western Plus / Chateau Suites (BECA International)
Bert Messier 24-Aug-17
Fixed Roof Accommodation Comfort Inn Soo Jung 01-Aug-17
Non-Fixed Roof Accommodation Meadowlands Golf Course & RV Park
Joel Johannson 10-Aug-17
Local Government Town of Sylvan Lake Vicki Kurz 20-Jul-17, 6-Nov-17
Provincial / Regional
Land Manager ESRD - Lands in Rocky Mountain House
Don Livingston 17-Aug-17
PMO Travel Alberta Lisa Lima 27-Jul-17
Land management Alberta Culture and Tourism Paul Radchenko 24-Jul-17, 7-Dec-17
Clearwater County Camping Alberta Parks Phil Hotter 27-Jul-17
Tourism Research and Evaluation Alberta Culture and Tourism Emily Wang 13-Jul-17, 7-Dec-17
• Reviewed background materials provided by the Alliance to identify regional economic and tourism-related trends and their impact on various segments of accommodation demand, how demand for fixed roof and non-fixed roof accommodations may change in future, and the needs of various market segments;
• Researched the current and projected size of the Central Alberta Region’s potential visitor market, with consideration given to the local resident and visitor markets within a 90-minute drive time radius;
• Identified the top PRIZM5 clusters that would be most interested in camping and other related overnight experiences in Central Alberta, and analyzed this group based on geographic origin for key visitor markets to the region;
• Finalized an inventory of fixed and non-fixed roof accommodations in the Central Alberta Region through reviewing the database provided by the Steering Committee and making updates based on stakeholder input, CBRE Hotels’ internal proprietary accommodation industry database and additional research where necessary;
• Undertook a historic overview of the fixed roof accommodation sector, including an analysis of historic operating performance and year-to-date 2017 results in each of the 11 partner communities;
• Prepared an analysis of historic utilization of non-fixed roof accommodations, including average occupancy rates, average per night rates for sites and market and geographic segmentation;
• Identified relevant tourism trends and demand factors impacting overnight demand in each of the 11 partner communities, as well as potential areas/concepts for new accommodation supply and opportunities for existing accommodation supply enhancements in the Central Alberta Region;
• Prepared market projections for the fixed roof accommodation sector, based on expected changes in supply of fixed roof accommodation facilities for each relevant partner community, and projected demand expressed in terms of occupied room nights, as well as Average Daily Rate (ADR) for the next five years.
Tourism Red Deer Date: January 31, 2018
CENTRAL ALBERTA TOURISM ALLIANCE ACCOMMODATION STUDY
5
VALUATION & ADVISORY SERVICES
• Analyzed the top 10 PRIZM5 clusters in each of the 7 target market locations for Central Alberta, and incorporated findings into the 5-year strategic framework;
• Consolidated our findings relative to accommodation market enhancements in each partner community, and developed a 5-year strategic framework, inclusive of action items, roles and responsibilities, and timing; and
• Documented study research, findings and conclusions into the subject Final Report
Limiting Conditions
The report is subject to the Assumptions and Limiting Conditions contained in Addendum “B”, in addition to specific assumptions, which may be stated in the body of the report.

Defining the Central Alberta Region
Cen
tra
l A
lber
ta T
ou
rism
Alli
an
ce A
cco
mm
od
atio
n S
tud
y

Tourism Red Deer Date: January 31, 2018
CENTRAL ALBERTA TOURISM ALLIANCE ACCOMMODATION STUDY
7
VALUATION & ADVISORY SERVICES
Provincial Market and Economic Overview
As Canada’s fourth-largest province, Alberta covers an area of 661,100 square kilometres. The Province features natural beauty from the Rocky Mountains in the west and forests in the north, to the central parkland and southern prairies. With approximately 1,900 hours of sunshine in the north and 2,300 hours in the south per year, Alberta has been deemed Canada’s sunniest province.
Located in the centre of the province, Edmonton is the provincial capital, while Calgary is the largest city. Approximately one-third of Alberta’s population resides in Edmonton and the surrounding area, one-third lives in Calgary and the remaining third resides in other areas of the province.
Alberta’s demographic profile is summarized below.
Alberta Economic Profile
Demographics
Population 2016 Estimate
% of Canadian Total
% Change 2011-2016
Average Annual Growth Rate
2011-2016 4,297,547 11.86% 13.40% 2.68%
Household Income – 2016 Average
% Above/Below National Average
Total Income 2016 Estimate
% Canadian Total
Per Capita
Hhlds. $100,000+
34.00% Above $207,517,939,000 15.03% $48,288 45.10%
Household Spending – 2016 Average
% Above/Below National Average
Total Household Spending 2016 Estimate
% Canadian Total
Per Capita
Per Household
19.10% Above $212,989,174,973 13.36% $49,561 $130,829 Source: Sitewise, 2016
• Alberta was home to almost 4.3 million residents in 2016, achieving 13.4% growth over 2011 levels and accounting for 11.9% of the Canadian population.
• Alberta residents made up approximately 1.6 million “households” and 1.1 million “families,” equating to 3.1 persons per household in 2016.
• The average household income of Alberta residents was about $127,500 in 2016, an amount 34% above the national average. Average household spending was $130,800, approximately 19% above the national average.
• The provincial population is projected to reach 4.7 million residents by 2021, an increase of 9.4% over 2016 levels.

8 CENTRAL ALBERTA TOURISM ALLIANCE ACCOMMODATION STUDY
Tourism Red Deer Date: January 31, 2018
VALUATION & ADVISORY SERVICES
Economic Overview
Notable highlights regarding Alberta’s economic environment are provided below and have been sourced from The Conference Board of Canada’s Autumn 2017 Metropolitan Outlook report:
• Alberta’s economy is set to rebound and is forecast to be the fastest-growing province this year with growth of 4.4% in GDP in 2017. The main drivers of economic growth will be the continued strength in household spending and a return to growth in the energy sector. However, this torrid pace of Alberta’s recovery is not expected to continue as low oil prices will limit growth in 2018 to 1.8%.
• Drilling and production in the oil sands ramped up as investments made prior to the 2015 recession started to come online. The increased activity will lead to a 5.0% growth in real exports and contribute to the strong economic performance in 2017. However, competition from U.S. shale producers and growing global oil inventories will keep oil prices low, discouraging new large-scale investments.
• Barring any political interventions, energy pipeline investments in Alberta are expected to grow over the next few years, despite oil prices struggling to consistently remain above the US$50/barrel mark. With $15 billion invested in the Kinder Morgan Trans Mountain, Keystone XL, and Enbridge Line 3 projects, total non-residential investment is projected to increase by 6.7% in 2018.
• As Alberta begins on their road to recovery, employment is expected to grow by over 22,000 jobs in 2017 with the unemployment rate decreasing to 7.9%. However, the public sector will account for over 90% of these new jobs.
• Afterwards, the employment trend is expected to shift with 27,000 predominately private sector jobs created in 2018 and the unemployment rate steadily falling to 5.6% through 2021.
• Household spending in Alberta leads all other provinces by a wide margin and is expected to increase by 3.8% in 2017. Consumers have begun to make large purchases again in 2017 after holding off during the recession, and have also begun to replace damaged goods/facilities from the 2016 Fort McMurray wildfires.
The worst of the recession is likely over in Alberta, however the long and slow recovery process has only begun in 2017.
Economic Indicators - Alberta
2014 2015 2016 2017F 2018F 2019F 2020F 2021F
Real GDP Growth at Market Prices ($2007 millions) $311,083 $299,603 $288,882 $301,467 $307,014 $312,378 $318,821 $325,514
Annual Growth (%) 4.9% -3.7% -3.6% 4.4% 1.8% 1.7% 2.1% 2.1%
Total Employment (000s) 2,273 2,301 2,265 2,288 2,315 2,332 2,362 2,394
Annual Growth (%) 2.2% 1.2% -1.6% 1.0% 1.2% 0.7% 1.3% 1.4%
Unemployment Rate (%) 4.7% 6.0% 8.1% 7.9% 6.9% 6.5% 6.0% 5.6%
Personal Income per Capita ($) $56,503 $57,298 $56,068 $56,233 $57,382 $58,358 $59,730 $61,315
Population (000s) 4,092 4,172 4,243 4,303 4,377 4,456 4,535 4,611
Annual Growth (%) 2.8% 2.0% 1.7% 1.4% 1.7% 1.8% 1.8% 1.7%
Retail Sales ($ millions) $79,147 $76,019 $75,110 $80,962 $82,803 $84,369 $86,645 $89,023
Annual Growth (%) 7.9% -4.0% -1.2% 7.8% 2.3% 1.9% 2.7% 2.7%
CPI Annual Growth (%) 2.6% 1.2% 1.1% 2.0% 2.2% 2.3% 2.0% 2.1%
F = Forecast data.
Source: The Conference Board of Canada, Metropolitan Outlook I, Autumn 2017

Tourism Red Deer Date: January 31, 2018
CENTRAL ALBERTA TOURISM ALLIANCE ACCOMMODATION STUDY
9
VALUATION & ADVISORY SERVICES
Tourism Overview
In Fall 2017, the Conference Board of Canada released the most recent Travel Market Outlooks for the 2017 to 2021 period. The projections for Alberta are summarized below.
• Alberta’s economy started to recover in 2017, with expected growth in pleasure travel bolstered by free national park entry and high-profile sporting events taking place such as the Canadian Synchronized Figure Skating Championships. In 2017, domestic pleasure travel grew by 3.9%, while total overnight visits grew by 3.6%.
• Tourist activity in Alberta over the medium term is also expected to be positive, benefitting from new hotel inventory and the hosting of the Volleyball Canada Championships in Edmonton in 2018. This event will be Canada’s largest celebration of indoor volleyball to date, with more than 10,000 participants, along with coaches and spectators expected, potentially drawing significant tourism to the surrounding area.
• Domestic travel will account for approximately 84.6% of overnight travel by 2021, generating 13.9 million overnight visits.
• U.S. visitation to Alberta is expected to grow by 3.3% in 2018, following strong growth of 4.9% achieved in 2017. Growth in 2017 was attributed in part to the exchange rate of the USD vs. CAD.
• Overall, visitation within Alberta is expected to grow by 2.0 – 2.3% over the 2018 – 2021 period.
Central Alberta Region Market and Economic Overview
Within Alberta, the Central Alberta Region is the most densely populated rural area, spanning 31,207 square kilometres and comprising 4.7% of Alberta’s land mass. Specifically, the Central Alberta Region is bordered by Clearwater County to the west up to Banff and Jasper National Park boundaries, south to Olds and Mountain
Alberta 2017 2018 2019 2020 2021Total ('000s overnight province visits) 15,018 15,370 15,694 16,044 16,365
3.6 2.3 2.1 2.2 2.0Domestic 12,882 13,133 13,363 13,626 13,861
3.0 1.9 1.8 2.0 1.7Business 1,567 1,587 1,608 1,632 1,656
2.6 1.3 1.3 1.5 1.5Pleasure 4,980 5,095 5,191 5,307 5,405
3.9 2.3 1.9 2.2 1.8United States 963 995 1,022 1,043 1,063
4.9 3.3 2.8 2.0 1.9Overseas 1,173 1,242 1,308 1,375 1,441
9.1 5.9 5.3 5.1 4.9Total Expenditures ($ millions) 9,304 9,746 10,209 10,662 11,158
7.3 4.8 4.7 4.4 4.6Travel Price Index 3.27 1.83 2.08 1.72 2.23Source: The Conference Board of Canada, Fall 2017 Preliminary Outlook
PROVINCIAL TRAVEL MARKET OUTLOOK

10 CENTRAL ALBERTA TOURISM ALLIANCE ACCOMMODATION STUDY
Tourism Red Deer Date: January 31, 2018
VALUATION & ADVISORY SERVICES
View County, and north to Lacombe and the Red Deer River. The map below identifies the boundaries of the Central Alberta Region study area within Central Alberta. The Region’s proximity and ease of access to Edmonton and Calgary is of importance, given that the majority of visitation to the Region is made by Albertan visitors.
Source: Central Alberta’s Tourism Destination Management Plan, 2015 The partner municipalities of The Central Alberta Region include:
• Cities of Red Deer and Lacombe; • Towns of Rocky Mountain House, Sylvan Lake, Innisfail, Blackfalds, and Olds; and • Counties of Red Deer, Lacombe, Mountain View and Clearwater.
Central Alberta Region’s demographics are summarized as follows:
Tourism Red Deer Date: January 31, 2018
CENTRAL ALBERTA TOURISM ALLIANCE ACCOMMODATION STUDY
11
VALUATION & ADVISORY SERVICES
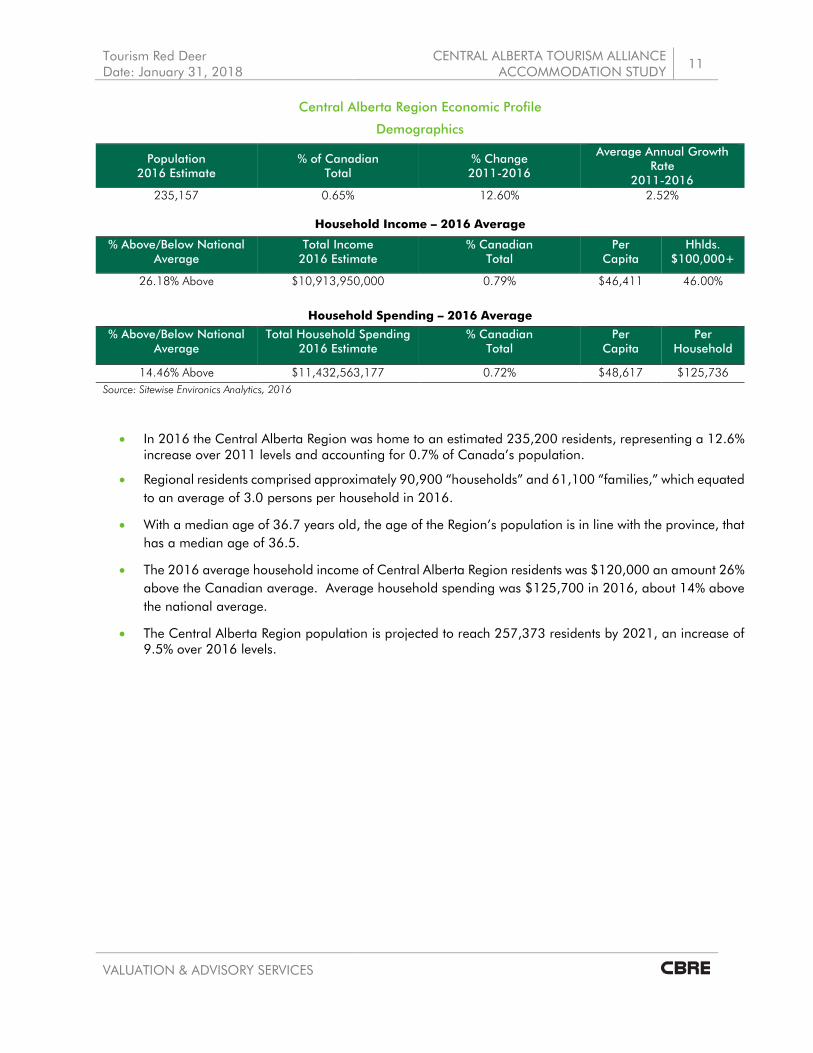
Central Alberta Region Economic Profile
Demographics
Population 2016 Estimate
% of Canadian Total
% Change 2011-2016
Average Annual Growth Rate
2011-2016 235,157 0.65% 12.60% 2.52%
Household Income – 2016 Average
% Above/Below National Average
Total Income 2016 Estimate
% Canadian Total
Per Capita
Hhlds. $100,000+
26.18% Above $10,913,950,000 0.79% $46,411 46.00%
Household Spending – 2016 Average
% Above/Below National Average
Total Household Spending 2016 Estimate
% Canadian Total
Per Capita
Per Household
14.46% Above $11,432,563,177 0.72% $48,617 $125,736 Source: Sitewise Environics Analytics, 2016
• In 2016 the Central Alberta Region was home to an estimated 235,200 residents, representing a 12.6% increase over 2011 levels and accounting for 0.7% of Canada’s population.
• Regional residents comprised approximately 90,900 “households” and 61,100 “families,” which equated to an average of 3.0 persons per household in 2016.
• With a median age of 36.7 years old, the age of the Region’s population is in line with the province, that has a median age of 36.5.
• The 2016 average household income of Central Alberta Region residents was $120,000 an amount 26% above the Canadian average. Average household spending was $125,700 in 2016, about 14% above the national average.
• The Central Alberta Region population is projected to reach 257,373 residents by 2021, an increase of 9.5% over 2016 levels.

12 CENTRAL ALBERTA TOURISM ALLIANCE ACCOMMODATION STUDY
Tourism Red Deer Date: January 31, 2018
VALUATION & ADVISORY SERVICES
Economic Overview
The Central Alberta Region features a diverse economy, with key industries ranging from agriculture, oil and gas exploration/extraction and petrochemicals, to professional and technical services, education, and tourism. The Regional economy is strengthened by a variety of supports in start-ups, business attraction and expansion, and export development.
The following table shows the largest sectors in Central Alberta by resident labour force based on 2016 data.
Central Alberta Region Largest Sectors by Labour Force - 2016
Sector Labour Force % of Labour Force Retail trade 15,729 11.2% Construction 14,835 10.6%
Health care and social assistance 14,273 10.2% Mining, quarrying, and oil and gas extraction 13,627 9.7%
Manufacturing 9,132 6.5% Educational services 8,522 6.1%
Accommodation and food services 8,077 5.7% Other services (except public administration) 7,950 5.7%
Public administration 7,436 5.3% Professional, scientific and technical services 6,766 4.8%
Source: Sitewise Environics Analytics, 2016
• In 2016, the Central Alberta Region had an estimated labour force of 140,500 residents.
• With a total of 15,700 jobs, the retail trade industry employed the largest amount of people (11% of total labour force), followed by the construction industry with 14,800 jobs.
• The health care and social assistance, and mining, quarrying, and oil and gas extraction industries also accounted for a significant proportion of the labour force at an estimated 10% each.
• The accommodation and food services sector had an employment base of 8,100, comprising 6% of the available labour force.
• The unemployment rate for the Central Alberta Region was approximately 7.0% in 2016.
• Many of the major communities within the Central Alberta Region have recently developed or are planning to develop new sport facilities and are looking to sport tourism as a core growth sector. Further details are provided in the Strategic Considerations section of the subject report.

Tourism Red Deer Date: January 31, 2018
CENTRAL ALBERTA TOURISM ALLIANCE ACCOMMODATION STUDY
13
VALUATION & ADVISORY SERVICES
Transportation
Central Alberta is strategically located from a transportation perspective, with the major Queen Elizabeth II Highway (Highway 2) spanning from north to south across the eastern portion of the Region, connecting it to Edmonton and Calgary. The David Thompson Highway, Alberta Provincial Highway 11 runs east to west across the Central Alberta Region and connects travellers to Banff and Jasper National Parks. The Region is also crossed by the CANAMEX corridor, which links Alberta to the USA and Mexico.
Located within the Central Alberta Region, the Red Deer Airport is serviced by Air Canada, which offers passenger service between Red Deer and Calgary three times daily, as well as a number of charters and flight schools. In 2016, the Red Deer Airport completed the Runway Expansion project, inclusive of a 2,000-ft. main runway extension, bringing the total runway length to 7,500 ft. With the opening of the new runway at the end of 2016, the Airport can now accommodate larger aircrafts. The airport is also looking at ultra low-cost airlines to expand its service, which would require an estimated capital investment of $15-20 Million, including construction of a new terminal, wider runway, etc.
There are three additional airports located in Central Alberta, including the Innisfail Airport, Lacombe Airport and Olds-Didsbury Airport, each of which has a potential impact on tourism for the region. Notable activities include: sky diving training facility and Central Alberta Gliding & Soaring Club at Innisfail Airport; the Calgary Flight Training Centre, private charter services, and a growing business park located at Olds-Didsbury Airport, as well as hosted events, such as an annual car show on Father’s Day weekend; and a bi-annual Airshow at the Rocky Mountain House Airport, which is being hosted in 2018. Sundre Residential Airpark also provides support for Alberta’s Forestry department and west country remote access, as well as a Mother’s Day Fly-in event. Finally, Netook Gliding Centre north of Olds is home to one of only five Air Cadet League of Canada gliding program facilities in Alberta, and the Olds General Hospital is a designated landing zone for STARS Air Ambulance. The variety of events and services at associated airports in Central Alberta provide increased opportunities for overnight stays in the region.
From an international perspective, the Central Alberta Region is primarily serviced by the Calgary (YYC) and Edmonton (YEG) International Airports. In 2016, the Calgary International Airport saw a total of 15,680,600 passengers, representing a 1.3% increase over 2015 levels. Year-to-date July 2017 results show a 2.8% increase in passengers over the same period in 2016. Approximately 7,523,900 passengers were served by the Edmonton International Airport in 2016, a 5.7% decrease from 2015. Year-to-date August 2017 statistics demonstrate a 2.7% increase in passengers over prior year results.

14 CENTRAL ALBERTA TOURISM ALLIANCE ACCOMMODATION STUDY
Tourism Red Deer Date: January 31, 2018
VALUATION & ADVISORY SERVICES
Central Alberta Region Community Profiles In an effort to better understand the economic and tourism related factors driving overnight visitation to Central Alberta, CBRE has compiled high-level profiles for each of the 11 participating CATA partner communities. Clearwater County Clearwater County is situated within mid-Western Alberta, bordering the Rocky Mountains to the west, Red Deer and Lacombe Counties to the east, and the Brazeau River to the north. As of 2016, the County had a population of an estimated 11,900 residents. The economy of Clearwater County is based on agriculture, oil and gas and forestry, with the tourism sector starting to truly be recognized as an economic generator. While the oil and gas sector has seen their prominence diminish over time, activity in the industry seems to be resurging in different forms, such as “fracking”. Though the County has not seen any significant development over the past few years, proactive planning and zoning throughout Clearwater County is promoting interest in overall development. From a tourism standpoint, the County is part of a significant branding exercise currently underway known as “David Thompson Country.” The area, which extends north of Calgary and includes Rocky Mountain House, Nordegg, Caroline and Clearwater Country, has just launched a new website featuring natural and culture history tied to adventure tourism. Approximately 80% of the County’s land base is Crown land, which is also where most of the adventure / cultural tourism takes place. This land could also provide an opportunity for future private sector tourism development (i.e. comfort camping) should the Province continue proposed changes to land regulations. The area is also known for a number of adventure and sporting events, including: a 10km run around Crimson Lake, the Brierley Rapids kayaking event; a destination for white-water kayaking along the North Saskatchewan River, and the Air Show at the Rocky Mountain House Airport, which features stunt flying. The County is looking to create more adventure tourism based events to potentially market as a “survivor series”. Other tourism offerings include: quadding, hiking, biking and lake-based activities on Cow Lake and Crimson Lake (boating, canoeing, fishing and skating), and kite surfing/skating on Abraham Lake. The County is also home to the Brierley Rapids, a destination for white-water kayaking along the North Saskatchewan River, near Rocky Mountain House. The County is also currently undertaking a Trails Strategy, which will address the need for multi-use trails in the region. Though the numbers of tourism outfitters in the County is still expanding, there is an opportunity to grow and link activities between different parts of the region, particularly if operators are able to extend their tourist seasons. In particular, the Town of Nordegg presents an opportunity to market heritage and adventure tourism. Rocky Mountain House Rocky Mountain House is the last major community that visitors pass through in the Central Alberta Region before crossing into the West Country / Rockies. The major industries are still oil and gas, particularly centred around discovery of these resources. Other major industries include forestry, agriculture and tourism. Like other communities in the region, Rocky Mountain House has suffered due to unemployment during the recent downturn, with population levels declining from 6,900 residents in 2011 to 6,600 in 2016.

Tourism Red Deer Date: January 31, 2018
CENTRAL ALBERTA TOURISM ALLIANCE ACCOMMODATION STUDY
15
VALUATION & ADVISORY SERVICES
The County, villages, and Town of Rocky Mountain House are working together to grow tourism under the banner of “David Thompson Country;” however, there is limited tourism infrastructure in the area. During the boom period, a number of new hotels were built, adding 110 new rooms over the past 3 years. Parks Canada has also invested some funds into Rocky Mountain House National Historic Site in the past few years which has in turn resulted in increased visitation to this major attraction. The Town is also in close proximity to Cow Lake, and Crimson Lake, which has become a popular cottaging destination. In terms of other local economic development projects with the potential of generating overnight demand, the Town is currently working on a Recreation Master Plan, and is actively looking to grow the meeting/conference market. Plans include development of an Agricultural Complex to host trade shows, with the potential to attract meeting and conferences to area hotels. There are several venues at the concept phase including: a riding arena for the equestrian industry, which is projected to be open within 5 years; a 900-seat banquet facility, and a 500-seat arena / event centre. The area is also home to 3 First Nations reserves and an active Metis community, as well as substantial off-reserve population. These communities already feature a number of festivals and events, and could provide an opportunity to further grow indigenous tourism. Lacombe County Lacombe County lies north of Red Deer County, to the east of Clearwater County, and borders the Brazeau River to the north. Lacombe offers a central location on Queen Elizabeth Hwy 2 Corridor, which is attractive to industrial and commercial developers. As of 2016, Lacombe County has a population of approximately 10,300 people. The main economic drivers in Lacombe County are Agriculture, Construction, and the Oil and Gas industries, collectively employing approximately 23% of the workforce in the County. In 2014, Lacombe Regional Tourism identified a set of goals in order to develop and promote tourism within the County. These goals include bolstering the County’s image from a branding perspective, helping in the development of tourism products and experiences, and creating partnerships with other Albertan tourism players to feature the natural beauty of the region. The County recently updated its land-use bylaw to make provisions for mobile food trucks and vendors, which may provide an opportunity to further enhance culinary tourism for the area. From a tourism perspective, the County is well-known for its lake-based tourism, with Gull Lake, Buffalo Lake and Sylvan Lake being key attractions that draw people to the area. Other attractions include Kraay Family Farms and Ellis Bird Farm, as well as the Haunted Lakes golf course and campground in the village of Alix. City of Lacombe The City of Lacombe is located approximately 25 km north of Red Deer, and was home to about 13,100 residents as of 2016. Key industries include: agriculture, oil and gas. Burman University, which currently features a student body of 500, acts as one of the main employment hubs in the town, along with Agricultural Financial Services Corporation (AFSC). In addition to growing these traditional industries, Lacombe’s Economic Development department is proactively looking to grow the City’s tourism and event demand, in order to further differentiate the City’s already-diverse economy. New commercial developments in Lacombe include: the proposed Wolf Creek Crossing/Lacombe Market Square – mixed use development (residential, commercial, industrial), with build out over 4 phases and anticipated

16 CENTRAL ALBERTA TOURISM ALLIANCE ACCOMMODATION STUDY
Tourism Red Deer Date: January 31, 2018
VALUATION & ADVISORY SERVICES
completion in 2030; and a proposed Midway Centre, which will feature multi-family residential, highway and neighbourhood commercial components, as well as open space. The City’s main tourism assets include a heritage downtown featuring 3 museums: Michener House, Blacksmith Shop, Flatiron Museum & Interpretive Centre; and a growing culinary tourism scene, featuring restaurants, orchards, and farmers market. The City’s culinary cluster of Cilantro & Chive, Blindman Microbrewery, Sweet Capone’s, draws guests and food bloggers from outside the region, including Calgary and Edmonton, and is generating positive social media. The City of Lacombe has seen has seen visitation to local festivals, events and attractions increase considerable since 2010. Visitation to the museum alone has seen an increase from approximately 1,000 visitors in 2010, to 5,700 visitors in 2016. The City’s core meeting and convention and sport tourism assets are comprised of Lacombe Memorial Centre, MEGlobal Athletic Park, Lacombe Sports & Leisure Complex. Furthermore, Lacombe Airport has plans for growth, as the City is a stopping point for travellers to destinations in northern Alberta. Municipal consideration of adding different land use districts to its bylaws may encourage development of hotels and other businesses. Town of Blackfalds The Town of Blackfalds is located in South-Central Lacombe County, approximately 15km north of the City of Red Deer. Blackfalds is considered a hub for firms servicing infrastructure development for oil and gas projects regionally and provincially, with key industries in petrochemicals, agri-foods, construction, and manufacturing. Large employers in the town currently include: Eagle Builders, a precast concrete product manufacturer, Nova Chemicals, a polyethylene and styrenics producer, and WorleyParsonsCord, a heavy-industrial construction firm. The Town of Blackfalds is gaining a reputation as a good location for young families in Alberta to purchase a home. The average age of its residents is 28, and the population has increased 92% since 2006, to reach just under 10,000 in 2017. The Town has a number of major developments underway, many of which are resident focused, including a 100-acre mixed-use development at Highway 2A and Broadway Ave. Phase 1 of this project is a retail/commercial development on a 12-acre parcel at SW corner of this intersection, and groundwork is already underway. Phase 2 may have potential for hotel development, but this would be a long-term opportunity (5-10 years) based on current market conditions. Tourism in Blackfalds is predominantly recreation-based and family oriented, and includes new BMX Bike Skills Park and Skateboard Plaza, the Abbey Centre (a 41,000-square foot indoor recreational centre and outdoor aquatic centre situated on the Trans Canada Trail), and Tayles Water Spray Park. The Town currently hosts a number of provincial and regional tournaments, including volleyball, martial arts and hockey, and is looking to twin its Multi-Plex Arena by 2020. The Town recently redeveloped the Wadey Heritage House as a Tourist Information Centre, which also houses the Chamber of Commerce and the Historical Society. Mountain View County Mountain View County sits to the south of Red Deer, and north of Airdrie, along the Calgary-Edmonton Corridor. With a population of approximately 13,000 as of 2016, Mountain View County offers 6 business parks throughout the

Tourism Red Deer Date: January 31, 2018
CENTRAL ALBERTA TOURISM ALLIANCE ACCOMMODATION STUDY
17
VALUATION & ADVISORY SERVICES
region, focused on warehousing and storage, manufacturing, agri services, farm equipment, vehicle and RV sales centres, contractors, cardlock services and construction businesses. The County’s tourism assets are focused on outdoor activities, including: numerous campgrounds, trails for quadding, and fishing in the many rivers, creeks and lakes. Most of the tourism activity in the County currently taking place on the west side of Hwy 2. There are also a number of agri-tourism attractions, such as the PaSu Sheep Farm, u-pick berry farms, and the Fallen Timber Meadery. Mukwah Tours also offers white-water rafting tours along the Upper Red Deer River, focusing on families and larger groups emphasizing the team-building nature of the experience. While some companies are operating day tours throughout the area, there are currently no overnight tours offered in Mountain View County. Recently, the County undertook a visitor friendly study, which identified the need for camping opportunities, particularly in the northwest, and has identified opportunities to grow indigenous tourism, with local products such as the Painted Warriors ranch. Olds Olds is located centrally in the Central Alberta region, 5km west of the intersection of Hwy 2 and 27, and acts as a hub between Airdrie and Red Deer. The Town has a diversified economy with strong agriculture, government, technology and education sectors, and was the first broadband community in Canada. Since 2011, Olds has seen its population grow by more than 11%, reaching approximately 9,200 residents in 2016. From an economic development standpoint, Olds has been selected as the site for three bio-medical operations for the production of cannabis and development of value added products for medical, health, and leisure markets. Modest estimations indicate that these operations will generate a minimum of 500 new jobs in the community over the next 2 – 5 years. Additionally, new seniors’ accommodations and residential developments are both proposed and under construction. A new sports field development in the northwest section of the town is in initial community engagement and planning stages. Tourism offerings in Olds tend to be focused on arts, culture and sports, with the major attractions being:
• Olds College, a core institution in the community that offers significant meeting and event space, as well as accommodations, educational facilities and features a Botanical Gardens, retail outlets and brewery;
• Olds Regional Exhibition, (ORE) which hosts Summer Synergy in partnership with the Calgary Stampede, as well as and the only Bavarian Rodeo and Biergarten, “Oldstoberfest”. ORE also provides agricultural event and training facilities as wells as a BMX Indoor Winter Track;
• Hay City Trail System; Centennial Park (both Skateboard and Splash parks, festivals); and • Olds Institute, which is a collaboration between the Town of Olds, Mountain View County, Olds Regional
Exhibition, Olds & District Chamber of Commerce, and Olds College. Olds Institute staffs and manages the Everything Olds Information & Entrepreneurship Centre and everythingolds.ca website.
Historically, Olds has not had a focus on tourism. However, their status as Canada’s first gigabit community has provided a digital advantage. In partnership with its community stakeholders, Olds Institute will continue to focus on digital marketing, tourism support, and event attraction strategy. This collective effort will focus on increasing facility utilization, creating visitor-focused experiences, and corridor trail development from the Rockies to the Badlands, using Olds as a stopping point.
18 CENTRAL ALBERTA TOURISM ALLIANCE ACCOMMODATION STUDY
Tourism Red Deer Date: January 31, 2018
VALUATION & ADVISORY SERVICES
Olds is a facility-rich community with a variety of event centres, sports venues, and tourism opportunities. Olds College invested $9 million to construct a 20-acre wetland including the BMO Bank of Montreal Amphitheatre. The Town of Olds is spending $5 million to develop a sports field project in the northwest section of the community. Olds Regional Exhibition (ORE) wishes to use their land adjacent to the municipal campground to expand it for their guests to accommodate horse trailers. ORE has developed a new commercial kitchen that will provide food services that will enable them to host sit-down indoor occupancy for up to 1,100 people. Red Deer County Red Deer County is well-situated between Airdrie and Edmonton along the Calgary-Edmonton Corridor. The major industries of Red Deer County include oil and gas, followed by goods producing sector (29% of labour force), agriculture, construction and energy. The County’s population base has undergone a 45% increase between 1996 and 2011, and is currently approaching 20,000 residents. Most of the visitor services and industries in the County are located along Highway 2, along with a large number of fixed roof accommodations, with Gasoline Alley undergoing significant construction activity including new commercial buildings and an overpass. Plans for Gasoline Alley also include a major residential component. The County’s tourist offerings are mainly connected to outdoor activities, festivals, golf, ski and arts/culture. Red Deer County is home to Canyon Ski Resort, which is the largest non-mountain ski resort in Alberta. In 2010, the County adopted an Open Space Master Plan which will create several rural trail linkages, potentially linking Red Deer to Sylvan Lake. Air Canada now offers flights from Calgary to Red Deer Regional Airport, with the majority of passengers comprised of business travellers connecting to travel to other parts of the province. The Airport recently expanded its runway (7,500 sq.ft.), in anticipation of the Winter Games and is now looking at ultra low-cost airlines to expand its service. The Airport is investing an estimated $15-20 Million over the next 3 to 5 years, for a new terminal and wider runway. City of Red Deer The City of Red Deer is the largest urban centre with the largest supply of fixed roof accommodation in Central Alberta. The main industries are oil and gas servicing and manufacturing, along with agricultural & food processing, and a large government core. The college and hospital are also large employers. Red Deer functions as the retail service hub for the region, and the City is currently working on Downtown Revitalization and Investment Attractions Plan. Following the last recession, the population of the City declined slightly and is now home to just under 100,000 residents. From an economic development perspective, Capstone at Riverlands is a new urban community along the banks of the Red Deer River, and next to the city’s historical downtown core. Capstone is expected to become one of Red Deer’s most innovative, balanced communities, including: a mix of condos and townhomes; commercial development, including hotels, office space, shopping and dining; riverfront gathering areas; proposed cultural facilities such as a public market, and artist studios; unique green spaces and water features; and, enhanced trail connections to Waskasoo Park and a proposed bridge over the river to Bower Ponds. From an overnight demand perspective, Red Deer has a huge opportunity to increase visitation as host to the Canada Winter Games in February 2019. Plans include the potential establishment of a new Sport Leadership

Tourism Red Deer Date: January 31, 2018
CENTRAL ALBERTA TOURISM ALLIANCE ACCOMMODATION STUDY
19
VALUATION & ADVISORY SERVICES
Agency that would act as an overall voice for Sport in Red Deer and Central Alberta. The City of Red Deer is looking to maximize the opportunity of the Canada Winter Games to showcase the community on a national stage, and to celebrate both the City and province. Coupled with this, the City is expected to benefit from lasting infrastructure that can attract people from all over the country, and raise its profile as a leader in sports tourism. Other tourism-related developments include a new sports centre at Red Deer College, along with additional sport fields and other community recreation facilities – all of which have strong synergies with fixed roof accommodation and camping. To achieve the vision and the established outcomes, Tourism Red Deer has identified several major strategies that will be pursued over the next ten years. Each strategy has a number of priority initiatives, complete with a prioritized action plan:
• Enhance the diversity & quality of experiential leisure travel opportunities
• Support the attraction, development and growth of special events opportunities
• Build market awareness and inspire visitors to experience Red Deer
• Strengthen tourism industry capacity and engagement
Sylvan Lake The Town of Sylvan Lake is located west of the City of Red Deer’s urban centre, and has a population of approximately 14,800 as of 2016. The Town features 1,200 businesses, of which 72 were related to tourism in 2013, the majority of which are foodservice establishments. Tourism has been a key driver of Sylvan Lake’s economy. In the summer of 2014, the Town undertook the Tourism Economic Impact Assessment study during July and August to determine the amount of money generated from tourism-related business in the town. The study found that 761,000 people visited Sylvan Lake during this time, contributing $75 million to the local economy. The town then looked to build upon these numbers by undertaking some developments on their own. In Fall 2016, Wild Rapids Waterslide, the Town’s major attraction, was permanently closed. The waterslides were removed by the owner, and the site adjacent was purchased by the Town (3.5 acres) and has negotiated a new License of Occupation (LOC) with the Province (1.5 acres) which was developed into Lakefront Park, as an active recreational park in 2017. The Sylvan Lake Provincial Park will be divested to the Town in early 2018 in order to increase access to the lake (for recreational purposes), and create opportunities to better manage the Town’s visitor experience, as well as contribute to the ongoing municipal efforts to expand tourism (provincially, nationally and internationally). To this end, the Town is now updating the 2006 Waterfront Area Redevelopment Plan with an emphasis on sustainability. The Town will be engaging the public (residents and visitors) to identify what features and amenities the site will house (i.e. year round destination products, festivals & events venue, public boat launch, day mooring, unique commercial opportunities, etc.) in a 3-day design charrette to be held in May 2018. In 2017, the Town also opened the new $33 million NexSource Centre, a 155,000 sq.ft. recreation and senior centre. A number of new residential developments are also underway in Sylvan Lake.

20 CENTRAL ALBERTA TOURISM ALLIANCE ACCOMMODATION STUDY
Tourism Red Deer Date: January 31, 2018
VALUATION & ADVISORY SERVICES
Furthermore, the Town recently developed a year-round Investment Attraction Strategy with a focus on establishing the Town as a destination, and is currently promoting the following opportunities in the Waterfront Commercial District (WCD):
• Sylvan Lake Waterfront Area Redevelopment Plan • Community owned 5-acre lakeshore property • Existing properties and vacant sites in the town core commercial district
The Town is also working on a Festival and Event Strategy, with a view of hosting events 8 months of the year, building on its inventory of assets, including a Waterfront Winter Village. In addition to the recently developed Cultural Master Plan, the Town is finalizing its 10-year Festival & Events Strategy that will focus on hosting events 8 months of the year, building on its inventory of assets, including the Waterfront Winter Village. The Town, in partnership with the Chamber of Commerce, has also established a Waterfront Commercial District (WCD) Revitalization Committee to address and implement the actions identified in the Visitor Friendly Assessment conducted in 2016. With the new NexSource Centre plus 3 arena floors, the Town is also looking to attract more trade shows and sport tourism events and other opportunities to grow the meeting/conference market with existing facilities. However, one of the weaknesses is the current capacity and quality of the accommodation product. The Town’s accommodation market has suffered without a free public boat launch, as there is currently a fee for the boat launch service resulting in patrons choosing other lakes instead.
Innisfail Innisfail is located along the Queen Elizabeth 2 Highway near the midpoint of the Calgary-Edmonton Corridor. The core industries within Innisfail include: retail trade, construction, and health care and social assistance. Some of the notable employers in the town include Bilton Welding, and Johns Manville (insulation, roofing and engineered products); both a part of the manufacturing sector. The population in Innisfail sits at approximately 7,800 as of 2016. From an economic development perspective, the Town has invested significantly in enhancements to the downtown core, and there are plans to add another industrial park in the next couple of years through the reclamation of the town’s former sewage lagoons. Several residential developments are in the planning stages around the outskirts of Innisfail. From a tourism perspective, the Town features a range of attractions, such as the Innisfail Golf Club, a new Library/Learning Centre, the Innisfail Historical Village, and a number of lakes, trails and green spaces. Other major attractions include Discovery Wildlife Park, which recently expanded to include camping, and Dinos Centre, a multi-activity centre with food and beverage facilities. The Town benefits from high vehicle traffic counts along the Queen Elizabeth 2 Highway on its eastern boundary, and is one of few communities between Red Deer and Calgary that presents an opportunity for overnight stays. The town’s hotel and motel supply is located primarily directly off the highway.

Tourism Red Deer Date: January 31, 2018
CENTRAL ALBERTA TOURISM ALLIANCE ACCOMMODATION STUDY
21
VALUATION & ADVISORY SERVICES
Summary & Implications The Central Alberta Region spans 31,207 square kilometres and is bordered by Clearwater County to the west up to Banff and Jasper National Park boundaries, south to Olds and north to Lacombe and the Red Deer River. In 2016, just over 5% of Alberta’s population resided in the Central Alberta Region (235,000 residents). Central Alberta’s resident base was comprised of 90,900 households and 61,100 families in 2016, which equated to an average of 3.0 persons per household. The average household income of Central Alberta residents was 26% above the national average ($120,000), while average household spending was also above the national level, at $125,700 (or 14% above) in 2016. With expectations for continued growth over the next 5 years, the population of Central Alberta is projected to reach 257,400 residents by 2021, representing a 9.5% increase over 2016. With a growing and affluent residential base, the Central Alberta market offers potential for future development and expansion. The individual communities within Central Alberta offer a variety of complementary opportunities to attract overnight demand. From an economic standpoint, key drivers will continue to be dominated by oil, gas and agriculture, but diversity is increasing, with a number of communities embracing tourism. A concentrated effort to capitalize on these opportunities in a strategic manner, as presented in this report, will not only help to grow the accommodation sector, but also bolster Central Alberta’s presence as a tourism destination.

Defining the Visitor Markets for the Central Alberta Region
Cen
tra
l A
lber
ta T
ou
rism
Alli
an
ce A
cco
mm
od
atio
n S
tud
y

Tourism Red Deer Date: January 31, 2018
CENTRAL ALBERTA TOURISM ALLIANCE ACCOMMODATION STUDY
23
VALUATION & ADVISORY SERVICES
Central Alberta Resident & Visitor Market Profile As discussed in the previous section of this report, the Central Alberta Region was home to an estimated 235,200 residents in 2016. In addition to residents travelling within their own region, overnight demand for accommodations in the Central Alberta region is driven by provincial, national, and to some extent U.S. and international visitors coming to the area for pleasure, to visit friends and relatives, or for business purposes (including meetings and conferences or government purposes). The volume and value of tourism in Canada is measured by two primary surveys: the Travel Survey of Residents of Canada (TSRC) and International Travel Survey (ITS). In Canada, a domestic tourist is someone who takes an “out-of-town” trip for one or more nights, or a same day out-of-town trip that takes them at least 40 km one-way from his/her home. It should be noted that visitor volumes have been calculated using person visits rather than the number of tourists, this means that one tourist can account for multiple visits throughout the year.
Alberta Central Tourism Region (Region #5) Visitor Volumes The Province of Alberta is divided into 6 Travel Regions, of which Central Alberta is identified on the adjacent map as Travel Region #5. Central Alberta extends east of the Rocky Mountains; and includes the communities south of Edson, Drayton Valley, Wetaskewin to the north; the Alberta Saskatchewan border to the east, including the communities of Lloydminster and Wainwright; and to the south, the communities north of Calgary and Drumheller. The Province’s Alberta Central Tourism Region includes Olds and Mountain View County, which are not included in the more detailed visitor profile provided for Central Alberta Census in the next section. The following table provides a summary of overnight visitation to Alberta Central Tourism Region and the province as a whole. In 2015, Alberta hosted 13.2 million overnight, of which 85% were Albertans, 10% were from other Canadian provinces, 2.8% from overseas and 2.6% from the United States. The key sources of overnight inbound travel to Alberta were from the neighbouring provinces of British Columbia and Saskatchewan, the U.S., Ontario, Manitoba, Europe and Asia. Alberta Central Region hosted 2.7 million overnight domestic person visits in 2015, representing 1-in-every-4 domestic overnight trips to the province. Close to 50% of the domestic overnight visitors to Central Alberta cited visiting friends and relatives as their main purpose of travel, followed by 42% who were travelling for pleasure. Overnight domestic visitors accounted for 7.1 million person nights in the region, for an

24 CENTRAL ALBERTA TOURISM ALLIANCE ACCOMMODATION STUDY
Tourism Red Deer Date: January 31, 2018
VALUATION & ADVISORY SERVICES
average stay of 2.6 nights. Approximately 63% of the overnight person visits to the Central Alberta Tourism Region were spent at the homes of friends and relatives, 24% at campgrounds and RV parks, and 13% at hotels/motels and other fixed roof accommodations.
Alberta Central Tourism Region (#5) Total Alberta
Alberta Central Tourism Region as %
of Total Alberta
Overnight Person Visits (2015)Domestic 2,700,000 11,450,000 24%
US N/A 829,000 Overseas N/A 921,000
TOTAL 13,200,000 Main Purpose of Overnight Visit Domestic %
Visiting Friends & Relatives 1,325,700 49.1%Pleasure 1,131,300 41.9%Business 178,200 6.6%
Other 64,800 2.4%TOTAL 2,700,000 100.0%
Average Length of Stay (nights) Domestic %Alberta 2.40 33.9%
Other Canada 4.70 66.4%Total 7.08 100.3%
Average 2.60
Accommodation Used (M person nights) Domestic %Friends and Relatives 4.46 63.1%
Campground/RV Park 1.69 23.9%Hotel/Motel 0.68 9.6%
Other Roofed Properties 0.24 3.4%TOTAL 7.07 100.0%
Source: Tourism Alberta, August 2017
Region #5, 2015
Note: International Overnight Visitation Profile not conducted at the Travel Region level.
OVERNIGHT VISITATION TO ALBERTA CENTRAL TOURISM REGION

Tourism Red Deer Date: January 31, 2018
CENTRAL ALBERTA TOURISM ALLIANCE ACCOMMODATION STUDY
25
VALUATION & ADVISORY SERVICES
Central Alberta Study Area (CD 8 & 9) Visitor Volumes The Alberta Ministry of Culture and Tourism customizes Statistics Canada data to reflect specific sub-regional census divisions within the Province. Although technically part of the greater Alberta Central Tourism Region, CBRE obtained a customized analysis of Census Divisions #8 and 9 to analyze visitation to the area at a more granular level. It should be noted that the Town of Olds and Mountain View County are in CD 16, which also includes the City of Calgary, and has not been included in this analysis. According to the most recent detailed data available from Statistics Canada, as of 2014, a total of 3.6 million visitors arrived in Central Alberta, of which 92% or 2.6 million people originated from within Alberta. Approximately 27% (974,000) of total visits in 2014 were overnight person visits travelling to the region for Visiting Friends / Relatives (VFR) or Pleasure, as compared to 1.9 million same-day VFR & Pleasure visits, as shown in the chart below. It should be noted that the sample size for the CD 8/9 dataset was too small to extract overnight visitors for business purposes.
VISITATION TO CENTRAL ALBERTA STUDY AREA (CD 8 & 9)
+1.2%
+4.1%
3,250
3,300
3,350
3,400
3,450
3,500
3,550
3,600
2012 2013 2014
Pers
on V
isits
(in
000
s)
Person Visits to Central Alberta Region 2012-2014
1,856(66%)
974(34%)
Pleasure & VFR Person Visits to Central Alberta by Length of Stay (in 000s)
Same-day Overnight
Source: Statistics Canada’s TSRC and ITS data, 2012-2014

26 CENTRAL ALBERTA TOURISM ALLIANCE ACCOMMODATION STUDY
Tourism Red Deer Date: January 31, 2018
VALUATION & ADVISORY SERVICES
In terms of spending, overnight visitors to the Central Alberta Region reached $186 Million in 2014, which equates to just under 50% of total visitor spending in the Region. From a seasonality perspective, over one-third of visitors arrived during the summer months, when the campgrounds are operating and many Alberta residents are taking vacation.
VISITOR SPENDING AND SEASONALITY - CENTRAL ALBERTA STUDY AREA (CD 8 & 9)
The average party size visiting the Central Alberta was 2.4 in 2014, of which 82% were made up of households 18 years and over. Further, the average length of stay for person visits to the Central Alberta region has increased slightly over the 3-year period from 0.71 nights in 2012 to 0.77 nights in 2014. This data directly relates to the number of person nights in campgrounds, which increased by almost 30% between 2012 and 2014, as compared to the number of person nights in hotels & motels, which declined by 6%. Overnight person visits that included a camping component totalled 225,000 visits in 2014, over 174,000 visits in 2012.
$196.2 Million, 51%
$185.8 Million, 49%
Spending in Central Alberta Region by Length of Stay - 2014
Same-day Overnight
Source: Statistics Canada's Travel Survey of Residents of Canada 2012-2014
22%
24%33%
21%
Person Visits to Central Alberta Region by Quarter - 2014
Q1 (Jan-Mar) Q2 (Apr-Jun)
Q3 (Jul-Sep) Q4 (Oct-Dec)
Source: Statistics Canada's Travel Survey of Residents of Canada 2012-2014

Tourism Red Deer Date: January 31, 2018
CENTRAL ALBERTA TOURISM ALLIANCE ACCOMMODATION STUDY
27
VALUATION & ADVISORY SERVICES
Tourism Experiences in Central Alberta As identified in the Destination Management Plan for the Central Alberta Region, the Central Alberta region offers a diverse range of tourism experiences, which can be organized into the following categories:
• Nature, Adventure and Ecotourism • Agri-tourism and Culinary Tourism • Cultural, Heritage and Arts Tourism • Aboriginal Tourism
32
5
30
6
56
3
73
1
100
200
300
400
500
600
700
800
2012 2014
Pers
on N
ight
s (in
00
0's)
Central Alberta Person Nights by Accommodation Type2012-2014 (in 000's)
Hotel/Motel Campground
Source: Statistics Canada's Travel Survey of Residents of Canada 2012, 2013, and 2014.
+29.8%
-5.7%
17
4 18
3
22
5
0
50
100
150
200
250
2012 2013 2014
Ove
rnig
ht P
erso
n V
isits
(in
00
0's)
Estimated Number of Campground Overnight Visits made to Central Alberta
2012-2014 (in 000's)
Source: Statistics Canada's Travel Survey of Residents of Canada 2012, 2013, and 2014.

28 CENTRAL ALBERTA TOURISM ALLIANCE ACCOMMODATION STUDY
Tourism Red Deer Date: January 31, 2018
VALUATION & ADVISORY SERVICES
• Festivals, Events & Sports Tourism • Business Events
Given the diversity of its landscape and geographic positioning within 90 minutes of the major urban centres of Calgary and Edmonton, it is not surprising that the Central Alberta Region obtains a significant source of its visitation from within the Province of Alberta. As further discussed in the following section, business trips and events make up a strong proportion of visitation to Central Alberta hotels and motels, and anecdotal information confirms that most of that market derives from either Calgary or Edmonton. Similarly, residents from other parts of Alberta and nearby provinces frequently come to the area for vacation/leisure purposes.
To determine a profile of the top target tourist markets that would be most interested in overnight experiences within Central Alberta, CBRE referred to Environics PRIZM5’s 68 defined lifestyles (understanding customers and their socioeconomic and purchasing behaviours). Ten targeted PRIZM segments were identified based on travel behavioural tendencies that would align well with what Central Alberta must offer from a tourism experience perspective (excluding business events), i.e., camping, RV touring, agri-tourism and culinary tourism, festivals/events and sport tourism:
• 09 Satellite Burbs • 17 Exurban Wonderland • 22 Aging in Suburbia • 24 Fresh Air Families • 36 Exurban Homesteaders • 37 Trucks & Trades • 40 Wide Open Spaces • 51 Aging & Active • 53 Outdoor Originals • 63 Lunch at Tim's
A description of each of the top 10 PRIZM Travel segments identified for Central Alberta is provided in the following chart.

Tourism Red Deer Date: January 31, 2018
CENTRAL ALBERTA TOURISM ALLIANCE ACCOMMODATION STUDY
29
VALUATION & ADVISORY SERVICES
Working in conjunction with Alberta Culture & Tourism, the project team further identified seven geographic markets with greater than average propensity to travel to Central Alberta for overnight stays:
1. Red Deer + 90-minute drivetime 2. Prince Albert 3. Saskatoon 4. Regina 5. Moose Jaw 6. Brandon 7. Winnipeg
PRIZM5 Travel Segments (#)
Age of Maintainer
Age of Children Family Status
Household Income ($2015) Travel Behavioural Tendencies
Satellite Burbs (9) Middle-Aged & Older 10+
Couples/ Families $128,962
Above average likelihood to go camping, boating or RV touring
Exurban Wonderland (17) Middle-Aged <20 Families $129,362
Enjoy family-friendly activities (theme parks, zoos); like fishing and camping to experience a simpler, more authentic way of life
Aging in Suburbia (22)
Middle-Aged & Older 15+ Mixed $108,590
Escape regularly to a cottage or local hiking trail (strong attraction to nature)
Fresh Air Families (24) Middle-Aged 5 - 20
Families/ Couples $102,243
Enjoy vacationing at parks and campgrounds, or sun destinations (Florida, Jamaica)
Exurban Homesteaders (36) Middle-Aged 10 - 24
Families/ Couples $93,396
Spend leisure time outdoors - fishing, hunting, camping, skiing and snowmobiling. May attend craft, cottage and RV shows.
Trucks & Trades (37)
Younger & Middle-Aged <15 Families $115,392
When not working hard, these households play hard - fishing, hunting, playing hockey and attending sports shows. Tend to own hot tubs, boats, camping trailers and motorcycles.
Wide Open Spaces (40) Middle-Aged 5 - 20
Couples/ Families $96,856
Spend much of their leisure time outside - fishing, snowmobiling, golfing and gardening. Tend to stay close to home - travelling to nearby campgrounds or home of friends/relatives. Tend to own pickup trucks, RVs, snowmobiles and ATVs.
Aging & Active (51) Older & Mature Mixed Mixed $76,823
Spend much of their free time outdoors - walking, hunting, fishing, cycling and outdoor sporting events. Also enjoy motorsports, ATCs and motorcycling on open roads.
Outdoor Originals (53)
Middle-Aged & Older 5 - 15 Mixed $72,128
Enjoy hunting, fishing, snowmobiling and power boating. Like to travel across Canada, looking for campgrounds and RV parks, as well as beaches, zoos, theme parks and cultural sites.
Lunch at Tim's (63) Mixed Mixed Singles/ Families $67,248
Typically take domestic vacations or stay in a campground or RV park.
Source: Sitewise Environics Analytics, 2016

30 CENTRAL ALBERTA TOURISM ALLIANCE ACCOMMODATION STUDY
Tourism Red Deer Date: January 31, 2018
VALUATION & ADVISORY SERVICES
The following table highlights the key geographic and demographic lifestyle target markets for Central Alberta, by size.
Key Geographic Markets Red
Dee
r 9
0 m
in D
rive
time
Win
nipe
g, M
B
Sask
atoo
n, S
K
Regi
na,
SK
Bran
don,
MB
Prin
ce A
lber
t, SK
Moo
se J
aw,
SK
TOTA
L
Total Population 1,545,290 796,364 306,794 241,942 57,652 44,981 36,976 2,648,448 Total Households 587,143 311,944 119,781 96,956 23,864 17,149 16,447 1,018,868 Top 10 Target SegmentsLunch at Tim's 12,208 31,112 10,882 11,647 4,054 4,126 4,814 67,196Aging in Suburbia 14,533 25,824 7,462 8,767 1,568 805 1,649 51,841Trucks & Trades 29,554 7,405 10,127 10,128 1,130 2,256 1,044 51,516Wide Open Spaces 25,870 2,651 2,856 550 1,035 66 63 32,541Exurban Wonderland 10,839 6,885 5,152 8,939 918 1,482 672 25,948Fresh Air Families 12,787 6,603 2,938 811 814 1,058 471 24,671Satellite Burbs 7,046 7,904 979 1,699 873 340 1,023 18,165Exurban Homesteaders 4,905 183 0 64 0 0 0 5,088Outdoor Originals 2,180 507 194 0 522 944 54 4,401Aging & Active 2,593 287 0 0 122 122 352 3,476Total Top 10 Target 122,515 89,361 40,590 42,605 11,036 11,199 10,142 284,843% of Households 20.9% 28.6% 33.9% 43.9% 46.2% 65.3% 61.7% 28.0%Source: Alberta Tourism, Culture and Recreation Analysis, Sitewise, 2015 Evironics Analytics, PRIZM
KEY GEOGRAPHIC AND DEMOGRAPHIC LIFESTYLE TARGET MARKETS FOR CENTRAL ALBERTA

Tourism Red Deer Date: January 31, 2018
CENTRAL ALBERTA TOURISM ALLIANCE ACCOMMODATION STUDY
31
VALUATION & ADVISORY SERVICES
Target Market - 90 minute Drivetime of Red Deer, AB The largest source of overnight demand in these 7 markets derives from the total catchment area within a 90-minute drivetime of the boundaries of the City of Red Deer (i.e. Red Deer + 90 minutes). This catchment area includes approximately 1.5 million residents and 587,100 households (inclusive of the 235,200 individuals living in the Central Alberta Region), and make up over 36% of Alberta’s total population. Furthermore, the 10 target PRIZM5 clusters comprise 21% of all households in the catchment area. A map of the Red Deer +90 Minute catchment area is provided below. The key geographic markets within a 90 minute drivetime include Calgary, Edmonton, and Red Deer, with the following 5 key target markets.
In terms of Lifestyle Groups, the primary targets are characterized by couples between 35 and 65 years old, with school and college-aged children, who tend to be outdoorsy types with high rates for camping, fishing, hunting and snowmobiling (Older Parents, Younger Kids) and Midlife Families with children of all ages, who also enjoy spending their leisure time outdoors. The following map identifies the boundaries for the catchment area within a 90-minute drivetime of the City of Red Deer. Within that boundary, the purple circles represent clusters where the top 10 target markets physically reside. The size of the circles represents the relative number of households for the 10 target markets combined. As shown, the largest sources of target market demand for Central Alberta overnight experiences are in the cities of Calgary and Edmonton.
PRIZM Segment Lifestyle Group Households
% of Alberta
Hhsld Trucks & Trades Growing Families 29,554 24.6%
Wide Open SpacesOlder Parents, Younger Kids 25,870 23.5%
Aging in Suburbia Midlife Families 14,533 28.4%
Fresh Air FamiliesOlder Parents, Younger Kids 12,787 41.3%
Lunch at Tim's Midlife Families 12,208 22.6%Source: Sitewise, 2015 Environics Analytics, PRIZM
KEY LIFESTYLE SEGMENTS Red Deer 90 min Drivetime Catchment Area

32 CENTRAL ALBERTA TOURISM ALLIANCE ACCOMMODATION STUDY
Tourism Red Deer Date: January 31, 2018
VALUATION & ADVISORY SERVICES
DRIVE TIME MAP CATCHMENT – CITY OF RED DEER + 90 MINUTES

Tourism Red Deer Date: January 31, 2018
CENTRAL ALBERTA TOURISM ALLIANCE ACCOMMODATION STUDY
33
VALUATION & ADVISORY SERVICES
Target Market – Winnipeg, MB The second largest target group for overnight demand is the Winnipeg catchment area. This catchment area includes just under 800,000 residents and 312,000 households and make up over 63% of Manitoba’s total population. In terms of Lifestyle Groups, the primary targets feature middle-aged and older couples and families with children of all ages. They enjoy spending their leisure time outdoors, attend community theatre or outdoor stage performances and tend to go to boat, cottage, garden, motorcycle, RV and sportsmen trade shows.
Target Market – Saskatoon, SK The Saskatoon target segment is comprised of close to 307,000 residents in approximately 120,000 households. Like the Winnipeg target market, the Saskatoon catchment area consist of Midlife Families as well as Growing Families. Growing families are characterized by younger-than-average families with high concentrations of children under the age of 19. These young families pursue active and outdoorsy lifestyles, with a high percentage who like to camp, fish, hunt, ski and play soccer and baseball. These families tend to drive large vans, sport utility vehicles and pickup trucks outfitted to handle their equipment-intensive activities.
Target Market – Regina, SK The Regina target segment is comprised of close to 242,000 residents in approximately 97,000 households. This group tends to be characterized by Growing and Midlife Families, with children of all ages and are demographically diverse, with white and blue collar jobs.
PRIZM Segment Lifestyle Group Households
% of Manitoba
Hhsld Lunch at Tim's Midlife Families 31,112 75.8%Aging in Suburbs Midlife Families 25,824 90.2%Satellite Burbs Prosperours Parents 7,904 64.8%Trucks and Trades Growing Families 7,405 63.3%Source: Sitewise, 2015 Environics Analytics, PRIZM
KEY LIFESTYLE SEGMENTS Winnipeg Catchment Area
PRIZM Segment Lifestyle Group Households % of SK
Hhsld Lunch at Tim's Midlife Families 10,882 28.9%Trucks and Trades Growing Families 10,127 31.5%Aging in Suburbs Midlife Families 7,462 64.8%Exurban Wonderland Growing Families 5,152 25.0%Source: Sitewise, 2015 Environics Analytics, PRIZM
KEY LIFESTYLE SEGMENTS Saskatoon Catchment Area

34 CENTRAL ALBERTA TOURISM ALLIANCE ACCOMMODATION STUDY
Tourism Red Deer Date: January 31, 2018
VALUATION & ADVISORY SERVICES
Target Markets – Brandon, MB, Prince Albert, SK and Moose Jaw, SK The remaining 3 target markets are relatively small, including:
• Brandon, MB which is comprised of 58,000 residents, with 24,000 households; • Prince Alberta, SK with 45,000 residents and 17,000 households; and • Moose Jaw, SK with 37,000 residents within 16,500 households.
These target markets are characterized by the following Lifestyle segments -- Growing and Midlife Families, Older Parents with Younger Kids and Prosperous Parents. While the characteristics of Growing and Midlife Families and Older Parents with Younger Kids have been previously discussed, Prosperous Parents consisting mainly of older married couples with teens and adult-age children. This lifestyle segment tends to be concentrated in and around larger cities, with incomes at nearly twice the national average. As such they can afford lifestyles that include entertainment, the arts, sports and travel.
PRIZM Segment Lifestyle Group Households % of SK
Hhsld Lunch at Tim's Midlife Families 11,647 31.0%Trucks and Trades Growing Families 10,128 31.2%Exurban Wonderland Growing Families 8,939 43.4%Aging in Suburbs Midlife Families 8,767 42.9%Source: Sitewise, 2015 Environics Analytics, PRIZM
KEY LIFESTYLE SEGMENTS Regina Catchment Area
PRIZM Segment Lifestyle Group Households
% of Manitoba
Hhsld Lunch at Tim's Midlife Families 4,054 9.9%Aging in Suburbs Midlife Families 1,568 5.5%Trucks and Trades Growing Families 1,130 9.7%
Wide Open SpacesOlder Parents Younger Kids 1,035 4.8%
Source: Sitewise, 2015 Environics Analytics, PRIZM
Brandon Catchment AreaKEY LIFESTYLE SEGMENTS
PRIZM Segment Lifestyle Group Households % of SK
Hhsld Lunch at Tim's Midlife Families 4,126 11.0%Trucks and Trades Growing Families 2,256 6.9%Exurban Wonderland Growing Families 1,482 7.2%
Fresh Air FamiliesOlder Parents Younger Kids 1,058 12.9%
Source: Sitewise, 2015 Environics Analytics, PRIZM
KEY LIFESTYLE SEGMENTS Prince Albert Catchment Area

Tourism Red Deer Date: January 31, 2018
CENTRAL ALBERTA TOURISM ALLIANCE ACCOMMODATION STUDY
35
VALUATION & ADVISORY SERVICES
Addendum “A” provides additional maps for each of the primary target markets for Central Alberta. Overall, the dominant target segment for Central Alberta across all 7 key geographic markets is the Lunch at Tim’s PRIZM5 segment. This target market consists of singles and solo-parent families living in older single-detached homes, semis and duplexes. They tend to be bargain hunters who shop for deals at Wal-Mart, take domestic vacations or stay in a campground or RV Park. Leisure activities include fitness walking, snowmobiling, boat shows and ice cream parlours.
PRIZM Segment Lifestyle Group Households % of SK
Hhsld Lunch at Tim's Midlife Families 4,814 12.8%Aging in Suburbs Midlife Families 1,649 8.1%Trucks and Trades Growing Families 1,044 3.2%Satellite Burbs Prosperous Parents 1,023 17.3%Source: Sitewise, 2015 Environics Analytics, PRIZM
KEY LIFESTYLE SEGMENTS Moose Jaw Catchment Area

Central Alberta Fixed Roof Accommodation Market Analysis Historic Market Performance Projected Market Performance
Cen
tra
l A
lber
ta T
ou
rism
Alli
an
ce A
cco
mm
od
atio
n S
tud
y

Tourism Red Deer Date: January 31, 2018
CENTRAL ALBERTA TOURISM ALLIANCE ACCOMMODATION STUDY
37
VALUATION & ADVISORY SERVICES
Introduction on Property Types/Classifications of Markets
The following discussion provides an overview of the historic performance of the fixed roof accommodation market in Central Alberta. We are able to provide a look at the most recent two years performance through our Trends in the Hotel Industry database and publication. CBRE Hotels collects top line (occupancy and average daily rate) data on close to 1,900 properties across Canada representing over 60% of the Canadian industry’s 440,000 rooms. CBRE Hotels is considered a standard source of reliable data for most markets. However, it should be noted that this database tracks only those properties of 30 rooms or more, which are open on a year-round basis and is primarily centred around traditional hotels. To that end, our analysis for the performance of many of the motels, lodges, and cabins included in the Central Alberta region inventory is estimated based on discussions with local operators and through our knowledge of the hotel and resort industry.
For the purposes of this analysis, fixed roof accommodations include:
• Hotels
• Motels
• Cabins/lodges (wherein guest accommodations are the core business function)
• Other seasonal accommodations (i.e. University/college residences). Accommodation types that were excluded from our analysis include:
• B&Bs
• Guest Ranches
• Cottages/Lodges – built around planned programming/activities (i.e. summer camps, hunting camps, etc.)

38 CENTRAL ALBERTA TOURISM ALLIANCE ACCOMMODATION STUDY
Tourism Red Deer Date: January 31, 2018
VALUATION & ADVISORY SERVICES
Measuring Accommodation Performance Accommodation performance is typically measured according to the following terminology: Accommodation Supply or Available Room Nights (ARNs) The total number of rooms at a property multiplied by the total number of nights the property is open during a given operating season. For example, a 25-room property open year-round (365 nights) would have 9,125 Available Room Nights. Accommodation Demand or Occupied Room Nights (ORNs) Demand refers to the total number of rooms occupied by transient, group and contract guests, without consideration to the number of guests in each room. Occupancy Rate is expressed as the percentage of rooms occupied out of the total rooms available at a property. The calculation is:
Occupancy Rate (%) = (Rooms Occupied / Rooms Available) x 100
Average Daily Rate (ADR) Although room rates may vary seasonally, by market segment, or by room type within a property, most properties calculate an overall average daily rate (ADR). This rate reveals the average rate charged per occupied room and is calculated by dividing total rooms revenue for a period (usually one year), by the number of rooms occupied during that period. The calculation is as follows:
ADR = Total Rooms Revenue / Rooms Occupied
Rooms Revenue per Available Room (RevPAR) RevPAR measures the rooms revenue yield a property achieves, relative to the rooms available in the property for a period of time (usually one year). The metric is influenced by 2 factors – occupancy and overall average daily rates (ADR). RevPAR can be used to compare rooms revenue results with prior period results or to compare actual to budgeted results. Because the rooms revenue is scaled by the number of rooms at the property, it can be used as one comparison of the rooms revenue yield of a property to its competitors or comparable properties. The calculation is as follows:
RevPAR = Total Rooms Revenue / Rooms Available
Market Segmentation Refers to the subdividing of a market into distinct subsets of users that behave in the same way or have similar needs. The hotel market segments most commonly used are Corporate, Meeting/Conference, Leisure, and Government/Other. Any new fixed roof supply within Central Alberta is expected to draw a portion of the existing corporate, government, leisure, and crew/other discounted demand from the local and regional accommodation market. However, a new hotel could also potentially induce some level of demand from other transient hotels and motels in other parts of Alberta. In other words, if a new hotel property was developed under such conditions, it may bring demand that was not already coming to a community in Central Alberta based on lack of supply. Typically, one would see this type of growth in a market that has much stronger overall occupancy levels, or has strong demand on a seasonal basis. New demand could also be derived from

Tourism Red Deer Date: January 31, 2018
CENTRAL ALBERTA TOURISM ALLIANCE ACCOMMODATION STUDY
39
VALUATION & ADVISORY SERVICES
regional meetings and conventions being driven to Central Alberta gateways or hubs due to higher prices in Calgary and Edmonton or the introduction of new property types (i.e. development of an eco-lodge, resort); or it could derive from unsatisfied demand in the regional market, due to issues such as quality of existing accommodations. In the following paragraphs, we discuss the historic and projected supply and demand within the competitive accommodation market. Provincial Market Performance and Trends
To provide some context to our Central Alberta regional discussion, we examined recent results for the Alberta hotel market as a whole. Data compiled and published by CBRE relating to the Alberta hotel market overall is summarized as follows. It should be noted that this data excludes the Alberta Resort areas (i.e. Banff, Jasper, Canmore and Lake Louise), as these properties are highly seasonal, with much stronger Average Daily Rates, and were not impacted to the same level by the recent economic downturn in Alberta.
• Provincial results were negatively impacted by the global economic downturn that began in late 2008. Occupancy fell close to 10 points by 2009, with little recovery until 2011. Alberta’s room supply also grew over this period, adding further strain on market occupancy and Average Daily Rate (ADR).
• Over 2011 to 2014, the Alberta accommodation market experienced solid gains in top line performance because of recovery in the economy generally, but more specifically, because of the healthy energy sector over this period. RevPAR reached an all-time high of $96.94 in 2014.
• In 2015, the Alberta economy felt the impact of the downturn in oil prices with a decline in room demand. RevPAR declined by 15.2% in 2015.
Year Occupancy ADRADR % Growth RevPAR
RevPAR % Growth
2005 63.7% $108.66 1.3% $69.22 -2.1%2006 65.8% $110.98 2.1% $73.02 5.5%2007 71.5% $125.68 13.2% $89.86 23.1%2008 68.5% $133.79 6.5% $91.65 2.0%2009 58.9% $128.74 -3.8% $75.83 -17.3%2010 58.3% $125.30 -2.7% $73.05 -3.7%2011 62.3% $125.84 0.4% $78.40 7.3%2012 65.8% $132.38 5.2% $87.11 11.1%2013 68.1% $138.10 4.3% $94.05 8.0%2014 67.8% $142.98 3.5% $96.94 3.1%2015 58.6% $140.80 -1.5% $82.52 -14.9%2016 52.3% $131.51 -6.6% $68.81 -16.6%
YTD Sep 2016 53.8% $132.08 - $71.03 -YTD Sep 2017 55.0% $130.80 -1.0% $71.94 1.3%
CAGR -1.8% 1.8% -0.1%Source: CBRE Hotels
Alberta Market Performance Results

40 CENTRAL ALBERTA TOURISM ALLIANCE ACCOMMODATION STUDY
Tourism Red Deer Date: January 31, 2018
VALUATION & ADVISORY SERVICES
• Year end results for 2016 indicate continued erosion in both occupancy and ADR. RevPAR performance was down 16.6% relative to 2015.
• Year to date results to September 2017 show a slight improvement of 1.3% in market RevPAR relative to the same period the year prior. While average daily rate was down in this nine-month period, occupancy increased 1.2 points.
• Longer term recovery and growth is expected for Alberta, with growth in hotel performance closely linked with improved pricing in the energy sector. It is expected that as the energy sector recovers, hotel demand volumes will be quick to follow.
• The resort market in Alberta is largely comprised of those hotels located in Banff, Jasper, Canmore and Lake Louise. The resort market finished 2016 at 64% occupancy at an average daily rate of $250. YTD results to September 2017 indicate occupancy to be up approximately 2% and rate up 10% over the same period in 2016.
• Recently, the resort market in Alberta has contrasted sharply with the performance of the urban/suburban markets in the Province. Resort hotels are enjoying growth and improved results as the Provincial downturn has led to more Albertans staying home and traveling within the region. The lower Canadian dollar has also played a factor in increasing travel to the resorts from travelers from British Columbia, Saskatchewan and Manitoba.

Tourism Red Deer Date: January 31, 2018
CENTRAL ALBERTA TOURISM ALLIANCE ACCOMMODATION STUDY
41
VALUATION & ADVISORY SERVICES
Regional Competitive Supply & Historic Market Performance
The area of study defined within the Central Alberta hotel market includes the Counties of Clearwater, Lacombe, Mountain View, and Red Deer. In total, the Central Alberta region of study currently includes 78 properties and 4,656 rooms (as at December 2016). This encompasses all fixed roof accommodation in the form of hotels, motels, cabins, lodges and cottages, but does not include B&B units or guest ranches. The initial discussion herein centres around the Central Alberta region as whole. We then examine the performance of the market on a county by county basis.
Our summary of the performance of the various markets is provided for the most recent two-year period over 2015 and 2016. To protect the confidential results of individual properties, the data must be presented as aggregate results and requires a reasonable sample size. As indicated below, many of the communities are small and do not have enough properties or rooms to create a reasonable sample. As such, we have presented the data for each County overall, and in the case of Red Deer, have provided results for the City with Gasoline Alley separately.
Number of Props # of RoomsRed Deer City 19 2,093Red Deer County (Gasoline Alley) 9 666Innisfail 5 243Sylvan Lake 7 271City of Lacombe 5 245Blackfalds 2 96Lacombe County 3 39Olds 7 346Rocky Mountain House 9 575Clearwater 12 160TOTAL 78 4,734
Number of Props # of RoomsRed Deer County & Area 40 3,273Lacombe County & Area 10 380Mountain View County & Area 7 346Clearwater County & Area 21 735TOTAL 78 4,734
County and Surrounding AreasHotels/Motels
Summary of Inventory by Community/AreaHotels/Motels
Community/Area
Summary of Inventory by County/Surrounding Area

42 CENTRAL ALBERTA TOURISM ALLIANCE ACCOMMODATION STUDY
Tourism Red Deer Date: January 31, 2018
VALUATION & ADVISORY SERVICES
Data compiled by CBRE for the performance of the Central Alberta accommodation market over past two years is summarized as follows:
• This market set in Central Alberta has performed below the overall Provincial hotel market by about 35-40% in terms of RevPAR in each of the last two years.
• The Central Alberta region was not immune to the challenges faced by the overall Provincial hotel market in recent years. Despite areas of Central Alberta that are attractive tourist destinations, overall, the region is still reliant on the oil and gas sector. In fact, the region is comprised of several small towns and only one mid-sized city, therefore, there is arguably even less diversity in the local economies to help offset the ailing energy sector.
Market Segmentation
In most markets, overall demand varies based on the nature of travel. Lodging demand is typically generated from four different segments - Corporate, Meeting/Conference, Leisure, and Government/Other. These segments are described as follows:
Corporate/Commercial Segment
Corporate travelers are defined as business people attracted by businesses in the area. Commercial transient demand includes individuals visiting the companies in the immediate area or passing through town. Corporate volume demand is generated by local firms and includes employees of the company or others doing business with the firm. Most demand from the corporate segment is generated between Monday and Thursday nights, declines Friday and Saturday nights, and increases somewhat on Sundays. Historically, this demand segment has been somewhat less price sensitive than other segments. Rates are often pre-negotiated with the hotel and are sometimes discounted in return for a high number of occupied rooms. Often, these types of travelers are influenced by quality of the hotel, brand loyalty, and location. Overall, the corporate segment is highly desirable as it provides a solid base of demand and tends to pay higher room rates than other segments.
Meeting/Conference Segment
Meeting/Conference travelers are defined as any group occupying five or more rooms on a given night travelling for the purpose of attending a meeting or conference or even banquets/social functions. This segment includes corporate groups, associations, SMERF (social, military, educational, religious, and fraternal) groups. This segment is typically attracted by a hotel's meeting facilities and recreational amenities in the area. Demand from corporate groups is typically generated between Sunday and Thursday nights, and can include corporate functions, holiday parties, incentive groups, etc. Corporate groups tend to have a high level of single occupancy, while other groups tend to have more double occupancy. Associations and SMERF
Year RoomsRooms
Available% Change
Rooms Occupied
% Change Occupancy Change (Pts) ADR % Change RevPAR % Change
2015 4336 1,582,640 - 750,278 - 47.4% - $111.16 - $52.70 -
2016 4656 1,699,440 7.4% 662,648 -11.7% 39.0% -8.4 $106.67 -4.0% $41.59 -21.1%
Competitive Market Performance Results - Central Alberta
Source: CBRE Hotels

Tourism Red Deer Date: January 31, 2018
CENTRAL ALBERTA TOURISM ALLIANCE ACCOMMODATION STUDY
43
VALUATION & ADVISORY SERVICES
groups have a more varied occupancy pattern and often hold weekend meetings and events. This demand segment tends to be somewhat price sensitive. There is a perception (often true) that by occupying a block of rooms, a volume discount should be given. Group/meeting travelers tend to stay at full-service hotels and often utilize a hotel's food and beverage facilities. This segment is seasonal, and repeat business on an annual basis is not guaranteed. Overall, the meeting/conference segment is desirable as it provides for a full utilization of hotel facilities.
Leisure/Tourist Segment
Leisure travelers generally include vacationers or travelers passing through the area. This category effectively includes all non-commercial related travellers including sports teams and tour groups. This segment is typically attracted by a hotel's location relative to area attractions (including friends/relatives). Demand from leisure travelers is typically generated throughout the week during peak periods, with more weekend demand in shoulder seasons. Leisure travelers tend to have a high level of double occupancy. This demand segment tends to generate a higher average daily rate as leisure travelers book the best available rate and volume or negotiated rates are not applicable.
Government/Other Segment
Government/Other demand includes any airline contracts or construction and maintenance crew business as well as rooms generated through special promotions and discount offers. Government demand is also included in this segment. Demand in this segment is typically represented by sources that are highly rate sensitive and are normally provided with significantly discounted room rates. Demand within this segment typically occurs during the Sunday to Thursday period, although a portion of this demand is also likely to occur on the weekends.
Based on CBRE Hotels market research, and discussions with local hoteliers, the estimated market segmentation for the Central Alberta region in 2016 is presented below:
Me

44 CENTRAL ALBERTA TOURISM ALLIANCE ACCOMMODATION STUDY
Tourism Red Deer Date: January 31, 2018
VALUATION & ADVISORY SERVICES
• As shown, the Central Alberta region relies almost equally on demand generated by the leisure and corporate segments.
• Discussions with various stakeholders indicate that, overall, market segmentation has changed in the past few years because of the downturn in the economy. While there is still corporate demand for transient overnight stays and for meeting/conferences, a significant volume of that demand has decreased. In some cases, that demand was replaced by more leisure traffic and in other situations, the demand was lost altogether.
• Meeting/conference demand is highly concentrated in the larger city centres and at hotels that have a significant volume of meeting space. There are several properties in the regional sample that do not have any meeting/conference space. Therefore, the meeting/conference segment generates a relatively low volume of demand overall.
• As indicated above, the government/other segment is highly rate sensitive and can impact a property’s average daily rate. It is best practice for a hotel to use the demand as a base from which to build business and to not rely on it as a steady segment of demand. As such, it is reasonable that this segment generates a relatively low volume of demand overall.
Demand Seasonality
The following chart provides occupancy by month for the year ended December 31, 2016. The markets of Red Deer including Gasoline Alley, Innisfail, Sylvan Lake, Olds and Lacombe County are shown relative to the Central Alberta region as a whole. Rocky Mountain House is the only major centre not highlighted separately, due to insufficient available data.
• As shown, the Central Alberta region overall did not experience dramatic swings in occupancy throughout the year; rather, occupancy was relatively steady month to month, with no more than a 15-point difference between the high and low (June and December).

Tourism Red Deer Date: January 31, 2018
CENTRAL ALBERTA TOURISM ALLIANCE ACCOMMODATION STUDY
45
VALUATION & ADVISORY SERVICES
• The region overall and each market individually were consistent in experiencing their lowest occupancy in the winter months – December, January and February.
• In contrast, peak occupancy times were different for some markets as compared to the market as a whole.
• Olds and Lacombe County both experienced their highest occupancy levels in April, and Sylvan Lake experienced peak occupancy in July.
• The Central Alberta region overall experienced its highest occupancy in May/June and November primarily.
• The City of Red Deer with Gasoline Alley most closely mirrors the trend line for the region overall, given that it represents the largest proportion of inventory.
• The highest occupancy achieved in any month was approximately 55%, which was achieved by the Olds market in April 2016.

46 CENTRAL ALBERTA TOURISM ALLIANCE ACCOMMODATION STUDY
Tourism Red Deer Date: January 31, 2018
VALUATION & ADVISORY SERVICES
Regional Competitive Supply & Historic Market Performance by County
Clearwater County & Area
The Clearwater County & Area accommodation market is primarily comprised of hotels in the Town of Rocky Mountain House. The balance of the market is comprised of various lodges and cabins located in communities throughout the county including some in Nordegg. In total, there are 21 properties and 735 rooms in the Clearwater County & Area sample. Rocky Mountain House represents approximately 78% of the total room inventory for that sample.
A list of these properties and their amenities is provided in the following table. And a map showing the location of the properties has been provided following the discussion below.
Data compiled by CBRE for the performance of the Clearwater County & Area market over the past two years is summarized as follows:
Loca
tion
Property Name Location Type Rooms Seas
onal
Mee
ting
Faci
litie
s
Rest
aura
nt /
Lo
unge
Brea
kfas
t Se
rver
y
Pool
Best Western Rocky Mountain House Inn & Suites 4407 41 Ave, Rocky Mountain House, AB Hotel 81 x xCanalta Rocky Mountain House 4406 41 Ave, Rocky Mountain House, AB Hotel 97 x x xChinook Inn 5321 59 Ave, Rocky Mountain House, AB Hotel 46Rocky Inn Express 4715 45 St, Rocky Mountain House, AB Hotel 39 xThe Walking Eagle Inn & Lodge 4819 45 St, Rocky Mountain House, AB Hotel 138 x x xAlpine Motel 4435 47 Ave, Rocky Mountain House, AB Motel 20Tamarack Motor Inn 4904 45 St, Rocky Mountain House, AB Motel 63 x xThe House Motel 4828 45 St, Rocky Mountain House, AB Motel 23Voyageur Motel 4035 45 St, Rocky Mountain House, AB Motel 68
Total Rocky Mountain House Rooms 575Properties 9
KB Trails RR 3, Site 2, Caroline, AB, T4T 2A3 Cabins 3David Thompson Resort AB-11, Nordegg, AB Lodge 45 x xNordegg Lodge 2 Stuart St, Nordegg, AB Lodge 40 xLeslieville Hotel 1 Ave, Leslieville, AB Hotel 4Caroline Motel 5027 50th St, Caroline, AB Motel 15Expanse Cottages 305 Shunda Creek Road, Nordegg, AB Cabins 4Grandview Stage Box 38, Site 3, RR2, Rocky Mountain House, AB Cabins 8 xBearberry Cabins Clearwater County, AB Cabins 7Cheechako Cabins 205 Grouse Meadow Ln, Nordegg, AB Cabins 4Aurum Lodge 374021, AB-11, Cline River, Nordegg, AB Lodge 6The Goldeye Centre Box 26, Nordegg, AB T0M 2H0 Lodge/Cabins 15 x x xTerratima Lodge Clearwater County, AB T0M 0M0 Lodge 9 x
Total Clearwater County Rooms 160Properties 12
TOTAL CLEARWATER COUNTY & AREA Rooms 735Properties 21
Sources: Central Alberta Features Inventory Database and CBRE Research
CLEARWATER COUNTY & AREA FIXED ROOF ACCOMMODATION INVENTORY
Rock
y M
ount
ain
Hou
seC
lear
wat
er C
ount
y
Year RoomsRooms
Available% Change
Rooms Occupied
% Change Occupancy Change ADR % Change RevPAR % Change
2015 735 268,275 - 150,937 - 56.3% - $119.58 - $67.28 -
2016 735 268,275 113,415 -24.9% 42.3% -14.0 $116.40 -2.7% $49.21 -26.9%
Competitive Market Performance Results - Clearwater County
Source: CBRE Hotels

Tourism Red Deer Date: January 31, 2018
CENTRAL ALBERTA TOURISM ALLIANCE ACCOMMODATION STUDY
47
VALUATION & ADVISORY SERVICES
• Clearwater County & Area represents approximately 16% of the Central Alberta region room inventory.
• Relative to the region overall, the Clearwater County & Area market performed better in both occupancy and ADR in 2015 and 2016. This is largely attributed to the fact that there are a number of resorts, lodges and cabins included in the inventory which often drive a higher rate than traditional hotel accommodation and they were less impacted by the decrease in corporate demand.
• There have been no supply changes in the past two years and there are no known hotels proposed for construction.
The estimated market segmentation for Clearwater County & Area in 2016 is as follows:
• The hotels in Rocky Mountain House are largely carrying the corporate demand for this sample. There were several energy sector projects happening in the area that resulted in strong occupancies for many of the hotels. Much of this demand was lost with the economic downturn but has allowed the leisure demand to grow.
• As noted, the Clearwater County sample of properties includes a number of resorts, lodges and cabins, which attract a high volume of leisure demand. There are also several tourists that use the area as a stopover on their travels through the Province, particularly in and out of Banff. The area is also known to attract bus tour demand and many people visit the area because of the outdoor recreation available.
• Most of the meeting/conference demand is also generated through the Rocky Mountain House market as many of the cabins and lodges do not have meeting/conference facilities. However, the David Thompson Resort, for example, does attract groups also, particularly for retreats and social functions.

48 CENTRAL ALBERTA TOURISM ALLIANCE ACCOMMODATION STUDY
Tourism Red Deer Date: January 31, 2018
VALUATION & ADVISORY SERVICES
CLEARWATER COUNTY

Tourism Red Deer Date: January 31, 2018
CENTRAL ALBERTA TOURISM ALLIANCE ACCOMMODATION STUDY 49
VALUATION & ADVISORY SERVICES
ROCKY MOUNTAIN HOUSE

50 CENTRAL ALBERTA TOURISM ALLIANCE ACCOMMODATION STUDY
Tourism Red Deer Date: January 31, 2018
VALUATION & ADVISORY SERVICES
Lacombe County & Area
The Lacombe County & Area accommodation market is primarily comprised of hotels in the City of Lacombe. The balance of the market is made up of hotels in Blackfalds and in Alix. There is a total of 10 properties in the sample with 380 rooms as at December 2016. Except for the new Best Western in Lacombe and the Microtel in Blackfalds, the market is comprised of mostly independent hotels and motels of 50 rooms or less.
A list of these properties and their amenities is provided in the following table and maps are provided following the discussion below. It is our understanding that the Empress Hotel is now closed, but has been included in our historic market analysis.
Data compiled by CBRE for the performance of the Lacombe County & Area market over the past two years is summarized as follows:
• Lacombe County & Area represents approximately 8% of the Central Alberta region
inventory.
Loca
tion
Property Name Location Type Rooms Seas
onal
Mee
ting
Faci
litie
s
Rest
aura
nt /
Lo
unge
Brea
kfas
t Se
rver
y
Pool
Best Western Plus Inn & Suites Lacombe 4751 63 St, Lacombe, AB Hotel 83 x x xGreen Way Inn 5402 AB-2A, Lacombe, AB Hotel 49 x x xCountry Club Inn Lacombe 6205 50 Ave, Lacombe, AB Hotel 25 xLacombe Motor Inn 5136 Highway 2A, Lacombe, AB Hotel 44 x xEmpress Hotel & Restaurant (CLOSED) 4711 49b Avenue, Lacombe, AB Motel 44 x
Total Lacombe Rooms 245Properties 5
Blackfalds Motor Inn 5201 Highway St, Blackfalds, AB Motel33 x
Microtel Inn & Suites by Wyndham Blackfalds Red Deer North
6021 Parkwood Rd, Blackfalds, AB Hotel63 x x
Total Blackfalds Rooms 96
Properties 2Alix Hotel 4936 Main St, Alix, AB Motel 11
Alix Motel 4704 51 Ave, Alix, AB Motel 14
Morris Meadows 40506 Range Rd 231, Alix, AB Lodge 14 x xTotal Lacombe County Rooms 39
Properties 3TOTAL LACOMBE COUNTY & AREA Rooms 380
Properties 10Other Seasonal Fixed Roof Accommodations
City
of
Laco
mbe
Burman University 6730 University Drive, Lacombe, ABUniversity Residence
112 x
LACOMBE COUNTY & AREA FIXED ROOF ACCOMMODATION INVENTORY
Sources: Central Alberta Features Inventory Database and CBRE Research
City
of
Laco
mbe
Blac
kfal
dsLa
com
be
Cou
nty
Year RoomsRooms
Available% Change
Rooms Occupied
% Change Occupancy Change ADR % Change RevPAR % Change
2015 325 118,625 - 54,736 - 46.1% - $95.13 - $43.90 -
2016 380 138,700 16.9% 54,804 0.1% 39.5% -6.6 $102.97 8.2% $40.69 -7.3%
Competitive Market Performance Results - Lacombe County
Source: CBRE Hotels

Tourism Red Deer Date: January 31, 2018
CENTRAL ALBERTA TOURISM ALLIANCE ACCOMMODATION STUDY
51
VALUATION & ADVISORY SERVICES
• Relative to the region overall, the Lacombe County & Area market achieved comparable results in terms of both occupancy and ADR in 2016; there was a greater spread in results in 2015 with the County & Area performing below the region by about $16 in terms of ADR.
• The increase in rooms supply is related to the opening of the Best Western in the City of Lacombe which took place in later 2015. Looking forward, there are no known hotels proposed for construction in the County.
The estimated market segmentation for Lacombe County & Area in 2016 is as follows:
• Given its proximity to the City of Red Deer, the Blackfalds accommodation market is dominated by the corporate travel segment. The City of Lacombe also has its corporate demand sources, albeit to a lesser degree.
• The meeting/conference segment is a small generator of rooms demand as there are few properties with meeting/conference facilities.
• Demand sources for the Leisure travel segment are generally sports teams, visiting friends and relatives and local tourists visiting the area. The central location results in the area being used a stopover for those traveling around the province.

52 CENTRAL ALBERTA TOURISM ALLIANCE ACCOMMODATION STUDY
Tourism Red Deer Date: January 31, 2018
VALUATION & ADVISORY SERVICES
LACOMBE COUNTY

Tourism Red Deer Date: January 31, 2018
CENTRAL ALBERTA TOURISM ALLIANCE ACCOMMODATION STUDY 53
VALUATION & ADVISORY SERVICES
CITY OF LACOMBE

54 CENTRAL ALBERTA TOURISM ALLIANCE ACCOMMODATION STUDY
Tourism Red Deer Date: January 31, 2018
VALUATION & ADVISORY SERVICES
BLACKFALDS

Tourism Red Deer Date: January 31, 2018
CENTRAL ALBERTA TOURISM ALLIANCE ACCOMMODATION STUDY
55
VALUATION & ADVISORY SERVICES
Mountain View County & Area
The Mountain View County & Area accommodation market in our analysis is strictly comprised of hotels in the Town of Olds. The current competitive market for Olds is comprised of 7 properties with 347 rooms or 126,655 available room nights. The market is characterized by branded limited/select service hotels and some non-branded motels. It should be noted that during the May to August months each year, the accommodation inventory increases with the residences units at Olds College, which are primarily available for nightly rental during the non-academic time of the year, with some accommodations made available year-round. The College is moving toward offering year-round availability. Currently, there are up to 496 units on offer seasonally, however, they have not been included in this market analysis.
A list of these properties and their amenities is provided in the following table and a map is provided following the discussion below:
Data compiled by CBRE for the performance of the Mountain View County & Area market over the past two years is summarized as follows:
• The Mountain View County & Area market represents approximately 7.5% of the Central Alberta region inventory.
• Relative to the region, this market has achieved comparable results in terms of both occupancy and ADR.
• There have been no supply changes in the past two years and there are no known hotels proposed for construction despite recent attempts by the Town to encourage hotel
Location Property Name Location Type Rooms Sea
son
al
Mee
ting
Fa
cilit
ies
Rest
aur
an
t /
Loun
ge
Bre
akf
ast
Se
rver
y
Poo
l
Circle 5 Motel 4513 52 Ave #17, Olds, AB Motel 26Best Western of Olds 4520 - 46th St, Box 4140, Olds, AB Hotel 40 x x xOlds Hotel 5102 50 St, Olds, AB Hotel 20Pomeroy Inn & Suites at Olds College 4601 46 Ave, Olds, AB Hotel 82 x x x xRamada Inn Olds 500 6700 46th Street, Olds, AB Hotel 98 x x xMotel 8 (former Sportsman's Hotel) 5610 46 St, Olds, AB Motel 44Siesta Motel 5218 46 St, Olds, AB T4H 1B8 Motel 36 x
Total Olds Rooms 346Properties 7
OldsOlds College Residences (public usage May through August) 4501 - 53 St, Olds, AB
University Residence 496 x
Sources: Central Alberta Features Inventory Database and CBRE Research
Old
s
MOUNTAIN VIEW COUNTY & AREA FIXED ROOF ACCOMMODATION INVENTORY
Year RoomsRooms
Available% Change
Rooms Occupied
% Change Occupancy Change ADR % Change RevPAR%
Change
2015 347 126,655 55,948 - 44.2% - $113.30 - $50.05 -
2016 347 126,655 47,891 -14.4% 37.8% -6.4 $108.97 -3.8% $41.20 -17.7%
Competitive Market Performance Results - Mountain View County (Olds)
Source: CBRE Hotels

56 CENTRAL ALBERTA TOURISM ALLIANCE ACCOMMODATION STUDY
Tourism Red Deer Date: January 31, 2018
VALUATION & ADVISORY SERVICES
development. However, the Schott’s Lake RV & Guest Ranch is opening Fall 2017 and will have 10 motel rooms, 6 serviced campsites, 3 tent sites, and 2 cabins. The motel will also feature a restaurant with 50 seats and lower level conference area with a capacity of 75.
The estimated market segmentation for Mountain View County & Area in 2016 is as follows:
• As shown, the leisure segment is the largest generator of demand in the market as there are a number of sports teams and events held in the Town, in addition to the regular leisure travelers (visiting friends and relatives, tourism, etc.).
• Corporate travel in Olds is generated by a mix of sources. The market is not heavily reliant on the oil and gas sector like many accommodation markets in Alberta, however, the market has benefited in prior years by some oil and gas related demand.
• While the Pomeroy Inn & Suites has a decent volume of meeting space, most hotels have very little or none. Many meetings and conferences are held at other venues in the Town, particularly at Olds College but also Olds Regional Exhibition.
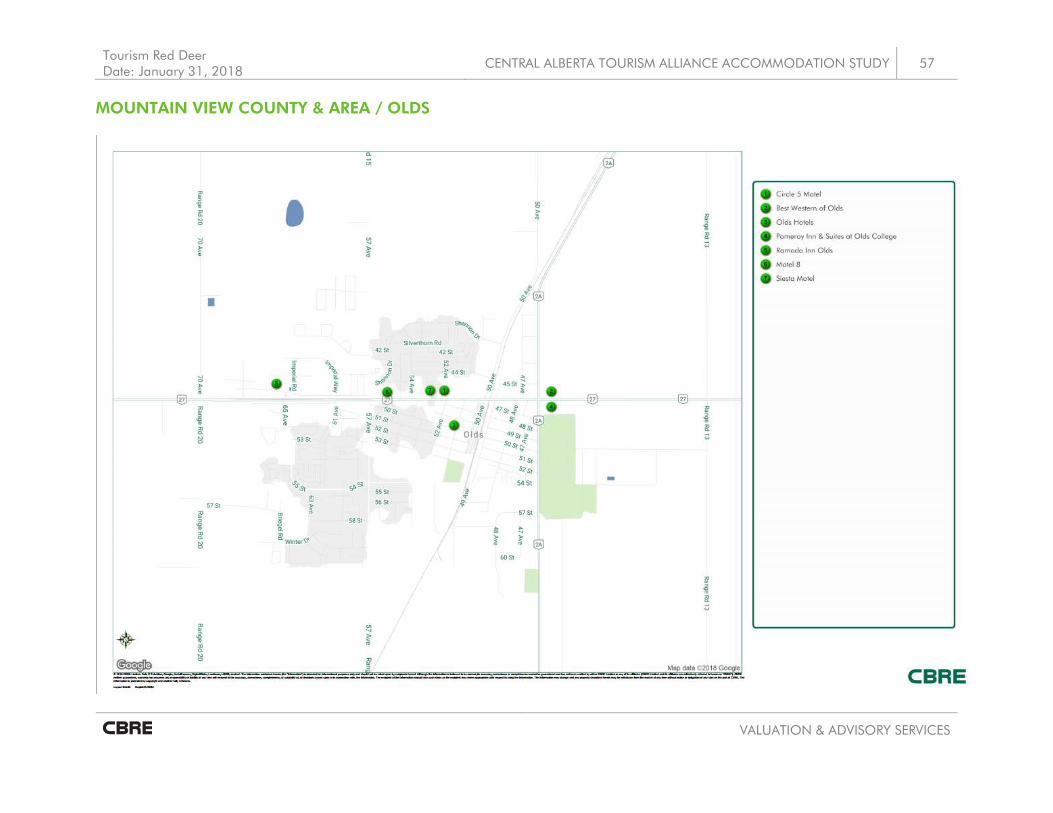
Tourism Red Deer Date: January 31, 2018
CENTRAL ALBERTA TOURISM ALLIANCE ACCOMMODATION STUDY 57
VALUATION & ADVISORY SERVICES
MOUNTAIN VIEW COUNTY & AREA / OLDS

58 CENTRAL ALBERTA TOURISM ALLIANCE ACCOMMODATION STUDY
Tourism Red Deer Date: January 31, 2018
VALUATION & ADVISORY SERVICES
Red Deer County & Area
A significant volume of hotel accommodations in Red Deer County & Area are either within the City of Red Deer, or in the area known as Gasoline Alley, which is within the boundaries of Red Deer County. The Towns of Sylvan Lake and Innisfail make up the balance of the accommodation market of Red Deer County & Area. Overall, the Red Deer County & Area sample is comprised of 40 properties with 3,194 rooms as at December 2016 (with the opening of the new Holiday Inn Express Red Deer North in 2017, the total inventory will be 3,273).
A list of these properties and their amenities is provided in the following table and maps are provided following the discussion below.
Loca
tion
Property Name Location (for maps) Type Rooms Sea
son
al
Mee
ting
Fa
cilit
ies
Rest
aur
an
t /
Loun
ge
Bre
akf
ast
Se
rver
y
Poo
l
Best Western Plus Red Deer Inn & Suites 6839 66 St, Red Deer, AB Hotel 92 x x xBlack Knight Inn 2929 50 Ave, Red Deer, AB Hotel 98 x x xComfort Inn & Suites Red Deer 6846 66 St, Red Deer, AB Hotel 88 x x xDays Inn Red Deer 1000-5001 19 St, Red Deer, AB Hotel 76 x xEcono Lodge Inn & Suites City Centre Red Deer 4124 Gaetz Avenue, Red Deer, AB Hotel 62 xHoliday Inn Express Red Deer North 6433 Orr Drive, Red Deer, AB Hotel 79 x x xHoliday Inn Express Red Deer 2803 50 Ave, Red Deer, AB Hotel 92 x xQuality Inn & Conference Centre Red Deer 7150 - 50th Avenue, Red Deer, AB Hotel 114 x x x xRadisson Hotel Red Deer 500 67 St, Red Deer, AB Hotel 142 x x xRamada Red Deer Hotel & Suites 6853 66 St, Red Deer, AB Hotel 90 x x xBaymont Inn & Suites Red Deer (former Red Deer Lodge Hotel and CC) 4311 49 Ave, Red Deer, AB Hotel 233 x x x xSandman Hotel Red Deer 2818 Gaetz Ave, Red Deer, AB Hotel 143 x x xSheraton Red Deer 3310 50 Ave, Red Deer, AB Hotel 241 x x xSuper 8 Red Deer City Centre 4217 50 Ave, Red Deer, AB Hotel 86 x xTravelodge Red Deer 2807-50 Avenue, Red Deer, AB Motel 135 x xMotel 6 Red Deer 5001 19 St #900, Red Deer, AB Motel 76 xSuper 8 Red Deer 7474 Gaetz Ave, Red Deer, AB Motel 74 x xTownePlace Suites by Marriott Red Deer 6822 66 St, Red Deer, AB Hotel 92 x x xAladdin Motor Inn Red Deer 7444 Gaetz Ave, Red Deer, AB Motel 80
Total Red Deer Rooms 2,093Properties 19
Days Inn Innisfail (former Best Western Inn) 5010 40 Ave, Innisfail, AB Hotel 66 x xEcono Lodge Inn & Suites Innisfail 5004 42 Ave, Innisfail, AB Hotel 46 xSuper 8 Innisfail 4704 42 Ave, Innisfail, AB Hotel 50 x xMotel 6 Innisfail 4512 42 Ave, Innisfail, AB Motel 36Bluebird Motel 4001 48 Ave, Innisfail, AB Motel 45
Total Innisfail Rooms 243Properties 5
Best Western Plus Chateau Inn Sylvan Lake 5027 Lakeshore Dr, Sylvan Lake, AB Hotel 72 x x xComfort Inn & Suites Sylvan Lake 13 Beju Industrial Drive, Sylvan Lake, AB Hotel 62 x xEdgewater Inn Sylvan Lake 5217 Lakeshore Dr, Sylvan Lake, AB Motel 20Lost Harbour Inn Sylvan Lake 5312 Lakeshore Dr, Sylvan Lake, AB Motel 28 xRaccoon Lodge Motel 4515 Lakeshore Dr, Sylvan Lake, AB Motel 28Beachfront Resort 4505 Lakeshore Dr, Sylvan Lake, AB Motel 20Days Inn Sylvan Lake 5004 33rd Street, Sylvan Lake, AB Hotel 41 x
Total Sylvan Lake Rooms 271Properties 7
Hampton Inn & Suites By Hilton Red Deer 128 Leva Ave, Red Deer County, AB Hotel 110 x x xHoliday Inn Hotel & Suites Red Deer South 33 Petrolia Dr, Red Deer County, AB Hotel 114 x x xHoward Johnson Inn Red Deer 71 Gasoline Alley East, Red Deer, AB Hotel 76 xMicrotel Inn & Suites by Wyndham Red Deer 126 Leva Ave, Red Deer County, AB Hotel 100 x x xWestern Budget Motel Red Deer #1 37468 Hwy 2 S, Red Deer County, AB Motel 59 x xWestern Budget Motel Red Deer #2 37549 Hwy 2 S, Red Deer County, AB Motel 110 x xElnora Hotel 407 Main St, Elnora, AB Motel 4Empire Inn & Suites (former Econolodge Red Deer) 37433 Highway 2 South, Red Deer, AB Motel 55 xSouth Hill Motor Inn Red Deer 73 Gasoline Alley East, Red Deer, AB Motel 38 x
Total Red Deer County Rooms 666Properties 9
TOTAL RED DEER COUNTY & AREA Rooms 3,273Properties 40
Sources: Central Alberta Features Inventory Database and CBRE Research
RED DEER COUNTY & AREA FIXED ROOF ACCOMMODATION INVENTORY
Inn
isfa
ilC
ity o
f Re
d D
eer
Sylv
an
La
keRe
d D
eer
Co
unty

Tourism Red Deer Date: January 31, 2018
CENTRAL ALBERTA TOURISM ALLIANCE ACCOMMODATION STUDY
59
VALUATION & ADVISORY SERVICES
Data compiled by CBRE for the performance of the Red Deer County & Area market over the past two years is summarized as follows:
• Red Deer County & Area (including Red Deer, Sylvan Lake, Red Deer County and Innisfail) represents approximately 69% of the Central Alberta region inventory.
• Relative to the region, the Red Deer County & Area market has achieved comparable results in terms of both occupancy and ADR, which is reasonable given it represents the greatest proportion of the inventory.
• In terms of supply, a 100 room Microtel opened in Gasoline Alley in Red Deer County in early 2015. In the City of Red Deer, the former Red Deer Lodge reopened some rooms to full inventory after a renovation and branding to a Baymont Inn & Suites in January 2016. And, in spring 2015, a 41 room Days Inn opened in Sylvan Lake.
• Looking forward, a 79 room Holiday Inn Express Red Deer North opened in late February 2017. Its sister property, an 80 room Staybridge Suites is proposed for construction, however, at the time of this report, construction had not started and timing is unknown.
The estimated market segmentation for Red Deer County & Area in 2016 is as follows:
• Market segmentation for Red Deer County & Area is dominated by the characteristics of travel segments in the City of Red Deer hotels and those in Gasoline Alley.
• Corporate travel is the largest generator of room demand in the competitive market, followed closely by leisure travel due to the City of Red Deer. Red Deer also has a healthy meeting/conference market because its location half way between Edmonton and Calgary. Many firms doing business in both major cities are known to meet in Red Deer.
Year RoomsRooms
Available% Change
Rooms Occupied
% Change Occupancy Change ADR % Change RevPAR % Change
2015 2929 1,069,085 - 489,024 - 45.7% - $110.11 - $50.37 -
2016 3194 1,165,810 9.0% 446,111 -8.8% 38.3% -7.5 $104.41 -5.2% $39.95 -20.7%
Competitive Market Performance Results - Red Deer County
Source: CBRE Hotels

60 CENTRAL ALBERTA TOURISM ALLIANCE ACCOMMODATION STUDY
Tourism Red Deer Date: January 31, 2018
VALUATION & ADVISORY SERVICES
• Sylvan Lake is predominantly a leisure market due to the lake itself. The Town is very much a summer destination when leisure travel is at its peak. In the recent past, Sylvan Lake also enjoyed some corporate demand related to the energy sector and nearby projects, however, much of that demand was lost with the economic downturn.
• Innisfail enjoys a prominent location on the highway, therefore, many stays are related to highway traffic. It is one of the few communities between Calgary and Edmonton whose hotels are visible from Highway 2. The highway demand would be a mix of all travel segments. Innisfail’s corporate demand is largely comprised of crews related to activity for hydro, road construction, and some nearby oil and gas projects.
City of Red Deer with Gasoline Alley
Given that Red Deer is the largest market within the Central Alberta region, we are able to provide a look at the performance of the City of Red Deer, with Gasoline Alley hotels included, separate from the rest of the County. The historic market performance is provided for the five-year period between 2012 and 2016.
The current competitive market (as at the end of 2016) for Red Deer is comprised of 28 properties with 2,680 rooms or 978,200 available room nights. This includes hotels in both the City of Red Deer and Red Deer County along Gasoline Alley and is comprised of both branded and unbranded hotels and motels, but does not include any cabins, lodges or resorts.
Based on our research, the competitive City of Red Deer and Gasoline Alley market has achieved the following results in recent years.
• The competitive market has experienced fluctuating levels of occupancy over the past five years. After experiencing a slight decline in occupancy in 2013, the market grew steadily in 2014 to reach 60.4%. The economic climate of the Province overall was healthy at that time and oil prices were at a high at over $100 per barrel.
• In 2015, the Provincial economy contracted sharply as oil prices plunged and several projects were halted. As a result, the City of Red Deer and Gasoline Alley market occupancy dropped to below 50% that year.
Year RoomsRooms
Available% Change
Rooms Occupied
% Change Occupancy Change ADR % Change RevPAR % Change
2012 2488 908,120 - 503,727 - 55.5% - $103.05 - $57.16 -
2013 2488 910,608 0.3% 501,477 -0.4% 55.1% -0.4 $105.45 2.3% $58.07 1.6%
2014 2486 907,390 -0.4% 547,765 9.2% 60.4% 5.3 $107.73 2.2% $65.03 12.0%
2015 2446 892,790 -1.6% 429,089 -21.7% 48.1% -12.3 $110.93 3.0% $53.31 -18.0%
2016 2680 978,200 9.6% 395,231 -7.9% 40.4% -7.7 $105.41 -5.0% $42.59 -20.1%
Compounded Annual Growth Rate 1.9% -5.9% -7.6% 0.6% -7.1%
Competitive Market Performance Results - Red Deer City (with Gasoline Alley)
Source: CBRE Hotels

Tourism Red Deer Date: January 31, 2018
CENTRAL ALBERTA TOURISM ALLIANCE ACCOMMODATION STUDY
61
VALUATION & ADVISORY SERVICES
• The economic struggles continued into 2016 and market demand fell a further 8%. Simultaneously, the hotel market in Red Deer grew with new supply, resulting in an overall occupancy of just 40%.
• Despite decreases in overall demand, the market managed to grow average daily rate at between 2% and 3% per year between 2012 and 2015. In 2016, however, market ADR declined by more than $5, resulting in an overall RevPAR decline of 20%.
Room Supply Changes
• Room inventory remained steady in 2012 and 2013 in the competitive market but decreased very slightly in 2014. The late year opening of the 92 room TownePlace Suites hotel was offset by the closure of some rooms at the Red Deer Lodge.
• In February 2015, the Red Deer Lodge began renovation of its guest rooms and rebranding. The property opened its full inventory of 233 rooms as the Baymont Inn & Suites in January 2016.
• Also in early 2015, the 100 room Microtel in Gasoline Alley opened.
• The most recent addition to supply in the competitive market was the opening of the 79 room Holiday Inn Express Red Deer North which opened late February 2017.
• Looking forward, there are no confirmed supply additions expected in the market.
• Of note is the proposal for an 80 room Staybridge Suites hotel to be constructed adjacent the new Holiday Inn Express Red Deer North. At the time of this report, construction had not begun and timing is unknown.
Market Segmentation for the City of Red Deer and Gasoline Alley market was not materially different than the segmentation for the County and area as a whole in 2016.

62 CENTRAL ALBERTA TOURISM ALLIANCE ACCOMMODATION STUDY
Tourism Red Deer Date: January 31, 2018
VALUATION & ADVISORY SERVICES
CITY OF RED DEER

Tourism Red Deer Date: January 31, 2018
CENTRAL ALBERTA TOURISM ALLIANCE ACCOMMODATION STUDY 63
VALUATION & ADVISORY SERVICES
RED DEER COUNTY

64 CENTRAL ALBERTA TOURISM ALLIANCE ACCOMMODATION STUDY
Tourism Red Deer Date: January 31, 2018
VALUATION & ADVISORY SERVICES
SYLVAN LAKE

Tourism Red Deer Date: January 31, 2018
CENTRAL ALBERTA TOURISM ALLIANCE ACCOMMODATION STUDY 65
VALUATION & ADVISORY SERVICES
INNISFAIL

66 CENTRAL ALBERTA TOURISM ALLIANCE ACCOMMODATION STUDY
Tourism Red Deer Date: January 31, 2018
VALUATION & ADVISORY SERVICES
Projected Market Performance
To project the performance of the Central Alberta fixed roof accommodation markets going forward, it is reasonable to look to the travel forecasts prepared by the Conference Board of Canada. In Autumn 2017, the Conference Board of Canada released the most recent Travel Market Outlooks for the 2017 to 2021 period. The projections for Alberta overall, Calgary, Edmonton and Other Alberta are summarized below.
As shown, the projections for growth in overnight visits are relatively consistent between the market categories, ranging between 1.9% and 3.7% annually over the next five years. The Central Alberta region falls into “Other Alberta” and there is no significant difference between growth projections in Other Alberta and the rest of the Province, including the two major cities of Edmonton and Calgary. This measure is a strong basis for our projections for demand growth for the fixed roof accommodation sector in the Central region.
Clearwater County & Area
Market demand and average daily rate projections for Clearwater County & Area are summarized as follows:
• There are no known supply additions projected for the market in the short term.
Alberta 2017 2018 2019 2020 2021Total ('000s overnight province visits) 15,018 15,370 15,694 16,044 16,365
3.6 2.3 2.1 2.2 2.0CalgaryTotal ('000s overnight city visits) 3,743 3,838 3,933 4,033 4,126
3.7 2.5 2.5 2.5 2.3EdmontonTotal ('000s overnight city visits) 3,243 3,319 3,388 3,461 3,528
3.2 2.4 2.1 2.1 1.9Other Alberta
Total ('000s overnight city visits) 8,032 8,213 8,373 8,550 8,711-- 2.3 1.9 2.1 1.9
Source: CBRE, The Conference Board of Canada, Fall 2017 Preliminary Outlook
PROVINCIAL TRAVEL MARKET OUTLOOK
Actual Actual Forecast Projection2015 2016 2017 2018 2019 2020 2021
Available Room Nights 268,275 268,275 268,275 268,275 268,275 268,275 268,275Occupied Room Nights 150,937 113,415 131,785 134,421 137,109 139,851 142,648Market Occupancy 56% 42% 49% 50% 51% 52% 53%Demand Growth -24.9% 16.2% 2.0% 2.0% 2.0% 2.0%Market Average Daily Rate $120 $116 $116 $119 $121 $124 $126Rate Growth -2.7% 0.0% 2.0% 2.0% 2.0% 2.0%Source: CBRE Hotels
Market Projections - Clearwater County

Tourism Red Deer Date: January 31, 2018
CENTRAL ALBERTA TOURISM ALLIANCE ACCOMMODATION STUDY
67
VALUATION & ADVISORY SERVICES
• Based on year to date performance as of September 2017, the market is projected to grow 16% in demand in 2017. Much of this is driven by improved performance in Rocky Mountain House.
• Demand is projected to grow 2.0% per year thereafter, with the market set to reach 53% by 2021.
• By 2021, market demand is projected to still be approximately 8,300 room nights behind levels achieved in 2015.
• In 2017, market ADR is on pace to be flat to 2016 levels but is projected to grow 2.0% annually between 2018 and 2021.
Lacombe County & Area
Market demand and average daily rate projections for Lacombe County & Area are summarized as follows:
• There are no known supply additions projected for the market in the short term; however, there is one property, the Empress Hotel – 44 rooms, that has permanently closed effective September 2017.
• Based on year to date performance as of September 2017, market demand is projected to be flat in 2017. With the decline in market supply, occupancy is expected to improve to 41%.
• While supply grew by approximately 17% in 2016, demand levels have been flat over the past 3 years (2015 to 2017), and are not expected to modestly improve until 2018.
• Demand is projected to grow 2.0% in 2018 and each year thereafter. With the balance of rooms associated with the Empress Hotel coming out of the market in 2018, occupancy is expected to grow to 46% that year and reach 48% by 2021.
• In 2017, market ADR is on pace to grow 1.0%, followed by projections of growth of 2.0% annually between 2018 and 2021.
Actual Actual Forecast Projection2015 2016 2017 2018 2019 2020 2021
Available Room Nights 118,625 138,700 133,347 122,640 122,640 122,640 122,640Occupied Room Nights 54,736 54,804 54,800 55,896 57,014 58,154 59,317Market Occupancy 46% 40% 41% 46% 46% 47% 48%Demand Growth 0.1% 0.0% 2.0% 2.0% 2.0% 2.0%Market Average Daily Rate $95 $103 $104 $106 $108 $110 $113Rate Growth 8.2% 1.0% 2.0% 2.0% 2.0% 2.0%Source: CBRE Hotels
Market Projections - Lacombe County

68 CENTRAL ALBERTA TOURISM ALLIANCE ACCOMMODATION STUDY
Tourism Red Deer Date: January 31, 2018
VALUATION & ADVISORY SERVICES
Mountain View County & Area
Market demand and average daily rate projections for Mountain View County & Area are summarized as follows:
• One known supply addition involves the development of 10 rooms at the Schott’s Lake RV and Guest Ranch (which is located approximately 55 kilometres to the west of Olds). These rooms have been projected to enter the market in January 2018.
• Based on year to date performance as of September 2017, market demand is projected to grow 1.0% in 2017.
• Demand is projected to grow 2.0% per year between 2018 and 2021, with the market set to reach 40% by 2021.
• By 2021, market demand is projected to still be approximately 3,600 room nights behind levels achieved in 2015.
• In 2017, market ADR is on pace to grow 1.5%, followed by projections of growth of 2.0% annually between 2018 and 2021.
Red Deer County & Area
Market demand and average daily rate projections for Red Deer County & Area are summarized as follows:
• One recent supply addition to the City of Red Deer involves the opening of the 79 room Holiday Inn Express Red Deer North in February 2017. Reportedly, a 42 room Suites Weekly Hotel is projected to open in November 2017 in Gasoline Alley and offer extended stay units. The property is expected to also have an additional 50 units of monthly rentals (not accounted for in this analysis).
Actual Actual Forecast Projection2015 2016 2017 2018 2019 2020 2021
Available Room Nights 126,655 126,655 126,655 130,305 130,305 130,305 130,305Occupied Room Nights 55,948 47,891 48,370 49,337 50,324 51,331 52,357Market Occupancy 44% 38% 38% 38% 39% 39% 40%Demand Growth -14.4% 1.0% 2.0% 2.0% 2.0% 2.0%Market Average Daily Rate $113 $109 $111 $113 $115 $117 $120Rate Growth -3.8% 1.5% 2.0% 2.0% 2.0% 2.0%Source: CBRE Hotels
Market Projections - Mountain View County
Actual Actual Forecast Projection2015 2016 2017 2018 2019 2020 2021
Available Room Nights 1,069,085 1,165,810 1,193,676 1,209,975 1,209,975 1,209,975 1,209,975Occupied Room Nights 489,024 446,111 462,954 472,213 495,823 500,782 510,797Market Occupancy 46% 38% 39% 39% 41% 41% 42%Demand Growth -8.8% 3.8% 2.0% 5.0% 1.0% 2.0%Market Average Daily Rate $110 $104 $100 $102 $104 $106 $108Rate Growth -5.2% -4.0% 2.0% 2.0% 2.0% 2.0%Source: CBRE Hotels
Market Projections - Red Deer County

Tourism Red Deer Date: January 31, 2018
CENTRAL ALBERTA TOURISM ALLIANCE ACCOMMODATION STUDY
69
VALUATION & ADVISORY SERVICES
• An 80 room Staybridge Suites is proposed for development adjacent to the newly opened Holiday Inn Express Red Deer North. However, the property is not currently under construction and has not been included in this analysis.
• There are no confirmed supply additions projected for Sylvan Lake, Innisfail or any other areas of Red Deer County within the next 5 years. However, meetings are underway with potential developers in Sylvan Lake regarding a potential hotel/conference facility.
• Based on year to date performance as of September 2017, market demand is projected to grow 3.8% in 2017. Both Red Deer and Sylvan Lake have experienced moderate growth in demand in 2017.
• Demand is projected to grow 2.0% in 2018 and a further 5.0% in 2019. The strong growth in 2019 is related to the Canada Winter Games which are being held in Red Deer in February/March. In 2020, that one-time event demand will not return, however, it is projected the market will grow demand 1.0% in consideration of overall improved market conditions. Market occupancy is projected to be 42% by 2021.
• By 2019, demand levels are projected to return to results achieved in 2015.
• In 2017, market ADR is on pace to be down 4.0% for the year, finishing at just $100. With growth projections of 2.0% annually between 2018 and 2021, market ADR is projected to reach $108 by 2021.
City of Red Deer with Gasoline Alley
Market demand and average daily rate projections for the City of Red Deer, with Gasoline Alley hotels, are summarized as follows:
• As previously noted, one recent supply addition to the City of Red Deer involves the opening of the 79 room Holiday Inn Express Red Deer North in February 2017. Reportedly, a 42 room Suites Weekly Hotel is projected to open in November 2017 in Gasoline Alley and offer extended stay units. The property is expected to also have an additional 50 units of monthly rentals (not accounted for in this analysis).
• An 80 room Staybridge Suites is proposed for development adjacent to the newly opened Holiday Inn Express Red Deer North. However, the property is not currently under construction and has not been included in this analysis.
• Based on year to date performance as of September 2017, market demand is projected to grow 4.0% in 2017. The new Holiday Inn Express that opened toward the beginning of the year has allowed for increased capacity in the market at peak times.
• Demand is projected to grow 2.0% in 2018 and a further 5.0% in 2019. The strong growth in 2019 is related to the Canada Winter Games which are being held in the City in February/March. In 2020, that one-time event demand will not return, however, it is
Actual Actual Forecast Projection2015 2016 2017 2018 2019 2020 2021
Available Room Nights 972,360 978,200 1,006,066 1,022,365 1,022,365 1,022,365 1,022,365Occupied Room Nights 445,080 395,231 411,040 419,261 440,224 444,627 453,519Market Occupancy 46% 40% 41% 41% 43% 43% 44%Demand Growth -11.2% 4.0% 2.0% 5.0% 1.0% 2.0%Market Average Daily Rate $110 $105 $101 $103 $105 $107 $110Rate Growth -4.3% -4.0% 2.0% 2.0% 2.0% 2.0%Source: CBRE Hotels
Market Projections - City of Red Deer (with Gasoline Alley)

70 CENTRAL ALBERTA TOURISM ALLIANCE ACCOMMODATION STUDY
Tourism Red Deer Date: January 31, 2018
VALUATION & ADVISORY SERVICES
projected the market will grow demand 1.0% in consideration of overall improved market conditions. Market occupancy is projected to reach 44% by 2021.
• By 2020, demand levels are projected to return to results achieved in 2015.
• In 2017, market ADR is on pace to be down 4.0% for the year, finishing at just $101. With growth projections of 2.0% annually between 2018 and 2021, market ADR is projected to reach $110 in 2021.
Central Alberta Region
The projections for each county presented above translate to the following market demand and average daily rate projections for the Central Alberta region as a whole:
• Room supply has grown by 8.8% over the 2015 to 2017 period.
• Based on year to date performance as of September 2017, market demand is projected to grow 5.2% in 2017.
• Demand is projected to grow 2.0% in 2018 and a further 4.0% in 2019, boosted by the hosting of the Canada Winter Games in the region. It is projected the market will grow demand each year thereafter in consideration of overall improved market conditions. Market occupancy for the region is projected to reach 44% by 2021.
• By 2020, demand levels (in terms of occupied room nights) are projected to return to results achieved in 2015.
• In 2017, the region’s ADR is on pace to be down 2.5% for the year, finishing at $104. With growth projections of 2.0% annually between 2018 and 2021, ADR is projected to reach $113 by 2021.
Actual Actual Forecast Projection2015 2016 2017 2018 2019 2020 2021
Available Room Nights 1,582,640 1,699,440 1,721,952 1,731,195 1,731,195 1,731,195 1,731,195Occupied Room Nights 750,278 662,648 697,426 711,374 739,829 750,187 765,191Market Occupancy 47% 39% 41% 41% 43% 43% 44%Demand Growth -11.7% 5.2% 2.0% 4.0% 1.4% 2.0%Market Average Daily Rate $111 $107 $104 $106 $108 $110 $113Rate Growth -4.0% -2.5% 2.0% 2.0% 2.0% 2.0%Source: CBRE Hotels
Market Projections - Central Alberta Region

Tourism Red Deer Date: January 31, 2018
CENTRAL ALBERTA TOURISM ALLIANCE ACCOMMODATION STUDY
71
VALUATION & ADVISORY SERVICES
Strategic Implications
As indicated, the Central Alberta fixed roof accommodation market of study achieved an occupancy of 39% at an average daily rate of $106.67 in 2016. This equates to RevPAR at just $42. Based on an estimate of year to date results, the market is not expected to make any strides in 2017, and is, in fact, projected to remain flat in RevPAR to 2016 levels, largely driven by a further decrease in average daily rate. Including an examination of the market on a county by county basis, the performance results indicated only one submarket to have achieved better than 40% occupancy in 2016 (Clearwater County at 42%).
Stakeholder interviews and subsequent analysis confirm that there is a “need” for additional hotel facilities in Central Alberta; however, this study also identifies that the depth of the market is limited in many regions, and there would be significant risk and challenges in building such a facility, whatever the size. In that respect, a new hotel would assist in attracting more demand, but will not attract demand in and of itself. As such, it is difficult to suggest at this time that the accommodation sector in Central Alberta can support new fixed roof accommodation in any particular market in the short to mid term within an increase in demand. Attracting more demand to the City will require a certain evolution. It means making Central Alberta more of a must-see destination, and increasing the number of demand generators – particularly for the corporate, tourist, and meeting/conference segments. In order to generate more demand for each of these segments, that will eventually translate into occupied room nights for a hotel, communities need to continue efforts to develop off-season product, such as festivals and events for the leisure market, packaging experiences and connecting to tour operators, and looking for opportunities to grow meeting / conference demand – all of which is discussed in the Central Alberta Accommodation Strategic Framework section of this report.
Thus, while there is demand and community support for a hotel development in Central Alberta, seasonality of visitation and the current lack of significant corporate demand generators, none of the submarkets are currently generating strong enough year-round occupancies to meet typical investor/developer criteria. Hotels are built in response to the demand for accommodation, and the growth in available room nights (supply) is in response to the growth in demand. In the City of Red Deer and Gasoline Alley market, the decline in occupancy levels in 2016 and 2017 over previous levels, provides an indication of how demand is being accommodated by new supply. Central Alberta Region is a market that has operated at less than 60% for a number of reasons, including: proximity to larger urban markets (Calgary, Edmonton), the small size of most communities, and the quality of many existing accommodations.
Despite current market performance levels, expectations for the future growth of Central Alberta’s accommodation market are positive. The Conference Board of Canada has projected roughly 2.0% growth per year in overnight visits for the Province as a whole over the 2017 to 2021 period, as well as for Edmonton and Calgary. Drawn from that, overnight visit growth also appears to be in the range of 2.0% per year for “Other Alberta” which would include the Central region. This measure is a strong basis for our projections for demand growth for the fixed roof accommodation sector in the Central region.
While the data provided for the Central Alberta region only examined the past two years, it is reasonable to suggest that the region’s performance has closely mirrored that of the City of Red Deer with Gasoline Alley due to its sample size relative to the region overall. Therefore, a look back to 2014 suggests the occupancy

72 CENTRAL ALBERTA TOURISM ALLIANCE ACCOMMODATION STUDY
Tourism Red Deer Date: January 31, 2018
VALUATION & ADVISORY SERVICES
performance of the Central Alberta region was likely upwards of 20 points higher than 2016 results. At 60% occupancy, it still may be difficult to suggest additional hotel supply would be economically feasible in the short to mid term, however, with continued growth, the opportunity to consider hotel development would arise much sooner.
Generally speaking, a minimum 65% occupancy is desired for a new hotel to perform at or above market levels. To put it in relative terms, an examination of Red Deer County indicates that total occupied room nights in 2017 would be approximately 760,000 at 65% occupancy. Our projections indicate 2017 occupied room nights to be at just 463,000. By 2021, demand levels in the Red Deer County market are projected to reach 511,000 – which is still approximately 250,000 occupied room nights short. To get there, the market would have to grow roughly 13.5% per year, which is unlikely to happen in any market.
Various economic reports for the Province of Alberta suggest there will be stronger growth in GDP in 2018 than there has been in the last three years, because of improvement in several areas including employment, retail sales, government spending, and oil prices, to name a few. As such, it is expected that corporate demand will begin to increase in many of the market areas. However, it is important for communities to keep in mind that with the strong likelihood that energy price recovery will be slow and prolonged over an extended period, the accommodation sector will continue to face challenges in significantly improving occupancy performance in the short term.
The prolonged downturn in prices in the energy sector has substantially reinforced the need for the Province to diversify its economic base. Currently the accommodation sector is faced with the same challenge. Corporate demand aside, much of the leisure, meeting/conference and government demand for hotels has been tied back to the oil and gas sector. Municipalities, including those in Central Alberta, need to pursue opportunities to increase Sunday to Thursday demand through other corporate activity, additional government demand, and meetings and conferences and seminars. It is also important to continue the promotion of locally based health and wellness facilities and for those communities that have tourism highlights and attractions, that these are effectively marketed and promoted to encourage more overnight leisure visitation.
The greatest opportunity lies in the ability of communities to create diversity away from the reliance and dependence on oil and gas related activity to improve accommodation performance levels.

Central Alberta Non-Fixed Roof Accommodation Market Analysis
Cen
tra
l A
lber
ta T
ou
rism
Alli
an
ce A
cco
mm
od
atio
n S
tud
y

74 CENTRAL ALBERTA TOURISM ALLIANCE ACCOMMODATION STUDY
Tourism Red Deer Date: January 31, 2018
VALUATION & ADVISORY SERVICES
Introduction on Property Types/Classifications of Markets The following section provides an overview of the current 2017 estimated performance of the non-fixed roof accommodation market in Central Alberta. The analysis has been based on CBRE’s telephone interviews with 14 operators of the 51 municipal and privately-owned campgrounds located in Central Alberta, representing close to one-third of the available campsites, together with a review of publicly available data on the operating season, facilities, and rental rates of the full inventory of 51 municipal and privately-owned campgrounds in the region. For the purposes of this analysis, non-fixed room accommodations include:
o Campgrounds (serviced, un-serviced, group) – municipal, private and public/private (i.e. municipally owned and privately managed)
o RV Parks
All provincial and federally owned campgrounds have been excluded from the analysis including:
o Campgrounds – Alberta Parks, Parks Canada, Provincial Recreation Areas
Four Season RV Resorts have also been excluded, as these have not been analyzed for market performance.
Campground sites have been classified by level of service:
• Full Serviced – includes electrical, water and sewer service • Semi Serviced – includes electrical service and/or water • Unserviced – only offer tent pads/a portion of land and separate amenities (e.g., facility
of toilets, showers and water)
Provincial Market Performance
Alberta Camping Behaviour Trends Recent statistics and documentation relative to overnight camping behaviour in Alberta is relatively limited, and minimal for Central Alberta. Alberta Parks is currently undertaking a study on Comfort Camping on Parks properties, but this study will not be finalized and made public until 2018. Based on discussions with the Project Manager at Alberta Parks, current data indicates that Alberta campers are staying closer to home, and tend to travel within 2 hours of home for either pure camping or comfort camping options. The typical demographic includes travellers interested in family getaways or older couples without kids. Based on the Economic Impact and Trend Analysis of the Canadian Camping Industry, which was completed by SOM Research & Surveys for the Canadian Camping and RV Council in 2015, the typical Canadian camper is a young (18 to 34 years old) English-speaking adult with a college or technical education. Campers tend to be concentrated in upper middle classes of income, and about 70% are employed, often as professionals, and approximately 40% camp with children.

Tourism Red Deer Date: January 31, 2018
CENTRAL ALBERTA TOURISM ALLIANCE ACCOMMODATION STUDY
75
VALUATION & ADVISORY SERVICES
According to this study, no significant differences exist regarding education, family income or employment status between the provinces, but there is a larger percentage of campers 65 years old and over in Alberta (13%). An estimated 37% of RV users are 55 years old and over, as compared to 13% of tent users. In relation to the aging demographic, there are 3 times more retired campers among RV users (24% vs 8%), and 26% of RV users have a family income above $100,000 compared to 19% of tent users. As of 2015, Alberta offered 699 campgrounds and 47,491 campsites, for an average of 68 sites per campground. At these levels, Alberta makes up 17% of Canada’s campgrounds, and 11% of overall campsites, with a lower number of sites per campground. The highest proportion of Alberta campgrounds are provincial (37%), whereas the Canadian average is 55% privately-owned campgrounds. Alberta also has a higher than average share of unserviced and serviced overnight sites, as compared to seasonal only sites (36%), yet the amperage at Alberta campsites is lower than the national average at 47% 15/20 amp sites, vs. Canada’s average of 28%. In 2014, 18% of Canadian campers camped in Alberta, and 19% were overnight only while 15% were seasonal only campers (i.e. staying in the same campground). According to the 2015 study, at least 80% of campers from each province camp within their own province. Further, RVs are most popular in Alberta and Saskatchewan, as compared to tents, which are more popular in Ontario. When looking at the most frequently used types of camping equipment across the country, 23% of Albertan used trailers, as compared to the national average of 16%, and 12% used fifth wheel RVs, as compared to the 8% average. Furthermore, the average number of trips taken by Alberta campers was 5.6, as compared to the national average of 4.1, and they stayed longer – at an average of 14.8 nights, versus the Canadian average of 13.9 camping nights. With respect to pricing, although the average family per night rates in Alberta are lower than the national average, the seasonal rates are higher, yielding an average seasonal rate of $12 per day, as compared to $10 for the rest of Canada. The following charts demonstrate Alberta’s positioning in comparison to other parts of Canada, based on the data presented in the 2015 Economic Impact and Trend Analysis of the Canadian Camping Industry:
Campgrounds CampsitesAvg Sites per Campground
Alberta 699 47,491 68 Canada 4,231 423,283 100 AB share of CA 17% 11%Source: SOM, Canadian Camping and RV Council, 2015
Total Number of Campgrounds & Campsites in Alberta
Private NFP Municipal Provincial Federal TotalPrivate/ NFP/ Municipal only
Alberta 132 66 215 257 28 698 413% of total 19% 9% 31% 37% 4% 100% 59%Canada 2,347 354 505 907 119 4,231 3,206% of total 55% 8% 12% 21% 3% 100% 76%
6% 19% 43% 28% 24% 16% 13%Source: SOM, Canadian Camping and RV Council, 2015
Total Number of Campgrounds by Type of Ownership in Alberta

76 CENTRAL ALBERTA TOURISM ALLIANCE ACCOMMODATION STUDY
Tourism Red Deer Date: January 31, 2018
VALUATION & ADVISORY SERVICES
Unserviced 1+ services Seasonal only TotalAlberta 17,510 19,430 10,551 47,491% of total 37% 41% 22% 100%Canada 75,850 153,028 193,343 423,283% of total 18% 36% 46% 100%AB share of CA 23% 13% 5% 11%Source: SOM, Canadian Camping and RV Council, 2015
Total Number of Campsites by Level of Service in Alberta
Cottages/ Cabins Yurts Ready-to-camp Total
Alberta 381 12 117 510% of total 75% 2% 23% 100%Canada 7,851 339 2,446 10,636% of total 74% 3% 23% 100%AB share of CA 5% 4% 5% 5%Source: SOM, Canadian Camping and RV Council, 2015
Other Types of Lodging at Campgrounds in Alberta
15/20 amps 30 amps 50 amps TotalAlberta 8,944 8,523 1,375 18,842% of total 47% 45% 7% 100%Canada 38,800 88,887 12,975 140,662% of total 28% 63% 9% 100%AB share of CA 23% 10% 11% 13%Source: SOM, Canadian Camping and RV Council, 2015
Amperage at Campsites in Alberta
Unserviced 1 svc 2 svcs 3 svcs Seasonal onlyAlberta 44% 54% 64% 68% 78%Canada 34% 41% 50% 65% 78%Source: SOM, Canadian Camping and RV Council, 2015
Occupancy Rates by Service Level - Summer 2014 (Private/NFP/Municipal)
Unserviced 1 svc 2 svcs 3 svcs Seasonal RateSeasonal rate/day Operating Days
Alberta $19 $24 $32 $35 $2,377 $12 199BC $27 $31 $34 $39 $2,144 $9 230SK $21 $23 $27 $49 $1,378 $9 149MB $17 $27 $27 $33 $1,492 $10 157ON $31 $36 $40 $44 $1,911 $12 162SK $25 $27 $33 $38 $1,297 $10 134ATL $24 $24 $33 $39 $1,647 $11 154Canada $26 $29 $35 $40 $1,727 $10 167Source: SOM, Canadian Camping and RV Council, 2015
Average Family Per Night Rates by Service Level - Summer 2014 (Private/NFP/Municipal)

Tourism Red Deer Date: January 31, 2018
CENTRAL ALBERTA TOURISM ALLIANCE ACCOMMODATION STUDY
77
VALUATION & ADVISORY SERVICES
A 2009 study by the Praxis Group, entitled Recreational Vehicle Camping in Alberta: A Demand and Supply Side Perspective, further indicates that the Alberta Central Tourism Region (Region 5 as defined by Travel Alberta) comprises almost one-third of campgrounds and campsites in the province, and along with the Northern Alberta Region, offers the greatest number of water-based opportunities in the province (p. 18). At the time that this report was published, which was also a time of economic down turn in the province, the camping industry was increasing, with Western Canadians demonstrating considerable investment in RV camping equipment and among the highest ownership rates in the country. Although most of camping involved RVs in Western Canada, “the majority of campsites are not designed for this type of equipment” (p. 59), which remains a key concern based on more recent research. The addition of Internet access was another key concern at the time of this publication, which is even more prevalent today with most travellers relying on social media and web-based trip planning methods.
Tent Trailer Tent-trailer Fifth wheel Motorhome Truck camperReady-to-
campAB 42% 23% 8% 12% 9% 4% 2%BC 55% 9% 6% 9% 11% 4% 6%SK 44% 18% 4% 15% 9% 1% 9%MB 48% 15% 13% 8% 7% 3% 6%ON 66% 13% 9% 4% 3% 2% 3%QC 52% 18% 8% 7% 6% 1% 8%Atl 54% 17% 6% 8% 2% 3% 10%Canada 55% 16% 8% 8% 6% 2% 5%Source: SOM, Canadian Camping and RV Council, 2015
Most Frequently Used Types of Camping Equipment - 2014
Tent / tent-trailer RV Undecided
AB 23% 47% 30%BC 42% 46% 12%SK 20% 51% 29%MB 34% 45% 21%ON 54% 29% 17%QC 47% 33% 20%Atl 46% 42% 12%Canada 43% 36% 21%Source: SOM, Canadian Camping and RV Council, 2015
Next Camping Equipment to be Purchased
1 2 3 or 4 5 or more Average (trips)Avg Camping
NightsAB 16% 19% 29% 36% 5.6 14.8 BC 22% 22% 28% 28% 4.1 17.5 SK 30% 27% 23% 20% 3.3 9.7 MB 16% 26% 41% 17% 3.9 13.8 ON 27% 23% 29% 21% 3.7 13.9 QC 31% 23% 22% 24% 3.8 11.8 Atl 16% 26% 30% 28% 4.1 14.5 Canada 24% 23% 28% 25% 4.1 13.9 Source: SOM, Canadian Camping and RV Council, 2015
Number of Trips of 1+ Nights in 2014 (Overnight & Hybrid Campers)
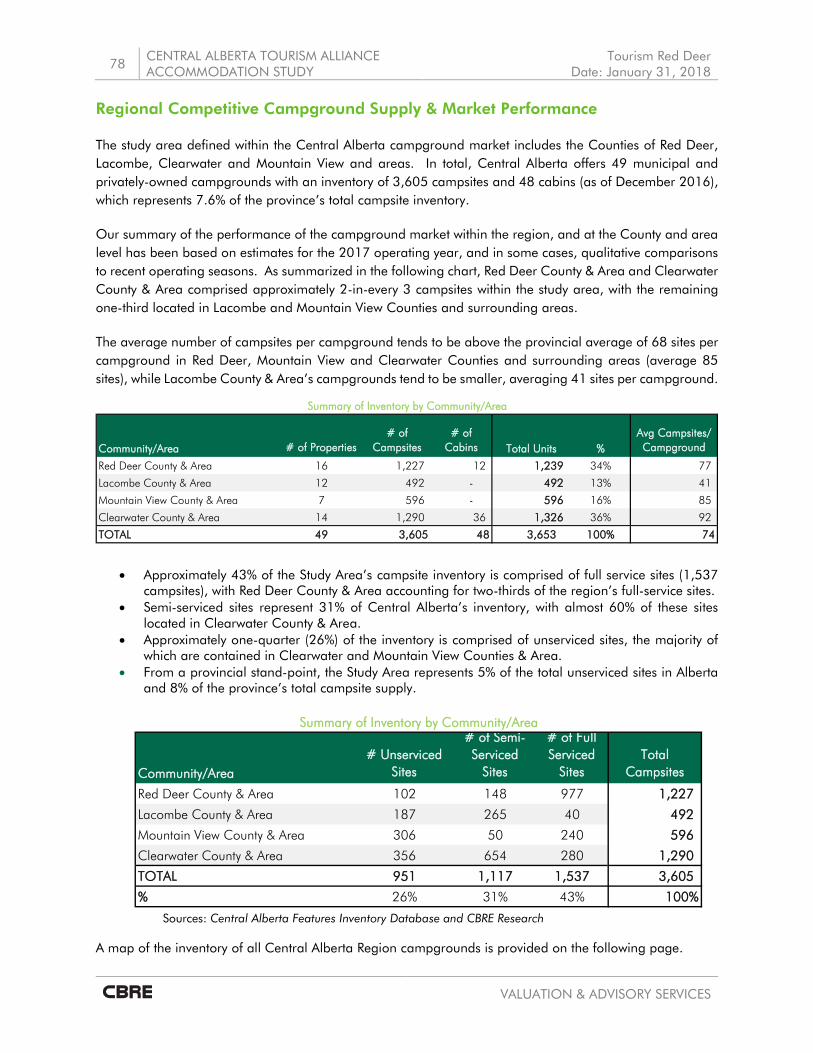
78 CENTRAL ALBERTA TOURISM ALLIANCE ACCOMMODATION STUDY
Tourism Red Deer Date: January 31, 2018
VALUATION & ADVISORY SERVICES
Regional Competitive Campground Supply & Market Performance
The study area defined within the Central Alberta campground market includes the Counties of Red Deer, Lacombe, Clearwater and Mountain View and areas. In total, Central Alberta offers 49 municipal and privately-owned campgrounds with an inventory of 3,605 campsites and 48 cabins (as of December 2016), which represents 7.6% of the province’s total campsite inventory.
Our summary of the performance of the campground market within the region, and at the County and area level has been based on estimates for the 2017 operating year, and in some cases, qualitative comparisons to recent operating seasons. As summarized in the following chart, Red Deer County & Area and Clearwater County & Area comprised approximately 2-in-every 3 campsites within the study area, with the remaining one-third located in Lacombe and Mountain View Counties and surrounding areas.
The average number of campsites per campground tends to be above the provincial average of 68 sites per campground in Red Deer, Mountain View and Clearwater Counties and surrounding areas (average 85 sites), while Lacombe County & Area’s campgrounds tend to be smaller, averaging 41 sites per campground.
• Approximately 43% of the Study Area’s campsite inventory is comprised of full service sites (1,537 campsites), with Red Deer County & Area accounting for two-thirds of the region’s full-service sites.
• Semi-serviced sites represent 31% of Central Alberta’s inventory, with almost 60% of these sites located in Clearwater County & Area.
• Approximately one-quarter (26%) of the inventory is comprised of unserviced sites, the majority of which are contained in Clearwater and Mountain View Counties & Area.
• From a provincial stand-point, the Study Area represents 5% of the total unserviced sites in Alberta and 8% of the province’s total campsite supply.
Sources: Central Alberta Features Inventory Database and CBRE Research A map of the inventory of all Central Alberta Region campgrounds is provided on the following page.
Community/Area # of Properties# of
Campsites# of
Cabins Total Units %Avg Campsites/ Campground
Red Deer County & Area 16 1,227 12 1,239 34% 77
Lacombe County & Area 12 492 - 492 13% 41
Mountain View County & Area 7 596 - 596 16% 85
Clearwater County & Area 14 1,290 36 1,326 36% 92
TOTAL 49 3,605 48 3,653 100% 74
Summary of Inventory by Community/Area
Community/Area# Unserviced
Sites
# of Semi-Serviced
Sites
# of Full Serviced
SitesTotal
Campsites
Red Deer County & Area 102 148 977 1,227
Lacombe County & Area 187 265 40 492
Mountain View County & Area 306 50 240 596
Clearwater County & Area 356 654 280 1,290
TOTAL 951 1,117 1,537 3,605
% 26% 31% 43% 100%
Summary of Inventory by Community/Area

Tourism Red Deer Date: January 31, 2018
CENTRAL ALBERTA TOURISM ALLIANCE ACCOMMODATION STUDY 79
VALUATION & ADVISORY SERVICES
CENTRAL ALBERTA CAMPGROUNDS
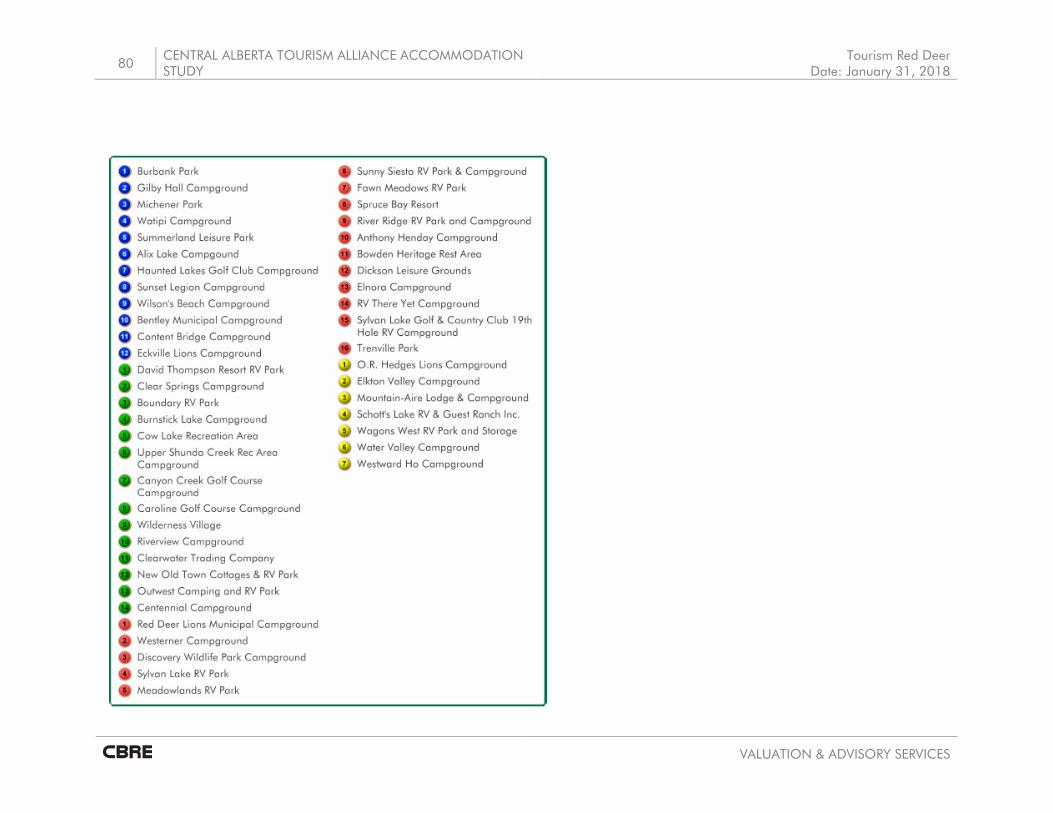
80 CENTRAL ALBERTA TOURISM ALLIANCE ACCOMMODATION STUDY
Tourism Red Deer Date: January 31, 2018
VALUATION & ADVISORY SERVICES

Tourism Red Deer Date: January 31, 2018
CENTRAL ALBERTA TOURISM ALLIANCE ACCOMMODATION STUDY
81
VALUATION & ADVISORY SERVICES
Data compiled by CBRE for the estimated 2017 performance of the Central Alberta campground market is summarized in the following table.
Facilities Total 2017 E
Campgrounds 49# of Unserviced Sites 951 26%
# of Semi Serviced Sites 1,117 31%
# of Full Serviced Sites 1,537 43%
Total Campsites 3,605 100%
# of Cabins 48
Avg Operating Days 195
Transient Utilization Occupancy
Weekdays May - June 12%
Wknds May - June 48%
Weekdays July - August 68%
Weekends July-August 84%
Weekdays September - October 30%
Wknds September - October 41%
Balance of Year 26%
Utilization Occupancy
Seasonal Rentals 75%
Operating Period 56%
Demand
Occupied Campsite
Nights
Estimated Transient Occupied Campsites Nights 167,600 43%
Estimated Seasonal Occupied Campsite Nights 224,200 57%
Total Occupied Campsite Nights 391,800 100%
Segmentation Total
Domestic Albertans 73%
Out of Province Tourists 19%
Groups 2%
Crew/Other 5%
Total 100%
Revenue Total
Avg Transient Rental Rate Per Day $29
Avg Seasonal Rental Rate Per Day $17
Source: CBRE Limited
Competitive Campground Market Performance Results
Central Alberta

82 CENTRAL ALBERTA TOURISM ALLIANCE ACCOMMODATION STUDY
Tourism Red Deer Date: January 31, 2018
VALUATION & ADVISORY SERVICES
It is estimated that the Central Alberta campground market performs in line with the Provincial market, at an occupancy of 56%. Operating periods for the campsites range from 124 days to year-round operations, for an average of 195 operating days, which is also in line the provincial average of 198 days. Weekends in July and August tend to be the busiest period at an average occupancy of 84%, followed by weekdays during July and August at 68%. Based on discussions with operators, it is estimated that Central Alberta attracted an estimated 392,000 occupied campsites in 2017, with approximately 43% of the demand derived from transient use; and 57% from seasonal demand. From a geographic perspective, approximately 73% of the demand is comprised of domestic leisure visitors; with 19% originating from out-of-province visitors, 2% from groups and 5% from crew/other business. With a decline in oil and natural gas production, crew business has diminished over the past few years.
In 2014, provincial campground rates ranged from $19 to $35 for unserviced and fully serviced sites, while
seasonal rental rates averaged $12 per day1. In 2017, the average transient rental rate for Central Alberta is estimated at $29, while seasonal rental rates average $17 per day.
Red Deer County & Area
Red Deer County & Area offers 16 campgrounds, which range in size from 23 sites to 207 sites, for an average of 77 sites. For the most part, operating seasons range from 124 days to 193 days, with 3 campgrounds open on a year-round basis.
An inventory of these properties is provided in the following table, followed by a map of their respective locations:
1 Economic Impact and Trend Analysis of the Canadian Camping Industry, SOM Research & Surveys for the Canadian Camping and RV Council, 2015

Tourism Red Deer Date: January 31, 2018
CENTRAL ALBERTA TOURISM ALLIANCE ACCOMMODATION STUDY 83
VALUATION & ADVISORY SERVICES
Community TentingTotal # of
Sites# of
CabinsRed Deer Lions Municipal Campground City of Red Deer Serviced Campground x 138 public/private Seasonal - May 1 to Sept 30Westerner Campground City of Red Deer Serviced Campground 98 municipal Year RoundDiscovery Wildlife Park Campground Innisfail Serviced Campground x 69 private Seasonal - May 1 to Oct 9Anthony Henday Campground Innisfail Serviced Campground x 42 municipal Seasonal - May 1 to Oct 15Sylvan Lake RV Park Sylvan Lake RV Park 88 private Seasonal - May 1 to Sept 30Meadowlands RV Park Sylvan Lake Serviced Campground x 95 private Seasonal - May 1 to Oct 15Sunny Siesta RV Park & Campground Sylvan Lake RV Park 99 private Seasonal - Apr 1 to Oct 1Fawn Meadows RV Park Red Deer County Serviced Campground 32 2 private Year RoundSpruce Bay Resort Red Deer County Serviced / Unserviced 70 10 private Seasonal - May 15 to Sept 15River Ridge RV Park and Campground Red Deer County RV Park 68 private Seasonal - May 1 to Sept 30Bowden Heritage Rest Area Red Deer County Serviced Campground 24 municipal Seasonal - May to OctDickson Leisure Grounds Red Deer County Serviced Campground 207 municipal Seasonal - Apr to mid OctElnora Campground Red Deer County Serviced Campground x 23 private Seasonal - May to OctRV There Yet Campground Red Deer County Serviced Campground x 78 private Year RoundSylvan Lake Golf & Country Club 19th Hole RV Campground Red Deer County Serviced Campground 30 private SeasonalTrenville Park Red Deer County Unserviced Campground x 66 municipal Seasonal - May 1 to Sept 30TOTAL RED DEER COUNTY & AREA Units 1,227 12
PropertiesSources: Central Alberta Features Inventory Database and CBRE Research
16
RED DEER COUNTY & AREA CAMPGROUND INVENTORY
Campground Type
Sites
Seasonal / Year RoundClassification

84 CENTRAL ALBERTA TOURISM ALLIANCE ACCOMMODATION STUDY
Tourism Red Deer Date: January 31, 2018
VALUATION & ADVISORY SERVICES

Tourism Red Deer Date: January 31, 2018
CENTRAL ALBERTA TOURISM ALLIANCE ACCOMMODATION STUDY
85
VALUATION & ADVISORY SERVICES
Campground operations in the Red Deer County & Area tend to achieve slightly higher occupancies compared to Central Alberta overall and offered the most full-service sites.
Approximately 60% of demand is generated by seasonal rentals with 40% derived from transient use. Based on discussions with operators, it is estimated that campgrounds in Red Deer County & Area are projected to attract 137,000 campsite nights in 2017, which represents 35% of total demand in Central Alberta. Weekends during July and August tend to be the busiest period, followed by mid-week periods during the summer months. Spring and fall periods tend to achieve occupancies of 40% to 50%, while campgrounds that are open year-round, tend to achieve occupancies of 10 to 20% during the off season. Most campers come from Calgary and Edmonton, with out of province tourists largely originating from Saskatchewan and the U.S. en route to Alaska. Campground operators also indicated that they previously hosted a significant portion of crew business, and now tend to attract nurses taking courses in the area.
Campgrounds in the Red Deer County & Area account for 64% of the full-service site supply in Central Alberta and tend to achieve the highest rental rates in the study area. In 2017, the average transient rental rate for campgrounds in Red Deer County & Area was estimated at $36, while seasonal rates averaged $21 per day.

86 CENTRAL ALBERTA TOURISM ALLIANCE ACCOMMODATION STUDY
Tourism Red Deer Date: January 31, 2018
VALUATION & ADVISORY SERVICES
Facilities Total 2017 E
Campgrounds 16
# of Unserviced Sites 102 8%
# of Semi Serviced Sites 148 12%
# of Full Serviced Sites 977 80%
Total Campsites 1,227 100%
# of Cabins 12
Avg Operating Days 201
Transient Utilization Occupancy
Weekdays May - June 13%
Wknds May - June 53%
Weekdays July - August 67%
Weekends July-August 83%
Weekdays September - October 32%
Wknds September - October 44%
Balance of Year 15%
Utilization Occupancy
Seasonal Rentals 73%
Operating Period 55%
Demand Occupied Campsite Nights
Estimated Transient Occupied Campsites Nights 55,400 40%
Estimated Seasonal Occupied Campsite Nights 81,700 60%
Total Occupied Campsite Nights 137,100 100%
Segmentation Total
Domestic Albertans 75%
Out of Province Tourists 16%
Groups 1%
Crew/Other 8%
Total 100%
Revenue Total
Avg Transient Rental Rate Per Day $36
Avg Seasonal Rental Rate Per Day $21
Source: CBRE Limited
Competitive Campground Market Performance Results
Red Deer County & Area

Tourism Red Deer Date: January 31, 2018
CENTRAL ALBERTA TOURISM ALLIANCE ACCOMMODATION STUDY
87
VALUATION & ADVISORY SERVICES
Lacombe County & Area
Lacombe County & Area campgrounds tend to be smaller operations with the shortest operating seasons within the Study Area. Lacombe County has an inventory of 12 campgrounds, ranging in size from 11 sites to 113 sites, for an average of 41 sites. All the operations are seasonal, with operating seasons ranging from 109 days to 214 days.
An inventory of these properties is provided in the following table, followed by a map of their respective locations:

88 CENTRAL ALBERTA TOURISM ALLIANCE ACCOMMODATION STUDY
Tourism Red Deer Date: January 31, 2018
VALUATION & ADVISORY SERVICES
Type TentingTotal # of Sites
# of Cabins
Burbank Park Blackfalds Serviced Campground 20 private Seasonal - Apr 1 to Sept 30Gilby Hall Campground City of Lacombe Serviced / Unserviced 20 municipal SeasonalMichener Park City of Lacombe Serviced / Unserviced 37 municipal Seasonal - May 1 to Oct 31Watipi Campground Lacombe County Serviced / Unserviced x 20 private Seasonal - May 19 to Oct 1Summerland Leisure Park Lacombe County RV Park 31 private Seasonal - May 1 to Sept 30Alix Lake Campgound Lacombe County Serviced Campground x 11 private Seasonal - May 1 to Sept 30Haunted Lake Golf Club Campground Lacombe County Serviced Campground x 26 municipal Seasonal - Apr to OctSunset Legion Campground Lacombe County Unserviced Campground x 113 municipal Seasonal - Apr 15 to Sept 15Wilson's Beach Campground Lacombe County Serviced Campground 96 municipal Seasonal
Bentley Municipal Campground Lacombe County Unserviced Campground x 33 municipalSeasonal - May long weekend to Sept long weekend
Content Bridge Campground Lacombe County Serviced / Unserviced x 70 private Seasonal - May to Sept 15Eckville Lions Campground Lacombe County Serviced Campground x 15 private SeasonalTOTAL LACOMBE COUNTY & AREA Units 492 0
PropertiesSources: Central Alberta Features Inventory Database and CBRE Research
LACOMBE COUNTY & AREA CAMPGROUND INVENTORY
Classification
Sites
Campgrounds Community Seasonal / Year Round
12

Tourism Red Deer Date: January 31, 2018
CENTRAL ALBERTA TOURISM ALLIANCE ACCOMMODATION STUDY 89
VALUATION & ADVISORY SERVICES

90 CENTRAL ALBERTA TOURISM ALLIANCE ACCOMMODATION STUDY
Tourism Red Deer Date: January 31, 2018
VALUATION & ADVISORY SERVICES
Occupancy rates averaged 70% over the season, with slightly more seasonal demand (59%) than transient rentals (41%). Based on discussions with operators, it is estimated that campgrounds in Lacombe County & Area are projected to attract an estimated 46,500 campsite nights in 2017, which represents 12% of total demand in Central Alberta. July and August are the heaviest demand periods, with May and June demand largely dependent on the weather and demand falling off after the September long weekend. Most campers come from Airdrie, Cochrane, Calgary and Edmonton, with out of province tourists largely originating from neighbouring provinces of Saskatchewan and B.C. and the U.S. en route to Alaska. Several campground operators generate crew business from the Joffre plant, however, there have been fewer workers in the past 2 years.
In 2017, the average transient rental rate for campgrounds in Lacombe County & Area was estimated at $27, while seasonal rates averaged $14 per day.

Tourism Red Deer Date: January 31, 2018
CENTRAL ALBERTA TOURISM ALLIANCE ACCOMMODATION STUDY
91
VALUATION & ADVISORY SERVICES
Facilities Total 2017 E
Campgrounds 12
# of Unserviced Sites 187 38%
# of Semi Serviced Sites 265 54%
# of Full Serviced Sites 40 8%
Total Campsites 492 100%
# of Cabins 0
Avg Operating Days 135
Transient Utilization Occupancy
Weekdays May - June 13%
Wknds May - June 63%
Weekdays July - August 73%
Weekends July-August 97%
Weekdays September - October 40%
Wknds September - October 50%
Balance of Year 0%
Utilization Occupancy
Seasonal Rentals 90%
Operating Period 70%
Demand Occupied Campsite Nights
Estimated Transient Occupied Campsites Nights 18,900 41%
Estimated Seasonal Occupied Campsite Nights 27,600 59%
Total Occupied Campsite Nights 46,500 100%
Segmentation Total
Domestic Albertans 76%
Out of Province Tourists 21%
Groups 2%
Crew/Other 2%
Total 100%
Revenue Total
Avg Transient Rental Rate Per Day $27
Avg Seasonal Rental Rate Per Day $14
Source: CBRE Limited
Competitive Campground Market Performance Results
Lacombe County & Area

92 CENTRAL ALBERTA TOURISM ALLIANCE ACCOMMODATION STUDY
Tourism Red Deer Date: January 31, 2018
VALUATION & ADVISORY SERVICES
Clearwater County & Area
Clearwater County & Area has an inventory of 14 campgrounds, which range in size from 15 sites to the largest campground in the study area with 389 sites. One campground is open year-round, with the balance open from 134 to 214 days, for an average of 186 operating days.
Although the subject study has only focused on private and municipal campgrounds, it should be noted that Clearwater County also offers the largest number of Provincial campgrounds and Provincial Recreation Areas in Central Alberta, estimated at over 600 sites. An inventory of private and municipal properties is provided in the following table, followed by a map of their respective locations:

Tourism Red Deer Date: January 31, 2018
CENTRAL ALBERTA TOURISM ALLIANCE ACCOMMODATION STUDY 93
VALUATION & ADVISORY SERVICES
TentingTotal # of
Sites# of Cabins
David Thompson Resort RV Park Clearwater County RV Park/Cabins x 120 6 private SeasonalClear Springs Campground Clearwater County Serviced / Unserviced x 25 public SeasonalBoundary RV Park Clearwater County Unserviced Campground x 39 1 (glamping tent) private Seasonal - May 15 to Oct 15Burnstick Lake Campground Clearwater County Unserviced Campground ? 63 municipal Seasonal - May to mid OctCow Lake Recreation Area Clearwater County Unserviced Campground x 117 private Seasonal - May to SeptUpper Shunda Creek Rec Area Campground Clearwater County Unserviced Campground x 28 private Seasonal - May 1 to Sept 30Canyon Creek Golf Course Campground Clearwater County RV Park 87 private Seasonal - May to SeptCaroline Golf Course Campground Clearwater County Serviced Campground x 66 private SeasonalWilderness Village Rocky Mountain House RV Park/Cabins x 389 11 private SeasonalRiverview Campground Rocky Mountain House Serviced Campground x 140 1 (outfitters tent) private Seasonal - May to OctClearwater Trading Company Rocky Mountain House Serviced Campground x 71 8 municipal Year RoundNew Old Town Cottages & RV Park Rocky Mountain House Campground/cabins x 30 9 Cottages private Seasonal - Apr 1 to Oct 31Outwest Camping and RV Park Rocky Mountain House RV Park x 100 private Seasonal - May 15 to Oct 15Centennial Campground Rocky Mountain House Serviced / Unserviced x 15 municipal Seasonal - May to SeptTOTAL CLEARWATER COUNTY & AREA Units 1,290 36
PropertiesSources: Central Alberta Features Inventory Database and CBRE Research
CLEARWATER COUNTY & AREA CAMPGROUND INVENTORY
14
Seasonal / Year RoundCommunityClearwater County & Area Type
Sites
Classification

94 CENTRAL ALBERTA TOURISM ALLIANCE ACCOMMODATION STUDY
Tourism Red Deer Date: January 31, 2018
VALUATION & ADVISORY SERVICES

Tourism Red Deer Date: January 31, 2018
CENTRAL ALBERTA TOURISM ALLIANCE ACCOMMODATION STUDY
95
VALUATION & ADVISORY SERVICES
Clearwater County & Area campgrounds account for approximately 37% of the study area’s unserviced sites, 52% of the Central Alberta’s semi-serviced sites, and 18% of the area’s full-service sites.
Just under 60% of demand is generated by seasonal rentals with 41% derived from transient use. Based on discussions with operators, campgrounds are busy during summer weekends, but operate at approximately 50% during mid-week. It is estimated that campgrounds in Clearwater County & Area are projected to attract 131,000 campsite nights in 2017, which represents one-third of total demand in Central Alberta. Most campers originate from Central Alberta, with approximately 21% of demand stemming from out of province tourists. A few campground operators also indicated that they previously hosted a significant portion of crew business, primarily in their cabins, however crew business has decreased in the last 3 to 4 years.
In 2017, the average transient rental rate for campgrounds in Clearwater County & Area was estimated at $30, while seasonal rates averaged $16 per day.

96 CENTRAL ALBERTA TOURISM ALLIANCE ACCOMMODATION STUDY
Tourism Red Deer Date: January 31, 2018
VALUATION & ADVISORY SERVICES
Facilities Total 2017 E
Campgrounds 14
# of Unserviced Sites 356 28%
# of Semi Serviced Sites 654 51%
# of Full Serviced Sites 280 22%
Total Campsites 1,290 100%
# of Cabins 36
Avg Operating Days 186
Transient Utilization Occupancy
Weekdays May - June 10%
Wknds May - June 45%
Weekdays July - August 66%
Weekends July-August 80%
Weekdays September - October 24%
Wknds September - October 37%
Balance of Year 22%
Utilization Occupancy
Seasonal Rentals 74%
Operating Period 55%
Demand Occupied Campsite Nights
Estimated Transient Occupied Campsites Nights 54,000 41%
Estimated Seasonal Occupied Campsite Nights 77,400 59%
Total Occupied Campsite Nights 131,400 100%
Segmentation Total
Domestic Albertans 72%
Out of Province Tourists 21%
Groups 2%
Crew/Other 5%
Total 100%
Revenue Total
Avg Transient Rental Rate Per Day $30
Avg Seasonal Rental Rate Per Day $16
Source: CBRE Limited
Competitive Campground Market Performance Results
Clearwater County & Area

Tourism Red Deer Date: January 31, 2018
CENTRAL ALBERTA TOURISM ALLIANCE ACCOMMODATION STUDY
97
VALUATION & ADVISORY SERVICES
Mountain View County & Area
Mountain View & Area has an inventory of 7 campgrounds, which range in size from 10 sites to 262 sites, for an average of 85 sites. Mountain View County & Area accounts for 16% of the region’s full-service supply and 32% of the region’s unserviced sites. Three of the seven campgrounds operated on a year-round basis, while the remaining four operate on a seasonal basis over 165 to 188 days.
An inventory of these properties is provided in the following table, followed by a map of their respective locations:

98 CENTRAL ALBERTA TOURISM ALLIANCE ACCOMMODATION STUDY
Tourism Red Deer Date: January 31, 2018
VALUATION & ADVISORY SERVICES
Type TentingTotal # of
Sites# of
CabinsO.R. Hedges Lions Campground Olds Serviced x 42 municipal Seasonal - May 1 to Oct 15Elkton Valley Campground Mountain View County Serviced Campground 130 municipal SeasonalMountain-Aire Lodge & Campground Mountain View County Serviced Campground x 50 private Year RoundSchott's Lake RV & Guest Ranch Inc. Mountain View County Serviced Campground x 10 2 privateWagons West RV Park and Storage Mountain View County RV Park x 62 private Year RoundWater Valley Campground Mountain View County Unserviced Campground x 40 municipal Seasonal - May to OctoberWestward Ho Campground Mountain View County Serviced / Unserviced x 262 municipal Year RoundTOTAL MOUNTAIN VIEW COUNTY & AREA Units 596 2
PropertiesSources: Central Alberta Features Inventory Database and CBRE Research
Classification
SitesMOUNTAIN VIEW COUNTY & AREA CAMPGROUND INVENTORY
Seasonal / Year RoundMountain View County & Area Community
7

Tourism Red Deer Date: January 31, 2018
CENTRAL ALBERTA TOURISM ALLIANCE ACCOMMODATION STUDY 99
VALUATION & ADVISORY SERVICES

100 CENTRAL ALBERTA TOURISM ALLIANCE ACCOMMODATION STUDY
Tourism Red Deer Date: January 31, 2018
VALUATION & ADVISORY SERVICES
Mountain View County & Area campgrounds account for approximately 32% of the study area’s unserviced sites, 4% of the Central Alberta’s semi-serviced sites, and 16% of the area’s full-service sites.
Demand tends to be evenly split between transient and seasonal rentals, with an estimated 77,000 campsite nights estimated for 2017. Mountain View County & Area campgrounds account for approximately 19% of Central Alberta’s total demand and 16% of available supply. Demand levels tend to be highest in July and August, slowing down in September. The market is primarily comprised of campers from Calgary, Airdrie, Cochrane and local Mountain View area.
In 2017, the average transient rental rate for campgrounds in Mountain View County & Area was estimated at $17, while seasonal rates averaged $14 per day.

Tourism Red Deer Date: January 31, 2018
CENTRAL ALBERTA TOURISM ALLIANCE ACCOMMODATION STUDY
101
VALUATION & ADVISORY SERVICES
Facilities Total 2017 E
Campgrounds 7
# of Unserviced Sites 306 51%
# of Semi Serviced Sites 50 8%
# of Full Serviced Sites 240 40%
Total Campsites 596 100%
# of Cabins 0
Avg Operating Days 257
Transient Utilization Occupancy
Weekdays May - June 11%
Wknds May - June 36%
Weekdays July - August 63%
Weekends July-August 78%
Weekdays September - October 30%
Wknds September - October 38%
Balance of Year 34%
Utilization Occupancy
Seasonal Rentals 73%
Operating Period 50%
Demand Occupied Campsite Nights
Estimated Transient Occupied Campsites Nights 39,300 51%
Estimated Seasonal Occupied Campsite Nights 37,600 49%
Total Occupied Campsite Nights 76,900 100%
Segmentation Total
Domestic Albertans 70%
Out of Province Tourists 22%
Groups 5%
Crew/Other 4%
Total 100%
Revenue Total
Avg Transient Rental Rate Per Day $17
Avg Seasonal Rental Rate Per Day $14
Source: CBRE Limited
Competitive Campground Market Performance Results
Mountain View County & Area

102 CENTRAL ALBERTA TOURISM ALLIANCE ACCOMMODATION STUDY
Tourism Red Deer Date: January 31, 2018
VALUATION & ADVISORY SERVICES
Strategic Implications
As indicated, the Central Alberta non-fixed roof accommodation market achieved an occupancy of 54% at an average transient rental rate of $28 and seasonal rental rate of $17. This equates to an average daily site rental rate of $12 per day.
In terms of new supply, our research has identified several rumoured additions and expansions including:
• An expanded RV resort development at Meadowlands RV Park in Sylvan Lake;
• Plans to develop 100 RV seasonal campsites on a property know as the Last Hill Golf Course in Lacombe County;
• A 31-site expansion at Summerland Leisure Park in Lacombe County;
• Expansion of Wilderness Village, Rocky Mountain House;
• Two additional cabins at the Discovery Wildlife Park in 2018; and
• Potential expansion of Water Valley Campground in Mountain View County.
Based on discussions with campground operators, the family leisure market seems to be improving somewhat. Increasingly, campers are looking for full-service sites with power, water and sewer hookups, as well as larger sites. Campers with large RV trailers are seeking 50-amp power outlets, and as a result campgrounds which are limited to 15 amp outlets cannot accommodate this demand. Campers are also seeking more onsite amenities and activities, such as: canoe and paddle board rentals and on-site retail, access to internet, as well as increased activities and attractions within the region to extend their stay in the area.
According to stakeholder discussion, provincial parks are seeing increased demand from new Canadian immigrants to Alberta, which are trying camping for the first time. The provincial parks are catering to this new market segment, by loaning or sourcing equipment to them (i.e. tents and cookware) to introduce them to the camping experience. Given this trend, there may also be an opportunity to provide Comfort Camping in the form of platforms with tent set ups or yurts to cater to the “ready to camp” market amongst Central Alberta campground operators. Comfort camping developments could also cater to winter camping demand as well as tourists to the area, that would typically stay in fixed roof accommodations.


Central Alberta Accommodation Strategic Framework
Cen
tra
l A
lber
ta T
ou
rism
Alli
an
ce A
cco
mm
od
atio
n S
tud
y

Tourism Red Deer Date: January 31, 2018
CENTRAL ALBERTA TOURISM ALLIANCE ACCOMMODATION STUDY
105
VALUATION & ADVISORY SERVICES
Introduction The following section outlines a strategic plan for enhancing existing and/or attracting new fixed roof accommodations in relevant partner municipalities within the Central Alberta study area, including approaches to growing small business event demand in the short to mid-term (within the next 5-10 years), and considerations for improving the non-fixed roof accommodation market in relevant partner communities in the longer term (10-15 years), particularly in locations where these markets are already established.
Strategic Context Central Alberta Tourism Alliance is currently underway with implementing Realizing our Potential – Central Alberta’s Tourism Destination Management Plan, a 10-year plan that provides direction for the organization with respect to tourism development, marketing and management. One of the core Outcomes of the Plan is “experiences,” which involves a strategic approach to destination development. Of note, within the DMP, a priority initiative was identified, to “diversify the supply of accommodations by modernizing campgrounds and offering opportunities for comfort camping, eco-lodges and farm stays.” An action plan was outlined in order to fulfil this initiative, building on rationale based on camping trends in the province (The Praxis Group, 2009), and primary research in the immediate area. What is missing from this strategic approach is the demand side of the equation regarding accommodation growth. The Central Alberta Tourism Alliance retained the services of CBRE to undertake a more in-depth study on the regional accommodation market, inclusive of the following steps:
• To assess the existing supply; • To analyze current demand; • To project future demand; • To project future supply requirements for fixed roof accommodations only in relevant partner
communities; • To identify development opportunities for fixed roof accommodations based on future supply
requirements (at the community level); and • To develop a strategic implementation plan – including the roles and requirements of partner
municipalities and other catalyst organizations in moving forward with the strategic plan.
Similar to the province as a whole, the Central Alberta fixed roof accommodation market benefitted from strong growth in both demand and supply over the 2011 to 2014 period. However, since 2015, the Alberta economy has felt the impacts of the downturn in oil prices, which has in turn resulted in a decline in room demand and average daily rates.
Based on an estimate of year to date results, the Central Alberta market is not expected to make any strides in 2017, and is, in fact, projected to remain flat in RevPAR to 2016 levels. CBRE’s analysis indicates strong growth expected for GDP in 2018 due to improvements in employment, retail sales, government spending, and oil prices. Corporate demand for accommodations is expected to increase in many of the market areas across the Region, but there is a strong likelihood that energy price recovery will be slow. As such, the accommodation sector will continue to face challenges in significantly improving occupancy performance in the short term, unless other strategies are put in place to increase year-round overnight demand.

106 CENTRAL ALBERTA TOURISM ALLIANCE ACCOMMODATION STUDY
Tourism Red Deer Date: January 31, 2018
VALUATION & ADVISORY SERVICES
Typically, a competitive hotel market that is performing well, in stable economic times, will achieve occupancy levels of 60% or better. Some of the hotels in that market will be in the upper 60% to 70% range, achieving more than their fair share of demand. The Central Alberta market has operated at less than 60% for a number of reasons, including: proximity to larger urban markets (Edmonton & Calgary), the smaller size of the communities, the quality of existing accommodations, a limited focus on tourism development in most parts of the region (outside Sylvan Lake and Rocky Mountain House), and limited foodservice and retail infrastructure to satisfy existing demand. The regional economic and market analysis that was undertaken for the subject study points to the need for CATA partners to take a different approach towards growing the regional accommodation market. The VISION for CATA’s Accommodation Strategy is as follows:
• To set the foundation for diversification and growth in Central Alberta Tourism Region’s accommodation sector in the short to mid-term, by making the region attractive to all segments of accommodation demand, and ensuring the Region is attracting investment for the longer-term.
STRATEGIC OBJECTIVES
1. Encourage diversification of accommodation demand a. The opportunity exists to capitalize and grow new or untapped sources of demand (i.e.
leisure, meeting/conference segments), and diversifying existing sources (i.e. corporate). b. Ensure alignment with economic development strategies across the region.
2. Develop linkages between products & experiences across the Region with the highest potential to
generate overnight demand a. Key markets to focus on include meeting/conference and leisure/tourist demand segments. b. Encourage regional marketing of packages that cater to specific leisure tourism markets
(building on PRIZM target segments), i.e. ATV & auto touring routes, adventure tourism routes, hiking/quad trails; and ensure appropriate accommodations are featured along these routes.
3. Cultivate a culture of support for investment attraction into accommodation supply a. Review existing supply and develop a mechanism to track new and enhanced supply. b. Develop connections with the investment community and learn what requirements are
needed for hotel investment. c. Develop action items to educate elected municipal officials and economic development
professionals on the requirements for new investment in the accommodation sector.
4. Encourage improved quality and consistency of accommodation product across the region a. Ensure existing accommodation operators have the right tools and resources at their
disposal. b. Conduct research into third-party self-assessment tools and other educational resources for
operators to improve their products, and potentially diversify their offerings for a broader demand base.
c. Build on tourism marketing guidelines in the DMP, focusing on market-ready “BEST BET” tourism products with the potential to drive overnight demand.

Tourism Red Deer Date: January 31, 2018
CENTRAL ALBERTA TOURISM ALLIANCE ACCOMMODATION STUDY
107
VALUATION & ADVISORY SERVICES
Action Plan by Objective and Accommodation Grouping In line with the findings in CATA’s Destination Management Plan (p. 121), communities across the Region have been categorized into the following groups within the Regional Tourism System for the subject Accommodation Strategy:
Gateways – City of Red Deer, Rocky Mountain House, Olds Communities that most visitors to the region will travel through (via air or road) – can be destinations unto themselves providing a critical mass of experiences, products and accommodations, enabling longer-term trips; with potential to expand trips to nearby Hubs.
Hubs – Sylvan Lake, City of Lacombe, Innisfail Communities that provide a smaller mix of experiences, attractions, accommodations and amenities, generating shorter-term trips; often provide a range of fixed-roof and non-fixed roof accommodations, but limited capacity.
Tourism Service Centres – Blackfalds Communities focused on “pass-through” travellers; typically provide business-focused amenities and a limited range of accommodations.
Counties – Red Deer, Clearwater, Lacombe, Mountain View Larger geographic areas comprising primarily rural communities, with limited fixed roof accommodations and a larger base of non-fixed roof accommodations, but limited tourism infrastructure.
Action plan items for each Accommodation Grouping are detailed in the following sections, inclusive of lead roles, strategic alliances, timing and level of importance.
OBJECTIVE #1 - Encourage Diversification of Accommodation Demand
The Central Alberta region was not immune to the challenges faced by the overall Provincial hotel market in recent years. Despite areas of Central Alberta that are attractive tourist destinations, overall, the region is still reliant on the oil and gas sector. In fact, the region is comprised of several small towns and only one mid-sized city, therefore, there is arguably even less diversity in the local economies to help offset the ailing energy sector. The impact of the economy has had a direct relation on accommodation demand across the province, i.e. reduced travel from the oil & gas sector.

108 CENTRAL ALBERTA TOURISM ALLIANCE ACCOMMODATION STUDY
Tourism Red Deer Date: January 31, 2018
VALUATION & ADVISORY SERVICES
As a result, accommodation demand levels in the Central Alberta region declined by almost 12% in 2016, leading to an annual occupancy rate of 39%, as compared to a 6% decline in demand for the Province overall (Alberta achieved a 53% occupancy by year-end 2016). This decline in demand can be attributed to a number of factors, but most significantly by a change in Market Segmentation.
The biggest shift has been in the decline of Corporate/Commercial demand, particularly transient corporate demand from the oil and gas industry. In 2016, this segment made up approximately 42% of demand in the Region. While some companies have evolved or diversified internally, others have halted exploration and drilling exercises that lead to travel. As such, a portion of Corporate demand that was previously travelling to Central Alberta has either been replaced by more leisure traffic OR has been lost altogether.
Meeting/Conference demand in 2016 made up 8% of overnight accommodation demand at hotels, and remains highly concentrated in the larger city centres and other Gateway communities (i.e. Red Deer, Lacombe, Olds and Rocky Mountain House) where there are dedicated event centres, and/or hotels that have a significant volume of meeting space. Stakeholders have pointed to this segment as a growing area. For instance, several properties across the region are looking to expand their meeting space, including: Best Western Plus Red Deer, Hampton Inn & Suites Red Deer County, Microtel Blackfalds, and the Walking Eagle Inn & Lodge. This is also a segment that CATA partners can actively attract, particularly in combination with existing sources of corporate transient and leisure demand (i.e. hosting agricultural conferences, AGMs for hockey coaches, etc.).
Leisure/Tourist demand was the largest source of demand for Central Alberta at 44% in 2016, and is predominantly driven by sport tourism, festivals and other events, and visiting friends and relatives (VFR) in Central Alberta. With culinary tourism showing a notable economic impact in parts of the region (i.e. Lacombe and Red Deer County), and agricultural businesses underpinning the economic, there may be an opportunity to grow tours and trails, in line with Travel Alberta strategic priorities. This is another segment that CATA partners can actively attract and look to combine with other activities (i.e. spousal programs for conferences or corporate retreats, farm to table vacations, etc.).
Government/Other Discounted demand includes government groups, as well as airline contracts or construction/maintenance crew business, and rooms generated through special promotions and discount offers. Demand within this segment typically occurs during the Sunday to Thursday period, and tends to be rate sensitive, making up 6% of demand in Central Alberta in 2016.

Tourism Red Deer Date: January 31, 2018
CENTRAL ALBERTA TOURISM ALLIANCE ACCOMMODATION STUDY
109
VALUATION & ADVISORY SERVICES
General feedback from hotels across the region suggests that targeted marketing is required in order to meet shifting demand patterns in the region. As such, part of emphasis for this market is to educate operators and government advisors on demand patterns within Central Alberta overall, and determine which new markets to attract using PRIZM data. For example, CBRE analysis identifies that the majority of leisure visitors with an interest in camping, adventure and outdoor experiences are from Alberta, as are corporate clientele. As such, there may be an opportunity to target the VFR market for tourism and local/regional associations for corporate demand opportunities. From a seasonality perspective, Statistics Canada data indicates that one-third of visitors arrived in the Central Alberta region during the summer months, when the campgrounds are operating and many Alberta residents are taking vacation. Over the course of 2016, the lowest occupancy levels were reached during the winter months (January, February, December), across the region, while the highest occupancies were reached in May, June and November. However, fixed roof accommodation market data suggests some distinct differences in occupancy levels across the region. For instance, Olds and Lacombe County both experienced their highest occupancy levels in April, and Sylvan Lake experienced peak occupancy in July of 2016. These seasonality trends point to some significant opportunity areas for the Region, in conjunction with specific demand segments, as these are segments wherein CATA partners can have a greater influence, and have the potential to boost demand during non-peak periods:
• Meeting/Conference – building demand during peak conference months in Spring and Fall (Apr-Jun, Sep-Nov);
• Leisure/Tourist – building demand during peak Summer and Winter tourism months (Jul-Aug, Dec-Mar) The following table outlines key action areas for CATA partners to follow in order to encourage diversification of accommodation demand by market demand category. For each demand category, CBRE has listed recommended Action items, the Lead roles and/or partners to undertake these initiatives, and timing (Short-Term = within 6 months-2 years, Medium-Term = within 2-5 years; Long-Term = 5 years +). Where relevant, time of year has been included as a reference in relation to specific action items (i.e. focus meeting/conference related actions on the Spring and Fall periods).
Demand Category
Action Area Leads Recommended Timeline / Season
Meeting / Conference
Work with accommodation partners & event centres to develop meeting planner packages to target SMERF (social, military, educational, religious, fraternal) groups, offering discounted rates over larger urban centres and resort destinations (i.e. Calgary, Edmonton, Banff), and capitalize on the region’s central location.
Gateways and Hubs
Short-term; Spring/Fall
Meeting / Conference
Work with accommodation partners to target meetings and conferences focused on core industries / sources of existing demand (i.e. forestry, agriculture, oil/gas, mining, medical marijuana, etc.) and growing international research areas (i.e. technology relevant to core industries).
Gateways and Hubs
Medium-Term; Spring/Fall
Meeting / Conference
Work with provincial meeting planners to target small meetings and corporate retreats that incorporate existing tourism demand generators: • Trails
Gateways, Hubs, Tourism Service Centres, Counties
Medium-Term; year-round
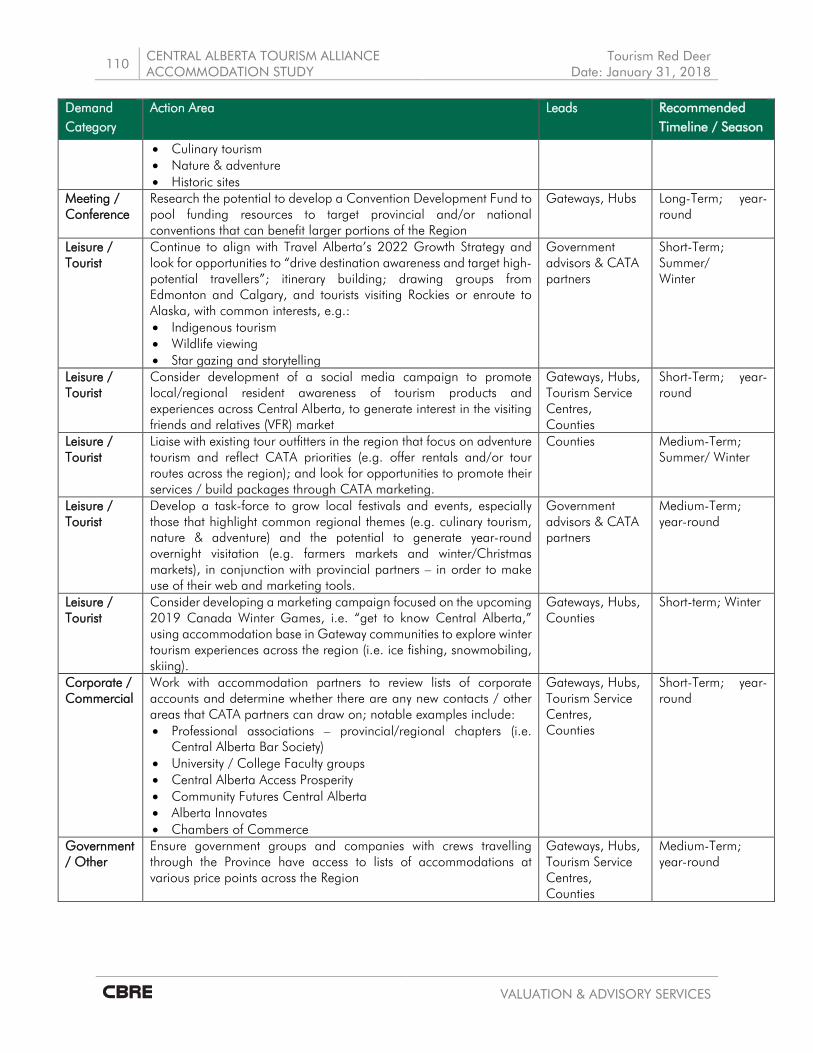
110 CENTRAL ALBERTA TOURISM ALLIANCE ACCOMMODATION STUDY
Tourism Red Deer Date: January 31, 2018
VALUATION & ADVISORY SERVICES
Demand Category
Action Area Leads Recommended Timeline / Season
• Culinary tourism • Nature & adventure • Historic sites
Meeting / Conference
Research the potential to develop a Convention Development Fund to pool funding resources to target provincial and/or national conventions that can benefit larger portions of the Region
Gateways, Hubs Long-Term; year-round
Leisure / Tourist
Continue to align with Travel Alberta’s 2022 Growth Strategy and look for opportunities to “drive destination awareness and target high-potential travellers”; itinerary building; drawing groups from Edmonton and Calgary, and tourists visiting Rockies or enroute to Alaska, with common interests, e.g.: • Indigenous tourism • Wildlife viewing • Star gazing and storytelling
Government advisors & CATA partners
Short-Term; Summer/ Winter
Leisure / Tourist
Consider development of a social media campaign to promote local/regional resident awareness of tourism products and experiences across Central Alberta, to generate interest in the visiting friends and relatives (VFR) market
Gateways, Hubs, Tourism Service Centres, Counties
Short-Term; year-round
Leisure / Tourist
Liaise with existing tour outfitters in the region that focus on adventure tourism and reflect CATA priorities (e.g. offer rentals and/or tour routes across the region); and look for opportunities to promote their services / build packages through CATA marketing.
Counties Medium-Term; Summer/ Winter
Leisure / Tourist
Develop a task-force to grow local festivals and events, especially those that highlight common regional themes (e.g. culinary tourism, nature & adventure) and the potential to generate year-round overnight visitation (e.g. farmers markets and winter/Christmas markets), in conjunction with provincial partners – in order to make use of their web and marketing tools.
Government advisors & CATA partners
Medium-Term; year-round
Leisure / Tourist
Consider developing a marketing campaign focused on the upcoming 2019 Canada Winter Games, i.e. “get to know Central Alberta,” using accommodation base in Gateway communities to explore winter tourism experiences across the region (i.e. ice fishing, snowmobiling, skiing).
Gateways, Hubs, Counties
Short-term; Winter
Corporate / Commercial
Work with accommodation partners to review lists of corporate accounts and determine whether there are any new contacts / other areas that CATA partners can draw on; notable examples include: • Professional associations – provincial/regional chapters (i.e.
Central Alberta Bar Society) • University / College Faculty groups • Central Alberta Access Prosperity • Community Futures Central Alberta • Alberta Innovates • Chambers of Commerce
Gateways, Hubs, Tourism Service Centres, Counties
Short-Term; year-round
Government / Other
Ensure government groups and companies with crews travelling through the Province have access to lists of accommodations at various price points across the Region
Gateways, Hubs, Tourism Service Centres, Counties
Medium-Term; year-round

Tourism Red Deer Date: January 31, 2018
CENTRAL ALBERTA TOURISM ALLIANCE ACCOMMODATION STUDY
111
VALUATION & ADVISORY SERVICES
OBJECTIVE #2 – Develop Linkages Between Products & Experiences Across the Region with the Highest Potential to Generate Overnight Demand In direct relation to the action items suggested for diversification of demand for the Meeting/Conference and Leisure/Tourist segments, CATA also has an opportunity to enhance and develop linkages around products and experiences that already exist in the Region. This objective ties in well with efforts identified in CATA’s Tourism Destination Management Plan to “Grow & Diversify Authentic Memorable Experiences,” by focusing on those that lead to higher spending and potential for overnight stays in the Region. The following table outlines key action areas for CATA partners to follow in order to build on existing products and experiences that are either already drawing visitors from out of region, or have the potential to induce new demand to the area based on tourism trends across the Province.
Product / Experience Groups
Action Items Leads Recommended Timeline / Season
Agri-tourism
• Build inventories of connections between agriculture, technology and agri-tourism (i.e. farmers markets, u pick, and attractions like Ellis Bird Farm, Kraay Family Farm)
• Build on trend of using authentic / unique venues for business and social events (i.e. old farmhouses for weddings)
• Research potential to offer cannabis production tours
Lacombe, Sylvan Lake, Innisfail, Blackfalds, Rocky Mountain House, Olds, Counties
Short-term; Spring and Fall
Culinary tourism • Develop inventories to promote culinary tourism across the region (i.e. restaurants, breweries and farmers markets), especially for groups
Lacombe, Olds, Red Deer, Blackfalds, Sylvan Lake, Counties
Short-term; year-round
Equestrian Events • Build on existing events and look to expand pan-regionally, i.e. Summer Synergy event at Olds Exhibition
Olds, Counties Medium-term; Spring-Fall
Indigenous tourism facilities and events
• Look at opportunities to drive evening events that require overnight accommodations, i.e. star-gazing and story-telling, and tie to group events (i.e. Native Friendship Centre meetings)
Rocky Mountain House, Clearwater County, Mountain View County
Medium-term; year-round
Multi-day festivals & events
• Build on existing festivals and events that are drawing people to the region and look for ways to expand them across the Region, (i.e. Lacombe Days, adventure tourism in West Country)
Lacombe, Rocky Mountain House, Red Deer, Olds, Sylvan Lake, Counties
Short-term; Spring-Fall
Nature & outdoors – mountain focus
• Promote West County camping and other opportunities to capture tourists on their way to Banff/Jasper
Rocky Mountain House, Counties
Medium-term; year-round
Sport tourism and training camps
• Promote opportunities to submit joint bids for high-profile tournaments, training camps, and AGM’s for sport groups (i.e. lacrosse, soccer, hockey, baseball)
• Promote high performance training camps at new sporting facilities across the region
Blackfalds, Olds, Innisfail, Sylvan Lake, Red Deer, Lacombe
Medium-term; year-round
Research & technology • Build on events linked to unique areas of research - wildlife research at Discovery Wildlife Park, agriculture technology at Olds College and Rocky Mountain House, Burman University in Lacombe & Red Deer Colleges, etc.
Innisfail, Olds, Lacombe, Rocky Mountain House, Red Deer
Medium-term; year-round

112 CENTRAL ALBERTA TOURISM ALLIANCE ACCOMMODATION STUDY
Tourism Red Deer Date: January 31, 2018
VALUATION & ADVISORY SERVICES
Product / Experience Groups
Action Items Leads Recommended Timeline / Season
Winter adventure tourism & events
• Build tours and trails involving extreme adventure (winter mountain biking, waterfall climbing) in conjunction with organized challenges and other events in Clearwater County
• Look for opportunities to promote Nordic ski and other low impact adventure travel in Lacombe, Mountain View and Red Deer County
• Build on and package Christmas markets and other winter festivals, along with low-impact winter activities
Rocky Mountain House, Sylvan Lake, Lacombe, Innisfail, Counties
Medium-term; winter
Trade Shows • Delegate a subcommittee to review trade shows that Central Alberta Tourism Alliance should attend, including those that meet interests of the top 10 PRIZM5 target markets –i.e. boat, cottage, garden, motorcycle, RV and sportsman travel shows
• Research additional opportunities to partner with Travel Alberta at relevant trade shows, i.e. Travel Alberta’s scholarship program for Canada’s West Marketplace
Gateways, Hubs, Tourism Service Centres
Short-term; annual
OBJECTIVE #3 - Cultivate a Culture of Support for Investment Attraction into Accommodation Supply
It is anticipated that the subject Accommodation Strategy document will be used by the Municipal Economic Development offices within Central Alberta to attract and engage potential investors, developers and strategic partners with respect to future development for the Region. However, with the overwhelming focus on oil and gas and agriculture that has dominated the economic development landscape in Central Alberta, it is recognized that there may be some education required at the municipal level in order to ensure sustainable success of the subject strategy.
Given the current economic climate and performance of fixed roof accommodations within Central Alberta’s urban centres, the existing market is not conducive to new supply development in the short to midterm; however, there are several opportunities for reinvestment and expansion. Furthermore, some new supply is already entering the market that stakeholders in partner jurisdictions may not be aware of. As such, it is recommended that CATA partners find a mechanism to both track and communicate supply additions.
In order to develop a culture of support for investment attraction into the accommodation market, it is recommended that CATA partners start by communicating with Government and industry stakeholders across the region. This could begin with hosting stakeholder workshops across the region:
• To introduce the results of the Central Alberta Tourism Alliance Accommodation Strategy;
• To advocate accommodation development benefits at the Regional and Municipal Government level; and
• To describe specific findings for the accommodation market within each relevant community.

Tourism Red Deer Date: January 31, 2018
CENTRAL ALBERTA TOURISM ALLIANCE ACCOMMODATION STUDY
113
VALUATION & ADVISORY SERVICES
The following table identifies a number of strategic recommendations for CATA partners to follow in order to cultivate a culture of support for accommodation investment across the region:
Market Action Areas Leads Recommended Timeline / Season
Fixed Roof Look for opportunities to introduce the Accommodation Strategy and specific community findings to relevant municipal Economic Development and Planning departments.
All CATA Partners
Short-term; year-round
Fixed Roof Plan quarterly meetings with Planning departments to monitor potential sites for accommodation development.
All CATA Partners
Short-term; year-round
Fixed Roof Review local planning policies, zoning and other By-Law amendments to ensure high potential sites under consideration for development permit hotel development.
All CATA Partners
Medium-term; year-round
Fixed Roof Continue to maintain regional accommodation supply database, building on data provided by CBRE project team (recommend semi-annual updates).
All CATA Partners
Short-term; year-round
Non-Fixed Roof
Lobby for enhanced servicing in communities where the camping plays a larger role.
Counties Short-term; year-round
Non-Fixed Roof
Research results of Provincial study on comfort camping (available Q1 2018) and look for potential development opportunities and other implications for Central Alberta.
Counties Short-term; year-round
Non-Fixed Roof
Survey local golf courses and clubs with excess land capacity that might have an interest in campground / RV site development.
Counties Medium-term; year-round
Fixed and Non-Fixed Roof
Research land use policies and set up regular meeting with provincial partners to ensure mechanisms are put in place to resolve implications of the Integrated Resource Plan (IRP) on tourism development nodes in the region (especially requirement for 25-year lease for developers in David Thompson Corridor – which has been a deterrent for some investors).
Rocky Mountain House, Clearwater County, Mountain View County
Short-term; year-round
Several priority accommodation development sites were identified during the course of this study that could have potential for hotel development in the longer term, as detailed in the table below.
Community High Potential Fixed Roof Site(s) / Expansions High Potential Non-Fixed Roof Site(s) / Expansions
City of Red Deer • Red Deer Airport – consider hotel development in line with long-term strategy to attract an ultra low-cost carrier
• Capstone at Riverlands area – 40-acre redevelopment with residential and commercial component, concept plan included hotel and conference centre
• Riverbend area – private developer has 62 acres for campground development; looking for market to improve
Innisfail • Heritage downtown – potential location for small boutique inn
• Discovery Wildlife Park – recently opened 63 sites in campground, with additional land

114 CENTRAL ALBERTA TOURISM ALLIANCE ACCOMMODATION STUDY
Tourism Red Deer Date: January 31, 2018
VALUATION & ADVISORY SERVICES
Community High Potential Fixed Roof Site(s) / Expansions High Potential Non-Fixed Roof Site(s) / Expansions
base to expand further in future; good add on activities with international interest; opening two additional cabins in 2018
• Dodds Lake – potential to expand existing campground; packaging with nearby Innisfail Golf Club
Sylvan Lake • Lakefront Park – Town currently working on investment attraction strategy that includes a hotel/conference centre at the waterfront
• Waterford Station – residential / commercial project that may incorporate a mixed-use accommodation component
• Pogadl Park – Town has future plans for Pogadl Park (60-acre site with future sports park and field house), which will include RV sites.
Red Deer County • Gasoline Alley – potential area for long-term hotel development, if market improves
City of Lacombe • Midway Centre – 2 phase program starting with retail/commercial; servicing approved with construction starting Spring 2018; potential for hotel development long-term
• Market Square – development plan includes land designated for accommodations; big box anchor store in negotiations for short-term
• Michener Park – potential for municipality to invest and assist with enhancing existing sites, landscaping, and improving event facilities
Blackfalds • SW corner of Broadway Ave and Highway 2A – 2 phase program; in Phase 1 – mainly commercial; Phase 2 may have potential for hotel (5-10years)
• Burbank Park – municipality to continue discussing potential for expansion on private site, or opportunity to develop nearby, and ensure public access to river
• Site currently used for active gravel companies in “Special Study Area” (country-residential development in Intermunicipal Development Plan between Lacombe County and Blackfalds) under consideration for future public recreation possibilities (golf course, campground, etc.).
Lacombe County • Hwy 2A and Hwy 2 – identified as a “growth” market in the County, with potential commercial/industrial development under consideration for long-term (pilot project for Development Incentive Grant focusing on Muir)
• Alberta Downs – private developer is planning to develop a multi-purpose event centre with RV sites for trainers
• Summerland Leisure Park – approved for 30 new sites in 2018
• Last Hill Golf Course – reopening with 100 fully serviced sites in 2018
• Nursery Golf & Country Club – recently submitted application for 31 sites
• Alix – opportunity to increase capacity for camping; already has tourism infrastructure, close to beaches, City of Lacombe, etc.

Tourism Red Deer Date: January 31, 2018
CENTRAL ALBERTA TOURISM ALLIANCE ACCOMMODATION STUDY
115
VALUATION & ADVISORY SERVICES
Community High Potential Fixed Roof Site(s) / Expansions High Potential Non-Fixed Roof Site(s) / Expansions
Rocky Mountain House / Clearwater County
• Rocky Mountain House downtown site (Hwy 22 / 11A) – potential for development of year-round cabins to accommodate families and adventure tourists
• David Thompson Resort – look at potential for private-public partnership to improve infrastructure and servicing for this property
• North Saskatchewan River Park, close to RMH – potential for development of campgrounds / RV sites with high quality activity base that can benefit from municipal servicing
• Nordegg & surrounding area – potential for private development of comfort camping and/or glamping experience for adventure travel market (in line with Travel Alberta)
Olds • Olds College Residences – potential to improve rental capacity for educational groups and meeting/conference event business (offering different price points, and appealing to the growing meeting/conference segment).
• Olds Regional Exhibition – plans to build 32-site campground; requires washrooms and shower facilities
Mountain View County
• Schott’s Lake Lodge & Campground – opening Fall 2017/Winter 2018 with 10 motel rooms
• Schott’s Lake Lodge & Campground – opening 10 campsites in Winter 2018, with plans to open 50 more sites by summer 2018
• Water Valley – ideal location for serviced campground development (currently has 40 unserviced sites)
• East of Hwy 2 – potential for glamping / other unique camping experiences near other tourist attractions
Fixed Roof Market Supply Development Considerations
CATA partners may need to offer incentives (financial and otherwise) to attract fixed roof accommodation investment that will generate long-term economic benefits for the Region. Considering the opportunities surrounding agriculture, along with culinary and sport tourism, and given that Red Deer is hosting the Canada Winter Games, a complementary focus would be appropriate for such incentives. Some examples that could be applied include:
• Investigate municipal interest in exploring opportunities for strategic partnerships to attract a potential hotel developer – Public Private Partnerships – to either reduce the development costs or enhance the cash flow of a proposed hotel operation (e.g., deferred property taxes).
• Consider opportunities for mixed-use developments with accommodation, such as residential, senior residences, retail and office space.
• Consider offering unique regionally inspired food & beverage offerings at hotel properties, and offer fundraising events, and other social opportunities.
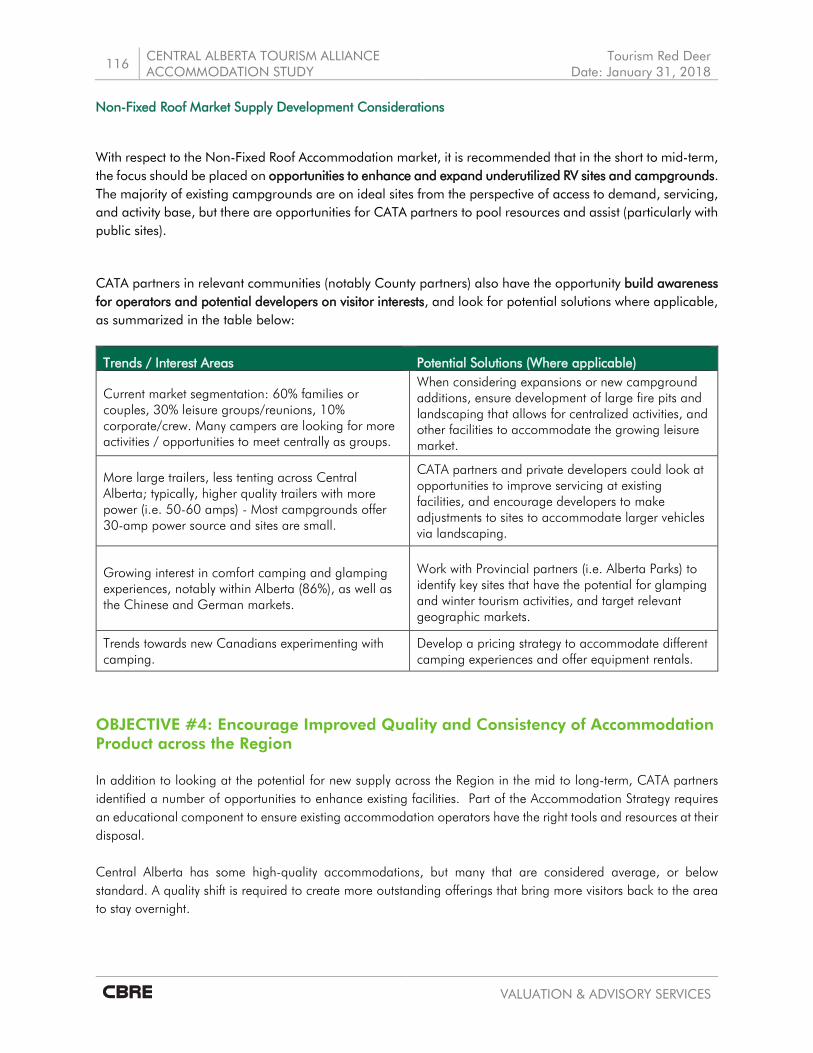
116 CENTRAL ALBERTA TOURISM ALLIANCE ACCOMMODATION STUDY
Tourism Red Deer Date: January 31, 2018
VALUATION & ADVISORY SERVICES
Non-Fixed Roof Market Supply Development Considerations
With respect to the Non-Fixed Roof Accommodation market, it is recommended that in the short to mid-term, the focus should be placed on opportunities to enhance and expand underutilized RV sites and campgrounds. The majority of existing campgrounds are on ideal sites from the perspective of access to demand, servicing, and activity base, but there are opportunities for CATA partners to pool resources and assist (particularly with public sites).
CATA partners in relevant communities (notably County partners) also have the opportunity build awareness for operators and potential developers on visitor interests, and look for potential solutions where applicable, as summarized in the table below:
Trends / Interest Areas Potential Solutions (Where applicable)
Current market segmentation: 60% families or couples, 30% leisure groups/reunions, 10% corporate/crew. Many campers are looking for more activities / opportunities to meet centrally as groups.
When considering expansions or new campground additions, ensure development of large fire pits and landscaping that allows for centralized activities, and other facilities to accommodate the growing leisure market.
More large trailers, less tenting across Central Alberta; typically, higher quality trailers with more power (i.e. 50-60 amps) - Most campgrounds offer 30-amp power source and sites are small.
CATA partners and private developers could look at opportunities to improve servicing at existing facilities, and encourage developers to make adjustments to sites to accommodate larger vehicles via landscaping.
Growing interest in comfort camping and glamping experiences, notably within Alberta (86%), as well as the Chinese and German markets.
Work with Provincial partners (i.e. Alberta Parks) to identify key sites that have the potential for glamping and winter tourism activities, and target relevant geographic markets.
Trends towards new Canadians experimenting with camping.
Develop a pricing strategy to accommodate different camping experiences and offer equipment rentals.
OBJECTIVE #4: Encourage Improved Quality and Consistency of Accommodation Product across the Region In addition to looking at the potential for new supply across the Region in the mid to long-term, CATA partners identified a number of opportunities to enhance existing facilities. Part of the Accommodation Strategy requires an educational component to ensure existing accommodation operators have the right tools and resources at their disposal. Central Alberta has some high-quality accommodations, but many that are considered average, or below standard. A quality shift is required to create more outstanding offerings that bring more visitors back to the area to stay overnight.

Tourism Red Deer Date: January 31, 2018
CENTRAL ALBERTA TOURISM ALLIANCE ACCOMMODATION STUDY
117
VALUATION & ADVISORY SERVICES
CATA has the opportunity to create a ‘culture of quality’ for accommodation products from both a supply and demand perspective. The following chart provides an action plan to help CATA improve and enhance the quality of fixed and non-fixed roof accommodation assets, and the overall quality of service and engagement across the Central Alberta lodging sector.
Action Item Leads Timing Conduct research into third-party self-assessment tools and other educational resources for operators to improve their products, and potentially diversify their offerings for a broader demand base.
All CATA partners Short-term
Investigate the availability of any capital funding programs which would be eligible for improvements and quality upgrades to small to medium sized accommodation properties (i.e. Community Futures).
All CATA partners Short-term
Provide support for small to medium sized operator business planning and proposal writing.
All CATA partners Medium-term
Supply operators with details surrounding the benefit of upgrading quality and the information they need to start the process, i.e. regional newsletter for operators.
All CATA partners Medium-term
Research opportunities to support or deliver a quality enhancement programs for operators and communities, such as: • Community tourism assessment program; • Customized, one-on-one business improvement and enhancement advice and
mentoring opportunities; • Formalized peer to peer mentoring; • Market readiness criteria-based approach for operator involvement in product
development initiatives; • Criteria-based quality upgrade initiative through a key supplier partnership or
product affiliation program; • Industry-wide use of TripAdvisor. • Programs to encourage operators to exceed consumer expectations.
All CATA partners Medium-term
Implementation and Performance Monitoring An important follow-up component for the subject Accommodation Strategy is the dedication of CATA partners towards implementation of all strategic objectives, in order to set the foundation for diversification and growth in Central Alberta Tourism Region’s accommodation sector in the short to mid-term. It is recommended that the partners work together to establish a Strategic Action Framework to follow, to ensure continued progress towards CATA’s overall goals and objectives. The following chart provides an example of a framework that could be followed for future CATA meetings:

118 CENTRAL ALBERTA TOURISM ALLIANCE ACCOMMODATION STUDY
Tourism Red Deer Date: January 31, 2018
VALUATION & ADVISORY SERVICES
Strategic Action Area
Projects Performance Measures
Successes and/or Challenges for CATA Discussion
Action Items / Resolutions for Follow-up
OJBECTIVE #1: Encourage Diversification of Accommodation Demand
Build Meeting/ Conference Demand
Work with accommodation partners & event centres to develop meeting planner packages to target SMERF groups, offering discounted rates over larger urban centres and resort destinations, and capitalize on the region’s central location
Increase Spring & Fall occupancy levels at hotels
Prior to CATA partner approval of the subject Accommodation Strategy, consideration should be given to the following:
• When will the new Strategy be on agenda for approval? • How often will the Alliance monitor progress? • What format does the Alliance want for progress reports?


VALUATION & ADVISORY SERVICES
ADDENDUM “A” PRIZM5 Target Group Maps
Cen
tra
l A
lber
ta T
ou
rism
Alli
an
ce A
cco
mm
od
atio
n S
tud
y

Tourism Red Deer Date: January 31, 2018
CENTRAL ALBERTA TOURISM ALLIANCE ACCOMMODATION STUDY I
VALUATION & ADVISORY SERVICES
PRIZM5 Target Group Maps
DRIVE TIME MAP CATCHMENT – WINNIPEG, MB
Source: Alberta Culture & Tourism, Environics Analytics

II CENTRAL ALBERTA TOURISM ALLIANCE ACCOMMODATION STUDY
Tourism Red Deer Date: January 31, 2018
VALUATION & ADVISORY SERVICES
DRIVE TIME MAP CATCHMENT – SASKATOON, SK
Source: Alberta Culture & Tourism, Environics Analytics

Tourism Red Deer Date: January 31, 2018
CENTRAL ALBERTA TOURISM ALLIANCE ACCOMMODATION STUDY III
VALUATION & ADVISORY SERVICES
DRIVE TIME MAP CATCHMENT – REGINA, SK
Source: Alberta Culture & Tourism, Environics Analytics

IV CENTRAL ALBERTA TOURISM ALLIANCE ACCOMMODATION STUDY
Tourism Red Deer Date: January 31, 2018
VALUATION & ADVISORY SERVICES
DRIVE TIME MAP CATCHMENT – BRANDON, MB
Source: Alberta Culture & Tourism, Environics Analytics
DRIVE TIME MAP CATCHMENT – PRINCE ALBERT, SK
Source: Alberta Culture & Tourism, Environics Analytics

Tourism Red Deer Date: January 31, 2018
CENTRAL ALBERTA TOURISM ALLIANCE ACCOMMODATION STUDY V
VALUATION & ADVISORY SERVICES
DRIVE TIME MAP CATCHMENT – BRANDON, MB
Source: Alberta Culture & Tourism, Environics Analytics

VI CENTRAL ALBERTA TOURISM ALLIANCE ACCOMMODATION STUDY
Tourism Red Deer Date: January 31, 2018
VALUATION & ADVISORY SERVICES
DRIVE TIME MAP CATCHMENT – WINNIPEG, MB
Source: Alberta Culture & Tourism, Environics Analytics
DRIVE TIME MAP CATCHMENT – MOOSE JAW, SK
Source: Alberta Culture & Tourism, Environics Analytics
DRIVE TIME MAP CATCHMENT – MOOSE JAW, SK
Source: Alberta Culture & Tourism, Environics Analytics


ADDENDUM “B” Assumptions and Limiting Conditions
Cen
tra
l A
lber
ta T
ou
rism
Alli
an
ce A
cco
mm
od
atio
n S
tud
y

Tourism Red Deer Date: January 31, 2018
CENTRAL ALBERTA TOURISM ALLIANCE ACCOMMODATION STUDY
I
VALUATION & ADVISORY SERVICES
Assumptions and Limiting Conditions
1. This Advisory Report prepared by CBRE, is intended for the exclusive use of Tourism Red Deer
(“Client”), and is not intended to be prepared for, given to, or relied upon, by any other person or entity, without the express prior written consent of CBRE, and the individual(s) who authored the Advisory Report.
2. It is assumed that all factual data furnished by the Client, property owner, owner’s representative, or persons designated by the Client or owner to supply said data are accurate and correct unless otherwise specifically noted in the report. Unless otherwise specifically noted in the report, CBRE has no reason to believe that any of the data furnished contain any material error. Information and data referred to in this paragraph include, without being limited to, numerical street addresses, lot and block numbers, land dimensions, square footage area of the land, dimensions of the improvements, gross building areas, net rentable areas, usable areas, unit count, room count, rent schedules, income data, historical operating expenses, budgets, and related data. Any material error in any of the above data could have a substantial impact on the conclusions reported. Thus, CBRE reserves the right to amend conclusions reported if made aware of any such error. Accordingly, the client-addressee should carefully review all assumptions, data, relevant calculations, and conclusions within 30 days after the date of delivery of this report and should immediately notify CBRE of any questions or errors. CBRE does not make any representation or warranty, express or implied, as to the accuracy or completeness of the information or the state of affairs of the real property furnished by the Client to CBRE and contained in any report prepared by CBRE.
3. The date to which any of the conclusions and opinions expressed in this report apply, is set forth in the Letter of Transmittal. Further, that the dollar amount of any opinion herein rendered is based upon the purchasing power of the Canadian Dollar on that date. This advisory report is based on market conditions existing as of the date of this report. Under the terms of the engagement, we will have no obligation to revise this report to reflect events or conditions which occur subsequent to the date of the report. However, CBRE will be available to discuss the necessity for revision resulting from changes in economic or market factors affecting the subject.
4. The conclusions, which may be defined within the body of this report, are subject to change with market fluctuations over time.
5. Any cash flows included in the analysis are forecasts of estimated future operating characteristics are predicated on the information and assumptions contained within the report. Any projections of income, expenses and economic conditions utilized in this report are not predictions of the future. Rather, they are estimates of current market expectations of future income and expenses. The achievement of the financial projections will be affected by fluctuating economic conditions and is dependent upon other future occurrences that cannot be assured. Actual results may vary from the projections considered herein. CBRE does not warrant these forecasts will occur. Projections may be affected by circumstances beyond the current realm of knowledge or control of CBRE.
6. Unless specifically set forth in the body of the report, nothing contained herein shall be construed to represent any direct or indirect recommendation of CBRE to buy, sell, or hold the properties. Such decisions involve substantial investment strategy questions and must be specifically addressed in consultation form.

II CENTRAL ALBERTA TOURISM ALLIANCE ACCOMMODATION STUDY
Tourism Red Deer Date: January 31, 2018
VALUATION & ADVISORY SERVICES
7. The report has been prepared at the request of the Client, and for the exclusive (and confidential) use of the Client. The report may not be duplicated in whole or in part without the specific written consent of CBRE nor may this report or copies hereof be disclosed to third parties without said written consent, which consent CBRE reserves the right to deny. If consent is given, it will be on condition that CBRE will be provided with an Indemnification Agreement and/or Non-Reliance letter, in a form and content satisfactory to CBRE, by a party satisfactory to CBRE. Exempt from this restriction is duplication for the internal use of the client-addressee and/or transmission to attorneys, accountants, or advisors of the client-addressee. Also exempt from this restriction is transmission of the report to any court, governmental authority, or regulatory agency having jurisdiction over the party/parties for whom this appraisal was prepared, provided that this report and/or its contents shall not be published, in whole or in part, in any public document without the express written consent of CBRE which consent CBRE reserves the right to deny. Finally, this report shall not be advertised to the public or otherwise used to induce a third party to purchase the property or to make a “sale” or “offer for sale” of any “security”. Any third party which may possess this report is advised that they should rely on their own independently secured advice for any decision in connection with this property. CBRE shall have no accountability or responsibility to any third party.
8. The maps, plans, sketches, graphs, photographs and exhibits included in this report are for illustration purposes only and are to be utilized only to assist in visualizing matters discussed within this report. Except as specifically stated, data relative to size or area of the subject and comparable properties has been obtained from sources deemed accurate and reliable. None of the exhibits are to be removed, reproduced, or used apart from this report.
9. No opinion is intended to be expressed on matters which may require legal expertise or specialized investigation or knowledge beyond that customarily employed by real estate advisors.
10. Acceptance and/or use of this report constitutes full acceptance of the Contingent and Limiting Conditions and special assumptions set forth in this report. It is the responsibility of the Client, or Client’s designees, to read in full, comprehend and thus become aware of the aforementioned contingencies and limiting conditions. Neither the Advisor nor CBRE assumes responsibility for any situation arising out of the Client’s failure to become familiar with and understand the same. The Client is advised to retain experts in areas that fall outside the scope of the real estate appraisal/consulting profession if so desired.
11. CBRE assumes that the subject property analyzed herein will be under prudent and competent management and ownership; neither inefficient nor super-efficient.
12. It is assumed that there is full compliance with all applicable federal, provincial, and local environmental regulations and laws unless noncompliance is stated, defined and considered in the report.
13. Because market conditions, including economic, social and political factors, change rapidly and, on occasion, without notice or warning, the herein, as of the effective date of this appraisal, cannot be relied upon as of any other date without subsequent advice of CBRE.
14. Client shall indemnify and hold CBRE fully harmless against any loss, damages, claims, or expenses of any kind whatsoever (including costs and reasonable attorneys’ fees), sustained or incurred by a third party as a result of the negligence or intentional acts or omissions of Client, and for which recovery is sought against CBRE by that third party.