
Rapid resetting of an estuarine recorder of the 1964 Alaska earthquake
12
For permission to copy, contact [email protected] q 2001 Geological Society of America 1193 GSA Bulletin; September 2001; v. 113; no. 9; p. 1193–1204; 12 figures; Data Repository item 2001100. Rapid resetting of an estuarine recorder of the 1964 Alaska earthquake Brian F. Atwater* U.S. Geological Survey at Department of Earth and Space Sciences, University of Washington, Seattle, Washington 98195-1310, USA David K. Yamaguchi ² 5630 200th Street S.W., #202B, Lynnwood, Washington 98036-6260, USA Stein Bondevik § Department of Geology, University of Tromsø, N-9073 Tromsø, Norway Walter A. Barnhardt # U.S. Geological Survey, M.S. 999, 345 Middlefield Road, Menlo Park, California 94025, USA Lorin J. Amidon** Department of Earth Sciences, Dartmouth College, Hanover, New Hampshire 03755-3571, USA Boyd E. Benson ²² GeoEngineers, Inc., 8410 154th Avenue N.E., Redmond, Washington 98052, USA Gudrun Skjerdal §§ Department of Geology, University of Tromsø, N-9073 Tromsø, Norway John A. Shulene ## 928 11th Avenue S.W., Puyallup, Washington 98371, USA Futoshi Nanayama*** Active Fault Research Center, National Institute for Advanced Industrial Science and Technology, Tsukuba, Ibaraki 305-8567, Japan ABSTRACT Tides and plants have already restored much of a landscape that the 1964 Alaska earthquake destroyed. At the head of a ma- crotidal estuary near Anchorage, in the vi- cinity of Portage, subsidence during the earthquake changed meadows, thickets, and spruce groves into barren tidal flats. Tidal-flat silt and sand soon buried the pre- earthquake landscape while filling intertid- al space that the subsidence had made. The flats supported new meadows and thickets by 1973 and new spruce by 1980. Three new findings confirm that the flats aggrad- ed rapidly and that their vegetation is ma- *E-mail: Atwater: [email protected]. ² Yamaguchi: [email protected]. § Bondevik: [email protected]. # Barnhardt: [email protected]. **Amidon: [email protected]. ²² Benson: [email protected]. §§ Skjerdal: [email protected]. ## Shulene: [email protected]. ***E-mail: [email protected]. turing. (1) Most of the postearthquake de- posits at Portage date from the first decade after the 1964 earthquake. Their thickness of 23 sites in a 0.5 km 2 area was 1.4 6 0.2 m in 1973, 1.6 6 0.2 m in 1991, and 1.6 6 0.3 m in 1998. (2) Many of the deposits probably date from the first months after the earthquake. The deposits contain sedi- mentary couplets in which coarse silt or very fine sand is capped by fine or medium silt. About 100 such couplets make up the lowest 0.5 m or more of the postearthquake deposits in two outcrops. These couplets thicken and thin rhythmically, both as groups of 5–20 couplets and as pairs of suc- cessive couplets. Probably, the groups of thick couplets represent the highest tides, the groups of thin couplets represent some of the lesser high tides, and the pairs record inequality between twice-daily high tides. (3) In the 1980s and 1990s, thickets ex- panded and spruce multiplied. The vegeta- tion now resembles the fossil assemblage rooted in the buried landscape from 1964. Had the 1964 Alaska earthquake been re- peated a decade later, the two earthquakes would now be recorded by two superposed, buried landscapes near Portage. Much more than a decade is probably needed to reset similar recorders at mesotidal estu- aries of the Cascadia subduction zone. Keywords: Alaska, earthquakes, estuaries, Holocene, stratigraphy. INTRODUCTION If the same part of a fault produces back- to-back earthquakes, how much time must pass between them for each earthquake to leave a distinct geologic record? For example, where a fault ruptures a previously unbroken deposit, when will deposits create a new marker for the next rupture? Where a fresh- ened fault scarp sheds colluvium, how quickly will a soil make this deposit distinct from later colluvium? After coseismic uplift raises a wave-cut platform, how soon will waves cut
Transcript of Rapid resetting of an estuarine recorder of the 1964 Alaska earthquake

For permission to copy, contact [email protected] 2001 Geological Society of America 1193
GSA Bulletin; September 2001; v. 113; no. 9; p. 1193–1204; 12 figures; Data Repository item 2001100.
Rapid resetting of an estuarine recorder of the 1964 Alaska earthquake
Brian F. Atwater*U.S. Geological Survey at Department of Earth and Space Sciences, University of Washington, Seattle, Washington98195-1310, USA
David K. Yamaguchi†
5630 200th Street S.W., #202B, Lynnwood, Washington 98036-6260, USA
Stein Bondevik§
Department of Geology, University of Tromsø, N-9073 Tromsø, Norway
Walter A. Barnhardt#
U.S. Geological Survey, M.S. 999, 345 Middlefield Road, Menlo Park, California 94025, USA
Lorin J. Amidon**Department of Earth Sciences, Dartmouth College, Hanover, New Hampshire 03755-3571, USA
Boyd E. Benson††
GeoEngineers, Inc., 8410 154th Avenue N.E., Redmond, Washington 98052, USA
Gudrun Skjerdal§§
Department of Geology, University of Tromsø, N-9073 Tromsø, Norway
John A. Shulene##
928 11th Avenue S.W., Puyallup, Washington 98371, USA
Futoshi Nanayama***Active Fault Research Center, National Institute for Advanced Industrial Science and Technology, Tsukuba, Ibaraki 305-8567,Japan
ABSTRACT
Tides and plants have already restoredmuch of a landscape that the 1964 Alaskaearthquake destroyed. At the head of a ma-crotidal estuary near Anchorage, in the vi-cinity of Portage, subsidence during theearthquake changed meadows, thickets,and spruce groves into barren tidal flats.Tidal-flat silt and sand soon buried the pre-earthquake landscape while filling intertid-al space that the subsidence had made. Theflats supported new meadows and thicketsby 1973 and new spruce by 1980. Threenew findings confirm that the flats aggrad-ed rapidly and that their vegetation is ma-
*E-mail: Atwater: [email protected].†Yamaguchi: [email protected].§Bondevik: [email protected].#Barnhardt: [email protected].**Amidon: [email protected].††Benson: [email protected].§§Skjerdal: [email protected].##Shulene: [email protected].***E-mail: [email protected].
turing. (1) Most of the postearthquake de-posits at Portage date from the first decadeafter the 1964 earthquake. Their thicknessof 23 sites in a 0.5 km2 area was 1.4 6 0.2m in 1973, 1.6 6 0.2 m in 1991, and 1.6 60.3 m in 1998. (2) Many of the depositsprobably date from the first months afterthe earthquake. The deposits contain sedi-mentary couplets in which coarse silt orvery fine sand is capped by fine or mediumsilt. About 100 such couplets make up thelowest 0.5 m or more of the postearthquakedeposits in two outcrops. These coupletsthicken and thin rhythmically, both asgroups of 5–20 couplets and as pairs of suc-cessive couplets. Probably, the groups ofthick couplets represent the highest tides,the groups of thin couplets represent someof the lesser high tides, and the pairs recordinequality between twice-daily high tides.(3) In the 1980s and 1990s, thickets ex-panded and spruce multiplied. The vegeta-tion now resembles the fossil assemblagerooted in the buried landscape from 1964.
Had the 1964 Alaska earthquake been re-peated a decade later, the two earthquakeswould now be recorded by two superposed,buried landscapes near Portage. Muchmore than a decade is probably needed toreset similar recorders at mesotidal estu-aries of the Cascadia subduction zone.
Keywords: Alaska, earthquakes, estuaries,Holocene, stratigraphy.
INTRODUCTION
If the same part of a fault produces back-to-back earthquakes, how much time mustpass between them for each earthquake toleave a distinct geologic record? For example,where a fault ruptures a previously unbrokendeposit, when will deposits create a newmarker for the next rupture? Where a fresh-ened fault scarp sheds colluvium, how quicklywill a soil make this deposit distinct from latercolluvium? After coseismic uplift raises awave-cut platform, how soon will waves cut

1194 Geological Society of America Bulletin, September 2001
ATWATER et al.
Figure 1. Earthquake-induced cycle of for-est death and renewal at an estuary. Forest1 dies from tidal submergence due to earth-quake A (Figs. 12A and 4A). Tidal sedimentburies the floor of the dead forest andbuilds land on which forest 2 grows (Fig. 3,B and C). This next forest eventually diesfrom effects of earthquake B. Recurrenceintervals in the vicinity of Portage, Alaska(location shown in Fig. 2), are from Com-bellick (1991) and Bartsch-Winkler andSchmoll (1992).
the next platform? Such lags become impor-tant if they make a paleoseismic record incom-plete, for in that case the earthquake hazard isgreater than the geology may imply (Mc-Calpin and Nelson, 1996, p. 15–17).
Short recurrence intervals present little dif-ficulty for the classic geologic recorder of co-seismic subsidence (Fig. 1). The setting forthis recorder is Portage, Alaska, at the head ofa macrotidal estuary along a subduction zone(Fig. 2). During the 1964 earthquake, Portageand its surroundings subsided into the estu-ary’s intertidal zone (Plafker, 1969). Duringthe next 15 yr, tidal silt and sand buried thesubsided landscape while building a new onecapable of recording the next earthquake(Ovenshine et al., 1976; Ovenshine and Ka-chadoorian, 1976; Bartsch-Winkler and Gar-row, 1982; Bartsch-Winkler, 1988).
To these previous findings we add severalnew ones, to emphasize how soon the Portagearea became ready to record the 1964 earth-quake’s successor. First, using repeated mea-surements of the thickness of postearthquakedeposits, we confirm previous estimates thatmost of the deposition took place in the firstdecade after the 1964 earthquake. Next, wedescribe rhythmic bedding as evidence fordecimeters of tidal deposition within the firstmonths after the earthquake. We then provide
an update on the maturing postearthquakelandscape by describing the distribution andage of plants that lived on the aggraded landin 1998. Finally, we make comparisons withthe probably slower recovery of tidal marshesand forests at the Cascadia subduction zone.
SETTING
Tides and Sediment
Portage adjoins the uppermost part of Tur-nagain Arm (Fig. 2, B and C), an estuary hav-ing a huge tidal range, strong tidal currents,and broad tidal flats (Bartsch-Winkler andOvenshine, 1984). The estuary’s tides at An-chorage have a mean range of 9 m and a max-imum range close to 11 m. The highest hightides, during twice-monthly series of so-calledspring tides, are as much as 3 m above thelevel of the lowest high tides, which are in theintervening series of neap tides. Most dayshave two high tides that differ in height by afew tenths of a meter. The highest spring tidesarrive as bores that ascend channels at speedsof several meters per second. The bores alsotraverse tidal flats, which make up nine-tenthsof the estuary upstream (southeast) ofGirdwood.
The tidal flats are made of noncohesivefine-grained sediment—chiefly coarse silt andvery fine sand (Bartsch-Winkler and Ovenshi-ne, 1984; Bartsch-Winkler, 1988). These de-posits contain few burrowing animals and nomacroalgal cover. When swept by bores, someof the tidal flats may be scoured to depths of10 cm or more (A.T. Ovenshine, 1998, writtencommun.). In the 1970s, Ovenshine inferredsuch erosion by noting, after successive tidalcycles, the exposed length of stakes on a sandbar near Girdwood.
Subsidence in 1964
The March 27, 1964, Alaska earthquake, ofmoment magnitude 9.2 (Kanamori, 1977),caused as much as 2.3 m of tectonic subsi-dence in a largely coastal belt 850 km longand 150 km wide (Fig. 2B; Plafker, 1969).Seismic shaking locally added to the subsi-dence by causing unconsolidated deposits tosettle (Plafker, 1969; McCulloch and Bonilla,1970).
In Portage and vicinity (Fig. 2C), the earth-quake produced 1.5 m of tectonic subsidenceand mostly unknown amounts of nontectonicsubsidence (McCulloch and Bonilla, 1970, p.D81). The tectonic subsidence was measuredat geodetic benchmarks on bedrock, the near-est of them 3.5 km northwest of town. Non-
tectonic subsidence averaged about 1 m on arailroad embankment that probably settledmore than did undeveloped land.
The area lowered into the intertidal zonenear Portage contained groves of spruce andcottonwood, thickets of alder and willow,marshes and bogs, hunting cabins, and a gasstation (Plafker et al., 1969; Ovenshine et al.,1976). Some 18 km2 became unvegetated tidalflat (Fig. 2, D and E).
THICKNESS OF POSTEARTHQUAKEDEPOSITS
Newly tidal land near Portage built upquickly in the first decade after the 1964 earth-quake. By 1973 it had accumulated over 20000 000 m3 of postearthquake silt and sand, asjudged from thickness measurements at 301sites in 1973 (Ovenshine et al., 1976). Thedeposit was 1–2 m thick at most of these sites(Fig. 2C).
This accretion dwarfed concurrent land-lev-el changes from postearthquake uplift. Post-earthquake uplift amounted to just 0.3 m be-tween 1964 and 1975 (Brown et al., 1977, p.3370)—both at benchmark P 73 in Portage(location in Fig. 2F) and at the benchmark onbedrock 3.5 km northwest of town (Fig. 3A).Greater uplift between 1964 and 1975 was de-tected at benchmarks farther northwest, to-ward Anchorage, but none of it exceeded 0.6m (Brown et al., 1977, p. 3370). Similarly, attide gages in Anchorage and Seward, pos-tearthquake uplift between 1964 and 1989 didnot exceed 0.2 m (locations in Fig. 1B; Savageand Plafker, 1991, p. 4330–4331).
Measurements in 1991 and 1998
We remeasured the thickness of postearth-quake deposits in 1991 and 1998 at nearly twodozen of the sites studied in 1973 (Fig. 3B).The remeasured sites lie west of Portage, be-tween Twentymile River and Portage Creek(Fig. 2F; Fig. DR11). Most are at or near chan-nel junctions from 1973 that were still rec-ognizable in 1991 and 1998, even though thechannels had mostly filled. To reoccupy thejunctions, we used the same 1:24 000 black-and-white aerial photographs, taken in 1973,on which Ovenshine et al. (1976) plotted lo-calities in the field. We also used 1:12 000 col-or air photos taken in 1989. We bored holes
1GSA Data Repository item 2001100, TablesDR1–DR4 and Figures DR1–DR3, is available onthe Web at http://www.geosociety.org/pubs/ft2001.htm. Requests may also be sent to Docu-ments Secretary, GSA, P.O. Box 9140, Boulder, CO80301; e-mail: [email protected].

Geological Society of America Bulletin, September 2001 1195
ESTUARINE STRATIGRAPHY AS A RECORDER OF SUBDUCTION-ZONE EARTHQUAKES
Figure 2. (A and B) Tectonic setting of the 1964 Alaska earthquake. Subsidence from Plafker (1969). (C) Postearthquake deposits andtheir geologic setting in the early 1970s. (D–F) Area around Portage outlined in C, showing the landscape two years before the earthquake(D), two years after the earthquake (E), and nine years after the earthquake (F). In F, location of benchmark P 73 is from http://www.ngs.noaa.gov/cgi-bin/ds2.prl and the Seward (D-6) SE 7.5-minute quadrangle, provisional edition of 1984.
on the flattest ground near 23 sites in 1991and near 22 of the same sites in 1998. Foreach hole we used a hand auger 5 or 10 cmin diameter; at many sites we also used agouge corer 2 cm in diameter.
Like Ovenshine and his coworkers, weidentified the buried 1964 surface by its buriedsoil. At most, sites this soil contains an up-permost horizon of organic mud 1–2 cm thick,
which overlies silt more compact and lesssandy than deposits above the soil. At mostsites, the lowest 20 cm of deposits above thesoil contains elongate pieces of black decayedorganic matter, which in outcrop can be iden-tified as stems or leaves of plants rooted in theburied soil.
Our thickness comparisons of postearth-quake deposits contain two main uncertainties.
First, exact locations may differ among the1973, 1991, and 1998 field work by as muchas 30 m, particularly between 1973 and thelater years. Second, whereas thickness mea-surements in 1991 and 1998 were limited toboreholes, a more representative thicknesswas measured in 1973 by hand leveling fromchannel outcrops of the 1964 surface to thegeneral level of the new tidal flat.

1196 Geological Society of America Bulletin, September 2001
ATWATER et al.
Figure 3. Postearthquake changes in landlevel and vegetation near Portage. (A) (atbottom) Uplift of benchmark on bedrock3.5 km northwest of Portage. Brown et al.(1977) reported similar uplift for bench-mark P 73 in Portage (location shown inFig. 2F). (B) Thickness and coarseness ofpostearthquake silt and sand in area westof Portage between Twentymile River andPortage Creek (Fig. 2F; Fig. DR1 and TableDR1; see footnote 1). (C) Return of livingspruce trees (Fig. DR2 and Table DR4; seefootnote 1).
We used analysis of variance to look forsignificant differences among the three sets ofmeasurements, and we used the Tukey test toexamine specific pairs of means for differenc-es. These statistical methods are described byZar (1996).
Changes Since 1973
Most of the postearthquake aggradation offlats near Portage was completed by 1973. Inthat year, the thickness of postearthquake de-posits between Twentymile River and PortageCreek had a mean and standard deviation of1.40 6 0.25 m (23 sites of Ovenshine et al.,1976; Figs. 2F, 3B; Fig. DR1, Table DR1; seefootnote 1). These numbers changed to 1.606 0.25 m in 1991 (same 23 sites, within es-
timated relocation error) and 1.65 6 0.27 min 1998 (22 of these sites). Thickness in-creased between 1973 and 1991 at 19 of 23sites, and this increase passes the Tukey testfor significance (p ,0.05; Table DR1; seefootnote 1). By contrast, thickness increasedbetween 1991 and 1998 at only 12 of 22 sites,and this change is not significant.
These findings confirm that sediment quick-ly filled the space made available by subsi-dence from the 1964 earthquake. The meanthickness in 1973 (1.4 m) resembles the tec-tonic component of this subsidence (1.5 m).The mean thickness in 1991 and 1998 (1.6 m)resembles the total, net subsidence if addition-al space was created by compaction in 1964,and if most of this extra space was closed bytectonic uplift between 1964 and 1975 (Fig.3A).
The newly deposited sediment became fineras deposition slowed in the 1970s and 1980s(Bartsch-Winkler, 1988). In the area of the airphotos in Figure 2, surface sediment in 1974contained at least 10% sand at each of 18 sitesand more than 30% sand at two of them. Asimilar suite of 19 samples contained no morethan 6% sand in 1981 (Fig. 3B).
Both the slowing of deposition and the fin-ing of surface sediment are signs of postearth-quake emergence at Portage (Ovenshine andKachadoorian, 1976; Bartsch-Winkler, 1988).As the land emerged—more by depositionthan by uplift (Fig. 3, A and B)—tides floodedit less often, less vigorously, and for shorterperiods of time.
DEPOSITS FROM THE FIRSTMONTHS AFTER THE EARTHQUAKE
The postearthquake section contains lami-nae that repeat rhythmically. As interpretedbelow, these rhythmic deposits built up thepostearthquake tidal flats by at least 0.5 m inthe first few months after the earthquake.
Methods
We measured postearthquake sections intwo riverbank outcrops chosen for ease of ac-cess and freshness of exposure. One is on amidstream island of Twentymile River (Figs.2C, 4, and 5); the other, along a meander ofPortage Creek (Fig. 2, C and E; Fig. 6). Theirsetting around the time of the earthquake isshown by air photos taken between 1962 and1966 (Figs. 2E and 4).
At both outcrops we used a tripod-mountedautomatic level to survey control points on theburied 1964 surface and on the modern bank-top surface (Figs. 7A and 8A). In addition, we
cleaned vertical panels 1–3 m wide (Fig. 5, Aand B), etched bedding by splashing the pan-els with water, sketched the main stratigraphicunits in each panel (Fig. 7, B and C; Fig. 8B),and measured to the nearest millimeter thethickness of sediment couplets (Figs. 7D and8C; Table DR2; see footnote 1). The thicknessmeasurements at Twentymile River weremade separately by two different observers ateach panel.
We assigned couplets to groups defined bycouplet thickness, as described below. Wegave letter names to three probably wide-spread groups of couplets (F, G, and U in Figs.5 and 7) and to units bounded by unconfor-mities (K-M and Q-S in Fig. 8).
To study fine details of bedding, we used aresin peel of a sample collected from the sur-veyed outcrop at Twentymile River (Figs. 5A,7A, and 9).
Description
CoupletsSediment couplets make up most of the
postearthquake deposit in both outcrops. Mostcontain a lower layer of coarse silt or very finesand, rarely more than 2 cm thick, and an up-per layer of fine or medium silt 1–2 mm thick(Fig. 5, B and C; Fig. 6A; Fig. 9). About 100such couplets make up the lowest 1 m of thepostearthquake deposit (Figs. 7 and 8).
The couplets in the lowest 0.5–0.8 m of thedeposit come in alternating groups of mostlythick (.5 mm) couplets and mostly thin (1–3mm) couplets. Some of the groups grade intoone another through couplets of intermediatethickness. Individual groups contain 5–20couplets. At least six groups of thin coupletsare present in the lowest 1 m of the postearth-quake deposit (Fig. 5, B and C; Fig. 7, C andD, sections 1–6; Fig. 8, B and C, section 9,lower part of unit L; Fig. 9).
Within most of the groups of thick couplets,successive couplets are alternately thicker andthinner (Figs. 7D and 8C). The main excep-tion is group U, in which couplets are uni-formly thick (Figs. 5B and 7D). Similaritiesin patterns of couplet thickness show thatgroup U and underlying group G extend alongat least 80 m of the Twentymile River outcropand may be present at Portage Creek as well(Figs. 5 and 7).
Groups of thick couplets become less dis-tinct upward above group U (Fig. 7D, sections2 and 5–8). In two of the tallest sections, thethickest couplets also tend to become thinnerupward (Fig. 7D, section 6; Fig. 8, section 9).Such thinning is not evident, however, in twoother tall sections (Fig. 7D, sections 2 and 8).

Geological Society of America Bulletin, September 2001 1197
ESTUARINE STRATIGRAPHY AS A RECORDER OF SUBDUCTION-ZONE EARTHQUAKES
Figure 4. Aerial views of lower Twentymile River. (A) High tide in the first weeks afterthe 1964 earthquake, probably on April 14. For low-tide views of the same area, seeMcCulloch and Bonilla (1970, p. D46 and Pl. 3). (B) Lower tide sometime in 1965. Locationis shown in Figure 2C.
Though most couplets are flat, some are wavyfrom deposition on ripples (Fig. 5, B and C; Fig.6B; Fig. 9). Many of the ripples climb throughdozens of successive rhythmites, and the direc-tion of climb suggests that some of the ripplesformed during flood (rising) tides. Where stud-ied in three dimensions at Twentymile River, rip-ples climb upstream, away from Turnagain Arm(Fig. 7A). Nearby, where checked only on anoutcrop that trends parallel to the river, ripplesclimb in an apparent downstream direction (Fig.5C). Where similarly checked on an outcropalong Portage Creek, ripples appear to climb up-stream through about 30 successive couplets(Figs. 5E and 8B).
Most of the sandy couplets contain parallellamination. However, the peel shows sand to bemassive in some of the thick couplets and cross-
laminated in at least six others (Fig. 9). The peelfurther implies that group F contains about twiceas many thin couplets as were counted nearbyin the field (Fig. 7, C and D, section 4). In thisnearby field count, we may have treated severalof the thinnest couplets in group F as parallellamination within thicker couplets.
Other Features Low in thePostearthquake Section
Erosional unconformities are more obviousand common at the Portage Creek outcrop(Fig. 6, A and C; Fig. 8B) than at the Twen-tymile River outcrop (Fig. 5, B and C; Fig. 7,B and C). At Portage Creek their relief rangesfrom a few centimeters (in unit Q of section10) to at least 1 m (beneath unit S of section10). Many of the unconformities probably re-
sulted from the rilling evident in 1965 and1966 air photos (Figs. 2E and 4B). Like theunconformities, rills were more common nearthe Portage Creek site (Fig. 2E) than near theTwentymile River site (Fig. 4B).
A fault displaces a group of thin coupletslow in the section at Portage Creek, withinunit R (Fig. 8B, section 10). This fault mayhave resulted from huge cakes of ice movedby postearthquake tides in April 1964. Suchcakes abounded near Portage, as shown byphotographs from that time (Fig. 4A; Plafkeret al., 1969, p. 41; McCulloch and Bonilla,1970, p. D83).
Evidence for Rapid Deposition
Several lines of evidence suggest that muchof the postearthquake section near Portageformed in the first months after the 1964earthquake. Postearthquake photographs shownew tidal-flat deposits in the area as early asApril 1964. The sediment couplets in the post-earthquake deposits resemble rhythmic bed-ding ascribed, at other macrotidal estuaries, toindividual high tides, inequality betweentwice-daily high tides, and neap-spring cycles.The couplets are too many to record merelyseasonal or annual cycles in deposition.Though too few to record every high tide, thecouplets likely record the highest tides. Thegroups of thick couplets may match specificseries of high tides from the first months afterthe 1964 earthquake.
Photographs from 1964–1966Tides began making a new deposit at Por-
tage in the first weeks after the March 27earthquake. An air photo taken April 14, dur-ing the month’s highest predicted tide, showsthe town invaded by floating ice like the cakesin Figure 4A (Plafker et al., 1969, p. 41). An-other photograph of the town shows ice cakesgrounded at a lower tide (McCulloch andBonilla, 1970, p. D83). These cakes rest onsmooth, glistening surfaces probably of silt orsand.
One to two years later the new deposit wasthick enough to obscure pre-earthquake shrubsand to contain hundreds of rills not present in1962 (Fig. 2D). These changes are evident onair photos taken in 1965 (Fig. 4B) and 1966(Fig. 2E).
Sediment Couplets at Other EstuariesCouplets like those near Portage are known
from the modern deposits of two other macro-tidal estuaries—the Bay of Fundy, Canada(Dalrymple and Makino, 1989; Dalrymple et
1198 Geological Society of America Bulletin, September 2001
ATWATER et al.
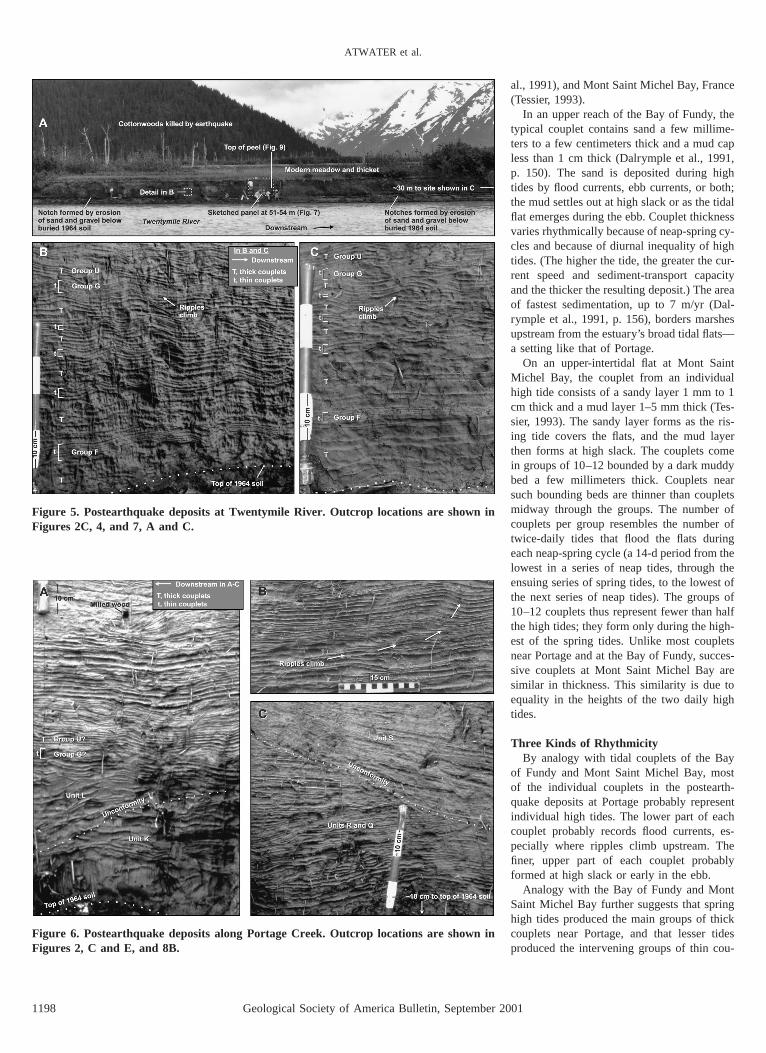
Figure 5. Postearthquake deposits at Twentymile River. Outcrop locations are shown inFigures 2C, 4, and 7, A and C.
Figure 6. Postearthquake deposits along Portage Creek. Outcrop locations are shown inFigures 2, C and E, and 8B.
al., 1991), and Mont Saint Michel Bay, France(Tessier, 1993).
In an upper reach of the Bay of Fundy, thetypical couplet contains sand a few millime-ters to a few centimeters thick and a mud capless than 1 cm thick (Dalrymple et al., 1991,p. 150). The sand is deposited during hightides by flood currents, ebb currents, or both;the mud settles out at high slack or as the tidalflat emerges during the ebb. Couplet thicknessvaries rhythmically because of neap-spring cy-cles and because of diurnal inequality of hightides. (The higher the tide, the greater the cur-rent speed and sediment-transport capacityand the thicker the resulting deposit.) The areaof fastest sedimentation, up to 7 m/yr (Dal-rymple et al., 1991, p. 156), borders marshesupstream from the estuary’s broad tidal flats—a setting like that of Portage.
On an upper-intertidal flat at Mont SaintMichel Bay, the couplet from an individualhigh tide consists of a sandy layer 1 mm to 1cm thick and a mud layer 1–5 mm thick (Tes-sier, 1993). The sandy layer forms as the ris-ing tide covers the flats, and the mud layerthen forms at high slack. The couplets comein groups of 10–12 bounded by a dark muddybed a few millimeters thick. Couplets nearsuch bounding beds are thinner than coupletsmidway through the groups. The number ofcouplets per group resembles the number oftwice-daily tides that flood the flats duringeach neap-spring cycle (a 14-d period from thelowest in a series of neap tides, through theensuing series of spring tides, to the lowest ofthe next series of neap tides). The groups of10–12 couplets thus represent fewer than halfthe high tides; they form only during the high-est of the spring tides. Unlike most coupletsnear Portage and at the Bay of Fundy, succes-sive couplets at Mont Saint Michel Bay aresimilar in thickness. This similarity is due toequality in the heights of the two daily hightides.
Three Kinds of RhythmicityBy analogy with tidal couplets of the Bay
of Fundy and Mont Saint Michel Bay, mostof the individual couplets in the postearth-quake deposits at Portage probably representindividual high tides. The lower part of eachcouplet probably records flood currents, es-pecially where ripples climb upstream. Thefiner, upper part of each couplet probablyformed at high slack or early in the ebb.
Analogy with the Bay of Fundy and MontSaint Michel Bay further suggests that springhigh tides produced the main groups of thickcouplets near Portage, and that lesser tidesproduced the intervening groups of thin cou-

Geological Society of America Bulletin, September 2001 1199
ESTUARINE STRATIGRAPHY AS A RECORDER OF SUBDUCTION-ZONE EARTHQUAKES
Figure 7. Bedding in postearthquake deposits at Twentymile River. (A) (at bottom): Out-crop (location shown in Figs. 2C and 4). Nuggets denote a lode of moose droppings on1964 soil. (B and C) Sketched panels. (D) Couplet thickness (Table DR2; see footnote 1).Letters in parentheses identify the author who made the measurements; LA—Amadon,BB—Benson, DY—Yamaguchi, FN—Nanayama. Scales are the same as in Figure 8.
plets. The lesser high tides were probably in-termediate between spring tides and neaptides, as shown in Figure 10A and discussedfurther in the next section.
As at the Bay of Fundy, the common alter-nation between relatively thick and thin cou-plets probably represents height differencesbetween the two daily high tides. This differ-ence approached 0.5 m during the high-tideseries early in the months of May, June, andJuly of 1964 (Fig. 10A). Where successivecouplets have uniform thickness (group U),they may correlate with series of nearly equal
high tides, such as the series in early Augustof 1964.
Number of CoupletsAt 100 or more, the couplets are too many
to explain by annual or seasonal cycles. Mostor all of the couplets probably date to the firstdecade after the earthquake, because most ofthe postearthquake deposition near Portagewas over by 1973 (Fig. 3B).
The couplets are too few, however, to re-cord more than half the high tides in theneap-spring cycles they likely span. In a
postearthquake section interrupted by fewunconformities, the lowest 0.8 m containsabout 100 couplets, and the thickest of thesecouplets form about eight groups (Fig. 7D,section 1). If each group represents a differentseries of spring tides, the roughly 100 coupletsspan at least eight neap-spring cycles—a timeincluding well over 200 twice-daily high tides.
Like tides at upper-intertidal flats of MontSaint Michel Bay (Tessier, 1993, p. 359), onlythe highest of the postearthquake high tidesnear Portage covered the sites of our measuredsections. Such selective inundation can bemodeled from amounts of coseismic subsi-dence and from tide predictions for the firstmonths after the 1964 earthquake (Fig. 10).
In a highly simplified case, land near Por-tage drops 1.5 m from tectonic subsidenceduring the March 27 earthquake (H in Fig.10A), and this subsidence changes the landlevel from just above maximum pre-earth-quake high tide to near the median of hightides predicted for the first seven months afterMarch 27. The land then remains at this newlevel. With these assumptions, about half thepostearthquake high tides fail to reach the newland level, and the higher tides repeat ingroups (Fig. 10E), somewhat like the thickcouplets (Fig. 10, B and C).
In a more realistic case, the land drops anadditional 0.5 m from settlement during theearthquake, for a total of 2.0 m of coseismicsubsidence, and it steadily aggrades 1.3 m inthe next seven months (diagonal line in Fig.10A). As the land aggrades, the highest tidesstill come in groups but cover it less deeply(Fig. 10D). Such shoaling may explain theoverall upward thinning of couplets in section6 (Fig. 7D) and in section 9 (Fig. 8), as wellas the small amount of deposition since 1973(Fig. 3B).
Correlation with Specific Tidal SeriesIf the couplets represent tides, the groups of
thick couplets should match particular seriesof spring tides. The possibility of such amatch is shown by speculative correlation be-tween groups of thick couplets in the Twen-tymile River outcrop and series of spring tidespredicted for Anchorage (Fig. 10, dashed linesbetween parts C and D).
In this correlation, we assume that the low-est group of thick couplets (between the 1964soil and thin group F) formed during thespring tides centered on April 14, not duringthe first few days after the March 27 earth-quake. This assumption is consistent withpostearthquake air photos of the Portage areaand perhaps also with an eyewitness account.
The air photos imply that the late March

1200 Geological Society of America Bulletin, September 2001
ATWATER et al.
Figure 8. Bedding in postearthquake deposits at Portage Creek. (A) (at bottom) Outcrop(location shown in Fig. 2, C and E). (B) Sketched panels. (C) Couplet thickness (TableDR2; see footnote 1). Letters in parentheses identify the author who made the measure-ments; BB—Benson, BA—Atwater. Scales are the same as in Figure 7.
tides failed to reach the sites of our measuredsections. Used for mapping earthquake-in-duced cracks in snow (McCulloch and Bon-illa, 1970, Pl. 3), the photos show no sign thatice cakes invaded Portage, which they did onApril 14 (see above section, ‘‘Photographsfrom 1964–1966’’). The air photos do showice cakes on channel banks along TwentymileRiver and Portage Creek, but only down-stream from the sites of the outcrops wherewe measured couplets.
The eyewitness account implies little or noinundation in the first few days of the earth-quake. It comes from a man who owned and
operated Portage Garage (Fig. 2E) at the timeof the 1964 earthquake and who lived on theproperty at the time. When interviewed a de-cade later by A.T. Ovenshine (1998, writtencommun.), he recalled a few days havingpassed before tides flooded the buildings. Per-haps ice in upper Turnagain Arm impeded thehighest postearthquake tides in late March.
Our speculative correlation of Twentymilecouplets with Anchorage tides contains a fur-ther assumption: that the first postearthquakegroup of uniformly thick couplets (group U)formed during the first postearthquake seriesof spring tides in which the two daily high
tides were of similar predicted height (Fig.10). This series, which peaked August 8 and9 of 1964, followed four to seven series ofpostearthquake spring tides that may havecovered subsided land near Portage. The ear-lier series may have produced the five groupsof thick couplets that underlie group U inTwentymile sections 1 and 2, and they maysimilarly explain the four or more groups ofthick couplets beneath group U in Twentymilesection 5 (Fig. 7D).
Such dating of postearthquake couplets nearPortage could be improved in several ways.Thickness patterns in the couplets could bemeasured in additional sections. They couldbe compared with additional features of tidalcycles described by Kvale et al. (1999), suchas the monthly alternation between a series ofextreme spring tides and a series of less ex-treme spring tides, as occurred in April andMay of 1964 (Fig. 10A). Observed tides couldbe substituted for the predicted tides in Figure10 (if postearthquake tidal curves are stillavailable from the Anchorage gage from thefirst months after the 1964 earthquake). Alsohelpful would be data on winds and storms,for the tidal couplets at Mont Saint MichelBay are thickened by sediment suspended dur-ing storms (Tessier, 1993, p. 363). Signs ofseasonal or annual cycles could be sought inthe measured sections, to locate such timelines as the first postearthquake winter.
VEGETATION IN 1998
In the 1990s, young shrubs and trees in-creasingly covered the recently aggraded landnear Portage. These plants continued a suc-cessional trend that began with grass and wil-low by 1974 (Ovenshine and Kachadoorian,1976) and included spruce by 1980 (Bartsch-Winkler and Garrow, 1982; Bartsch-Winkler,1988).
Methods
Between June 26 and July 2, 1998, we stud-ied plant distribution in the area of repeatedthickness measurements of postearthquake de-posits near Portage (Fig. 2F). In this area weidentified major plant taxa to genus or species,following the taxonomy of Hulten (1941–1946) (Table DR3; see footnote 1). In thesame area, we also measured vertical rangesof major taxa and determined ages of post-earthquake spruce (Picea sitchensis orhybrids).
To measure vertical ranges, we noted theoccurrence of plant taxa along a leveled tran-sect (Figs. 2F and 11). The height of the

Geological Society of America Bulletin, September 2001 1201
ESTUARINE STRATIGRAPHY AS A RECORDER OF SUBDUCTION-ZONE EARTHQUAKES
Figure 9. Bedding in a peel from an outcrop along Twentymile River (location shown inFigs. 5A and 7C). Viewed as if behind the outcrop, facing the camera in Figure 5A. (A)Overview. (B) Sketch. (C) Cross-lamination from one or more thick couplets. (D) Parallellamination in thin and thick couplets. (E) Lowest group of thin couplets, group F.
ground surface was measured with an auto-matic level at 172 points distributed unevenlyalong a distance of 837 m. Most of thesepoints were measured at boundaries betweenplant assemblages. Closure error in the level-ing was less than 1 cm.
We dated 73 postearthquake spruce (Figs.2F and 3C; Fig. DR2 and Table DR4; see foot-note 1). Using increment borers 5 mm in di-
ameter, we collected cores from 61 spruce atheights of 1 to 26 cm above ground. The coreswere mounted and sanded, and their annualrings were counted by standard methods(Stokes and Smiley, 1996). Cores of 23 sprucecontain the center ring (pith). For the other 38cored trees, we estimated pith dates from theyear and curvature of the innermost coredring.
Twelve spruce were too slender for coring.On stems of these saplings, we measuredheight increments marked by nodes at branch-es (Fig. DR3; see footnote 1). Such nodes,where high on conifer stems, mark annual in-creases in height. We also sacrificed a fewsaplings to check the dates inferred fromnodes and to measure growth increments lowon their stems, where node positions are ob-scured by radial growth and by death of earlybranches. Using these samples, we countedannual rings on sanded cross sections at 5-cmintervals on the lowest 45 cm of tree 46 andon the lowest 80 cm of tree 66 (Fig. DR3; seefootnote 1).
The nodal measurements gave nearly lineargrowth rates—from 4 to 13 cm/yr—that weused to correct tree ages for sampling height(Figs. 3C; Fig. DR3; see footnote 1). The larg-est correction was 6 yr, applied to five treescored 26 cm above the 1998 land surface (Ta-ble DR4; see footnote 1). We did not correctcore heights for sedimentation around thetrees because most of the trees sprouted atleast a decade after postearthquake depositionhad nearly ceased (Fig. 3, B and C).
Topography
What was new tidal flat at Portage in 1964had become, by 1998, a well-vegetated plainabove all but the highest tides. In 1998 theplain had decimeters of relief along most ofthe leveled transect (Fig. 11) and a maximumof 2 m of relief at tidal channels.
Tides still covered the plain in 1998, asshown by silt coatings on leaf litter. However,high tides were confined to major channelseven on June 26, when the maximum predict-ed tide at Anchorage was only 1 m below theyear’s highest astronomically predicted levels(National Ocean Service, 1997).
Vegetation Patterns
A mosaic of meadows and thickets coveredPortage flats in early summer of 1998 (Fig.11). In the meadows stood vetchling (Lathyruspalustris), yarrow (Achillea borealis), silver-weed (Potentilla egedii), lupine (Lupinusnootkatensis), horsetail (Equisetum arvense),rush (Juncus sp.), sedge (Carex lyngbyaei),wild flag (Iris setosa), and several kinds ofgrass. Most of the thickets contained willow(Salix spp.) and sweet gale (Myrica gale), andmany had an understory of horsetail. Here andthere the thickets contained alder (Alnus cris-pa), cottonwood (Populus balsamifera), orspruce. Few of these woody plants stood morethan 2 m high.

1202 Geological Society of America Bulletin, September 2001
ATWATER et al.
Figure 10. Comparison between predicted postearthquake tides and observed postearth-quake bedding. (A) Predicted high tides for the first seven months after the March 27earthquake (U.S. Coast and Geodetic Survey, 1964, p. 130–133). (B and C) Examples ofcycles in couplet thickness from Figures 8C and 7D, respectively. (D and E) Hypotheticalheights of postearthquake tides, derived from predictions in A, for stable and linearlyaggrading land levels (for assumptions, see text section ‘‘Correlation with Specific TidalSeries’’).
The plants showed little vertical zonation,despite their combined vertical range of 1.5 mand a scarcity of shrubs along the seaward halfof the transect (Fig. 11). Sedge dominated thewalls and floors of tidal creeks but also livedon some of the highest ground. Willow bor-dered a small channel but also descended intoa sedge-dominated swale. Most boundariesbetween meadows and thickets were on flatground. In the two places where we measuredit, land level beside living spruce resembledthat of meadows.
New Trees and Shrubs
Among the 73 spruce dated in 1998, theoldest probably originated between 1979 and1984 (Fig. DR2, tree 2; see footnote 1). Thistree, the largest, was 5.8 m tall and 0.22 m inbasal diameter. Most of the other spruce orig-inated in the late 1980s and early 1990s (Fig.3C). Although we found no spruce from laterthan 1994, we surely overlooked seedlings tooshort to stand above surrounding plants.
Although few shrubs lived near Portage Ga-rage in 1973 (A.T. Ovenshine, unpublished
photograph), the area was crowded with themby 1998. Part of the invasion occurred after1991, as shrubs surrounded a truck beside thegarage and took over an area that had beenmarsh in 1991 (Fig. 12). Shrubs may havealso spread in the 1980s along our transect,because several willows cut in 1998 containedat least eight annual rings (Fig. 11).
Old Trees and Buildings
Remains of the pre-earthquake landscapedecayed as the postearthquake landscape ma-tured. Although hundreds of dead trunks ofpreearthquake spruce and cottonwood re-mained standing, dead, in 1998, many of thesesnags had fallen between 1991 and 1998(compare B and C in Fig. 12). Snags stillstanding in 1998 were mostly rotten near thepresent ground level. Sometime between 1991and 1998, Portage Garage collapsed amongthe shrubs that had spread around it (Fig. 12).
Soils
Though we did not study soils on the 1991or l998 landscape, we noticed an A or O ho-
rizon in some areas and its absence in others.Leaf litter formed an O horizon millimetersthick in willow thickets. By contrast, even in1998, seaward parts of meadows commonlylacked surficial accumulation of organicmatter.
Indistinct bedding may mark the beginningsof soil formation on the postearthquake land-scape. Such bedding is present beneath the Aor O horizon of the buried 1964 soil (Walshet al., 1995, p. 38, 65). Similarly, in the high-est parts of postearthquake sections, beddingis indistinct from roots and burrows and fromair voids a few millimeters in diameter. Suchair voids were previously reported from upper-intertidal deposits of Turnagain Arm (Bartsch-Winkler and Ovenshine, 1984, p. 1233). Theymay be explained by trapping of air duringdeposition (Bartsch-Winkler and Ovenshine,1984, p. 1233) or by later decay of organicmaterial from diatoms or microbes (Robert W.Dalrymple, 2000, written commun.).
RESOLVING SHORT INTERVALSBETWEEN GREAT EARTHQUAKES
What is the least time that must elapse be-tween two great (magnitude 8 or larger) earth-quakes for each earthquake to produce its ownrecord of coseismic subsidence in a singlestratigraphic section? This time is probablyshorter near Portage than at the Cascadia sub-duction zone.
Portage
Stratigraphy near Portage can record great-earthquake recurrence intervals as short as adecade. In 1973, when vegetation was return-ing to areas where postearthquake depositionwas nearly complete, the rebuilt landscapenear Portage was already set to record a repeatof the 1964 earthquake (Ovenshine et al.,1976; Ovenshine and Kachadoorian, 1976).Had the repeat earthquake occurred in 1973,its geologic record would not include a wide-spread peaty soil on post-1964 tidal deposits.With good preservation of organic matter,however, the record would include growth-po-sition remains of herbaceous plants and wil-lows that were living on the new land in 1973.Had the repeat earthquake occurred another 25years later, its geologic record would begin aswell with an incipient A or O horizon and thegrowth-position remains of young sprucetrees. Even if these organic materials were de-stroyed by later oxidation, the 1998 land sur-face could be identified by the indistinct bed-ding beneath it.
Great earthquakes inferred from estuarine
Geological Society of America Bulletin, September 2001 1203
ESTUARINE STRATIGRAPHY AS A RECORDER OF SUBDUCTION-ZONE EARTHQUAKES
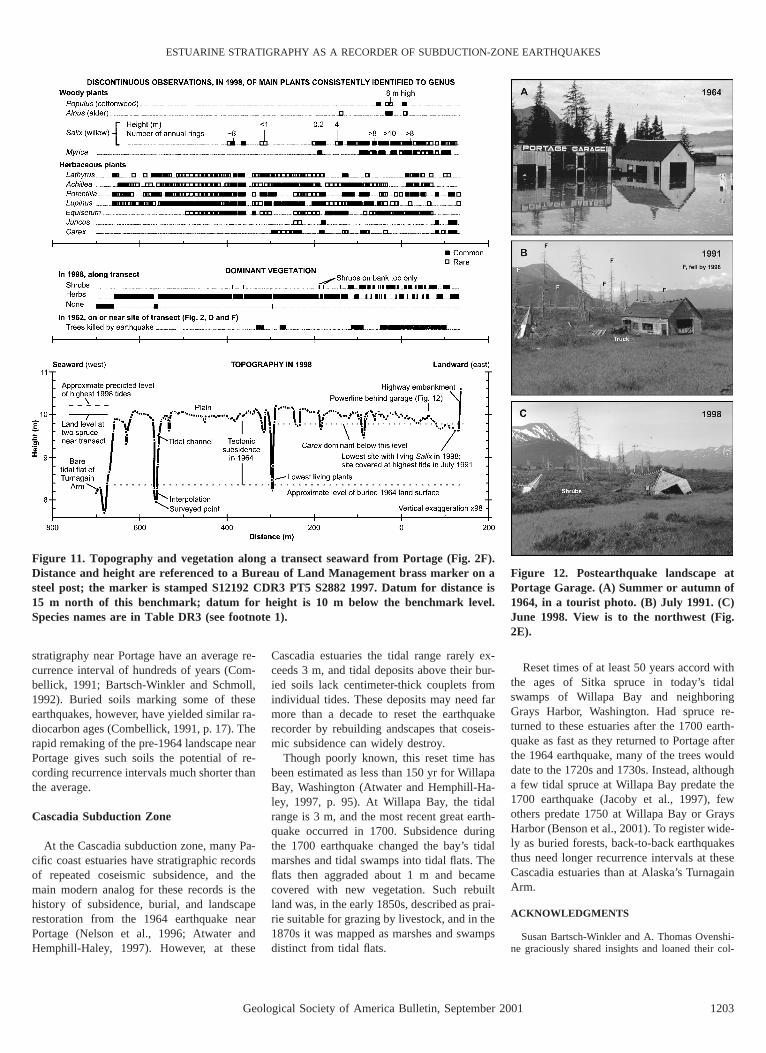
Figure 11. Topography and vegetation along a transect seaward from Portage (Fig. 2F).Distance and height are referenced to a Bureau of Land Management brass marker on asteel post; the marker is stamped S12192 CDR3 PT5 S2882 1997. Datum for distance is15 m north of this benchmark; datum for height is 10 m below the benchmark level.Species names are in Table DR3 (see footnote 1).
Figure 12. Postearthquake landscape atPortage Garage. (A) Summer or autumn of1964, in a tourist photo. (B) July 1991. (C)June 1998. View is to the northwest (Fig.2E).
stratigraphy near Portage have an average re-currence interval of hundreds of years (Com-bellick, 1991; Bartsch-Winkler and Schmoll,1992). Buried soils marking some of theseearthquakes, however, have yielded similar ra-diocarbon ages (Combellick, 1991, p. 17). Therapid remaking of the pre-1964 landscape nearPortage gives such soils the potential of re-cording recurrence intervals much shorter thanthe average.
Cascadia Subduction Zone
At the Cascadia subduction zone, many Pa-cific coast estuaries have stratigraphic recordsof repeated coseismic subsidence, and themain modern analog for these records is thehistory of subsidence, burial, and landscaperestoration from the 1964 earthquake nearPortage (Nelson et al., 1996; Atwater andHemphill-Haley, 1997). However, at these
Cascadia estuaries the tidal range rarely ex-ceeds 3 m, and tidal deposits above their bur-ied soils lack centimeter-thick couplets fromindividual tides. These deposits may need farmore than a decade to reset the earthquakerecorder by rebuilding andscapes that coseis-mic subsidence can widely destroy.
Though poorly known, this reset time hasbeen estimated as less than 150 yr for WillapaBay, Washington (Atwater and Hemphill-Ha-ley, 1997, p. 95). At Willapa Bay, the tidalrange is 3 m, and the most recent great earth-quake occurred in 1700. Subsidence duringthe 1700 earthquake changed the bay’s tidalmarshes and tidal swamps into tidal flats. Theflats then aggraded about 1 m and becamecovered with new vegetation. Such rebuiltland was, in the early 1850s, described as prai-rie suitable for grazing by livestock, and in the1870s it was mapped as marshes and swampsdistinct from tidal flats.
Reset times of at least 50 years accord withthe ages of Sitka spruce in today’s tidalswamps of Willapa Bay and neighboringGrays Harbor, Washington. Had spruce re-turned to these estuaries after the 1700 earth-quake as fast as they returned to Portage afterthe 1964 earthquake, many of the trees woulddate to the 1720s and 1730s. Instead, althougha few tidal spruce at Willapa Bay predate the1700 earthquake (Jacoby et al., 1997), fewothers predate 1750 at Willapa Bay or GraysHarbor (Benson et al., 2001). To register wide-ly as buried forests, back-to-back earthquakesthus need longer recurrence intervals at theseCascadia estuaries than at Alaska’s TurnagainArm.
ACKNOWLEDGMENTS
Susan Bartsch-Winkler and A. Thomas Ovenshi-ne graciously shared insights and loaned their col-

1204 Geological Society of America Bulletin, September 2001
ATWATER et al.
lections of field notes, air photos, and slides of thePortage area. Mark Hemphill-Haley helped withsediment borings in 1991. Roger Lewis made thepeel, and David Young donated a gutter for its col-lection. Robert Dalrymple, Alan Nelson, HarveyKelsey, Sue Cashman, and Roman Modjka providedcritical reviews. Funding sources include the U.S.Geological Survey, the Norwegian Research Coun-cil, the Geological Survey of Japan, and the Uni-versity of Tokyo.
REFERENCES CITED
Atwater, B.F., and Hemphill-Haley, E., 1997, Recurrenceintervals for great earthquakes of the past 3,500 yearsat northeastern Willapa Bay, Washington: U.S. Geo-logical Survey Professional Paper 1576, 108 p.
Bartsch-Winkler, S.R., 1988, Cycle of earthquake-inducedaggradation and related tidal channel shifting, upperTurnagain Arm, Alaska, USA: Sedimentology, v. 35,p. 621–628.
Bartsch-Winkler, S.R., and Garrow, H.C., 1982, Deposi-tional systems approaching maturity at Portage Flats,in Coonrad, W.L., ed., The United States GeologicalSurvey in Alaska: Accomplishments during 1980:U.S. Geological Survey Circular 844, p. 115–117.
Bartsch-Winkler, S.R., and Ovenshine, A.T., 1984, Macro-tidal subarctic environment of Turnagain and KnikArms, upper Cook Inlet, Alaska: Sedimentology of theintertidal zone: Journal of Sedimentary Petrology, v.54, p. 1221–1238.
Bartsch-Winkler, S.R., and Schmoll, H.R., 1992, Utility ofradiocarbon-dated stratigraphy in determining late Ho-locene earthquake recurrence intervals, upper CookInlet region, Alaska: Geological Society of AmericaBulletin, v. 104, p. 684–694.
Benson, B.E., Atwater, B.F., Yamaguchi, D.K., Amidon, L.J.,Brown, S.L., and Lewis, R.C., 2001, Renewal of tidalforests in Washington state after a subduction earth-quake in A.D. 1700: Quaternary Research (in press).
Brown, L.D., Reilinger, R.E., Holdahl, S.R., and Balazs,E.I., 1977, Postseismic crustal uplift near Anchorage,Alaska: Journal of Geophysical Research, v. 82, p.3369–3378.
Combellick, R.A., 1991, Paleoseismicity of the Cook Inlet
region, Alaska: Evidence from peat stratigraphy inTurnagain and Knik Arms: Alaska Division of Geol-ogy and Geophysical Surveys Professional Report112, 52 p.
Dalrymple, R.W., and Makino, Y., 1989, Description andgenesis of tidal bedding in the Cobequid Bay–SalmonRiver estuary, Bay of Fundy, Canada, in Taira, A., andMasuda, F., eds., Sedimentary facies in the active platemargin: Tokyo, Terra Scientific, p. 151–177.
Dalrymple, R.W., Makino, Y., and Zaitlin, B.A., 1991,Temporal and spatial patterns of rhythmite depositionon mud flats in the macrotidal Cobequid Bay–SalmonRiver estuary, Bay of Fundy, Canada, in Smith, D.G.,et al., eds., Clastic tidal sedimentology: Canadian So-ciety of Petroleum Geologists Memoir 16, p. 137–160.
Hulten, E., 1941–1946, Flora of Alaska and Yukon, parts1–10: Lund Universitets Arsskrift, Acta UniversistatisLundensis, Nova series, v. 37–46 [in Swedish;abridged, amended, translated, and published in 1968as Flora of Alaska and neighboring territories, a man-ual of the vascular plants: Stanford, Stanford Univer-sity Press, 1008 p.]
Jacoby, G.C., Bunker, D.E., and Benson, B.E., 1997, Tree-ring evidence for an A.D. 1700 Cascadia earthquakein Washington and northern Oregon: Geology, v. 25,p. 999–1002.
Kanamori, H., 1977, The energy release in great earth-quakes: Journal of Geophysical Research, v. 82, p.2981–2987.
Kvale, E.P., Johnson, H.W., Sonett, C.P., Archer, A.W., andZawistoski, A., 1999, Calculating lunar retreat ratesusing tidal rhythmites: Journal of Sedimentary Re-search, v. 69, p. 1154–1168.
McCalpin, J.P., and Nelson, A.R., 1996, Introduction of pa-leoseismology, in McCalpin, J.P., ed., Paleoseismolo-gy (International Geophysics Series, Volume 62): NewYork, Academic Press, p. 1–32.
McCulloch, D.S., and Bonilla, M.G., 1970, Effects of theearthquake of March 27, 1964, on the Alaska Rail-road: U.S. Geological Survey Professional Paper 545-D, 161 p.
National Ocean Service, 1997, Tide tables 1998, high andlow water predictions, west coast of North and SouthAmerica including Hawaiian Islands: Marina Del Rey,California, Lighthouse Press, 254 p.
Nelson, A.R., Shennan, I., and Long, A.J., 1996, Identify-ing coseismic subsidence in tidal-wetland stratigraphic
sequences at the Cascadia subduction zone of westernNorth America: Journal of Geophysical Research, v.101, p. 6115–6135.
Ovenshine, A.T., and Kachadoorian, R., 1976, Estimate ofthe time required for natural restoration of the effectsof the 1964 earthquake at Portage, in Cobb, E.H., ed.,The United States Geological Survey in Alaska: Ac-complishments during 1975: U.S. Geological SurveyCircular 733, p. 53–54.
Ovenshine, A.T., Lawson, D.E., and Bartsch-Winkler, S.R.,1976, The Placer River silt—An intertidal depositcaused by the 1964 Alaska earthquake: U.S. Geolog-ical Survey Journal of Research, v. 4, p. 151–162.
Plafker, G., 1969, Tectonics of the March 27, 1964 Alaskaearthquake: U.S. Geological Survey Professional Pa-per 543-I, 74 p.
Plafker, G., Kachadoorian, R., Eckel, E.B., and Mayo, L.R.,1969, Effects of the earthquake of March 27, 1964 onvarious communities: U.S. Geological Survey Profes-sional Paper 542-G, 50 p.
Savage, J.C., and Plafker, G., 1991, Tide gage measure-ments of uplift along the south coast of Alaska: Jour-nal of Geophysical Research, v. 96, p. 4325–4335.
Stokes, M.A., and Smiley, T.L., 1996, An introduction totree-ring dating: Tucson, University of Arizona Press,73 p. [originally published 1968 by University of Chi-cago Press]
Tessier, B., 1993, Upper intertidal rhythmites in the Mont-Saint-Michel Bay (NW France); perspectives for re-construction: Marine Geology, v. 110, p. 355–367.
U.S. Coast and Geodetic Survey, 1964, Tide tables, highand low water predictions, west coast of North andSouth America, including the Hawaiian Islands:Washington, D.C., U.S. Department of Commerce,386 p.
Walsh, T.J., Combellick, R.A., and Black, G.L., 1995, Liq-uefaction features from a subduction zone earthquake:Preserved examples from the 1964 Alaska earthquake:Washington Division of Geology and Earth Resources,Report of Investigations 32, 80 p.
Zar, J.H., 1996, Biostatistical analysis (3rd edition): UpperSaddle River, New Jersey, Prentice-Hall, 662 p.
MANUSCRIPT RECEIVED BY THE SOCIETY MAY 2, 2000REVISED MANUSCRIPT RECEIVED NOVEMBER 27, 2000MANUSCRIPT ACCEPTED DECEMBER 22, 2000
Printed in the USA