Randomness Analyzing Signals @BULLET June 2014 @BULLET Masters in Engineering -Industrial Automation...
10
Randomness Analyzing Signals • June 2014 • Masters in Engineering - Industrial Automation Heartbeat classification scheme based on the principle of information relevant PRI to the detection of arrhythmias in ECG recordings D.F Collazos-Huertas * Universidad Nacional de Colombia Sede Manizales [email protected] Abstract This study proposes a classification system based on information measures arrhythmias, using the relevant principle of entropy (PRI) in order to detect pathological structures present in the data and supporting specialists for diagnostic tasks through the implementation of an automatic processing and analysis of electrocardiogram (ECG) records, through a graphical interface developed in Matlab R . The results correspond to the classification of six types of arrhythmias, type N (normal beat), L (left bundle branch block beat), V (ventricular premature contraction), A (atrial premature beat), E (ventricular escape beat) and P (paced beat) that are found in the base records data from MIT-BIH, thus obtaining an average of sensitivity of 98.82 %, specificity of 98.525% and Accuracy of 98,445%, showing that the proposed scheme outperforms classification methods of the art state.In unsupervised classification tasks the PRI was found to be more robust in terms of sensitivity to initialization and accuracy in detection of clusters compared to the clustering algorithm K-means. I. Introduction Over recent years in today’s society, cardiovas- cular disease has been one of the leading causes of death per year, according to studies by the World Health Organization (WHO) and Cen- ter for Disease Control and Prevention (CDC). At the same time, the early prevention and risk reduction are considered as the most effec- tive form of treatment. The electrocardiogram (ECG) of the electrocardiogram may reflect bio- electric activity of the myocardium. Therefore, it is important to the analysis of ECG signals (representing and classifying) with the purpose of preventing cardiovascular diseases such as arrhythmias, heart failure, heart attacks among others. Advances in computing technologies and information processing have allowed car- rying the analysis of these signals to another level by allowing developing software to help the work of the specialist in the detection of diseases by reducing the time significantly of diagnosis. Many studies have been done recently in or- der to support the classification task analysis of representative beats this problem has been ad- dressed by researchers in many disciplines and in different contexts, proving its importance when offering a diagnosis. For example in [1] is presented an evaluation of different meth- ods, spectral and partition clustering applied to ECG signals representative patterns, extracted from Holter records that have a variety of car- diac arrhythmias, in order to determine those having a good compromise between efficiency and time of processing in homogeneous group- ing beats. However for evaluation of clustering were not taken sets of balanced samples, but rather complete records (records selected for this study) were analyzed. In addition based upon different methodologies initialization are getting results with good performance only for some types of arrhythmias. In some research, the original pre-processed signal are used as appropriate characteristics accompanied by the use of artificial neural net or fuzzy classifiers [2], parametric and probabilistic classifiers [3], the goals of discrimination are followed. Al- * Signal Processing and Recognition Group Unal Manizales 1
-
Upload
independent -
Category
Documents
-
view
3 -
download
0
Transcript of Randomness Analyzing Signals @BULLET June 2014 @BULLET Masters in Engineering -Industrial Automation...
Randomness Analyzing Signals • June 2014 • Masters in Engineering - Industrial Automation
Heartbeat classification scheme based on the principle ofinformation relevant PRI to the detection of arrhythmias in
ECG recordings
D.F Collazos-Huertas∗
Universidad Nacional de Colombia Sede [email protected]
Abstract
This study proposes a classification system based on information measures arrhythmias, using the relevantprinciple of entropy (PRI) in order to detect pathological structures present in the data and supportingspecialists for diagnostic tasks through the implementation of an automatic processing and analysis ofelectrocardiogram (ECG) records, through a graphical interface developed in Matlab R©. The resultscorrespond to the classification of six types of arrhythmias, type N (normal beat), L (left bundle branchblock beat), V (ventricular premature contraction), A (atrial premature beat), E (ventricular escape beat)and P (paced beat) that are found in the base records data from MIT-BIH, thus obtaining an averageof sensitivity of 98.82 %, specificity of 98.525% and Accuracy of 98,445%, showing that the proposedscheme outperforms classification methods of the art state.In unsupervised classification tasks the PRIwas found to be more robust in terms of sensitivity to initialization and accuracy in detection of clusterscompared to the clustering algorithm K-means.
I. Introduction
Over recent years in today’s society, cardiovas-cular disease has been one of the leading causesof death per year, according to studies by theWorld Health Organization (WHO) and Cen-ter for Disease Control and Prevention (CDC).At the same time, the early prevention andrisk reduction are considered as the most effec-tive form of treatment. The electrocardiogram(ECG) of the electrocardiogram may reflect bio-electric activity of the myocardium. Therefore,it is important to the analysis of ECG signals(representing and classifying) with the purposeof preventing cardiovascular diseases such asarrhythmias, heart failure, heart attacks amongothers. Advances in computing technologiesand information processing have allowed car-rying the analysis of these signals to anotherlevel by allowing developing software to helpthe work of the specialist in the detection ofdiseases by reducing the time significantly ofdiagnosis.
Many studies have been done recently in or-
der to support the classification task analysis ofrepresentative beats this problem has been ad-dressed by researchers in many disciplines andin different contexts, proving its importancewhen offering a diagnosis. For example in [1]is presented an evaluation of different meth-ods, spectral and partition clustering applied toECG signals representative patterns, extractedfrom Holter records that have a variety of car-diac arrhythmias, in order to determine thosehaving a good compromise between efficiencyand time of processing in homogeneous group-ing beats. However for evaluation of clusteringwere not taken sets of balanced samples, butrather complete records (records selected forthis study) were analyzed. In addition basedupon different methodologies initialization aregetting results with good performance only forsome types of arrhythmias. In some research,the original pre-processed signal are used asappropriate characteristics accompanied by theuse of artificial neural net or fuzzy classifiers[2], parametric and probabilistic classifiers [3],the goals of discrimination are followed. Al-
∗Signal Processing and Recognition Group Unal Manizales
1
Randomness Analyzing Signals • June 2014 • Masters in Engineering - Industrial Automation
though in such classification approaches, ac-ceptable results can be achieved, however, be-cause of the application of the original sam-ples as components of the characteristics vector,computational cost and charge, especially athigh sampling frequencies will be very highand the algorithm can take a long time to train-ing for a given database.
This study proposes to develop a clas-sification schema arrhythmic heartbeat, tocarry out tasks of clustering based in informa-tion measures using the Principle of Informa-tion(entropy) Relevant PRI to the discovery ofcardiac pathologies present in records such asto permit to perform a task more reliable andaccurate diagnosis. Subsequently implementan analysis system and classification, usingsoftware tools that allow automatically sup-port specialists in discovering cardiopathies inECG recordings in real time.
II. Problem Statement
Currently one of the biggest problems in ambu-latory diagnostic evaluation of heart anomaliesis the massive number of data from recordsECG, which causes the visual inspection andmanual annotation to be a laborious job forspecialists. Due to this problem have beendeveloped support tools to diagnosis and pre-diction based on techniques of digital signalprocessing and pattern recognition (softwareand body area networks). Mainly, the generalidea of diagnostic assistance is decreasing theamount of beats you should check the special-ist, so that instead of reviewing all beats onlyneed to review the representative beats in eachgroup (type beat) obtained by the system anal-ysis and, finally, to suggest a type of associatedpathology.
III. State of the Art
The classification task (normal and abnormal)beats has been an object of great interest inrecent years, to the point that you can find vari-ety of methodologies and schemes to carry outan outstanding performance in the detection
of arrhythmias and the prediction of cardiacabnormalities. The studies focus on two typesof classification, supervised and unsupervised.
In general, supervised classification meth-ods are divided into statistical methods, syn-tactic and artificial intelligence. Found imple-menting classifiers based in fuzzy logic, whichmodel the nonlinear dynamic of electrocardio-gram signals (ECG) for the characterization ofarrhythmia [4]. However, this methodologyis often difficult to implement in real time be-cause of the high number of parameters andrules that must be tuned. In [5][6], a new clus-tering method based ECG beat on kernelizedfuzzy c-means and Hybrid Ant Colony Opti-mization for continuous domains is proposed.HACO optimizes both the kernel function pa-rameter (here σ values) and cluster centers,that in turn minimizes the objective functionof the KFCM traditional algorithm. This kindof optimization requires initialization to findthe optimal clusters which makes the modelis little generalizable. Moreover, in [7] classi-fication algorithms fuzzy models (FCM) areimplemented in conjunction with subtractiveclustering techniques, with adequate robust-ness against noise, artifacts and arrhythmicoutliers.
The Support Vector Machines (SVM) is an-other commonly used method for classifyingheartbeat [8]. Use different types of characteri-zation, as morphological descriptors and vari-ety of Kernel methods (polynomial, Gaussian)and higher order statistics measures, obtaininggood results in terms of performance and ac-curacy. The tuning of the parameters of theSVM and the Kernel makes the computationalcost increases on the model. In many studies,classification schemes beats are raised, using ar-tificial neural networks [9][10]. The best knownare the multilayer perceptron, self-organizingKohonen networks, probabilistic neural net-works, fuzzy or neuro-fuzzy systems and thecombination of different neural networks inhybrid systems. In these models, an importantadvantage is that by selecting the optimal net-work topology, learning rule, the number of
2
Randomness Analyzing Signals • June 2014 • Masters in Engineering - Industrial Automation
iterations for training and the learning rate canbe obtained a significant improvement in accu-racy. The study in [11], a classification methodbased on similarity functions obtained by repre-senting the similarity of the waveform and reg-istry RR interval is presented. The method usesa single approach and runs with low process-ing cost in comparison with neural networkswith those using fuzzy logic. In [12] combineddecision trees are used for feature extractiontechniques such as wavelet transform, forminga reliable classification scheme that describesthe ECG waveform and the QRS complex.
The work done in [13] proposes a combina-tion of linear discriminant classifier (LDC) anda clustering algorithm based on ExpectationMaximization (EM). The main limitation of theLDC is the inability to handle large rhythmsand variations in morphology between patients.The EMC approach is used to handle this dif-ficulty and is based on a clustering algorithm,responsible for keeping most of the specificcharacteristics of the patient’s heartbeat.
The most usual technique for unsupervisedanalysis of beats in ECG signal is the art un-supervised clustering, which involves the clas-sification of patterns through the formationof groups of similar patterns. The clusteringproblem has been addressed by researchersin many disciplines and in different contexts,proving their versatility, practicality and effi-ciency in exploratory data analysis. In studiesof classification with unsupervised approachare designed to optimize clustering method-ologies basic jobs. An optimization model ofK-means clustering using genetic algorithmsis presented in [14]. The algorithm uses prin-ciples borrowed from natural genetic. In con-trast to conventional search algorithms andoptimization, GA begins its search for a ran-dom set of solutions. In the context of GA, themetric used to represent the distance is calledthe objective function, which gives relative im-portance for each population. Is demonstratethat the scheme has very similar performanceto supervised classifiers approach. Methods ofAnalysis of simple cluster, fast and reliable forECG signal analysis is easily carried out and do
not require complex mathematical calculations(such as cross-correlation and Fourier trans-form) [15]. The disadvantage of this system isthat even though decreasing the computationalcost of the process, the accuracy and perfor-mance of the classifier is also compromised.
IV. Objetives
• Develop a classification scheme beats ac-quired of ECG signals, based on the prin-ciple of relevant information (PRI), inorder to detect pathological structures(arrhythmias) present in the data, andthat will support specialists in diagnos-tic tasks. The classifier performance isquantified by measuring the sensitivity,specificity and accuracy of the systemto beat previously labeled (supervisedclassification), while non-tagged beatsThe Calinski-Harabasz criterion (unsu-pervised classification) is used.
• Implement an automatic processingand analysis of electrocardiogram ECGrecords including pre-processing steps,representation and signal classification,through a graphical user interface soft-ware developed in Matlab R©, to supportthe work of the specialist diagnostic tasksin real time and more graphic. The per-formance measurement system is givenby the Variance Ratio Criterion whichmeasures the performance of clustering.
V. Principle of Information
Relevant PRI
In unsupervised learning, referring mainly tothe preservation of information and how ithelps us to discover the structures present rel-evant data, taking into account the feedbackloop of information necessary for the acquisi-tion of knowledge (a priori information). How-ever, the estimate of the theoretical amountsof information from data is a difficult problemthat leads to simplifications and assumptionsthat may lead to bad results or insignificant
3
Randomness Analyzing Signals • June 2014 • Masters in Engineering - Industrial Automation
improvements. It is then necessary compactlymodel data in a way that the relation is exposedand data structure by introducing a distortionmeasure, allowing find a variety of structuressubject to the magnitude of the distortion.
The structure in a data set may be associ-ated to statistical regularities on the results of aprocess. Because these regularities or patternsare subsets of the given data, the entropy issmaller than the entire set of samples. There-fore, the entropy on these results can be at-tributed in part to the underlying structure,and the rest to the particularities of each result,ie the details or even random perturbations.Therefore, we can think of the minimization ofentropy as a means of finding such regularities[16].
Consider a dataset S ∈ Rd with samplepopulation {s1, s2, ..., sM}. This original datasetis static and kept constant throughout theprocess. Let us now create a new datasetX = {x1, x2, ..., xN} such that X = S initially.Starting with this initialization, we would liketo evolve the samples of X so as to capture rele-vant structures of S. We formulate this problemas minimizing a weighted combination of theRenyit’s entropy of X namely H(X) and theCauchy Schwartz divergence measure betweenthe probability densities (pdfs) of X and S asshow below.
J(X) = minX
H(X) + βDcs(pX‖pS) (1)
where β ∈ [0, ∞). The first quantity H(X)can be seen as a redundancy reduction termand second quantity Dcs(pX‖pS), as an infor-mation preservation term. At the first iteration,Dcs(pX‖pS) = 0 due to the initialization X = S.This would reduce the entropy of X irrespec-tive of the value of β selected, thus makingDcs(pX‖pS) positive. This is a key factor inpreventing X from diverging. From the seconditeration onwards, depending on the β valuechosen, one would iteratively move the sam-ples of X to capture different regularities in S[17].
Let us simplify the cost function. To avoidworking with fractional values, we use a more
convenient definition of Cauchy Schwartz di-vergence given by
Dcs(pX‖pS) = − log(∫
px(u)ps(u)du)2
(∫
p2X(u)du)(
∫p2
S(u)du)(2)
= 2H(X; S)− H(X)− H(S) (3)
We could also see this change as absorb-ing a scaling constant (a value of 1/2) in theweighting factor β. In any case, this is not go-ing to alter any results. Having done this, thecost function now looks like
J(X) = minX
H(X) + β[2H(X; S)− H(X)− H(S)] (4)
= minX
(1− β)H(X) + 2βH(X; S) (5)
We have dropped the extra term H(S) sincethis constant with respect to X. The effect ofthe weighted cost function of the parameter βis analyzed. Case 1 β = 0, case 2 β = 1 andCase 3 β = ∞. In this case, as what is intendedis to fulfill a task of clustering, the weightingeffect in case 2 is investigated. For β = 1, thecost function directly minimizes Renyi crossentropy between X and the original dataset S.Again, using the monotonous property of thelog, the cost function can be rewritten as
J(X) = minX
H(X; S) (6)
= maxX
V(X; S) (7)
= maxX
1NM
N
∑k=1
M
∑j=1
Gσ(xk − sj) (8)
Where V(·) is the potential informationassociated with variables, and G(·) corre-sponds to a Gaussian kernel function. Onecould obtain the following fixed point updaterule by differentiating J(X) with respect toxk={1,2,,N} ∈ X and equivating it to zero.
xτ+1k =
∑Mj=1 Gσ(xτ
k − sj)sj
∑Mj=1 Gσ(xτ
k − sj)(9)
4

Randomness Analyzing Signals • June 2014 • Masters in Engineering - Industrial Automation
ECG Signal
PreprocesingExtraction and segmentation
of beats
Feature extractionTW+CH+KPCA
ClassificationPRI Kernel
Clusters
Figure 1: General scheme proposed
VI. Experiments and Results
I. Experiment 1: supervised classification
In figure 1 the general layout of the systemin which the processing steps described signalis presented. In this experiment, the databaseused is arrhythmia database MIT BIH thathas records with different types of arrhythmia(A, L, R, V, etc.). The signals were acquiredthrough two channels (1 and 2), with a sam-pling frequency of 360 Hz, 11 bits of resolutionand range 10mV. This database has 48 recordsobtained from different leads. These recordsare labeled with several useful annotations foranalysis and classification. In total were ana-lyzed and classified 7100 beating of 6 types ofarrhythmias, N (normal beat), L (left bundlebranch block beat), V (ventricular prematurecontraction), A (atrial premature beat), E (ven-tricular escape beat) P (paced beat), 1400 beatsper class (N, L, V, A, P) and 100 beats for ClassE.
First signal (ECG record) and baseline am-plitude is normalized, then the signal is pro-cessed by a NOTCH filter to remove 50Hzcomponent. The filter order was chosen bytrial and error, starting with a low order of 64and up to an order of 1536 where the 50 Hzcomponent in the FFT spectrum is sufficientlyreduced (attenuated to 122.9 times). To elimi-nate the DC component and variations of thebaseline, a high pass filter is implemented. Acutoff frequency of 1 Hz and by 2000 was cho-sen, obtaining an attenuation of 271.88 timesthe DC component. The procedure is similar
to that described for the notch filter.
For segmentation stage the beats of eachrecord are extracted from the database MIT/ BIH data with a fixed window size (usingthe entries in the records) and size of dynamicwindows "sliding windows" whose boundariesare chosen by the user (using automatic anno-tations by detection algorithm for QRS com-plex Pam Tompkins, 1985 and peaks R), com-bined with adaptive threshold techniques. Thedefault criterion is used .25.75 in distance be-tween the previous peak R and peak near Rrespectively the current peak. The QRS com-plexes are segmented using a fixed as it hasworked in the art window. Window Length:200ms centered at the peak R. The result is ob-tained each QRS segmented the types of beatsin the totality of the records of the MIT-BIHdatabase.
The estimate of the characteristics for eachQRS complex segmented above is carried outbased on morphological descriptors calculatedfrom the decomposition Wavelet db2 (TWwhich increases the complexity of Haar) com-plex [18]. A matrix of features comprising thefollowing measures were obtained: the vari-ance of each sublevel decomposition (QRS vari-ance), the min max of the complex reason,the first 5 components of the Fourier spectrum(spectrum from 120Hz) characteristics of RR in-terval range (distance between current peak Rand previous peak R) and Hermite coefficients(Bases Hermite with sigma = 0.05 (50msec) and250 ms in length for each base. We utilize thecombination of principal component analysis
5
Randomness Analyzing Signals • June 2014 • Masters in Engineering - Industrial Automation
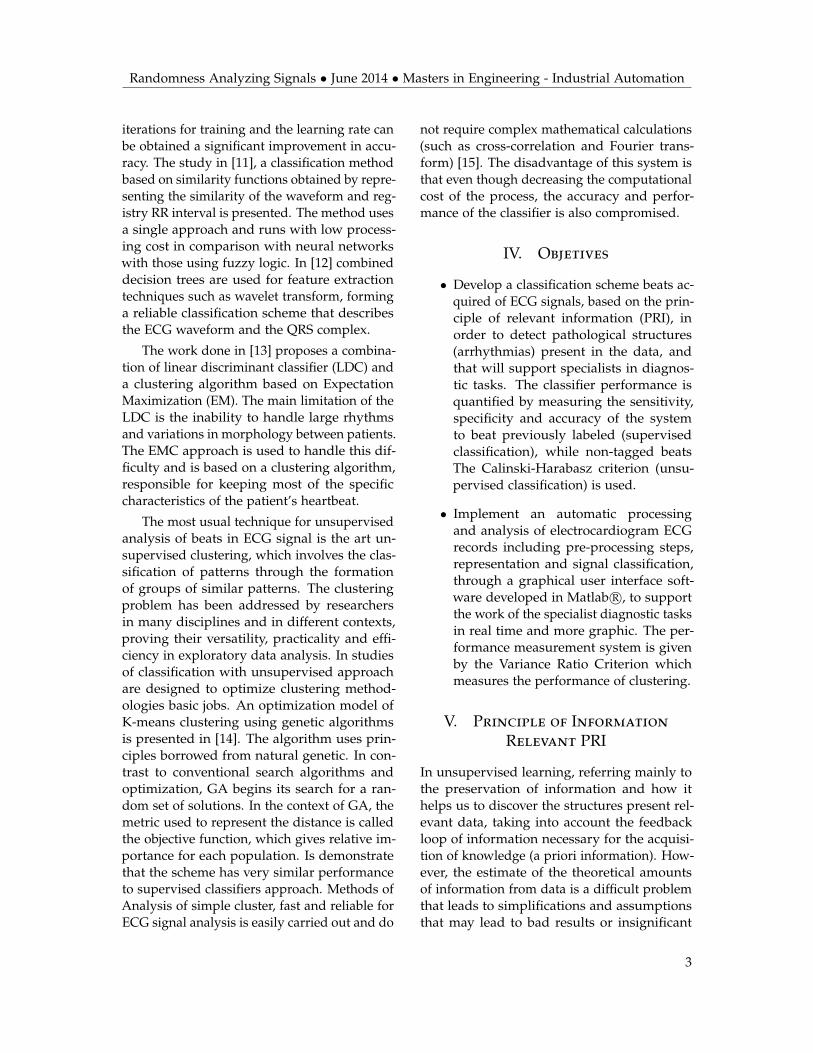
Cost Function Types Arrithmias
N L V A E P MeansSe % 99.17 98.72 99.01 98.34 98.52 99.56 98.882Sp % 98.89 99.65 97.08 98.25 98.02 99.26 98.525
Accuracy % 98.26 98.70 98.01 98.11 98.26 99.33 98.445
Table 1: Results of experiment 1 for ECG registration database MIT-BIH
(PCA) based on Gaussian Kernel (KPCA) toremove the first features relativity and searchthis features independence as the new features.
The classification scheme developed (seesection V) uses the matrix representation todiscover the structure present in the data usingthe location of "clusters" in the representativesample dispersion properly balanced. In eachiteration the algorithm (rule fixed point update)updates the value of the samples xk subject tochange threshold governed by the difference inthe value of the cost function 5, to converge andfind the centroids as the number of structurespresent. The model parameter β is tuned to 1because the task of clustering, the sigma σ istuned as the median of the data σx = medianxk.After the location of the centroids carries outa post-process of labeling the sample with re-spect to the cluster, using the fundamental ba-sis of K-means clustering with a fixed centroidinitialization given by the result of Kernel PRImethod. 700 beats for modeling clusters and700 for model evaluation were used, except fortype E beats that only have 106 samples.
The accuracy of the resulting heartbeat clus-tering was assessed in terms of sensitivity (Se),specificity (Sp), and clustering performance(CP), defined as:
• Sensitivity. Ratio of correctly not in-cluded heartbeats in a cluster. Se =
TPTP+FN
• Specificity. Ratio of correctly includedheartbeat in a cluster. Sp = TN
TN+FP
• Clustering performance. Ratio of cor-rectly grouped heartbeats.Acc = TP+TN
n
Where TN and TP are the true negatives and
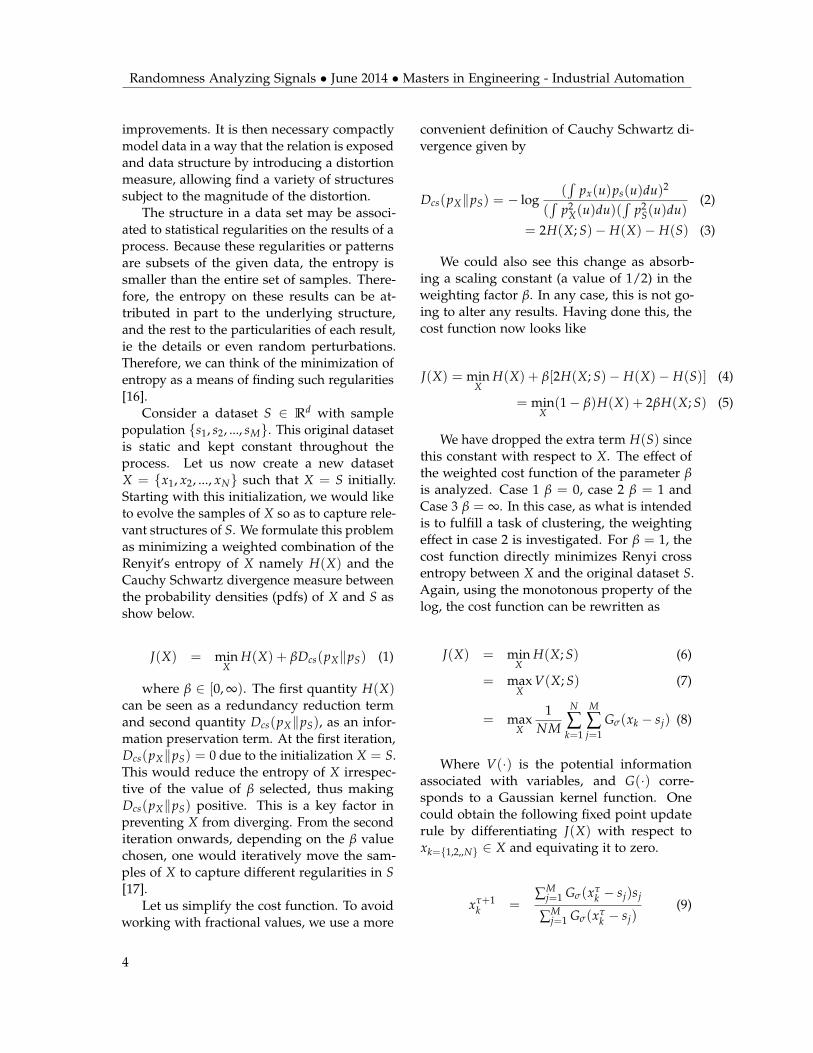
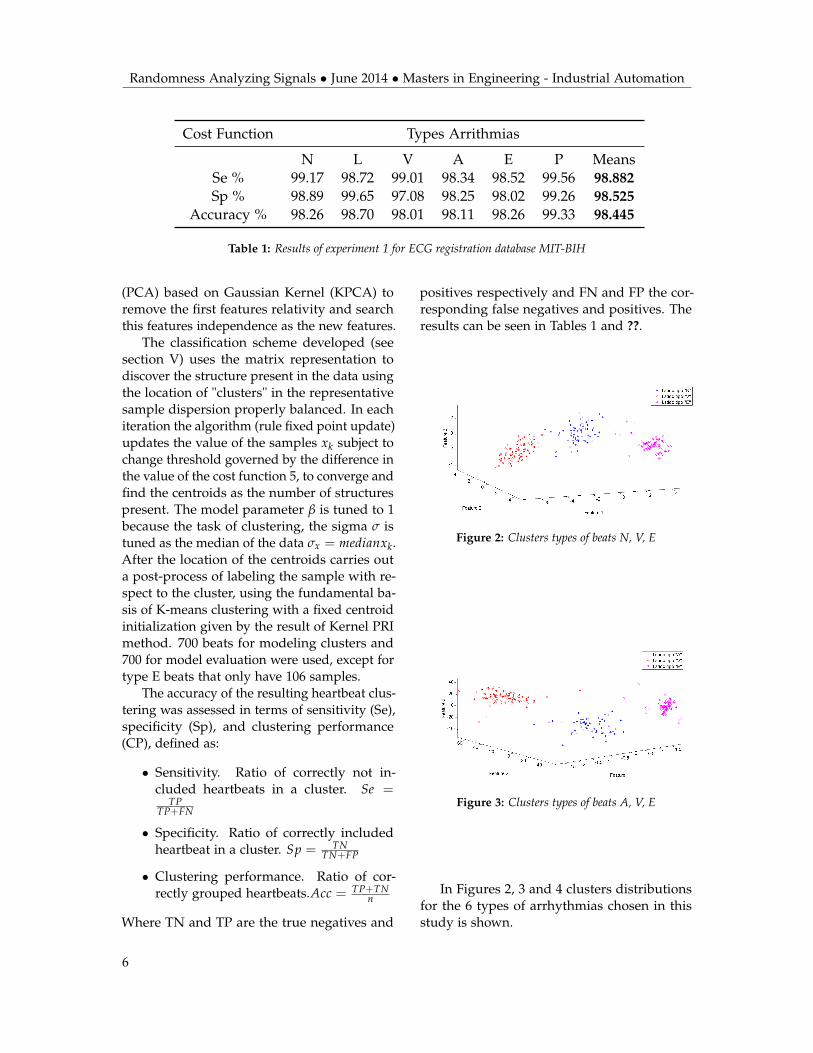
positives respectively and FN and FP the cor-responding false negatives and positives. Theresults can be seen in Tables 1 and ??.
Figure 2: Clusters types of beats N, V, E
Figure 3: Clusters types of beats A, V, E
In Figures 2, 3 and 4 clusters distributionsfor the 6 types of arrhythmias chosen in thisstudy is shown.
6

Randomness Analyzing Signals • June 2014 • Masters in Engineering - Industrial Automation
Accuracy %
Autor Classifier N L V A E P[5] Fuzzy Classifiers N/A 92.85 93.85 90.00 N/A N/A[9] Decission Trees 97.44 94.52 91.62 83.33 N/A 98.63
[11] Neruonal Networks 95.41 98.65 96.88 97.90 99.84 99.12[13] Fuzzy Classifiers + HACO 97.93 N/A 97.32 97.84 N/A N/A[14] ACO-based Clustering 95.49 N/A 93.35 86.78 N/A N/A
This Study PRI - Kernel 98.26 98.70 98.01 98.11 98.26 99.33
Table 2: Comparison study of the proposed approach with the state of the art in terms of accuracy
Figure 4: Clusters types of beats L, V, P
II. Experiment 2: unsupervised classifica-tion
To perform this experiment methodology isused unsupervised classification, which aimsto implement the proposed scheme in cluster-ing tasks. The database used is The PTB Di-agnostic ECG Database available online. Thedatabase contains 549 records from 290 sub-jects (aged 17 to 87, mean 57.2, 209 men, meanage 55.5, and 81 women, mean age 61.6, agesWere Not Recorded for 1 female and 14 malesubjects).Each subject is represented by one tofive records. In addition the database MITDBarrhythmia, used in experiment 1 was used. Atotal of 10 records are used, 5 of each database.
Filtering, segmentation and classification ofeach of the ECG samples were performed ac-cording to the scheme described in experiment1 of the section using a method for represen-tation and feature extraction based on KernelPCA (KPCA). The classification scheme usedemployed, is proposed in this paper focusedon the recognition of implicit structures in thedata and information preservation (PRI Ker-
nel). The tuning of the parameters σ and βwas conducted in the same manner as in exper-iment 1 The cost function used is the VarianceRatio Criterion The Calinski-Harabasz or crite-rion, which is defined as:
VRC =SSBSSW
∗ n− kk− 1
(10)
The overall between-cluster variance SSB isdefined as
SSB =k
∑i=1
ni‖mi −m‖2 (11)
The overall within-cluster variance SSW isdefined as
SSB =k
∑i=1
ci
∑x∈ci
‖x−mi‖2 (12)
The larger the VRC ratio, the better the datapartition. To determine the optimal number ofclusters, maximize VRC with respect to k. Theoptimal number of clusters is the solution withthe highest Calinski-Harabasz index value.
As can be observed in Table ?? an eval-uation of proposed versus K-means whichis widely used in tasks performed clusteringscheme. Getting better performance, the Ker-nel PRI methodology proves to be a more accu-rate detection of the optimal number of clustersand a better performance in relation to existingdataset in clusters.
7
Randomness Analyzing Signals • June 2014 • Masters in Engineering - Industrial Automation
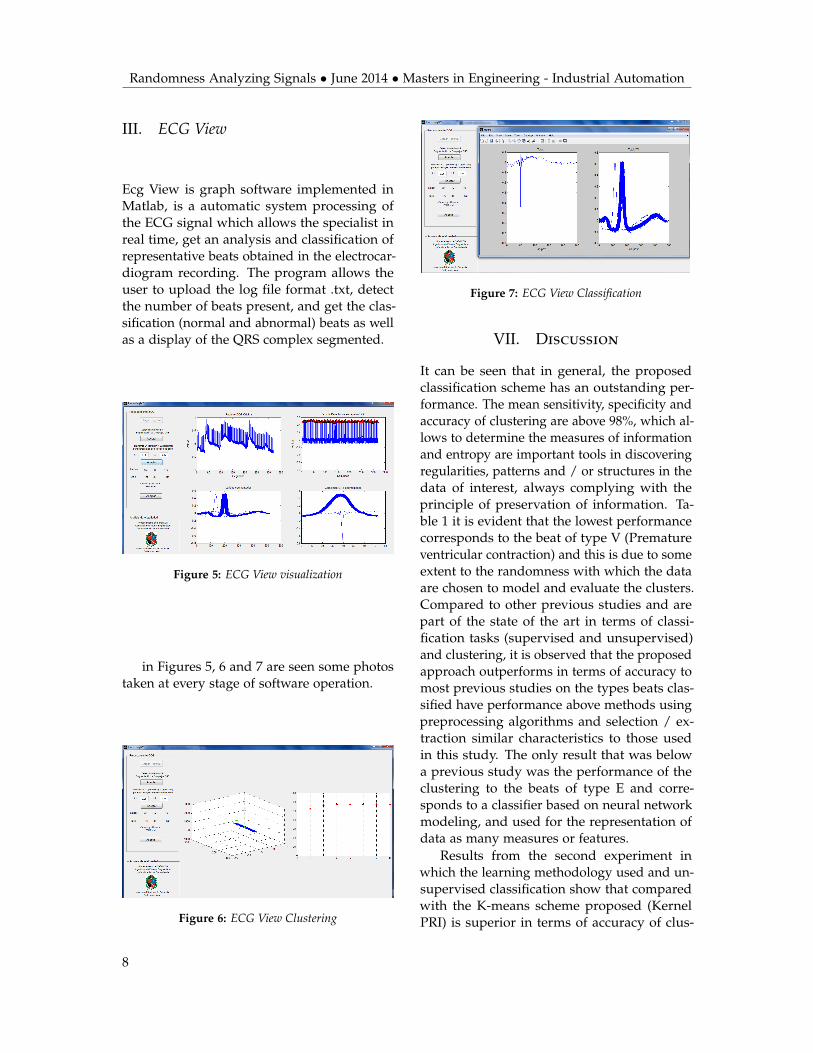
III. ECG View
Ecg View is graph software implemented inMatlab, is a automatic system processing ofthe ECG signal which allows the specialist inreal time, get an analysis and classification ofrepresentative beats obtained in the electrocar-diogram recording. The program allows theuser to upload the log file format .txt, detectthe number of beats present, and get the clas-sification (normal and abnormal) beats as wellas a display of the QRS complex segmented.
Figure 5: ECG View visualization
in Figures 5, 6 and 7 are seen some photostaken at every stage of software operation.
Figure 6: ECG View Clustering
Figure 7: ECG View Classification
VII. Discussion
It can be seen that in general, the proposedclassification scheme has an outstanding per-formance. The mean sensitivity, specificity andaccuracy of clustering are above 98%, which al-lows to determine the measures of informationand entropy are important tools in discoveringregularities, patterns and / or structures in thedata of interest, always complying with theprinciple of preservation of information. Ta-ble 1 it is evident that the lowest performancecorresponds to the beat of type V (Prematureventricular contraction) and this is due to someextent to the randomness with which the dataare chosen to model and evaluate the clusters.Compared to other previous studies and arepart of the state of the art in terms of classi-fication tasks (supervised and unsupervised)and clustering, it is observed that the proposedapproach outperforms in terms of accuracy tomost previous studies on the types beats clas-sified have performance above methods usingpreprocessing algorithms and selection / ex-traction similar characteristics to those usedin this study. The only result that was belowa previous study was the performance of theclustering to the beats of type E and corre-sponds to a classifier based on neural networkmodeling, and used for the representation ofdata as many measures or features.
Results from the second experiment inwhich the learning methodology used and un-supervised classification show that comparedwith the K-means scheme proposed (KernelPRI) is superior in terms of accuracy of clus-
8
Randomness Analyzing Signals • June 2014 • Masters in Engineering - Industrial Automation
VRC
Dataset Register Clusters K-Means PRI Kernel210 2 88,0177 122,194133 2 111,8115 120,8115
PTBDB 370 3 124,8615 132,8936141 3 131,6061 134,6099548 5 72,3615 76,5722
1 2 423,6309 482,18866 2 282,943 367,8059
MITDB 8 2 2324,8 2541,29 3 949,9836 1115,930 3 1365,8 1380,5
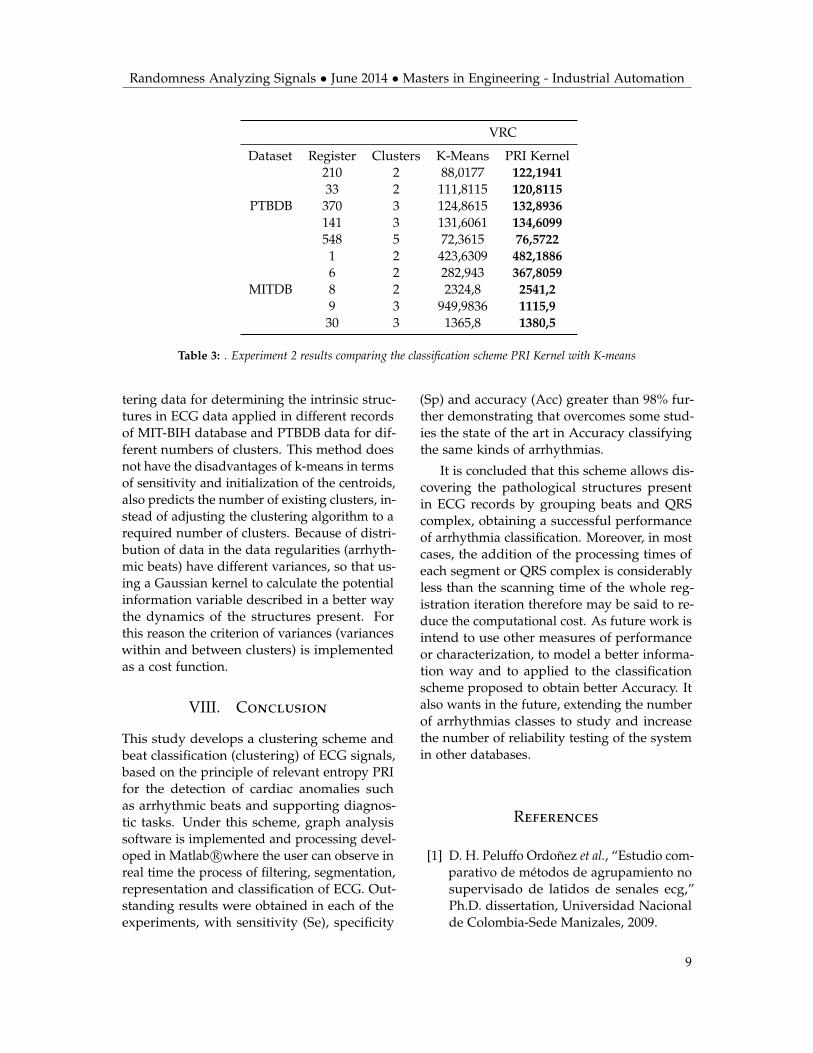
Table 3: . Experiment 2 results comparing the classification scheme PRI Kernel with K-means
tering data for determining the intrinsic struc-tures in ECG data applied in different recordsof MIT-BIH database and PTBDB data for dif-ferent numbers of clusters. This method doesnot have the disadvantages of k-means in termsof sensitivity and initialization of the centroids,also predicts the number of existing clusters, in-stead of adjusting the clustering algorithm to arequired number of clusters. Because of distri-bution of data in the data regularities (arrhyth-mic beats) have different variances, so that us-ing a Gaussian kernel to calculate the potentialinformation variable described in a better waythe dynamics of the structures present. Forthis reason the criterion of variances (varianceswithin and between clusters) is implementedas a cost function.
VIII. Conclusion
This study develops a clustering scheme andbeat classification (clustering) of ECG signals,based on the principle of relevant entropy PRIfor the detection of cardiac anomalies suchas arrhythmic beats and supporting diagnos-tic tasks. Under this scheme, graph analysissoftware is implemented and processing devel-oped in Matlab R©where the user can observe inreal time the process of filtering, segmentation,representation and classification of ECG. Out-standing results were obtained in each of theexperiments, with sensitivity (Se), specificity
(Sp) and accuracy (Acc) greater than 98% fur-ther demonstrating that overcomes some stud-ies the state of the art in Accuracy classifyingthe same kinds of arrhythmias.
It is concluded that this scheme allows dis-covering the pathological structures presentin ECG records by grouping beats and QRScomplex, obtaining a successful performanceof arrhythmia classification. Moreover, in mostcases, the addition of the processing times ofeach segment or QRS complex is considerablyless than the scanning time of the whole reg-istration iteration therefore may be said to re-duce the computational cost. As future work isintend to use other measures of performanceor characterization, to model a better informa-tion way and to applied to the classificationscheme proposed to obtain better Accuracy. Italso wants in the future, extending the numberof arrhythmias classes to study and increasethe number of reliability testing of the systemin other databases.
References
[1] D. H. Peluffo Ordoñez et al., “Estudio com-parativo de métodos de agrupamiento nosupervisado de latidos de senales ecg,”Ph.D. dissertation, Universidad Nacionalde Colombia-Sede Manizales, 2009.
9

Randomness Analyzing Signals • June 2014 • Masters in Engineering - Industrial Automation
[2] R. Ceylan, Y. Özbay, and B. Karlik, “Anovel approach for classification of ecg ar-rhythmias: Type-2 fuzzy clustering neuralnetwork,” Expert Systems with Applications,vol. 36, no. 3, pp. 6721–6726, 2009.
[3] M. Wiggins, A. Saad, B. Litt, and G. Vacht-sevanos, “Evolving a bayesian classifierfor ecg-based age classification in medi-cal applications,” Applied soft computing,vol. 8, no. 1, pp. 599–608, 2008.
[4] B. Anuradha, V. Reddy, and C. Veera,“Cardiac arrhythmia classification usingfuzzy classifiers,” Journal of Theoretical andApplied Information Technology, vol. 4, no. 4,pp. 353–359, 2008.
[5] B. Dogan and M. Korürek, “A new ecgbeat clustering method based on kernel-ized fuzzy c-means and hybrid ant colonyoptimization for continuous domains,”Applied soft computing, vol. 12, no. 11, pp.3442–3451, 2012.
[6] M. Korürek and A. Nizam, “A newarrhythmia clustering technique basedon ant colony optimization,” Journal ofBiomedical Informatics, vol. 41, no. 6, pp.874–881, 2008.
[7] M. R. Homaeinezhad, E. Tavakkoli, andA. Ghaffari, “Discrete wavelet-based fuzzynetwork architecture for ecg rhythm-type recognition: feature extraction andclustering-oriented tuning of fuzzy infer-ence system,” International Journal of Sig-nal Processing, Image Processing and PatternRecognition, vol. 4, no. 3, pp. 107–130, 2011.
[8] R. Besrour, Z. Lachiri, and N. Ellouze,“Ecg beat classifier using support vectormachine,” in Information and Communica-tion Technologies: From Theory to Applica-tions, 2008. ICTTA 2008. 3rd InternationalConference on. IEEE, 2008, pp. 1–5.
[9] R. Ghongade and A. Ghatol, “A robustand reliable ecg pattern classification us-ing qrs morphological features and ann,”in TENCON 2008-2008 IEEE Region 10 Con-ference. IEEE, 2008, pp. 1–6.
[10] J.-S. Wang, W.-C. Chiang, Y.-L. Hsu, andY.-T. C. Yang, “Ecg arrhythmia classifica-tion using a probabilistic neural networkwith a feature reduction method,” Neuro-computing, vol. 116, pp. 38–45, 2013.
[11] A. K. Ka, “Ecg beats classification us-ing waveform similarity and rr interval,”arXiv preprint arXiv:1101.1836, 2011.
[12] L. Zhang, H. Peng, and C. Yu, “An ap-proach for ecg classification based onwavelet feature extraction and decisiontree,” in Wireless Communications and Sig-nal Processing (WCSP), 2010 InternationalConference on. IEEE, 2010, pp. 1–4.
[13] M. Llamedo and J. P. Martínez, “Án auto-matic patient-adapted ecg heartbeat classi-fier allowing expert assistance,” BiomedicalEngineering, IEEE Transactions on, vol. 59,no. 8, pp. 2312–2320, 2012.
[14] R. J. Martis and C. Chakraborty, “Ar-rhythmia disease diagnosis using neu-ral network, svm, and genetic algorithm-optimized k-means clustering,” Journal ofMechanics in Medicine and Biology, vol. 11,no. 04, pp. 897–915, 2011.
[15] Y.-C. Yeh, C. W. Chiou, and H.-J. Lin, “An-alyzing ecg for cardiac arrhythmia usingcluster analysis,” Expert Systems with Ap-plications, vol. 39, no. 1, pp. 1000–1010,2012.
[16] L. G. S. Giraldo, “Reproducing kernelhilbert space methods for information the-oretic learning,” Ph.D. dissertation, Uni-versity of Florida, 2012.
[17] S. M. Rao and J. C. Adviser-Principe, Un-supervised learning: an information theoreticframework. University of Florida, 2008.
[18] D. Cvetkovic, E. D. Übeyli, and I. Cosic,“Wavelet transform feature extraction fromhuman ppg, ecg, and eeg signal responsesto elf pemf exposures: A pilot study,” Dig-ital Signal Processing, vol. 18, no. 5, pp.861–874, 2008.
10