Hydrocarbon gas sensing of nano-crystalline perovskite oxides LnFeO 3 ( Ln = La, Nd and Sm
Upload
independentCategory
view
3download
0
Raman Scattering and Infrared Spectroscopy of ChemicallySubstituted Sr2LnTaO6 (Ln ) Lanthanides, Y, and In) Double
Perovskites
Anderson Dias,*,† L. Abdul Khalam,‡ Mailadil Thomas Sebastian,‡ Marcio Martins Lage,§
Franklin Massami Matinaga,§ and Roberto Luiz Moreira§
Departamento de Quımica, UniVersidade Federal de Ouro Preto, Campus Morro do Cruzeiro, ICEB II,Ouro Preto-MG, 35400-000, Brazil, Materials and Minerals DiVision, National Institute for
Interdisciplinary Science and Technology, TriVandrum-695 019, India, and Departamento de Fısica,UniVersidade Federal de Minas Gerais, C.P. 702, Belo Horizonte-MG, 30123-970, Brazil
ReceiVed April 4, 2008. ReVised Manuscript ReceiVed June 4, 2008
Sr2LnTaO6 (Ln ) lanthanides, Y, and In) ceramics were prepared by a solid-state route, and theirvibrational phonon modes were investigated using Raman and infrared (IR) spectroscopic techniques.Lorentzian lines were used to fit the Raman spectra, which showed 24 bands in perfect agreement withtheoretical calculations. The IR spectra were fitted with a four-parameter semiquantum model, and theresults showed 17 bands for the materials. The position and width of the phonon modes were determinedand correlated to the ionic radii for the different atoms substituted in the B′-site. It was verified that allmaterials belong to the monoclinic P21/n (C2h
5 ) structure.
Introduction
It is well-known that ceramics with a perovskite structurerepresent potential compounds for technological applica-tions.1 These materials show an incredibly high versatilitydue to their wide array of structures and phases with totallydifferent functions, which are directly related to the combi-nation of chemical elements in the basic formula ABX3.Multiple ion substitution in the perovskite lattice creates theso-called complex perovskites, which present pairs ofunlikely valence cations in proportions depending on theiroxidation states and ionic radii.1 In the last 50 years, manycompounds were studied in the framework of their crystalchemistry toward emerging applications: ferroelectrics,2
superconductors,3 relaxors,4 photonics,5 catalysts,6 and mi-crowave (MW) dielectrics.7 The ever-growing proliferationin telecommunication technologies provided an increasingdemand for MW dielectric ceramics.7,8 These materialsconstitute the basic components in various communication
and MW systems providing very effective size reduction forMW components. High dielectric constants (εr), minimumpossible dielectric losses, and near-zero temperature stabilityof the resonant frequency (τf) are the basic requirements forMW applications, which are not fully attained by anycompound. Even though a number of MW resonator materi-als are available, the demand for new MW dielectrics witha multifunctionality feature is also increasing.7
In this respect, complex perovskites provide a wide andgood range of suitable materials due to the possibilities oftailoring the chemistry and consequently the parameters tomeet device requirements. It is well-known that the finalproperties are highly dependent on the nature of the cationspresent as well as on structural features, including orderingand defects.9 Extensive research was carried out to investigatethe properties of complex A(B′1/3B′′ 2/3)O3 perovskites, suchas Ba(Mg1/3Ta2/3)O3 and Ba(Zn1/3Ta2/3)O3, as they possessexcellent MW properties.10 In spite of that, less attentionhas been paid to MW dielectric properties of A2B′B′′O6,known as double perovskites. Current investigations on theseceramics showed a number of temperature-stable MWdielectric materials with potential new applications extendingto the millimeter wave range.11–14 Among the doubleperovskites recently investigated, the series containing lan-thanides in the B-sites besides niobium or tantalum presentedexcellent MW properties.11–14 For these ceramics, the crystalstructures are controversial: cubic, pseudo-cubic, tetragonal,
* Corresponding author. Tel.: 55-31-3559-1716. E-mail: [email protected].
† Universidade Federal de Ouro Preto.‡ National Institute for Interdisciplinary Science and Technology.§ Universidade Federal de Minas Gerais.
(1) (a) Mitchell, R. H. PeroVskites: Modern and Ancient; Almaz Press:Ontario, Canada, 2002. (b) Properties and Applications of PeroVskiteType Oxides; Tejuca, L. G., Fierro, J. L. G., Eds.; Marcel Decker:New York, 1993.
(2) Samara, G. A. J. Phys.: Condens. Matter. 2003, 15, 367.(3) Blackstead, H. A.; Dow, J. D.; Harshman, D. R.; Yelon, W. B.; Chen,
M. X.; Wu, M. K.; Chen, D. Y.; Chien, F. Z.; Pulling, D. B. Phys.ReV. B: Condens. Matter Mater. Phys. 2001, 61, 214412-1.
(4) Bokov, A. A.; Ye, Z. G. J. Mater. Sci. 2006, 41, 31.(5) Wojtowicz, A. J.; Drozdowski, W.; Wisniewski, D.; Lefaucheur, J. L.;
Galazka, Z.; Gou, Z. H.; Lukasiewicz, T.; Kisielewski, J. Opt. Mater.2006, 28, 85.
(6) Osterloh, F. E. Chem. Mater. 2008, 20, 35.(7) Reaney, I. M.; Iddles, D. J. Am. Ceram. Soc. 2006, 89, 2063.(8) Subodh, G.; James, J.; Sebastian, M. T.; Paniago, R.; Dias, A.; Moreira,
R. L. Chem. Mater. 2007, 19, 4077.
(9) Knapp, M. C.; Woodward, P. M. J. Solid State Chem. 2006, 179, 1076.(10) Varma, M. R.; Raghunandan, R.; Sebastian, M. T. Jpn. J. Appl. Phys.
2005, 44, 298.(11) Khalam, L. A.; Sebastian, M. T. Int. J. Appl. Ceram. Technol. 2006,
3, 364.(12) Khalam, L. A.; Sebastian, M. T. J. Am. Ceram. Soc. 2007, 90, 1467.(13) Subodh, G.; Sebastian, M. T. J. Am. Ceram. Soc. 2007, 90, 2266.(14) Dias, A.; Khalam, L. A.; Sebastian, M. T.; Paschoal, C. W. A.; Moreira,
R. L. Chem. Mater. 2006, 18, 214.
5253Chem. Mater. 2008, 20, 5253–5259
10.1021/cm800969m CCC: $40.75 2008 American Chemical SocietyPublished on Web 07/22/2008
orthorhombic, and monoclinic structures are frequently foundin the literature.
Our group studied the crystal structures of complexperovskites using Raman and infrared (IR) spectroscopies.14–17
These techniques are employed to investigate the behaviorof the polar phonon modes, which represent the intrinsicdielectric contributions to the MW response and are directlydependent on the crystalline structure. Thus, to study thepotential of a given material to MW applications (resonatorsor filters), the knowledge of its polar phonon features ismandatory. Barium-,17 strontium-,18 and calcium-based12
complex perovskites with lanthanides previously were studiedfrom the point-of-view of their MW dielectric properties,but only the ceramics containing Ba were investigated byspectroscopic techniques,14,17 although a preliminary incom-plete study on Sr-based ceramics was published some yearsago.19 For these materials, cubic, tetragonal, and orthorhom-bic structures were reported for the lanthanide series depend-ing on the ionic radii.18,19 In this work, the vibrationalproperties of Sr2LnTaO6 ceramics (Ln ) lanthanides, Y, andIn) were investigated in detail by Raman scattering and far-IR spectroscopy together with group-theory calculations. Theresults showed correlations between structures and vibrationalmodes for these materials, allowing us to contribute to thedebate on the crystalline structure of this lanthanide series.
Experimental Procedures
Sr2LnTaO6 (Ln ) La, Pr, Nd, Sm, Eu, Gd, Tb, Dy, Ho, Er, Yb,Y, and In) ceramics were prepared by a solid-state ceramic route.High-purity SrCO3 (99.9%, Aldrich Chemical, St. Louis, MO), rare-earth oxides (99.99%, Treibacher, Althofen, Austria), and Ta2O5
(99.9%, Nuclear Fuel Complex, Hyderabad, India) were used asthe starting materials. Stoichiometric amounts of powder mixtureswere ball-milled in a distilled water medium using yttria-stabilizedzirconia balls in a plastic container for 48 h. The slurry was dried,ground well, and calcined at 1250 °C for 4 h. Because of the poorsinterability of the ceramics with Ho and Y, 0.5 wt % Nb2O5 wasadded as a sintering aid and mixed thoroughly with the powders indistilled water and dried. They were then mixed with 3 wt %polyvinyl alcohol (molecular weight ≈ 22 000, BDH LaboratorySuppliers) and again dried and ground well. Cylindrical pucks of∼7-9 mm in height and 14 mm in diameter were produced byapplying a pressure of 150 MPa. These compacts were then firedat 600 °C for 30 min to expel the binder before being sintered at1600 °C for 4 h. Bulk densities of the sintered samples weremeasured using Archimedes’ method, and the results showedceramics with values in the range of 97-99% of the theoreticalvalue.18
The crystal structure and phase purity of the powdered sampleswere studied by X-ray diffraction (XRD) using Cu KR radiation(λ ) 0.15418 nm) in a Rigaku diffractometer, with a graphitemonochromator and a nickel filter in the 2θ range of 10-140° (step
0.02°2θ). Raman spectra were collected in a back-scatteringconfiguration by using an Olympus confocal microscope attachedto a triple-monochromator T64000 Jobin-Yvon spectrometer (objec-tive 50×). The 532 nm line of the YVO4:Nd laser (second harmonicline with an output of 3 mW at the sample’s surface) together withtwo different lines of an Ar+ laser (514.5 and 488 nm with effective2 mW power at the sample’s surface) were used as the excitinglines. A liquid N2-cooled charge coupled device (CCD) detectedthe scattered light. The frequency resolution was better than 2 cm-1,and the accumulation times were typically five collections of 60 s.The obtained spectra were divided by the Bose-Einstein thermalfactor20 before being fitted by a sum of Lorentzian lines. IRreflectivity spectra were recorded in a Fourier-transform spectrom-eter (Bomem DA 8-02) equipped with a fixed-angle specularreflectance accessory (external incidence angle of 11.5°). In themid-IR region (500-4000 cm-1), we used a SiC glow-bar lampas the IR source, a Ge-coated KBr beamsplitter, and a liquid N2-cooled HgCdTe detector. In the far-IR range (50-600 cm-1), weemployed a mercury-arc lamp, a 6 µm coated Mylar hypersplitter,and a liquid He-cooled Si bolometer. The sample surfaces werepolished to an optical grade (0.25 µm) before measurements. Agold mirror was used as a reference. The data were collected at apressure of 10-4 bar and a frequency resolution of 2 cm-1. ThereflectivityspectrawereevaluatedbymeansofstandardKramers-Kroniganalysis and adjusted by an oscillator model. A generalized four-parameter oscillator model was used rather than the classical modelto achieve a good fit with a minimum number of physicallymeaningful oscillators.
Results
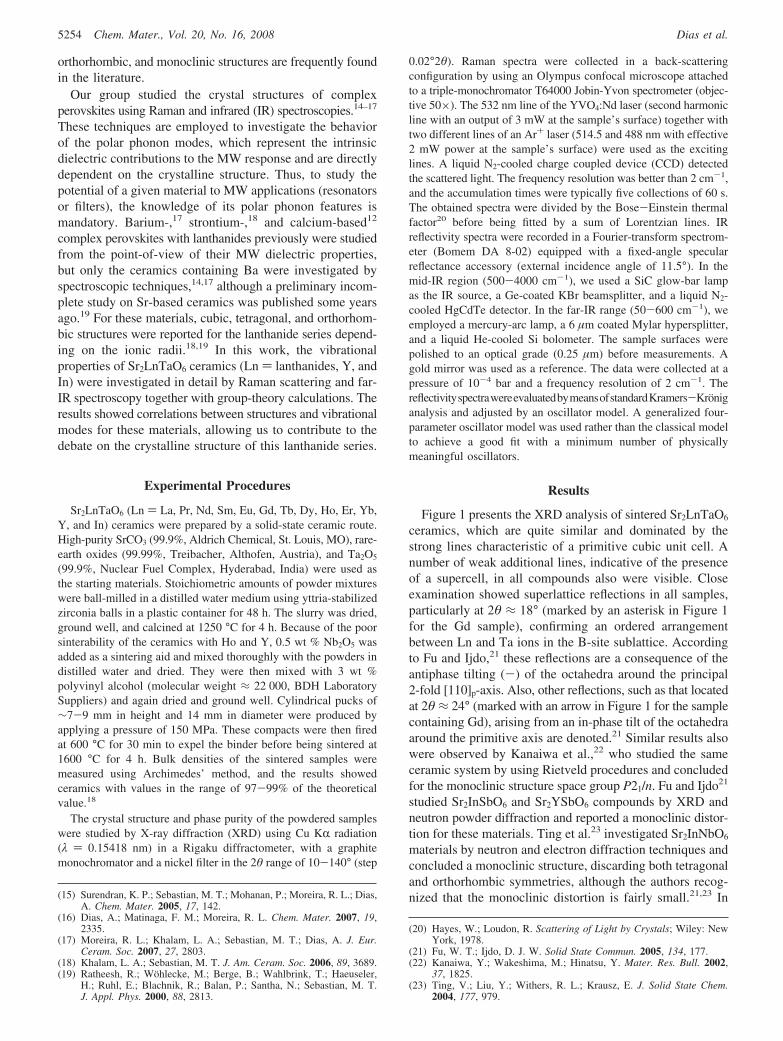
Figure 1 presents the XRD analysis of sintered Sr2LnTaO6
ceramics, which are quite similar and dominated by thestrong lines characteristic of a primitive cubic unit cell. Anumber of weak additional lines, indicative of the presenceof a supercell, in all compounds also were visible. Closeexamination showed superlattice reflections in all samples,particularly at 2θ ≈ 18° (marked by an asterisk in Figure 1for the Gd sample), confirming an ordered arrangementbetween Ln and Ta ions in the B-site sublattice. Accordingto Fu and Ijdo,21 these reflections are a consequence of theantiphase tilting (-) of the octahedra around the principal2-fold [110]p-axis. Also, other reflections, such as that locatedat 2θ ≈ 24° (marked with an arrow in Figure 1 for the samplecontaining Gd), arising from an in-phase tilt of the octahedraaround the primitive axis are denoted.21 Similar results alsowere observed by Kanaiwa et al.,22 who studied the sameceramic system by using Rietveld procedures and concludedfor the monoclinic structure space group P21/n. Fu and Ijdo21
studied Sr2InSbO6 and Sr2YSbO6 compounds by XRD andneutron powder diffraction and reported a monoclinic distor-tion for these materials. Ting et al.23 investigated Sr2InNbO6
materials by neutron and electron diffraction techniques andconcluded a monoclinic structure, discarding both tetragonaland orthorhombic symmetries, although the authors recog-nized that the monoclinic distortion is fairly small.21,23 In(15) Surendran, K. P.; Sebastian, M. T.; Mohanan, P.; Moreira, R. L.; Dias,
A. Chem. Mater. 2005, 17, 142.(16) Dias, A.; Matinaga, F. M.; Moreira, R. L. Chem. Mater. 2007, 19,
2335.(17) Moreira, R. L.; Khalam, L. A.; Sebastian, M. T.; Dias, A. J. Eur.
Ceram. Soc. 2007, 27, 2803.(18) Khalam, L. A.; Sebastian, M. T. J. Am. Ceram. Soc. 2006, 89, 3689.(19) Ratheesh, R.; Wohlecke, M.; Berge, B.; Wahlbrink, T.; Haeuseler,
H.; Ruhl, E.; Blachnik, R.; Balan, P.; Santha, N.; Sebastian, M. T.J. Appl. Phys. 2000, 88, 2813.
(20) Hayes, W.; Loudon, R. Scattering of Light by Crystals; Wiley: NewYork, 1978.
(21) Fu, W. T.; Ijdo, D. J. W. Solid State Commun. 2005, 134, 177.(22) Kanaiwa, Y.; Wakeshima, M.; Hinatsu, Y. Mater. Res. Bull. 2002,
37, 1825.(23) Ting, V.; Liu, Y.; Withers, R. L.; Krausz, E. J. Solid State Chem.
2004, 177, 979.
5254 Chem. Mater., Vol. 20, No. 16, 2008 Dias et al.

the present work, it was observed that as the ionic radii ofthe Ln elements increase (from In to La), the reflection peaksshift toward the low-angle (higher lattice parameter) side.A significant shift of the peaks for the In sample towardhigher angles when compared to the peaks of the lanthanidesand yttrium ceramics can be attributed to the large differencein their ionic radii. The splitting of the group of reflectionsindexing as (400), (440), and (620) indicates a symmetrylower than tetragonal for all materials, in contrast to theresults for Ba-based ceramics previously published by Diaset al.14 In view of that, the structure of this Sr-basedlanthanide series was investigated by Raman and IR spec-troscopies together with group-theory calculations.
Room-temperature Raman analysis was carried out in allSr2LnTaO6 materials, and the results are displayed in Figure2. As can be seen, similar spectral profiles are clearlyobserved, which indicates that the ceramics likely occur inthe same crystalline structure. Dominating bands located at100-200, 420, and 800 cm-1 are present in the samples,which were previously observed in similar 1:1 orderedceramics.14,17 The sharp and intense set of bands in the rangeof 100-200 cm-1 remains the main feature of the tetragonalstructure previously verified in Ba-based ceramics withlanthanides,14 but the observed splitting is clear evidence
for a lowering in the tetragonal symmetry, as will bediscussed later. For samples containing La, Eu, Ho, and Er,the 488 nm exciting line was used to avoid the extra bandsobserved when using 514 and 532 nm as laser lines. In thisrespect, the samples with Pr, Tb, and even Ho presented extrabands (marked with arrows in Figure 2) probably related tomixed oxidation states (i.e., reagents Pr6O11 and Tb4O7 wereemployed), which could not be removed or avoided bychanging the excitation line. Because of the large numberof modes, the detailed assignment could be achieved onlywith the help of lattice dynamical calculations. To performsuch calculations, it is necessary to know the symmetries ofthe vibrational modes from the polarized spectra of a singlecrystal. Unfortunately, single crystals are not available, andtherefore, it is not possible to obtain a reliable assignmentof all modes observed. Thus, the assignment was performedby comparing experimental data with other complexperovskites.
As a general trend, the Raman bands of all Sr2LnTaO6
ceramics are up-shifted (from La to In), which is aconsequence of the smaller In ions as compared to La ions,leading to a contracted unit cell with smaller ionic distancesand then to stronger ionic bonds. Practically no variation infrequency was observed for bands below 600 cm-1, whichare related to Sr (Ag x Bg cubic-like modes) and Sr-O (Ag)vibrations (translational motions) and are insensitive tochemical substitution on B-sites. While the mode centeredat 530-570 cm-1 can be assigned as the Bg stretching mode(ν2 for a free octahedron), the set of modes centered at410-420 cm-1 corresponds to the bending modes (ν5 for afree octahedron). The region below 300 cm-1 is normallyaffected by composition (external modes), but no change wasobserved, probably due to invariance of the cation on theB′′ -site (Ta) in the samples studied. For frequencies above600 cm-1, a shift to lower frequencies was detected as afunction of the rare-earth ion, from In to La, as commentedpreviously. The frequency range of 650-950 cm-1 repre-sents vibrations of the oxygen octahedra with Ln/Ta cations
Figure 1. XRD for all Sr2LnTaO6 (Ln ) lanthanides, Y, and In) materialsstudied. A superlattice reflection due to negative tilts around the principal[110]p-axis is marked with an asterisk, while superlattice diffractions arisingfrom an in-phase tilt of the octahedra are indicated by the symbol #. Thedashed line denotes a change in the intensity scale used for bettervisualization of the range of 17-25°2θ.
Figure 2. Room-temperature Raman spectra for Sr2LnTaO6 (Ln ) lan-thanides, Y, and In) complex perovskites. Extra bands due to mixedoxidation states are marked with arrows in samples containing Pr, Tb, andHo.
5255Chem. Mater., Vol. 20, No. 16, 2008Substituted Sr2LnTaO6 Double PeroVskites

on their interior. Changes in the composition affect themodes, especially the Ag(O) peaks at 790-830 cm-1 (totallysymmetric stretching of TaO6 octahedra or ν1 mode for afree octahedron).
The Raman spectra of the ceramic containing La must bediscussed separately. As can be seen in Figure 2, the splittingof the F2g(1)-like mode is not clear, albeit our efforts to obtaingood Raman data, including different laser lines, intensities,and acquisition times. Ratheesh et al.19 studied these ceramicsand verified remarkable changes in their MW properties ascompared to other lanthanides. Although the tolerance factorfor this sample indicates a strong deviation from cubicsymmetry, the Raman experimental data are not consistentwith this auxiliary parameter. In terms of ionic radii, Sr2+
and La3+ exhibit (coordination number 12) very close values:1.58 and 1.50 Å, respectively. It is then possible that a partialintersubstitution occurred between the A-site occupied bySr ions and the B-site occupied by La ions. However, thewidth of the broadband at 100-200 cm-1 is comparable tothe corresponding bands in the other rare-earth, Y, and Inceramics, displayed in Figure 2. From these observations, itis not possible to conclude possible intersubstitutions in thisLa containing ceramic.
The ideal simple perovskite is cubic, space group Pm3jm,which presents no-active first-order Raman phonons and onlythree IR-active modes. For complex cubic perovskites ofgeneral formula A2B′B′′O6, Fm3jm symmetry (Oh
5, No. 225,Glazer’s notation a0a0a0) is frequently expected in ordereduntilted lattices. This configuration allows classification ofthe normal modes at the Brillouin zone center as Γ ) A1g xEg x F1g x 2F2g x 5F1u x F2u.14 Symmetry analysis of theirreducible representations indicates that four modes areRaman-active (A1g, Eg, and 2F2g) and also that four modesare IR-active (4F1u). The strong features observed in Figure2 can be assigned to these first-order Raman active modes;however, many additional features appeared, particularly inthe triply degenerate low-frequency F2g(1) mode. The sharpand intense lines in the range of 100-200 cm-1 split into atleast four bands, which lead us to investigate the crystalstructure of this lanthanide series. Literature data andprevious results with Ba-based, lanthanide ceramics indicatethat a structure with a symmetry lower than tetragonal ismore plausible for these materials; in particular, the mono-clinic P21/n structure.21–25 Because of the completely dif-ferent Raman patterns observed for Ba-based materials andour present samples,14,26 in the absence of clear splitting ofthe triply degenerate mode in the 100-200 cm-1 region,the hypothesis for an orthorhombic structure was disregarded.
Thus, we adopted the much more common tetragonalstructure for this type of ordered double perovskite (I4/m,No. 87, C4h
5 space group).27 This tetragonal structure isderived from the prototype Fm3jm cubic structure by a single
rotation (antiphase) of the LnO6 and TaO6 octahedra alongthe [001] direction of the cubic cell (Glazer’s notationa0a0c-). For this structure, the Sr atoms occupy 4d sites ofS4 symmetry, the Ln and Ta ions occupy 2a and 2b sites ofC4h symmetry, and the oxygen atoms are in the 8h and 4esites (Cs and C4 symmetries, respectively). Then, using thesite-group method of Rousseau et al.,28 it is possible to obtainthe following distribution in terms of the irreducible repre-sentations of the C4h point group: Γ ) 3Ag x 5Au x 3Bg xBu x 3Eg x 6Eu. Excluding the acoustic (Au x Eu) and silentmodes (Bu), we would expect nine Raman-active modes (3Ag,3Bg, and 3Eg) and nine IR bands (4Au and 5Bu) for thisstructure. As can be easily observed in Figures 2 and 3, thenumber of Raman and IR bands is higher than nine, whichmeans that the symmetry of our ceramics is lower than thetetragonal space group I4/m. Also, XRD results showed thatboth antiphase and in-phase tilts occur in these materials,which do not allow this particular tetragonal structure. Theonly possibility for a tetragonal structure with in-phase andantiphase tilts (P42/n, No. 86, a+a+c-)29 predicts 35 Raman-active bands and another 35 IR-active modes, which is notcompatible with our experimental data.
We assume a monoclinic structure, space group P21/n (C2h5 ,
No. 14, Glazer’s notation a-a-c+), which can be understoodto result from a combination of in-phase (+) and antiphase(-) tilts of LnO6 and TaO6 octahedra in the (- - +) sensearound the <001> axes of the ideal cubic perovskite. Thisstructure presents a direct group-subgroup relationship withtetragonal I4/m symmetry, discussed previously.29 In thiscase, Ln and Ta ions should occupy the 2a and 2b Wyckoff-sites of both Ci symmetry, and Sr and O ions are in 4e sitesof general C1 symmetry. The site-group method28 leads nowto the following distribution of irreducible representationsof the C2h point group: Γ ) 12Ag x 12Bg x 18Au x 18Bu.Thus, one would have 24 Raman-active phonon modes (12Ag
and 12Bg) and 33 IR-active modes (17Au and 16Bu) for thesesamples (the acoustic modes are Au x 2Bu). On the basis ofthe previous factor-group analyses, careful fittings of theRaman spectra were carried out, and the results for a typicalsample are displayed in Figure 3. As an example, thespectrum for the ceramic containing Gd was divided intothree wavenumber regions for better visualization: 30-310,290-650, and 640-1005 cm-1 (Figure 3a-c). The finalfittings (red lines in Figure 3) were obtained through a sumof 24 Lorentzian lines, in perfect agreement with the previoustheoretical predictions (similar fittings with 24 bands couldbe obtained for all other ceramics). Table 1 presents theparameters after deconvolution of the spectrum of Sr2GdTaO6
(i.e., wavenumbers (cm-1) and full width at half-maximum(cm-1)) for the phonon modes identified by experimentaldata. The present Raman spectroscopic results lead us toconclude that the correct structure for the Sr2LnTaO6
perovskites appears to be within the monoclinic P21/n (C2h5 )
structure.(24) Ting, V.; Liu, Y.; Withers, R. L.; Noren, L.; James, M.; Fitzgerald,
J. D. J. Solid State Chem. 2006, 179, 551.(25) Howard, C. J.; Barnes, P. W.; Kennedy, B. J.; Woodward, P. M. Acta
Crystallogr., Sect. B: Struct. Sci. 2005, 61, 258.(26) Dias, A.; Khalam, L. A.; Sebastian, M. T.; Moreira, R. L. J. Solid
State Chem. 2007, 180, 2143.(27) Lufaso, M. W.; Barnes, P. W.; Woodward, P. M. Acta Crystallogr.,
Sect. B: Struct. Sci. 2006, 62, 397.
(28) Rousseau, D. L.; Bauman, R. P.; Porto, S. P. S. J. Raman Spectrosc.1981, 10, 253.
(29) Howard, C. J.; Kennedy, B. J.; Woodward, P. M. Acta Crystallogr.,Sect. B: Struct. Sci. 2003, 59, 463.
5256 Chem. Mater., Vol. 20, No. 16, 2008 Dias et al.

The IR reflectivity spectra of all samples studied in thepresent work are displayed in Figure 4. Visual inspection ofthe spectra shows at least 10 well-defined modes for allmaterials. Notice the high similarity between the spectra ofthe ceramics with different Ln ions, confirming their averagenoncubic symmetry, as will be discussed later. Again, thehigher number of bands if compared to tetragonal ceramicspreviously studied14 also indicates a lower symmetry thanthe common tetragonal. As a preliminary assignment, thebands above 450 cm-1 contain the ν3 (F1u) modes for a free
octahedron, while the 300-450 cm-1 region includes thebending ν4 modes. Below 300 cm-1, the external (transla-tional) modes dominate. Careful inspection of Figure 4reveals the presence of many strong and weak bands, as wellas shoulders in all samples. In view of that, a group-theoryinvestigation was undertaken toward a better understandingof the crystal chemistry of these materials. The exact numberof bands will be known only after precise fitting by usingthe four-parameter semiquantum model30 and a nonlinearleast-squares program.31 According to this model, the IR
Figure 3. Raman spectra for Sr2GdTaO6 ceramics: (a) 50-300 cm-1, (b)300-600 cm-1, and (c) 600-900 cm-1. Experimental data are solid squares,while the fitting curve is the red line. Blue lines represent phonon modesadjusted by Lorentzian curves.
Table 1. Observed Raman Modes for Sr2GdTaO6 Ceramicsa
band Ω γ
1 79.5 192 110.4 123 116.1 64 126.7 55 139.8 46 141.5 67 152.3 78 160.1 139 177.2 1110 214.3 1011 267.3 2912 348.7 1313 381.2 4014 405.4 1115 417.8 916 421.9 1017 448.9 1318 562.0 2219 515.2 2920 614.3 4221 798.7 2122 698.4 5623 754.6 724 818.4 45
a Positions (Ω, cm-1) and full width at half-maximum (γ, cm-1)were obtained from adjustment of experimental data by Lorentzianlines.
Figure 4. IR spectra for Sr2LnTaO6 (Ln ) lanthanides, Y, and In)materials.
5257Chem. Mater., Vol. 20, No. 16, 2008Substituted Sr2LnTaO6 Double PeroVskites

phonon contributions to the complex dielectric function ε(ω)are given by30
ε(ω)) ε∞∏j)1
N Ωj,LO2 -ω2 + iωγj,LO
Ωj,TO2 -ω2 + iωγj,TO
(1)
where ε∞ is the dielectric constant due to the electronicpolarization contribution, and Ωj,LO(Ωj,TO) and γj,LO(γj,TO) arethe frequency and damping of the j-th longitudinal (trans-verse) optical modes, respectively. N is the number of polarphonons. At quasi-normal incidence, the dielectric functionis related to the optical reflectance R by the Fresnel formula
R) |√ε(ω)- 1
√ε(ω)+ 1|2 (2)
Eqs 1and 2were used to fit the experimental data for the Gdceramic (chosen as a typical sample), and the results arepresented in Figure 5 as a solid red curve. Then, we obtainedthe wavenumbers and widths of the transverse (TO) andlongitudinal (LO) IR modes, which are listed in Table 2 forthis sample. We note first that 17 IR modes could be adjustedfor the Sr2GdTaO6 ceramic, which is quite similar to thesituation found for RE2MgB′′O6 (RE ) rare earth and B′′ )Ti, Sn) compounds. For these materials, quasi-accidental
degeneracy forbids distinction between corresponding Au andBu modes, and also only 17 IR modes were observed insteadof the 33 foreseen ones (17Au and 16Bu).32–34 The resem-blance of the spectra of our Sr2GdTaO6 compound and thoseof RE2MgB′′O6,32–34which is derived from the fact that thevibrational modes come essentially from the MgO6 and B”O6
octahedra, are tentatively assigned in refs 32–34.Once the IR modes were determined, the oscillator
strengths of the individual j-th TO modes were obtained(Table 2) by30
∆εj )ε∞
Ωj,TO2
∏k
(Ωk,LO2 -Ωj,TO
2 )
∏k*j
(Ωk,TO2 -Ωj,TO
2 )(3)
Now, the static (IR) dielectric constant, which correspondsto the intrinsic MW dielectric constant, can be obtained byadding the oscillator strengths over all modes according to
εr ) ε∞ +∑j)i
N
∆εj (4)
The values of εr and ε∞ for the sample with Gd are given inTable 2, together with the phonon modes. It is important tonote that the intrinsic unloaded quality factor at the MWregion, Qu, can be calculated as the reciprocal of the dielectricloss tangent (tan δ) in the limit where Ωj,TO. ω, which leadsto the equation
tan δ)∑j
tan δj )∑j
ω∆εjγj,TO
εrΩj,TO2
(5)
The values for ∑j tan δj/ω are also in Table 2. The value ofthe intrinsic (FTIR) quality factor time frequency was 35THz for Gd containing ceramics. This value is 1 order ofmagnitude larger than the MW samples18 because theextrapolation of IR losses to the MW region is often spoileddue to the dominance of extrinsic losses of different origins(polar species, microstructural defects, etc.) leading tooverestimated FTIR quality factors.35–37 The lower value isalso due to the fewer number of modes depicted by fittingbecause of the proximity between modes of differentirreducible representations, which forbids their individualassessment by regular fitting procedures. Intrinsic εr is ingood agreement with the previously published MW measure-ments.18
The IR reflectance spectra displayed in Figure 4 weresubjected to Kramers-Kronig analysis. The complex dielec-tric constant, ε(ω) ) ε′(ω) + Iε′′ (ω), of each Sr2LnTaO6
(30) Gervais, F.; Echegut, P. In Incommensurate Phases in Dielectrics;Blinc, A., Levanyuk, A. P., Eds.; North Holland: Amsterdam, 1986;p 337.
(31) Meneses, D. D.; Gruener, G.; Malki, M.; Echegut, P. J. Non-Cryst.Solids 2005, 351, 124.
(32) Salak, A. N.; Khalyavin, D. D.; Ferreira, V. M.; Ribeiro, J. L.; Vieira,L. G. J. Appl. Phys. 2006, 99, 94104.
(33) Babu, G. S.; Subramanian, V.; Murthy, V. R. K.; Lin, I. N.; Chia,C. T.; Liu, H. L. J. Appl. Phys. 2007, 102, 64906.
(34) Babu, G. S.; Subramanian, V.; Murthy, V. R. K.; Moreira, R. L.; Lobo,R. P. S. M. J. Appl. Phys. 2008, 103, 84104.
(35) Petzelt, J.; Kamba, S. Mater. Chem. Phys. 2003, 79, 175.(36) Zurmuhlen, R.; Petzelt, J.; Kamba, S.; Voitsekhovskii, V.; Colla, E.;
Setter, N. J. Appl. Phys. 1995, 77, 5341.(37) Zurmuhlen, R.; Petzelt, J.; Kamba, S.; Kozlov, G.; Volkov, A.;
Gorshunov, B.; Dube, D.; Tagantsev, A.; Setter, N. J. Appl. Phys.1995, 77, 5351.
Figure 5. IR spectrum for Sr2GdTaO6 sample. Experimental data in opencircles were fit by using the four-parameter semiquantum model (solid redline).
Table 2. Dispersion Parameters Calculated from Fit of IRReflectance Spectrum of Sr2GdTaO6
a
Ωj,TO γj,TO Ωj,LO γj,LO ∆εj 105 tan δj/ω
90.1 11.4 93.6 9.4 3.744 17.768110.1 38.9 113.2 25.8 3.370 36.634121.0 14.0 133.4 14.3 5.013 16.215139.4 17.0 140.8 48.9 0.255 0.756144.0 13.2 144.5 7.3 0.091 0.196173.9 11.8 204.3 11.9 6.905 9.157231.6 23.9 255.2 43.8 2.645 3.998278.3 29.0 292.9 39.9 2.061 2.612293.1 14.4 306.4 43.3 0.020 0.011317.0 26.3 362.2 39.4 0.817 0.724364.3 29.9 398.1 46.6 0.048 0.036399.2 47.6 400.6 37.4 0.001 0.001426.9 47.3 428.0 28.9 0.014 0.012520.6 21.9 567.0 39.2 1.540 0.422567.0 45.6 644.3 48.2 0.001 0.001647.6 46.2 689.6 41.4 0.013 0.005693.6 47.2 704.7 27.2 0.003 0.001
ε∞ ) 3.703 εr ) 30.244 Σ tan δj/ω ) 86.4 × 10⁻⁵
a Positions (Ω) and damping constants (γ) are given in cm-1.
5258 Chem. Mater., Vol. 20, No. 16, 2008 Dias et al.

material was calculated, and the imaginary parts of ε(ω) and1/ε(ω), denoted ε′′ and η′′ , were analyzed in detail. Theseoptical functions were studied because they give, respec-tively, the values of the TO and LO mode frequencies anddamping constants. These values can be compared to thosenormally obtained from the fit with the advantage of studyingindividual phonon contributions without any physical incon-sistency. Figures 6 and 7 show both ε′′ and η′′ as functionsof the chemical substitution on the B-site of the doubleperovskite in the range of 50-900 cm-1. Many distinctmodes can be clearly seen in Figures 6 and 7, which variedin shape and intensity as the ion changed. The lowerfrequency modes in Figure 6 (<350 cm-1) are the mostimportant in view of their contribution to dielectric and MWproperties. These set of intense peaks represent the mainvibrational modes and can be attributed to the Sr-BO3
external vibration as well as to the vibrations for each LnO6
and TaO6 octahedra (O-Ln-O and O-Ta-O bending). Becausethe charge of Ta5+ is higher than that of Ln3+, the forceconstant associated with the Ta-O vibration must be largerthan that of the Ln-O vibration. As a consequence, Ln-Omodes dominate the lower frequency region of the spectra.Besides, higher Ln ionic radii (from In to La) lead to lowerfrequency modes. Similar behavior can be seen in vibrationalmodes in the range of 500-600 cm-1, which are less intense,broader (larger damping), and downshifted with increasingLn3+ ionic radii. Figure 7 (η′′ ) supplies a good image of theevolution of these modes, especially above 400 cm-1, whichare related to the O-Ta-O bending (the dashed line is centered
at 332 cm-1 and represents a change in the intensity scaleused for better visualization). The most relevant informationin the highest wavenumber range (600-900 cm-1) concernsthe contributions of TaO6 and LnO6 stretching vibrations tooptical and dielectric properties. As a general trend, thefrequency decreasing and broadening of the polar (IR) modeswith Ln ionic radii explain, respectively, the observedincrease of the dielectric constants and a decreasing tendencyof quality factors at the MW region.18
Conclusion
Sr2LnTaO6 (Ln ) lanthanides, Y, and In) ceramics wereprepared with the aim of being applied as dielectric resona-tors in telecommunication systems. Together with the XRDtechnique, experimental Raman and IR data allowed us todetermine the correct structure and phonon modes for allthe lanthanide series in Sr-based double perovskites in lightof group-theoretical models. A total of 24 Raman-activebands and 17 IR phonon modes were observed, in goodagreement with group-theoretical calculations for a mono-clinic P21/n (C2h
5 ) structure.
Acknowledgment. The Brazilian authors acknowledge fi-nancial support from CNPq, FINEP, and FAPEMIG. The Indianauthors are grateful to the Council of Scientific and IndustrialResearch (India). Special thanks go to Alexandre M. Moreirafor his assistance with XRD analyses.
CM800969M
Figure 6. Imaginary part of dielectric constant (ε′′ ) calculated fromKramers-Kronig analysis for Sr2LnTaO6 ceramics in the far-IR region(50-700 cm-1).
Figure 7. Inverse of the imaginary part of the dielectric constant (η′′ )calculated from Kramers-Kronig analysis for all Sr2LnTaO6 materials inthe far-IR region. The dashed line centered at 332 cm-1 denotes a changein the intensity scale used for better visualization.
5259Chem. Mater., Vol. 20, No. 16, 2008Substituted Sr2LnTaO6 Double PeroVskites
Copyright © 2022 FDOKUMEN