Non-adiabatic small-polaron hopping conduction in Pr0.65Ca0.35-xSrxMnO3 perovskites above the...
12
Journal of Magnetism and Magnetic Materials 284 (2004) 383–394 Non-adiabatic small-polaron hopping conduction in Pr 0.65 Ca 0.35x Sr x MnO 3 perovskites above the metal–insulator transition temperature S. Mollah a,1 , H.L. Huang a , H.D. Yang a , Sudipta Pal b , S. Taran b , B.K. Chaudhuri b, a Department of Physics, National Sun Yat Sen University, Kaohsiung 804, Taiwan, ROC b Solid State Physics Department, Indian Association for the Cultivation of Science, Jadavpur, Kolkata-700032, India Received 18 May 2004; received in revised form 2 July 2004 Available online 28 July 2004 Abstract We report structural, magnetic and transport properties of Pr 0.65 Ca 0.35x Sr x MnO 3 (x ¼ 0 0:35) perovskites. Non- adiabatic small-polaron hopping (SPH) conduction mechanism is followed in all the manganites above the respective metal–insulator transition temperatures (T MI ). Variable range hopping has been found less important with the increase of Sr concentration in the low temperature semiconducting region (T 4T MI ). A non-linear change in the activation energy (E p ) and Debye temperature (y D ) with applied magnetic field has been observed for all the samples. The metallic conduction below T MI shows the electron–magnon scattering behavior similar to other manganites. Activation energy E s , estimated from the temperature dependent Seebeck coefficient data, was observed to be much smaller than E p determined from the resistivity data which also supports the SPH conduction. r 2004 Published by Elsevier B.V. PACS: 75.47.Jn; 75.47.Gk; 71.30.+h; 72.20.i Keywords: CMR manganites; Electrical conductivity; Thermodynamic properties 1. Introduction Recent explorations on the colossal magnetor- esistive (CMR) materials have focused on the role of strong electron–phonon (e–ph) coupling leading to the formation of polarons (i.e. the association of the localized charge carriers with the lattice ARTICLE IN PRESS www.elsevier.com/locate/jmmm 0304-8853/$ - see front matter r 2004 Published by Elsevier B.V. doi:10.1016/j.jmmm.2004.07.004 Corresponding author. Tel.: +91-33-247-34971; fax: +91- 33-247-32805. E-mail address: [email protected] (B.K. Chaudhuri). 1 Permanent address: Department of Physics, Aligarh Muslim University, Aligarh-202002, India.
Transcript of Non-adiabatic small-polaron hopping conduction in Pr0.65Ca0.35-xSrxMnO3 perovskites above the...
ARTICLE IN PRESS
Journal of Magnetism and Magnetic Materials 284 (2004) 383–394
0304-8853/$
doi:10.1016
Corresp33-247-3280
E-mail a
(B.K. Chau1Permane
University,
www.elsevier.com/locate/jmmm
Non-adiabatic small-polaron hopping conduction inPr0.65Ca0.35xSrxMnO3 perovskites above the metal–insulator
transition temperature
S. Mollaha,1, H.L. Huanga, H.D. Yanga, Sudipta Palb, S. Taranb,B.K. Chaudhurib,
aDepartment of Physics, National Sun Yat Sen University, Kaohsiung 804, Taiwan, ROCbSolid State Physics Department, Indian Association for the Cultivation of Science, Jadavpur, Kolkata-700032, India
Received 18 May 2004; received in revised form 2 July 2004
Available online 28 July 2004
Abstract
We report structural, magnetic and transport properties of Pr0.65Ca0.35xSrxMnO3 (x ¼ 0 0:35) perovskites. Non-adiabatic small-polaron hopping (SPH) conduction mechanism is followed in all the manganites above the respective
metal–insulator transition temperatures (TMI). Variable range hopping has been found less important with the increase
of Sr concentration in the low temperature semiconducting region (T4TMI). A non-linear change in the activation
energy (Ep) and Debye temperature (yD) with applied magnetic field has been observed for all the samples. The metallicconduction below TMI shows the electron–magnon scattering behavior similar to other manganites. Activation energy
Es, estimated from the temperature dependent Seebeck coefficient data, was observed to be much smaller than Ep
determined from the resistivity data which also supports the SPH conduction.
r 2004 Published by Elsevier B.V.
PACS: 75.47.Jn; 75.47.Gk; 71.30.+h; 72.20.i
Keywords: CMR manganites; Electrical conductivity; Thermodynamic properties
- see front matter r 2004 Published by Elsevier B.V.
/j.jmmm.2004.07.004
onding author. Tel.: +91-33-247-34971; fax: +91-
5.
ddress: [email protected]
dhuri).
nt address: Department of Physics, Aligarh Muslim
Aligarh-202002, India.
1. Introduction
Recent explorations on the colossal magnetor-esistive (CMR) materials have focused on the roleof strong electron–phonon (e–ph) coupling leadingto the formation of polarons (i.e. the association ofthe localized charge carriers with the lattice
ARTICLE IN PRESS
S. Mollah et al. / Journal of Magnetism and Magnetic Materials 284 (2004) 383–394384
distortions) in the paramagnetic (PM) insulatingphases, supplementing to the double exchange(DE) interactions (for a review, see Ref. [1]) [2,3].The formation of small polarons is due to themixed-valance transition metal ions (TMIs) pre-sent in the manganites. The lattice distortion arisesas a result of the localization of the eg electronsof Mn3+ ions. The different ion sizes rR;A of(R, A)MnO3 (R=rare earth, A=alkaline earthmetals) manganites also lead to disorder owing tosize mismatch. It can be qualitatively expressed [4]by the variance factor f2
¼ hr2R;Ai hrR;Ai2. Since
there are no 3+ and 2+ cations whose ionic radiiare identical or close to each other, the (R, A) sitedisorder will always exist in (R, A)MnO3 manga-nites. The polaron formation is believed to be anecessary ingredient for modeling a temperaturedependent magnetic and transport behavior ofCMR materials [5,6]. The electrical conductiontakes place by the hopping/tunneling of thepolarons from lower to the higher valance statesof TMIs.Praseodymium (Pr)-based CMR materials have
shown numerous remarkable properties like me-tal–insulator transition (MIT), antiferromagne-tic–ferromagnetic (AFM–FM) phase transition,charge ordering (CO), phase separation (PS), etc.[7–10]. The melting of AFM insulating state intoFM metallic one has been perceived inPr0.5Sr0.5MnO3 through the application of mag-netic fields [7]. The entropy change associated withthe magnetic transitions in Pr0.6(Ca1xSrx)0.4MnO3 (0pxp1) polycrystals is much smaller thanthe expected value [10] which is attributed to thelocalization of charge carriers around MIT and thepresence of short-range magnetic correlation wellabove MIT. The occurrence of PS, typicallyinvolving FM metallic and AFM/CO insulat-ing (COI) domains of different shapes likespherical droplets, curves or stripes, have beenobserved [11,12]. Usually, the PS phenomenaare pronounced near the MIT temperature ofmanganites. In this context, the electronic, mag-netic and thermal properties of polycrystallinePr0.65Ca0.35xSrxMnO3 (x ¼ 0:0 0:35) perovs-kites have been studied and reported earlier[13,14]. A PS-induced huge enhancement ofmagnetoresistance (MR) 10% at H ¼ 100Oe and
99% at H ¼ 0:5T around MIT tempera-ture (TMI 80K) has been observed in x ¼ 0:1sample [13,14]. However, the conduction mechan-ism above and below the TMI of it and othersamples of this series has yet not been thoroughlyanalyzed.In the present paper, we report in detail the
structural, magnetic and magneto-transport prop-erties of polycrystalline Pr0.65Ca0.35xSrxMnO3
(x ¼ 020:35) manganites. From the temperaturedependent resistivity (r) and thermoelectric power(TEP) above the respective TMI of the samples, ithas been found that the transport property ismainly governed by the non-adiabatic small-polaron hopping (SPH) conduction in high tem-perature insulating phase.
2. Experimental
Polycrystalline Pr0.65Ca0.35xSrxMnO3 (x ¼
020:35) perovskite manganites were prepared bythe standard solid-state reaction method [13,14]from the powdered raw materials Pr6O11, CaO,MnO2 and SrCO3 (each of purity 499%).Homogeneous stoichiometric mixtures were heattreated at 900 1C for 12 h followed by regrindingand firing at 1200 1C for 12 h. The resultantpowder was palletized at a pressure of 2 ton cm2
and sintered in air at 1350 1C for 48 h with in-between grinding, palletizing and annealing forthree times. Powder X-ray diffraction (XRD)data of the samples were obtained at roomtemperature from a SIEMENS D5000 diffract-ometer using CuKa radiation. Magnetization (M)measurements were performed by the commer-cial superconducting quantum interface device(SQUID) magnetometer between room tempera-ture (300K) and 10K with applied magneticfields (H) up to 8T. Magnetic field (0–8T)dependent electrical resistivity (r) of the sampleswas measured by the standard four-probe method.The TEP (S) of the samples was determinedby the standard differential technique in thetemperature range of 80–300K using an APDcryo-cooler unit with a temperature controllerin the presence or absence of a magnetic fieldof 1.5 T.
ARTICLE IN PRESS
Table 1
Structural parameters of Pr0.65Ca0.35xSrxMnO3 perovskites
x a (A) b (A) c* (A)
0.0 5.447 5.419 5.415
0.05 5.444 5.425 5.421
0.075 5.446 5.429 5.423
0.10 5.444 5.435 5.425
0.125 5.449 5.435 5.437
0.15 5.453 5.438 5.435
0.20 5.446 5.430 5.426
0.25 5.459 5.437 5.435
0.30 5.467 5.437 5.433
0.35 5.481 5.444 5.440
S. Mollah et al. / Journal of Magnetism and Magnetic Materials 284 (2004) 383–394 385
3. Results and discussion
3.1. Structural study with X-ray diffraction
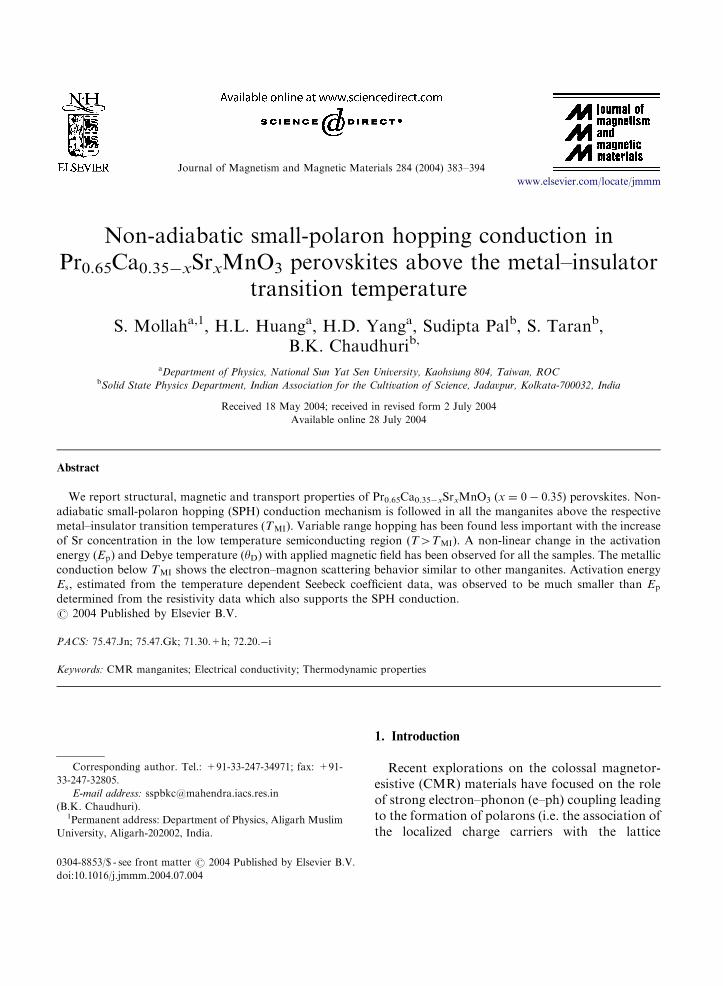
Powder XRD data of Pr0.65Ca0.35xSrxMnO3
(x ¼ 020:35) show single-phase character of allthe samples without any measurable impurityphases (Fig. 1). Rietveld refinement of the datareveals that the samples crystallize in an orthor-hombically distorted perovskite structure withspace group Pbmn consistent with the previouslyreported results [15]. All the structural parameters(a, b and c*) are listed in Table 1. It clearly showsthe increment of the structural parameters with theincrease of doping concentration (x) of larger ionsSr in place of Ca. The corresponding increase of a
is greater than those of b and c* indicating adecrease in orthorhombic distortion due to in-creasing Sr content. This is further supported bythe transport data, which clearly indicate asubstantial increase in conductivity due to increaseof x.
20 40 60 80
(114
)
(312
)
(220
)
(202
)
(111
) (112
)
(110
)
x=0.35
x=0.3
x=0.25
x=0.2
x=0.15
x=0.125
x=0.1
x=0.075
x=0.05
x=0
2θ (degrees)
Inte
nsity
(a.
u.)
Fig. 1. XRD pattern of the samples Pr0.65Ca0.35xSrxMnO3
(x ¼ 020:35) clearly indicating their single-phase character.
3.2. Magnetic field dependent resistivity and
magnetization
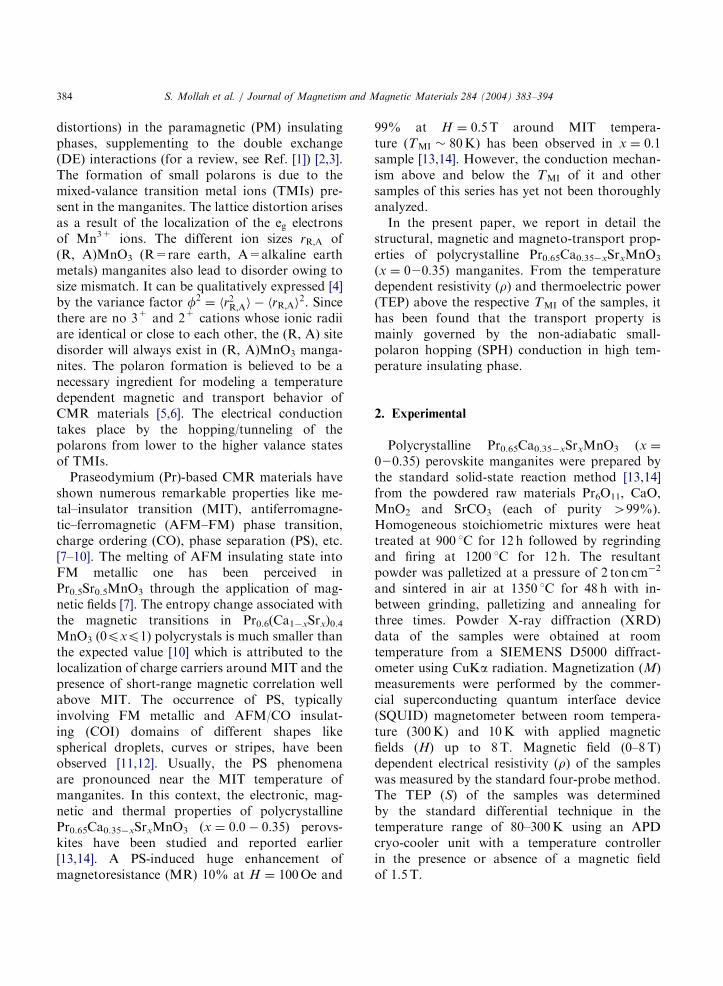
The temperature variation of resistivity (r) ofPr0.65Ca0.35xSrxMnO3 samples shows a sharpMIT for x ¼ 0:1 in the absence of magnetic field(H) [13,14]. Temperature dependent resistivity oftwo samples (with x ¼ 0:075 and 0.125) above andbelow the Sr concentration (x ¼ 0:1) at different H
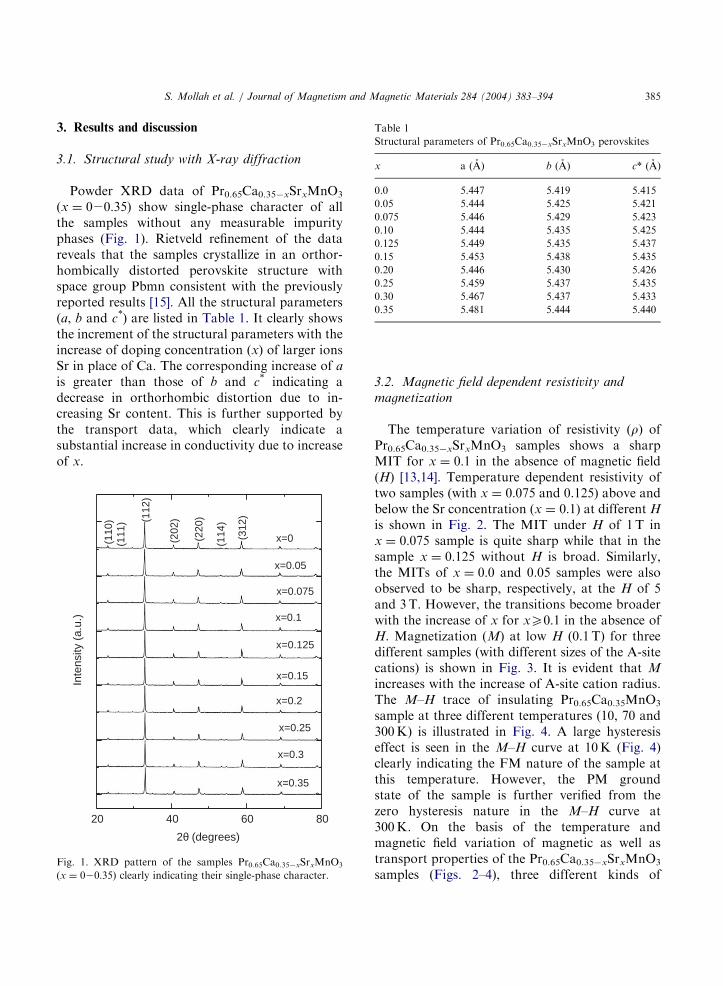
is shown in Fig. 2. The MIT under H of 1T inx ¼ 0:075 sample is quite sharp while that in thesample x ¼ 0:125 without H is broad. Similarly,the MITs of x ¼ 0:0 and 0.05 samples were alsoobserved to be sharp, respectively, at the H of 5and 3T. However, the transitions become broaderwith the increase of x for xX0:1 in the absence ofH. Magnetization (M) at low H (0.1 T) for threedifferent samples (with different sizes of the A-sitecations) is shown in Fig. 3. It is evident that M
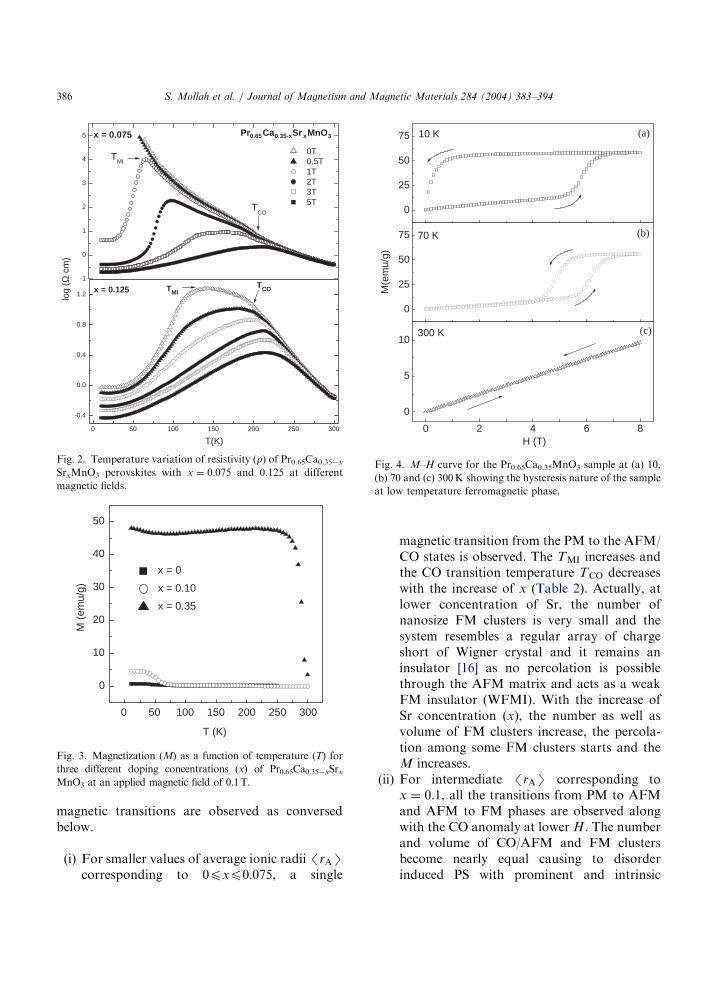
increases with the increase of A-site cation radius.The M–H trace of insulating Pr0.65Ca0.35MnO3
sample at three different temperatures (10, 70 and300K) is illustrated in Fig. 4. A large hysteresiseffect is seen in the M–H curve at 10K (Fig. 4)clearly indicating the FM nature of the sample atthis temperature. However, the PM groundstate of the sample is further verified from thezero hysteresis nature in the M–H curve at300K. On the basis of the temperature andmagnetic field variation of magnetic as well astransport properties of the Pr0.65Ca0.35xSrxMnO3
samples (Figs. 2–4), three different kinds of
ARTICLE IN PRESS
-1
0
1
2
3
4
5
0 50 100 150 200 250 300
-0.4
0.0
0.4
0.8
1.2x = 0.125 TMI
TCO
T(K)
x = 0.075
TMI
TCO
0T 0.5T 1T 2T 3T 5T
Pr0.65Ca0.35-xSr xMnO3
log
(Ω c
m)
Fig. 2. Temperature variation of resistivity (r) of Pr0.65Ca0.35x
SrxMnO3 perovskites with x ¼ 0:075 and 0.125 at different
magnetic fields.
0 50 100 150 200 250 300
0
10
20
30
40
50
x = 0
x = 0.10
x = 0.35
M (
emu/
g)
T (K)
Fig. 3. Magnetization (M) as a function of temperature (T) for
three different doping concentrations (x) of Pr0.65Ca0.35xSrxMnO3 at an applied magnetic field of 0.1T.
0 2 4 6 8
0
5
10(c)300 K
10 K
H (T)
0
25
50
75 (b)
(a)
70 K
M(e
mu/
g)
0
25
50
75
Fig. 4. M–H curve for the Pr0.65Ca0.35MnO3 sample at (a) 10,
(b) 70 and (c) 300K showing the hysteresis nature of the sample
at low temperature ferromagnetic phase.
S. Mollah et al. / Journal of Magnetism and Magnetic Materials 284 (2004) 383–394386
magnetic transitions are observed as conversedbelow.
(i)
For smaller values of average ionic radii /rAScorresponding to 0pxp0:075, a singlemagnetic transition from the PM to the AFM/CO states is observed. The TMI increases andthe CO transition temperature TCO decreaseswith the increase of x (Table 2). Actually, atlower concentration of Sr, the number ofnanosize FM clusters is very small and thesystem resembles a regular array of chargeshort of Wigner crystal and it remains aninsulator [16] as no percolation is possiblethrough the AFM matrix and acts as a weakFM insulator (WFMI). With the increase ofSr concentration (x), the number as well asvolume of FM clusters increase, the percola-tion among some FM clusters starts and theM increases.
(ii)
For intermediate /rAS corresponding tox ¼ 0:1, all the transitions from PM to AFMand AFM to FM phases are observed alongwith the CO anomaly at lower H. The numberand volume of CO/AFM and FM clustersbecome nearly equal causing to disorderinduced PS with prominent and intrinsic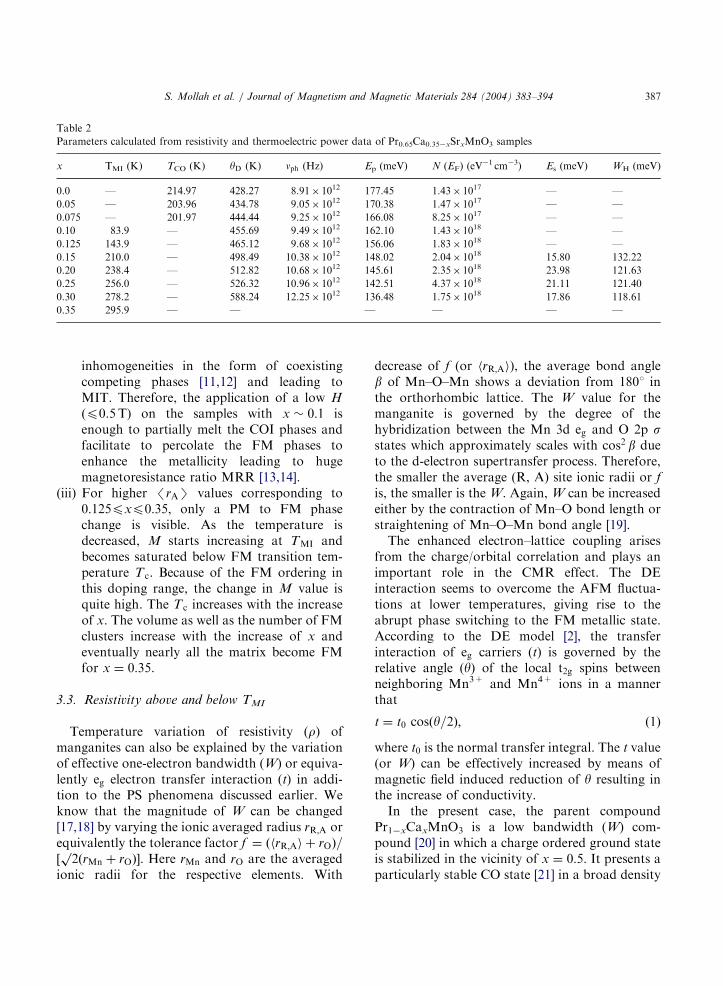
ARTICLE IN PRESS
Table 2
Parameters calculated from resistivity and thermoelectric power data of Pr0.65Ca0.35xSrxMnO3 samples
x TMI (K) TCO (K) yD (K) nph (Hz) Ep (meV) N (EF) (eV1 cm3) Es (meV) WH (meV)
0.0 — 214.97 428.27 8.91 1012 177.45 1.43 1017 — —
0.05 — 203.96 434.78 9.05 1012 170.38 1.47 1017 — —
0.075 — 201.97 444.44 9.25 1012 166.08 8.25 1017 — —
0.10 83.9 — 455.69 9.49 1012 162.10 1.43 1018 — —
0.125 143.9 — 465.12 9.68 1012 156.06 1.83 1018 — —
0.15 210.0 — 498.49 10.38 1012 148.02 2.04 1018 15.80 132.22
0.20 238.4 — 512.82 10.68 1012 145.61 2.35 1018 23.98 121.63
0.25 256.0 — 526.32 10.96 1012 142.51 4.37 1018 21.11 121.40
0.30 278.2 — 588.24 12.25 1012 136.48 1.75 1018 17.86 118.61
0.35 295.9 — — — — — —
S. Mollah et al. / Journal of Magnetism and Magnetic Materials 284 (2004) 383–394 387
inhomogeneities in the form of coexistingcompeting phases [11,12] and leading toMIT. Therefore, the application of a low H
(p0.5 T) on the samples with x 0:1 isenough to partially melt the COI phases andfacilitate to percolate the FM phases toenhance the metallicity leading to hugemagnetoresistance ratio MRR [13,14].
(iii)
For higher /rAS values corresponding to0:125pxp0:35, only a PM to FM phasechange is visible. As the temperature isdecreased, M starts increasing at TMI andbecomes saturated below FM transition tem-perature T c. Because of the FM ordering inthis doping range, the change in M value isquite high. The Tc increases with the increaseof x. The volume as well as the number of FMclusters increase with the increase of x andeventually nearly all the matrix become FMfor x ¼ 0:35.3.3. Resistivity above and below TMI
Temperature variation of resistivity (r) ofmanganites can also be explained by the variationof effective one-electron bandwidth (W) or equiva-lently eg electron transfer interaction (t) in addi-tion to the PS phenomena discussed earlier. Weknow that the magnitude of W can be changed[17,18] by varying the ionic averaged radius rR;A orequivalently the tolerance factor f ¼ ðhrR;Ai þ rOÞ=½p2ðrMn þ rOÞ. Here rMn and rO are the averaged
ionic radii for the respective elements. With
decrease of f (or hrR;Ai), the average bond angleb of Mn–O–Mn shows a deviation from 1801 inthe orthorhombic lattice. The W value for themanganite is governed by the degree of thehybridization between the Mn 3d eg and O 2p sstates which approximately scales with cos2 b dueto the d-electron supertransfer process. Therefore,the smaller the average (R, A) site ionic radii or f
is, the smaller is the W. Again, W can be increasedeither by the contraction of Mn–O bond length orstraightening of Mn–O–Mn bond angle [19].The enhanced electron–lattice coupling arises
from the charge/orbital correlation and plays animportant role in the CMR effect. The DEinteraction seems to overcome the AFM fluctua-tions at lower temperatures, giving rise to theabrupt phase switching to the FM metallic state.According to the DE model [2], the transferinteraction of eg carriers (t) is governed by therelative angle (y) of the local t2g spins betweenneighboring Mn3+ and Mn4+ ions in a mannerthat
t ¼ t0 cosðy=2Þ; ð1Þ
where t0 is the normal transfer integral. The t value(or W) can be effectively increased by means ofmagnetic field induced reduction of y resulting inthe increase of conductivity.In the present case, the parent compound
Pr1xCaxMnO3 is a low bandwidth (W) com-pound [20] in which a charge ordered ground stateis stabilized in the vicinity of x ¼ 0:5. It presents aparticularly stable CO state [21] in a broad density
ARTICLE IN PRESS
0.003 0.004 0.005 0.006-9
-6
-3
0
3
6
-7.0
-6.5
-6.0
-5.5
-8
-6
-4
-2
0
2
-8.0
-7.5
-7.0
x = 0.0
1/ T (K-1)
x = 0.2
x = 0.1
x = 0.3
ln (
ρ/ T
) (Ω
cm
K-1
)
Fig. 5. Variation of ln ðr=TÞ of some of the samples with
x ¼ 0:0, 0.1, 0.2 and 0.3 as a function of inverse temperature.
Solid lines are the best fit to the SPH model of Mott, viz.
r=T ¼ ra expðEp=kBTÞ.
S. Mollah et al. / Journal of Magnetism and Magnetic Materials 284 (2004) 383–394388
region between x ¼ 0:30 and 0.75. For xX0:30, anAFM/CO state is stabilized [21]. Neutron diffrac-tion studies showed that the arrangement ofcharge/spin/orbital order in samples with xX0:30is similar to the charge-exchange (CE)-AFM state[21]. When Ca is successively substituted with Sr,the nominal ratio of Mn3+/Mn4+ and hence thehole density in the system remains unchanged dueto the same valence of Ca and Sr. The only effectthat is prominent is the difference of the atomicsize of the Sr and Ca ions which alters the /rR;ASvalue [18]. Due to the larger size of the Sr ions, theelectron bandwidth (W) increases and hence thehopping amplitude for the electrons in the eg bandbecomes larger causing reduction in resistivity ofPr0.65Ca0.35xSrxMnO3 with the increase of x.The increase in W stabilizes the FM state by
increasing the DE interaction and hence favors theFM metallic state over the COI one. In theminimal W system like Pr1xCaxMnO3, the FMmetallic state becomes apparently absent while forthe maximal W system, i.e. Pr1xSrxMnO3 the FMmetallic state due to DE interaction becomesdominant [1]. Around the middle W region, thesubtle balance or competition between the ferro-magnetic DE and the antiferromagnetic COinteractions result in versatile phenomena [1]including striction-coupled CMR. It is noted thatall the r2T curves for x ¼ 020:35 converge to theconstant resistivity around 300K [14]. This is incontrast to the low temperature region in whichonly a small variation of W causes a crucial changein transport properties.Fig. 5 shows the inverse temperature variation
of lnðr=TÞ of some selective samples. In the hightemperature (T4TMI) insulating (semiconduct-ing) phase, the conductivity data are dominatedby the thermally activated hopping of smallpolarons [22] and are fitted well with the SPHmodel (for T4yD=2) of Mott and Davis [23], viz.
r=T ¼ ra expðEp=kBTÞ; ð2Þ
where ra ¼ ½kB=nphNe2R2Cð1 CÞ exp ð2aRÞ, kBis the Boltzmann constant and T is the absolutetemperature. N is the number of ion sites per unitvolume, R ð1=NÞ
1=3 is the average inter-sitespacing, C is the fraction of sites occupied by apolaron, a is the electron wave function decay
constant, nph is the optical phonon frequency(Table 2) as estimated from the relationhnph ¼ kByD, and the Debye temperature yD isobtained from the temperature where the linearityof ln ðr=TÞ vs. 1=T curve (Fig. 5) disappears in thehigh temperature region. yD as well as nph increasewith the increase of x (Table 2). The activationenergy (Ep) was determined from the slope of theln ðr=TÞ vs. 1=T curve above yD=2 (Fig. 5). Forpolaron hopping conduction [23],
Ep ¼ WH þ WD=2 ðfor T4yD=2Þ and
¼ WD for ToyD=4; ð3Þ
where WH is the polaron hopping energy and WD
is the disorder energy. The difference between theEp and Es (activation energy estimated from thehigh temperature TEP data discussed below) isthe polaron hopping energy. Therefore, WH is
ARTICLE IN PRESS
0 42 6 8110
120
130
140
150
160
170
300
350
400
450
500
550
Pr0.65
Ca0.25
Sr0.1
MnO3
θ D (
K)
H (T)
Ep
(meV
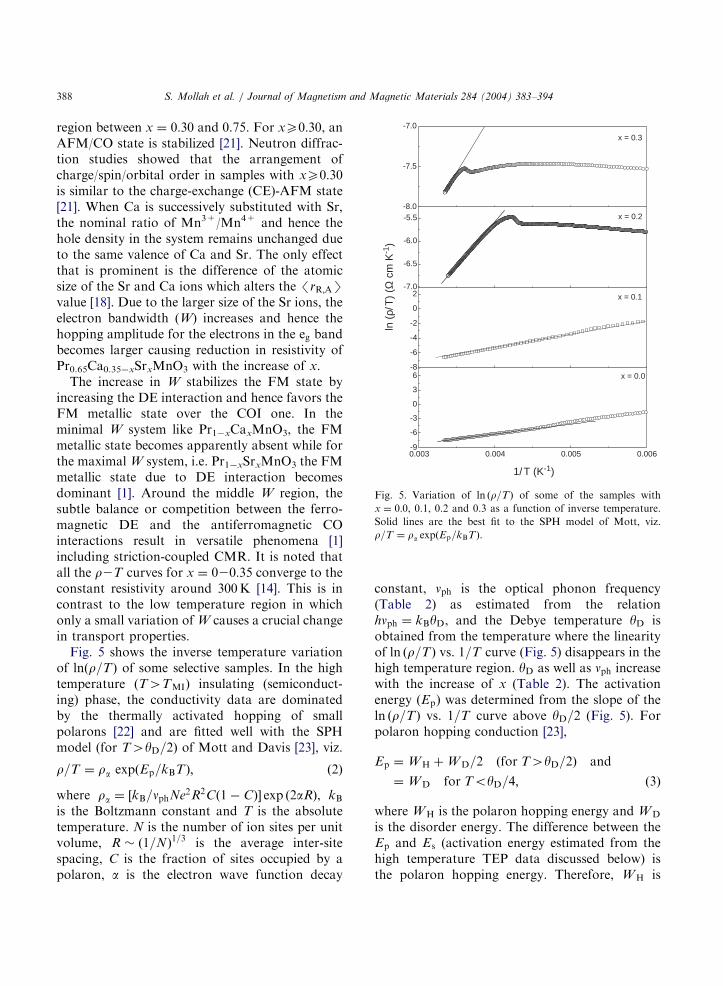
)Fig. 6. Magnetic field dependence of Ep and yD obtained from
fitting the resistivity data of Pr0.65Ca0.25Sr0.1MnO3 sample with
r=T ¼ ra expðEp=kBTÞ.
S. Mollah et al. / Journal of Magnetism and Magnetic Materials 284 (2004) 383–394 389
estimated from the relation [24]
WH ¼ Ep Es: ð4Þ
From the values of Ep, Es and WH, as shown inTable 2, we notice that with increasing value ofstrontium concentration (x), the Ep graduallydecreases. This behavior can be explained byconsidering that increasing x causes larger band-width and hence charge delocalization occurs dueto decrease of e–ph interaction constant gp (asdiscussed later) in the system (Table 3) and therebythe energy required to liberate a free carrier isreduced. Using Eq. (2), the magnetic field depen-dence of Ep and yD are calculated for the sample(x ¼ 0:1) with electronic and magnetic instabilitynear TMI and is shown in Fig. 6. It is noted thatthere is a non-linear decrease of Ep and increasein yD with the increase of applied magnetic field(Fig. 6). Similar trend is also observed in othersamples of the series. Here, it should be mentionedthat the activation energy decreases with theincrease of magnetic field (Fig. 6) for anyparticular x similar to the increase of Sr dopingconcentration (x) in Pr0.65Ca0.35xSrxMnO3
(Table 2). Thus, the role of increasing Sr concen-tration and magnetic field are the same fordelocalization of charge carriers and spin orderingin the CMR system as reported earlier [18].As mentioned previously in this paper and also
reported in our former work [25] that the lowtemperature (TMIoToyD=2) transport phenom-enon in perovskites and in some other semicon-ducting oxides are described by variable range
Table 3
Parameters of Pr0.65Ca0.35xSrxMnO3 perovskites for non-
adiabatic small-polaron hopping conduction
x J (meV) H (meV) WH/3 (meV) gp expðgpÞ
0.0 22.3 — — — —
0.05 22.6 — — — —
0.075 23.0 — — — —
0.10 23.4 — — — —
0.125 23.8 — — — —
0.15 25.1 26.9 43.6 6.14 464.05
0.20 25.6 26.7 40.3 5.47 237.46
0.25 26.1 27.1 40.3 5.33 206.43
0.30 28.4 28.5 39.3 4.65 104.58
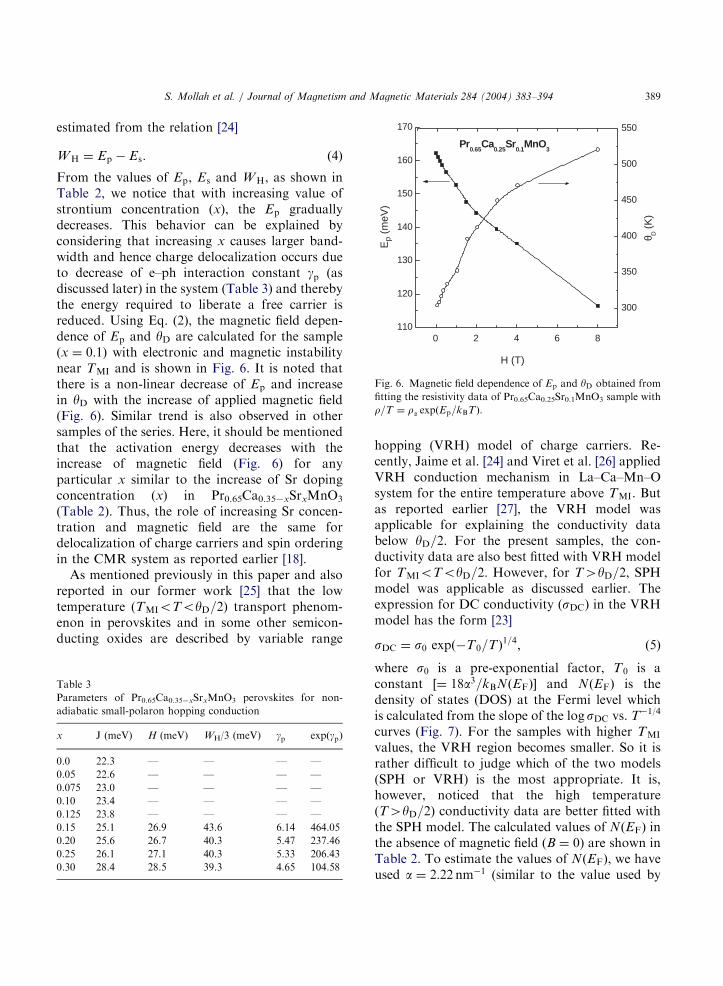
hopping (VRH) model of charge carriers. Re-cently, Jaime et al. [24] and Viret et al. [26] appliedVRH conduction mechanism in La–Ca–Mn–Osystem for the entire temperature above TMI. Butas reported earlier [27], the VRH model wasapplicable for explaining the conductivity databelow yD=2. For the present samples, the con-ductivity data are also best fitted with VRH modelfor TMIoToyD=2. However, for T4yD=2, SPHmodel was applicable as discussed earlier. Theexpression for DC conductivity (sDC) in the VRHmodel has the form [23]
sDC ¼ s0 expðT0=TÞ1=4; ð5Þ
where s0 is a pre-exponential factor, T0 is aconstant ½¼ 18a3=kBNðEFÞ and NðEFÞ is thedensity of states (DOS) at the Fermi level whichis calculated from the slope of the logsDC vs. T1/4
curves (Fig. 7). For the samples with higher TMI
values, the VRH region becomes smaller. So it israther difficult to judge which of the two models(SPH or VRH) is the most appropriate. It is,however, noticed that the high temperature(T4yD=2) conductivity data are better fitted withthe SPH model. The calculated values of NðEFÞ inthe absence of magnetic field (B ¼ 0) are shown inTable 2. To estimate the values of NðEFÞ, we haveused a ¼ 2:22 nm1 (similar to the value used by
ARTICLE IN PRESS
0.24 0.26 0.28 0.30 0.32 0.34 0.36
-12
-8
-4
0
40.24 0.26 0.28 0.30 0.32 0.34 0.36
-12
-8
-4
0
0.24 0.26 0.28 0.30-1.4
-0.7
0.0
0.7
1.4
0.240 0.242 0.244 0.246 0.248 0.250
2.0
2.2
ln
dc (
Ωσ
-1cm
-1)
x = 0.0
T -1/4 (K-1/4 )
x = 0.075
x = 0.15
x = 0.3
Fig. 7. Plot of lnsDC as a function of T1/4 for
Pr0.65Ca0.35xSrxMnO3 samples with x ¼ 0, 0.075, 0.15 and
0.3. Solid lines are the best fit to the VRH model ½sDC ¼
s0 expðT0=TÞ1=4
between TMI and yD=2, where yD is the
Debye temperature.
S. Mollah et al. / Journal of Magnetism and Magnetic Materials 284 (2004) 383–394390
Viret et al. [26] for La–Sr–Mn–O samples). T0 isfound to be 106 for best fit similar to La–Ca–M-n–O and La–Ca–K–Mn–O systems [25]. For anyparticular composition, T0 is found to decreasewith the increasing magnetic field strength. NðEFÞ
values are also in good agreement with thepreviously reported results [27]. The NðEFÞ of thepresent system increases with increasing Sr con-centration (Table 2). Application of magnetic fieldalso increases NðEFÞ for all Sr concentrations. Thisincrease of NðEFÞ with the increase of both by Srdoping and field is also expected, as the increase inconductivity is the obvious effect of the increasednumber of charges at the Fermi level.
From Holstein’s [28] relation, one can conferwhether the hopping conduction is in the adiabaticor non-adiabatic region. According to that rela-tion, the polaron bandwidth J should accomplishthe following condition:
J4H for adiabatic hopping and
oH for non-adiabatic hopping conduction;
ð6Þ
where
H ¼ ð2kBTWH=pÞ1=4
ðhnph=pÞ1=2: ð7Þ
The condition for small-polaron formation isJoWH=3 [28]. An evaluation of J can be madefrom the approximate relation for high tempera-ture jump site
JðTÞ 0:67hnphðT=yDÞ1=4
ð8Þ
and for ground-state bandwidth Jð0Þ ¼ 3hnph ¼124meV with nph 1013 Hz. In the present system,from Table 3, we find that H varies from 26.7 to28.5meV for a temperature of 290K (above TMI
of all the samples), J(290K)22.3–28.4meV, andWH/3 39.3–43.6meV. Since J(290K)oH andJ(290K)oWH/3, we conclude that the DC con-duction in the Pr0.65Ca0.35xSrxMnO3 manganitesis by reason of SPH in the non-adiabatic regime.The values of small-polaron coupling constant(gp), which is a measure of e–ph interaction inthese manganites, can be estimated [23,29] fromthe relation gp ¼ 2WH=hnph. The accomplished gpfor the present system alters from 4.65 to 6.14(Table 3). Austin and Mott [29] suggested that avalue of gp44 usually indicates strong e–phinteraction. Hence, the e–ph interaction in thesemanganites is confirmed to be very strong. Thepolaron mass (mp) and rigid lattice effective massðmnÞ in the manganites are related by [23]
mp ¼ ðh2=8p2JR2Þ expðgpÞ ¼ mn expðgpÞ: ð9Þ
The mP=mn is found to vary from 104.58 to 464.05(Table 3) and is very large indicating furtherstrong e–ph interaction in these manganites.At low temperature (ToTMI) the metallic
behavior of the samples can be explained in termsof electron–magnon scattering of the carriers(Fig. 8). In this temperature regime, the resistivity
ARTICLE IN PRESS
Table 4
Best fitted parameters obtained from the fitting of the low
temperature resistivity data in the metallic regime of
Pr0.65Ca0.35xSrxMnO3 manganites with r ¼ r0 þ r2:5T2:5
x r0 (O cm) r2:5 (O cmK2.5)
0.15 0.33 2.14 106
0.20 0.14 1.01 106
0.25 0.09 4.94 107
0.30 0.03 1.55 107
0.35 0.002 8.02 107
S. Mollah et al. / Journal of Magnetism and Magnetic Materials 284 (2004) 383–394 391
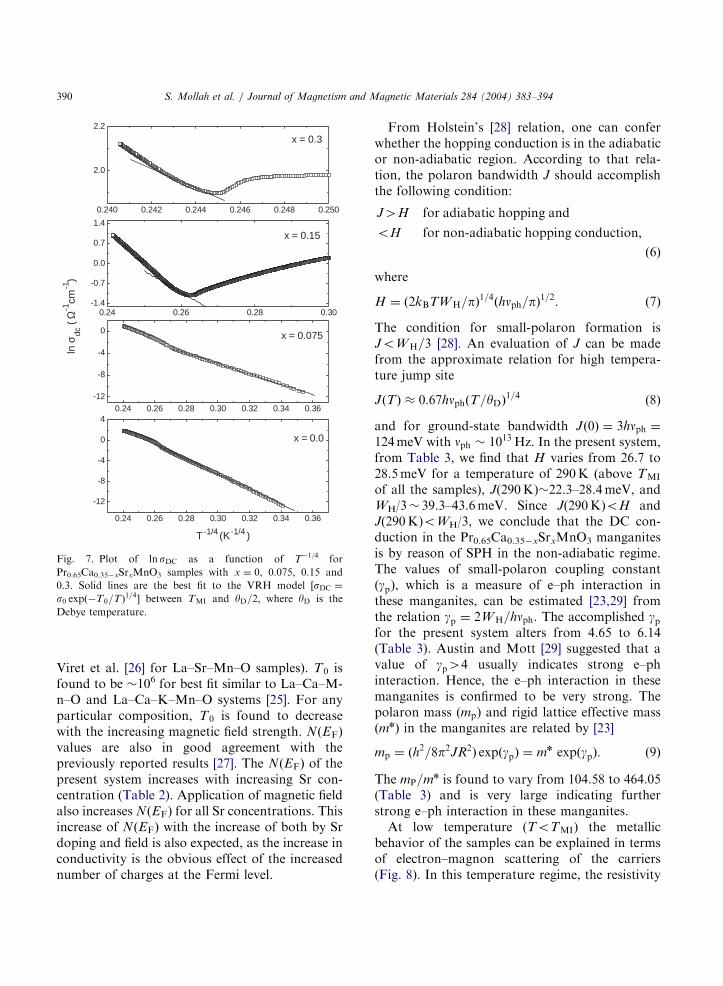
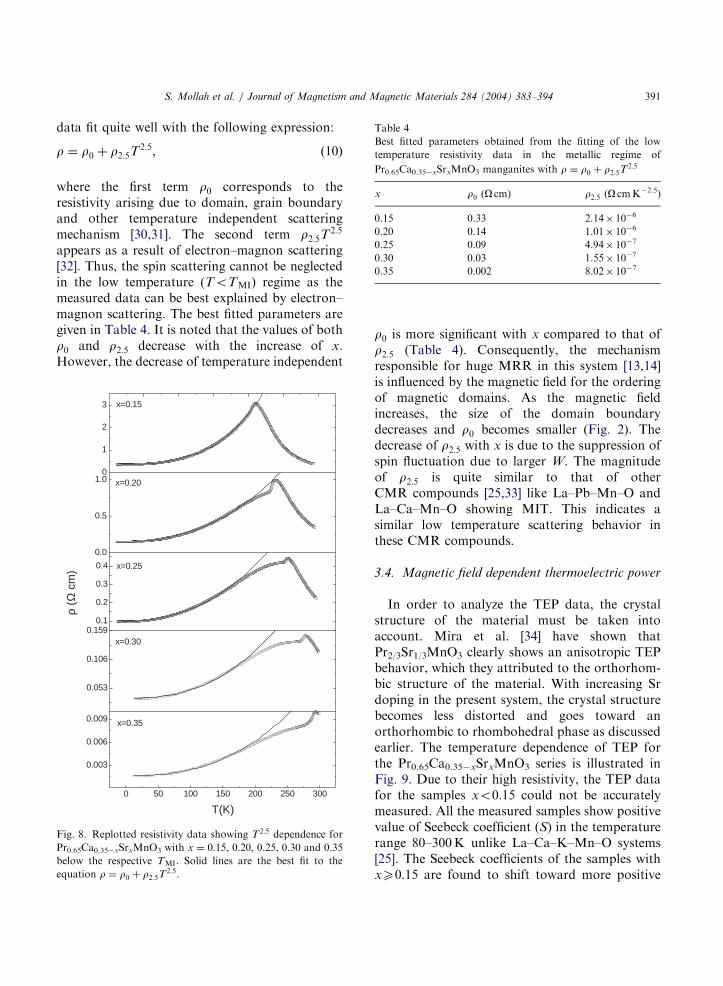
data fit quite well with the following expression:
r ¼ r0 þ r2:5T2:5; ð10Þ
where the first term r0 corresponds to theresistivity arising due to domain, grain boundaryand other temperature independent scatteringmechanism [30,31]. The second term r2:5T
2:5
appears as a result of electron–magnon scattering[32]. Thus, the spin scattering cannot be neglectedin the low temperature (ToTMI) regime as themeasured data can be best explained by electron–magnon scattering. The best fitted parameters aregiven in Table 4. It is noted that the values of bothr0 and r2:5 decrease with the increase of x.However, the decrease of temperature independent
0.0
0.5
1.0
0.1
0.2
0.3
0.4
0 50 100 150 200 250 300
0.003
0.006
0.009
0.053
0.106
0.159
0
1
2
3
x=0.20
x=0.25
ρ (Ω
cm
)
x=0.35
T(K)
x=0.30
x=0.15
Fig. 8. Replotted resistivity data showing T2:5 dependence for
Pr0.65Ca0.35xSrxMnO3 with x ¼ 0:15, 0.20, 0.25, 0.30 and 0.35below the respective TMI. Solid lines are the best fit to the
equation r ¼ r0 þ r2:5T2:5.
r0 is more significant with x compared to that ofr2:5 (Table 4). Consequently, the mechanismresponsible for huge MRR in this system [13,14]is influenced by the magnetic field for the orderingof magnetic domains. As the magnetic fieldincreases, the size of the domain boundarydecreases and r0 becomes smaller (Fig. 2). Thedecrease of r2:5 with x is due to the suppression ofspin fluctuation due to larger W. The magnitudeof r2:5 is quite similar to that of otherCMR compounds [25,33] like La–Pb–Mn–O andLa–Ca–Mn–O showing MIT. This indicates asimilar low temperature scattering behavior inthese CMR compounds.
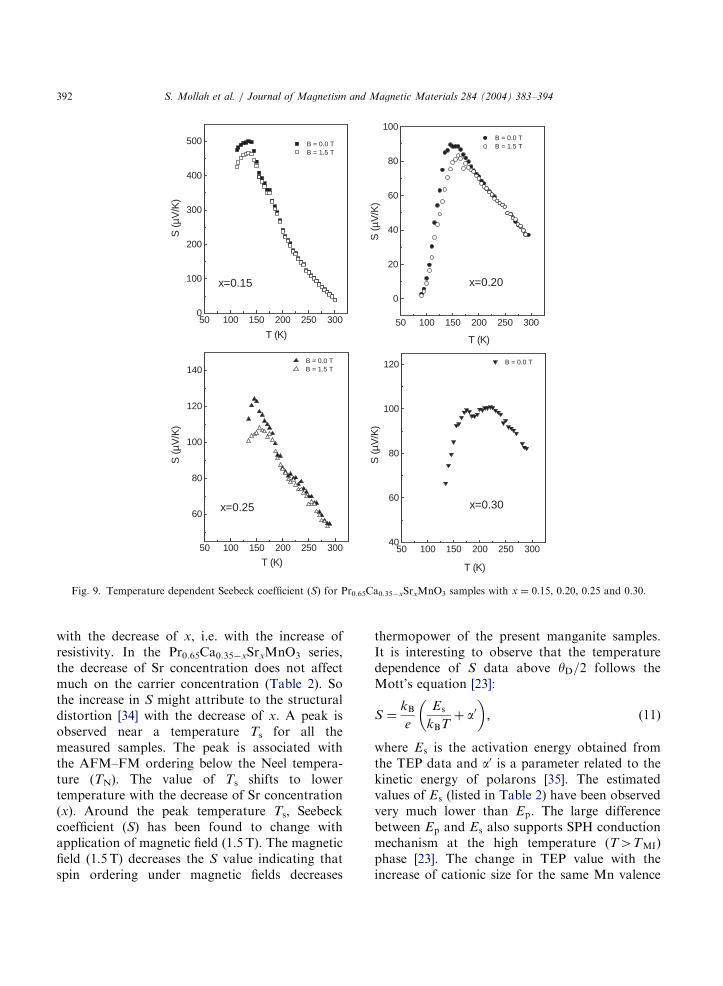
3.4. Magnetic field dependent thermoelectric power
In order to analyze the TEP data, the crystalstructure of the material must be taken intoaccount. Mira et al. [34] have shown thatPr2/3Sr1/3MnO3 clearly shows an anisotropic TEPbehavior, which they attributed to the orthorhom-bic structure of the material. With increasing Srdoping in the present system, the crystal structurebecomes less distorted and goes toward anorthorhombic to rhombohedral phase as discussedearlier. The temperature dependence of TEP forthe Pr0.65Ca0.35xSrxMnO3 series is illustrated inFig. 9. Due to their high resistivity, the TEP datafor the samples xo0:15 could not be accuratelymeasured. All the measured samples show positivevalue of Seebeck coefficient (S) in the temperaturerange 80–300K unlike La–Ca–K–Mn–O systems[25]. The Seebeck coefficients of the samples withxX0:15 are found to shift toward more positive
ARTICLE IN PRESS
50 100 150 200 250 30040
60
80
100
120
x=0.30
50 100 150 200 250 300
60
80
100
120
140
x=0.25
S
(µV
/K)
T (K)
S (
µV/K
)
T (K)
S (
µV/K
)
T (K)
S (
µV/K
)
T (K)
50 100 150 200 250 300
0
20
40
60
80
100
x=0.20
B = 0.0 T B = 1.5 T
50 100 150 200 250 3000
100
200
300
400
500
x=0.15
B = 0.0 T B = 1.5 T
B = 0.0 T B = 1.5 T
B = 0.0 T
Fig. 9. Temperature dependent Seebeck coefficient (S) for Pr0.65Ca0.35xSrxMnO3 samples with x ¼ 0:15, 0.20, 0.25 and 0.30.
S. Mollah et al. / Journal of Magnetism and Magnetic Materials 284 (2004) 383–394392
with the decrease of x, i.e. with the increase ofresistivity. In the Pr0.65Ca0.35xSrxMnO3 series,the decrease of Sr concentration does not affectmuch on the carrier concentration (Table 2). Sothe increase in S might attribute to the structuraldistortion [34] with the decrease of x. A peak isobserved near a temperature Ts for all themeasured samples. The peak is associated withthe AFM–FM ordering below the Neel tempera-ture (TN). The value of Ts shifts to lowertemperature with the decrease of Sr concentration(x). Around the peak temperature Ts, Seebeckcoefficient (S) has been found to change withapplication of magnetic field (1.5 T). The magneticfield (1.5 T) decreases the S value indicating thatspin ordering under magnetic fields decreases
thermopower of the present manganite samples.It is interesting to observe that the temperaturedependence of S data above yD=2 follows theMott’s equation [23]:
S ¼kB
e
Es
kBTþ a0
; ð11Þ
where Es is the activation energy obtained fromthe TEP data and a0 is a parameter related to thekinetic energy of polarons [35]. The estimatedvalues of Es (listed in Table 2) have been observedvery much lower than Ep. The large differencebetween Ep and Es also supports SPH conductionmechanism at the high temperature (T4TMI)phase [23]. The change in TEP value with theincrease of cationic size for the same Mn valence
ARTICLE IN PRESS
S. Mollah et al. / Journal of Magnetism and Magnetic Materials 284 (2004) 383–394 393
state cannot be attributed to a change of carriersfrom electrons to holes. The high sensitivity of theTEP data to the composition variation ofPr0.65Ca0.35xSrxMnO3 suggests that the strongband structure modifications induced by the sizeeffect are correlated to the overlapping of theatomic Mn–O orbitals. A possibility of interpreta-tion is an evolution of the Jahn–Teller effect,which is larger for the smaller x values (smallerionic radii of the interpolated cation). On the otherhand, it cannot be totally ruled out that the effectof the Coulombian localization, which is ofteninvoked for the CMR properties, also plays a rolein the TEP values.Finally, we would like to mention that in the
high temperature semiconducting region (above220K), the charge carriers are no more itinerantsand the transport properties are governed by thethermally activated carriers (i.e. polarons, whichare formed as a result of strong electron–latticecoupling). Above the CO temperature (TCO), theCMR systems are mostly PM and no ferromag-netic cluster exists within the system. So in the hightemperature region, possibility of formation of CEbubble does not arise. Above all, the largedifference between Ep and Es signifies thatconvenient band transport does not occur aboveCurie temperature (T c), rather an SPH is domi-nated by the carrier dependent mobility effects[36]. However, in the high temperature semicon-ducting phase some kind of clusters or islandsmight be formed. Such clusters, if formed, are PM.It has also been pointed out that much of thebehavior of resistivity above the T c is indicative ofconduction by ‘magnetic polarons’ [37–39]. In thiscase, percolation theory could be applied. Con-sidering the correlation of sites in a percolationcluster [40], it can be shown that the expression ofconductivity is equivalent to that deduced from theMott’s VRH model [23]. The VRH has also beenreported to be applicable in some manganitesamples [26,36]. But the VRH model shouldgenerally be applicable in low temperature(o100K) semiconducting phase. Therefore, polar-on hopping conduction mechanism used in thepresent manuscript can, in general, be used toexplain the high temperature (above the Curietemperature) semiconducting behavior of the
manganite systems even if the conduction processis related to the incipient magnetic polaron or inother complicated mechanism yet to be explored.
4. Summary and conclusions
A detailed magnetic field dependent study onthe magnetization and transport properties ofPr0.65Ca0.35xSrxMnO3 has been reported. Struc-tural studies show the decrease in orthorhombicdistortion with the increase of Sr content. Thesystem gradually transforms to a highly conduct-ing metallic phase from a highly insulating CO/AFM phase with increase of x. MIT appears athigher fields for lower Sr concentration (x) forxo0:1 and without field for x40:1. Metallicconduction in these systems follows T2:5 depen-dence indicating the importance of electron–mag-non contribution. Non-adiabatic SPH conductionis observed above MIT temperature of all samples.The e–ph coupling constant and the ratio ofpolaron mass to rigid lattice effective mass indicatestrong coupling in this system. An appreciablechange in the Seebeck coefficient is observed withthe application of magnetic field around the peaktemperature which is associated with theAFM–FM ordering in these compounds. Forma-tion of ferromagnetic clusters in the high tempera-ture phase is not realized. However, the concept ofmagnetic polaron may be invoked to analyze thetransport behavior of this phase.
Acknowledgements
The author (S. Taran) is grateful to Council forScientific and Industrial Research (CSIR) forgranting research fellowship. This work wassupported by National Science Council of Repub-lic of China under contract no. NSC 92-2112-M110-017.
References
[1] Y. Tokura (Ed.), Colossal Magnetoresistive Oxides,
Gordon and Breach, London, 1999.
ARTICLE IN PRESS
S. Mollah et al. / Journal of Magnetism and Magnetic Materials 284 (2004) 383–394394
[2] C. Zener, Phys. Rev. 82 (1951) 403;
P.W. Anderson, H. Hasegawa, Phys. Rev. 100 (1955) 675;
J.B. Goodenough, Phys. Rev. 100 (1955) 564;
E.O. Wollan, W.C. Koehler, Phys. Rev. 100 (1955) 545;
P.G. deGennes, Phys. Rev. 118 (1960) 141.
[3] A. Banerjee, S. Bhattacharya, S. Mollah, H. Sakata, H.D.
Yang, B.K. Chaudhuri, Phys. Rev. B 68 (2003) 186401.
[4] L.M. Rodriguez-Martinez, J.P. Attfield, Phys. Rev. B 54
(1996) 15622.
[5] H. Roder, J. Zang, A.R. Bishop, Phys. Rev. Lett. 76 (1996)
1356.
[6] A.J. Millis, B.I. Shraiman, R. Mueller, Phys. Rev. Lett. 77
(1996) 175.
[7] Y. Tomioka, A. Asamitsu, Y. Moritomo, H. Kuwahara,
Y. Tokura, Phys. Rev. Lett. 74 (1995) 5108.
[8] C. Martin, A. Maignan, M. Herview, B. Raveau, Phys.
Rev. B 60 (1999) 12191.
[9] D. Niebieskikwiat, R.D. Sanchez, A. Caneiro, J. Magn.
Magn. Mater. 237 (2001) 241.
[10] M.R. Lees, O.A. Petrenko, G. Balakrishnan, D. McK.
Paul, Phys. Rev. B 59 (1999) 1298.
[11] A. Moreo, S. Yunoki, E. Dogatto, Science 283 (1999)
2034.
[12] E. Dagotto, T. Hotta, A. Moreo, Phys. Rep. 344 (2001) 1.
[13] S. Mollah, H.L. Huang, P.L. Ho, W.L. Huang, C.W.
Huang, C.P. Sun, J. -Y. Lin, S.J. Liu, Y.S. Gou, W.-H. Li,
H.D. Yang, J. Magn. Magn. Mater. 265 (2003) 215.
[14] S. Mollah, C.P. Sun, H.L. Huang, P.L. Ho, H.D. Yang,
J. Appl. Phys. 95 (2004) 6813.
[15] M.v. Zimmermann, C.S. Nelson, J.P. Hill, D. Gibbs,
M. Blume, D. Casa, B. Keimer, Y. Murakami, C.-C. Kao,
C. Venkataraman, T. Gog, Y. Tomioka, Y. Tokura, Phys.
Rev. B 64 (2001) 195133.
[16] A.L. Malvezzi, S. Yunoki, E. Dagotto, Phys. Rev. B 59
(1999) 7033.
[17] J.B. Torrance, P. Lacorre, A.I. Nazzal, E.J. Ansaldo, Ch.
Nidermayer, Phys. Rev. B 45 (1992) 8209.
[18] Y. Tomioka, A. Asamitsu, H. Kuwahara, Y. Tokura,
J. Phys. Soc. Jpn. 66 (1997) 302.
[19] H.Y. Hwang, T.T.M. Palstra, S.-W. Cheong, B. Batlogg,
Phys. Rev. B 52 (1995) 15046.
[20] A. Maignan, C. Martin, F. Damay, B. Raveau, Z. Phys. B
104 (1997) 21.
[21] Z. Jirak, S. Krupicka, Z. Simsa, M. Dlouha, Z. Vratislav,
J. Magn. Magn. Mater. 53 (1985) 153.
[22] A.J. Millis, P.B. Littlewood, B.I. Shraiman, Phys. Rev.
Lett. 74 (1995) 5144.
[23] N.F. Mott, E.A. Davis, in: Electronics Process in
Non Crystalline Materials, Clarendon Press, Oxford,
1979.
[24] M. Jaime, M.B. Salamon, M. Rubenstein, R.E. Treece,
J.S. Horwitz, D.B. Chrisey, Phys. Rev. B 54 (1996)
11914.
[25] S. Bhattacharya, S. Pal, R.K. Mukherjee, B.K. Chaudhuri,
S. Neeleshwar, Y.Y. Chen, S. Mollah, H.D. Yang,
J. Magn. Magn. Mater. 269 (2004) 359.
[26] M. Viret, L. Ranno, J.M.D. Coey, Phys. Rev. B 55 (1997)
8067.
[27] S. Pal, A. Banerjee, E. Rozenberg, B.K. Chaudhuri,
J. Appl. Phys. 89 (2001) 4955.
[28] T. Holstein, Ann. Phys. (NY) 8 (1959) 343.
[29] I.G. Austin, N.F. Mott, Adv. Phys. 18 (1969) 41.
[30] P. Schiffer, A.P. Ramirez, W. Bao, S.W. Cheong, Phys.
Rev. Lett. 75 (1995) 3336.
[31] G.J. Snyder, R. Hiskes, S. Dicarolis, M.R. Beasley, T.H.
Geballe, Phys. Rev. B 53 (1996) 14434.
[32] J.M. De Teresa, M.R. Ibarra, J. Blasco, J. Garcıa, C.
Marquina, P.A. Algarabel, Z. Arnold, K. Kamenev, C.
Ritter, R. von Helmolt, Phys. Rev. B 54 (1996) 1187.
[33] A. Banerjee, S. Pal, B.K. Chaudhuri, J. Chem. Phys. 115
(2001) 1550.
[34] J. Mira, A. Fondado, L.E. Hueso, J. Rivas, F. Rivadulla,
M.A. Lopez Quintela, Phys. Rev. B 61 (2000) 5857.
[35] K. Sega, Y. Kuroda, H. Sakata, J. Mater. Sci. 33 (1998)
1303.
[36] M. Jaime, M.B. Salamon, K. Pettit, M. Rubinstein, R.E.
Treece, J. S Horwitz, D.B. Chrisey, Appl. Phys. Lett. 68
(1996) 1576.
[37] M. Sawicki, T. Dietl, J. Kossut, J. Igalson, T. Wojtowicz,
W. Plesiewicz, Phys. Rev. Lett. 56 (1986) 508.
[38] R.M. Kusters, J. Singleton, D.A. Keen, R. McGreevy,
W. Hayes, Physica B 155 (1989) 362.
[39] S. Wang, K. Li, Z. Chen, Y. Zhang, Phys. Rev. B 61 (2000)
575.
[40] G.P. Triberis, L.R. Friedman, J. Phys. C:: Solid State
Phys. 14 (1981) 4631.