Rainfall regionalization on the basis of the precipitation convective features using a raingauge...
12
Rainfall regionalization on the basis of the precipitation convective features using a raingauge network and weather radar observations Maria-Carmen Llasat a, ⁎ , Manuel Ceperuelo a , Tomeu Rigo b a Department of Astronomy and Meteorology, University of Barcelona, Avda. Diagonal, 647, 08028, Barcelona, Spain b Servei Meteorològic de Catalunya, Spain Accepted 13 August 2005 Abstract The main objective of the present paper is to show a methodology for undertaking rainfall regionalization of a region taking into account the convective features of the precipitation, and useful for establishing homogeneous zones for improving the alert system. This methodology has been applied to a hydrographic region located in northeast Spain, with an area of 16000 km 2 and characterized by a highly contrasted topography. Information provided by meteorological radar and 5-min precipitation data for 126 automatic raingauges has been used for the period 1996–2002. The previous analysis done on the basis of the 1927–1981 rainfall rate series for the Jardí raingauge, located in Barcelona, has also been considered. To that end, the first step was to draw up a proposal for classification of the pluviometric episodes. Recourse was had for this purpose to definition of the β parameter, related with the greater or lesser convective character of the event and calculated on the basis of the rainfall intensity at the surface ( Llasat, 2001) and, when data are available, on the basis of radar reflectivity. Results show that the threshold of 35 mm/h to characterize convective episodes from raingauge data can be corroborated from the radar point of view when convective precipitation is identified using 2-D algorithms with a reflectivity threshold of 43 dBZ. Once the soundness of the β parameter had been corroborated, it was applied to more than 2900 precipitation episodes recorded in the region, in order to discriminate the features of the different subregions and their time and space distribution throughout the entire series of the samples. Using this definition, 92% of the precipitation events recorded in this region, with accumulated rainfall above 35 mm, are classified as convective ones, representing 95% of the precipitation amount. Application of the β parameter combined with monthly rainfall data allows differentiation of 8 regions with different convective precipitation features. © 2006 Elsevier B.V. All rights reserved. Keywords: Rainfall; Convective precipitation; Rainfall regionalization; Weather radar; Catalonia; Spain 1. Introduction Amongst other objectives, the advances made in hydrometeorology in recent years have included the modelling of precipitation to improve the design curves and hyetographs or to build “synthetic rainfall events”. Usually, this conceptual and mathematical modelling is based on certain climatic features of the region, and does not distinguish between the different kinds of rainfall episodes that can arise. However, their classification could help to improve this modelling by adding more information to the parameterization process. Besides this, the classification of precipitation has a wide spectrum of applications. From a meteorological point of view, the distinction between convective/stratiform Atmospheric Research 83 (2007) 415 – 426 www.elsevier.com/locate/atmos ⁎ Corresponding author. Tel.: +34 93 4021124; fax: +34 93 4021133. E-mail address: [email protected] (M.-C. Llasat). 0169-8095/$ - see front matter © 2006 Elsevier B.V. All rights reserved. doi:10.1016/j.atmosres.2005.08.014
-
Upload
independent -
Category
Documents
-
view
3 -
download
0
Transcript of Rainfall regionalization on the basis of the precipitation convective features using a raingauge...
3 (2007) 415–426www.elsevier.com/locate/atmos
Atmospheric Research 8
Rainfall regionalization on the basis of the precipitation convectivefeatures using a raingauge network and weather radar observations
Maria-Carmen Llasat a,⁎, Manuel Ceperuelo a, Tomeu Rigo b
a Department of Astronomy and Meteorology, University of Barcelona, Avda. Diagonal, 647, 08028, Barcelona, Spainb Servei Meteorològic de Catalunya, Spain
Accepted 13 August 2005
Abstract
The main objective of the present paper is to show a methodology for undertaking rainfall regionalization of a region taking intoaccount the convective features of the precipitation, and useful for establishing homogeneous zones for improving the alert system.This methodology has been applied to a hydrographic region located in northeast Spain, with an area of 16000 km2 andcharacterized by a highly contrasted topography. Information provided by meteorological radar and 5-min precipitation data for126 automatic raingauges has been used for the period 1996–2002. The previous analysis done on the basis of the 1927–1981rainfall rate series for the Jardí raingauge, located in Barcelona, has also been considered. To that end, the first step was to draw upa proposal for classification of the pluviometric episodes. Recourse was had for this purpose to definition of the β parameter, relatedwith the greater or lesser convective character of the event and calculated on the basis of the rainfall intensity at the surface ( Llasat,2001) and, when data are available, on the basis of radar reflectivity. Results show that the threshold of 35 mm/h to characterizeconvective episodes from raingauge data can be corroborated from the radar point of view when convective precipitation isidentified using 2-D algorithms with a reflectivity threshold of 43 dBZ. Once the soundness of the β parameter had beencorroborated, it was applied to more than 2900 precipitation episodes recorded in the region, in order to discriminate the features ofthe different subregions and their time and space distribution throughout the entire series of the samples. Using this definition, 92%of the precipitation events recorded in this region, with accumulated rainfall above 35 mm, are classified as convective ones,representing 95% of the precipitation amount. Application of the β parameter combined with monthly rainfall data allowsdifferentiation of 8 regions with different convective precipitation features.© 2006 Elsevier B.V. All rights reserved.
Keywords: Rainfall; Convective precipitation; Rainfall regionalization; Weather radar; Catalonia; Spain
1. Introduction
Amongst other objectives, the advances made inhydrometeorology in recent years have included themodelling of precipitation to improve the design curvesand hyetographs or to build “synthetic rainfall events”.
⁎ Corresponding author. Tel.: +34 93 4021124; fax: +34 93 4021133.E-mail address: [email protected] (M.-C. Llasat).
0169-8095/$ - see front matter © 2006 Elsevier B.V. All rights reserved.doi:10.1016/j.atmosres.2005.08.014
Usually, this conceptual and mathematical modelling isbased on certain climatic features of the region, and doesnot distinguish between the different kinds of rainfallepisodes that can arise. However, their classificationcould help to improve this modelling by adding moreinformation to the parameterization process. Besidesthis, the classification of precipitation has a widespectrum of applications. From a meteorological pointof view, the distinction between convective/stratiform
416 M.-C. Llasat et al. / Atmospheric Research 83 (2007) 415–426
precipitation is important in determining the verticaldistribution of the diabatic process and thermodynamicsfeatures, improving the rainfall retrieval accuracy fromremotely sensed data, identifying and correcting effectsassociated with bright band and the conversion fromreflectivity measurement to rainfall (Anagnostou, 2004).Considering all the alert chain involved in heavy rainfallevents management, the obtaining of homogeneousareas characterized by different warning thresholds onthe basis of the climatic rainfall features that includerainfall intensity and the greater or lesser possibility ofhaving flash floods, would be very useful. Within thisline, an interdisciplinary classification that endeavoursto merge convective features, rainfall intensity andaccumulated values, the extension of the event andpossible damage, are being prepared nowadays (Llasatet al., 2005; Llasat, in press).
However, when we try to undertake a classificationof rainfall events and rainfall precipitation, we are thusfaced with a problem difficult to resolve. The bestsolution would be to study the nature of the process thatgave rise to the precipitation. In this case a distinctioncould be made, essentially, between precipitation ofconvective origin and precipitation of stratiform origin,which classification should not be identified withclassification of the rainfall associated with a storm orrainfall associated with a front, as has unfortunatelysometimes occurred. In a simplified form, following thedefinition proposed by the AMS Glossary of Meteorol-ogy (Huschke, 1959) and by Houghton (1950), it wouldbe a matter of associating the first type with clouds ofconvective type, such as cumulonimbus, and the second,with clouds of stratiform type, such as nimbostratus.Houze (1993) defines the stratiform/convective precip-itation on the basis of the vertical air velocity, w. If it isless than the terminal fall velocity of ice crystals andsnow, then it is called “stratiform”. Together with thisfeature, and using the 3-D radar imagery, the “brightband” near the melting level is a signature that helps todistinguish convective mode from stratiform mode.Although this kind of analysis would be better and couldbe applied to a specific event, its systematic applicationto a long series could be difficult if not impossible.Consequently, other approximations have been made.
Some analyses of convective systems from meteo-rological satellites have been performed for differentregions of the world, such as Spain (Sánchez et al.,1992, 2003; Martín et al., 1998) or North America(Fritsch et al., 1986; Maddox et al., 1986; Miller andFritsch, 1991). The problem is that within a system ofeminently convective origin, it is possible to find rain ofstratiform character, or, into the trailing anvil of a MCS,
it is possible to find vertical motions of several metersper second, moderate intensity rainfall with a showerycharacter and a certain vertical organization (Doswell,1993; Doswell et al., 1996; Houze, 1997; Anagnostou,2004).
Since the late 1980s, many methods have beendeveloped for analyzing convection and convectiveprecipitation from the radar imagery. Besides the fact ofdistinguishing the bright band, most of these methodsare based on background-exceeding techniques (Steineret al., 1995; Collier, 1989; Hand, 1996; Johnson et al.,1998; Wilson et al., 1998; Biggerstaff and Listemaa,2000; Rigo and Llasat, 2004): they select reflectivityvalues, which are considered as the threshold values foridentifying “convective” pixels. The main differencebetween those algorithms is the point of view used toanalyze convection. In general, it is possible to classifythem into two types. The first methodology uses onlythe lowest (PPI or CAPPI) radar level, and consequentlyworks into a 2-dimensional (2D) analysis (i.e., Steiner etal., 1995). The second one uses all the volume radar andworks into a 3-dimensional (3D) analysis (i.e., Johnsonet al., 1998). Where possible, both methodologies areintegrated in order to improve the characterization of thesystem and its tracking and nowcasting.
The main problem of the previous methodologies liesin the need to have information from meteorologicalsatellites and radars, which would hinder the feasibilityof the process. This problem increases when aclimatological analysis for a long series is required, orwhen the people who would have to manage theclassification are not expert in the radar or satelliteanalysis or require an easier tool to classify the rainfallevents. Then, the third possibility would consist instudying the rainfall intensity threshold exceeded whena “heavy rain” is considered or the required thresholdfrom which the mitigation produced by rain in the short-wave radio links occurs, both of which problems areusually related with convective rainfalls (Llasat andPuigcerver, 1985, 1997). Although the concept of highrainfall rate can vary with the climatic characteristics ofthe rain for each location, the literature usually considersa high intensity to be that which exceeds 0.8 mm/min(Dutton and Dougherty, 1979; Watson et al., 1982; Vilarand Burgueño, 1991). Although not all rain ofconvective origin exceeds that threshold, while not allrain which does exceed said threshold is convective,Llasat (2001) shows that the error made whenconvective rainfall is identified with 1-min intensitiesexceeding 50 mm/min can be misleading.
The objective of this paper lies in an attempt tooverlap the ground information and weather radar
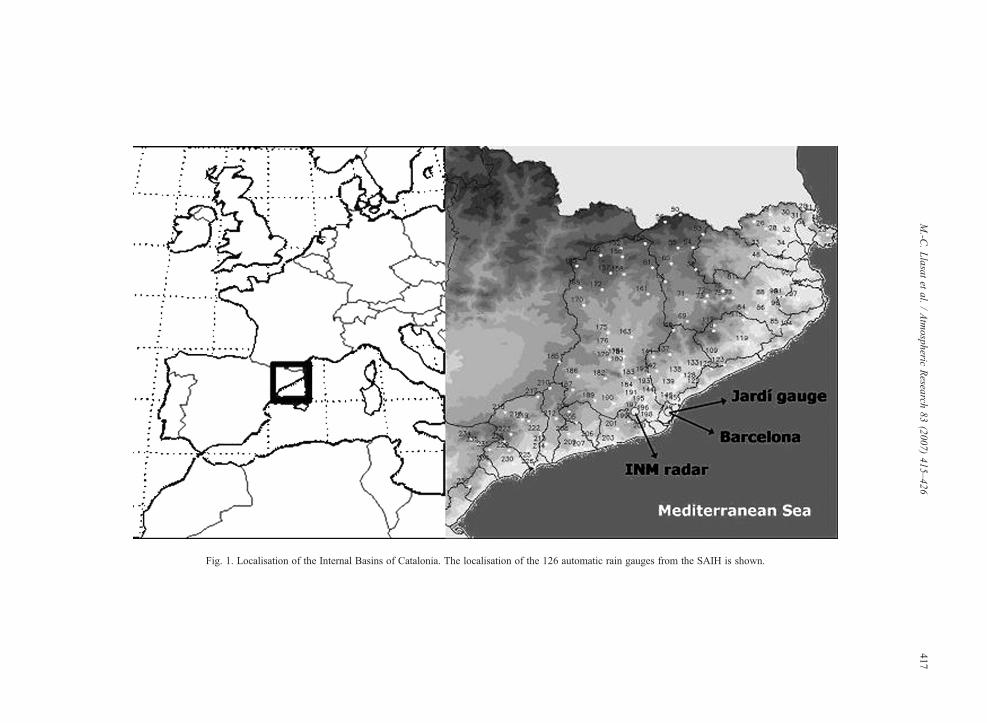
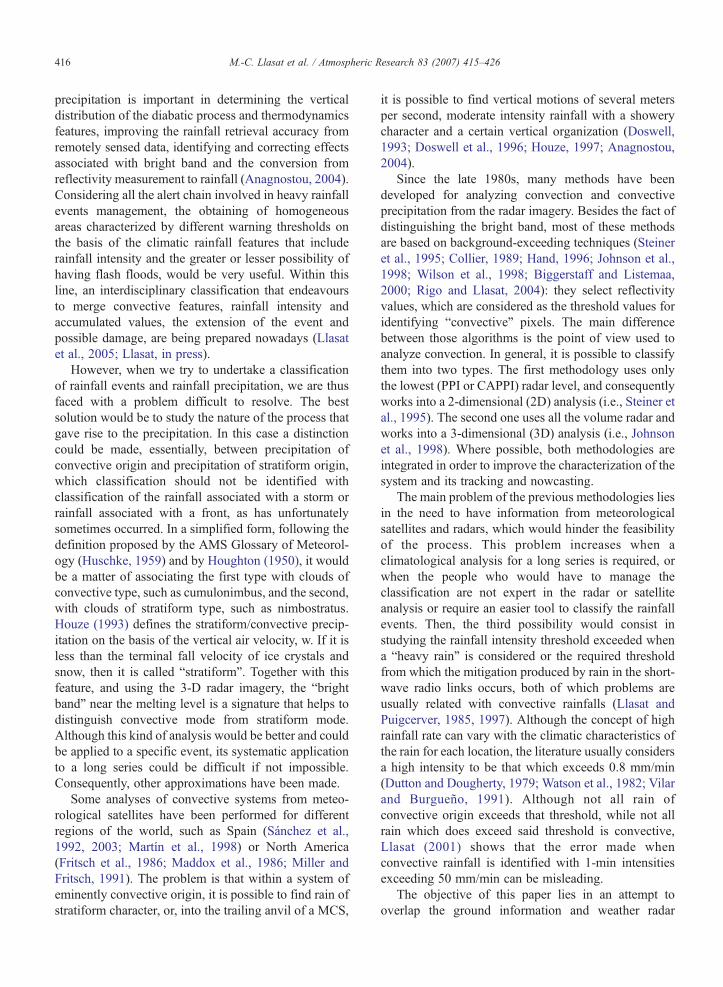
Fig. 1. Localisation of the Internal Basins of Catalonia. The localisation of the 126 automatic rain gauges from the SAIH is shown.
417M.-C
.Llasat
etal.
/Atmospheric
Research
83(2007)
415–426
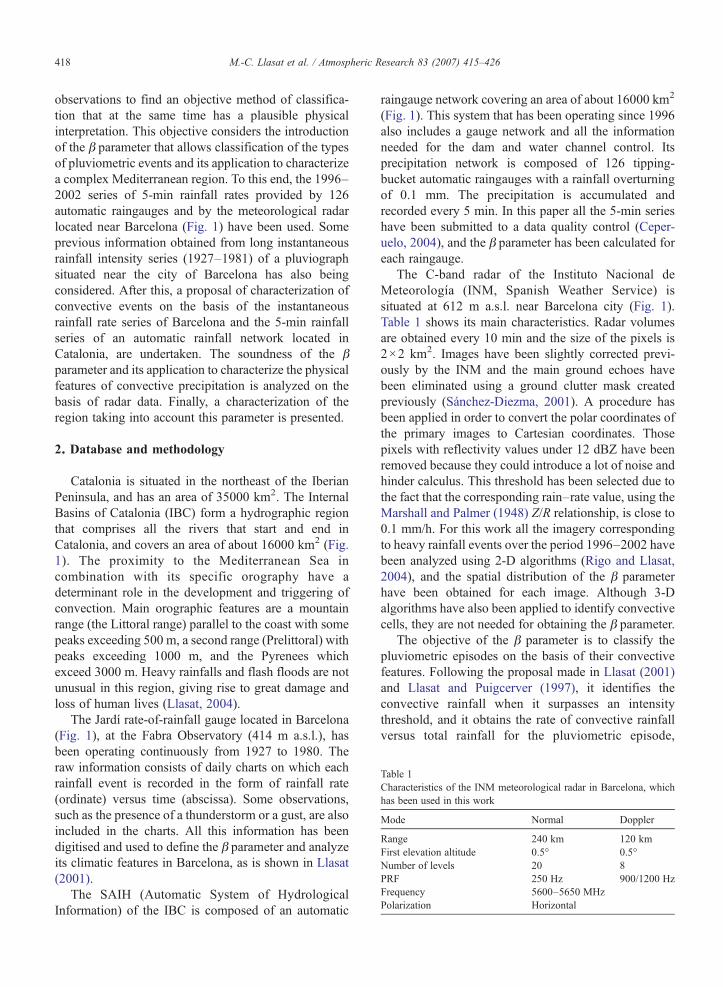
Table 1Characteristics of the INM meteorological radar in Barcelona, whichhas been used in this work
Mode Normal Doppler
Range 240 km 120 kmFirst elevation altitude 0.5° 0.5°Number of levels 20 8PRF 250 Hz 900/1200 HzFrequency 5600–5650 MHzPolarization Horizontal
418 M.-C. Llasat et al. / Atmospheric Research 83 (2007) 415–426
observations to find an objective method of classifica-tion that at the same time has a plausible physicalinterpretation. This objective considers the introductionof the β parameter that allows classification of the typesof pluviometric events and its application to characterizea complex Mediterranean region. To this end, the 1996–2002 series of 5-min rainfall rates provided by 126automatic raingauges and by the meteorological radarlocated near Barcelona (Fig. 1) have been used. Someprevious information obtained from long instantaneousrainfall intensity series (1927–1981) of a pluviographsituated near the city of Barcelona has also beingconsidered. After this, a proposal of characterization ofconvective events on the basis of the instantaneousrainfall rate series of Barcelona and the 5-min rainfallseries of an automatic rainfall network located inCatalonia, are undertaken. The soundness of the βparameter and its application to characterize the physicalfeatures of convective precipitation is analyzed on thebasis of radar data. Finally, a characterization of theregion taking into account this parameter is presented.
2. Database and methodology
Catalonia is situated in the northeast of the IberianPeninsula, and has an area of 35000 km2. The InternalBasins of Catalonia (IBC) form a hydrographic regionthat comprises all the rivers that start and end inCatalonia, and covers an area of about 16000 km2 (Fig.1). The proximity to the Mediterranean Sea incombination with its specific orography have adeterminant role in the development and triggering ofconvection. Main orographic features are a mountainrange (the Littoral range) parallel to the coast with somepeaks exceeding 500 m, a second range (Prelittoral) withpeaks exceeding 1000 m, and the Pyrenees whichexceed 3000 m. Heavy rainfalls and flash floods are notunusual in this region, giving rise to great damage andloss of human lives (Llasat, 2004).
The Jardí rate-of-rainfall gauge located in Barcelona(Fig. 1), at the Fabra Observatory (414 m a.s.l.), hasbeen operating continuously from 1927 to 1980. Theraw information consists of daily charts on which eachrainfall event is recorded in the form of rainfall rate(ordinate) versus time (abscissa). Some observations,such as the presence of a thunderstorm or a gust, are alsoincluded in the charts. All this information has beendigitised and used to define the β parameter and analyzeits climatic features in Barcelona, as is shown in Llasat(2001).
The SAIH (Automatic System of HydrologicalInformation) of the IBC is composed of an automatic
raingauge network covering an area of about 16000 km2
(Fig. 1). This system that has been operating since 1996also includes a gauge network and all the informationneeded for the dam and water channel control. Itsprecipitation network is composed of 126 tipping-bucket automatic raingauges with a rainfall overturningof 0.1 mm. The precipitation is accumulated andrecorded every 5 min. In this paper all the 5-min serieshave been submitted to a data quality control (Ceper-uelo, 2004), and the β parameter has been calculated foreach raingauge.
The C-band radar of the Instituto Nacional deMeteorología (INM, Spanish Weather Service) issituated at 612 m a.s.l. near Barcelona city (Fig. 1).Table 1 shows its main characteristics. Radar volumesare obtained every 10 min and the size of the pixels is2×2 km2. Images have been slightly corrected previ-ously by the INM and the main ground echoes havebeen eliminated using a ground clutter mask createdpreviously (Sánchez-Diezma, 2001). A procedure hasbeen applied in order to convert the polar coordinates ofthe primary images to Cartesian coordinates. Thosepixels with reflectivity values under 12 dBZ have beenremoved because they could introduce a lot of noise andhinder calculus. This threshold has been selected due tothe fact that the corresponding rain–rate value, using theMarshall and Palmer (1948) Z/R relationship, is close to0.1 mm/h. For this work all the imagery correspondingto heavy rainfall events over the period 1996–2002 havebeen analyzed using 2-D algorithms (Rigo and Llasat,2004), and the spatial distribution of the β parameterhave been obtained for each image. Although 3-Dalgorithms have also been applied to identify convectivecells, they are not needed for obtaining the β parameter.
The objective of the β parameter is to classify thepluviometric episodes on the basis of their convectivefeatures. Following the proposal made in Llasat (2001)and Llasat and Puigcerver (1997), it identifies theconvective rainfall when it surpasses an intensitythreshold, and it obtains the rate of convective rainfallversus total rainfall for the pluviometric episode,
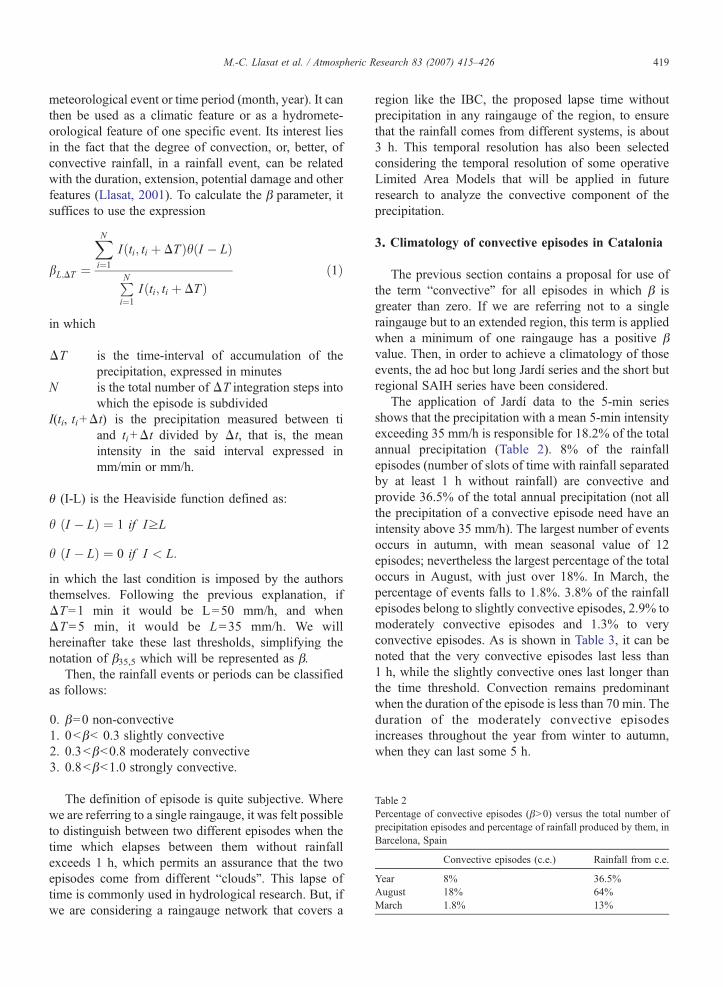
Table 2Percentage of convective episodes (β>0) versus the total number ofprecipitation episodes and percentage of rainfall produced by them, inBarcelona, Spain
Convective episodes (c.e.) Rainfall from c.e.
Year 8% 36.5%August 18% 64%March 1.8% 13%
419M.-C. Llasat et al. / Atmospheric Research 83 (2007) 415–426
meteorological event or time period (month, year). It canthen be used as a climatic feature or as a hydromete-orological feature of one specific event. Its interest liesin the fact that the degree of convection, or, better, ofconvective rainfall, in a rainfall event, can be relatedwith the duration, extension, potential damage and otherfeatures (Llasat, 2001). To calculate the β parameter, itsuffices to use the expression
bL;DT ¼
XNi¼1
Iðti; ti þ DTÞhðI � LÞ
PNi¼1
Iðti; ti þ DTÞð1Þ
in which
ΔT is the time-interval of accumulation of theprecipitation, expressed in minutes
N is the total number of ΔT integration steps intowhich the episode is subdivided
I(ti, ti+Δt) is the precipitation measured between tiand ti+Δt divided by Δt, that is, the meanintensity in the said interval expressed inmm/min or mm/h.
θ (I-L) is the Heaviside function defined as:
h ðI � LÞ ¼ 1 if IzL
h ðI � LÞ ¼ 0 if I < L:
in which the last condition is imposed by the authorsthemselves. Following the previous explanation, ifΔT=1 min it would be L=50 mm/h, and whenΔT=5 min, it would be L=35 mm/h. We willhereinafter take these last thresholds, simplifying thenotation of β35,5 which will be represented as β.
Then, the rainfall events or periods can be classifiedas follows:
0. β=0 non-convective1. 0<β< 0.3 slightly convective2. 0.3<β<0.8 moderately convective3. 0.8<β<1.0 strongly convective.
The definition of episode is quite subjective. Wherewe are referring to a single raingauge, it was felt possibleto distinguish between two different episodes when thetime which elapses between them without rainfallexceeds 1 h, which permits an assurance that the twoepisodes come from different “clouds”. This lapse oftime is commonly used in hydrological research. But, ifwe are considering a raingauge network that covers a
region like the IBC, the proposed lapse time withoutprecipitation in any raingauge of the region, to ensurethat the rainfall comes from different systems, is about3 h. This temporal resolution has also been selectedconsidering the temporal resolution of some operativeLimited Area Models that will be applied in futureresearch to analyze the convective component of theprecipitation.
3. Climatology of convective episodes in Catalonia
The previous section contains a proposal for use ofthe term “convective” for all episodes in which β isgreater than zero. If we are referring not to a singleraingauge but to an extended region, this term is appliedwhen a minimum of one raingauge has a positive βvalue. Then, in order to achieve a climatology of thoseevents, the ad hoc but long Jardí series and the short butregional SAIH series have been considered.
The application of Jardí data to the 5-min seriesshows that the precipitation with a mean 5-min intensityexceeding 35 mm/h is responsible for 18.2% of the totalannual precipitation (Table 2). 8% of the rainfallepisodes (number of slots of time with rainfall separatedby at least 1 h without rainfall) are convective andprovide 36.5% of the total annual precipitation (not allthe precipitation of a convective episode need have anintensity above 35 mm/h). The largest number of eventsoccurs in autumn, with mean seasonal value of 12episodes; nevertheless the largest percentage of the totaloccurs in August, with just over 18%. In March, thepercentage of events falls to 1.8%. 3.8% of the rainfallepisodes belong to slightly convective episodes, 2.9% tomoderately convective episodes and 1.3% to veryconvective episodes. As is shown in Table 3, it can benoted that the very convective episodes last less than1 h, while the slightly convective ones last longer thanthe time threshold. Convection remains predominantwhen the duration of the episode is less than 70 min. Theduration of the moderately convective episodesincreases throughout the year from winter to autumn,when they can last some 5 h.
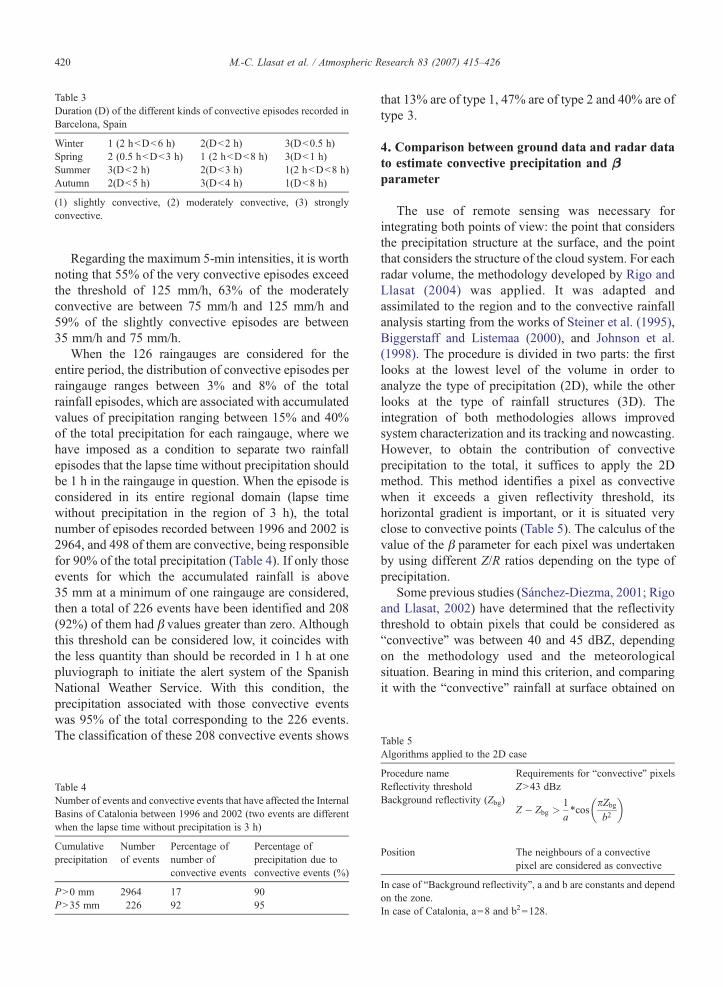
Table 5
Table 3Duration (D) of the different kinds of convective episodes recorded inBarcelona, Spain
Winter 1 (2 h<D<6 h) 2(D<2 h) 3(D<0.5 h)Spring 2 (0.5 h<D<3 h) 1 (2 h<D<8 h) 3(D<1 h)Summer 3(D<2 h) 2(D<3 h) 1(2 h<D<8 h)Autumn 2(D<5 h) 3(D<4 h) 1(D<8 h)
(1) slightly convective, (2) moderately convective, (3) stronglyconvective.
420 M.-C. Llasat et al. / Atmospheric Research 83 (2007) 415–426
Regarding the maximum 5-min intensities, it is worthnoting that 55% of the very convective episodes exceedthe threshold of 125 mm/h, 63% of the moderatelyconvective are between 75 mm/h and 125 mm/h and59% of the slightly convective episodes are between35 mm/h and 75 mm/h.
When the 126 raingauges are considered for theentire period, the distribution of convective episodes perraingauge ranges between 3% and 8% of the totalrainfall episodes, which are associated with accumulatedvalues of precipitation ranging between 15% and 40%of the total precipitation for each raingauge, where wehave imposed as a condition to separate two rainfallepisodes that the lapse time without precipitation shouldbe 1 h in the raingauge in question. When the episode isconsidered in its entire regional domain (lapse timewithout precipitation in the region of 3 h), the totalnumber of episodes recorded between 1996 and 2002 is2964, and 498 of them are convective, being responsiblefor 90% of the total precipitation (Table 4). If only thoseevents for which the accumulated rainfall is above35 mm at a minimum of one raingauge are considered,then a total of 226 events have been identified and 208(92%) of them had β values greater than zero. Althoughthis threshold can be considered low, it coincides withthe less quantity than should be recorded in 1 h at onepluviograph to initiate the alert system of the SpanishNational Weather Service. With this condition, theprecipitation associated with those convective eventswas 95% of the total corresponding to the 226 events.The classification of these 208 convective events shows
Table 4Number of events and convective events that have affected the InternalBasins of Catalonia between 1996 and 2002 (two events are differentwhen the lapse time without precipitation is 3 h)
Cumulativeprecipitation
Numberof events
Percentage ofnumber ofconvective events
Percentage ofprecipitation due toconvective events (%)
P>0 mm 2964 17 90P>35 mm 226 92 95
that 13% are of type 1, 47% are of type 2 and 40% are oftype 3.
4. Comparison between ground data and radar datato estimate convective precipitation and βparameter
The use of remote sensing was necessary forintegrating both points of view: the point that considersthe precipitation structure at the surface, and the pointthat considers the structure of the cloud system. For eachradar volume, the methodology developed by Rigo andLlasat (2004) was applied. It was adapted andassimilated to the region and to the convective rainfallanalysis starting from the works of Steiner et al. (1995),Biggerstaff and Listemaa (2000), and Johnson et al.(1998). The procedure is divided in two parts: the firstlooks at the lowest level of the volume in order toanalyze the type of precipitation (2D), while the otherlooks at the type of rainfall structures (3D). Theintegration of both methodologies allows improvedsystem characterization and its tracking and nowcasting.However, to obtain the contribution of convectiveprecipitation to the total, it suffices to apply the 2Dmethod. This method identifies a pixel as convectivewhen it exceeds a given reflectivity threshold, itshorizontal gradient is important, or it is situated veryclose to convective points (Table 5). The calculus of thevalue of the β parameter for each pixel was undertakenby using different Z/R ratios depending on the type ofprecipitation.
Some previous studies (Sánchez-Diezma, 2001; Rigoand Llasat, 2002) have determined that the reflectivitythreshold to obtain pixels that could be considered as“convective” was between 40 and 45 dBZ, dependingon the methodology used and the meteorologicalsituation. Bearing in mind this criterion, and comparingit with the “convective” rainfall at surface obtained on
Algorithms applied to the 2D case
Procedure name Requirements for “convective” pixelsReflectivity threshold Z>43 dBzBackground reflectivity (Zbg)
Z � Zbg >1aTcos
pZbgb2
� �
Position The neighbours of a convectivepixel are considered as convective
In case of “Background reflectivity”, a and b are constants and dependon the zone.In case of Catalonia, a=8 and b2=128.
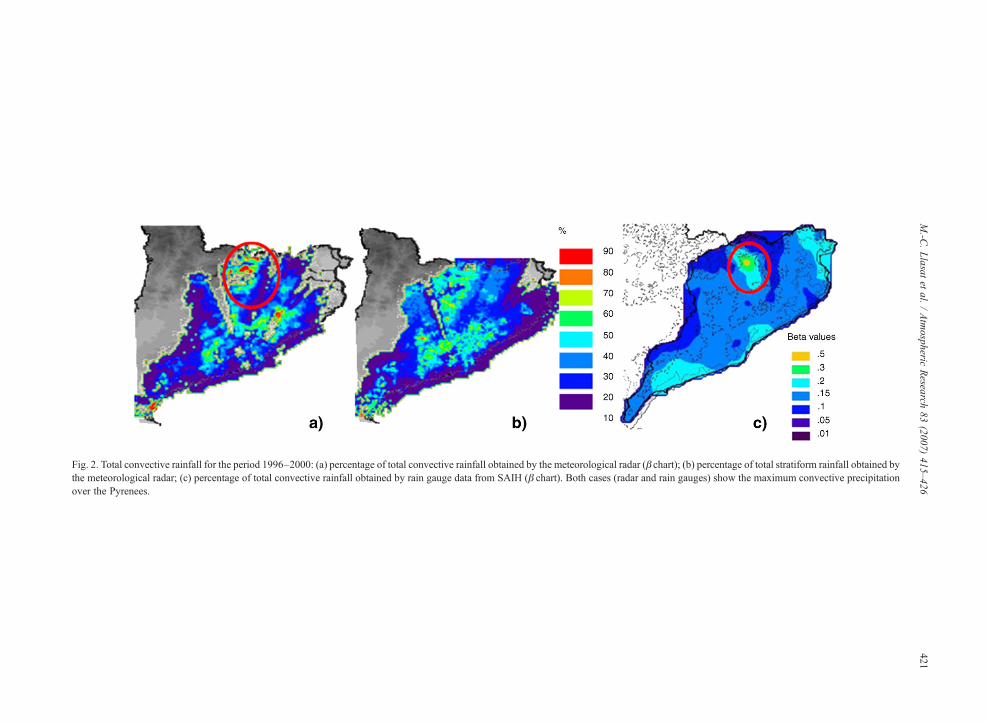
Fig. 2. Total convective rainfall for the period 1996–2000: (a) percentage of total convective rainfall obtained by the meteorological radar (β chart); (b) percentage of total stratiform rainfall obtained bythe meteorological radar; (c) percentage of total convective rainfall obtained by rain gauge data from SAIH (β chart). Both cases (radar and rain gauges) show the maximum convective precipitationover the Pyrenees.
421M.-C
.Llasat
etal.
/Atmospheric
Research
83(2007)
415–426
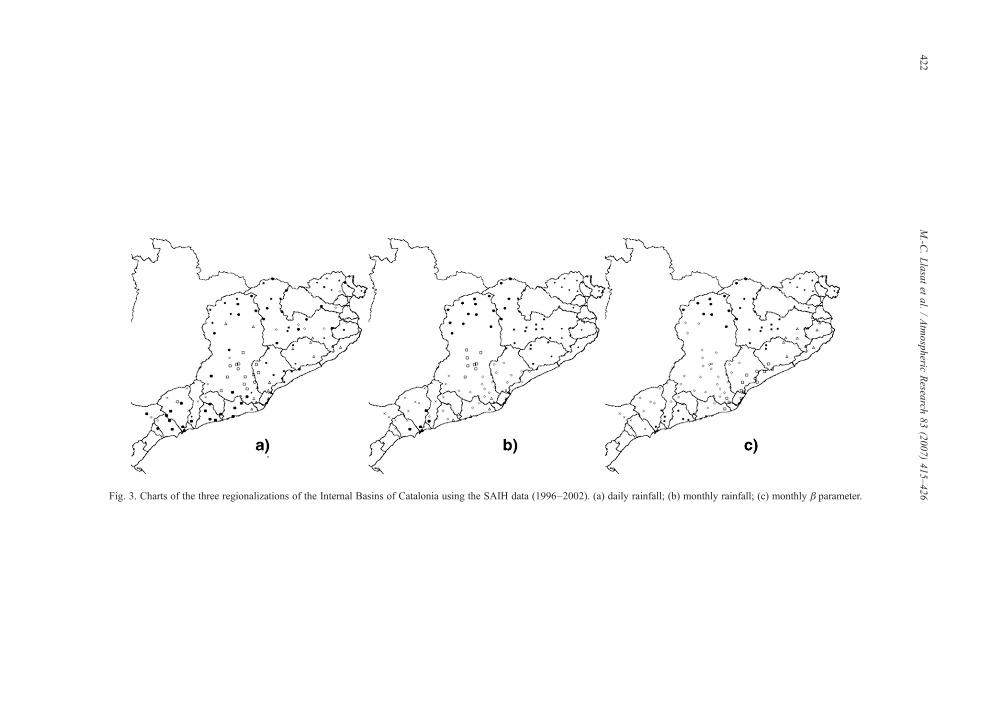
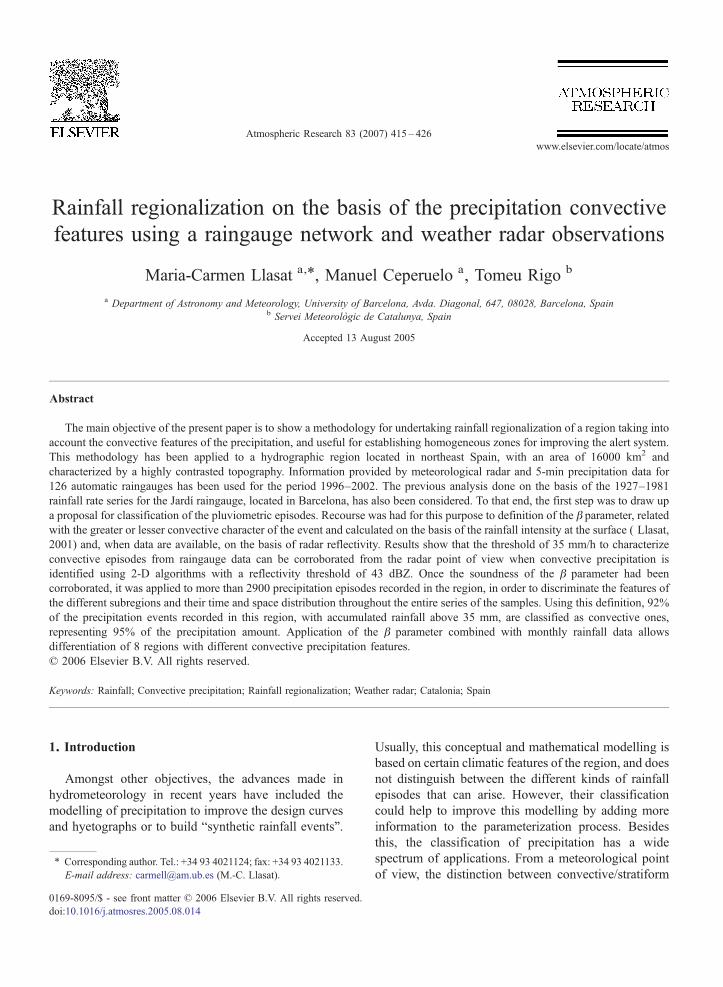
Fig. 3. Charts of the three regionalizations of the Internal Basins of Catalonia using the SAIH data (1996–2002). (a) daily rainfall; (b) monthly rainfall; (c) monthly β parameter.
422M.-C
.Llasat
etal.
/Atmospheric
Research
83(2007)
415–426
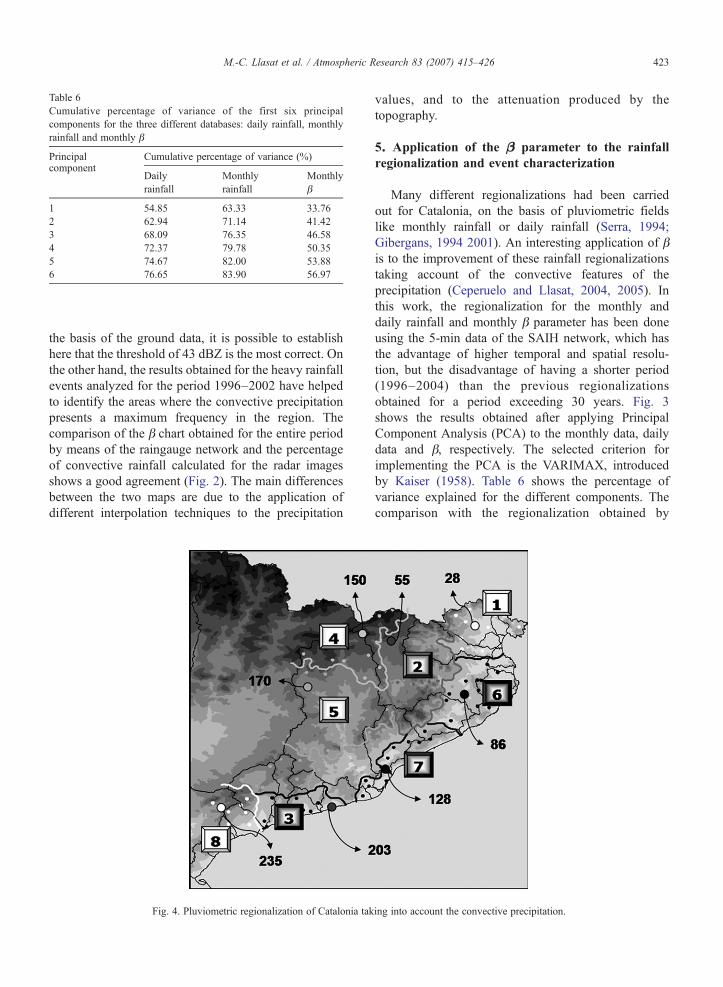
Table 6Cumulative percentage of variance of the first six principalcomponents for the three different databases: daily rainfall, monthlyrainfall and monthly β
Principal Cumulative percentage of variance (%)component
Dailyrainfall
Monthlyrainfall
Monthlyβ
1 54.85 63.33 33.762 62.94 71.14 41.423 68.09 76.35 46.584 72.37 79.78 50.355 74.67 82.00 53.886 76.65 83.90 56.97
423M.-C. Llasat et al. / Atmospheric Research 83 (2007) 415–426
the basis of the ground data, it is possible to establishhere that the threshold of 43 dBZ is the most correct. Onthe other hand, the results obtained for the heavy rainfallevents analyzed for the period 1996–2002 have helpedto identify the areas where the convective precipitationpresents a maximum frequency in the region. Thecomparison of the β chart obtained for the entire periodby means of the raingauge network and the percentageof convective rainfall calculated for the radar imagesshows a good agreement (Fig. 2). The main differencesbetween the two maps are due to the application ofdifferent interpolation techniques to the precipitation
Fig. 4. Pluviometric regionalization of Catalonia tak
values, and to the attenuation produced by thetopography.
5. Application of the β parameter to the rainfallregionalization and event characterization
Many different regionalizations had been carriedout for Catalonia, on the basis of pluviometric fieldslike monthly rainfall or daily rainfall (Serra, 1994;Gibergans, 1994 2001). An interesting application of βis to the improvement of these rainfall regionalizationstaking account of the convective features of theprecipitation (Ceperuelo and Llasat, 2004, 2005). Inthis work, the regionalization for the monthly anddaily rainfall and monthly β parameter has been doneusing the 5-min data of the SAIH network, which hasthe advantage of higher temporal and spatial resolu-tion, but the disadvantage of having a shorter period(1996–2004) than the previous regionalizationsobtained for a period exceeding 30 years. Fig. 3shows the results obtained after applying PrincipalComponent Analysis (PCA) to the monthly data, dailydata and β, respectively. The selected criterion forimplementing the PCA is the VARIMAX, introducedby Kaiser (1958). Table 6 shows the percentage ofvariance explained for the different components. Thecomparison with the regionalization obtained by
ing into account the convective precipitation.
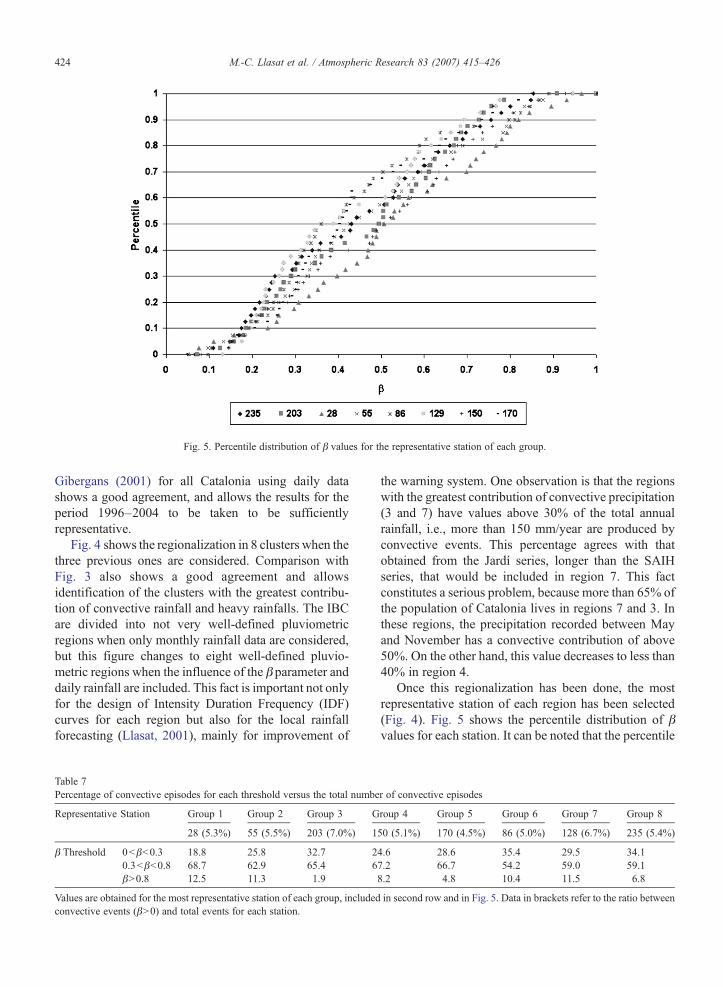
Fig. 5. Percentile distribution of β values for the representative station of each group.
424 M.-C. Llasat et al. / Atmospheric Research 83 (2007) 415–426
Gibergans (2001) for all Catalonia using daily datashows a good agreement, and allows the results for theperiod 1996–2004 to be taken to be sufficientlyrepresentative.
Fig. 4 shows the regionalization in 8 clusters when thethree previous ones are considered. Comparison withFig. 3 also shows a good agreement and allowsidentification of the clusters with the greatest contribu-tion of convective rainfall and heavy rainfalls. The IBCare divided into not very well-defined pluviometricregions when only monthly rainfall data are considered,but this figure changes to eight well-defined pluvio-metric regions when the influence of the β parameter anddaily rainfall are included. This fact is important not onlyfor the design of Intensity Duration Frequency (IDF)curves for each region but also for the local rainfallforecasting (Llasat, 2001), mainly for improvement of
Table 7Percentage of convective episodes for each threshold versus the total numbe
Representative Station Group 1 Group 2 Group 3 G
28 (5.3%) 55 (5.5%) 203 (7.0%) 1
β Threshold 0<β<0.3 18.8 25.8 32.7 20.3<β<0.8 68.7 62.9 65.4 6β>0.8 12.5 11.3 1.9
Values are obtained for the most representative station of each group, includedconvective events (β>0) and total events for each station.
the warning system. One observation is that the regionswith the greatest contribution of convective precipitation(3 and 7) have values above 30% of the total annualrainfall, i.e., more than 150 mm/year are produced byconvective events. This percentage agrees with thatobtained from the Jardí series, longer than the SAIHseries, that would be included in region 7. This factconstitutes a serious problem, because more than 65% ofthe population of Catalonia lives in regions 7 and 3. Inthese regions, the precipitation recorded between Mayand November has a convective contribution of above50%. On the other hand, this value decreases to less than40% in region 4.
Once this regionalization has been done, the mostrepresentative station of each region has been selected(Fig. 4). Fig. 5 shows the percentile distribution of βvalues for each station. It can be noted that the percentile
r of convective episodes
roup 4 Group 5 Group 6 Group 7 Group 8
50 (5.1%) 170 (4.5%) 86 (5.0%) 128 (6.7%) 235 (5.4%)
4.6 28.6 35.4 29.5 34.17.2 66.7 54.2 59.0 59.18.2 4.8 10.4 11.5 6.8
in second row and in Fig. 5. Data in brackets refer to the ratio between
425M.-C. Llasat et al. / Atmospheric Research 83 (2007) 415–426
distribution shows that 30% of them have values lowerthan 0.25, while a percentage ranging between 6% and21% has values above 0.75. Region 1 shows the highestcontribution of episodes with a high degree ofconvective precipitation, while in region 5 more than75% of the convective events have a convectivecontribution of between 25% and 75%.
The distribution between the different types ofepisodes per raingauge shows that between 0.2% and3% of the total are slightly convective (1–18% of annualprecipitation), while the moderate convective ones havevalues between 1.5% and 6% (6–30% of annualprecipitation), being concentrated in the Central Coast(region 7). Type 3 constitutes 0.5% of total episodes, butin some regions represents more than 5% of the totalrainfall. The results are clearer when they relate to therepresentative station of each region (the one that has thenearest values to the average values of the cluster), as isshown in Table 7.
6. Conclusions
This paper has centred on obtaining an objectivemethod of classification of rainfall episodes on the basisof raingauge data and its application to obtaininghomogenous zones, taking into account their convectivefeatures. Two sources of rainfall data at surface havebeen considered in order to compare a long but localseries (Jardí series) with a short but extensive series(SAIH series). After considering the antecedents in thisfield, the parameter β has been introduced and the use ofthe term “convective” has been proposed for all thoseepisodes in which β is greater than zero, drawing up aclassification of the rainfall events in the light of theirgreater or lesser convective character. In order toguarantee the β parameter validity, convective eventsand their space distribution have been compared withweather radar information. The comparison between theβ fields obtained from the SAIH data with thoseobtained from the meteorological radar have determinedthat the reflectivity threshold to obtain pixels that couldbe considered as “convective” is close to 43 dBZ.
Comparison of the values obtained for the longestseries with those obtained for the 126 raingauges over theperiod 1996–2002, corroborates the soundness of thelatter. The spatial distribution shows that the percentageof convective episodes versus the total number ofepisodes recorded in the various zones of the InternalBasins of Catalonia ranges between 3% and 9%, and isresponsible for a rainfall contribution of between 10%and 40%. The largest number of events occurs in summerand autumn. The distribution between the different types
of episodes per raingauge shows that between 0.2% and3% of the total are of slightly convective (type 1), givingrise in some cases to 18% of annual precipitation, whilethe moderate convective ones (type 2) have valuesbetween 1.5% and 6% and can be responsible for asmuch as 30% of annual precipitation, which isconcentrated on the Central Coast (region 7). Type 3(strongly convective) constitutes 0.5% of total episodes,but in some regions represents more than 5% of the totalrainfall. If we consider all the moderate or heavy rainfallevents (more than 35 mm are recorded at any point) thataffect the region, 92% of those events are convective,with a distribution of 13% of type 1.47% of type 2 and40% of type 3.
The application of the β parameter to carry out aregionalization of the Internal Basins of Catalonia, incombination with daily rainfall data, allows eight sub-regions to be identified in which the features of theconvective contribution to total precipitation are con-siderably different. The region with the highestcontribution of very convective events is situated inthe North, with more than 20% of the convectiveepisodes, while region 3 records less than 6% of thiskind. The β parameter has been revealed to be a goodindicator of convective activity, both from a meteoro-logical and a climatological point of view. It can be usedto substitute radar information when not available, or tocomplete it, in order to identify convective rainfall. Theβ parameter improves the regionalization procedure onthe basis of the convective rainfall features, which canhelp to improve the criteria used in the alert chain, whichat present over the entire the region.
Acknowledgements
We would like to thank the Royal Academy ofSciences and Arts of Barcelona for providing us with therainfall intensity data of the Jardí raingauge, the AgenciaCatalana de l'Aigua de la Generalitat de Catalunya, forthe SAIH data, and the Instituto Nacional de Meteor-ología for the radar data. This work has been sponsoredby the MONEGRO (REN 2003-09617-C02-02) Spanishproject, and the AMPHORE (Interreg IIIB Medocc2003-03-4.3-I-079) European project. Our thanks to T.Barrera for his kind collaboration and to T. Molloy forundertaking the language revision of this paper.
References
Anagnostou, E., 2004. A convective/stratiform precipitation classifi-cation algorithm for volume scanning weather radar observations.Meteorological Applications 11 (4), 291–300.
426 M.-C. Llasat et al. / Atmospheric Research 83 (2007) 415–426
Biggerstaff, M.I., Listemaa, S.A., 2000. An Improved Scheme forConvective/Stratiform Echo Classification Using Radar Reflectiv-ity. Journal of Applied Meteorology 39 (12), 2129–2150.
Ceperuelo, M., 2004. Diseño de una herramienta para el tratamientode la lluvia 5-minutal en las Cuencas Internas de Catalunya.Aplicación al estudio de la distribución espacial de laprecipitación convectiva. Bachelor in Meteorology. InternalPublication.
Ceperuelo, M., Llasat, M.C., 2004. La Precipitación Convectiva en lasCuencas Internas de Catalunya. Revista del Aficionado a laMeteorologia 23.
Ceperuelo, M., Llasat, M.C., 2005. Regionalización Pluviométrica delas Cuencas Internas de Cataluña en función de la precipitaciónconvectiva. Revista del Aficionado a la Meteorologia 27.
Collier, C., 1989. Applications of Weather Radar Systems. EllisHorwood, London.
Doswell III, C.A., 1993. Flash-flood producing convective storms:current understanding and research. In: Corominas, J., Georgaka-kos, K.P. (Eds.), Proc. US-Spain Workshop on Natural Hazards,pp. 97–107. Barcelona, 8–11 June.
Doswell III, C.A., Brooks, H.E., Maddox, R.A., 1996. Flash floodforecasting: an ingredients based methodology. Weather andForecasting 11, 560–581.
Dutton, E.J., Dougherty, H.T., 1979. Year-to-year variability of rainfallfor microwave applications in the U.S.A. IEEE Transactions onCommunication COM-27 5, 829–832.
Fritsch, J.M., Kane, R.J., Chelius, C.R., 1986. The contribution ofmesoscale convective weather systems to the warm-seasonprecipitation in the United States. Journal of Climate and AppliedMeteorology 25, 1333–1345.
Gibergans, J., 1994. Aproximación a una tipología de lluvias extremas:Análisis de las precipitaciones superiores a 100 mm en 24 h. PhDthesis. Universitat de Barcelona.
Gibergans, J., 2001. Aplicación de métodos hidrometeorológicos parala predicción de la precipitación diaria. PhD thesis. Universidad deBarcelona.
Hand, W.H., 1996. An object-oriented technique for nowcasting heavyshowers and thunderstorms. Meteorological Applications 3,31–41.
Houghton, H.G., 1950. A preliminary quantitative analysis ofprecipitation mechanisms. Journal of Meteorology 7, 363–369.
Houze Jr., R.A., 1993. Cloud Dynamics. Academic Press.Houze Jr., R.A., 1997. Stratiform Precipitation in regions of
Convection: A Meteorological Paradox? Bulletin of the AmericanMeteorological Society 78 (10), 2179–2196.
Huschke, R.E., 1959. Glossary of Meteorology. American Meteoro-logical Society.
Johnson, J.Y., MacKeen, P.L., Witt, A., Mitchell, E.D., Stumpf, G.J.,Eilts, M.D., Thomas, K.W., 1998. The Storm Cell Identificationand Tracking (SCIT) Algorithm: An Enhanced WSR-88DAlgorithm. Weather and Forecasting 13, 263–276 (June 1998).
Kaiser, H.F., 1958. The varimax criterion for analytic rotation in factoranalysis. Psychometrika 23, 187–200.
Llasat, M.C., 2001. An objective classification of rainfall events on thebasis of their convective features. Application to rainfall intensityin the North-East of Spain. International Journal of Climatology21, 1385–1400.
Llasat, M.C., 2004. La vulnérabilité en Catalogne et la perceptionsociale. La Houille Blanche 6, 71–75.
Llasat, M.C., in press. The Physical Geography of the MediterraneanBasin. Chapter 24: High Magnitude Storms and Floods. OxfordUniversity Press.
Llasat, M.C., Puigcerver, M., 1985. Un intento de aplicación a laPeninsula Ibérica de un modelo empirico de precipitación. Revistade Geofísica 41, 135–144.
Llasat, M.C., Puigcerver, M., 1997. Total rainfall and convectiverainfall in Catalonia, Spain. International Journal of Climatology17, 1683–1695.
Llasat, M.C., Barriendos, M., Rigo, Barrera, A., 2005. Floods inCatalonia (NE Spain) since the 14th Century. Climatological andmeteorological aspects from historical documentary sources andold instrumental records. Journal of Hydrology 1–16.
Maddox, R.A., Howard, K.W., Bartels, D.L., Rodgers, D.M., 1986.Mesoscale convective complexes in the middle latitudes. In: Ray,P.S. (Ed.), Mesoscale Meteorology and Forecasting. AmericanMeteorological Society, pp. 390–413.
Marshall, J.S., Palmer, W.M., 1948. The distribution of raindrops withsize. Journal of Meteorology 5, 156–166.
Martín, F., Carretero, O., Castro, P., Riosalido, R., 1998. SistemasConvectivos de Mesoescala-97. Caracterización a partir de lasimágenes de satélite. Technical Note of STAP 28, Spanish WeatherService. May 1998.
Miller, D., Fritsch, J.M., 1991. Mesoscale convective complexes in theWestern Pacific region.MonthlyWeather Review 119, 2978–2992.
Rigo, T., Llasat, M.C., 2002. Analysis of Convective Structures thatProduce Heavy Rainfall Events in Catalonia (NE of Spain) usingMeteorological Radar. In: Proceedings of Second EuropeanConference on Radar Meteorology (ERAD), Delft, NetherlandsNovember 18-22, pp. 45–48.
Rigo, T., Llasat, M.C., 2004. A methodology for the classification ofconvective structures using meteorological radar: application toheavy rainfall events on the Mediterranean coast of the IberianPeninsula. Natural Hazards and Earth System Science 4, 59–68.
Sánchez-Diezma, R., 2001. Optimización de la medida de lluvia porradar meteorológico para su aplicación hidrológica. PhD thesis.Universitat Politecnica de Catalunya.
Sánchez, J.L., Vega, A., Castro, A., de la Fuente, M.T., Fraile, R.,1992. Classification of convective clouds. In: Proceedings of 9thMeteosat Scientific Users Meeting. Locarno (Switzerland).EUMETSAT & SMA, pp. 147–154.
Sánchez, J.L., Fernández, M.V., Fernández, J.T., Tudurí, E., Ramis, C.,2003. Analysis of mesoscale convective systems with hailprecipitation. Atmospheric Research 67–68, 573–588.
Serra, C., 1994. Análisis en componentes principales y algoritmos declasificación automática: aplicación al estudio del comportamientode la precipitación en Catalunya y a la obtención local de tipos detiempo. PhD thesis. Universidad de Barcelona.
Steiner, M., Houze Jr., R.A., Yutter, S.E., 1995. Climatologicalcharacterization of three- dimensional storm structure fromoperational radar and raingauge data. Journal of AppliedMeteorology 34 (9), 1978–2007.
Vilar, E., Burgueño, A., 1991. Analysis and modelling of time intervalsbetween rain rate exceedances in the context of fade dynamics.IEEE Transactions on Communications 39 (9), 1306–1312.
Watson, P.A., Gunes, M., Potter, B.A., Sathiaseelan, V., Leitas, D.J.(1982). Development of a climatic map of rainfall attenuation forEurope. Final Rept. Europ. Space Agency, ESTEC CONTR. no.4162/79/NL. Postgrad. School Electr. Electron. Eng., Univ.Bradford, U.K.
Wilson, J.W., Crook, N.A., Mueller, C.K., Sun, J., Dixon, M., 1998.Nowcasting Thunderstorms: A Status Report. Bulletin of theAmerican Meteorological Society 79, 2079–2099.