Raichur District Human Development Report 2014 Raichur ...
346
Raichur District Human Development Report 2014 Raichur District Human Development Report 2014 Zilla Panchayat Raichur and Planning, Programme Monitoring and Statistics Department Government of Karnataka
-
Upload
khangminh22 -
Category
Documents
-
view
5 -
download
0
Transcript of Raichur District Human Development Report 2014 Raichur ...
Raichur DistrictHuman Development Report 2014
Raichur D
istrictH
uman D
evelopment R
eport 2014
Zilla Panchayat Raichurand
Planning, Programme Monitoring and Statistics Department
Government of Karnataka
Zilla Panchayat Raichurand
Planning, Programme Monitoring and
Statistics Department
Government of Karnataka
ii
Raichur District Human Development Report 2014
Copyright� : � Planning, Programme Monitoring and Statistics �� � � � Department, Government of Karnataka
Published by� : � Zilla Panchayat, Raichur Government of Karnataka
First Published� : � 2015� � All rights reserved. No part of this publication may be �� � � reproduced, stored or transmitted in any form by any �� � � means without the prior permission by Zilla Panchayat Raichur and Planning, Programme Monitoring and Statistics Department, Government of Karnataka
Printed by : M/s Swami Enterprises, MPL No.10-3-14, Makthal peth, Raichur Cell : 9739752485
� � While every care has been taken to reproduce the � � accurate data, oversights/errors may occur. If found � � convey it to the CEO, Zilla Panchayat Raichur and Planning, Programme Monitoring and Statistics Department, Government of Karnataka.
iii
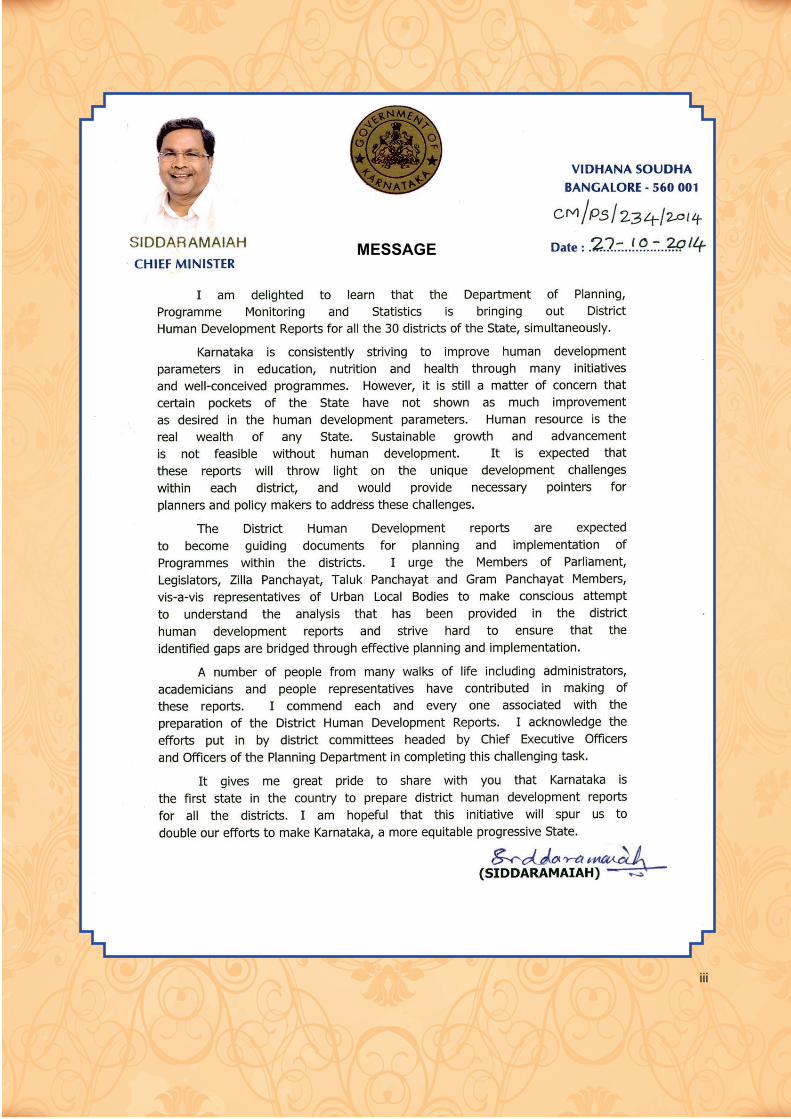
MESSAGE
iv
MESSAGE
Message
The quest for an appropriate approach to development continues even today. The concept of
human development revolutionalized the thinking on development and has become the catch-word in all
countries and regions. HD champions the creation of an enabling environment for people to enjoy long,
healthy, and creative lives. The concept of human development focuses on the actual well-being of the
people in terms of indicators like education, health-life expectancy income and gender equity. The
Millennium Development Goals have reiterated the importance of putting people at the centre stage. The
national and state level HDRs published in India have adopted a similar framework and analyzed the
development achievements and gaps in aspects that touch human lives.
Karnataka state has been in the forefront of preparing such reports and plans. In the last decade,
apart from two state level HDRs, district level HDRs were prepared for Bijapur, Gulbarga, Mysore and
Udupi districts which helped in strengthening their development plans. Now, the government has pushed
this activity deeper and is attempting to measure human development at the taluk levels. A uniform
methodology and format is adopted for better comparability and effectiveness. The exercise involves the
preparation of indices relating to gender inequality, child development, food security, urban development
and comprehensive taluk development.
The Raichur District HDR deals with various important sectors like education, health, women and
child development, status of SCs and STs, urban development, governance, etc., relating to Raichur
district. The present status of the sectors, problems and probable solutions are discussed under various
chapters. A considerable amount of data and information have been generated and inferences drawn. The
secondary data is supplemented through four small area studies and a pilot survey on dalit development.
The report is a product of an interactive process involving stakeholders such as local bodies,
NGOs, academia, various departments of the Zilla Panchayat and others. I congratulate all those who were
involved in this exercise under the leadership of Mr. Shri T.Gnanaprakash, Dr. Muddu Mohan and Shri S.N.
Nagaraju, the previous CEOs, and Smt. Vijaya Jyothsna, the present CEO. I also congratulate
Prof.S.T.Bagalkoti of Karnatak University, Dharwad, the Lead Agency for preparation of this Report. As a
useful reference in development planning, this Report is especially dedicated to the local governments and
their leaders to assist them in reviewing policies and interventions to maximize their efciency in
accordance to geographical uniqueness. I hope the report will generate further discussions and would help
in improving the quality of life of the people in Raichur district of the state of Karnataka.
v
Dr.Sharanaprakash R. PatilMinister of State for Medical Education
Government of Karnataka and Raichur District In-Charge Minister
3-3-2015
vi
3-3-2015
vii
3-3-2015
viii
Lead Agency
ix
Acknowledgements
The report is a collective effort of many agencies, officials and individuals. It is with their
support and co-operation that the report has taken shape. I take this opportunity to
thank profusely all of them for complementing my efforts.
At the outset, I thank the Planning Department of the Government of Karnataka, Shri
Sanjiv Kumar, the former Principal Secretary; Smt. Anita Kaul, I.A.S., former Additional
Chief Secretary; and V. Manjula, I.A.S., the present Principal Secretary, Planning,
Programme Monitoring and Statistics Department for giving the dynamic leadership to
the whole process. Sri.Rajiv Ranjan, I.F.S., Secretary, Planning, Programme monitoring
and Statistics Department also guided the work. However, a major credit should go to
Dr.Shashidhar, the State Level Consultant and Co-ordinator for preparation of DHDRs.
He left no stone unturned. Right from arranging general and technical trainings;
sharing vast amount of data; providing regular guidelines and instructions; monitoring
the progress and reminding about various phases and deadlines; he kept the clock
ticking and is mostly responsible for realization of this ambitious project of the
Government. My gratitude to all these authorities is beyond words. UNDP and Planning
Commission of India supported the preparation of the DHDR, under their project
'Human Development: Towards Bridging inequalities'. Their support is profusely
acknowledged.
Dr.Sharanaprakash R. Patil, Hon'ble Minister of State for Medical Education and
District-in-charge Minister, evinced keen interest in the preparation of the Report. Shri
B.V.Nayak (MP, Raichur) and Shri Karadi Sanganna (MP, Koppal); and the legislators of
the district, Dr.Shivaraj Patil (MLA); Shri Hampayya Sahukar (MLA); Shri M.Venkatesh
Nayak (MLA); Shri Hampanagouda Badarli (MLA); Shri Manappa D. Vajjal (MLA); Shri
Pratapgouda Patil (MLA); Shri Sharanappa Mattur (MLC); Shri N.S.Bosaraju (MLC) and
Shri Amarnath Patil (MLC) have provided the necessary guidance in preparation of the
Report. They are keenly interested in the outcome and policy implications of the report. I
thank them for their involvement and their contribution to the report.
3-3-2015
The President of Raichur Zilla Panchayat, Smt.Sarojamma Basavaraj; Vice President
Shri Jaffer Ali Patel and Members were ready for interaction in different forums and
extended complete support in collection of data and finalization of the report. They
offered useful suggestions during the workshops and meetings and that helped the
report to be rooted to the ground level. My sincere thanks are to them also. I similarly
thank all the presidents, vice-presidents and members of all taluk and gram panchyats
who provided useful insights about local problems and helped in preparation of the
report. In the same manner I heartily thank all the elected representatives of all urban
local bodies in Raichur District for their support.
My deepest gratitude is to all the former CEOs of Raichur ZP Shri T.Gnanaprakash, Dr.
Muddu Mohan and Shri S.N. Nagaraju, who were involved in various stages of this report
preparation. As the Chairpersons of the District Core Committee they were instrumental
in calling for data and validating it; and at my every call were available for consultation.
They were very enthusiastic about the results and provided a solid support to the
activity. The present CEO and Smt. Vijaya Jyothsna, I.A.S., is also equally co-operative
and enthusiastic about the report. I thank all of them whole heartedly.
The members of the Core Committee participated in the whole process of collecting
and validating data, conducting taluk and district level workshops, finalizing the
topics and sites for small area studies and in meticulously going through the draft
report. They were the ones on whom I relied upon for much of the basic information.
I thank them profusely.
The Chief Planning Officer (CPO) has been the pivot around whom all the process
revolved. But for the co-operation and involvement of Dr.T.Roni, the CPO, the Report
would not have seen the light of the day. It is his active persuasion of officials which
resulted in finalization of the draft report. I am deeply indebted to him.
The member of the Quality Monitoring Group (QMG), Dr. T.R.Chandrashekhar,
Professor (Retd), Department of Development Studies, Kannada Vishwavidyala, Hampi
was insightful in his ideas and comments about the data. Dr.R.N.Achuta, former faculty
of the Institute of Development Studies, Mysuru and currently Visiting Professor at the
Administrative Training Institute, Mysuru, peer reviewed the report and offered incisive
comments and suggestions that have made the report more relevant. I thank him for the
suggestions. Prof.T.R.Chandrashekhar provided a ready reckoner of technical terms in
Kannada and I thank him for it.
x
S.T.BagalkotiProfessor,
Dept. of EconomicsKarnatak University, Dharwad
xi
Back in the University I am highly obliged to the Honorable Vice Chancellors, Prof.
H.B.Walikar (former), Prof.S.S.Hugar (present); Registrars- Prof.S.B.Hinchigeri,
Prof.S.A.Patil, Prof.G.B.Nandana, Prof.C.S.Kanagali and Prof.M.N.Joshi - who
permitted me to undertake the task of preparation of Dharwad DHDR and allowed me to
utilize the facilities at the University. Without their willingness and inspiration, the
report would not have materialized. A special mention has to be made of Smt. Rajashree
and Prof.R.L.Hyderabad, the Finance Officers; Prof.B.M.Ratnakar, the Development
Officer; and Prof.I.M.Khazi, Director, PMEB, who were instrumental in processing for
payment and other office correspondences. I thank all of them.
The Chairman and Faculty members of the Department of Economics, especially
Prof.P.M.Honakeri, Prof.L.D.Vaikunthe, Prof.H.H.Uliveppa, Dr.R.R.Biradar,
Dr.B.H.Nagoor, Dr.H.H.Bharadi, Dr.S.B.Nari and Dr.N.S.Mugadur helped me with
their discussions and interventions at specific points. I am thankful for their co-
operation. I benefitted from interaction with the members of various subcommittees
and I am grateful to them. Dr.S.Annapurna of Karnatak Arts College, Dharwad who
assisted in translation work
Research scholars at the Department of Economics helped me in preparation of the
report. Shri Ashwath Naik, Shri Raju Talawar, Shri Suresh Banakar, Smt.
R.G.Kadapatti, Shri Ravi Naik helped in various stages of data preparation and other
research assistance. Miss Manjula Kandagal provided the office assistance. Shri
Ramanand Hegde of Krupa Computers, Dharwad took special interest in type-setting
the Report and making it ready for printing.
I must admit the suggestions and help I received from all these people have helped to
make this report immensely better than it would otherwise have been.
xii
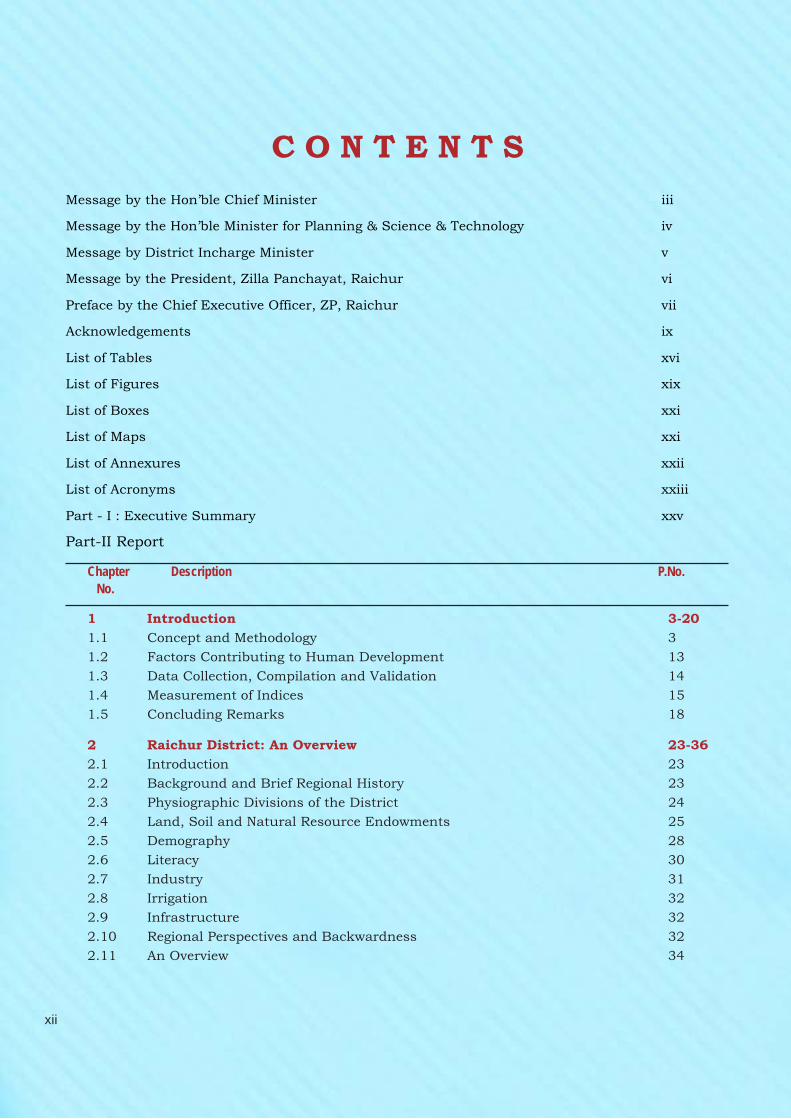
Message by the Hon’ble Chief Minister iii
Message by the Hon’ble Minister for Planning & Science & Technology iv
Message by District Incharge Minister v
Message by the President, Zilla Panchayat, Raichur vi
Preface by the Chief Executive Officer, ZP, Raichur vii
Acknowledgements ix
List of Tables xvi
List of Figures xix
List of Boxes xxi
List of Maps xxi
List of Annexures xxii
List of Acronyms xxiii
Part - I : Executive Summary xxv
Part-II Report
C O N T E N T S
Chapter Description P.No.
No.
1 Introduction 3-20
1.1 Concept and Methodology 3
1.2 Factors Contributing to Human Development 13
1.3 Data Collection, Compilation and Validation 14
1.4 Measurement of Indices 15
1.5 Concluding Remarks 18
2 Raichur District: An Overview 23-36
2.1 Introduction 23
2.2 Background and Brief Regional History 23
2.3 Physiographic Divisions of the District 24
2.4 Land, Soil and Natural Resource Endowments 25
2.5 Demography 28
2.6 Literacy 30
2.7 Industry 31
2.8 Irrigation 32
2.9 Infrastructure 32
2.10 Regional Perspectives and Backwardness 32
2.11 An Overview 34
xiiixiii
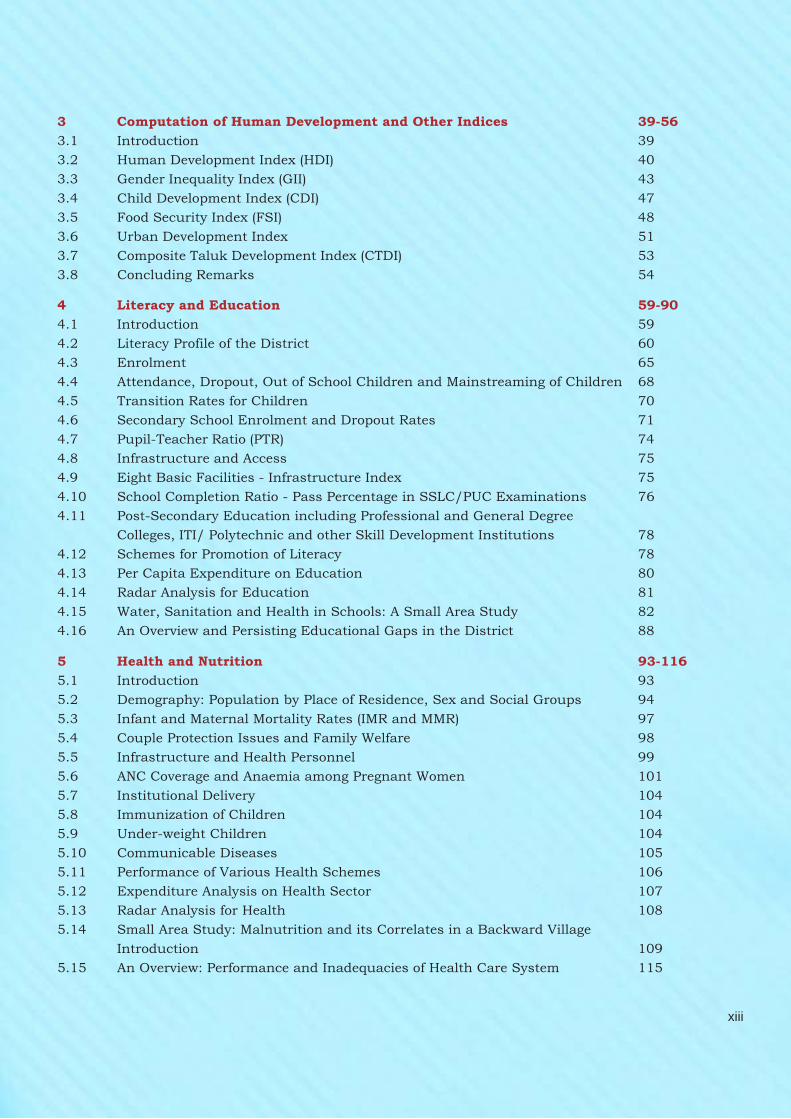
3 Computation of Human Development and Other Indices 39-56
3.1 Introduction 39
3.2 Human Development Index (HDI) 40
3.3 Gender Inequality Index (GII) 43
3.4 Child Development Index (CDI) 47
3.5 Food Security Index (FSI) 48
3.6 Urban Development Index 51
3.7 Composite Taluk Development Index (CTDI) 53
3.8 Concluding Remarks 54
4 Literacy and Education 59-90
4.1 Introduction 59
4.2 Literacy Profile of the District 60
4.3 Enrolment 65
4.4 Attendance, Dropout, Out of School Children and Mainstreaming of Children 68
4.5 Transition Rates for Children 70
4.6 Secondary School Enrolment and Dropout Rates 71
4.7 Pupil-Teacher Ratio (PTR) 74
4.8 Infrastructure and Access 75
4.9 Eight Basic Facilities - Infrastructure Index 75
4.10 School Completion Ratio - Pass Percentage in SSLC/PUC Examinations 76
4.11 Post-Secondary Education including Professional and General Degree
Colleges, ITI/ Polytechnic and other Skill Development Institutions 78
4.12 Schemes for Promotion of Literacy 78
4.13 Per Capita Expenditure on Education 80
4.14 Radar Analysis for Education 81
4.15 Water, Sanitation and Health in Schools: A Small Area Study 82
4.16 An Overview and Persisting Educational Gaps in the District 88
5 Health and Nutrition 93-116
5.1 Introduction 93
5.2 Demography: Population by Place of Residence, Sex and Social Groups 94
5.3 Infant and Maternal Mortality Rates (IMR and MMR) 97
5.4 Couple Protection Issues and Family Welfare 98
5.5 Infrastructure and Health Personnel 99
5.6 ANC Coverage and Anaemia among Pregnant Women 101
5.7 Institutional Delivery 104
5.8 Immunization of Children 104
5.9 Under-weight Children 104
5.10 Communicable Diseases 105
5.11 Performance of Various Health Schemes 106
5.12 Expenditure Analysis on Health Sector 107
5.13 Radar Analysis for Health 108
5.14 Small Area Study: Malnutrition and its Correlates in a Backward Village
Introduction 109
5.15 An Overview: Performance and Inadequacies of Health Care System 115
xiv
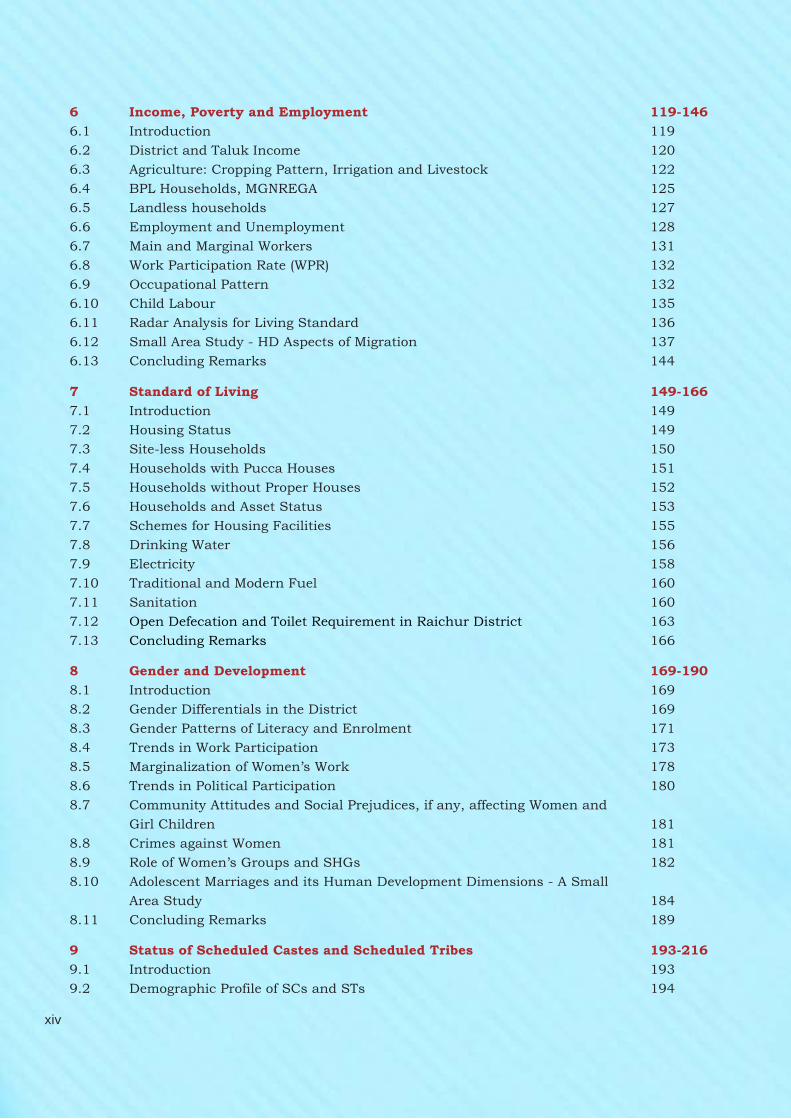
6 Income, Poverty and Employment 119-146
6.1 Introduction 119
6.2 District and Taluk Income 120
6.3 Agriculture: Cropping Pattern, Irrigation and Livestock 122
6.4 BPL Households, MGNREGA 125
6.5 Landless households 127
6.6 Employment and Unemployment 128
6.7 Main and Marginal Workers 131
6.8 Work Participation Rate (WPR) 132
6.9 Occupational Pattern 132
6.10 Child Labour 135
6.11 Radar Analysis for Living Standard 136
6.12 Small Area Study - HD Aspects of Migration 137
6.13 Concluding Remarks 144
7 Standard of Living 149-166
7.1 Introduction 149
7.2 Housing Status 149
7.3 Site-less Households 150
7.4 Households with Pucca Houses 151
7.5 Households without Proper Houses 152
7.6 Households and Asset Status 153
7.7 Schemes for Housing Facilities 155
7.8 Drinking Water 156
7.9 Electricity 158
7.10 Traditional and Modern Fuel 160
7.11 Sanitation 160
7.12 Open Defecation and Toilet Requirement in Raichur District 163
7.13 Concluding Remarks 166
8 Gender and Development 169-190
8.1 Introduction 169
8.2 Gender Differentials in the District 169
8.3 Gender Patterns of Literacy and Enrolment 171
8.4 Trends in Work Participation 173
8.5 Marginalization of Women’s Work 178
8.6 Trends in Political Participation 180
8.7 Community Attitudes and Social Prejudices, if any, affecting Women and
Girl Children 181
8.8 Crimes against Women 181
8.9 Role of Women’s Groups and SHGs 182
8.10 Adolescent Marriages and its Human Development Dimensions - A Small
Area Study 184
8.11 Concluding Remarks 189
9 Status of Scheduled Castes and Scheduled Tribes 193-216
9.1 Introduction 193
9.2 Demographic Profile of SCs and STs 194
xvxv
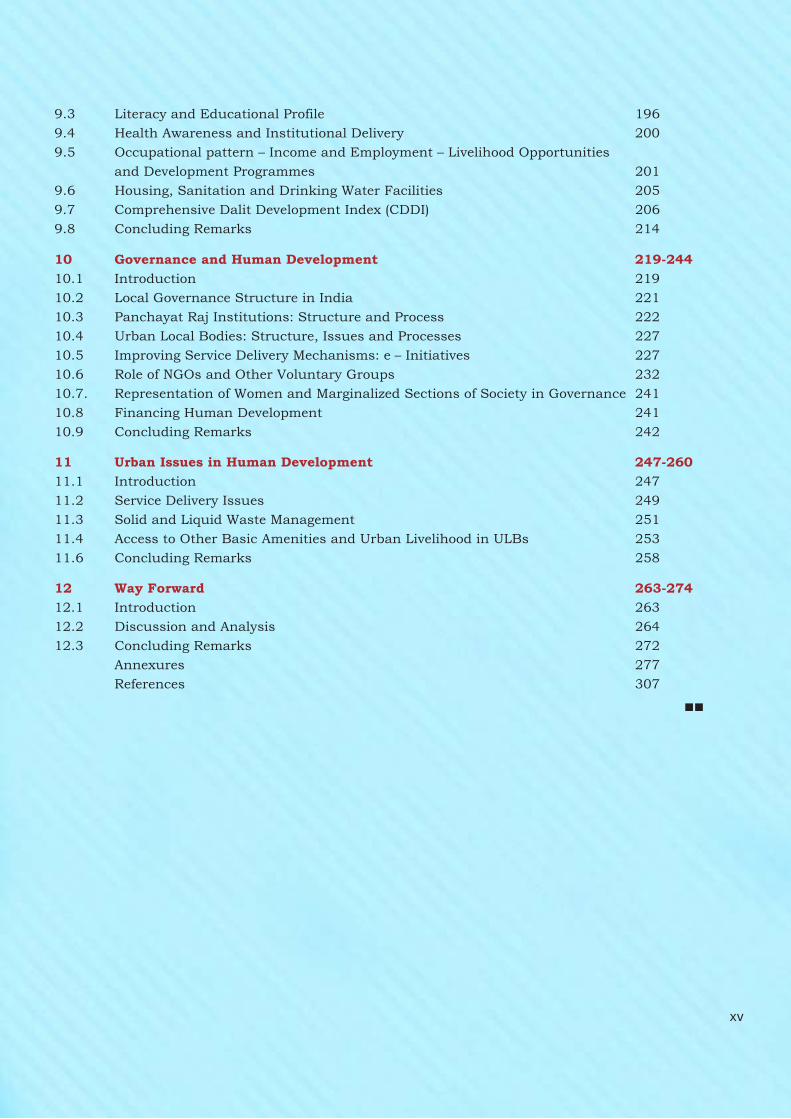
9.3 Literacy and Educational Profile 196
9.4 Health Awareness and Institutional Delivery 200
9.5 Occupational pattern – Income and Employment – Livelihood Opportunities
and Development Programmes 201
9.6 Housing, Sanitation and Drinking Water Facilities 205
9.7 Comprehensive Dalit Development Index (CDDI) 206
9.8 Concluding Remarks 214
10 Governance and Human Development 219-244
10.1 Introduction 219
10.2 Local Governance Structure in India 221
10.3 Panchayat Raj Institutions: Structure and Process 222
10.4 Urban Local Bodies: Structure, Issues and Processes 227
10.5 Improving Service Delivery Mechanisms: e – Initiatives 227
10.6 Role of NGOs and Other Voluntary Groups 232
10.7. Representation of Women and Marginalized Sections of Society in Governance 241
10.8 Financing Human Development 241
10.9 Concluding Remarks 242
11 Urban Issues in Human Development 247-260
11.1 Introduction 247
11.2 Service Delivery Issues 249
11.3 Solid and Liquid Waste Management 251
11.4 Access to Other Basic Amenities and Urban Livelihood in ULBs 253
11.6 Concluding Remarks 258
12 Way Forward 263-274
12.1 Introduction 263
12.2 Discussion and Analysis 264
12.3 Concluding Remarks 272
Annexures 277
References 307
xvi
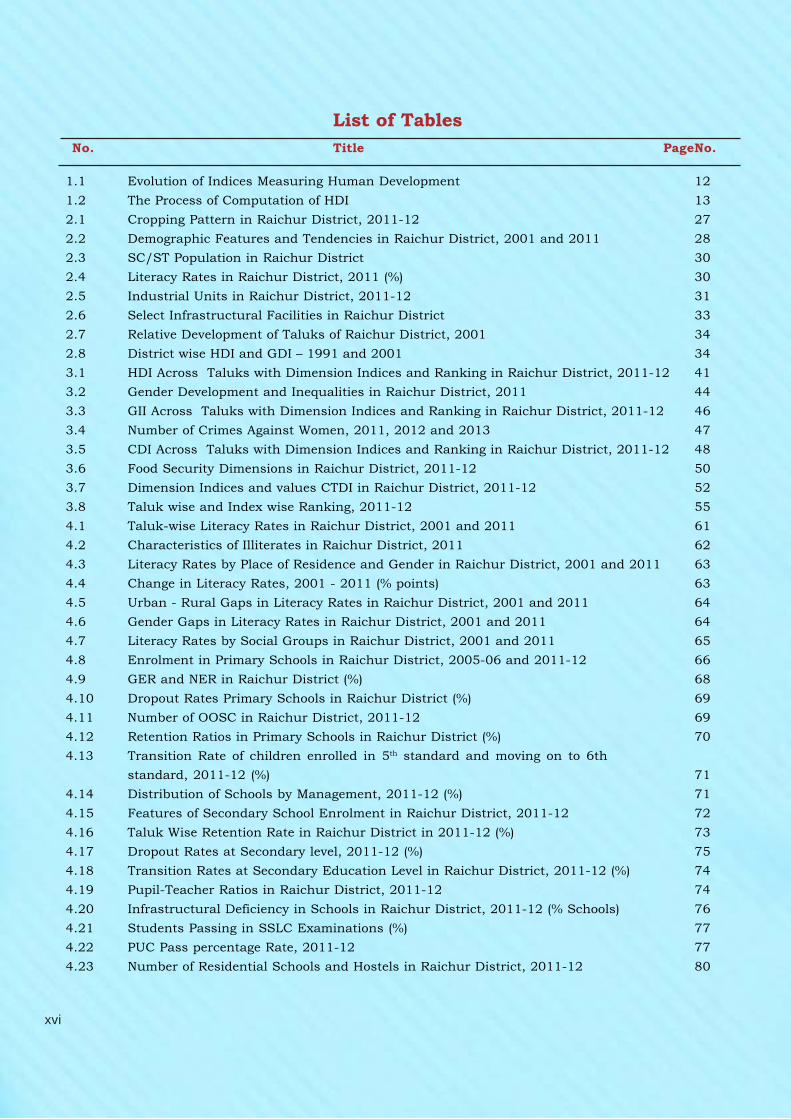
List of Tables
1.1 Evolution of Indices Measuring Human Development 12
1.2 The Process of Computation of HDI 13
2.1 Cropping Pattern in Raichur District, 2011-12 27
2.2 Demographic Features and Tendencies in Raichur District, 2001 and 2011 28
2.3 SC/ST Population in Raichur District 30
2.4 Literacy Rates in Raichur District, 2011 (%) 30
2.5 Industrial Units in Raichur District, 2011-12 31
2.6 Select Infrastructural Facilities in Raichur District 33
2.7 Relative Development of Taluks of Raichur District, 2001 34
2.8 District wise HDI and GDI – 1991 and 2001 34
3.1 HDI Across Taluks with Dimension Indices and Ranking in Raichur District, 2011-12 41
3.2 Gender Development and Inequalities in Raichur District, 2011 44
3.3 GII Across Taluks with Dimension Indices and Ranking in Raichur District, 2011-12 46
3.4 Number of Crimes Against Women, 2011, 2012 and 2013 47
3.5 CDI Across Taluks with Dimension Indices and Ranking in Raichur District, 2011-12 48
3.6 Food Security Dimensions in Raichur District, 2011-12 50
3.7 Dimension Indices and values CTDI in Raichur District, 2011-12 52
3.8 Taluk wise and Index wise Ranking, 2011-12 55
4.1 Taluk-wise Literacy Rates in Raichur District, 2001 and 2011 61
4.2 Characteristics of Illiterates in Raichur District, 2011 62
4.3 Literacy Rates by Place of Residence and Gender in Raichur District, 2001 and 2011 63
4.4 Change in Literacy Rates, 2001 - 2011 (% points) 63
4.5 Urban - Rural Gaps in Literacy Rates in Raichur District, 2001 and 2011 64
4.6 Gender Gaps in Literacy Rates in Raichur District, 2001 and 2011 64
4.7 Literacy Rates by Social Groups in Raichur District, 2001 and 2011 65
4.8 Enrolment in Primary Schools in Raichur District, 2005-06 and 2011-12 66
4.9 GER and NER in Raichur District (%) 68
4.10 Dropout Rates Primary Schools in Raichur District (%) 69
4.11 Number of OOSC in Raichur District, 2011-12 69
4.12 Retention Ratios in Primary Schools in Raichur District (%) 70
4.13 Transition Rate of children enrolled in 5th standard and moving on to 6th
standard, 2011-12 (%) 71
4.14 Distribution of Schools by Management, 2011-12 (%) 71
4.15 Features of Secondary School Enrolment in Raichur District, 2011-12 72
4.16 Taluk Wise Retention Rate in Raichur District in 2011-12 (%) 73
4.17 Dropout Rates at Secondary level, 2011-12 (%) 75
4.18 Transition Rates at Secondary Education Level in Raichur District, 2011-12 (%) 74
4.19 Pupil-Teacher Ratios in Raichur District, 2011-12 74
4.20 Infrastructural Deficiency in Schools in Raichur District, 2011-12 (% Schools) 76
4.21 Students Passing in SSLC Examinations (%) 77
4.22 PUC Pass percentage Rate, 2011-12 77
4.23 Number of Residential Schools and Hostels in Raichur District, 2011-12 80
No. Title PageNo.
xviixvii
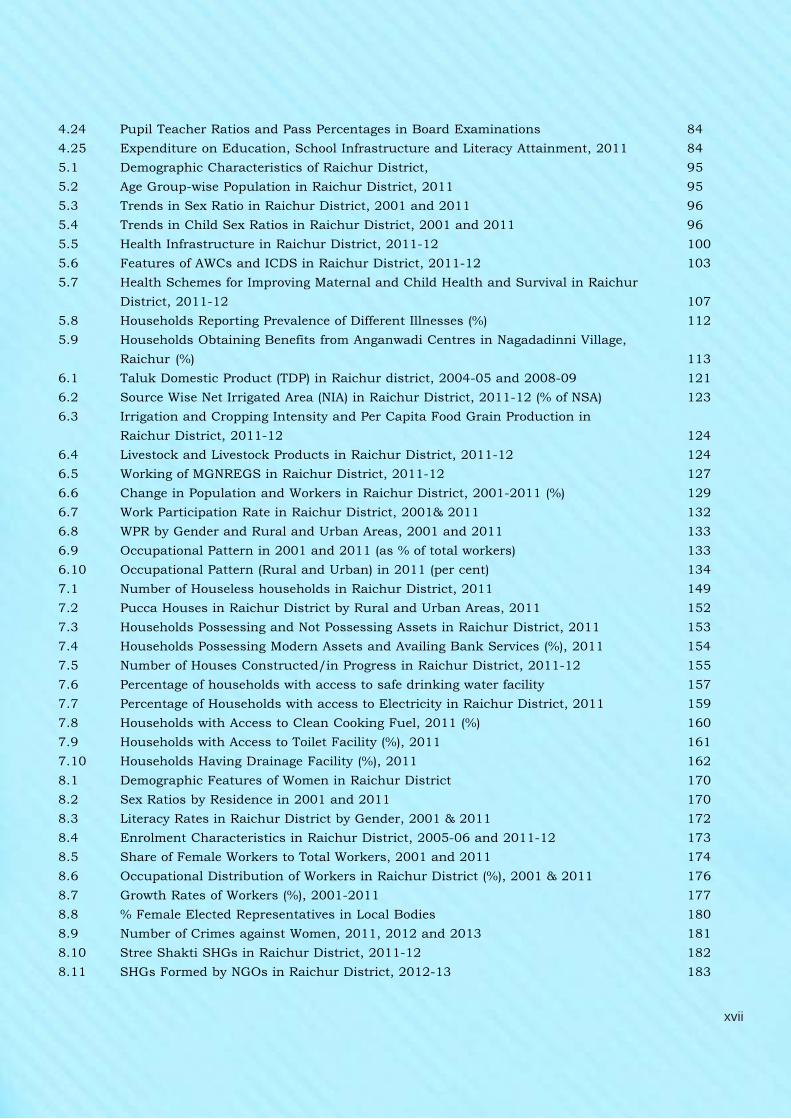
4.24 Pupil Teacher Ratios and Pass Percentages in Board Examinations 84
4.25 Expenditure on Education, School Infrastructure and Literacy Attainment, 2011 84
5.1 Demographic Characteristics of Raichur District, 95
5.2 Age Group-wise Population in Raichur District, 2011 95
5.3 Trends in Sex Ratio in Raichur District, 2001 and 2011 96
5.4 Trends in Child Sex Ratios in Raichur District, 2001 and 2011 96
5.5 Health Infrastructure in Raichur District, 2011-12 100
5.6 Features of AWCs and ICDS in Raichur District, 2011-12 103
5.7 Health Schemes for Improving Maternal and Child Health and Survival in Raichur
District, 2011-12 107
5.8 Households Reporting Prevalence of Different Illnesses (%) 112
5.9 Households Obtaining Benefits from Anganwadi Centres in Nagadadinni Village,
Raichur (%) 113
6.1 Taluk Domestic Product (TDP) in Raichur district, 2004-05 and 2008-09 121
6.2 Source Wise Net Irrigated Area (NIA) in Raichur District, 2011-12 (% of NSA) 123
6.3 Irrigation and Cropping Intensity and Per Capita Food Grain Production in
Raichur District, 2011-12 124
6.4 Livestock and Livestock Products in Raichur District, 2011-12 124
6.5 Working of MGNREGS in Raichur District, 2011-12 127
6.6 Change in Population and Workers in Raichur District, 2001-2011 (%) 129
6.7 Work Participation Rate in Raichur District, 2001& 2011 132
6.8 WPR by Gender and Rural and Urban Areas, 2001 and 2011 133
6.9 Occupational Pattern in 2001 and 2011 (as % of total workers) 133
6.10 Occupational Pattern (Rural and Urban) in 2011 (per cent) 134
7.1 Number of Houseless households in Raichur District, 2011 149
7.2 Pucca Houses in Raichur District by Rural and Urban Areas, 2011 152
7.3 Households Possessing and Not Possessing Assets in Raichur District, 2011 153
7.4 Households Possessing Modern Assets and Availing Bank Services (%), 2011 154
7.5 Number of Houses Constructed/in Progress in Raichur District, 2011-12 155
7.6 Percentage of households with access to safe drinking water facility 157
7.7 Percentage of Households with access to Electricity in Raichur District, 2011 159
7.8 Households with Access to Clean Cooking Fuel, 2011 (%) 160
7.9 Households with Access to Toilet Facility (%), 2011 161
7.10 Households Having Drainage Facility (%), 2011 162
8.1 Demographic Features of Women in Raichur District 170
8.2 Sex Ratios by Residence in 2001 and 2011 170
8.3 Literacy Rates in Raichur District by Gender, 2001 & 2011 172
8.4 Enrolment Characteristics in Raichur District, 2005-06 and 2011-12 173
8.5 Share of Female Workers to Total Workers, 2001 and 2011 174
8.6 Occupational Distribution of Workers in Raichur District (%), 2001 & 2011 176
8.7 Growth Rates of Workers (%), 2001-2011 177
8.8 % Female Elected Representatives in Local Bodies 180
8.9 Number of Crimes against Women, 2011, 2012 and 2013 181
8.10 Stree Shakti SHGs in Raichur District, 2011-12 182
8.11 SHGs Formed by NGOs in Raichur District, 2012-13 183
xviii
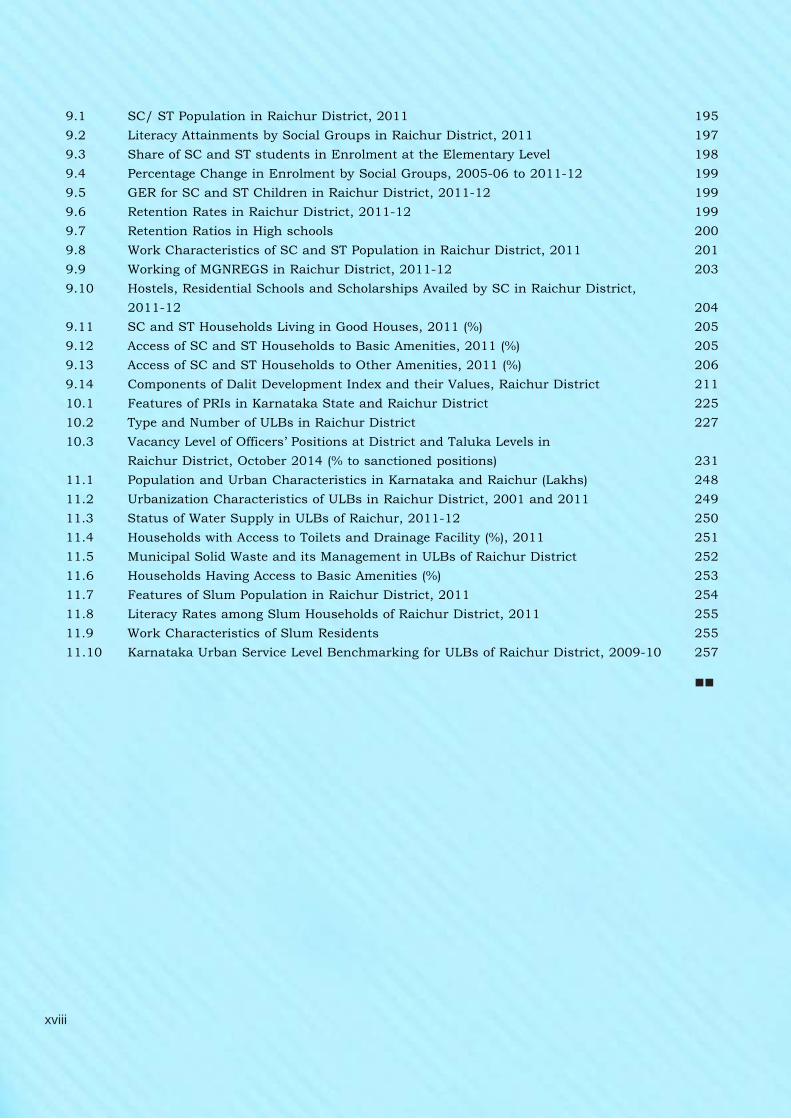
9.1 SC/ ST Population in Raichur District, 2011 195
9.2 Literacy Attainments by Social Groups in Raichur District, 2011 197
9.3 Share of SC and ST students in Enrolment at the Elementary Level 198
9.4 Percentage Change in Enrolment by Social Groups, 2005-06 to 2011-12 199
9.5 GER for SC and ST Children in Raichur District, 2011-12 199
9.6 Retention Rates in Raichur District, 2011-12 199
9.7 Retention Ratios in High schools 200
9.8 Work Characteristics of SC and ST Population in Raichur District, 2011 201
9.9 Working of MGNREGS in Raichur District, 2011-12 203
9.10 Hostels, Residential Schools and Scholarships Availed by SC in Raichur District,
2011-12 204
9.11 SC and ST Households Living in Good Houses, 2011 (%) 205
9.12 Access of SC and ST Households to Basic Amenities, 2011 (%) 205
9.13 Access of SC and ST Households to Other Amenities, 2011 (%) 206
9.14 Components of Dalit Development Index and their Values, Raichur District 211
10.1 Features of PRIs in Karnataka State and Raichur District 225
10.2 Type and Number of ULBs in Raichur District 227
10.3 Vacancy Level of Officers’ Positions at District and Taluka Levels in
Raichur District, October 2014 (% to sanctioned positions) 231
11.1 Population and Urban Characteristics in Karnataka and Raichur (Lakhs) 248
11.2 Urbanization Characteristics of ULBs in Raichur District, 2001 and 2011 249
11.3 Status of Water Supply in ULBs of Raichur, 2011-12 250
11.4 Households with Access to Toilets and Drainage Facility (%), 2011 251
11.5 Municipal Solid Waste and its Management in ULBs of Raichur District 252
11.6 Households Having Access to Basic Amenities (%) 253
11.7 Features of Slum Population in Raichur District, 2011 254
11.8 Literacy Rates among Slum Households of Raichur District, 2011 255
11.9 Work Characteristics of Slum Residents 255
11.10 Karnataka Urban Service Level Benchmarking for ULBs of Raichur District, 2009-10 257
xixxix
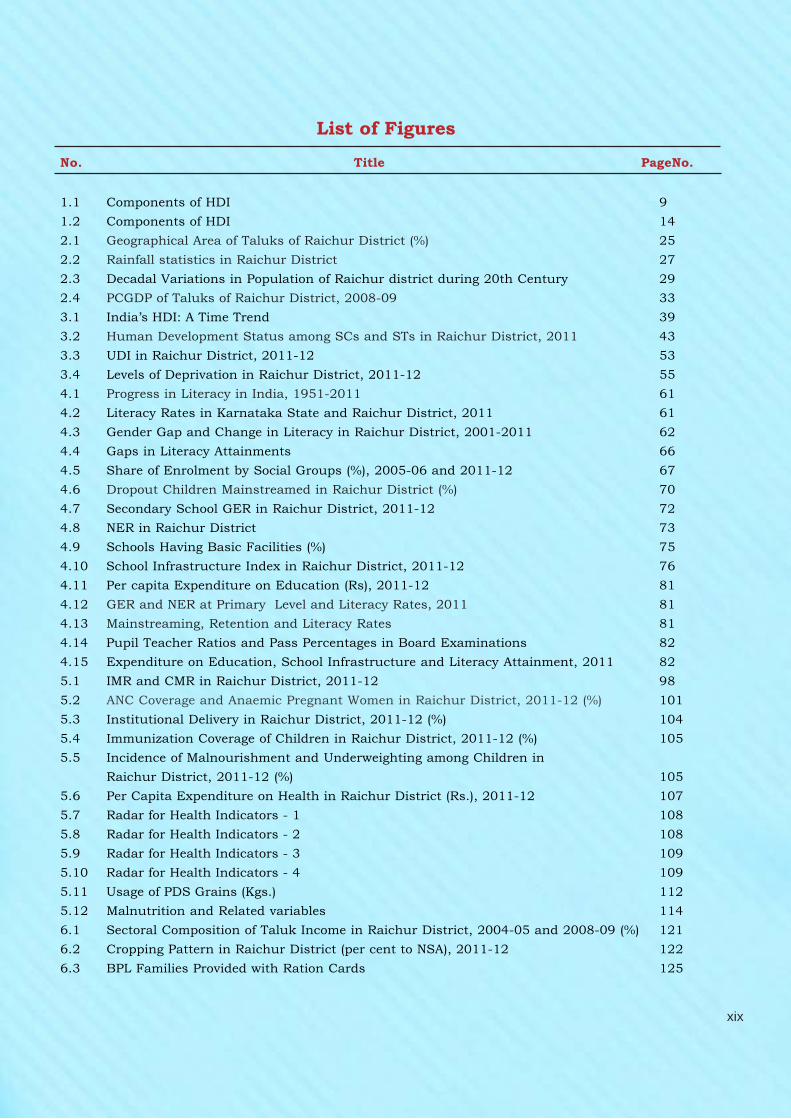
No. Title PageNo.
1.1 Components of HDI 9
1.2 Components of HDI 14
2.1 Geographical Area of Taluks of Raichur District (%) 25
2.2 Rainfall statistics in Raichur District 27
2.3 Decadal Variations in Population of Raichur district during 20th Century 29
2.4 PCGDP of Taluks of Raichur District, 2008-09 33
3.1 India’s HDI: A Time Trend 39
3.2 Human Development Status among SCs and STs in Raichur District, 2011 43
3.3 UDI in Raichur District, 2011-12 53
3.4 Levels of Deprivation in Raichur District, 2011-12 55
4.1 Progress in Literacy in India, 1951-2011 61
4.2 Literacy Rates in Karnataka State and Raichur District, 2011 61
4.3 Gender Gap and Change in Literacy in Raichur District, 2001-2011 62
4.4 Gaps in Literacy Attainments 66
4.5 Share of Enrolment by Social Groups (%), 2005-06 and 2011-12 67
4.6 Dropout Children Mainstreamed in Raichur District (%) 70
4.7 Secondary School GER in Raichur District, 2011-12 72
4.8 NER in Raichur District 73
4.9 Schools Having Basic Facilities (%) 75
4.10 School Infrastructure Index in Raichur District, 2011-12 76
4.11 Per capita Expenditure on Education (Rs), 2011-12 81
4.12 GER and NER at Primary Level and Literacy Rates, 2011 81
4.13 Mainstreaming, Retention and Literacy Rates 81
4.14 Pupil Teacher Ratios and Pass Percentages in Board Examinations 82
4.15 Expenditure on Education, School Infrastructure and Literacy Attainment, 2011 82
5.1 IMR and CMR in Raichur District, 2011-12 98
5.2 ANC Coverage and Anaemic Pregnant Women in Raichur District, 2011-12 (%) 101
5.3 Institutional Delivery in Raichur District, 2011-12 (%) 104
5.4 Immunization Coverage of Children in Raichur District, 2011-12 (%) 105
5.5 Incidence of Malnourishment and Underweighting among Children in
Raichur District, 2011-12 (%) 105
5.6 Per Capita Expenditure on Health in Raichur District (Rs.), 2011-12 107
5.7 Radar for Health Indicators - 1 108
5.8 Radar for Health Indicators - 2 108
5.9 Radar for Health Indicators - 3 109
5.10 Radar for Health Indicators - 4 109
5.11 Usage of PDS Grains (Kgs.) 112
5.12 Malnutrition and Related variables 114
6.1 Sectoral Composition of Taluk Income in Raichur District, 2004-05 and 2008-09 (%) 121
6.2 Cropping Pattern in Raichur District (per cent to NSA), 2011-12 122
6.3 BPL Families Provided with Ration Cards 125
List of Figures
xx
6.4 Job Cards Issued and Employment Provided under MGNREGS in Raichur District,
2011-12 127
6.5 Change of Total Workers in Raichur District (%), 2001-2011 129
6.6 Share of Main Workers to Total Workers in Raichur District, 2001 and 2011(%) 131
6.7 Share of Female Workers to Total Workers, 2001 and 2011 131
6.8 Occupational Pattern in Raichur District, 2001 & 2011 134
6.9 Radar of Livelihood Indicators - 1 136
6.10 Radar of Livelihood Indicators - 2 136
6.11 Radar of Livelihood Indicators - 3 137
6.12 Radar of Livelihood Indicators - 4 137
7.1 Site-less Households in Raichur District, 2011-12 150
7.2 Households having Pucca Houses in Raichur District, 2011 151
7.3 Houses Constructed for Poor People (%) 155
7.4 Habitations Supplied More Than 40 LPCD of Water in Raichur, 2011-12 (%) 156
7.5 Habitations by contaminants (%) 158
7.6 Population by contaminants (%) 158
7.7 Distribution of Habitations and Population of Raichur District Affected by
Various Water Contaminants, 2013-14 (%) 158
7.8 Per cent Households Resorting to Open defecation in Raichur District, 2011 164
7.9 Number of Toilets to be Constructed in Raichur District to Achieve Zero Open
Defecation by 2019 164
8.1 WPRs and Gender Gaps in Work Participation in Raichur District, 2001 and 2011 175
8.2 Share of Female Workers in Census Occupation Categories,2011 (%) 176
8.3 Median age at first marriage among women of age 25-29 by different population
characteristics in India – (NHFS) 2005-06 184
8.4 Age of Marriage (years) 186
8.5 Respondents by Education (%) 186
8.6 Age at First Delivery (Years) 188
9.1 Growth in Total Population and SC/ST Population 196
9.2 Sex Ratio by Social Groups in Raichur District 196
9.3 Gaps in Literacy Level across Social Groups 197
9.4 Health Awareness and Utilization by SC and ST Communities, 2007-08 200
9.5 Occupational Pattern across Social Groups in Raichur District, 2011 (%
of total workers) 201
9.6 Share in Number and Area of Operational holdings by Social Groups, 2010-11 202
9.7 Agricultural Land Holdings across Social Groups (%) 203
9.8 Comprehensive Dalit Development Index for Raichur District 212
10.1 Representation of SC, ST, OBCs and Women in PRIs in Raichur District (%) 241
10.2 Purpose wise Expenditure of Raichur ZP, 2011-12 (%) 242
11.1 Talukwise Urbanization Ratios in Raichur District, 2001and 2011 248
xxixxi
List of Boxes
No. Index PageNo.
1.1 What all does GDP measures? 3
1.2 Gross National Happiness 10
2.1 Article 371-J 35
3.1 MDGs on Child Development 47
4.1 Millennium Development Goals on Education 60
5.1 UN Millennium Development Goals with respect to Health 95
8.1 Agricultural Holdings of Women 179
9.1 Why are SCs and STs Poorer? 206
10.1 Five Principles of Good Governance 221
No. Index PageNo.
3.1 Taluka HDIs in Raichur District, 2011-12 41
3.2 Taluk GII in Raichur District, 2011-12 46
3.3 Taluk CDI in Raichur District, 2011-12 48
3.4 Taluk FSI in Raichur District, 2011-12 51
3.5 CTDI in Raichur District, 2011-12 53
5.1 Health Facilities in District Raichur 100
List of Maps
xxii
No. Description P.No.
1.1 Parameters and Variables of DHDR 277
1.2 Note on Estimation of IMR, CMR and MMR 280
1.3 A Brief Note on Preparation of DHDR of Raichur District 282
1.4 Data Quality and Limitations 284
2.1 Demographic Information of Raichur District, 2011 285
3.1 Human development Indicators for Raichur District, 2011-12 286
3.2 HD Indicators among SC and ST Households, 2011 294
4.1 Number of Illiterates in Raichur District, 2011 295
4.2 Schools Possessing Infrastructural Facilities 296
4.3 Colleges and Enrolment in Raichur District, 2011-12 297
5.1 Demographic Details of Raichur District, 2011 298
5.2 Allopathic Hospital Infrastructure in Raichur District (Numbers), 2011-12 299
7.1 Households Possessing Select Assets in Raichur District (%), 2011 300
9.1 Livelihood Opportunity Index for SC and ST Population 301
9.2 Questionnaire Used for Collection of Data for Computation of CDDI 302
10.1 List of 29 Subjects as per Eleventh Schedule (Article 243G) for Devolution to
the Panchayati Raj Institutions 304
10.2 List of Functions of ULBs 305
10.3 Public Expenditure for Human Development in Raichur, 2011-12 306
List of Annexures
xxiiixxiii
Acronyms
AL : Agricultural Labour/er/s
ANM : Auxiliary Nurse Midwife
APL : Above Poverty Line
ASHA : Accredited Social Health Activist
AWC : Anganawadi Centre
AWW : Anganwadi Worker
BPL : Below Poverty Line
CPIAL : Consumer Price Index for Agricultural Labour
CPIIW : Consumer Price Index for Industrial Workers
CTDI : Comprehensive Taluka Development Index
DDP : District Domestic Product
DES : Directorate of Economics and Statistics
DHO : District Health Office
DOR : Dropout Rate
FLR : Female Literacy Rate
GDI : Gender Related Development Index
GDP : Gross Domestic Product
GER : Gross Enrolment Rate
GII : Gender Inequality Index
GoI : Government of India
GoK : Government of Karnataka
GP : Gram Panchayat
HD : Human Development
HDI : Human Development Index
HDR : Human Development Report
HPI : Human Poverty Index
ICDS : Integrated Child Development Service
IGNOAPS : Indira Gandhi National Old Age Pension Scheme
IGNWPS : Indira Gandhi National Widow Pension Scheme
IGNDPS : Indira Gandhi National Disability Pension Scheme
IMR : Infant Mortality Rate
LEB : Life Expectancy at Birth
LOI : Livelihood Opportunity Index
MGNREGA/S : Mahatma Gandhi National Rural Employment Guarantee
Act/ Scheme
MLALADS : Member of Legislative Assembly Local Area Development
Scheme
xxiv
MLR : Male Literacy Rate
MPI : Multidimensional Poverty Index
NER : Net Enrolment Ratio
NFBS : National Family Benefit Scheme
NRHM : National Rural Health Mission
NSA : Net Sown Area
NSAP : National social Assistance Programme
NSSO : National Sample Survey Organization
OBC : Other Backward Castes
O&M : Operation and Maintenance
OOSC : Out of School Children
PCDDP : Per Capita District Domestic Product
PCGDP : Per Capita Gross Domestic Product
PCI : Per Capita Income
PDS : Public Distribution System
PPP : Purchasing Power Parity
PRI : Panchayat Raj Institution
PTR : Pupil Teacher Ratio
RLR : Rural Literacy Rate
RMSA : Rashtriya Madhyamika Shiksha Abhiyan
SC : Scheduled Castes
SHG : Self Help Group
SSA : Sarva Shiksha Abhiyan
SSY : Sandhya Suraksha Yojane
ST : Scheduled Tribes
TDP : Taluka Domestic Product
TLR : Total Literacy Rate
TMC : Town Municipal Committee
TOP : Town Panchayat
TV : Television
ULB : Urban Local Body
ULR : Urban Literacy Rate
UNDP : United Nations Development Programme
UWS : Urban Water Supply
WB : World Bank
WPR : Work Participation Rate
ZP : Zilla Panchayat
EXECUTIVE SUMMARY
Part - I

.
xxvii
Executive Summary
Part-I
1. Introduction
Understanding of the concept and
measurement of development has
undergone substantial changes.
Policy makers worldwide are using
‘Human Development (HD)’ for
assessing development as well as
for prioritizing resource allocation.
HD is about how the basic
requirements needed for ‘living a life
that they value’ are created by
people themselves and how the
administration responds to their
requirements. It is a people centred
process which seeks to reduce
deprivations and expand the
‘choices’ and ‘opportunities’
available to people. It also involves
creation of ‘capabilities’ in them to
lead a life that they value the most.
This paradigm of development is
based on Amartya Sen’s ideology of
promoting capabilities and choice
and opportunities available to
people. He says ‘richness of human
life is more important than the
richness of the economy itself’.
Based on the above premise, UNDP
perceived the basic capabilities
required for a decent living as
health, knowledge and income.
Considering level and progress in
these dimensions, the UNDP since
1990 has tried to measure and
compare development by defining
and constructing the ‘human
development index (HDI)’. Since
then the annual Human
Development Reports (HDR) and
HDI have been very influential
instruments in shaping the
development policies and principles
throughout the world.
The same ideology and approach
has been adopted to measure
performance of states and regions
below state levels everywhere. In
this context, Karnataka
government has already prepared
two state level HDRs (in 1999 and
2006) and has used them in
resource devolution for
development of backward regions.
The current exercise involves
preparation of similar report for all
districts to assess HD levels at
taluk levels for identifying
deprivations in its different
dimensions and initiate measures
to reduce the same.
In the present report HDI and other
indices are constructed at taluk
level for the year 2011-12.
Development is analysed at micro
level and deprivation of people tried
to be identified using Gender
Inequality Index (GII), Child
Development Index (CDI), Food
Security Index (FSI), Composite
Taluk Development Index (CTDI),
and Composite Dalit Development
Index (CDDI), apart from HDI itself.
xxviii
The data has been compiled from
the Census documents, DSO,
DLHS, publications of individual
departments at the district level like
HMIS, SSA/RMSA and unpublished
data available with them. The HDD
of the Planning Department shared
a huge amount of standardized data
and provided detailed guidelines
and training of the process involved
in preparation of HDRs. At the
district level, the District Core
Committee was responsible for
collection, compilation and
validation of data and review of the
progress. Thus, the Raichur District
Human Development Report has
been the result of a participative
and consultative process prepared
with the help of all stakeholders and
dedicated to the people of Raichur
district.
Raichur district has been a
historically backward region. The
Report tries to identify the levels of
backwardness in each of the
selected dimension and for different
sections of the population, based on
which suitable suggestions are
made. People having been subject
to multiple deprivations, a
comprehensive intervention is
required for improving their
conditions.
2. Human Development:
In spite of the district having a vast
cultivated area and agriculture
being the predominant occupation,
due to the inadequacy and
uncertainty of rainfall, agricultural
productivity is very low rendering
the people poor. Similarly due to
non-availability of mineral
resources industrial activity is not
significant in the district. Excepting
few agro-based industries like rice
mills, the industrial map of the
district is not rich. These have
resulted in low incomes. The
infrastructure and basic amenities
are also not adequate and do not
support the enhancement of health
and educational levels. For
instance, the proportion of non-
pucca houses being very high,
availability of safe drinking water,
toilets and drainage facilities is very
poor. Owing to these, the HD of the
district is lower in the state. Very
low level of education has also
contributed to very low HD.
Technical and professional
education needs to be extended in
the district. Hence, unavailability of
skills has been responsible for
underdevelopment of the district.
Minimal non-agricultural
employment, high levels of
mortality and very low standard of
living have rendered the HD to be
very low. The situation of SCs and
STs is still deplorable.
3. Gender and Child Development:
The still lower female literacy has
constrained them to participate
actively in socio-political and
economic life of the district. The low
female literacy has also resulted in
a higher population growth; high
infant, child and maternal mortality
rates. Women do not have adequate
xxix
employment opportunities and
crimes against them are still
considerable. Lack of awareness
has contributed to high levels of
malnourishment among children.
Not all children are enrolled in
schools and not all enrolled children
finish their schooling. Since, girl
students dominate in this, higher
drop out leads to deprivation of a
whole generation to education and
its benefits.
4. Food Security:
The low agricultural productivity
has kept the food availability low
in the district. The government
schemes of providing ration cards
and opening PDS outlets have
improved the accessibility
indicators. But the absorption
indicators like safe drinking water,
sanitation and female literacy being
minimal, have resulted in lower
food security index in all taluks,
hence the district.
5. Composite Taluk Development:
In 2002, Dr.Nanjundappa
Committee measured the overall
development of a taluk by
constructing a composite
development index. Based on it, not
only taluks were classified by
development but a Special
Development Plan for development
of was also rolled out with
differential allocation of resources
for taluk development. This Report
takes the exercise forward by
measuring the composite
development of taluks. Accordingly,
Sindhnur comes at the top followed
by Raichur, Lingsugur, Manvi and
Devadurga in the last position.
Health and education indices have
predominantly affected the
performance of taluks and
wherever, they are stronger, taluk
development is better.
6. Dalit Development:
Scheduled caste (SC) and
scheduled tribe (ST) population is
about 40 per cent and their
backwardness is reflected in overall
backwardness of the district. Their
school enrolment is lower and they
have virtually no non-agricultural
employment. Their population
growth is high as their access to
reproductive health facilities is
lower. Discrimination is found to be
lower wherever statutory provisions
are there, but is still continued in
different forms in other social,
economic and political spheres.
7. Urban Development:
The population living in urban
areas is growing rapidly and
therefore, it is necessary to analyze
the deprivations of people living in
urban areas. Raichur city
Municipal Council (CMC) is the
most developed mainly because of
better amenities, lower rates of
crimes and accidents and higher
mobilization of own resources.
Sindhnur CMC is in the second
place of development. As far as
town municipal councils (TMC) are
concerned, Manvi is in the first
place followed by Lingsugur and
xxx
Devadurga TMCs. In fact,
Devadurga TMC is the least
developed urban area in the
district. Mudgal town panchayat is
in last but one place in overall
urban development in the district.
The urban development is mainly
guided by the availability of basic
amenities, mobilization of own
resources, and the incidence of
accidents and crimes.
8. Achievements and Gaps:
Education
• Literacy rates, especially female
literacy rates are at very low
levels;
• Gender gaps in literacy in rural
areas being twice those in urban
areas is really distressing;
• The literacy among SCs and STs
is also lower than that of others,
and literacy deprivation is higher
among STs;
• The proportion of drop out and
out of school children is higher
and is intensive in rural areas;
• The pass percentage in SSLC and
PUC of the district is not
satisfactory compared to the
other districts and the state;
• The per capita expenditure on
education in the district being
very low Rs. 467 is one of the
prime reasons for low level of
educational development.
Health
• Mortality rates and proportion of
anemia among pregnant women
are higher in the district;
• There is a severe shortage of
health institutions and
personnel;
• Couples not using contraceptives
is 26 per cent and female
sterilization is the major
contraceptive type adopted;
• The per capita expenditure on
health is also very low leading to
low level of health development.
Livelihood
• The district is a low income and
slow growing district;
• The share of agriculture in
district’s income is higher;
• The dependence for work in
agriculture as cultivators and
agricultural laborers is 70 per
cent in the district compared to
49 per cent at the state level;
• Agricultural labour is the
predominant livelihood option in
the rural areas;
• Employment growth is confined
to urban areas and that too for
males;
• There is a stagnation of
employment growth for females
in rural areas;
• Migration still being rampant,
implementation in MGNREGS is
not encouraging;
• Agricultural productivity and per
capita food grains production are
very low in the district.
Quality of Life
• Non-pucca houses being 30 per
cent is a major challenge;
xxxi
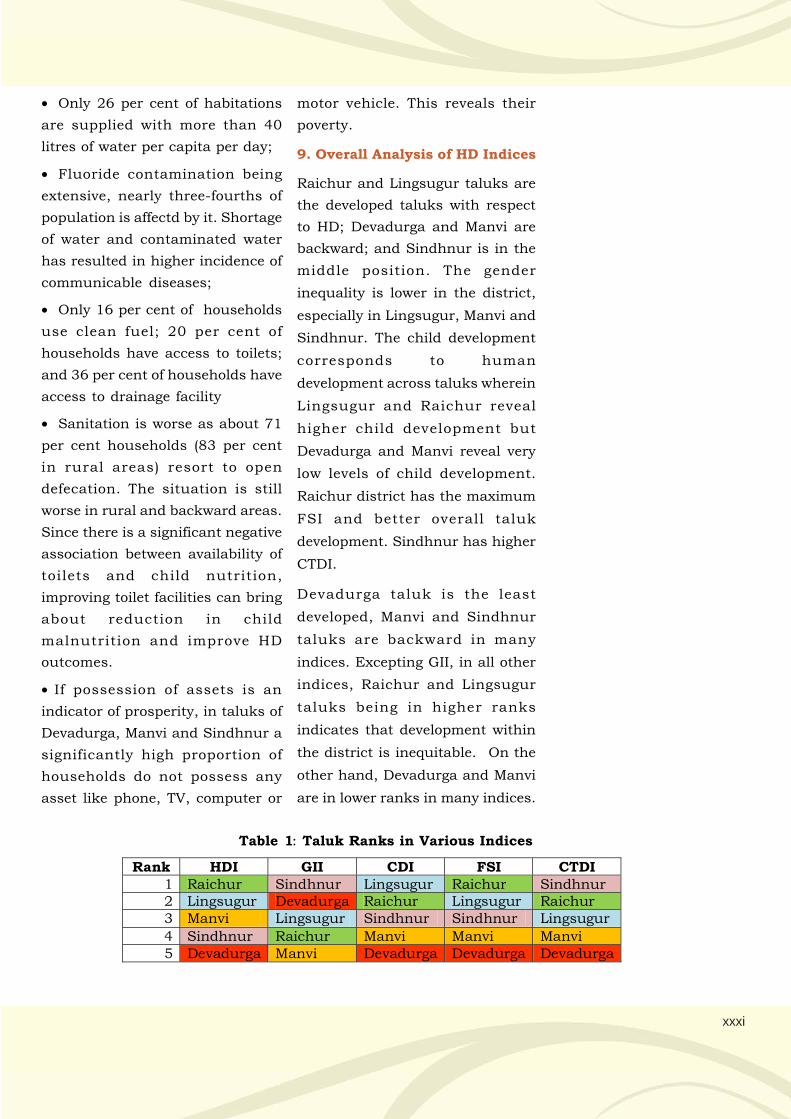
Table 1: Taluk Ranks in Various Indices
Rank HDI GII CDI FSI CTDI 1 Raichur Sindhnur Lingsugur Raichur Sindhnur 2 Lingsugur Devadurga Raichur Lingsugur Raichur 3 Manvi Lingsugur Sindhnur Sindhnur Lingsugur
4 Sindhnur Raichur Manvi Manvi Manvi 5 Devadurga Manvi Devadurga Devadurga Devadurga
• Only 26 per cent of habitations
are supplied with more than 40
litres of water per capita per day;
• Fluoride contamination being
extensive, nearly three-fourths of
population is affectd by it. Shortage
of water and contaminated water
has resulted in higher incidence of
communicable diseases;
• Only 16 per cent of households
use clean fuel; 20 per cent of
households have access to toilets;
and 36 per cent of households have
access to drainage facility
• Sanitation is worse as about 71
per cent households (83 per cent
in rural areas) resort to open
defecation. The situation is still
worse in rural and backward areas.
Since there is a significant negative
association between availability of
toilets and child nutrition,
improving toilet facilities can bring
about reduction in child
malnutrition and improve HD
outcomes.
• If possession of assets is an
indicator of prosperity, in taluks of
Devadurga, Manvi and Sindhnur a
significantly high proportion of
households do not possess any
asset like phone, TV, computer or
motor vehicle. This reveals their
poverty.
9. Overall Analysis of HD Indices
Raichur and Lingsugur taluks are
the developed taluks with respect
to HD; Devadurga and Manvi are
backward; and Sindhnur is in the
middle position. The gender
inequality is lower in the district,
especially in Lingsugur, Manvi and
Sindhnur. The child development
corresponds to human
development across taluks wherein
Lingsugur and Raichur reveal
higher child development but
Devadurga and Manvi reveal very
low levels of child development.
Raichur district has the maximum
FSI and better overall taluk
development. Sindhnur has higher
CTDI.
Devadurga taluk is the least
developed, Manvi and Sindhnur
taluks are backward in many
indices. Excepting GII, in all other
indices, Raichur and Lingsugur
taluks being in higher ranks
indicates that development within
the district is inequitable. On the
other hand, Devadurga and Manvi
are in lower ranks in many indices.
xxxii
10. Suggested Interventions:
• Focus must be on rural areas,
women, children and the
disadvantaged sections of the
society
• Priority to Devadurga, Manvi,
Sindhnur, Lingsugur and Raichur
in that order
Resources to be allocated for:
1. Increased spending on
education, health and sanitation
aspects
2. Improving sanitation, especially
construction and use of toilets
3. Enhancing female literacy
4. Increasing male participation in
family planning
5. Strengthening of Anganwadis
6. Intensifying mainstreaming of
dropouts
7. Promoting non-agricultural work
in rural areas
8. Promoting skill based and
professional education
9. Strengthening Health
Institutions and Personnel
10.Increasing the number and
effectiveness of SHGs
11.Increasing the nutritional
support to children and
pregnant women
12.Improving the quantity and
quality of drinking water
13.Promoting the use of alternative
fuels
14.Improving water use efficiency
and agricultural productivity
15.Enhancing physical and social
security of women, children,
aged, physically disabled and
other disadvantaged sections of
the society
16.Awareness programmes to
women and disadvantaged
sections for their inclusion in
the development process.
17.Strengthening of urban
infrastructure and amenities
and increased own resource
mobilization
18.Increasing staff strength in all
departments of district
administration, especially those
directly linked to HD
19.Appointing more number of
women and especially of those
from disadvantaged section in
education and health sectors
20.Complete spending of grants
meant for SCs and STs;
increasing their participation;
and appointing them in
education and health sectors
11. Conclusion
Raichur district being
predominantly agricultural, priority
should be for increasing
agricultural productivity through
efficient water management.
Implementing the employment
guarantee scheme effectively and
encouraging more women to
participate in it should also be
emphasized. The migration can be
checked through this. Enhancing
xxxiii
non-agricultural employment is
another way of improving the
incomes and standard of living of
people. Increasing female literacy
and strengthening their social
capabilities must be high on
development agenda. Education
and awareness programmes will
ensure a greater participation of
people in development.
Expenditure on HD should be
increased and for effectively
utilizing the opportunity under 371
(j), adequate number of staff needs
to be appointed. Since the number
of women and SCs and STs is
relatively higher in the district, the
benefits of all programmes must be
directed to them. Their development
will enhance the district’s
development.
A fourpronged strategy for the
overall development of the district
is suggested, the components of
which are:
Increased Employment
Generation: Providing gainful
employment to the rapidly rising
population has to be the first
priority. While construction
activities and resource development
activities can be better avenues for
the unskilled workers, promoting
rural entrepreneurship may be a
desired means to tap the rural
educated but unemployed youth.
In the urban areas, jobs suitable to
women need to be generated.
Increasing literacy and deepening
skills is a necessary condition for
this.
Enhancing Agricultural
productivity : Strengthening
agricultural infrastructure,
research and extension can
increase agricultural productivity.
The district has not only a large
area under canal irrigation but also
suffers from water stress.
Promoting efficient water
management can resolve the issue.
Increased agricultural productivity
also promotes non-agricultural
development.
Strengthening Infrastructure: The
focus needs to be on ensuring safe
drinking water and better
sanitation to all people. Good
housing, health and education
facilities also should be part of this
strategy.
Effective Provisioning of Basic
Services and Infrastructure:
Governance plays an important role
here. With illiteracy being higher,
the administrative machinery
needs to be proactive in adopting
good practices and innovative
interventions in reaching the
people. Promoting private public
partnership and using technology
to implement and monitor
programmes can bring in effective
people’s involvement in
development. Recruitment of
adequate staff is the most essential
requirement for this.
xxxiv
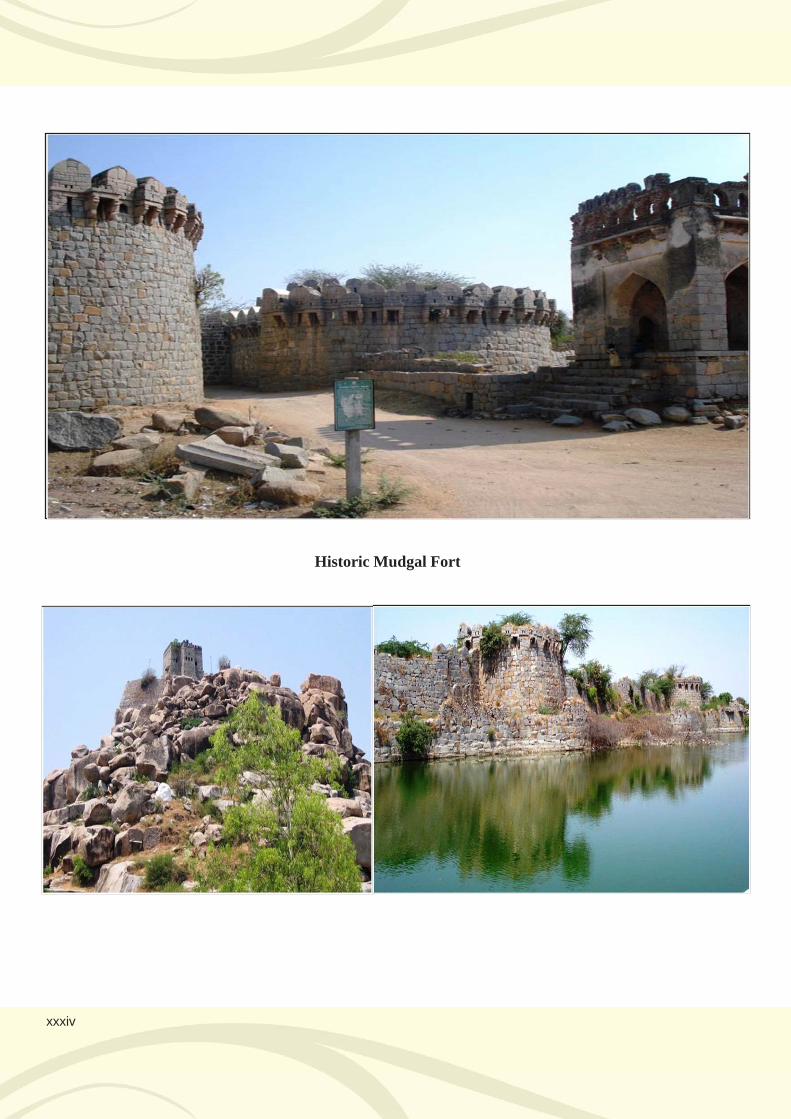
Historic Mudgal Fort
Chapter 1
INTRODUCTION
Part - II

.
3
Chapter 1
1.1. Concept and Methodology
Development being a complex
phenomenon has been eluding the
thinkers as well as policy makers.
The earlier paradigm of
development predominantly
advocated income growth which
resulted in searching for strategies
that increased the gross domestic
product (GDP) of the countries. This
economic growth in the form of a
sustained increase in gross and per
capita income was believed to
contribute to the overall progress of
a nation and its people. The market
forces were assumed to pass on the
benefits to all the people and
thereby result in end of poverty. The
focus was, therefore, on economic
growth and growth in the GDP,
defined as the market value of
goods and services produced by a
country within the period of one
year, was a widely accepted
indicator for measuring economic
status and growth. Even today, it is
used to compare the performance of
countries. Per capita GDP is
normally compared to judge the
relative progress of countries.
However, thinkers have criticized it
to be a partial measure as growth
in no part of the world has
automatically led to the reduction
in poverty and inequality. A Report
of the UN states that income growth
in recent decades is not associated
with reduction in inequality or
Introduction
poverty (UN, 2013, pp.29-30). Not
only this inequality is masked by
the GDP measure, it also includes
goods as well as evils (see Box 1.1).
Since it is increasingly felt that the
GDP is not meant to be an accurate
measure of long term economic
and social progress, agitation
against the use of GDP as a
measure of development is now
widespread. According to
Commission of the European
Communities (2009), there is
hardly any direct correlation
between increased GDP and
enhanced standard of living of the
common man. Although GDP as a
measure itself need not be blamed,
economists have felt it necessary to
supplement GDP with indices
covering other economic, social
and environmental issues, on
Box 1.1: What all does GDP measures?
“Our Gross National Product...counts air pollution and cigarette
advertising, and ambulances to clear our highways of carnage. It counts
special locks for our doors and the jails for the people who break them. It
counts the destruction of the redwood and the loss of our natural wonder
in chaotic sprawl. It counts napalm and counts nuclear warheads and
armoured cars for the police to fight the riots in our cities..., and the
television programs which glorify violence in order to sell toys to our
children. Yet the Gross National Product does not allow for the health of
our children, the quality of their education or the joy of their play. It does
not include the beauty of our poetry or the strength of our marriages, the
intelligence of our public debate or the integrity of our public officials. It
measures neither our wit nor our courage, neither our wisdom nor our
learning, neither our compassion nor our devotion to our country, it
measures everything, in short, except that which makes life worthwhile.
And it can tell us everything about America except why we are proud that
we are Americans (emphasis added)”.
- Robert F. Kennedy, speech at the University of Kansas on March 18,
1968
If a tree is
standing, it
does not
contribute to
GDP. But the
moment it is
cut and
made into
tradable
timber, it
adds to GDP.
4
Raichur District Human Development Report 2014
which people’s well-being critically
depends, is felt necessary.
Therefore, the failure of ‘trickle
down’ power of market forces to
spread economic benefits and end
poverty; increased human costs of
the Structural Adjustment
Programs, initiated in many
countries; widespread prevalence
of social ills (crime, the reduced
social cohesion, HIV/AIDS,
pollution, etc.) despite strong and
consistent economic growth; and
the increased hopes for people-
centred models due to the
democratization wave that swept in
the early 90s gave rise to alternative
development models.
1.1.1. Human Development (HD)
Paradigm
Because of reasons mentioned
above pressure to measure
progress, well-being and
sustainable development in a more
comprehensive way; and account
for it has been mounting. A series
of attempts to measure
development and human progress
have been attempted and it is now
accepted that the ultimate objective
of economic development should
be to promote a milieu, which
supports the development of people;
so that they can lead productive
and creative lives and make
informed choices according to their
needs and interests. These attempts
have resulted in combining socio-
economic and political factors to
develop indices of development
(PQLI, for instance). These indices
being more comprehensive than
income are expected to reflect the
progress and deprivation of people
or groups of people.
The first HDR was built on the
assertion that “income is not the
sum total of human life” (UNDP
1990). Daly (2008) remarks that,
“Economists have focused too much
on the economy’s circulatory
system and have neglected to study
its digestive tract. Throughput
growth means pushing more of the
same food through an ever larger
digestive tract; development means
eating better food and digesting it
more thoroughly”. Similarly, the
Global Happiness Report (2013)
mentions that there is now a rising
worldwide demand that policy be
more closely aligned with what
really matters to people as they
themselves characterize their lives.
More and more world leaders are
talking about the importance of
well-being as a guide for their
nations and the world.
Better Life Initiative of The
Organisation for Economic
Cooperation and Development’s
(OECD) is among the efforts to
capture in a better way what is
important to people. The
Commission on the Measurement of
Economic Performance and Social
Progress indicated, “... interest in
alternative or complements to GDP
resumed progressively during the
90s,” a process led in many aspects
by the Human Development Report
Office with the instrument of
Human Development Index (HDI).
According to the Commission’s
“GNP (the Gross
National Product)
by itself does not
promote
happiness. The
U.S. has had a
three time
increase of GNP
per capita since
1960, but the
happiness needle
hasn’t budged.
Other countries
have pursued
other policies and
achieved much
greater gains of
happiness, even
at much lower
levels of per
capita income.” -
Jeffery Sachs,
Economist and
author of the World
Happiness Report
5
Introduction
report, there were two synthetic
indicators of social progress in
1990, increasing to about 30 in
2001-2002. Today there are more
than 50 indicators capturing the
social, environmental, economic
and psychological aspects of
people’s lives.
All these efforts emphasize that the
quality of life led by people should
be at the centre of growth process.
Income is only a means to the
broader end of building capabilities
of people. It is only a necessary
condition of human well-being.
More depends on how it is earned,
who controls it and how society
allocates its own resources. The HD
paradigm that came into light in this
context asserts that ‘people are the
real wealth of a nation and the
ultimate aim of economic and
social policy should be to improve
their lives, and enhance their
choices and capabilities’. This
approach is derived from Amartya
Sen’s Capabilities Approach.
Capabilities represent the
minimum basic amenities and
opportunities that enable the people
to be well-nourished, decently
housed, and in many other ways
live lives that they deem
worthwhile. The capability
approach tries to answer the
question “What do we really want
from development?” The capabilities
view shifts attention away from
measures of income or wealth, and
focuses instead on issues like
opportunities for health and
participation in society. Capability
approach defines the ‘beings’ and
‘doings’ of human beings.
Mahabub Ul Haq, a Pakistani
economist at the UNDP,
synthesized the capabilities
approach into a statistically
measurable development
parameter. It was an improvement
over the Physical Quality of Life
Indicator (PQLI) and was named as
the Human Development Index
(HDI). Based on such an ideology
of promoting human well-being,
not income alone, the UNDP started
publishing Human Development
Reports (HDR) on an annual basis
since 1990. Since then, it has been
universally accepted to be a
measure of socio-economic well-
being and a tool for resource
allocation to bring about the
desired nature of development.
HDI is a composite indicator that
successfully measures the multi-
dimensionality of development.
HDI was also not free from
criticisms. But the flexibility of the
concept and methodology resulted
in construction of a few more
indices such as the Gender-related
Development Index (GDI) and the
Human Poverty Index (HPI-1, HPI-
2). In 2010 HDR, the introduction
of Inequality adjusted HDI (IHDI),
Gender Inequality Index (GII) and
the Multidimensional Poverty
Index (MPI) has further improved
the relevance of HD paradigm.
These indices have been so popular
cutting across the disciplines,
among academia, researchers,
planners and program managers
Capabilities
represent the
minimum basic
amenities and
opportunities
that
enable the
people to be
wellnourished,
decently
housed, and in
many other
ways live lives
that they
deem worth-
while.
6
Raichur District Human Development Report 2014
that have been incorporated into
the standard texts and widely used
in planning and programme
implementation at various levels.
Many of the federal and state
governments have taken active
interest and have prepared the
human development reports at the
national and sub-national levels.
1.1.2. Concept of Human Develop
ment
Evolution of human development
(HD) paradigm has provided a useful
tool for initiating a people-centered
development process. By arguing
that all development should
enlarge choices and opportunities
should be available to all sections,
the HD approach renders income to
be a means of achieving those
objectives, rather being an end in
itself. The declaration of UN
Millennium Development Goals
(MDGs) that are to be achieved in a
time bound manner has
predominantly underlined the HD
aspects. Thus HD paradigm has
become the pivot of all development
discourses. Due to the deficiencies
of the earlier multidimensional
approaches, like PQLI, human
development has emerged as a tool
that would sensitize the academia,
policy makers, administrators and
general public about the pattern
and direction of human progress.
But the concept is not new to social
philosophers. For instance,
Aristotle argued that “wealth is not
the good we are seeking – it is
merely useful for the sake of
something else.” He distinguished a
good political arrangement from a
bad one in terms of its success in
enabling people to lead “flourishing
lives”. Immanuel Kant treating
human beings as the ends of all
activities observes, ‘So act as to treat
humanity, whether in their own
person or in that of any other, in
every case as an end withal, never
as means only’. Adam Smith
advocated a model of economic
development that would allow a
person to mix freely with others
“without being ashamed to appear in
public” - a concept that gave
importance to human dignity above
and beyond income. Similar
concerns are reflected in the works
of thinkers and economists such as
Karl Marx and John Stuart Mill.
Thus, the human development
approach contains two central
theses about people and
development – that improvements
in human lives should be an
explicit development objective, and
that human achievements can be
used as key indicators of progress.
1.1.3. Defining Human
Development
As stated in the HDR, 1990, HD ‘is
about more than GNP growth, more
than producing commodities, and
accumulating capital’ which is
only a means of enlarging people’s
choices. It is about creating an
environment in which people can
develop their full potential and lead
productive, creative lives in
accordance with their needs and
interests. People are the real wealth
of nations. Development is thus
“Not
everything
that can be
counted
counts; not
everything
that counts
can be
counted”
- Albert
Einstein
7
Introduction
about expanding the choices people
have to lead lives that they value.
HD is defined as ‘a process of
enlarging people’s choices’.
HD is multidimensional and its
components are interconnected. A
survey of definitions of HD suggests
that the definition has been fairly
stable over time, different reports
emphasized different aspects of
human development, but the
underlying concept has provided a
solid foundation which has not
changed radically since its
articulation in 1990 (Alkire, 2009).
The following paragraph, an
adaptation of the HDR, 1990,
enunciates the central theme of
HD:
Human development aims to
enlarge people’s freedoms to do and
be what they value and have reason
to value. In practice, human
development also empowers people
to engage actively in development
on our shared planet. It is people-
centered. At all levels of
development, human development
focuses on essential freedoms:
enabling people to lead long and
healthy lives, to acquire
knowledge, to be able to enjoy a
decent standard of living and to
shape their own lives. Many people
value these freedoms in and of
themselves; they are also powerful
means to other opportunities. Human
development also encompasses
other worthwhile freedoms
associated with human well-being
in both developing and
industrialized nations. The
emphasis and particularities vary
but often include secure, safe and
meaningful livelihoods; caring and
dignified relationships; protection
against crime and violence;
artistic, cultural and spiritual
activities; participation in political
and community activities; self-
respect; and emotional well-being.
HD is development by the people,
of the people and for the people.
Because human development
views people not as passive victims
but as entrepreneurs and active
agents, it helps people to help
themselves.
1.1.4. Principles of Human
Development
HD approach rests on four basic
principles, they are: equity,
productivity/ efficiency,
participation or empowerment and
sustainability.
1. Equity: Equity refers to a concept
of justice, impartiality or fairness.
It recognizes that those who have
unequal opportunities should
receive differential treatment to put
them on par with others. For
example, children, women,
differently-abled and
disadvantaged and tribals face
different kinds of deprivation. Their
specific needs have to be addressed
to enable them to make choices
and utilize opportunities.
2. Efficiency/Productivity:
Efficiency/ productivity broadly
refers to effective use of available
The purpose of
development
must be to
create enabling
conditions
through public
policy for the
pursuit of the
ultimate goal of
happiness by
all citizens.
8
Raichur District Human Development Report 2014
resources. From the HD
perspective, it implies maximizing
the use of material, human and
community resources. Any effort
made to enhance wellbeing should
make use of all available resources
in the best possible manner. This
will have the maximum impact on
widening of choices. Like equity,
efficiency too is a dynamic concept,
what may be efficient today may not
be efficient in the long run and
efficiency may mean different
things for different people and
communities.
3. Participation and Empower-
ment: Empowerment is a basic
principle of HD. People have to be
empowered to be able to shape their
lives and exercise choices. People
experience a sense of
empowerment when they are
involved in the planning and
decision making processes of any
initiative that affects them. People
no longer remain mere
beneficiaries of change but can
pursue the goals they value.
4. Sustainability: Sustainable
development broadly refers to
development undertaken in such a
way that it does not endanger the
opportunities of the future
generations. Sustainability is also
a multidimensional concept which
concerns itself with environmental,
cultural, financial and social
aspects of life. For example,
developmental agendas that lead to
excessive spending, increase in
debt servicing burden and eventual
debt trap are unsustainable.
The HD approach requires that all
four principles are adhered to.
Paying attention to any one
dimension while ignoring others
would be self- defeating.
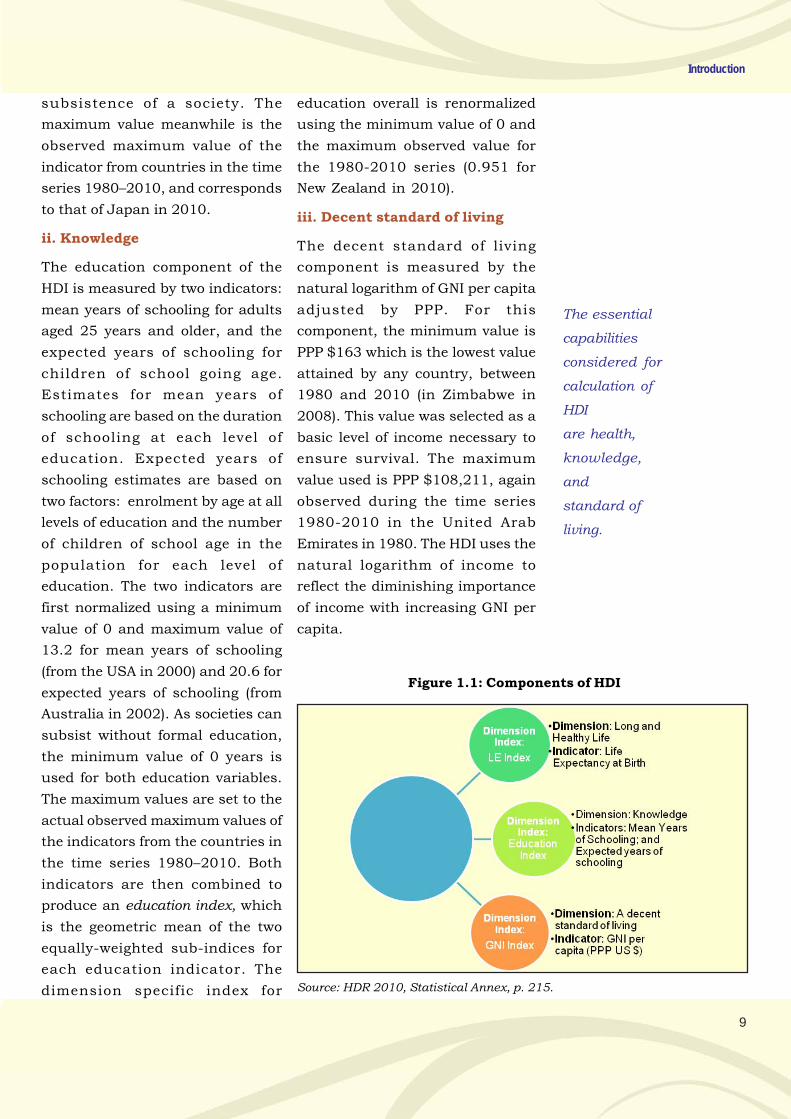
1.1.5. Components of the HDI
Since 1990 the HDI has used three
dimensions: a long and healthy life,
knowledge, and a decent standard
of living. The indicators used to
inform each dimension have,
however, changed over time—most
recently in the 2010 HDR. As shown
in Figure 1.1, presently four
indicators are used to measure the
three dimensions.
i. Long and healthy life
The long and healthy life
dimension uses life expectancy at
birth as its indicator. Life
expectancy at birth is: “the number
of years a new born infant could
expect to live if prevailing patterns
of age-specific mortality rates at the
time of birth were to stay the same
throughout the child’s life” (UNDP,
2010. p. 224). The life expectancy
index is calculated using a
minimum value of 20 years and
maximum value of 83.2 years. The
minimum value for life expectancy
(20 years) is based on long-run
historical evidence from Maddison
(2010) and Riley (2005) which
shows that if a society or a sub-group
of society has a life expectancy
below the typical age of
reproduction, then that society
would die out. The minimum level
of 20 years is therefore the life
expectancy needed for the
9
Introduction
subsistence of a society. The
maximum value meanwhile is the
observed maximum value of the
indicator from countries in the time
series 1980–2010, and corresponds
to that of Japan in 2010.
ii. Knowledge
The education component of the
HDI is measured by two indicators:
mean years of schooling for adults
aged 25 years and older, and the
expected years of schooling for
children of school going age.
Estimates for mean years of
schooling are based on the duration
of schooling at each level of
education. Expected years of
schooling estimates are based on
two factors: enrolment by age at all
levels of education and the number
of children of school age in the
population for each level of
education. The two indicators are
first normalized using a minimum
value of 0 and maximum value of
13.2 for mean years of schooling
(from the USA in 2000) and 20.6 for
expected years of schooling (from
Australia in 2002). As societies can
subsist without formal education,
the minimum value of 0 years is
used for both education variables.
The maximum values are set to the
actual observed maximum values of
the indicators from the countries in
the time series 1980–2010. Both
indicators are then combined to
produce an education index, which
is the geometric mean of the two
equally-weighted sub-indices for
each education indicator. The
dimension specific index for
education overall is renormalized
using the minimum value of 0 and
the maximum observed value for
the 1980-2010 series (0.951 for
New Zealand in 2010).
iii. Decent standard of living
The decent standard of living
component is measured by the
natural logarithm of GNI per capita
adjusted by PPP. For this
component, the minimum value is
PPP $163 which is the lowest value
attained by any country, between
1980 and 2010 (in Zimbabwe in
2008). This value was selected as a
basic level of income necessary to
ensure survival. The maximum
value used is PPP $108,211, again
observed during the time series
1980-2010 in the United Arab
Emirates in 1980. The HDI uses the
natural logarithm of income to
reflect the diminishing importance
of income with increasing GNI per
capita.
The essential
capabilities
considered for
calculation of
HDI
are health,
knowledge,
and
standard of
living.
Figure 1.1: Components of HDI
Source: HDR 2010, Statistical Annex, p. 215.
10
Raichur District Human Development Report 2014
The HDI provides a useful tool for
the policy makers to gauge their
own country’s achievement vis-a-
vis the other countries with respect
to the individual indicators or to the
overall HDI. Specifically the HDI is
used to:
1. To capture the attention of policy
makers, media and NGOs and to
draw their attention away from the
more usual economic statistics to
focus instead on human outcomes.
2. To question national policy
choices – asking how two countries
with the same level of income per
person can end up with such
different HD outcomes (HDI levels).
For example, Costa Rica and Iran
have similar levels of income per
person, but life expectancy and
literacy differ greatly between the
two countries, with Costa Rica
having a much higher HDI value
than Iran. These striking contrasts
immediately stimulate debate on
government policies on health and
education, asking why what is
achieved in one country is far from
the reach of another.
3. To highlight wide differences
within countries, between
provinces or states, across gender,
ethnicity, and other socio-
economic groupings. Highlighting
internal disparities along these
lines has raised national debate in
many countries. For instance, in
nations with very low per capita
incomes, many people do not have
access to adequate food, clean
water, or basic knowledge of health
and sanitation. It is clear that,
substantial increases in the
provision of at least some goods and
services are necessary to increase
human well-being in such
countries.
Over time, and on a society-wide
scale, more income does not seem
to be related to more happiness in
already affluent societies. In 1957,
for example, 35 percent of
respondents to a U.S. survey
indicated that they were “very
happy.” Between 1957 and 1998
the purchasing power of the average
citizen of the U.S. roughly doubled.
In 1998, the proportion saying they
were “very happy” was a little lower,
at 32 percent. At high income
levels, other dimensions of human
development, such as freedom from
violence, closer and more peaceful
families and communities,
investments in the productive and
creative capacities of the next
generation, or the opportunity to
have a satisfying work life (whether
paid or unpaid) may be more
important than having more
marketed goods and services. An
interesting innovation is the Gross
National Happiness Index (Box 1.2).
1.1.6. Measurement of Human
Development
HD is a multidimensional
indicator of development which is
dynamic in nature, changes with
the perception of development or in
the preferred choices overtime.
Given the nature of human
thinking, the choices and
capabilities may be quite
diversified. They need to be
The HDI has been
criticized for its
narrow focus and
non-inclusion of
critical dimensions
such as
employment,
political freedom,
human rights,
environmental
sustainability and
people’s self
respect, arbitrary
weighting of the
components,
possibility of
substitution
between the
dimensions and
inability to
measure inequality
in the
distribution of
human
development
within a country
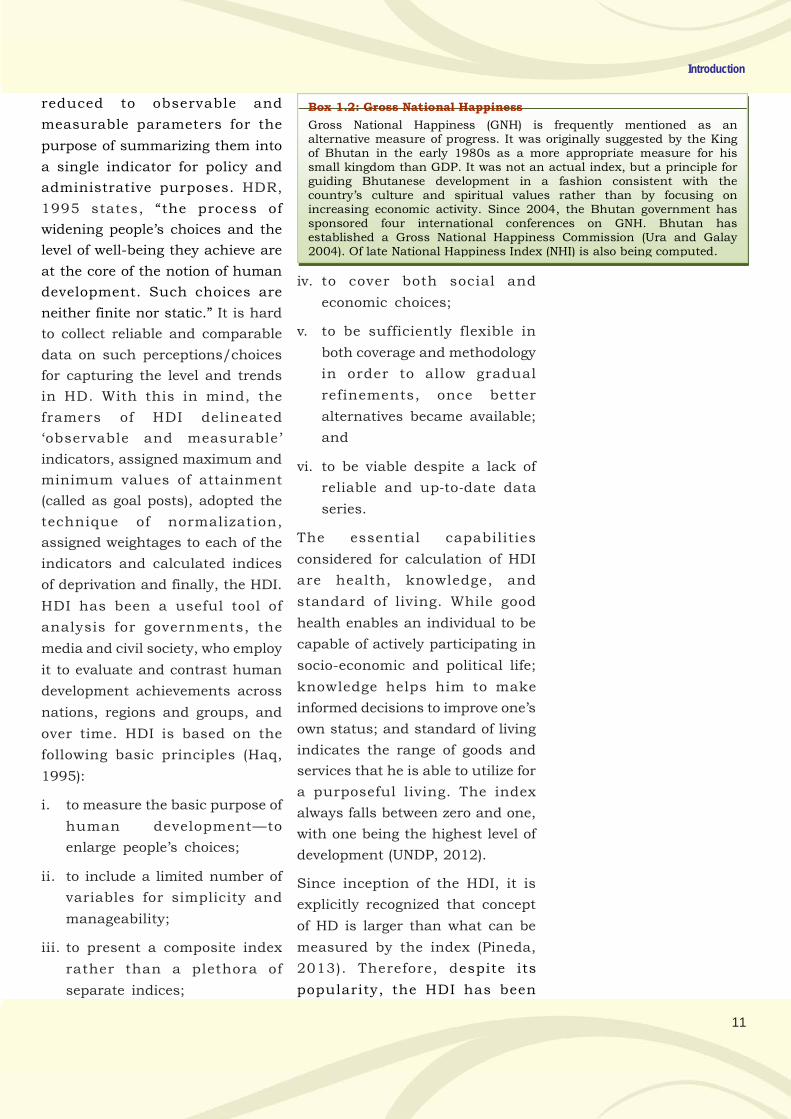
11
Introduction
reduced to observable and
measurable parameters for the
purpose of summarizing them into
a single indicator for policy and
administrative purposes. HDR,
1995 states, “the process of
widening people’s choices and the
level of well-being they achieve are
at the core of the notion of human
development. Such choices are
neither finite nor static.” It is hard
to collect reliable and comparable
data on such perceptions/choices
for capturing the level and trends
in HD. With this in mind, the
framers of HDI delineated
‘observable and measurable’
indicators, assigned maximum and
minimum values of attainment
(called as goal posts), adopted the
technique of normalization,
assigned weightages to each of the
indicators and calculated indices
of deprivation and finally, the HDI.
HDI has been a useful tool of
analysis for governments, the
media and civil society, who employ
it to evaluate and contrast human
development achievements across
nations, regions and groups, and
over time. HDI is based on the
following basic principles (Haq,
1995):
i. to measure the basic purpose of
human development—to
enlarge people’s choices;
ii. to include a limited number of
variables for simplicity and
manageability;
iii. to present a composite index
rather than a plethora of
separate indices;
iv. to cover both social and
economic choices;
v. to be sufficiently flexible in
both coverage and methodology
in order to allow gradual
refinements, once better
alternatives became available;
and
vi. to be viable despite a lack of
reliable and up-to-date data
series.
The essential capabilities
considered for calculation of HDI
are health, knowledge, and
standard of living. While good
health enables an individual to be
capable of actively participating in
socio-economic and political life;
knowledge helps him to make
informed decisions to improve one’s
own status; and standard of living
indicates the range of goods and
services that he is able to utilize for
a purposeful living. The index
always falls between zero and one,
with one being the highest level of
development (UNDP, 2012).
Since inception of the HDI, it is
explicitly recognized that concept
of HD is larger than what can be
measured by the index (Pineda,
2013). Therefore, despite its
popularity, the HDI has been
Box 1.2: Gross National Happiness
Gross National Happiness (GNH) is frequently mentioned as an alternative measure of progress. It was originally suggested by the King of Bhutan in the early 1980s as a more appropriate measure for his small kingdom than GDP. It was not an actual index, but a principle for guiding Bhutanese development in a fashion consistent with the country’s culture and spiritual values rather than by focusing on increasing economic activity. Since 2004, the Bhutan government has sponsored four international conferences on GNH. Bhutan has established a Gross National Happiness Commission (Ura and Galay 2004). Of late National Happiness Index (NHI) is also being computed.
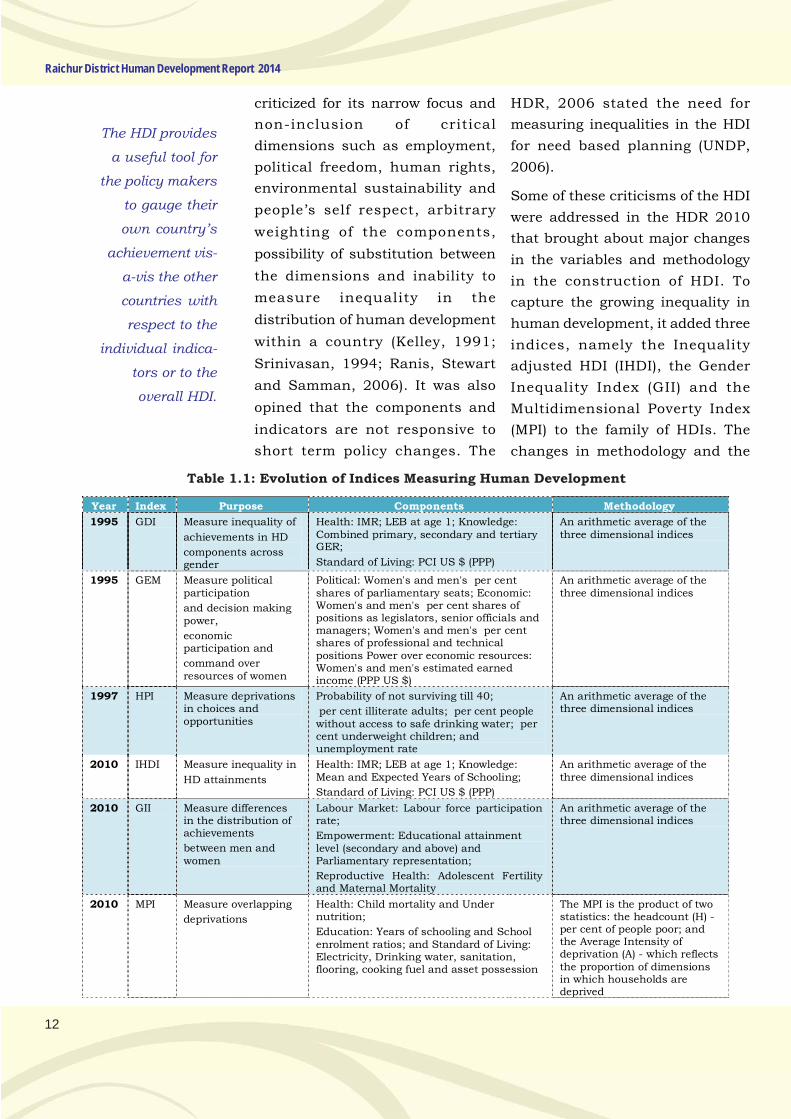
12
Raichur District Human Development Report 2014
criticized for its narrow focus and
non-inclusion of critical
dimensions such as employment,
political freedom, human rights,
environmental sustainability and
people’s self respect, arbitrary
weighting of the components,
possibility of substitution between
the dimensions and inability to
measure inequality in the
distribution of human development
within a country (Kelley, 1991;
Srinivasan, 1994; Ranis, Stewart
and Samman, 2006). It was also
opined that the components and
indicators are not responsive to
short term policy changes. The
HDR, 2006 stated the need for
measuring inequalities in the HDI
for need based planning (UNDP,
2006).
Some of these criticisms of the HDI
were addressed in the HDR 2010
that brought about major changes
in the variables and methodology
in the construction of HDI. To
capture the growing inequality in
human development, it added three
indices, namely the Inequality
adjusted HDI (IHDI), the Gender
Inequality Index (GII) and the
Multidimensional Poverty Index
(MPI) to the family of HDIs. The
changes in methodology and the
The HDI provides
a useful tool for
the policy makers
to gauge their
own country’s
achievement vis-
a-vis the other
countries with
respect to the
individual indica-
tors or to the
overall HDI.
Table 1.1: Evolution of Indices Measuring Human Development
Year Index Purpose Components Methodology
1995 GDI Measure inequality of
achievements in HD
components across gender
Health: IMR; LEB at age 1; Knowledge: Combined primary, secondary and tertiary GER;
Standard of Living: PCI US $ (PPP)
An arithmetic average of the three dimensional indices
1995 GEM Measure political participation
and decision making power,
economic participation and
command over resources of women
Political: Women's and men's per cent shares of parliamentary seats; Economic: Women's and men's per cent shares of positions as legislators, senior officials and managers; Women's and men's per cent shares of professional and technical positions Power over economic resources: Women's and men's estimated earned income (PPP US $)
An arithmetic average of the three dimensional indices
1997 HPI Measure deprivations in choices and opportunities
Probability of not surviving till 40;
per cent illiterate adults; per cent people without access to safe drinking water; per cent underweight children; and unemployment rate
An arithmetic average of the three dimensional indices
2010 IHDI Measure inequality in
HD attainments
Health: IMR; LEB at age 1; Knowledge: Mean and Expected Years of Schooling;
Standard of Living: PCI US $ (PPP)
An arithmetic average of the three dimensional indices
2010 GII Measure differences in the distribution of achievements
between men and women
Labour Market: Labour force participation rate;
Empowerment: Educational attainment level (secondary and above) and Parliamentary representation;
Reproductive Health: Adolescent Fertility and Maternal Mortality
An arithmetic average of the three dimensional indices
2010 MPI Measure overlapping
deprivations
Health: Child mortality and Under nutrition;
Education: Years of schooling and School enrolment ratios; and Standard of Living: Electricity, Drinking water, sanitation, flooring, cooking fuel and asset possession
The MPI is the product of two statistics: the headcount (H) - per cent of people poor; and the Average Intensity of deprivation (A) - which reflects the proportion of dimensions in which households are deprived
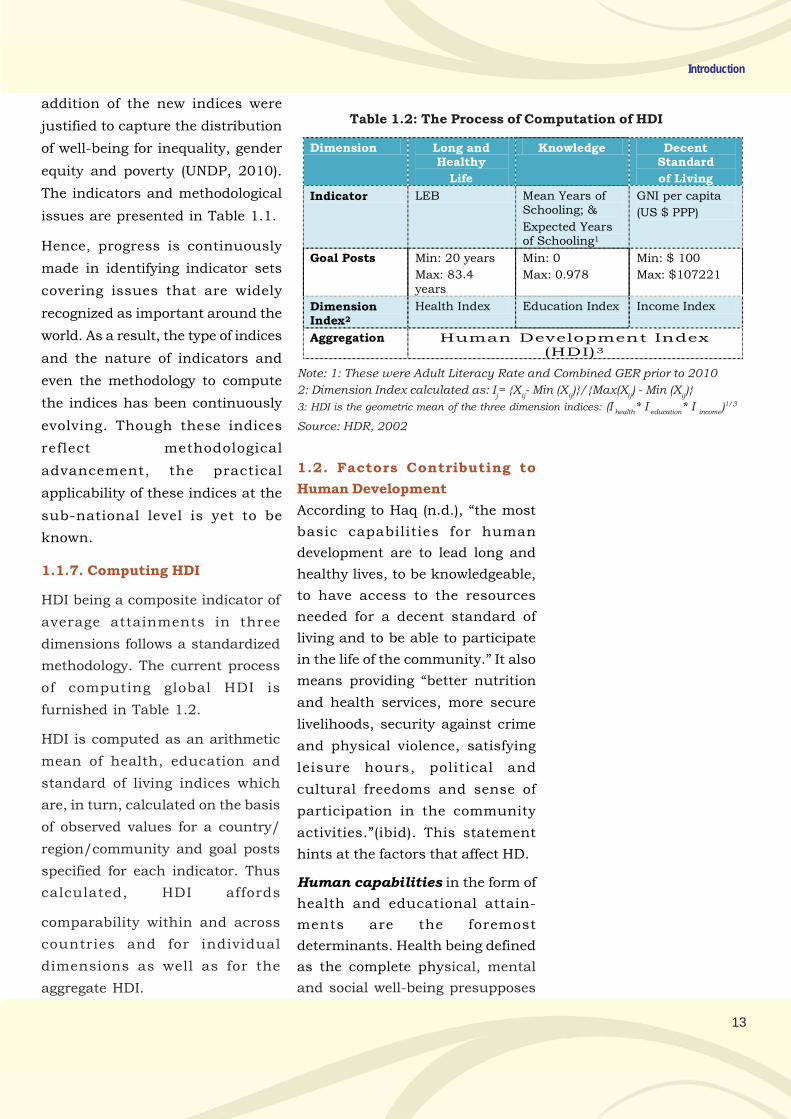
13
Introduction
1.1.7. Computing HDI
HDI being a composite indicator of
average attainments in three
dimensions follows a standardized
methodology. The current process
of computing global HDI is
furnished in Table 1.2.
HDI is computed as an arithmetic
mean of health, education and
standard of living indices which
are, in turn, calculated on the basis
of observed values for a country/
region/community and goal posts
specified for each indicator. Thus
calculated, HDI affords
comparability within and across
countries and for individual
dimensions as well as for the
aggregate HDI.
Table 1.2: The Process of Computation of HDI
Dimension Long and Healthy
Life
Knowledge Decent Standard
of Living
Indicator LEB Mean Years of Schooling; &
Expected Years of Schooling1
GNI per capita
(US $ PPP)
Goal Posts Min: 20 years
Max: 83.4 years
Min: 0
Max: 0.978
Min: $ 100
Max: $107221
Dimension Index2
Health Index Education Index Income Index
Aggregation Human Development Index (HDI)3
Note: 1: These were Adult Literacy Rate and Combined GER prior to 2010
2: Dimension Index calculated as: Ij= {X
ij- Min (X
ij)}/{Max(X
ij) - Min (X
ij)}
3: HDI is the geometric mean of the three dimension indices: (I health
* I education
* I income
)1/3
Source: HDR, 2002
addition of the new indices were
justified to capture the distribution
of well-being for inequality, gender
equity and poverty (UNDP, 2010).
The indicators and methodological
issues are presented in Table 1.1.
Hence, progress is continuously
made in identifying indicator sets
covering issues that are widely
recognized as important around the
world. As a result, the type of indices
and the nature of indicators and
even the methodology to compute
the indices has been continuously
evolving. Though these indices
reflect methodological
advancement, the practical
applicability of these indices at the
sub-national level is yet to be
known.
1.2. Factors Contributing to
Human Development
According to Haq (n.d.), “the most
basic capabilities for human
development are to lead long and
healthy lives, to be knowledgeable,
to have access to the resources
needed for a decent standard of
living and to be able to participate
in the life of the community.” It also
means providing “better nutrition
and health services, more secure
livelihoods, security against crime
and physical violence, satisfying
leisure hours, political and
cultural freedoms and sense of
participation in the community
activities.”(ibid). This statement
hints at the factors that affect HD.
Human capabilities in the form of
health and educational attain-
ments are the foremost
determinants. Health being defined
as the complete physical, mental
and social well-being presupposes
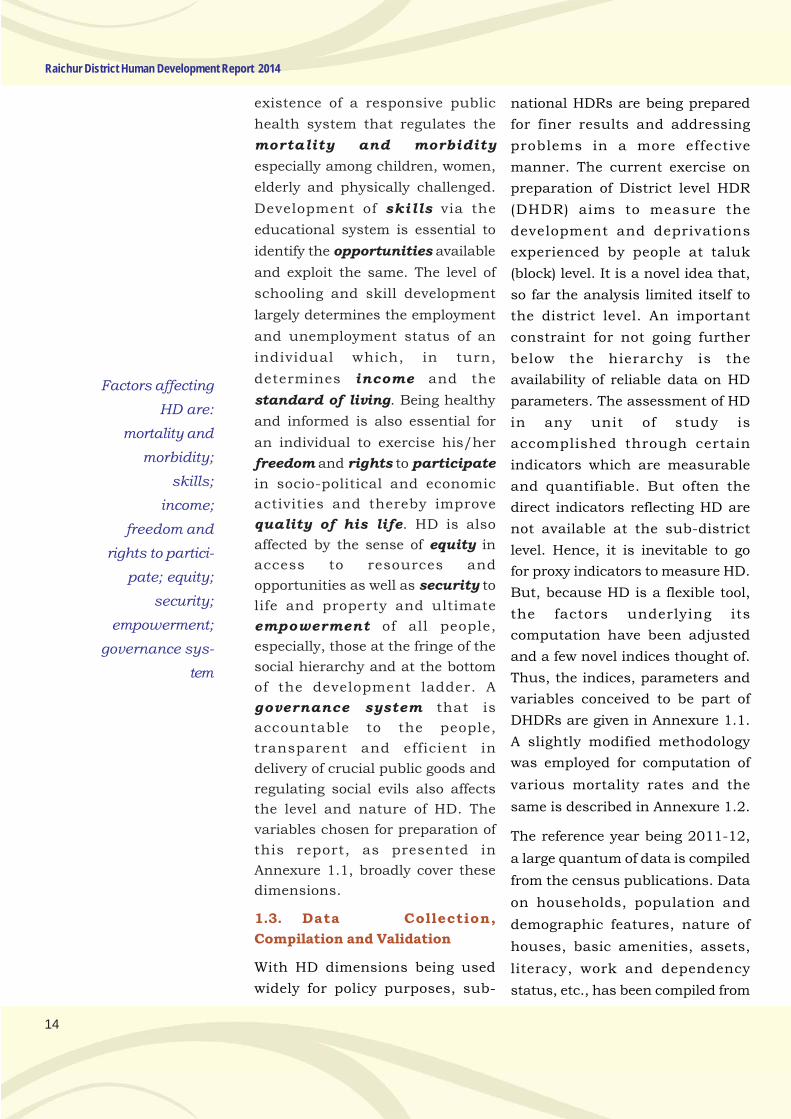
14
Raichur District Human Development Report 2014
existence of a responsive public
health system that regulates the
mortality and morbidity
especially among children, women,
elderly and physically challenged.
Development of skills via the
educational system is essential to
identify the opportunities available
and exploit the same. The level of
schooling and skill development
largely determines the employment
and unemployment status of an
individual which, in turn,
determines income and the
standard of living. Being healthy
and informed is also essential for
an individual to exercise his/her
freedom and rights to participate
in socio-political and economic
activities and thereby improve
quality of his life. HD is also
affected by the sense of equity in
access to resources and
opportunities as well as security to
life and property and ultimate
empowerment of all people,
especially, those at the fringe of the
social hierarchy and at the bottom
of the development ladder. A
governance system that is
accountable to the people,
transparent and efficient in
delivery of crucial public goods and
regulating social evils also affects
the level and nature of HD. The
variables chosen for preparation of
this report, as presented in
Annexure 1.1, broadly cover these
dimensions.
1.3. Data Collection,
Compilation and Validation
With HD dimensions being used
widely for policy purposes, sub-
national HDRs are being prepared
for finer results and addressing
problems in a more effective
manner. The current exercise on
preparation of District level HDR
(DHDR) aims to measure the
development and deprivations
experienced by people at taluk
(block) level. It is a novel idea that,
so far the analysis limited itself to
the district level. An important
constraint for not going further
below the hierarchy is the
availability of reliable data on HD
parameters. The assessment of HD
in any unit of study is
accomplished through certain
indicators which are measurable
and quantifiable. But often the
direct indicators reflecting HD are
not available at the sub-district
level. Hence, it is inevitable to go
for proxy indicators to measure HD.
But, because HD is a flexible tool,
the factors underlying its
computation have been adjusted
and a few novel indices thought of.
Thus, the indices, parameters and
variables conceived to be part of
DHDRs are given in Annexure 1.1.
A slightly modified methodology
was employed for computation of
various mortality rates and the
same is described in Annexure 1.2.
The reference year being 2011-12,
a large quantum of data is compiled
from the census publications. Data
on households, population and
demographic features, nature of
houses, basic amenities, assets,
literacy, work and dependency
status, etc., has been compiled from
Factors affecting
HD are:
mortality and
morbidity;
skills;
income;
freedom and
rights to partici-
pate; equity;
security;
empowerment;
governance sys-
tem
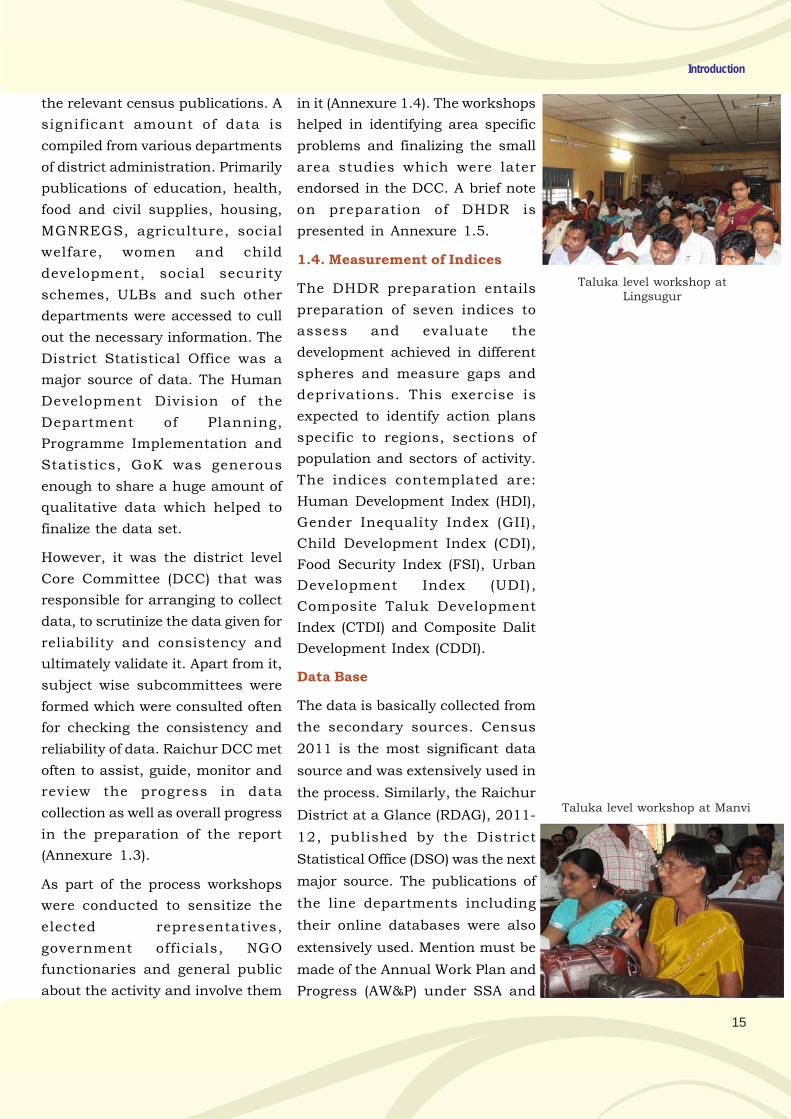
15
Introduction
the relevant census publications. A
significant amount of data is
compiled from various departments
of district administration. Primarily
publications of education, health,
food and civil supplies, housing,
MGNREGS, agriculture, social
welfare, women and child
development, social security
schemes, ULBs and such other
departments were accessed to cull
out the necessary information. The
District Statistical Office was a
major source of data. The Human
Development Division of the
Department of Planning,
Programme Implementation and
Statistics, GoK was generous
enough to share a huge amount of
qualitative data which helped to
finalize the data set.
However, it was the district level
Core Committee (DCC) that was
responsible for arranging to collect
data, to scrutinize the data given for
reliability and consistency and
ultimately validate it. Apart from it,
subject wise subcommittees were
formed which were consulted often
for checking the consistency and
reliability of data. Raichur DCC met
often to assist, guide, monitor and
review the progress in data
collection as well as overall progress
in the preparation of the report
(Annexure 1.3).
As part of the process workshops
were conducted to sensitize the
elected representatives,
government officials, NGO
functionaries and general public
about the activity and involve them
in it (Annexure 1.4). The workshops
helped in identifying area specific
problems and finalizing the small
area studies which were later
endorsed in the DCC. A brief note
on preparation of DHDR is
presented in Annexure 1.5.
1.4. Measurement of Indices
The DHDR preparation entails
preparation of seven indices to
assess and evaluate the
development achieved in different
spheres and measure gaps and
deprivations. This exercise is
expected to identify action plans
specific to regions, sections of
population and sectors of activity.
The indices contemplated are:
Human Development Index (HDI),
Gender Inequality Index (GII),
Child Development Index (CDI),
Food Security Index (FSI), Urban
Development Index (UDI),
Composite Taluk Development
Index (CTDI) and Composite Dalit
Development Index (CDDI).
Data Base
The data is basically collected from
the secondary sources. Census
2011 is the most significant data
source and was extensively used in
the process. Similarly, the Raichur
District at a Glance (RDAG), 2011-
12, published by the District
Statistical Office (DSO) was the next
major source. The publications of
the line departments including
their online databases were also
extensively used. Mention must be
made of the Annual Work Plan and
Progress (AW&P) under SSA and
Taluka level workshop atLingsugur
Taluka level workshop at Manvi
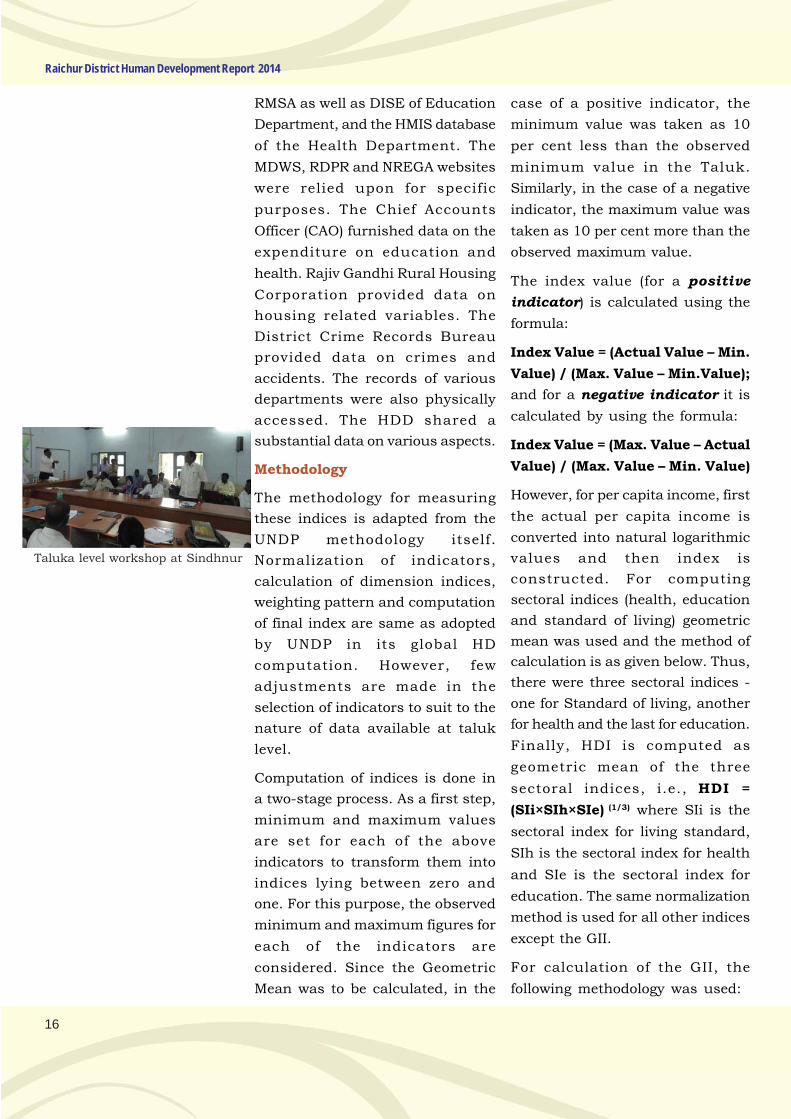
16
Raichur District Human Development Report 2014
RMSA as well as DISE of Education
Department, and the HMIS database
of the Health Department. The
MDWS, RDPR and NREGA websites
were relied upon for specific
purposes. The Chief Accounts
Officer (CAO) furnished data on the
expenditure on education and
health. Rajiv Gandhi Rural Housing
Corporation provided data on
housing related variables. The
District Crime Records Bureau
provided data on crimes and
accidents. The records of various
departments were also physically
accessed. The HDD shared a
substantial data on various aspects.
Methodology
The methodology for measuring
these indices is adapted from the
UNDP methodology itself.
Normalization of indicators,
calculation of dimension indices,
weighting pattern and computation
of final index are same as adopted
by UNDP in its global HD
computation. However, few
adjustments are made in the
selection of indicators to suit to the
nature of data available at taluk
level.
Computation of indices is done in
a two-stage process. As a first step,
minimum and maximum values
are set for each of the above
indicators to transform them into
indices lying between zero and
one. For this purpose, the observed
minimum and maximum figures for
each of the indicators are
considered. Since the Geometric
Mean was to be calculated, in the
case of a positive indicator, the
minimum value was taken as 10
per cent less than the observed
minimum value in the Taluk.
Similarly, in the case of a negative
indicator, the maximum value was
taken as 10 per cent more than the
observed maximum value.
The index value (for a positive
indicator) is calculated using the
formula:
Index Value = (Actual Value – Min.
Value) / (Max. Value – Min.Value);
and for a negative indicator it is
calculated by using the formula:
Index Value = (Max. Value – Actual
Value) / (Max. Value – Min. Value)
However, for per capita income, first
the actual per capita income is
converted into natural logarithmic
values and then index is
constructed. For computing
sectoral indices (health, education
and standard of living) geometric
mean was used and the method of
calculation is as given below. Thus,
there were three sectoral indices -
one for Standard of living, another
for health and the last for education.
Finally, HDI is computed as
geometric mean of the three
sectoral indices, i.e., HDI =
(SIi×SIh×SIe) (1/3) where SIi is the
sectoral index for living standard,
SIh is the sectoral index for health
and SIe is the sectoral index for
education. The same normalization
method is used for all other indices
except the GII.
For calculation of the GII, the
following methodology was used:
Taluka level workshop at Sindhnur
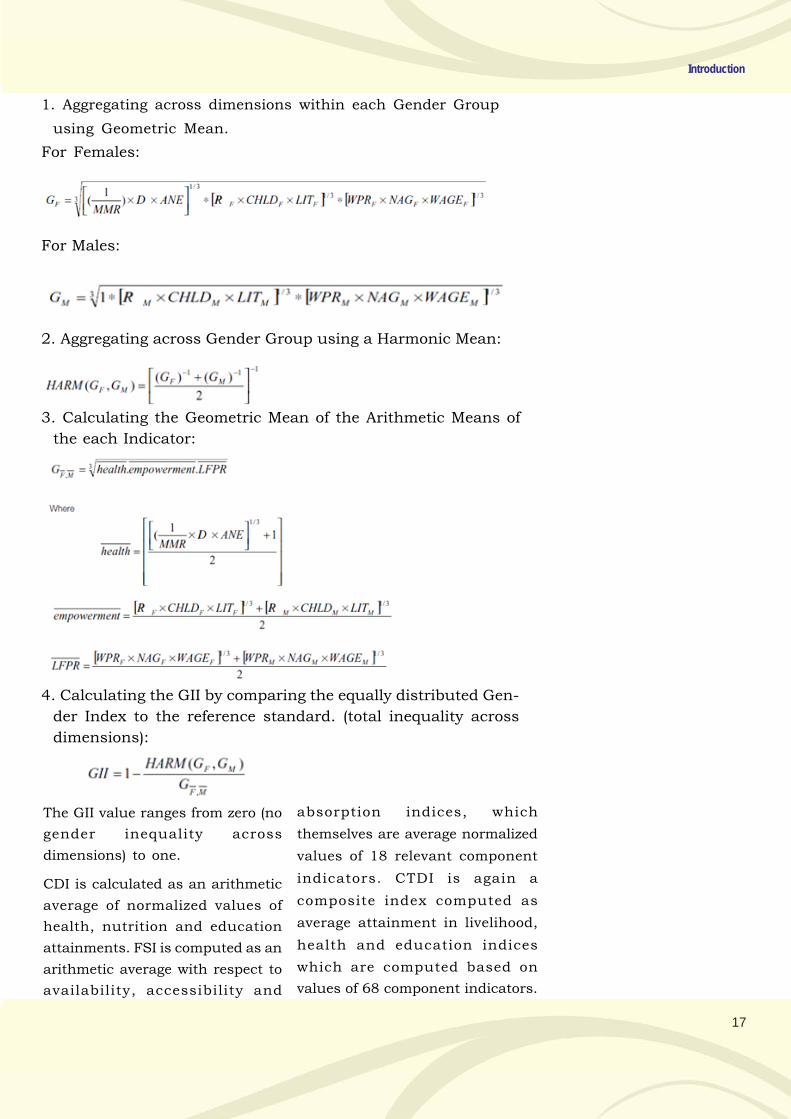
17
Introduction
1. Aggregating across dimensions within each Gender Group
using Geometric Mean.
For Females:
For Males:
2. Aggregating across Gender Group using a Harmonic Mean:
3. Calculating the Geometric Mean of the Arithmetic Means of
the each Indicator:
4. Calculating the GII by comparing the equally distributed Gen-
der Index to the reference standard. (total inequality across
dimensions):
The GII value ranges from zero (no
gender inequality across
dimensions) to one.
CDI is calculated as an arithmetic
average of normalized values of
health, nutrition and education
attainments. FSI is computed as an
arithmetic average with respect to
availability, accessibility and
absorption indices, which
themselves are average normalized
values of 18 relevant component
indicators. CTDI is again a
composite index computed as
average attainment in livelihood,
health and education indices
which are computed based on
values of 68 component indicators.
18
Raichur District Human Development Report 2014
UDI is also an arithmetic average of
normalized values for 11 indicators
across ULBs of the district.
The CDDI is computed as an
arithmetic average of attainments
with respect to education,
exclusion, discrimination,
freedom, living standard, gender
equality and access to basic
amenities of the selected gram
panchayat and the sample dalit
households. One gram panchayat
in the district, viz. Mundaragi, with
not less than fifty dalit households,
was selected for the study.
1.5. Concluding Remarks
Initially approaches to development
presumed a close link between
growth in GDP and well being of
people. Development being a
multidimensional concept with
numerous quality dimensions, is
not adequately captured in
unidimensional concept of income
and its growth. However, the
persistence of poverty, inequality
and deprivation compelled the
policy makers to search for
alternative approaches to measure
development. The HD approach
arose in part as a result of growing
criticism to the approaches
prevailing in the 1980s, which
presumed a close link between
national economic growth and
greater well-being. According to
the UNDP, the idea of human
development embodies the
objective of expanding the range of
people’s choices and creating an
enabling environment for people to
attain important capabilities of
leading a long, healthy and
creative life, to participate in
decision making, with a focus on
poor and the marginalized.
Therefore in the words of Amartya
Sen, it posited that human
development is about, “advancing
the richness of human life, rather
than the richness of the economy
in which human beings live”. The
HD approach iterates that people
are the real wealth of nations. The
basic objective of development is to
enable all people to flourish in
varied and creative ways.
The definition of HD has always
been flexible and open-ended and
there are as many dimensions of
human development as there are
ways of enlarging people’s choices.
But applying the approach
generally requires one to identify
things that matter to a particular
community at a point in time and
the HDRs, since the first in 1990,
have published the HDI as a
measure of HD. The HDI is a
summary composite index that
measures a country’s average
achievements in three basic
aspects of human development:
health, knowledge, and a decent
standard of living. Health is
measured by life expectancy at
birth; knowledge is measured by a
combination of the expected years;
and mean years of schooling; and
standard of living by GDP per capita
(PPP US$). The index always falls
between zero and one, with one
being the highest level of
development.
A populous nation
like India which is
predominantly
rural and farm
based is
confronted by
dual realities -
prosperity and
poverty. On one
hand, according to
Business Today,
India is ranked
15th among
nations with 175
millionaires and
on the other, it is
ranked 63rd in
Global Hunger
Index - 2013 and
136th in HDI -
2013, way off
from
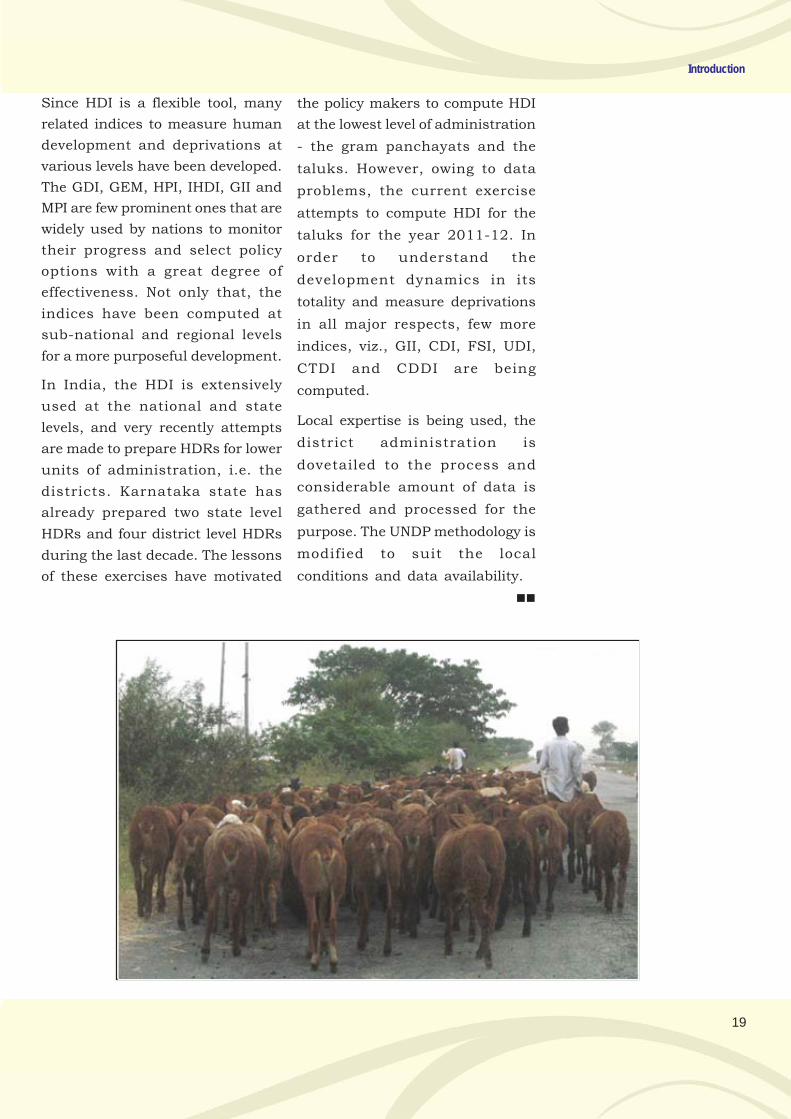
19
Introduction
Since HDI is a flexible tool, many
related indices to measure human
development and deprivations at
various levels have been developed.
The GDI, GEM, HPI, IHDI, GII and
MPI are few prominent ones that are
widely used by nations to monitor
their progress and select policy
options with a great degree of
effectiveness. Not only that, the
indices have been computed at
sub-national and regional levels
for a more purposeful development.
In India, the HDI is extensively
used at the national and state
levels, and very recently attempts
are made to prepare HDRs for lower
units of administration, i.e. the
districts. Karnataka state has
already prepared two state level
HDRs and four district level HDRs
during the last decade. The lessons
of these exercises have motivated
the policy makers to compute HDI
at the lowest level of administration
- the gram panchayats and the
taluks. However, owing to data
problems, the current exercise
attempts to compute HDI for the
taluks for the year 2011-12. In
order to understand the
development dynamics in its
totality and measure deprivations
in all major respects, few more
indices, viz., GII, CDI, FSI, UDI,
CTDI and CDDI are being
computed.
Local expertise is being used, the
district administration is
dovetailed to the process and
considerable amount of data is
gathered and processed for the
purpose. The UNDP methodology is
modified to suit the local
conditions and data availability.
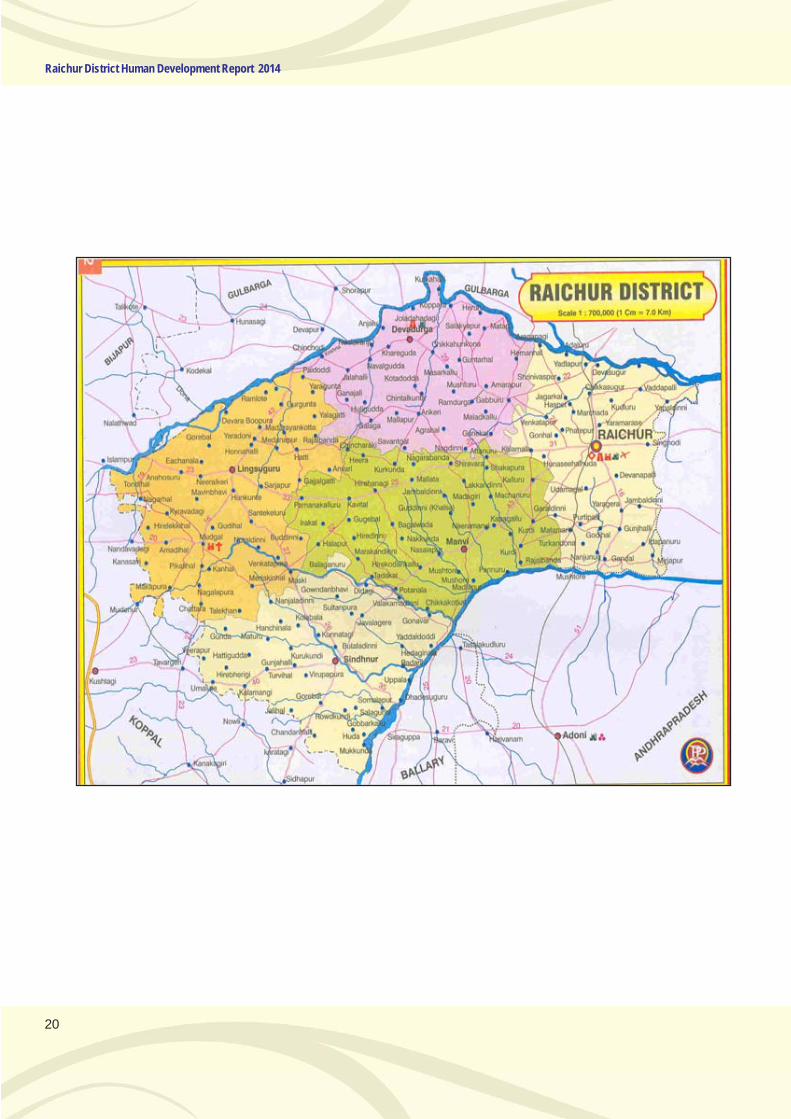
20
Raichur District Human Development Report 2014
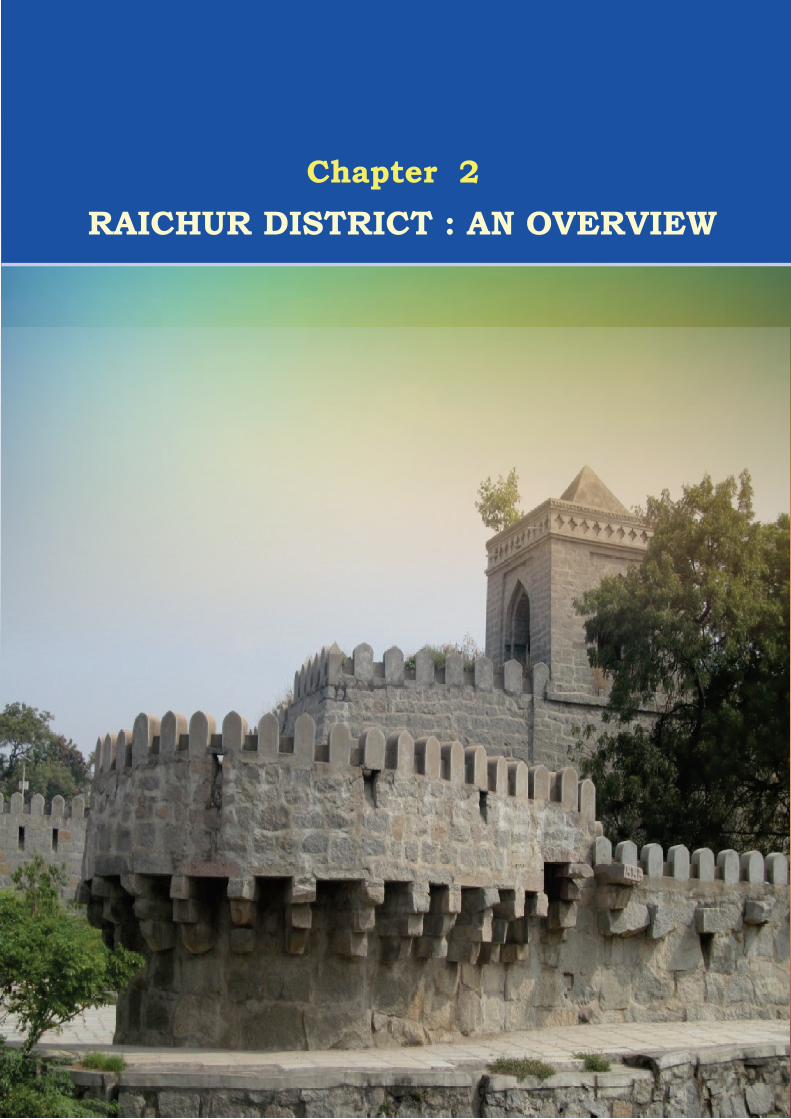
Chapter 2
RAICHUR DISTRICT : AN OVERVIEW

.
23
Chapter 2
Raichur District: An Overview
2.1. Introduction
Human development being a
composite index consisting of
education, health and livelihood
parameters depends largely on the
region-specific factors. Especially
the historical and cultural
background, the resource base,
agro-climatic factors, infrastructure
facilities and institutions to
promote development are very
important. Especially livelihood is
dependent on soil, climate, mineral
resource availability, agricultural
and industrial activity and facilities
for furthering these activities. In
this context, the present chapter
presents a brief historical,
physiographical, climatic and
developmental background of
Raichur district. This helps in
understanding the factors affecting
the level of present human
development and identifying the
constraints that need to be
addressed for improving
development in the future.
2.2. Background and Brief
Regional History
Being located in the rain shadow
area of northern maidan region of
Karnataka state and adjoining to
the rayalaseema region, Raichur
evokes a picture of drought,
backwardness, poverty, migration
and deprivations. The HPCFRRI
classifies it as one of the most
backward districts in the state.
Accordingly, not only the state
government has classified it as a
backward district, even the central
government has done so under the
BRGF scheme. However, despite
such efforts, the district continues
to remain backward. For instance,
the two Karnataka Human
Development Reports (KHDR)
prepared in 1999 and 2005, put
Raichur as the least developed
district and Devadurga as the least
developed taluk in the whole state.
It is one of the five districts in
Karnataka currently receiving
funds from the Backward Regions
Grant Fund Programme. How are
the physio-geographical features
responsible for this situation? How
have the historical and cultural
factors affected the development?
What has been the level and quality
of infrastructure? We seek to
provide answers to these questions
for placing the HD in Raichur
district in its proper perspective.
2.2.1. Brief Regional History
The district of Raichur has a hoary
past. It has had a rich beginning
from the days of the Mauryan King
Ashoka. A number of inscriptions,
rock edicts and other records,
temples, forts and battlefields bear
testimony to this fact. The recorded
history of the district is traced to the
third century B.C. Three minor
rock edicts of Ashoka - one at Maski
in Lingsugur taluk and the other
The two
Karnataka
Human
Development
Reports (KHDR)
prepared in
1999 and 2005,
put
Raichur as the
least developed
district and
Devadurga as
the least devel-
oped taluk in the
whole state.
24
Raichur District Human Development Report 2014
two near Koppal found in this
district prove that this area was
included in the territory of the great
Mauryan king Ashoka (273 - 236
B.C.). Early in the Christian era, the
district was a part of the kingdom
of the Satavahanas. The Vakatakas
reigned over the region during the
3rd and 4th centuries A.D., after
which it came under the Kadamba
control. The next dynasty of
importance, which ruled over this
region, was that of the Chalukyas
of Badami. According to an
inscription from Aihole, Pulikeshi-
II defeated the Pallavas, occupied
this area and made it a province in
his empire under the governance of
his son Adityavarma. Later it was
included in the dominions of the
Rashtrakutas, who rose to power in
the 8th century. According to an
inscription from Manvi taluk, one
Jagattunga, a subordinate ruler
under the Rashtrakuta king
Krishna-II, was ruling the province
of Adedore Eradusavirapranta, i.e.,
the area constituting the present
Raichur district.
Numerous inscriptions of the
Chalukyas of Kalyana, found in
various parts of the district, testify
to the fact that this region was
under their sway for a considerable
length of time between the 10th and
12th centuries A.D. There were
frequent wars between the Chola
kings of the south and the
Chalukyan kings of Kalyana for
supremacy over the Raichur region
and the territory passed into the
hands of the Cholas for a brief
period. The Haihayas and Sindas
also seem to have ruled some parts
of this region for some time. Later,
after the fall of the Chalukyas,
Raichur passed into the hands of
the Kalachuri kings. Then came the
Kakatiyas in the 13th century. A
number of inscriptions found
during these periods point to the
area as Rachavoor and later as
Permma Rachavoor. After the
decline of Kakatiya rulers the region
was captured by the Vijayanagar
kingdom. Krishnadevaraya of
Vijayanagara Empire recaptured
the region of Raichur in the year
1520 CE after the historic battle of
Raichur. During the rule of
Vijayanagara the area was captured
by the Bahmanis in 1323 CE. Later
the region was under the control of
Mughal Empire, Nizam of
Hyderabad and then British. In the
year 1956, Raichur became a part
of the Mysore state, later renamed
as Karnataka.
2.3 Physiographic Divisions of
the District
Raichur district is situated in the
northeastern part of Karnataka,
which is also popularly known as
Hyderabad Karnataka. Raichur
District lies between 15 degrees 9
minutes and 16 degrees and 344
minutes North latitude and 75
degrees 46 minutes and 77 degrees
35 minutes East longitude. The
general slope of the district is from
the north-west towards the South-
east, its average height above the
MSL being just 1131 feet. Spread
over a geographical area of 8,383
HGML - The only Gold
Mining Company in India
Hutti Gold Mines Com-
pany Limited (HGML),
Government of Karnataka
Undertaking (Established
in 1947 as Hyderabad
Gold Mines), has the
unique distinction of
being the only producer
of primary gold in the
country. HGML has been
active in the exploration,
development and exploi-
tation of gold deposits
occurring in Karnataka.
The Company’s Corporate
Office is situated in
Bangalore and it operates
two units-The Hutti Gold
unit (HGU) ,in Raichur
district and the
Chitradurga Gold Unit
(CGU) in Chitradurga
district with an operating
mine at Ajjanahalli
(Tumkur District) .HGU is
a fully integrated unit with
a capacity to produce
5,50,000 tonnes per
annum.
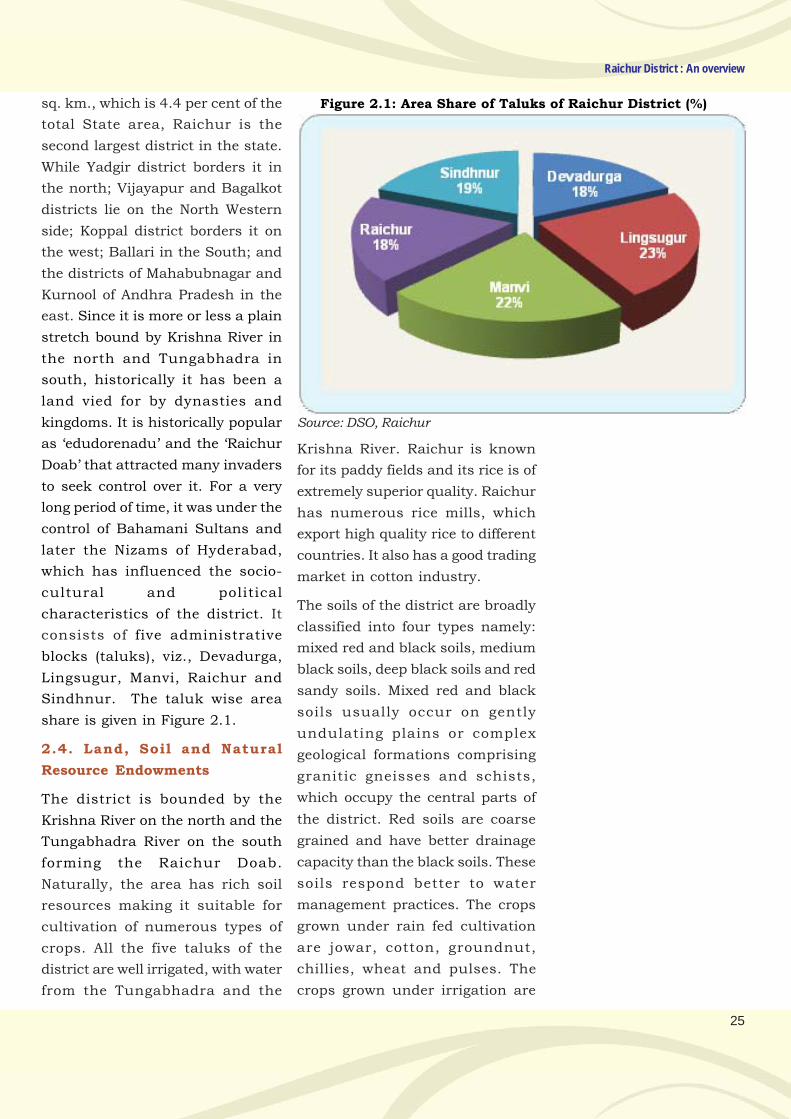
25
Raichur District : An overview
sq. km., which is 4.4 per cent of the
total State area, Raichur is the
second largest district in the state.
While Yadgir district borders it in
the north; Vijayapur and Bagalkot
districts lie on the North Western
side; Koppal district borders it on
the west; Ballari in the South; and
the districts of Mahabubnagar and
Kurnool of Andhra Pradesh in the
east. Since it is more or less a plain
stretch bound by Krishna River in
the north and Tungabhadra in
south, historically it has been a
land vied for by dynasties and
kingdoms. It is historically popular
as ‘edudorenadu’ and the ‘Raichur
Doab’ that attracted many invaders
to seek control over it. For a very
long period of time, it was under the
control of Bahamani Sultans and
later the Nizams of Hyderabad,
which has influenced the socio-
cultural and political
characteristics of the district. It
consists of five administrative
blocks (taluks), viz., Devadurga,
Lingsugur, Manvi, Raichur and
Sindhnur. The taluk wise area
share is given in Figure 2.1.
2.4. Land, Soil and Natural
Resource Endowments
The district is bounded by the
Krishna River on the north and the
Tungabhadra River on the south
forming the Raichur Doab.
Naturally, the area has rich soil
resources making it suitable for
cultivation of numerous types of
crops. All the five taluks of the
district are well irrigated, with water
from the Tungabhadra and the
Figure 2.1: Area Share of Taluks of Raichur District (%)
Krishna River. Raichur is known
for its paddy fields and its rice is of
extremely superior quality. Raichur
has numerous rice mills, which
export high quality rice to different
countries. It also has a good trading
market in cotton industry.
The soils of the district are broadly
classified into four types namely:
mixed red and black soils, medium
black soils, deep black soils and red
sandy soils. Mixed red and black
soils usually occur on gently
undulating plains or complex
geological formations comprising
granitic gneisses and schists,
which occupy the central parts of
the district. Red soils are coarse
grained and have better drainage
capacity than the black soils. These
soils respond better to water
management practices. The crops
grown under rain fed cultivation
are jowar, cotton, groundnut,
chillies, wheat and pulses. The
crops grown under irrigation are
Source: DSO, Raichur
26
Raichur District Human Development Report 2014
paddy, sugarcane, maize, wheat,
chillies, cotton, pulses, and
plantains
Medium black soils are seen in the
western part of the district overlying
the Peninsular Gneisses. The soils
are moderately deep, about one
metre thick and are dark to greyish,
brown to dark reddish brown or
black in colour. The crops grown
under rain fed cultivation are jowar,
wheat, millets, cotton, sunflower,
and groundnut. Under irrigation,
crops like paddy, sugarcane,
vegetables, onion, chillies, jowar,
cotton, wheat, and plantains are
grown.
Deep black soils occur on gently
sloping to nearly even or low
grounds on parent rocks like
gneisses, schists of mixed origin
and occupy considerable areas in
the northern parts of the district.
Nearly a metre in thickness these
soils are dark brown, dark greyish
brown or black in colour. The
texture is usually clayey throughout
the section and at places on the
surface clayey loam to silty clay
texture. Lime concretions on the
surface and sub surface are also
present. These soils are generally
fertile and produce good yields.
Good drainage facilities are
essential to obtain sustainable
yields; otherwise, salinity and water
logging conditions may develop.
Crops similar to medium black soils
are grown here.
Red sandy soils occur on
undulating landscape on acidic
rocks like granites and granitic
gneisses under three distinct
physiographic positions viz; upland,
midland and low land regions. Red
sandy soils occurring in the upland
region are shallow to moderately
deep, reddish-brown to dark
reddish in colour, with high
permeability and low yields. These
soils need development for
irrigation. Crops grown are Jowar,
Millets, Pulses and Groundnut. The
soils of the midland region are deep
to very deep reddish-brown, loamy-
sand to sandy-loam and well
developed with moderate
permeability and respond well to
irrigation. The crops grown are
similar as above. The soils of the
low land region are partially
deposited soils occurring on very
gently sloping to nearly flat valley
bottom areas. The soils are deep to
very deep dark brown, sandy-loam
to sandy clay, loam to clayey soil
in the sub-surface horizons. The
soils are poorly drained and with
low permeability. Saline patches
are seen at places. Yields are
generally good. The crops grown
under rain fed conditions are
jowar, groundnut, castor, and
cotton while under irrigation crops
like paddy, sugarcane, potato, etc,
are grown.
The cropping pattern of the district
is given in Table 2.1. Paddy is the
major crop followed by Jowar,
Bengal gram, sunflower, maize, tur,
cotton and ground nut. The other
crops occupy less than 1 per cent
of the NSA.
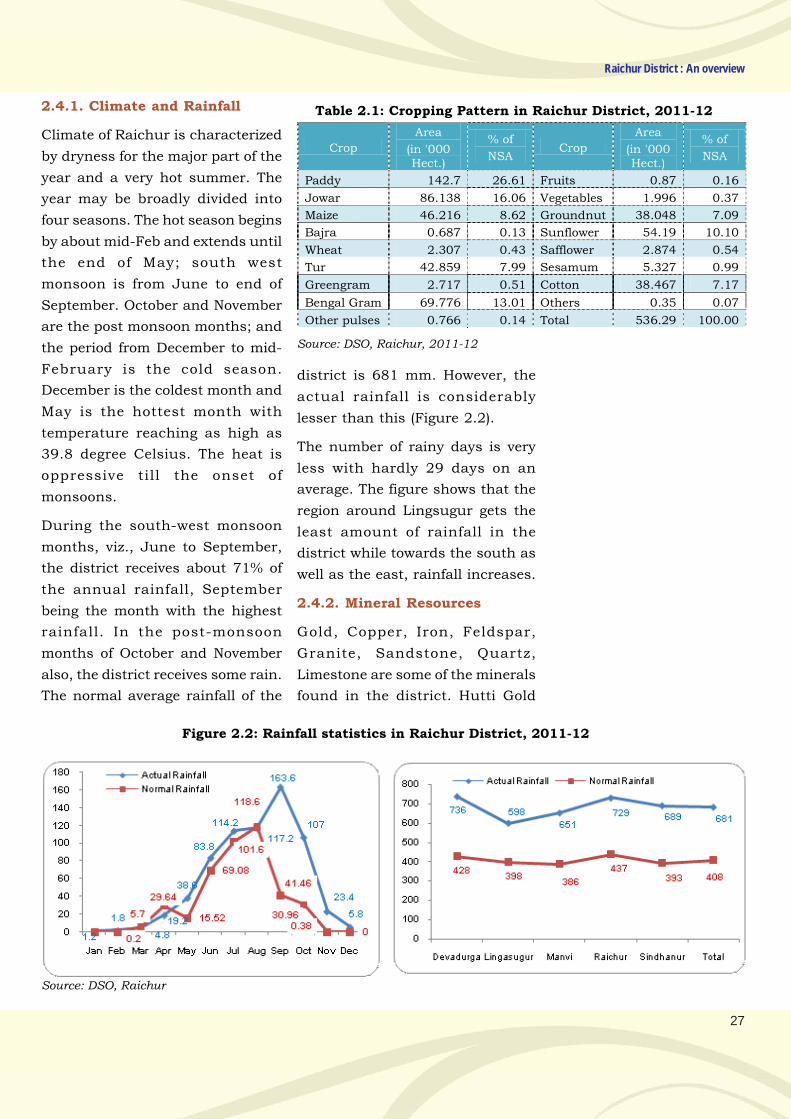
27
Raichur District : An overview
Table 2.1: Cropping Pattern in Raichur District, 2011-12
Crop
Area
(in '000 Hect.)
% of
NSA Crop
Area
(in '000 Hect.)
% of
NSA
Paddy 142.7 26.61 Fruits 0.87 0.16
Jowar 86.138 16.06 Vegetables 1.996 0.37
Maize 46.216 8.62 Groundnut 38.048 7.09
Bajra 0.687 0.13 Sunflower 54.19 10.10
Wheat 2.307 0.43 Safflower 2.874 0.54
Tur 42.859 7.99 Sesamum 5.327 0.99
Greengram 2.717 0.51 Cotton 38.467 7.17
Bengal Gram 69.776 13.01 Others 0.35 0.07
Other pulses 0.766 0.14 Total 536.29 100.00
Source: DSO, Raichur, 2011-12
2.4.1. Climate and Rainfall
Climate of Raichur is characterized
by dryness for the major part of the
year and a very hot summer. The
year may be broadly divided into
four seasons. The hot season begins
by about mid-Feb and extends until
the end of May; south west
monsoon is from June to end of
September. October and November
are the post monsoon months; and
the period from December to mid-
February is the cold season.
December is the coldest month and
May is the hottest month with
temperature reaching as high as
39.8 degree Celsius. The heat is
oppressive till the onset of
monsoons.
During the south-west monsoon
months, viz., June to September,
the district receives about 71% of
the annual rainfall, September
being the month with the highest
rainfall. In the post-monsoon
months of October and November
also, the district receives some rain.
The normal average rainfall of the
Figure 2.2: Rainfall statistics in Raichur District, 2011-12
district is 681 mm. However, the
actual rainfall is considerably
lesser than this (Figure 2.2).
The number of rainy days is very
less with hardly 29 days on an
average. The figure shows that the
region around Lingsugur gets the
least amount of rainfall in the
district while towards the south as
well as the east, rainfall increases.
2.4.2. Mineral Resources
Gold, Copper, Iron, Feldspar,
Granite, Sandstone, Quartz,
Limestone are some of the minerals
found in the district. Hutti Gold
Source: DSO, Raichur
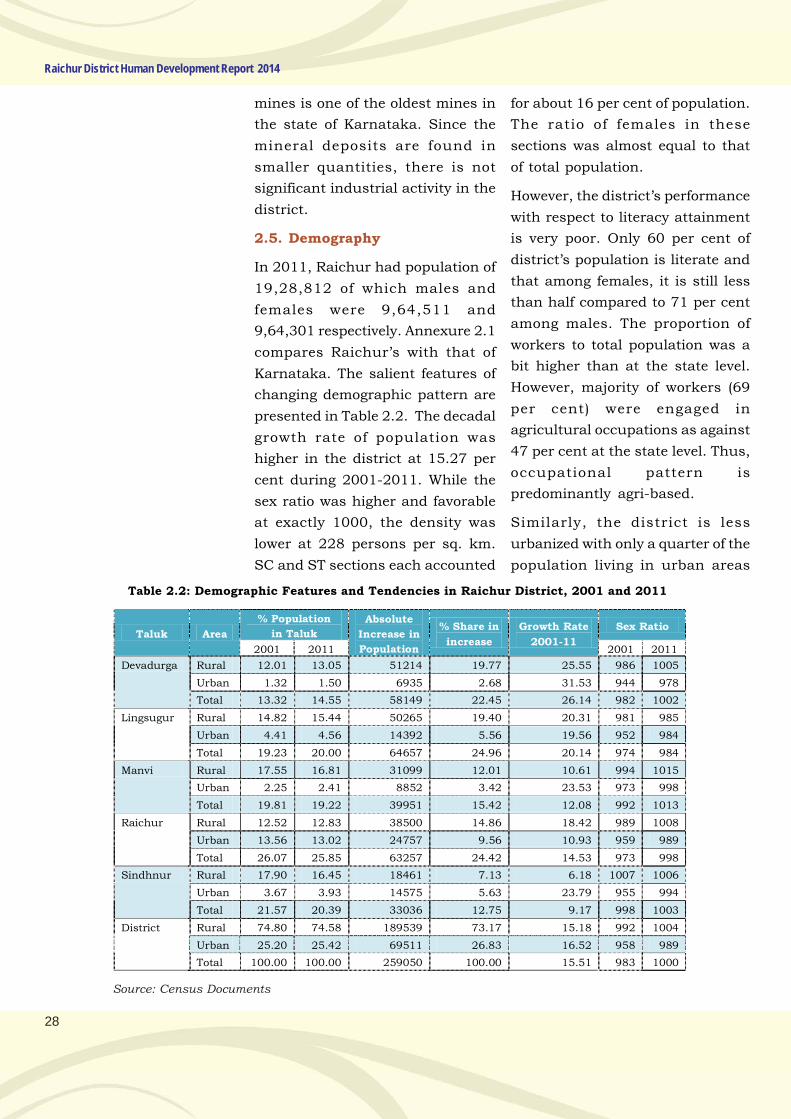
28
Raichur District Human Development Report 2014
mines is one of the oldest mines in
the state of Karnataka. Since the
mineral deposits are found in
smaller quantities, there is not
significant industrial activity in the
district.
2.5. Demography
In 2011, Raichur had population of
19,28,812 of which males and
females were 9,64,511 and
9,64,301 respectively. Annexure 2.1
compares Raichur’s with that of
Karnataka. The salient features of
changing demographic pattern are
presented in Table 2.2. The decadal
growth rate of population was
higher in the district at 15.27 per
cent during 2001-2011. While the
sex ratio was higher and favorable
at exactly 1000, the density was
lower at 228 persons per sq. km.
SC and ST sections each accounted
for about 16 per cent of population.
The ratio of females in these
sections was almost equal to that
of total population.
However, the district’s performance
with respect to literacy attainment
is very poor. Only 60 per cent of
district’s population is literate and
that among females, it is still less
than half compared to 71 per cent
among males. The proportion of
workers to total population was a
bit higher than at the state level.
However, majority of workers (69
per cent) were engaged in
agricultural occupations as against
47 per cent at the state level. Thus,
occupational pattern is
predominantly agri-based.
Similarly, the district is less
urbanized with only a quarter of the
population living in urban areas
Table 2.2: Demographic Features and Tendencies in Raichur District, 2001 and 2011
Taluk Area
% Population
in Taluk
Absolute
Increase in
Population
% Share in
increase
Growth Rate
2001-11
Sex Ratio
2001 2011 2001 2011
Devadurga Rural 12.01 13.05 51214 19.77 25.55 986 1005
Urban 1.32 1.50 6935 2.68 31.53 944 978
Total 13.32 14.55 58149 22.45 26.14 982 1002
Lingsugur Rural 14.82 15.44 50265 19.40 20.31 981 985
Urban 4.41 4.56 14392 5.56 19.56 952 984
Total 19.23 20.00 64657 24.96 20.14 974 984
Manvi Rural 17.55 16.81 31099 12.01 10.61 994 1015
Urban 2.25 2.41 8852 3.42 23.53 973 998
Total 19.81 19.22 39951 15.42 12.08 992 1013
Raichur Rural 12.52 12.83 38500 14.86 18.42 989 1008
Urban 13.56 13.02 24757 9.56 10.93 959 989
Total 26.07 25.85 63257 24.42 14.53 973 998
Sindhnur Rural 17.90 16.45 18461 7.13 6.18 1007 1006
Urban 3.67 3.93 14575 5.63 23.79 955 994
Total 21.57 20.39 33036 12.75 9.17 998 1003
District Rural 74.80 74.58 189539 73.17 15.18 992 1004
Urban 25.20 25.42 69511 26.83 16.52 958 989
Total 100.00 100.00 259050 100.00 15.51 983 1000
Source: Census Documents
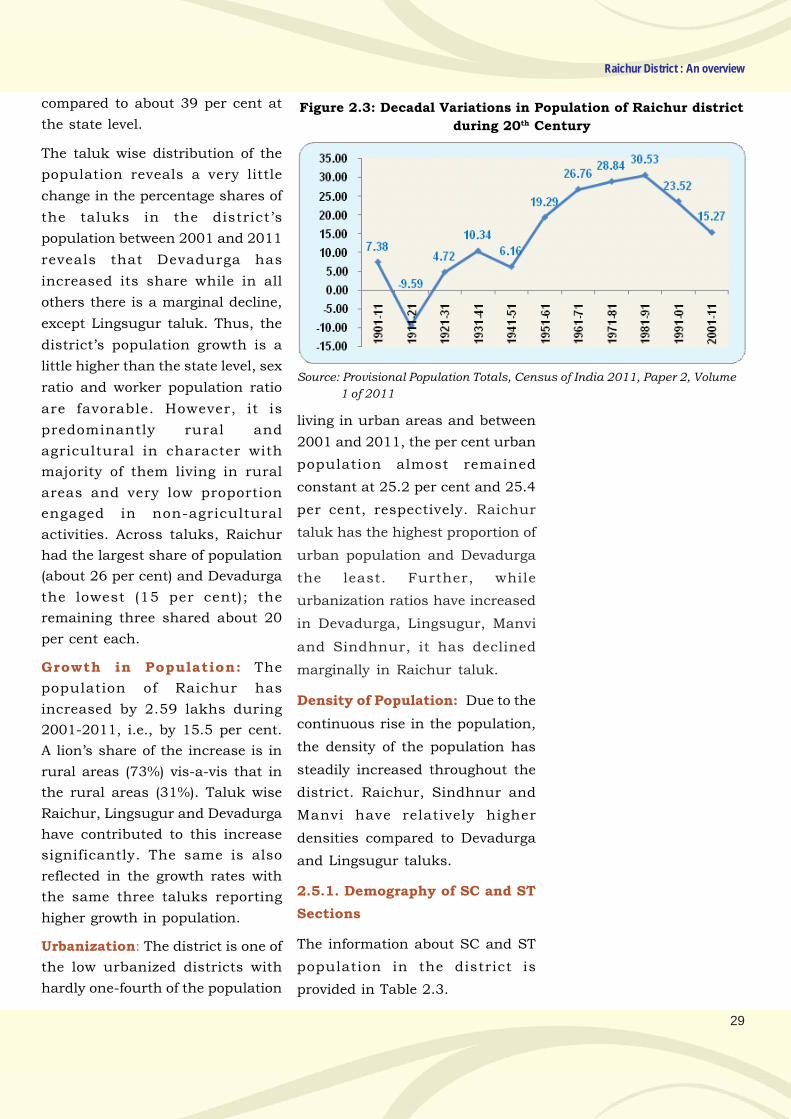
29
Raichur District : An overview
compared to about 39 per cent at
the state level.
The taluk wise distribution of the
population reveals a very little
change in the percentage shares of
the taluks in the district’s
population between 2001 and 2011
reveals that Devadurga has
increased its share while in all
others there is a marginal decline,
except Lingsugur taluk. Thus, the
district’s population growth is a
little higher than the state level, sex
ratio and worker population ratio
are favorable. However, it is
predominantly rural and
agricultural in character with
majority of them living in rural
areas and very low proportion
engaged in non-agricultural
activities. Across taluks, Raichur
had the largest share of population
(about 26 per cent) and Devadurga
the lowest (15 per cent); the
remaining three shared about 20
per cent each.
Growth in Population: The
population of Raichur has
increased by 2.59 lakhs during
2001-2011, i.e., by 15.5 per cent.
A lion’s share of the increase is in
rural areas (73%) vis-a-vis that in
the rural areas (31%). Taluk wise
Raichur, Lingsugur and Devadurga
have contributed to this increase
significantly. The same is also
reflected in the growth rates with
the same three taluks reporting
higher growth in population.
Urbanization: The district is one of
the low urbanized districts with
hardly one-fourth of the population
Figure 2.3: Decadal Variations in Population of Raichur district
during 20th Century
Source: Provisional Population Totals, Census of India 2011, Paper 2, Volume
1 of 2011
living in urban areas and between
2001 and 2011, the per cent urban
population almost remained
constant at 25.2 per cent and 25.4
per cent, respectively. Raichur
taluk has the highest proportion of
urban population and Devadurga
the least. Further, while
urbanization ratios have increased
in Devadurga, Lingsugur, Manvi
and Sindhnur, it has declined
marginally in Raichur taluk.
Density of Population: Due to the
continuous rise in the population,
the density of the population has
steadily increased throughout the
district. Raichur, Sindhnur and
Manvi have relatively higher
densities compared to Devadurga
and Lingsugur taluks.
2.5.1. Demography of SC and ST
Sections
The information about SC and ST
population in the district is
provided in Table 2.3.
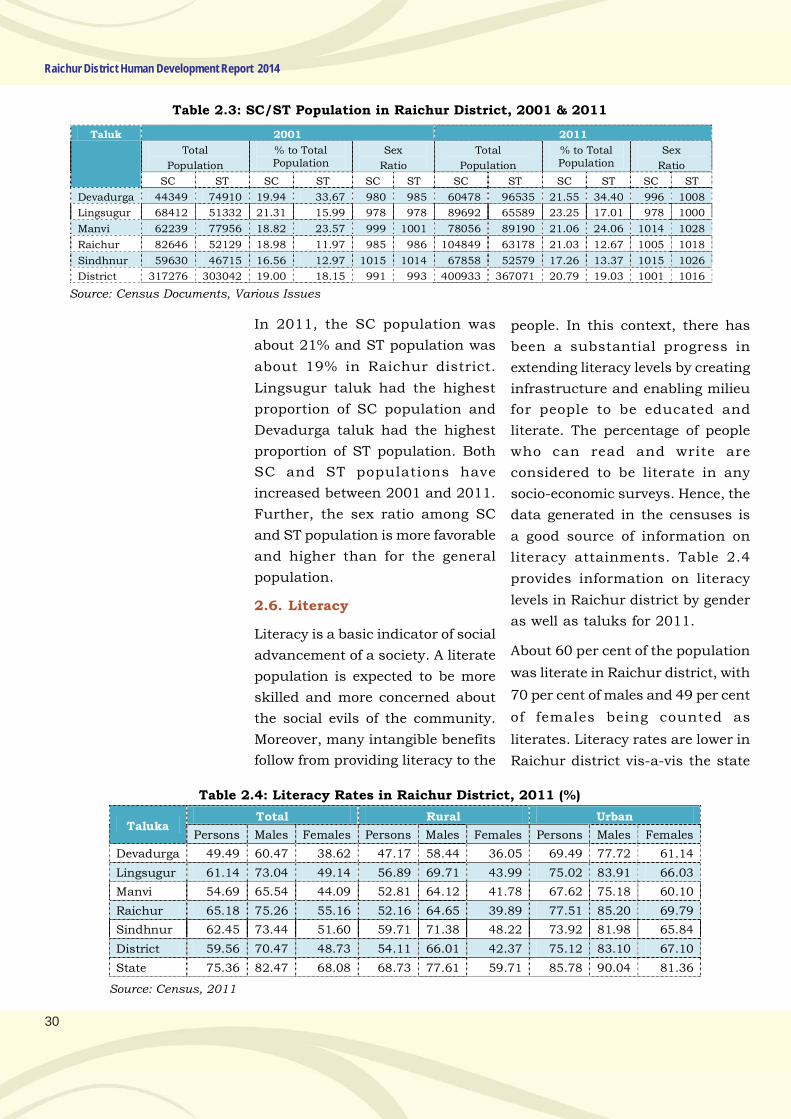
30
Raichur District Human Development Report 2014
Table 2.3: SC/ST Population in Raichur District, 2001 & 2011
Taluk 2001 2011
Total
Population
% to Total Population
Sex
Ratio
Total
Population
% to Total Population
Sex
Ratio
SC ST SC ST SC ST SC ST SC ST SC ST
Devadurga 44349 74910 19.94 33.67 980 985 60478 96535 21.55 34.40 996 1008
Lingsugur 68412 51332 21.31 15.99 978 978 89692 65589 23.25 17.01 978 1000
Manvi 62239 77956 18.82 23.57 999 1001 78056 89190 21.06 24.06 1014 1028
Raichur 82646 52129 18.98 11.97 985 986 104849 63178 21.03 12.67 1005 1018
Sindhnur 59630 46715 16.56 12.97 1015 1014 67858 52579 17.26 13.37 1015 1026
District 317276 303042 19.00 18.15 991 993 400933 367071 20.79 19.03 1001 1016
Source: Census Documents, Various Issues
In 2011, the SC population was
about 21% and ST population was
about 19% in Raichur district.
Lingsugur taluk had the highest
proportion of SC population and
Devadurga taluk had the highest
proportion of ST population. Both
SC and ST populations have
increased between 2001 and 2011.
Further, the sex ratio among SC
and ST population is more favorable
and higher than for the general
population.
2.6. Literacy
Literacy is a basic indicator of social
advancement of a society. A literate
population is expected to be more
skilled and more concerned about
the social evils of the community.
Moreover, many intangible benefits
follow from providing literacy to the
people. In this context, there has
been a substantial progress in
extending literacy levels by creating
infrastructure and enabling milieu
for people to be educated and
literate. The percentage of people
who can read and write are
considered to be literate in any
socio-economic surveys. Hence, the
data generated in the censuses is
a good source of information on
literacy attainments. Table 2.4
provides information on literacy
levels in Raichur district by gender
as well as taluks for 2011.
About 60 per cent of the population
was literate in Raichur district, with
70 per cent of males and 49 per cent
of females being counted as
literates. Literacy rates are lower in
Raichur district vis-a-vis the state
Table 2.4: Literacy Rates in Raichur District, 2011 (%)
Taluka Total Rural Urban
Persons Males Females Persons Males Females Persons Males Females
Devadurga 49.49 60.47 38.62 47.17 58.44 36.05 69.49 77.72 61.14
Lingsugur 61.14 73.04 49.14 56.89 69.71 43.99 75.02 83.91 66.03
Manvi 54.69 65.54 44.09 52.81 64.12 41.78 67.62 75.18 60.10
Raichur 65.18 75.26 55.16 52.16 64.65 39.89 77.51 85.20 69.79
Sindhnur 62.45 73.44 51.60 59.71 71.38 48.22 73.92 81.98 65.84
District 59.56 70.47 48.73 54.11 66.01 42.37 75.12 83.10 67.10
State 75.36 82.47 68.08 68.73 77.61 59.71 85.78 90.04 81.36
Source: Census, 2011
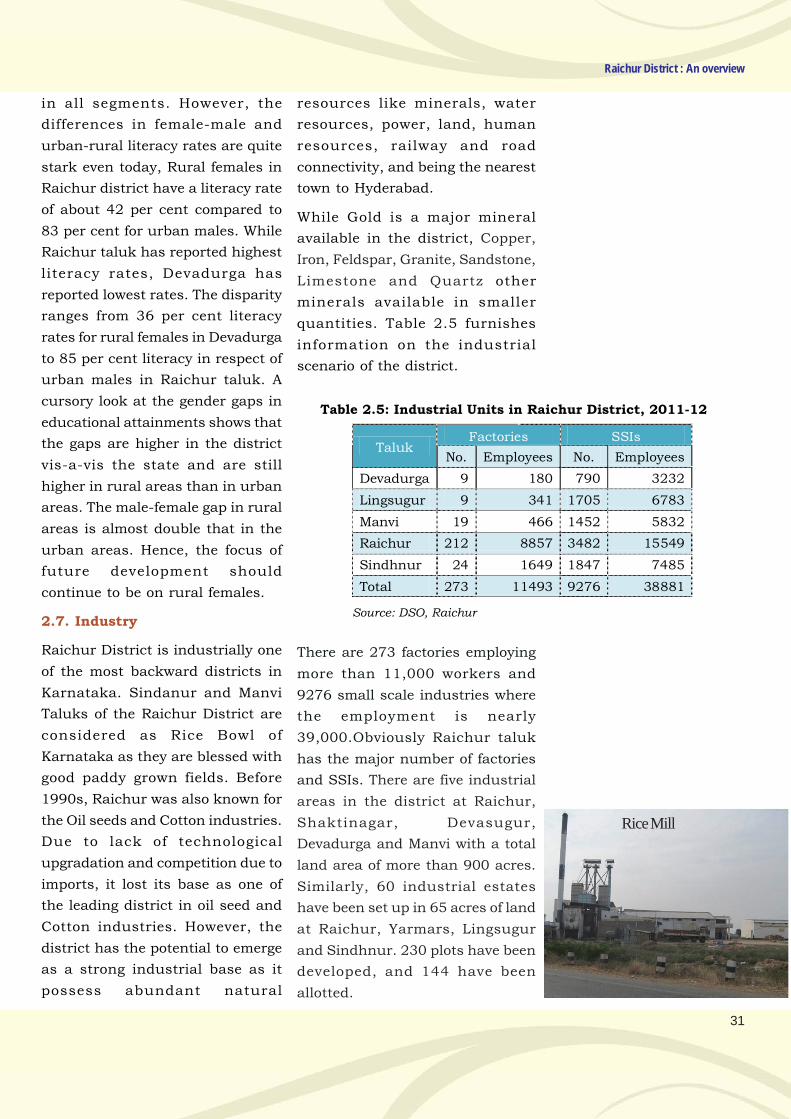
31
Raichur District : An overview
in all segments. However, the
differences in female-male and
urban-rural literacy rates are quite
stark even today, Rural females in
Raichur district have a literacy rate
of about 42 per cent compared to
83 per cent for urban males. While
Raichur taluk has reported highest
literacy rates, Devadurga has
reported lowest rates. The disparity
ranges from 36 per cent literacy
rates for rural females in Devadurga
to 85 per cent literacy in respect of
urban males in Raichur taluk. A
cursory look at the gender gaps in
educational attainments shows that
the gaps are higher in the district
vis-a-vis the state and are still
higher in rural areas than in urban
areas. The male-female gap in rural
areas is almost double that in the
urban areas. Hence, the focus of
future development should
continue to be on rural females.
2.7. Industry
Raichur District is industrially one
of the most backward districts in
Karnataka. Sindanur and Manvi
Taluks of the Raichur District are
considered as Rice Bowl of
Karnataka as they are blessed with
good paddy grown fields. Before
1990s, Raichur was also known for
the Oil seeds and Cotton industries.
Due to lack of technological
upgradation and competition due to
imports, it lost its base as one of
the leading district in oil seed and
Cotton industries. However, the
district has the potential to emerge
as a strong industrial base as it
possess abundant natural
resources like minerals, water
resources, power, land, human
resources, railway and road
connectivity, and being the nearest
town to Hyderabad.
While Gold is a major mineral
available in the district, Copper,
Iron, Feldspar, Granite, Sandstone,
Limestone and Quartz other
minerals available in smaller
quantities. Table 2.5 furnishes
information on the industrial
scenario of the district.
Table 2.5: Industrial Units in Raichur District, 2011-12
Taluk Factories SSIs
No. Employees No. Employees
Devadurga 9 180 790 3232
Lingsugur 9 341 1705 6783
Manvi 19 466 1452 5832
Raichur 212 8857 3482 15549
Sindhnur 24 1649 1847 7485
Total 273 11493 9276 38881
Source: DSO, Raichur
There are 273 factories employing
more than 11,000 workers and
9276 small scale industries where
the employment is nearly
39,000.Obviously Raichur taluk
has the major number of factories
and SSIs. There are five industrial
areas in the district at Raichur,
Shaktinagar, Devasugur,
Devadurga and Manvi with a total
land area of more than 900 acres.
Similarly, 60 industrial estates
have been set up in 65 acres of land
at Raichur, Yarmars, Lingsugur
and Sindhnur. 230 plots have been
developed, and 144 have been
allotted.
Rice Mill
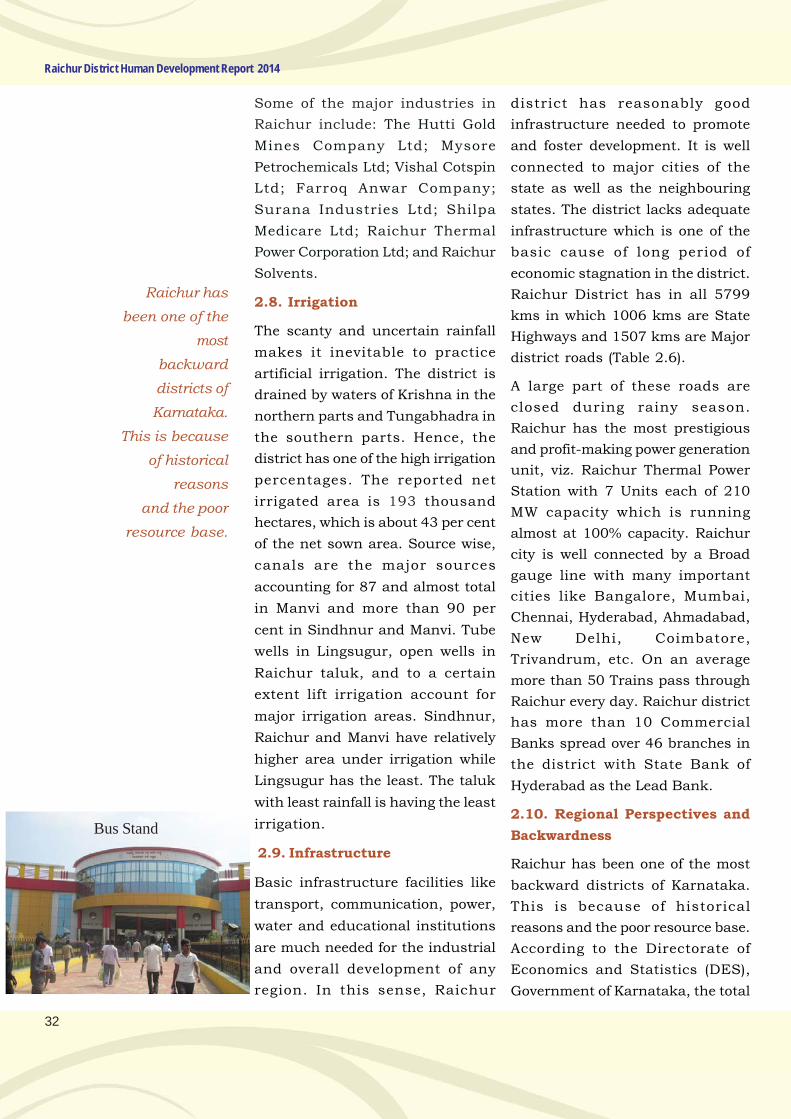
32
Raichur District Human Development Report 2014
Some of the major industries in
Raichur include: The Hutti Gold
Mines Company Ltd; Mysore
Petrochemicals Ltd; Vishal Cotspin
Ltd; Farroq Anwar Company;
Surana Industries Ltd; Shilpa
Medicare Ltd; Raichur Thermal
Power Corporation Ltd; and Raichur
Solvents.
2.8. Irrigation
The scanty and uncertain rainfall
makes it inevitable to practice
artificial irrigation. The district is
drained by waters of Krishna in the
northern parts and Tungabhadra in
the southern parts. Hence, the
district has one of the high irrigation
percentages. The reported net
irrigated area is 193 thousand
hectares, which is about 43 per cent
of the net sown area. Source wise,
canals are the major sources
accounting for 87 and almost total
in Manvi and more than 90 per
cent in Sindhnur and Manvi. Tube
wells in Lingsugur, open wells in
Raichur taluk, and to a certain
extent lift irrigation account for
major irrigation areas. Sindhnur,
Raichur and Manvi have relatively
higher area under irrigation while
Lingsugur has the least. The taluk
with least rainfall is having the least
irrigation.
2.9. Infrastructure
Basic infrastructure facilities like
transport, communication, power,
water and educational institutions
are much needed for the industrial
and overall development of any
region. In this sense, Raichur
district has reasonably good
infrastructure needed to promote
and foster development. It is well
connected to major cities of the
state as well as the neighbouring
states. The district lacks adequate
infrastructure which is one of the
basic cause of long period of
economic stagnation in the district.
Raichur District has in all 5799
kms in which 1006 kms are State
Highways and 1507 kms are Major
district roads (Table 2.6).
A large part of these roads are
closed during rainy season.
Raichur has the most prestigious
and profit-making power generation
unit, viz. Raichur Thermal Power
Station with 7 Units each of 210
MW capacity which is running
almost at 100% capacity. Raichur
city is well connected by a Broad
gauge line with many important
cities like Bangalore, Mumbai,
Chennai, Hyderabad, Ahmadabad,
New Delhi, Coimbatore,
Trivandrum, etc. On an average
more than 50 Trains pass through
Raichur every day. Raichur district
has more than 10 Commercial
Banks spread over 46 branches in
the district with State Bank of
Hyderabad as the Lead Bank.
2.10. Regional Perspectives and
Backwardness
Raichur has been one of the most
backward districts of Karnataka.
This is because of historical
reasons and the poor resource base.
According to the Directorate of
Economics and Statistics (DES),
Government of Karnataka, the total
Raichur has
been one of the
most
backward
districts of
Karnataka.
This is because
of historical
reasons
and the poor
resource base.
Bus Stand
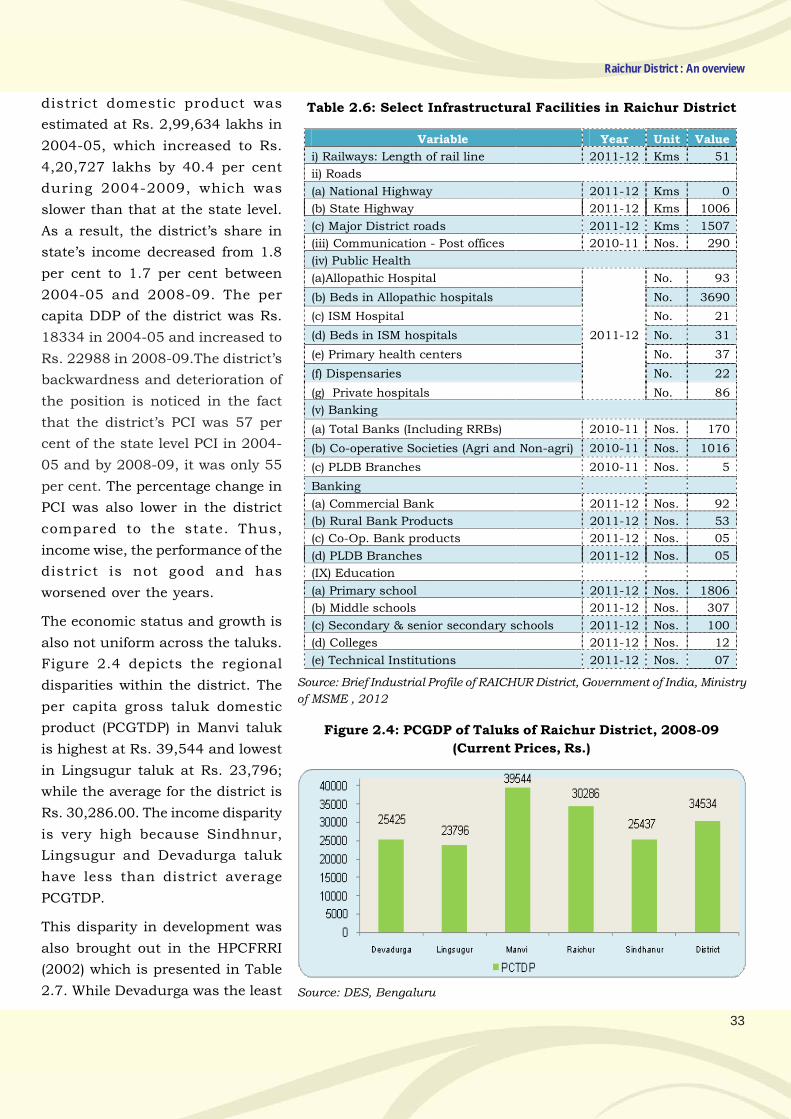
33
Raichur District : An overview
Table 2.6: Select Infrastructural Facilities in Raichur District
Variable Year Unit Value
i) Railways: Length of rail line 2011-12 Kms 51
ii) Roads
(a) National Highway 2011-12 Kms 0
(b) State Highway 2011-12 Kms 1006
(c) Major District roads 2011-12 Kms 1507
(iii) Communication - Post offices 2010-11 Nos. 290
(iv) Public Health
(a)Allopathic Hospital
2011-12
No. 93
(b) Beds in Allopathic hospitals No. 3690
(c) ISM Hospital No. 21
(d) Beds in ISM hospitals No. 31
(e) Primary health centers No. 37
(f) Dispensaries No. 22
(g) Private hospitals No. 86
(v) Banking
(a) Total Banks (Including RRBs) 2010-11 Nos. 170
(b) Co-operative Societies (Agri and Non-agri) 2010-11 Nos. 1016
(c) PLDB Branches 2010-11 Nos. 5
Banking
(a) Commercial Bank 2011-12 Nos. 92
(b) Rural Bank Products 2011-12 Nos. 53
(c) Co-Op. Bank products 2011-12 Nos. 05
(d) PLDB Branches 2011-12 Nos. 05
(IX) Education
(a) Primary school 2011-12 Nos. 1806
(b) Middle schools 2011-12 Nos. 307
(c) Secondary & senior secondary schools 2011-12 Nos. 100
(d) Colleges 2011-12 Nos. 12
(e) Technical Institutions 2011-12 Nos. 07
Source: Brief Industrial Profile of RAICHUR District, Government of India, Ministry
of MSME , 2012
district domestic product was
estimated at Rs. 2,99,634 lakhs in
2004-05, which increased to Rs.
4,20,727 lakhs by 40.4 per cent
during 2004-2009, which was
slower than that at the state level.
As a result, the district’s share in
state’s income decreased from 1.8
per cent to 1.7 per cent between
2004-05 and 2008-09. The per
capita DDP of the district was Rs.
18334 in 2004-05 and increased to
Rs. 22988 in 2008-09.The district’s
backwardness and deterioration of
the position is noticed in the fact
that the district’s PCI was 57 per
cent of the state level PCI in 2004-
05 and by 2008-09, it was only 55
per cent. The percentage change in
PCI was also lower in the district
compared to the state. Thus,
income wise, the performance of the
district is not good and has
worsened over the years.
The economic status and growth is
also not uniform across the taluks.
Figure 2.4 depicts the regional
disparities within the district. The
per capita gross taluk domestic
product (PCGTDP) in Manvi taluk
is highest at Rs. 39,544 and lowest
in Lingsugur taluk at Rs. 23,796;
while the average for the district is
Rs. 30,286.00. The income disparity
is very high because Sindhnur,
Lingsugur and Devadurga taluk
have less than district average
PCGTDP.
This disparity in development was
also brought out in the HPCFRRI
(2002) which is presented in Table
2.7. While Devadurga was the least
Figure 2.4: PCGDP of Taluks of Raichur District, 2008-09
(Current Prices, Rs.)
Source: DES, Bengaluru
34
Raichur District Human Development Report 2014
developed taluk in the state,
Lingsugur was one of the 10 least
developed taluks in 2002. Position
of Manvi and Sindhnur taluks is
equally precarious. Except Raichur,
which was classified as a more
backward taluk, all others were in
the most backward category. The
values of comprehensive composite
development index (CCDI) were very
low and ranged from 0.53 for
Devadurga to 0.87 for Raichur.
Thus, there are stark regional
deprivations. These are reflected in
the components of CCDI as well and
in all the components - agriculture,
industry, finance and trade,
economic and social infrastructure,
and demographic indicators - the
district’s position is in the least
developed group.
Table 2.7: Relative Development of Taluks of Raichur District,
2001
Sl.
No.
Taluk CCDI value
Rank in
the State
Status
1 Devadurga 0.53 175 Most Backward
2 Lingsugur 0.63 169 Most Backward
3 Manvi 0.69 160 Most Backward
4 Raichur 0.87 107 More Backward
5 Sindhnur 0.78 141 Most Backward
Source: HPCFRRI, 2002
Table 2.8: District wise HDI and GDI – 1991 and 2001
Region Human Development Index %
change 1991 Rank 2001 Rank
Raichur District 0.443 27 0.547 27 23.48
Karnataka 0.541 0.650 20.15
Gender Development Index
Raichur District 0.422 27 0.530 27 25.59
Karnataka 0.525 0.637 21.33
Source: Karnataka Human Development Reports, 1999 and 2005
Similar regional pattern of regional
backwardness is noticed in HD
parameters as well. Table 2.8
provides information on values of
human and gender development
indicators as computed by the state
HDRs for 1991 and 2001. The
district had the least value of HDI
in both 1991 as well as 2001, but
the percent change in the value was
little higher than at the state level.
The district occupied the last rank
in HDI in both the years, implying
minimum human development
status. With respect to GDI, though
the value has increased by more
than the value of the state but that
has not been able to improve the
ranking of the district and it
continues to be in the last place.
Hence, the district is backward in
terms of both income and human
development.
2.11. An Overview
The district is one of the
traditionally backward districts of
the state characterized by higher
population growth, high mortality
rates, low levels of literacy, poor
natural resource base leading to
slow and stagnant industrial
growth. Hence, the district has very
low income and is ranked last in
HD attainments in the state. The
district has three taluks that fall in
the 10 least developed taluks.
Despite a huge area being canal
irrigated has not helped the people
to enjoy a decent standard of living.
Migration is still a rampant feature
of population of Raichur district.
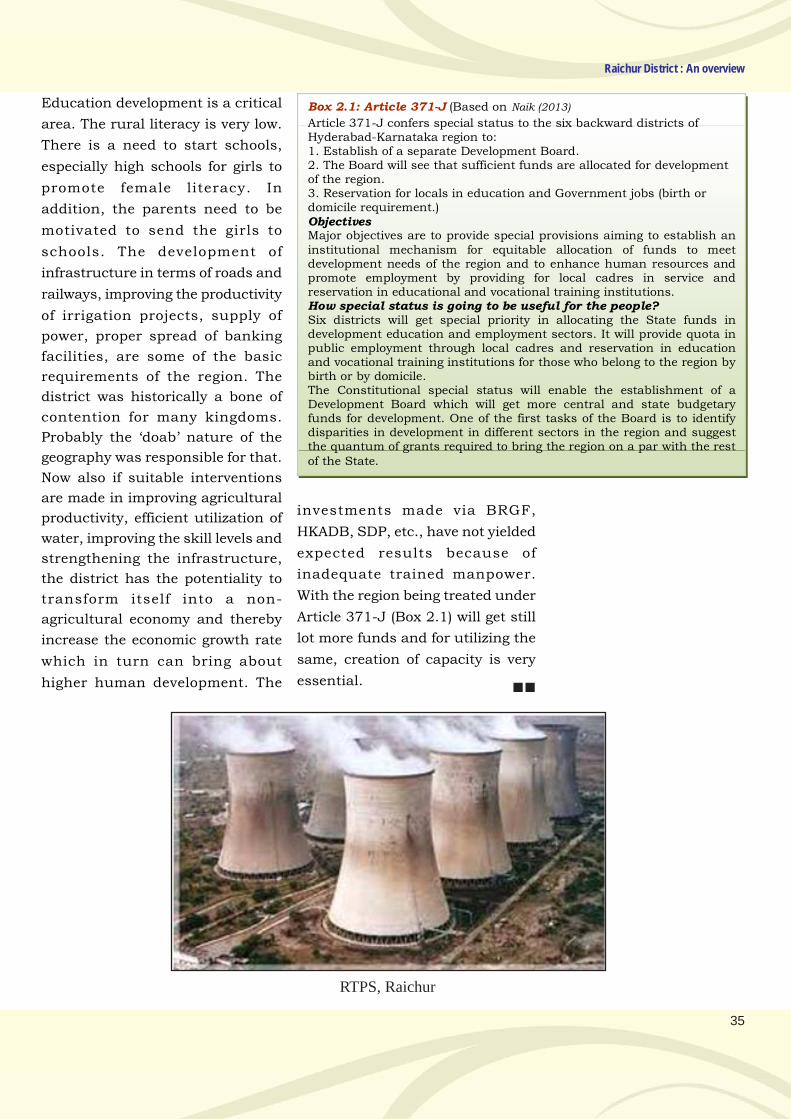
35
Raichur District : An overview
Education development is a critical
area. The rural literacy is very low.
There is a need to start schools,
especially high schools for girls to
promote female literacy. In
addition, the parents need to be
motivated to send the girls to
schools. The development of
infrastructure in terms of roads and
railways, improving the productivity
of irrigation projects, supply of
power, proper spread of banking
facilities, are some of the basic
requirements of the region. The
district was historically a bone of
contention for many kingdoms.
Probably the ‘doab’ nature of the
geography was responsible for that.
Now also if suitable interventions
are made in improving agricultural
productivity, efficient utilization of
water, improving the skill levels and
strengthening the infrastructure,
the district has the potentiality to
transform itself into a non-
agricultural economy and thereby
increase the economic growth rate
which in turn can bring about
higher human development. The
Box 2.1: Article 371-J (Based on Naik (2013)
Article 371-J confers special status to the six backward districts of Hyderabad-Karnataka region to: 1. Establish of a separate Development Board. 2. The Board will see that sufficient funds are allocated for development of the region. 3. Reservation for locals in education and Government jobs (birth or domicile requirement.) Objectives Major objectives are to provide special provisions aiming to establish an institutional mechanism for equitable allocation of funds to meet development needs of the region and to enhance human resources and promote employment by providing for local cadres in service and reservation in educational and vocational training institutions. How special status is going to be useful for the people? Six districts will get special priority in allocating the State funds in development education and employment sectors. It will provide quota in public employment through local cadres and reservation in education and vocational training institutions for those who belong to the region by birth or by domicile. The Constitutional special status will enable the establishment of a Development Board which will get more central and state budgetary funds for development. One of the first tasks of the Board is to identify disparities in development in different sectors in the region and suggest the quantum of grants required to bring the region on a par with the rest of the State.
investments made via BRGF,
HKADB, SDP, etc., have not yielded
expected results because of
inadequate trained manpower.
With the region being treated under
Article 371-J (Box 2.1) will get still
lot more funds and for utilizing the
same, creation of capacity is very
essential.
RTPS, Raichur
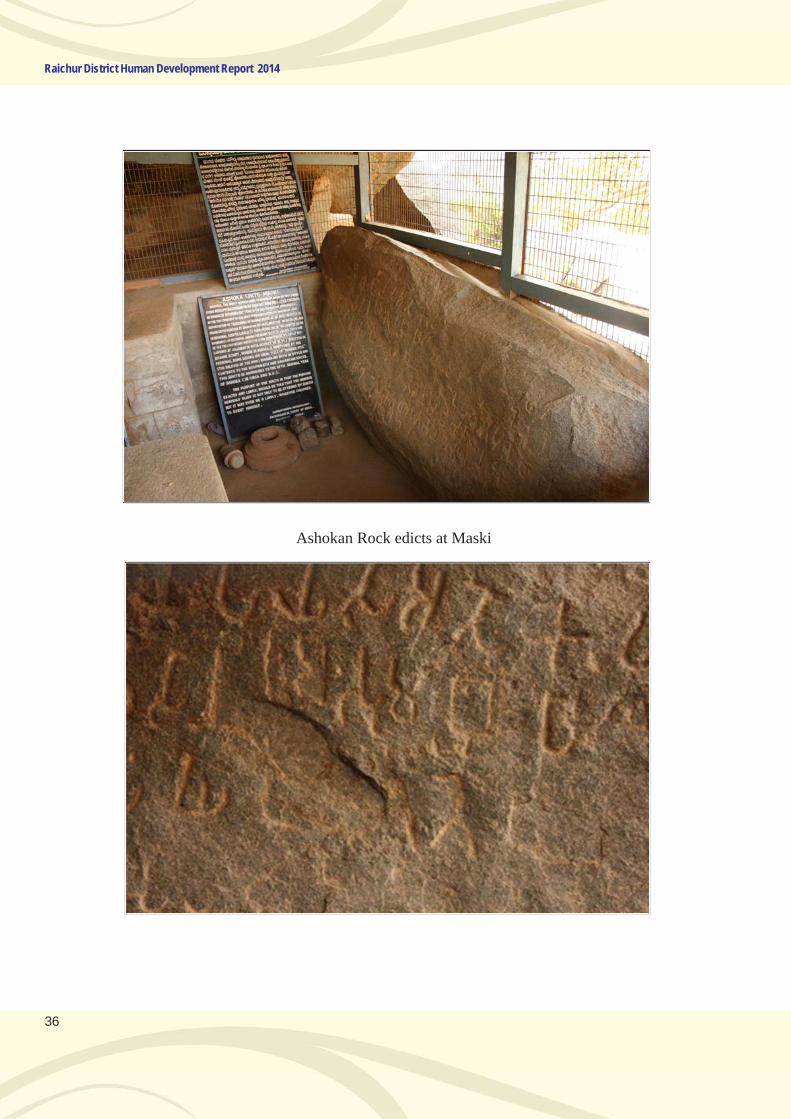
36
Raichur District Human Development Report 2014
Ashokan Rock edicts at Maski
Chapter 3
COMPUTATION OF INDICES

.
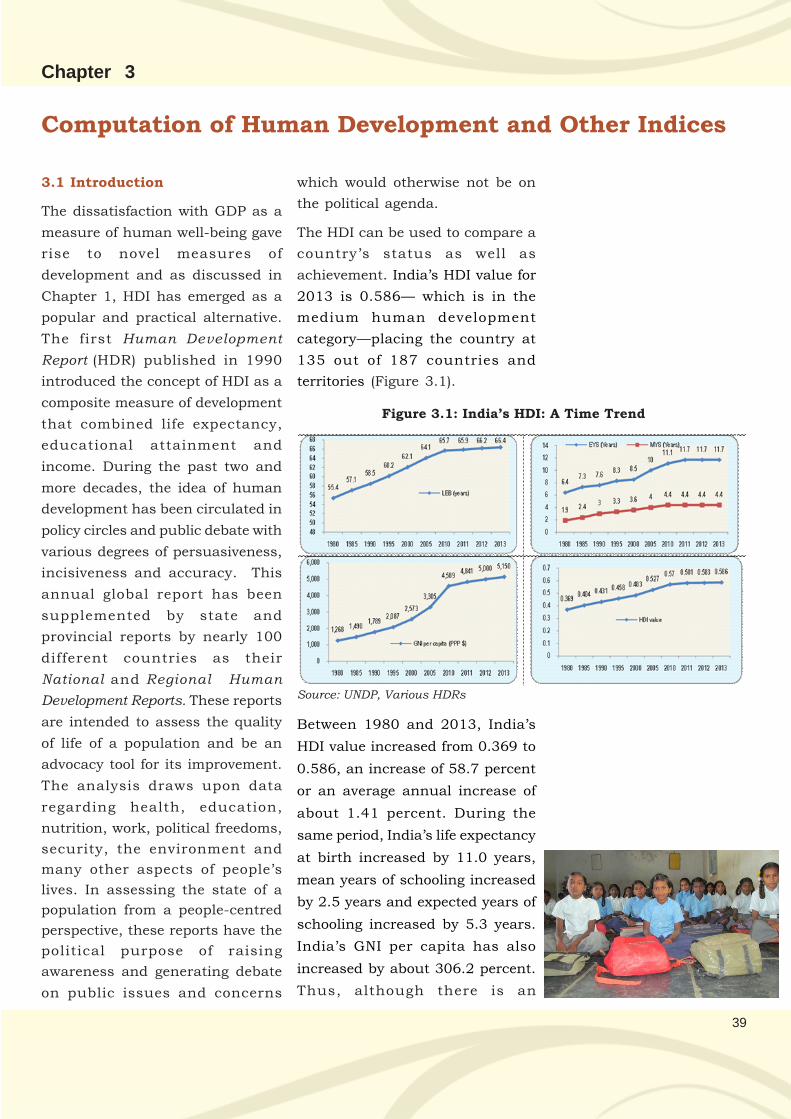
39
Chapter 3
Computation of Human Development and Other Indices
3.1 Introduction
The dissatisfaction with GDP as a
measure of human well-being gave
rise to novel measures of
development and as discussed in
Chapter 1, HDI has emerged as a
popular and practical alternative.
The first Human Development
Report (HDR) published in 1990
introduced the concept of HDI as a
composite measure of development
that combined life expectancy,
educational attainment and
income. During the past two and
more decades, the idea of human
development has been circulated in
policy circles and public debate with
various degrees of persuasiveness,
incisiveness and accuracy. This
annual global report has been
supplemented by state and
provincial reports by nearly 100
different countries as their
National and Regional Human
Development Reports. These reports
are intended to assess the quality
of life of a population and be an
advocacy tool for its improvement.
The analysis draws upon data
regarding health, education,
nutrition, work, political freedoms,
security, the environment and
many other aspects of people’s
lives. In assessing the state of a
population from a people-centred
perspective, these reports have the
political purpose of raising
awareness and generating debate
on public issues and concerns
which would otherwise not be on
the political agenda.
The HDI can be used to compare a
country’s status as well as
achievement. India’s HDI value for
2013 is 0.586— which is in the
medium human development
category—placing the country at
135 out of 187 countries and
territories (Figure 3.1).
Figure 3.1: India’s HDI: A Time Trend
Source: UNDP, Various HDRs
Between 1980 and 2013, India’s
HDI value increased from 0.369 to
0.586, an increase of 58.7 percent
or an average annual increase of
about 1.41 percent. During the
same period, India’s life expectancy
at birth increased by 11.0 years,
mean years of schooling increased
by 2.5 years and expected years of
schooling increased by 5.3 years.
India’s GNI per capita has also
increased by about 306.2 percent.
Thus, although there is an
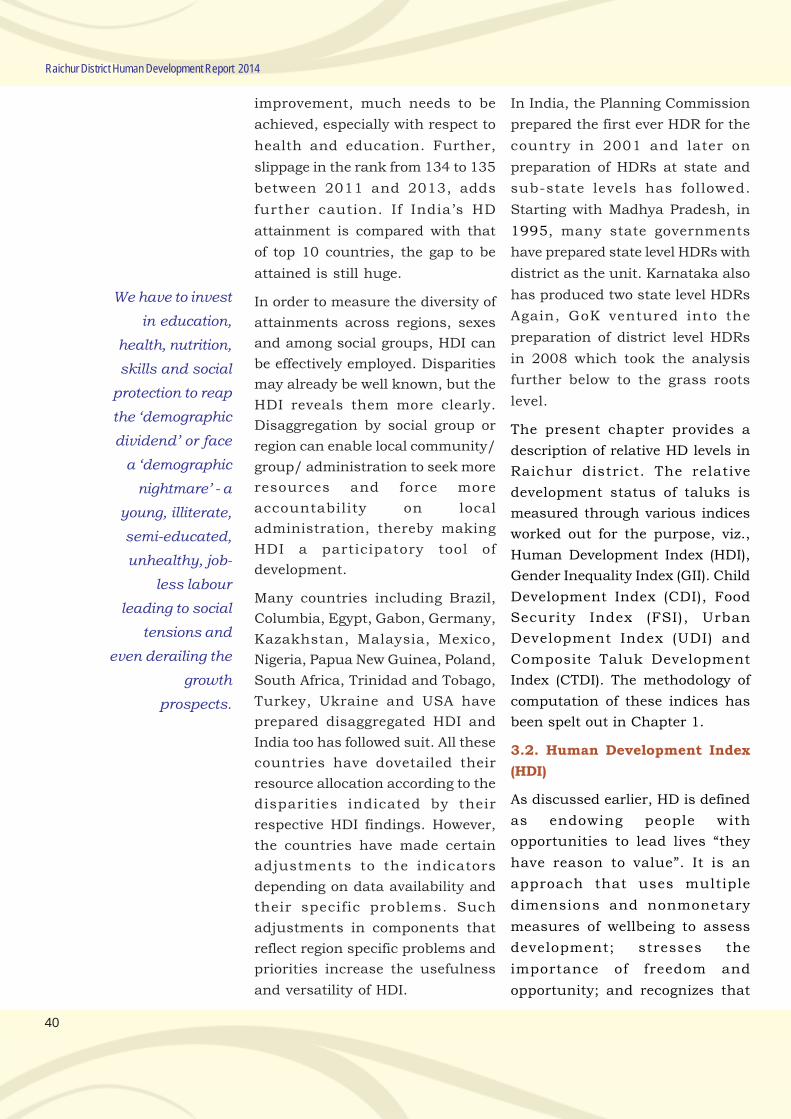
40
Raichur District Human Development Report 2014
improvement, much needs to be
achieved, especially with respect to
health and education. Further,
slippage in the rank from 134 to 135
between 2011 and 2013, adds
further caution. If India’s HD
attainment is compared with that
of top 10 countries, the gap to be
attained is still huge.
In order to measure the diversity of
attainments across regions, sexes
and among social groups, HDI can
be effectively employed. Disparities
may already be well known, but the
HDI reveals them more clearly.
Disaggregation by social group or
region can enable local community/
group/ administration to seek more
resources and force more
accountability on local
administration, thereby making
HDI a participatory tool of
development.
Many countries including Brazil,
Columbia, Egypt, Gabon, Germany,
Kazakhstan, Malaysia, Mexico,
Nigeria, Papua New Guinea, Poland,
South Africa, Trinidad and Tobago,
Turkey, Ukraine and USA have
prepared disaggregated HDI and
India too has followed suit. All these
countries have dovetailed their
resource allocation according to the
disparities indicated by their
respective HDI findings. However,
the countries have made certain
adjustments to the indicators
depending on data availability and
their specific problems. Such
adjustments in components that
reflect region specific problems and
priorities increase the usefulness
and versatility of HDI.
In India, the Planning Commission
prepared the first ever HDR for the
country in 2001 and later on
preparation of HDRs at state and
sub-state levels has followed.
Starting with Madhya Pradesh, in
1995, many state governments
have prepared state level HDRs with
district as the unit. Karnataka also
has produced two state level HDRs
Again, GoK ventured into the
preparation of district level HDRs
in 2008 which took the analysis
further below to the grass roots
level.
The present chapter provides a
description of relative HD levels in
Raichur district. The relative
development status of taluks is
measured through various indices
worked out for the purpose, viz.,
Human Development Index (HDI),
Gender Inequality Index (GII). Child
Development Index (CDI), Food
Security Index (FSI), Urban
Development Index (UDI) and
Composite Taluk Development
Index (CTDI). The methodology of
computation of these indices has
been spelt out in Chapter 1.
3.2. Human Development Index
(HDI)
As discussed earlier, HD is defined
as endowing people with
opportunities to lead lives “they
have reason to value”. It is an
approach that uses multiple
dimensions and nonmonetary
measures of wellbeing to assess
development; stresses the
importance of freedom and
opportunity; and recognizes that
We have to invest
in education,
health, nutrition,
skills and social
protection to reap
the ‘demographic
dividend’ or face
a ‘demographic
nightmare’ - a
young, illiterate,
semi-educated,
unhealthy, job-
less labour
leading to social
tensions and
even derailing the
growth
prospects.
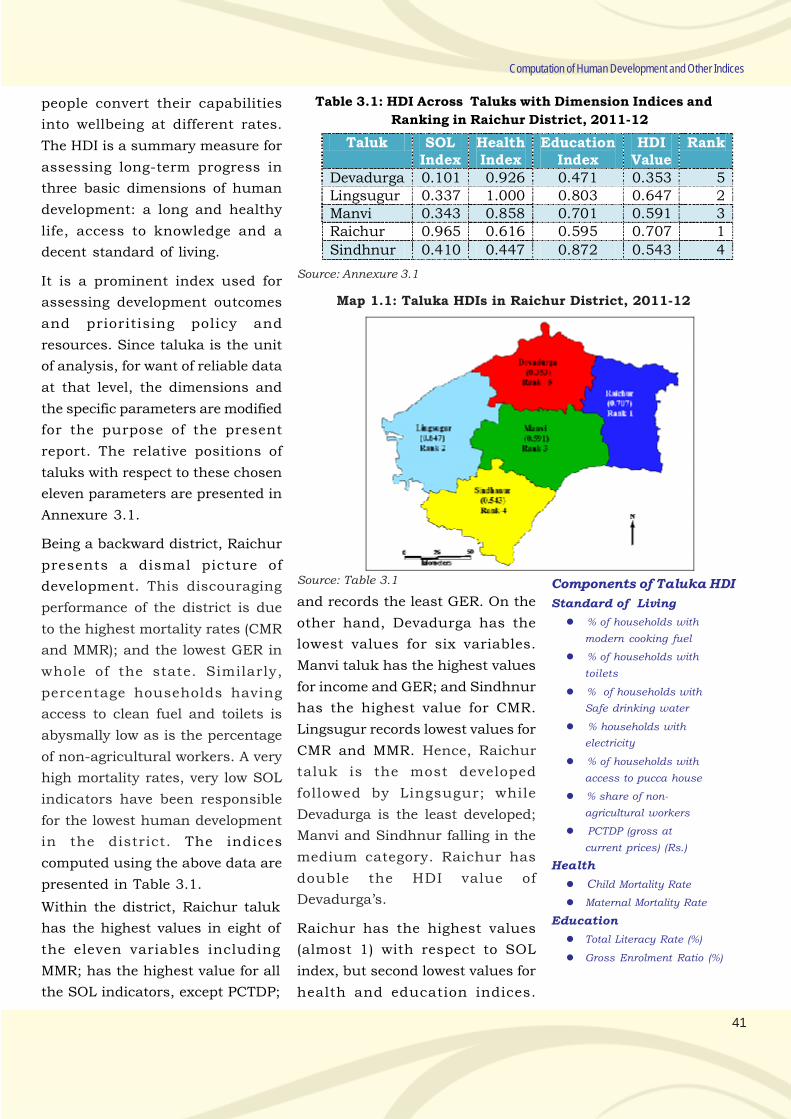
41
Computation of Human Development and Other Indices
people convert their capabilities
into wellbeing at different rates.
The HDI is a summary measure for
assessing long-term progress in
three basic dimensions of human
development: a long and healthy
life, access to knowledge and a
decent standard of living.
It is a prominent index used for
assessing development outcomes
and prioritising policy and
resources. Since taluka is the unit
of analysis, for want of reliable data
at that level, the dimensions and
the specific parameters are modified
for the purpose of the present
report. The relative positions of
taluks with respect to these chosen
eleven parameters are presented in
Annexure 3.1.
Being a backward district, Raichur
presents a dismal picture of
development. This discouraging
performance of the district is due
to the highest mortality rates (CMR
and MMR); and the lowest GER in
whole of the state. Similarly,
percentage households having
access to clean fuel and toilets is
abysmally low as is the percentage
of non-agricultural workers. A very
high mortality rates, very low SOL
indicators have been responsible
for the lowest human development
in the district. The indices
computed using the above data are
presented in Table 3.1.
Table 3.1: HDI Across Taluks with Dimension Indices and
Ranking in Raichur District, 2011-12
Source: Annexure 3.1
Within the district, Raichur taluk
has the highest values in eight of
the eleven variables including
MMR; has the highest value for all
the SOL indicators, except PCTDP;
Map 1.1: Taluka HDIs in Raichur District, 2011-12
Source: Table 3.1
Taluk SOL Index
Health Index
Education Index
HDI Value
Rank
Devadurga 0.101 0.926 0.471 0.353 5 Lingsugur 0.337 1.000 0.803 0.647 2 Manvi 0.343 0.858 0.701 0.591 3 Raichur 0.965 0.616 0.595 0.707 1
Sindhnur 0.410 0.447 0.872 0.543 4
and records the least GER. On the
other hand, Devadurga has the
lowest values for six variables.
Manvi taluk has the highest values
for income and GER; and Sindhnur
has the highest value for CMR.
Lingsugur records lowest values for
CMR and MMR. Hence, Raichur
taluk is the most developed
followed by Lingsugur; while
Devadurga is the least developed;
Manvi and Sindhnur falling in the
medium category. Raichur has
double the HDI value of
Devadurga’s.
Raichur has the highest values
(almost 1) with respect to SOL
index, but second lowest values for
health and education indices.
Components of Taluka HDI
Standard of Living
% of households with
modern cooking fuel
% of households with
toilets
% of households with
Safe drinking water
% households with
electricity
% of households with
access to pucca house
% share of non-
agricultural workers
PCTDP (gross at
current prices) (Rs.)
Health
Child Mortality Rate
Maternal Mortality Rate
Education
Total Literacy Rate (%)
Gross Enrolment Ratio (%)
42
Raichur District Human Development Report 2014
Sindhnur has the highest value for
education index and Lingsugur has
the highest value for health index.
Lingsugur also has second highest
value for education index.
Devadurga has the least values for
SOL and education indices. What
matters for relative positioning of
the taluks is the stark inequality in
SOL index, where as others are
more equally developed. Thus,
across variables, one notices
unequal development in each taluk.
A decomposition of the average HDI
value for the district shows that
health index predominantly
influences performance in HD,
followed by education and standard
of living. Health and educational
performances accounted for nearly
77 per cent of HDI value.
Indicator wise analysis shows that
access to safe cooking fuels is
inadequate - Devadurga reporting
hardly 5 per cent and Raichur
reporting the highest proportion of
25%. Access to toilets is also
unsatisfactory with maximum
value being 34% in Raichur and
lowest being 7% in Devadurga.
Drinking water facility is available
to around 50% of households,
except Raichur, where it is 75%.
Access to electricity is relatively
better at around 80-90%, but
universal availability of electricity
is still a distant goal.
Housing status is poor with only
about half of the households in
Raichur taluk; about one-third in
Lingsugur and Sindhnur taluks;
and less than one-third in Manvi
and Devadurga taluks reporting as
living pucca houses. Notable fallout
is the participation in non-
agricultural work which is very low
except in Raichur (51%) and
Lingsugur (32%) taluks. PCTDP is
in a comparable range, with Manvi
and Sindhnur reporting high
income and Lingsugur, the lowest.
Mortality rates - CMR and MMR are
high but are more or less equally
spread across taluks. The severest
deprivation is in terms of TLR with
only less than half of Devadurga’s
population being literate and in no
taluk the TLR has reached two-
third level. GER is also very low
indicating the huge deprivation in
educational front.
3.2.1. Human Development
Status among SC/ST and others
In the absence of data on standard
parameters to compute HDI for SC
and ST population, an average of
important amenities and assets
possessed by the households is
computed to reflect their HD status.
The amenities and assets
considered are good houses, access
to safe drinking water, electricity,
toilet, bathroom, drainage, clean
cooking fuel, radio, TV, computer/
laptop, telephone/ landline/
mobile, two wheeler and car. These
assets are indicative of the standard
of living of a household as they
contribute toward improvement in
other dimensions of HD like
education, health and livelihood.
Annexure 3.2 provides information
on the asset possession across
social groups. Of course,
A decomposition
of the average
HDI
value for the
district shows
that
health index
predominantly
influences
performance in
HD, followed by
education and
standard of
living. Health
and educational
performances
accounted for
nearly 77 per
cent of HDI
value.
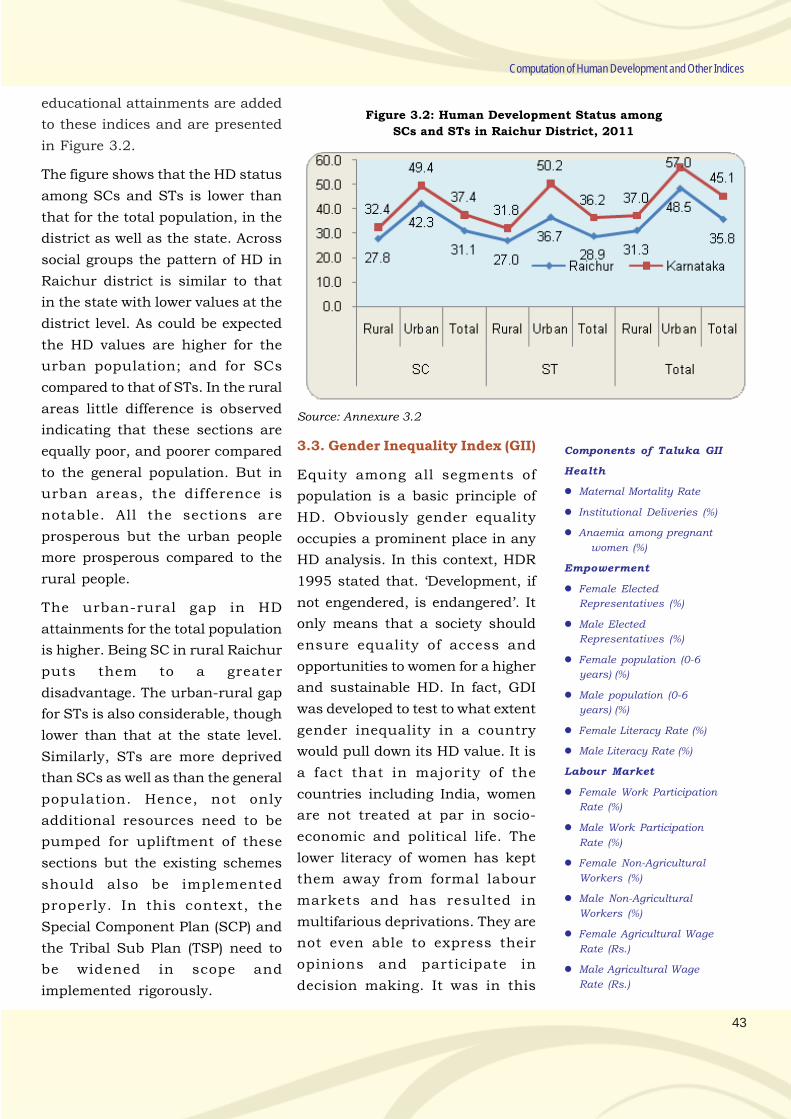
43
Computation of Human Development and Other Indices
educational attainments are added
to these indices and are presented
in Figure 3.2.
The figure shows that the HD status
among SCs and STs is lower than
that for the total population, in the
district as well as the state. Across
social groups the pattern of HD in
Raichur district is similar to that
in the state with lower values at the
district level. As could be expected
the HD values are higher for the
urban population; and for SCs
compared to that of STs. In the rural
areas little difference is observed
indicating that these sections are
equally poor, and poorer compared
to the general population. But in
urban areas, the difference is
notable. All the sections are
prosperous but the urban people
more prosperous compared to the
rural people.
The urban-rural gap in HD
attainments for the total population
is higher. Being SC in rural Raichur
puts them to a greater
disadvantage. The urban-rural gap
for STs is also considerable, though
lower than that at the state level.
Similarly, STs are more deprived
than SCs as well as than the general
population. Hence, not only
additional resources need to be
pumped for upliftment of these
sections but the existing schemes
should also be implemented
properly. In this context, the
Special Component Plan (SCP) and
the Tribal Sub Plan (TSP) need to
be widened in scope and
implemented rigorously.
Figure 3.2: Human Development Status among
SCs and STs in Raichur District, 2011
Source: Annexure 3.2
3.3. Gender Inequality Index (GII)
Equity among all segments of
population is a basic principle of
HD. Obviously gender equality
occupies a prominent place in any
HD analysis. In this context, HDR
1995 stated that. ‘Development, if
not engendered, is endangered’. It
only means that a society should
ensure equality of access and
opportunities to women for a higher
and sustainable HD. In fact, GDI
was developed to test to what extent
gender inequality in a country
would pull down its HD value. It is
a fact that in majority of the
countries including India, women
are not treated at par in socio-
economic and political life. The
lower literacy of women has kept
them away from formal labour
markets and has resulted in
multifarious deprivations. They are
not even able to express their
opinions and participate in
decision making. It was in this
Components of Taluka GII
Health
Maternal Mortality Rate
Institutional Deliveries (%)
Anaemia among pregnant
women (%)
Empowerment
Female Elected
Representatives (%)
Male Elected
Representatives (%)
Female population (0-6
years) (%)
Male population (0-6
years) (%)
Female Literacy Rate (%)
Male Literacy Rate (%)
Labour Market
Female Work Participation
Rate (%)
Male Work Participation
Rate (%)
Female Non-Agricultural
Workers (%)
Male Non-Agricultural
Workers (%)
Female Agricultural Wage
Rate (Rs.)
Male Agricultural Wage
Rate (Rs.)
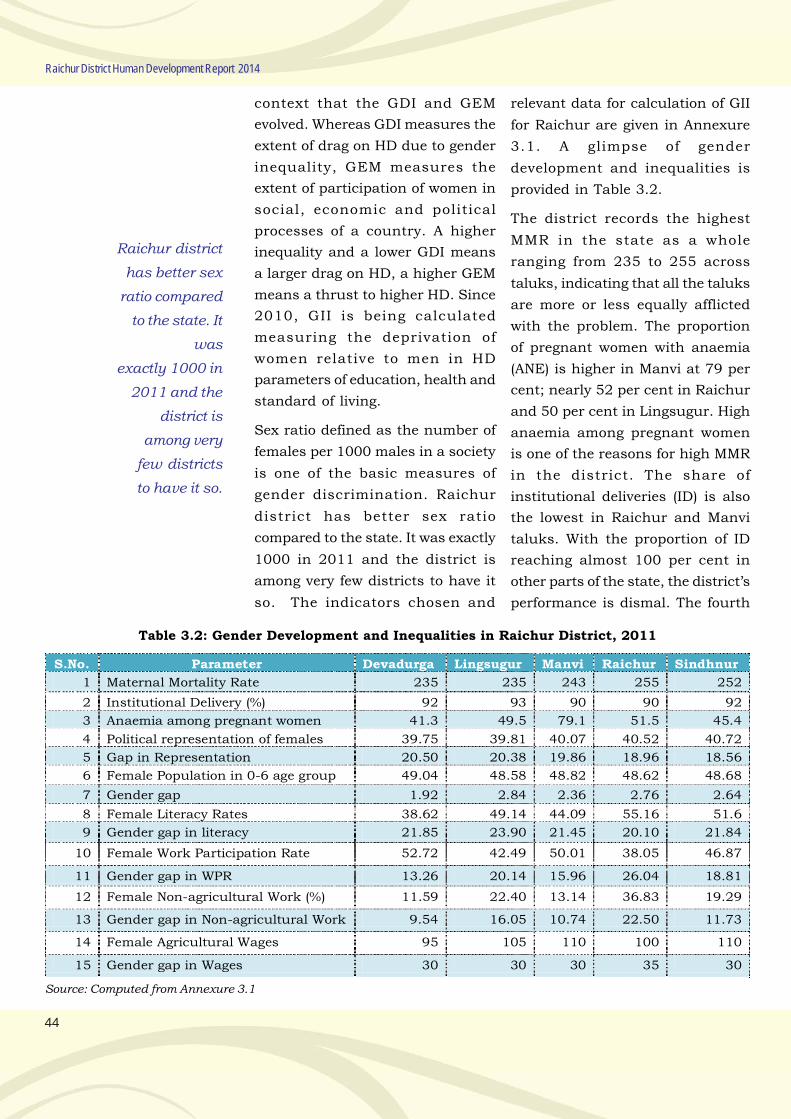
44
Raichur District Human Development Report 2014
context that the GDI and GEM
evolved. Whereas GDI measures the
extent of drag on HD due to gender
inequality, GEM measures the
extent of participation of women in
social, economic and political
processes of a country. A higher
inequality and a lower GDI means
a larger drag on HD, a higher GEM
means a thrust to higher HD. Since
2010, GII is being calculated
measuring the deprivation of
women relative to men in HD
parameters of education, health and
standard of living.
Sex ratio defined as the number of
females per 1000 males in a society
is one of the basic measures of
gender discrimination. Raichur
district has better sex ratio
compared to the state. It was exactly
1000 in 2011 and the district is
among very few districts to have it
so. The indicators chosen and
relevant data for calculation of GII
for Raichur are given in Annexure
3.1. A glimpse of gender
development and inequalities is
provided in Table 3.2.
The district records the highest
MMR in the state as a whole
ranging from 235 to 255 across
taluks, indicating that all the taluks
are more or less equally afflicted
with the problem. The proportion
of pregnant women with anaemia
(ANE) is higher in Manvi at 79 per
cent; nearly 52 per cent in Raichur
and 50 per cent in Lingsugur. High
anaemia among pregnant women
is one of the reasons for high MMR
in the district. The share of
institutional deliveries (ID) is also
the lowest in Raichur and Manvi
taluks. With the proportion of ID
reaching almost 100 per cent in
other parts of the state, the district’s
performance is dismal. The fourth
Table 3.2: Gender Development and Inequalities in Raichur District, 2011
S.No. Parameter Devadurga Lingsugur Manvi Raichur Sindhnur
1 Maternal Mortality Rate 235 235 243 255 252
2 Institutional Delivery (%) 92 93 90 90 92
3 Anaemia among pregnant women 41.3 49.5 79.1 51.5 45.4
4 Political representation of females 39.75 39.81 40.07 40.52 40.72
5 Gap in Representation 20.50 20.38 19.86 18.96 18.56
6 Female Population in 0-6 age group 49.04 48.58 48.82 48.62 48.68
7 Gender gap 1.92 2.84 2.36 2.76 2.64
8 Female Literacy Rates 38.62 49.14 44.09 55.16 51.6
9 Gender gap in literacy 21.85 23.90 21.45 20.10 21.84
10 Female Work Participation Rate 52.72 42.49 50.01 38.05 46.87
11 Gender gap in WPR 13.26 20.14 15.96 26.04 18.81
12 Female Non-agricultural Work (%) 11.59 22.40 13.14 36.83 19.29
13 Gender gap in Non-agricultural Work 9.54 16.05 10.74 22.50 11.73
14 Female Agricultural Wages 95 105 110 100 110
15 Gender gap in Wages 30 30 30 35 30
Source: Computed from Annexure 3.1
Raichur district
has better sex
ratio compared
to the state. It
was
exactly 1000 in
2011 and the
district is
among very
few districts
to have it so.
45
row shows political participation of
women in panchayat raj
institutions (PRIs) and urban local
bodies vis-a-vis men. Female
representation in the local bodies
is around 40 per cent throughout
the district which is lower than 50
per cent. The district has the
minimum value for this indicator.
Another indicator is the share of
females in 0-6 age group population
(rows 6 and 7), which is in the range
of 48 to 49 per cent. This might be
because of adverse child sex ratio
in 2011, which is around 950.
Hence, discrimination against girl
child seems to have increased in the
recent years. The gender gap
though lower, being positive in all
the taluks, indicates that the
discrimination is evenly spread
across the taluks.
In terms of capabilities, literacy
attainments reflect an important
aspect of gender development.
Raichur district has lower literacy
than the state level for the overall
as well as female population.
Female literacy is substantially
lower, and lower than that of males
(rows 8 and 9). Even as late as in
2011, less than half of the female
population was literate with a
literacy rate of 48.7 per cent, which
is very low compared to the state
average at 68 per cent and district’s
own male literacy at 70 per cent.
Thus, the gender gap in literacy was
about 21 per cent, with gender gap
in rural areas being 24 per cent in
rural areas, which is 50 per cent
higher than in urban areas at 16 per
cent. Across taluks, Raichur and
Sindhnur had higher female
literacy with relatively lower
gender gaps, vis-a-vis the other
three taluks.
Opposite tendency is noticed with
respect to work participation rates
(rows 10 and 11). Devadurga
records the highest female WPR (53
per cent), followed by Manvi (50 per
cent) and Sindhnur (47 per cent).
It is 38 per cent in Raichur and 42
per cent in Lingsugur. Gender gaps
in WPR are lower in Devadurga,
Manvi and Sindhnur taluks
compared to Lingsugur and
Raichur. Probably, the
backwardness of the former taluks
compels the women folk to
participate extensively in work.
Poverty is another factor forcing
them to participate in work in these
taluks.
The district has very low share of
workers engaged in non-
agricultural work, especially of
women workers (rows 12 and 13).
Only Raichur taluk reports a higher
share of female workers working in
non-agriculture. It is as low as 12
per cent in Devadurga and 13 per
cent in Manvi taluks. In Sindhnur
and Lingsugur taluks, the
percentage female workers
employed in non-agricultural work
is substantially lower at 19 per
cent and 22 per cent respectively.
Non-agricultural employment is
available extensively in advanced
taluks and that too predominantly
for males. This results in a higher
wage inequality across gender and
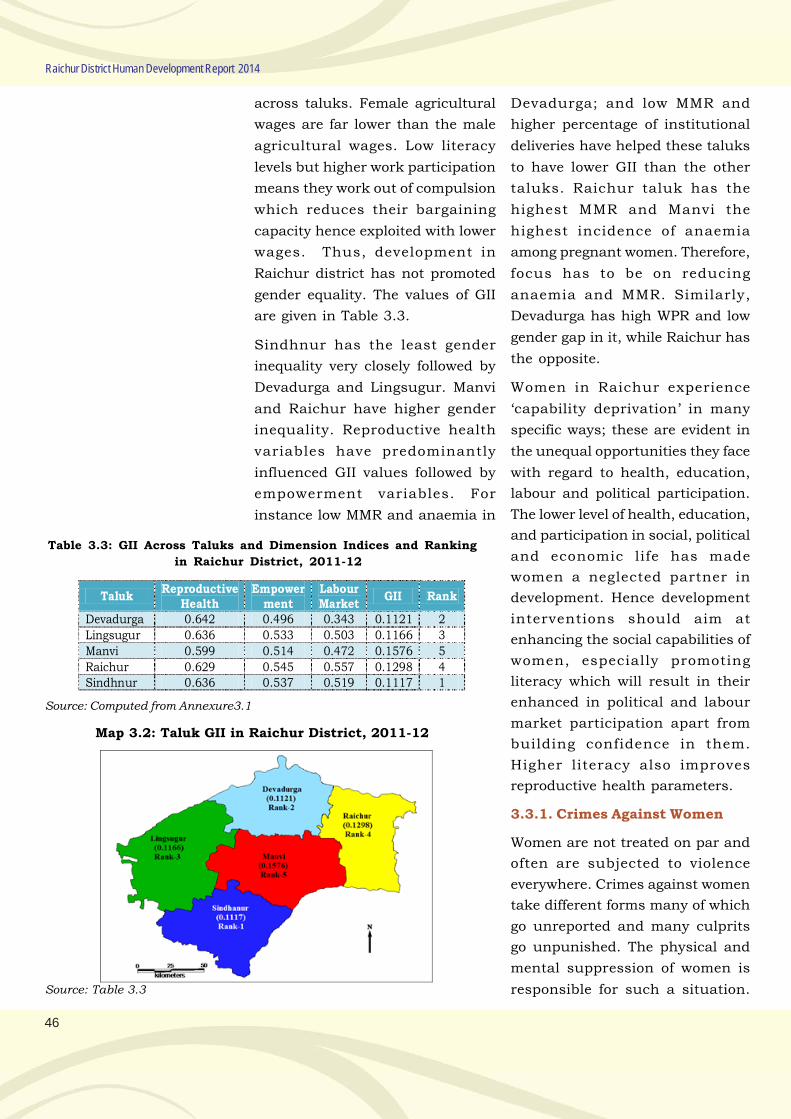
46
Raichur District Human Development Report 2014
across taluks. Female agricultural
wages are far lower than the male
agricultural wages. Low literacy
levels but higher work participation
means they work out of compulsion
which reduces their bargaining
capacity hence exploited with lower
wages. Thus, development in
Raichur district has not promoted
gender equality. The values of GII
are given in Table 3.3.
Sindhnur has the least gender
inequality very closely followed by
Devadurga and Lingsugur. Manvi
and Raichur have higher gender
inequality. Reproductive health
variables have predominantly
influenced GII values followed by
empowerment variables. For
instance low MMR and anaemia in
Devadurga; and low MMR and
higher percentage of institutional
deliveries have helped these taluks
to have lower GII than the other
taluks. Raichur taluk has the
highest MMR and Manvi the
highest incidence of anaemia
among pregnant women. Therefore,
focus has to be on reducing
anaemia and MMR. Similarly,
Devadurga has high WPR and low
gender gap in it, while Raichur has
the opposite.
Women in Raichur experience
‘capability deprivation’ in many
specific ways; these are evident in
the unequal opportunities they face
with regard to health, education,
labour and political participation.
The lower level of health, education,
and participation in social, political
and economic life has made
women a neglected partner in
development. Hence development
interventions should aim at
enhancing the social capabilities of
women, especially promoting
literacy which will result in their
enhanced in political and labour
market participation apart from
building confidence in them.
Higher literacy also improves
reproductive health parameters.
3.3.1. Crimes Against Women
Women are not treated on par and
often are subjected to violence
everywhere. Crimes against women
take different forms many of which
go unreported and many culprits
go unpunished. The physical and
mental suppression of women is
responsible for such a situation.
Table 3.3: GII Across Taluks and Dimension Indices and Ranking
in Raichur District, 2011-12
Source: Computed from Annexure3.1
Map 3.2: Taluk GII in Raichur District, 2011-12
Taluk Reproductive
Health Empower
ment Labour Market
GII Rank
Devadurga 0.642 0.496 0.343 0.1121 2
Lingsugur 0.636 0.533 0.503 0.1166 3
Manvi 0.599 0.514 0.472 0.1576 5
Raichur 0.629 0.545 0.557 0.1298 4 Sindhnur 0.636 0.537 0.519 0.1117 1
Source: Table 3.3
47
The number of crimes against
women reported during 2011, 2012
and 2013 in Raichur district are
given in Table 3.4.
The number of all crimes was 4446
in 2011 which came down to 3277
in 2012. Further up to the end of
August 2013, the total number of
reported crimes was 3199.
Similarly, the number of reported
crimes against women also came
down from 291 in 2011 to 257 in
2012 and was 202 till the end of
August 2013. Thus, the number of
all crimes and those against females
has gradually declined. Molestation
and dowry harassment were the
major crime types reported.
The number of crimes per 10000
persons comes to 22; and those
against women count to 30 per
lakh. Hence, incidence of crimes
against women is relatively higher.
The crimes can be reduced by
strengthening the police and
surveillance system. But more than
that empowering women socially,
economically and politically, as
well as enhancing the social values
and morals about women are
essential.
3.4. Child Development Index
(CDI)
Children are also neglected in the
development process. HD paradigm
emphasizes that development
should be all inclusive and the
process should recognize the
deprivations suffered by all
categories of people. For the first
time that the extent of children’s
Table 3.4: Number of Crimes Against Women in Raichur
District, 2011, 2012 and 2013
Crime 2011 2012 2013*
Dowry death 11 2 1
Dowry Harassment 99 107 74
Molestation 148 126 99
Rape 33 22 28
Total against women 291 257 202
Total of all crimes 4446 3277 3199
Total number of crimes per 10000 people 22**
Crimes against women per lakh women 30**
Note: * Upto the end of October2013 only; ** Average of three years reported
Source: District Crime Records Bureau, Raichur
socio-economic development is
being measured through an index
- the CDI. Apart from specific targets
set out in MDGs (Box 3.1), the other
goals relating to reduction of
poverty and hunger and promoting
women empowerment also affect
child development positively. India
is committed to achieve all these
goals in a time bound framework.
The indicators and variables relat-
ing to the above dimensions and
their values for Raichur district are
presented in Annexure 3.1. While
the first three are negative indica-
tors, the last is a positive one. CMR
is higher in all taluks, more so in
Sindhnur and Raichur. Percentage
of children born underweight is
also higher in all taluks, except
Sindhnur and Raichur. The per-
centage of children malnourished
is also high throughout the district
reaching to almost 50 per cent in
Box 3.1: MDGs on Child Development
The UN Declaration on MDGs, target at: reducing the prevalence of
underweight children below three years of age and child mortality rate;
increasing net enrolment ratio; increasing the proportion of pupils
starting Grade 1 who reach Grade 5; and increasing institutional
deliveries.
Components of Taluk CDI
Health
Child Mortality Rate
Nutrition
% children born
under weight
% malnourished
children
Education
% dropout children
mainstreamed
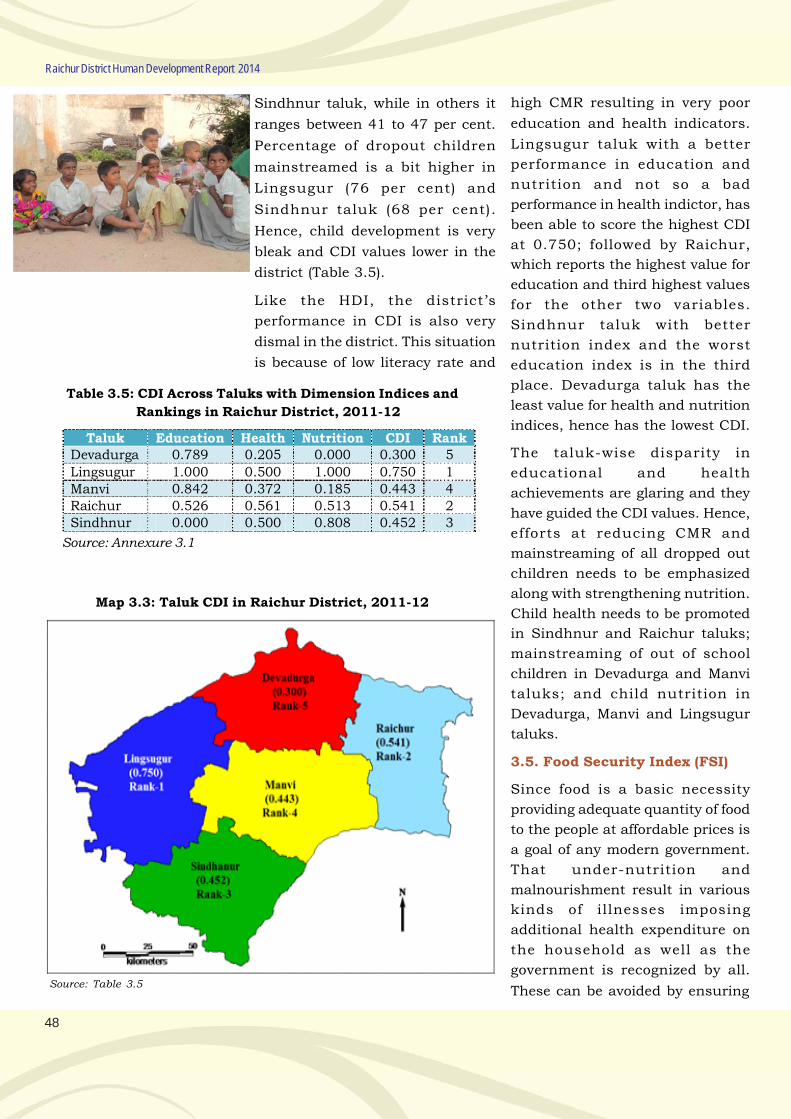
48
Raichur District Human Development Report 2014
Sindhnur taluk, while in others it
ranges between 41 to 47 per cent.
Percentage of dropout children
mainstreamed is a bit higher in
Lingsugur (76 per cent) and
Sindhnur taluk (68 per cent).
Hence, child development is very
bleak and CDI values lower in the
district (Table 3.5).
Like the HDI, the district’s
performance in CDI is also very
dismal in the district. This situation
is because of low literacy rate and
Table 3.5: CDI Across Taluks with Dimension Indices and
Rankings in Raichur District, 2011-12
Source: Annexure 3.1
high CMR resulting in very poor
education and health indicators.
Lingsugur taluk with a better
performance in education and
nutrition and not so a bad
performance in health indictor, has
been able to score the highest CDI
at 0.750; followed by Raichur,
which reports the highest value for
education and third highest values
for the other two variables.
Sindhnur taluk with better
nutrition index and the worst
education index is in the third
place. Devadurga taluk has the
least value for health and nutrition
indices, hence has the lowest CDI.
The taluk-wise disparity in
educational and health
achievements are glaring and they
have guided the CDI values. Hence,
efforts at reducing CMR and
mainstreaming of all dropped out
children needs to be emphasized
along with strengthening nutrition.
Child health needs to be promoted
in Sindhnur and Raichur taluks;
mainstreaming of out of school
children in Devadurga and Manvi
taluks; and child nutrition in
Devadurga, Manvi and Lingsugur
taluks.
3.5. Food Security Index (FSI)
Since food is a basic necessity
providing adequate quantity of food
to the people at affordable prices is
a goal of any modern government.
That under-nutrition and
malnourishment result in various
kinds of illnesses imposing
additional health expenditure on
the household as well as the
government is recognized by all.
These can be avoided by ensuring
Map 3.3: Taluk CDI in Raichur District, 2011-12
Source: Table 3.5
Taluk Education Health Nutrition CDI Rank Devadurga 0.789 0.205 0.000 0.300 5
Lingsugur 1.000 0.500 1.000 0.750 1 Manvi 0.842 0.372 0.185 0.443 4 Raichur 0.526 0.561 0.513 0.541 2 Sindhnur 0.000 0.500 0.808 0.452 3
49
food security. In this report, the FSI
is computed at the taluk level using
19 indicators encompassing
availability, accessibility and
absorption aspects. The data is
given in Annexure 3.1.
Food security is measured as a
collective outcome of three
dimensions, viz., availability,
accessibility and absorption.
Availability indicators reveal a
region’s capacity to produce food
grains; accessibility indicators
reveal the purchasing power of
people to buy food; and the
government support in terms of
provision of ration cards, especially
to poor people. Finally, the
absorption indicators indicate the
access to basic amenities that
improve the imbibing of food
consumed. A few observations
regarding the taluk level status with
respect to the indicators are
mentioned hereunder.
3.5.1. Availability
Availability of food depends upon
local production which itself
depends upon the area under food
grains and yield levels. Therefore,
land available for cultivation,
irrigation and cropping intensity
and area under pulse crops are
considered along with the extent of
forest cover. These represent the
capability of a region to produce
and sustain the food output. The
index of availability largely
depends on area under cultivation,
per capita food grains production,
irrigation intensity and cropping
intensity. It is also significantly
affected by changes in total
cultivated area (TCA) and
percentage degraded land. Thus
wherever, these indicators are
better, i.e., they are higher than the
district average, the per capita
availability of food grains is also
higher.
3.5.2: Accessibility
Unless the available food is made
available to the people at prices
they can pay and nearer to their
places of residence food security
cannot be attained. In order to
compute accessibility index at the
taluk level, number of PDS outlets,
number of PDS cards issued and
factors determining purchasing
power of people are considered for
analysis. Thus, percentage villages
with PDS outlets, percentage
households possessing ration
cards, on the one hand; per capita
income, average size of holdings,
percentage of workers in non-
agricultural activities and
agricultural work, on the other; are
the variables chosen for the
analysis. While the first set
indicates government efforts to
improve physical access, the
second set of variables reflect the
purchasing power of households.
The indicators affecting the
accessibility index are per capita
income, proportion of non-
agricultural workers and per cent
villages having PDS outlets. Thus,
increasing the number of PDS
outlets and enhancing income
earning capacity of households by
Nutrition security
is dependent on
several inter-
related factors
such as food
production, food
access, poverty,
gender, access to
health and
sanitation, and
cultural beliefs
and practices.
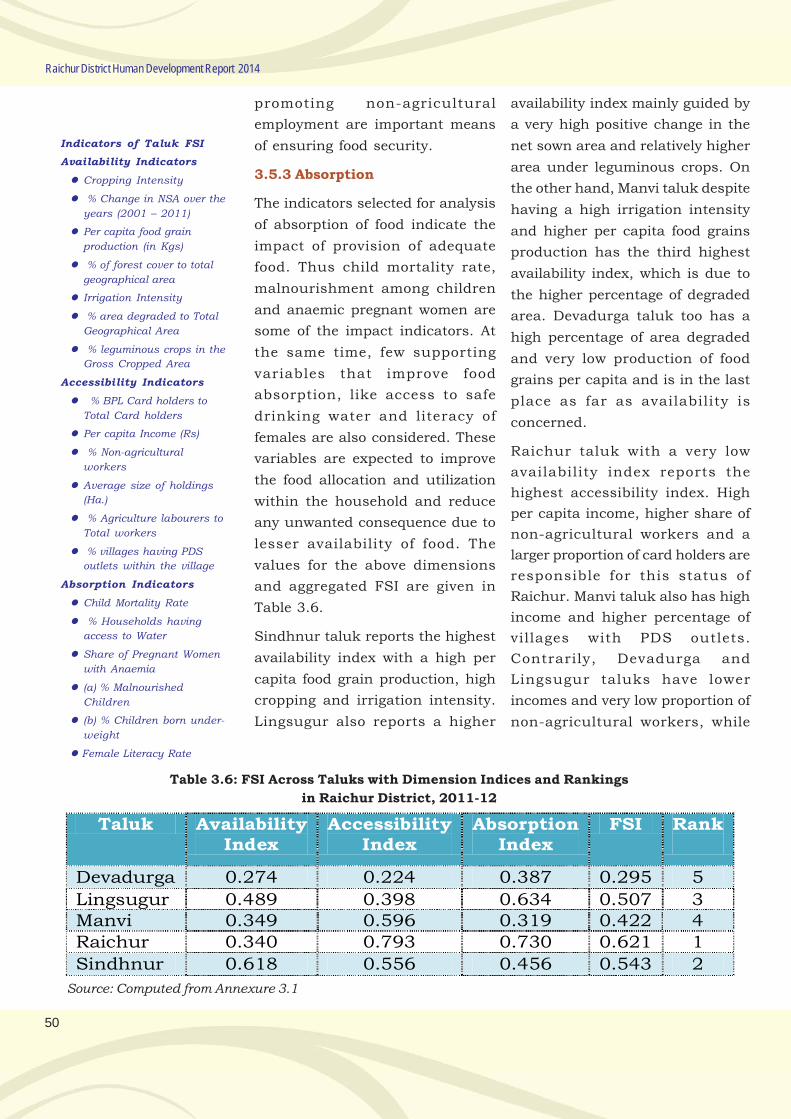
50
Raichur District Human Development Report 2014
promoting non-agricultural
employment are important means
of ensuring food security.
3.5.3 Absorption
The indicators selected for analysis
of absorption of food indicate the
impact of provision of adequate
food. Thus child mortality rate,
malnourishment among children
and anaemic pregnant women are
some of the impact indicators. At
the same time, few supporting
variables that improve food
absorption, like access to safe
drinking water and literacy of
females are also considered. These
variables are expected to improve
the food allocation and utilization
within the household and reduce
any unwanted consequence due to
lesser availability of food. The
values for the above dimensions
and aggregated FSI are given in
Table 3.6.
Sindhnur taluk reports the highest
availability index with a high per
capita food grain production, high
cropping and irrigation intensity.
Lingsugur also reports a higher
Table 3.6: FSI Across Taluks with Dimension Indices and Rankings
in Raichur District, 2011-12
availability index mainly guided by
a very high positive change in the
net sown area and relatively higher
area under leguminous crops. On
the other hand, Manvi taluk despite
having a high irrigation intensity
and higher per capita food grains
production has the third highest
availability index, which is due to
the higher percentage of degraded
area. Devadurga taluk too has a
high percentage of area degraded
and very low production of food
grains per capita and is in the last
place as far as availability is
concerned.
Raichur taluk with a very low
availability index reports the
highest accessibility index. High
per capita income, higher share of
non-agricultural workers and a
larger proportion of card holders are
responsible for this status of
Raichur. Manvi taluk also has high
income and higher percentage of
villages with PDS outlets.
Contrarily, Devadurga and
Lingsugur taluks have lower
incomes and very low proportion of
non-agricultural workers, while
Source: Computed from Annexure 3.1
Taluk Availability Index
Accessibility Index
Absorption Index
FSI Rank
Devadurga 0.274 0.224 0.387 0.295 5
Lingsugur 0.489 0.398 0.634 0.507 3 Manvi 0.349 0.596 0.319 0.422 4 Raichur 0.340 0.793 0.730 0.621 1
Sindhnur 0.618 0.556 0.456 0.543 2
Indicators of Taluk FSI
Availability Indicators
Cropping Intensity
% Change in NSA over the
years (2001 – 2011)
Per capita food grain
production (in Kgs)
% of forest cover to total
geographical area
Irrigation Intensity
% area degraded to Total
Geographical Area
% leguminous crops in the
Gross Cropped Area
Accessibility Indicators
% BPL Card holders to
Total Card holders
Per capita Income (Rs)
% Non-agricultural
workers
Average size of holdings
(Ha.)
% Agriculture labourers to
Total workers
% villages having PDS
outlets within the village
Absorption Indicators
Child Mortality Rate
% Households having
access to Water
Share of Pregnant Women
with Anaemia
(a) % Malnourished
Children
(b) % Children born under-
weight
Female Literacy Rate
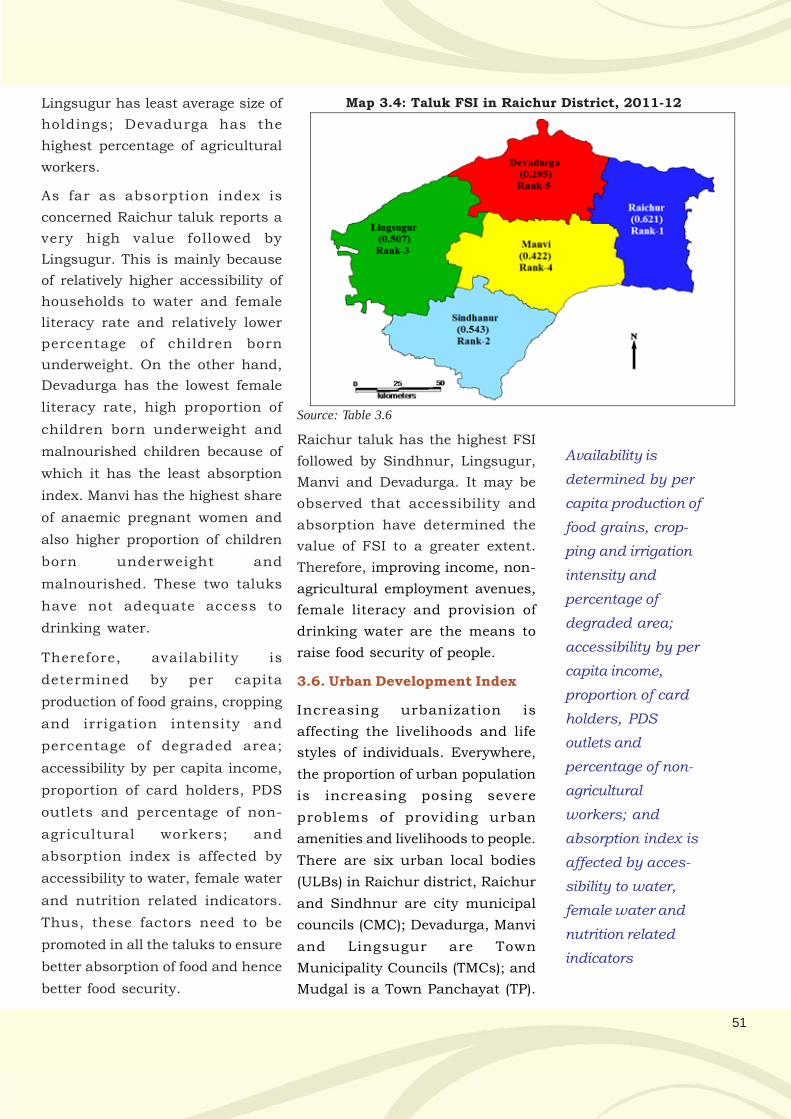
51
Lingsugur has least average size of
holdings; Devadurga has the
highest percentage of agricultural
workers.
As far as absorption index is
concerned Raichur taluk reports a
very high value followed by
Lingsugur. This is mainly because
of relatively higher accessibility of
households to water and female
literacy rate and relatively lower
percentage of children born
underweight. On the other hand,
Devadurga has the lowest female
literacy rate, high proportion of
children born underweight and
malnourished children because of
which it has the least absorption
index. Manvi has the highest share
of anaemic pregnant women and
also higher proportion of children
born underweight and
malnourished. These two taluks
have not adequate access to
drinking water.
Therefore, availability is
determined by per capita
production of food grains, cropping
and irrigation intensity and
percentage of degraded area;
accessibility by per capita income,
proportion of card holders, PDS
outlets and percentage of non-
agricultural workers; and
absorption index is affected by
accessibility to water, female water
and nutrition related indicators.
Thus, these factors need to be
promoted in all the taluks to ensure
better absorption of food and hence
better food security.
Map 3.4: Taluk FSI in Raichur District, 2011-12
Raichur taluk has the highest FSI
followed by Sindhnur, Lingsugur,
Manvi and Devadurga. It may be
observed that accessibility and
absorption have determined the
value of FSI to a greater extent.
Therefore, improving income, non-
agricultural employment avenues,
female literacy and provision of
drinking water are the means to
raise food security of people.
3.6. Urban Development Index
Increasing urbanization is
affecting the livelihoods and life
styles of individuals. Everywhere,
the proportion of urban population
is increasing posing severe
problems of providing urban
amenities and livelihoods to people.
There are six urban local bodies
(ULBs) in Raichur district, Raichur
and Sindhnur are city municipal
councils (CMC); Devadurga, Manvi
and Lingsugur are Town
Municipality Councils (TMCs); and
Mudgal is a Town Panchayat (TP).
Availability is
determined by per
capita production of
food grains, crop-
ping and irrigation
intensity and
percentage of
degraded area;
accessibility by per
capita income,
proportion of card
holders, PDS
outlets and
percentage of non-
agricultural
workers; and
absorption index is
affected by acces-
sibility to water,
female water and
nutrition related
indicators
Source: Table 3.6
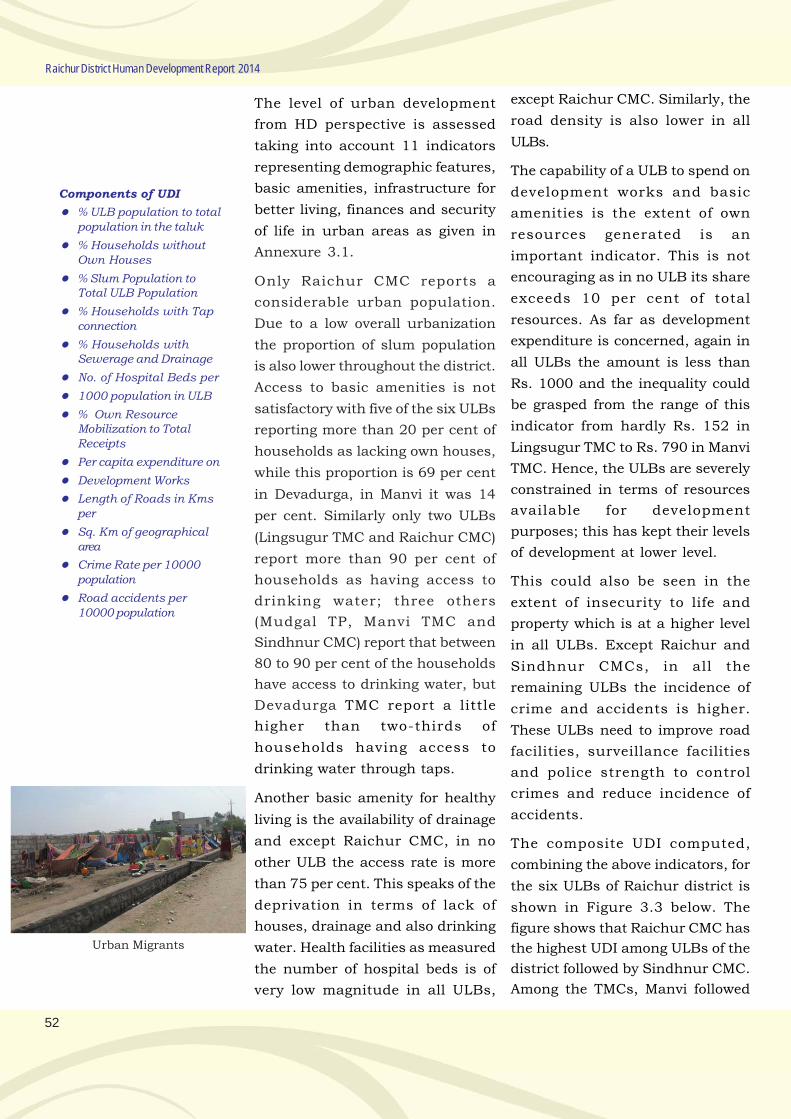
52
Raichur District Human Development Report 2014
The level of urban development
from HD perspective is assessed
taking into account 11 indicators
representing demographic features,
basic amenities, infrastructure for
better living, finances and security
of life in urban areas as given in
Annexure 3.1.
Only Raichur CMC reports a
considerable urban population.
Due to a low overall urbanization
the proportion of slum population
is also lower throughout the district.
Access to basic amenities is not
satisfactory with five of the six ULBs
reporting more than 20 per cent of
households as lacking own houses,
while this proportion is 69 per cent
in Devadurga, in Manvi it was 14
per cent. Similarly only two ULBs
(Lingsugur TMC and Raichur CMC)
report more than 90 per cent of
households as having access to
drinking water; three others
(Mudgal TP, Manvi TMC and
Sindhnur CMC) report that between
80 to 90 per cent of the households
have access to drinking water, but
Devadurga TMC report a little
higher than two-thirds of
households having access to
drinking water through taps.
Another basic amenity for healthy
living is the availability of drainage
and except Raichur CMC, in no
other ULB the access rate is more
than 75 per cent. This speaks of the
deprivation in terms of lack of
houses, drainage and also drinking
water. Health facilities as measured
the number of hospital beds is of
very low magnitude in all ULBs,
except Raichur CMC. Similarly, the
road density is also lower in all
ULBs.
The capability of a ULB to spend on
development works and basic
amenities is the extent of own
resources generated is an
important indicator. This is not
encouraging as in no ULB its share
exceeds 10 per cent of total
resources. As far as development
expenditure is concerned, again in
all ULBs the amount is less than
Rs. 1000 and the inequality could
be grasped from the range of this
indicator from hardly Rs. 152 in
Lingsugur TMC to Rs. 790 in Manvi
TMC. Hence, the ULBs are severely
constrained in terms of resources
available for development
purposes; this has kept their levels
of development at lower level.
This could also be seen in the
extent of insecurity to life and
property which is at a higher level
in all ULBs. Except Raichur and
Sindhnur CMCs, in all the
remaining ULBs the incidence of
crime and accidents is higher.
These ULBs need to improve road
facilities, surveillance facilities
and police strength to control
crimes and reduce incidence of
accidents.
The composite UDI computed,
combining the above indicators, for
the six ULBs of Raichur district is
shown in Figure 3.3 below. The
figure shows that Raichur CMC has
the highest UDI among ULBs of the
district followed by Sindhnur CMC.
Among the TMCs, Manvi followed
Urban Migrants
Components of UDI
% ULB population to totalpopulation in the taluk
% Households withoutOwn Houses
% Slum Population toTotal ULB Population
% Households with Tapconnection
% Households withSewerage and Drainage
No. of Hospital Beds per
1000 population in ULB
% Own ResourceMobilization to TotalReceipts
Per capita expenditure on
Development Works
Length of Roads in Kmsper
Sq. Km of geographicalarea
Crime Rate per 10000population
Road accidents per10000 population
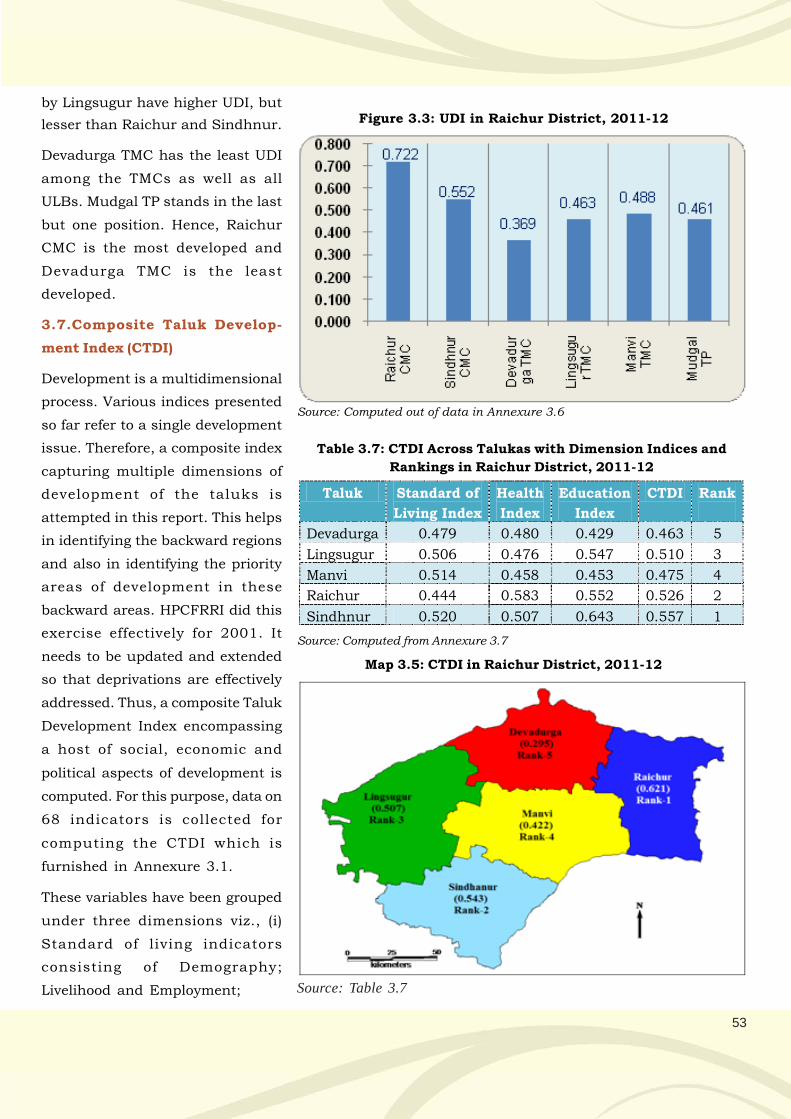
53
by Lingsugur have higher UDI, but
lesser than Raichur and Sindhnur.
Devadurga TMC has the least UDI
among the TMCs as well as all
ULBs. Mudgal TP stands in the last
but one position. Hence, Raichur
CMC is the most developed and
Devadurga TMC is the least
developed.
3.7.Composite Taluk Develop-
ment Index (CTDI)
Development is a multidimensional
process. Various indices presented
so far refer to a single development
issue. Therefore, a composite index
capturing multiple dimensions of
development of the taluks is
attempted in this report. This helps
in identifying the backward regions
and also in identifying the priority
areas of development in these
backward areas. HPCFRRI did this
exercise effectively for 2001. It
needs to be updated and extended
so that deprivations are effectively
addressed. Thus, a composite Taluk
Development Index encompassing
a host of social, economic and
political aspects of development is
computed. For this purpose, data on
68 indicators is collected for
computing the CTDI which is
furnished in Annexure 3.1.
These variables have been grouped
under three dimensions viz., (i)
Standard of living indicators
consisting of Demography;
Livelihood and Employment;
Figure 3.3: UDI in Raichur District, 2011-12
Source: Computed out of data in Annexure 3.6
Table 3.7: CTDI Across Talukas with Dimension Indices and
Rankings in Raichur District, 2011-12
Taluk Standard of
Living Index
Health
Index
Education
Index
CTDI Rank
Devadurga 0.479 0.480 0.429 0.463 5
Lingsugur 0.506 0.476 0.547 0.510 3
Manvi 0.514 0.458 0.453 0.475 4
Raichur 0.444 0.583 0.552 0.526 2
Sindhnur 0.520 0.507 0.643 0.557 1
Source: Computed from Annexure 3.7
Map 3.5: CTDI in Raichur District, 2011-12
Source: Table 3.7
54
Raichur District Human Development Report 2014
3.8. Concluding Remarks
Human development is the process
of increasing knowledge, skill and
capacities of all the people in a given
society. Human Development Reports
have expanded development
discourse beyond its focus on
economic growth to consider
human development and people’s
basic needs, such as their standard
of living, education, and health
care. It is now universally accepted
that these different dimensions of
human development—livelihood,
education, and health—play
important roles in shaping personal
well being. In this context, the
present chapter discussed the HD
attainments in Raichur district
through such indices as HDI, GII,
CDI, FSI, UDI and CTDI were
calculated. Further, to look into the
deprivations from social group
point of view, HD dimensions for
SC/ST population were separately
looked into. The UDI was computed
to reflect upon the relative
development of ULBs. More
importantly, comprehensive taluka
and district development indices
are also constructed to understand
regional deprivations in
development.
The human deprivation is higher
due to high illiteracy, high mortality
rates and less avenues of
employment, especially in the non-
agricultural sector. The basic
amenities in terms of good houses,
electricity, drinking water and
toilets are also not adequately
available. Devadurga and Manvi are
more deprived compared to the
other taluks. Women in Raichur
experience ‘capability deprivation’
in terms of unequal opportunities
with regard to health, education,
Excepting
participation
indicators, in
all others, the
district’s
performance
has been
dismal.
Housing and Assets;and
Participation; (ii) Health indicators
consisting of Health; Sanitation;
Drinking water and (iii) Education
indicators. The dimension indices
and the CTDI are given in Table 3.7.
Sindhnur taluk has the highest
CTDI followed by Raichur,
Lingsugur, Manvi and Devadurga.
That there is not much variation in
the values of CTDI shows that all
taluks are more or less equally
backward. Higher educational
development has fostered a higher
development of the taluka. The
coefficients of correlation between
these three indices with CTDI, work
out as; Education index: 0.99,
Health index: 0.55 and Standard of
Living: 0.08, indicating that overall
development goes together with
educational development.
Though the association between
CTDI and Health index is positive
and significant, the extent of
association is lesser; and that
between SOL and CTDI is almost
non-existent. This is because of
very low levels of basic amenities
available to the households across
taluks. If basic amenities are
strengthened, CTDI will also
improve. Even when education has
a strong association with CTDI,
because of low educational
development the district itself is
poor and the CTDI is also lower.
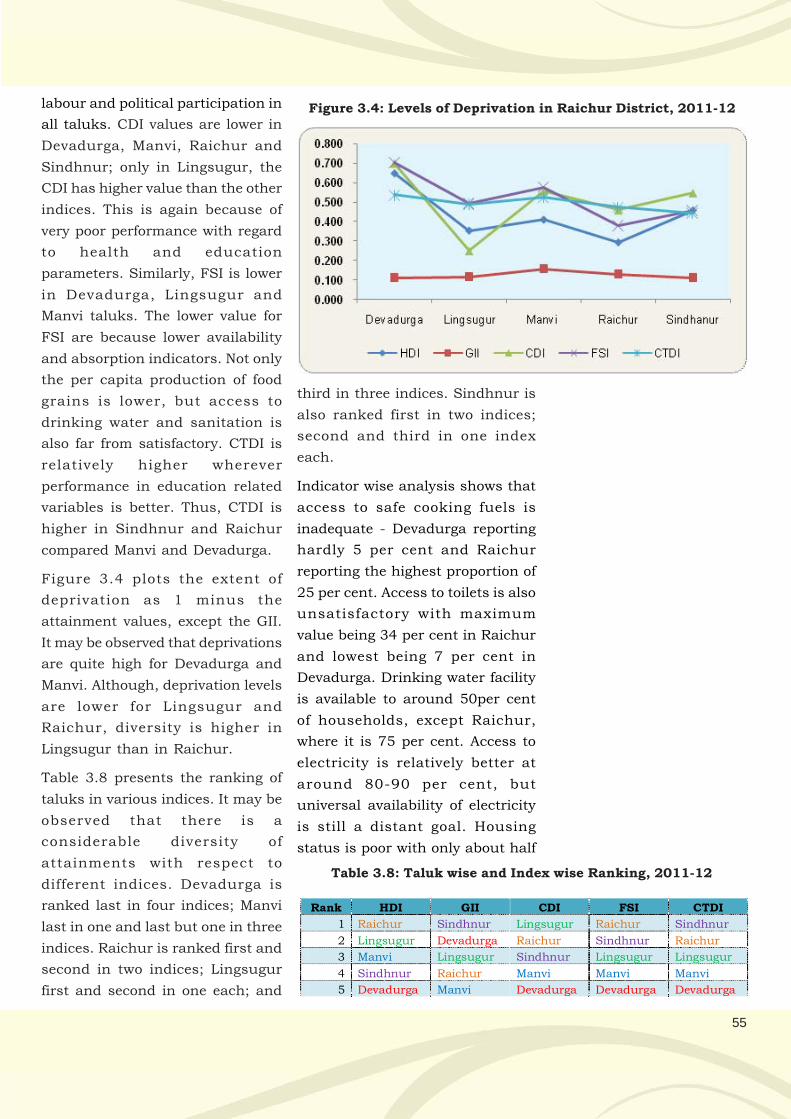
55
labour and political participation in
all taluks. CDI values are lower in
Devadurga, Manvi, Raichur and
Sindhnur; only in Lingsugur, the
CDI has higher value than the other
indices. This is again because of
very poor performance with regard
to health and education
parameters. Similarly, FSI is lower
in Devadurga, Lingsugur and
Manvi taluks. The lower value for
FSI are because lower availability
and absorption indicators. Not only
the per capita production of food
grains is lower, but access to
drinking water and sanitation is
also far from satisfactory. CTDI is
relatively higher wherever
performance in education related
variables is better. Thus, CTDI is
higher in Sindhnur and Raichur
compared Manvi and Devadurga.
Figure 3.4 plots the extent of
deprivation as 1 minus the
attainment values, except the GII.
It may be observed that deprivations
are quite high for Devadurga and
Manvi. Although, deprivation levels
are lower for Lingsugur and
Raichur, diversity is higher in
Lingsugur than in Raichur.
Table 3.8 presents the ranking of
taluks in various indices. It may be
observed that there is a
considerable diversity of
attainments with respect to
different indices. Devadurga is
ranked last in four indices; Manvi
last in one and last but one in three
indices. Raichur is ranked first and
second in two indices; Lingsugur
first and second in one each; and
third in three indices. Sindhnur is
also ranked first in two indices;
second and third in one index
each.
Indicator wise analysis shows that
access to safe cooking fuels is
inadequate - Devadurga reporting
hardly 5 per cent and Raichur
reporting the highest proportion of
25 per cent. Access to toilets is also
unsatisfactory with maximum
value being 34 per cent in Raichur
and lowest being 7 per cent in
Devadurga. Drinking water facility
is available to around 50per cent
of households, except Raichur,
where it is 75 per cent. Access to
electricity is relatively better at
around 80-90 per cent, but
universal availability of electricity
is still a distant goal. Housing
status is poor with only about half
Figure 3.4: Levels of Deprivation in Raichur District, 2011-12
Table 3.8: Taluk wise and Index wise Ranking, 2011-12
Rank HDI GII CDI FSI CTDI
1 Raichur Sindhnur Lingsugur Raichur Sindhnur
2 Lingsugur Devadurga Raichur Sindhnur Raichur
3 Manvi Lingsugur Sindhnur Lingsugur Lingsugur
4 Sindhnur Raichur Manvi Manvi Manvi
5 Devadurga Manvi Devadurga Devadurga Devadurga
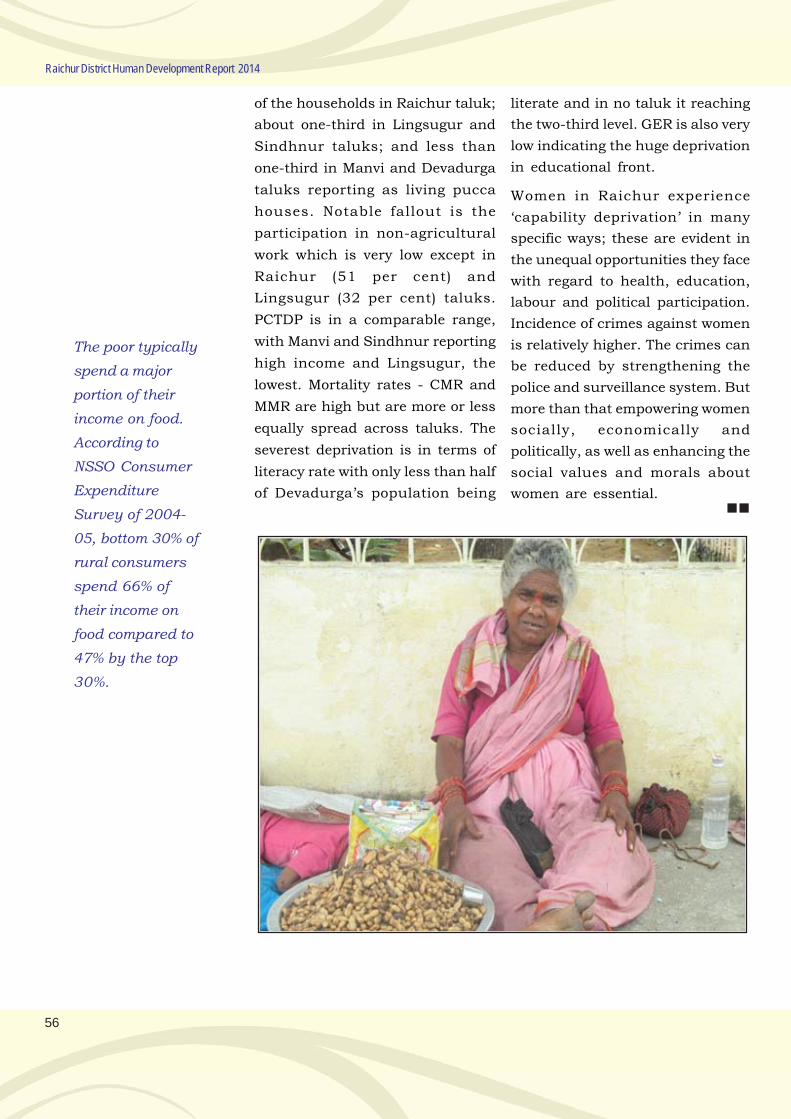
56
Raichur District Human Development Report 2014
The poor typically
spend a major
portion of their
income on food.
According to
NSSO Consumer
Expenditure
Survey of 2004-
05, bottom 30% of
rural consumers
spend 66% of
their income on
food compared to
47% by the top
30%.
of the households in Raichur taluk;
about one-third in Lingsugur and
Sindhnur taluks; and less than
one-third in Manvi and Devadurga
taluks reporting as living pucca
houses. Notable fallout is the
participation in non-agricultural
work which is very low except in
Raichur (51 per cent) and
Lingsugur (32 per cent) taluks.
PCTDP is in a comparable range,
with Manvi and Sindhnur reporting
high income and Lingsugur, the
lowest. Mortality rates - CMR and
MMR are high but are more or less
equally spread across taluks. The
severest deprivation is in terms of
literacy rate with only less than half
of Devadurga’s population being
literate and in no taluk it reaching
the two-third level. GER is also very
low indicating the huge deprivation
in educational front.
Women in Raichur experience
‘capability deprivation’ in many
specific ways; these are evident in
the unequal opportunities they face
with regard to health, education,
labour and political participation.
Incidence of crimes against women
is relatively higher. The crimes can
be reduced by strengthening the
police and surveillance system. But
more than that empowering women
socially, economically and
politically, as well as enhancing the
social values and morals about
women are essential.
Chapter 4
LITERACY AND EDUCATION

.
59
Chapter 4
Literacy and Education
4.1 Introduction
A completed primary education is
a basic human right and is
necessary for enjoying many other
rights. It is transformative and
empowering, and a means for
accessing broad economic, social,
political and cultural benefits.
Primary education is a powerful
driver for realizing all of the MDGs
and for sustainable development
more generally. Education is a
human right and is essential for
human emancipation and social
development. It contributes to
better health, higher productivity,
greater income, human freedom,
capability and esteemed living,
increased participation in
community life. Education is the
single best development investment
and a powerful instrument to
develop an economically
prosperous society. The long term
social and economic return from
education is enormous. Education,
as articulated in National Policy on
Education (1986), is a “dynamic,
cumulative, life long process
providing diversity of learning
opportunities to all segments of
society.” Education is not only an
end in itself, but also a means to
achieve many other valued goals of
human development. Gender
justice gets a boost when women
have access to education, which, by
enhancing women’s knowledge and
employment capacity, increases
their sense of autonomy and self-
worth. Thus, in achieving
sustainable human development
universal access to education plays
a vital role.
The HDRs stress the importance of
education in HD. The basic
underpinning behind the concept
of HD is that the income centered
understanding of development
cannot manifest the actual
development scenario and needs to
be attended by other aspects such
as education. The HDI in the
beginning used literacy rate and
school enrolment rate to develop an
index of education. The literacy rate
was given a two-third and school
enrolment rates a one-third
weightage in constructing the HDI.
In fact, the analysis of district’s HDI
and CTDI revealed that education
influenced both of them
significantly. In fact, one of the
prominent reasons for higher
gender inequality in Raichur
district is because of lower female
literacy.
Multifarious interventions are
initiated by all governments to
realize universal access to
education. In India, extending
literacy and education to all
sections of population has been an
important policy plank of the
strategy of ‘growth with equity and
social justice’ since the beginning
of planned development itself.
60
Raichur District Human Development Report 2014
While historically, education was
used as an instrument for
exclusion of certain population
groups and regions from
participation in the development
process, the latter half of the
twentieth century marked the
realization that to minimize all
types of disparities in the shortest
possible time frame, discrimination
in access to educational and other
social services need to be
minimized. Hence ‘Education for
All’ is a universally accepted goal
today. Further, since education is
both a cause and effect of
underdevelopment, there is
growing evidence that it is a
powerful tool in overcoming socio-
economic disparities.
The Constitution of India, under
the Directive Principles of State
Policy, emphasizes the provision of
universal and free education to all
in the age-group of 6-14 years. Not
only this was sincerely followed at
all levels of governance, the most
recent culmination of these efforts
is the enactment of the Right to
Education (RTE) Act in 2009,
making education a fundamental
right of every child. Considering the
vitality of education in the overall
development process the UN has
specified the following goals as part
of Millennium Development Goals
to be achieved by 2015 (Box 4.1).
Box 4.1: Millennium Development Goals on Education 1. Achieve universal Primary education: Ensure that, by 2015, children
everywhere, boys and girls alike, will be able to complete a full course of
primary schooling
2. Promote gender equality and empower women: Eliminate gender
disparity in primary and secondary education, preferably by 2005, and in all
levels of education not later than 2015.
In India, the achievement in edu-
cation has been quite remarkable
since Independence. Although uni-
versal literacy is yet to be attained,
the nation is fast moving towards
it (Figure 4.1).
The figure shows that the literacy
has increased between 1951 and
2011 across all categories.
However, rural areas and females
still report very low levels of literacy,
but he gaps are declining.
4.2 Literacy Profile of the District
Raichur district has lower rates of
literacy compared to the state,
hence to the country as well (Figure
4.2). Figures indicate that for the
state as a whole, the literacy has
increased from 67 per cent to 75.6
per cent between 2001 and 2011.
In Raichur district too, the literacy
for all persons has increased
steadily from about 49.5 per cent
to 60 per cent between 2001 and
2011. Males have higher literacy
rates compared to females. However,
Raichur district has lower literacy
rates in all categories compared to
Karnataka state. Further, while
gaps elsewhere have declined,
those in Raichur have increased.
This needs to be arrested.
4.2.1 Region wise Literacy
Attainments
The district’s literacy levels have
been lower than the state literacy
levels. Table 4.1 presents the
information on literacy attainment
in Raichur district across taluks.
Education
is the
single best
development
investment
and a
powerful
instrument to
develop an
economically
prosperous
society. The
long term
social and
economic
return from
education is
enormous.
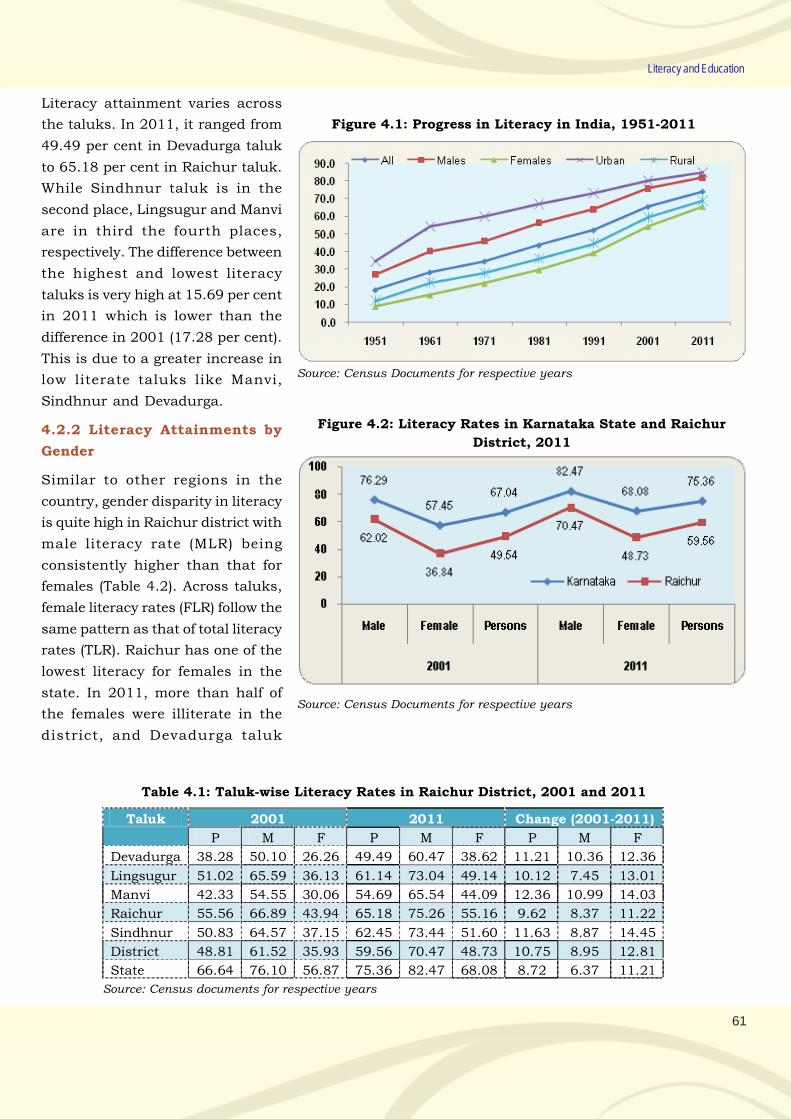
61
Literacy and Education
Figure 4.1: Progress in Literacy in India, 1951-2011
Source: Census Documents for respective years
Figure 4.2: Literacy Rates in Karnataka State and Raichur
District, 2011
Source: Census Documents for respective years
Table 4.1: Taluk-wise Literacy Rates in Raichur District, 2001 and 2011
Taluk 2001 2011 Change (2001-2011)
P M F P M F P M F
Devadurga 38.28 50.10 26.26 49.49 60.47 38.62 11.21 10.36 12.36
Lingsugur 51.02 65.59 36.13 61.14 73.04 49.14 10.12 7.45 13.01
Manvi 42.33 54.55 30.06 54.69 65.54 44.09 12.36 10.99 14.03
Raichur 55.56 66.89 43.94 65.18 75.26 55.16 9.62 8.37 11.22
Sindhnur 50.83 64.57 37.15 62.45 73.44 51.60 11.63 8.87 14.45
District 48.81 61.52 35.93 59.56 70.47 48.73 10.75 8.95 12.81
State 66.64 76.10 56.87 75.36 82.47 68.08 8.72 6.37 11.21
Source: Census documents for respective years
Literacy attainment varies across
the taluks. In 2011, it ranged from
49.49 per cent in Devadurga taluk
to 65.18 per cent in Raichur taluk.
While Sindhnur taluk is in the
second place, Lingsugur and Manvi
are in third the fourth places,
respectively. The difference between
the highest and lowest literacy
taluks is very high at 15.69 per cent
in 2011 which is lower than the
difference in 2001 (17.28 per cent).
This is due to a greater increase in
low literate taluks like Manvi,
Sindhnur and Devadurga.
4.2.2 Literacy Attainments by
Gender
Similar to other regions in the
country, gender disparity in literacy
is quite high in Raichur district with
male literacy rate (MLR) being
consistently higher than that for
females (Table 4.2). Across taluks,
female literacy rates (FLR) follow the
same pattern as that of total literacy
rates (TLR). Raichur has one of the
lowest literacy for females in the
state. In 2011, more than half of
the females were illiterate in the
district, and Devadurga taluk
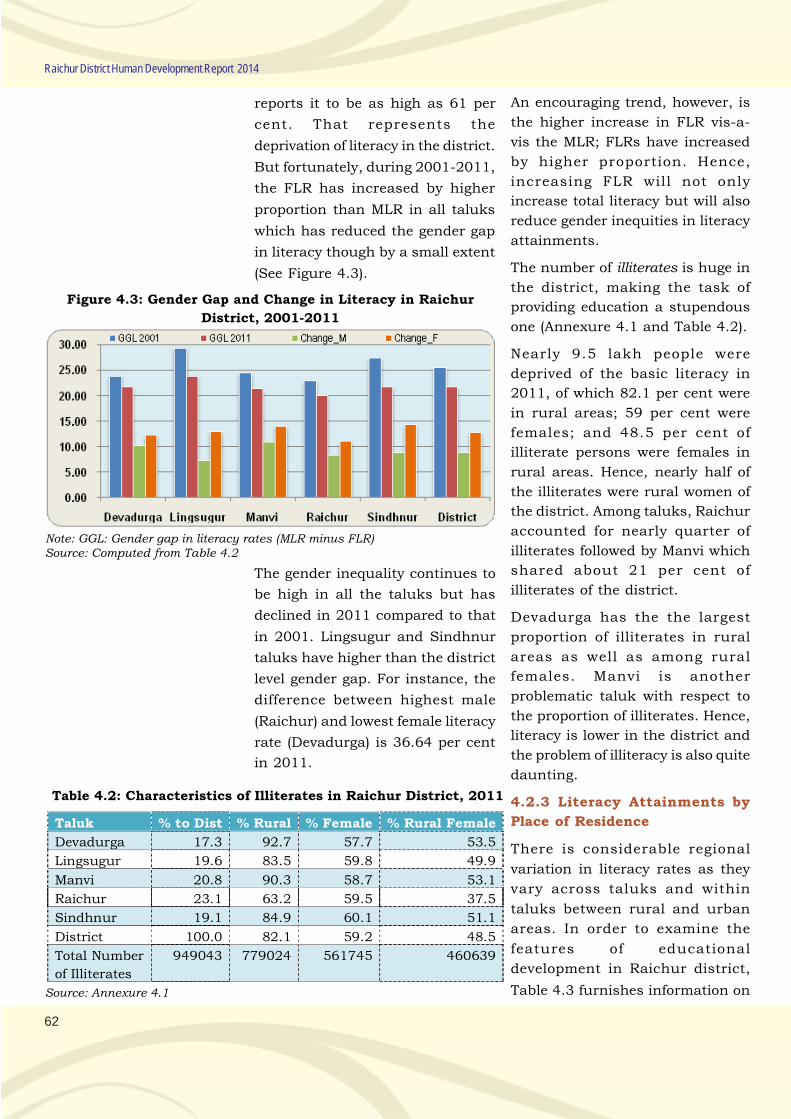
62
Raichur District Human Development Report 2014
reports it to be as high as 61 per
cent. That represents the
deprivation of literacy in the district.
But fortunately, during 2001-2011,
the FLR has increased by higher
proportion than MLR in all taluks
which has reduced the gender gap
in literacy though by a small extent
(See Figure 4.3).
Figure 4.3: Gender Gap and Change in Literacy in Raichur
District, 2001-2011
Note: GGL: Gender gap in literacy rates (MLR minus FLR)Source: Computed from Table 4.2
The gender inequality continues to
be high in all the taluks but has
declined in 2011 compared to that
in 2001. Lingsugur and Sindhnur
taluks have higher than the district
level gender gap. For instance, the
difference between highest male
(Raichur) and lowest female literacy
rate (Devadurga) is 36.64 per cent
in 2011.
Taluk % to Dist % Rural % Female % Rural Female
Devadurga 17.3 92.7 57.7 53.5
Lingsugur 19.6 83.5 59.8 49.9
Manvi 20.8 90.3 58.7 53.1
Raichur 23.1 63.2 59.5 37.5
Sindhnur 19.1 84.9 60.1 51.1
District 100.0 82.1 59.2 48.5
Total Number
of Illiterates
949043 779024 561745 460639
Table 4.2: Characteristics of Illiterates in Raichur District, 2011
Source: Annexure 4.1
An encouraging trend, however, is
the higher increase in FLR vis-a-
vis the MLR; FLRs have increased
by higher proportion. Hence,
increasing FLR will not only
increase total literacy but will also
reduce gender inequities in literacy
attainments.
The number of illiterates is huge in
the district, making the task of
providing education a stupendous
one (Annexure 4.1 and Table 4.2).
Nearly 9.5 lakh people were
deprived of the basic literacy in
2011, of which 82.1 per cent were
in rural areas; 59 per cent were
females; and 48.5 per cent of
illiterate persons were females in
rural areas. Hence, nearly half of
the illiterates were rural women of
the district. Among taluks, Raichur
accounted for nearly quarter of
illiterates followed by Manvi which
shared about 21 per cent of
illiterates of the district.
Devadurga has the the largest
proportion of illiterates in rural
areas as well as among rural
females. Manvi is another
problematic taluk with respect to
the proportion of illiterates. Hence,
literacy is lower in the district and
the problem of illiteracy is also quite
daunting.
4.2.3 Literacy Attainments by
Place of Residence
There is considerable regional
variation in literacy rates as they
vary across taluks and within
taluks between rural and urban
areas. In order to examine the
features of educational
development in Raichur district,
Table 4.3 furnishes information on
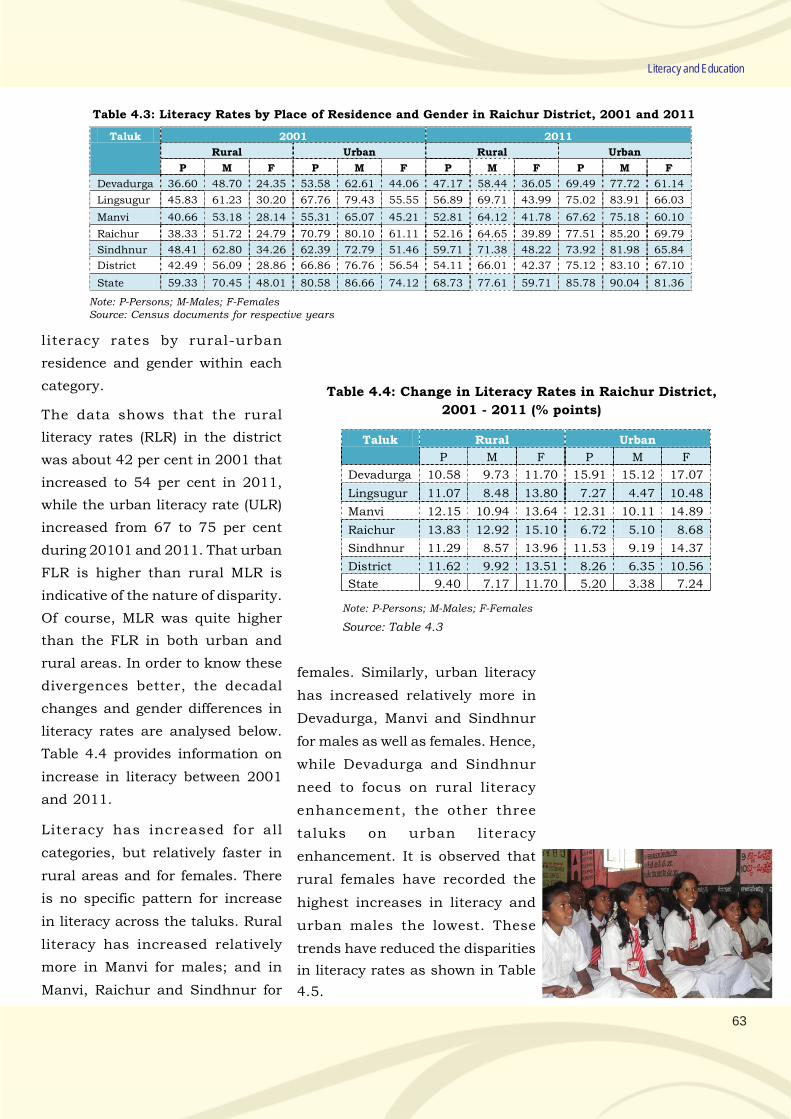
63
Literacy and Education
Table 4.3: Literacy Rates by Place of Residence and Gender in Raichur District, 2001 and 2011
Taluk 2001 2011
Rural Urban Rural Urban
P M F P M F P M F P M F
Devadurga 36.60 48.70 24.35 53.58 62.61 44.06 47.17 58.44 36.05 69.49 77.72 61.14
Lingsugur 45.83 61.23 30.20 67.76 79.43 55.55 56.89 69.71 43.99 75.02 83.91 66.03
Manvi 40.66 53.18 28.14 55.31 65.07 45.21 52.81 64.12 41.78 67.62 75.18 60.10
Raichur 38.33 51.72 24.79 70.79 80.10 61.11 52.16 64.65 39.89 77.51 85.20 69.79
Sindhnur 48.41 62.80 34.26 62.39 72.79 51.46 59.71 71.38 48.22 73.92 81.98 65.84
District 42.49 56.09 28.86 66.86 76.76 56.54 54.11 66.01 42.37 75.12 83.10 67.10
State 59.33 70.45 48.01 80.58 86.66 74.12 68.73 77.61 59.71 85.78 90.04 81.36
Note: P-Persons; M-Males; F-FemalesSource: Census documents for respective years
literacy rates by rural-urban
residence and gender within each
category.
The data shows that the rural
literacy rates (RLR) in the district
was about 42 per cent in 2001 that
increased to 54 per cent in 2011,
while the urban literacy rate (ULR)
increased from 67 to 75 per cent
during 20101 and 2011. That urban
FLR is higher than rural MLR is
indicative of the nature of disparity.
Of course, MLR was quite higher
than the FLR in both urban and
rural areas. In order to know these
divergences better, the decadal
changes and gender differences in
literacy rates are analysed below.
Table 4.4 provides information on
increase in literacy between 2001
and 2011.
Literacy has increased for all
categories, but relatively faster in
rural areas and for females. There
is no specific pattern for increase
in literacy across the taluks. Rural
literacy has increased relatively
more in Manvi for males; and in
Manvi, Raichur and Sindhnur for
Table 4.4: Change in Literacy Rates in Raichur District,
2001 - 2011 (% points)
Taluk Rural Urban
P M F P M F
Devadurga 10.58 9.73 11.70 15.91 15.12 17.07
Lingsugur 11.07 8.48 13.80 7.27 4.47 10.48
Manvi 12.15 10.94 13.64 12.31 10.11 14.89
Raichur 13.83 12.92 15.10 6.72 5.10 8.68
Sindhnur 11.29 8.57 13.96 11.53 9.19 14.37
District 11.62 9.92 13.51 8.26 6.35 10.56
State 9.40 7.17 11.70 5.20 3.38 7.24
Note: P-Persons; M-Males; F-Females
Source: Table 4.3
females. Similarly, urban literacy
has increased relatively more in
Devadurga, Manvi and Sindhnur
for males as well as females. Hence,
while Devadurga and Sindhnur
need to focus on rural literacy
enhancement, the other three
taluks on urban literacy
enhancement. It is observed that
rural females have recorded the
highest increases in literacy and
urban males the lowest. These
trends have reduced the disparities
in literacy rates as shown in Table
4.5.
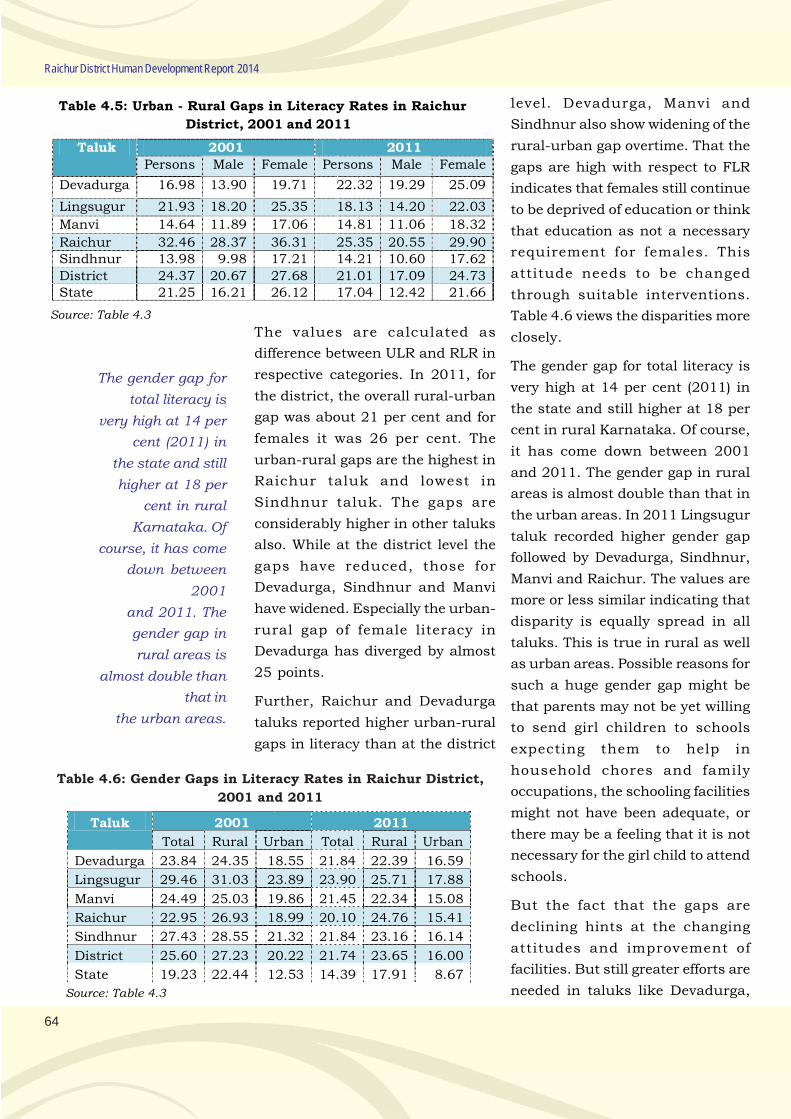
64
Raichur District Human Development Report 2014
Table 4.5: Urban - Rural Gaps in Literacy Rates in Raichur
District, 2001 and 2011
Source: Table 4.3
The values are calculated as
difference between ULR and RLR in
respective categories. In 2011, for
the district, the overall rural-urban
gap was about 21 per cent and for
females it was 26 per cent. The
urban-rural gaps are the highest in
Raichur taluk and lowest in
Sindhnur taluk. The gaps are
considerably higher in other taluks
also. While at the district level the
gaps have reduced, those for
Devadurga, Sindhnur and Manvi
have widened. Especially the urban-
rural gap of female literacy in
Devadurga has diverged by almost
25 points.
Further, Raichur and Devadurga
taluks reported higher urban-rural
gaps in literacy than at the district
level. Devadurga, Manvi and
Sindhnur also show widening of the
rural-urban gap overtime. That the
gaps are high with respect to FLR
indicates that females still continue
to be deprived of education or think
that education as not a necessary
requirement for females. This
attitude needs to be changed
through suitable interventions.
Table 4.6 views the disparities more
closely.
The gender gap for total literacy is
very high at 14 per cent (2011) in
the state and still higher at 18 per
cent in rural Karnataka. Of course,
it has come down between 2001
and 2011. The gender gap in rural
areas is almost double than that in
the urban areas. In 2011 Lingsugur
taluk recorded higher gender gap
followed by Devadurga, Sindhnur,
Manvi and Raichur. The values are
more or less similar indicating that
disparity is equally spread in all
taluks. This is true in rural as well
as urban areas. Possible reasons for
such a huge gender gap might be
that parents may not be yet willing
to send girl children to schools
expecting them to help in
household chores and family
occupations, the schooling facilities
might not have been adequate, or
there may be a feeling that it is not
necessary for the girl child to attend
schools.
But the fact that the gaps are
declining hints at the changing
attitudes and improvement of
facilities. But still greater efforts are
needed in taluks like Devadurga,
Table 4.6: Gender Gaps in Literacy Rates in Raichur District,
2001 and 2011
Taluk 2001 2011
Total Rural Urban Total Rural Urban
Devadurga 23.84 24.35 18.55 21.84 22.39 16.59
Lingsugur 29.46 31.03 23.89 23.90 25.71 17.88
Manvi 24.49 25.03 19.86 21.45 22.34 15.08
Raichur 22.95 26.93 18.99 20.10 24.76 15.41
Sindhnur 27.43 28.55 21.32 21.84 23.16 16.14
District 25.60 27.23 20.22 21.74 23.65 16.00
State 19.23 22.44 12.53 14.39 17.91 8.67
Source: Table 4.3
The gender gap for
total literacy is
very high at 14 per
cent (2011) in
the state and still
higher at 18 per
cent in rural
Karnataka. Of
course, it has come
down between
2001
and 2011. The
gender gap in
rural areas is
almost double than
that in
the urban areas.
Taluk 2001 2011
Persons Male Female Persons Male Female
Devadurga 16.98 13.90 19.71 22.32 19.29 25.09
Lingsugur 21.93 18.20 25.35 18.13 14.20 22.03
Manvi 14.64 11.89 17.06 14.81 11.06 18.32
Raichur 32.46 28.37 36.31 25.35 20.55 29.90
Sindhnur 13.98 9.98 17.21 14.21 10.60 17.62
District 24.37 20.67 27.68 21.01 17.09 24.73
State 21.25 16.21 26.12 17.04 12.42 21.66
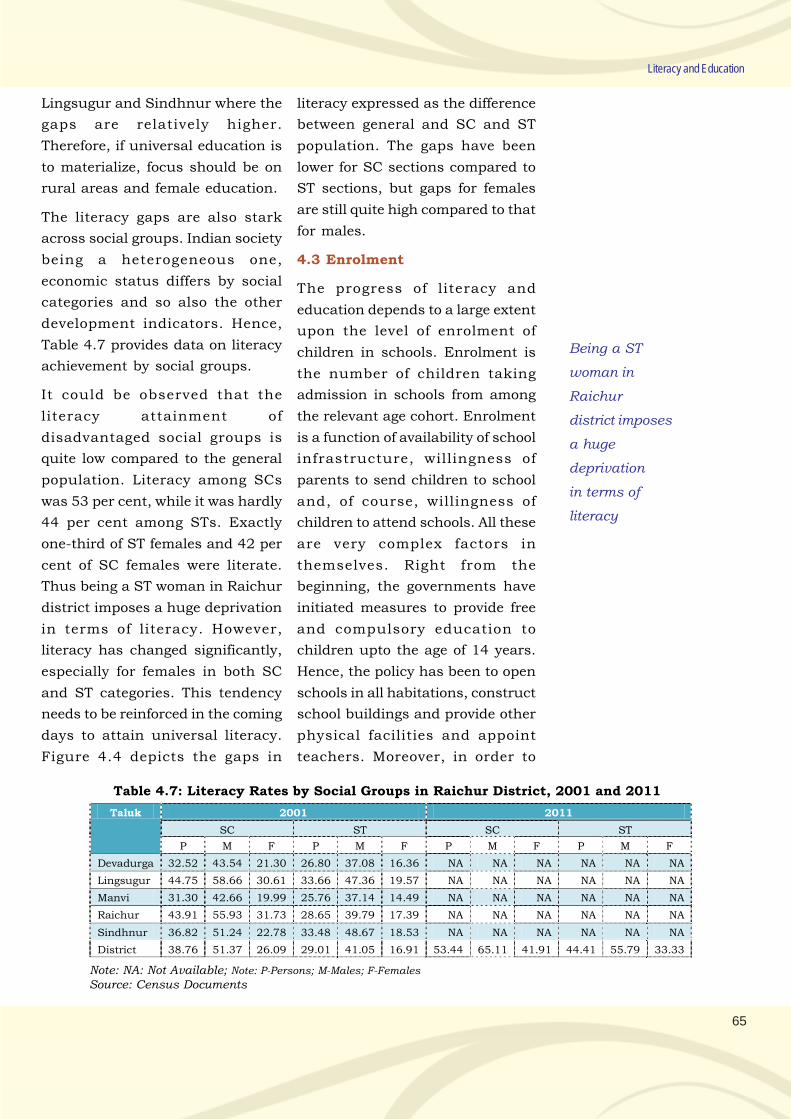
65
Literacy and Education
Lingsugur and Sindhnur where the
gaps are relatively higher.
Therefore, if universal education is
to materialize, focus should be on
rural areas and female education.
The literacy gaps are also stark
across social groups. Indian society
being a heterogeneous one,
economic status differs by social
categories and so also the other
development indicators. Hence,
Table 4.7 provides data on literacy
achievement by social groups.
It could be observed that the
literacy attainment of
disadvantaged social groups is
quite low compared to the general
population. Literacy among SCs
was 53 per cent, while it was hardly
44 per cent among STs. Exactly
one-third of ST females and 42 per
cent of SC females were literate.
Thus being a ST woman in Raichur
district imposes a huge deprivation
in terms of literacy. However,
literacy has changed significantly,
especially for females in both SC
and ST categories. This tendency
needs to be reinforced in the coming
days to attain universal literacy.
Figure 4.4 depicts the gaps in
Table 4.7: Literacy Rates by Social Groups in Raichur District, 2001 and 2011
Taluk 2001 2011
SC ST SC ST
P M F P M F P M F P M F
Devadurga 32.52 43.54 21.30 26.80 37.08 16.36 NA NA NA NA NA NA
Lingsugur 44.75 58.66 30.61 33.66 47.36 19.57 NA NA NA NA NA NA
Manvi 31.30 42.66 19.99 25.76 37.14 14.49 NA NA NA NA NA NA
Raichur 43.91 55.93 31.73 28.65 39.79 17.39 NA NA NA NA NA NA
Sindhnur 36.82 51.24 22.78 33.48 48.67 18.53 NA NA NA NA NA NA
District 38.76 51.37 26.09 29.01 41.05 16.91 53.44 65.11 41.91 44.41 55.79 33.33
Note: NA: Not Available; Note: P-Persons; M-Males; F-Females
Source: Census Documents
literacy expressed as the difference
between general and SC and ST
population. The gaps have been
lower for SC sections compared to
ST sections, but gaps for females
are still quite high compared to that
for males.
4.3 Enrolment
The progress of literacy and
education depends to a large extent
upon the level of enrolment of
children in schools. Enrolment is
the number of children taking
admission in schools from among
the relevant age cohort. Enrolment
is a function of availability of school
infrastructure, willingness of
parents to send children to school
and, of course, willingness of
children to attend schools. All these
are very complex factors in
themselves. Right from the
beginning, the governments have
initiated measures to provide free
and compulsory education to
children upto the age of 14 years.
Hence, the policy has been to open
schools in all habitations, construct
school buildings and provide other
physical facilities and appoint
teachers. Moreover, in order to
Being a ST
woman in
Raichur
district imposes
a huge
deprivation
in terms of
literacy
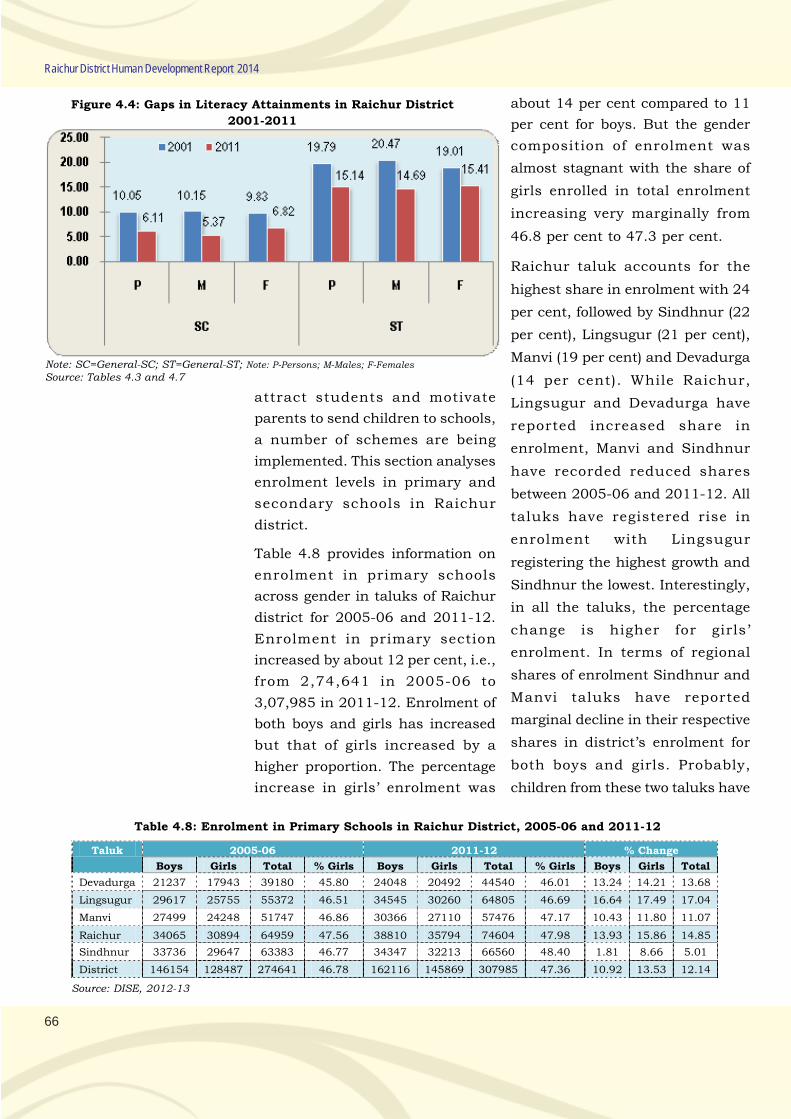
66
Raichur District Human Development Report 2014
Figure 4.4: Gaps in Literacy Attainments in Raichur District
2001-2011
Note: SC=General-SC; ST=General-ST; Note: P-Persons; M-Males; F-Females
Source: Tables 4.3 and 4.7
attract students and motivate
parents to send children to schools,
a number of schemes are being
implemented. This section analyses
enrolment levels in primary and
secondary schools in Raichur
district.
Table 4.8 provides information on
enrolment in primary schools
across gender in taluks of Raichur
district for 2005-06 and 2011-12.
Enrolment in primary section
increased by about 12 per cent, i.e.,
from 2,74,641 in 2005-06 to
3,07,985 in 2011-12. Enrolment of
both boys and girls has increased
but that of girls increased by a
higher proportion. The percentage
increase in girls’ enrolment was
Table 4.8: Enrolment in Primary Schools in Raichur District, 2005-06 and 2011-12
Taluk 2005-06 2011-12 % Change
Boys Girls Total % Girls Boys Girls Total % Girls Boys Girls Total
Devadurga 21237 17943 39180 45.80 24048 20492 44540 46.01 13.24 14.21 13.68
Lingsugur 29617 25755 55372 46.51 34545 30260 64805 46.69 16.64 17.49 17.04
Manvi 27499 24248 51747 46.86 30366 27110 57476 47.17 10.43 11.80 11.07
Raichur 34065 30894 64959 47.56 38810 35794 74604 47.98 13.93 15.86 14.85
Sindhnur 33736 29647 63383 46.77 34347 32213 66560 48.40 1.81 8.66 5.01
District 146154 128487 274641 46.78 162116 145869 307985 47.36 10.92 13.53 12.14
Source: DISE, 2012-13
about 14 per cent compared to 11
per cent for boys. But the gender
composition of enrolment was
almost stagnant with the share of
girls enrolled in total enrolment
increasing very marginally from
46.8 per cent to 47.3 per cent.
Raichur taluk accounts for the
highest share in enrolment with 24
per cent, followed by Sindhnur (22
per cent), Lingsugur (21 per cent),
Manvi (19 per cent) and Devadurga
(14 per cent). While Raichur,
Lingsugur and Devadurga have
reported increased share in
enrolment, Manvi and Sindhnur
have recorded reduced shares
between 2005-06 and 2011-12. All
taluks have registered rise in
enrolment with Lingsugur
registering the highest growth and
Sindhnur the lowest. Interestingly,
in all the taluks, the percentage
change is higher for girls’
enrolment. In terms of regional
shares of enrolment Sindhnur and
Manvi taluks have reported
marginal decline in their respective
shares in district’s enrolment for
both boys and girls. Probably,
children from these two taluks have
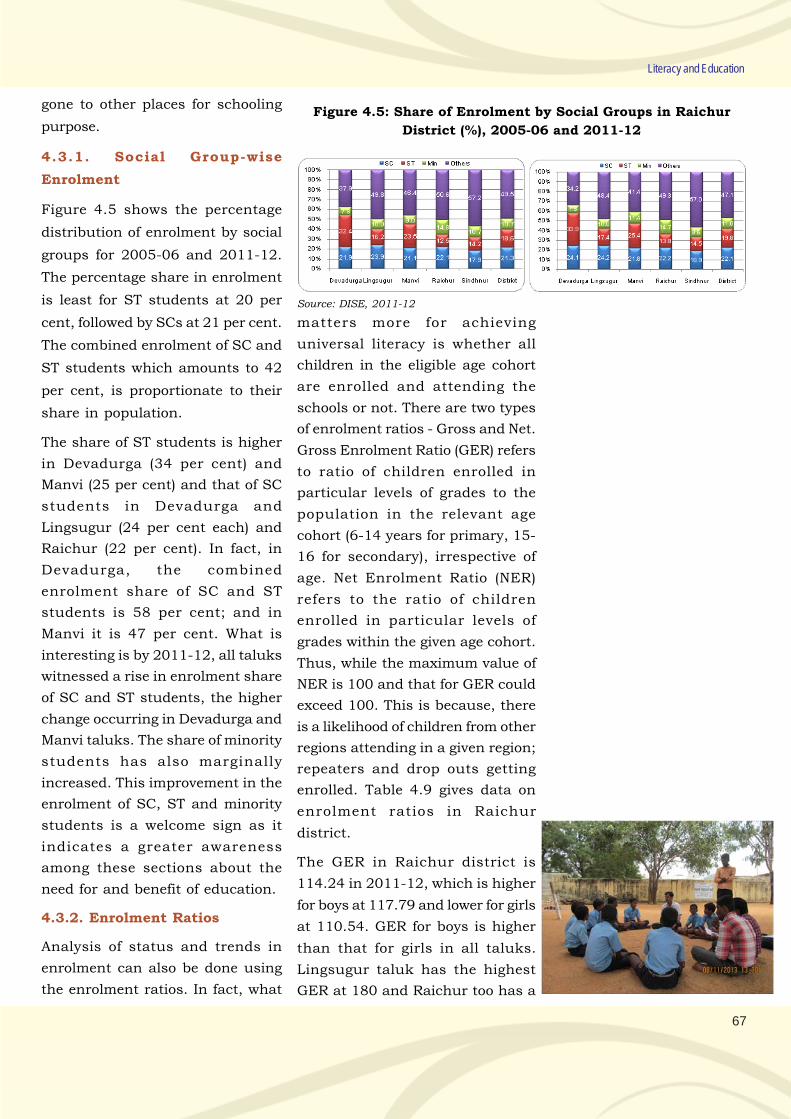
67
Literacy and Education
gone to other places for schooling
purpose.
4.3.1. Social Group-wise
Enrolment
Figure 4.5 shows the percentage
distribution of enrolment by social
groups for 2005-06 and 2011-12.
The percentage share in enrolment
is least for ST students at 20 per
cent, followed by SCs at 21 per cent.
The combined enrolment of SC and
ST students which amounts to 42
per cent, is proportionate to their
share in population.
The share of ST students is higher
in Devadurga (34 per cent) and
Manvi (25 per cent) and that of SC
students in Devadurga and
Lingsugur (24 per cent each) and
Raichur (22 per cent). In fact, in
Devadurga, the combined
enrolment share of SC and ST
students is 58 per cent; and in
Manvi it is 47 per cent. What is
interesting is by 2011-12, all taluks
witnessed a rise in enrolment share
of SC and ST students, the higher
change occurring in Devadurga and
Manvi taluks. The share of minority
students has also marginally
increased. This improvement in the
enrolment of SC, ST and minority
students is a welcome sign as it
indicates a greater awareness
among these sections about the
need for and benefit of education.
4.3.2. Enrolment Ratios
Analysis of status and trends in
enrolment can also be done using
the enrolment ratios. In fact, what
Figure 4.5: Share of Enrolment by Social Groups in Raichur
District (%), 2005-06 and 2011-12
Source: DISE, 2011-12
matters more for achieving
universal literacy is whether all
children in the eligible age cohort
are enrolled and attending the
schools or not. There are two types
of enrolment ratios - Gross and Net.
Gross Enrolment Ratio (GER) refers
to ratio of children enrolled in
particular levels of grades to the
population in the relevant age
cohort (6-14 years for primary, 15-
16 for secondary), irrespective of
age. Net Enrolment Ratio (NER)
refers to the ratio of children
enrolled in particular levels of
grades within the given age cohort.
Thus, while the maximum value of
NER is 100 and that for GER could
exceed 100. This is because, there
is a likelihood of children from other
regions attending in a given region;
repeaters and drop outs getting
enrolled. Table 4.9 gives data on
enrolment ratios in Raichur
district.
The GER in Raichur district is
114.24 in 2011-12, which is higher
for boys at 117.79 and lower for girls
at 110.54. GER for boys is higher
than that for girls in all taluks.
Lingsugur taluk has the highest
GER at 180 and Raichur too has a
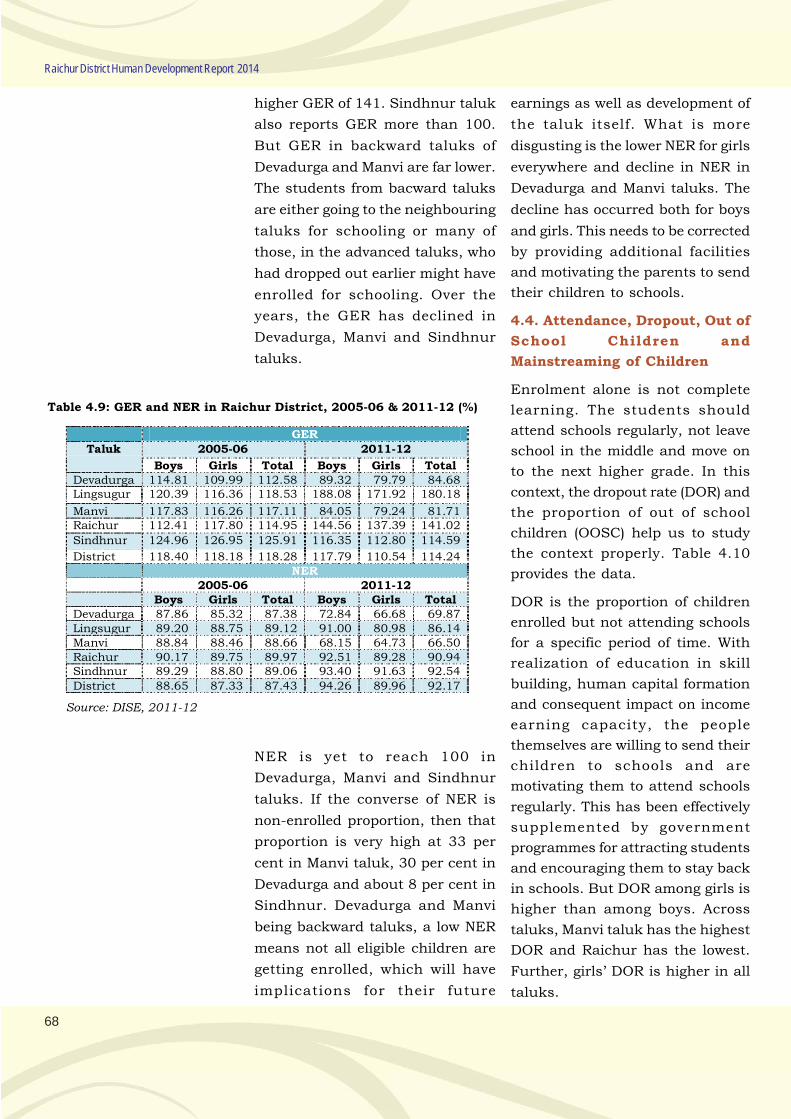
68
Raichur District Human Development Report 2014
higher GER of 141. Sindhnur taluk
also reports GER more than 100.
But GER in backward taluks of
Devadurga and Manvi are far lower.
The students from bacward taluks
are either going to the neighbouring
taluks for schooling or many of
those, in the advanced taluks, who
had dropped out earlier might have
enrolled for schooling. Over the
years, the GER has declined in
Devadurga, Manvi and Sindhnur
taluks.
Table 4.9: GER and NER in Raichur District, 2005-06 & 2011-12 (%)
Source: DISE, 2011-12
NER is yet to reach 100 in
Devadurga, Manvi and Sindhnur
taluks. If the converse of NER is
non-enrolled proportion, then that
proportion is very high at 33 per
cent in Manvi taluk, 30 per cent in
Devadurga and about 8 per cent in
Sindhnur. Devadurga and Manvi
being backward taluks, a low NER
means not all eligible children are
getting enrolled, which will have
implications for their future
earnings as well as development of
the taluk itself. What is more
disgusting is the lower NER for girls
everywhere and decline in NER in
Devadurga and Manvi taluks. The
decline has occurred both for boys
and girls. This needs to be corrected
by providing additional facilities
and motivating the parents to send
their children to schools.
4.4. Attendance, Dropout, Out of
School Children and
Mainstreaming of Children
Enrolment alone is not complete
learning. The students should
attend schools regularly, not leave
school in the middle and move on
to the next higher grade. In this
context, the dropout rate (DOR) and
the proportion of out of school
children (OOSC) help us to study
the context properly. Table 4.10
provides the data.
DOR is the proportion of children
enrolled but not attending schools
for a specific period of time. With
realization of education in skill
building, human capital formation
and consequent impact on income
earning capacity, the people
themselves are willing to send their
children to schools and are
motivating them to attend schools
regularly. This has been effectively
supplemented by government
programmes for attracting students
and encouraging them to stay back
in schools. But DOR among girls is
higher than among boys. Across
taluks, Manvi taluk has the highest
DOR and Raichur has the lowest.
Further, girls’ DOR is higher in all
taluks.
GER
Taluk 2005-06 2011-12
Boys Girls Total Boys Girls Total Devadurga 114.81 109.99 112.58 89.32 79.79 84.68 Lingsugur 120.39 116.36 118.53 188.08 171.92 180.18
Manvi 117.83 116.26 117.11 84.05 79.24 81.71 Raichur 112.41 117.80 114.95 144.56 137.39 141.02
Sindhnur 124.96 126.95 125.91 116.35 112.80 114.59
District 118.40 118.18 118.28 117.79 110.54 114.24 NER 2005-06 2011-12 Boys Girls Total Boys Girls Total Devadurga 87.86 85.32 87.38 72.84 66.68 69.87 Lingsugur 89.20 88.75 89.12 91.00 80.98 86.14 Manvi 88.84 88.46 88.66 68.15 64.73 66.50 Raichur 90.17 89.75 89.97 92.51 89.28 90.94 Sindhnur 89.29 88.80 89.06 93.40 91.63 92.54
District 88.65 87.33 87.43 94.26 89.96 92.17
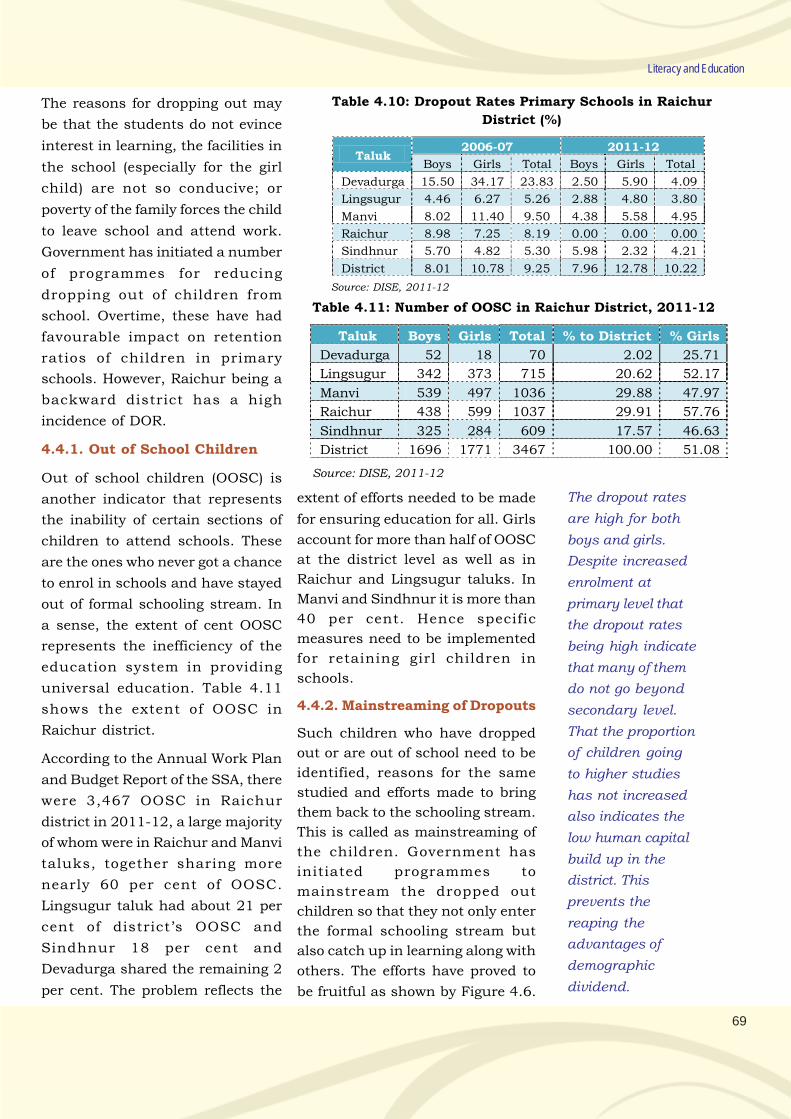
69
Literacy and Education
Table 4.10: Dropout Rates Primary Schools in Raichur
District (%)
Taluk 2006-07 2011-12
Boys Girls Total Boys Girls Total
Devadurga 15.50 34.17 23.83 2.50 5.90 4.09
Lingsugur 4.46 6.27 5.26 2.88 4.80 3.80
Manvi 8.02 11.40 9.50 4.38 5.58 4.95
Raichur 8.98 7.25 8.19 0.00 0.00 0.00
Sindhnur 5.70 4.82 5.30 5.98 2.32 4.21
District 8.01 10.78 9.25 7.96 12.78 10.22
Source: DISE, 2011-12
The reasons for dropping out may
be that the students do not evince
interest in learning, the facilities in
the school (especially for the girl
child) are not so conducive; or
poverty of the family forces the child
to leave school and attend work.
Government has initiated a number
of programmes for reducing
dropping out of children from
school. Overtime, these have had
favourable impact on retention
ratios of children in primary
schools. However, Raichur being a
backward district has a high
incidence of DOR.
4.4.1. Out of School Children
Out of school children (OOSC) is
another indicator that represents
the inability of certain sections of
children to attend schools. These
are the ones who never got a chance
to enrol in schools and have stayed
out of formal schooling stream. In
a sense, the extent of cent OOSC
represents the inefficiency of the
education system in providing
universal education. Table 4.11
shows the extent of OOSC in
Raichur district.
According to the Annual Work Plan
and Budget Report of the SSA, there
were 3,467 OOSC in Raichur
district in 2011-12, a large majority
of whom were in Raichur and Manvi
taluks, together sharing more
nearly 60 per cent of OOSC.
Lingsugur taluk had about 21 per
cent of district’s OOSC and
Sindhnur 18 per cent and
Devadurga shared the remaining 2
per cent. The problem reflects the
Table 4.11: Number of OOSC in Raichur District, 2011-12
Taluk Boys Girls Total % to District % Girls
Devadurga 52 18 70 2.02 25.71
Lingsugur 342 373 715 20.62 52.17
Manvi 539 497 1036 29.88 47.97
Raichur 438 599 1037 29.91 57.76
Sindhnur 325 284 609 17.57 46.63
District 1696 1771 3467 100.00 51.08
Source: DISE, 2011-12
extent of efforts needed to be made
for ensuring education for all. Girls
account for more than half of OOSC
at the district level as well as in
Raichur and Lingsugur taluks. In
Manvi and Sindhnur it is more than
40 per cent. Hence specific
measures need to be implemented
for retaining girl children in
schools.
4.4.2. Mainstreaming of Dropouts
Such children who have dropped
out or are out of school need to be
identified, reasons for the same
studied and efforts made to bring
them back to the schooling stream.
This is called as mainstreaming of
the children. Government has
initiated programmes to
mainstream the dropped out
children so that they not only enter
the formal schooling stream but
also catch up in learning along with
others. The efforts have proved to
be fruitful as shown by Figure 4.6.
The dropout rates
are high for both
boys and girls.
Despite increased
enrolment at
primary level that
the dropout rates
being high indicate
that many of them
do not go beyond
secondary level.
That the proportion
of children going
to higher studies
has not increased
also indicates the
low human capital
build up in the
district. This
prevents the
reaping the
advantages of
demographic
dividend.
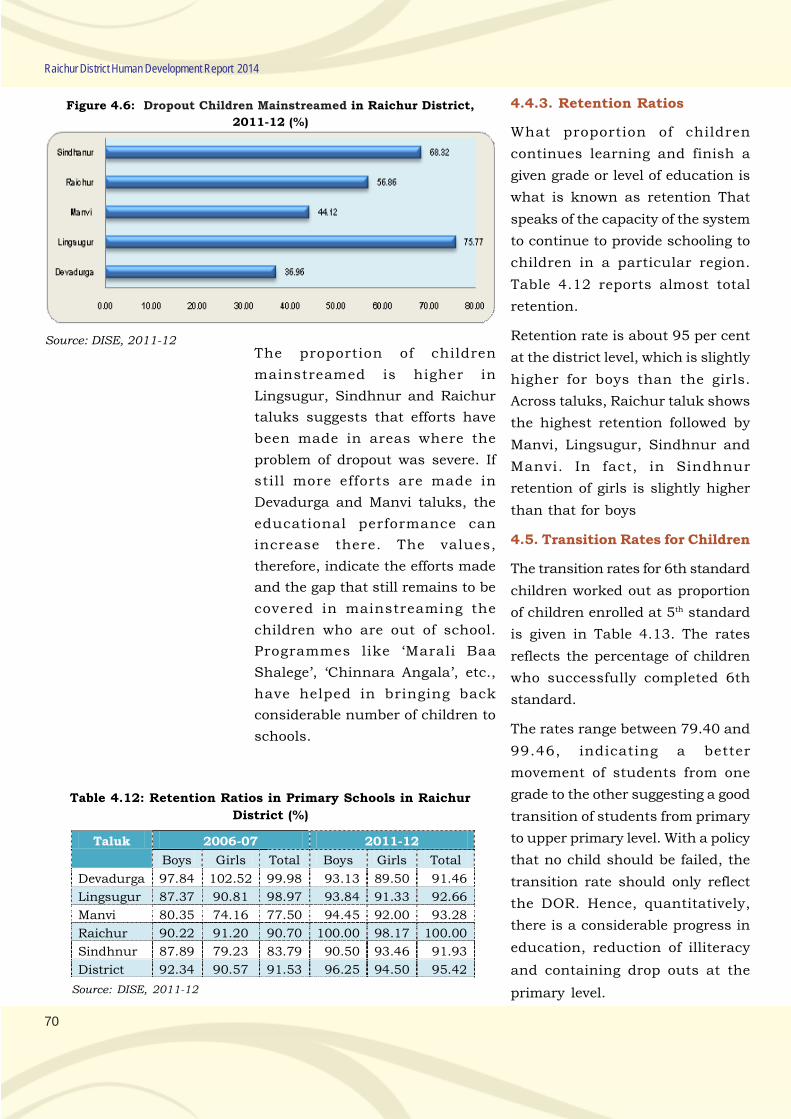
70
Raichur District Human Development Report 2014
Figure 4.6: Dropout Children Mainstreamed in Raichur District,
2011-12 (%)
Source: DISE, 2011-12The proportion of children
mainstreamed is higher in
Lingsugur, Sindhnur and Raichur
taluks suggests that efforts have
been made in areas where the
problem of dropout was severe. If
still more efforts are made in
Devadurga and Manvi taluks, the
educational performance can
increase there. The values,
therefore, indicate the efforts made
and the gap that still remains to be
covered in mainstreaming the
children who are out of school.
Programmes like ‘Marali Baa
Shalege’, ‘Chinnara Angala’, etc.,
have helped in bringing back
considerable number of children to
schools.
Table 4.12: Retention Ratios in Primary Schools in Raichur
District (%)
4.4.3. Retention Ratios
What proportion of children
continues learning and finish a
given grade or level of education is
what is known as retention That
speaks of the capacity of the system
to continue to provide schooling to
children in a particular region.
Table 4.12 reports almost total
retention.
Retention rate is about 95 per cent
at the district level, which is slightly
higher for boys than the girls.
Across taluks, Raichur taluk shows
the highest retention followed by
Manvi, Lingsugur, Sindhnur and
Manvi. In fact, in Sindhnur
retention of girls is slightly higher
than that for boys
4.5. Transition Rates for Children
The transition rates for 6th standard
children worked out as proportion
of children enrolled at 5th standard
is given in Table 4.13. The rates
reflects the percentage of children
who successfully completed 6th
standard.
The rates range between 79.40 and
99.46, indicating a better
movement of students from one
grade to the other suggesting a good
transition of students from primary
to upper primary level. With a policy
that no child should be failed, the
transition rate should only reflect
the DOR. Hence, quantitatively,
there is a considerable progress in
education, reduction of illiteracy
and containing drop outs at the
primary level.
Taluk 2006-07 2011-12
Boys Girls Total Boys Girls Total
Devadurga 97.84 102.52 99.98 93.13 89.50 91.46
Lingsugur 87.37 90.81 98.97 93.84 91.33 92.66
Manvi 80.35 74.16 77.50 94.45 92.00 93.28
Raichur 90.22 91.20 90.70 100.00 98.17 100.00
Sindhnur 87.89 79.23 83.79 90.50 93.46 91.93
District 92.34 90.57 91.53 96.25 94.50 95.42
Source: DISE, 2011-12
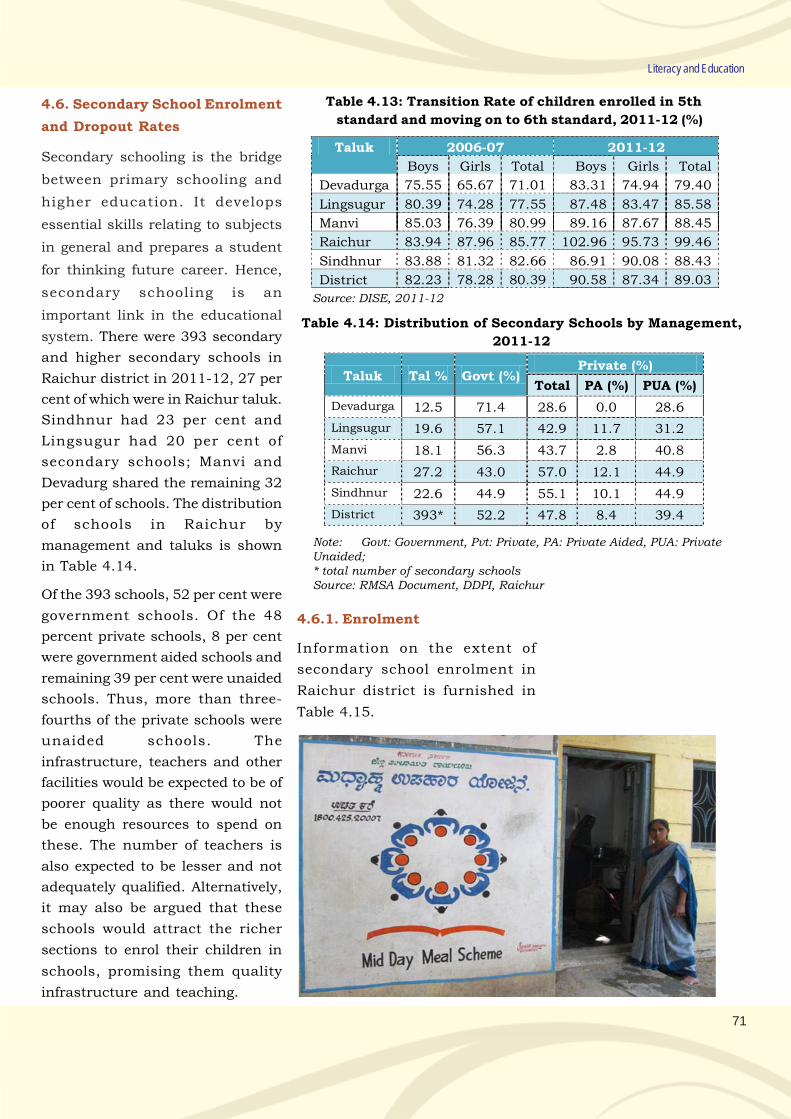
71
Literacy and Education
Table 4.13: Transition Rate of children enrolled in 5th
standard and moving on to 6th standard, 2011-12 (%)
Taluk 2006-07 2011-12
Boys Girls Total Boys Girls Total
Devadurga 75.55 65.67 71.01 83.31 74.94 79.40
Lingsugur 80.39 74.28 77.55 87.48 83.47 85.58
Manvi 85.03 76.39 80.99 89.16 87.67 88.45
Raichur 83.94 87.96 85.77 102.96 95.73 99.46
Sindhnur 83.88 81.32 82.66 86.91 90.08 88.43
District 82.23 78.28 80.39 90.58 87.34 89.03
Source: DISE, 2011-12
4.6. Secondary School Enrolment
and Dropout Rates
Secondary schooling is the bridge
between primary schooling and
higher education. It develops
essential skills relating to subjects
in general and prepares a student
for thinking future career. Hence,
secondary schooling is an
important link in the educational
system. There were 393 secondary
and higher secondary schools in
Raichur district in 2011-12, 27 per
cent of which were in Raichur taluk.
Sindhnur had 23 per cent and
Lingsugur had 20 per cent of
secondary schools; Manvi and
Devadurg shared the remaining 32
per cent of schools. The distribution
of schools in Raichur by
management and taluks is shown
in Table 4.14.
Of the 393 schools, 52 per cent were
government schools. Of the 48
percent private schools, 8 per cent
were government aided schools and
remaining 39 per cent were unaided
schools. Thus, more than three-
fourths of the private schools were
unaided schools. The
infrastructure, teachers and other
facilities would be expected to be of
poorer quality as there would not
be enough resources to spend on
these. The number of teachers is
also expected to be lesser and not
adequately qualified. Alternatively,
it may also be argued that these
schools would attract the richer
sections to enrol their children in
schools, promising them quality
infrastructure and teaching.
Table 4.14: Distribution of Secondary Schools by Management,
2011-12
Note: Govt: Government, Pvt: Private, PA: Private Aided, PUA: PrivateUnaided;* total number of secondary schoolsSource: RMSA Document, DDPI, Raichur
Taluk Tal % Govt (%) Private (%)
Total PA (%) PUA (%)
Devadurga 12.5 71.4 28.6 0.0 28.6
Lingsugur 19.6 57.1 42.9 11.7 31.2
Manvi 18.1 56.3 43.7 2.8 40.8
Raichur 27.2 43.0 57.0 12.1 44.9
Sindhnur 22.6 44.9 55.1 10.1 44.9
District 393* 52.2 47.8 8.4 39.4
4.6.1. Enrolment
Information on the extent of
secondary school enrolment in
Raichur district is furnished in
Table 4.15.
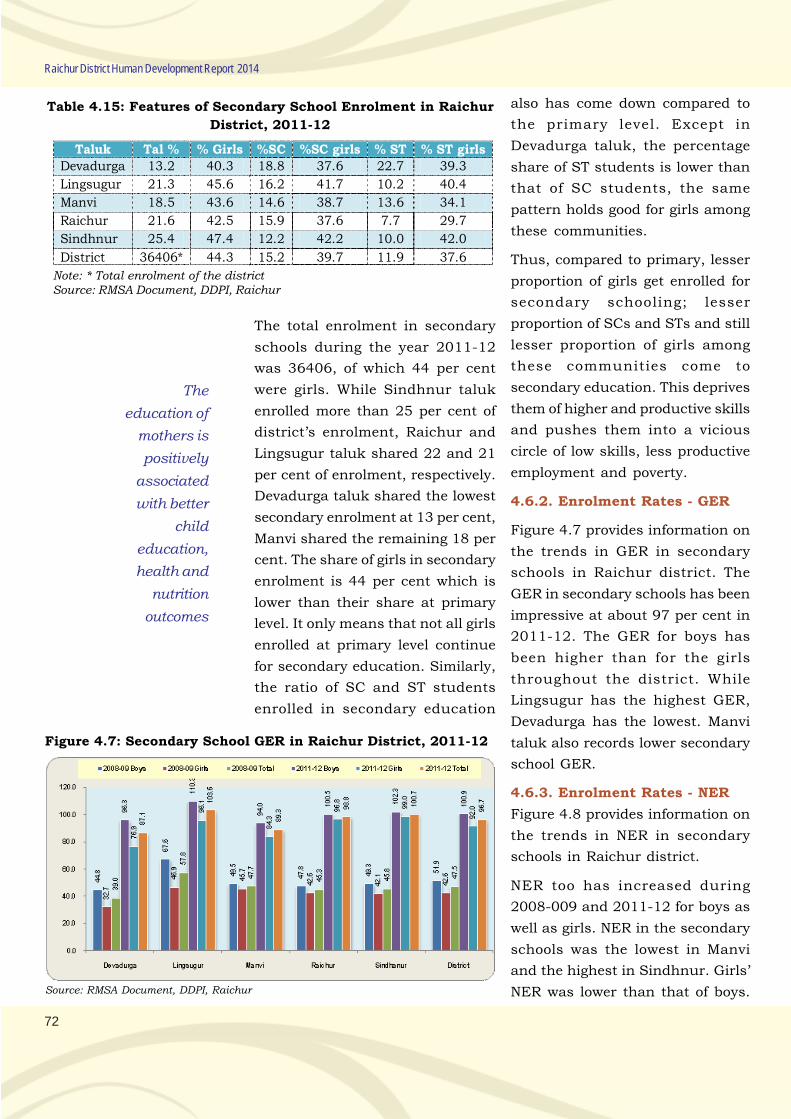
72
Raichur District Human Development Report 2014
Table 4.15: Features of Secondary School Enrolment in Raichur
District, 2011-12
Note: * Total enrolment of the districtSource: RMSA Document, DDPI, Raichur
The total enrolment in secondary
schools during the year 2011-12
was 36406, of which 44 per cent
were girls. While Sindhnur taluk
enrolled more than 25 per cent of
district’s enrolment, Raichur and
Lingsugur taluk shared 22 and 21
per cent of enrolment, respectively.
Devadurga taluk shared the lowest
secondary enrolment at 13 per cent,
Manvi shared the remaining 18 per
cent. The share of girls in secondary
enrolment is 44 per cent which is
lower than their share at primary
level. It only means that not all girls
enrolled at primary level continue
for secondary education. Similarly,
the ratio of SC and ST students
enrolled in secondary education
also has come down compared to
the primary level. Except in
Devadurga taluk, the percentage
share of ST students is lower than
that of SC students, the same
pattern holds good for girls among
these communities.
Thus, compared to primary, lesser
proportion of girls get enrolled for
secondary schooling; lesser
proportion of SCs and STs and still
lesser proportion of girls among
these communities come to
secondary education. This deprives
them of higher and productive skills
and pushes them into a vicious
circle of low skills, less productive
employment and poverty.
4.6.2. Enrolment Rates - GER
Figure 4.7 provides information on
the trends in GER in secondary
schools in Raichur district. The
GER in secondary schools has been
impressive at about 97 per cent in
2011-12. The GER for boys has
been higher than for the girls
throughout the district. While
Lingsugur has the highest GER,
Devadurga has the lowest. Manvi
taluk also records lower secondary
school GER.
4.6.3. Enrolment Rates - NER
Figure 4.8 provides information on
the trends in NER in secondary
schools in Raichur district.
NER too has increased during
2008-009 and 2011-12 for boys as
well as girls. NER in the secondary
schools was the lowest in Manvi
and the highest in Sindhnur. Girls’
NER was lower than that of boys.
Figure 4.7: Secondary School GER in Raichur District, 2011-12
Source: RMSA Document, DDPI, Raichur
The
education of
mothers is
positively
associated
with better
child
education,
health and
nutrition
outcomes
Taluk Tal % % Girls %SC %SC girls % ST % ST girls Devadurga 13.2 40.3 18.8 37.6 22.7 39.3
Lingsugur 21.3 45.6 16.2 41.7 10.2 40.4
Manvi 18.5 43.6 14.6 38.7 13.6 34.1
Raichur 21.6 42.5 15.9 37.6 7.7 29.7
Sindhnur 25.4 47.4 12.2 42.2 10.0 42.0
District 36406* 44.3 15.2 39.7 11.9 37.6
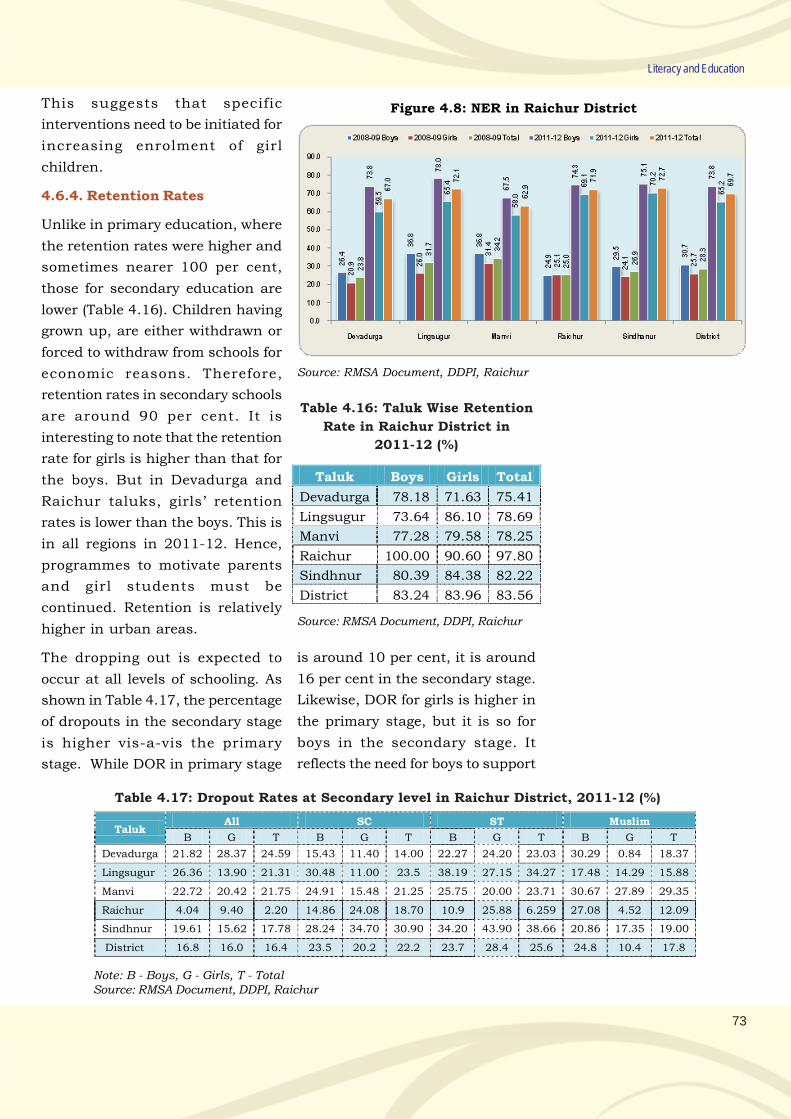
73
Literacy and Education
Figure 4.8: NER in Raichur District
Source: RMSA Document, DDPI, Raichur
This suggests that specific
interventions need to be initiated for
increasing enrolment of girl
children.
4.6.4. Retention Rates
Unlike in primary education, where
the retention rates were higher and
sometimes nearer 100 per cent,
those for secondary education are
lower (Table 4.16). Children having
grown up, are either withdrawn or
forced to withdraw from schools for
economic reasons. Therefore,
retention rates in secondary schools
are around 90 per cent. It is
interesting to note that the retention
rate for girls is higher than that for
the boys. But in Devadurga and
Raichur taluks, girls’ retention
rates is lower than the boys. This is
in all regions in 2011-12. Hence,
programmes to motivate parents
and girl students must be
continued. Retention is relatively
higher in urban areas.
The dropping out is expected to
occur at all levels of schooling. As
shown in Table 4.17, the percentage
of dropouts in the secondary stage
is higher vis-a-vis the primary
stage. While DOR in primary stage
Table 4.16: Taluk Wise Retention
Rate in Raichur District in
2011-12 (%)
Taluk Boys Girls Total
Devadurga 78.18 71.63 75.41
Lingsugur 73.64 86.10 78.69
Manvi 77.28 79.58 78.25
Raichur 100.00 90.60 97.80
Sindhnur 80.39 84.38 82.22
District 83.24 83.96 83.56
Source: RMSA Document, DDPI, Raichur
Table 4.17: Dropout Rates at Secondary level in Raichur District, 2011-12 (%)
Taluk All SC ST Muslim
B G T B G T B G T B G T
Devadurga 21.82 28.37 24.59 15.43 11.40 14.00 22.27 24.20 23.03 30.29 0.84 18.37
Lingsugur 26.36 13.90 21.31 30.48 11.00 23.5 38.19 27.15 34.27 17.48 14.29 15.88
Manvi 22.72 20.42 21.75 24.91 15.48 21.25 25.75 20.00 23.71 30.67 27.89 29.35
Raichur 4.04 9.40 2.20 14.86 24.08 18.70 10.9 25.88 6.259 27.08 4.52 12.09
Sindhnur 19.61 15.62 17.78 28.24 34.70 30.90 34.20 43.90 38.66 20.86 17.35 19.00
District 16.8 16.0 16.4 23.5 20.2 22.2 23.7 28.4 25.6 24.8 10.4 17.8
Note: B - Boys, G - Girls, T - TotalSource: RMSA Document, DDPI, Raichur
is around 10 per cent, it is around
16 per cent in the secondary stage.
Likewise, DOR for girls is higher in
the primary stage, but it is so for
boys in the secondary stage. It
reflects the need for boys to support
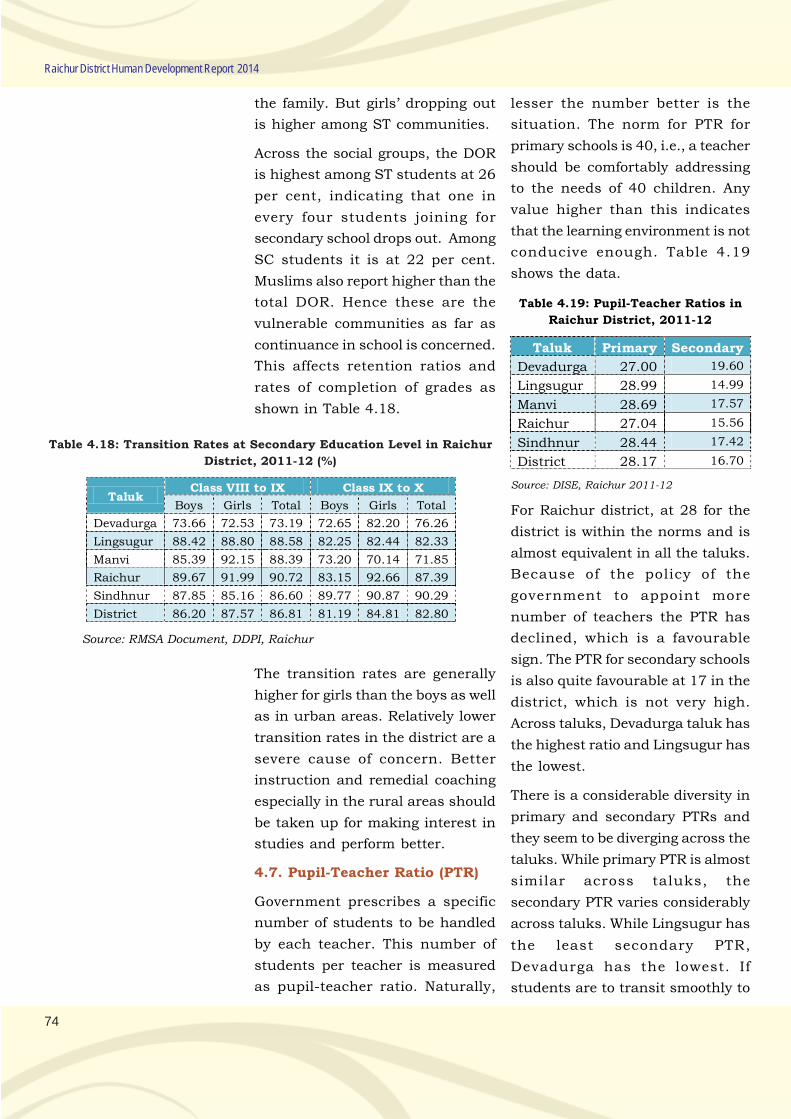
74
Raichur District Human Development Report 2014
the family. But girls’ dropping out
is higher among ST communities.
Across the social groups, the DOR
is highest among ST students at 26
per cent, indicating that one in
every four students joining for
secondary school drops out. Among
SC students it is at 22 per cent.
Muslims also report higher than the
total DOR. Hence these are the
vulnerable communities as far as
continuance in school is concerned.
This affects retention ratios and
rates of completion of grades as
shown in Table 4.18.
Table 4.18: Transition Rates at Secondary Education Level in Raichur
District, 2011-12 (%)
Taluk Class VIII to IX Class IX to X
Boys Girls Total Boys Girls Total
Devadurga 73.66 72.53 73.19 72.65 82.20 76.26
Lingsugur 88.42 88.80 88.58 82.25 82.44 82.33
Manvi 85.39 92.15 88.39 73.20 70.14 71.85
Raichur 89.67 91.99 90.72 83.15 92.66 87.39
Sindhnur 87.85 85.16 86.60 89.77 90.87 90.29
District 86.20 87.57 86.81 81.19 84.81 82.80
Source: RMSA Document, DDPI, Raichur
The transition rates are generally
higher for girls than the boys as well
as in urban areas. Relatively lower
transition rates in the district are a
severe cause of concern. Better
instruction and remedial coaching
especially in the rural areas should
be taken up for making interest in
studies and perform better.
4.7. Pupil-Teacher Ratio (PTR)
Government prescribes a specific
number of students to be handled
by each teacher. This number of
students per teacher is measured
as pupil-teacher ratio. Naturally,
lesser the number better is the
situation. The norm for PTR for
primary schools is 40, i.e., a teacher
should be comfortably addressing
to the needs of 40 children. Any
value higher than this indicates
that the learning environment is not
conducive enough. Table 4.19
shows the data.
Table 4.19: Pupil-Teacher Ratios in
Raichur District, 2011-12
Source: DISE, Raichur 2011-12
Taluk Primary Secondary
Devadurga 27.00 19.60
Lingsugur 28.99 14.99
Manvi 28.69 17.57
Raichur 27.04 15.56
Sindhnur 28.44 17.42
District 28.17 16.70
For Raichur district, at 28 for the
district is within the norms and is
almost equivalent in all the taluks.
Because of the policy of the
government to appoint more
number of teachers the PTR has
declined, which is a favourable
sign. The PTR for secondary schools
is also quite favourable at 17 in the
district, which is not very high.
Across taluks, Devadurga taluk has
the highest ratio and Lingsugur has
the lowest.
There is a considerable diversity in
primary and secondary PTRs and
they seem to be diverging across the
taluks. While primary PTR is almost
similar across taluks, the
secondary PTR varies considerably
across taluks. While Lingsugur has
the least secondary PTR,
Devadurga has the lowest. If
students are to transit smoothly to
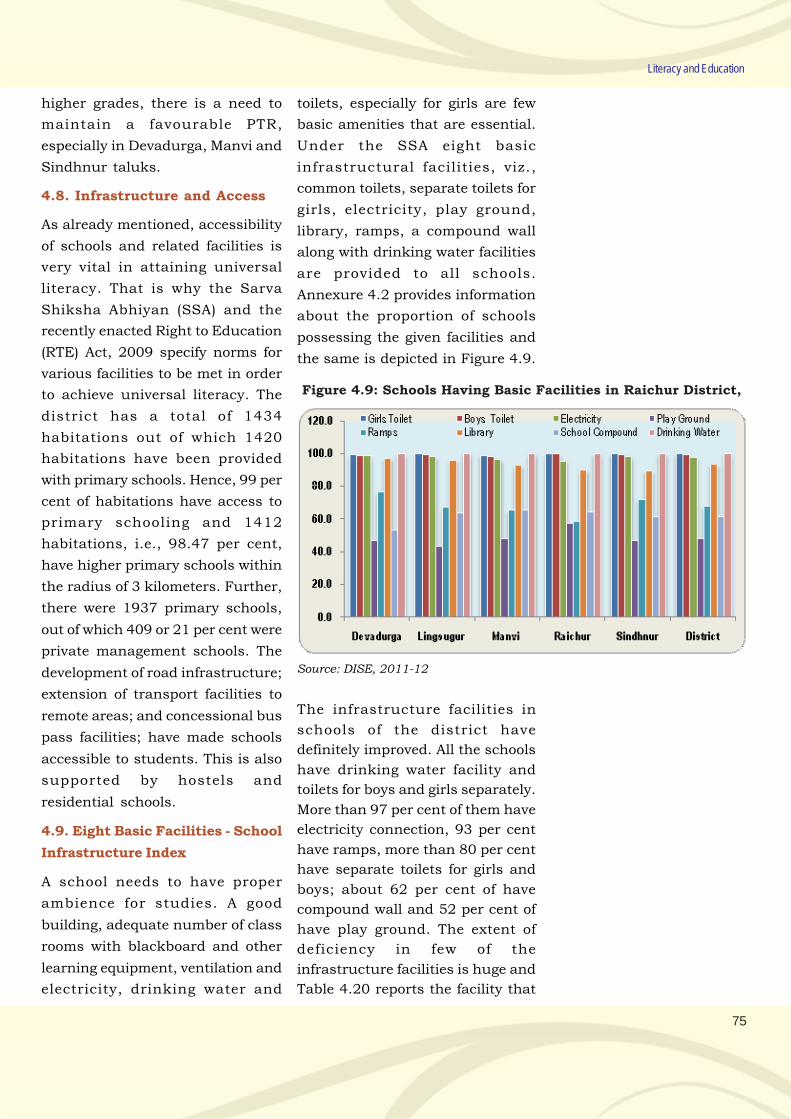
75
Literacy and Education
higher grades, there is a need to
maintain a favourable PTR,
especially in Devadurga, Manvi and
Sindhnur taluks.
4.8. Infrastructure and Access
As already mentioned, accessibility
of schools and related facilities is
very vital in attaining universal
literacy. That is why the Sarva
Shiksha Abhiyan (SSA) and the
recently enacted Right to Education
(RTE) Act, 2009 specify norms for
various facilities to be met in order
to achieve universal literacy. The
district has a total of 1434
habitations out of which 1420
habitations have been provided
with primary schools. Hence, 99 per
cent of habitations have access to
primary schooling and 1412
habitations, i.e., 98.47 per cent,
have higher primary schools within
the radius of 3 kilometers. Further,
there were 1937 primary schools,
out of which 409 or 21 per cent were
private management schools. The
development of road infrastructure;
extension of transport facilities to
remote areas; and concessional bus
pass facilities; have made schools
accessible to students. This is also
supported by hostels and
residential schools.
4.9. Eight Basic Facilities - School
Infrastructure Index
A school needs to have proper
ambience for studies. A good
building, adequate number of class
rooms with blackboard and other
learning equipment, ventilation and
electricity, drinking water and
toilets, especially for girls are few
basic amenities that are essential.
Under the SSA eight basic
infrastructural facilities, viz.,
common toilets, separate toilets for
girls, electricity, play ground,
library, ramps, a compound wall
along with drinking water facilities
are provided to all schools.
Annexure 4.2 provides information
about the proportion of schools
possessing the given facilities and
the same is depicted in Figure 4.9.
Figure 4.9: Schools Having Basic Facilities in Raichur District,
2011-12 (%)
Source: DISE, 2011-12
The infrastructure facilities in
schools of the district have
definitely improved. All the schools
have drinking water facility and
toilets for boys and girls separately.
More than 97 per cent of them have
electricity connection, 93 per cent
have ramps, more than 80 per cent
have separate toilets for girls and
boys; about 62 per cent of have
compound wall and 52 per cent of
have play ground. The extent of
deficiency in few of the
infrastructure facilities is huge and
Table 4.20 reports the facility that
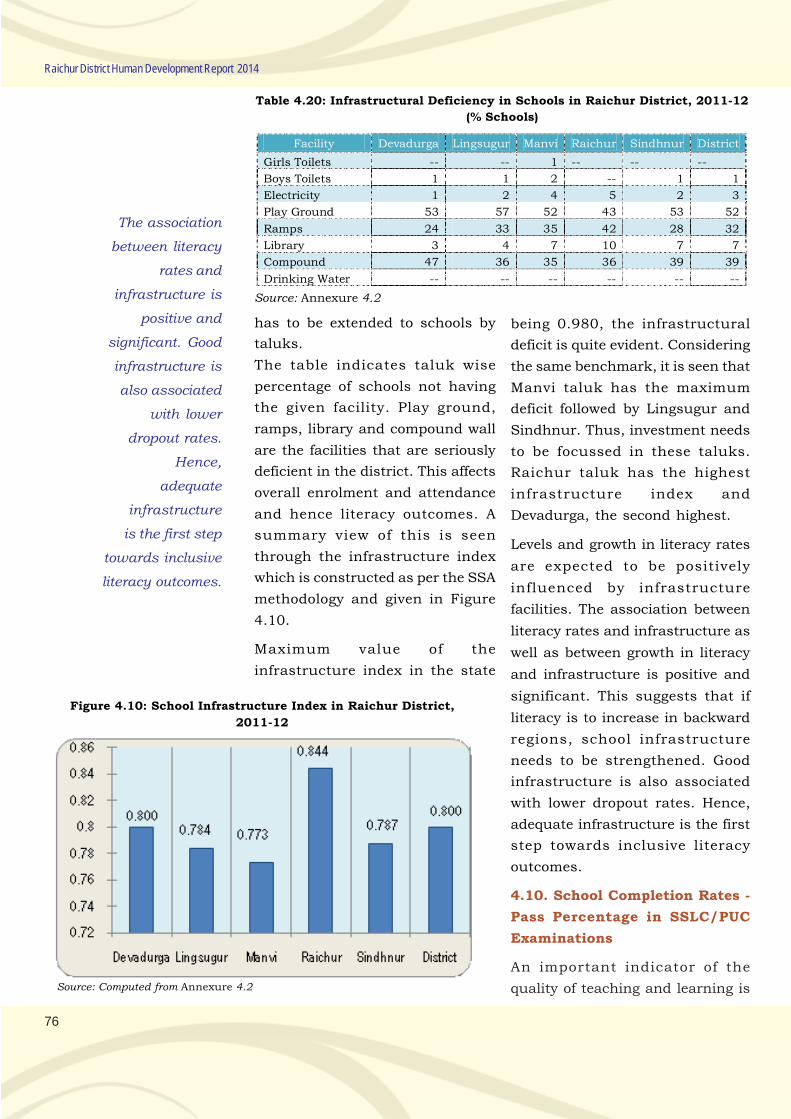
76
Raichur District Human Development Report 2014
has to be extended to schools by
taluks.
The table indicates taluk wise
percentage of schools not having
the given facility. Play ground,
ramps, library and compound wall
are the facilities that are seriously
deficient in the district. This affects
overall enrolment and attendance
and hence literacy outcomes. A
summary view of this is seen
through the infrastructure index
which is constructed as per the SSA
methodology and given in Figure
4.10.
Maximum value of the
infrastructure index in the state
Table 4.20: Infrastructural Deficiency in Schools in Raichur District, 2011-12
(% Schools)
Facility Devadurga Lingsugur Manvi Raichur Sindhnur District
Girls Toilets -- -- 1 -- -- --
Boys Toilets 1 1 2 -- 1 1
Electricity 1 2 4 5 2 3
Play Ground 53 57 52 43 53 52
Ramps 24 33 35 42 28 32
Library 3 4 7 10 7 7
Compound 47 36 35 36 39 39
Drinking Water -- -- -- -- -- --
Source: Annexure 4.2
Figure 4.10: School Infrastructure Index in Raichur District,
2011-12
Source: Computed from Annexure 4.2
being 0.980, the infrastructural
deficit is quite evident. Considering
the same benchmark, it is seen that
Manvi taluk has the maximum
deficit followed by Lingsugur and
Sindhnur. Thus, investment needs
to be focussed in these taluks.
Raichur taluk has the highest
infrastructure index and
Devadurga, the second highest.
Levels and growth in literacy rates
are expected to be positively
influenced by infrastructure
facilities. The association between
literacy rates and infrastructure as
well as between growth in literacy
and infrastructure is positive and
significant. This suggests that if
literacy is to increase in backward
regions, school infrastructure
needs to be strengthened. Good
infrastructure is also associated
with lower dropout rates. Hence,
adequate infrastructure is the first
step towards inclusive literacy
outcomes.
4.10. School Completion Rates -
Pass Percentage in SSLC/PUC
Examinations
An important indicator of the
quality of teaching and learning is
The association
between literacy
rates and
infrastructure is
positive and
significant. Good
infrastructure is
also associated
with lower
dropout rates.
Hence,
adequate
infrastructure
is the first step
towards inclusive
literacy outcomes.
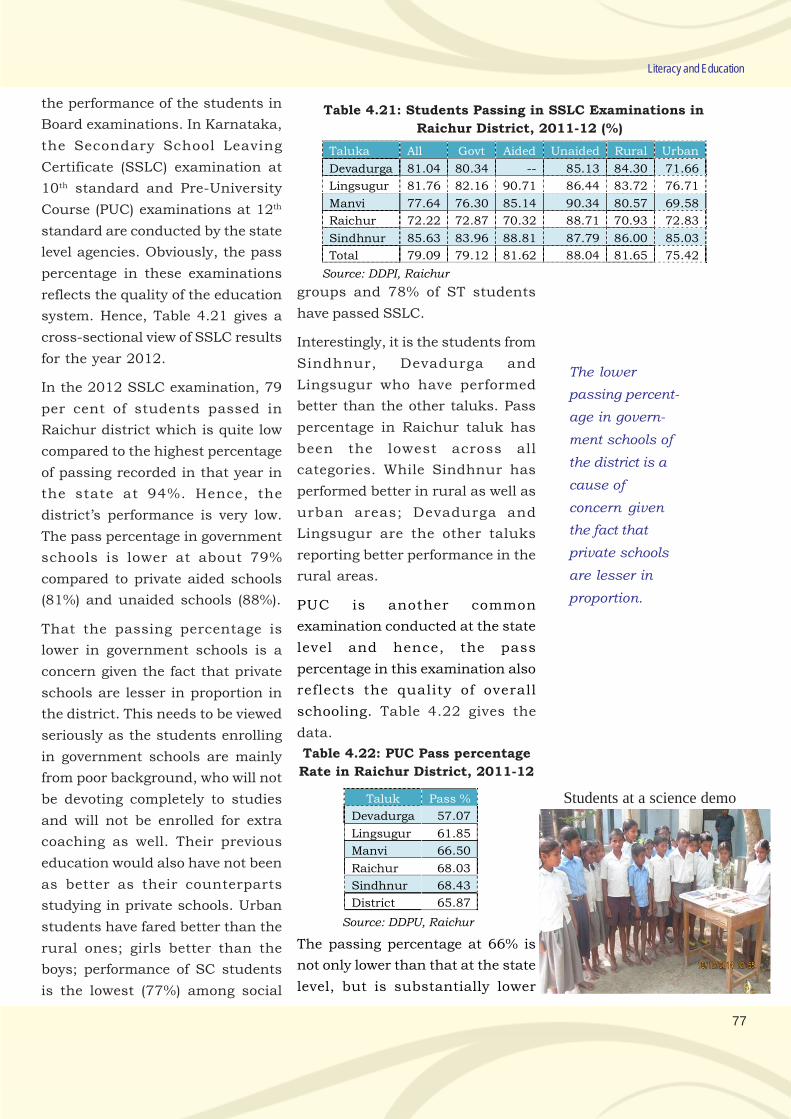
77
Literacy and Education
the performance of the students in
Board examinations. In Karnataka,
the Secondary School Leaving
Certificate (SSLC) examination at
10th standard and Pre-University
Course (PUC) examinations at 12th
standard are conducted by the state
level agencies. Obviously, the pass
percentage in these examinations
reflects the quality of the education
system. Hence, Table 4.21 gives a
cross-sectional view of SSLC results
for the year 2012.
In the 2012 SSLC examination, 79
per cent of students passed in
Raichur district which is quite low
compared to the highest percentage
of passing recorded in that year in
the state at 94%. Hence, the
district’s performance is very low.
The pass percentage in government
schools is lower at about 79%
compared to private aided schools
(81%) and unaided schools (88%).
That the passing percentage is
lower in government schools is a
concern given the fact that private
schools are lesser in proportion in
the district. This needs to be viewed
seriously as the students enrolling
in government schools are mainly
from poor background, who will not
be devoting completely to studies
and will not be enrolled for extra
coaching as well. Their previous
education would also have not been
as better as their counterparts
studying in private schools. Urban
students have fared better than the
rural ones; girls better than the
boys; performance of SC students
is the lowest (77%) among social
Table 4.21: Students Passing in SSLC Examinations in
Raichur District, 2011-12 (%)
Taluka All Govt Aided Unaided Rural Urban
Devadurga 81.04 80.34 -- 85.13 84.30 71.66
Lingsugur 81.76 82.16 90.71 86.44 83.72 76.71
Manvi 77.64 76.30 85.14 90.34 80.57 69.58
Raichur 72.22 72.87 70.32 88.71 70.93 72.83
Sindhnur 85.63 83.96 88.81 87.79 86.00 85.03
Total 79.09 79.12 81.62 88.04 81.65 75.42
Source: DDPI, Raichur
groups and 78% of ST students
have passed SSLC.
Interestingly, it is the students from
Sindhnur, Devadurga and
Lingsugur who have performed
better than the other taluks. Pass
percentage in Raichur taluk has
been the lowest across all
categories. While Sindhnur has
performed better in rural as well as
urban areas; Devadurga and
Lingsugur are the other taluks
reporting better performance in the
rural areas.
PUC is another common
examination conducted at the state
level and hence, the pass
percentage in this examination also
reflects the quality of overall
schooling. Table 4.22 gives the
data.
Table 4.22: PUC Pass percentage
Rate in Raichur District, 2011-12
Taluk Pass %
Devadurga 57.07
Lingsugur 61.85
Manvi 66.50
Raichur 68.03
Sindhnur 68.43
District 65.87
Source: DDPU, Raichur
The passing percentage at 66% is
not only lower than that at the state
level, but is substantially lower
The lower
passing percent-
age in govern-
ment schools of
the district is a
cause of
concern given
the fact that
private schools
are lesser in
proportion.
Students at a science demo
78
Raichur District Human Development Report 2014
than the maximum pass percentage
among the taluks elsewhere in the
state at 99% in that year. Therefore,
it indicates the need for a massive
effort in instruction as well as
coaching of students. Across taluks,
Raichur taluk is the second best
after Sindhnur; and Devadurga and
Lingsugur have been pushed below.
Manvi is in between. But even the
highest performing taluk (Sindhnur)
is almost one-third lower than the
best performing taluk in the state.
This makes the PU education very
weak component of the overall
education system in the district. It
needs to be strengthened.
What is more intriguing is the
differential performances in SSLC
and PUC examinations across the
taluks. Devadurga taluka with the
second highest passing percentage
in SSLC examination records the
lowest passing percentage in PUC
examination. On the other hand,
Raichur with the lowest SSLC
passing percentage has the highest
PUC passing percentage. Such a
mismatch could also be observed in
Lingsugur as well as Sindhnur as
well. The PUC passing percentage
is substantially lower in the district
except Raichur taluk which calls for
additional coaching, in general, and
for PUC students, in particular.
4.11. Post-Secondary Education
including Professional and
General Degree Colleges, ITI/
Polytechnic and other Skill
Development Institutions
Raichur district has not been a
predominant district in education.
One University of Agricultural
Sciences has been very recently
established and there are no other
notable higher educational
institutions in the district. But with
increasing urbanization many
colleges imparting technical and
general education have been
started.
There were 166 institutions
imparting post-secondary
education of various kinds in the
District. Of course more than half
of them are PU colleges and 17 are
degree colleges (Annexure 4.3).
There are 2 colleges each imparting
Engineering, Medical, Dental and
Law education. Further, there are
also 5 pharmacy colleges, 7
polytechnics, 8 it is, 6 D.Ed.
training institutes and 5 B.Ed.
Colleges. A total of 10181
students were enrolled in these
institutions in 2011-12, of whom 35
per cent were females. Significantly,
nearly 70 per cent of that enrolment
was in general degree course and
that in technical courses being
hardly 14 per cent. This reveals the
technical competency that is being
developed in the district.
4.12. Schemes for Promotion of
Literacy
Government is implementing
various schemes for promotion of
enrolment, retention and better
performance. Of course
strengthening of infrastructure,
appointment of teachers and other
personnel is a major support of the
government. Apart from that many
specific support programmes are
That nearly 70
per cent of
enrolment
is in general
degree course
and
hardly 14 per
cent in technical
courses reveals
that the
technical
competency
is not
adequately
being
developed
in the district.
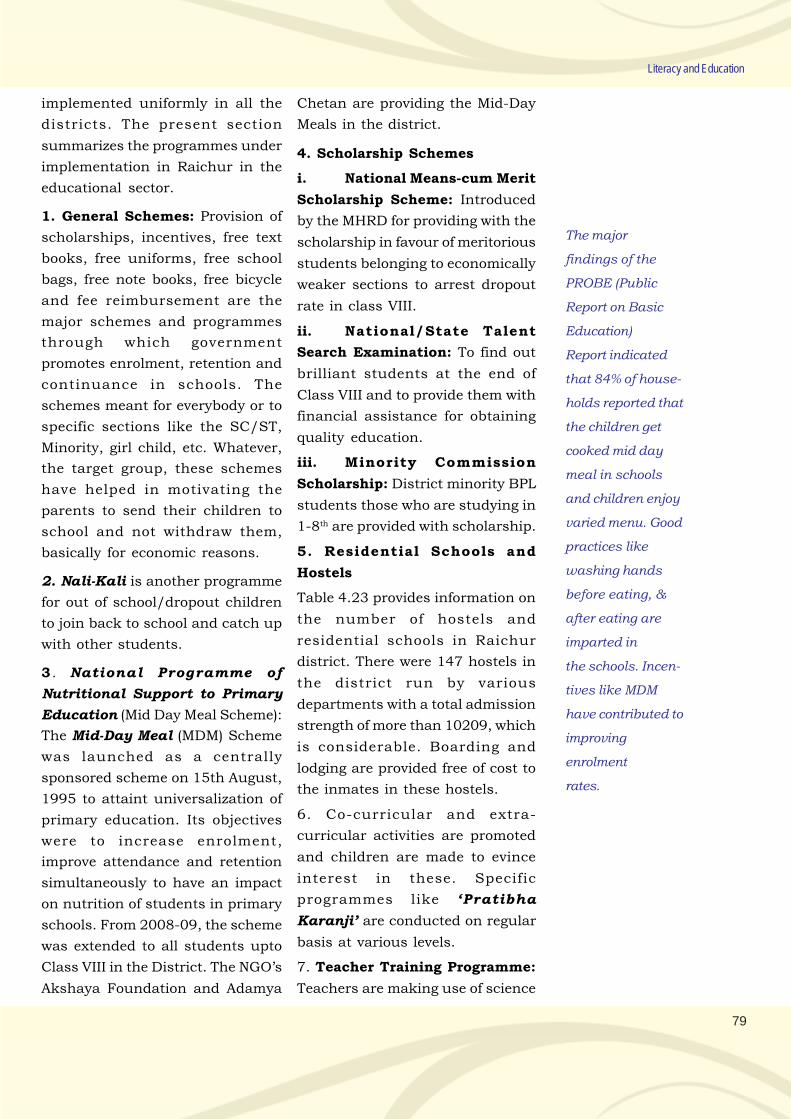
79
Literacy and Education
implemented uniformly in all the
districts. The present section
summarizes the programmes under
implementation in Raichur in the
educational sector.
1. General Schemes: Provision of
scholarships, incentives, free text
books, free uniforms, free school
bags, free note books, free bicycle
and fee reimbursement are the
major schemes and programmes
through which government
promotes enrolment, retention and
continuance in schools. The
schemes meant for everybody or to
specific sections like the SC/ST,
Minority, girl child, etc. Whatever,
the target group, these schemes
have helped in motivating the
parents to send their children to
school and not withdraw them,
basically for economic reasons.
2. Nali-Kali is another programme
for out of school/dropout children
to join back to school and catch up
with other students.
3 . National Programme of
Nutritional Support to Primary
Education (Mid Day Meal Scheme):
The Mid-Day Meal (MDM) Scheme
was launched as a centrally
sponsored scheme on 15th August,
1995 to attaint universalization of
primary education. Its objectives
were to increase enrolment,
improve attendance and retention
simultaneously to have an impact
on nutrition of students in primary
schools. From 2008-09, the scheme
was extended to all students upto
Class VIII in the District. The NGO’s
Akshaya Foundation and Adamya
Chetan are providing the Mid-Day
Meals in the district.
4. Scholarship Schemes
i. National Means-cum Merit
Scholarship Scheme: Introduced
by the MHRD for providing with the
scholarship in favour of meritorious
students belonging to economically
weaker sections to arrest dropout
rate in class VIII.
ii. National/State Talent
Search Examination: To find out
brilliant students at the end of
Class VIII and to provide them with
financial assistance for obtaining
quality education.
iii. Minority Commission
Scholarship: District minority BPL
students those who are studying in
1-8th are provided with scholarship.
5. Residential Schools and
Hostels
Table 4.23 provides information on
the number of hostels and
residential schools in Raichur
district. There were 147 hostels in
the district run by various
departments with a total admission
strength of more than 10209, which
is considerable. Boarding and
lodging are provided free of cost to
the inmates in these hostels.
6. Co-curricular and extra-
curricular activities are promoted
and children are made to evince
interest in these. Specific
programmes like ‘Pratibha
Karanji’ are conducted on regular
basis at various levels.
7. Teacher Training Programme:
Teachers are making use of science
The major
findings of the
PROBE (Public
Report on Basic
Education)
Report indicated
that 84% of house-
holds reported that
the children get
cooked mid day
meal in schools
and children enjoy
varied menu. Good
practices like
washing hands
before eating, &
after eating are
imparted in
the schools. Incen-
tives like MDM
have contributed to
improving
enrolment
rates.
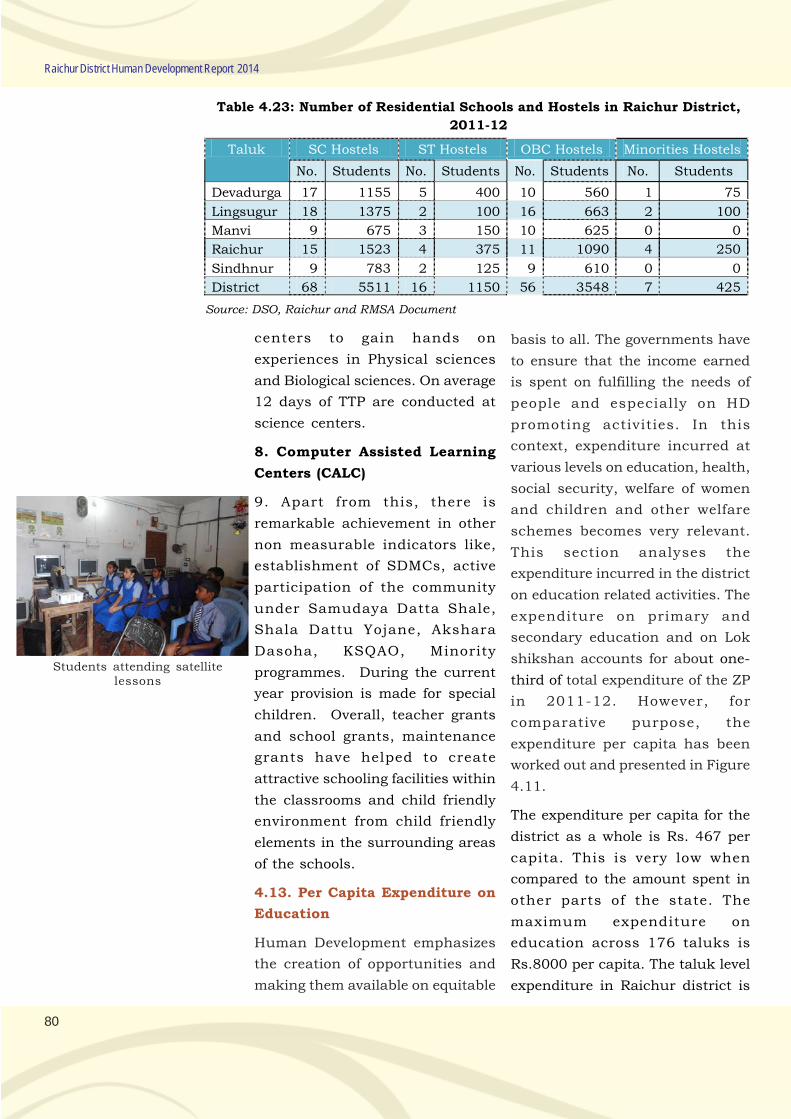
80
Raichur District Human Development Report 2014
Table 4.23: Number of Residential Schools and Hostels in Raichur District,
2011-12
Taluk SC Hostels ST Hostels OBC Hostels Minorities Hostels
No. Students No. Students No. Students No. Students
Devadurga 17 1155 5 400 10 560 1 75
Lingsugur 18 1375 2 100 16 663 2 100
Manvi 9 675 3 150 10 625 0 0
Raichur 15 1523 4 375 11 1090 4 250
Sindhnur 9 783 2 125 9 610 0 0
District 68 5511 16 1150 56 3548 7 425
Source: DSO, Raichur and RMSA Document
centers to gain hands on
experiences in Physical sciences
and Biological sciences. On average
12 days of TTP are conducted at
science centers.
8. Computer Assisted Learning
Centers (CALC)
9. Apart from this, there is
remarkable achievement in other
non measurable indicators like,
establishment of SDMCs, active
participation of the community
under Samudaya Datta Shale,
Shala Dattu Yojane, Akshara
Dasoha, KSQAO, Minority
programmes. During the current
year provision is made for special
children. Overall, teacher grants
and school grants, maintenance
grants have helped to create
attractive schooling facilities within
the classrooms and child friendly
environment from child friendly
elements in the surrounding areas
of the schools.
4.13. Per Capita Expenditure on
Education
Human Development emphasizes
the creation of opportunities and
making them available on equitable
basis to all. The governments have
to ensure that the income earned
is spent on fulfilling the needs of
people and especially on HD
promoting activities. In this
context, expenditure incurred at
various levels on education, health,
social security, welfare of women
and children and other welfare
schemes becomes very relevant.
This section analyses the
expenditure incurred in the district
on education related activities. The
expenditure on primary and
secondary education and on Lok
shikshan accounts for about one-
third of total expenditure of the ZP
in 2011-12. However, for
comparative purpose, the
expenditure per capita has been
worked out and presented in Figure
4.11.
The expenditure per capita for the
district as a whole is Rs. 467 per
capita. This is very low when
compared to the amount spent in
other parts of the state. The
maximum expenditure on
education across 176 taluks is
Rs.8000 per capita. The taluk level
expenditure in Raichur district is
Students attending satellitelessons
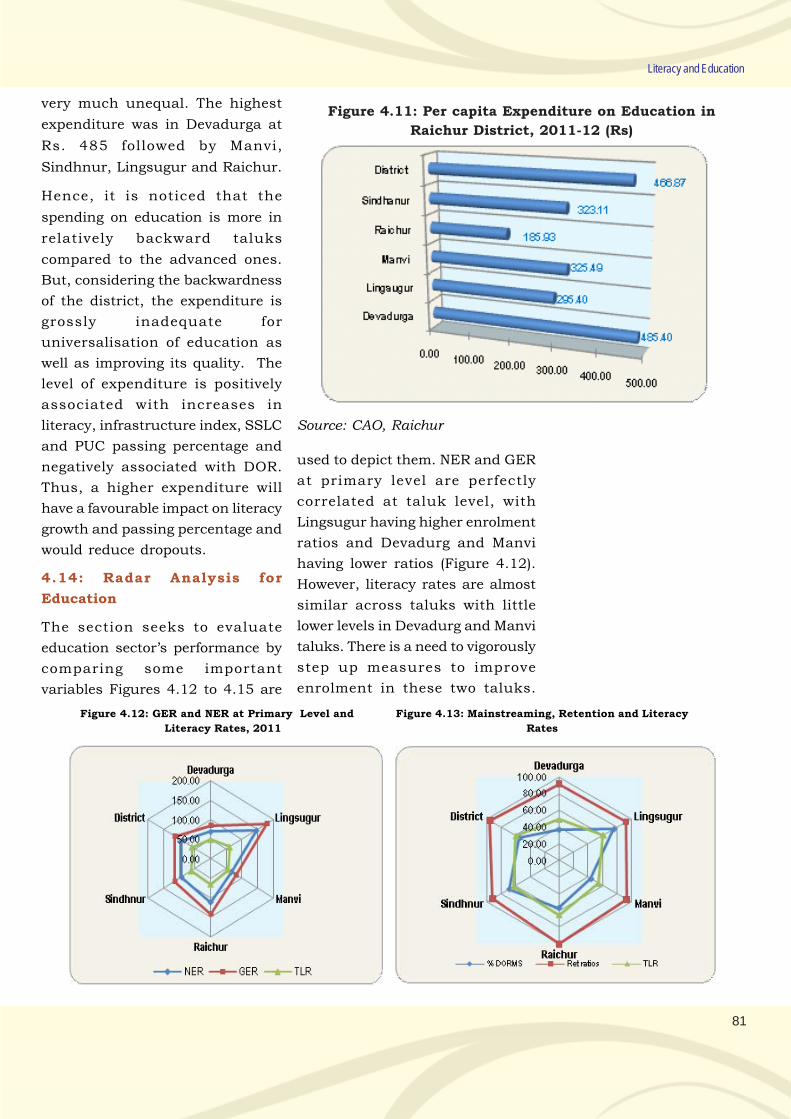
81
Literacy and Education
Figure 4.11: Per capita Expenditure on Education in
Raichur District, 2011-12 (Rs)
Source: CAO, Raichur
very much unequal. The highest
expenditure was in Devadurga at
Rs. 485 followed by Manvi,
Sindhnur, Lingsugur and Raichur.
Hence, it is noticed that the
spending on education is more in
relatively backward taluks
compared to the advanced ones.
But, considering the backwardness
of the district, the expenditure is
grossly inadequate for
universalisation of education as
well as improving its quality. The
level of expenditure is positively
associated with increases in
literacy, infrastructure index, SSLC
and PUC passing percentage and
negatively associated with DOR.
Thus, a higher expenditure will
have a favourable impact on literacy
growth and passing percentage and
would reduce dropouts.
4.14: Radar Analysis for
Education
The section seeks to evaluate
education sector’s performance by
comparing some important
variables Figures 4.12 to 4.15 are
Figure 4.12: GER and NER at Primary Level and
Literacy Rates, 2011
Figure 4.13: Mainstreaming, Retention and Literacy
Rates
used to depict them. NER and GER
at primary level are perfectly
correlated at taluk level, with
Lingsugur having higher enrolment
ratios and Devadurg and Manvi
having lower ratios (Figure 4.12).
However, literacy rates are almost
similar across taluks with little
lower levels in Devadurg and Manvi
taluks. There is a need to vigorously
step up measures to improve
enrolment in these two taluks.
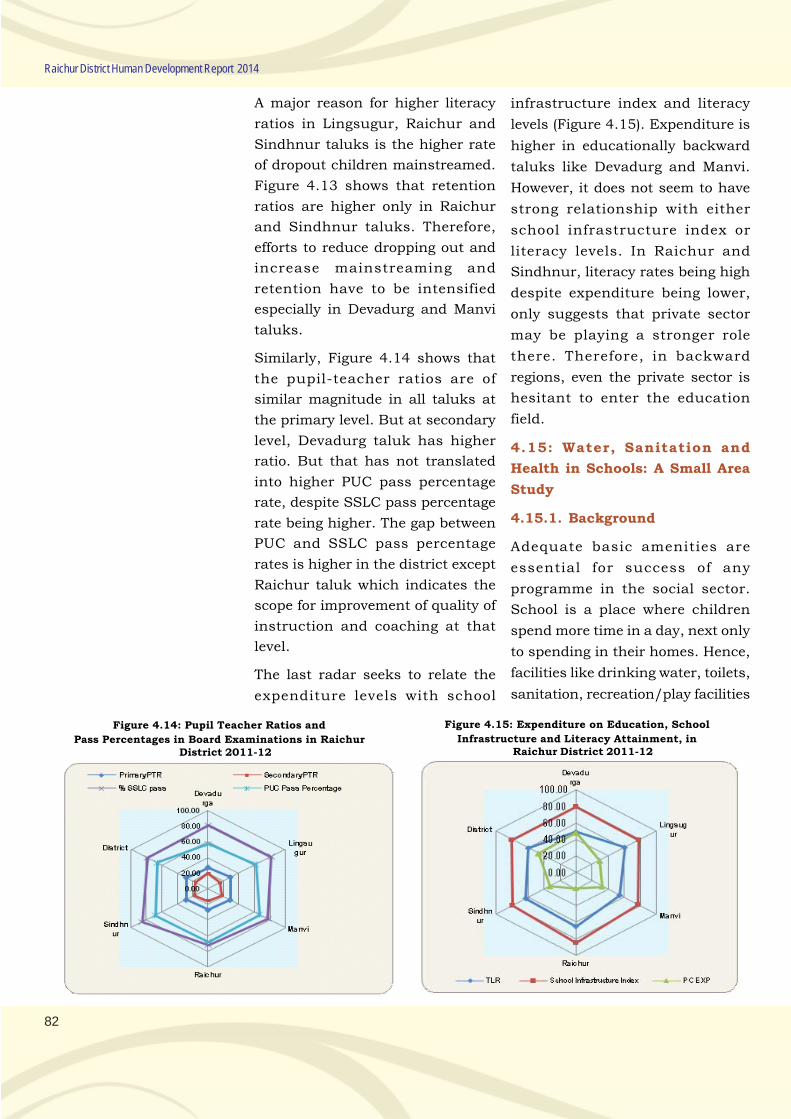
82
Raichur District Human Development Report 2014
A major reason for higher literacy
ratios in Lingsugur, Raichur and
Sindhnur taluks is the higher rate
of dropout children mainstreamed.
Figure 4.13 shows that retention
ratios are higher only in Raichur
and Sindhnur taluks. Therefore,
efforts to reduce dropping out and
increase mainstreaming and
retention have to be intensified
especially in Devadurg and Manvi
taluks.
Similarly, Figure 4.14 shows that
the pupil-teacher ratios are of
similar magnitude in all taluks at
the primary level. But at secondary
level, Devadurg taluk has higher
ratio. But that has not translated
into higher PUC pass percentage
rate, despite SSLC pass percentage
rate being higher. The gap between
PUC and SSLC pass percentage
rates is higher in the district except
Raichur taluk which indicates the
scope for improvement of quality of
instruction and coaching at that
level.
The last radar seeks to relate the
expenditure levels with school
Figure 4.15: Expenditure on Education, School
Infrastructure and Literacy Attainment, inRaichur District 2011-12
Figure 4.14: Pupil Teacher Ratios and
Pass Percentages in Board Examinations in RaichurDistrict 2011-12
infrastructure index and literacy
levels (Figure 4.15). Expenditure is
higher in educationally backward
taluks like Devadurg and Manvi.
However, it does not seem to have
strong relationship with either
school infrastructure index or
literacy levels. In Raichur and
Sindhnur, literacy rates being high
despite expenditure being lower,
only suggests that private sector
may be playing a stronger role
there. Therefore, in backward
regions, even the private sector is
hesitant to enter the education
field.
4.15: Water, Sanitation and
Health in Schools: A Small Area
Study
4.15.1. Background
Adequate basic amenities are
essential for success of any
programme in the social sector.
School is a place where children
spend more time in a day, next only
to spending in their homes. Hence,
facilities like drinking water, toilets,
sanitation, recreation/play facilities
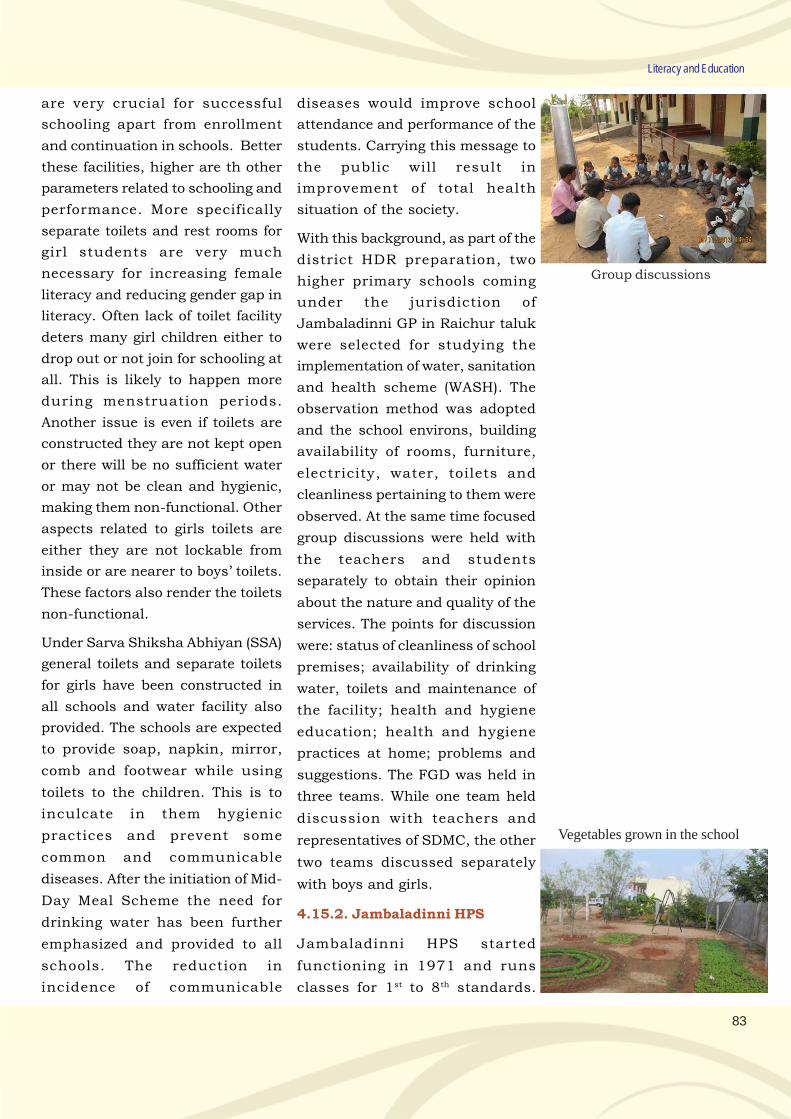
83
Literacy and Education
are very crucial for successful
schooling apart from enrollment
and continuation in schools. Better
these facilities, higher are th other
parameters related to schooling and
performance. More specifically
separate toilets and rest rooms for
girl students are very much
necessary for increasing female
literacy and reducing gender gap in
literacy. Often lack of toilet facility
deters many girl children either to
drop out or not join for schooling at
all. This is likely to happen more
during menstruation periods.
Another issue is even if toilets are
constructed they are not kept open
or there will be no sufficient water
or may not be clean and hygienic,
making them non-functional. Other
aspects related to girls toilets are
either they are not lockable from
inside or are nearer to boys’ toilets.
These factors also render the toilets
non-functional.
Under Sarva Shiksha Abhiyan (SSA)
general toilets and separate toilets
for girls have been constructed in
all schools and water facility also
provided. The schools are expected
to provide soap, napkin, mirror,
comb and footwear while using
toilets to the children. This is to
inculcate in them hygienic
practices and prevent some
common and communicable
diseases. After the initiation of Mid-
Day Meal Scheme the need for
drinking water has been further
emphasized and provided to all
schools. The reduction in
incidence of communicable
diseases would improve school
attendance and performance of the
students. Carrying this message to
the public will result in
improvement of total health
situation of the society.
With this background, as part of the
district HDR preparation, two
higher primary schools coming
under the jurisdiction of
Jambaladinni GP in Raichur taluk
were selected for studying the
implementation of water, sanitation
and health scheme (WASH). The
observation method was adopted
and the school environs, building
availability of rooms, furniture,
electricity, water, toilets and
cleanliness pertaining to them were
observed. At the same time focused
group discussions were held with
the teachers and students
separately to obtain their opinion
about the nature and quality of the
services. The points for discussion
were: status of cleanliness of school
premises; availability of drinking
water, toilets and maintenance of
the facility; health and hygiene
education; health and hygiene
practices at home; problems and
suggestions. The FGD was held in
three teams. While one team held
discussion with teachers and
representatives of SDMC, the other
two teams discussed separately
with boys and girls.
4.15.2. Jambaladinni HPS
Jambaladinni HPS started
functioning in 1971 and runs
classes for 1st to 8th standards.
Vegetables grown in the school
Group discussions
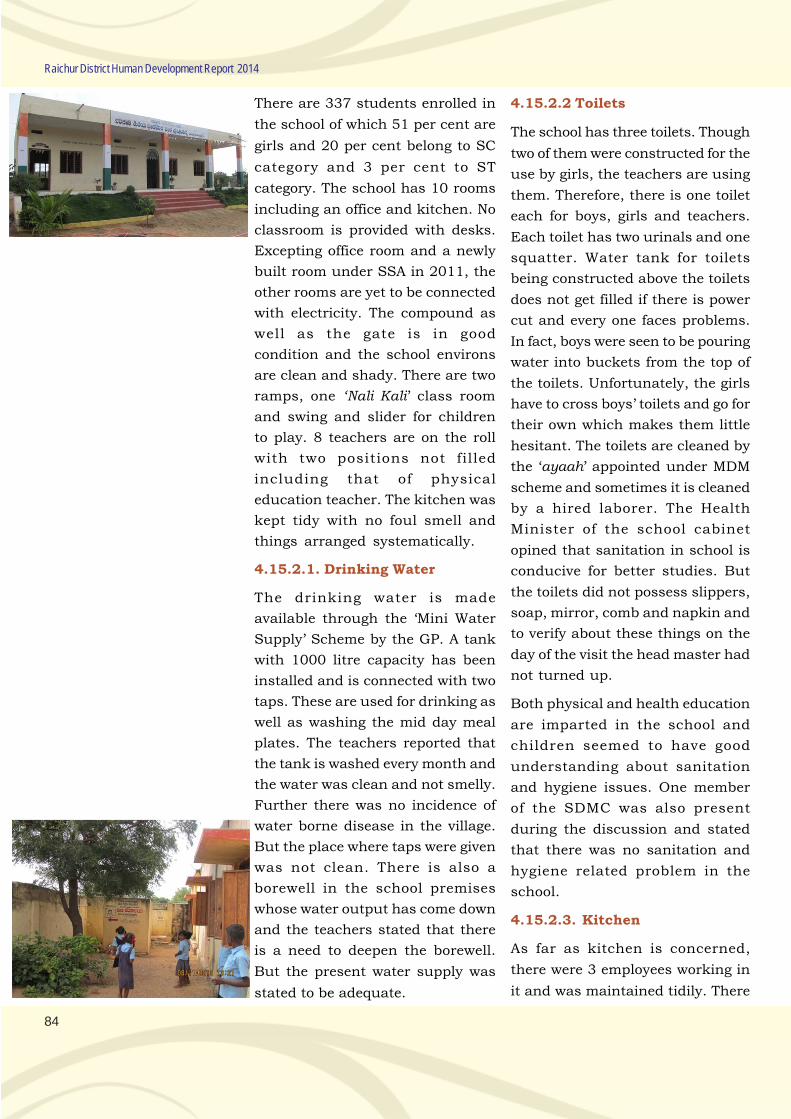
84
Raichur District Human Development Report 2014
There are 337 students enrolled in
the school of which 51 per cent are
girls and 20 per cent belong to SC
category and 3 per cent to ST
category. The school has 10 rooms
including an office and kitchen. No
classroom is provided with desks.
Excepting office room and a newly
built room under SSA in 2011, the
other rooms are yet to be connected
with electricity. The compound as
well as the gate is in good
condition and the school environs
are clean and shady. There are two
ramps, one ‘Nali Kali’ class room
and swing and slider for children
to play. 8 teachers are on the roll
with two positions not filled
including that of physical
education teacher. The kitchen was
kept tidy with no foul smell and
things arranged systematically.
4.15.2.1. Drinking Water
The drinking water is made
available through the ‘Mini Water
Supply’ Scheme by the GP. A tank
with 1000 litre capacity has been
installed and is connected with two
taps. These are used for drinking as
well as washing the mid day meal
plates. The teachers reported that
the tank is washed every month and
the water was clean and not smelly.
Further there was no incidence of
water borne disease in the village.
But the place where taps were given
was not clean. There is also a
borewell in the school premises
whose water output has come down
and the teachers stated that there
is a need to deepen the borewell.
But the present water supply was
stated to be adequate.
4.15.2.2 Toilets
The school has three toilets. Though
two of them were constructed for the
use by girls, the teachers are using
them. Therefore, there is one toilet
each for boys, girls and teachers.
Each toilet has two urinals and one
squatter. Water tank for toilets
being constructed above the toilets
does not get filled if there is power
cut and every one faces problems.
In fact, boys were seen to be pouring
water into buckets from the top of
the toilets. Unfortunately, the girls
have to cross boys’ toilets and go for
their own which makes them little
hesitant. The toilets are cleaned by
the ‘ayaah’ appointed under MDM
scheme and sometimes it is cleaned
by a hired laborer. The Health
Minister of the school cabinet
opined that sanitation in school is
conducive for better studies. But
the toilets did not possess slippers,
soap, mirror, comb and napkin and
to verify about these things on the
day of the visit the head master had
not turned up.
Both physical and health education
are imparted in the school and
children seemed to have good
understanding about sanitation
and hygiene issues. One member
of the SDMC was also present
during the discussion and stated
that there was no sanitation and
hygiene related problem in the
school.
4.15.2.3. Kitchen
As far as kitchen is concerned,
there were 3 employees working in
it and was maintained tidily. There
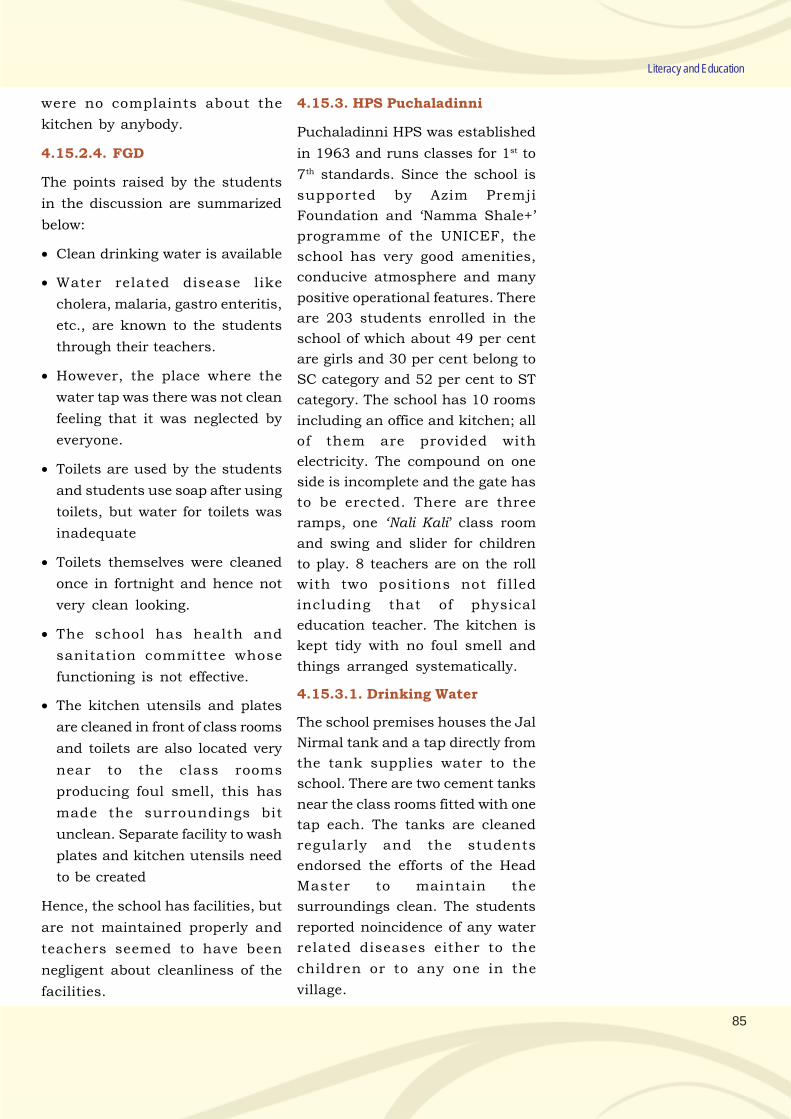
85
Literacy and Education
were no complaints about the
kitchen by anybody.
4.15.2.4. FGD
The points raised by the students
in the discussion are summarized
below:
• Clean drinking water is available
• Water related disease like
cholera, malaria, gastro enteritis,
etc., are known to the students
through their teachers.
• However, the place where the
water tap was there was not clean
feeling that it was neglected by
everyone.
• Toilets are used by the students
and students use soap after using
toilets, but water for toilets was
inadequate
• Toilets themselves were cleaned
once in fortnight and hence not
very clean looking.
• The school has health and
sanitation committee whose
functioning is not effective.
• The kitchen utensils and plates
are cleaned in front of class rooms
and toilets are also located very
near to the class rooms
producing foul smell, this has
made the surroundings bit
unclean. Separate facility to wash
plates and kitchen utensils need
to be created
Hence, the school has facilities, but
are not maintained properly and
teachers seemed to have been
negligent about cleanliness of the
facilities.
4.15.3. HPS Puchaladinni
Puchaladinni HPS was established
in 1963 and runs classes for 1st to
7th standards. Since the school is
supported by Azim Premji
Foundation and ‘Namma Shale+’
programme of the UNICEF, the
school has very good amenities,
conducive atmosphere and many
positive operational features. There
are 203 students enrolled in the
school of which about 49 per cent
are girls and 30 per cent belong to
SC category and 52 per cent to ST
category. The school has 10 rooms
including an office and kitchen; all
of them are provided with
electricity. The compound on one
side is incomplete and the gate has
to be erected. There are three
ramps, one ‘Nali Kali’ class room
and swing and slider for children
to play. 8 teachers are on the roll
with two positions not filled
including that of physical
education teacher. The kitchen is
kept tidy with no foul smell and
things arranged systematically.
4.15.3.1. Drinking Water
The school premises houses the Jal
Nirmal tank and a tap directly from
the tank supplies water to the
school. There are two cement tanks
near the class rooms fitted with one
tap each. The tanks are cleaned
regularly and the students
endorsed the efforts of the Head
Master to maintain the
surroundings clean. The students
reported noincidence of any water
related diseases either to the
children or to any one in the
village.
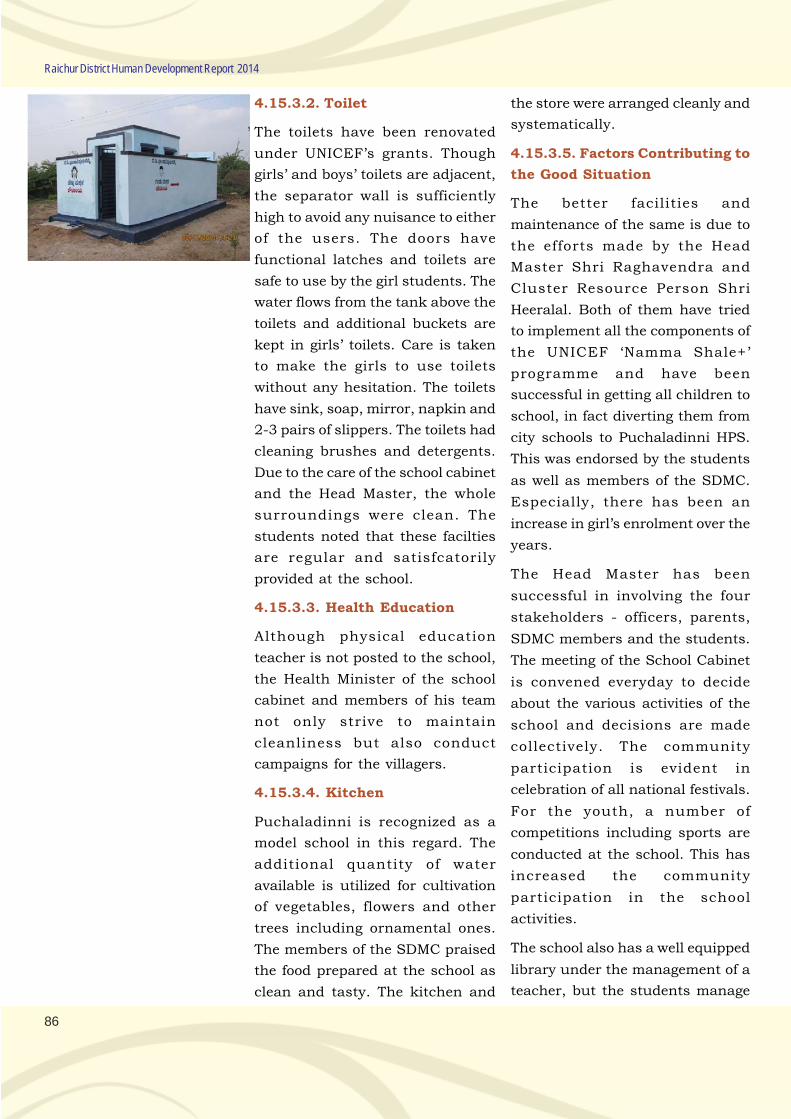
86
Raichur District Human Development Report 2014
4.15.3.2. Toilet
The toilets have been renovated
under UNICEF’s grants. Though
girls’ and boys’ toilets are adjacent,
the separator wall is sufficiently
high to avoid any nuisance to either
of the users. The doors have
functional latches and toilets are
safe to use by the girl students. The
water flows from the tank above the
toilets and additional buckets are
kept in girls’ toilets. Care is taken
to make the girls to use toilets
without any hesitation. The toilets
have sink, soap, mirror, napkin and
2-3 pairs of slippers. The toilets had
cleaning brushes and detergents.
Due to the care of the school cabinet
and the Head Master, the whole
surroundings were clean. The
students noted that these facilties
are regular and satisfcatorily
provided at the school.
4.15.3.3. Health Education
Although physical education
teacher is not posted to the school,
the Health Minister of the school
cabinet and members of his team
not only strive to maintain
cleanliness but also conduct
campaigns for the villagers.
4.15.3.4. Kitchen
Puchaladinni is recognized as a
model school in this regard. The
additional quantity of water
available is utilized for cultivation
of vegetables, flowers and other
trees including ornamental ones.
The members of the SDMC praised
the food prepared at the school as
clean and tasty. The kitchen and
the store were arranged cleanly and
systematically.
4.15.3.5. Factors Contributing to
the Good Situation
The better facilities and
maintenance of the same is due to
the efforts made by the Head
Master Shri Raghavendra and
Cluster Resource Person Shri
Heeralal. Both of them have tried
to implement all the components of
the UNICEF ‘Namma Shale+’
programme and have been
successful in getting all children to
school, in fact diverting them from
city schools to Puchaladinni HPS.
This was endorsed by the students
as well as members of the SDMC.
Especially, there has been an
increase in girl’s enrolment over the
years.
The Head Master has been
successful in involving the four
stakeholders - officers, parents,
SDMC members and the students.
The meeting of the School Cabinet
is convened everyday to decide
about the various activities of the
school and decisions are made
collectively. The community
participation is evident in
celebration of all national festivals.
For the youth, a number of
competitions including sports are
conducted at the school. This has
increased the community
participation in the school
activities.
The school also has a well equipped
library under the management of a
teacher, but the students manage
87
Literacy and Education
borrowing and other activities of the
library; there are two ‘nali kali’
programme and vocational training
under which tailoring training is
given.
Because of all these proactive
interventions by the Head Master,
the respect for school has increased
and more significantly the drop out
rate has come down.
Positive Aspects Noticed:
• Clean and beautiful environment
• Garden consisting of vegetables,
flowers and fruit bearing trees
• Commercial tree plantation (300)
in collaboration with forest
department officials
• Active involvement of the
community and students in
school management
• Providing value addition through
library and vocational training to
students
• Convergence of schemes for
overall development of the school
• Displaying all information
through charts and boards and
maintaining transparency
• Record keeping with photos.
4.15.3.6. Negative Aspects
While the students enjoy best of the
facilities at the school, no child
reported of having toilets at home
and they do not use of soap for hand
wash. A very discouraging issue as
voiced by the Health Minister Miss
Nagalakshmi is that the people
defecate on either side of the school
road making it inconvenient for
children to come to school. The
Head Master informed that this
issue has been discussed with the
SDMC members who have assured
of solving the problem.
Hence, the awareness created
among children at the school level
is not disseminated at the
community level, at least with
respect to sanitation and hygiene.
Continuing the same unhygienic
practices when away from home
will not deliver the benefits of the
WASH programme. A soloution to
this can be provision of locally
made soap or soap powder which
can be distributed through PDS
and making people to use them for
their hygiene and health.
These weak points apart, many
visitors from France and other
Indian states like Chhattisgarh and
Andhra Pradesh; and from pther
districts of Karnataka have visited
the school and shared its success.
All this is due to the efforts of a
teacher who took the programme
seriously, involved various stake
holders and used the grants in a
transparent manner to create good
facilities and obtained appreciable
results.
4.15.3.7. FGD
• Water availability is satisfactory
and liked by the students;
• Students are informed about the
water related diseases
• Toilets are in good condition
and maintenance is very good;
The awareness
created
among children at the
school level
is not disseminated at
the community level,
at least with
respect to sanitation
and hygiene.
Continuing the same
unhygienic
practices when away
from home
will not deliver the
benefits of the
WASH
programme.
88
Raichur District Human Development Report 2014
all things like broom, brush,
bucket, mug, soap, napkin,
mirror, comb and slippers
provided for use of the students
• Students themselves clean the
school play ground while
laborers are hired to clean the
toilets
• Vocational training is given to the
students and a number of
activities like kasuti, preparing
wire bags, painting on cloth, etc.
are taught. The school grows
vegetables required for cooking
mid day meals.
• Children felt that that the lack
of physical education instructor
was a major lacuna along with
lack of hostels, art master and a
bigger play ground
• The school has a functional
health and sanitation committee
That the Head Masters were not
available in the other two schools,
to which we went, shows how an
interested and self-motivated
person can make a difference.
4.16. An Overview and Persisting
Educational Gaps in the District
Raichur district has lower literacy
rates in all categories compared to
Karnataka state. Further, while
gaps elsewhere have declined, those
in Raichur have increased, which
needs to be arrested. Relatively
backward taluks Manvi, Sindhnur
and Devadurga have shown better
progress in the recent years.
Raichur district has very low
literacy for females. But FLR has
increased by higher proportion
than MLR in all taluks thereby
reducing the gender gap in literacy.
Lingsugur and Sindhnur taluks
have higher than the district level
gender gap.
Nearly half of the illiterates were
rural women of the district.
Devadurga has the lowest share of
illiterates but had the largest
proportion of illiterates in rural
areas as well as among rural
females. Manvi is another
problematic taluk with respect to
the proportion of illiterates, while
Devadurga and Sindhnur need to
focus on rural literacy
enhancement, the other three
taluks on urban literacy
enhancement.
Devadurga and Manvi have
recorded higher change in literacy
compared to other taluks and the
district has helped in reducing
regional inequities in educational
attainments.
It is observed that rural females
have recorded the highest increases
in literacy and urban males the
lowest. The urban-rural gaps are
the highest in Raichur taluk and
lowest in Sindhnur taluk. While at
the district level the gaps have
reduced, those for Devadurga,
Sindhnur and Manvi have widened.
Devadurga, Manvi and Sindhnur
show widening of the rural-urban
gap overtime. The gender gap in
rural areas is almost double than
that in the urban areas for the
entire state and 50 per cent higher
in the district.
89
Literacy and Education
Literacy attainment of
disadvantaged social groups is
lower compared to the general
population. Being a ST woman in
Raichur district imposes a huge
deprivation in terms of literacy.
Enrolment of both boys and girls
has increased but that of girls
increased by a higher proportion.
Raichur, Lingsugur and Devadurga
have reported increased share in
enrolment, Manvi and Sindhnur
have recorded lower shares between
2005-06 and 2011-12. All taluks
have registered rise in enrolment
with Lingsugur registering the
highest growth and Sindhnur the
lowest. The percentage change
being higher for girls’ enrolment in
all the taluks, improvement in the
enrolment of SC, ST and minority
students is a good sign as far as
inclusive education is concerned,
GER has declined in Devadurga,
Manvi and Sindhnur taluks. If the
converse of NER is non-enrolled
proportion, then that proportion is
very high at 33 per cent in Manvi
taluk, 30 per cent in Devadurga and
about 8 per cent in Sindhnur.
There were 3467 OOSC in Raichur
district in 2011-12, a large majority
of whom were in Raichur and Manvi
taluks, together sharing nearly 60
per cent of OOSC. Retention rate is
about 95 per cent at the district
level, which is slightly higher for
boys than the girls. Across taluks,
Raichur taluk shows the highest
retention followed by Manvi,
Lingsugur, Sindhnur and Manvi.
DOR in primary education among
girls is higher than among boys.
Across taluks, Manvi taluk has the
highest DOR and Raichur has the
lowest. Further, girls’ DOR is higher
in all taluks. Raichur being a
backward district has a high
incidence of DOR.
In secondary education, across the
social groups, the DOR is highest
among ST students at 26 per cent,
indicating that one in every four
students joining for secondary
school drops out. Among SC
students it is at 22 per cent.
Muslims also report higher than the
total DOR. Hence these are the
vulnerable communities as far as
continuance in school is concerned.
The share of girls in secondary
enrolment is 44 per cent which is
lower than their share at primary
level. It only means that not all girls
enrolled at primary level continue
for secondary education. Similarly,
the ratio of SC and ST students
enrolled in secondary education
also has come down compared to
the primary level. This deprives
them of higher and productive skills
and pushes them into a vicious
circle of low skills, less productive
employment and poverty.
The PTR in Raichur district is
within the norms with a value of
28. The schools in the district also
have better infrastructure. All the
schools have drinking water facility
and toilets for boys and girls
separately. More than 97 per cent
of them have electricity connection,
93 per cent have ramps, more than
Not all girls
enrolled at primary
level continue for
secondary educa-
tion. Similarly, the
ratio of SC and ST
students enrolled
in secondary
education
also has come
down compared to
the primary level.
This deprives
them of higher and
productive skills
and pushes them
into a vicious circle
of low skills, less
productive
employment and
poverty.
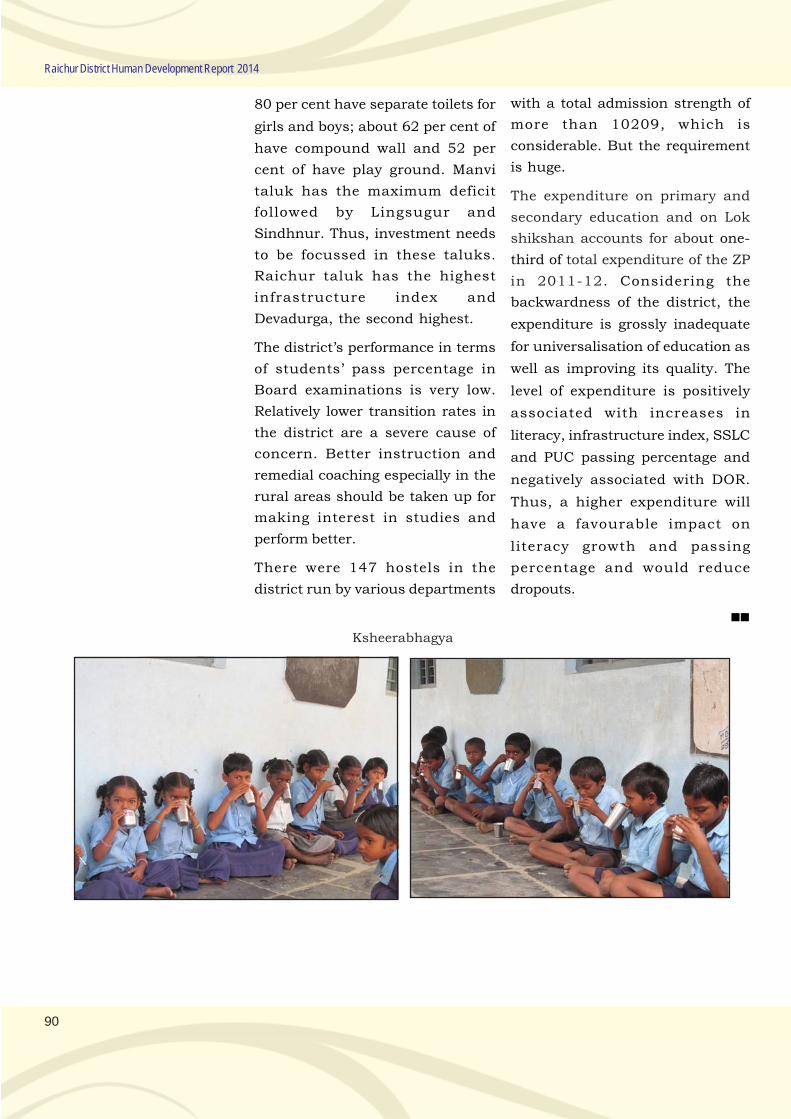
90
Raichur District Human Development Report 2014
80 per cent have separate toilets for
girls and boys; about 62 per cent of
have compound wall and 52 per
cent of have play ground. Manvi
taluk has the maximum deficit
followed by Lingsugur and
Sindhnur. Thus, investment needs
to be focussed in these taluks.
Raichur taluk has the highest
infrastructure index and
Devadurga, the second highest.
The district’s performance in terms
of students’ pass percentage in
Board examinations is very low.
Relatively lower transition rates in
the district are a severe cause of
concern. Better instruction and
remedial coaching especially in the
rural areas should be taken up for
making interest in studies and
perform better.
There were 147 hostels in the
district run by various departments
with a total admission strength of
more than 10209, which is
considerable. But the requirement
is huge.
The expenditure on primary and
secondary education and on Lok
shikshan accounts for about one-
third of total expenditure of the ZP
in 2011-12. Considering the
backwardness of the district, the
expenditure is grossly inadequate
for universalisation of education as
well as improving its quality. The
level of expenditure is positively
associated with increases in
literacy, infrastructure index, SSLC
and PUC passing percentage and
negatively associated with DOR.
Thus, a higher expenditure will
have a favourable impact on
literacy growth and passing
percentage and would reduce
dropouts.
Ksheerabhagya
Chapter 5
HEALTH AND NUTRITION

.
93
Chapter 5
Health and Nutrition
5.1. Introduction
Health is a complex, multi-
dimensional phenomenon that is
not readily measured by any single
indicator. Health gains can facilitate
numerous achievements in various
aspects of life, while losses in health
can exacerbate deprivations in
other dimensions. Like education
health is often viewed from a human
capital perspective, where the value
of health lies in its ability to ensure
productive inputs to achieve
economic ends (Ariana and Naveed,
2009). According to the World
Health Organization (WHO), ‘the
enjoyment of the highest attainable
standard of health is one of the
fundamental rights of every human
being.’ As Sen (2002) observes,
‘health is among the most important
conditions of human life and a
critically significant constituent of
human capabilities which we have
reason to value’. In addition to its
intrinsic value, it is also agreed that
health is instrumental to economic
growth, educational achievements
and cognitive development,
employment opportunities, income
earning potential, as well as the
more amorphous aspects of dignity,
safety, security and empowerment.
But what is health? According to the
constitutional preamble of the WHO
(1946), ‘health is a state of complete
physical, mental and social well-
being and not merely the absence
of disease or infirmity.’ Although
holistic and indisputable, this
definition is far from operational.
In contrast, deprivations in health
may be irreversible. Once
individuals have suffered from
incurable diseases, they do not
necessarily regain their health over
a period of time. Such irreversible
health losses may occur at any age.
The health and nutritional status
of children can potentially
determine their achievements in
the social, psychological and
economic spheres of their lives.
Given the interactions between
health and other capabilities, the
incidence of irreversible health
loss may indicate irreversible
deprivation in multiple
capabilities. There is thus an
urgent need for appropriate social
arrangements to tackle diseases
before they occur. Public policy
should therefore emphasize the
importance of preventive health
care, so that individuals are
protected from the types of multi-
faceted deprivations that could
potentially threaten their overall
well-being.
There are specific segments of the
population which are at higher risk
of poor health. These are the poor,
women, children, SC and ST
people. Relative physical and
economic inaccessibility of health
services may be the major reasons
for it. Obviously it gives rise to a
If you are not
blessed with long
life, what use is
money? - Lord
Basaveshwara
‘health is
among the most
important
conditions of
human life
and a
critically
significant
constituent of
human
capabilities which
we have
reason to value’
94
Raichur District Human Development Report 2014
vicious cycle of bad health, low
productivity, increased spending
on health care, low investible
surplus, low productivity and lower
incomes. Further, the health needs
of different sections of the
population like infants, children,
adolescents, pregnant women,
lactating mothers, aged population,
differently abled, etc., are different.
The health care should also be
preventive as well as curative.
Therefore, a holistic approach to
provision of health services should
be adopted.
The measures of health status are
not complete. Hence proxy
indicators like morbidity, mortality
as well as longevity rates are used.
While data is available at the
aggregate level, at the micro level
information is very hard to get.
Overtime, in India, the SRS
Registration system, anganwadi
records, village accountant’s office
and hospital records have been
identified as the major sources of
information on morbidity and
mortality indicators. National
Sample Survey Organization (NSSO)
and National Family Health Survey
(NFHS) have been compiling useful
information based on large scale
sample surveys, on a regular basis.
However, their data is not available
at the taluk level and for our
reference period. In the HD
framework, however, the health
dimension is measured using the
data on life expectancy at birth
(LEB), which indicates the extent of
spread of health facilities, their
usage by the people as well as
quality of the same.
Health and nutrition are very
closely interrelated. Better
nutrition supplements the health
status and increases productivity
and efficiency of people. Nutrition
security also needs to be ensured
for sustaining human development.
Especially, malnourishment of
pregnant women, infants and
children would result in sick and
less productive population apart
from making it vulnerable to a
number of communicable diseases.
Hunger is still a serious problem
and is reflected in high maternal,
infant and child mortality rates.
Hence, for absorption of the
development inputs by the
population and for sustaining a
higher growth, good and affordable
health care as well as nutrition
facilities are essential for any
community. Lack of proper
nutrition among children would
result in stunting, wasting and
dwarfing making them endemically
sick and sometimes resulting in
premature deaths. In this context,
the UN MDGs focus on many
aspects of health (Box 5.1).
This chapter presents a review of
achievements and challenges of
health and nutrition sector in
Raichur district and how they are
linked to human development.
5.2. Demography: Population by
Place of Residence, Sex and
Social Groups
The population of a region defines
the number of people to be provided
with basic amenities and other
services. This section presents the
population dynamics of Raichur
malnourishment
of pregnant
women, infants
and children
would result in
sick and
less productive
population apart
from making it
vulnerable to a
number of
communicable
diseases.
Good nutritional
status is an
important indicator
of development.
Despite an
apparent surplus
of food grains at
the national level,
and several efforts
being made
through favourable
public policies,
malnutrition
persists. India is
challenged with
43.5% children
under the age of 5
being underweight
(the highest rate in
the World) and
50% of pregnant
women being
anemic. This is
truer especially
with the poor and
vulnerable groups.
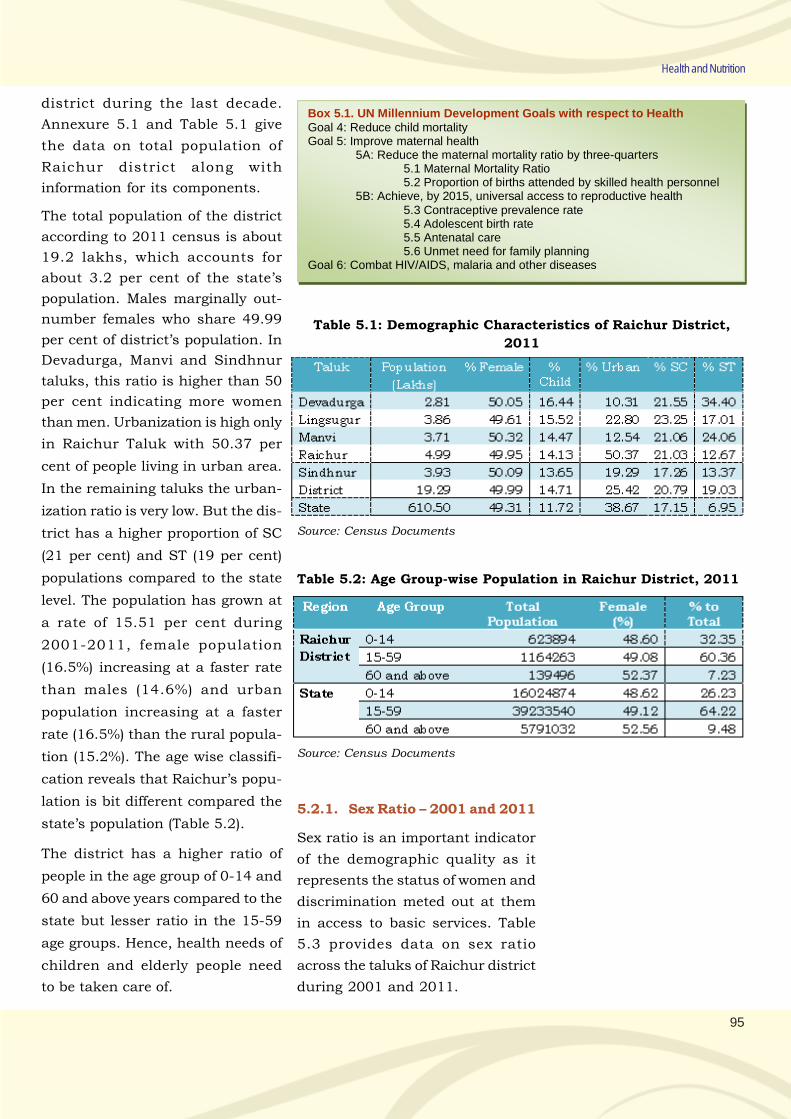
95
Health and Nutrition
Box 5.1. UN Millennium Development Goals with respect to Health Goal 4: Reduce child mortality Goal 5: Improve maternal health
5A: Reduce the maternal mortality ratio by three-quarters 5.1 Maternal Mortality Ratio 5.2 Proportion of births attended by skilled health personnel 5B: Achieve, by 2015, universal access to reproductive health 5.3 Contraceptive prevalence rate 5.4 Adolescent birth rate 5.5 Antenatal care 5.6 Unmet need for family planning Goal 6: Combat HIV/AIDS, malaria and other diseases
district during the last decade.
Annexure 5.1 and Table 5.1 give
the data on total population of
Raichur district along with
information for its components.
The total population of the district
according to 2011 census is about
19.2 lakhs, which accounts for
about 3.2 per cent of the state’s
population. Males marginally out-
number females who share 49.99
per cent of district’s population. In
Devadurga, Manvi and Sindhnur
taluks, this ratio is higher than 50
per cent indicating more women
than men. Urbanization is high only
in Raichur Taluk with 50.37 per
cent of people living in urban area.
In the remaining taluks the urban-
ization ratio is very low. But the dis-
trict has a higher proportion of SC
(21 per cent) and ST (19 per cent)
populations compared to the state
level. The population has grown at
a rate of 15.51 per cent during
2001-2011, female population
(16.5%) increasing at a faster rate
than males (14.6%) and urban
population increasing at a faster
rate (16.5%) than the rural popula-
tion (15.2%). The age wise classifi-
cation reveals that Raichur’s popu-
lation is bit different compared the
state’s population (Table 5.2).
The district has a higher ratio of
people in the age group of 0-14 and
60 and above years compared to the
state but lesser ratio in the 15-59
age groups. Hence, health needs of
children and elderly people need
to be taken care of.
Table 5.1: Demographic Characteristics of Raichur District,
2011
Source: Census Documents
Table 5.2: Age Group-wise Population in Raichur District, 2011
Source: Census Documents
5.2.1. Sex Ratio – 2001 and 2011
Sex ratio is an important indicator
of the demographic quality as it
represents the status of women and
discrimination meted out at them
in access to basic services. Table
5.3 provides data on sex ratio
across the taluks of Raichur district
during 2001 and 2011.
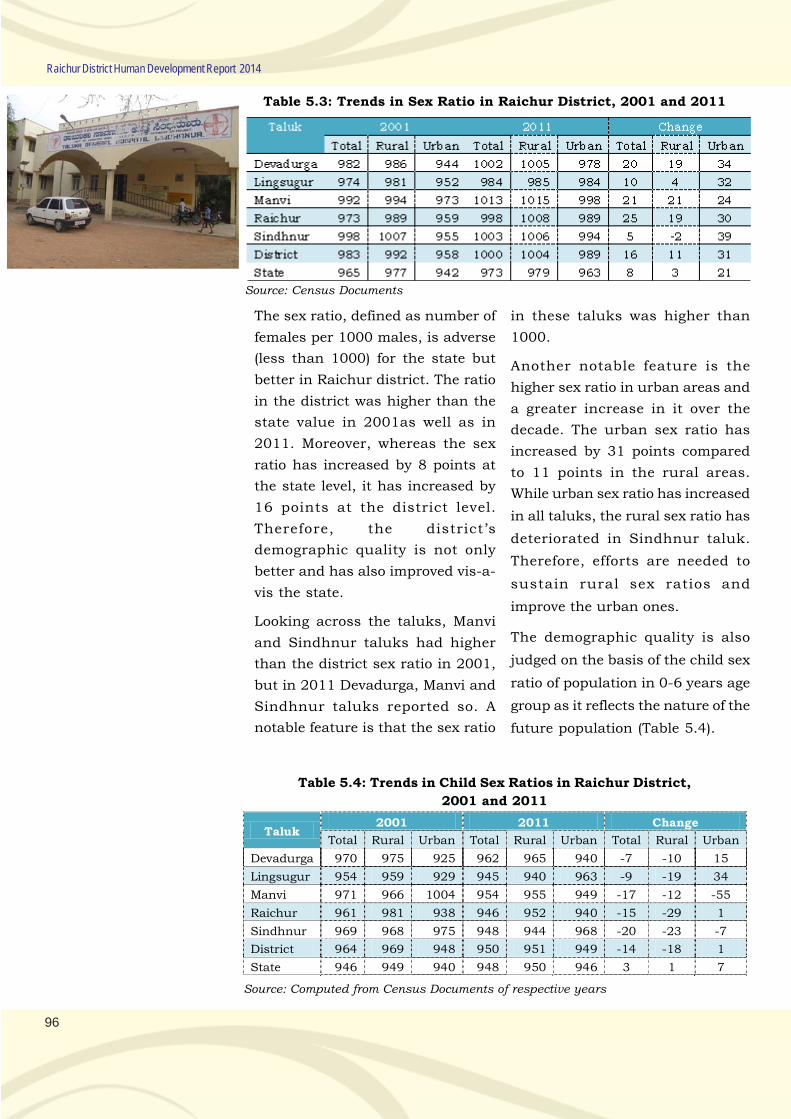
96
Raichur District Human Development Report 2014
Table 5.3: Trends in Sex Ratio in Raichur District, 2001 and 2011
Source: Census Documents
The sex ratio, defined as number of
females per 1000 males, is adverse
(less than 1000) for the state but
better in Raichur district. The ratio
in the district was higher than the
state value in 2001as well as in
2011. Moreover, whereas the sex
ratio has increased by 8 points at
the state level, it has increased by
16 points at the district level.
Therefore, the district’s
demographic quality is not only
better and has also improved vis-a-
vis the state.
Looking across the taluks, Manvi
and Sindhnur taluks had higher
than the district sex ratio in 2001,
but in 2011 Devadurga, Manvi and
Sindhnur taluks reported so. A
notable feature is that the sex ratio
in these taluks was higher than
1000.
Another notable feature is the
higher sex ratio in urban areas and
a greater increase in it over the
decade. The urban sex ratio has
increased by 31 points compared
to 11 points in the rural areas.
While urban sex ratio has increased
in all taluks, the rural sex ratio has
deteriorated in Sindhnur taluk.
Therefore, efforts are needed to
sustain rural sex ratios and
improve the urban ones.
The demographic quality is also
judged on the basis of the child sex
ratio of population in 0-6 years age
group as it reflects the nature of the
future population (Table 5.4).
Table 5.4: Trends in Child Sex Ratios in Raichur District,
2001 and 2011
Taluk 2001 2011 Change
Total Rural Urban Total Rural Urban Total Rural Urban
Devadurga 970 975 925 962 965 940 -7 -10 15
Lingsugur 954 959 929 945 940 963 -9 -19 34
Manvi 971 966 1004 954 955 949 -17 -12 -55
Raichur 961 981 938 946 952 940 -15 -29 1
Sindhnur 969 968 975 948 944 968 -20 -23 -7
District 964 969 948 950 951 949 -14 -18 1
State 946 949 940 948 950 946 3 1 7
Source: Computed from Census Documents of respective years
97
Health and Nutrition
The child sex ratio has also been
higher in the district compared to
the state. However, child sex ratio
is adverse unlike general sex ratio.
Further, overtime the child sex ratio
has deteriorated as against a rise
at the state level. While the rural
child sex ratio has declined by 18
points, the urban child sex ratio by
1 point only. Except Devadurga and
Manvi in all other taluks, it is less
than 950. However, deterioration in
urban child sex ratio in Manvi is
very huge. Hence efforts must be
made in all taluks for improving the
child sex ratios.
5.2.2. Sex Ratio among SC and ST
Population
Analysing the sex ratio by social
groups, we notice that sex ratio for
SCs is slightly lower compared to
that for STs. The sex ratio for these
sections was also higher than at the
state level in both 2001 and 2011.
Like the general sex ratios, for SCs
and STs also they are quite
favourable, except for Devadurga
and Lingsugur. For STs also the
increase in sex ratio in the district
is more than that at the state level.
In fact, gain in ST sex ratio has been
highly commendable.
5.3. Infant and Maternal
Mortality Rates (IMR and MMR)
The UNDP methodology uses life
expectancy at birth (LEB) for
measuring the health status of
individuals. However, at micro
levels, it is hard to estimate LEB.
Therefore, mortality rates are used
for the purpose in this report. They
are infant, child and maternal
mortality rates (IMR, CMR and
MMR). The IMR is defined as
number of infants dying during 0-
1 years out of every 1000 live births
in a given year. The CMR also
called as the under-5 mortality rate,
refers to the number of children
who die by the age of five, per
thousand live births per year. The
MMR is the annual number of
female deaths per 100,000 live
births from any cause related to or
aggravated by pregnancy or its
management (excluding accidental
or incidental causes). The MMR
includes deaths during pregnancy,
childbirth, or within 42 days of
termination of pregnancy,
irrespective of the duration and site
of the pregnancy, for a specified
year. These rates are often used as
indicators of the level of health in a
country/region. They reflect the
extent of availability of health
facilities and their usage by the
respective clientele. IMR, CMR and
MMR are reported in the district
level Health Management
Information Systems (HMIS).
However, in order to overcome the
non-comparability of that data as
well as inconsistencies therein, the
HDD has computed these rates for
taluks using the SRS 2011-12 data
and the same are used for analysis
here. Figure 5.1 shows IMR and
CMR in Raichur district for the year
2011-12. Raichur records the
highest values for both of them.
Thus in 2011-12, for every 1000 live
births, 67 infants have died within
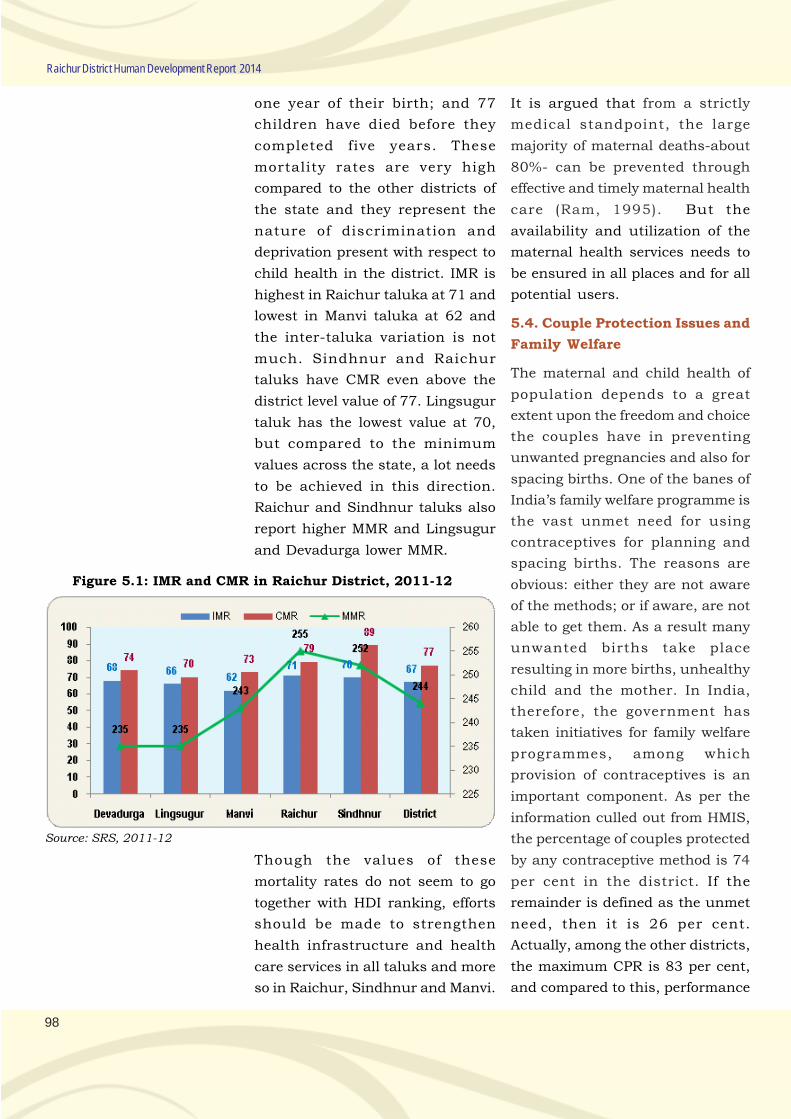
98
Raichur District Human Development Report 2014
one year of their birth; and 77
children have died before they
completed five years. These
mortality rates are very high
compared to the other districts of
the state and they represent the
nature of discrimination and
deprivation present with respect to
child health in the district. IMR is
highest in Raichur taluka at 71 and
lowest in Manvi taluka at 62 and
the inter-taluka variation is not
much. Sindhnur and Raichur
taluks have CMR even above the
district level value of 77. Lingsugur
taluk has the lowest value at 70,
but compared to the minimum
values across the state, a lot needs
to be achieved in this direction.
Raichur and Sindhnur taluks also
report higher MMR and Lingsugur
and Devadurga lower MMR.
Figure 5.1: IMR and CMR in Raichur District, 2011-12
Source: SRS, 2011-12
Though the values of these
mortality rates do not seem to go
together with HDI ranking, efforts
should be made to strengthen
health infrastructure and health
care services in all taluks and more
so in Raichur, Sindhnur and Manvi.
It is argued that from a strictly
medical standpoint, the large
majority of maternal deaths-about
80%- can be prevented through
effective and timely maternal health
care (Ram, 1995). But the
availability and utilization of the
maternal health services needs to
be ensured in all places and for all
potential users.
5.4. Couple Protection Issues and
Family Welfare
The maternal and child health of
population depends to a great
extent upon the freedom and choice
the couples have in preventing
unwanted pregnancies and also for
spacing births. One of the banes of
India’s family welfare programme is
the vast unmet need for using
contraceptives for planning and
spacing births. The reasons are
obvious: either they are not aware
of the methods; or if aware, are not
able to get them. As a result many
unwanted births take place
resulting in more births, unhealthy
child and the mother. In India,
therefore, the government has
taken initiatives for family welfare
programmes, among which
provision of contraceptives is an
important component. As per the
information culled out from HMIS,
the percentage of couples protected
by any contraceptive method is 74
per cent in the district. If the
remainder is defined as the unmet
need, then it is 26 per cent.
Actually, among the other districts,
the maximum CPR is 83 per cent,
and compared to this, performance
99
Health and Nutrition
of Raichur district is not
encouraging.
Among the taluks, the highest CPR
is recorded by Devadurga and
Lingsugur taluks with 80 per cent
of couples provided with any
contraceptive method. Manvi has
the least CPR with 65 per cent and
Raichur too has a CPR of 70 per
cent, while in Sindhnur it is 75 per
cent. Thus, the unmet need ranges
from 18 per cent in Devadurga and
35 per cent in Manvi taluk. This
needs to be corrected and efforts
made to bring all eligible couples
into the family planning fold for
reducing the population growth and
also promoting the health of women
and children.
The information on instrument wise
distribution of contraceptive usage
across the taluks of Raichur district
during the year 2011-12 reveals
that CC is the major contraceptive
followed by female sterilization as
adopted by couples of Raichur
district. Nearly 63 per cent of birth
control burden is borne by women.
This is indicative of gender bias in
the family planning practices. If
males also participate in birth
control activity, the extent of unmet
need can be reduced and the health
of women can be substantially
improved.
5.5. Infrastructure and Health
Personnel
Health status of people is
influenced to a larger extent by the
availability of health care services
and accessibility of people to the
same. Good health being a positive
externality helps in improving
efficiency and longevity of people.
Hence, governments have initiated
measures to promote preventive as
well as curative health facilities.
These health facilities primarily
include health institutions like sub
centres, primary health centres
(PHC), community health centres
(CHCs), taluk and district general
hospitals, specialised hospitals to
treat specific ailments, research
and training institutions, family
welfare centres and sub centres
and clinics and dispensaries
pertaining to local and indigenous
medicine systems. It is not only the
institutions but also health
personnel like doctors, nurses,
radiologists, druggists, laboratory
technicians and attendants; apart
from host of equipments,
ambulance as well as adequate
drug supplies which determines
the effectiveness of a health system.
All these are provided by the
government for improving the
health status of people. The present
section analyses the nature of
health infrastructure available in
Raichur district. The central
government has fixed the norms for
setting up of health institutions
based on population as well as
specific needs of the region.
Annexure 5.2 and Table 5.5
provide a picture of health
infrastructure in Raichur District.
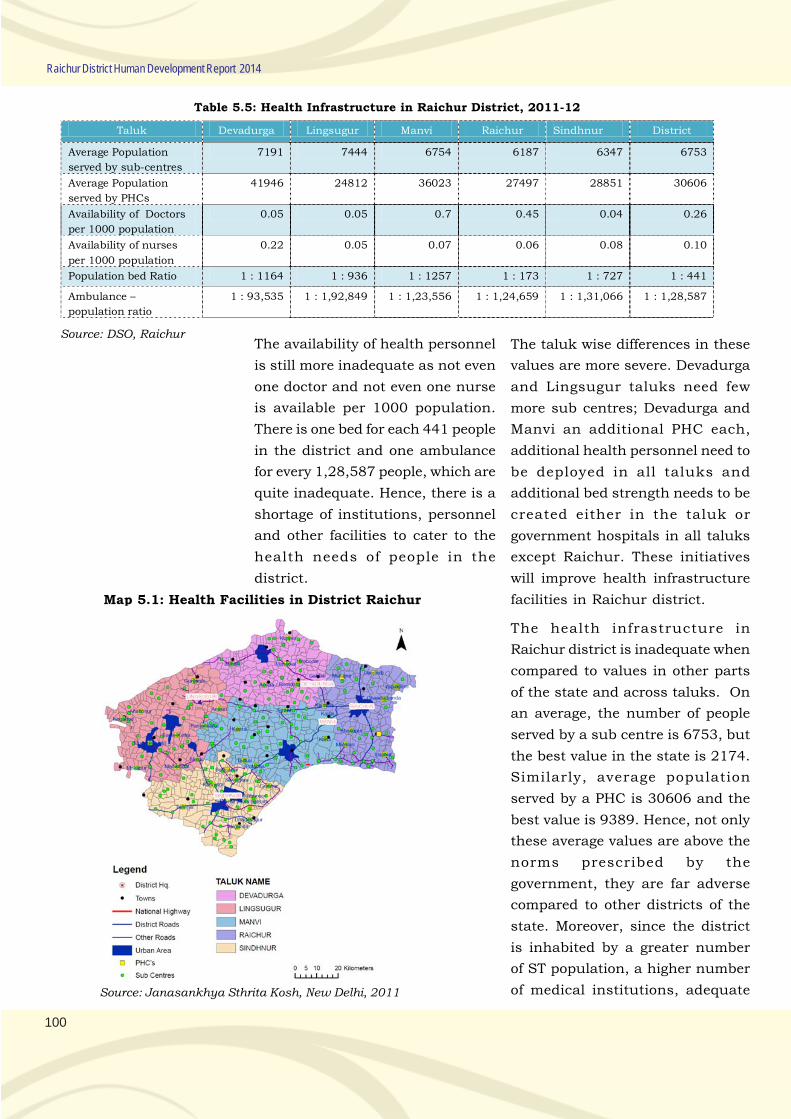
100
Raichur District Human Development Report 2014
Table 5.5: Health Infrastructure in Raichur District, 2011-12
Taluk Devadurga Lingsugur Manvi Raichur Sindhnur District
Average Population
served by sub-centres
7191 7444 6754 6187 6347 6753
Average Population
served by PHCs
41946 24812 36023 27497 28851 30606
Availability of Doctors
per 1000 population
0.05 0.05 0.7 0.45 0.04 0.26
Availability of nurses
per 1000 population
0.22 0.05 0.07 0.06 0.08 0.10
Population bed Ratio 1 : 1164 1 : 936 1 : 1257 1 : 173 1 : 727 1 : 441
Ambulance –
population ratio
1 : 93,535 1 : 1,92,849 1 : 1,23,556 1 : 1,24,659 1 : 1,31,066 1 : 1,28,587
Source: DSO, RaichurThe availability of health personnel
is still more inadequate as not even
one doctor and not even one nurse
is available per 1000 population.
There is one bed for each 441 people
in the district and one ambulance
for every 1,28,587 people, which are
quite inadequate. Hence, there is a
shortage of institutions, personnel
and other facilities to cater to the
health needs of people in the
district.
Map 5.1: Health Facilities in District Raichur
The taluk wise differences in these
values are more severe. Devadurga
and Lingsugur taluks need few
more sub centres; Devadurga and
Manvi an additional PHC each,
additional health personnel need to
be deployed in all taluks and
additional bed strength needs to be
created either in the taluk or
government hospitals in all taluks
except Raichur. These initiatives
will improve health infrastructure
facilities in Raichur district.
The health infrastructure in
Raichur district is inadequate when
compared to values in other parts
of the state and across taluks. On
an average, the number of people
served by a sub centre is 6753, but
the best value in the state is 2174.
Similarly, average population
served by a PHC is 30606 and the
best value is 9389. Hence, not only
these average values are above the
norms prescribed by the
government, they are far adverse
compared to other districts of the
state. Moreover, since the district
is inhabited by a greater number
of ST population, a higher number
of medical institutions, adequateSource: Janasankhya Sthrita Kosh, New Delhi, 2011
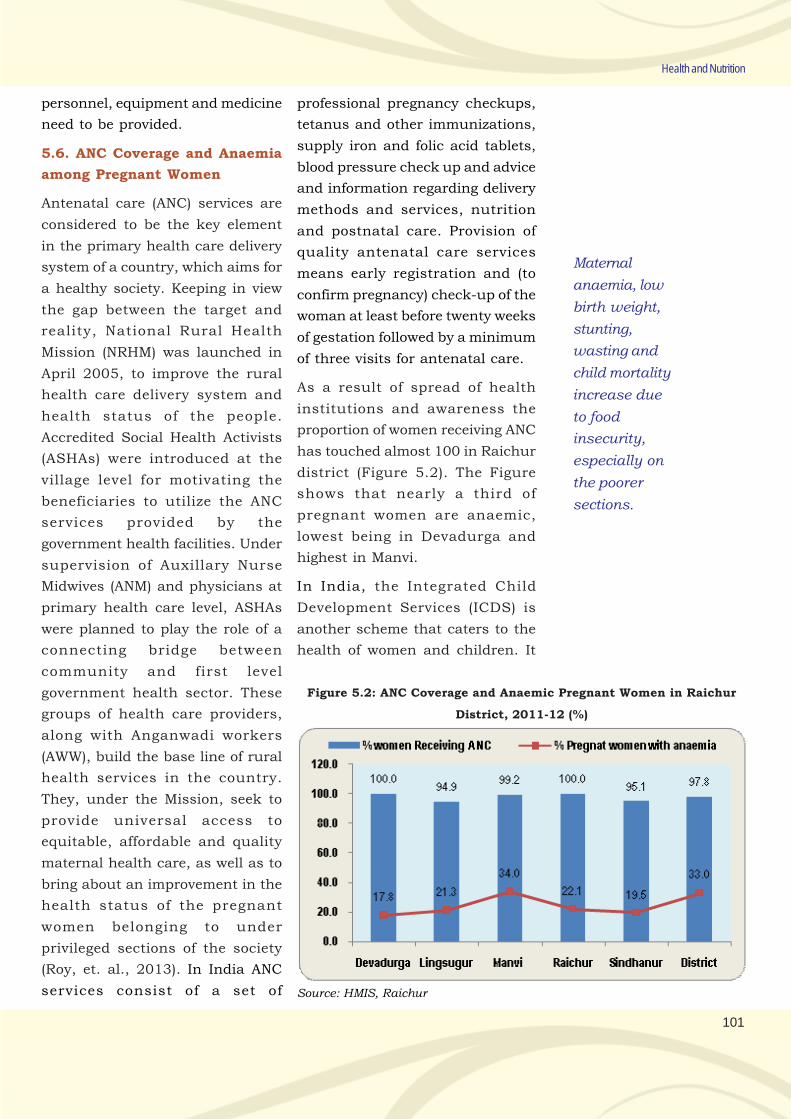
101
Health and Nutrition
personnel, equipment and medicine
need to be provided.
5.6. ANC Coverage and Anaemia
among Pregnant Women
Antenatal care (ANC) services are
considered to be the key element
in the primary health care delivery
system of a country, which aims for
a healthy society. Keeping in view
the gap between the target and
reality, National Rural Health
Mission (NRHM) was launched in
April 2005, to improve the rural
health care delivery system and
health status of the people.
Accredited Social Health Activists
(ASHAs) were introduced at the
village level for motivating the
beneficiaries to utilize the ANC
services provided by the
government health facilities. Under
supervision of Auxillary Nurse
Midwives (ANM) and physicians at
primary health care level, ASHAs
were planned to play the role of a
connecting bridge between
community and first level
government health sector. These
groups of health care providers,
along with Anganwadi workers
(AWW), build the base line of rural
health services in the country.
They, under the Mission, seek to
provide universal access to
equitable, affordable and quality
maternal health care, as well as to
bring about an improvement in the
health status of the pregnant
women belonging to under
privileged sections of the society
(Roy, et. al., 2013). In India ANC
services consist of a set of
professional pregnancy checkups,
tetanus and other immunizations,
supply iron and folic acid tablets,
blood pressure check up and advice
and information regarding delivery
methods and services, nutrition
and postnatal care. Provision of
quality antenatal care services
means early registration and (to
confirm pregnancy) check-up of the
woman at least before twenty weeks
of gestation followed by a minimum
of three visits for antenatal care.
As a result of spread of health
institutions and awareness the
proportion of women receiving ANC
has touched almost 100 in Raichur
district (Figure 5.2). The Figure
shows that nearly a third of
pregnant women are anaemic,
lowest being in Devadurga and
highest in Manvi.
In India, the Integrated Child
Development Services (ICDS) is
another scheme that caters to the
health of women and children. It
Figure 5.2: ANC Coverage and Anaemic Pregnant Women in Raichur
District, 2011-12 (%)
Source: HMIS, Raichur
Maternal
anaemia, low
birth weight,
stunting,
wasting and
child mortality
increase due
to food
insecurity,
especially on
the poorer
sections.
102
Raichur District Human Development Report 2014
provides an integrated approach for
converging six basic services for
improved childcare, early
stimulation and learning, health
and nutrition, education, primarily
targeting young children (0-6 years),
expectant and nursing mothers.
ICDS scheme is one of the world’s
largest and most unique
programmes for early childhood
development. ICDS Children
undergo a routine health check up,
and those found to be sick or
undernourished are referred to the
local PHC. Since good health of
mothers is essential for children’s
well-being and important in its own
right, the ICDS also provides
nutrition and health services for
women in the reproductive age
group, such as food supplements
during pregnancy and other forms
of antenatal care. Anganwadi centre
(AWC) is the pivotal institution
through which the ICDS scheme
functions. The clients of AWC
include children from 6 months to
6 years; pregnant and lactating
mothers and adolescent girls. An
AWC performs functions like
providing supplementary nutrition;
regular health check up, treatment
of minor health problem and
referral services; immunization;
health and hygiene education;
providing vocational training,
counselling and guidance as family
welfare and home management;
and enabling children to learn
through games and prepare them
for formal schooling (play home).
Thus, health, nutrition and capacity
building are the major activities
through which the AWC aims at
making the children and women
healthy. The Anganwadi Centre is
the operational unit of ICDS at
habitation level which is also used
for other related schemes like
SABLA, IGMSY and RCH which
benefit pregnant women, children
and adolescent girls. Under the
ICDS programme norms are
prescribed for setting up of AWC,
for supply and distribution of
nutrition supplements, health
check up, care of pregnant and
lactating women as well as
adolescent girls.
At the end of March 2012, 1324
AWCs were functioning in the
district. The details of these centres
and their activities are furnished in
Table 5.6.
AWCs are more or less equally
distributed across taluks with
Raichur, Lingsugur and Devadurga
having relatively higher number of
AWCs. Based on population norms,
if additionally required number of
AWCs is worked out, the district
would additionally require more
than 80 per cent of the existing
number. Majority of these will have
to be set up in Raichur, Sindhnur,
Manvi and Lingsugur taluks. In
Devadurga additionally 81 AWCs
need to be set up. But the target
population served by AWCs is little
more than 50 per cent of the norm
suggesting that not everyone avails
the benefit of the AWCs. This
number is still smaller in
Devadurga and Lingsugur taluks.
Probably, the people migrate and
AWC performs
functions like
providing
supplementary
nutrition; regular
health check up,
treatment of
minor health
problem and
referral services;
immunization;
health and
hygiene
education;
providing
vocational
training,
counselling and
guidance as
family
welfare and
home
management;
and enabling
children to
learn
through
games and pre-
pare them
for formal
schooling (play
home).
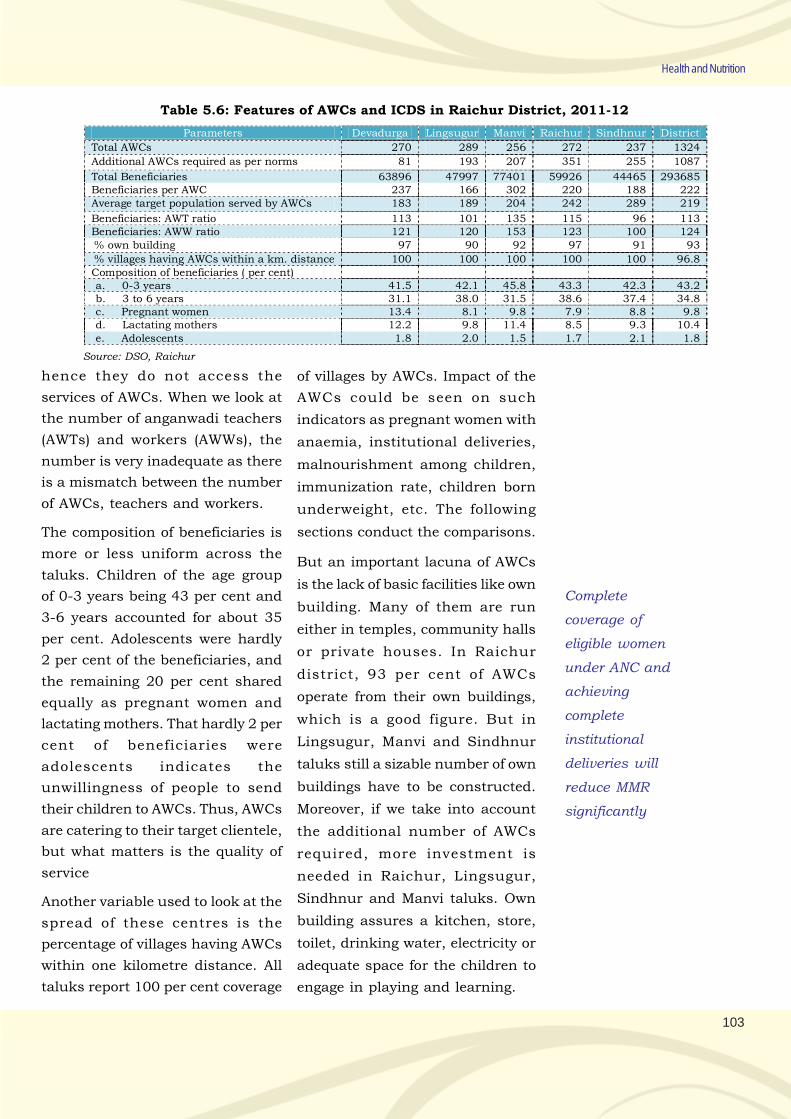
103
Health and Nutrition
Table 5.6: Features of AWCs and ICDS in Raichur District, 2011-12
Parameters Devadurga Lingsugur Manvi Raichur Sindhnur District
Total AWCs 270 289 256 272 237 1324
Additional AWCs required as per norms 81 193 207 351 255 1087
Total Beneficiaries 63896 47997 77401 59926 44465 293685 Beneficiaries per AWC 237 166 302 220 188 222
Average target population served by AWCs 183 189 204 242 289 219
Beneficiaries: AWT ratio 113 101 135 115 96 113 Beneficiaries: AWW ratio 121 120 153 123 100 124
% own building 97 90 92 97 91 93
% villages having AWCs within a km. distance 100 100 100 100 100 96.8
Composition of beneficiaries ( per cent) a. 0-3 years 41.5 42.1 45.8 43.3 42.3 43.2 b. 3 to 6 years 31.1 38.0 31.5 38.6 37.4 34.8 c. Pregnant women 13.4 8.1 9.8 7.9 8.8 9.8 d. Lactating mothers 12.2 9.8 11.4 8.5 9.3 10.4
e. Adolescents 1.8 2.0 1.5 1.7 2.1 1.8
Source: DSO, Raichur
hence they do not access the
services of AWCs. When we look at
the number of anganwadi teachers
(AWTs) and workers (AWWs), the
number is very inadequate as there
is a mismatch between the number
of AWCs, teachers and workers.
The composition of beneficiaries is
more or less uniform across the
taluks. Children of the age group
of 0-3 years being 43 per cent and
3-6 years accounted for about 35
per cent. Adolescents were hardly
2 per cent of the beneficiaries, and
the remaining 20 per cent shared
equally as pregnant women and
lactating mothers. That hardly 2 per
cent of beneficiaries were
adolescents indicates the
unwillingness of people to send
their children to AWCs. Thus, AWCs
are catering to their target clientele,
but what matters is the quality of
service
Another variable used to look at the
spread of these centres is the
percentage of villages having AWCs
within one kilometre distance. All
taluks report 100 per cent coverage
of villages by AWCs. Impact of the
AWCs could be seen on such
indicators as pregnant women with
anaemia, institutional deliveries,
malnourishment among children,
immunization rate, children born
underweight, etc. The following
sections conduct the comparisons.
But an important lacuna of AWCs
is the lack of basic facilities like own
building. Many of them are run
either in temples, community halls
or private houses. In Raichur
district, 93 per cent of AWCs
operate from their own buildings,
which is a good figure. But in
Lingsugur, Manvi and Sindhnur
taluks still a sizable number of own
buildings have to be constructed.
Moreover, if we take into account
the additional number of AWCs
required, more investment is
needed in Raichur, Lingsugur,
Sindhnur and Manvi taluks. Own
building assures a kitchen, store,
toilet, drinking water, electricity or
adequate space for the children to
engage in playing and learning.
Complete
coverage of
eligible women
under ANC and
achieving
complete
institutional
deliveries will
reduce MMR
significantly
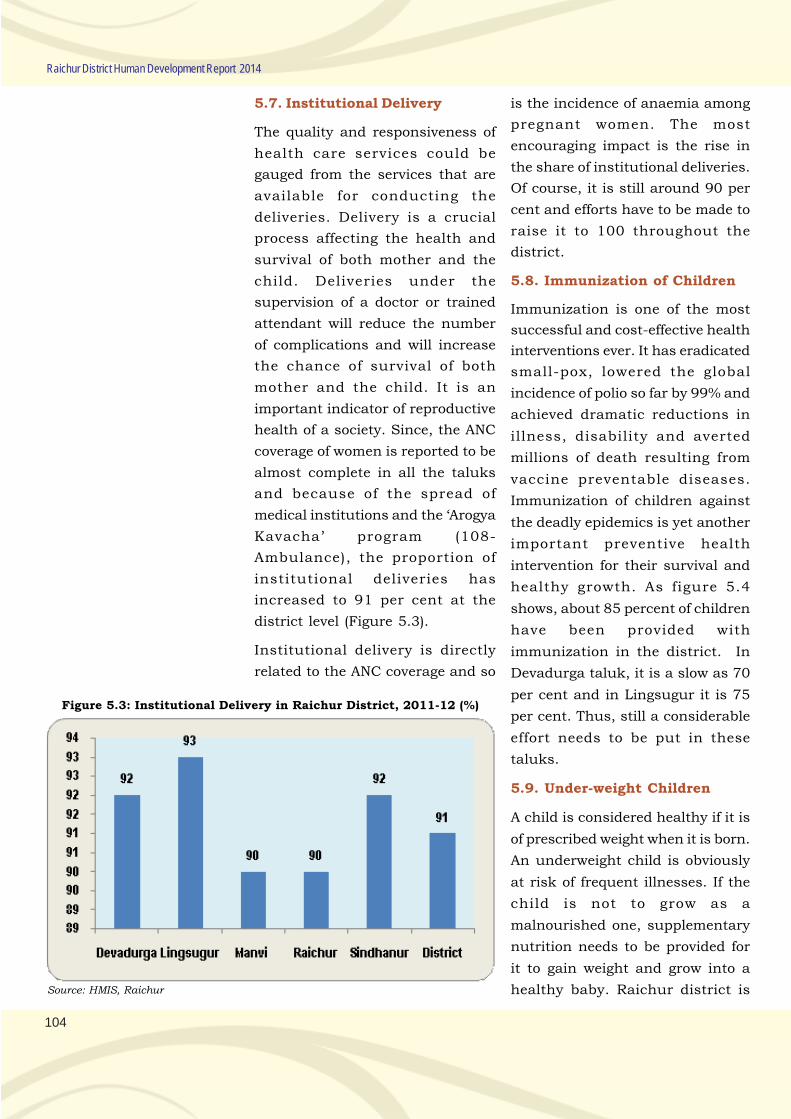
104
Raichur District Human Development Report 2014
5.7. Institutional Delivery
The quality and responsiveness of
health care services could be
gauged from the services that are
available for conducting the
deliveries. Delivery is a crucial
process affecting the health and
survival of both mother and the
child. Deliveries under the
supervision of a doctor or trained
attendant will reduce the number
of complications and will increase
the chance of survival of both
mother and the child. It is an
important indicator of reproductive
health of a society. Since, the ANC
coverage of women is reported to be
almost complete in all the taluks
and because of the spread of
medical institutions and the ‘Arogya
Kavacha’ program (108-
Ambulance), the proportion of
institutional deliveries has
increased to 91 per cent at the
district level (Figure 5.3).
Institutional delivery is directly
related to the ANC coverage and so
is the incidence of anaemia among
pregnant women. The most
encouraging impact is the rise in
the share of institutional deliveries.
Of course, it is still around 90 per
cent and efforts have to be made to
raise it to 100 throughout the
district.
5.8. Immunization of Children
Immunization is one of the most
successful and cost-effective health
interventions ever. It has eradicated
small-pox, lowered the global
incidence of polio so far by 99% and
achieved dramatic reductions in
illness, disability and averted
millions of death resulting from
vaccine preventable diseases.
Immunization of children against
the deadly epidemics is yet another
important preventive health
intervention for their survival and
healthy growth. As figure 5.4
shows, about 85 percent of children
have been provided with
immunization in the district. In
Devadurga taluk, it is a slow as 70
per cent and in Lingsugur it is 75
per cent. Thus, still a considerable
effort needs to be put in these
taluks.
5.9. Under-weight Children
A child is considered healthy if it is
of prescribed weight when it is born.
An underweight child is obviously
at risk of frequent illnesses. If the
child is not to grow as a
malnourished one, supplementary
nutrition needs to be provided for
it to gain weight and grow into a
healthy baby. Raichur district is
Figure 5.3: Institutional Delivery in Raichur District, 2011-12 (%)
Source: HMIS, Raichur
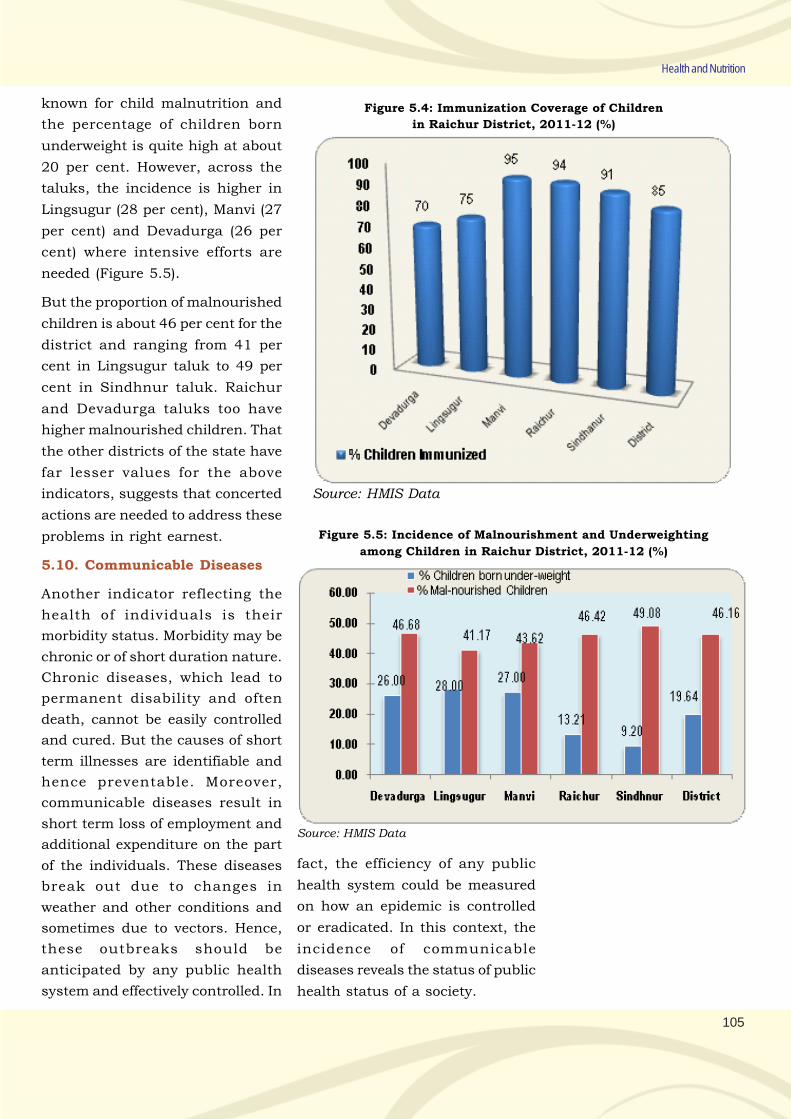
105
Health and Nutrition
Figure 5.4: Immunization Coverage of Children
in Raichur District, 2011-12 (%)
Source: HMIS Data
known for child malnutrition and
the percentage of children born
underweight is quite high at about
20 per cent. However, across the
taluks, the incidence is higher in
Lingsugur (28 per cent), Manvi (27
per cent) and Devadurga (26 per
cent) where intensive efforts are
needed (Figure 5.5).
But the proportion of malnourished
children is about 46 per cent for the
district and ranging from 41 per
cent in Lingsugur taluk to 49 per
cent in Sindhnur taluk. Raichur
and Devadurga taluks too have
higher malnourished children. That
the other districts of the state have
far lesser values for the above
indicators, suggests that concerted
actions are needed to address these
problems in right earnest.
5.10. Communicable Diseases
Another indicator reflecting the
health of individuals is their
morbidity status. Morbidity may be
chronic or of short duration nature.
Chronic diseases, which lead to
permanent disability and often
death, cannot be easily controlled
and cured. But the causes of short
term illnesses are identifiable and
hence preventable. Moreover,
communicable diseases result in
short term loss of employment and
additional expenditure on the part
of the individuals. These diseases
break out due to changes in
weather and other conditions and
sometimes due to vectors. Hence,
these outbreaks should be
anticipated by any public health
system and effectively controlled. In
Figure 5.5: Incidence of Malnourishment and Underweighting
among Children in Raichur District, 2011-12 (%)
Source: HMIS Data
fact, the efficiency of any public
health system could be measured
on how an epidemic is controlled
or eradicated. In this context, the
incidence of communicable
diseases reveals the status of public
health status of a society.
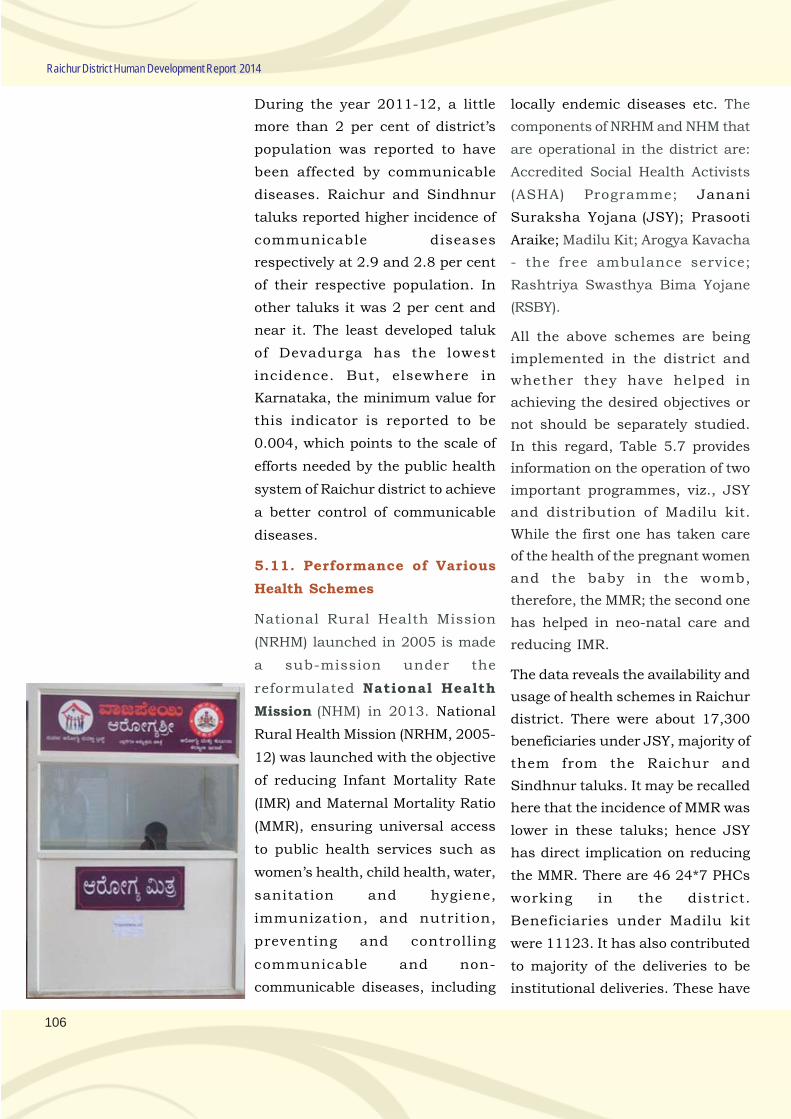
106
Raichur District Human Development Report 2014
During the year 2011-12, a little
more than 2 per cent of district’s
population was reported to have
been affected by communicable
diseases. Raichur and Sindhnur
taluks reported higher incidence of
communicable diseases
respectively at 2.9 and 2.8 per cent
of their respective population. In
other taluks it was 2 per cent and
near it. The least developed taluk
of Devadurga has the lowest
incidence. But, elsewhere in
Karnataka, the minimum value for
this indicator is reported to be
0.004, which points to the scale of
efforts needed by the public health
system of Raichur district to achieve
a better control of communicable
diseases.
5.11. Performance of Various
Health Schemes
National Rural Health Mission
(NRHM) launched in 2005 is made
a sub-mission under the
reformulated National Health
Mission (NHM) in 2013. National
Rural Health Mission (NRHM, 2005-
12) was launched with the objective
of reducing Infant Mortality Rate
(IMR) and Maternal Mortality Ratio
(MMR), ensuring universal access
to public health services such as
women’s health, child health, water,
sanitation and hygiene,
immunization, and nutrition,
preventing and controlling
communicable and non-
communicable diseases, including
locally endemic diseases etc. The
components of NRHM and NHM that
are operational in the district are:
Accredited Social Health Activists
(ASHA) Programme; Janani
Suraksha Yojana (JSY); Prasooti
Araike; Madilu Kit; Arogya Kavacha
- the free ambulance service;
Rashtriya Swasthya Bima Yojane
(RSBY).
All the above schemes are being
implemented in the district and
whether they have helped in
achieving the desired objectives or
not should be separately studied.
In this regard, Table 5.7 provides
information on the operation of two
important programmes, viz., JSY
and distribution of Madilu kit.
While the first one has taken care
of the health of the pregnant women
and the baby in the womb,
therefore, the MMR; the second one
has helped in neo-natal care and
reducing IMR.
The data reveals the availability and
usage of health schemes in Raichur
district. There were about 17,300
beneficiaries under JSY, majority of
them from the Raichur and
Sindhnur taluks. It may be recalled
here that the incidence of MMR was
lower in these taluks; hence JSY
has direct implication on reducing
the MMR. There are 46 24*7 PHCs
working in the district.
Beneficiaries under Madilu kit
were 11123. It has also contributed
to majority of the deliveries to be
institutional deliveries. These have
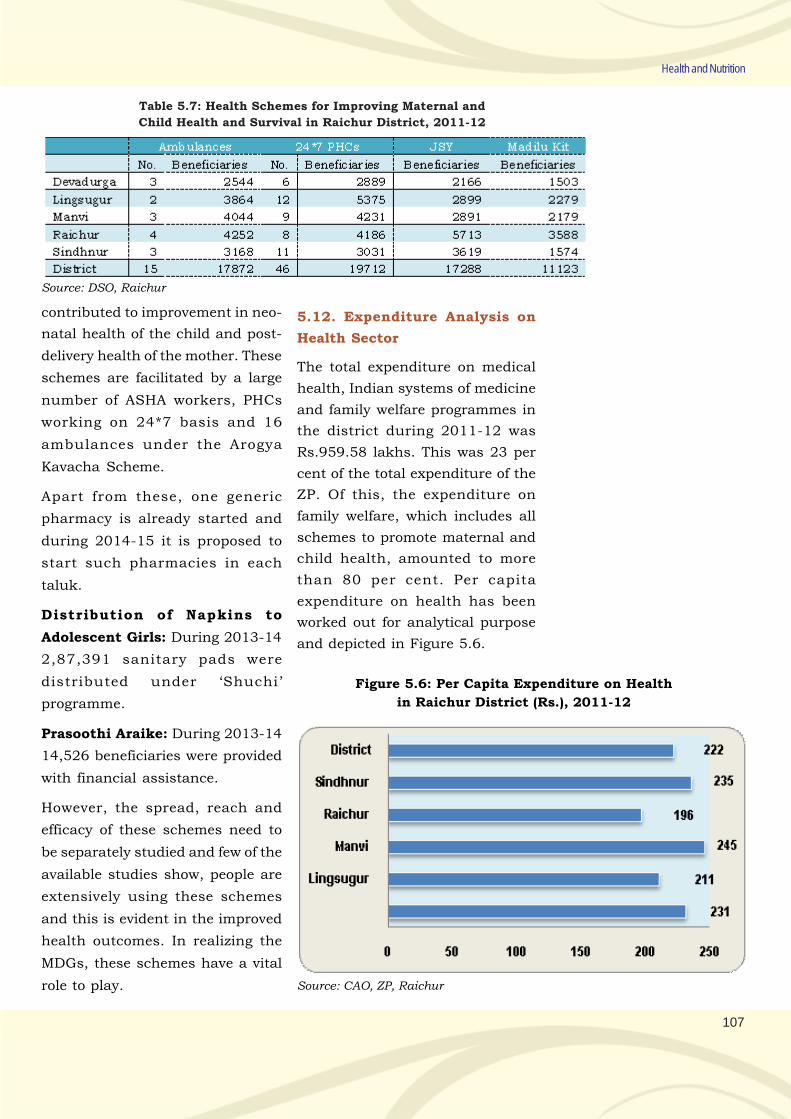
107
Health and Nutrition
Table 5.7: Health Schemes for Improving Maternal and
Child Health and Survival in Raichur District, 2011-12
Source: DSO, Raichur
contributed to improvement in neo-
natal health of the child and post-
delivery health of the mother. These
schemes are facilitated by a large
number of ASHA workers, PHCs
working on 24*7 basis and 16
ambulances under the Arogya
Kavacha Scheme.
Apart from these, one generic
pharmacy is already started and
during 2014-15 it is proposed to
start such pharmacies in each
taluk.
Distribution of Napkins to
Adolescent Girls: During 2013-14
2,87,391 sanitary pads were
distributed under ‘Shuchi’
programme.
Prasoothi Araike: During 2013-14
14,526 beneficiaries were provided
with financial assistance.
However, the spread, reach and
efficacy of these schemes need to
be separately studied and few of the
available studies show, people are
extensively using these schemes
and this is evident in the improved
health outcomes. In realizing the
MDGs, these schemes have a vital
role to play.
5.12. Expenditure Analysis on
Health Sector
The total expenditure on medical
health, Indian systems of medicine
and family welfare programmes in
the district during 2011-12 was
Rs.959.58 lakhs. This was 23 per
cent of the total expenditure of the
ZP. Of this, the expenditure on
family welfare, which includes all
schemes to promote maternal and
child health, amounted to more
than 80 per cent. Per capita
expenditure on health has been
worked out for analytical purpose
and depicted in Figure 5.6.
Figure 5.6: Per Capita Expenditure on Health
in Raichur District (Rs.), 2011-12
Source: CAO, ZP, Raichur
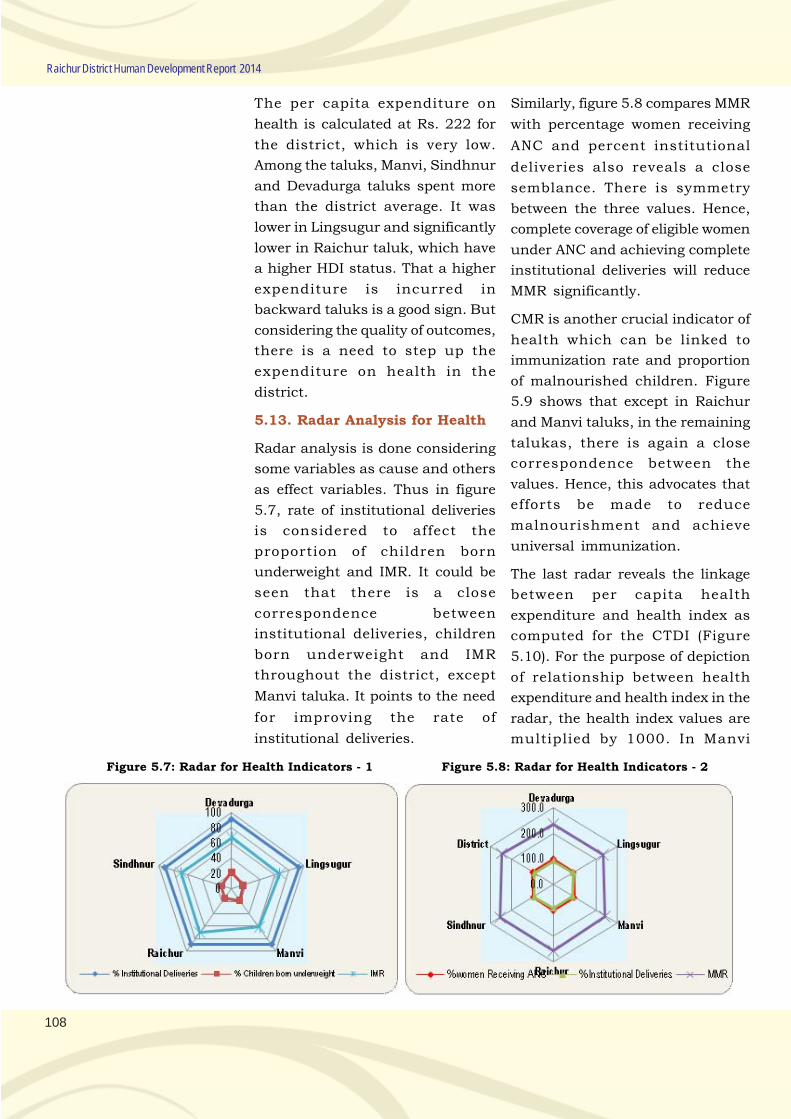
108
Raichur District Human Development Report 2014
Figure 5.7: Radar for Health Indicators - 1 Figure 5.8: Radar for Health Indicators - 2
Similarly, figure 5.8 compares MMR
with percentage women receiving
ANC and percent institutional
deliveries also reveals a close
semblance. There is symmetry
between the three values. Hence,
complete coverage of eligible women
under ANC and achieving complete
institutional deliveries will reduce
MMR significantly.
CMR is another crucial indicator of
health which can be linked to
immunization rate and proportion
of malnourished children. Figure
5.9 shows that except in Raichur
and Manvi taluks, in the remaining
talukas, there is again a close
correspondence between the
values. Hence, this advocates that
efforts be made to reduce
malnourishment and achieve
universal immunization.
The last radar reveals the linkage
between per capita health
expenditure and health index as
computed for the CTDI (Figure
5.10). For the purpose of depiction
of relationship between health
expenditure and health index in the
radar, the health index values are
multiplied by 1000. In Manvi
The per capita expenditure on
health is calculated at Rs. 222 for
the district, which is very low.
Among the taluks, Manvi, Sindhnur
and Devadurga taluks spent more
than the district average. It was
lower in Lingsugur and significantly
lower in Raichur taluk, which have
a higher HDI status. That a higher
expenditure is incurred in
backward taluks is a good sign. But
considering the quality of outcomes,
there is a need to step up the
expenditure on health in the
district.
5.13. Radar Analysis for Health
Radar analysis is done considering
some variables as cause and others
as effect variables. Thus in figure
5.7, rate of institutional deliveries
is considered to affect the
proportion of children born
underweight and IMR. It could be
seen that there is a close
correspondence between
institutional deliveries, children
born underweight and IMR
throughout the district, except
Manvi taluka. It points to the need
for improving the rate of
institutional deliveries.
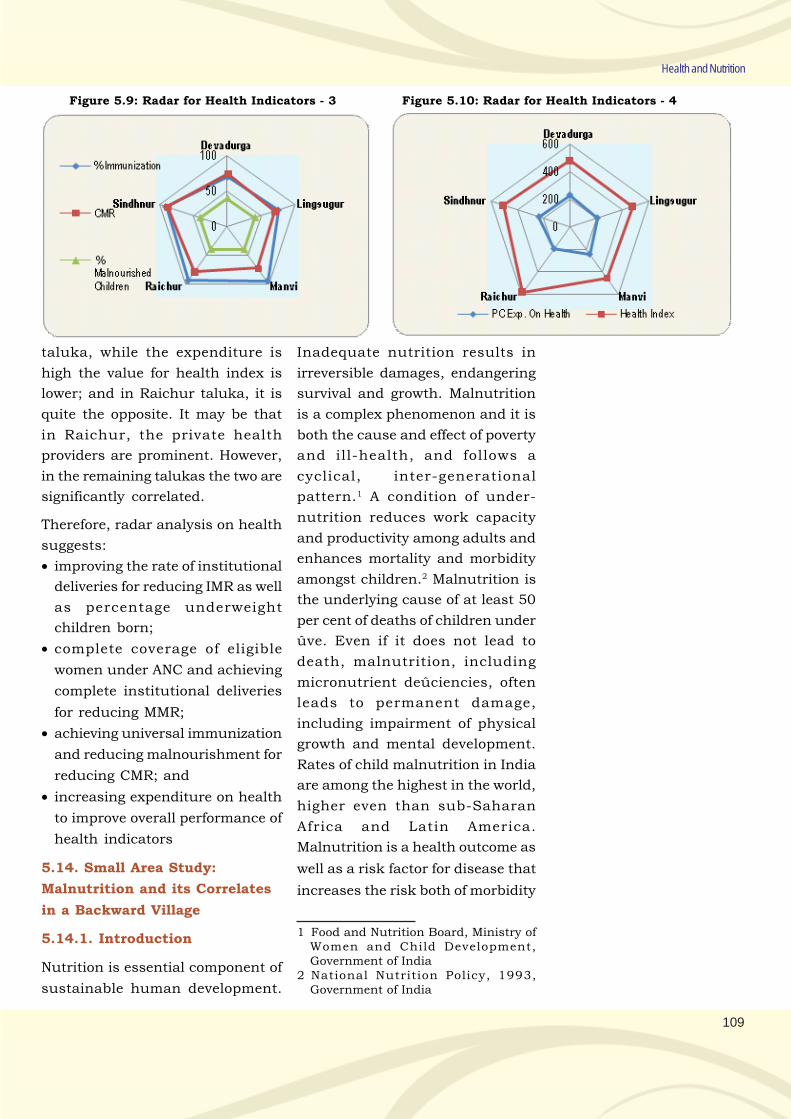
109
Health and Nutrition
Figure 5.9: Radar for Health Indicators - 3 Figure 5.10: Radar for Health Indicators - 4
taluka, while the expenditure is
high the value for health index is
lower; and in Raichur taluka, it is
quite the opposite. It may be that
in Raichur, the private health
providers are prominent. However,
in the remaining talukas the two are
significantly correlated.
Therefore, radar analysis on health
suggests:
• improving the rate of institutional
deliveries for reducing IMR as well
as percentage underweight
children born;
• complete coverage of eligible
women under ANC and achieving
complete institutional deliveries
for reducing MMR;
• achieving universal immunization
and reducing malnourishment for
reducing CMR; and
• increasing expenditure on health
to improve overall performance of
health indicators
5.14. Small Area Study:
Malnutrition and its Correlates
in a Backward Village
5.14.1. Introduction
Nutrition is essential component of
sustainable human development.
Inadequate nutrition results in
irreversible damages, endangering
survival and growth. Malnutrition
is a complex phenomenon and it is
both the cause and effect of poverty
and ill-health, and follows a
cyclical, inter-generational
pattern.1 A condition of under-
nutrition reduces work capacity
and productivity among adults and
enhances mortality and morbidity
amongst children.2 Malnutrition is
the underlying cause of at least 50
per cent of deaths of children under
ûve. Even if it does not lead to
death, malnutrition, including
micronutrient deûciencies, often
leads to permanent damage,
including impairment of physical
growth and mental development.
Rates of child malnutrition in India
are among the highest in the world,
higher even than sub-Saharan
Africa and Latin America.
Malnutrition is a health outcome as
well as a risk factor for disease that
increases the risk both of morbidity
1 Food and Nutrition Board, Ministry ofWomen and Child Development,Government of India
2 National Nutrition Policy, 1993,Government of India
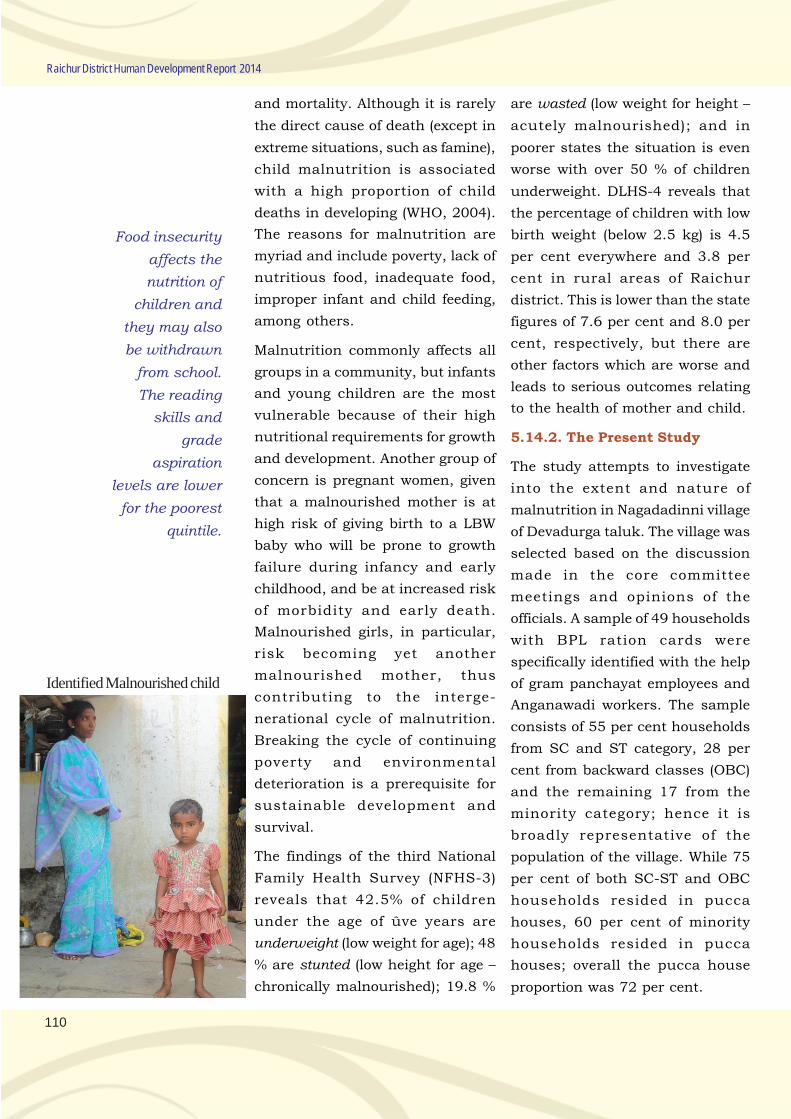
110
Raichur District Human Development Report 2014
and mortality. Although it is rarely
the direct cause of death (except in
extreme situations, such as famine),
child malnutrition is associated
with a high proportion of child
deaths in developing (WHO, 2004).
The reasons for malnutrition are
myriad and include poverty, lack of
nutritious food, inadequate food,
improper infant and child feeding,
among others.
Malnutrition commonly affects all
groups in a community, but infants
and young children are the most
vulnerable because of their high
nutritional requirements for growth
and development. Another group of
concern is pregnant women, given
that a malnourished mother is at
high risk of giving birth to a LBW
baby who will be prone to growth
failure during infancy and early
childhood, and be at increased risk
of morbidity and early death.
Malnourished girls, in particular,
risk becoming yet another
malnourished mother, thus
contributing to the interge-
nerational cycle of malnutrition.
Breaking the cycle of continuing
poverty and environmental
deterioration is a prerequisite for
sustainable development and
survival.
The findings of the third National
Family Health Survey (NFHS-3)
reveals that 42.5% of children
under the age of ûve years are
underweight (low weight for age); 48
% are stunted (low height for age –
chronically malnourished); 19.8 %
are wasted (low weight for height –
acutely malnourished); and in
poorer states the situation is even
worse with over 50 % of children
underweight. DLHS-4 reveals that
the percentage of children with low
birth weight (below 2.5 kg) is 4.5
per cent everywhere and 3.8 per
cent in rural areas of Raichur
district. This is lower than the state
figures of 7.6 per cent and 8.0 per
cent, respectively, but there are
other factors which are worse and
leads to serious outcomes relating
to the health of mother and child.
5.14.2. The Present Study
The study attempts to investigate
into the extent and nature of
malnutrition in Nagadadinni village
of Devadurga taluk. The village was
selected based on the discussion
made in the core committee
meetings and opinions of the
officials. A sample of 49 households
with BPL ration cards were
specifically identified with the help
of gram panchayat employees and
Anganawadi workers. The sample
consists of 55 per cent households
from SC and ST category, 28 per
cent from backward classes (OBC)
and the remaining 17 from the
minority category; hence it is
broadly representative of the
population of the village. While 75
per cent of both SC-ST and OBC
households resided in pucca
houses, 60 per cent of minority
households resided in pucca
houses; overall the pucca house
proportion was 72 per cent.
Food insecurity
affects the
nutrition of
children and
they may also
be withdrawn
from school.
The reading
skills and
grade
aspiration
levels are lower
for the poorest
quintile.
Identified Malnourished child
111
Health and Nutrition
5.14.2. Extent and Nature of
Malnutrition
In order to measure the extent of
malnutrition, the question - Is any
child is identified as malnourished
by the Anganwadi worker (AWW)?
was put. The records of the
anganwadis were cross checked
and at the time of field work there
was no child was identified as
severely malnourished. However,
the responses show that 59 per cent
of the households reported
presence of malnourished child.
OBC households had the largest
proportion (75 per cent); followed by
SC-ST (56 per cent) and minority
(40 per cent) households.
Nearly three-fourths (72 per cent) of
the sample households reported
there was child birth occurring and
all the children born were healthy.
So if children are born healthy and
they eventually become
malnourished later speaks of the
inadequate feeding practices, extent
of use of supplementary nutrition
provisions and of course hygienic
practices. 80 per cent of minority,
75 per cent of SC-ST and 63 per
cent of OBC households reported
births all of whom were healthy
when born.
The immediate concern is whether
the malnourished child receives
any special care, supplementary
feeding and medical treatment.
Unfortunately, nearly half of the
households (48 per cent) stated no
such special care was taken and
this proportion is higher in minority
and OBC households. Also more
than half of the households
reported they have not consulted
doctors (feeling that it is a common
malady and child will come out of
it over a period of time). 80 per cent
of minority households and 50 per
cent each of SC-ST and OBC
households did not provide medical
care to the malnourished children.
5.14.3. Morbidity Pattern of
Households
Malnutrition is expected to be
associated with serious health
concerns and increase in illness
incidences. Accordingly Table 5.8
shows the morbidity pattern of the
sample households. One-third
households (60 per cent among
minorities; 38 per cent among
OBCs and 25 per cent among SC-
ST households) reported to have
experienced frequent illnesses.
Similarly, only 4 households (14
per cent) reported prevalence of
malaria, dengue, diarrhoea, etc.
during the last one year. However,
female morbidity related to
malnutrition like headache, back
pain and body ache is very common
as about one-third of households
report their prevalence.
The minority households report a
greater average illness followed by
OBC and SC-ST households. 60 per
cent and 40 per cent of minority
households report, respectively, to
be suffering from frequent
headache and body ache, while 50
If children are
born healthy
and
they eventually
become
malnourished
later speaks of
the
inadequate
feeding
practices, extent
of use of
supplementary
nutrition
provisions and
of course
hygienic
practices.
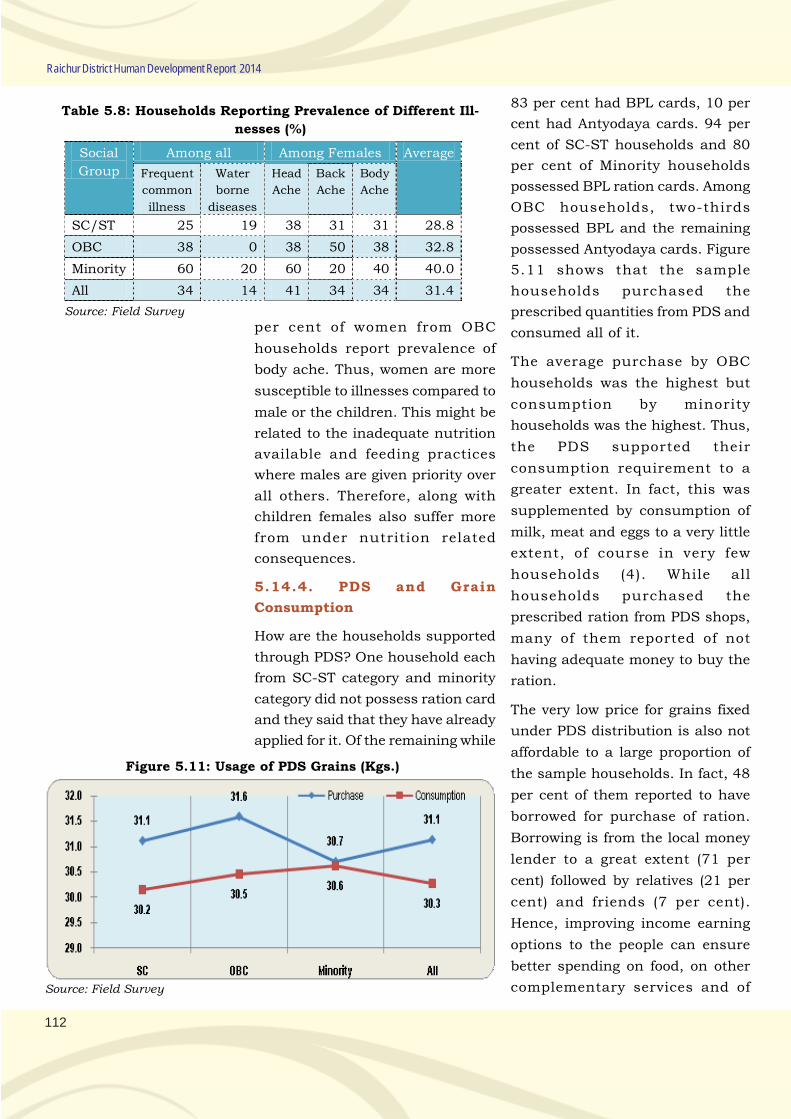
112
Raichur District Human Development Report 2014
Table 5.8: Households Reporting Prevalence of Different Ill-
nesses (%)
Social
Group
Among all Among Females Average
Frequent
common
illness
Water
borne
diseases
Head
Ache
Back
Ache
Body
Ache
SC/ST 25 19 38 31 31 28.8
OBC 38 0 38 50 38 32.8
Minority 60 20 60 20 40 40.0
All 34 14 41 34 34 31.4
Source: Field Survey
per cent of women from OBC
households report prevalence of
body ache. Thus, women are more
susceptible to illnesses compared to
male or the children. This might be
related to the inadequate nutrition
available and feeding practices
where males are given priority over
all others. Therefore, along with
children females also suffer more
from under nutrition related
consequences.
5.14.4. PDS and Grain
Consumption
How are the households supported
through PDS? One household each
from SC-ST category and minority
category did not possess ration card
and they said that they have already
applied for it. Of the remaining while
83 per cent had BPL cards, 10 per
cent had Antyodaya cards. 94 per
cent of SC-ST households and 80
per cent of Minority households
possessed BPL ration cards. Among
OBC households, two-thirds
possessed BPL and the remaining
possessed Antyodaya cards. Figure
5.11 shows that the sample
households purchased the
prescribed quantities from PDS and
consumed all of it.
The average purchase by OBC
households was the highest but
consumption by minority
households was the highest. Thus,
the PDS supported their
consumption requirement to a
greater extent. In fact, this was
supplemented by consumption of
milk, meat and eggs to a very little
extent, of course in very few
households (4). While all
households purchased the
prescribed ration from PDS shops,
many of them reported of not
having adequate money to buy the
ration.
The very low price for grains fixed
under PDS distribution is also not
affordable to a large proportion of
the sample households. In fact, 48
per cent of them reported to have
borrowed for purchase of ration.
Borrowing is from the local money
lender to a great extent (71 per
cent) followed by relatives (21 per
cent) and friends (7 per cent).
Hence, improving income earning
options to the people can ensure
better spending on food, on other
complementary services and of
Figure 5.11: Usage of PDS Grains (Kgs.)
Source: Field Survey
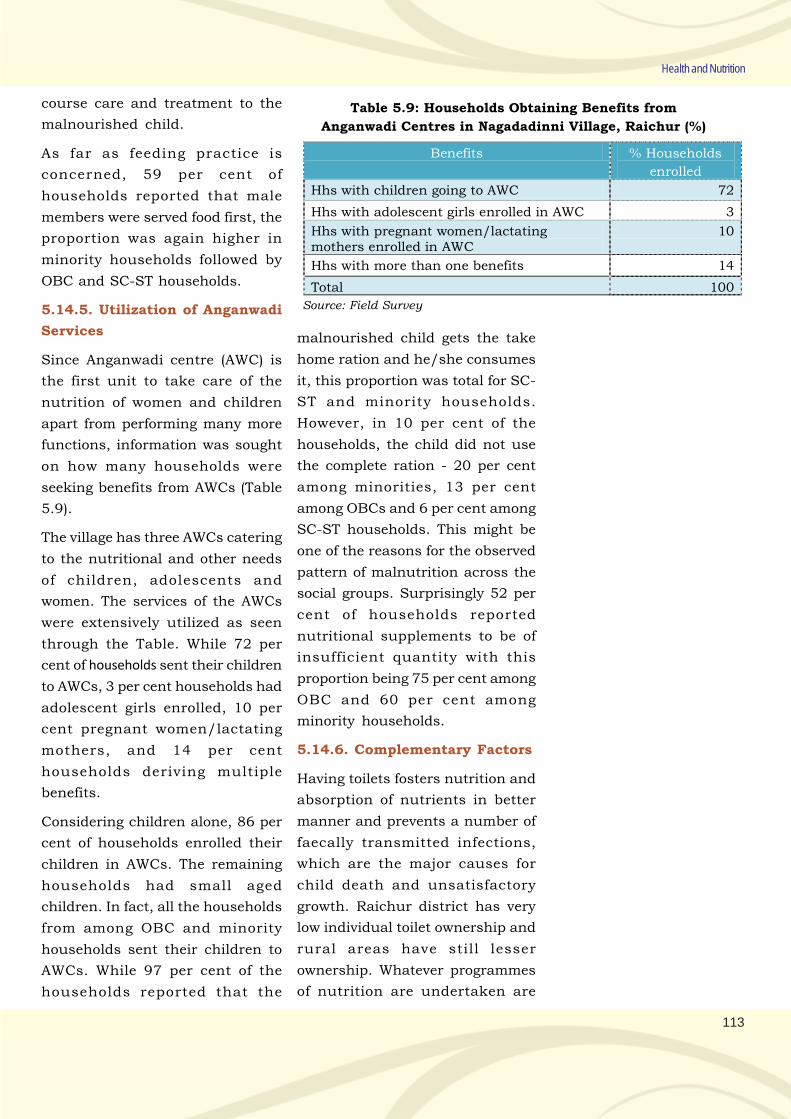
113
Health and Nutrition
course care and treatment to the
malnourished child.
As far as feeding practice is
concerned, 59 per cent of
households reported that male
members were served food first, the
proportion was again higher in
minority households followed by
OBC and SC-ST households.
5.14.5. Utilization of Anganwadi
Services
Since Anganwadi centre (AWC) is
the first unit to take care of the
nutrition of women and children
apart from performing many more
functions, information was sought
on how many households were
seeking benefits from AWCs (Table
5.9).
The village has three AWCs catering
to the nutritional and other needs
of children, adolescents and
women. The services of the AWCs
were extensively utilized as seen
through the Table. While 72 per
cent of households sent their children
to AWCs, 3 per cent households had
adolescent girls enrolled, 10 per
cent pregnant women/lactating
mothers, and 14 per cent
households deriving multiple
benefits.
Considering children alone, 86 per
cent of households enrolled their
children in AWCs. The remaining
households had small aged
children. In fact, all the households
from among OBC and minority
households sent their children to
AWCs. While 97 per cent of the
households reported that the
Table 5.9: Households Obtaining Benefits from
Anganwadi Centres in Nagadadinni Village, Raichur (%)
Benefits % Households
enrolled
Hhs with children going to AWC 72
Hhs with adolescent girls enrolled in AWC 3
Hhs with pregnant women/lactating mothers enrolled in AWC
10
Hhs with more than one benefits 14
Total 100
Source: Field Survey
malnourished child gets the take
home ration and he/she consumes
it, this proportion was total for SC-
ST and minority households.
However, in 10 per cent of the
households, the child did not use
the complete ration - 20 per cent
among minorities, 13 per cent
among OBCs and 6 per cent among
SC-ST households. This might be
one of the reasons for the observed
pattern of malnutrition across the
social groups. Surprisingly 52 per
cent of households reported
nutritional supplements to be of
insufficient quantity with this
proportion being 75 per cent among
OBC and 60 per cent among
minority households.
5.14.6. Complementary Factors
Having toilets fosters nutrition and
absorption of nutrients in better
manner and prevents a number of
faecally transmitted infections,
which are the major causes for
child death and unsatisfactory
growth. Raichur district has very
low individual toilet ownership and
rural areas have still lesser
ownership. Whatever programmes
of nutrition are undertaken are
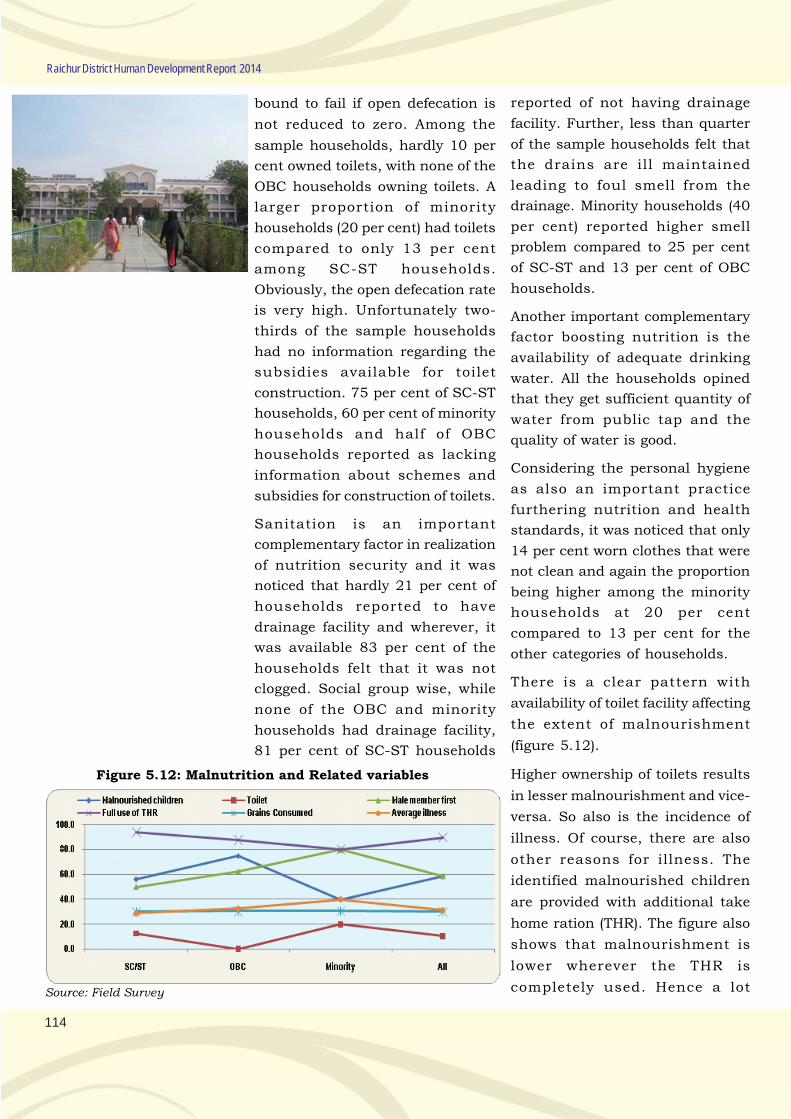
114
Raichur District Human Development Report 2014
bound to fail if open defecation is
not reduced to zero. Among the
sample households, hardly 10 per
cent owned toilets, with none of the
OBC households owning toilets. A
larger proportion of minority
households (20 per cent) had toilets
compared to only 13 per cent
among SC-ST households.
Obviously, the open defecation rate
is very high. Unfortunately two-
thirds of the sample households
had no information regarding the
subsidies available for toilet
construction. 75 per cent of SC-ST
households, 60 per cent of minority
households and half of OBC
households reported as lacking
information about schemes and
subsidies for construction of toilets.
Sanitation is an important
complementary factor in realization
of nutrition security and it was
noticed that hardly 21 per cent of
households reported to have
drainage facility and wherever, it
was available 83 per cent of the
households felt that it was not
clogged. Social group wise, while
none of the OBC and minority
households had drainage facility,
81 per cent of SC-ST households
reported of not having drainage
facility. Further, less than quarter
of the sample households felt that
the drains are ill maintained
leading to foul smell from the
drainage. Minority households (40
per cent) reported higher smell
problem compared to 25 per cent
of SC-ST and 13 per cent of OBC
households.
Another important complementary
factor boosting nutrition is the
availability of adequate drinking
water. All the households opined
that they get sufficient quantity of
water from public tap and the
quality of water is good.
Considering the personal hygiene
as also an important practice
furthering nutrition and health
standards, it was noticed that only
14 per cent worn clothes that were
not clean and again the proportion
being higher among the minority
households at 20 per cent
compared to 13 per cent for the
other categories of households.
There is a clear pattern with
availability of toilet facility affecting
the extent of malnourishment
(figure 5.12).
Higher ownership of toilets results
in lesser malnourishment and vice-
versa. So also is the incidence of
illness. Of course, there are also
other reasons for illness. The
identified malnourished children
are provided with additional take
home ration (THR). The figure also
shows that malnourishment is
lower wherever the THR is
completely used. Hence a lot
Figure 5.12: Malnutrition and Related variables
Source: Field Survey
115
Health and Nutrition
depends on other members of the
house for enabling the children to
consume the additional nutrients.
The same argument holds good for
grains consumed in the household
there is a close relationship between
the two. But as mentioned earlier,
there is a need to increase
employment and income earning
opportunities so that people buy the
ration from the PDS. The correlation
coefficients of malnourished
children with selected variables
show significant association. It is
highly and negatively associated
with grain consumption, and
feeding practices. It is positively
associated with the full utilization
of THR.
5.15. An Overview: Performance
and Inadequacies of Health Care
System
The framers of HDI have used
health as a basic component of
human development. Health is a
vital input into human resource
development that increases
longevity and productivity of human
beings. Especially, good health of
women spills over to the next
generation which will also be
healthy and able to contribute more
to societal development. Hence,
assuring better and timely health
care facilities will contribute to
achieving higher levels of human
development. In a backward
district like Raichur, nutrition
security has a special place in
sustaining human development.
The district has a total population
of about 19.9 lakhs according to
2011 census, which accounts for
about 3.5 per cent of the state’s
population. Urbanization ratio is
lower in the district. The district
has a higher proportion of both SC
and ST populations. The district
has a higher ratio of people in the
age group of 0-14 and 60 and above
years compared to the state but
lesser ratio in the 15-59 age
groups. Hence, health needs of
children and elderly people need
to be taken care of.
The district’s demographic quality
in terms of sex ratio is better vis-a-
vis the state and has improved over
the years. CMR is the highest
among the districts of the state at
77. While the unmet need for birth
control ranges from 18 per cent in
Devadurga to 35 per cent in Manvi
taluk, 63 per cent of birth control
burden is borne by women. This is
indicative of gender bias in the
family planning practices. If males
also participate in birth control
activity, the extent of unmet need
can be reduced and health of
women substantially improved.
The mortality rates are very high
compared to the other districts of
the state and they represent the
nature of discrimination and
deprivation present with respect to
child health in the district. IMR is
highest in Raichur taluka at 71 and
lowest in Manvi taluka at 62 and
the inter-taluka variation is not
much. Sindhnur and Raichur
taluks have CMR even above the
district level value of 77. Lingsugur
taluk has the lowest value at 70, but
compared to the minimum values
across the state, a lot needs to be
116
Raichur District Human Development Report 2014
achieved in this direction. IMR and
MMR are higher in the district
owing to a higher proportion of
anaemic pregnant women. As a
result of spread of health
institutions and awareness the
proportion of women receiving ANC
has touched almost 100 in Raichur
district; and because medical
institutions and the ‘Arogya
Kavacha’ program (108-
Ambulance), have spread
throughout the district, and
because of the efforts of
functionaries like AHSAs and
AWWs the proportion of
institutional deliveries has
increased to 91 per cent at the
district level. But still the health
infrastructure needs to be
strengthened in the taluks of
Devadurga, Manvi and Sindhnur.
About one-third of pregnant women
are identified as anaemic in the
district, about 85 per cent of
children have been provided with
immunization in the district.
Raichur district has a higher
percentage of children who are born
underweight at about 20 per cent
and the proportion of malnourished
children is 46 per cent.
The health infrastructure in
Raichur district is inadequate when
compared to other districts of the
state. The availability of health
personnel is still more
unfavourable. Similarly,
considering the existing number of
anganwadis, if additional required
number of AWCs is worked out
based on population norms, the
district would additionally require
80 per cent more number of AWCs.
Expenditure on health is about 23
per cent of the total expenditure of
the ZP, of which, expenditure on
family welfare, which includes all
schemes to promote maternal and
child health, amounted to more
than 80 per cent. However, the per
capita expenditure on health is
calculated at Rs. 222 for the
district, which is very low.
The Radar analysis on health
suggests: improving the rate of
institutional deliveries for reducing
IMR as well as percentage
underweight children born;
complete coverage of eligible women
under ANC and achieving complete
institutional deliveries for reducing
MMR; achieving universal
immunization and reducing
malnourishment for reducing CMR;
and increasing expenditure on
health to improve overall
performance of health indicators
The small area study reveals that
OBC households had the largest
proportion of malnourished
children followed by SC-ST and
minority households. PDS strongly
supported the consumption
requirement of the households to a
greater extent. That 48 per cent of
sample households reported to have
borrowed for purchase of ration,
reiterates the need for improving
income earning options for better
spending on food, on other
complementary services and for
care and treatment to the
malnourished child. Malnutrition
is highly and negatively associated
with grain consumption and
feeding practices; and is positively
associated with the full utilization
of THR.
Improving
the rate of
institutional
deliveries
for reducing
IMR as well as
percentage
underweight
children born;
complete
coverage of
eligible women
under ANC
and achieving
complete
institutional
deliveries for
reducing
MMR; achieving
universal
immunization
and reducing
malnourishment
for reducing
CMR;
and
increasing
expenditure on
health to
improve
overall
performance
of health
indicators
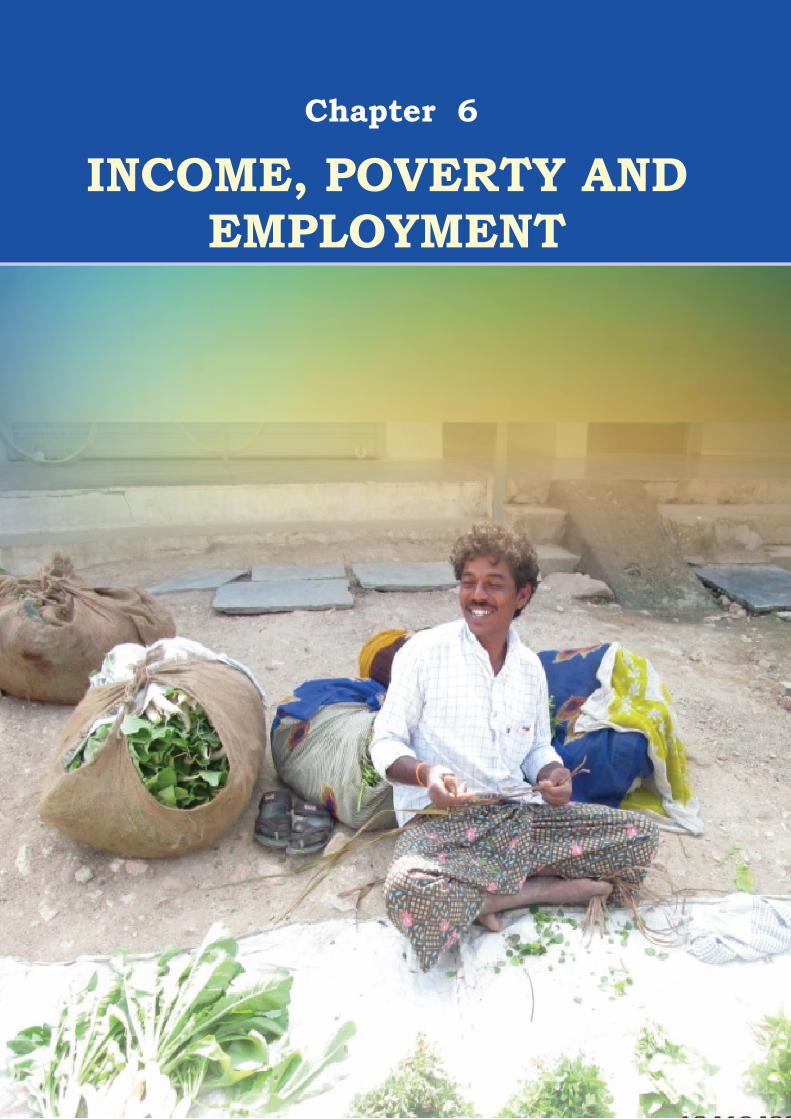
Chapter 6
INCOME, POVERTY AND EMPLOYMENT

.
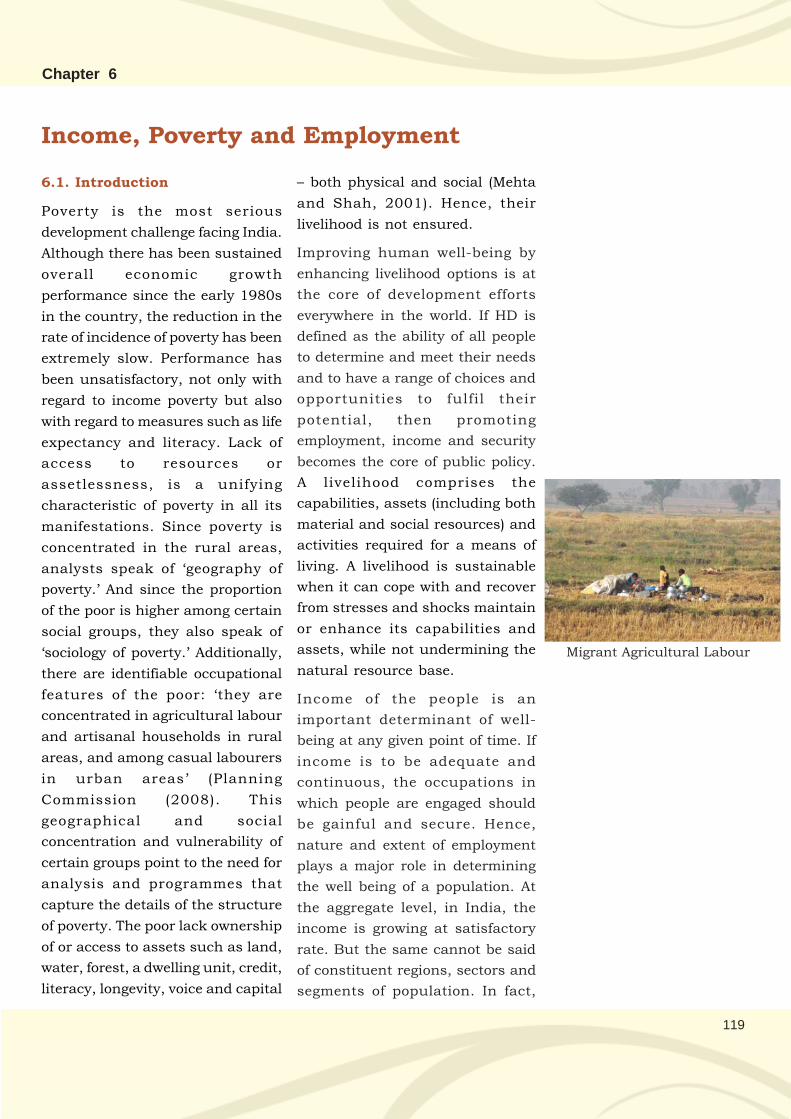
119
Chapter 6
Income, Poverty and Employment
6.1. Introduction
Poverty is the most serious
development challenge facing India.
Although there has been sustained
overall economic growth
performance since the early 1980s
in the country, the reduction in the
rate of incidence of poverty has been
extremely slow. Performance has
been unsatisfactory, not only with
regard to income poverty but also
with regard to measures such as life
expectancy and literacy. Lack of
access to resources or
assetlessness, is a unifying
characteristic of poverty in all its
manifestations. Since poverty is
concentrated in the rural areas,
analysts speak of ‘geography of
poverty.’ And since the proportion
of the poor is higher among certain
social groups, they also speak of
‘sociology of poverty.’ Additionally,
there are identifiable occupational
features of the poor: ‘they are
concentrated in agricultural labour
and artisanal households in rural
areas, and among casual labourers
in urban areas’ (Planning
Commission (2008). This
geographical and social
concentration and vulnerability of
certain groups point to the need for
analysis and programmes that
capture the details of the structure
of poverty. The poor lack ownership
of or access to assets such as land,
water, forest, a dwelling unit, credit,
literacy, longevity, voice and capital
– both physical and social (Mehta
and Shah, 2001). Hence, their
livelihood is not ensured.
Improving human well-being by
enhancing livelihood options is at
the core of development efforts
everywhere in the world. If HD is
defined as the ability of all people
to determine and meet their needs
and to have a range of choices and
opportunities to fulfil their
potential, then promoting
employment, income and security
becomes the core of public policy.
A livelihood comprises the
capabilities, assets (including both
material and social resources) and
activities required for a means of
living. A livelihood is sustainable
when it can cope with and recover
from stresses and shocks maintain
or enhance its capabilities and
assets, while not undermining the
natural resource base.
Income of the people is an
important determinant of well-
being at any given point of time. If
income is to be adequate and
continuous, the occupations in
which people are engaged should
be gainful and secure. Hence,
nature and extent of employment
plays a major role in determining
the well being of a population. At
the aggregate level, in India, the
income is growing at satisfactory
rate. But the same cannot be said
of constituent regions, sectors and
segments of population. In fact,
Migrant Agricultural Labour
120
Raichur District Human Development Report 2014
evidence shows that the growth
pattern in the country in the post-
1990 period has not been uniform.
A harsh consequence is seen in
terms of stagnation in agriculture
and consequent slow down of village
economies vis-a-vis the urban ones.
Another consequence has been the
‘job-less growth’. Income and
employment characteristics to a
large extent, determine the
livelihood security of people. Thus,
human development presupposes
provision of livelihood security to
people. The present chapter focuses
on the livelihood issues of people
in Raichur district and puts it in the
human development framework.
6.2. District and Taluk Income
In Karnataka, the district income is
estimated by the Directorate of
Economics and Statistics. The total
district income was estimated to
have increased by 31.8 per cent
during 2004-2009, from Rs.
3,07,911 lakhs in 2004-05, to Rs.
4,05,795 lakhs in 2008-09. The
increase, however, was slower than
that at the state level. As a result,
the district’s share in state’s income
decreased from 1.8 per cent to 1.7
per cent between 2004-05 and
2008-09. The per capita income of
the district not only continued to
be lower than the state level, the
percentage change in PCI was also
lower in the district compared to the
state.
An important analysis with regard
to HD implications of income growth
is the composition of the income.
In Raichur, like at the state level,
the service sector dominates, but
not at the same level as that in the
state. Agriculture contributes about
a quarter of the district income and
total primary sector nearly one-
third. Actually, the share of
secondary and tertiary sectors in
the district’s income have declined,
which is contrary to the trends at
the state level. In the secondary
sector construction dominates and
manufacturing contributes very
little. Similarly, in the tertiary
sector, except for banking and
insurance all major service
activities have contributed lower to
the district income. Hence, contrary
to the usual tendency, agriculture
has increased its share;
manufacturing is a very small
component of the district’s
economy and major services are
declining. These tendencies are
expected to keep the district a low
growing one in the years to come.
As far as growth drivers are
concerned banking and
insurance, manufacturing,
construction and agriculture are
the growth promoting sectors. But
because the district has
decelerated in service sector, its
growth has not been as high as in
the state. The district, therefore,
represents a traditional economy
dependent on primary production
with less of manufacturing and few
services. Therefore, not much of
diversification into high productive
sectors could be observed.
6.2.1. Taluk Income
The information on taluk incomes
is provided in Table 6.1. Raichur
taluk has almost one-third of the
Lack of access
to resources or
assetlessness,
is a unifying
characteristic of
poverty in all its
manifestations.
There is a
‘geography of
poverty’ and of
course a
‘sociology of
poverty.’
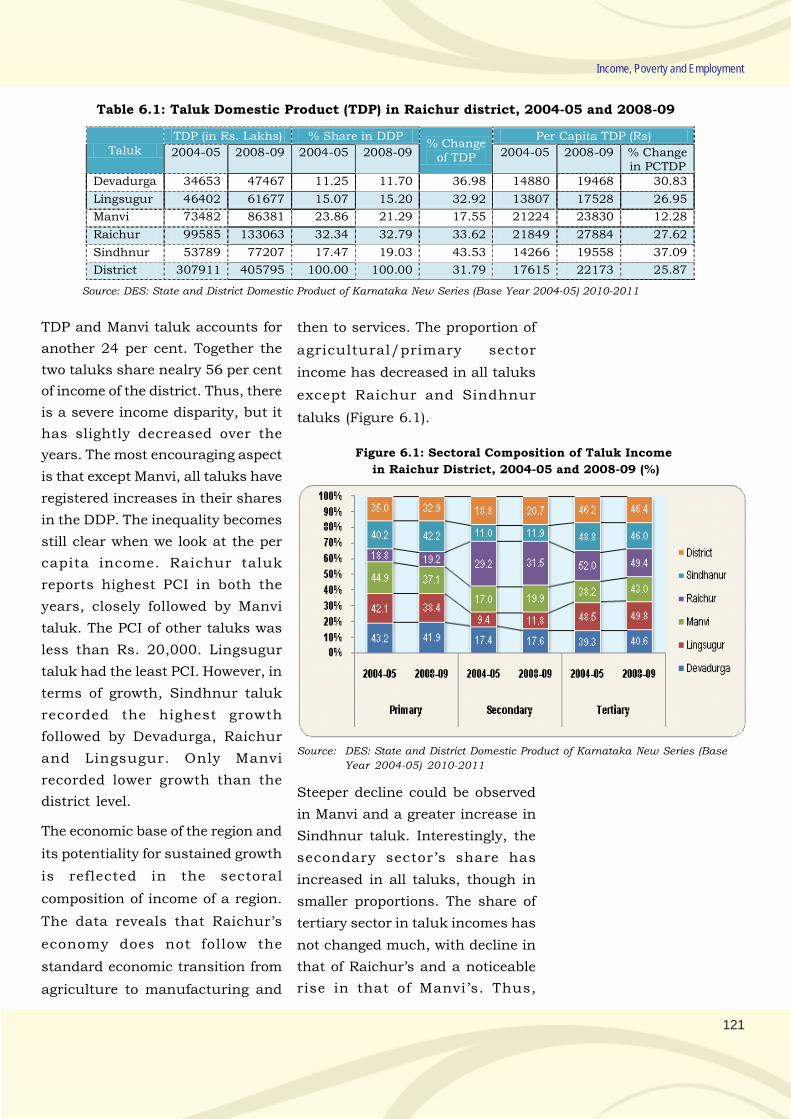
121
Income, Poverty and Employment
TDP and Manvi taluk accounts for
another 24 per cent. Together the
two taluks share nealry 56 per cent
of income of the district. Thus, there
is a severe income disparity, but it
has slightly decreased over the
years. The most encouraging aspect
is that except Manvi, all taluks have
registered increases in their shares
in the DDP. The inequality becomes
still clear when we look at the per
capita income. Raichur taluk
reports highest PCI in both the
years, closely followed by Manvi
taluk. The PCI of other taluks was
less than Rs. 20,000. Lingsugur
taluk had the least PCI. However, in
terms of growth, Sindhnur taluk
recorded the highest growth
followed by Devadurga, Raichur
and Lingsugur. Only Manvi
recorded lower growth than the
district level.
The economic base of the region and
its potentiality for sustained growth
is reflected in the sectoral
composition of income of a region.
The data reveals that Raichur’s
economy does not follow the
standard economic transition from
agriculture to manufacturing and
Table 6.1: Taluk Domestic Product (TDP) in Raichur district, 2004-05 and 2008-09
Taluk TDP (in Rs. Lakhs) % Share in DDP
% Change of TDP
Per Capita TDP (Rs)
2004-05 2008-09 2004-05 2008-09 2004-05 2008-09 % Change in PCTDP
Devadurga 34653 47467 11.25 11.70 36.98 14880 19468 30.83
Lingsugur 46402 61677 15.07 15.20 32.92 13807 17528 26.95
Manvi 73482 86381 23.86 21.29 17.55 21224 23830 12.28
Raichur 99585 133063 32.34 32.79 33.62 21849 27884 27.62
Sindhnur 53789 77207 17.47 19.03 43.53 14266 19558 37.09
District 307911 405795 100.00 100.00 31.79 17615 22173 25.87
Source: DES: State and District Domestic Product of Karnataka New Series (Base Year 2004-05) 2010-2011
then to services. The proportion of
agricultural/primary sector
income has decreased in all taluks
except Raichur and Sindhnur
taluks (Figure 6.1).
Figure 6.1: Sectoral Composition of Taluk Income
in Raichur District, 2004-05 and 2008-09 (%)
Source: DES: State and District Domestic Product of Karnataka New Series (Base
Year 2004-05) 2010-2011
Steeper decline could be observed
in Manvi and a greater increase in
Sindhnur taluk. Interestingly, the
secondary sector’s share has
increased in all taluks, though in
smaller proportions. The share of
tertiary sector in taluk incomes has
not changed much, with decline in
that of Raichur’s and a noticeable
rise in that of Manvi’s. Thus,
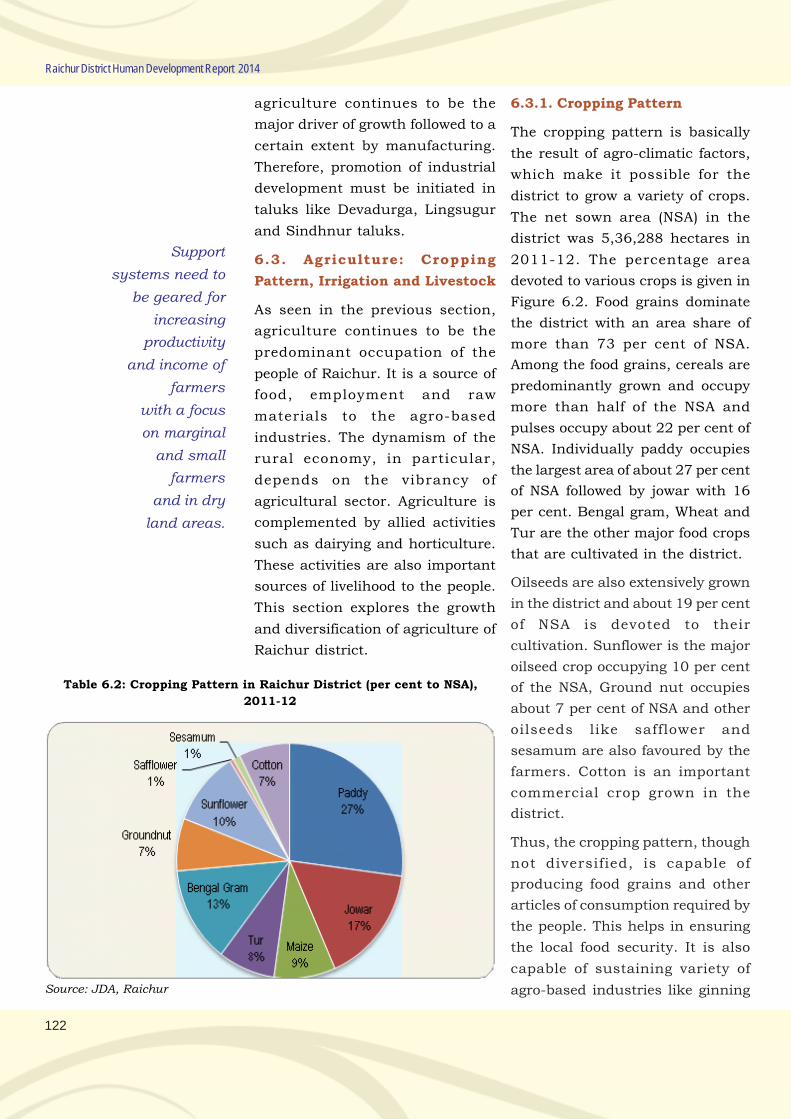
122
Raichur District Human Development Report 2014
agriculture continues to be the
major driver of growth followed to a
certain extent by manufacturing.
Therefore, promotion of industrial
development must be initiated in
taluks like Devadurga, Lingsugur
and Sindhnur taluks.
6.3. Agriculture: Cropping
Pattern, Irrigation and Livestock
As seen in the previous section,
agriculture continues to be the
predominant occupation of the
people of Raichur. It is a source of
food, employment and raw
materials to the agro-based
industries. The dynamism of the
rural economy, in particular,
depends on the vibrancy of
agricultural sector. Agriculture is
complemented by allied activities
such as dairying and horticulture.
These activities are also important
sources of livelihood to the people.
This section explores the growth
and diversification of agriculture of
Raichur district.
6.3.1. Cropping Pattern
The cropping pattern is basically
the result of agro-climatic factors,
which make it possible for the
district to grow a variety of crops.
The net sown area (NSA) in the
district was 5,36,288 hectares in
2011-12. The percentage area
devoted to various crops is given in
Figure 6.2. Food grains dominate
the district with an area share of
more than 73 per cent of NSA.
Among the food grains, cereals are
predominantly grown and occupy
more than half of the NSA and
pulses occupy about 22 per cent of
NSA. Individually paddy occupies
the largest area of about 27 per cent
of NSA followed by jowar with 16
per cent. Bengal gram, Wheat and
Tur are the other major food crops
that are cultivated in the district.
Oilseeds are also extensively grown
in the district and about 19 per cent
of NSA is devoted to their
cultivation. Sunflower is the major
oilseed crop occupying 10 per cent
of the NSA, Ground nut occupies
about 7 per cent of NSA and other
oilseeds like safflower and
sesamum are also favoured by the
farmers. Cotton is an important
commercial crop grown in the
district.
Thus, the cropping pattern, though
not diversified, is capable of
producing food grains and other
articles of consumption required by
the people. This helps in ensuring
the local food security. It is also
capable of sustaining variety of
agro-based industries like ginning
Table 6.2: Cropping Pattern in Raichur District (per cent to NSA),
2011-12
Source: JDA, Raichur
Support
systems need to
be geared for
increasing
productivity
and income of
farmers
with a focus
on marginal
and small
farmers
and in dry
land areas.
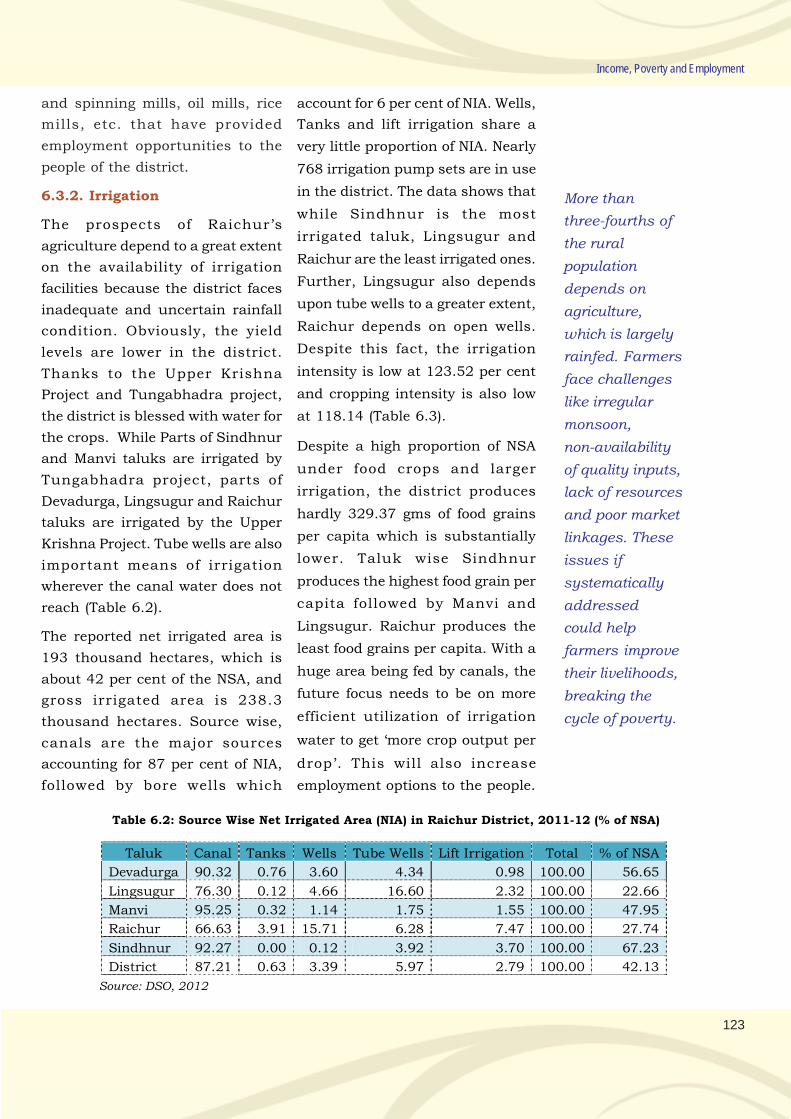
123
Income, Poverty and Employment
and spinning mills, oil mills, rice
mills, etc. that have provided
employment opportunities to the
people of the district.
6.3.2. Irrigation
The prospects of Raichur’s
agriculture depend to a great extent
on the availability of irrigation
facilities because the district faces
inadequate and uncertain rainfall
condition. Obviously, the yield
levels are lower in the district.
Thanks to the Upper Krishna
Project and Tungabhadra project,
the district is blessed with water for
the crops. While Parts of Sindhnur
and Manvi taluks are irrigated by
Tungabhadra project, parts of
Devadurga, Lingsugur and Raichur
taluks are irrigated by the Upper
Krishna Project. Tube wells are also
important means of irrigation
wherever the canal water does not
reach (Table 6.2).
The reported net irrigated area is
193 thousand hectares, which is
about 42 per cent of the NSA, and
gross irrigated area is 238.3
thousand hectares. Source wise,
canals are the major sources
accounting for 87 per cent of NIA,
followed by bore wells which
Table 6.2: Source Wise Net Irrigated Area (NIA) in Raichur District, 2011-12 (% of NSA)
Taluk Canal Tanks Wells Tube Wells Lift Irrigation Total % of NSA
Devadurga 90.32 0.76 3.60 4.34 0.98 100.00 56.65
Lingsugur 76.30 0.12 4.66 16.60 2.32 100.00 22.66
Manvi 95.25 0.32 1.14 1.75 1.55 100.00 47.95
Raichur 66.63 3.91 15.71 6.28 7.47 100.00 27.74
Sindhnur 92.27 0.00 0.12 3.92 3.70 100.00 67.23
District 87.21 0.63 3.39 5.97 2.79 100.00 42.13
Source: DSO, 2012
account for 6 per cent of NIA. Wells,
Tanks and lift irrigation share a
very little proportion of NIA. Nearly
768 irrigation pump sets are in use
in the district. The data shows that
while Sindhnur is the most
irrigated taluk, Lingsugur and
Raichur are the least irrigated ones.
Further, Lingsugur also depends
upon tube wells to a greater extent,
Raichur depends on open wells.
Despite this fact, the irrigation
intensity is low at 123.52 per cent
and cropping intensity is also low
at 118.14 (Table 6.3).
Despite a high proportion of NSA
under food crops and larger
irrigation, the district produces
hardly 329.37 gms of food grains
per capita which is substantially
lower. Taluk wise Sindhnur
produces the highest food grain per
capita followed by Manvi and
Lingsugur. Raichur produces the
least food grains per capita. With a
huge area being fed by canals, the
future focus needs to be on more
efficient utilization of irrigation
water to get ‘more crop output per
drop’. This will also increase
employment options to the people.
More than
three-fourths of
the rural
population
depends on
agriculture,
which is largely
rainfed. Farmers
face challenges
like irregular
monsoon,
non-availability
of quality inputs,
lack of resources
and poor market
linkages. These
issues if
systematically
addressed
could help
farmers improve
their livelihoods,
breaking the
cycle of poverty.
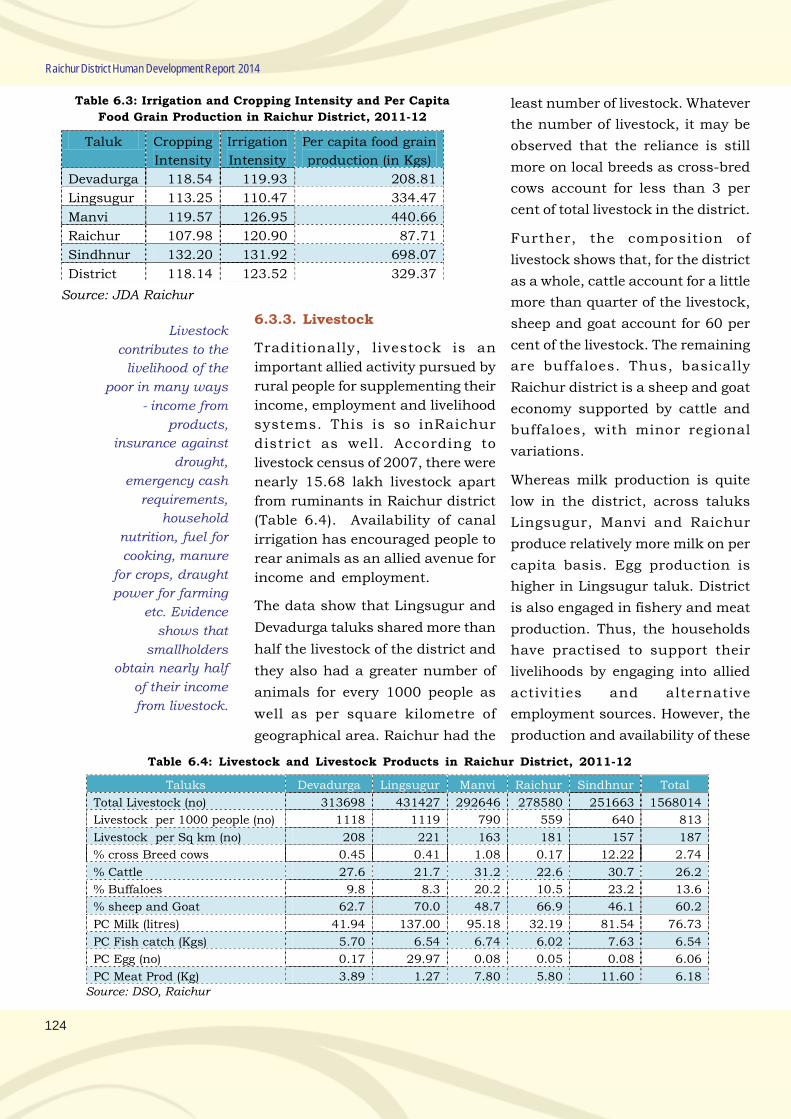
124
Raichur District Human Development Report 2014
Table 6.3: Irrigation and Cropping Intensity and Per Capita
Food Grain Production in Raichur District, 2011-12
Taluk Cropping
Intensity
Irrigation
Intensity
Per capita food grain
production (in Kgs)
Devadurga 118.54 119.93 208.81
Lingsugur 113.25 110.47 334.47
Manvi 119.57 126.95 440.66
Raichur 107.98 120.90 87.71
Sindhnur 132.20 131.92 698.07
District 118.14 123.52 329.37
Source: JDA Raichur
6.3.3. Livestock
Traditionally, livestock is an
important allied activity pursued by
rural people for supplementing their
income, employment and livelihood
systems. This is so inRaichur
district as well. According to
livestock census of 2007, there were
nearly 15.68 lakh livestock apart
from ruminants in Raichur district
(Table 6.4). Availability of canal
irrigation has encouraged people to
rear animals as an allied avenue for
income and employment.
The data show that Lingsugur and
Devadurga taluks shared more than
half the livestock of the district and
they also had a greater number of
animals for every 1000 people as
well as per square kilometre of
geographical area. Raichur had the
Table 6.4: Livestock and Livestock Products in Raichur District, 2011-12
Taluks Devadurga Lingsugur Manvi Raichur Sindhnur Total
Total Livestock (no) 313698 431427 292646 278580 251663 1568014
Livestock per 1000 people (no) 1118 1119 790 559 640 813
Livestock per Sq km (no) 208 221 163 181 157 187
% cross Breed cows 0.45 0.41 1.08 0.17 12.22 2.74
% Cattle 27.6 21.7 31.2 22.6 30.7 26.2
% Buffaloes 9.8 8.3 20.2 10.5 23.2 13.6
% sheep and Goat 62.7 70.0 48.7 66.9 46.1 60.2
PC Milk (litres) 41.94 137.00 95.18 32.19 81.54 76.73
PC Fish catch (Kgs) 5.70 6.54 6.74 6.02 7.63 6.54
PC Egg (no) 0.17 29.97 0.08 0.05 0.08 6.06
PC Meat Prod (Kg) 3.89 1.27 7.80 5.80 11.60 6.18
Source: DSO, Raichur
least number of livestock. Whatever
the number of livestock, it may be
observed that the reliance is still
more on local breeds as cross-bred
cows account for less than 3 per
cent of total livestock in the district.
Further, the composition of
livestock shows that, for the district
as a whole, cattle account for a little
more than quarter of the livestock,
sheep and goat account for 60 per
cent of the livestock. The remaining
are buffaloes. Thus, basically
Raichur district is a sheep and goat
economy supported by cattle and
buffaloes, with minor regional
variations.
Whereas milk production is quite
low in the district, across taluks
Lingsugur, Manvi and Raichur
produce relatively more milk on per
capita basis. Egg production is
higher in Lingsugur taluk. District
is also engaged in fishery and meat
production. Thus, the households
have practised to support their
livelihoods by engaging into allied
activities and alternative
employment sources. However, the
production and availability of these
Livestock
contributes to the
livelihood of the
poor in many ways
- income from
products,
insurance against
drought,
emergency cash
requirements,
household
nutrition, fuel for
cooking, manure
for crops, draught
power for farming
etc. Evidence
shows that
smallholders
obtain nearly half
of their income
from livestock.
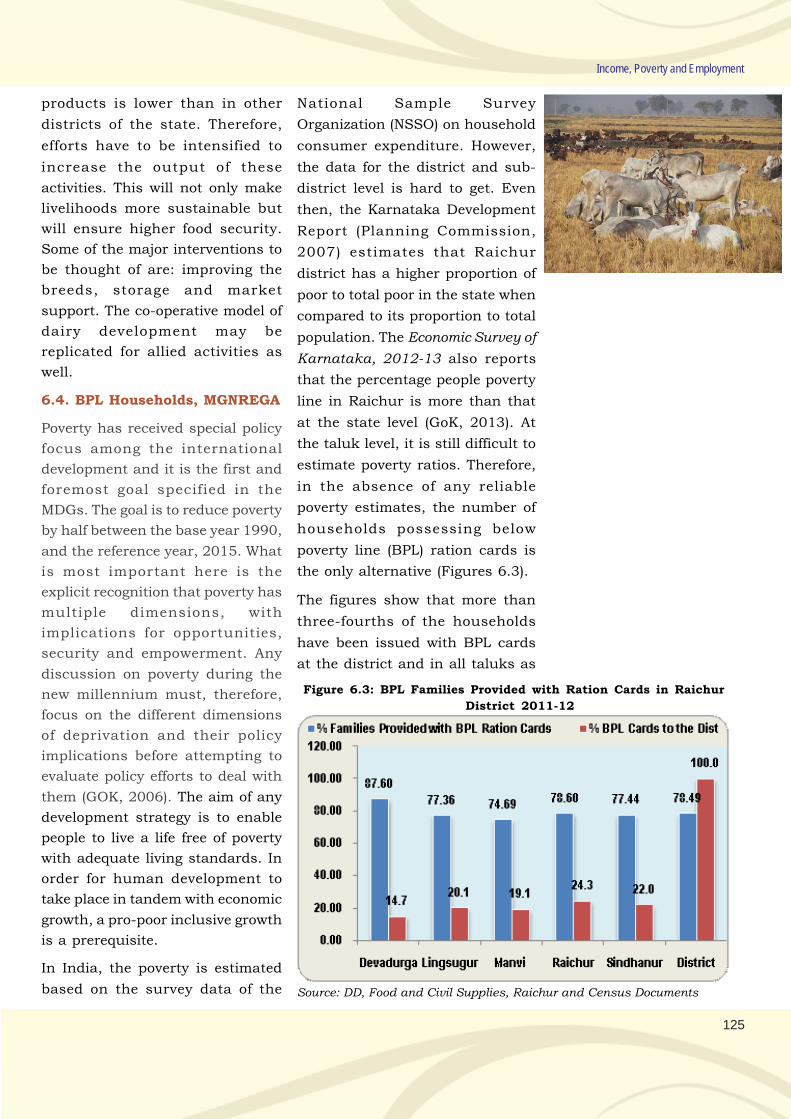
125
Income, Poverty and Employment
products is lower than in other
districts of the state. Therefore,
efforts have to be intensified to
increase the output of these
activities. This will not only make
livelihoods more sustainable but
will ensure higher food security.
Some of the major interventions to
be thought of are: improving the
breeds, storage and market
support. The co-operative model of
dairy development may be
replicated for allied activities as
well.
6.4. BPL Households, MGNREGA
Poverty has received special policy
focus among the international
development and it is the first and
foremost goal specified in the
MDGs. The goal is to reduce poverty
by half between the base year 1990,
and the reference year, 2015. What
is most important here is the
explicit recognition that poverty has
multiple dimensions, with
implications for opportunities,
security and empowerment. Any
discussion on poverty during the
new millennium must, therefore,
focus on the different dimensions
of deprivation and their policy
implications before attempting to
evaluate policy efforts to deal with
them (GOK, 2006). The aim of any
development strategy is to enable
people to live a life free of poverty
with adequate living standards. In
order for human development to
take place in tandem with economic
growth, a pro-poor inclusive growth
is a prerequisite.
In India, the poverty is estimated
based on the survey data of the
National Sample Survey
Organization (NSSO) on household
consumer expenditure. However,
the data for the district and sub-
district level is hard to get. Even
then, the Karnataka Development
Report (Planning Commission,
2007) estimates that Raichur
district has a higher proportion of
poor to total poor in the state when
compared to its proportion to total
population. The Economic Survey of
Karnataka, 2012-13 also reports
that the percentage people poverty
line in Raichur is more than that
at the state level (GoK, 2013). At
the taluk level, it is still difficult to
estimate poverty ratios. Therefore,
in the absence of any reliable
poverty estimates, the number of
households possessing below
poverty line (BPL) ration cards is
the only alternative (Figures 6.3).
The figures show that more than
three-fourths of the households
have been issued with BPL cards
at the district and in all taluks as
Figure 6.3: BPL Families Provided with Ration Cards in Raichur
District 2011-12
Source: DD, Food and Civil Supplies, Raichur and Census Documents
126
Raichur District Human Development Report 2014
well. In Devadurga taluk it is as high
as 88 per cent. Since the ration
card is an instrument for obtaining
subsidized food supplies and many
more benefits, every household
would possess it. Further, as the
BPL tag gets access to many more
benefits from government schemes,
every one attempts to get a BPL
ration card. There is also a tendency
to overstate the number of
households in a family for getting
multiple cards resulting in variation
in the number of card holding
households and the census
households. When we look into the
taluk wise distribution of BPL
households, Raichur accounts for
the maximum number of cards
while Devadurga for the minimum.
May be the there is an identification
failure as a result of which the
genuine poor are deprived of
benefits due to them.
6.4.1. Mahatma Gandhi National
Rural Employment Guarantee
Scheme (MGNREGS)
The MGNREGS is a job guarantee
scheme and is one of many other
government interventions to provide
livelihood opportunities. MGNREGS
has been playing a significant role
in increasing wages of unskilled
labourers. With land becoming
increasingly unable to support the
family’s requirements of food and
the cattle’s requirements for fodder,
land based livelihoods of small and
marginal farmers are fast becoming
unsustainable. Works under
MGNREGS are expected to result in
resource development thereby
contributing to increased
livelihood options in the rural
areas.
The scheme aims at providing 100
days of guaranteed employment to
rural unskilled labourers within
the vicinity of their habitations and
proposes to pay the minimum
wages, equally for both men and
women and provide other basic
amenities at the worksite like
toilets, drinking water and crèches.
The wages are to be paid through
the Bank or Post Office savings
account to avoid pilferages. The
component of expenditure on
machinery is also predetermined.
If the Gram Panchayat fails to
provide employment after an
individual registers and demands
employment, there is a provision
for paying unemployment
allowance. The present section
seeks to present briefly the progress
made by the district in
implementation of the MGNREGS.
The scheme has been in
implementation in Raichur district
since 2007-08. The relevant data
is presented in Table 6.5.
The data shows that 2,34,325
households (37.3 per cent of census
households) were issued job cards
by 31-3-2012. The percentage of SC
and ST households issued with job
cards was lower at 18.82 per cent
and 20.45 per cent, respectively.
But less than half of these
households (43 per cent),
demanded work and almost all of
them (99.9 per cent) were allotted
with work.
Highlights of MGNREGS in
Raichur District
• Job cards issued amounts
to 37.3 per cent of census
households and which is
comparable to the poverty
ratios. Hence poor
households were
adequately covered.
• The percentage of SC and
ST households possessing
job cards and participating
in work was also
comparable to their ratio
in district’s population at
18.82 per cent and 20.45
per cent, respectively.
• Half of the job card
holders demanded
employment and all were
provided with jobs
• In Lingsugur and
Devdurga, the number of
mandays worked is higher.
These taluks being less
irrigated regions also
justifies greater work in
these taluks
• Nearly half of the
persondays worked were
by women, which is also
representative to their
share in population
• However, the vast scope is
evident in the persistence
of migration and very few
households reaching the
100 days employment
mark.
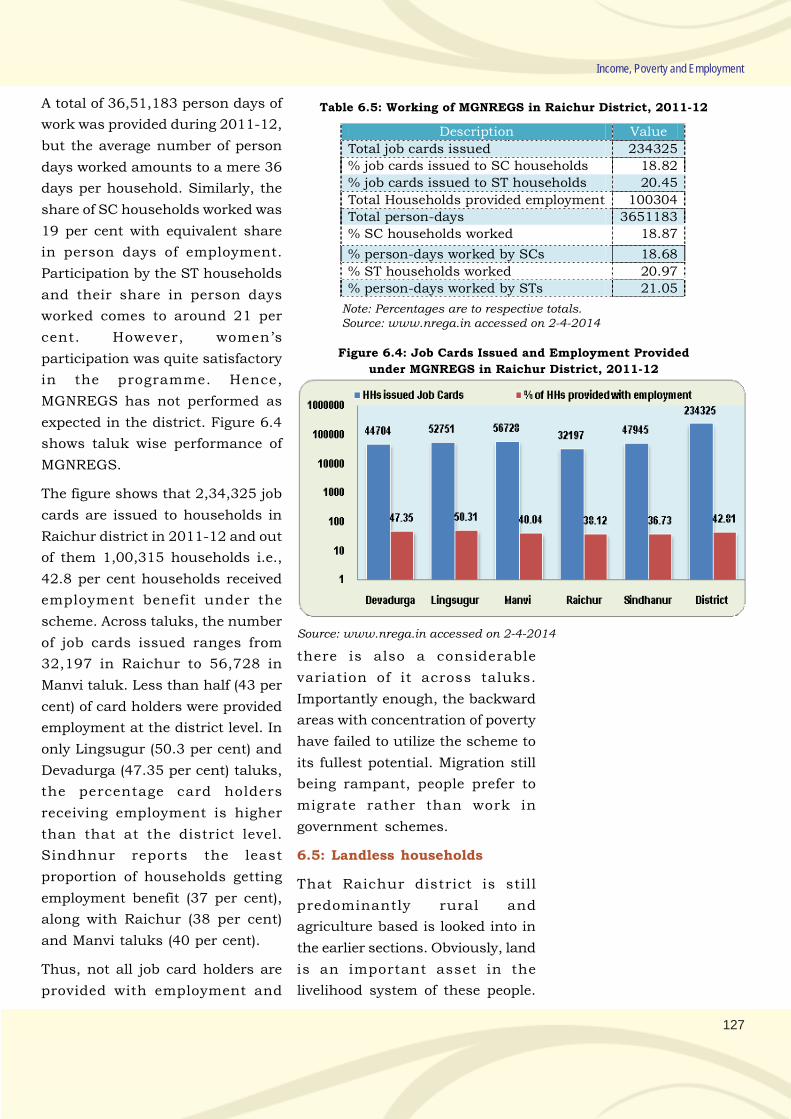
127
Income, Poverty and Employment
Table 6.5: Working of MGNREGS in Raichur District, 2011-12
Description Value
Total job cards issued 234325
% job cards issued to SC households 18.82
% job cards issued to ST households 20.45
Total Households provided employment 100304
Total person-days 3651183
% SC households worked 18.87
% person-days worked by SCs 18.68
% ST households worked 20.97
% person-days worked by STs 21.05
Note: Percentages are to respective totals.Source: www.nrega.in accessed on 2-4-2014
A total of 36,51,183 person days of
work was provided during 2011-12,
but the average number of person
days worked amounts to a mere 36
days per household. Similarly, the
share of SC households worked was
19 per cent with equivalent share
in person days of employment.
Participation by the ST households
and their share in person days
worked comes to around 21 per
cent. However, women’s
participation was quite satisfactory
in the programme. Hence,
MGNREGS has not performed as
expected in the district. Figure 6.4
shows taluk wise performance of
MGNREGS.
The figure shows that 2,34,325 job
cards are issued to households in
Raichur district in 2011-12 and out
of them 1,00,315 households i.e.,
42.8 per cent households received
employment benefit under the
scheme. Across taluks, the number
of job cards issued ranges from
32,197 in Raichur to 56,728 in
Manvi taluk. Less than half (43 per
cent) of card holders were provided
employment at the district level. In
only Lingsugur (50.3 per cent) and
Devadurga (47.35 per cent) taluks,
the percentage card holders
receiving employment is higher
than that at the district level.
Sindhnur reports the least
proportion of households getting
employment benefit (37 per cent),
along with Raichur (38 per cent)
and Manvi taluks (40 per cent).
Thus, not all job card holders are
provided with employment and
Figure 6.4: Job Cards Issued and Employment Provided
under MGNREGS in Raichur District, 2011-12
Source: www.nrega.in accessed on 2-4-2014
there is also a considerable
variation of it across taluks.
Importantly enough, the backward
areas with concentration of poverty
have failed to utilize the scheme to
its fullest potential. Migration still
being rampant, people prefer to
migrate rather than work in
government schemes.
6.5: Landless households
That Raichur district is still
predominantly rural and
agriculture based is looked into in
the earlier sections. Obviously, land
is an important asset in the
livelihood system of these people.
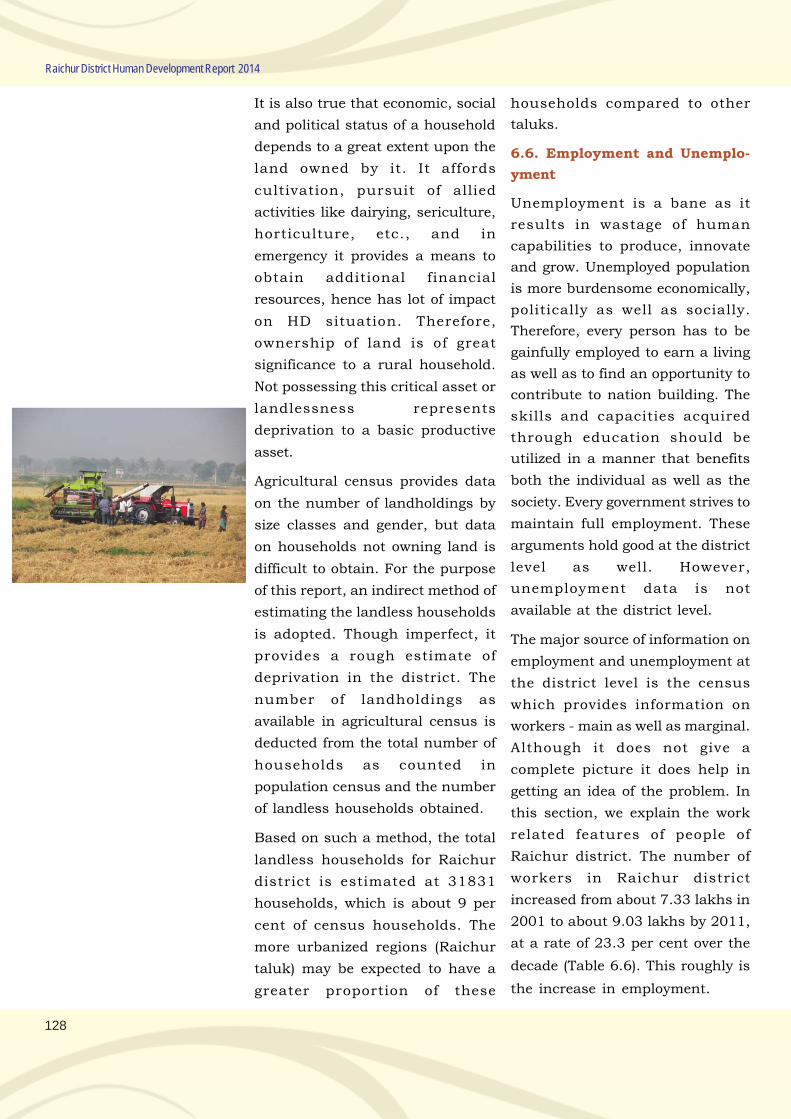
128
Raichur District Human Development Report 2014
It is also true that economic, social
and political status of a household
depends to a great extent upon the
land owned by it. It affords
cultivation, pursuit of allied
activities like dairying, sericulture,
horticulture, etc., and in
emergency it provides a means to
obtain additional financial
resources, hence has lot of impact
on HD situation. Therefore,
ownership of land is of great
significance to a rural household.
Not possessing this critical asset or
landlessness represents
deprivation to a basic productive
asset.
Agricultural census provides data
on the number of landholdings by
size classes and gender, but data
on households not owning land is
difficult to obtain. For the purpose
of this report, an indirect method of
estimating the landless households
is adopted. Though imperfect, it
provides a rough estimate of
deprivation in the district. The
number of landholdings as
available in agricultural census is
deducted from the total number of
households as counted in
population census and the number
of landless households obtained.
Based on such a method, the total
landless households for Raichur
district is estimated at 31831
households, which is about 9 per
cent of census households. The
more urbanized regions (Raichur
taluk) may be expected to have a
greater proportion of these
households compared to other
taluks.
6.6. Employment and Unemplo-
yment
Unemployment is a bane as it
results in wastage of human
capabilities to produce, innovate
and grow. Unemployed population
is more burdensome economically,
politically as well as socially.
Therefore, every person has to be
gainfully employed to earn a living
as well as to find an opportunity to
contribute to nation building. The
skills and capacities acquired
through education should be
utilized in a manner that benefits
both the individual as well as the
society. Every government strives to
maintain full employment. These
arguments hold good at the district
level as well. However,
unemployment data is not
available at the district level.
The major source of information on
employment and unemployment at
the district level is the census
which provides information on
workers - main as well as marginal.
Although it does not give a
complete picture it does help in
getting an idea of the problem. In
this section, we explain the work
related features of people of
Raichur district. The number of
workers in Raichur district
increased from about 7.33 lakhs in
2001 to about 9.03 lakhs by 2011,
at a rate of 23.3 per cent over the
decade (Table 6.6). This roughly is
the increase in employment.
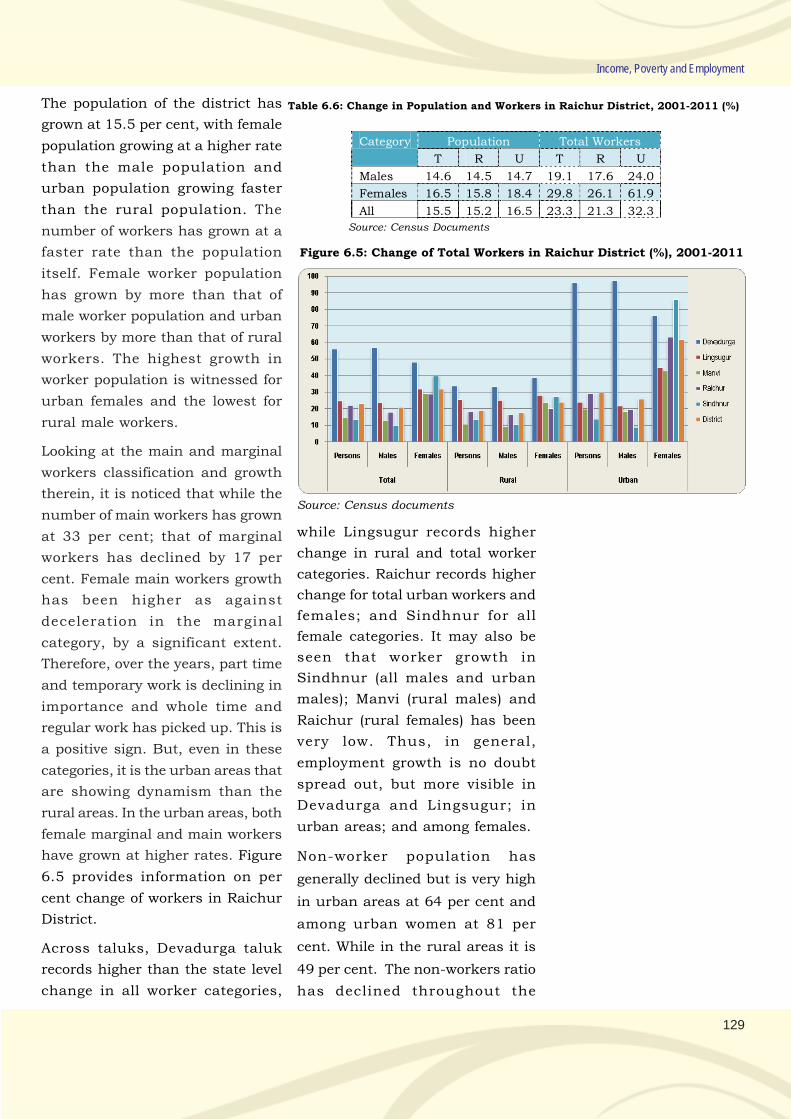
129
Income, Poverty and Employment
Table 6.6: Change in Population and Workers in Raichur District, 2001-2011 (%)
Category Population Total Workers
T R U T R U
Males 14.6 14.5 14.7 19.1 17.6 24.0
Females 16.5 15.8 18.4 29.8 26.1 61.9
All 15.5 15.2 16.5 23.3 21.3 32.3
Source: Census Documents
The population of the district has
grown at 15.5 per cent, with female
population growing at a higher rate
than the male population and
urban population growing faster
than the rural population. The
number of workers has grown at a
faster rate than the population
itself. Female worker population
has grown by more than that of
male worker population and urban
workers by more than that of rural
workers. The highest growth in
worker population is witnessed for
urban females and the lowest for
rural male workers.
Looking at the main and marginal
workers classification and growth
therein, it is noticed that while the
number of main workers has grown
at 33 per cent; that of marginal
workers has declined by 17 per
cent. Female main workers growth
has been higher as against
deceleration in the marginal
category, by a significant extent.
Therefore, over the years, part time
and temporary work is declining in
importance and whole time and
regular work has picked up. This is
a positive sign. But, even in these
categories, it is the urban areas that
are showing dynamism than the
rural areas. In the urban areas, both
female marginal and main workers
have grown at higher rates. Figure
6.5 provides information on per
cent change of workers in Raichur
District.
Across taluks, Devadurga taluk
records higher than the state level
change in all worker categories,
Figure 6.5: Change of Total Workers in Raichur District (%), 2001-2011
Source: Census documents
while Lingsugur records higher
change in rural and total worker
categories. Raichur records higher
change for total urban workers and
females; and Sindhnur for all
female categories. It may also be
seen that worker growth in
Sindhnur (all males and urban
males); Manvi (rural males) and
Raichur (rural females) has been
very low. Thus, in general,
employment growth is no doubt
spread out, but more visible in
Devadurga and Lingsugur; in
urban areas; and among females.
Non-worker population has
generally declined but is very high
in urban areas at 64 per cent and
among urban women at 81 per
cent. While in the rural areas it is
49 per cent. The non-workers ratio
has declined throughout the
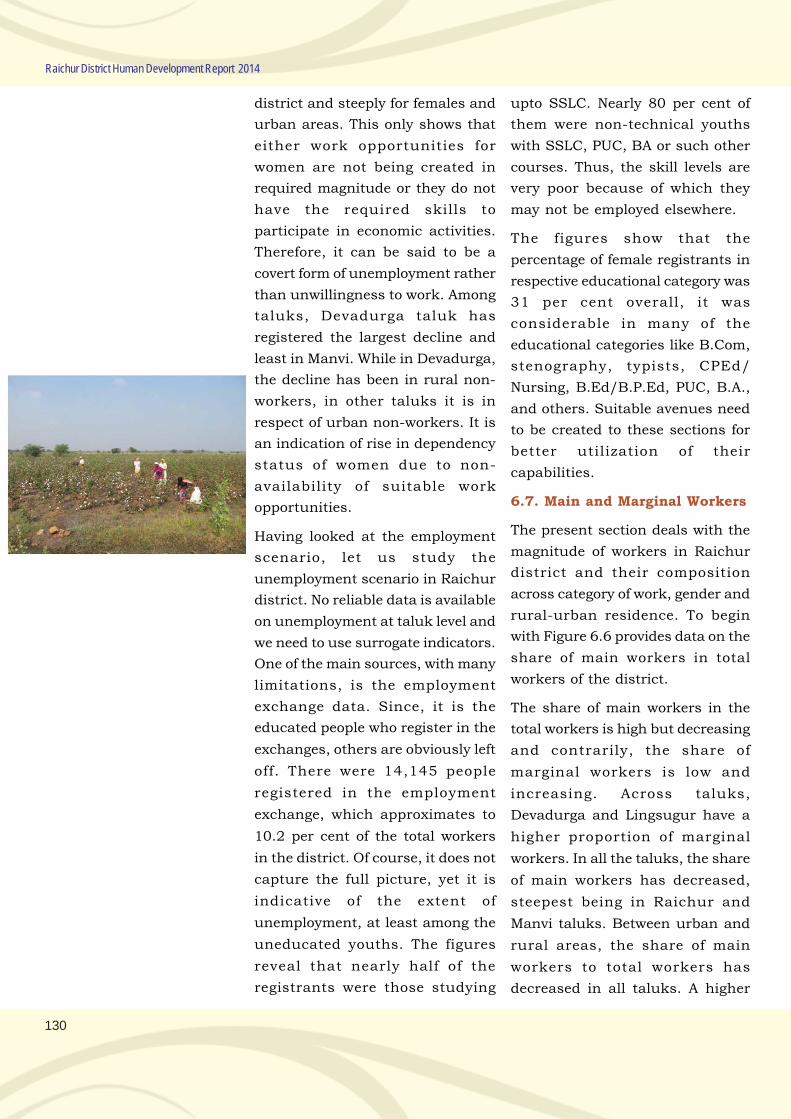
130
Raichur District Human Development Report 2014
district and steeply for females and
urban areas. This only shows that
either work opportunities for
women are not being created in
required magnitude or they do not
have the required skills to
participate in economic activities.
Therefore, it can be said to be a
covert form of unemployment rather
than unwillingness to work. Among
taluks, Devadurga taluk has
registered the largest decline and
least in Manvi. While in Devadurga,
the decline has been in rural non-
workers, in other taluks it is in
respect of urban non-workers. It is
an indication of rise in dependency
status of women due to non-
availability of suitable work
opportunities.
Having looked at the employment
scenario, let us study the
unemployment scenario in Raichur
district. No reliable data is available
on unemployment at taluk level and
we need to use surrogate indicators.
One of the main sources, with many
limitations, is the employment
exchange data. Since, it is the
educated people who register in the
exchanges, others are obviously left
off. There were 14,145 people
registered in the employment
exchange, which approximates to
10.2 per cent of the total workers
in the district. Of course, it does not
capture the full picture, yet it is
indicative of the extent of
unemployment, at least among the
uneducated youths. The figures
reveal that nearly half of the
registrants were those studying
upto SSLC. Nearly 80 per cent of
them were non-technical youths
with SSLC, PUC, BA or such other
courses. Thus, the skill levels are
very poor because of which they
may not be employed elsewhere.
The figures show that the
percentage of female registrants in
respective educational category was
31 per cent overall, it was
considerable in many of the
educational categories like B.Com,
stenography, typists, CPEd/
Nursing, B.Ed/B.P.Ed, PUC, B.A.,
and others. Suitable avenues need
to be created to these sections for
better utilization of their
capabilities.
6.7. Main and Marginal Workers
The present section deals with the
magnitude of workers in Raichur
district and their composition
across category of work, gender and
rural-urban residence. To begin
with Figure 6.6 provides data on the
share of main workers in total
workers of the district.
The share of main workers in the
total workers is high but decreasing
and contrarily, the share of
marginal workers is low and
increasing. Across taluks,
Devadurga and Lingsugur have a
higher proportion of marginal
workers. In all the taluks, the share
of main workers has decreased,
steepest being in Raichur and
Manvi taluks. Between urban and
rural areas, the share of main
workers to total workers has
decreased in all taluks. A higher
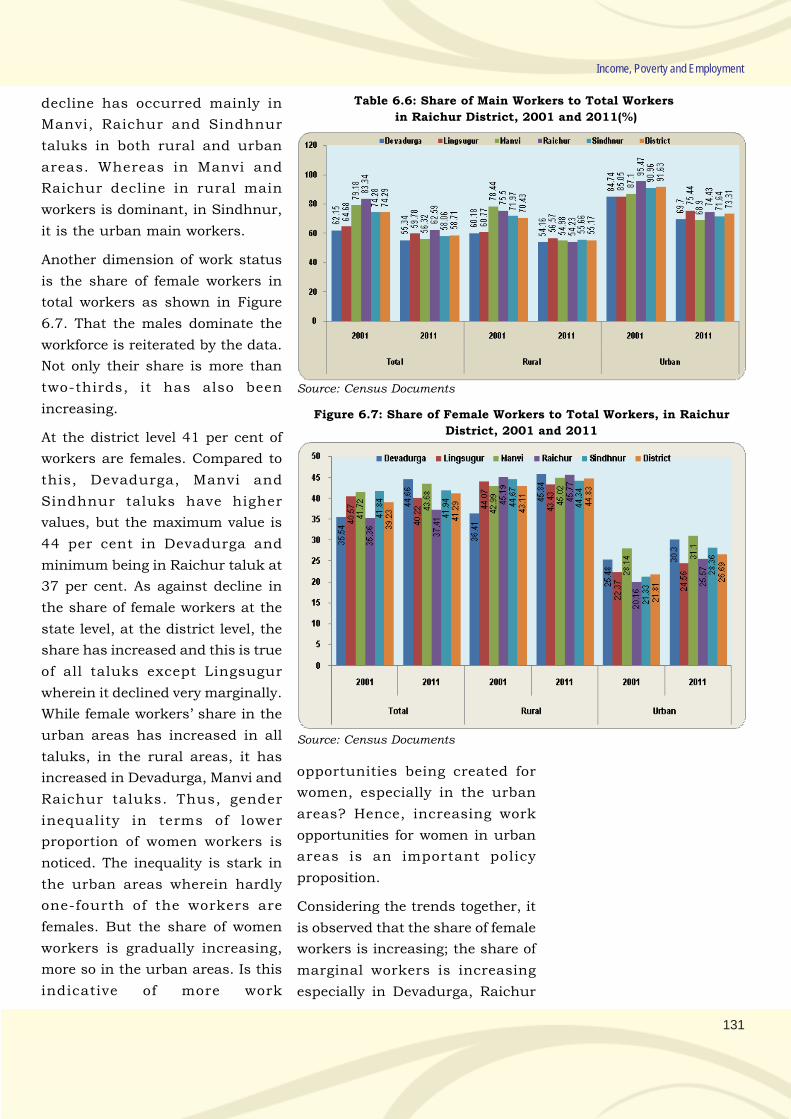
131
Income, Poverty and Employment
decline has occurred mainly in
Manvi, Raichur and Sindhnur
taluks in both rural and urban
areas. Whereas in Manvi and
Raichur decline in rural main
workers is dominant, in Sindhnur,
it is the urban main workers.
Another dimension of work status
is the share of female workers in
total workers as shown in Figure
6.7. That the males dominate the
workforce is reiterated by the data.
Not only their share is more than
two-thirds, it has also been
increasing.
At the district level 41 per cent of
workers are females. Compared to
this, Devadurga, Manvi and
Sindhnur taluks have higher
values, but the maximum value is
44 per cent in Devadurga and
minimum being in Raichur taluk at
37 per cent. As against decline in
the share of female workers at the
state level, at the district level, the
share has increased and this is true
of all taluks except Lingsugur
wherein it declined very marginally.
While female workers’ share in the
urban areas has increased in all
taluks, in the rural areas, it has
increased in Devadurga, Manvi and
Raichur taluks. Thus, gender
inequality in terms of lower
proportion of women workers is
noticed. The inequality is stark in
the urban areas wherein hardly
one-fourth of the workers are
females. But the share of women
workers is gradually increasing,
more so in the urban areas. Is this
indicative of more work
Table 6.6: Share of Main Workers to Total Workers
in Raichur District, 2001 and 2011(%)
Source: Census Documents
Figure 6.7: Share of Female Workers to Total Workers, in Raichur
District, 2001 and 2011
Source: Census Documents
opportunities being created for
women, especially in the urban
areas? Hence, increasing work
opportunities for women in urban
areas is an important policy
proposition.
Considering the trends together, it
is observed that the share of female
workers is increasing; the share of
marginal workers is increasing
especially in Devadurga, Raichur
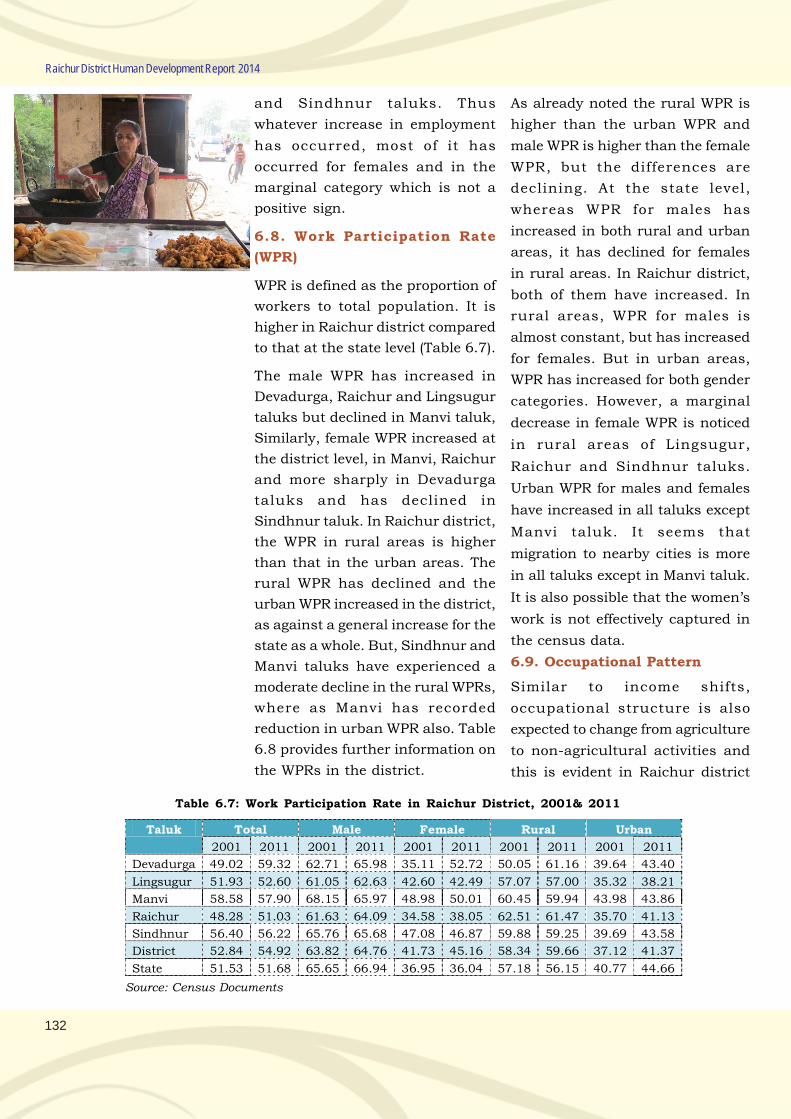
132
Raichur District Human Development Report 2014
and Sindhnur taluks. Thus
whatever increase in employment
has occurred, most of it has
occurred for females and in the
marginal category which is not a
positive sign.
6.8. Work Participation Rate
(WPR)
WPR is defined as the proportion of
workers to total population. It is
higher in Raichur district compared
to that at the state level (Table 6.7).
The male WPR has increased in
Devadurga, Raichur and Lingsugur
taluks but declined in Manvi taluk,
Similarly, female WPR increased at
the district level, in Manvi, Raichur
and more sharply in Devadurga
taluks and has declined in
Sindhnur taluk. In Raichur district,
the WPR in rural areas is higher
than that in the urban areas. The
rural WPR has declined and the
urban WPR increased in the district,
as against a general increase for the
state as a whole. But, Sindhnur and
Manvi taluks have experienced a
moderate decline in the rural WPRs,
where as Manvi has recorded
reduction in urban WPR also. Table
6.8 provides further information on
the WPRs in the district.
Table 6.7: Work Participation Rate in Raichur District, 2001& 2011
Taluk Total Male Female Rural Urban
2001 2011 2001 2011 2001 2011 2001 2011 2001 2011
Devadurga 49.02 59.32 62.71 65.98 35.11 52.72 50.05 61.16 39.64 43.40
Lingsugur 51.93 52.60 61.05 62.63 42.60 42.49 57.07 57.00 35.32 38.21
Manvi 58.58 57.90 68.15 65.97 48.98 50.01 60.45 59.94 43.98 43.86
Raichur 48.28 51.03 61.63 64.09 34.58 38.05 62.51 61.47 35.70 41.13
Sindhnur 56.40 56.22 65.76 65.68 47.08 46.87 59.88 59.25 39.69 43.58
District 52.84 54.92 63.82 64.76 41.73 45.16 58.34 59.66 37.12 41.37
State 51.53 51.68 65.65 66.94 36.95 36.04 57.18 56.15 40.77 44.66
Source: Census Documents
As already noted the rural WPR is
higher than the urban WPR and
male WPR is higher than the female
WPR, but the differences are
declining. At the state level,
whereas WPR for males has
increased in both rural and urban
areas, it has declined for females
in rural areas. In Raichur district,
both of them have increased. In
rural areas, WPR for males is
almost constant, but has increased
for females. But in urban areas,
WPR has increased for both gender
categories. However, a marginal
decrease in female WPR is noticed
in rural areas of Lingsugur,
Raichur and Sindhnur taluks.
Urban WPR for males and females
have increased in all taluks except
Manvi taluk. It seems that
migration to nearby cities is more
in all taluks except in Manvi taluk.
It is also possible that the women’s
work is not effectively captured in
the census data.
6.9. Occupational Pattern
Similar to income shifts,
occupational structure is also
expected to change from agriculture
to non-agricultural activities and
this is evident in Raichur district
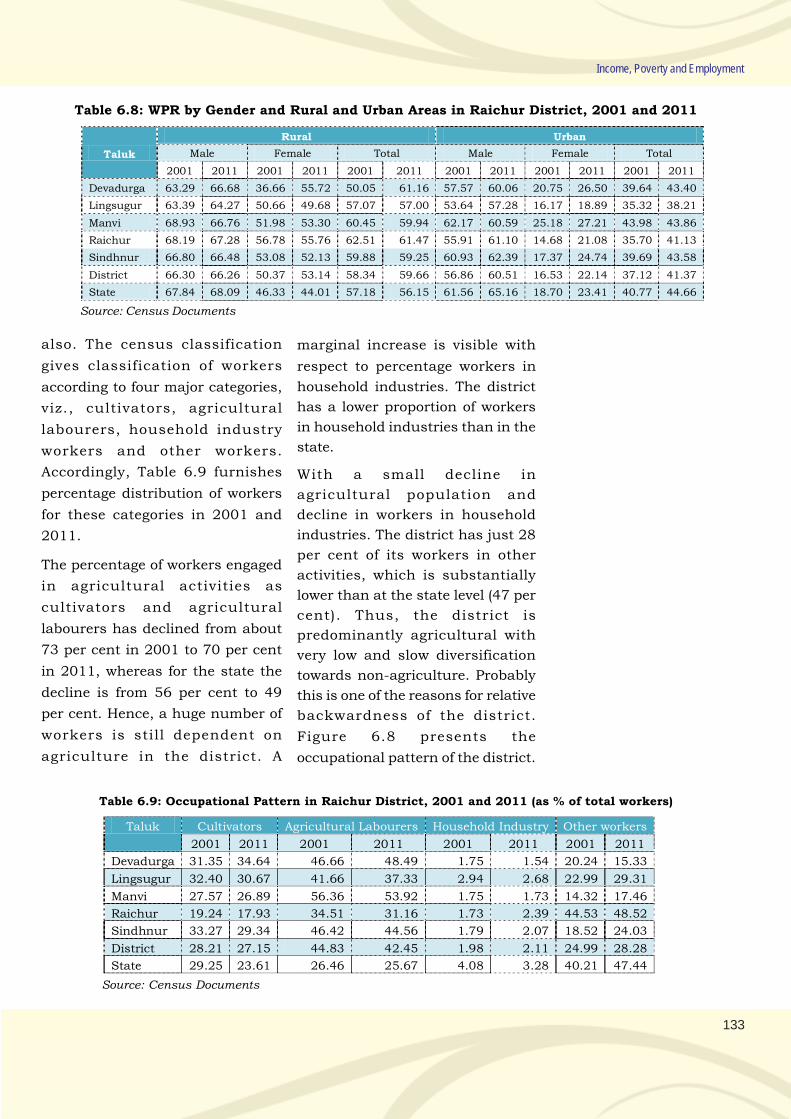
133
Income, Poverty and Employment
Table 6.8: WPR by Gender and Rural and Urban Areas in Raichur District, 2001 and 2011
Taluk
Rural Urban
Male Female Total Male Female Total
2001 2011 2001 2011 2001 2011 2001 2011 2001 2011 2001 2011
Devadurga 63.29 66.68 36.66 55.72 50.05 61.16 57.57 60.06 20.75 26.50 39.64 43.40
Lingsugur 63.39 64.27 50.66 49.68 57.07 57.00 53.64 57.28 16.17 18.89 35.32 38.21
Manvi 68.93 66.76 51.98 53.30 60.45 59.94 62.17 60.59 25.18 27.21 43.98 43.86
Raichur 68.19 67.28 56.78 55.76 62.51 61.47 55.91 61.10 14.68 21.08 35.70 41.13
Sindhnur 66.80 66.48 53.08 52.13 59.88 59.25 60.93 62.39 17.37 24.74 39.69 43.58
District 66.30 66.26 50.37 53.14 58.34 59.66 56.86 60.51 16.53 22.14 37.12 41.37
State 67.84 68.09 46.33 44.01 57.18 56.15 61.56 65.16 18.70 23.41 40.77 44.66
Source: Census Documents
also. The census classification
gives classification of workers
according to four major categories,
viz., cultivators, agricultural
labourers, household industry
workers and other workers.
Accordingly, Table 6.9 furnishes
percentage distribution of workers
for these categories in 2001 and
2011.
The percentage of workers engaged
in agricultural activities as
cultivators and agricultural
labourers has declined from about
73 per cent in 2001 to 70 per cent
in 2011, whereas for the state the
decline is from 56 per cent to 49
per cent. Hence, a huge number of
workers is still dependent on
agriculture in the district. A
Table 6.9: Occupational Pattern in Raichur District, 2001 and 2011 (as % of total workers)
Taluk Cultivators Agricultural Labourers Household Industry Other workers
2001 2011 2001 2011 2001 2011 2001 2011
Devadurga 31.35 34.64 46.66 48.49 1.75 1.54 20.24 15.33
Lingsugur 32.40 30.67 41.66 37.33 2.94 2.68 22.99 29.31
Manvi 27.57 26.89 56.36 53.92 1.75 1.73 14.32 17.46
Raichur 19.24 17.93 34.51 31.16 1.73 2.39 44.53 48.52
Sindhnur 33.27 29.34 46.42 44.56 1.79 2.07 18.52 24.03
District 28.21 27.15 44.83 42.45 1.98 2.11 24.99 28.28
State 29.25 23.61 26.46 25.67 4.08 3.28 40.21 47.44
Source: Census Documents
marginal increase is visible with
respect to percentage workers in
household industries. The district
has a lower proportion of workers
in household industries than in the
state.
With a small decline in
agricultural population and
decline in workers in household
industries. The district has just 28
per cent of its workers in other
activities, which is substantially
lower than at the state level (47 per
cent). Thus, the district is
predominantly agricultural with
very low and slow diversification
towards non-agriculture. Probably
this is one of the reasons for relative
backwardness of the district.
Figure 6.8 presents the
occupational pattern of the district.
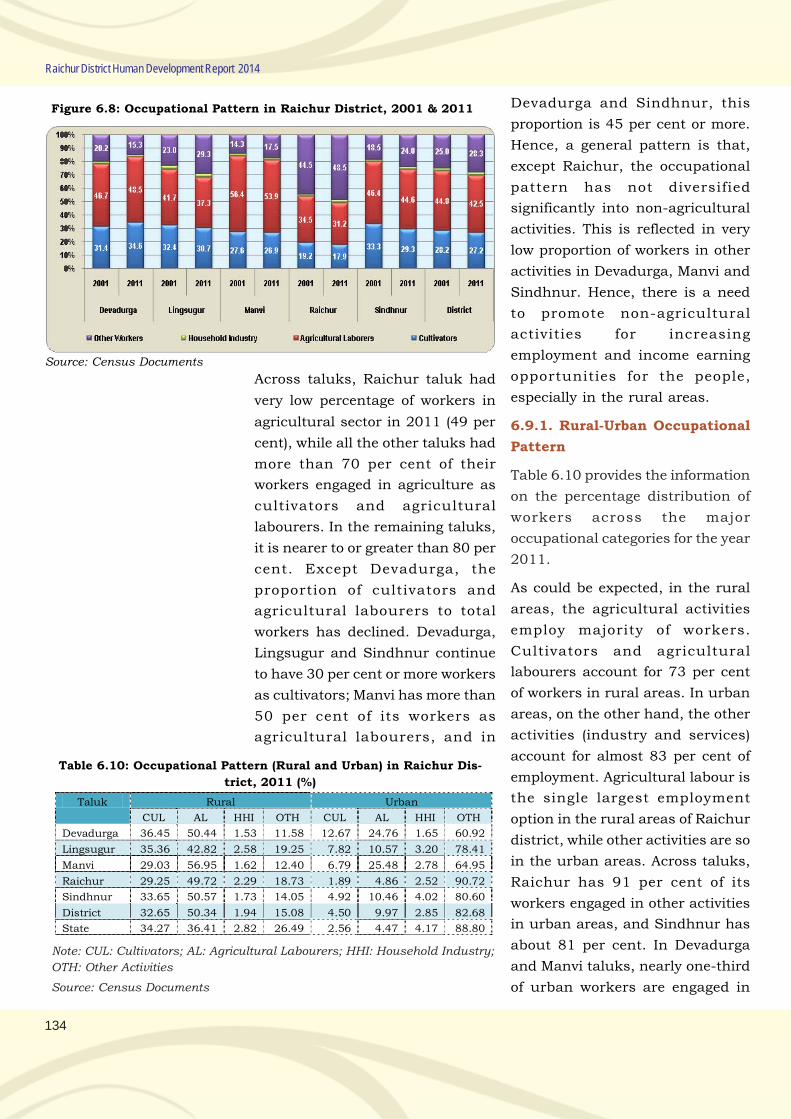
134
Raichur District Human Development Report 2014
Figure 6.8: Occupational Pattern in Raichur District, 2001 & 2011
Source: Census Documents
Across taluks, Raichur taluk had
very low percentage of workers in
agricultural sector in 2011 (49 per
cent), while all the other taluks had
more than 70 per cent of their
workers engaged in agriculture as
cultivators and agricultural
labourers. In the remaining taluks,
it is nearer to or greater than 80 per
cent. Except Devadurga, the
proportion of cultivators and
agricultural labourers to total
workers has declined. Devadurga,
Lingsugur and Sindhnur continue
to have 30 per cent or more workers
as cultivators; Manvi has more than
50 per cent of its workers as
agricultural labourers, and in
Devadurga and Sindhnur, this
proportion is 45 per cent or more.
Hence, a general pattern is that,
except Raichur, the occupational
pattern has not diversified
significantly into non-agricultural
activities. This is reflected in very
low proportion of workers in other
activities in Devadurga, Manvi and
Sindhnur. Hence, there is a need
to promote non-agricultural
activities for increasing
employment and income earning
opportunities for the people,
especially in the rural areas.
6.9.1. Rural-Urban Occupational
Pattern
Table 6.10 provides the information
on the percentage distribution of
workers across the major
occupational categories for the year
2011.
As could be expected, in the rural
areas, the agricultural activities
employ majority of workers.
Cultivators and agricultural
labourers account for 73 per cent
of workers in rural areas. In urban
areas, on the other hand, the other
activities (industry and services)
account for almost 83 per cent of
employment. Agricultural labour is
the single largest employment
option in the rural areas of Raichur
district, while other activities are so
in the urban areas. Across taluks,
Raichur has 91 per cent of its
workers engaged in other activities
in urban areas, and Sindhnur has
about 81 per cent. In Devadurga
and Manvi taluks, nearly one-third
of urban workers are engaged in
Table 6.10: Occupational Pattern (Rural and Urban) in Raichur Dis-
trict, 2011 (%)
Taluk Rural Urban
CUL AL HHI OTH CUL AL HHI OTH
Devadurga 36.45 50.44 1.53 11.58 12.67 24.76 1.65 60.92
Lingsugur 35.36 42.82 2.58 19.25 7.82 10.57 3.20 78.41
Manvi 29.03 56.95 1.62 12.40 6.79 25.48 2.78 64.95
Raichur 29.25 49.72 2.29 18.73 1.89 4.86 2.52 90.72
Sindhnur 33.65 50.57 1.73 14.05 4.92 10.46 4.02 80.60
District 32.65 50.34 1.94 15.08 4.50 9.97 2.85 82.68
State 34.27 36.41 2.82 26.49 2.56 4.47 4.17 88.80
Note: CUL: Cultivators; AL: Agricultural Labourers; HHI: Household Industry;
OTH: Other Activities
Source: Census Documents
135
Income, Poverty and Employment
agricultural activities. Thus, the
underdevelopment has spilled over
from the rural to urban areas in
these taluks. Household industry is
significant in urban Sindhnur and
Lingsugur. Hence, promotion of
non-agricultural work opportunities
should be priority of the policy
makers.
Salient features of occupational
shifts of Raichur district are:
• The occupational pattern is still
dominated by agricultural sector
• The shares of cultivators and
agricultural labourers are still
high and have declined in all
taluks except Devadurga;
• The share of household workers
too has declined in all taluks.
• The share of other workers has
increased very slowly at the
district level. But Sindhnur,
Raichur and Lingsugur taluks
have witnessed notable increases
in their employment in other
sectors.
Since agriculture is a low productive
and slow-growth sector, excessive
dependence on it will lead to slow
overall growth. Therefore, policy
should be to promote non-farm
activities in all the taluks and
making agriculture more
employment generating.
6.10. Child Labour
Child labour refers to those
labourers who are working in
hazardous or non-hazardous
occupations in the age group of 5-
14 years. It is common to find
children working in all sorts of
occupations, especially hotels,
automobile sheds, agriculture and
other informal activities. It is a
manifestation of household
poverty, which is exploited by
employers who do not pay adult
wages. It is violation of child as well
as human rights. It stunts the
development of the child during
his/her crucial learning years and
leads to irreparable physical and
psychological damage, impairing
for life, his/her opportunities for
social and economic mobility. Child
labour also creates a vicious cycle
of illiteracy and low income, while
simultaneously depriving adults of
employment and higher wages. The
prevalence of child labour also
deprives the society of an educated,
skilled and productive workforce
which could form the basis of rapid
economic growth. That is why child
labour is banned in all societies. As
a result although children are hired
as laborers, it is usually not
revealed and hence reliable
estimates of it are not available. Of
course, Census 2001 provided the
worker details by age categories,
through which we could gauge the
extent of child labour. Similar
results for Census 2011 are not yet
published. Hence, other sources
have to be relied upon for studying
the incidence of the problem.
Poverty and assetlessness being
high in Raichur, poor households
perceive their children to be assets
for supplementing the income of the
household. Either they are sent to
Since agriculture is
a low productive
and slow-growth
sector, excessive
dependence on it
will lead to slow
overall growth.
Therefore, policy
should be to
promote
non-farm
activities in all the
taluks and
making agriculture
more employment
generating.
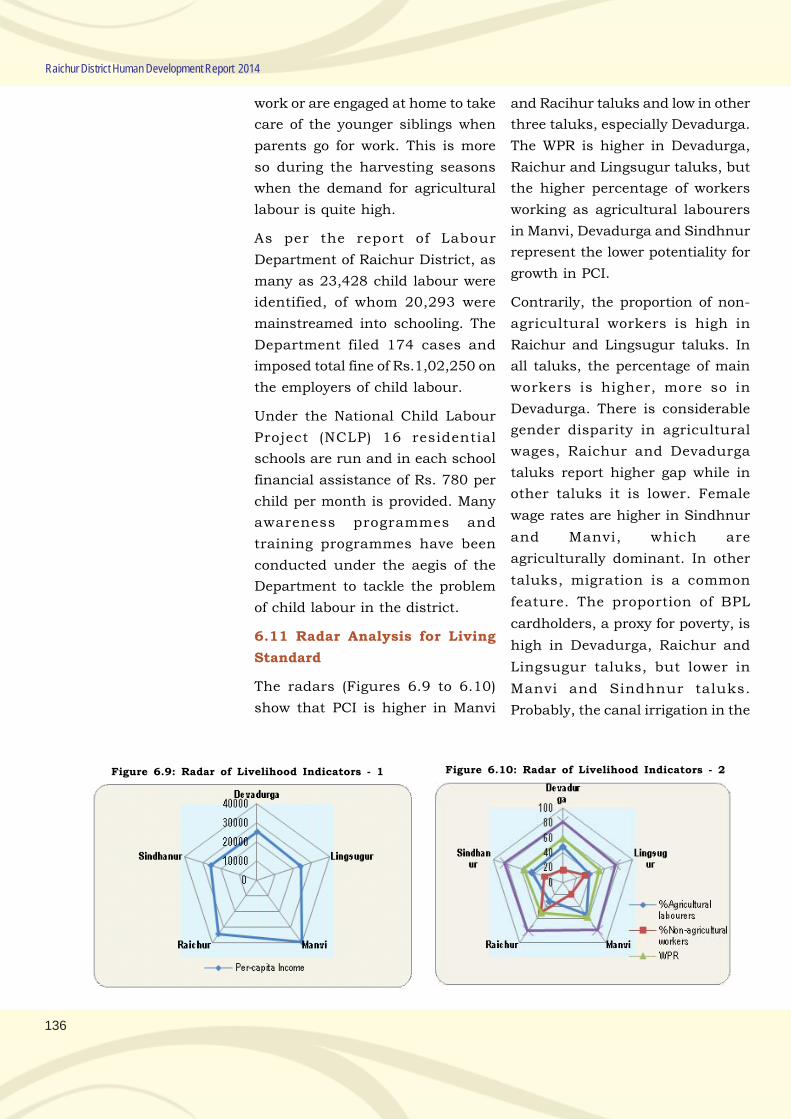
136
Raichur District Human Development Report 2014
work or are engaged at home to take
care of the younger siblings when
parents go for work. This is more
so during the harvesting seasons
when the demand for agricultural
labour is quite high.
As per the report of Labour
Department of Raichur District, as
many as 23,428 child labour were
identified, of whom 20,293 were
mainstreamed into schooling. The
Department filed 174 cases and
imposed total fine of Rs.1,02,250 on
the employers of child labour.
Under the National Child Labour
Project (NCLP) 16 residential
schools are run and in each school
financial assistance of Rs. 780 per
child per month is provided. Many
awareness programmes and
training programmes have been
conducted under the aegis of the
Department to tackle the problem
of child labour in the district.
6.11 Radar Analysis for Living
Standard
The radars (Figures 6.9 to 6.10)
show that PCI is higher in Manvi
and Racihur taluks and low in other
three taluks, especially Devadurga.
The WPR is higher in Devadurga,
Raichur and Lingsugur taluks, but
the higher percentage of workers
working as agricultural labourers
in Manvi, Devadurga and Sindhnur
represent the lower potentiality for
growth in PCI.
Contrarily, the proportion of non-
agricultural workers is high in
Raichur and Lingsugur taluks. In
all taluks, the percentage of main
workers is higher, more so in
Devadurga. There is considerable
gender disparity in agricultural
wages, Raichur and Devadurga
taluks report higher gap while in
other taluks it is lower. Female
wage rates are higher in Sindhnur
and Manvi, which are
agriculturally dominant. In other
taluks, migration is a common
feature. The proportion of BPL
cardholders, a proxy for poverty, is
high in Devadurga, Raichur and
Lingsugur taluks, but lower in
Manvi and Sindhnur taluks.
Probably, the canal irrigation in the
Figure 6.9: Radar of Livelihood Indicators - 1 Figure 6.10: Radar of Livelihood Indicators - 2
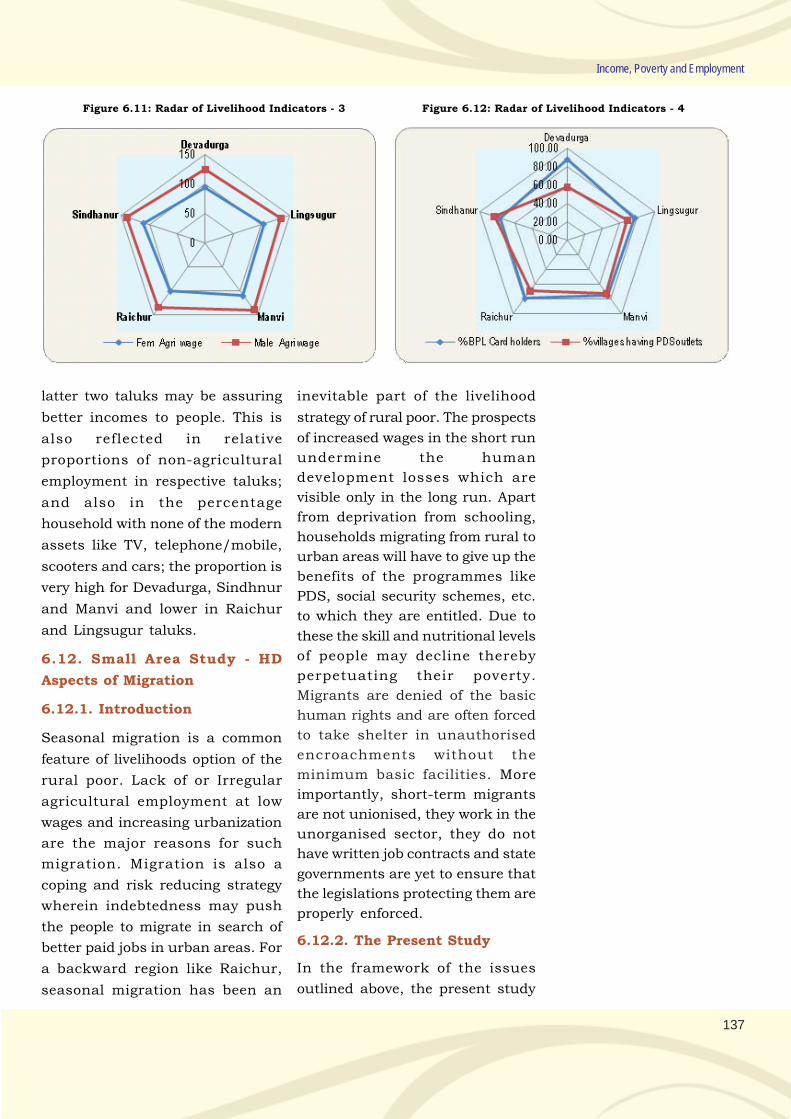
137
Income, Poverty and Employment
latter two taluks may be assuring
better incomes to people. This is
also reflected in relative
proportions of non-agricultural
employment in respective taluks;
and also in the percentage
household with none of the modern
assets like TV, telephone/mobile,
scooters and cars; the proportion is
very high for Devadurga, Sindhnur
and Manvi and lower in Raichur
and Lingsugur taluks.
6.12. Small Area Study - HD
Aspects of Migration
6.12.1. Introduction
Seasonal migration is a common
feature of livelihoods option of the
rural poor. Lack of or Irregular
agricultural employment at low
wages and increasing urbanization
are the major reasons for such
migration. Migration is also a
coping and risk reducing strategy
wherein indebtedness may push
the people to migrate in search of
better paid jobs in urban areas. For
a backward region like Raichur,
seasonal migration has been an
Figure 6.11: Radar of Livelihood Indicators - 3 Figure 6.12: Radar of Livelihood Indicators - 4
inevitable part of the livelihood
strategy of rural poor. The prospects
of increased wages in the short run
undermine the human
development losses which are
visible only in the long run. Apart
from deprivation from schooling,
households migrating from rural to
urban areas will have to give up the
benefits of the programmes like
PDS, social security schemes, etc.
to which they are entitled. Due to
these the skill and nutritional levels
of people may decline thereby
perpetuating their poverty.
Migrants are denied of the basic
human rights and are often forced
to take shelter in unauthorised
encroachments without the
minimum basic facilities. More
importantly, short-term migrants
are not unionised, they work in the
unorganised sector, they do not
have written job contracts and state
governments are yet to ensure that
the legislations protecting them are
properly enforced.
6.12.2. The Present Study
In the framework of the issues
outlined above, the present study
138
Raichur District Human Development Report 2014
seeks to inquire into the socio-
economic status of migrant
households, impact of migration on
their employment and income, HD
implications of migration in terms
of access to schooling, nutritional
benefits and other government
programmes. Based on discussion
with district and taluk level officials
as well as NGO functionaries,
Gurgunta gram panchayat of
Lingsugur taluk was purposively
chosen for the study. The timing of
the study coincided with
‘Muharram’ festival for the
celebration of which majority of
migrants had returned to the
village. The gram panchayat
officials helped in locating the
households and snow ball sampling
technique also helped in locating
sample households. In all 46
households were surveyed using a
structured schedule.
6.12.3. Profile of Sample
Respondents:
61 per cent of the sample
population were Hindus and
remaining were Muslims; while 54
per cent belonged to SC/ST, 39 per
cent belonged to minority, and the
remaining 7 per cent belonged to
OBC categories. As could be
expected 85 per cent of the sample
respondents were poor having BPL
ration cards. Of the 15 per cent
households that did not possess
ration cards majority were from SC
and ST sections. This was so
because they were unable to
complete the formalities to get a
card or they were disinterested as
they would not come regularly to
buy the ration. In fact, all of the
sample OBC, 94 per cent of
minority and 76 per cent of SC/ST
households possessed BPL ration
cards. It means 24 per cent of SC/
ST and 6 per cent of minority
households did not possess any
ration card. However, housing
status was relatively better owing
to either government programmes
or income earned due to migration
or both. More than half of the
respondents (54 per cent) are
residing in pucca houses; it being
72 per cent of minority, 67 per cent
for OBC households and 40 per
cent for SC/ST households.
6.12.4. Reasons for Migration
There were multiple reasons for a
household to migrate. 85 per cent
of the respondents were compelled
to migrate to earn for repayment of
loan, taken for various purposes.
Nearly, two-thirds of the
respondents (63per cent), said that
the work in the village is neither
adequate nor regular. 30 per cent
of the respondents stated that the
work was non-remunerative as the
wage was very low. Thus, the most
common feeling was that if they
continue work in the village itself,
they would be intermittently
unemployed the wage would be
adequate. 24 per cent of the
respondents mentioned that they
needed extra money to spend on
social and cultural activities like
marriages and hence they migrated.
Similarly, 17 per cent migrated
because of the drudgery of rural
The most
common feeling
was that if they
continue work
in the village
itself,
they would be
intermittently
unemployed
the wage
would be
adequate.
139
Income, Poverty and Employment
works; and another 9 per cent said
that they migrate because their
neighbours, relatives and friends
migrated. Thus, lack of regular
remunerative and adequate work in
the villages and compulsion to
spend on various activities compel
the people to migrate and earn the
required money.
The respondents were also asked
about their perception about
migration and the results reveal
that majority of them (59 per cent)
migrate due to compulsion, may be
of repaying loan and the remaining
41 per cent report that they have
migrate to fulfil the basic needs of
their families. It may be meeting
expenditures on food, health,
education or social function. That
none of them say that migration is
a good thing is reflective of the
agony they may be undergoing and
lack of alternative which has forced
them to migrate. Across social
groups, majority of minority
households (72 per cent) reported
migration to meet basic necessities.
However, all of the OBC households
and three-fourths of SC/ST
households reported that they
migrate out of compulsion,
especially to repay debts. Thus,
migration from Raichur district
occurs due to sheer compulsion
and is a distress induced
phenomenon indicating deprivation
and is not considered as a good
option.
6.12.5. Characteristics of
Migration
Place of Migration: A majority of
sample respondents (91 per cent)
migrated to Bangalore; 4 per cent
to Pune and the remaining to
places like Mangalore, Goa,
Mumbai and other cities. There was
no migration to villages at all.
Duration of Migration: Since the
village selected falls in a backward
region, the respondents stated that
they have migrated for work
permanently and stay at migrated
place for the whole year. Members
of the family who do not migrate
like aged parents, school going
children and sick, stay back in the
village, for whom they remit money
on a regular basis. They visit the
village during festivals, fairs and
whenever they are required to. For
instance, for filling up applications
to avail government schemes, buy
ration, voting, etc., they visit the
village and return. Thus, the
respondents are permanent
migrants who return occasionally.
During the time of the field work,
Mohurrum festival had neared.
This festival is celebrated with lot
of devotion irrespective of religion
and caste in the village and almost
of them had returned.
Composition of Migrants: How
many members from the family
migrate and what problems do they
face in the work place and what
problems the residual members in
the village face have important
implications for HD. Since the
migration is of longer term, it is not
wrong to expect that majority of the
households migrate along with all
family members. 54 per cent of the
sample households migrate with
Migration from
Raichur district
occurs due to
sheer compul-
sion and is a
distress induced
phenomenon
indicating
deprivation
which is not
considered as a
good option.
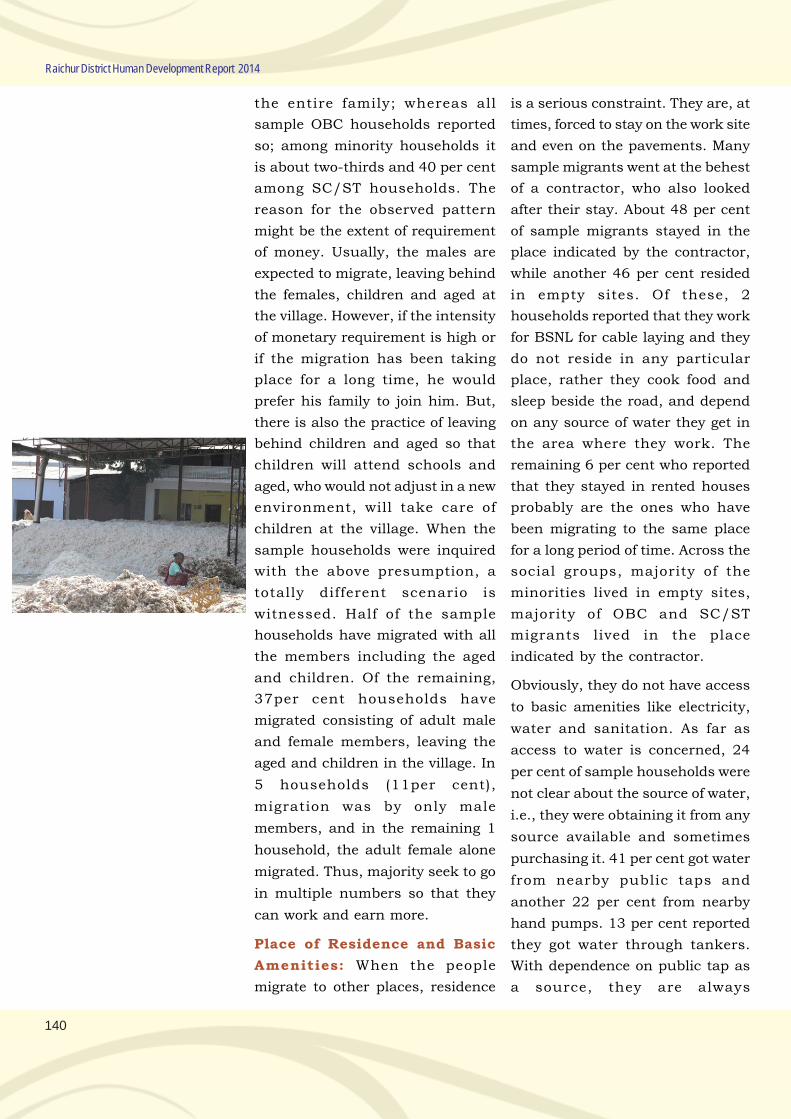
140
Raichur District Human Development Report 2014
the entire family; whereas all
sample OBC households reported
so; among minority households it
is about two-thirds and 40 per cent
among SC/ST households. The
reason for the observed pattern
might be the extent of requirement
of money. Usually, the males are
expected to migrate, leaving behind
the females, children and aged at
the village. However, if the intensity
of monetary requirement is high or
if the migration has been taking
place for a long time, he would
prefer his family to join him. But,
there is also the practice of leaving
behind children and aged so that
children will attend schools and
aged, who would not adjust in a new
environment, will take care of
children at the village. When the
sample households were inquired
with the above presumption, a
totally different scenario is
witnessed. Half of the sample
households have migrated with all
the members including the aged
and children. Of the remaining,
37per cent households have
migrated consisting of adult male
and female members, leaving the
aged and children in the village. In
5 households (11per cent),
migration was by only male
members, and in the remaining 1
household, the adult female alone
migrated. Thus, majority seek to go
in multiple numbers so that they
can work and earn more.
Place of Residence and Basic
Amenities: When the people
migrate to other places, residence
is a serious constraint. They are, at
times, forced to stay on the work site
and even on the pavements. Many
sample migrants went at the behest
of a contractor, who also looked
after their stay. About 48 per cent
of sample migrants stayed in the
place indicated by the contractor,
while another 46 per cent resided
in empty sites. Of these, 2
households reported that they work
for BSNL for cable laying and they
do not reside in any particular
place, rather they cook food and
sleep beside the road, and depend
on any source of water they get in
the area where they work. The
remaining 6 per cent who reported
that they stayed in rented houses
probably are the ones who have
been migrating to the same place
for a long period of time. Across the
social groups, majority of the
minorities lived in empty sites,
majority of OBC and SC/ST
migrants lived in the place
indicated by the contractor.
Obviously, they do not have access
to basic amenities like electricity,
water and sanitation. As far as
access to water is concerned, 24
per cent of sample households were
not clear about the source of water,
i.e., they were obtaining it from any
source available and sometimes
purchasing it. 41 per cent got water
from nearby public taps and
another 22 per cent from nearby
hand pumps. 13 per cent reported
they got water through tankers.
With dependence on public tap as
a source, they are always
141
Income, Poverty and Employment
vulnerable to magnitude as well as
conflict between themselves and
local people. As far as sanitation is
concerned, the situation is quite
precarious, especially for the
females.
6.12.6. Work Characteristics at
the Migrant Place
Two-thirds (65per cent) of the
migrant workers mentioned that
they get work through the
contractor who takes commission
ranging from Rs. 20 to Rs. 60 per
labour per day. The remaining 35
per cent said, they get work directly
through their own contacts. All
male workers reported to be
working in construction activities
receiving wages ranging from Rs.
200 to Rs. 350, the average wage
being Rs. 257 per day. This is
substantially higher than what they
would earn in their native or
surrounding villages. So is the case
with female workers who also were
engaged in construction activity.
Unfortunately, the wage differential
exists here also with females
receiving wages ranging from Rs.
100 to Rs. 300, averaging at Rs. 170
per day. While, the male workers
were engaged in semi-skilled jobs
such as masonry, bar bending,
centring, etc., females were
performing earth works. There are
no amenities at the work site
including drinking water and toilet
facility and the workers are
compelled to arrange them on their
own. Though income figures were
not revealed exactly, 80 to 90 per
cent of their annual household
income is derived from migration
alone.
6.12.7. Human Development
Consequences of Migration
The main purpose of the survey was
to focus on HD impacts due to
migration. Except for regular
employment and higher wages,
migration could be considered as a
sign of deprivation and
vulnerability. The migrants face
dual seclusion, first from their kith
and kin at a far off place; and
second, are not in the mainstream
in the place they are residing in.
They also face the problem of
frequent eviction, police atrocity,
security of women and aged,
educating their children, access to
government schemes, especially,
PDS and many more. 28per cent of
respondents (14 respondents)
reported to have faced problems.
The major problem was frequent
change of residence with 15 per
cent of the respondents being
forced to change their residence
which makes it difficult for them to
plan for basic amenities or
children’s education. Similarly, 7
per cent (3 respondents) felt that
they were deprived of food
distribution and they have to make
frequent trips to their native
villages for buying the grains
allocated under PDS. They feel that
they should be allowed to buy
grains from PDS shops in the
places where they work. Very few
households (2 respondents, 4 per
cent) were concerned about their
children’s education. 27
Except forregularemploymentand higherwages,migration couldbe consideredas asign ofdeprivationandvulnerability.
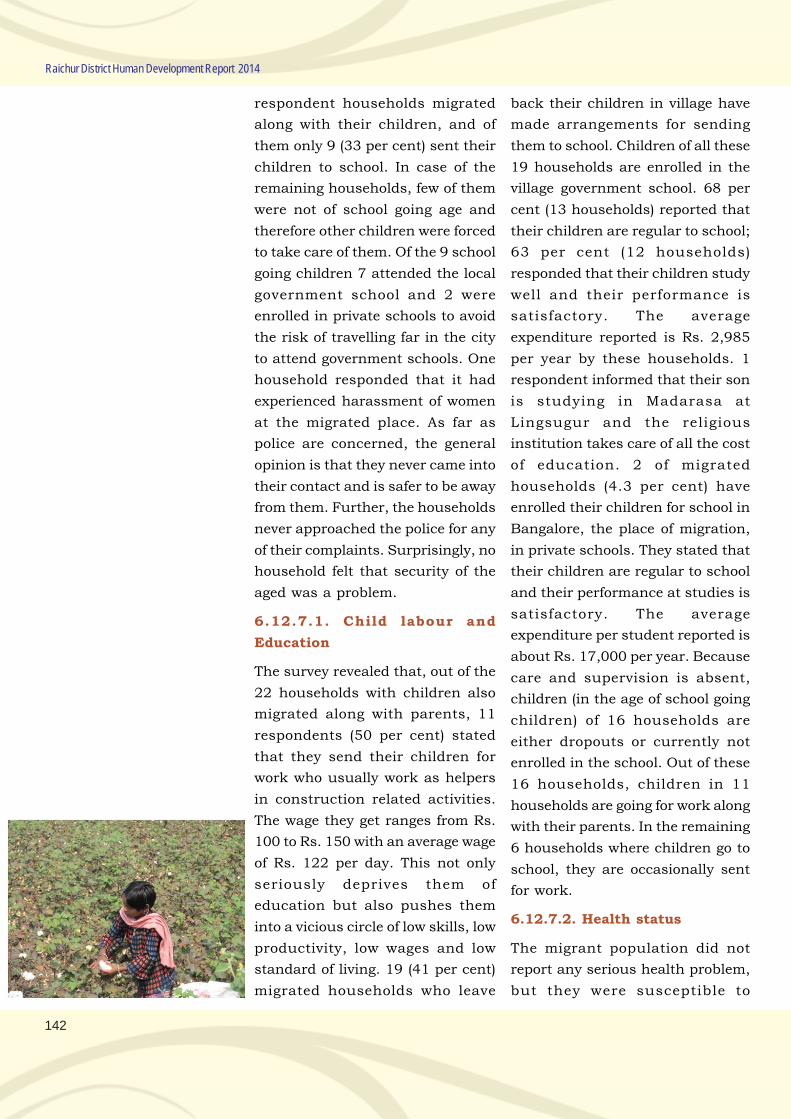
142
Raichur District Human Development Report 2014
respondent households migrated
along with their children, and of
them only 9 (33 per cent) sent their
children to school. In case of the
remaining households, few of them
were not of school going age and
therefore other children were forced
to take care of them. Of the 9 school
going children 7 attended the local
government school and 2 were
enrolled in private schools to avoid
the risk of travelling far in the city
to attend government schools. One
household responded that it had
experienced harassment of women
at the migrated place. As far as
police are concerned, the general
opinion is that they never came into
their contact and is safer to be away
from them. Further, the households
never approached the police for any
of their complaints. Surprisingly, no
household felt that security of the
aged was a problem.
6.12.7.1. Child labour and
Education
The survey revealed that, out of the
22 households with children also
migrated along with parents, 11
respondents (50 per cent) stated
that they send their children for
work who usually work as helpers
in construction related activities.
The wage they get ranges from Rs.
100 to Rs. 150 with an average wage
of Rs. 122 per day. This not only
seriously deprives them of
education but also pushes them
into a vicious circle of low skills, low
productivity, low wages and low
standard of living. 19 (41 per cent)
migrated households who leave
back their children in village have
made arrangements for sending
them to school. Children of all these
19 households are enrolled in the
village government school. 68 per
cent (13 households) reported that
their children are regular to school;
63 per cent (12 households)
responded that their children study
well and their performance is
satisfactory. The average
expenditure reported is Rs. 2,985
per year by these households. 1
respondent informed that their son
is studying in Madarasa at
Lingsugur and the religious
institution takes care of all the cost
of education. 2 of migrated
households (4.3 per cent) have
enrolled their children for school in
Bangalore, the place of migration,
in private schools. They stated that
their children are regular to school
and their performance at studies is
satisfactory. The average
expenditure per student reported is
about Rs. 17,000 per year. Because
care and supervision is absent,
children (in the age of school going
children) of 16 households are
either dropouts or currently not
enrolled in the school. Out of these
16 households, children in 11
households are going for work along
with their parents. In the remaining
6 households where children go to
school, they are occasionally sent
for work.
6.12.7.2. Health status
The migrant population did not
report any serious health problem,
but they were susceptible to
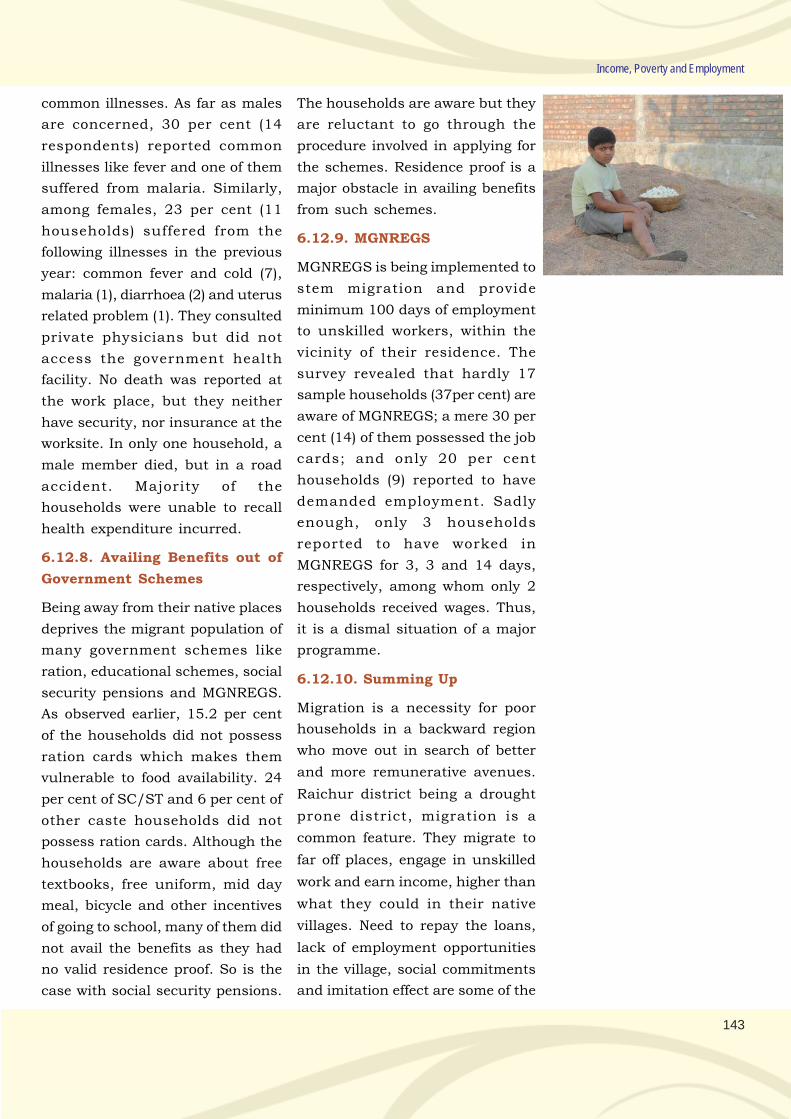
143
Income, Poverty and Employment
common illnesses. As far as males
are concerned, 30 per cent (14
respondents) reported common
illnesses like fever and one of them
suffered from malaria. Similarly,
among females, 23 per cent (11
households) suffered from the
following illnesses in the previous
year: common fever and cold (7),
malaria (1), diarrhoea (2) and uterus
related problem (1). They consulted
private physicians but did not
access the government health
facility. No death was reported at
the work place, but they neither
have security, nor insurance at the
worksite. In only one household, a
male member died, but in a road
accident. Majority of the
households were unable to recall
health expenditure incurred.
6.12.8. Availing Benefits out of
Government Schemes
Being away from their native places
deprives the migrant population of
many government schemes like
ration, educational schemes, social
security pensions and MGNREGS.
As observed earlier, 15.2 per cent
of the households did not possess
ration cards which makes them
vulnerable to food availability. 24
per cent of SC/ST and 6 per cent of
other caste households did not
possess ration cards. Although the
households are aware about free
textbooks, free uniform, mid day
meal, bicycle and other incentives
of going to school, many of them did
not avail the benefits as they had
no valid residence proof. So is the
case with social security pensions.
The households are aware but they
are reluctant to go through the
procedure involved in applying for
the schemes. Residence proof is a
major obstacle in availing benefits
from such schemes.
6.12.9. MGNREGS
MGNREGS is being implemented to
stem migration and provide
minimum 100 days of employment
to unskilled workers, within the
vicinity of their residence. The
survey revealed that hardly 17
sample households (37per cent) are
aware of MGNREGS; a mere 30 per
cent (14) of them possessed the job
cards; and only 20 per cent
households (9) reported to have
demanded employment. Sadly
enough, only 3 households
reported to have worked in
MGNREGS for 3, 3 and 14 days,
respectively, among whom only 2
households received wages. Thus,
it is a dismal situation of a major
programme.
6.12.10. Summing Up
Migration is a necessity for poor
households in a backward region
who move out in search of better
and more remunerative avenues.
Raichur district being a drought
prone district, migration is a
common feature. They migrate to
far off places, engage in unskilled
work and earn income, higher than
what they could in their native
villages. Need to repay the loans,
lack of employment opportunities
in the village, social commitments
and imitation effect are some of the
144
Raichur District Human Development Report 2014
reasons for migration. Many of
them migrate with the whole family
thereby jeopardizing the situation
of children, who are deprived of
schooling; and the aged, who might
feel displaced at an advanced age.
People from all social groups
migrated and majority of them were
at the mercy of contractors for
employment as well as residence,
for whom they paid hefty
commission. Many households did
not send their children to school,
but forced them to work. Thus, a
scenario of deprivation is present
all around. Children do not go to
school, many households do not
avail the benefits of government
schemes, especially PDS and social
security pensions. Knowledge about
and participation in MGNREGS is
the least. There are vulnerabilities
associated with frequent change of
residence, security of women and
availability of basic amenities in the
place of work.
There is a need for temporary
structural changes in protocols so
that the migrant poor are issued
identity documents (voter card and
ration card) that will allow them to
access government social security
schemes such as subsidised food.
A policy through which a household
can avail benefits where ever it
resides needs to be evolved. The
information technology can
leverage this. Increase in the
number of anganwadi centres (to
provide children, pregnant and
lactating mothers with
supplementary nutrition) and
government schools in areas where
migrant workers reside to enhance
schooling and nutritional benefits
to these sections. Improving skill
levels through vocational training
will help the children to break the
cycle of poverty and attain higher
HD status.
Similarly, awareness about the
government schemes needs to be
further made extensive so that
people could avail them and stay
back. Of course investment in
backward area development is the
ultimate measure to reduce
migration and related deprivations.
With extension of irrigation facilities
to a major portion of the district and
conferring the 371(J) status is likely
to have a favourable impact.
6.13. Concluding Remarks
Attainment of higher HD levels is
contingent upon providing better
livelihood options to the people.
Better natural resources,
productive avenues of employment
and suitable policies would ensure
a decent and sustainable livelihood
to the people thereby promoting
HD. Raichur district being located
in a rain shadow area with harsh
weather condition, the prospects for
higher employment and income are
limited and hence the district has
high levels of poverty.
It is evident in the district’s share
of income in state’s income that
has declined between 2004-05 and
2008-09. The per capita income of
the district continued to be lower
than the state PCSDP. Sector wise,
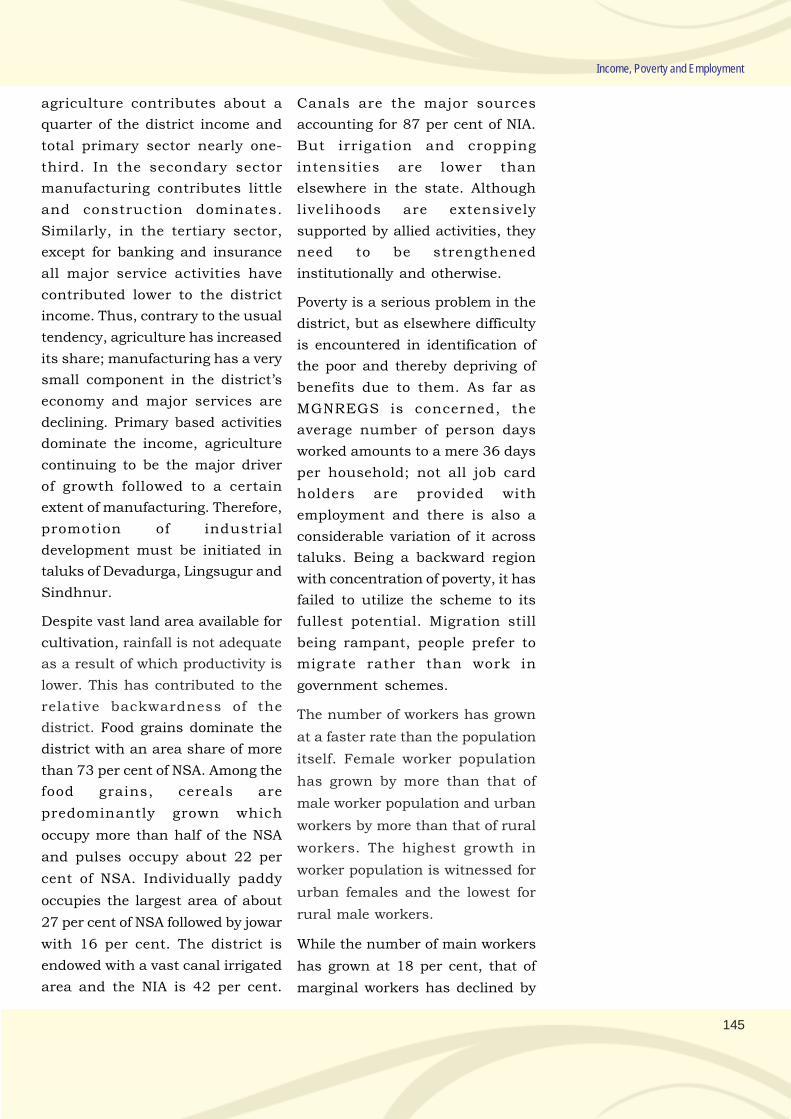
145
Income, Poverty and Employment
agriculture contributes about a
quarter of the district income and
total primary sector nearly one-
third. In the secondary sector
manufacturing contributes little
and construction dominates.
Similarly, in the tertiary sector,
except for banking and insurance
all major service activities have
contributed lower to the district
income. Thus, contrary to the usual
tendency, agriculture has increased
its share; manufacturing has a very
small component in the district’s
economy and major services are
declining. Primary based activities
dominate the income, agriculture
continuing to be the major driver
of growth followed to a certain
extent of manufacturing. Therefore,
promotion of industrial
development must be initiated in
taluks of Devadurga, Lingsugur and
Sindhnur.
Despite vast land area available for
cultivation, rainfall is not adequate
as a result of which productivity is
lower. This has contributed to the
relative backwardness of the
district. Food grains dominate the
district with an area share of more
than 73 per cent of NSA. Among the
food grains, cereals are
predominantly grown which
occupy more than half of the NSA
and pulses occupy about 22 per
cent of NSA. Individually paddy
occupies the largest area of about
27 per cent of NSA followed by jowar
with 16 per cent. The district is
endowed with a vast canal irrigated
area and the NIA is 42 per cent.
Canals are the major sources
accounting for 87 per cent of NIA.
But irrigation and cropping
intensities are lower than
elsewhere in the state. Although
livelihoods are extensively
supported by allied activities, they
need to be strengthened
institutionally and otherwise.
Poverty is a serious problem in the
district, but as elsewhere difficulty
is encountered in identification of
the poor and thereby depriving of
benefits due to them. As far as
MGNREGS is concerned, the
average number of person days
worked amounts to a mere 36 days
per household; not all job card
holders are provided with
employment and there is also a
considerable variation of it across
taluks. Being a backward region
with concentration of poverty, it has
failed to utilize the scheme to its
fullest potential. Migration still
being rampant, people prefer to
migrate rather than work in
government schemes.
The number of workers has grown
at a faster rate than the population
itself. Female worker population
has grown by more than that of
male worker population and urban
workers by more than that of rural
workers. The highest growth in
worker population is witnessed for
urban females and the lowest for
rural male workers.
While the number of main workers
has grown at 18 per cent, that of
marginal workers has declined by
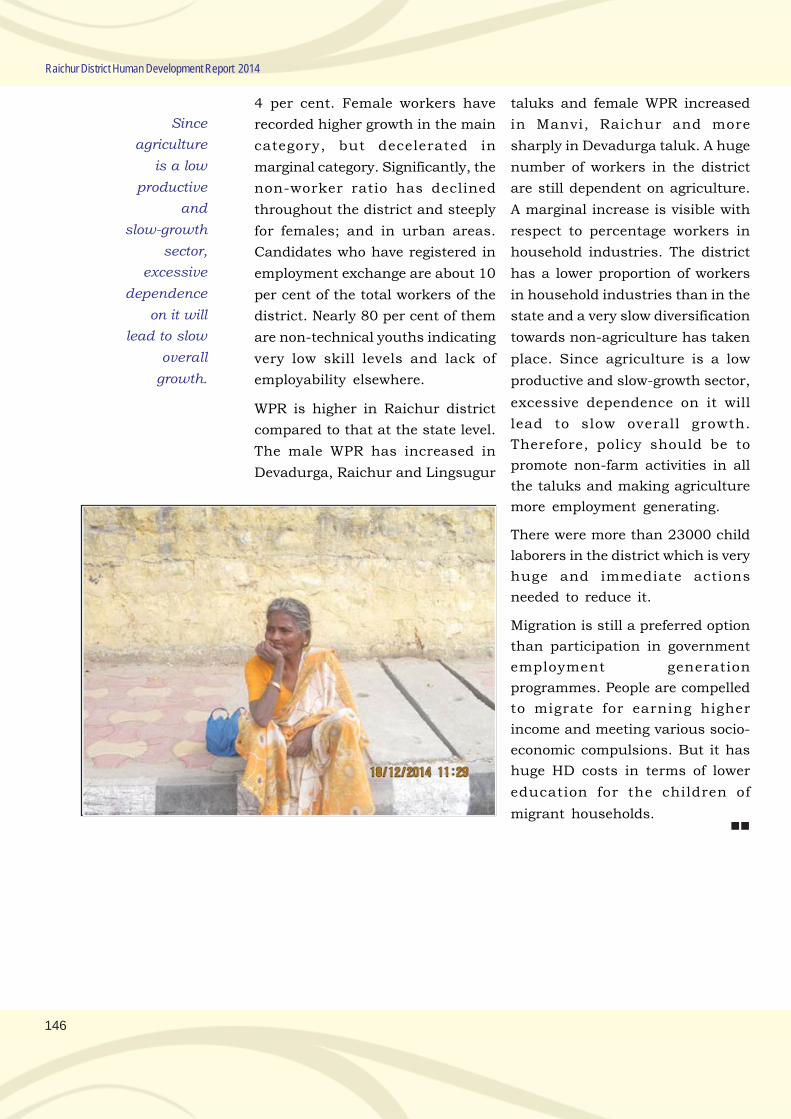
146
Raichur District Human Development Report 2014
4 per cent. Female workers have
recorded higher growth in the main
category, but decelerated in
marginal category. Significantly, the
non-worker ratio has declined
throughout the district and steeply
for females; and in urban areas.
Candidates who have registered in
employment exchange are about 10
per cent of the total workers of the
district. Nearly 80 per cent of them
are non-technical youths indicating
very low skill levels and lack of
employability elsewhere.
WPR is higher in Raichur district
compared to that at the state level.
The male WPR has increased in
Devadurga, Raichur and Lingsugur
taluks and female WPR increased
in Manvi, Raichur and more
sharply in Devadurga taluk. A huge
number of workers in the district
are still dependent on agriculture.
A marginal increase is visible with
respect to percentage workers in
household industries. The district
has a lower proportion of workers
in household industries than in the
state and a very slow diversification
towards non-agriculture has taken
place. Since agriculture is a low
productive and slow-growth sector,
excessive dependence on it will
lead to slow overall growth.
Therefore, policy should be to
promote non-farm activities in all
the taluks and making agriculture
more employment generating.
There were more than 23000 child
laborers in the district which is very
huge and immediate actions
needed to reduce it.
Migration is still a preferred option
than participation in government
employment generation
programmes. People are compelled
to migrate for earning higher
income and meeting various socio-
economic compulsions. But it has
huge HD costs in terms of lower
education for the children of
migrant households.
Since
agriculture
is a low
productive
and
slow-growth
sector,
excessive
dependence
on it will
lead to slow
overall
growth.
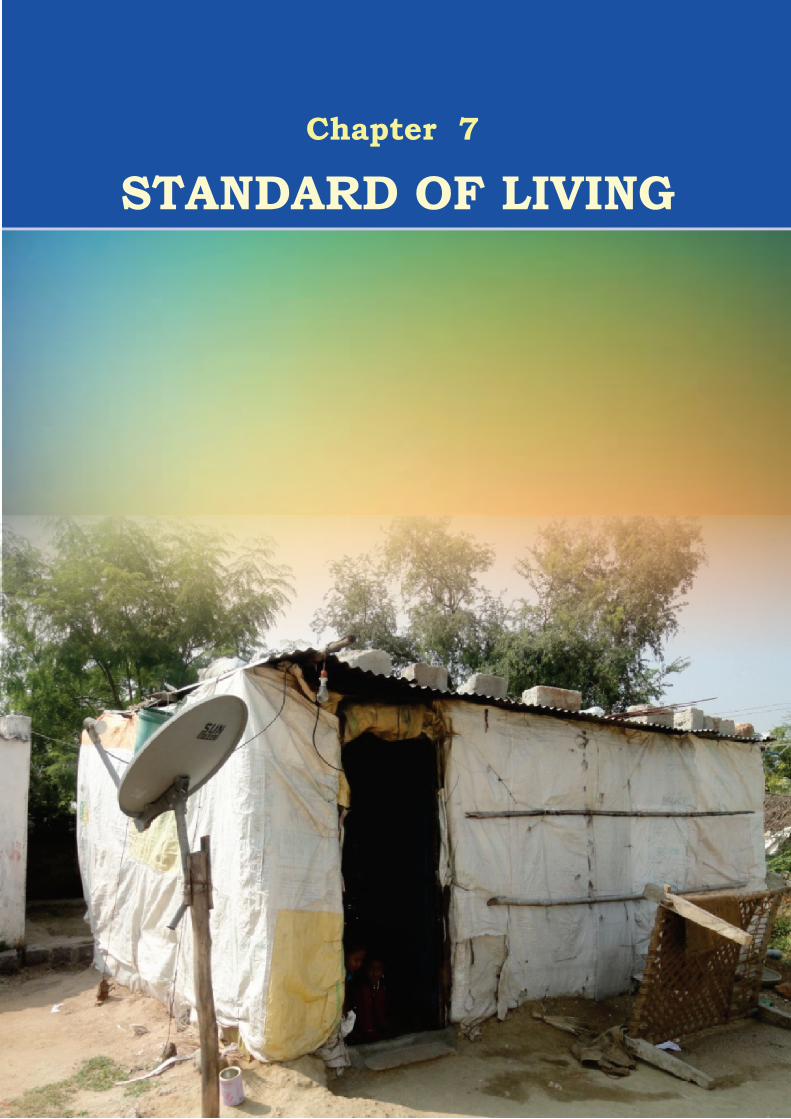
STANDARD OF LIVING
Chapter 7

.
149
Chapter 7
Standard of Living
7.1. Introduction
Human development paradigm
believes that income is not an end
in itself but a means to achieve
broader ends of HD itself. Hence,
income alone cannot measure
human progress completely. Non-
income indicators are found to be
more robust than income
indicators. HD involves expanding
choices and opportunities of people
for living with dignity and decency.
For this, all human beings must be
assured of basic amenities like
decent shelter, food, potable water,
sanitation, energy, among others.
Human beings should also have
access to few basic assets that
enhance their livelihood
opportunities and increase their
productivity. Assetlessness is also
a feature of poverty. Hence, the
government should initiate
measures to provide these basic
amenities and assets to people
which will result in improvement of
their health, productivity and
ultimately income earning capacity
of the people and will have a positive
impact on their HD parameters.
HDI and CTDI analysis in Chapter
3 indicated a significant association
between standard of living
indicators and HD attainments.
In this chapter an attempt is made
to analyze the availability of a few
basic amenities in Raichur district
and how they affect the differential
HD attainments across taluks. The
amenities considered are stock and
quality of housing, drinking water,
electricity, type of cooking fuel and
sanitation. These not only have
general HD implications but also
have significant gender
implications. Availability of potable
drinking water, clean fuel and
sanitation improves women’s
health and work characteristics,
which has greater positive impact
on the household economic and
therefore, socio-political situation.
7.2. Housing Status
According to Census 2011, there
were 3,63,853 listed households
in Raichur district of which,
2,67,585 (74 per cent) lived in rural
areas and rest 96,268 (26 per cent)
lived in urban areas. This was
respectively, 2.7 per cent, 3.4 per
cent and 1.8 per cent of state
population. However, not all these
households had houses to live in.
Table 7.1 shows that 421
households did not possess any
type of house and were classified
as houseless in 2011.
Table 7.1: Number of Houseless households in
Raichur District, 2011
Source: Census 2011
Availability of
potable drinking
water, clean fuel
and sanitation
improves
women’s
health and work
characteristics,
which has
greater positive
impact
on the house-
hold economic
and
therefore, socio-
political situa-
tion.
Description Rural Urban Total
Raichur 314 107 421
% to total Households 0.12 0.11 0.12
Karnataka 10503 10922 21425
% to total Households 0.13 0.20 0.16
150
Raichur District Human Development Report 2014
Of these, 314 were living in rural
areas and 107 in urban areas.
However, compared to the state, the
proportion of houseless households
was lesser. Thus, Raichur being a
predominantly rural district, the
problem is severe in the rural areas.
Central and state governments have
taken measures to provide houses
or support house construction, so
that people can live in good houses.
Based on a systematic identification
of these households, there is a need
to provide houses or facilities for
construction of houses to these
households.
7.3. Site-less Households
The first requirement for
construction of a house is a
residential site. Owing to shortage
of suitable land, and sometimes, the
cost of residential site many
households do not possess a site
for house construction. Apart from
this, even today there are large
numbers of migrant communities,
especially in urban areas, who do
not reside at a fixed place. It is one
of the factors for such people being
deprived of government schemes
and assistance. Therefore, house
sites should be provided to site-less
households and provide assistance
to construct houses to houseless
households. As far as information
on site-less households and
number of sites allotted is
concerned, the data is not reliable
and adequate. Because of this,
there are problems in identification
of genuine beneficiaries for
provision of house sites.
Rajiv Gandhi Rural Housing
Corporation and the district
administration together implement
the schemes relating to house and
site allotment. The data provided by
these agencies is given in Figure
7.1.
For the district as a whole, 11 per
cent percent of households are
reported to be site-less. This is a
huge proportion and when applied
to the 2011 census data, the
number works out to 41,625
households. Across the taluks,
Manvi reports the highest
proportion of households (17 per
cent) without sites, followed by
Sindhnur and Devadurga (14 and
13 per cent, respectively). The figure
also depicts the percentage
households provided with house
sites by the Government. At the
district level, hardly 2 per cent of
the households have been provided
with house sites as at the end of
Figure 7.1: Site-less Households in Raichur District, 2011-12
Source: ZP, Raichur
A typical Kaccha House
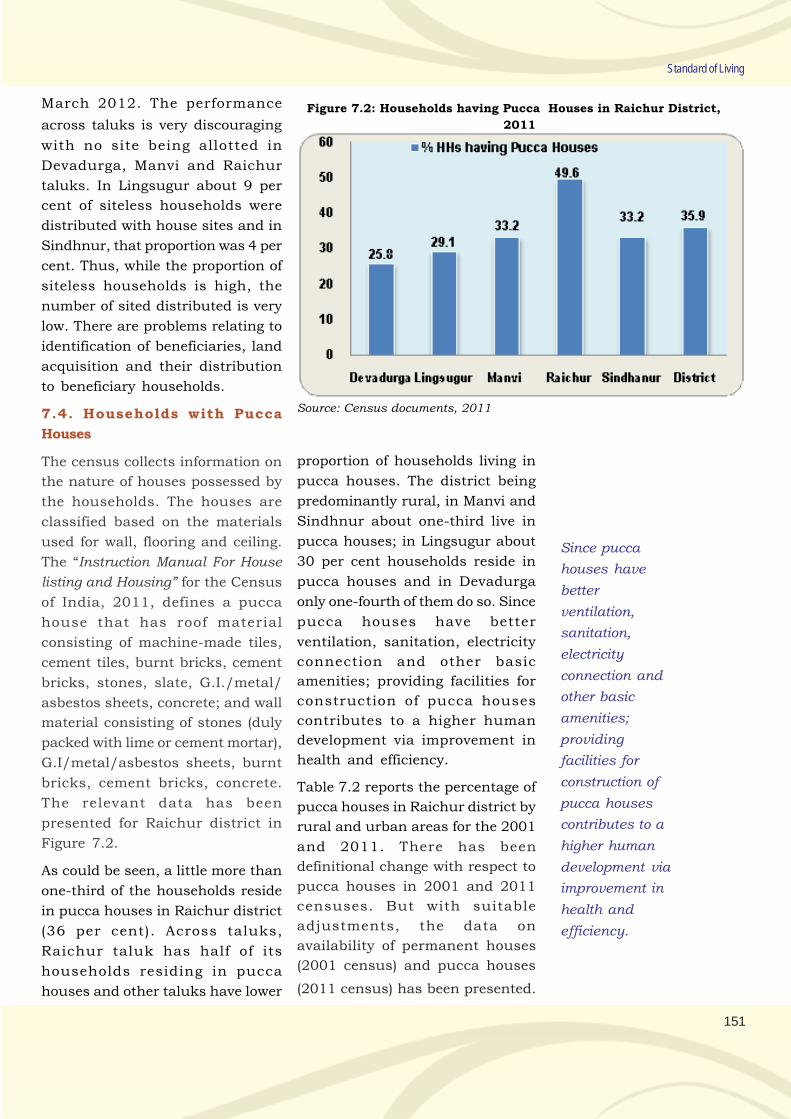
151
Standard of Living
March 2012. The performance
across taluks is very discouraging
with no site being allotted in
Devadurga, Manvi and Raichur
taluks. In Lingsugur about 9 per
cent of siteless households were
distributed with house sites and in
Sindhnur, that proportion was 4 per
cent. Thus, while the proportion of
siteless households is high, the
number of sited distributed is very
low. There are problems relating to
identification of beneficiaries, land
acquisition and their distribution
to beneficiary households.
7.4. Households with Pucca
Houses
The census collects information on
the nature of houses possessed by
the households. The houses are
classified based on the materials
used for wall, flooring and ceiling.
The “Instruction Manual For House
listing and Housing” for the Census
of India, 2011, defines a pucca
house that has roof material
consisting of machine-made tiles,
cement tiles, burnt bricks, cement
bricks, stones, slate, G.I./metal/
asbestos sheets, concrete; and wall
material consisting of stones (duly
packed with lime or cement mortar),
G.I/metal/asbestos sheets, burnt
bricks, cement bricks, concrete.
The relevant data has been
presented for Raichur district in
Figure 7.2.
As could be seen, a little more than
one-third of the households reside
in pucca houses in Raichur district
(36 per cent). Across taluks,
Raichur taluk has half of its
households residing in pucca
houses and other taluks have lower
Figure 7.2: Households having Pucca Houses in Raichur District,
2011
Source: Census documents, 2011
proportion of households living in
pucca houses. The district being
predominantly rural, in Manvi and
Sindhnur about one-third live in
pucca houses; in Lingsugur about
30 per cent households reside in
pucca houses and in Devadurga
only one-fourth of them do so. Since
pucca houses have better
ventilation, sanitation, electricity
connection and other basic
amenities; providing facilities for
construction of pucca houses
contributes to a higher human
development via improvement in
health and efficiency.
Table 7.2 reports the percentage of
pucca houses in Raichur district by
rural and urban areas for the 2001
and 2011. There has been
definitional change with respect to
pucca houses in 2001 and 2011
censuses. But with suitable
adjustments, the data on
availability of permanent houses
(2001 census) and pucca houses
(2011 census) has been presented.
Since pucca
houses have
better
ventilation,
sanitation,
electricity
connection and
other basic
amenities;
providing
facilities for
construction of
pucca houses
contributes to a
higher human
development via
improvement in
health and
efficiency.
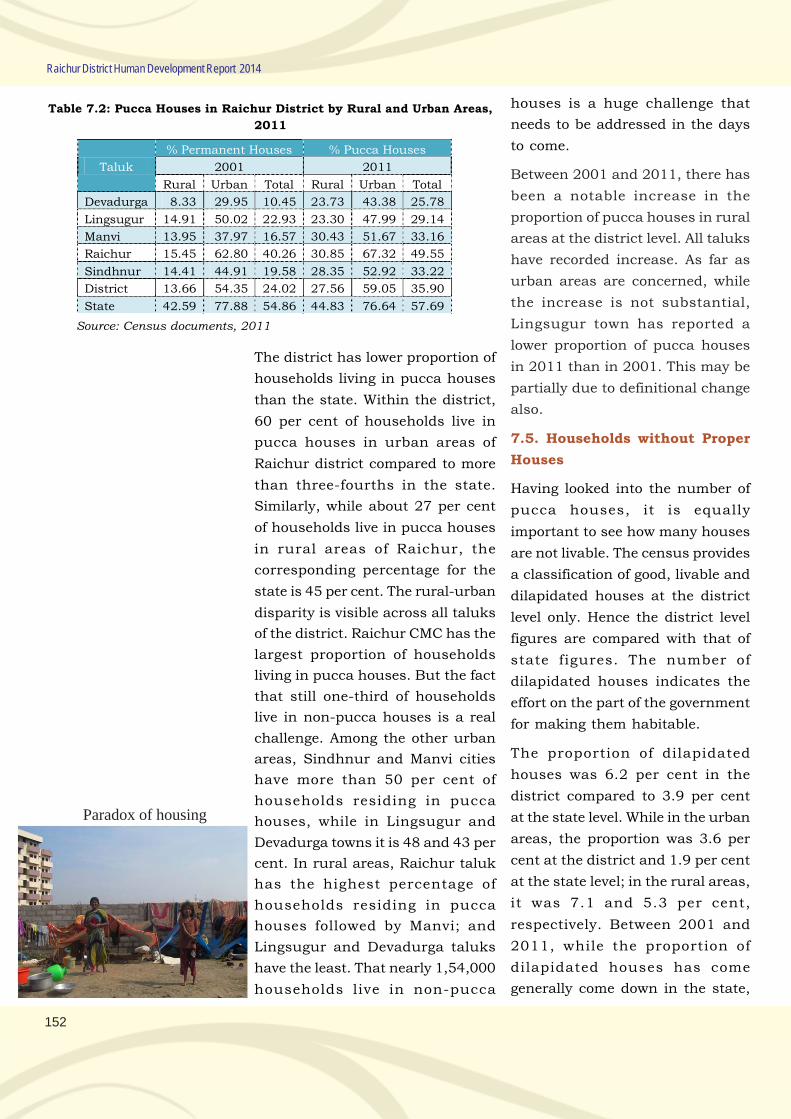
152
Raichur District Human Development Report 2014
Table 7.2: Pucca Houses in Raichur District by Rural and Urban Areas,
2011
Taluk
% Permanent Houses % Pucca Houses
2001 2011
Rural Urban Total Rural Urban Total
Devadurga 8.33 29.95 10.45 23.73 43.38 25.78
Lingsugur 14.91 50.02 22.93 23.30 47.99 29.14
Manvi 13.95 37.97 16.57 30.43 51.67 33.16
Raichur 15.45 62.80 40.26 30.85 67.32 49.55
Sindhnur 14.41 44.91 19.58 28.35 52.92 33.22
District 13.66 54.35 24.02 27.56 59.05 35.90
State 42.59 77.88 54.86 44.83 76.64 57.69
Source: Census documents, 2011
The district has lower proportion of
households living in pucca houses
than the state. Within the district,
60 per cent of households live in
pucca houses in urban areas of
Raichur district compared to more
than three-fourths in the state.
Similarly, while about 27 per cent
of households live in pucca houses
in rural areas of Raichur, the
corresponding percentage for the
state is 45 per cent. The rural-urban
disparity is visible across all taluks
of the district. Raichur CMC has the
largest proportion of households
living in pucca houses. But the fact
that still one-third of households
live in non-pucca houses is a real
challenge. Among the other urban
areas, Sindhnur and Manvi cities
have more than 50 per cent of
households residing in pucca
houses, while in Lingsugur and
Devadurga towns it is 48 and 43 per
cent. In rural areas, Raichur taluk
has the highest percentage of
households residing in pucca
houses followed by Manvi; and
Lingsugur and Devadurga taluks
have the least. That nearly 1,54,000
households live in non-pucca
houses is a huge challenge that
needs to be addressed in the days
to come.
Between 2001 and 2011, there has
been a notable increase in the
proportion of pucca houses in rural
areas at the district level. All taluks
have recorded increase. As far as
urban areas are concerned, while
the increase is not substantial,
Lingsugur town has reported a
lower proportion of pucca houses
in 2011 than in 2001. This may be
partially due to definitional change
also.
7.5. Households without Proper
Houses
Having looked into the number of
pucca houses, it is equally
important to see how many houses
are not livable. The census provides
a classification of good, livable and
dilapidated houses at the district
level only. Hence the district level
figures are compared with that of
state figures. The number of
dilapidated houses indicates the
effort on the part of the government
for making them habitable.
The proportion of dilapidated
houses was 6.2 per cent in the
district compared to 3.9 per cent
at the state level. While in the urban
areas, the proportion was 3.6 per
cent at the district and 1.9 per cent
at the state level; in the rural areas,
it was 7.1 and 5.3 per cent,
respectively. Between 2001 and
2011, while the proportion of
dilapidated houses has come
generally come down in the state,
Paradox of housing
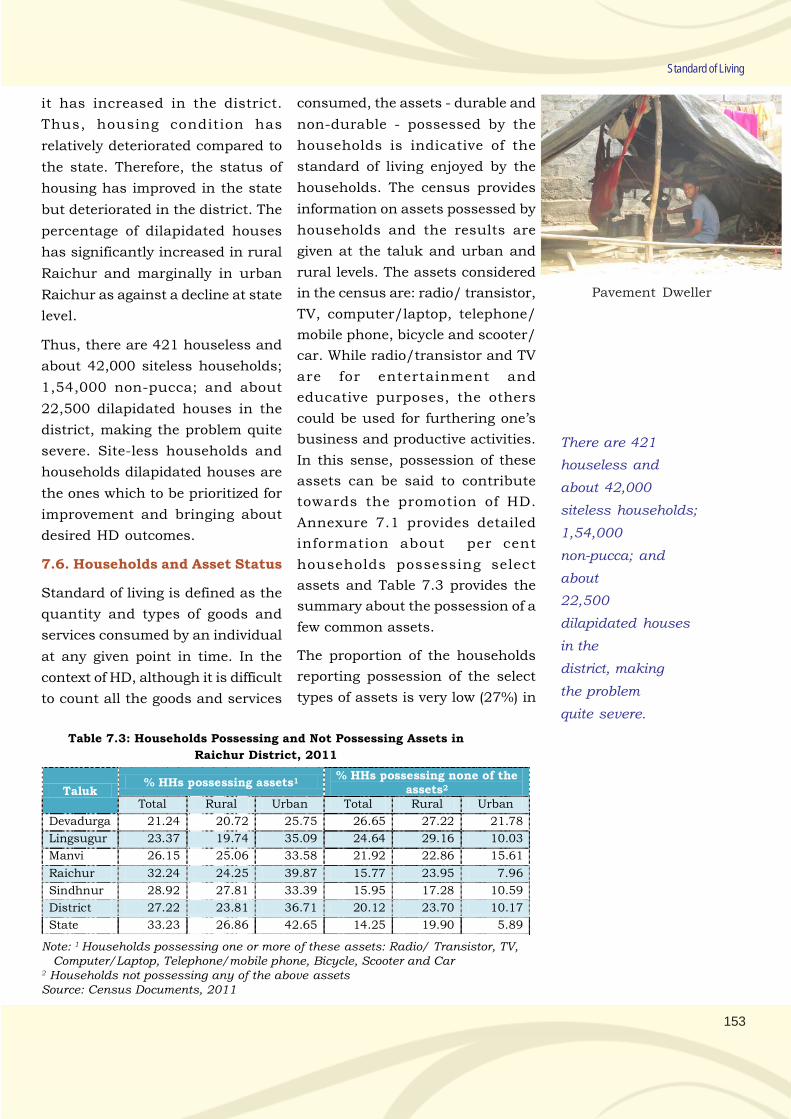
153
Standard of Living
it has increased in the district.
Thus, housing condition has
relatively deteriorated compared to
the state. Therefore, the status of
housing has improved in the state
but deteriorated in the district. The
percentage of dilapidated houses
has significantly increased in rural
Raichur and marginally in urban
Raichur as against a decline at state
level.
Thus, there are 421 houseless and
about 42,000 siteless households;
1,54,000 non-pucca; and about
22,500 dilapidated houses in the
district, making the problem quite
severe. Site-less households and
households dilapidated houses are
the ones which to be prioritized for
improvement and bringing about
desired HD outcomes.
7.6. Households and Asset Status
Standard of living is defined as the
quantity and types of goods and
services consumed by an individual
at any given point in time. In the
context of HD, although it is difficult
to count all the goods and services
consumed, the assets - durable and
non-durable - possessed by the
households is indicative of the
standard of living enjoyed by the
households. The census provides
information on assets possessed by
households and the results are
given at the taluk and urban and
rural levels. The assets considered
in the census are: radio/ transistor,
TV, computer/laptop, telephone/
mobile phone, bicycle and scooter/
car. While radio/transistor and TV
are for entertainment and
educative purposes, the others
could be used for furthering one’s
business and productive activities.
In this sense, possession of these
assets can be said to contribute
towards the promotion of HD.
Annexure 7.1 provides detailed
information about per cent
households possessing select
assets and Table 7.3 provides the
summary about the possession of a
few common assets.
The proportion of the households
reporting possession of the select
types of assets is very low (27%) in
Table 7.3: Households Possessing and Not Possessing Assets in
Raichur District, 2011
Note: 1 Households possessing one or more of these assets: Radio/ Transistor, TV,Computer/Laptop, Telephone/mobile phone, Bicycle, Scooter and Car
2 Households not possessing any of the above assetsSource: Census Documents, 2011
There are 421
houseless and
about 42,000
siteless households;
1,54,000
non-pucca; and
about
22,500
dilapidated houses
in the
district, making
the problem
quite severe.
Taluk % HHs possessing assets1
% HHs possessing none of the assets2
Total Rural Urban Total Rural Urban
Devadurga 21.24 20.72 25.75 26.65 27.22 21.78
Lingsugur 23.37 19.74 35.09 24.64 29.16 10.03
Manvi 26.15 25.06 33.58 21.92 22.86 15.61
Raichur 32.24 24.25 39.87 15.77 23.95 7.96
Sindhnur 28.92 27.81 33.39 15.95 17.28 10.59
District 27.22 23.81 36.71 20.12 23.70 10.17
State 33.23 26.86 42.65 14.25 19.90 5.89
Pavement Dweller
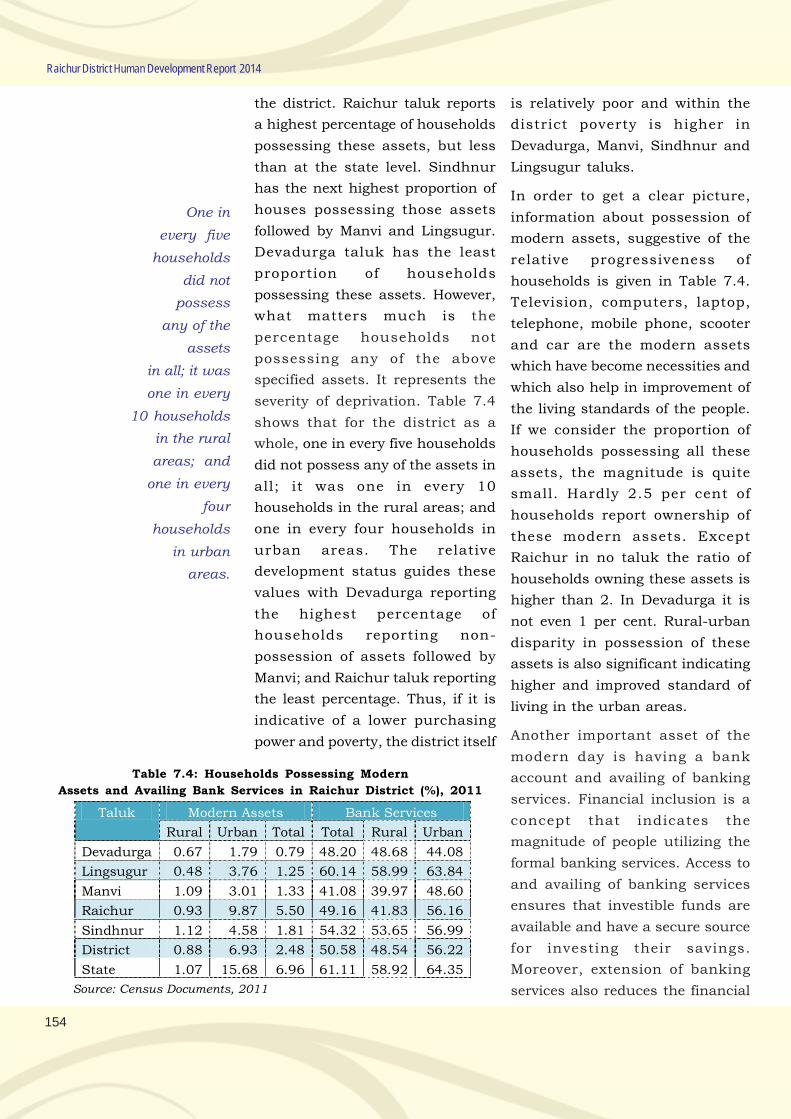
154
Raichur District Human Development Report 2014
the district. Raichur taluk reports
a highest percentage of households
possessing these assets, but less
than at the state level. Sindhnur
has the next highest proportion of
houses possessing those assets
followed by Manvi and Lingsugur.
Devadurga taluk has the least
proportion of households
possessing these assets. However,
what matters much is the
percentage households not
possessing any of the above
specified assets. It represents the
severity of deprivation. Table 7.4
shows that for the district as a
whole, one in every five households
did not possess any of the assets in
all; it was one in every 10
households in the rural areas; and
one in every four households in
urban areas. The relative
development status guides these
values with Devadurga reporting
the highest percentage of
households reporting non-
possession of assets followed by
Manvi; and Raichur taluk reporting
the least percentage. Thus, if it is
indicative of a lower purchasing
power and poverty, the district itself
is relatively poor and within the
district poverty is higher in
Devadurga, Manvi, Sindhnur and
Lingsugur taluks.
In order to get a clear picture,
information about possession of
modern assets, suggestive of the
relative progressiveness of
households is given in Table 7.4.
Television, computers, laptop,
telephone, mobile phone, scooter
and car are the modern assets
which have become necessities and
which also help in improvement of
the living standards of the people.
If we consider the proportion of
households possessing all these
assets, the magnitude is quite
small. Hardly 2.5 per cent of
households report ownership of
these modern assets. Except
Raichur in no taluk the ratio of
households owning these assets is
higher than 2. In Devadurga it is
not even 1 per cent. Rural-urban
disparity in possession of these
assets is also significant indicating
higher and improved standard of
living in the urban areas.
Another important asset of the
modern day is having a bank
account and availing of banking
services. Financial inclusion is a
concept that indicates the
magnitude of people utilizing the
formal banking services. Access to
and availing of banking services
ensures that investible funds are
available and have a secure source
for investing their savings.
Moreover, extension of banking
services also reduces the financial
Table 7.4: Households Possessing Modern
Assets and Availing Bank Services in Raichur District (%), 2011
Taluk Modern Assets Bank Services
Rural Urban Total Total Rural Urban
Devadurga 0.67 1.79 0.79 48.20 48.68 44.08
Lingsugur 0.48 3.76 1.25 60.14 58.99 63.84
Manvi 1.09 3.01 1.33 41.08 39.97 48.60
Raichur 0.93 9.87 5.50 49.16 41.83 56.16
Sindhnur 1.12 4.58 1.81 54.32 53.65 56.99
District 0.88 6.93 2.48 50.58 48.54 56.22
State 1.07 15.68 6.96 61.11 58.92 64.35
Source: Census Documents, 2011
One in
every five
households
did not
possess
any of the
assets
in all; it was
one in every
10 households
in the rural
areas; and
one in every
four
households
in urban
areas.
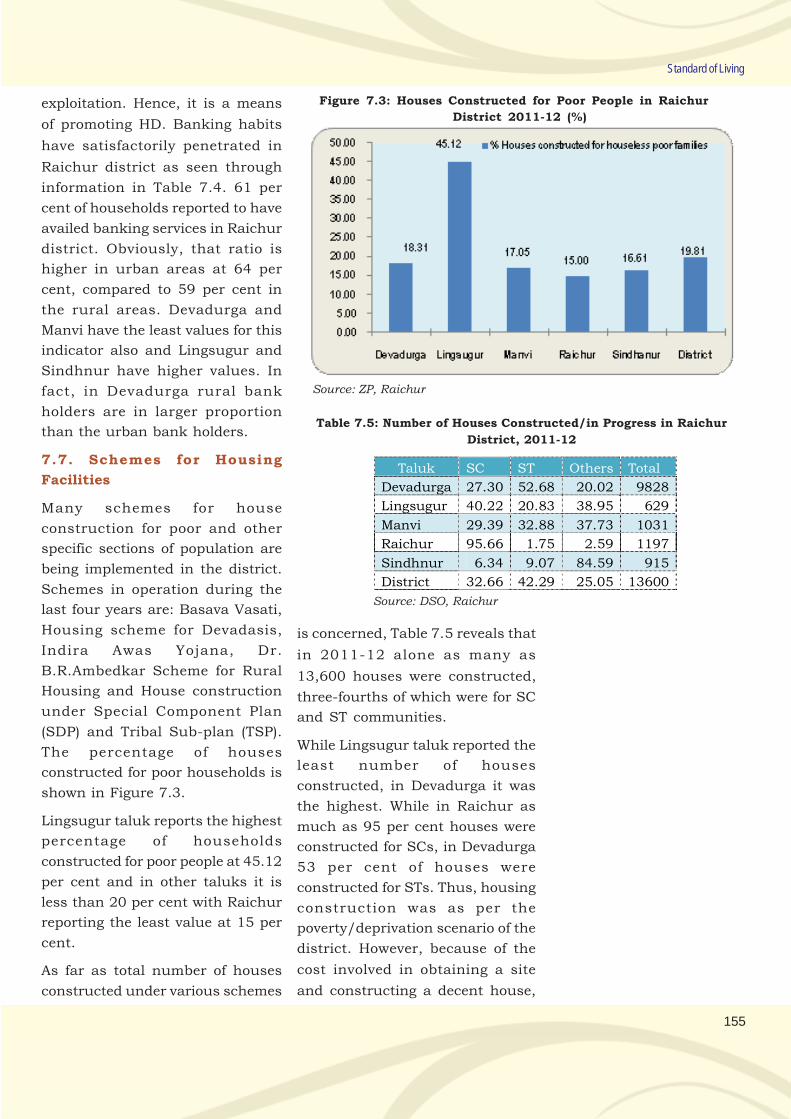
155
Standard of Living
exploitation. Hence, it is a means
of promoting HD. Banking habits
have satisfactorily penetrated in
Raichur district as seen through
information in Table 7.4. 61 per
cent of households reported to have
availed banking services in Raichur
district. Obviously, that ratio is
higher in urban areas at 64 per
cent, compared to 59 per cent in
the rural areas. Devadurga and
Manvi have the least values for this
indicator also and Lingsugur and
Sindhnur have higher values. In
fact, in Devadurga rural bank
holders are in larger proportion
than the urban bank holders.
7.7. Schemes for Housing
Facilities
Many schemes for house
construction for poor and other
specific sections of population are
being implemented in the district.
Schemes in operation during the
last four years are: Basava Vasati,
Housing scheme for Devadasis,
Indira Awas Yojana, Dr.
B.R.Ambedkar Scheme for Rural
Housing and House construction
under Special Component Plan
(SDP) and Tribal Sub-plan (TSP).
The percentage of houses
constructed for poor households is
shown in Figure 7.3.
Lingsugur taluk reports the highest
percentage of households
constructed for poor people at 45.12
per cent and in other taluks it is
less than 20 per cent with Raichur
reporting the least value at 15 per
cent.
As far as total number of houses
constructed under various schemes
Figure 7.3: Houses Constructed for Poor People in Raichur
District 2011-12 (%)
Source: ZP, Raichur
is concerned, Table 7.5 reveals that
in 2011-12 alone as many as
13,600 houses were constructed,
three-fourths of which were for SC
and ST communities.
While Lingsugur taluk reported the
least number of houses
constructed, in Devadurga it was
the highest. While in Raichur as
much as 95 per cent houses were
constructed for SCs, in Devadurga
53 per cent of houses were
constructed for STs. Thus, housing
construction was as per the
poverty/deprivation scenario of the
district. However, because of the
cost involved in obtaining a site
and constructing a decent house,
Table 7.5: Number of Houses Constructed/in Progress in Raichur
District, 2011-12
Taluk SC ST Others Total
Devadurga 27.30 52.68 20.02 9828
Lingsugur 40.22 20.83 38.95 629
Manvi 29.39 32.88 37.73 1031
Raichur 95.66 1.75 2.59 1197
Sindhnur 6.34 9.07 84.59 915
District 32.66 42.29 25.05 13600
Source: DSO, Raichur
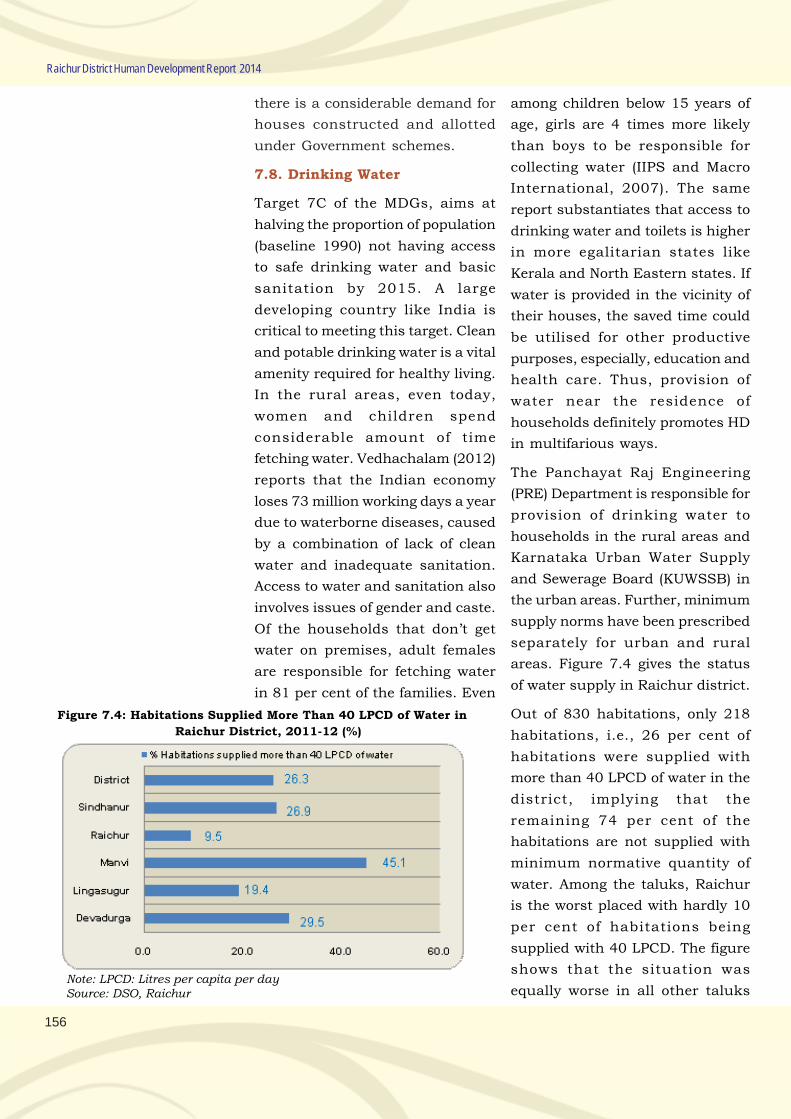
156
Raichur District Human Development Report 2014
there is a considerable demand for
houses constructed and allotted
under Government schemes.
7.8. Drinking Water
Target 7C of the MDGs, aims at
halving the proportion of population
(baseline 1990) not having access
to safe drinking water and basic
sanitation by 2015. A large
developing country like India is
critical to meeting this target. Clean
and potable drinking water is a vital
amenity required for healthy living.
In the rural areas, even today,
women and children spend
considerable amount of time
fetching water. Vedhachalam (2012)
reports that the Indian economy
loses 73 million working days a year
due to waterborne diseases, caused
by a combination of lack of clean
water and inadequate sanitation.
Access to water and sanitation also
involves issues of gender and caste.
Of the households that don’t get
water on premises, adult females
are responsible for fetching water
in 81 per cent of the families. Even
among children below 15 years of
age, girls are 4 times more likely
than boys to be responsible for
collecting water (IIPS and Macro
International, 2007). The same
report substantiates that access to
drinking water and toilets is higher
in more egalitarian states like
Kerala and North Eastern states. If
water is provided in the vicinity of
their houses, the saved time could
be utilised for other productive
purposes, especially, education and
health care. Thus, provision of
water near the residence of
households definitely promotes HD
in multifarious ways.
The Panchayat Raj Engineering
(PRE) Department is responsible for
provision of drinking water to
households in the rural areas and
Karnataka Urban Water Supply
and Sewerage Board (KUWSSB) in
the urban areas. Further, minimum
supply norms have been prescribed
separately for urban and rural
areas. Figure 7.4 gives the status
of water supply in Raichur district.
Out of 830 habitations, only 218
habitations, i.e., 26 per cent of
habitations were supplied with
more than 40 LPCD of water in the
district, implying that the
remaining 74 per cent of the
habitations are not supplied with
minimum normative quantity of
water. Among the taluks, Raichur
is the worst placed with hardly 10
per cent of habitations being
supplied with 40 LPCD. The figure
shows that the situation was
equally worse in all other taluks
Figure 7.4: Habitations Supplied More Than 40 LPCD of Water in
Raichur District, 2011-12 (%)
Note: LPCD: Litres per capita per daySource: DSO, Raichur
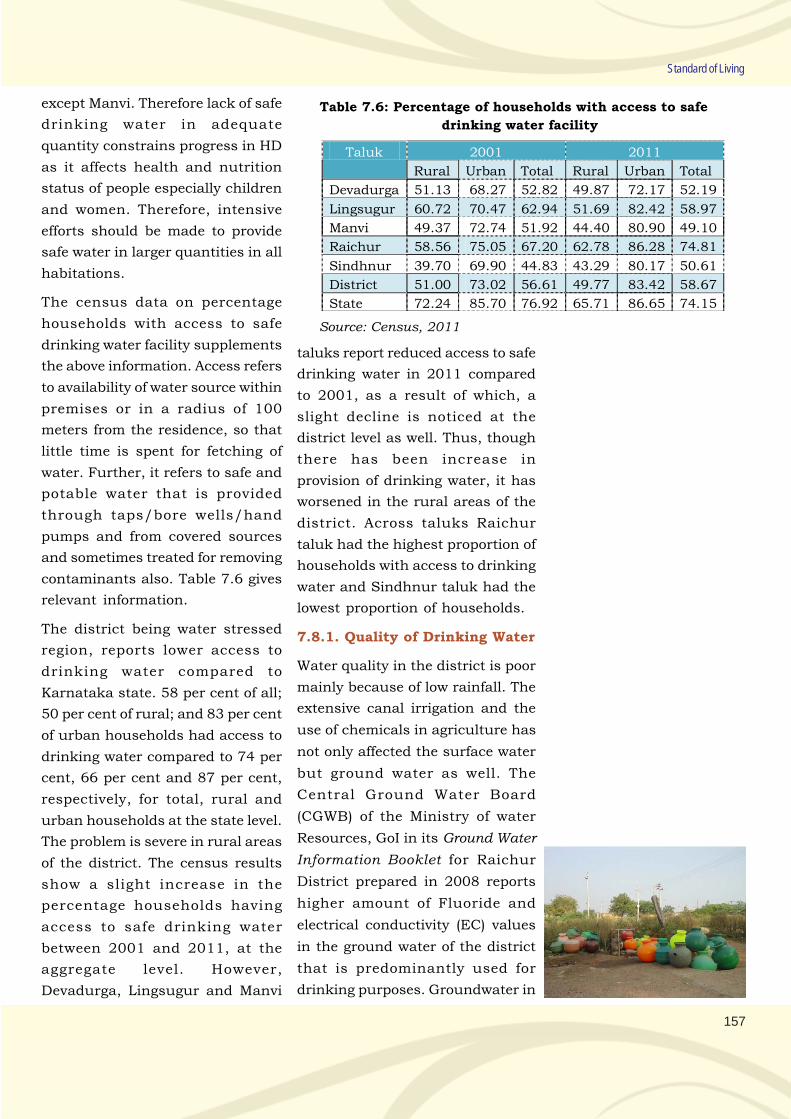
157
Standard of Living
except Manvi. Therefore lack of safe
drinking water in adequate
quantity constrains progress in HD
as it affects health and nutrition
status of people especially children
and women. Therefore, intensive
efforts should be made to provide
safe water in larger quantities in all
habitations.
The census data on percentage
households with access to safe
drinking water facility supplements
the above information. Access refers
to availability of water source within
premises or in a radius of 100
meters from the residence, so that
little time is spent for fetching of
water. Further, it refers to safe and
potable water that is provided
through taps/bore wells/hand
pumps and from covered sources
and sometimes treated for removing
contaminants also. Table 7.6 gives
relevant information.
The district being water stressed
region, reports lower access to
drinking water compared to
Karnataka state. 58 per cent of all;
50 per cent of rural; and 83 per cent
of urban households had access to
drinking water compared to 74 per
cent, 66 per cent and 87 per cent,
respectively, for total, rural and
urban households at the state level.
The problem is severe in rural areas
of the district. The census results
show a slight increase in the
percentage households having
access to safe drinking water
between 2001 and 2011, at the
aggregate level. However,
Devadurga, Lingsugur and Manvi
Table 7.6: Percentage of households with access to safe
drinking water facility
Taluk 2001 2011
Rural Urban Total Rural Urban Total
Devadurga 51.13 68.27 52.82 49.87 72.17 52.19
Lingsugur 60.72 70.47 62.94 51.69 82.42 58.97
Manvi 49.37 72.74 51.92 44.40 80.90 49.10
Raichur 58.56 75.05 67.20 62.78 86.28 74.81
Sindhnur 39.70 69.90 44.83 43.29 80.17 50.61
District 51.00 73.02 56.61 49.77 83.42 58.67
State 72.24 85.70 76.92 65.71 86.65 74.15
Source: Census, 2011
taluks report reduced access to safe
drinking water in 2011 compared
to 2001, as a result of which, a
slight decline is noticed at the
district level as well. Thus, though
there has been increase in
provision of drinking water, it has
worsened in the rural areas of the
district. Across taluks Raichur
taluk had the highest proportion of
households with access to drinking
water and Sindhnur taluk had the
lowest proportion of households.
7.8.1. Quality of Drinking Water
Water quality in the district is poor
mainly because of low rainfall. The
extensive canal irrigation and the
use of chemicals in agriculture has
not only affected the surface water
but ground water as well. The
Central Ground Water Board
(CGWB) of the Ministry of water
Resources, GoI in its Ground Water
Information Booklet for Raichur
District prepared in 2008 reports
higher amount of Fluoride and
electrical conductivity (EC) values
in the ground water of the district
that is predominantly used for
drinking purposes. Groundwater in
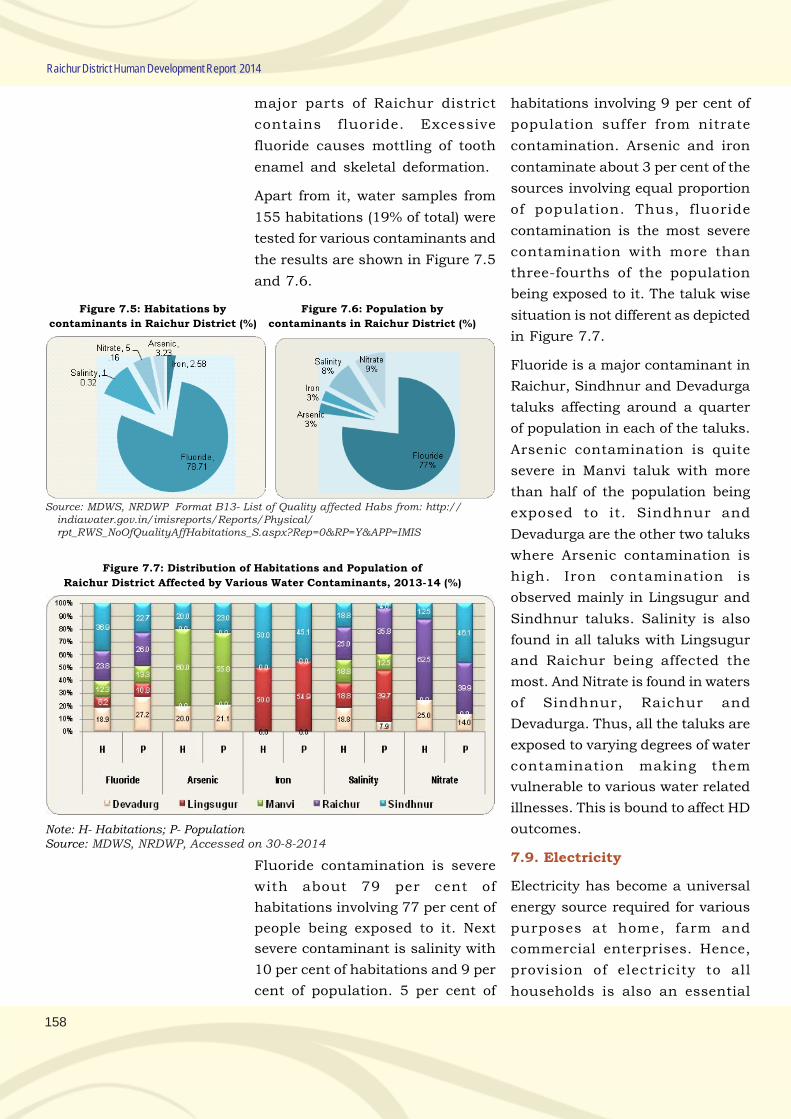
158
Raichur District Human Development Report 2014
major parts of Raichur district
contains fluoride. Excessive
fluoride causes mottling of tooth
enamel and skeletal deformation.
Apart from it, water samples from
155 habitations (19% of total) were
tested for various contaminants and
the results are shown in Figure 7.5
and 7.6.
Figure 7.5: Habitations by
contaminants in Raichur District (%)
Figure 7.6: Population by
contaminants in Raichur District (%)
Source: MDWS, NRDWP Format B13- List of Quality affected Habs from: http://indiawater.gov.in/imisreports/Reports/Physical/rpt_RWS_NoOfQualityAffHabitations_S.aspx?Rep=0&RP=Y&APP=IMIS
Fluoride contamination is severe
with about 79 per cent of
habitations involving 77 per cent of
people being exposed to it. Next
severe contaminant is salinity with
10 per cent of habitations and 9 per
cent of population. 5 per cent of
habitations involving 9 per cent of
population suffer from nitrate
contamination. Arsenic and iron
contaminate about 3 per cent of the
sources involving equal proportion
of population. Thus, fluoride
contamination is the most severe
contamination with more than
three-fourths of the population
being exposed to it. The taluk wise
situation is not different as depicted
in Figure 7.7.
Fluoride is a major contaminant in
Raichur, Sindhnur and Devadurga
taluks affecting around a quarter
of population in each of the taluks.
Arsenic contamination is quite
severe in Manvi taluk with more
than half of the population being
exposed to it. Sindhnur and
Devadurga are the other two taluks
where Arsenic contamination is
high. Iron contamination is
observed mainly in Lingsugur and
Sindhnur taluks. Salinity is also
found in all taluks with Lingsugur
and Raichur being affected the
most. And Nitrate is found in waters
of Sindhnur, Raichur and
Devadurga. Thus, all the taluks are
exposed to varying degrees of water
contamination making them
vulnerable to various water related
illnesses. This is bound to affect HD
outcomes.
7.9. Electricity
Electricity has become a universal
energy source required for various
purposes at home, farm and
commercial enterprises. Hence,
provision of electricity to all
households is also an essential
Figure 7.7: Distribution of Habitations and Population of
Raichur District Affected by Various Water Contaminants, 2013-14 (%)
Note: H- Habitations; P- PopulationSource: MDWS, NRDWP, Accessed on 30-8-2014
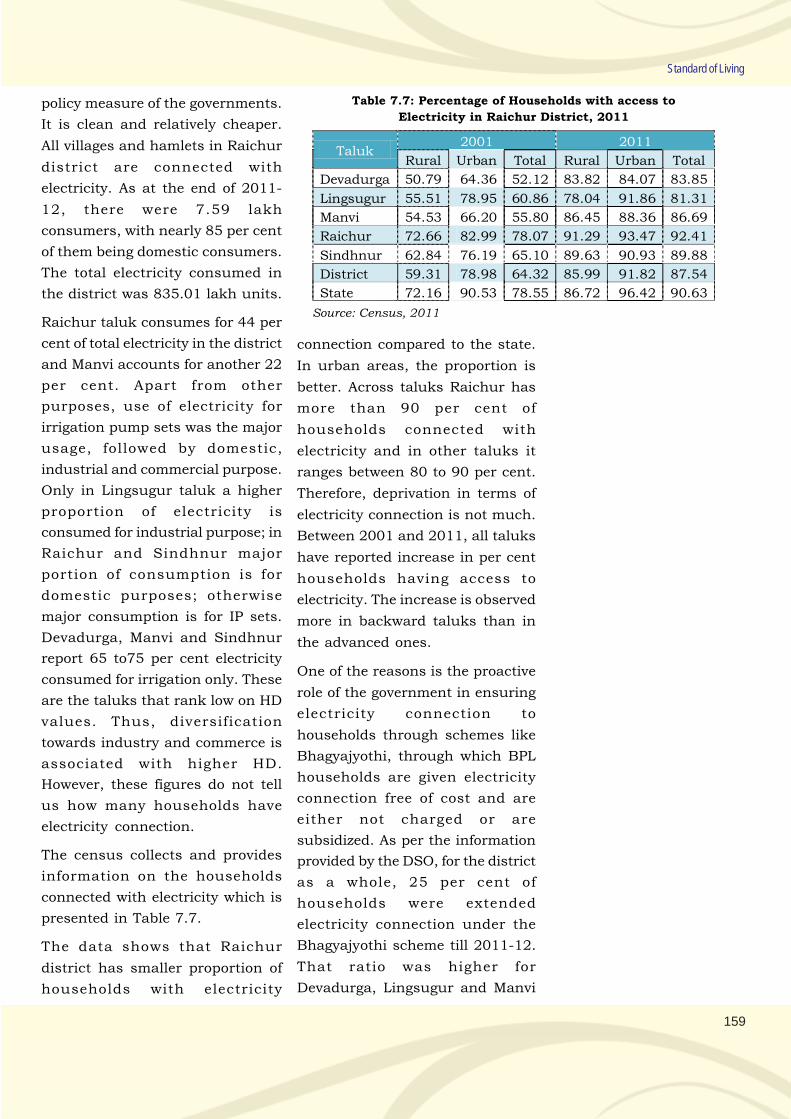
159
Standard of Living
policy measure of the governments.
It is clean and relatively cheaper.
All villages and hamlets in Raichur
district are connected with
electricity. As at the end of 2011-
12, there were 7.59 lakh
consumers, with nearly 85 per cent
of them being domestic consumers.
The total electricity consumed in
the district was 835.01 lakh units.
Raichur taluk consumes for 44 per
cent of total electricity in the district
and Manvi accounts for another 22
per cent. Apart from other
purposes, use of electricity for
irrigation pump sets was the major
usage, followed by domestic,
industrial and commercial purpose.
Only in Lingsugur taluk a higher
proportion of electricity is
consumed for industrial purpose; in
Raichur and Sindhnur major
portion of consumption is for
domestic purposes; otherwise
major consumption is for IP sets.
Devadurga, Manvi and Sindhnur
report 65 to75 per cent electricity
consumed for irrigation only. These
are the taluks that rank low on HD
values. Thus, diversification
towards industry and commerce is
associated with higher HD.
However, these figures do not tell
us how many households have
electricity connection.
The census collects and provides
information on the households
connected with electricity which is
presented in Table 7.7.
The data shows that Raichur
district has smaller proportion of
households with electricity
Table 7.7: Percentage of Households with access to
Electricity in Raichur District, 2011
Taluk 2001 2011
Rural Urban Total Rural Urban Total
Devadurga 50.79 64.36 52.12 83.82 84.07 83.85
Lingsugur 55.51 78.95 60.86 78.04 91.86 81.31
Manvi 54.53 66.20 55.80 86.45 88.36 86.69
Raichur 72.66 82.99 78.07 91.29 93.47 92.41
Sindhnur 62.84 76.19 65.10 89.63 90.93 89.88
District 59.31 78.98 64.32 85.99 91.82 87.54
State 72.16 90.53 78.55 86.72 96.42 90.63
Source: Census, 2011
connection compared to the state.
In urban areas, the proportion is
better. Across taluks Raichur has
more than 90 per cent of
households connected with
electricity and in other taluks it
ranges between 80 to 90 per cent.
Therefore, deprivation in terms of
electricity connection is not much.
Between 2001 and 2011, all taluks
have reported increase in per cent
households having access to
electricity. The increase is observed
more in backward taluks than in
the advanced ones.
One of the reasons is the proactive
role of the government in ensuring
electricity connection to
households through schemes like
Bhagyajyothi, through which BPL
households are given electricity
connection free of cost and are
either not charged or are
subsidized. As per the information
provided by the DSO, for the district
as a whole, 25 per cent of
households were extended
electricity connection under the
Bhagyajyothi scheme till 2011-12.
That ratio was higher for
Devadurga, Lingsugur and Manvi
160
Raichur District Human Development Report 2014
taluks. Even Sindhnur taluk had
23 per cent households availing
benefit under Bhagyajyothi
scheme, where as in Raichur taluk
it was 19 per cent. Thus, the
backward taluks in HD had higher
proportion of beneficiaries under
the scheme. Extension of
connection is not a problem, what
is essential is regularity and
continuity in electricity supply.
With alternative sources of
electricity being tapped, the
scenario may change for better in
days to come.
7.10. Traditional and Modern Fuel
A typical Indian rural woman
spends most of her time in kitchen
cooking food for the family. They
normally use conventional fuel
types like the agricultural residue,
fuel wood, dung cakes, kerosene
and charcoal. These sources are not
healthy in the sense, they emit lot
of smoke and soot and other
poisonous gases like CO and CO2.
The houses they live in do not have
adequate ventilation facilities and
the women are subject to a number
of respiratory and neurological
disorders. Therefore, providing
cleaner fuels like bio-gas,
electricity and LPG can reduce the
ill health of women and promote HD.
The census provides the number of
households using clean cooking
fuel types and based on that, the
relevant information is given in
Table 7.8.
It is evident that about one-third of
the households in the state use
modern cooking fuel and hardly 12
Table 7.8: Households with Accessto Modern Cooking Fuel in Raichur
District, 2011 (%)
Taluk Rural Urban Total
Devadurga 2.91 22.73 4.97
Lingsugur 4.74 39.60 12.99
Manvi 9.01 28.38 11.50
Raichur 4.56 45.46 25.48
Sindhnur 11.44 34.95 16.11
District 6.95 39.99 15.69
State 12.02 65.34 33.52
Source: Census, 2011
per cent of rural households do so.
In Raichur district, only 16 per
cent of households use modern
cooking fuel, and in rural areas the
percentage is hardly 7 per cent.
Extensive availability of crop
residue and relative inaccessibility
of modern fuel are the reasons for
excessive dependence on
traditional fuel types. In urban
areas, on the other hand, 40 per
cent of households report the use
of modern cooking fuel. Among
taluks, naturally Raichur taluk has
the highest usage of modern fuel
(25 per cent). The other taluks
report less than 10 per cent of
households using modern fuel and
is about and in Devadurga taluk, it
is a mere 5 per cent. The rural-
urban disparity with respect to this
indicator is quite severe.
7.11. Sanitation
That of standard of living and
quality of life are affected by various
factors is now well accepted. Access
to safe water and sanitation, good
health and literacy are some of the
crucial factors other than income.
Health is largely affected by the
cleanliness and sanitation of an
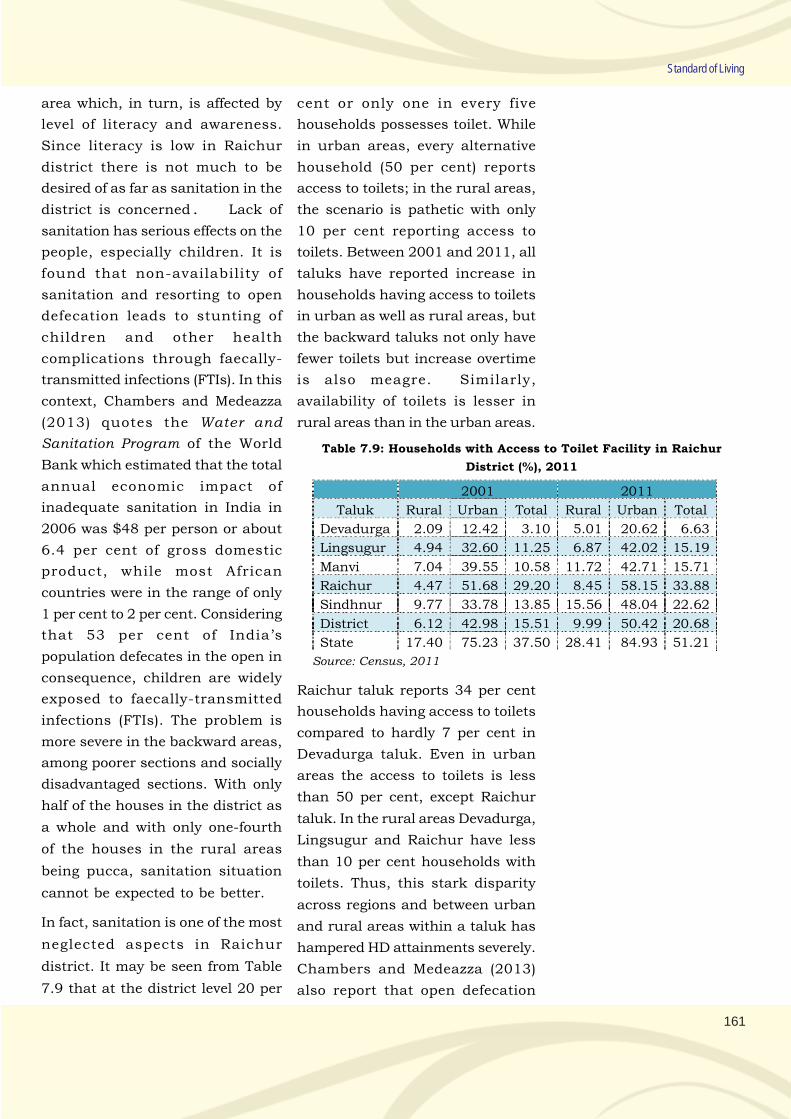
161
Standard of Living
area which, in turn, is affected by
level of literacy and awareness.
Since literacy is low in Raichur
district there is not much to be
desired of as far as sanitation in the
district is concerned. Lack of
sanitation has serious effects on the
people, especially children. It is
found that non-availability of
sanitation and resorting to open
defecation leads to stunting of
children and other health
complications through faecally-
transmitted infections (FTIs). In this
context, Chambers and Medeazza
(2013) quotes the Water and
Sanitation Program of the World
Bank which estimated that the total
annual economic impact of
inadequate sanitation in India in
2006 was $48 per person or about
6.4 per cent of gross domestic
product, while most African
countries were in the range of only
1 per cent to 2 per cent. Considering
that 53 per cent of India’s
population defecates in the open in
consequence, children are widely
exposed to faecally-transmitted
infections (FTIs). The problem is
more severe in the backward areas,
among poorer sections and socially
disadvantaged sections. With only
half of the houses in the district as
a whole and with only one-fourth
of the houses in the rural areas
being pucca, sanitation situation
cannot be expected to be better.
In fact, sanitation is one of the most
neglected aspects in Raichur
district. It may be seen from Table
7.9 that at the district level 20 per
cent or only one in every five
households possesses toilet. While
in urban areas, every alternative
household (50 per cent) reports
access to toilets; in the rural areas,
the scenario is pathetic with only
10 per cent reporting access to
toilets. Between 2001 and 2011, all
taluks have reported increase in
households having access to toilets
in urban as well as rural areas, but
the backward taluks not only have
fewer toilets but increase overtime
is also meagre. Similarly,
availability of toilets is lesser in
rural areas than in the urban areas.
Table 7.9: Households with Access to Toilet Facility in Raichur
District (%), 2011
2001 2011
Taluk Rural Urban Total Rural Urban Total
Devadurga 2.09 12.42 3.10 5.01 20.62 6.63
Lingsugur 4.94 32.60 11.25 6.87 42.02 15.19
Manvi 7.04 39.55 10.58 11.72 42.71 15.71
Raichur 4.47 51.68 29.20 8.45 58.15 33.88
Sindhnur 9.77 33.78 13.85 15.56 48.04 22.62
District 6.12 42.98 15.51 9.99 50.42 20.68
State 17.40 75.23 37.50 28.41 84.93 51.21
Source: Census, 2011
Raichur taluk reports 34 per cent
households having access to toilets
compared to hardly 7 per cent in
Devadurga taluk. Even in urban
areas the access to toilets is less
than 50 per cent, except Raichur
taluk. In the rural areas Devadurga,
Lingsugur and Raichur have less
than 10 per cent households with
toilets. Thus, this stark disparity
across regions and between urban
and rural areas within a taluk has
hampered HD attainments severely.
Chambers and Medeazza (2013)
also report that open defecation
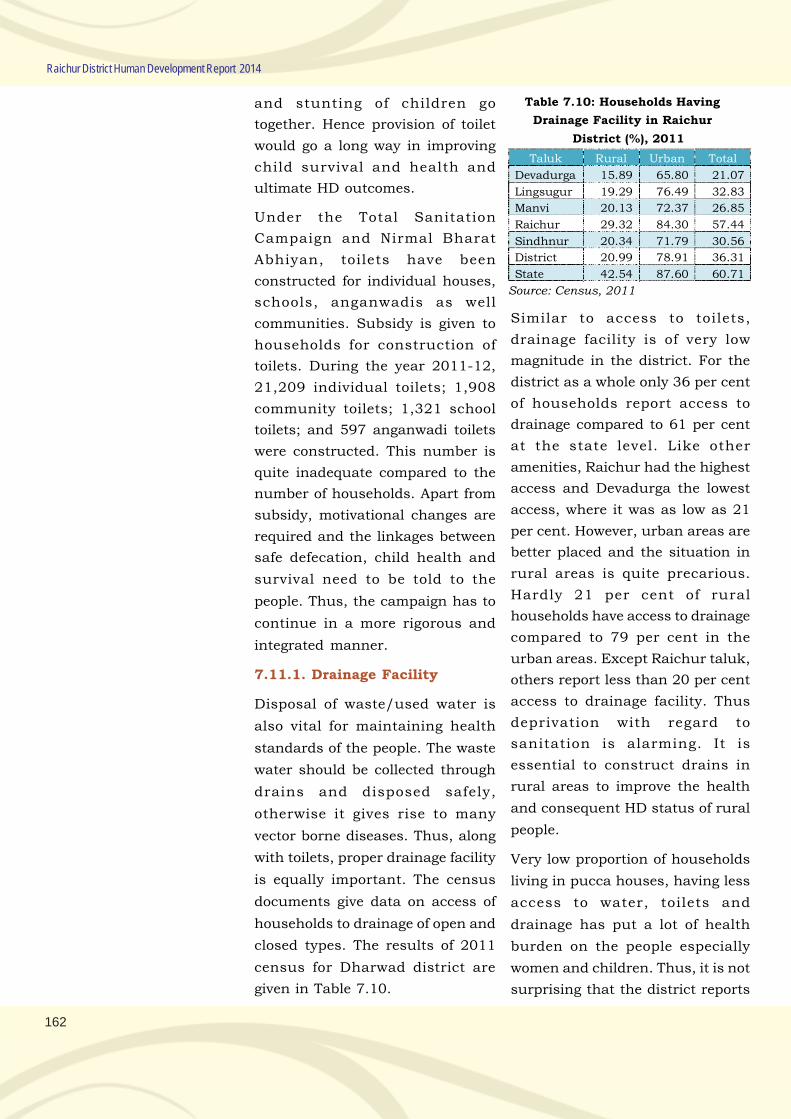
162
Raichur District Human Development Report 2014
and stunting of children go
together. Hence provision of toilet
would go a long way in improving
child survival and health and
ultimate HD outcomes.
Under the Total Sanitation
Campaign and Nirmal Bharat
Abhiyan, toilets have been
constructed for individual houses,
schools, anganwadis as well
communities. Subsidy is given to
households for construction of
toilets. During the year 2011-12,
21,209 individual toilets; 1,908
community toilets; 1,321 school
toilets; and 597 anganwadi toilets
were constructed. This number is
quite inadequate compared to the
number of households. Apart from
subsidy, motivational changes are
required and the linkages between
safe defecation, child health and
survival need to be told to the
people. Thus, the campaign has to
continue in a more rigorous and
integrated manner.
7.11.1. Drainage Facility
Disposal of waste/used water is
also vital for maintaining health
standards of the people. The waste
water should be collected through
drains and disposed safely,
otherwise it gives rise to many
vector borne diseases. Thus, along
with toilets, proper drainage facility
is equally important. The census
documents give data on access of
households to drainage of open and
closed types. The results of 2011
census for Dharwad district are
given in Table 7.10.
Table 7.10: Households Having
Drainage Facility in Raichur
District (%), 2011
Taluk Rural Urban Total
Devadurga 15.89 65.80 21.07
Lingsugur 19.29 76.49 32.83
Manvi 20.13 72.37 26.85
Raichur 29.32 84.30 57.44
Sindhnur 20.34 71.79 30.56
District 20.99 78.91 36.31
State 42.54 87.60 60.71
Source: Census, 2011
Similar to access to toilets,
drainage facility is of very low
magnitude in the district. For the
district as a whole only 36 per cent
of households report access to
drainage compared to 61 per cent
at the state level. Like other
amenities, Raichur had the highest
access and Devadurga the lowest
access, where it was as low as 21
per cent. However, urban areas are
better placed and the situation in
rural areas is quite precarious.
Hardly 21 per cent of rural
households have access to drainage
compared to 79 per cent in the
urban areas. Except Raichur taluk,
others report less than 20 per cent
access to drainage facility. Thus
deprivation with regard to
sanitation is alarming. It is
essential to construct drains in
rural areas to improve the health
and consequent HD status of rural
people.
Very low proportion of households
living in pucca houses, having less
access to water, toilets and
drainage has put a lot of health
burden on the people especially
women and children. Thus, it is not
surprising that the district reports
163
Standard of Living
very high mortality rates because of
which its HD status is the last in the
state. Diversification of fuel use at
the household level is another
strategy that could be adopted to
bring about a positive impact on HD
in the district.
As a result of the very dismal
performance in the sanitation front,
the proportion of panchayats
awarded with ‘Nirmal Gram
Puraskar’ (NGP) award is the lowest
in Raichur district. That so far only
one gram panchayat in Sindhnur
taluk has been awarded with NGP
shows how poor the sanitation
situation is! Therefore, all round
efforts are needed to improve
sanitation in the district, with more
focus in the rural areas.
7.12. Open Defecation and Toilet
Requirement in Raichur District
With the world’s largest population
that defecates in the open, India is
in a pathetic condition as far as
sanitation is concerned. According
to data released by the National
Sample Survey Office (NSSO) in
December 2013, 59.4 per cent of
rural India defecates in the open.
The 2011 Census puts the national
toilet coverage at only 31 per cent,
which is in contrast to the reports
of the Ministry of Drinking Water
Supply (MDWS) which had all along
put the figure at 68 per cent.
According to a report by the Centre
for Science and Environment, New
Delhi, the MDWS states that up to
2013, 93.5 million toilets have been
built in India at a cost of Rs.15,000
crores. Yet the number of rural
households without access to
toilets is 113 million. The official
deadline for attaining total
sanitation is 2022 and to meet this
target of 15.3 million toilets need
to be constructed every year. But
the current rate is 4 million, which
renders total sanitation possible
only by 2044. So the task is
stupendous and the progress is
tardy.
The costs of this tardy progress are
colossal as revealed by World
Bank’s Economic Impact of
Inadequate Sanitation in India
published by Water and Sanitation
Programme, 2011. It is estimated
that the economic impact of
inadequate sanitation in India in
Rs.2.4 trillion, out of which health
costs account for Rs. 1.75 trillion,
making the annual loss per capita
at Rs.2180. Of the total health
related loss, diarrhoea among
children below five years of age
accounts for Rs. 824 bn. While the
poorest rural households are
estimated to suffer a loss of Rs. 204
billion, the urban counterparts
suffer Rs. 16 billion loss. Thus, lack
of sanitation affects health and
survival, especially of children and
the poor and is economically
burdensome as well.
Sanitation scenario is one of the
worst in Raichur district. The data
in Figure 7.8 shows that nearly 71
per cent of households resort to
open defecation. In the rural areas,
it is as high as 83 per cent and more
than two-thirds in the urban areas.
These values are quite higher than
The proportion
of panchayats
awarded with
‘Nirmal Gram
Puraskar’
(NGP) award
is the lowest
in Raichur
district
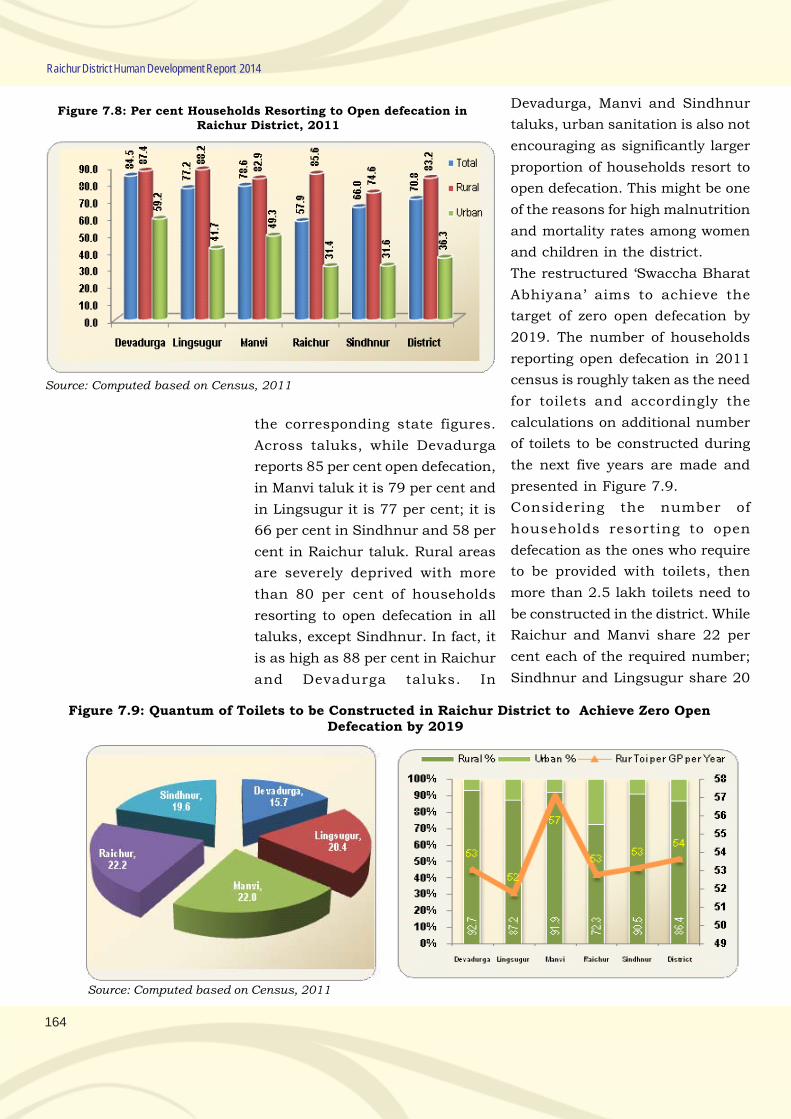
164
Raichur District Human Development Report 2014
the corresponding state figures.
Across taluks, while Devadurga
reports 85 per cent open defecation,
in Manvi taluk it is 79 per cent and
in Lingsugur it is 77 per cent; it is
66 per cent in Sindhnur and 58 per
cent in Raichur taluk. Rural areas
are severely deprived with more
than 80 per cent of households
resorting to open defecation in all
taluks, except Sindhnur. In fact, it
is as high as 88 per cent in Raichur
and Devadurga taluks. In
Devadurga, Manvi and Sindhnur
taluks, urban sanitation is also not
encouraging as significantly larger
proportion of households resort to
open defecation. This might be one
of the reasons for high malnutrition
and mortality rates among women
and children in the district.
The restructured ‘Swaccha Bharat
Abhiyana’ aims to achieve the
target of zero open defecation by
2019. The number of households
reporting open defecation in 2011
census is roughly taken as the need
for toilets and accordingly the
calculations on additional number
of toilets to be constructed during
the next five years are made and
presented in Figure 7.9.
Considering the number of
households resorting to open
defecation as the ones who require
to be provided with toilets, then
more than 2.5 lakh toilets need to
be constructed in the district. While
Raichur and Manvi share 22 per
cent each of the required number;
Sindhnur and Lingsugur share 20
Figure 7.8: Per cent Households Resorting to Open defecation inRaichur District, 2011
Source: Computed based on Census, 2011
Figure 7.9: Quantum of Toilets to be Constructed in Raichur District to Achieve Zero OpenDefecation by 2019
Source: Computed based on Census, 2011
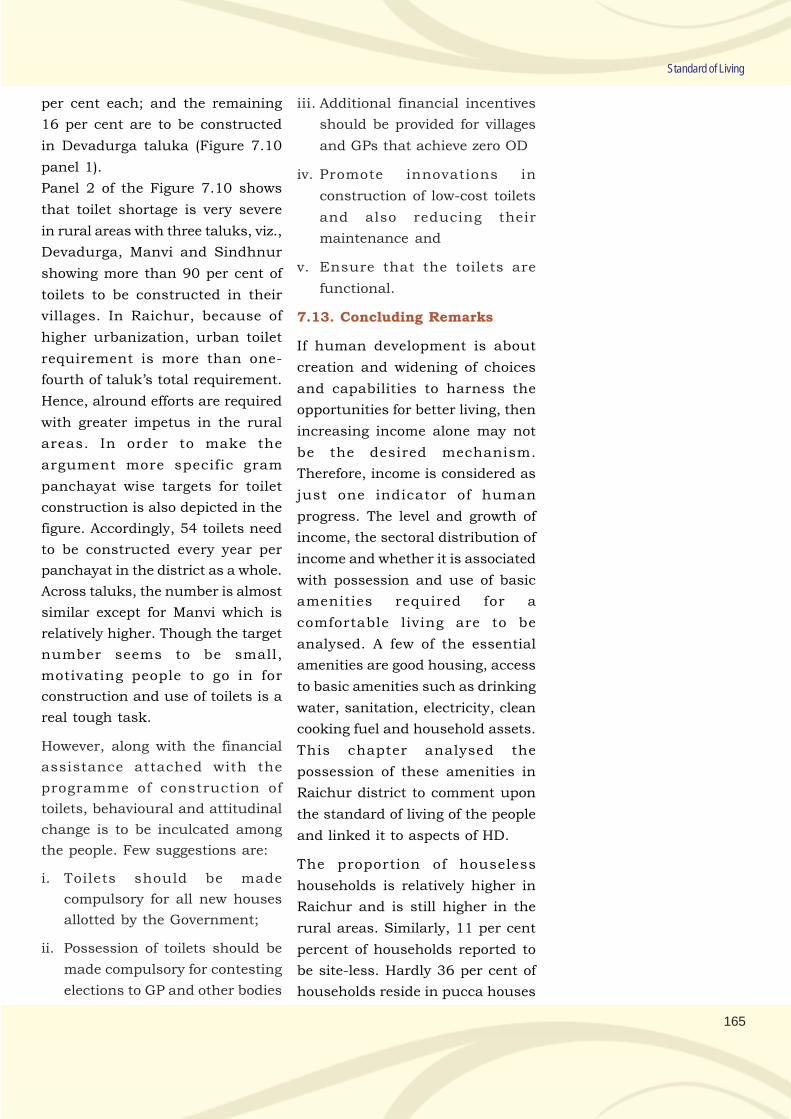
165
Standard of Living
per cent each; and the remaining
16 per cent are to be constructed
in Devadurga taluka (Figure 7.10
panel 1).
Panel 2 of the Figure 7.10 shows
that toilet shortage is very severe
in rural areas with three taluks, viz.,
Devadurga, Manvi and Sindhnur
showing more than 90 per cent of
toilets to be constructed in their
villages. In Raichur, because of
higher urbanization, urban toilet
requirement is more than one-
fourth of taluk’s total requirement.
Hence, alround efforts are required
with greater impetus in the rural
areas. In order to make the
argument more specific gram
panchayat wise targets for toilet
construction is also depicted in the
figure. Accordingly, 54 toilets need
to be constructed every year per
panchayat in the district as a whole.
Across taluks, the number is almost
similar except for Manvi which is
relatively higher. Though the target
number seems to be small,
motivating people to go in for
construction and use of toilets is a
real tough task.
However, along with the financial
assistance attached with the
programme of construction of
toilets, behavioural and attitudinal
change is to be inculcated among
the people. Few suggestions are:
i. Toilets should be made
compulsory for all new houses
allotted by the Government;
ii. Possession of toilets should be
made compulsory for contesting
elections to GP and other bodies
iii. Additional financial incentives
should be provided for villages
and GPs that achieve zero OD
iv. Promote innovations in
construction of low-cost toilets
and also reducing their
maintenance and
v. Ensure that the toilets are
functional.
7.13. Concluding Remarks
If human development is about
creation and widening of choices
and capabilities to harness the
opportunities for better living, then
increasing income alone may not
be the desired mechanism.
Therefore, income is considered as
just one indicator of human
progress. The level and growth of
income, the sectoral distribution of
income and whether it is associated
with possession and use of basic
amenities required for a
comfortable living are to be
analysed. A few of the essential
amenities are good housing, access
to basic amenities such as drinking
water, sanitation, electricity, clean
cooking fuel and household assets.
This chapter analysed the
possession of these amenities in
Raichur district to comment upon
the standard of living of the people
and linked it to aspects of HD.
The proportion of houseless
households is relatively higher in
Raichur and is still higher in the
rural areas. Similarly, 11 per cent
percent of households reported to
be site-less. Hardly 36 per cent of
households reside in pucca houses
166
Raichur District Human Development Report 2014
in Raichur district. Thus, with 421
houseless and about 42,000
siteless households; 1,54,000
households residing in non-pucca
houses; and about 22,500
households residing in dilapidated
houses; the housing problem is
quite severe.
As far as possession of assets is
concerned, one in every five
households did not possess any of
the select assets; that proportion
was one in every 10 households in
the rural areas. 2.5 per cent of
households did own modern assets
like computer/laptop, telephones,
2/4 wheelers, etc. This reiterates
the poverty position of the district.
But, 61 per cent of households
reported to have availed banking
services in the district.
In terms of basic amenities, 26 per
cent of habitations were supplied
with more than 40 LPCD of water;
only 16 per cent of households used
clean cooking fuel; hardly 20 per
cent possessed toilet; and every
alternative household (50 per cent)
reported access to drainage.
Electricity connection was relatively
satisfactory though not universal.
The rural areas depict a picture of
stark deprivation with hardly 7 per
cent households using clean fuel;
barely 10 per cent reporting access
to toilets; and only 36 per cent
reporting access to drainage.
However, water quality is very
doubtful with fluoride
contamination being critical
affecting more than three-fourths of
the population of the district.
Sanitation is a severe problem in
the district with 71 per cent
households resorting to open
defecation (OD) which is almost 75
per cent higher than the state
figure. Worse scenario is that of
rural sanitation where 83 per cent
households resort to OD. In order
to achieve zero OD by 2019, it is
estimated that the number of toilets
to be constructed per GP works out
to 54 per year. Access to drainage
is also not complete with less than
half of the households having
access to it and only 43 per cent in
rural areas.
Very low proportion of households
living in pucca houses, having less
access to water, toilets and
drainage has put a lot of health
burden on the people especially
women and children. Thus, it is not
surprising that the district reports
very high mortality rates because
of which its HD status is the last in
the state. Diversification of fuel use
at the household level is another
strategy that could be adopted to
bring about a positive impact on HD
in the district. Income generating
options need to be expanded so that
people are able to access the basic
amenities. Government’s role in
identifying the poor and extending
basic facilities to them is also
emphasized.
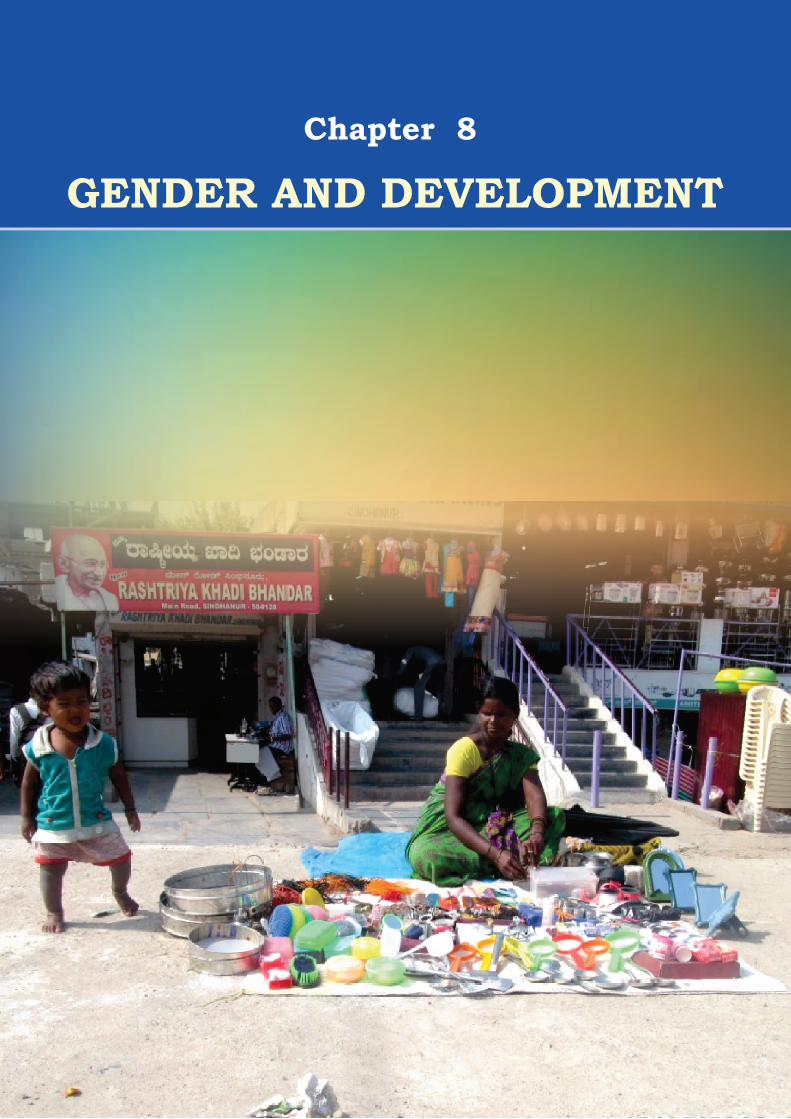
GENDER AND DEVELOPMENT
Chapter 8

.
169
Chapter 8
Gender Development
8.1. Introduction
Gender relations are the key to
understanding the inequalities
between men and women. In many
cultures, women suffer from an
imposed role of inferiority which
leads to “gender differentials in
nutrition, food allocation, health
status and health expenditure,
education, mortality rates and life
expectancy.”The term gender is a
broader concept that indicates the
culturally specific set of
characteristics that identifies the
social behaviour of women and men
and the relationship between them.
But in common parlance, gender
and sex are used interchangeably.
‘Sex’ identifies the biological
differences between women and
men and gender goes beyond that
and does not simply refer to women
or men, but to the relationship
between them, and the way it is
socially constructed. Because it is
a relational term, gender must
include women and men. According
to GoK (2006), like the concepts of
class, race and ethnicity, gender is
an analytical tool for understanding
social processes. In India like many
other patriarchal societies,
discrimination against women is
manifold and females are deprived
of even basic necessities. If woman
belongs to a disadvantaged
community, then discriminations
and deprivations faced by her are
manifold. Unfortunately, the feeling
that a female child is a ‘burden’
continues even today. The
Eleventh Five Year Plan of the
Government of India lamented that
“Gender inequality…remains a
pervasive problem.” Discrimination
and inequality is extensive both
within and outside the house.
However, Gender equity is one of
the cornerstones for sustaining
human development. Being half of
the population, enhancing the
capabilities of womenfolk and
empowering them will not only
accelerate human development but
many other related problems could
also be overcome. Poverty could
also come down with development
of women. As The Global Gender
Gap Report 2013 recommends that
in order to maximize
competitiveness and development
potential, each country should
strive for gender equality—that is,
it should give women the same
rights, responsibilities and
opportunities as men. The present
chapter attempts to analyse the
status of females, extent of
inequality in gender development
processes and suggest suitable
actions to mainstream women for
development and engender
development.
8.2. Gender Differentials in the
District
Gender differentials could be
studied using different parameters.
Gender is the term
for the socially and
culturally defined
roles for each of the
sexes. Although
women are women
everywhere on earth
and men are men,
what is considered
a “normal activity”
for each of the
sexes varies from
place to place and
from culture to
culture. The
variation in these
roles suggests that
the different
activities of women
and men in practice
have less to do with
their biological sex,
than with the social
and cultural context
in which they live.
We talk about
gender rather than
sex because while
a person’s sex does
not change, gender
roles are socially
determined and can
evolve together with
society.
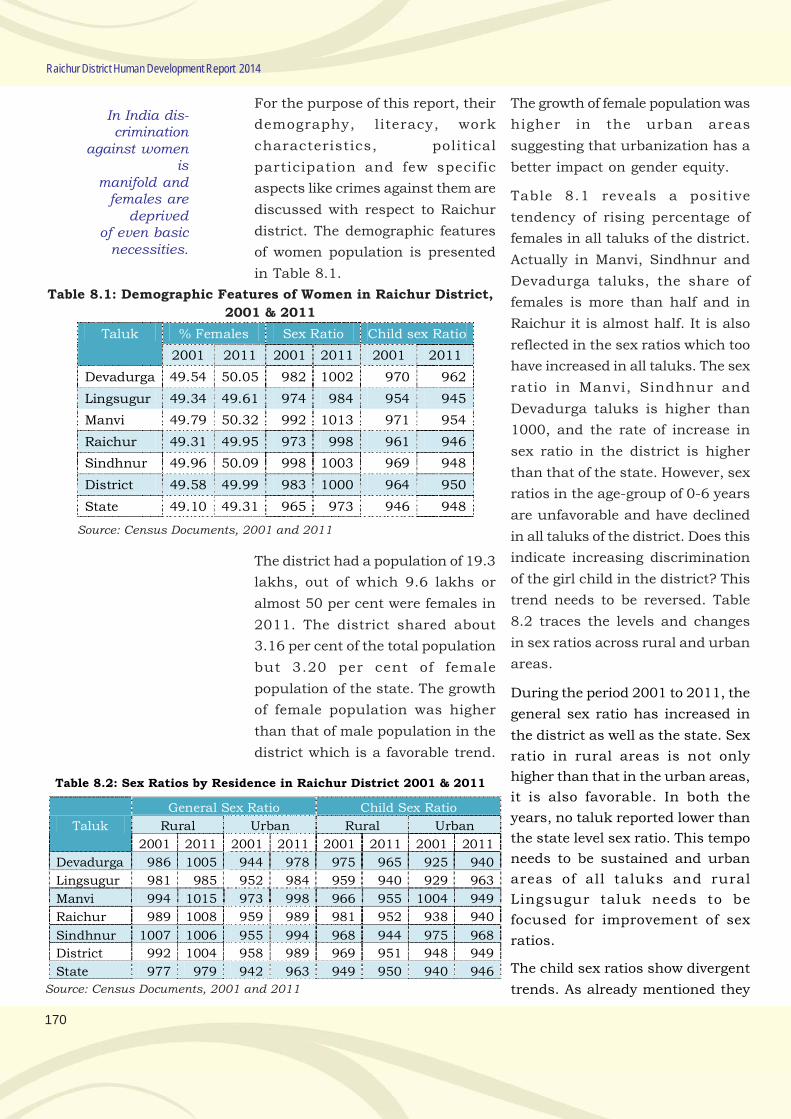
170
Raichur District Human Development Report 2014
For the purpose of this report, their
demography, literacy, work
characteristics, political
participation and few specific
aspects like crimes against them are
discussed with respect to Raichur
district. The demographic features
of women population is presented
in Table 8.1.
Table 8.1: Demographic Features of Women in Raichur District,
2001 & 2011
Taluk % Females Sex Ratio Child sex Ratio
2001 2011 2001 2011 2001 2011
Devadurga 49.54 50.05 982 1002 970 962
Lingsugur 49.34 49.61 974 984 954 945
Manvi 49.79 50.32 992 1013 971 954
Raichur 49.31 49.95 973 998 961 946
Sindhnur 49.96 50.09 998 1003 969 948
District 49.58 49.99 983 1000 964 950
State 49.10 49.31 965 973 946 948
Source: Census Documents, 2001 and 2011
The district had a population of 19.3
lakhs, out of which 9.6 lakhs or
almost 50 per cent were females in
2011. The district shared about
3.16 per cent of the total population
but 3.20 per cent of female
population of the state. The growth
of female population was higher
than that of male population in the
district which is a favorable trend.
The growth of female population was
higher in the urban areas
suggesting that urbanization has a
better impact on gender equity.
Table 8.1 reveals a positive
tendency of rising percentage of
females in all taluks of the district.
Actually in Manvi, Sindhnur and
Devadurga taluks, the share of
females is more than half and in
Raichur it is almost half. It is also
reflected in the sex ratios which too
have increased in all taluks. The sex
ratio in Manvi, Sindhnur and
Devadurga taluks is higher than
1000, and the rate of increase in
sex ratio in the district is higher
than that of the state. However, sex
ratios in the age-group of 0-6 years
are unfavorable and have declined
in all taluks of the district. Does this
indicate increasing discrimination
of the girl child in the district? This
trend needs to be reversed. Table
8.2 traces the levels and changes
in sex ratios across rural and urban
areas.
During the period 2001 to 2011, the
general sex ratio has increased in
the district as well as the state. Sex
ratio in rural areas is not only
higher than that in the urban areas,
it is also favorable. In both the
years, no taluk reported lower than
the state level sex ratio. This tempo
needs to be sustained and urban
areas of all taluks and rural
Lingsugur taluk needs to be
focused for improvement of sex
ratios.
The child sex ratios show divergent
trends. As already mentioned they
Table 8.2: Sex Ratios by Residence in Raichur District 2001 & 2011
Taluk
General Sex Ratio Child Sex Ratio
Rural Urban Rural Urban
2001 2011 2001 2011 2001 2011 2001 2011
Devadurga 986 1005 944 978 975 965 925 940
Lingsugur 981 985 952 984 959 940 929 963
Manvi 994 1015 973 998 966 955 1004 949
Raichur 989 1008 959 989 981 952 938 940
Sindhnur 1007 1006 955 994 968 944 975 968
District 992 1004 958 989 969 951 948 949
State 977 979 942 963 949 950 940 946
Source: Census Documents, 2001 and 2011
In India dis-crimination
against womenis
manifold andfemales are
deprivedof even basic
necessities.
171
Gender Development
are lower than the general sex
ratios. The values have declined in
rural areas of all taluks. Rural
Lingsugur reports lowest child sex
ratio of 940. In the urban areas,
Manvi had a favorable sex ratio in
2001 but has turned adverse in
2011. It has also declined in
Sindhnur taluk. In other taluks, it
has shown improvement, especially
Lingsugur which has the lowest
general sex ratio. Hence, urban
areas of all taluks need to be
focused for improving sex ratios.
These declining child sex ratios are
a severe cause of concern.
The sex ratio for SC and ST sections
is better in the district compared to
the state. Actually both have turned
favorable in 2011. This is so for all
taluks. Only in Lingsugur, the sex
ratio among SCs is adverse at 978,
but everywhere else, it is favorable.
Looking at the changes sex ratios,
except for Lingsugur and Sindhnur,
all taluks have registered increases
in the sex ratios of SCs and STs.
This might be indicative of the
cultural belief of these sections
wherein a girl child is not treated
as a burden like in other
communities. Hence, the current
activities need to be continued to
maintain the favorableness of the
sex ratios.
8.3. Gender Patterns of Literacy
and Enrolment
Education is a social capability that
empowers a person with
information and helps him/her to
take a good decision. It enhances
skill levels and productivity of the
population. It also generates
positive social externalities like
good health, higher participation
and better empowerment.
Especially literacy among females
is relatively more beneficial as it
affects child upbringing and
household management. Female
literacy is found to have a favorable
impact on socio-demographic
indicators like usage of
contraceptives, limiting the size of
the family, better care of children,
etc. It is also associated with lower
morbidity and mortality rates
among mothers and children.
Hence, universalizing female
education is a sure means of gender
as well as human development.
That is why a Kannada saying is
“Hennondu Kalitare Shaleyondu
Teredante” meaning, if a woman is
made literate, it is akin to opening
a school. Achievements in literacy
have already been studied in
Chapter 4. Here a few aspects with
respect to gender inequities will be
taken up. Relevant data is
furnished in Table 8.3.
In 2011, less than half (48.7 per
cent) of females were literate in
Raichur district compared to 70.5
per cent of males. Literacy
attainments have increased
between 2001 and 2011. The
district literacy rates were
considerably lower than the state
figures, indicating a greater
proportion of illiterate population in
the district. Illiterates among
females are significantly higher
than among males. Across taluks,
Education is a
social capabil-
ity that
empowers a
person with
information
and helps
him/her to
take a good
decision.
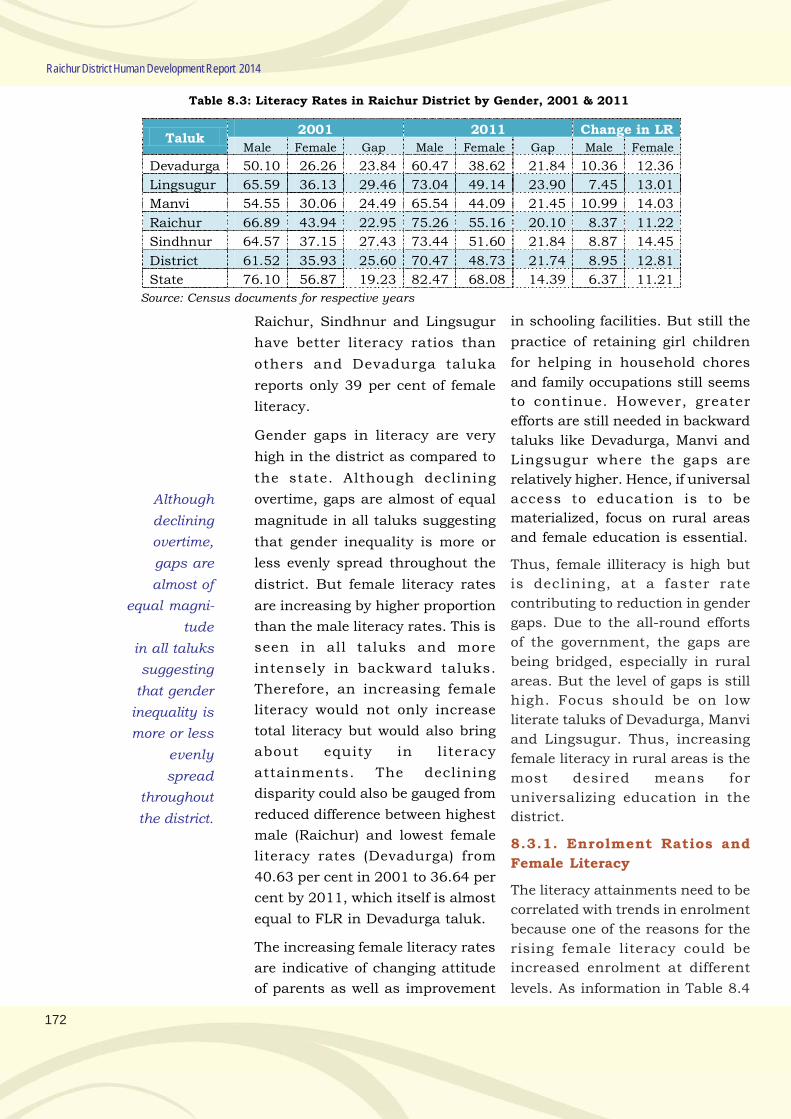
172
Raichur District Human Development Report 2014
Table 8.3: Literacy Rates in Raichur District by Gender, 2001 & 2011
Taluk 2001 2011 Change in LR
Male Female Gap Male Female Gap Male Female
Devadurga 50.10 26.26 23.84 60.47 38.62 21.84 10.36 12.36
Lingsugur 65.59 36.13 29.46 73.04 49.14 23.90 7.45 13.01
Manvi 54.55 30.06 24.49 65.54 44.09 21.45 10.99 14.03
Raichur 66.89 43.94 22.95 75.26 55.16 20.10 8.37 11.22
Sindhnur 64.57 37.15 27.43 73.44 51.60 21.84 8.87 14.45
District 61.52 35.93 25.60 70.47 48.73 21.74 8.95 12.81
State 76.10 56.87 19.23 82.47 68.08 14.39 6.37 11.21
Source: Census documents for respective years
Raichur, Sindhnur and Lingsugur
have better literacy ratios than
others and Devadurga taluka
reports only 39 per cent of female
literacy.
Gender gaps in literacy are very
high in the district as compared to
the state. Although declining
overtime, gaps are almost of equal
magnitude in all taluks suggesting
that gender inequality is more or
less evenly spread throughout the
district. But female literacy rates
are increasing by higher proportion
than the male literacy rates. This is
seen in all taluks and more
intensely in backward taluks.
Therefore, an increasing female
literacy would not only increase
total literacy but would also bring
about equity in literacy
attainments. The declining
disparity could also be gauged from
reduced difference between highest
male (Raichur) and lowest female
literacy rates (Devadurga) from
40.63 per cent in 2001 to 36.64 per
cent by 2011, which itself is almost
equal to FLR in Devadurga taluk.
The increasing female literacy rates
are indicative of changing attitude
of parents as well as improvement
in schooling facilities. But still the
practice of retaining girl children
for helping in household chores
and family occupations still seems
to continue. However, greater
efforts are still needed in backward
taluks like Devadurga, Manvi and
Lingsugur where the gaps are
relatively higher. Hence, if universal
access to education is to be
materialized, focus on rural areas
and female education is essential.
Thus, female illiteracy is high but
is declining, at a faster rate
contributing to reduction in gender
gaps. Due to the all-round efforts
of the government, the gaps are
being bridged, especially in rural
areas. But the level of gaps is still
high. Focus should be on low
literate taluks of Devadurga, Manvi
and Lingsugur. Thus, increasing
female literacy in rural areas is the
most desired means for
universalizing education in the
district.
8.3.1. Enrolment Ratios and
Female Literacy
The literacy attainments need to be
correlated with trends in enrolment
because one of the reasons for the
rising female literacy could be
increased enrolment at different
levels. As information in Table 8.4
Although
declining
overtime,
gaps are
almost of
equal magni-
tude
in all taluks
suggesting
that gender
inequality is
more or less
evenly
spread
throughout
the district.
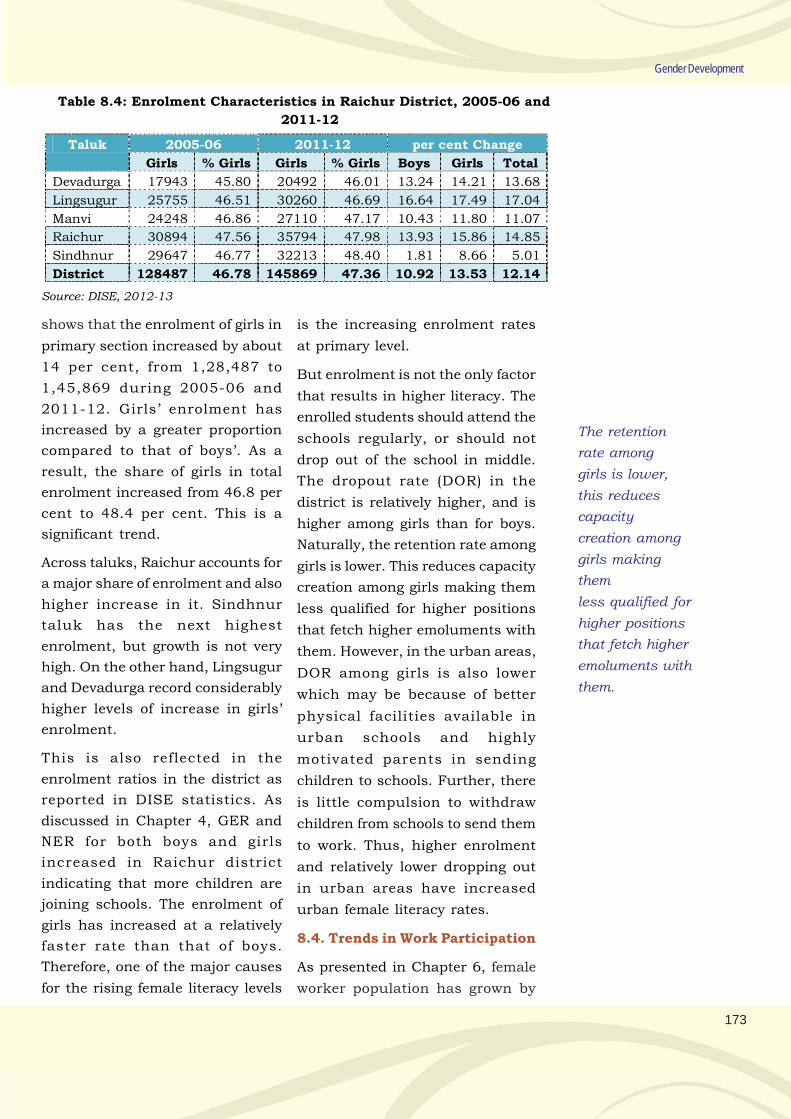
173
Gender Development
shows that the enrolment of girls in
primary section increased by about
14 per cent, from 1,28,487 to
1,45,869 during 2005-06 and
2011-12. Girls’ enrolment has
increased by a greater proportion
compared to that of boys’. As a
result, the share of girls in total
enrolment increased from 46.8 per
cent to 48.4 per cent. This is a
significant trend.
Across taluks, Raichur accounts for
a major share of enrolment and also
higher increase in it. Sindhnur
taluk has the next highest
enrolment, but growth is not very
high. On the other hand, Lingsugur
and Devadurga record considerably
higher levels of increase in girls’
enrolment.
This is also reflected in the
enrolment ratios in the district as
reported in DISE statistics. As
discussed in Chapter 4, GER and
NER for both boys and girls
increased in Raichur district
indicating that more children are
joining schools. The enrolment of
girls has increased at a relatively
faster rate than that of boys.
Therefore, one of the major causes
for the rising female literacy levels
Table 8.4: Enrolment Characteristics in Raichur District, 2005-06 and
2011-12
Taluk 2005-06 2011-12 per cent Change
Girls % Girls Girls % Girls Boys Girls Total
Devadurga 17943 45.80 20492 46.01 13.24 14.21 13.68
Lingsugur 25755 46.51 30260 46.69 16.64 17.49 17.04
Manvi 24248 46.86 27110 47.17 10.43 11.80 11.07
Raichur 30894 47.56 35794 47.98 13.93 15.86 14.85
Sindhnur 29647 46.77 32213 48.40 1.81 8.66 5.01
District 128487 46.78 145869 47.36 10.92 13.53 12.14
Source: DISE, 2012-13
is the increasing enrolment rates
at primary level.
But enrolment is not the only factor
that results in higher literacy. The
enrolled students should attend the
schools regularly, or should not
drop out of the school in middle.
The dropout rate (DOR) in the
district is relatively higher, and is
higher among girls than for boys.
Naturally, the retention rate among
girls is lower. This reduces capacity
creation among girls making them
less qualified for higher positions
that fetch higher emoluments with
them. However, in the urban areas,
DOR among girls is also lower
which may be because of better
physical facilities available in
urban schools and highly
motivated parents in sending
children to schools. Further, there
is little compulsion to withdraw
children from schools to send them
to work. Thus, higher enrolment
and relatively lower dropping out
in urban areas have increased
urban female literacy rates.
8.4. Trends in Work Participation
As presented in Chapter 6, female
worker population has grown by
The retention
rate among
girls is lower,
this reduces
capacity
creation among
girls making
them
less qualified for
higher positions
that fetch higher
emoluments with
them.
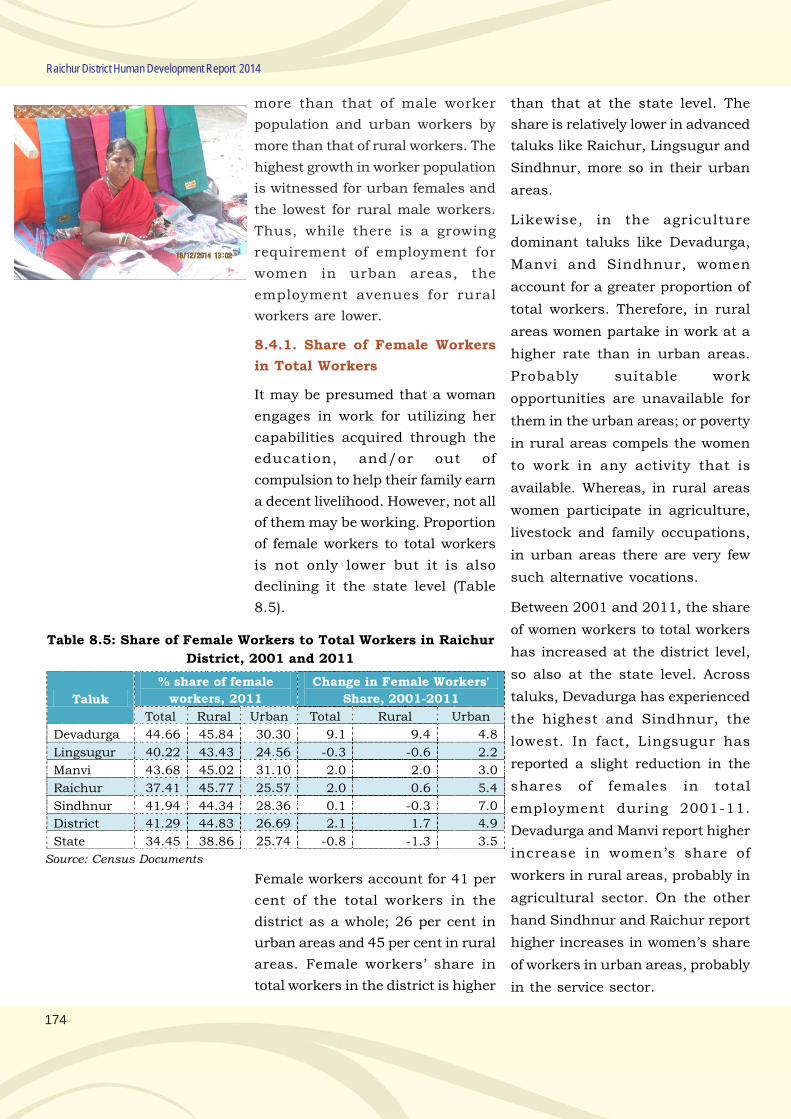
174
Raichur District Human Development Report 2014
more than that of male worker
population and urban workers by
more than that of rural workers. The
highest growth in worker population
is witnessed for urban females and
the lowest for rural male workers.
Thus, while there is a growing
requirement of employment for
women in urban areas, the
employment avenues for rural
workers are lower.
8.4.1. Share of Female Workers
in Total Workers
It may be presumed that a woman
engages in work for utilizing her
capabilities acquired through the
education, and/or out of
compulsion to help their family earn
a decent livelihood. However, not all
of them may be working. Proportion
of female workers to total workers
is not only lower but it is also
declining it the state level (Table
8.5).
Table 8.5: Share of Female Workers to Total Workers in Raichur
District, 2001 and 2011
Taluk
% share of female
workers, 2011
Change in Female Workers'
Share, 2001-2011
Total Rural Urban Total Rural Urban
Devadurga 44.66 45.84 30.30 9.1 9.4 4.8
Lingsugur 40.22 43.43 24.56 -0.3 -0.6 2.2
Manvi 43.68 45.02 31.10 2.0 2.0 3.0
Raichur 37.41 45.77 25.57 2.0 0.6 5.4
Sindhnur 41.94 44.34 28.36 0.1 -0.3 7.0
District 41.29 44.83 26.69 2.1 1.7 4.9
State 34.45 38.86 25.74 -0.8 -1.3 3.5
Source: Census Documents
Female workers account for 41 per
cent of the total workers in the
district as a whole; 26 per cent in
urban areas and 45 per cent in rural
areas. Female workers’ share in
total workers in the district is higher
than that at the state level. The
share is relatively lower in advanced
taluks like Raichur, Lingsugur and
Sindhnur, more so in their urban
areas.
Likewise, in the agriculture
dominant taluks like Devadurga,
Manvi and Sindhnur, women
account for a greater proportion of
total workers. Therefore, in rural
areas women partake in work at a
higher rate than in urban areas.
Probably suitable work
opportunities are unavailable for
them in the urban areas; or poverty
in rural areas compels the women
to work in any activity that is
available. Whereas, in rural areas
women participate in agriculture,
livestock and family occupations,
in urban areas there are very few
such alternative vocations.
Between 2001 and 2011, the share
of women workers to total workers
has increased at the district level,
so also at the state level. Across
taluks, Devadurga has experienced
the highest and Sindhnur, the
lowest. In fact, Lingsugur has
reported a slight reduction in the
shares of females in total
employment during 2001-11.
Devadurga and Manvi report higher
increase in women’s share of
workers in rural areas, probably in
agricultural sector. On the other
hand Sindhnur and Raichur report
higher increases in women’s share
of workers in urban areas, probably
in the service sector.
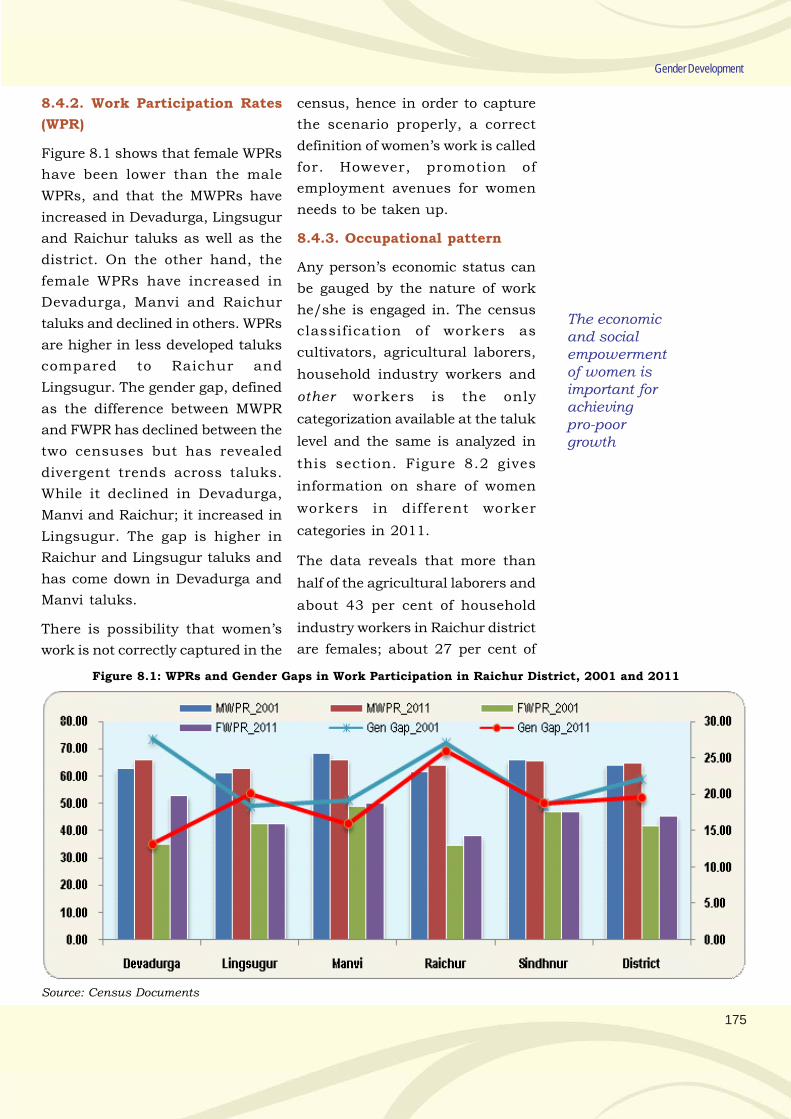
175
Gender Development
8.4.2. Work Participation Rates
(WPR)
Figure 8.1 shows that female WPRs
have been lower than the male
WPRs, and that the MWPRs have
increased in Devadurga, Lingsugur
and Raichur taluks as well as the
district. On the other hand, the
female WPRs have increased in
Devadurga, Manvi and Raichur
taluks and declined in others. WPRs
are higher in less developed taluks
compared to Raichur and
Lingsugur. The gender gap, defined
as the difference between MWPR
and FWPR has declined between the
two censuses but has revealed
divergent trends across taluks.
While it declined in Devadurga,
Manvi and Raichur; it increased in
Lingsugur. The gap is higher in
Raichur and Lingsugur taluks and
has come down in Devadurga and
Manvi taluks.
There is possibility that women’s
work is not correctly captured in the
Figure 8.1: WPRs and Gender Gaps in Work Participation in Raichur District, 2001 and 2011
Source: Census Documents
census, hence in order to capture
the scenario properly, a correct
definition of women’s work is called
for. However, promotion of
employment avenues for women
needs to be taken up.
8.4.3. Occupational pattern
Any person’s economic status can
be gauged by the nature of work
he/she is engaged in. The census
classification of workers as
cultivators, agricultural laborers,
household industry workers and
other workers is the only
categorization available at the taluk
level and the same is analyzed in
this section. Figure 8.2 gives
information on share of women
workers in different worker
categories in 2011.
The data reveals that more than
half of the agricultural laborers and
about 43 per cent of household
industry workers in Raichur district
are females; about 27 per cent of
The economicand socialempowermentof women isimportant forachievingpro-poorgrowth
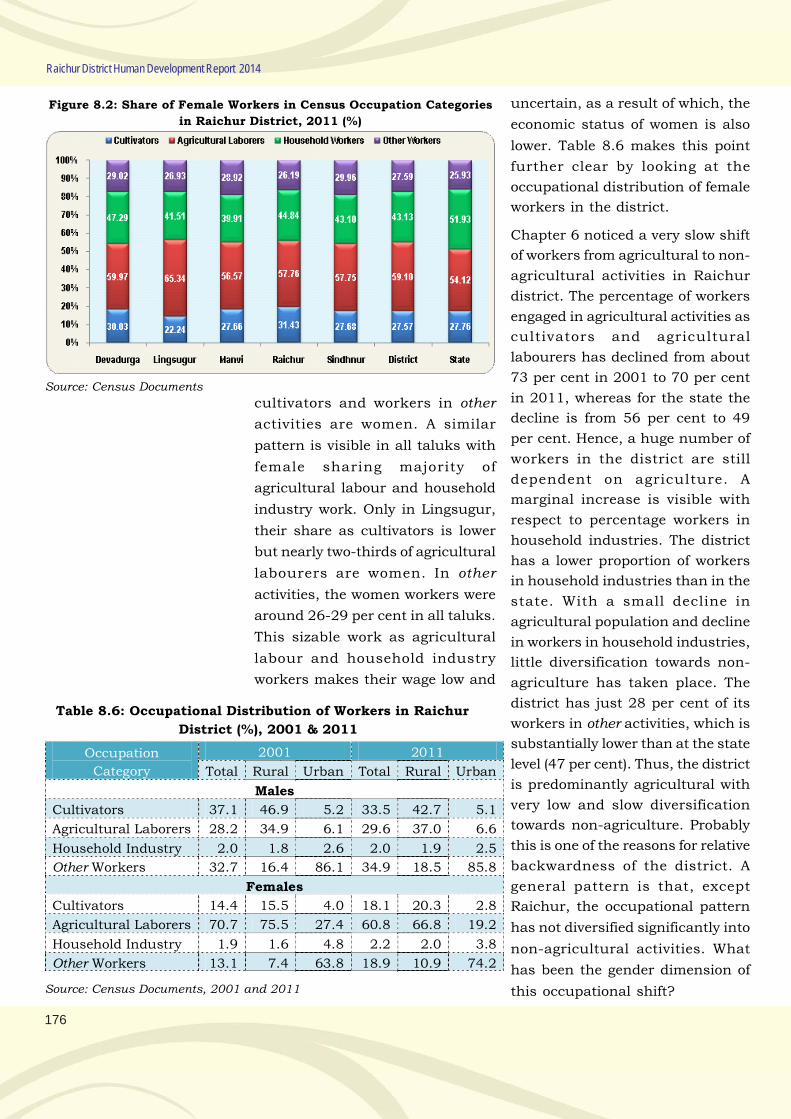
176
Raichur District Human Development Report 2014
Figure 8.2: Share of Female Workers in Census Occupation Categories
in Raichur District, 2011 (%)
Source: Census Documents
cultivators and workers in other
activities are women. A similar
pattern is visible in all taluks with
female sharing majority of
agricultural labour and household
industry work. Only in Lingsugur,
their share as cultivators is lower
but nearly two-thirds of agricultural
labourers are women. In other
activities, the women workers were
around 26-29 per cent in all taluks.
This sizable work as agricultural
labour and household industry
workers makes their wage low and
uncertain, as a result of which, the
economic status of women is also
lower. Table 8.6 makes this point
further clear by looking at the
occupational distribution of female
workers in the district.
Chapter 6 noticed a very slow shift
of workers from agricultural to non-
agricultural activities in Raichur
district. The percentage of workers
engaged in agricultural activities as
cultivators and agricultural
labourers has declined from about
73 per cent in 2001 to 70 per cent
in 2011, whereas for the state the
decline is from 56 per cent to 49
per cent. Hence, a huge number of
workers in the district are still
dependent on agriculture. A
marginal increase is visible with
respect to percentage workers in
household industries. The district
has a lower proportion of workers
in household industries than in the
state. With a small decline in
agricultural population and decline
in workers in household industries,
little diversification towards non-
agriculture has taken place. The
district has just 28 per cent of its
workers in other activities, which is
substantially lower than at the state
level (47 per cent). Thus, the district
is predominantly agricultural with
very low and slow diversification
towards non-agriculture. Probably
this is one of the reasons for relative
backwardness of the district. A
general pattern is that, except
Raichur, the occupational pattern
has not diversified significantly into
non-agricultural activities. What
has been the gender dimension of
this occupational shift?
Table 8.6: Occupational Distribution of Workers in Raichur
District (%), 2001 & 2011
Occupation
Category
2001 2011
Total Rural Urban Total Rural Urban
Males
Cultivators 37.1 46.9 5.2 33.5 42.7 5.1
Agricultural Laborers 28.2 34.9 6.1 29.6 37.0 6.6
Household Industry 2.0 1.8 2.6 2.0 1.9 2.5
Other Workers 32.7 16.4 86.1 34.9 18.5 85.8
Females
Cultivators 14.4 15.5 4.0 18.1 20.3 2.8
Agricultural Laborers 70.7 75.5 27.4 60.8 66.8 19.2
Household Industry 1.9 1.6 4.8 2.2 2.0 3.8
Other Workers 13.1 7.4 63.8 18.9 10.9 74.2
Source: Census Documents, 2001 and 2011
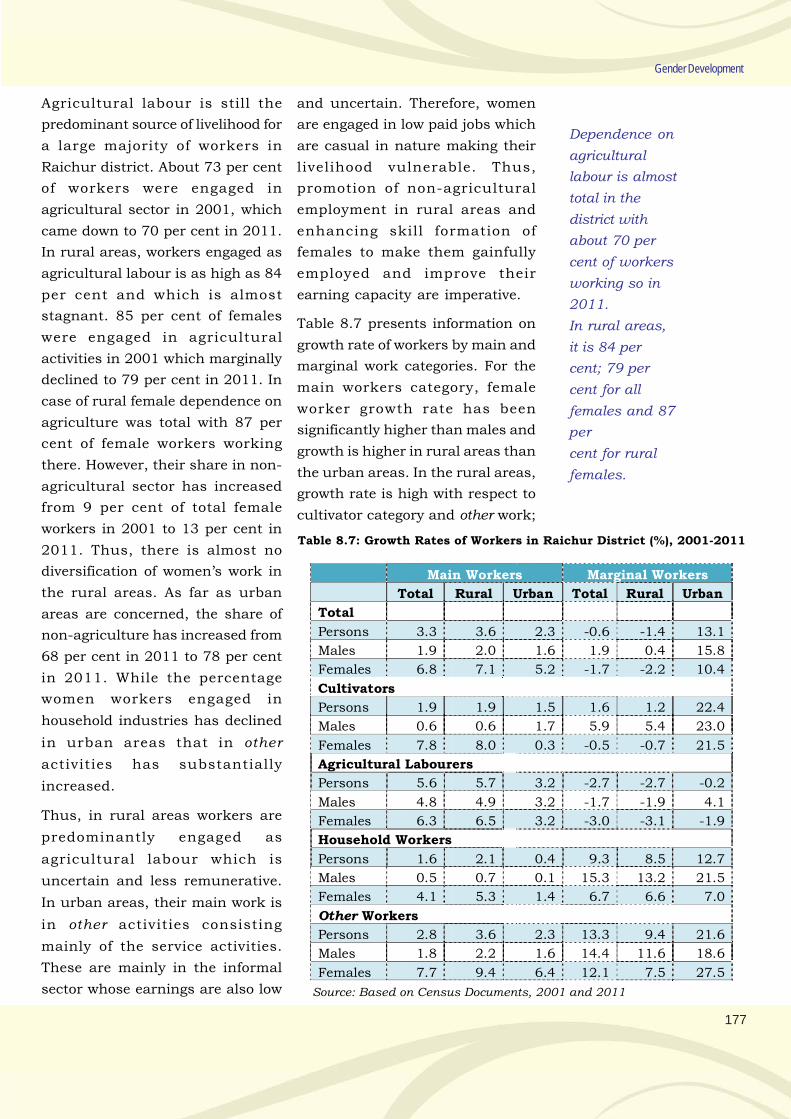
177
Gender Development
Agricultural labour is still the
predominant source of livelihood for
a large majority of workers in
Raichur district. About 73 per cent
of workers were engaged in
agricultural sector in 2001, which
came down to 70 per cent in 2011.
In rural areas, workers engaged as
agricultural labour is as high as 84
per cent and which is almost
stagnant. 85 per cent of females
were engaged in agricultural
activities in 2001 which marginally
declined to 79 per cent in 2011. In
case of rural female dependence on
agriculture was total with 87 per
cent of female workers working
there. However, their share in non-
agricultural sector has increased
from 9 per cent of total female
workers in 2001 to 13 per cent in
2011. Thus, there is almost no
diversification of women’s work in
the rural areas. As far as urban
areas are concerned, the share of
non-agriculture has increased from
68 per cent in 2011 to 78 per cent
in 2011. While the percentage
women workers engaged in
household industries has declined
in urban areas that in other
activities has substantially
increased.
Thus, in rural areas workers are
predominantly engaged as
agricultural labour which is
uncertain and less remunerative.
In urban areas, their main work is
in other activities consisting
mainly of the service activities.
These are mainly in the informal
sector whose earnings are also low
and uncertain. Therefore, women
are engaged in low paid jobs which
are casual in nature making their
livelihood vulnerable. Thus,
promotion of non-agricultural
employment in rural areas and
enhancing skill formation of
females to make them gainfully
employed and improve their
earning capacity are imperative.
Table 8.7 presents information on
growth rate of workers by main and
marginal work categories. For the
main workers category, female
worker growth rate has been
significantly higher than males and
growth is higher in rural areas than
the urban areas. In the rural areas,
growth rate is high with respect to
cultivator category and other work;
Table 8.7: Growth Rates of Workers in Raichur District (%), 2001-2011
Main Workers Marginal Workers
Total Rural Urban Total Rural Urban
Total
Persons 3.3 3.6 2.3 -0.6 -1.4 13.1
Males 1.9 2.0 1.6 1.9 0.4 15.8
Females 6.8 7.1 5.2 -1.7 -2.2 10.4
Cultivators
Persons 1.9 1.9 1.5 1.6 1.2 22.4
Males 0.6 0.6 1.7 5.9 5.4 23.0
Females 7.8 8.0 0.3 -0.5 -0.7 21.5
Agricultural Labourers
Persons 5.6 5.7 3.2 -2.7 -2.7 -0.2
Males 4.8 4.9 3.2 -1.7 -1.9 4.1
Females 6.3 6.5 3.2 -3.0 -3.1 -1.9
Household Workers
Persons 1.6 2.1 0.4 9.3 8.5 12.7
Males 0.5 0.7 0.1 15.3 13.2 21.5
Females 4.1 5.3 1.4 6.7 6.6 7.0
Other Workers
Persons 2.8 3.6 2.3 13.3 9.4 21.6
Males 1.8 2.2 1.6 14.4 11.6 18.6
Females 7.7 9.4 6.4 12.1 7.5 27.5
Source: Based on Census Documents, 2001 and 2011
Dependence on
agricultural
labour is almost
total in the
district with
about 70 per
cent of workers
working so in
2011.
In rural areas,
it is 84 per
cent; 79 per
cent for all
females and 87
per
cent for rural
females.
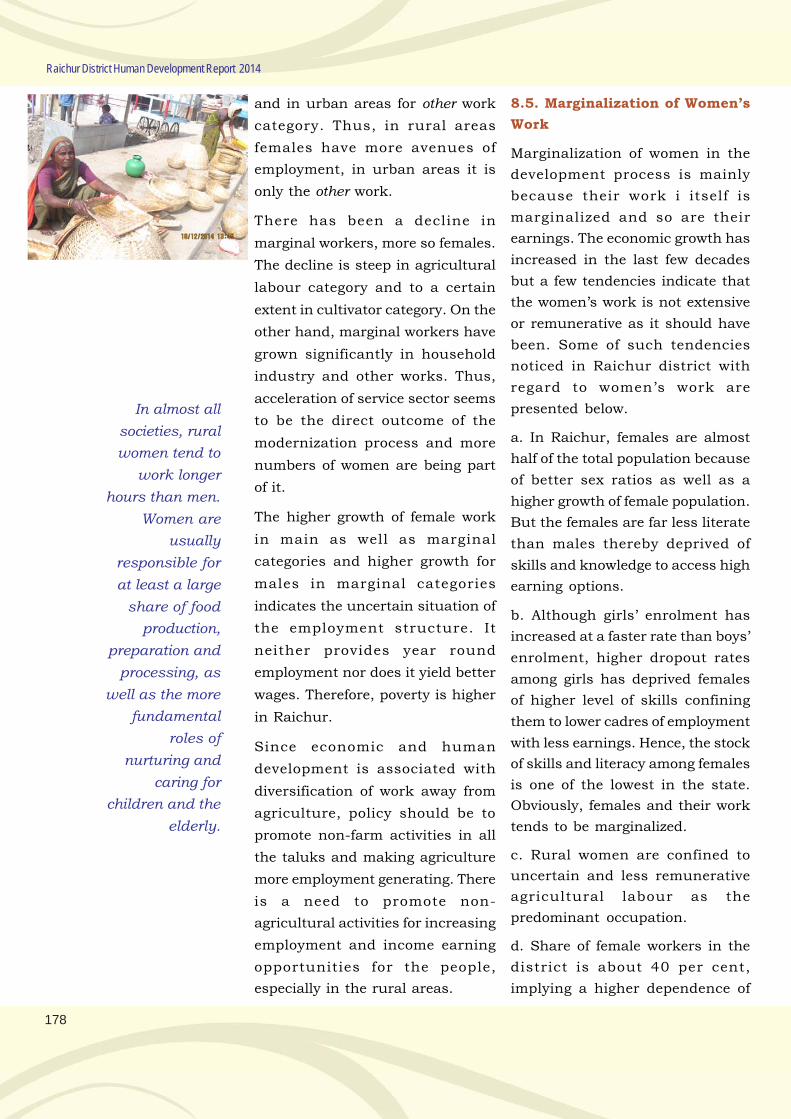
178
Raichur District Human Development Report 2014
and in urban areas for other work
category. Thus, in rural areas
females have more avenues of
employment, in urban areas it is
only the other work.
There has been a decline in
marginal workers, more so females.
The decline is steep in agricultural
labour category and to a certain
extent in cultivator category. On the
other hand, marginal workers have
grown significantly in household
industry and other works. Thus,
acceleration of service sector seems
to be the direct outcome of the
modernization process and more
numbers of women are being part
of it.
The higher growth of female work
in main as well as marginal
categories and higher growth for
males in marginal categories
indicates the uncertain situation of
the employment structure. It
neither provides year round
employment nor does it yield better
wages. Therefore, poverty is higher
in Raichur.
Since economic and human
development is associated with
diversification of work away from
agriculture, policy should be to
promote non-farm activities in all
the taluks and making agriculture
more employment generating. There
is a need to promote non-
agricultural activities for increasing
employment and income earning
opportunities for the people,
especially in the rural areas.
8.5. Marginalization of Women’s
Work
Marginalization of women in the
development process is mainly
because their work i itself is
marginalized and so are their
earnings. The economic growth has
increased in the last few decades
but a few tendencies indicate that
the women’s work is not extensive
or remunerative as it should have
been. Some of such tendencies
noticed in Raichur district with
regard to women’s work are
presented below.
a. In Raichur, females are almost
half of the total population because
of better sex ratios as well as a
higher growth of female population.
But the females are far less literate
than males thereby deprived of
skills and knowledge to access high
earning options.
b. Although girls’ enrolment has
increased at a faster rate than boys’
enrolment, higher dropout rates
among girls has deprived females
of higher level of skills confining
them to lower cadres of employment
with less earnings. Hence, the stock
of skills and literacy among females
is one of the lowest in the state.
Obviously, females and their work
tends to be marginalized.
c. Rural women are confined to
uncertain and less remunerative
agricultural labour as the
predominant occupation.
d. Share of female workers in the
district is about 40 per cent,
implying a higher dependence of
In almost all
societies, rural
women tend to
work longer
hours than men.
Women are
usually
responsible for
at least a large
share of food
production,
preparation and
processing, as
well as the more
fundamental
roles of
nurturing and
caring for
children and the
elderly.
179
Gender Development
women on men folk. Similarly,
WPRs are lower for females
corroborating the above view.
e. That the share of female workers
and WPR are higher and increasing
in backward taluks and in rural
areas is indicative of poverty and
compulsions to work. They may be
compelled to be working in less
remunerative occupations.
f. More important in this context is
the occupational pattern that is
suggestive of income earning
capacity of the working population.
Women account for more than half
of total workers engaged as
agricultural labour and as workers
in household activities. Share in
other activities, which are more
remunerative is hardly 25 per cent.
In 2001, 85 per cent of females were
engaged in agricultural activities
which marginally declined to 79 per
cent in 2011. In case of rural female
workers, dependence on agriculture
was total with 87 per cent of female
workers working there. Hence,
agriculture is more feminized in the
district. However, their share in
non-agricultural sector has
increased from 9 per cent of total
female workers in 2001 to 13 per
cent in 2011. Thus, there is almost
no diversification of women’s work
in the rural areas. As far as urban
areas are concerned, the share of
non-agriculture has increased from
68 per cent in 2011 to 78 per cent
in 2011.
g. The proportion of cultivators
among females and female owned
agricultural holdings have
increased in number between
2000-01 and 2011-12 (See Box
8.1). They are engaged in
agriculture, largely as subsistence
farmers, who cultivate small pieces
of land, often less than 0.2
hectares.
Box 8.1: Agricultural Holdings of Women
The agricultural holdings owned by females account for hardly 17 per cent in 2010-11, almost equal to that in 2000-01. All the taluks have experienced increase in women agricultural holdings, except Raichur taluk. Female holdings have increased by a higher proportion than the male owned holdings. Devadurga and Lingsugur have reported steep increase. But the average size of these holdings is declining, implying very weak prospects for increasing the farm incomes. The decline is higher in those taluks that have recorded higher increases in female holdings. Hence, either employment available or income generated does not support the livelihoods of women, rather makes them more vulnerable.
h. Although female workers’ share
in tertiary sector has increased, it
is wrought with a number of
problems. Service sector is
predominantly informal in nature
with less and uncertain returns.
Opportunities in services sector for
women remain very limited in rural
areas.
i. Approximately 50 lakh women
(Talukdar, 2012), are employed in
various government schemes
without being recognised as
government workers with the right
to government level wages. Flagship
programmes like the ICDS, NRHM
and the Mid-Day Meal Scheme are
dependent for their day-to-day
operations on them. It is only
appropriate to provide necessary
recognition to them as government
employees with an urgent need to
increase their remuneration and
social security benefits.
j. In urban areas women are largely
concentrated in other services, with
There is
almost
no
diversification
of women’s
work
in the rural
areas.
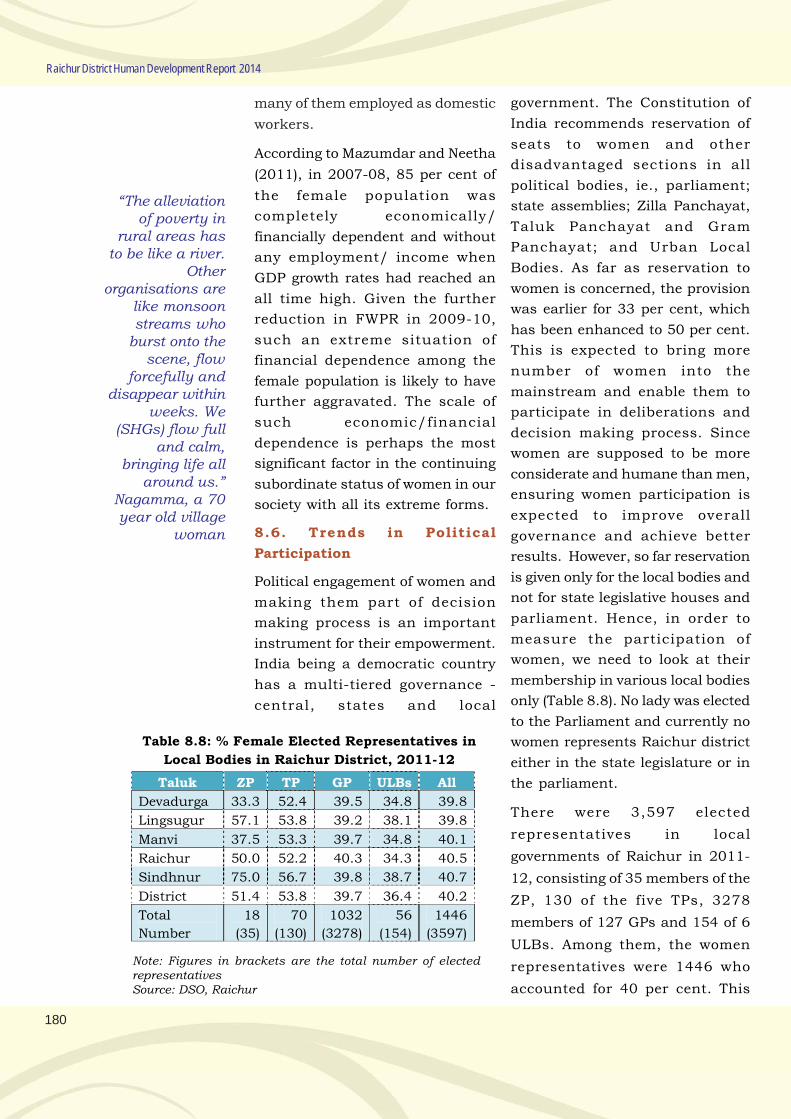
180
Raichur District Human Development Report 2014
many of them employed as domestic
workers.
According to Mazumdar and Neetha
(2011), in 2007-08, 85 per cent of
the female population was
completely economically/
financially dependent and without
any employment/ income when
GDP growth rates had reached an
all time high. Given the further
reduction in FWPR in 2009-10,
such an extreme situation of
financial dependence among the
female population is likely to have
further aggravated. The scale of
such economic/financial
dependence is perhaps the most
significant factor in the continuing
subordinate status of women in our
society with all its extreme forms.
8.6. Trends in Political
Participation
Political engagement of women and
making them part of decision
making process is an important
instrument for their empowerment.
India being a democratic country
has a multi-tiered governance -
central, states and local
government. The Constitution of
India recommends reservation of
seats to women and other
disadvantaged sections in all
political bodies, ie., parliament;
state assemblies; Zilla Panchayat,
Taluk Panchayat and Gram
Panchayat; and Urban Local
Bodies. As far as reservation to
women is concerned, the provision
was earlier for 33 per cent, which
has been enhanced to 50 per cent.
This is expected to bring more
number of women into the
mainstream and enable them to
participate in deliberations and
decision making process. Since
women are supposed to be more
considerate and humane than men,
ensuring women participation is
expected to improve overall
governance and achieve better
results. However, so far reservation
is given only for the local bodies and
not for state legislative houses and
parliament. Hence, in order to
measure the participation of
women, we need to look at their
membership in various local bodies
only (Table 8.8). No lady was elected
to the Parliament and currently no
women represents Raichur district
either in the state legislature or in
the parliament.
There were 3,597 elected
representatives in local
governments of Raichur in 2011-
12, consisting of 35 members of the
ZP, 130 of the five TPs, 3278
members of 127 GPs and 154 of 6
ULBs. Among them, the women
representatives were 1446 who
accounted for 40 per cent. This
Table 8.8: % Female Elected Representatives in
Local Bodies in Raichur District, 2011-12
Taluk ZP TP GP ULBs All
Devadurga 33.3 52.4 39.5 34.8 39.8
Lingsugur 57.1 53.8 39.2 38.1 39.8
Manvi 37.5 53.3 39.7 34.8 40.1
Raichur 50.0 52.2 40.3 34.3 40.5
Sindhnur 75.0 56.7 39.8 38.7 40.7
District 51.4 53.8 39.7 36.4 40.2
Total
Number
18
(35)
70
(130)
1032
(3278)
56
(154)
1446
(3597)
Note: Figures in brackets are the total number of electedrepresentativesSource: DSO, Raichur
“The alleviationof poverty in
rural areas hasto be like a river.
Otherorganisations are
like monsoonstreams who
burst onto thescene, flow
forcefully anddisappear within
weeks. We(SHGs) flow full
and calm,bringing life all
around us.”Nagamma, a 70year old village
woman
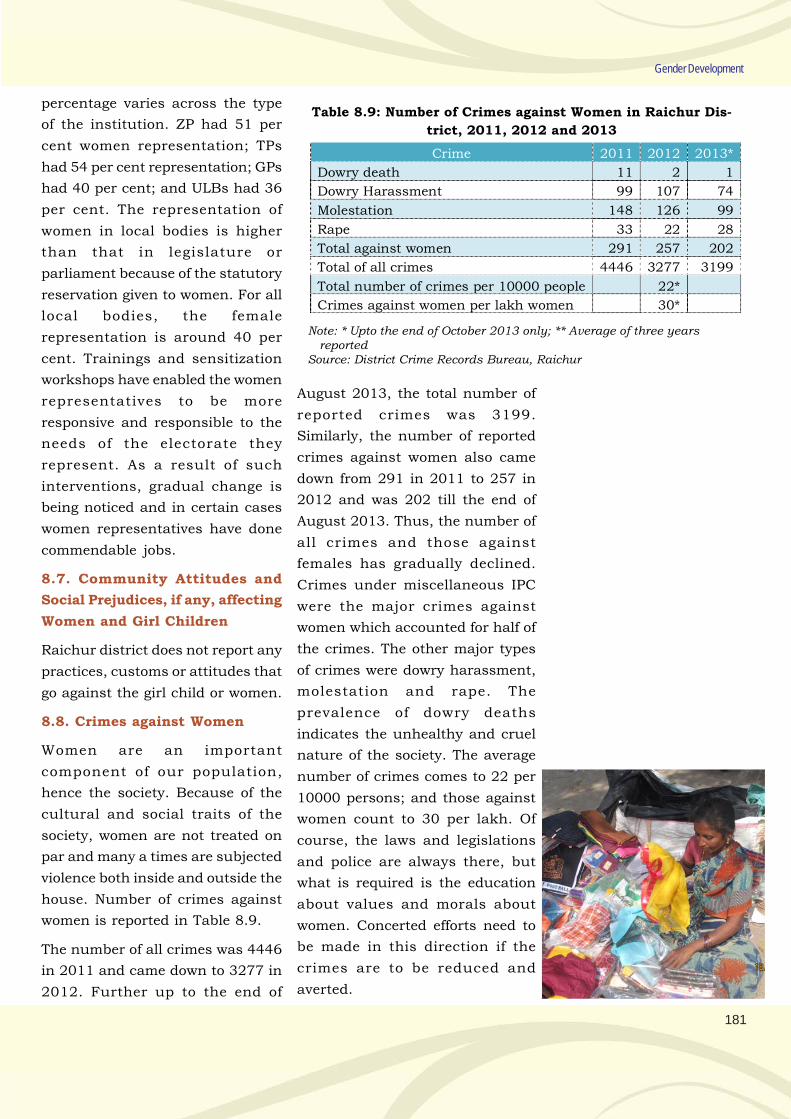
181
Gender Development
percentage varies across the type
of the institution. ZP had 51 per
cent women representation; TPs
had 54 per cent representation; GPs
had 40 per cent; and ULBs had 36
per cent. The representation of
women in local bodies is higher
than that in legislature or
parliament because of the statutory
reservation given to women. For all
local bodies, the female
representation is around 40 per
cent. Trainings and sensitization
workshops have enabled the women
representatives to be more
responsive and responsible to the
needs of the electorate they
represent. As a result of such
interventions, gradual change is
being noticed and in certain cases
women representatives have done
commendable jobs.
8.7. Community Attitudes and
Social Prejudices, if any, affecting
Women and Girl Children
Raichur district does not report any
practices, customs or attitudes that
go against the girl child or women.
8.8. Crimes against Women
Women are an important
component of our population,
hence the society. Because of the
cultural and social traits of the
society, women are not treated on
par and many a times are subjected
violence both inside and outside the
house. Number of crimes against
women is reported in Table 8.9.
The number of all crimes was 4446
in 2011 and came down to 3277 in
2012. Further up to the end of
Table 8.9: Number of Crimes against Women in Raichur Dis-
trict, 2011, 2012 and 2013
Crime 2011 2012 2013*
Dowry death 11 2 1
Dowry Harassment 99 107 74
Molestation 148 126 99
Rape 33 22 28
Total against women 291 257 202
Total of all crimes 4446 3277 3199
Total number of crimes per 10000 people 22*
Crimes against women per lakh women 30*
Note: * Upto the end of October 2013 only; ** Average of three yearsreported
Source: District Crime Records Bureau, Raichur
August 2013, the total number of
reported crimes was 3199.
Similarly, the number of reported
crimes against women also came
down from 291 in 2011 to 257 in
2012 and was 202 till the end of
August 2013. Thus, the number of
all crimes and those against
females has gradually declined.
Crimes under miscellaneous IPC
were the major crimes against
women which accounted for half of
the crimes. The other major types
of crimes were dowry harassment,
molestation and rape. The
prevalence of dowry deaths
indicates the unhealthy and cruel
nature of the society. The average
number of crimes comes to 22 per
10000 persons; and those against
women count to 30 per lakh. Of
course, the laws and legislations
and police are always there, but
what is required is the education
about values and morals about
women. Concerted efforts need to
be made in this direction if the
crimes are to be reduced and
averted.
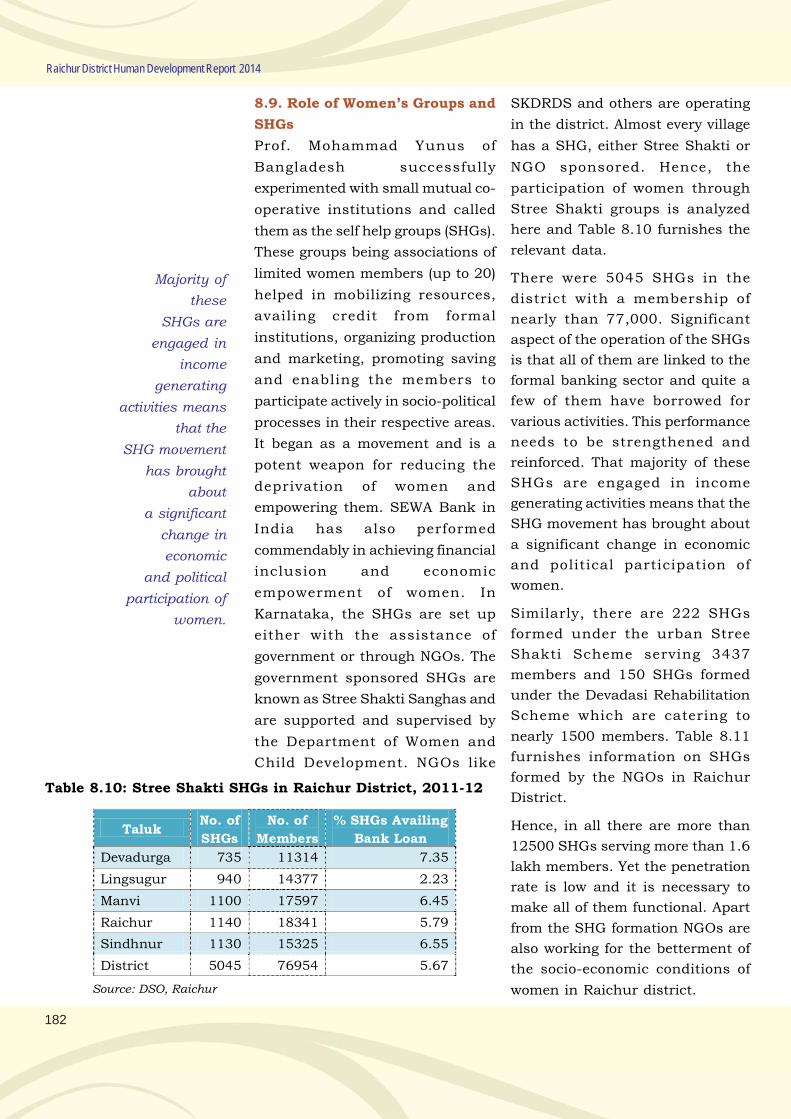
182
Raichur District Human Development Report 2014
8.9. Role of Women’s Groups and
SHGs
Prof. Mohammad Yunus of
Bangladesh successfully
experimented with small mutual co-
operative institutions and called
them as the self help groups (SHGs).
These groups being associations of
limited women members (up to 20)
helped in mobilizing resources,
availing credit from formal
institutions, organizing production
and marketing, promoting saving
and enabling the members to
participate actively in socio-political
processes in their respective areas.
It began as a movement and is a
potent weapon for reducing the
deprivation of women and
empowering them. SEWA Bank in
India has also performed
commendably in achieving financial
inclusion and economic
empowerment of women. In
Karnataka, the SHGs are set up
either with the assistance of
government or through NGOs. The
government sponsored SHGs are
known as Stree Shakti Sanghas and
are supported and supervised by
the Department of Women and
Child Development. NGOs like
Table 8.10: Stree Shakti SHGs in Raichur District, 2011-12
Taluk No. of
SHGs
No. of
Members
% SHGs Availing
Bank Loan
Devadurga 735 11314 7.35
Lingsugur 940 14377 2.23
Manvi 1100 17597 6.45
Raichur 1140 18341 5.79
Sindhnur 1130 15325 6.55
District 5045 76954 5.67
Source: DSO, Raichur
SKDRDS and others are operating
in the district. Almost every village
has a SHG, either Stree Shakti or
NGO sponsored. Hence, the
participation of women through
Stree Shakti groups is analyzed
here and Table 8.10 furnishes the
relevant data.
There were 5045 SHGs in the
district with a membership of
nearly than 77,000. Significant
aspect of the operation of the SHGs
is that all of them are linked to the
formal banking sector and quite a
few of them have borrowed for
various activities. This performance
needs to be strengthened and
reinforced. That majority of these
SHGs are engaged in income
generating activities means that the
SHG movement has brought about
a significant change in economic
and political participation of
women.
Similarly, there are 222 SHGs
formed under the urban Stree
Shakti Scheme serving 3437
members and 150 SHGs formed
under the Devadasi Rehabilitation
Scheme which are catering to
nearly 1500 members. Table 8.11
furnishes information on SHGs
formed by the NGOs in Raichur
District.
Hence, in all there are more than
12500 SHGs serving more than 1.6
lakh members. Yet the penetration
rate is low and it is necessary to
make all of them functional. Apart
from the SHG formation NGOs are
also working for the betterment of
the socio-economic conditions of
women in Raichur district.
Majority of
these
SHGs are
engaged in
income
generating
activities means
that the
SHG movement
has brought
about
a significant
change in
economic
and political
participation of
women.
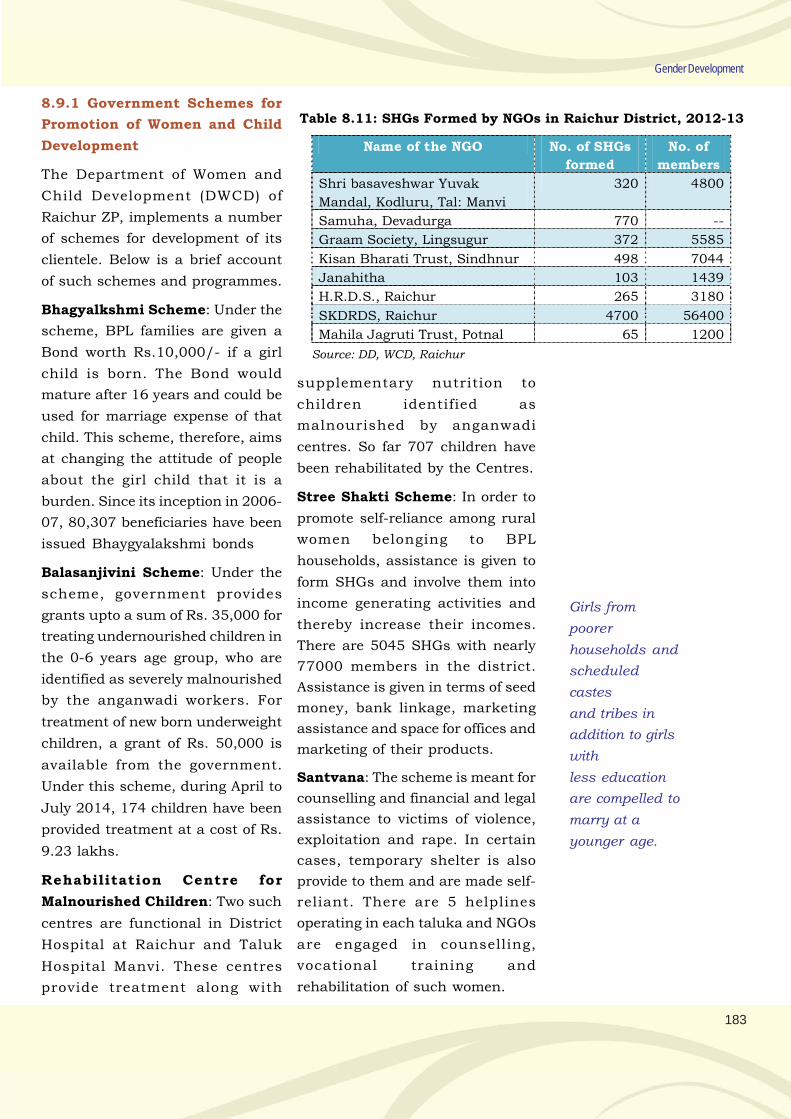
183
Gender Development
Table 8.11: SHGs Formed by NGOs in Raichur District, 2012-13
Name of the NGO No. of SHGs
formed
No. of
members
Shri basaveshwar Yuvak
Mandal, Kodluru, Tal: Manvi
320 4800
Samuha, Devadurga 770 --
Graam Society, Lingsugur 372 5585
Kisan Bharati Trust, Sindhnur 498 7044
Janahitha 103 1439
H.R.D.S., Raichur 265 3180
SKDRDS, Raichur 4700 56400
Mahila Jagruti Trust, Potnal 65 1200
Source: DD, WCD, Raichur
8.9.1 Government Schemes for
Promotion of Women and Child
Development
The Department of Women and
Child Development (DWCD) of
Raichur ZP, implements a number
of schemes for development of its
clientele. Below is a brief account
of such schemes and programmes.
Bhagyalkshmi Scheme: Under the
scheme, BPL families are given a
Bond worth Rs.10,000/- if a girl
child is born. The Bond would
mature after 16 years and could be
used for marriage expense of that
child. This scheme, therefore, aims
at changing the attitude of people
about the girl child that it is a
burden. Since its inception in 2006-
07, 80,307 beneficiaries have been
issued Bhaygyalakshmi bonds
Balasanjivini Scheme: Under the
scheme, government provides
grants upto a sum of Rs. 35,000 for
treating undernourished children in
the 0-6 years age group, who are
identified as severely malnourished
by the anganwadi workers. For
treatment of new born underweight
children, a grant of Rs. 50,000 is
available from the government.
Under this scheme, during April to
July 2014, 174 children have been
provided treatment at a cost of Rs.
9.23 lakhs.
Rehabilitation Centre for
Malnourished Children: Two such
centres are functional in District
Hospital at Raichur and Taluk
Hospital Manvi. These centres
provide treatment along with
supplementary nutrition to
children identified as
malnourished by anganwadi
centres. So far 707 children have
been rehabilitated by the Centres.
Stree Shakti Scheme: In order to
promote self-reliance among rural
women belonging to BPL
households, assistance is given to
form SHGs and involve them into
income generating activities and
thereby increase their incomes.
There are 5045 SHGs with nearly
77000 members in the district.
Assistance is given in terms of seed
money, bank linkage, marketing
assistance and space for offices and
marketing of their products.
Santvana: The scheme is meant for
counselling and financial and legal
assistance to victims of violence,
exploitation and rape. In certain
cases, temporary shelter is also
provide to them and are made self-
reliant. There are 5 helplines
operating in each taluka and NGOs
are engaged in counselling,
vocational training and
rehabilitation of such women.
Girls from
poorer
households and
scheduled
castes
and tribes in
addition to girls
with
less education
are compelled to
marry at a
younger age.
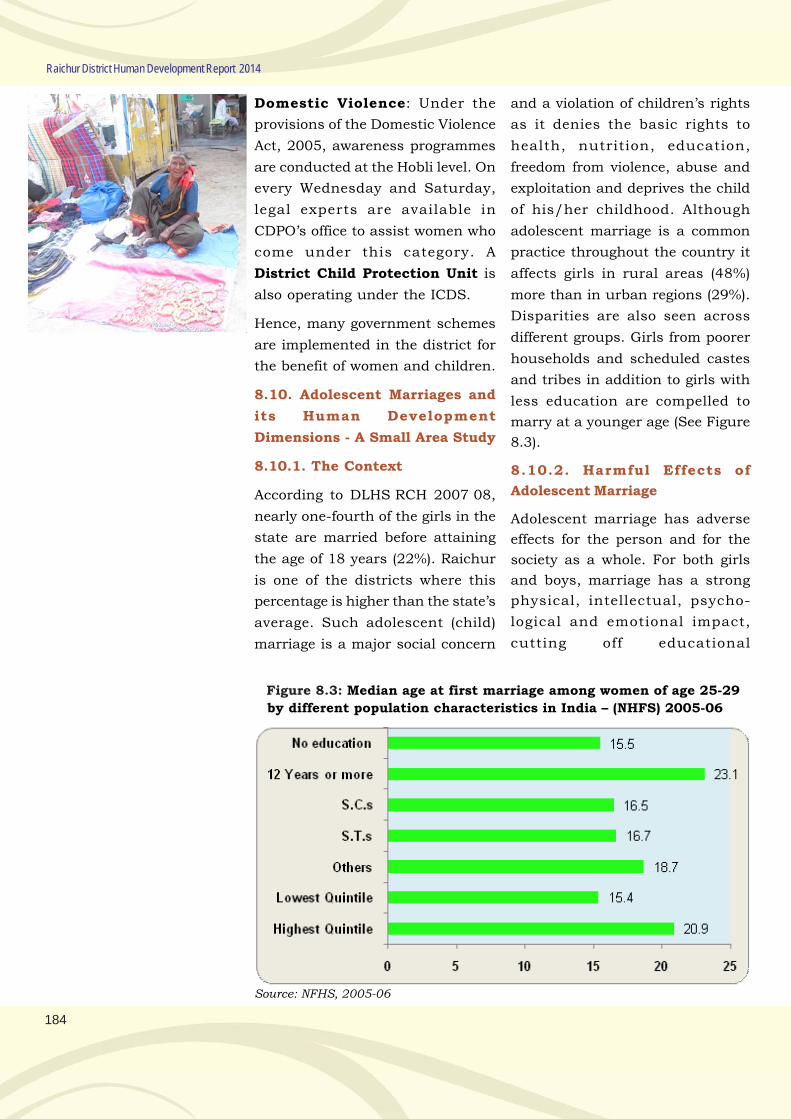
184
Raichur District Human Development Report 2014
Domestic Violence: Under the
provisions of the Domestic Violence
Act, 2005, awareness programmes
are conducted at the Hobli level. On
every Wednesday and Saturday,
legal experts are available in
CDPO’s office to assist women who
come under this category. A
District Child Protection Unit is
also operating under the ICDS.
Hence, many government schemes
are implemented in the district for
the benefit of women and children.
8.10. Adolescent Marriages and
its Human Development
Dimensions - A Small Area Study
8.10.1. The Context
According to DLHS RCH 2007 08,
nearly one-fourth of the girls in the
state are married before attaining
the age of 18 years (22%). Raichur
is one of the districts where this
percentage is higher than the state’s
average. Such adolescent (child)
marriage is a major social concern
and a violation of children’s rights
as it denies the basic rights to
health, nutrition, education,
freedom from violence, abuse and
exploitation and deprives the child
of his/her childhood. Although
adolescent marriage is a common
practice throughout the country it
affects girls in rural areas (48%)
more than in urban regions (29%).
Disparities are also seen across
different groups. Girls from poorer
households and scheduled castes
and tribes in addition to girls with
less education are compelled to
marry at a younger age (See Figure
8.3).
8.10.2. Harmful Effects of
Adolescent Marriage
Adolescent marriage has adverse
effects for the person and for the
society as a whole. For both girls
and boys, marriage has a strong
physical, intellectual, psycho-
logical and emotional impact,
cutting off educational
Figure 8.3: Median age at first marriage among women of age 25-29
by different population characteristics in India – (NHFS) 2005-06
Source: NFHS, 2005-06
185
Gender Development
opportunities and chances of
personal growth. While boys are also
affected by adolescent marriage,
girls are affected in far larger
numbers and with more intensity.
The consequences for girls are
especially dire, as they are usually
compelled into early child bearing
and social isolation. Adolescent
brides will drop out of school and
be exposed to higher risk of
domestic violence and abuse,
increased economic dependence,
denial of decision-making power,
inequality at home, which further
perpetuates discrimination and low
status of girls/women. Adolescent
marriage is also associated with
several health risks for the young
mother, as early marriage may
translate into repeated pregnancies
at a tender age when the body is not
fully prepared for child bearing.
Girls aged 15-19 are more likely
(66.6%) to experience delivery
complications compared to 30-34
year-old women (59.7%) and
neonatal, infant and child mortality
rates are much higher for younger
girls. Risks of HIV/AIDS infection
are higher among young girls as
their negotiation skills and
experience to ensure a healthy
sexual life are less developed
(Sahoo, 2011).
8.10.3. The Present Study
The study was undertaken in
Kurudi village of Manvi taluk in
Raichur District. The village lies at
a distance of 22 kms from the taluk
headquarters and has a pucca road
connecting to Manvi. Being
dependent primarily on
agricultural occupations, the
village represents a backward rural
economy.
A sample of 36 married women
below the age of 30 years was
chosen and for eliciting
information about their marriage,
family relations and child bearing
issues, women below the age of 30
years were specifically chosen for
the study. The social group
composition shows that majority
(64 %) of them were from backward
classes (OBC); 25% from SC-ST
category; and 11% belonged to
minority community. All the
sample women belonged to BPL
households since all of them
possessed BPL cards.
8.10.4. Average Age at marriage
The respondents were not in a
position to reveal their husband’s
age correctly as is evident in the
Figure 8.4. While the average for
the sample women is less than 17
years, it has been the lowest among
minority communities and OBCs.
However, the social group wise
difference is not much. But what
matters is the age difference
between the couple. The average
age difference among the sample is
7.78 years and as high as 8.75
years among minorities. This only
indicates that girls are married off
early and that too to a person quite
older than her. However, as
mentioned earlier, the age of
husbands might not have been
stated correct, but the age gap
between husband and the wife has
implications for family health as
well as personal health.
Adolescent
marriage is also
associated with
several health
risks for the
young mother, as
early marriage
may
translate into
repeated preg-
nancies
at a tender age
when the body is
not fully
prepared for
child bearing.
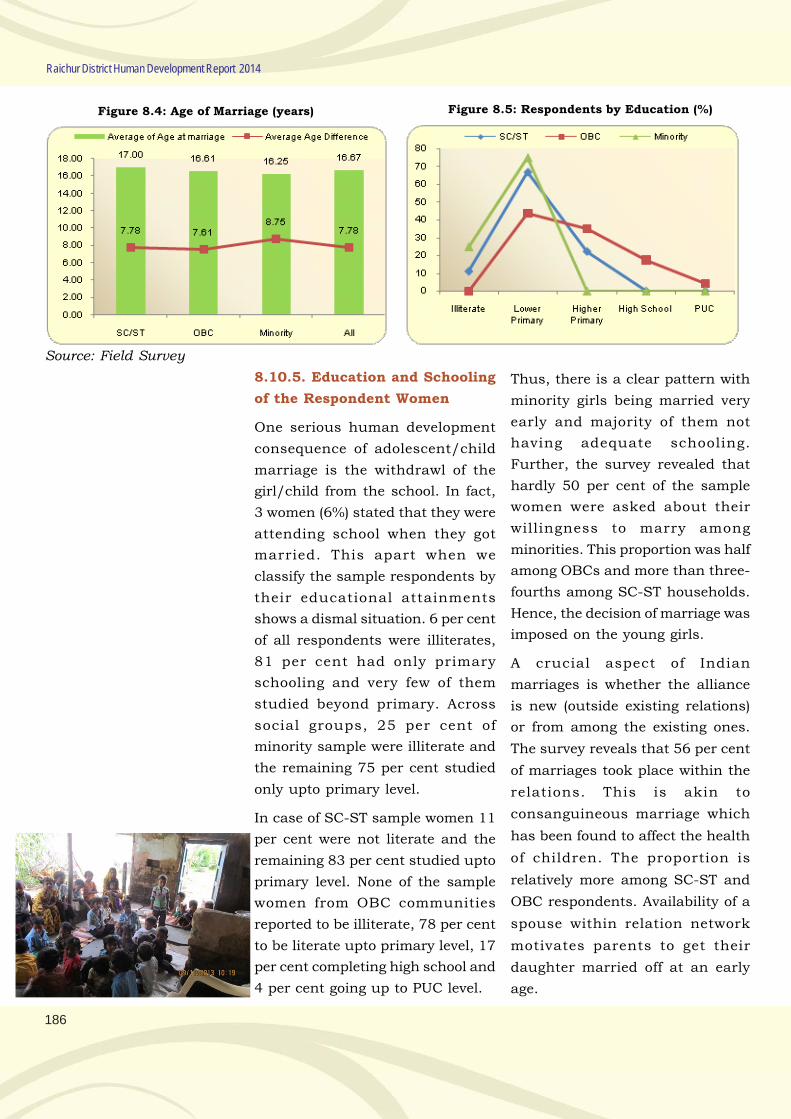
186
Raichur District Human Development Report 2014
Figure 8.4: Age of Marriage (years) Figure 8.5: Respondents by Education (%)
Source: Field Survey
8.10.5. Education and Schooling
of the Respondent Women
One serious human development
consequence of adolescent/child
marriage is the withdrawl of the
girl/child from the school. In fact,
3 women (6%) stated that they were
attending school when they got
married. This apart when we
classify the sample respondents by
their educational attainments
shows a dismal situation. 6 per cent
of all respondents were illiterates,
81 per cent had only primary
schooling and very few of them
studied beyond primary. Across
social groups, 25 per cent of
minority sample were illiterate and
the remaining 75 per cent studied
only upto primary level.
In case of SC-ST sample women 11
per cent were not literate and the
remaining 83 per cent studied upto
primary level. None of the sample
women from OBC communities
reported to be illiterate, 78 per cent
to be literate upto primary level, 17
per cent completing high school and
4 per cent going up to PUC level.
Thus, there is a clear pattern with
minority girls being married very
early and majority of them not
having adequate schooling.
Further, the survey revealed that
hardly 50 per cent of the sample
women were asked about their
willingness to marry among
minorities. This proportion was half
among OBCs and more than three-
fourths among SC-ST households.
Hence, the decision of marriage was
imposed on the young girls.
A crucial aspect of Indian
marriages is whether the alliance
is new (outside existing relations)
or from among the existing ones.
The survey reveals that 56 per cent
of marriages took place within the
relations. This is akin to
consanguineous marriage which
has been found to affect the health
of children. The proportion is
relatively more among SC-ST and
OBC respondents. Availability of a
spouse within relation network
motivates parents to get their
daughter married off at an early
age.
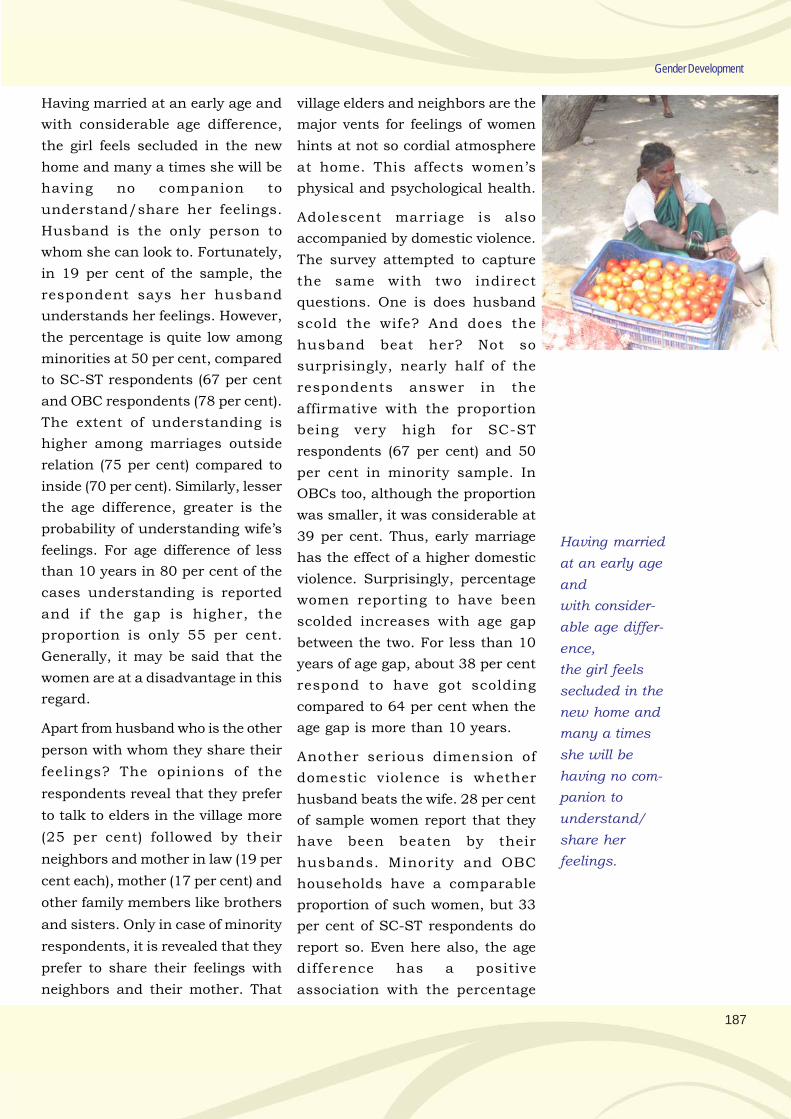
187
Gender Development
Having married at an early age and
with considerable age difference,
the girl feels secluded in the new
home and many a times she will be
having no companion to
understand/share her feelings.
Husband is the only person to
whom she can look to. Fortunately,
in 19 per cent of the sample, the
respondent says her husband
understands her feelings. However,
the percentage is quite low among
minorities at 50 per cent, compared
to SC-ST respondents (67 per cent
and OBC respondents (78 per cent).
The extent of understanding is
higher among marriages outside
relation (75 per cent) compared to
inside (70 per cent). Similarly, lesser
the age difference, greater is the
probability of understanding wife’s
feelings. For age difference of less
than 10 years in 80 per cent of the
cases understanding is reported
and if the gap is higher, the
proportion is only 55 per cent.
Generally, it may be said that the
women are at a disadvantage in this
regard.
Apart from husband who is the other
person with whom they share their
feelings? The opinions of the
respondents reveal that they prefer
to talk to elders in the village more
(25 per cent) followed by their
neighbors and mother in law (19 per
cent each), mother (17 per cent) and
other family members like brothers
and sisters. Only in case of minority
respondents, it is revealed that they
prefer to share their feelings with
neighbors and their mother. That
village elders and neighbors are the
major vents for feelings of women
hints at not so cordial atmosphere
at home. This affects women’s
physical and psychological health.
Adolescent marriage is also
accompanied by domestic violence.
The survey attempted to capture
the same with two indirect
questions. One is does husband
scold the wife? And does the
husband beat her? Not so
surprisingly, nearly half of the
respondents answer in the
affirmative with the proportion
being very high for SC-ST
respondents (67 per cent) and 50
per cent in minority sample. In
OBCs too, although the proportion
was smaller, it was considerable at
39 per cent. Thus, early marriage
has the effect of a higher domestic
violence. Surprisingly, percentage
women reporting to have been
scolded increases with age gap
between the two. For less than 10
years of age gap, about 38 per cent
respond to have got scolding
compared to 64 per cent when the
age gap is more than 10 years.
Another serious dimension of
domestic violence is whether
husband beats the wife. 28 per cent
of sample women report that they
have been beaten by their
husbands. Minority and OBC
households have a comparable
proportion of such women, but 33
per cent of SC-ST respondents do
report so. Even here also, the age
difference has a positive
association with the percentage
Having married
at an early age
and
with consider-
able age differ-
ence,
the girl feels
secluded in the
new home and
many a times
she will be
having no com-
panion to
understand/
share her
feelings.
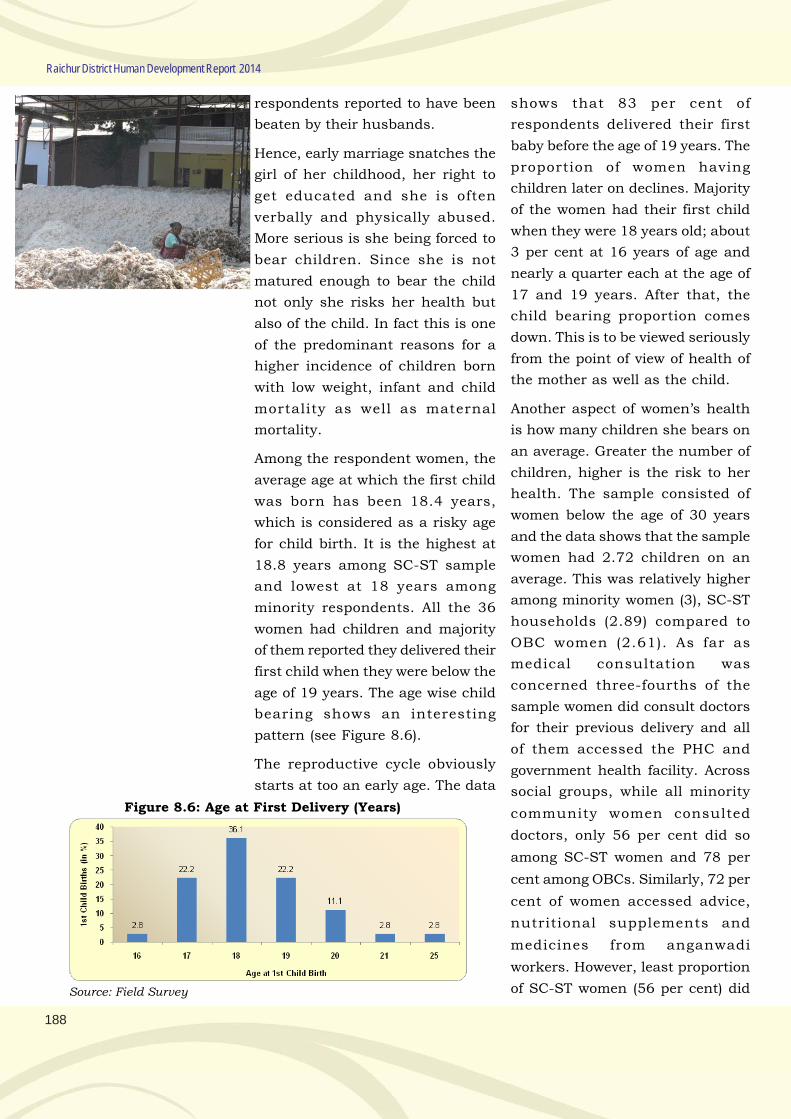
188
Raichur District Human Development Report 2014
respondents reported to have been
beaten by their husbands.
Hence, early marriage snatches the
girl of her childhood, her right to
get educated and she is often
verbally and physically abused.
More serious is she being forced to
bear children. Since she is not
matured enough to bear the child
not only she risks her health but
also of the child. In fact this is one
of the predominant reasons for a
higher incidence of children born
with low weight, infant and child
mortality as well as maternal
mortality.
Among the respondent women, the
average age at which the first child
was born has been 18.4 years,
which is considered as a risky age
for child birth. It is the highest at
18.8 years among SC-ST sample
and lowest at 18 years among
minority respondents. All the 36
women had children and majority
of them reported they delivered their
first child when they were below the
age of 19 years. The age wise child
bearing shows an interesting
pattern (see Figure 8.6).
The reproductive cycle obviously
starts at too an early age. The data
shows that 83 per cent of
respondents delivered their first
baby before the age of 19 years. The
proportion of women having
children later on declines. Majority
of the women had their first child
when they were 18 years old; about
3 per cent at 16 years of age and
nearly a quarter each at the age of
17 and 19 years. After that, the
child bearing proportion comes
down. This is to be viewed seriously
from the point of view of health of
the mother as well as the child.
Another aspect of women’s health
is how many children she bears on
an average. Greater the number of
children, higher is the risk to her
health. The sample consisted of
women below the age of 30 years
and the data shows that the sample
women had 2.72 children on an
average. This was relatively higher
among minority women (3), SC-ST
households (2.89) compared to
OBC women (2.61). As far as
medical consultation was
concerned three-fourths of the
sample women did consult doctors
for their previous delivery and all
of them accessed the PHC and
government health facility. Across
social groups, while all minority
community women consulted
doctors, only 56 per cent did so
among SC-ST women and 78 per
cent among OBCs. Similarly, 72 per
cent of women accessed advice,
nutritional supplements and
medicines from anganwadi
workers. However, least proportion
of SC-ST women (56 per cent) did
Figure 8.6: Age at First Delivery (Years)
Source: Field Survey
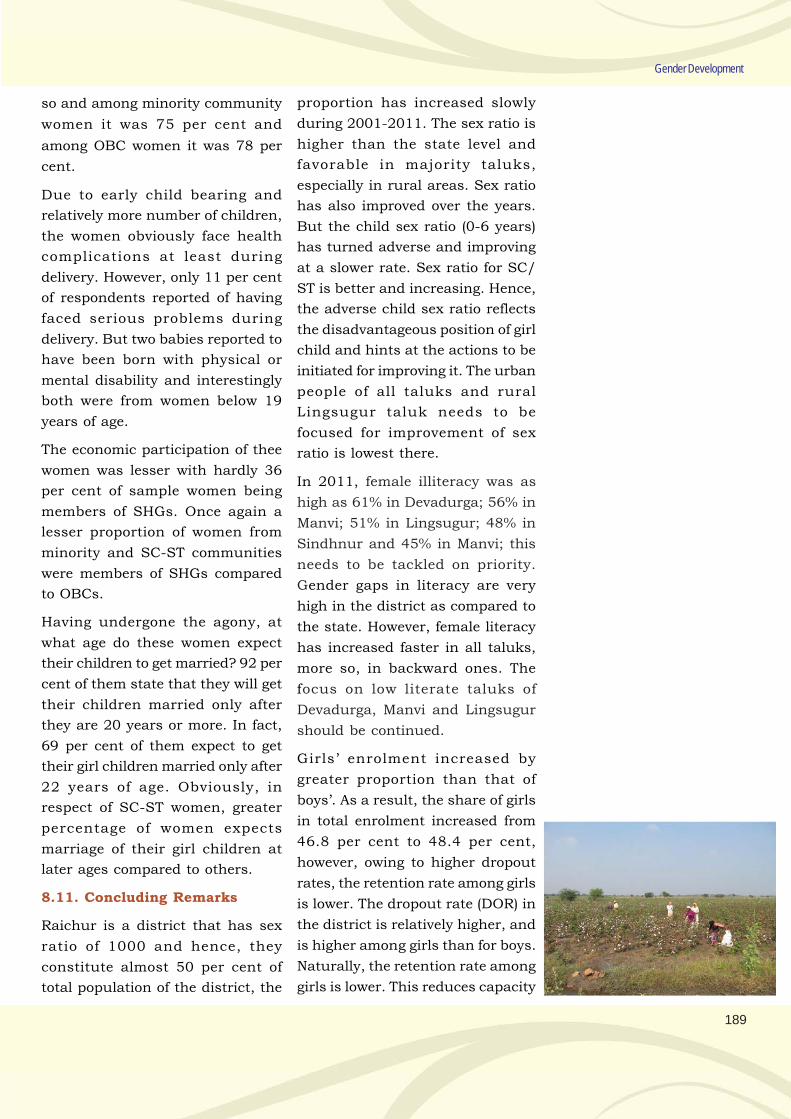
189
Gender Development
so and among minority community
women it was 75 per cent and
among OBC women it was 78 per
cent.
Due to early child bearing and
relatively more number of children,
the women obviously face health
complications at least during
delivery. However, only 11 per cent
of respondents reported of having
faced serious problems during
delivery. But two babies reported to
have been born with physical or
mental disability and interestingly
both were from women below 19
years of age.
The economic participation of thee
women was lesser with hardly 36
per cent of sample women being
members of SHGs. Once again a
lesser proportion of women from
minority and SC-ST communities
were members of SHGs compared
to OBCs.
Having undergone the agony, at
what age do these women expect
their children to get married? 92 per
cent of them state that they will get
their children married only after
they are 20 years or more. In fact,
69 per cent of them expect to get
their girl children married only after
22 years of age. Obviously, in
respect of SC-ST women, greater
percentage of women expects
marriage of their girl children at
later ages compared to others.
8.11. Concluding Remarks
Raichur is a district that has sex
ratio of 1000 and hence, they
constitute almost 50 per cent of
total population of the district, the
proportion has increased slowly
during 2001-2011. The sex ratio is
higher than the state level and
favorable in majority taluks,
especially in rural areas. Sex ratio
has also improved over the years.
But the child sex ratio (0-6 years)
has turned adverse and improving
at a slower rate. Sex ratio for SC/
ST is better and increasing. Hence,
the adverse child sex ratio reflects
the disadvantageous position of girl
child and hints at the actions to be
initiated for improving it. The urban
people of all taluks and rural
Lingsugur taluk needs to be
focused for improvement of sex
ratio is lowest there.
In 2011, female illiteracy was as
high as 61% in Devadurga; 56% in
Manvi; 51% in Lingsugur; 48% in
Sindhnur and 45% in Manvi; this
needs to be tackled on priority.
Gender gaps in literacy are very
high in the district as compared to
the state. However, female literacy
has increased faster in all taluks,
more so, in backward ones. The
focus on low literate taluks of
Devadurga, Manvi and Lingsugur
should be continued.
Girls’ enrolment increased by
greater proportion than that of
boys’. As a result, the share of girls
in total enrolment increased from
46.8 per cent to 48.4 per cent,
however, owing to higher dropout
rates, the retention rate among girls
is lower. The dropout rate (DOR) in
the district is relatively higher, and
is higher among girls than for boys.
Naturally, the retention rate among
girls is lower. This reduces capacity
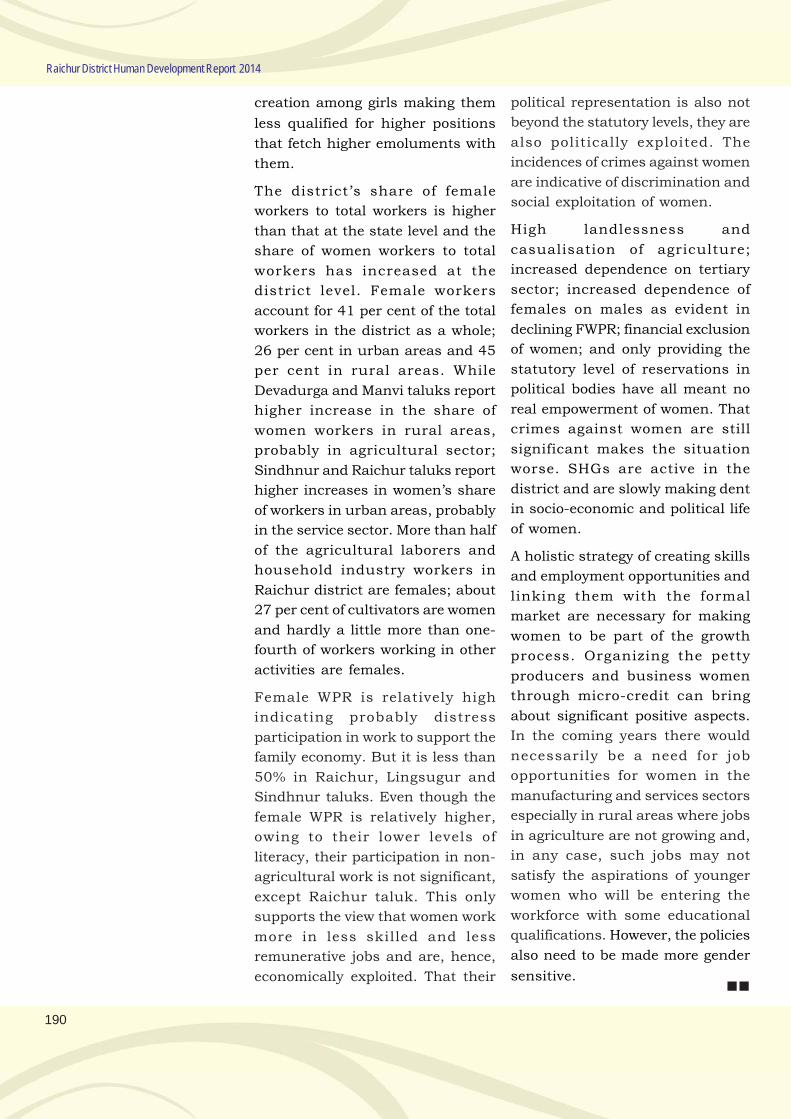
190
Raichur District Human Development Report 2014
creation among girls making them
less qualified for higher positions
that fetch higher emoluments with
them.
The district’s share of female
workers to total workers is higher
than that at the state level and the
share of women workers to total
workers has increased at the
district level. Female workers
account for 41 per cent of the total
workers in the district as a whole;
26 per cent in urban areas and 45
per cent in rural areas. While
Devadurga and Manvi taluks report
higher increase in the share of
women workers in rural areas,
probably in agricultural sector;
Sindhnur and Raichur taluks report
higher increases in women’s share
of workers in urban areas, probably
in the service sector. More than half
of the agricultural laborers and
household industry workers in
Raichur district are females; about
27 per cent of cultivators are women
and hardly a little more than one-
fourth of workers working in other
activities are females.
Female WPR is relatively high
indicating probably distress
participation in work to support the
family economy. But it is less than
50% in Raichur, Lingsugur and
Sindhnur taluks. Even though the
female WPR is relatively higher,
owing to their lower levels of
literacy, their participation in non-
agricultural work is not significant,
except Raichur taluk. This only
supports the view that women work
more in less skilled and less
remunerative jobs and are, hence,
economically exploited. That their
political representation is also not
beyond the statutory levels, they are
also politically exploited. The
incidences of crimes against women
are indicative of discrimination and
social exploitation of women.
High landlessness and
casualisation of agriculture;
increased dependence on tertiary
sector; increased dependence of
females on males as evident in
declining FWPR; financial exclusion
of women; and only providing the
statutory level of reservations in
political bodies have all meant no
real empowerment of women. That
crimes against women are still
significant makes the situation
worse. SHGs are active in the
district and are slowly making dent
in socio-economic and political life
of women.
A holistic strategy of creating skills
and employment opportunities and
linking them with the formal
market are necessary for making
women to be part of the growth
process. Organizing the petty
producers and business women
through micro-credit can bring
about significant positive aspects.
In the coming years there would
necessarily be a need for job
opportunities for women in the
manufacturing and services sectors
especially in rural areas where jobs
in agriculture are not growing and,
in any case, such jobs may not
satisfy the aspirations of younger
women who will be entering the
workforce with some educational
qualifications. However, the policies
also need to be made more gender
sensitive.
Chapter 9
STATUS OF SCHEDULED
CASTES AND SCHEDULED TRIBES

.
193
Chapter 9
Status of Scheduled Castes and Scheduled Tribes
9.1. Introduction
Indian society practiced a value
system that was based on division
and hierarchy which itself
classically manifested in the
system of caste-feudal patriarchy.
However, the post-independent
Consti-tutional commitment to
social equality and social justice
initiated significant changes.
Equality was operationalised in the
establishment of democratic
socialism and the welfare state.
Along with guaranteeing equality
of citizenship, the state assumed
the primary responsibility for
compensating for centuries of
discrimination, exploitation and
marginalisation and providing
special support to the Scheduled
Castes (SC) and Scheduled Tribes
(ST).
The SC and ST are administrative
connotations, referring to
population identified by the
Constitution of India for
compensatory discrimination and
special protection. They intend to
comprise those who were at the
bottom and margins respectively, of
the Indian social order – viz. caste
groups who because of their low
cultural and social status in the
traditional social hierarchy and
tribal groups because of their spatial
isolation and distinctive cultures
have been subject to impositions of
disabilities and lack of opportunity.
Socio-cultural practices of
exclusion and discrimination
continue to define the existence of
the poor Scheduled Castes and
Scheduled Tribes. Cultural factors
can play a role in sustaining inter-
group differences in wealth, status
and power.
Article 46 of the Indian
Constitution imposes the
obligation on the government to
promote the socio-economic
interests of the scheduled castes
and scheduled tribes. This and
many other provisions enshrined
in the Constitution have played an
important role in improving the
socio-economic conditions and
achieving a respectful position to
the members of these communities
in the society.
Since the beginning of the XI Five
Year Plan, reducing social
exclusion and reduction of
inequalities are at the core of the
inclusive growth approach. Social
exclusion involves the denial of
equal access to opportunities
imposed by certain groups in a
society upon others. According to
Sen (2000), the distinguishing
features of social exclusion in India
are: it affects culturally defined
groups; is embedded in social
relations between them; and
results in deprivation for the
excluded. According to Thorat and
Newman (2007) the form of
Social
exclusion
involves the
denial of
equal access
to opportuni-
ties
imposed by
certain groups
in a society
upon others.
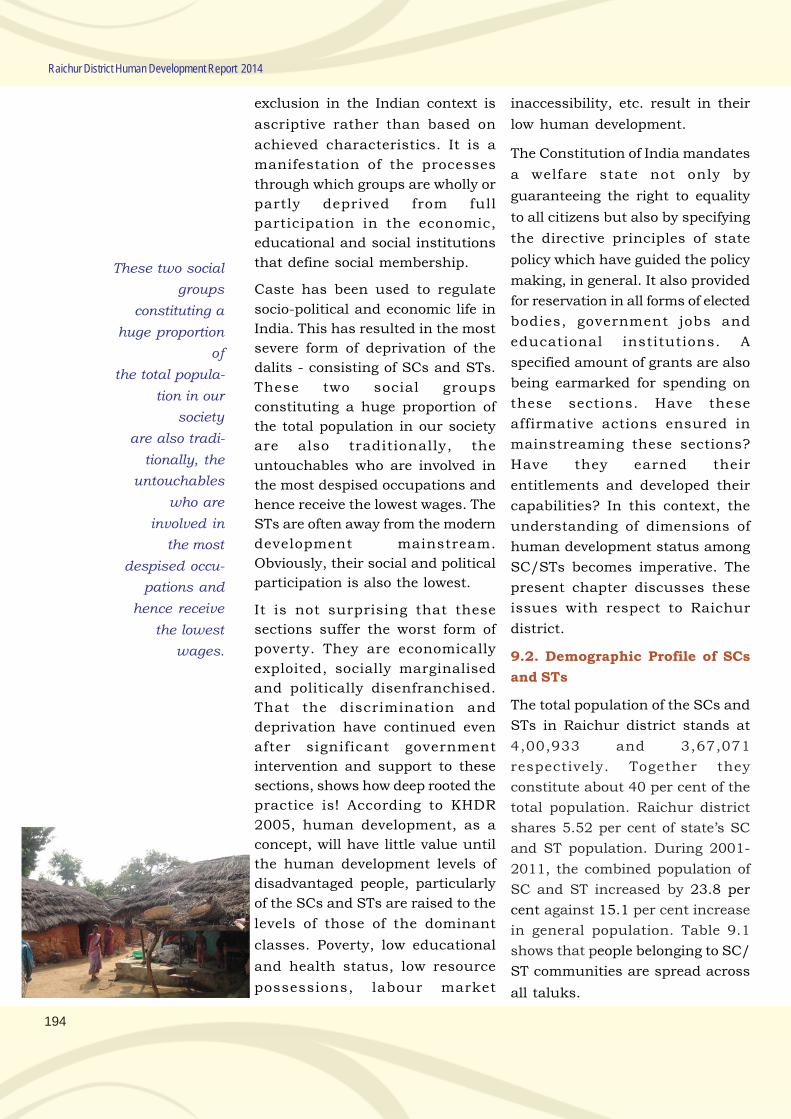
194
Raichur District Human Development Report 2014
exclusion in the Indian context is
ascriptive rather than based on
achieved characteristics. It is a
manifestation of the processes
through which groups are wholly or
partly deprived from full
participation in the economic,
educational and social institutions
that define social membership.
Caste has been used to regulate
socio-political and economic life in
India. This has resulted in the most
severe form of deprivation of the
dalits - consisting of SCs and STs.
These two social groups
constituting a huge proportion of
the total population in our society
are also traditionally, the
untouchables who are involved in
the most despised occupations and
hence receive the lowest wages. The
STs are often away from the modern
development mainstream.
Obviously, their social and political
participation is also the lowest.
It is not surprising that these
sections suffer the worst form of
poverty. They are economically
exploited, socially marginalised
and politically disenfranchised.
That the discrimination and
deprivation have continued even
after significant government
intervention and support to these
sections, shows how deep rooted the
practice is! According to KHDR
2005, human development, as a
concept, will have little value until
the human development levels of
disadvantaged people, particularly
of the SCs and STs are raised to the
levels of those of the dominant
classes. Poverty, low educational
and health status, low resource
possessions, labour market
inaccessibility, etc. result in their
low human development.
The Constitution of India mandates
a welfare state not only by
guaranteeing the right to equality
to all citizens but also by specifying
the directive principles of state
policy which have guided the policy
making, in general. It also provided
for reservation in all forms of elected
bodies, government jobs and
educational institutions. A
specified amount of grants are also
being earmarked for spending on
these sections. Have these
affirmative actions ensured in
mainstreaming these sections?
Have they earned their
entitlements and developed their
capabilities? In this context, the
understanding of dimensions of
human development status among
SC/STs becomes imperative. The
present chapter discusses these
issues with respect to Raichur
district.
9.2. Demographic Profile of SCs
and STs
The total population of the SCs and
STs in Raichur district stands at
4,00,933 and 3,67,071
respectively. Together they
constitute about 40 per cent of the
total population. Raichur district
shares 5.52 per cent of state’s SC
and ST population. During 2001-
2011, the combined population of
SC and ST increased by 23.8 per
cent against 15.1 per cent increase
in general population. Table 9.1
shows that people belonging to SC/
ST communities are spread across
all taluks.
These two social
groups
constituting a
huge proportion
of
the total popula-
tion in our
society
are also tradi-
tionally, the
untouchables
who are
involved in
the most
despised occu-
pations and
hence receive
the lowest
wages.
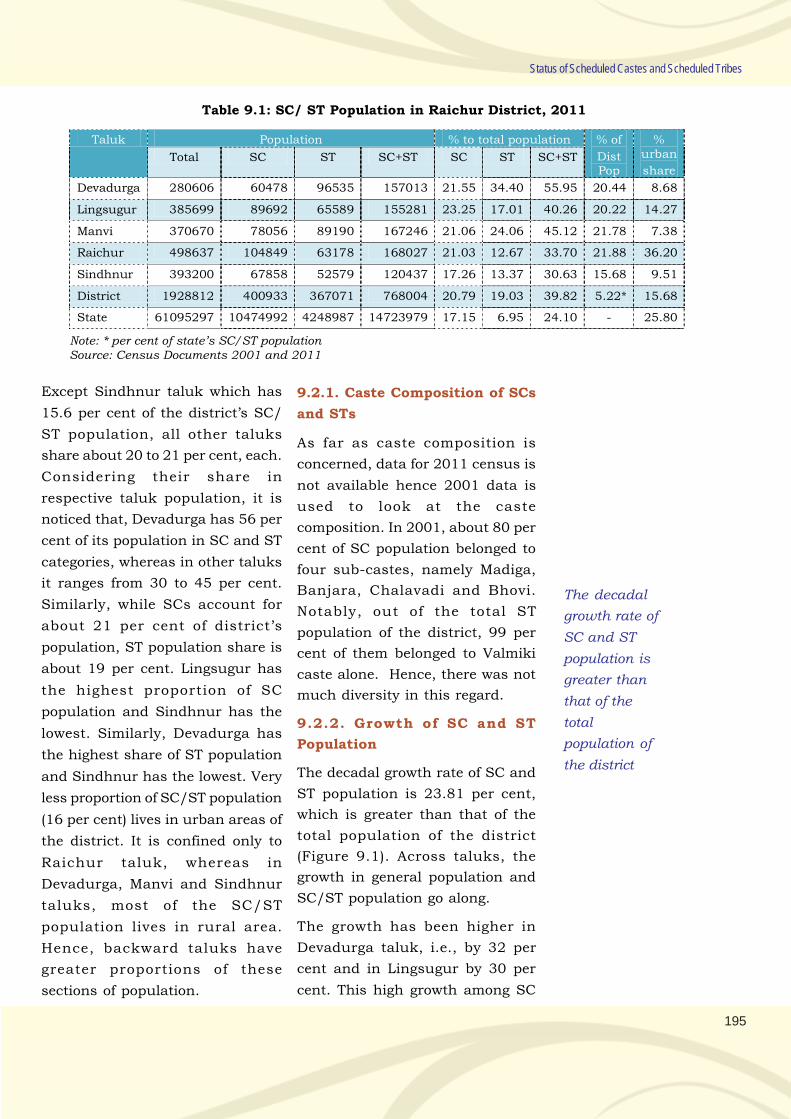
195
Status of Scheduled Castes and Scheduled Tribes
Table 9.1: SC/ ST Population in Raichur District, 2011
Taluk Population % to total population % of
Dist Pop
% urban
share Total SC ST SC+ST SC ST SC+ST
Devadurga 280606 60478 96535 157013 21.55 34.40 55.95 20.44 8.68
Lingsugur 385699 89692 65589 155281 23.25 17.01 40.26 20.22 14.27
Manvi 370670 78056 89190 167246 21.06 24.06 45.12 21.78 7.38
Raichur 498637 104849 63178 168027 21.03 12.67 33.70 21.88 36.20
Sindhnur 393200 67858 52579 120437 17.26 13.37 30.63 15.68 9.51
District 1928812 400933 367071 768004 20.79 19.03 39.82 5.22* 15.68
State 61095297 10474992 4248987 14723979 17.15 6.95 24.10 - 25.80
Note: * per cent of state’s SC/ST populationSource: Census Documents 2001 and 2011
Except Sindhnur taluk which has
15.6 per cent of the district’s SC/
ST population, all other taluks
share about 20 to 21 per cent, each.
Considering their share in
respective taluk population, it is
noticed that, Devadurga has 56 per
cent of its population in SC and ST
categories, whereas in other taluks
it ranges from 30 to 45 per cent.
Similarly, while SCs account for
about 21 per cent of district’s
population, ST population share is
about 19 per cent. Lingsugur has
the highest proportion of SC
population and Sindhnur has the
lowest. Similarly, Devadurga has
the highest share of ST population
and Sindhnur has the lowest. Very
less proportion of SC/ST population
(16 per cent) lives in urban areas of
the district. It is confined only to
Raichur taluk, whereas in
Devadurga, Manvi and Sindhnur
taluks, most of the SC/ST
population lives in rural area.
Hence, backward taluks have
greater proportions of these
sections of population.
9.2.1. Caste Composition of SCs
and STs
As far as caste composition is
concerned, data for 2011 census is
not available hence 2001 data is
used to look at the caste
composition. In 2001, about 80 per
cent of SC population belonged to
four sub-castes, namely Madiga,
Banjara, Chalavadi and Bhovi.
Notably, out of the total ST
population of the district, 99 per
cent of them belonged to Valmiki
caste alone. Hence, there was not
much diversity in this regard.
9.2.2. Growth of SC and ST
Population
The decadal growth rate of SC and
ST population is 23.81 per cent,
which is greater than that of the
total population of the district
(Figure 9.1). Across taluks, the
growth in general population and
SC/ST population go along.
The growth has been higher in
Devadurga taluk, i.e., by 32 per
cent and in Lingsugur by 30 per
cent. This high growth among SC
The decadal
growth rate of
SC and ST
population is
greater than
that of the
total
population of
the district
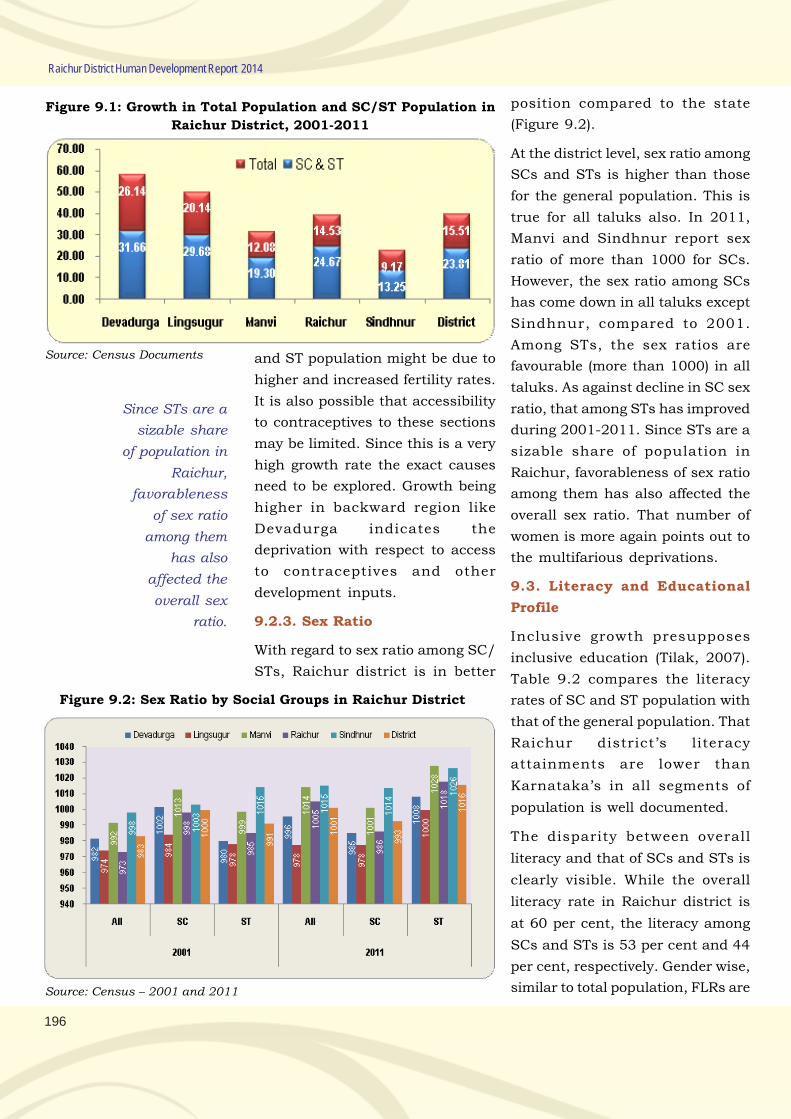
196
Raichur District Human Development Report 2014
Figure 9.1: Growth in Total Population and SC/ST Population in
Raichur District, 2001-2011
Source: Census Documents and ST population might be due to
higher and increased fertility rates.
It is also possible that accessibility
to contraceptives to these sections
may be limited. Since this is a very
high growth rate the exact causes
need to be explored. Growth being
higher in backward region like
Devadurga indicates the
deprivation with respect to access
to contraceptives and other
development inputs.
9.2.3. Sex Ratio
With regard to sex ratio among SC/
STs, Raichur district is in better
Figure 9.2: Sex Ratio by Social Groups in Raichur District
Source: Census – 2001 and 2011
position compared to the state
(Figure 9.2).
At the district level, sex ratio among
SCs and STs is higher than those
for the general population. This is
true for all taluks also. In 2011,
Manvi and Sindhnur report sex
ratio of more than 1000 for SCs.
However, the sex ratio among SCs
has come down in all taluks except
Sindhnur, compared to 2001.
Among STs, the sex ratios are
favourable (more than 1000) in all
taluks. As against decline in SC sex
ratio, that among STs has improved
during 2001-2011. Since STs are a
sizable share of population in
Raichur, favorableness of sex ratio
among them has also affected the
overall sex ratio. That number of
women is more again points out to
the multifarious deprivations.
9.3. Literacy and Educational
Profile
Inclusive growth presupposes
inclusive education (Tilak, 2007).
Table 9.2 compares the literacy
rates of SC and ST population with
that of the general population. That
Raichur district’s literacy
attainments are lower than
Karnataka’s in all segments of
population is well documented.
The disparity between overall
literacy and that of SCs and STs is
clearly visible. While the overall
literacy rate in Raichur district is
at 60 per cent, the literacy among
SCs and STs is 53 per cent and 44
per cent, respectively. Gender wise,
similar to total population, FLRs are
Since STs are a
sizable share
of population in
Raichur,
favorableness
of sex ratio
among them
has also
affected the
overall sex
ratio.
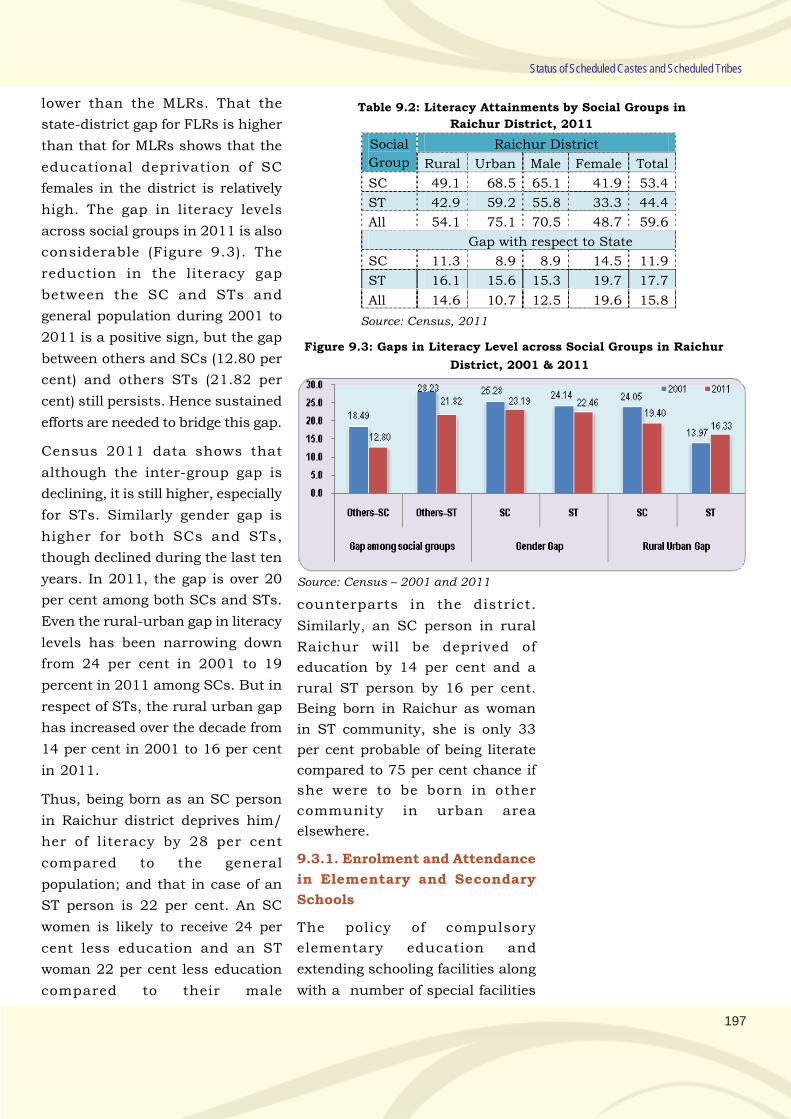
197
Status of Scheduled Castes and Scheduled Tribes
Table 9.2: Literacy Attainments by Social Groups in
Raichur District, 2011
Social
Group
Raichur District
Rural Urban Male Female Total
SC 49.1 68.5 65.1 41.9 53.4
ST 42.9 59.2 55.8 33.3 44.4
All 54.1 75.1 70.5 48.7 59.6
Gap with respect to State
SC 11.3 8.9 8.9 14.5 11.9
ST 16.1 15.6 15.3 19.7 17.7
All 14.6 10.7 12.5 19.6 15.8
Source: Census, 2011
lower than the MLRs. That the
state-district gap for FLRs is higher
than that for MLRs shows that the
educational deprivation of SC
females in the district is relatively
high. The gap in literacy levels
across social groups in 2011 is also
considerable (Figure 9.3). The
reduction in the literacy gap
between the SC and STs and
general population during 2001 to
2011 is a positive sign, but the gap
between others and SCs (12.80 per
cent) and others STs (21.82 per
cent) still persists. Hence sustained
efforts are needed to bridge this gap.
Census 2011 data shows that
although the inter-group gap is
declining, it is still higher, especially
for STs. Similarly gender gap is
higher for both SCs and STs,
though declined during the last ten
years. In 2011, the gap is over 20
per cent among both SCs and STs.
Even the rural-urban gap in literacy
levels has been narrowing down
from 24 per cent in 2001 to 19
percent in 2011 among SCs. But in
respect of STs, the rural urban gap
has increased over the decade from
14 per cent in 2001 to 16 per cent
in 2011.
Thus, being born as an SC person
in Raichur district deprives him/
her of literacy by 28 per cent
compared to the general
population; and that in case of an
ST person is 22 per cent. An SC
women is likely to receive 24 per
cent less education and an ST
woman 22 per cent less education
compared to their male
Figure 9.3: Gaps in Literacy Level across Social Groups in Raichur
District, 2001 & 2011
Source: Census – 2001 and 2011
counterparts in the district.
Similarly, an SC person in rural
Raichur will be deprived of
education by 14 per cent and a
rural ST person by 16 per cent.
Being born in Raichur as woman
in ST community, she is only 33
per cent probable of being literate
compared to 75 per cent chance if
she were to be born in other
community in urban area
elsewhere.
9.3.1. Enrolment and Attendance
in Elementary and Secondary
Schools
The policy of compulsory
elementary education and
extending schooling facilities along
with a number of special facilities
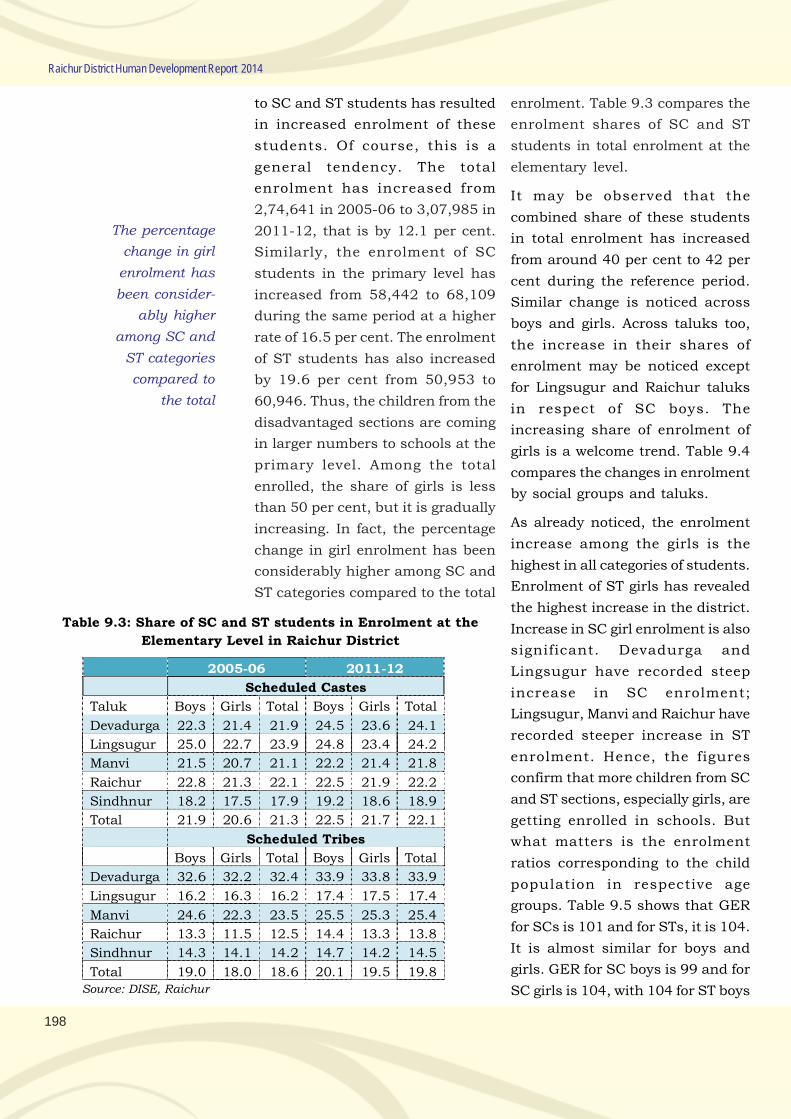
198
Raichur District Human Development Report 2014
to SC and ST students has resulted
in increased enrolment of these
students. Of course, this is a
general tendency. The total
enrolment has increased from
2,74,641 in 2005-06 to 3,07,985 in
2011-12, that is by 12.1 per cent.
Similarly, the enrolment of SC
students in the primary level has
increased from 58,442 to 68,109
during the same period at a higher
rate of 16.5 per cent. The enrolment
of ST students has also increased
by 19.6 per cent from 50,953 to
60,946. Thus, the children from the
disadvantaged sections are coming
in larger numbers to schools at the
primary level. Among the total
enrolled, the share of girls is less
than 50 per cent, but it is gradually
increasing. In fact, the percentage
change in girl enrolment has been
considerably higher among SC and
ST categories compared to the total
Table 9.3: Share of SC and ST students in Enrolment at the
Elementary Level in Raichur District
2005-06 2011-12
Scheduled Castes
Taluk Boys Girls Total Boys Girls Total
Devadurga 22.3 21.4 21.9 24.5 23.6 24.1
Lingsugur 25.0 22.7 23.9 24.8 23.4 24.2
Manvi 21.5 20.7 21.1 22.2 21.4 21.8
Raichur 22.8 21.3 22.1 22.5 21.9 22.2
Sindhnur 18.2 17.5 17.9 19.2 18.6 18.9
Total 21.9 20.6 21.3 22.5 21.7 22.1
Scheduled Tribes
Boys Girls Total Boys Girls Total
Devadurga 32.6 32.2 32.4 33.9 33.8 33.9
Lingsugur 16.2 16.3 16.2 17.4 17.5 17.4
Manvi 24.6 22.3 23.5 25.5 25.3 25.4
Raichur 13.3 11.5 12.5 14.4 13.3 13.8
Sindhnur 14.3 14.1 14.2 14.7 14.2 14.5
Total 19.0 18.0 18.6 20.1 19.5 19.8
Source: DISE, Raichur
enrolment. Table 9.3 compares the
enrolment shares of SC and ST
students in total enrolment at the
elementary level.
It may be observed that the
combined share of these students
in total enrolment has increased
from around 40 per cent to 42 per
cent during the reference period.
Similar change is noticed across
boys and girls. Across taluks too,
the increase in their shares of
enrolment may be noticed except
for Lingsugur and Raichur taluks
in respect of SC boys. The
increasing share of enrolment of
girls is a welcome trend. Table 9.4
compares the changes in enrolment
by social groups and taluks.
As already noticed, the enrolment
increase among the girls is the
highest in all categories of students.
Enrolment of ST girls has revealed
the highest increase in the district.
Increase in SC girl enrolment is also
significant. Devadurga and
Lingsugur have recorded steep
increase in SC enrolment;
Lingsugur, Manvi and Raichur have
recorded steeper increase in ST
enrolment. Hence, the figures
confirm that more children from SC
and ST sections, especially girls, are
getting enrolled in schools. But
what matters is the enrolment
ratios corresponding to the child
population in respective age
groups. Table 9.5 shows that GER
for SCs is 101 and for STs, it is 104.
It is almost similar for boys and
girls. GER for SC boys is 99 and for
SC girls is 104, with 104 for ST boys
The percentage
change in girl
enrolment has
been consider-
ably higher
among SC and
ST categories
compared to
the total
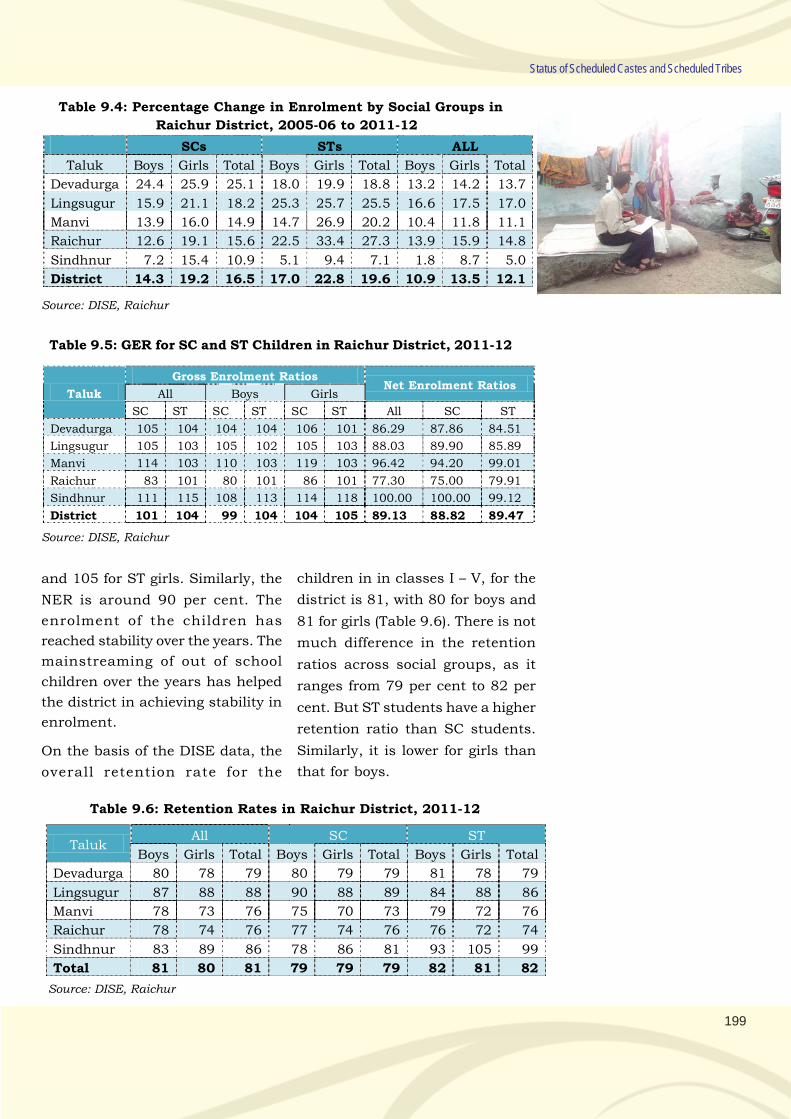
199
Status of Scheduled Castes and Scheduled Tribes
Table 9.4: Percentage Change in Enrolment by Social Groups in
Raichur District, 2005-06 to 2011-12
SCs STs ALL
Taluk Boys Girls Total Boys Girls Total Boys Girls Total
Devadurga 24.4 25.9 25.1 18.0 19.9 18.8 13.2 14.2 13.7
Lingsugur 15.9 21.1 18.2 25.3 25.7 25.5 16.6 17.5 17.0
Manvi 13.9 16.0 14.9 14.7 26.9 20.2 10.4 11.8 11.1
Raichur 12.6 19.1 15.6 22.5 33.4 27.3 13.9 15.9 14.8
Sindhnur 7.2 15.4 10.9 5.1 9.4 7.1 1.8 8.7 5.0
District 14.3 19.2 16.5 17.0 22.8 19.6 10.9 13.5 12.1
Source: DISE, Raichur
and 105 for ST girls. Similarly, the
NER is around 90 per cent. The
enrolment of the children has
reached stability over the years. The
mainstreaming of out of school
children over the years has helped
the district in achieving stability in
enrolment.
On the basis of the DISE data, the
overall retention rate for the
Table 9.5: GER for SC and ST Children in Raichur District, 2011-12
Taluk
Gross Enrolment Ratios Net Enrolment Ratios
All Boys Girls
SC ST SC ST SC ST All SC ST
Devadurga 105 104 104 104 106 101 86.29 87.86 84.51
Lingsugur 105 103 105 102 105 103 88.03 89.90 85.89
Manvi 114 103 110 103 119 103 96.42 94.20 99.01
Raichur 83 101 80 101 86 101 77.30 75.00 79.91
Sindhnur 111 115 108 113 114 118 100.00 100.00 99.12
District 101 104 99 104 104 105 89.13 88.82 89.47
Source: DISE, Raichur
children in in classes I – V, for the
district is 81, with 80 for boys and
81 for girls (Table 9.6). There is not
much difference in the retention
ratios across social groups, as it
ranges from 79 per cent to 82 per
cent. But ST students have a higher
retention ratio than SC students.
Similarly, it is lower for girls than
that for boys.
Table 9.6: Retention Rates in Raichur District, 2011-12
Taluk All SC ST
Boys Girls Total Boys Girls Total Boys Girls Total
Devadurga 80 78 79 80 79 79 81 78 79
Lingsugur 87 88 88 90 88 89 84 88 86
Manvi 78 73 76 75 70 73 79 72 76
Raichur 78 74 76 77 74 76 76 72 74
Sindhnur 83 89 86 78 86 81 93 105 99
Total 81 80 81 79 79 79 82 81 82
Source: DISE, Raichur
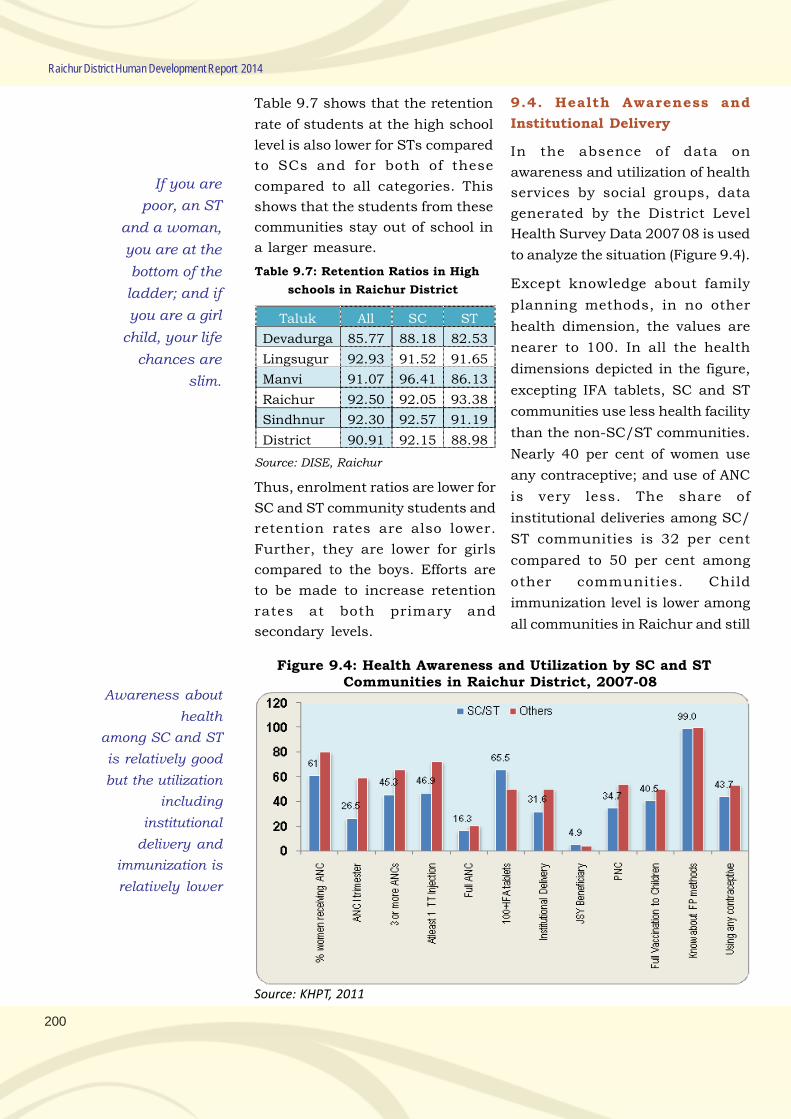
200
Raichur District Human Development Report 2014
Table 9.7 shows that the retention
rate of students at the high school
level is also lower for STs compared
to SCs and for both of these
compared to all categories. This
shows that the students from these
communities stay out of school in
a larger measure.
Table 9.7: Retention Ratios in High
schools in Raichur District
Taluk All SC ST
Devadurga 85.77 88.18 82.53
Lingsugur 92.93 91.52 91.65
Manvi 91.07 96.41 86.13
Raichur 92.50 92.05 93.38
Sindhnur 92.30 92.57 91.19
District 90.91 92.15 88.98
Source: DISE, Raichur
Thus, enrolment ratios are lower for
SC and ST community students and
retention rates are also lower.
Further, they are lower for girls
compared to the boys. Efforts are
to be made to increase retention
rates at both primary and
secondary levels.
Figure 9.4: Health Awareness and Utilization by SC and STCommunities in Raichur District, 2007-08
9.4. Health Awareness and
Institutional Delivery
In the absence of data on
awareness and utilization of health
services by social groups, data
generated by the District Level
Health Survey Data 2007 08 is used
to analyze the situation (Figure 9.4).
Except knowledge about family
planning methods, in no other
health dimension, the values are
nearer to 100. In all the health
dimensions depicted in the figure,
excepting IFA tablets, SC and ST
communities use less health facility
than the non-SC/ST communities.
Nearly 40 per cent of women use
any contraceptive; and use of ANC
is very less. The share of
institutional deliveries among SC/
ST communities is 32 per cent
compared to 50 per cent among
other communities. Child
immunization level is lower among
all communities in Raichur and still
Source: KHPT, 2011
If you are
poor, an ST
and a woman,
you are at the
bottom of the
ladder; and if
you are a girl
child, your life
chances are
slim.
Awareness about
health
among SC and ST
is relatively good
but the utilization
including
institutional
delivery and
immunization is
relatively lower
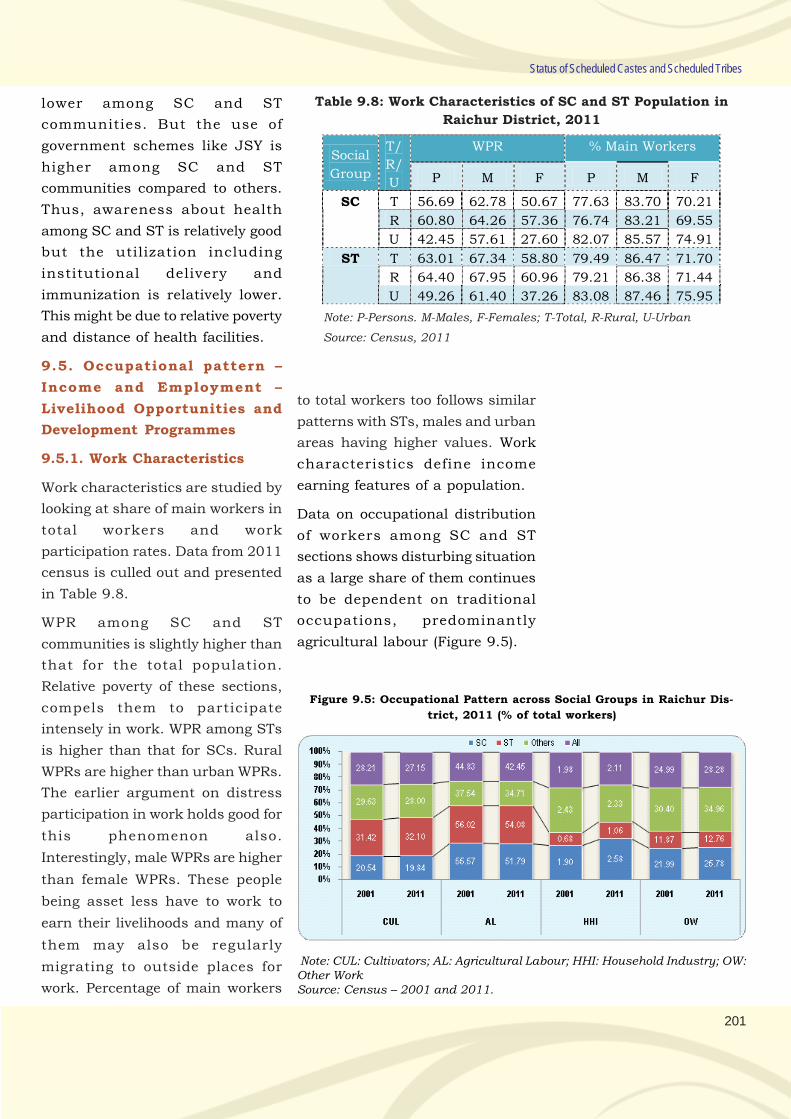
201
Status of Scheduled Castes and Scheduled Tribes
lower among SC and ST
communities. But the use of
government schemes like JSY is
higher among SC and ST
communities compared to others.
Thus, awareness about health
among SC and ST is relatively good
but the utilization including
institutional delivery and
immunization is relatively lower.
This might be due to relative poverty
and distance of health facilities.
9.5. Occupational pattern –
Income and Employment –
Livelihood Opportunities and
Development Programmes
9.5.1. Work Characteristics
Work characteristics are studied by
looking at share of main workers in
total workers and work
participation rates. Data from 2011
census is culled out and presented
in Table 9.8.
WPR among SC and ST
communities is slightly higher than
that for the total population.
Relative poverty of these sections,
compels them to participate
intensely in work. WPR among STs
is higher than that for SCs. Rural
WPRs are higher than urban WPRs.
The earlier argument on distress
participation in work holds good for
this phenomenon also.
Interestingly, male WPRs are higher
than female WPRs. These people
being asset less have to work to
earn their livelihoods and many of
them may also be regularly
migrating to outside places for
work. Percentage of main workers
Table 9.8: Work Characteristics of SC and ST Population in
Raichur District, 2011
Social
Group
T/
R/
U
WPR % Main Workers
P M F P M F
SC T 56.69 62.78 50.67 77.63 83.70 70.21
R 60.80 64.26 57.36 76.74 83.21 69.55
U 42.45 57.61 27.60 82.07 85.57 74.91
ST T 63.01 67.34 58.80 79.49 86.47 71.70
R 64.40 67.95 60.96 79.21 86.38 71.44
U 49.26 61.40 37.26 83.08 87.46 75.95
Note: P-Persons. M-Males, F-Females; T-Total, R-Rural, U-Urban
Source: Census, 2011
to total workers too follows similar
patterns with STs, males and urban
areas having higher values. Work
characteristics define income
earning features of a population.
Data on occupational distribution
of workers among SC and ST
sections shows disturbing situation
as a large share of them continues
to be dependent on traditional
occupations, predominantly
agricultural labour (Figure 9.5).
Figure 9.5: Occupational Pattern across Social Groups in Raichur Dis-
trict, 2011 (% of total workers)
Note: CUL: Cultivators; AL: Agricultural Labour; HHI: Household Industry; OW:Other WorkSource: Census – 2001 and 2011.
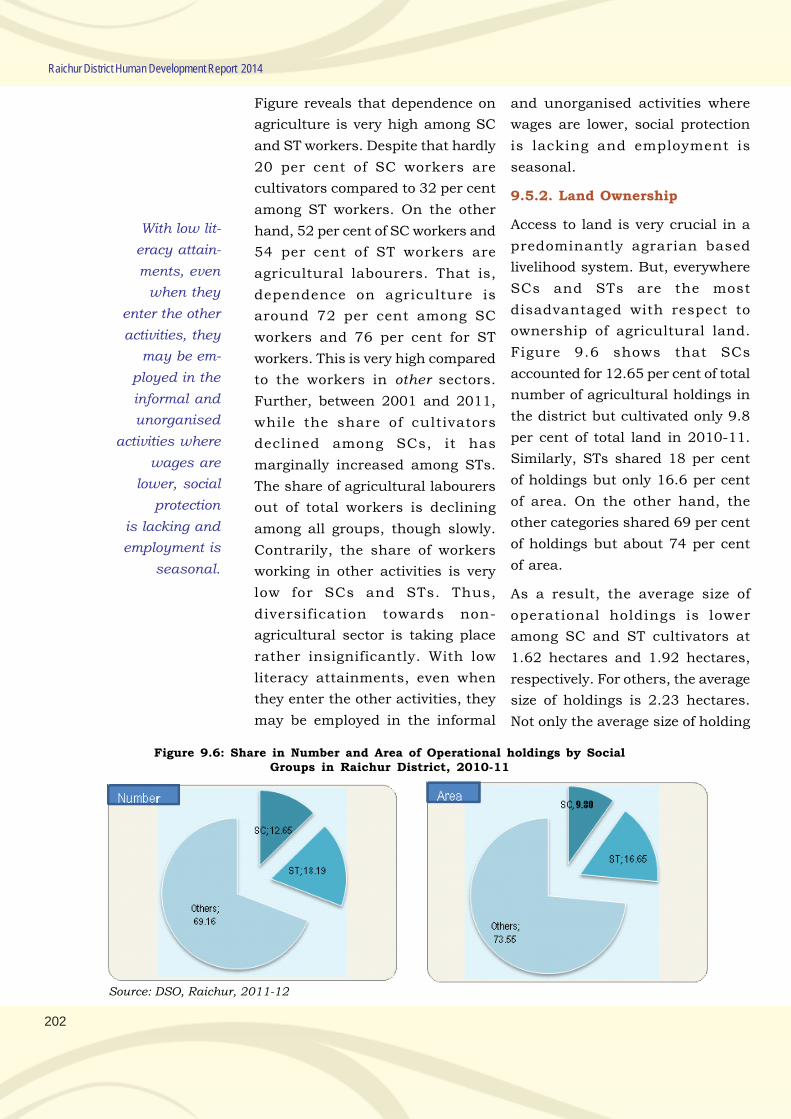
202
Raichur District Human Development Report 2014
Figure reveals that dependence on
agriculture is very high among SC
and ST workers. Despite that hardly
20 per cent of SC workers are
cultivators compared to 32 per cent
among ST workers. On the other
hand, 52 per cent of SC workers and
54 per cent of ST workers are
agricultural labourers. That is,
dependence on agriculture is
around 72 per cent among SC
workers and 76 per cent for ST
workers. This is very high compared
to the workers in other sectors.
Further, between 2001 and 2011,
while the share of cultivators
declined among SCs, it has
marginally increased among STs.
The share of agricultural labourers
out of total workers is declining
among all groups, though slowly.
Contrarily, the share of workers
working in other activities is very
low for SCs and STs. Thus,
diversification towards non-
agricultural sector is taking place
rather insignificantly. With low
literacy attainments, even when
they enter the other activities, they
may be employed in the informal
and unorganised activities where
wages are lower, social protection
is lacking and employment is
seasonal.
9.5.2. Land Ownership
Access to land is very crucial in a
predominantly agrarian based
livelihood system. But, everywhere
SCs and STs are the most
disadvantaged with respect to
ownership of agricultural land.
Figure 9.6 shows that SCs
accounted for 12.65 per cent of total
number of agricultural holdings in
the district but cultivated only 9.8
per cent of total land in 2010-11.
Similarly, STs shared 18 per cent
of holdings but only 16.6 per cent
of area. On the other hand, the
other categories shared 69 per cent
of holdings but about 74 per cent
of area.
As a result, the average size of
operational holdings is lower
among SC and ST cultivators at
1.62 hectares and 1.92 hectares,
respectively. For others, the average
size of holdings is 2.23 hectares.
Not only the average size of holding
Figure 9.6: Share in Number and Area of Operational holdings by SocialGroups in Raichur District, 2010-11
Source: DSO, Raichur, 2011-12
With low lit-
eracy attain-
ments, even
when they
enter the other
activities, they
may be em-
ployed in the
informal and
unorganised
activities where
wages are
lower, social
protection
is lacking and
employment is
seasonal.
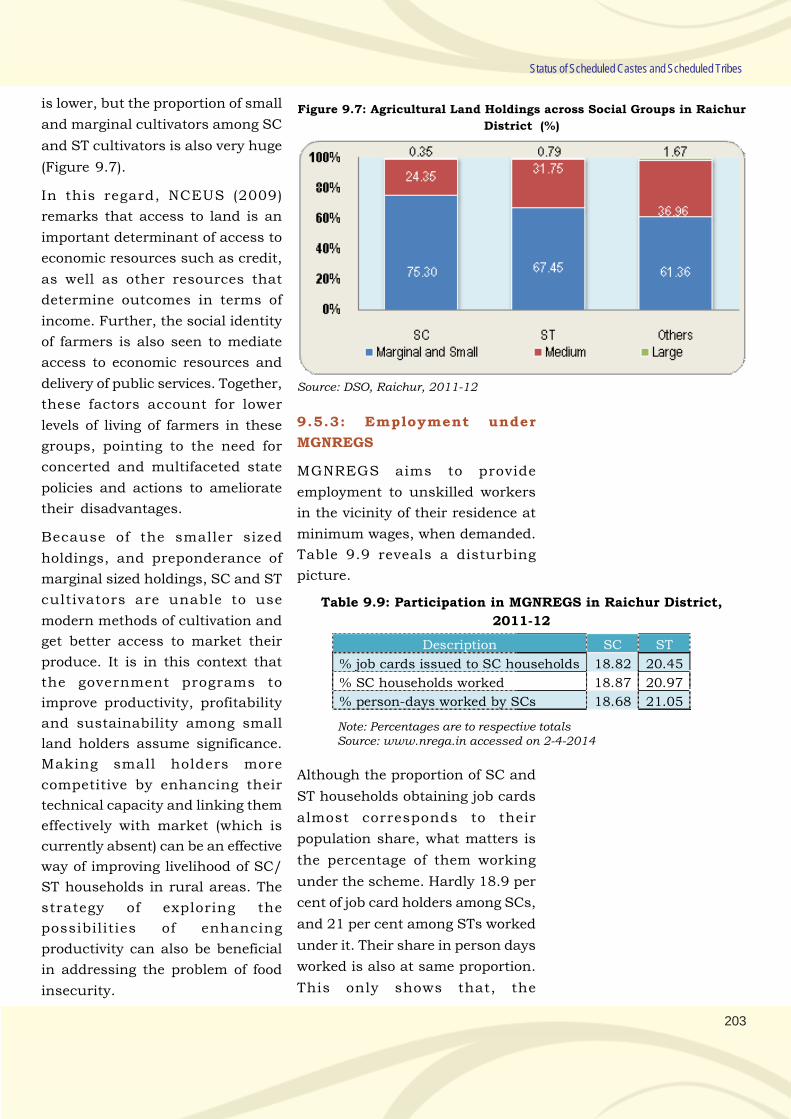
203
Status of Scheduled Castes and Scheduled Tribes
is lower, but the proportion of small
and marginal cultivators among SC
and ST cultivators is also very huge
(Figure 9.7).
In this regard, NCEUS (2009)
remarks that access to land is an
important determinant of access to
economic resources such as credit,
as well as other resources that
determine outcomes in terms of
income. Further, the social identity
of farmers is also seen to mediate
access to economic resources and
delivery of public services. Together,
these factors account for lower
levels of living of farmers in these
groups, pointing to the need for
concerted and multifaceted state
policies and actions to ameliorate
their disadvantages.
Because of the smaller sized
holdings, and preponderance of
marginal sized holdings, SC and ST
cultivators are unable to use
modern methods of cultivation and
get better access to market their
produce. It is in this context that
the government programs to
improve productivity, profitability
and sustainability among small
land holders assume significance.
Making small holders more
competitive by enhancing their
technical capacity and linking them
effectively with market (which is
currently absent) can be an effective
way of improving livelihood of SC/
ST households in rural areas. The
strategy of exploring the
possibilities of enhancing
productivity can also be beneficial
in addressing the problem of food
insecurity.
Figure 9.7: Agricultural Land Holdings across Social Groups in Raichur
District (%)
Source: DSO, Raichur, 2011-12
9.5.3: Employment under
MGNREGS
MGNREGS aims to provide
employment to unskilled workers
in the vicinity of their residence at
minimum wages, when demanded.
Table 9.9 reveals a disturbing
picture.
Table 9.9: Participation in MGNREGS in Raichur District,
2011-12
Description SC ST
% job cards issued to SC households 18.82 20.45
% SC households worked 18.87 20.97
% person-days worked by SCs 18.68 21.05
Note: Percentages are to respective totalsSource: www.nrega.in accessed on 2-4-2014
Although the proportion of SC and
ST households obtaining job cards
almost corresponds to their
population share, what matters is
the percentage of them working
under the scheme. Hardly 18.9 per
cent of job card holders among SCs,
and 21 per cent among STs worked
under it. Their share in person days
worked is also at same proportion.
This only shows that, the
204
Raichur District Human Development Report 2014
programme meant for vulnerable
sections of the society, who do not
have secure livelihoods, does not
seem to be working satisfactorily.
9.5.4. Schemes and Programmes
of Department of Social Welfare
The governments at various levels,
under the given Constitutional
mandate, have formulated various
schemes and programmes for socio-
economic upliftment and
educational advancement of SC/
STs. The Department of Social
Welfare (DSW) implements the
same. Although, majority of the
schemes executed by the
Department are funded by State
Government, some schemes are
assisted by Central Government
under Special Component Plan
(SCP) and Tribal Sub Plan (TSP).
There are 81 hostels run by the
DSW and 65 hostels that are
provided grant-in-aid (Table 9.10.)
They cater to the needs of boarding
and lodging requirements of nearly
12000 SC/ST students in the
district. Of the government run 81
hostels, 28 are girls’ hostels and 53
are boys’ hostels. Given the lower
enrolment of girls from these
communities, there is a need to
open more number of girls’ hostels
as a priority measure. Similarly,
more than 27000 SC and ST
students are given scholarships.
Though hostels are spread
throughout the district, 40 per cent
of scholarships are availed by
students from Raichur taluk. There
is a need to increase awareness
among students regarding the
schemes available for SC and ST
students.
Further under Dr.B.R.Ambedkar
Housing Scheme 107 houses for
SCs and 92 houses for STs were
constructed during 2011-12.
Similarly, under Indira Awas
Yojana about 14800 houses and
Ashraya Scheme about 10141
houses were constructed, out of
which nearly three-fourths of the
houses were allotted to these
households and in Devadurga
taluka 80 per cent of houses were
allotted to SC and ST households.
In the year 2011-12, a total amount
of Rs. 1472 lakhs was spent on
welfare of SC and ST communities
and SCP and TSP. It amounts to
nearly 15 per cent of the total
expenditure of the ZP. But it was
Table 9.10: Hostels, Residential Schools and Scholarships Availed by SC in
Raichur District, 2011-12
Taluk Department Hostels Aided Hostels Scholarships
No. Students No. Students Pre-Matric Post-Matric
Devadurga 20 1480 15 1080 3669 347
Lingsugur 20 1475 18 1375 2919 531
Manvi 12 825 9 675 2817 505
Raichur 18 1848 14 1473 9082 1971
Sindhnur 11 908 9 783 4713 605
District 81 6536 65 5386 23200 3959
Source: Department of Social Welfare, Raichur
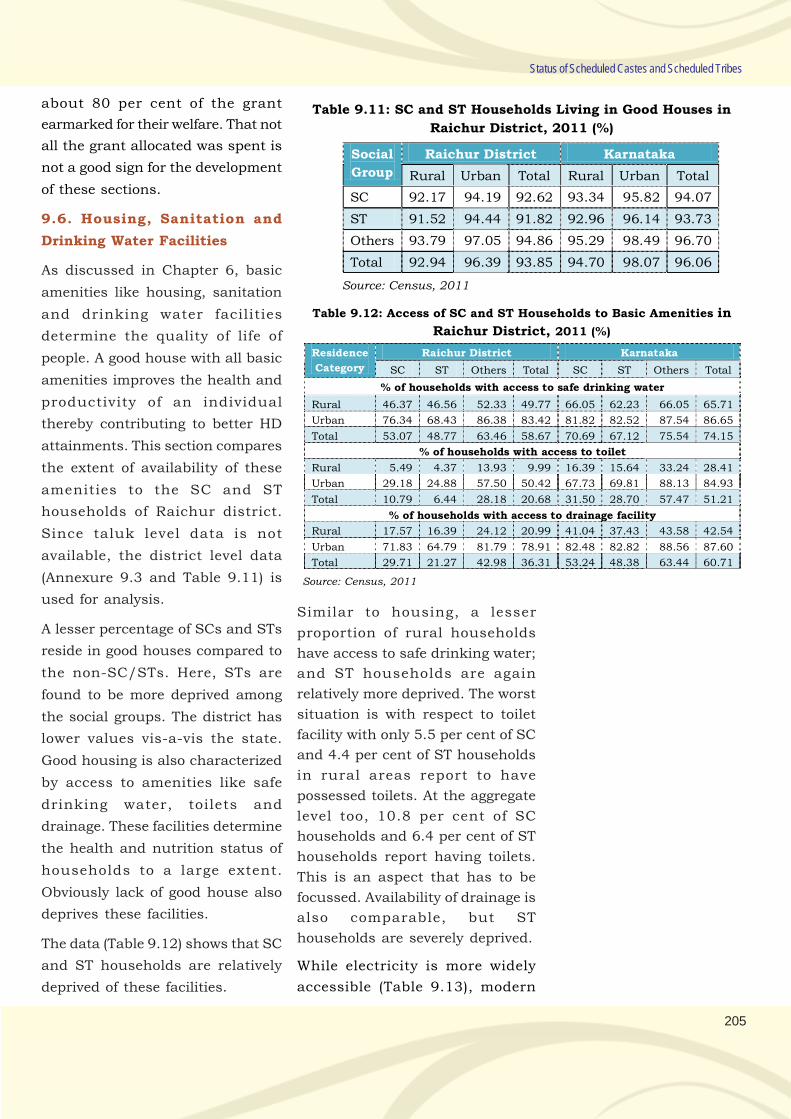
205
Status of Scheduled Castes and Scheduled Tribes
about 80 per cent of the grant
earmarked for their welfare. That not
all the grant allocated was spent is
not a good sign for the development
of these sections.
9.6. Housing, Sanitation and
Drinking Water Facilities
As discussed in Chapter 6, basic
amenities like housing, sanitation
and drinking water facilities
determine the quality of life of
people. A good house with all basic
amenities improves the health and
productivity of an individual
thereby contributing to better HD
attainments. This section compares
the extent of availability of these
amenities to the SC and ST
households of Raichur district.
Since taluk level data is not
available, the district level data
(Annexure 9.3 and Table 9.11) is
used for analysis.
A lesser percentage of SCs and STs
reside in good houses compared to
the non-SC/STs. Here, STs are
found to be more deprived among
the social groups. The district has
lower values vis-a-vis the state.
Good housing is also characterized
by access to amenities like safe
drinking water, toilets and
drainage. These facilities determine
the health and nutrition status of
households to a large extent.
Obviously lack of good house also
deprives these facilities.
The data (Table 9.12) shows that SC
and ST households are relatively
deprived of these facilities.
Table 9.11: SC and ST Households Living in Good Houses in
Raichur District, 2011 (%)
Social
Group
Raichur District Karnataka
Rural Urban Total Rural Urban Total
SC 92.17 94.19 92.62 93.34 95.82 94.07
ST 91.52 94.44 91.82 92.96 96.14 93.73
Others 93.79 97.05 94.86 95.29 98.49 96.70
Total 92.94 96.39 93.85 94.70 98.07 96.06
Source: Census, 2011
Table 9.12: Access of SC and ST Households to Basic Amenities in
Raichur District, 2011 (%)
Residence
Category
Raichur District Karnataka
SC ST Others Total SC ST Others Total
% of households with access to safe drinking water
Rural 46.37 46.56 52.33 49.77 66.05 62.23 66.05 65.71
Urban 76.34 68.43 86.38 83.42 81.82 82.52 87.54 86.65
Total 53.07 48.77 63.46 58.67 70.69 67.12 75.54 74.15
% of households with access to toilet
Rural 5.49 4.37 13.93 9.99 16.39 15.64 33.24 28.41
Urban 29.18 24.88 57.50 50.42 67.73 69.81 88.13 84.93
Total 10.79 6.44 28.18 20.68 31.50 28.70 57.47 51.21
% of households with access to drainage facility
Rural 17.57 16.39 24.12 20.99 41.04 37.43 43.58 42.54
Urban 71.83 64.79 81.79 78.91 82.48 82.82 88.56 87.60
Total 29.71 21.27 42.98 36.31 53.24 48.38 63.44 60.71
Source: Census, 2011
Similar to housing, a lesser
proportion of rural households
have access to safe drinking water;
and ST households are again
relatively more deprived. The worst
situation is with respect to toilet
facility with only 5.5 per cent of SC
and 4.4 per cent of ST households
in rural areas report to have
possessed toilets. At the aggregate
level too, 10.8 per cent of SC
households and 6.4 per cent of ST
households report having toilets.
This is an aspect that has to be
focussed. Availability of drainage is
also comparable, but ST
households are severely deprived.
While electricity is more widely
accessible (Table 9.13), modern
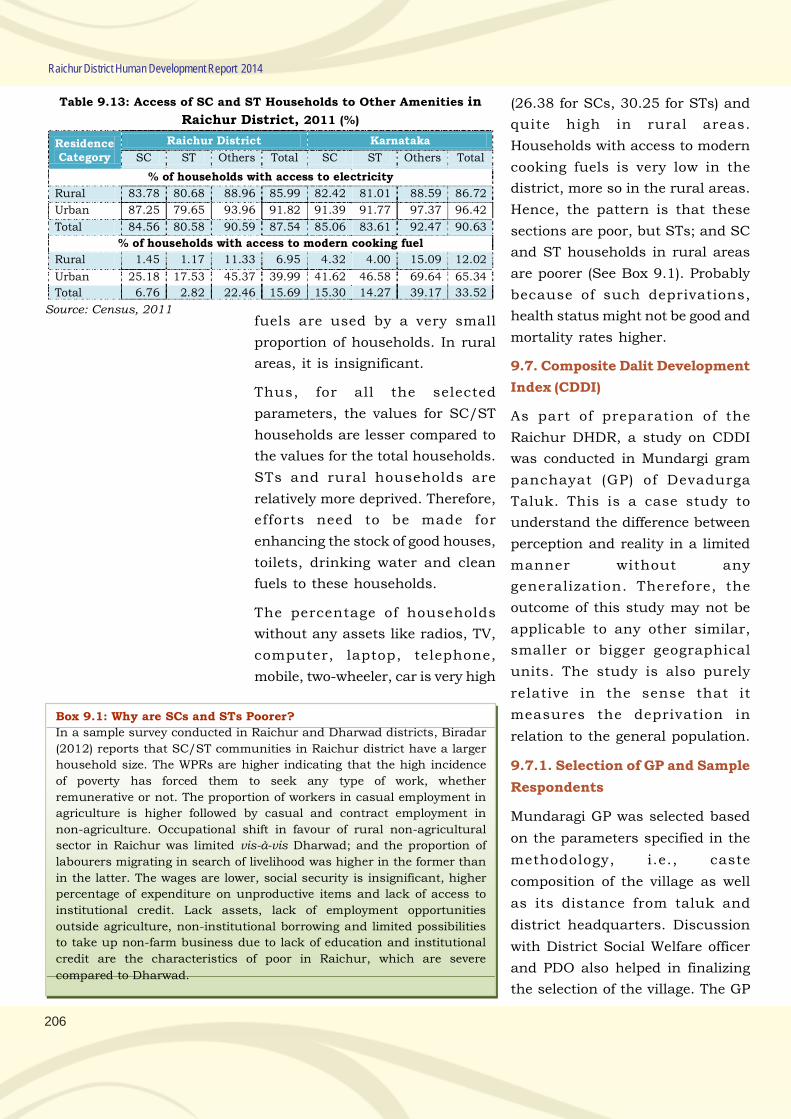
206
Raichur District Human Development Report 2014
fuels are used by a very small
proportion of households. In rural
areas, it is insignificant.
Thus, for all the selected
parameters, the values for SC/ST
households are lesser compared to
the values for the total households.
STs and rural households are
relatively more deprived. Therefore,
efforts need to be made for
enhancing the stock of good houses,
toilets, drinking water and clean
fuels to these households.
The percentage of households
without any assets like radios, TV,
computer, laptop, telephone,
mobile, two-wheeler, car is very high
Table 9.13: Access of SC and ST Households to Other Amenities in
Raichur District, 2011 (%)
Source: Census, 2011
Box 9.1: Why are SCs and STs Poorer?
In a sample survey conducted in Raichur and Dharwad districts, Biradar
(2012) reports that SC/ST communities in Raichur district have a larger
household size. The WPRs are higher indicating that the high incidence
of poverty has forced them to seek any type of work, whether
remunerative or not. The proportion of workers in casual employment in
agriculture is higher followed by casual and contract employment in
non-agriculture. Occupational shift in favour of rural non-agricultural
sector in Raichur was limited vis-à-vis Dharwad; and the proportion of
labourers migrating in search of livelihood was higher in the former than
in the latter. The wages are lower, social security is insignificant, higher
percentage of expenditure on unproductive items and lack of access to
institutional credit. Lack assets, lack of employment opportunities
outside agriculture, non-institutional borrowing and limited possibilities
to take up non-farm business due to lack of education and institutional
credit are the characteristics of poor in Raichur, which are severe
compared to Dharwad.
(26.38 for SCs, 30.25 for STs) and
quite high in rural areas.
Households with access to modern
cooking fuels is very low in the
district, more so in the rural areas.
Hence, the pattern is that these
sections are poor, but STs; and SC
and ST households in rural areas
are poorer (See Box 9.1). Probably
because of such deprivations,
health status might not be good and
mortality rates higher.
9.7. Composite Dalit Development
Index (CDDI)
As part of preparation of the
Raichur DHDR, a study on CDDI
was conducted in Mundargi gram
panchayat (GP) of Devadurga
Taluk. This is a case study to
understand the difference between
perception and reality in a limited
manner without any
generalization. Therefore, the
outcome of this study may not be
applicable to any other similar,
smaller or bigger geographical
units. The study is also purely
relative in the sense that it
measures the deprivation in
relation to the general population.
9.7.1. Selection of GP and Sample
Respondents
Mundaragi GP was selected based
on the parameters specified in the
methodology, i.e., caste
composition of the village as well
as its distance from taluk and
district headquarters. Discussion
with District Social Welfare officer
and PDO also helped in finalizing
the selection of the village. The GP
Residence Category
Raichur District Karnataka
SC ST Others Total SC ST Others Total
% of households with access to electricity
Rural 83.78 80.68 88.96 85.99 82.42 81.01 88.59 86.72
Urban 87.25 79.65 93.96 91.82 91.39 91.77 97.37 96.42
Total 84.56 80.58 90.59 87.54 85.06 83.61 92.47 90.63
% of households with access to modern cooking fuel
Rural 1.45 1.17 11.33 6.95 4.32 4.00 15.09 12.02
Urban 25.18 17.53 45.37 39.99 41.62 46.58 69.64 65.34
Total 6.76 2.82 22.46 15.69 15.30 14.27 39.17 33.52
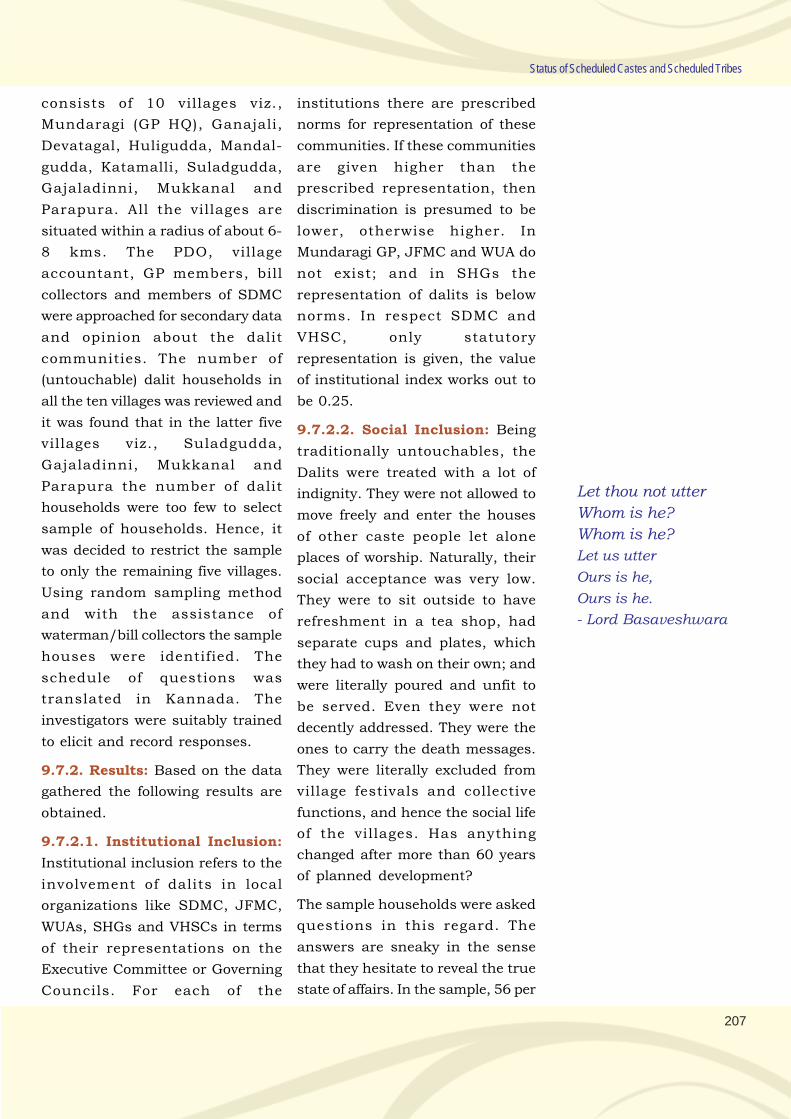
207
Status of Scheduled Castes and Scheduled Tribes
consists of 10 villages viz.,
Mundaragi (GP HQ), Ganajali,
Devatagal, Huligudda, Mandal-
gudda, Katamalli, Suladgudda,
Gajaladinni, Mukkanal and
Parapura. All the villages are
situated within a radius of about 6-
8 kms. The PDO, village
accountant, GP members, bill
collectors and members of SDMC
were approached for secondary data
and opinion about the dalit
communities. The number of
(untouchable) dalit households in
all the ten villages was reviewed and
it was found that in the latter five
villages viz., Suladgudda,
Gajaladinni, Mukkanal and
Parapura the number of dalit
households were too few to select
sample of households. Hence, it
was decided to restrict the sample
to only the remaining five villages.
Using random sampling method
and with the assistance of
waterman/bill collectors the sample
houses were identified. The
schedule of questions was
translated in Kannada. The
investigators were suitably trained
to elicit and record responses.
9.7.2. Results: Based on the data
gathered the following results are
obtained.
9.7.2.1. Institutional Inclusion:
Institutional inclusion refers to the
involvement of dalits in local
organizations like SDMC, JFMC,
WUAs, SHGs and VHSCs in terms
of their representations on the
Executive Committee or Governing
Councils. For each of the
institutions there are prescribed
norms for representation of these
communities. If these communities
are given higher than the
prescribed representation, then
discrimination is presumed to be
lower, otherwise higher. In
Mundaragi GP, JFMC and WUA do
not exist; and in SHGs the
representation of dalits is below
norms. In respect SDMC and
VHSC, only statutory
representation is given, the value
of institutional index works out to
be 0.25.
9.7.2.2. Social Inclusion: Being
traditionally untouchables, the
Dalits were treated with a lot of
indignity. They were not allowed to
move freely and enter the houses
of other caste people let alone
places of worship. Naturally, their
social acceptance was very low.
They were to sit outside to have
refreshment in a tea shop, had
separate cups and plates, which
they had to wash on their own; and
were literally poured and unfit to
be served. Even they were not
decently addressed. They were the
ones to carry the death messages.
They were literally excluded from
village festivals and collective
functions, and hence the social life
of the villages. Has anything
changed after more than 60 years
of planned development?
The sample households were asked
questions in this regard. The
answers are sneaky in the sense
that they hesitate to reveal the true
state of affairs. In the sample, 56 per
Let thou not utter
Whom is he?
Whom is he?
Let us utter
Ours is he,
Ours is he.
- Lord Basaveshwara
208
Raichur District Human Development Report 2014
cent of respondents reported that
there was no discrimination to
enter the residences of non-dalits;
82 per cent stated that they are not
discriminated for involvement in
festivals; 72 per cent responded that
they are not addressed with
indignity; and 66 per cent felt that
they are not discriminated as far as
entry into hotels and tea shops is
concerned. Thus, though not all of
them agree that discrimination is
not practised, lesser portion of them
reveal unrestricted entry into
residences of non-dalits and hotels.
The index of social inclusion which
is worked out at 0.70, on the basis
of the percentage of respondents
stating that there is no restriction
in the above domains.
9.7.2.3. Perception of
Discrimination: Discrimination is
a perception as well as practice. It
can be in various domains and
forms entrenched in social beliefs
and access to assets and amenities.
Even the social assets like roads,
temples, hotels, tanks, wells may
not be accessible to them. Many a
times the government provides a
number of public goods for general
usage of all. How are these accessed
by the dalits? Are they
discriminated in provision and use
of basic amenities? These basic
amenities are water, schooling and
education and health care services.
Questions were asked to the sample
households about the nature and
extent of discrimination in the
access of these amenities. The
percentage households who reply
in the negative is considered for
index calculation. Surprisingly, no
sample dalit household perceives
any discrimination in the above
mentioned spheres as a result of
which the index of perception of
discrimination turns out to be 1.00.
It is reported by the sample dalits
that teachers do not discriminate
against their children in schools in
respect of seating; involving them
in various co-curricular and extra-
curricular activities; and in serving
mid-day meals at schools. They also
reported that health functionaries
too do not discriminate and attend
to the clients from the dalit
community in the usual way.
Similarly, in terms of participation
in work and socio-cultural activities
too, majority of the respondents feel
that discrimination is not practiced.
9.7.2.4. Protest against
Discrimination: Since sample
households do not perceive any
kind of discrimination, they said
there is no need of protesting nor
there is tendency to protest.
However, protest is bound to be
there against discriminated
provision of any service by the
government. But, when it comes to
discrimination in social and
economic spheres, none of the
sample households reported to have
protested nor they will do so in
future. Therefore, the index for
protest against discrimination is
calculated at 0.00 for the sample
population.
9.7.2.5. Conflict Resolution:
Conflicts emerge in the wake of
though not all of
them agree that
discrimination is
not practised,
lesser portion of
them reveal
unrestricted
entry into
residences of
non-dalits and
hotels
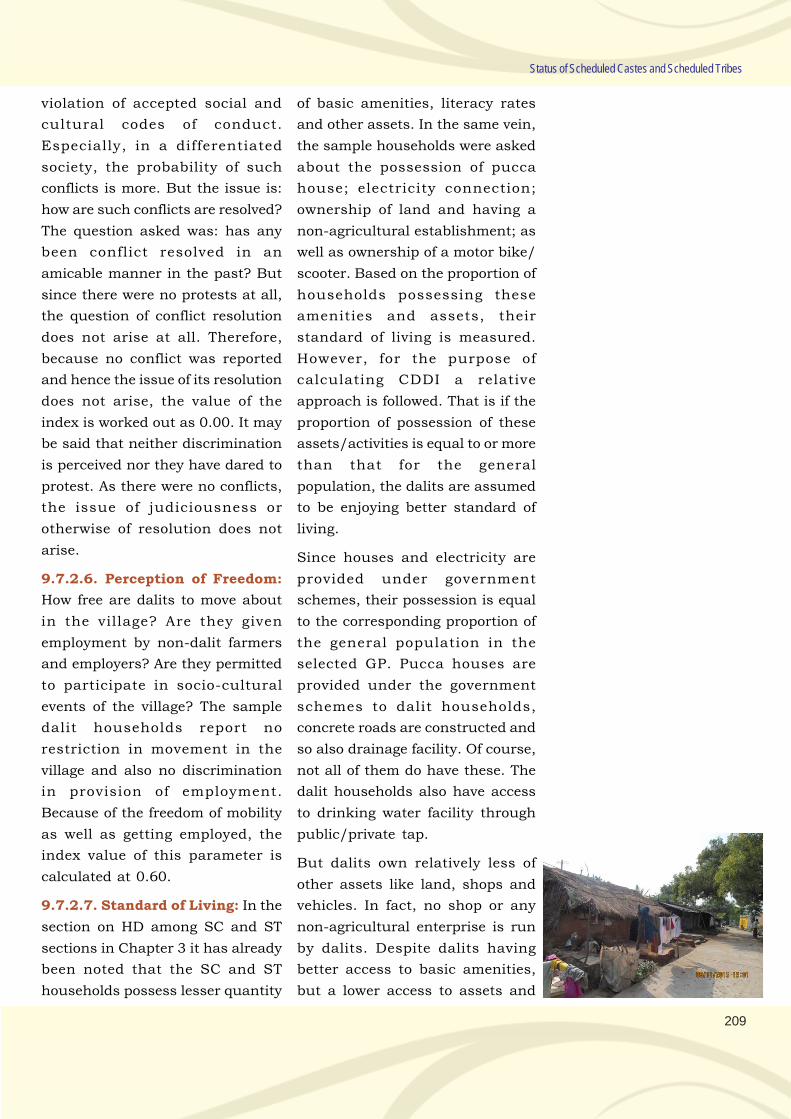
209
Status of Scheduled Castes and Scheduled Tribes
violation of accepted social and
cultural codes of conduct.
Especially, in a differentiated
society, the probability of such
conflicts is more. But the issue is:
how are such conflicts are resolved?
The question asked was: has any
been conflict resolved in an
amicable manner in the past? But
since there were no protests at all,
the question of conflict resolution
does not arise at all. Therefore,
because no conflict was reported
and hence the issue of its resolution
does not arise, the value of the
index is worked out as 0.00. It may
be said that neither discrimination
is perceived nor they have dared to
protest. As there were no conflicts,
the issue of judiciousness or
otherwise of resolution does not
arise.
9.7.2.6. Perception of Freedom:
How free are dalits to move about
in the village? Are they given
employment by non-dalit farmers
and employers? Are they permitted
to participate in socio-cultural
events of the village? The sample
dalit households report no
restriction in movement in the
village and also no discrimination
in provision of employment.
Because of the freedom of mobility
as well as getting employed, the
index value of this parameter is
calculated at 0.60.
9.7.2.7. Standard of Living: In the
section on HD among SC and ST
sections in Chapter 3 it has already
been noted that the SC and ST
households possess lesser quantity
of basic amenities, literacy rates
and other assets. In the same vein,
the sample households were asked
about the possession of pucca
house; electricity connection;
ownership of land and having a
non-agricultural establishment; as
well as ownership of a motor bike/
scooter. Based on the proportion of
households possessing these
amenities and assets, their
standard of living is measured.
However, for the purpose of
calculating CDDI a relative
approach is followed. That is if the
proportion of possession of these
assets/activities is equal to or more
than that for the general
population, the dalits are assumed
to be enjoying better standard of
living.
Since houses and electricity are
provided under government
schemes, their possession is equal
to the corresponding proportion of
the general population in the
selected GP. Pucca houses are
provided under the government
schemes to dalit households,
concrete roads are constructed and
so also drainage facility. Of course,
not all of them do have these. The
dalit households also have access
to drinking water facility through
public/private tap.
But dalits own relatively less of
other assets like land, shops and
vehicles. In fact, no shop or any
non-agricultural enterprise is run
by dalits. Despite dalits having
better access to basic amenities,
but a lower access to assets and
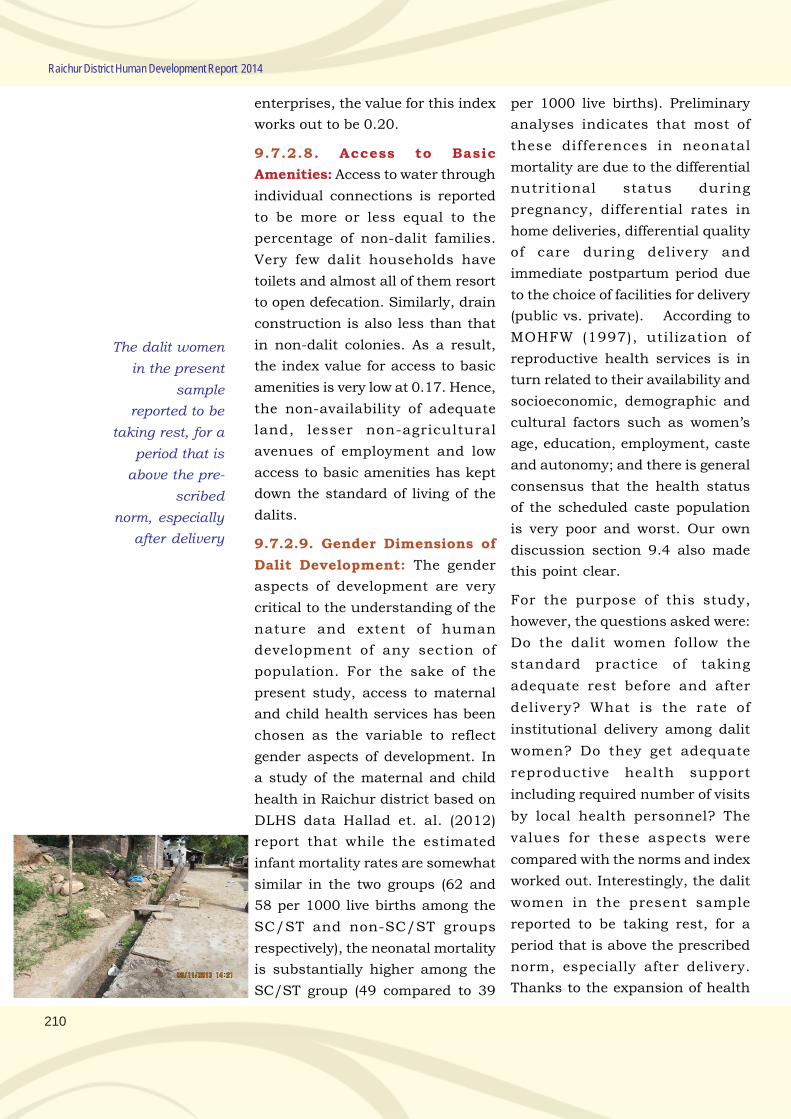
210
Raichur District Human Development Report 2014
enterprises, the value for this index
works out to be 0.20.
9.7.2.8. Access to Basic
Amenities: Access to water through
individual connections is reported
to be more or less equal to the
percentage of non-dalit families.
Very few dalit households have
toilets and almost all of them resort
to open defecation. Similarly, drain
construction is also less than that
in non-dalit colonies. As a result,
the index value for access to basic
amenities is very low at 0.17. Hence,
the non-availability of adequate
land, lesser non-agricultural
avenues of employment and low
access to basic amenities has kept
down the standard of living of the
dalits.
9.7.2.9. Gender Dimensions of
Dalit Development: The gender
aspects of development are very
critical to the understanding of the
nature and extent of human
development of any section of
population. For the sake of the
present study, access to maternal
and child health services has been
chosen as the variable to reflect
gender aspects of development. In
a study of the maternal and child
health in Raichur district based on
DLHS data Hallad et. al. (2012)
report that while the estimated
infant mortality rates are somewhat
similar in the two groups (62 and
58 per 1000 live births among the
SC/ST and non-SC/ST groups
respectively), the neonatal mortality
is substantially higher among the
SC/ST group (49 compared to 39
per 1000 live births). Preliminary
analyses indicates that most of
these differences in neonatal
mortality are due to the differential
nutritional status during
pregnancy, differential rates in
home deliveries, differential quality
of care during delivery and
immediate postpartum period due
to the choice of facilities for delivery
(public vs. private). According to
MOHFW (1997), utilization of
reproductive health services is in
turn related to their availability and
socioeconomic, demographic and
cultural factors such as women’s
age, education, employment, caste
and autonomy; and there is general
consensus that the health status
of the scheduled caste population
is very poor and worst. Our own
discussion section 9.4 also made
this point clear.
For the purpose of this study,
however, the questions asked were:
Do the dalit women follow the
standard practice of taking
adequate rest before and after
delivery? What is the rate of
institutional delivery among dalit
women? Do they get adequate
reproductive health support
including required number of visits
by local health personnel? The
values for these aspects were
compared with the norms and index
worked out. Interestingly, the dalit
women in the present sample
reported to be taking rest, for a
period that is above the prescribed
norm, especially after delivery.
Thanks to the expansion of health
The dalit women
in the present
sample
reported to be
taking rest, for a
period that is
above the pre-
scribed
norm, especially
after delivery
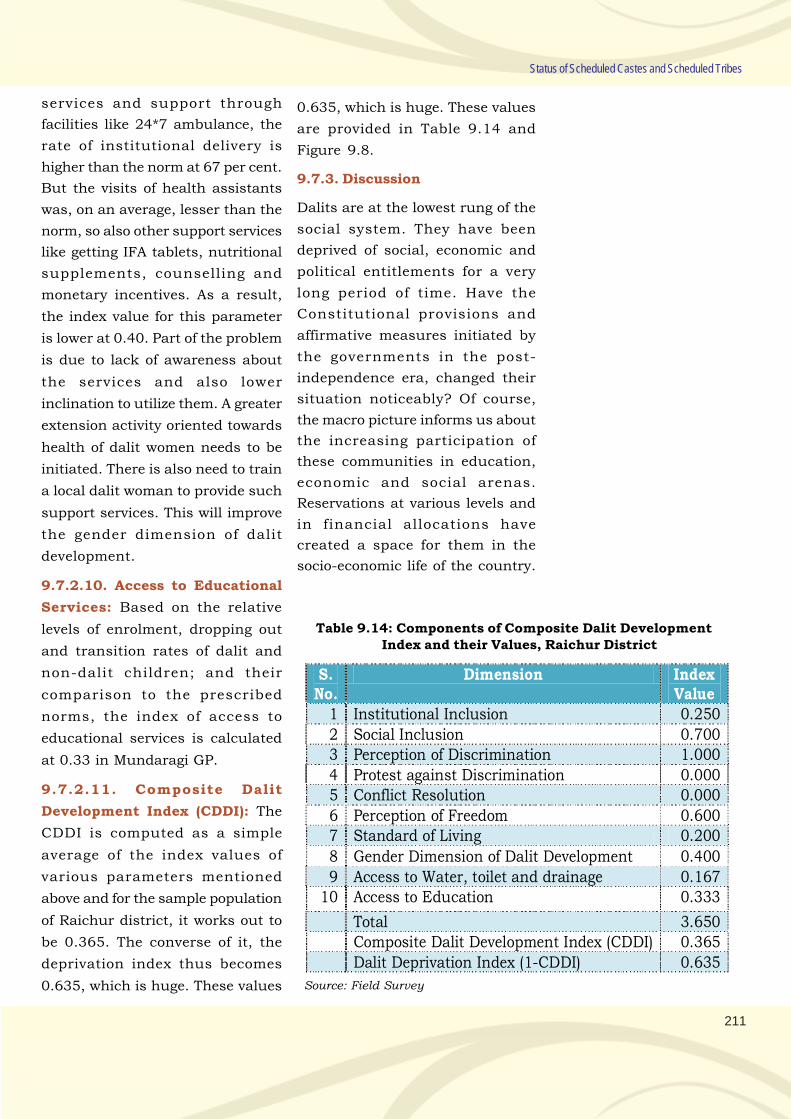
211
Status of Scheduled Castes and Scheduled Tribes
services and support through
facilities like 24*7 ambulance, the
rate of institutional delivery is
higher than the norm at 67 per cent.
But the visits of health assistants
was, on an average, lesser than the
norm, so also other support services
like getting IFA tablets, nutritional
supplements, counselling and
monetary incentives. As a result,
the index value for this parameter
is lower at 0.40. Part of the problem
is due to lack of awareness about
the services and also lower
inclination to utilize them. A greater
extension activity oriented towards
health of dalit women needs to be
initiated. There is also need to train
a local dalit woman to provide such
support services. This will improve
the gender dimension of dalit
development.
9.7.2.10. Access to Educational
Services: Based on the relative
levels of enrolment, dropping out
and transition rates of dalit and
non-dalit children; and their
comparison to the prescribed
norms, the index of access to
educational services is calculated
at 0.33 in Mundaragi GP.
9.7.2.11. Composite Dalit
Development Index (CDDI): The
CDDI is computed as a simple
average of the index values of
various parameters mentioned
above and for the sample population
of Raichur district, it works out to
be 0.365. The converse of it, the
deprivation index thus becomes
0.635, which is huge. These values
Table 9.14: Components of Composite Dalit DevelopmentIndex and their Values, Raichur District
Source: Field Survey
S. No.
Dimension Index Value
1 Institutional Inclusion 0.250 2 Social Inclusion 0.700 3 Perception of Discrimination 1.000 4 Protest against Discrimination 0.000 5 Conflict Resolution 0.000 6 Perception of Freedom 0.600 7 Standard of Living 0.200
8 Gender Dimension of Dalit Development 0.400 9 Access to Water, toilet and drainage 0.167
10 Access to Education 0.333
Total 3.650 Composite Dalit Development Index (CDDI) 0.365 Dalit Deprivation Index (1-CDDI) 0.635
0.635, which is huge. These values
are provided in Table 9.14 and
Figure 9.8.
9.7.3. Discussion
Dalits are at the lowest rung of the
social system. They have been
deprived of social, economic and
political entitlements for a very
long period of time. Have the
Constitutional provisions and
affirmative measures initiated by
the governments in the post-
independence era, changed their
situation noticeably? Of course,
the macro picture informs us about
the increasing participation of
these communities in education,
economic and social arenas.
Reservations at various levels and
in financial allocations have
created a space for them in the
socio-economic life of the country.
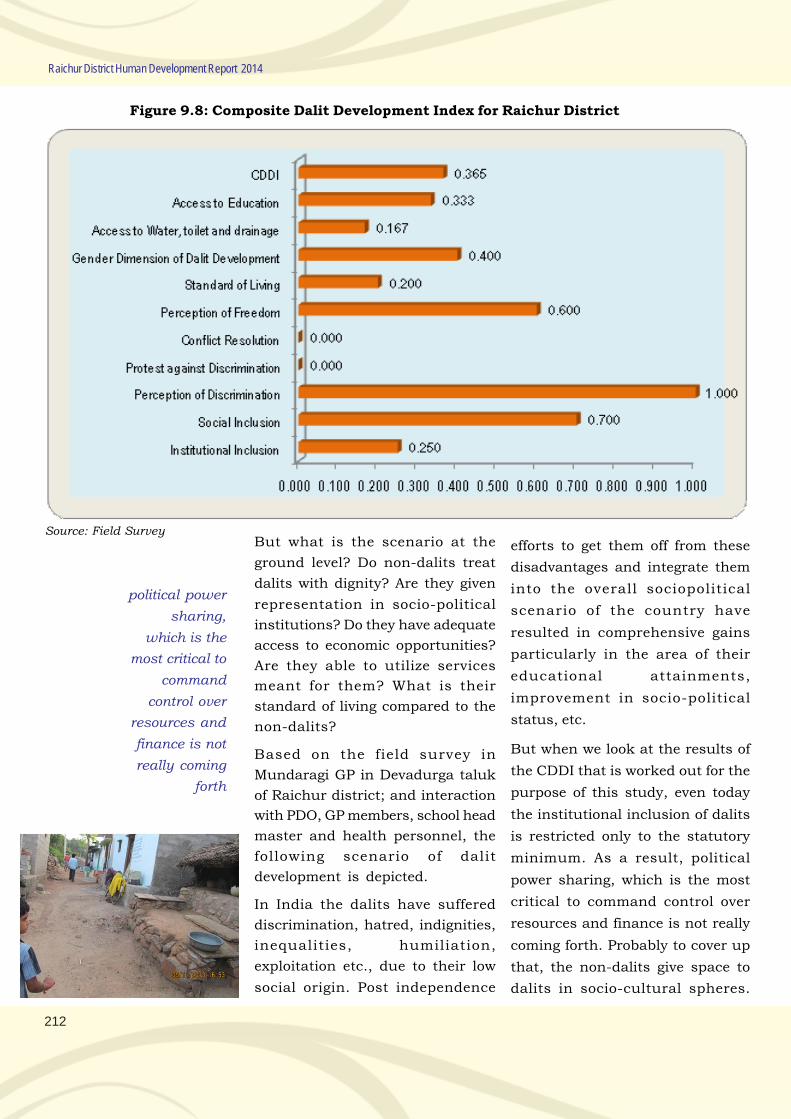
212
Raichur District Human Development Report 2014
But what is the scenario at the
ground level? Do non-dalits treat
dalits with dignity? Are they given
representation in socio-political
institutions? Do they have adequate
access to economic opportunities?
Are they able to utilize services
meant for them? What is their
standard of living compared to the
non-dalits?
Based on the field survey in
Mundaragi GP in Devadurga taluk
of Raichur district; and interaction
with PDO, GP members, school head
master and health personnel, the
following scenario of dalit
development is depicted.
In India the dalits have suffered
discrimination, hatred, indignities,
inequalities, humiliation,
exploitation etc., due to their low
social origin. Post independence
efforts to get them off from these
disadvantages and integrate them
into the overall sociopolitical
scenario of the country have
resulted in comprehensive gains
particularly in the area of their
educational attainments,
improvement in socio-political
status, etc.
But when we look at the results of
the CDDI that is worked out for the
purpose of this study, even today
the institutional inclusion of dalits
is restricted only to the statutory
minimum. As a result, political
power sharing, which is the most
critical to command control over
resources and finance is not really
coming forth. Probably to cover up
that, the non-dalits give space to
dalits in socio-cultural spheres.
political power
sharing,
which is the
most critical to
command
control over
resources and
finance is not
really coming
forth
Figure 9.8: Composite Dalit Development Index for Raichur District
Source: Field Survey
213
Status of Scheduled Castes and Scheduled Tribes
Discrimination being declared
illegal, non-dalits seem to include
dalits wherever activities are
visible/measurable. Thus, the
dalits perceive that the kind of
discrimination that prevailed a few
years ago does not prevail now.
Further, expansion of education
and a higher degree of interaction
of dalits and non-dalits with the
urban centres might have also
contributed to reduction of
discrimination. Many dalits have
been recruited as teachers, doctors
and other government servants,
who have to be accepted and, often,
obeyed.
But the real problem rests with
standard of living. For centuries,
dalits have been a landless class
and they neither had/have the
skills nor resources to start non-
agricultural ventures like shops,
businesses or even tailoring. Due
to lower literacy and skill base,
dalits are unable to diversify into
non-agriculture. That there are no
non-agricultural establishments in
the selected GP indicates the
absence of confidence among the
dalits that they can start and run
their business. Of course, lack of
institutional support, especially
credit, may be another handicap.
Due to all these reasons, they do not
enjoy a decent standard of living.
Since a certain proportion of
government assistance is
earmarked for these sections and
also because there are few schemes
exclusively for them, they have
been able to get better houses,
electricity connection, roads and
drainage and such other facilities.
However, health and related
services are not adequately
provided to them. As far as
education is concerned, there is
not much to be discriminated and
various kinds of assistance are
available to these sections. As a
result, dalits today are showing
better performance than in earlier
times. However, in health,
especially, maternal, reproductive
and child health, the dalit women
are not provided services on par
with non-dalit women. This makes
the health of the pregnant woman,
mother and the child vulnerable.
Thus, lack of skills on the part of
dalits, statutory minimum
representation in politico-
economic bodies, symbolic
inclusion in socio-cultural events
and almost neglect in provision of
health services is hampering the
human development of dalits. More
significantly, the economic assets
are not adequate enough to ensure
a higher income and consequently
a higher standard of living for these
people.
9.7.4. Suggestions
If the deprivation of dalits, worked
out at 0.635, is to be reduced the
following actions need to be
initiated:
i. The reservation of seats meant
for dalits in local politico-
economic institutions should
be increased and
implemented effectively;
lack of skills on
the part of
dalits, statutory
minimum
representation in
politico-economic
bodies, symbolic
inclusion in
sociocultural
events and
almost neglect
in provision of
health services
is hampering
the human
development
among dalits.
214
Raichur District Human Development Report 2014
ii. In all the local government
institutions, a separate
Standing Committee
specifically to look into the
schemes meant for dalits, their
implementation and
evaluation can be created;
iii. In order to discuss the
problems of dalits, their
inclusion and implementation
of schemes meant for them a
separate gram sabha may be
convened every year;
iv. For increasing the quantity
and quality of education and
health care to dalit members, a
greater number of personnel to
work as teachers and local
health workers from among
these communities ahould be
appointed;
v. Strengthening awareness
programmes about schemes,
rights and entitlements so that
dalits become aware about
them and access the benefits
due to them; and
vi. The socio-economic
institutions like SHGs and
such other institutions,
exclusively of dalits, need to be
promoted for their economic
and political empowerment.
9.8 Concluding Remarks
The district has a large contribution
of SC and ST population that
constitutes about 40 per cent of the
total population of the district. The
district shares 5.52 per cent of
state’s SC and ST population.
During 2001-2011, the combined
population of SC and ST increased
by 23.8 per cent against 15.1 per
cent increase in general
population. Devadurga and
Lingsugur taluks share 45 per cent
of SC/ST population in the district.
Devadurga, Lingsugur and Manvi
taluks record higher growth is SC/
ST population. The higher growth
of SC and ST population suggests
that access to contraceptives might
be limited. Sex ratio among SC/STs
is favorable and higher than that for
the general population and that
among STs is above 1000. Since
STs are a sizable portion of district’s
population, favorableness of sex
ratio among them has also affected
the overall sex ratio. Very less
proportion of SC/ST population
(i.e.16 per cent) is urbanized and
most of the SC/ST population lives
in rural areas. There is also not
much diversity in caste
composition of these sections.
Raichur being an educationally
backward, reports still lower
literacy rates among dalits. Literacy
among SCs is lower than the
general population and literacy
among STs is lower than that
among SCs; similarly male literacy
rates are higher than female
literacy rates. The most critical gap
is for females, especially in rural
areas. The gaps are declining but
still high. Thus, being an ST woman
in rural Raichur district makes her
completely deprived of education.
Within SC/ST population, gender
gaps are very wide but have
declined during the last ten years.
Enrolment ratios are comparable to
the general population and
215
Status of Scheduled Castes and Scheduled Tribes
represent the increased awareness
for education in all taluks.
Enrolment among SC and ST
children is increasing by faster
rates and the proportion of girl
students in total enrolment is also
increasing. More children from SC
and ST sections, especially girls,
are getting enrolled in schools.
There is not much difference in the
retention ratios across social
groups, as it ranges from 79 per cent
to 82 per cent. But ST students
have a higher retention ratio than
SC students. Similarly, it is lower
for girls than that for boys. However,
at the high school level, retention
rate for STs lower than that for SCs
Predominant occupation for SC/
STs continues to be agri-related,
though it has declined overtime.
Dependence on agriculture is
around 72 per cent among SC
workers and 76 per cent for ST
workers. The traditional households
industries of these communities
have also declined in importance.
Diversification towards non-
agricultural sector is insignificant.
With low literacy attainments, even
when they enter the other (service)
activities, they may be employed in
informal and unorganised
activities where wages are lower,
social protection is lacking and
employment is seasonal. They
owned 31 per cent of all holdings
but cultivated only 26 per cent of
the land. Not only is the average size
of holding 75 per cent less than
that of the general population, the
proportion of marginal and small
holdings is higher for SC and ST
cultivators. Dependence on
MGNREGS is not significant,
hardly 8 per cent of SC and 2 per
cent of ST households worked in
the scheme. Access to basic
amenities like good houses and
electricity and is better. But,
availability of drinking water,
sanitation (toilets and drainage)
and use of clean fuels is very less
making the condition of SCs and
STs precarious. The composite Dalit
Development Index being
computed at 0.365, shows that the
deprivation is severe.
This recognition of differences
among social groups in achieving
various dimensions of HD, is
severely hampered by
landlessness, poor housing, poor
sanitation, poor drinking water
facilities, poor asset holding
capacities, etc. shows that the SC/
STs are not equal participants in
the development process. Hence,
there is a need to enhance the
social capability of SCs and STs by
improving their literacy; effective
implementation of the programmes
meant for them; induction of dalits
in education and health cadres for
extension and strengthening of
these services to those
communities.
216
Raichur District Human Development Report 2014
GOVERNANCE AND HUMAN DEVELOPMENT
Chapter 10

.
219
Chapter 10
Governance and Human Development
10.1. Introduction
Development planning has
contributed to substantial
improvements in economic
prosperity as well as aspects of HD.
The globalization wave that swept
the world during the last twenty
years has reinforced this growth
trend. But a concomitant
consequence has been increased
socio-economic divides between
and within countries. While some
can actively participate in the
wonders of technological
achievement and increased
prosperity, one-third of the global
population lives in abject poverty.
It is a world of stark polarity and
inequality (Work, 2002).
Development is not mere increase
in incomes but a broader process
that expands the real freedoms of
the people. This requires “removal
of various sources of unfreedom:
poverty as well tyranny, poor
economic opportunities as well as
systematic social deprivation,
neglect of public facilities as well
as intolerance or over-activity of
repressive states” (Sen, 1999). In the
context of non-declining poverty,
inequality and other deprivations
faced by the people across the
world, the UN has set forth time
bound goals called as the MDGs.
Attainment of these goals is
expected to bring about
sustainability of HD outcomes.
The size and role of government in
a country’s socio-economic
development has been a matter of
debate since long. Notwithstanding
the arguments and
counterarguments, in the recent
discourses on development,
agencies like World Bank and
UNDP have stressed the
importance of good governance in
bringing about the expected
changes in human lives. In this
context, it may be noted that while
the state remains an important
player in the execution of
development programs, the
emphasis is on good governance
agenda, through its prescriptions
of efficiency, accountability, and
democratization. Good governance
is viewed as a prerequisite for
attainment and sustenance of
higher level of HD. The UNDP and
most scholars, connect HD very
closely with good governance. The
2002 Human Development Report
(HDR) leads its chapter on
governance with a quote from Kofi
Annan: “Good governance is
perhaps the single most important
factor in eradicating poverty and
promoting development” (UNDP
2002).
Community participation and
boosting grass roots development
plays a key role in the
sustainability of programmes and
improvements in quality of life.
“Good gover-
nance is per-
haps the single
most important
factor in eradi-
cating poverty
and promoting
development”
- Kofi Annan
220
Raichur District Human Development Report 2014
Bringing the stakeholders together
for defining priorities for projects
and programmes increases interest
and sense of ownership, this in turn
promotes sustainability. Hence, the
way in which development is
conceived and implemented matters
much. This is an aspect of
governance of development.
Increasing number of studies
indicate that the governance is
positively associated with growth
and social development. The World
Bank (1992) defined governance as
the “exercise of authority, control,
management, power of government
and the manner in which power is
exercised in the management of a
country’s economic and social
resources for development. Good
governance ... is synonymous with
sound development management.”
The UNDP does not define
governance beyond linking it with
democracy (UNDP, 2002); good
governance is democratic
governance (UNDP, 2010).
Governance is broadly defined as the
system of values, policies and
institutions by which a society
organizes collective decision-making
and action related to political,
economic and socio-cultural and
environmental affairs through the
interaction of the state, civil society
and the private sector. Governance
comprises the complex
mechanisms, processes and
institutions through which citizens
and groups articulate their
interests, mediate their differences
and exercise their legal rights and
obligations.
Governance thus refers to the
functioning of the government
which depends on whether a
government has the requisite
political and administrative
structures and mechanisms and
the capability to function effectively
and efficiently. Elements
contributing to the concept of good
governance include the basic laws
and institutions of a nation, the
administrative competence and
transparency, decentralization of
its administration, and the creation
of an appropriate market
environment; all of these are
needed to support people’s
participation in every aspect of
politics, the economy, and society.
These are therefore necessary
components of good governance as
“the government functioning as the
basis for participatory
development.”
HD being a people centric process
underscores the need for people’s
involvement in all stages of decision
making. It is well recognized that
decentralization promotes
participatory governance, enables
more efficient and accountable
delivery of public services in
accordance with the preferences of
the people and creates an
environment for participatory
planning and inclusive growth.
Decentralization, through
participatory governance promotes
a sense of ownership and
belongingness, transparency and
accountability. Decentralization
and local governance are
Increasing
number of
studies
indicate that
the gover-
nance is
positively
associated
with growth
and social
development.
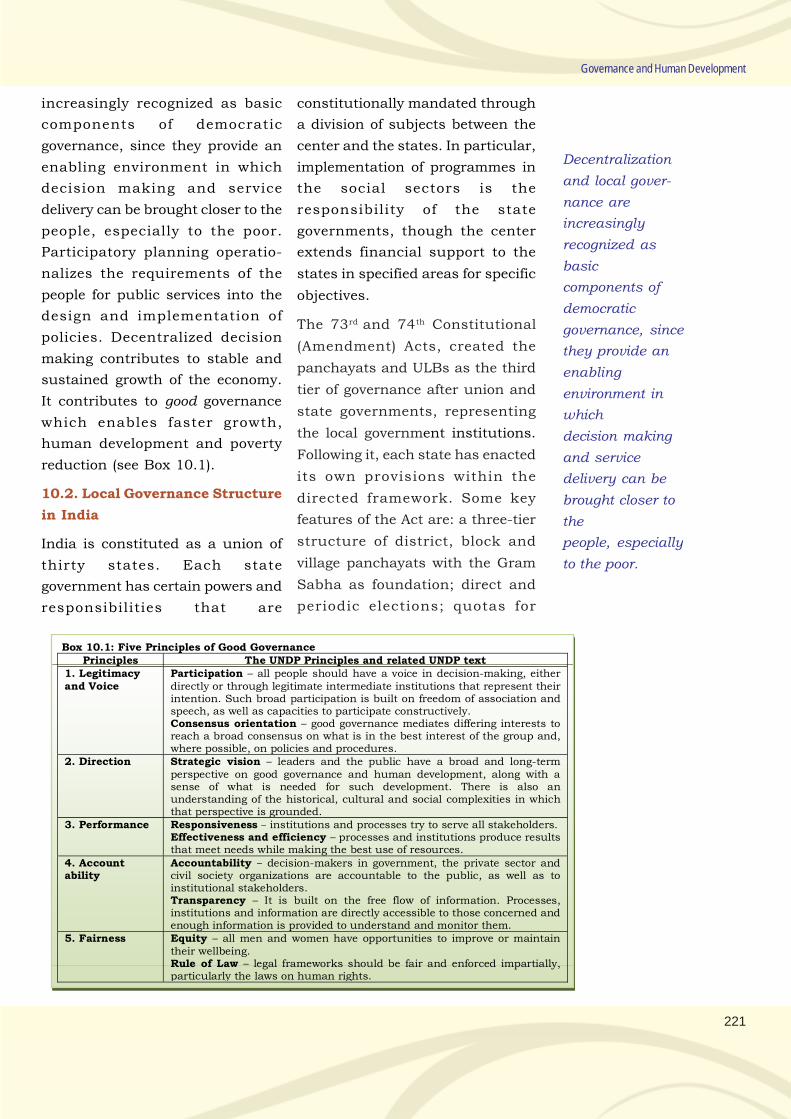
221
Governance and Human Development
increasingly recognized as basic
components of democratic
governance, since they provide an
enabling environment in which
decision making and service
delivery can be brought closer to the
people, especially to the poor.
Participatory planning operatio-
nalizes the requirements of the
people for public services into the
design and implementation of
policies. Decentralized decision
making contributes to stable and
sustained growth of the economy.
It contributes to good governance
which enables faster growth,
human development and poverty
reduction (see Box 10.1).
10.2. Local Governance Structure
in India
India is constituted as a union of
thirty states. Each state
government has certain powers and
responsibilities that are
constitutionally mandated through
a division of subjects between the
center and the states. In particular,
implementation of programmes in
the social sectors is the
responsibility of the state
governments, though the center
extends financial support to the
states in specified areas for specific
objectives.
The 73rd and 74th Constitutional
(Amendment) Acts, created the
panchayats and ULBs as the third
tier of governance after union and
state governments, representing
the local government institutions.
Following it, each state has enacted
its own provisions within the
directed framework. Some key
features of the Act are: a three-tier
structure of district, block and
village panchayats with the Gram
Sabha as foundation; direct and
periodic elections; quotas for
Decentralization
and local gover-
nance are
increasingly
recognized as
basic
components of
democratic
governance, since
they provide an
enabling
environment in
which
decision making
and service
delivery can be
brought closer to
the
people, especially
to the poor.
Box 10.1: Five Principles of Good Governance Principles The UNDP Principles and related UNDP text
1. Legitimacy and Voice
Participation – all people should have a voice in decision-making, either directly or through legitimate intermediate institutions that represent their intention. Such broad participation is built on freedom of association and speech, as well as capacities to participate constructively. Consensus orientation – good governance mediates differing interests to reach a broad consensus on what is in the best interest of the group and, where possible, on policies and procedures.
2. Direction
Strategic vision – leaders and the public have a broad and long-term perspective on good governance and human development, along with a sense of what is needed for such development. There is also an understanding of the historical, cultural and social complexities in which that perspective is grounded.
3. Performance
Responsiveness – institutions and processes try to serve all stakeholders. Effectiveness and efficiency – processes and institutions produce results that meet needs while making the best use of resources.
4. Account ability
Accountability – decision-makers in government, the private sector and civil society organizations are accountable to the public, as well as to institutional stakeholders. Transparency – It is built on the free flow of information. Processes, institutions and information are directly accessible to those concerned and enough information is provided to understand and monitor them.
5. Fairness
Equity – all men and women have opportunities to improve or maintain their wellbeing. Rule of Law – legal frameworks should be fair and enforced impartially, particularly the laws on human rights.
222
Raichur District Human Development Report 2014
scheduled castes (SCs) and
scheduled tribes (STs), backward
classes and women; delineation of
major financial and administrative
responsibilities, budget and audit
requirements; a supposedly rational
basis for resource sharing between
the state and panchayats; provision
for executive/support staff; a rather
strict procedure for dissolution/
suppression of panchayats and
mandatory elections within six
months of dissolution.
Karnataka also has a 3-tier Rural
Local Government System (called
Panchayat Raj Institutions – PRIs).
These include 30 Zilla Panchayats
(ZPs, district level), 176 Taluk
Panchayats (TPs, block-level), and
5659 Gram Panchayats (GPs,
village level). The PRIs are local
governments that report to their
own elected peoples’
representatives. This panchayat
system is responsible for
implementing various schemes
related to poverty alleviation and
livelihood security, besides its
responsibility to provide a limited
range of public goods. However,
until recently, their involvement in
delivery of such services as health
care and education was negligible.
Initiatives such as School
Development and Monitoring
Committee (SDMC), Village Health
and Sanitation Committees (VHSC),
strengthening of gram sabhas and
promoting events such as children’s
gram sabhas are worth mentioning.
There is also a wider participation
of civil society organizations (CSOs),
NGOs and private companies which
have increased accountability of
political institutions and have
helped in effective planning and
utilization of resources at the local
level. Hence, local governance
structure is a mix of institutions
consisting of panchayats, NGOs,
advocacy groups and private
companies.
10.3. Panchayat Raj Institutions:
Structure and Process
The present structure of democratic
decentralization is as provided in
the 73rd and 74th Amendments.
The working of the PRIs in
Karnataka state is governed by the
Karnataka Panchayat Raj (KPR)
Act, 1993 that has been modelled
on the 73rd Constitutional
Amendment. The chief
responsibility of the Rural
Development and Panchayat Raj
(RDPR) Department lies in the
implementation of the provisions of
the KPR Act, 1993. This Act aims
at the achievement of the
democratic decentralization
especially for the rural areas. The
Act established a three tier PRIs
with zilla panchayat (ZP) at district
level, taluk panchayat (TP) at taluk
level and gram panchayat (GP) at
village level.
In tune with the provisions of the
National Act, the state Act has the
following features:
It established a three tier
Panchayati Raj system in the
state
It envisaged elected bodies at all
the three levels.
The panchayat
system is
responsible for
implementing
various
schemes
related to
poverty allevia-
tion and
livelihood
security,
besides its
responsibility to
provide a
limited range of
public goods.
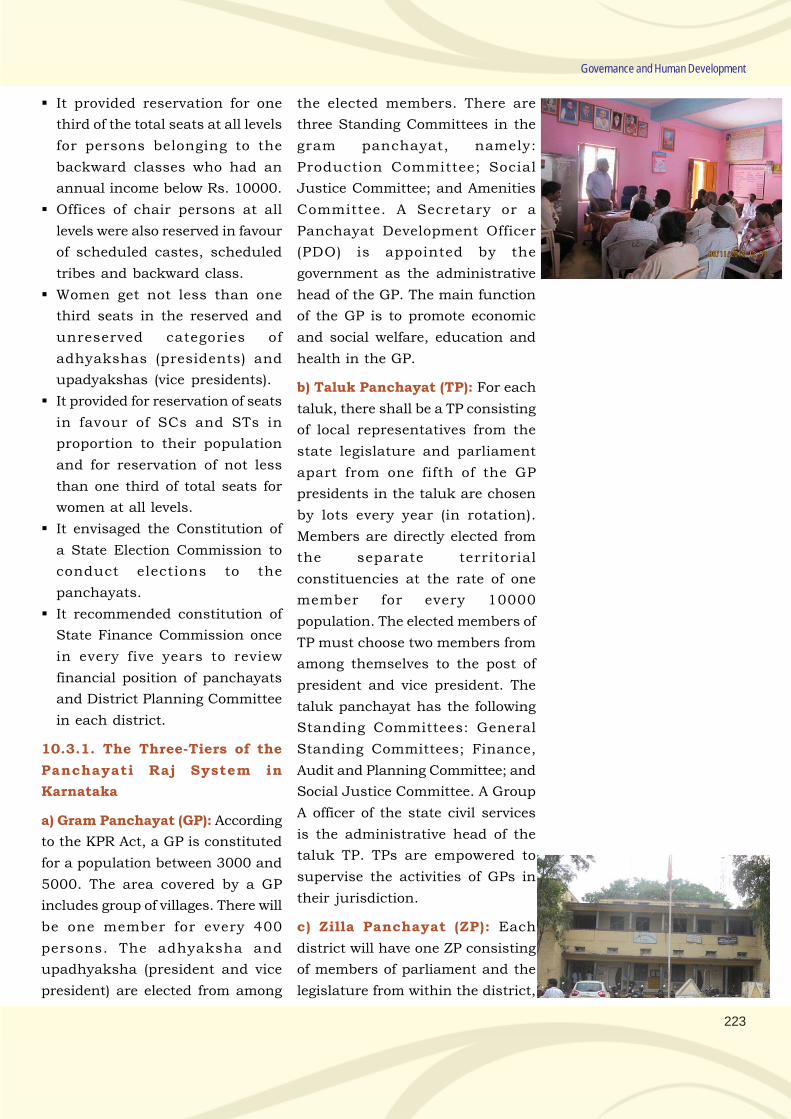
223
Governance and Human Development
It provided reservation for one
third of the total seats at all levels
for persons belonging to the
backward classes who had an
annual income below Rs. 10000.
Offices of chair persons at all
levels were also reserved in favour
of scheduled castes, scheduled
tribes and backward class.
Women get not less than one
third seats in the reserved and
unreserved categories of
adhyakshas (presidents) and
upadyakshas (vice presidents).
It provided for reservation of seats
in favour of SCs and STs in
proportion to their population
and for reservation of not less
than one third of total seats for
women at all levels.
It envisaged the Constitution of
a State Election Commission to
conduct elections to the
panchayats.
It recommended constitution of
State Finance Commission once
in every five years to review
financial position of panchayats
and District Planning Committee
in each district.
10.3.1. The Three-Tiers of the
Panchayati Raj System in
Karnataka
a) Gram Panchayat (GP): According
to the KPR Act, a GP is constituted
for a population between 3000 and
5000. The area covered by a GP
includes group of villages. There will
be one member for every 400
persons. The adhyaksha and
upadhyaksha (president and vice
president) are elected from among
the elected members. There are
three Standing Committees in the
gram panchayat, namely:
Production Committee; Social
Justice Committee; and Amenities
Committee. A Secretary or a
Panchayat Development Officer
(PDO) is appointed by the
government as the administrative
head of the GP. The main function
of the GP is to promote economic
and social welfare, education and
health in the GP.
b) Taluk Panchayat (TP): For each
taluk, there shall be a TP consisting
of local representatives from the
state legislature and parliament
apart from one fifth of the GP
presidents in the taluk are chosen
by lots every year (in rotation).
Members are directly elected from
the separate territorial
constituencies at the rate of one
member for every 10000
population. The elected members of
TP must choose two members from
among themselves to the post of
president and vice president. The
taluk panchayat has the following
Standing Committees: General
Standing Committees; Finance,
Audit and Planning Committee; and
Social Justice Committee. A Group
A officer of the state civil services
is the administrative head of the
taluk TP. TPs are empowered to
supervise the activities of GPs in
their jurisdiction.
c) Zilla Panchayat (ZP): Each
district will have one ZP consisting
of members of parliament and the
legislature from within the district,
224
Raichur District Human Development Report 2014
the presidents of taluk panchayats
in the district and elected members
in accordance with the scale of one
member for 40,000 of the
population. The elected members
shall choose two members from
amongst them to the post of
president and vice president. The
ZPs will have the following Standing
Committees: General Standing
Committee; Finance, Audit and
Planning Committee; Social Justice
Committee; Education and Health
Committee; and Agriculture and
Industries Committee. A Chief
Executive Officer (CEO), not below
the rank of Deputy Commissioner
is to be the administrative head of
the ZP.
d) Gram Sabha: The gram sabha is
a statutory body of a GP. It is
obligatory on the part of the GP to
convene gram sabha meeting at
least once in six months. All the
adults who are in the voters list of
the village are the members of the
gram sabha. Thus confirming to the
mandatory requirement of the 73rd
Amendment, Karnataka became the
first state to implement the
Panchayati Raj Act on the basis of
this amendment and holding
elections to the panchayat under
the Act. Since its enactment, it has
been amended on many occasions,
leading to some important changes
in the Act.
Karnataka is one of the few states
that have transferred funds,
functions and functionaries with
respect to 29 subjects (Annexure
10.1) as mentioned in the 73rd
Amendment. It has given an
opportunity to large number of
people at the grass root level to
participate in local administration.
A substantial number of scheduled
caste, scheduled tribe and
backward class representatives
have got an opportunity to actively
involve themselves in local
administration, which was
otherwise a domain of upper castes
and classes. Significant
developments have taken place in
the representation of women too.
Participation of women has gone up
sharply at all levels. Mandating
reservation for women in
membership as well in the position
of chairpersons of panchayats at all
three levels has given an
opportunity for women to take the
position of leadership. Today, rural
women are able to participate in the
decision making process. The 73rd
amendment brought a new
perspective to decentralization and
political empowerment of women.
10.3.2. Functioning of
Panchayats
As per the Constitution,
Panchayats in their respective
areas would prepare plans for
economic development and social
justice and also execute them. To
facilitate this, states are supposed
to devolve functions to Panchayats
and also make funds available for
doing these (as per State Finance
Commission’s recommendations).
The functions of Panchayats are
divided among different
Committees, which are called
Mandating
reservation for
women in
membership as
well in the
position
of chairpersons
of panchayats at
all
three levels has
given an
opportunity for
women to take
the
position of
leadership.
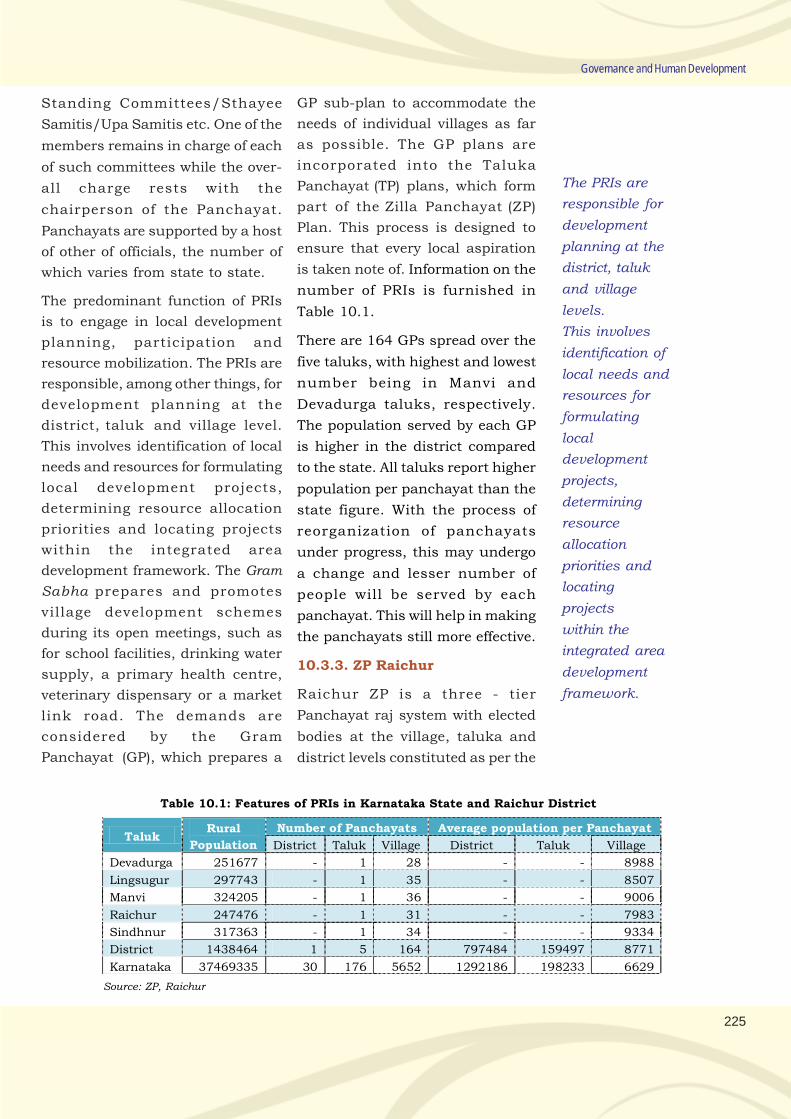
225
Governance and Human Development
Standing Committees/Sthayee
Samitis/Upa Samitis etc. One of the
members remains in charge of each
of such committees while the over-
all charge rests with the
chairperson of the Panchayat.
Panchayats are supported by a host
of other of officials, the number of
which varies from state to state.
The predominant function of PRIs
is to engage in local development
planning, participation and
resource mobilization. The PRIs are
responsible, among other things, for
development planning at the
district, taluk and village level.
This involves identification of local
needs and resources for formulating
local development projects,
determining resource allocation
priorities and locating projects
within the integrated area
development framework. The Gram
Sabha prepares and promotes
village development schemes
during its open meetings, such as
for school facilities, drinking water
supply, a primary health centre,
veterinary dispensary or a market
link road. The demands are
considered by the Gram
Panchayat (GP), which prepares a
Table 10.1: Features of PRIs in Karnataka State and Raichur District
Taluk Rural
Population
Number of Panchayats Average population per Panchayat
District Taluk Village District Taluk Village
Devadurga 251677 - 1 28 - - 8988
Lingsugur 297743 - 1 35 - - 8507
Manvi 324205 - 1 36 - - 9006
Raichur 247476 - 1 31 - - 7983
Sindhnur 317363 - 1 34 - - 9334
District 1438464 1 5 164 797484 159497 8771
Karnataka 37469335 30 176 5652 1292186 198233 6629
GP sub-plan to accommodate the
needs of individual villages as far
as possible. The GP plans are
incorporated into the Taluka
Panchayat (TP) plans, which form
part of the Zilla Panchayat (ZP)
Plan. This process is designed to
ensure that every local aspiration
is taken note of. Information on the
number of PRIs is furnished in
Table 10.1.
There are 164 GPs spread over the
five taluks, with highest and lowest
number being in Manvi and
Devadurga taluks, respectively.
The population served by each GP
is higher in the district compared
to the state. All taluks report higher
population per panchayat than the
state figure. With the process of
reorganization of panchayats
under progress, this may undergo
a change and lesser number of
people will be served by each
panchayat. This will help in making
the panchayats still more effective.
10.3.3. ZP Raichur
Raichur ZP is a three - tier
Panchayat raj system with elected
bodies at the village, taluka and
district levels constituted as per the
Source: ZP, Raichur
The PRIs are
responsible for
development
planning at the
district, taluk
and village
levels.
This involves
identification of
local needs and
resources for
formulating
local
development
projects,
determining
resource
allocation
priorities and
locating
projects
within the
integrated area
development
framework.
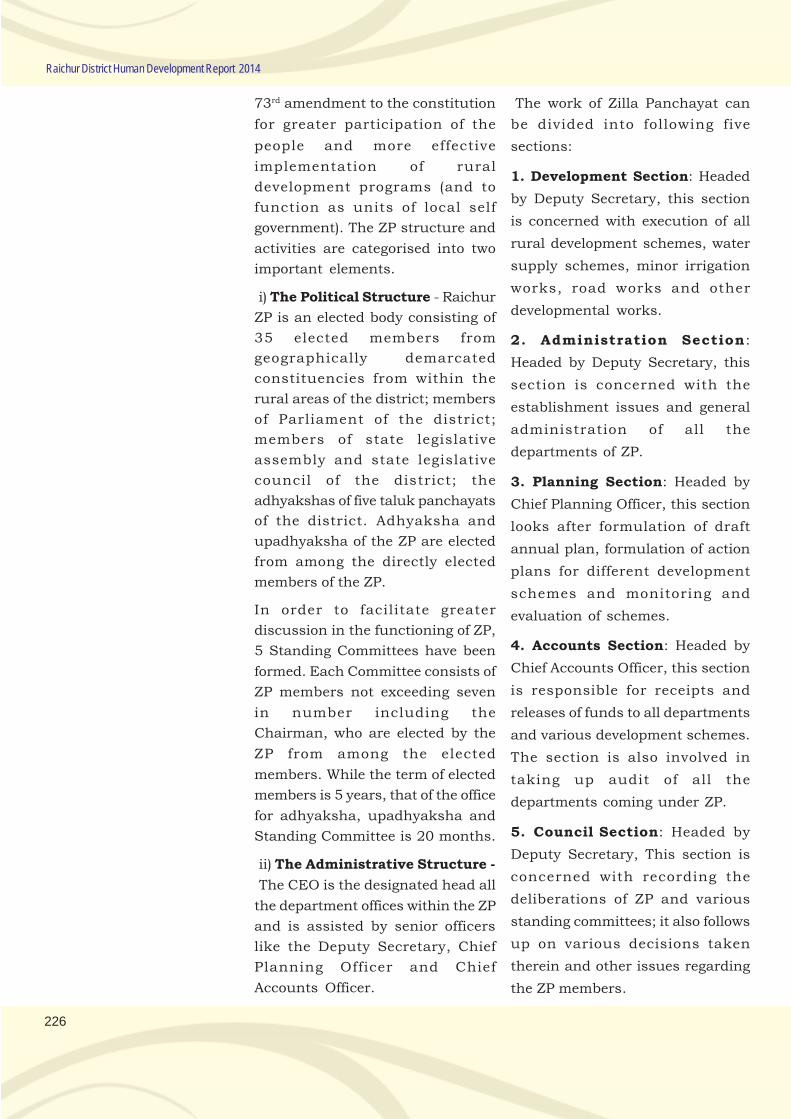
226
Raichur District Human Development Report 2014
73rd amendment to the constitution
for greater participation of the
people and more effective
implementation of rural
development programs (and to
function as units of local self
government). The ZP structure and
activities are categorised into two
important elements.
i) The Political Structure - Raichur
ZP is an elected body consisting of
35 elected members from
geographically demarcated
constituencies from within the
rural areas of the district; members
of Parliament of the district;
members of state legislative
assembly and state legislative
council of the district; the
adhyakshas of five taluk panchayats
of the district. Adhyaksha and
upadhyaksha of the ZP are elected
from among the directly elected
members of the ZP.
In order to facilitate greater
discussion in the functioning of ZP,
5 Standing Committees have been
formed. Each Committee consists of
ZP members not exceeding seven
in number including the
Chairman, who are elected by the
ZP from among the elected
members. While the term of elected
members is 5 years, that of the office
for adhyaksha, upadhyaksha and
Standing Committee is 20 months.
ii) The Administrative Structure -
The CEO is the designated head all
the department offices within the ZP
and is assisted by senior officers
like the Deputy Secretary, Chief
Planning Officer and Chief
Accounts Officer.
The work of Zilla Panchayat can
be divided into following five
sections:
1. Development Section: Headed
by Deputy Secretary, this section
is concerned with execution of all
rural development schemes, water
supply schemes, minor irrigation
works, road works and other
developmental works.
2. Administration Section:
Headed by Deputy Secretary, this
section is concerned with the
establishment issues and general
administration of all the
departments of ZP.
3. Planning Section: Headed by
Chief Planning Officer, this section
looks after formulation of draft
annual plan, formulation of action
plans for different development
schemes and monitoring and
evaluation of schemes.
4. Accounts Section: Headed by
Chief Accounts Officer, this section
is responsible for receipts and
releases of funds to all departments
and various development schemes.
The section is also involved in
taking up audit of all the
departments coming under ZP.
5. Council Section: Headed by
Deputy Secretary, This section is
concerned with recording the
deliberations of ZP and various
standing committees; it also follows
up on various decisions taken
therein and other issues regarding
the ZP members.
227
Governance and Human Development
10.4. Urban Local Bodies:
Structure, Issues and Processes
The 74th Amendment to the
Constitution extended local
governance to urban areas by
setting up urban local self
governing institutions or urban
local bodies (ULBs). Karnataka has
219 ULBs. These include 6
Corporations for the largest cities,
44 City Municipal Councils, 95
Town Municipal Councils, and 67
Town Panchayats for smaller towns.
There are also 5 Notified Area
Committees (NAC) taking the total
to 224. The ULBs, unlike the PRIs,
exist in a single-tier structure. The
6 corporations account for about
70% of the total receipts and
expenditures as well as total
population of the ULBs.
The ULBs are substantially under
the state government’s control.
There are two main statutes
governing the functioning of ULBs:
the corporations are governed by
the Karnataka Municipal
Corporations Act, 1976 (KMC Act),
and the other ULBs by the
Karnataka Municipalities Act, 1964
(KM Act). Each ULB has a ‘Council’
that is comprised of the ULB’s own
representatives (mostly elected by
its citizens and some nominated)
which is a policy-making and
oversight body of the ULB. The state
government has substantial powers
over the functioning of the ULBs,
and also has a major policy-making
and oversight role. The Urban
Development Department of the
state government administers the
ULBs. A Directorate of Municipal
Administration within the UDD
directly oversees the ULBs other
than the 6 Corporations. The
management of each ULB is headed
by a Commissioner/ Chief Officer
who is appointed by the state
government. Like PRIS, the
Constitution mandates transfer of
18 activities to the ULBs (Annexure
10.2). Raichur district has 6 ULBs
as follows (Table 10.2):
Table 10.2: Type and Number of ULBs in Raichur District
Type Number Name
City Municipal Committee 2 Raichur, Sindhnur
Town Municipal Committee 3 Lingsugur, Manvi, Devadurga
Town Panchayats 1 Mudgal
Apart from these, there is one
notified area committee (NAC), i.e,
the Hutti Gold Mines.
10.5. Improving Service Delivery
Mechanisms: e – Initiatives
Involvement in grassroots
planning, implementation,
monitoring and evaluation
processes is the main objective of
creating PRIs. Obviously, it goes
without saying that the success of
these organizations rests on how
well the programmes are designed
and implemented and what
processes are adopted in delivery
of services to the people. Since not
many powers, especially, mobilizing
finances, are given to the
panchayats, generally their
effectiveness is still not felt.
However, few initiatives are taken
up by the government and the ZP
itself to adopt some good practices
in training of staff, educating the
228
Raichur District Human Development Report 2014
clientele and making the
representatives more accountable.
This section summarizes few such
initiatives adopted in Raichur
district in governance especially in
adoption of ICT in administration
and governance.
10.5.1. e-initiatives
Realizing the transformative
potential of ICT, the Government of
India and various state
governments have initiated the
process of applying ICT measures to
reform governance for improving
the delivery of public services for
greater speed, transparency and
accountability. The notion of e-
governance is picking up as it
confers advantages such as:
efficient public service delivery;
effective monitoring development
programmes; better financial
management; facilitating planning
at the grassroots level; real-time
information dissemination;
realizing people’s participation; and
capacity to address new
development challenges. Some of
the elements of good governance,
viz., rule of law, accountability,
transparency, participation and
people’s control can be effectively
achieved through it.
The objectives of decentralized
governance viz., efficiency,
transparency, accountability,
responsibility and participation,
social equity and gender equality
can be easily achieved through e-
governance. Therefore, e-
governance and decentralization
as both are integral parts of the
current governance paradigm. E-
governance has become a means to
achieve the goal of ‘Good
governance’.
In this background, initiatives have
been taken by many state
governments to set up e-panchayats
to facilitate the development
process and provide easy access to
information to citizens. All
panchayats have been connected
with broad band network and
suitably trained computer operators
are hired to make it a reality.
Karnataka is a pioneering state to
have set up panchayat portal to
provide information regarding
development schemes. A very
important feature of the portal is
that it gives information in
Kannada language about issues
concerning the local people. The
portal also acts as a platform for
users to know whom they have to
approach for the processing of their
applications and resolution of
grievances. The portals are intra-
linked with other state government
departments so that it is more
service oriented. A few of the
initiatives under e-governance are:
• Each officer is issued a
designated SIM and a
predetermined amount of talk
time is also provided for
continuous availability.
• Each Panchayat is given
computers with internet facility
along with a trained computer
operator;
E-governance
has become a
means to
achieve the
goal of ‘good
governance’. It
confers
advantages
such as:
efficient public
service
delivery;
effective
monitoring
development
programmes;
better financial
management;
facilitating
planning
at the
grassroots
level; real-time
information
dissemination;
realizing
people’s
participation;
and
capacity to
address new
development
challenges.
229
Governance and Human Development
• The government designs the
software, trains the personnel
and seeks to transact online for
data dissemination and
complying to its various queries
and returns.
• The government also regularly
arranges for training of various
functionaries on handling of
computers and other electronic
devices;
• GPS based monitoring is
adopted to review the stages of
completion of housing projects
for scheduling the release of
financial assistance;
• Satellite based training and
video conferencing are arranged
on important issues for higher
level officers to enable them to
monitor and implement the
schemes in a better way;
• The citizens are also allowed to
access the information online
without any restriction;
• Many departments have their
own MIS under various
programmes like the DISE in
Education Department, HMIS
in health Department, HRMS in
DPAR, etc which have been
functioning quite satisfactorily
and much of this information
system is linked to the internet;
• The government has set up
Atalji Jana Sneha Kendras
(earlier Nemmadi Kendras) to
provide over the counter
services for issue and delivery
of important documents like
birth and death certificates,
submit applications for various
government schemes, etc. A
total of 36 services are provided
by these Kendras;
• Some meetings (allotment of
houses, for e.g.) of the gram
sabha are video recorded and
proceedings immediately
uploaded so that there is no
scope for any modification later
on;
• State Panchayat Portal: The
website of the Rural
Development and Panchayat
Raj (RDPR) contains link to
among other things to
important ICT applications like:
M G N R E G A - K a r n a t a k a ;
Panchatantra; Gandhi Sakshi
Kayaka; e-swathu;
Panchamitra; PlanPlus; Local
Government Directory; Area
Profiler; ActionSoft; National
Panchayat Portal; among
others.
• Panchatantra: Pancha Tantra
Online System is an ICT-based
innovation aimed at improving
the functioning of GPs in the
state through an automated
process of accounting and
budgeting of rural
expenditures. It is a web-based
application to assist GPs in
fulfilling the basic requirements
of a double entry accounting
system. It has enabled all GPs
in Karnataka to enter and
monitor all activities at the
village level in a more efficient,
accountable and transparent
way. The Panchatantra system
230
Raichur District Human Development Report 2014
has several unique built in
features that make the
application user friendly and
citizen centric. Moreover, it
ensures effective monitoring of
gram panchayats through a
workflow system that ensures
all the procedures and
processes prescribed by the
system are fulfilled in a timely
and transparent manner. The
information generated by the
system can be accessed by the
public and the government in
real time. In all, the
Panchatantra Online System
has been designed to facilitate
greater accountability and
transparency in local
governance. It is also used as a
means for real time monitoring
of implementation of various
schemes and also evaluation of
the overall monitoring of GPs.
Panchatantra has active links
to all major activities
undertaken at the GP level and
contemplates regular updating
of information GP wise.
• Panchamitra: Panchamitra is
another web application that
gives detailed information on
all aspects of functioning of a
GP, ward wise. It has links for
schemes in operation in the GP,
development works being
undertaken, samanya mahiti of
the villages, MGNREGS,
meetings and proceedings, tax
collection status, tenders,
applications, RTI, circulars and
monthly and annual reports.
All these initiatives are directed
towards making panchayat
administration more dynamic,
transparent, accountable and
time bound. With all
information accessible to
everyone, the selection of
beneficiaries and
implementation of schemes is
made more responsive to the
needs of the people. This
definitely empowers the people
to participate in decision
making as well availing the
services in desired manner.
In the same vein, for the ULBs also
a number of initiatives are under
implementation. Some of them are:
• Aasthi : GIS-based Property Tax
Information system (PTIS)
• Public Grievances and
Redressal (PGR)
• Birth and Death Registration
and Certification (BandD)
• Fund Based Double Entry
Accrual Accounting System
(FBDEAAS)
• ULB websites
• Karnataka Municipal Data
Society (KMDS) was set up with
an intention of managing e-
governance initiatives of the
Urban Local Bodies, ULBs. The
prominent e-governance
applications are: Service Level
Benchmarking; Asha Kirana
Mahithi – Slum Survey (RAY);
Namma Mane (Interest Subsidy
Scheme for Housing Urban Poor
(ISHUP); Monthly Information
M One: Governance at
Finger Tip
M One is designed as an
integrated mobile phone
platform, to be used by all
citizens for providing a
platform for m-governance in
the State. President Pranab
Mukherjee launched the
Karnataka Mobile One App (M
One app) on 8 December 2014
in Bengaluru. The app is first
such initiative of India. The M
One app is expected to
provide more than 4000
services, including 637
government services and
3644 private services to the
citizens. Citizens will be able
to pay electricity bills, book
train and bus tickets, recharge
their mobile phones, receive
traffic updates, track income
tax refund status, book cabs,
and much more through the M
One app. Citizens can also
keep a track of all transactions
processed through this
platform, complete with bill
date, payment mode, bill
number and many more
services. It has been
commented that the
Karnataka Mobile One app is a
pioneering effort to integrate
mobile enabled services
delivery system that signals a
new era in Governance. This
will improve delivery system
and facilitate prompt redressal
of grievances.
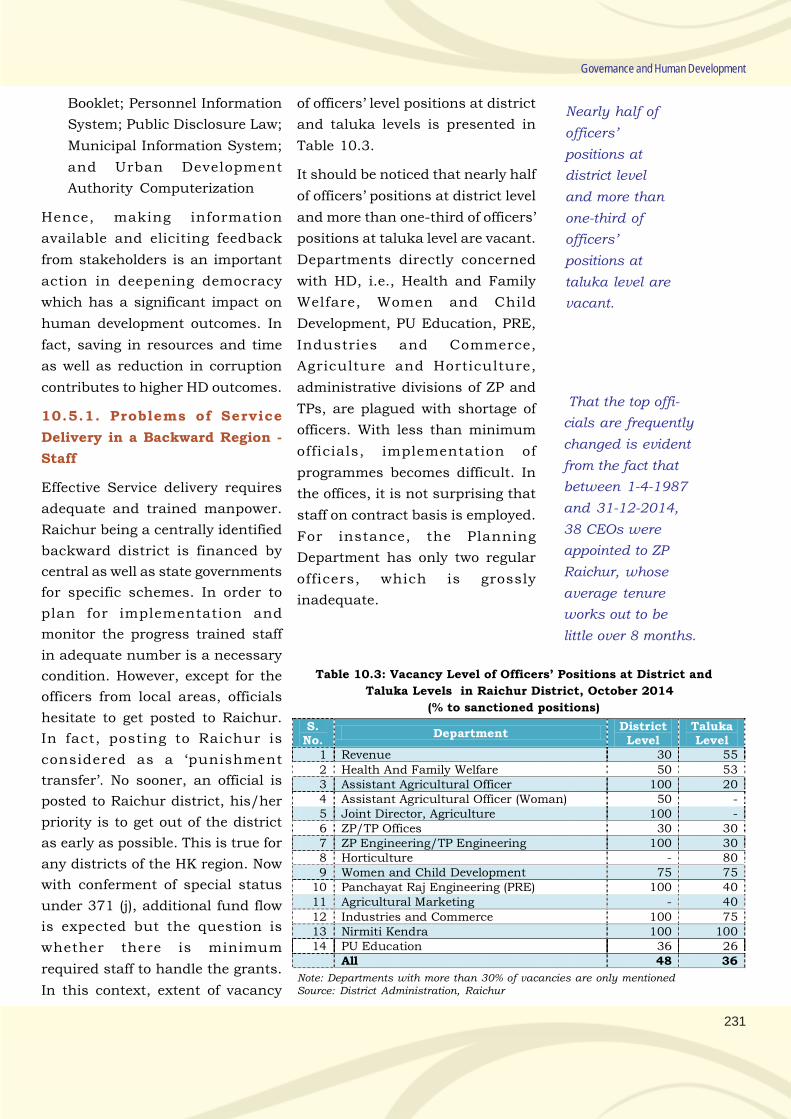
231
Governance and Human Development
Booklet; Personnel Information
System; Public Disclosure Law;
Municipal Information System;
and Urban Development
Authority Computerization
Hence, making information
available and eliciting feedback
from stakeholders is an important
action in deepening democracy
which has a significant impact on
human development outcomes. In
fact, saving in resources and time
as well as reduction in corruption
contributes to higher HD outcomes.
10.5.1. Problems of Service
Delivery in a Backward Region -
Staff
Effective Service delivery requires
adequate and trained manpower.
Raichur being a centrally identified
backward district is financed by
central as well as state governments
for specific schemes. In order to
plan for implementation and
monitor the progress trained staff
in adequate number is a necessary
condition. However, except for the
officers from local areas, officials
hesitate to get posted to Raichur.
In fact, posting to Raichur is
considered as a ‘punishment
transfer’. No sooner, an official is
posted to Raichur district, his/her
priority is to get out of the district
as early as possible. This is true for
any districts of the HK region. Now
with conferment of special status
under 371 (j), additional fund flow
is expected but the question is
whether there is minimum
required staff to handle the grants.
In this context, extent of vacancy
of officers’ level positions at district
and taluka levels is presented in
Table 10.3.
It should be noticed that nearly half
of officers’ positions at district level
and more than one-third of officers’
positions at taluka level are vacant.
Departments directly concerned
with HD, i.e., Health and Family
Welfare, Women and Child
Development, PU Education, PRE,
Industries and Commerce,
Agriculture and Horticulture,
administrative divisions of ZP and
TPs, are plagued with shortage of
officers. With less than minimum
officials, implementation of
programmes becomes difficult. In
the offices, it is not surprising that
staff on contract basis is employed.
For instance, the Planning
Department has only two regular
officers, which is grossly
inadequate.
Table 10.3: Vacancy Level of Officers’ Positions at District and
Taluka Levels in Raichur District, October 2014
(% to sanctioned positions)
S. No.
Department District Level
Taluka Level
1 Revenue 30 55
2 Health And Family Welfare 50 53 3 Assistant Agricultural Officer 100 20 4 Assistant Agricultural Officer (Woman) 50 - 5 Joint Director, Agriculture 100 - 6 ZP/TP Offices 30 30 7 ZP Engineering/TP Engineering 100 30 8 Horticulture - 80 9 Women and Child Development 75 75
10 Panchayat Raj Engineering (PRE) 100 40 11 Agricultural Marketing - 40
12 Industries and Commerce 100 75 13 Nirmiti Kendra 100 100 14 PU Education 36 26
All 48 36
Note: Departments with more than 30% of vacancies are only mentionedSource: District Administration, Raichur
Nearly half of
officers’
positions at
district level
and more than
one-third of
officers’
positions at
taluka level are
vacant.
That the top offi-
cials are frequently
changed is evident
from the fact that
between 1-4-1987
and 31-12-2014,
38 CEOs were
appointed to ZP
Raichur, whose
average tenure
works out to be
little over 8 months.
232
Raichur District Human Development Report 2014
Another related problem is that of
assimilation of new technology in
governance. With many tasks are
carried out on-line, inititatives like
sakala and M-one, the supporting
infrastructure has to be strong. The
officers complain that despite
similar bandwidth given throughout
the state, the internet speed is not
fast enough. Naturally, the
compliances in on-line mode get
delayed leading to drop in the
ranking of the district. For instance,
in panchatantra on line
assessment, the district is placed
at last but one place as many of the
compliances are pending from the
GPs, especially from backward
taluks. Thus, the overall points
scored by Devadurga and Manvi
taluks, respectively, are 46 and 41,
as against 76 Sindhnur and 55 for
Raichur. Hence, training to officials,
awareness to general public and
strengthening of infrastructure
need to be attended to.
10.6. Role of NGOs and Other
Voluntary Groups
A democratic system presupposes
involvement of various stakeholders
in preparation, implementation and
monitoring of development
schemes. In this regard, the non-
government organizations (NGOs)
can complement the efforts of the
government. Being a backward
district with lower levels of literacy
and awareness about development
schemes, NGOs have a lot of scope
to function as a bridge between the
local government and the people.
Naturally, many NGOs are
functioning in Raichur district for
betterment of different sections of
the society. In this section a
summary of activities of few of the
prominent NGOs working in
Raichur district is provided.
10.6.1.1. Janakalyan
Initially set up to address the issues
of refugees resettled in Sindhanur
Rehabilitation Project of Karnataka
Janakalyan works in 7 sectors with
tools like Jana Sanghatan (Women
Development and Empowerment
Program); Jana Krishi (Livelihood
Improvement through IIFS); Jana
Jal (Rain Water Harvesting
Program); Jana Udyog (Rural
Entrepreneurship Development
Program); Jana Shiksha (Reaching
the Unreached); Jana Shakti
(Renewable Sources of Energy
Harnessing); and Jana Raksha
(Dairy Development as livelihood of
women). Major Accomplishments
are:
a. Promoted more than 200 SHGs
and successfully linked with
banks and government schemes;
b. Self-sustainable livelihood model
for tail end farmers in the
command areas
c. Introduced the concept of rain
water harvesting in water scarce
areas of Sindhnur taluk for
drinking and greening the house
yard.
d. Induced entrepreneurial skills
among more than 300 educated
youths through Rural
Entrepreneurship Development
Programme.
With many
tasks are
carried out on-
line, inititatives
like sakala and
M-one, the
supporting
infrastructure
has to be strong.
The officers
complain that
despite similar
bandwidth
given
throughout the
state, the
internet speed is
not fast enough.
Naturally, the
compliances in
on-line mode get
delayed leading
to drop in the
ranking of the
district.
233
Governance and Human Development
e. More than thousand out-of-
school children are brought
under the umbrella of school
through its innovative program
called VIDYA.
f. Introduced concept of renewable
energy harnessing like biogas,
improved chula, solar cooker,
solar dryer, etc. in the rural
areas.
g. Introduced dairying as a
livelihood option among the
refugees and now it has become
second largest source of
livelihood for the rural women
and landless agricultural
labourers
h. The Detailed Project Report for
Kugram Suvarna Gram scheme
was prepared for Sindhnur taluk
of Raichur district.
i. The District Perspective Plan for
Raichur was prepared by
Janakalyan as per the request of
the CEO of Zilla Panchayat.
j. Suvarna Gramodaya was
assigned to Janakalyan for
preparation of Detailed Project
Report for Sindhnur and Manvi
taluks of Raichur district.
Owing to its successful
interventions, Janakalyan has
achieved the status of mother NGO
for UNICEF supported projects in
Raichur district.
10.6.1.2. Jagrat Mahila
Sanghtana (JMS)
JMS, started in 2000, is a dalit
women agricultural labourer’s
collective, having a membership of
800 women from Dalit and other
backward communities, who are
trained to take leadership in
various issues. SHGs are the key
institutions for organizing these
disempowered women. As a part of
the activities of JMS, the
Navnirman Trust was set up in
2005 for legal and statutory
requirements to facilitate the work
of Jagrutha Mahila Sanghatan.
Other major interventions of the
organization are:
1. Child Labourers’ School: Based
on the ideology of Right to
Education, the organization runs
child labourers’ special schools
known as ‘Chilipili’. In 2011-12
batch 50 childen (30 boys and 20
girls) were enrolled and in June
2012, 30 children were
mainstreamed into various levels in
the government schools ranging
from 5th std to 7th std. This is a
regular process. Children are
taught basic skills of life apart from
training them for formal education.
However, apart from running this
informal school, the main thrust of
the JMS is No Dalit Child Out of
School and efforts are intensified to
identify children and enrol them in
schools on a regular basis.
2. Livelihood Programmes: Under
the name ‘Chiguru’, women are
trained in skilled activities so that
they can produce value added
commodities and ear a decent
livelihood for themselves. For
instance, the Terracotta Unit
(comprising of 15 women) has
achieved a turn-over of about Rs.
3 lakh and they have added quite
The main
thrust of the
JMS is No
Dalit Child
Out of School
and efforts
are
intensified to
identify
children and
enrol them in
schools on a
regular
basis.
234
Raichur District Human Development Report 2014
innovative items to their jewellery.
They have also travelled to Delhi,
Hyderabad, Chennai and Bangalore
to participate in various exhibitions
cum sale events. The neem fertiliser
unit, consists of 15 women,
prepares organic neem fertiliser and
networked with the farmers who
purchase it for their farms. They
had a turn-over of 4 lakhs. The new
additions to the productions were
the bio-compost and vermi-
compost. A commendable success
is that the neem fertiliser unit of
Chiguru has ventured to purchase
one-and-a- half acre land for their
enterprise through their own
resources and partly through bank
loan.
3. Right to Work: In order to
ensure that the MGNREGS is
utilized by poor rural women, the
organization has collaborated with
the panchayats in implementing the
scheme in its totality and ensure
that the average number of days
worked by laborers is higher and
they receive whatever wages they
are due for. Up to October 2012,
5407 families across 13 gram
panchayats (57 villages) were
mobilized; issue of 4802 job cards,
opening of 3744 bank accounts;
and 11230 applications for work
were facilitated. As a result,
163294 person days of jobs were
created involving a payment of
more than Rs. 2 crores.
4. Promoting Community and
Mental Health: JMS has recruited
a number of Community Health
Workers (CHWs) functioning as
‘bare-foot doctors’ and as healers at
the primary health care level. They
cater to patients with paralytic
stroke, virtiligo, anemia, migraine
headaches, women’s health related
problems such as anemia, white
discharge etc using herbal
medicines and local remedies as the
base. They have been able to
counsel and treat over 10,000 men
and women from all castes and
creeds through their regular
‘Thursday clinics’. JMS plays a
very proactive role in facilitating the
Raichur District unit of JAAK (i.e.
Jana Arogya Andolana Karnataka,
the People’s Health Movement)
apart from taking lead in the district
in the Right to Primary Healthcare
Campaign.
5. Promoting Social
Security: JMS has co-ordinated in
getting pensions for senior dalit
women. Awareness campaigns on
this are also organized.
6. Fighting Malnutrition: JMS
has co-ordinated in identifying
malnourished children and
monitoring the implementation of
programmes fighting malnutrition.
ICDS and MDM programmes are
regularly monitored by it. Regular
vigilance at the local level,
identifying children who are
undernourished etc has improved
the functioning of the ICDS centres.
Sanchalakis regularly visit schools
for monitoring the quality of MDM.
7. State Level Seminars on Legal
Awareness and Special
Component Plan: In 2012, JMS
hosted two state level seminars on
The neem
fertiliser unit,
consists of 15
women,
prepares
organic neem
fertiliser and
networked
with the
farmers who
purchase it
for their
farms. They
had a turn-
over of 4
lakhs.
235
Governance and Human Development
dalit issues in which delegates from
all over the state and women
leaders of JMS from every village
participated.
10.6.1.3. Janachetana
Janachetana is implementing the
India Literacy Project since 2000 in
rural areas of Raichur district to
ensure that all working children are
in school. In order to ensure that
children continue to go to school
after enrollment, children from
extremely poor homes are admitted
to government hostels to address
their basic needs of food, uniforms
and shelter and a residential bridge
program - a short-term intervention
program for “out of school” children
- with a definite focus on preparing
children with the necessary
competencies for enrollment to
schools is also implemented. Every
year, the project aims at enrolling
100 children in the residential
bridge center will be provided
necessary competencies for 6
months to enroll them in
mainstream schools in the ensuing
academic year; following up 300
children of the previous batches for
school retention; strengthening of
School Development & Monitoring
Committees and SHGs and gram
Panchayat members in the
education system; ensuring
retention in middle/high schools
through ILP scholarships; and
conducted special coaching classes
at 3 schools for 10th class students.
10.6.1.4. Janahitha
Janahitha is also a longstanding
NGO working in the district
covering all major aspects of human
development since 2000.
Janahitha works for the welfare of
the vulnerable, down trodden and
needy communities in seven
districts and is networked with
other NGOs in North Karnataka.
Janahitha is identified as a district
RCH Mother NGO by Ministry of
Health and Family Welfare,
Government of India. It is working
with many institutions like
UNICEF, NABARD, CHAI,
AKSHARA Foundation, ARGHYAM,
Narayana Hrudayalaya, RDPR,
Karnataka State Watershed
Development Department,
Karnataka Health and Family
Welfare Department, DWCD and
DHO. It has been honored with
state level award of
“Yashodaramma Dasappa award
2010” for Valuable service in social
sector, and also got the National
Award of “ Servant of the Poor
Award “ by Confederation of NGOs
for Rural India. Janahitha
implementing major health related
projects in Raichur district like
ASHA project, IECDP, IYCF,
SANKALPA- ICDS Project, Water
and Sanitation, Drinking Water
Quality testing, Training for PRI
Members and staffs, Rain water
harvesting, HIV/AIDS, SSA, Home
placement (railway plat form
children), Urban Sthri Shakthi
Group formation, SHG Formation &
Bank Linkage (NABARD), Human
Resource development, Rural
development Projects, skill based
training for livelihood, Capacity
Enhancement of community
Every year,
the project
aims at
enrolling 100
children in the
residential
bridge center
will be
provided
necessary
competencies
for 6 months to
enroll them in
mainstream
schools in the
ensuing
academic year
236
Raichur District Human Development Report 2014
organizations, education, Women
empowerment.
10.6.1.5. Pragati Health and Rural
Development Society
The Society is involved in all-round
development of the people. The
main activities are in the sectors of
health, education, vocational
training, multipurpose training and
awareness programs for women,
children, youth, and eligible
couples. A birth based approach
(b.b.a.) is implemented in 14
villages in Manvi taluk through
basic maternal and child health
care facilities to accelerate the
reduction in fertility in high fertility
areas. It is a central government
programs through P.R.C. Dharwad.
Two ANMs one Field Officer and 14
Anganawadi Workers take care of
this programme and are well
trained in this regard. The main
components of this programs are
Mother care, child care,
adolescents care, family planning
and service for eligible couples
such as STD-RTI, IEC activities,
formation of mahila sangha, health
camps are some of the methods
through which this programme is
implemented. 11830 beneficiaries
and 120 community awareness
programs have been successfully
conducted. Health and Family
Welfare Department of Karnataka is
also partner in these programmes.
10.6.1.6. Prerana
The organization is engaged in the
service of rural poor, marginal
farmers, women labourers and
destitute children in Raichur
district since 2005. It organises
women’s associations; runs savings
and credit and awareness
programmes for rural women,
provides home placement and
education of destitute children,
non-formal education schools for
child labourers; street plays,
resettles and rehabilitates
displaced families; arranges
exposure visits for the staff;
involves professionals in rural
development; coordinates with the
government; supports NGOs. So
far, the organization has helped 50
families under 19 lift irrigation
schemes; formed 150 self-help
groups under women’s
development programme. The
organization gets grants from
central/ state governments,
Command Area Development
Authority, Government of
Karnataka, Oxfam, CAA, Tata
Trust.
10.6.1.7. Bharatiya Seva Samsthe
Working since 1992, the key areas
of intervention by the NGO is
involved in activities like animal
husbandry, dairying and fisheries,
aged/elderly, agriculture, children,
differently abled, disaster
management, dalit upliftment,
drinking water, education and
literacy, environment and forests,
health and family welfare, HIV/
AIDS, housing, human rights, legal
awareness and aid, labour and
employment, micro finance (SHGs),
minority issues, micro small and
medium enterprises. The
A birth based
approach (b.b.a.)
is implemented in
14 villages in
Manvi taluk
through basic
maternal and
child health care
facilities to
accelerate the
reduction in
fertility in high
fertility areas.
237
Governance and Human Development
organization is also involved in
educational activities like Sarva
Shikshana Abhiyaana (SSA), Rajiv
Gandhi Crèche Programme, service
providers for horticulture dept,
evaluation for rural development
and health awareness programme
for rural youth and for poor people
etc., and running projects under the
aids from central and state
governments.
10.6.1.8. Maa Sarada Social
Welfare and Education Society
Working since 2006, the NGO
caters to issues like agriculture,
children, education and literacy,
health and family welfare, HIV/
AIDS, legal awareness and aid,
labour and employment, nutrition,
rural development and poverty
alleviation, sports, women’s
development and empowerment. Its
major achievements include
starting primary school, children
motivation program, women
empowerment, rural development,
tailor training, counselling the
farmers about agriculture and
health activities.
10.6.1.9. Janamitra Nagara
Mathu Gramina Abhivrudhi
Samsthe
The organization has been engaged
in rural and urban development
and poverty alleviation since 2007
and mainly supports other
voluntary organizations in
implementing projects for
sustainable development in rural
areas. It endeavours to create
employment opportunities and
economic self-reliance through
training camps. Major
accomplishments of the
organization are in conducting
HIV/AIDS awareness programmes,
self employment camp for women,
environment improvement
programme in rural and urban
areas and tailoring camps for
women.
10.6.1.10. Supreme Vidya
Samsthe
Established in 1996, the
organization works in varied areas
including aged/elderly,
agriculture, children, differently
abled, dalit upliftment, drinking
water, education and literacy,
environment and forests, health
and family welfare, HIV/AIDS,
housing, human rights, legal
awareness and aid, labour and
employment, land resources, micro
finance (SHGs), micro small and
medium enterprises, nutrition,
panchayati raj, rural development
and poverty alleviation, science
and technology, sports, tribal
affairs, urban development and
poverty alleviation and vocational
training.
10.6.1.11. We Care Society
We Care Society is a registered
society (2004) working in selected
villages of Raichur district,
assisting the poor farmers in terms
of reducing the cost of cultivation
and increase the income for their
livelihood. The Society also focuses
on providing biogas for their
kitchens and composting pits for
238
Raichur District Human Development Report 2014
their agriculture lands, which
indirectly reduces their
expenditure on household fuel,
chemical fertilizers and pesticides.
The Society addresses the health
issues faced by the farmers, women
and children, who are suffering
from water borne diseases,
malnutrition, respiratory diseases,
diabetes and cancer.
10.6.1.12. Chaitanya Rural
Development Soceity Raichur
The organisation is involved in
formation of women groups in both
rural and urban areas for social
awareness, promotion of education,
vocational training, SHG formation
and bank linkage, health awareness
programme, activities for the
disabled, awareness about govt
programmes.
10.6.1.13. Aman Welfare Trust
The Trust was established in 2007
to promote education and literacy;
housing; labour and employment;
micro finance (SHGs); minority
issues; micro, small and medium
enterprises; new and renewable
energy; nutrition; science and
technology; vocational training;
water resources; women’s
development and empowerment;
and youth affairs. The Trust has
dedicated itself to development of
minorities.
10.6.1.14. Gowrishankar Human
Welfare Association
It is one of the earliest NGOs
working since 1991. The
organization strives for the
empowerment, upliftment,
rehabilitation of socially,
economically, physically, mentally
challenged in the society by
providing equitable and appropriate
services through development of
suitable projects, policies,
advocacy, education and training
and promotion of best practices
with special emphasis on the
neglected and the downtrodden
women, children, poor, disabled,
underdeveloped, underserved
section of society. Some of the
activities of the organisation are:
education institutions for the
weaker sections of the society;
family counselling centre offering
free counselling and legal services;
short stay home for the welfare of
insecure and distressed women and
girls; sarva shiksha abhiyana
programs; child labour school;
vermi-compost project; crèche
centre; health awareness,
consumer education, adult
education, SC and ST development
activities, etc.
Thus, all the NGOs are working for
all-round development of the people
in collaboration with other NGOs
and government agencies. This has
complemented the efforts of the
government in improving the living
conditions of the people in this
backward district.
10.6.2. Public Private Partnership
in Local Development
Development requirements being
massive, necessitates co-operation
of all stake holders. In the previous
section, activities of few NGOs were
studied. The private sector is also
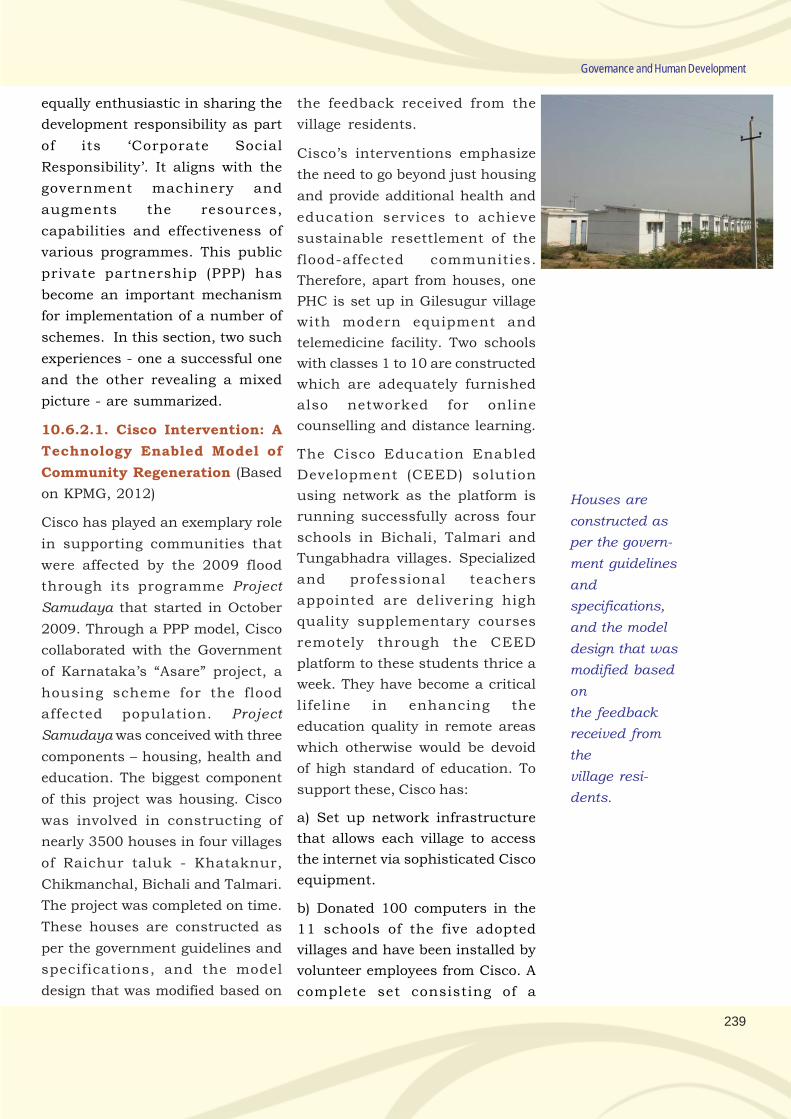
239
Governance and Human Development
equally enthusiastic in sharing the
development responsibility as part
of its ‘Corporate Social
Responsibility’. It aligns with the
government machinery and
augments the resources,
capabilities and effectiveness of
various programmes. This public
private partnership (PPP) has
become an important mechanism
for implementation of a number of
schemes. In this section, two such
experiences - one a successful one
and the other revealing a mixed
picture - are summarized.
10.6.2.1. Cisco Intervention: A
Technology Enabled Model of
Community Regeneration (Based
on KPMG, 2012)
Cisco has played an exemplary role
in supporting communities that
were affected by the 2009 flood
through its programme Project
Samudaya that started in October
2009. Through a PPP model, Cisco
collaborated with the Government
of Karnataka’s “Asare” project, a
housing scheme for the flood
affected population. Project
Samudaya was conceived with three
components – housing, health and
education. The biggest component
of this project was housing. Cisco
was involved in constructing of
nearly 3500 houses in four villages
of Raichur taluk - Khataknur,
Chikmanchal, Bichali and Talmari.
The project was completed on time.
These houses are constructed as
per the government guidelines and
specifications, and the model
design that was modified based on
the feedback received from the
village residents.
Cisco’s interventions emphasize
the need to go beyond just housing
and provide additional health and
education services to achieve
sustainable resettlement of the
flood-affected communities.
Therefore, apart from houses, one
PHC is set up in Gilesugur village
with modern equipment and
telemedicine facility. Two schools
with classes 1 to 10 are constructed
which are adequately furnished
also networked for online
counselling and distance learning.
The Cisco Education Enabled
Development (CEED) solution
using network as the platform is
running successfully across four
schools in Bichali, Talmari and
Tungabhadra villages. Specialized
and professional teachers
appointed are delivering high
quality supplementary courses
remotely through the CEED
platform to these students thrice a
week. They have become a critical
lifeline in enhancing the
education quality in remote areas
which otherwise would be devoid
of high standard of education. To
support these, Cisco has:
a) Set up network infrastructure
that allows each village to access
the internet via sophisticated Cisco
equipment.
b) Donated 100 computers in the
11 schools of the five adopted
villages and have been installed by
volunteer employees from Cisco. A
complete set consisting of a
Houses are
constructed as
per the govern-
ment guidelines
and
specifications,
and the model
design that was
modified based
on
the feedback
received from
the
village resi-
dents.
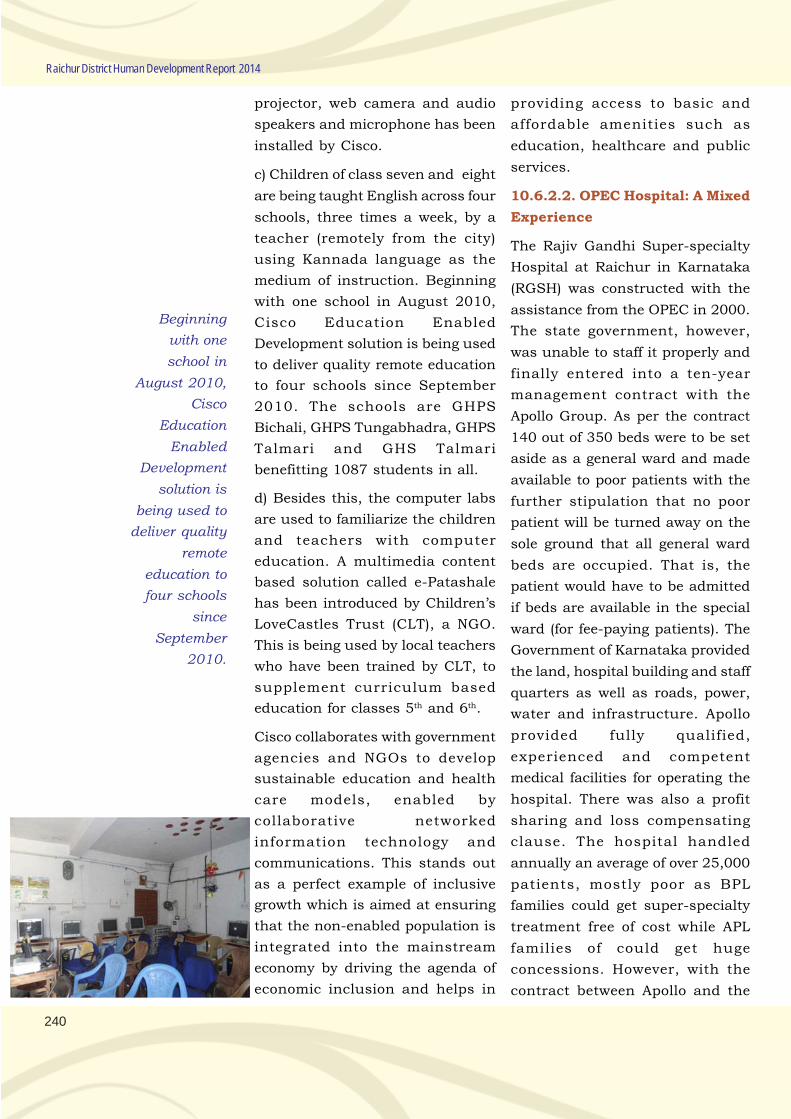
240
Raichur District Human Development Report 2014
projector, web camera and audio
speakers and microphone has been
installed by Cisco.
c) Children of class seven and eight
are being taught English across four
schools, three times a week, by a
teacher (remotely from the city)
using Kannada language as the
medium of instruction. Beginning
with one school in August 2010,
Cisco Education Enabled
Development solution is being used
to deliver quality remote education
to four schools since September
2010. The schools are GHPS
Bichali, GHPS Tungabhadra, GHPS
Talmari and GHS Talmari
benefitting 1087 students in all.
d) Besides this, the computer labs
are used to familiarize the children
and teachers with computer
education. A multimedia content
based solution called e-Patashale
has been introduced by Children’s
LoveCastles Trust (CLT), a NGO.
This is being used by local teachers
who have been trained by CLT, to
supplement curriculum based
education for classes 5th and 6th.
Cisco collaborates with government
agencies and NGOs to develop
sustainable education and health
care models, enabled by
collaborative networked
information technology and
communications. This stands out
as a perfect example of inclusive
growth which is aimed at ensuring
that the non-enabled population is
integrated into the mainstream
economy by driving the agenda of
economic inclusion and helps in
providing access to basic and
affordable amenities such as
education, healthcare and public
services.
10.6.2.2. OPEC Hospital: A Mixed
Experience
The Rajiv Gandhi Super-specialty
Hospital at Raichur in Karnataka
(RGSH) was constructed with the
assistance from the OPEC in 2000.
The state government, however,
was unable to staff it properly and
finally entered into a ten-year
management contract with the
Apollo Group. As per the contract
140 out of 350 beds were to be set
aside as a general ward and made
available to poor patients with the
further stipulation that no poor
patient will be turned away on the
sole ground that all general ward
beds are occupied. That is, the
patient would have to be admitted
if beds are available in the special
ward (for fee-paying patients). The
Government of Karnataka provided
the land, hospital building and staff
quarters as well as roads, power,
water and infrastructure. Apollo
provided fully qualified,
experienced and competent
medical facilities for operating the
hospital. There was also a profit
sharing and loss compensating
clause. The hospital handled
annually an average of over 25,000
patients, mostly poor as BPL
families could get super-specialty
treatment free of cost while APL
families of could get huge
concessions. However, with the
contract between Apollo and the
Beginning
with one
school in
August 2010,
Cisco
Education
Enabled
Development
solution is
being used to
deliver quality
remote
education to
four schools
since
September
2010.
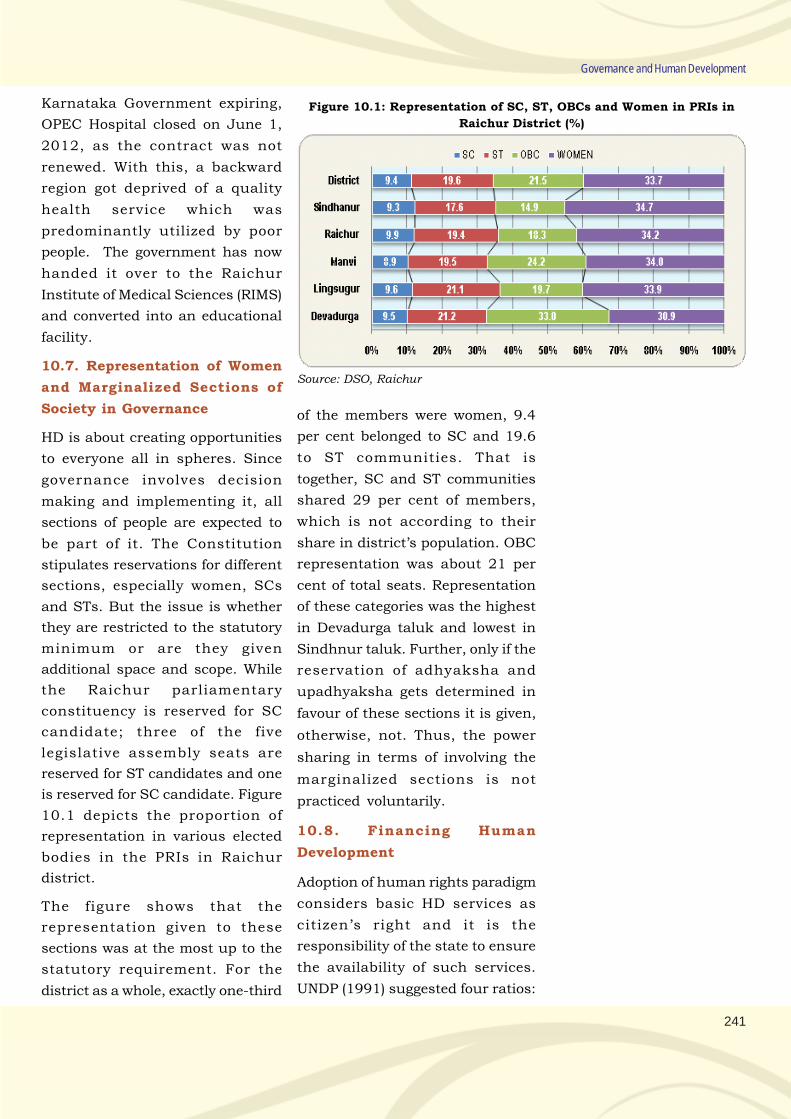
241
Governance and Human Development
Karnataka Government expiring,
OPEC Hospital closed on June 1,
2012, as the contract was not
renewed. With this, a backward
region got deprived of a quality
health service which was
predominantly utilized by poor
people. The government has now
handed it over to the Raichur
Institute of Medical Sciences (RIMS)
and converted into an educational
facility.
10.7. Representation of Women
and Marginalized Sections of
Society in Governance
HD is about creating opportunities
to everyone all in spheres. Since
governance involves decision
making and implementing it, all
sections of people are expected to
be part of it. The Constitution
stipulates reservations for different
sections, especially women, SCs
and STs. But the issue is whether
they are restricted to the statutory
minimum or are they given
additional space and scope. While
the Raichur parliamentary
constituency is reserved for SC
candidate; three of the five
legislative assembly seats are
reserved for ST candidates and one
is reserved for SC candidate. Figure
10.1 depicts the proportion of
representation in various elected
bodies in the PRIs in Raichur
district.
The figure shows that the
representation given to these
sections was at the most up to the
statutory requirement. For the
district as a whole, exactly one-third
Figure 10.1: Representation of SC, ST, OBCs and Women in PRIs in
Raichur District (%)
Source: DSO, Raichur
of the members were women, 9.4
per cent belonged to SC and 19.6
to ST communities. That is
together, SC and ST communities
shared 29 per cent of members,
which is not according to their
share in district’s population. OBC
representation was about 21 per
cent of total seats. Representation
of these categories was the highest
in Devadurga taluk and lowest in
Sindhnur taluk. Further, only if the
reservation of adhyaksha and
upadhyaksha gets determined in
favour of these sections it is given,
otherwise, not. Thus, the power
sharing in terms of involving the
marginalized sections is not
practiced voluntarily.
10.8. Financing Human
Development
Adoption of human rights paradigm
considers basic HD services as
citizen’s right and it is the
responsibility of the state to ensure
the availability of such services.
UNDP (1991) suggested four ratios:
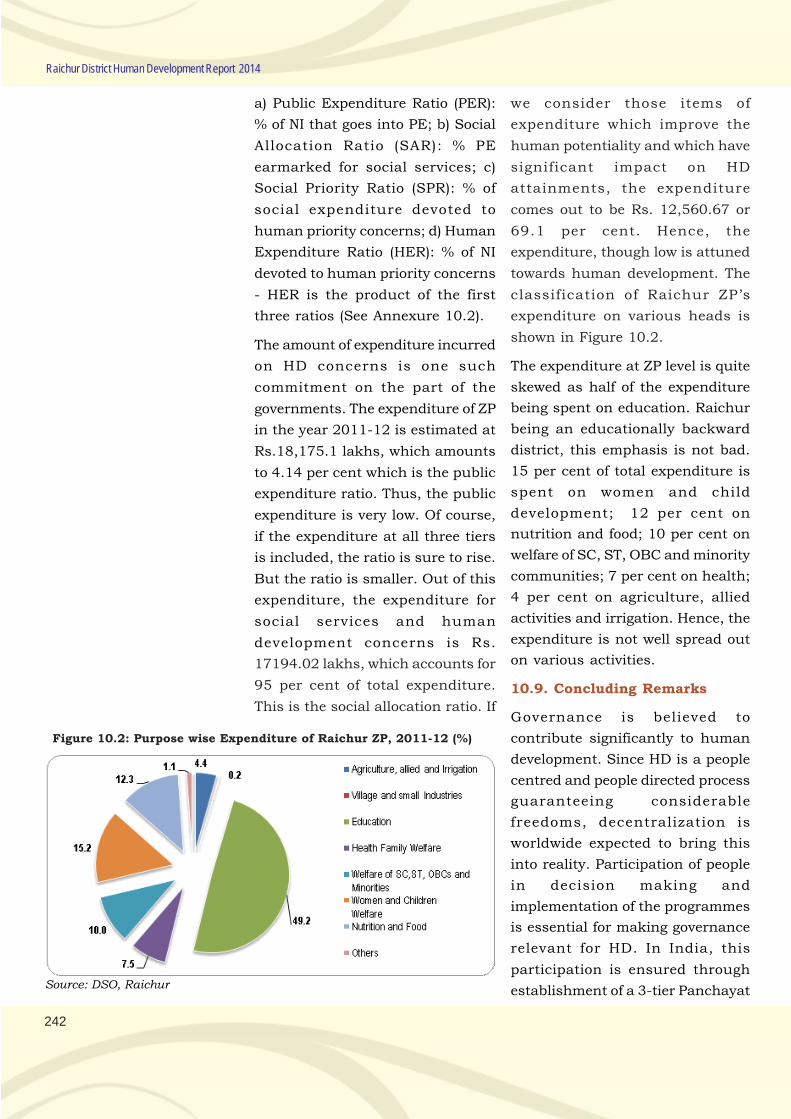
242
Raichur District Human Development Report 2014
a) Public Expenditure Ratio (PER):
% of NI that goes into PE; b) Social
Allocation Ratio (SAR): % PE
earmarked for social services; c)
Social Priority Ratio (SPR): % of
social expenditure devoted to
human priority concerns; d) Human
Expenditure Ratio (HER): % of NI
devoted to human priority concerns
- HER is the product of the first
three ratios (See Annexure 10.2).
The amount of expenditure incurred
on HD concerns is one such
commitment on the part of the
governments. The expenditure of ZP
in the year 2011-12 is estimated at
Rs.18,175.1 lakhs, which amounts
to 4.14 per cent which is the public
expenditure ratio. Thus, the public
expenditure is very low. Of course,
if the expenditure at all three tiers
is included, the ratio is sure to rise.
But the ratio is smaller. Out of this
expenditure, the expenditure for
social services and human
development concerns is Rs.
17194.02 lakhs, which accounts for
95 per cent of total expenditure.
This is the social allocation ratio. If
Figure 10.2: Purpose wise Expenditure of Raichur ZP, 2011-12 (%)
we consider those items of
expenditure which improve the
human potentiality and which have
significant impact on HD
attainments, the expenditure
comes out to be Rs. 12,560.67 or
69.1 per cent. Hence, the
expenditure, though low is attuned
towards human development. The
classification of Raichur ZP’s
expenditure on various heads is
shown in Figure 10.2.
The expenditure at ZP level is quite
skewed as half of the expenditure
being spent on education. Raichur
being an educationally backward
district, this emphasis is not bad.
15 per cent of total expenditure is
spent on women and child
development; 12 per cent on
nutrition and food; 10 per cent on
welfare of SC, ST, OBC and minority
communities; 7 per cent on health;
4 per cent on agriculture, allied
activities and irrigation. Hence, the
expenditure is not well spread out
on various activities.
10.9. Concluding Remarks
Governance is believed to
contribute significantly to human
development. Since HD is a people
centred and people directed process
guaranteeing considerable
freedoms, decentralization is
worldwide expected to bring this
into reality. Participation of people
in decision making and
implementation of the programmes
is essential for making governance
relevant for HD. In India, this
participation is ensured through
establishment of a 3-tier PanchayatSource: DSO, Raichur
243
Governance and Human Development
Raj system. Panchayats are set up
at village, taluk and district levels
with statutory reservation to SCs,
STs, OBCs and women. Over the
years, there have been positive as
well as negative aspects of the
working of the PRI system.
Moreover, it is noticed that there is
more of administrative
decentralization, and a very little of
financial decentralization. At the
least elections are held regularly
and the bodies not dissolved
unnecessarily.
To make governance more
accountable and transparent a
number of e-initiatives are adopted
for delivery of service and
development of MIS. However, the
regularity of updation of
information is hampered by less e-
readiness on the part of the staff as
well as poor infrastructure. There
is also significant shortage of staff,
especially at the officers’ level
which has affected the effective
governance. The problem is severe
with departments directly related to
HD concerns. This is a severe
challenge in the face of conferring
371 (j) status. Efforts are to be
made in tax collection by the GPs.
Although the overall expenditure is
lower, the human development
orientation of expenditure is visible
in the ‘Social Allocation Ratio’ and
‘Human Priority Ratios’. There is a
need to increase overall spending
to derive more HD attainments.
Many NGOs are actively working to
bring about desired changes in the
lives of common people, especially
education, health and livelihood of
women, children and
disadvantaged sections and overall
rural development.
‘Wiping every tear from every eye’: the JAM Number Trinity Solution
Arguing that the current subsidy regime is regressive and breeds leakages, the Economic Survey 2014-15proposes to use the JAM number trinity - Jan Dhan Yojane account, Adhaar and Moble numbers - forovercoming the same. It says “If the JAM Number Trinity can be seamlessly linked, and all subsidiesrolled into one or a few monthly transfers, real progress in terms of direct income support to the poor mayfinally be possible,” it said. This can reform the subsidy delivery in a tragetted manner and improve itseffectiveness. Recent experimental evidence documents that unconditional cash transfers - if targeted well-can boost household consumption and asset ownership, reduce food security problems for the ultra-poorand opportunities for leakage, the survey says. The Survey mentions that there are more than 900 millioncell phone users which is increasing at a rate of 2.82 million per month and this affords the use of mobilemoney for direct transfers. Similarly as of December 2013 more than 720 million citizens had been allocatedan Aadhaar card. By December 2015 the total number of Aadhaar enrolments in the country is expected toexceed 1 billion. Linking the Aadhaar Number to an active bank account is key to implementing incometransfers. With the introduction of Jan Dhan Yojana, the number of bank accounts is expected to increasefurther and offering greater opportunities to target and transfer financial resources to the poor. The Surveyalso proposes to involve post offices can also be dovetailed into the Aadhaar linked benefits-transferarchitecture. The Survey, therefore, hopes that “If the JAM Number Trinity can be seamlessly linked, andall subsidies rolled into one or a few monthly transfers, real progress in terms of direct income support tothe poor may finally be possible.”
- Economic Survey of India, 2014-15
244
Raichur District Human Development Report 2014
URBAN ISSUES IN HUMAN DEVELOPMENT
Chapter 11

.
247
Chapter 11
Urban Issues in Human Development
11.1. Introduction
Urbanization denotes the
percentage of the total population
living in urban areas. India’s urban
areas are defined on the basis of two
criteria. First, the state government
grants municipal status –
corporation, municipal council,
notified town area committee or
nagar panchayat, etc – to a
settlement. Such settlements are
known as statutory or municipal
towns in the census definition of
urban areas. Second, if a settlement
does not have an urban civic status,
but satisfies demographic and
economic criteria, like a population
of more than 5,000, a density of 400
persons per square kilometre and
75% male workforce in the non-
agricultural sector, it can be
declared urban. Such urban areas
are termed census towns (Bhagat,
2011).
Urbanization and urban problems
have received a lot of attention in
the recent years because of their
growth promoting role as well as
problems thrown open because of
growing cities. As cities account for
some 70 per cent of global GDP,
urbanization is a key indicator of
economic development and should
be seen as a positive factor for
overall development. Urban India
represents the entire nation and is
home to a rich variety of
communities, professions and
income classes.
The growth of urban population is
higher in India and by 2040, it is
estimated that more than half of the
Indian population will be urban.
The rapid pace of urbanisation in
the sub-continent has not only
created opportunities for economic
growth and improved quality of life,
but has also led to increased
pressures on the delivery of urban
civic services and poverty.
Integration of economic and social
infrastructure is essential while
considering the urban growth.
Development of smaller urban
areas into integrated townships
(satellite towns) reduces the
negative impacts on the nearby
city. This transition is expected to
have a significant implication for
HD attainments of a region. Urban
areas offer vast opportunities for
skill development and livelihood,
and because of the anonymity,
exclusion will not be so widespread.
However, rapid urbanization has its
own concomitant problems like
emergence of slums, inadequate
provision of basic amenities and
insecurity to life and property due
to increased pollution and crimes.
It has already been noticed that in
Raichur district HD attainments
are positively correlated with level
of urbanization.
Karnataka’s cities house 4.4 per
cent of country’s total urban
population. Between 1951 and
2011, the total population of
The rapid pace
of urbanisation
in the sub-
continent has
not only
created oppor-
tunities for
economic
growth and
improved
quality of life,
but has also
led to increased
pressures on
the delivery of
urban
civic services
and poverty.
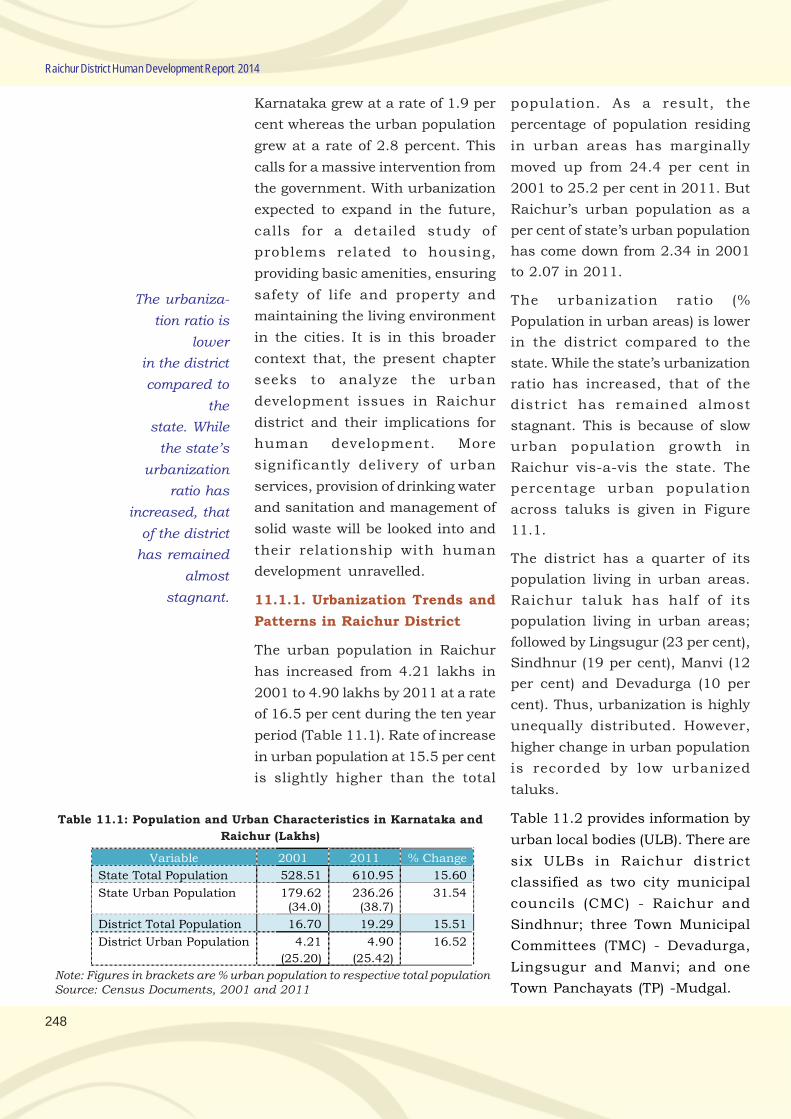
248
Raichur District Human Development Report 2014
Karnataka grew at a rate of 1.9 per
cent whereas the urban population
grew at a rate of 2.8 percent. This
calls for a massive intervention from
the government. With urbanization
expected to expand in the future,
calls for a detailed study of
problems related to housing,
providing basic amenities, ensuring
safety of life and property and
maintaining the living environment
in the cities. It is in this broader
context that, the present chapter
seeks to analyze the urban
development issues in Raichur
district and their implications for
human development. More
significantly delivery of urban
services, provision of drinking water
and sanitation and management of
solid waste will be looked into and
their relationship with human
development unravelled.
11.1.1. Urbanization Trends and
Patterns in Raichur District
The urban population in Raichur
has increased from 4.21 lakhs in
2001 to 4.90 lakhs by 2011 at a rate
of 16.5 per cent during the ten year
period (Table 11.1). Rate of increase
in urban population at 15.5 per cent
is slightly higher than the total
Table 11.1: Population and Urban Characteristics in Karnataka and
Raichur (Lakhs)
Variable 2001 2011 % Change
State Total Population 528.51 610.95 15.60
State Urban Population 179.62 (34.0)
236.26 (38.7)
31.54
District Total Population 16.70 19.29 15.51
District Urban Population 4.21
(25.20)
4.90
(25.42)
16.52
Note: Figures in brackets are % urban population to respective total populationSource: Census Documents, 2001 and 2011
population. As a result, the
percentage of population residing
in urban areas has marginally
moved up from 24.4 per cent in
2001 to 25.2 per cent in 2011. But
Raichur’s urban population as a
per cent of state’s urban population
has come down from 2.34 in 2001
to 2.07 in 2011.
The urbanization ratio (%
Population in urban areas) is lower
in the district compared to the
state. While the state’s urbanization
ratio has increased, that of the
district has remained almost
stagnant. This is because of slow
urban population growth in
Raichur vis-a-vis the state. The
percentage urban population
across taluks is given in Figure
11.1.
The district has a quarter of its
population living in urban areas.
Raichur taluk has half of its
population living in urban areas;
followed by Lingsugur (23 per cent),
Sindhnur (19 per cent), Manvi (12
per cent) and Devadurga (10 per
cent). Thus, urbanization is highly
unequally distributed. However,
higher change in urban population
is recorded by low urbanized
taluks.
Table 11.2 provides information by
urban local bodies (ULB). There are
six ULBs in Raichur district
classified as two city municipal
councils (CMC) - Raichur and
Sindhnur; three Town Municipal
Committees (TMC) - Devadurga,
Lingsugur and Manvi; and one
Town Panchayats (TP) -Mudgal.
The urbaniza-
tion ratio is
lower
in the district
compared to
the
state. While
the state’s
urbanization
ratio has
increased, that
of the district
has remained
almost
stagnant.
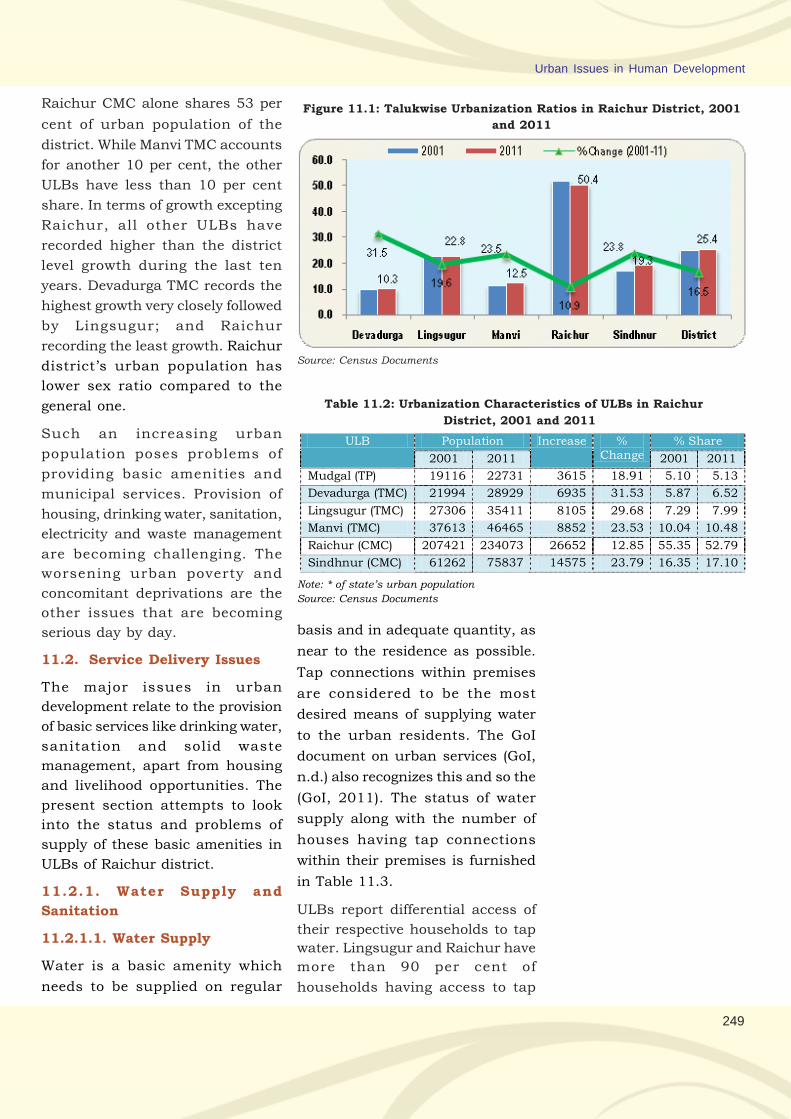
249
Urban Issues in Human Development
Figure 11.1: Talukwise Urbanization Ratios in Raichur District, 2001
and 2011
Source: Census Documents
Table 11.2: Urbanization Characteristics of ULBs in Raichur
District, 2001 and 2011
Note: * of state’s urban population
Source: Census Documents
Raichur CMC alone shares 53 per
cent of urban population of the
district. While Manvi TMC accounts
for another 10 per cent, the other
ULBs have less than 10 per cent
share. In terms of growth excepting
Raichur, all other ULBs have
recorded higher than the district
level growth during the last ten
years. Devadurga TMC records the
highest growth very closely followed
by Lingsugur; and Raichur
recording the least growth. Raichur
district’s urban population has
lower sex ratio compared to the
general one.
Such an increasing urban
population poses problems of
providing basic amenities and
municipal services. Provision of
housing, drinking water, sanitation,
electricity and waste management
are becoming challenging. The
worsening urban poverty and
concomitant deprivations are the
other issues that are becoming
serious day by day.
11.2. Service Delivery Issues
The major issues in urban
development relate to the provision
of basic services like drinking water,
sanitation and solid waste
management, apart from housing
and livelihood opportunities. The
present section attempts to look
into the status and problems of
supply of these basic amenities in
ULBs of Raichur district.
11.2.1. Water Supply and
Sanitation
11.2.1.1. Water Supply
Water is a basic amenity which
needs to be supplied on regular
basis and in adequate quantity, as
near to the residence as possible.
Tap connections within premises
are considered to be the most
desired means of supplying water
to the urban residents. The GoI
document on urban services (GoI,
n.d.) also recognizes this and so the
(GoI, 2011). The status of water
supply along with the number of
houses having tap connections
within their premises is furnished
in Table 11.3.
ULBs report differential access of
their respective households to tap
water. Lingsugur and Raichur have
more than 90 per cent of
households having access to tap
ULB Population Increase % Change
% Share
2001 2011 2001 2011
Mudgal (TP) 19116 22731 3615 18.91 5.10 5.13
Devadurga (TMC) 21994 28929 6935 31.53 5.87 6.52
Lingsugur (TMC) 27306 35411 8105 29.68 7.29 7.99
Manvi (TMC) 37613 46465 8852 23.53 10.04 10.48
Raichur (CMC) 207421 234073 26652 12.85 55.35 52.79
Sindhnur (CMC) 61262 75837 14575 23.79 16.35 17.10
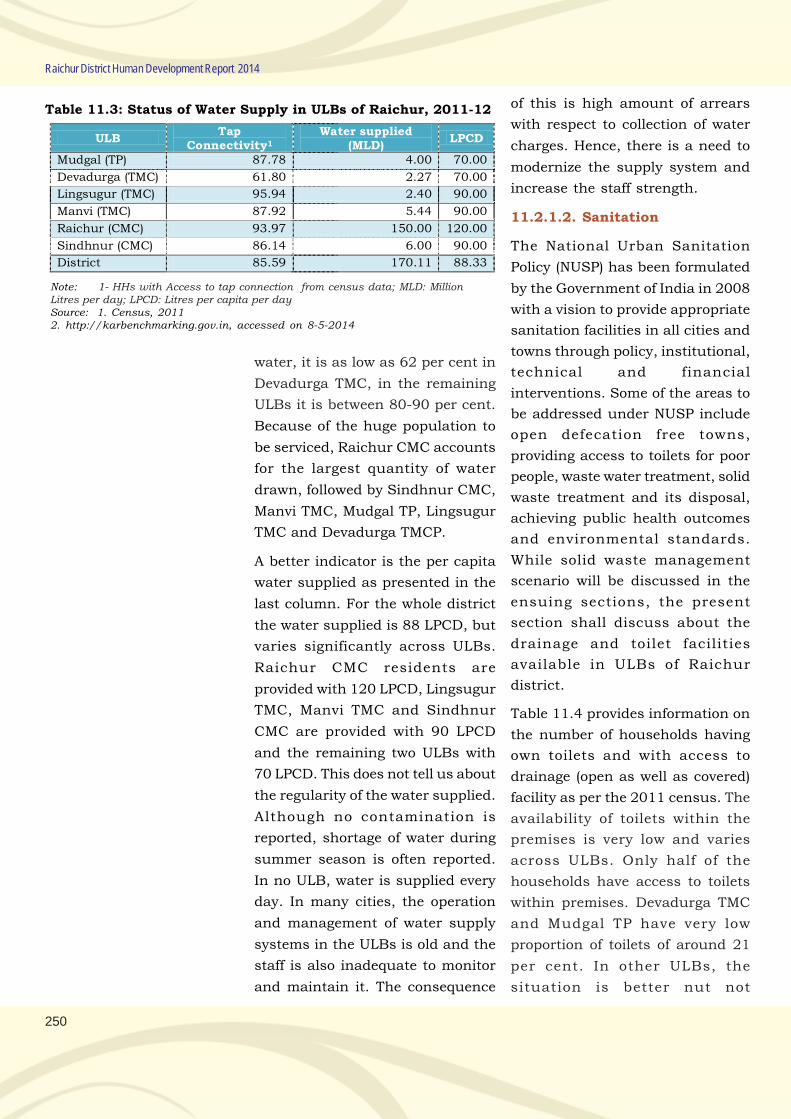
250
Raichur District Human Development Report 2014
water, it is as low as 62 per cent in
Devadurga TMC, in the remaining
ULBs it is between 80-90 per cent.
Because of the huge population to
be serviced, Raichur CMC accounts
for the largest quantity of water
drawn, followed by Sindhnur CMC,
Manvi TMC, Mudgal TP, Lingsugur
TMC and Devadurga TMCP.
A better indicator is the per capita
water supplied as presented in the
last column. For the whole district
the water supplied is 88 LPCD, but
varies significantly across ULBs.
Raichur CMC residents are
provided with 120 LPCD, Lingsugur
TMC, Manvi TMC and Sindhnur
CMC are provided with 90 LPCD
and the remaining two ULBs with
70 LPCD. This does not tell us about
the regularity of the water supplied.
Although no contamination is
reported, shortage of water during
summer season is often reported.
In no ULB, water is supplied every
day. In many cities, the operation
and management of water supply
systems in the ULBs is old and the
staff is also inadequate to monitor
and maintain it. The consequence
Table 11.3: Status of Water Supply in ULBs of Raichur, 2011-12
Note: 1- HHs with Access to tap connection from census data; MLD: MillionLitres per day; LPCD: Litres per capita per daySource: 1. Census, 20112. http://karbenchmarking.gov.in, accessed on 8-5-2014
of this is high amount of arrears
with respect to collection of water
charges. Hence, there is a need to
modernize the supply system and
increase the staff strength.
11.2.1.2. Sanitation
The National Urban Sanitation
Policy (NUSP) has been formulated
by the Government of India in 2008
with a vision to provide appropriate
sanitation facilities in all cities and
towns through policy, institutional,
technical and financial
interventions. Some of the areas to
be addressed under NUSP include
open defecation free towns,
providing access to toilets for poor
people, waste water treatment, solid
waste treatment and its disposal,
achieving public health outcomes
and environmental standards.
While solid waste management
scenario will be discussed in the
ensuing sections, the present
section shall discuss about the
drainage and toilet facilities
available in ULBs of Raichur
district.
Table 11.4 provides information on
the number of households having
own toilets and with access to
drainage (open as well as covered)
facility as per the 2011 census. The
availability of toilets within the
premises is very low and varies
across ULBs. Only half of the
households have access to toilets
within premises. Devadurga TMC
and Mudgal TP have very low
proportion of toilets of around 21
per cent. In other ULBs, the
situation is better nut not
ULB Tap
Connectivity1 Water supplied
(MLD) LPCD
Mudgal (TP) 87.78 4.00 70.00
Devadurga (TMC) 61.80 2.27 70.00
Lingsugur (TMC) 95.94 2.40 90.00
Manvi (TMC) 87.92 5.44 90.00
Raichur (CMC) 93.97 150.00 120.00
Sindhnur (CMC) 86.14 6.00 90.00
District 85.59 170.11 88.33
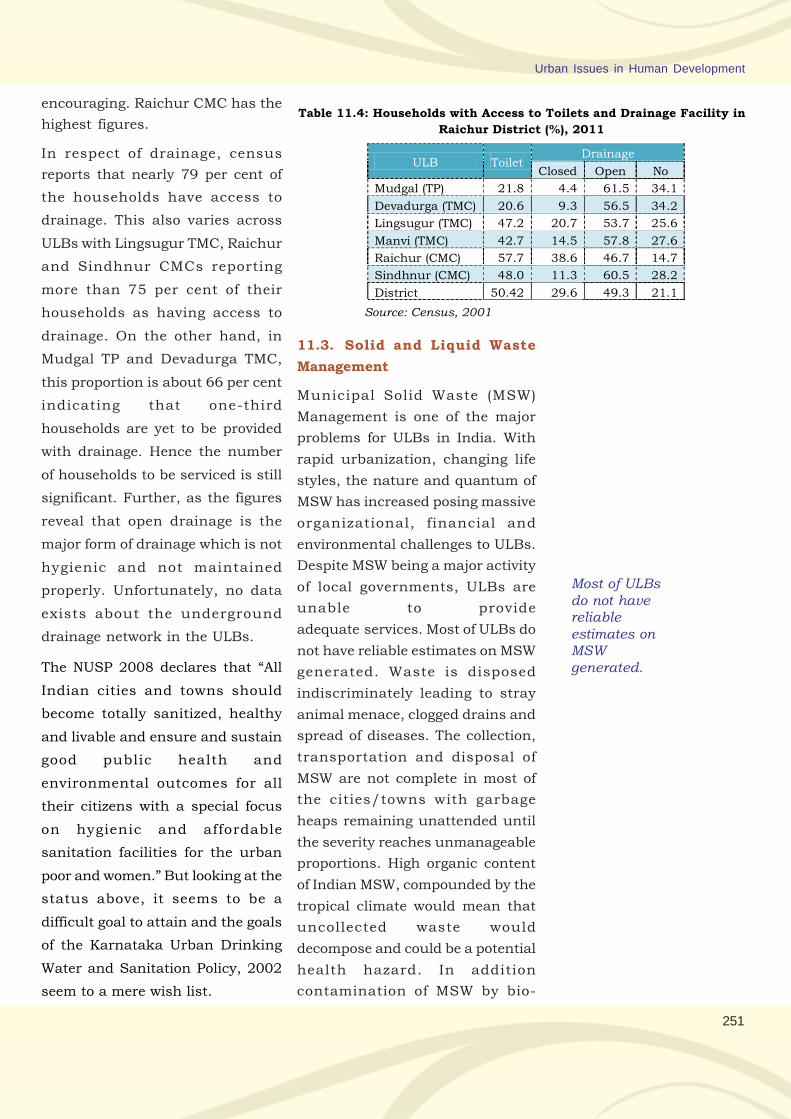
251
Urban Issues in Human Development
encouraging. Raichur CMC has the
highest figures.
In respect of drainage, census
reports that nearly 79 per cent of
the households have access to
drainage. This also varies across
ULBs with Lingsugur TMC, Raichur
and Sindhnur CMCs reporting
more than 75 per cent of their
households as having access to
drainage. On the other hand, in
Mudgal TP and Devadurga TMC,
this proportion is about 66 per cent
indicating that one-third
households are yet to be provided
with drainage. Hence the number
of households to be serviced is still
significant. Further, as the figures
reveal that open drainage is the
major form of drainage which is not
hygienic and not maintained
properly. Unfortunately, no data
exists about the underground
drainage network in the ULBs.
The NUSP 2008 declares that “All
Indian cities and towns should
become totally sanitized, healthy
and livable and ensure and sustain
good public health and
environmental outcomes for all
their citizens with a special focus
on hygienic and affordable
sanitation facilities for the urban
poor and women.” But looking at the
status above, it seems to be a
difficult goal to attain and the goals
of the Karnataka Urban Drinking
Water and Sanitation Policy, 2002
seem to a mere wish list.
Table 11.4: Households with Access to Toilets and Drainage Facility in
Raichur District (%), 2011
ULB Toilet Drainage
Closed Open No
Mudgal (TP) 21.8 4.4 61.5 34.1
Devadurga (TMC) 20.6 9.3 56.5 34.2
Lingsugur (TMC) 47.2 20.7 53.7 25.6
Manvi (TMC) 42.7 14.5 57.8 27.6
Raichur (CMC) 57.7 38.6 46.7 14.7
Sindhnur (CMC) 48.0 11.3 60.5 28.2
District 50.42 29.6 49.3 21.1
Source: Census, 2001
11.3. Solid and Liquid Waste
Management
Municipal Solid Waste (MSW)
Management is one of the major
problems for ULBs in India. With
rapid urbanization, changing life
styles, the nature and quantum of
MSW has increased posing massive
organizational, financial and
environmental challenges to ULBs.
Despite MSW being a major activity
of local governments, ULBs are
unable to provide
adequate services. Most of ULBs do
not have reliable estimates on MSW
generated. Waste is disposed
indiscriminately leading to stray
animal menace, clogged drains and
spread of diseases. The collection,
transportation and disposal of
MSW are not complete in most of
the cities/towns with garbage
heaps remaining unattended until
the severity reaches unmanageable
proportions. High organic content
of Indian MSW, compounded by the
tropical climate would mean that
uncollected waste would
decompose and could be a potential
health hazard. In addition
contamination of MSW by bio-
Most of ULBsdo not havereliableestimates onMSWgenerated.
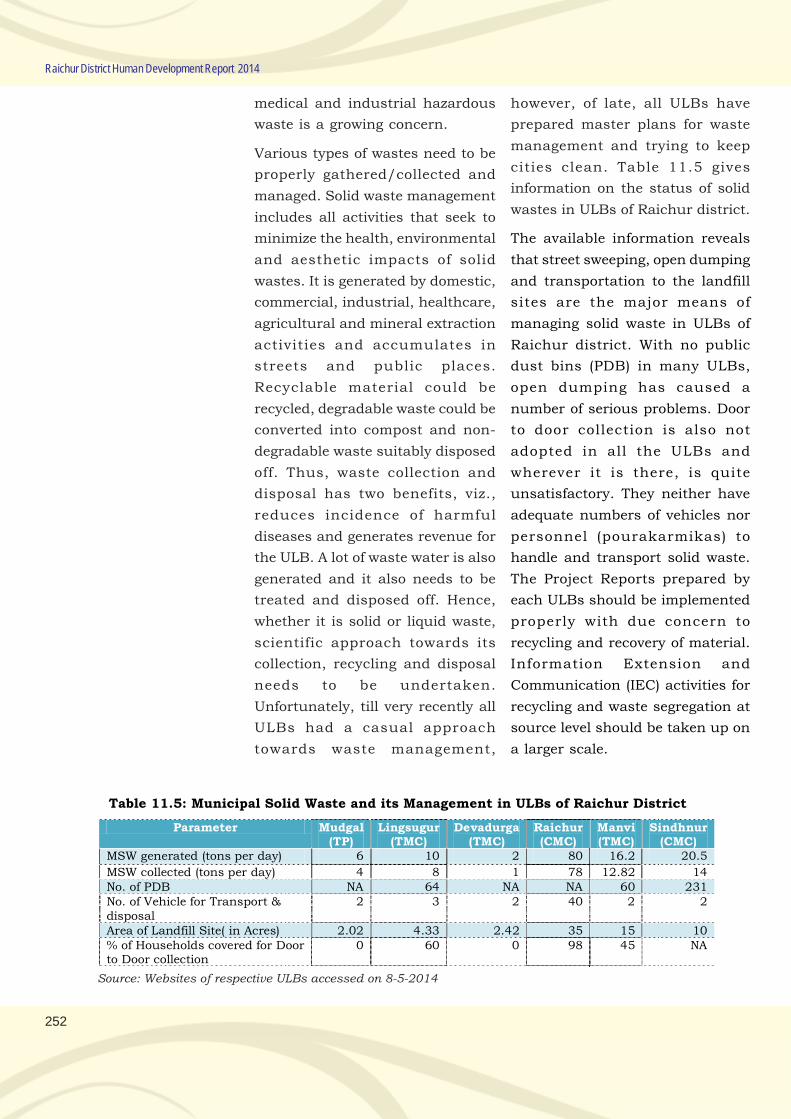
252
Raichur District Human Development Report 2014
medical and industrial hazardous
waste is a growing concern.
Various types of wastes need to be
properly gathered/collected and
managed. Solid waste management
includes all activities that seek to
minimize the health, environmental
and aesthetic impacts of solid
wastes. It is generated by domestic,
commercial, industrial, healthcare,
agricultural and mineral extraction
activities and accumulates in
streets and public places.
Recyclable material could be
recycled, degradable waste could be
converted into compost and non-
degradable waste suitably disposed
off. Thus, waste collection and
disposal has two benefits, viz.,
reduces incidence of harmful
diseases and generates revenue for
the ULB. A lot of waste water is also
generated and it also needs to be
treated and disposed off. Hence,
whether it is solid or liquid waste,
scientific approach towards its
collection, recycling and disposal
needs to be undertaken.
Unfortunately, till very recently all
ULBs had a casual approach
towards waste management,
Table 11.5: Municipal Solid Waste and its Management in ULBs of Raichur District
Source: Websites of respective ULBs accessed on 8-5-2014
however, of late, all ULBs have
prepared master plans for waste
management and trying to keep
cities clean. Table 11.5 gives
information on the status of solid
wastes in ULBs of Raichur district.
The available information reveals
that street sweeping, open dumping
and transportation to the landfill
sites are the major means of
managing solid waste in ULBs of
Raichur district. With no public
dust bins (PDB) in many ULBs,
open dumping has caused a
number of serious problems. Door
to door collection is also not
adopted in all the ULBs and
wherever it is there, is quite
unsatisfactory. They neither have
adequate numbers of vehicles nor
personnel (pourakarmikas) to
handle and transport solid waste.
The Project Reports prepared by
each ULBs should be implemented
properly with due concern to
recycling and recovery of material.
Information Extension and
Communication (IEC) activities for
recycling and waste segregation at
source level should be taken up on
a larger scale.
Parameter Mudgal (TP)
Lingsugur (TMC)
Devadurga (TMC)
Raichur (CMC)
Manvi (TMC)
Sindhnur (CMC)
MSW generated (tons per day) 6 10 2 80 16.2 20.5
MSW collected (tons per day) 4 8 1 78 12.82 14 No. of PDB NA 64 NA NA 60 231 No. of Vehicle for Transport & disposal
2 3 2 40 2 2
Area of Landfill Site( in Acres) 2.02 4.33 2.42 35 15 10 % of Households covered for Door to Door collection
0 60 0 98 45 NA
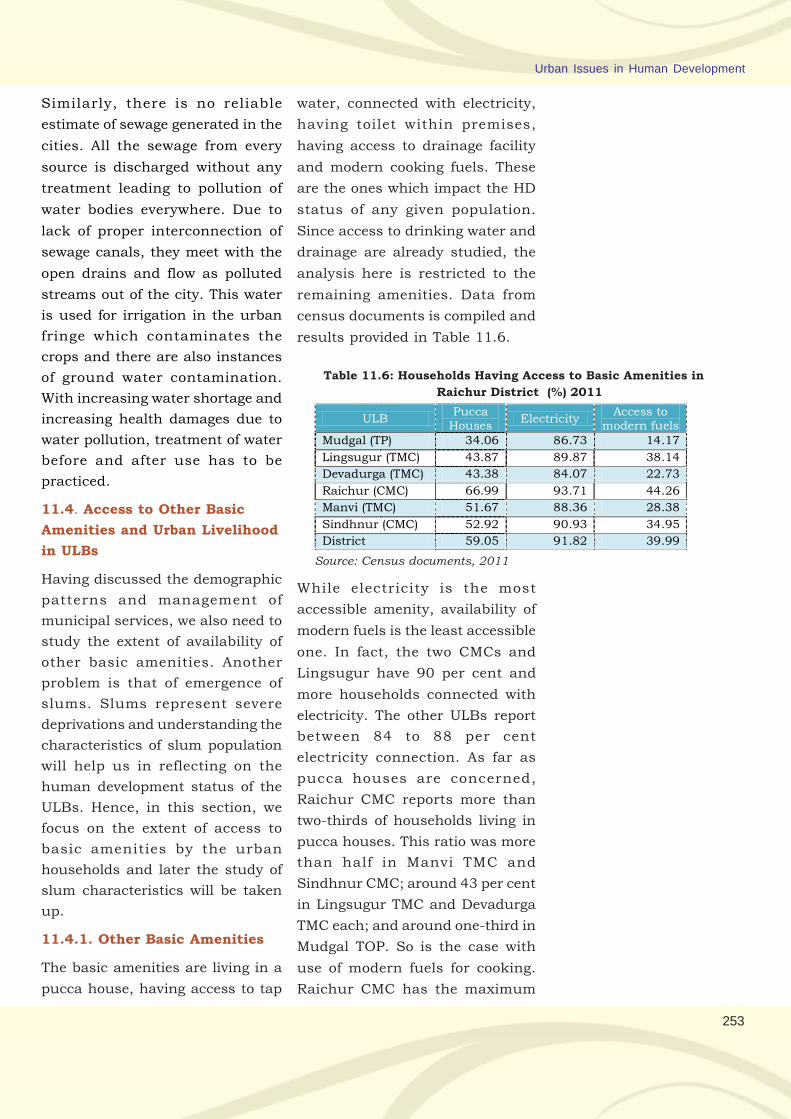
253
Urban Issues in Human Development
Similarly, there is no reliable
estimate of sewage generated in the
cities. All the sewage from every
source is discharged without any
treatment leading to pollution of
water bodies everywhere. Due to
lack of proper interconnection of
sewage canals, they meet with the
open drains and flow as polluted
streams out of the city. This water
is used for irrigation in the urban
fringe which contaminates the
crops and there are also instances
of ground water contamination.
With increasing water shortage and
increasing health damages due to
water pollution, treatment of water
before and after use has to be
practiced.
11.4. Access to Other Basic
Amenities and Urban Livelihood
in ULBs
Having discussed the demographic
patterns and management of
municipal services, we also need to
study the extent of availability of
other basic amenities. Another
problem is that of emergence of
slums. Slums represent severe
deprivations and understanding the
characteristics of slum population
will help us in reflecting on the
human development status of the
ULBs. Hence, in this section, we
focus on the extent of access to
basic amenities by the urban
households and later the study of
slum characteristics will be taken
up.
11.4.1. Other Basic Amenities
The basic amenities are living in a
pucca house, having access to tap
water, connected with electricity,
having toilet within premises,
having access to drainage facility
and modern cooking fuels. These
are the ones which impact the HD
status of any given population.
Since access to drinking water and
drainage are already studied, the
analysis here is restricted to the
remaining amenities. Data from
census documents is compiled and
results provided in Table 11.6.
Table 11.6: Households Having Access to Basic Amenities in
Raichur District (%) 2011
Source: Census documents, 2011
While electricity is the most
accessible amenity, availability of
modern fuels is the least accessible
one. In fact, the two CMCs and
Lingsugur have 90 per cent and
more households connected with
electricity. The other ULBs report
between 84 to 88 per cent
electricity connection. As far as
pucca houses are concerned,
Raichur CMC reports more than
two-thirds of households living in
pucca houses. This ratio was more
than half in Manvi TMC and
Sindhnur CMC; around 43 per cent
in Lingsugur TMC and Devadurga
TMC each; and around one-third in
Mudgal TOP. So is the case with
use of modern fuels for cooking.
Raichur CMC has the maximum
ULB Pucca
Houses Electricity
Access to modern fuels
Mudgal (TP) 34.06 86.73 14.17
Lingsugur (TMC) 43.87 89.87 38.14
Devadurga (TMC) 43.38 84.07 22.73
Raichur (CMC) 66.99 93.71 44.26
Manvi (TMC) 51.67 88.36 28.38
Sindhnur (CMC) 52.92 90.93 34.95
District 59.05 91.82 39.99
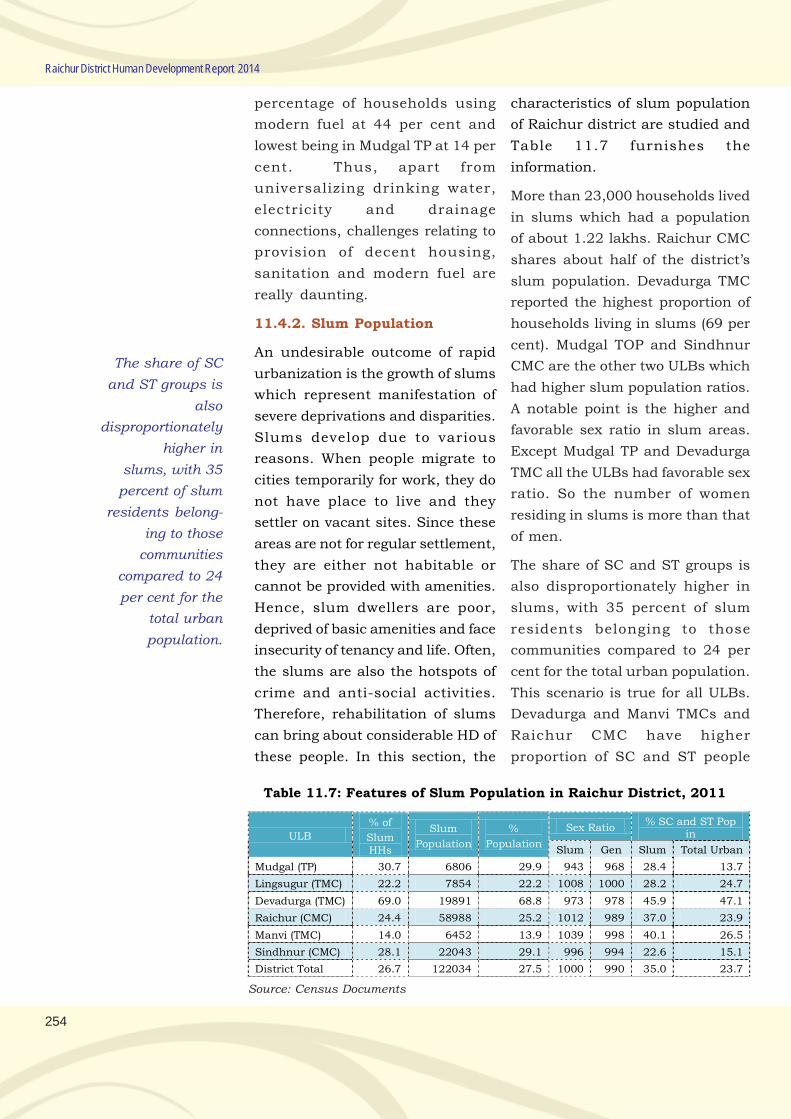
254
Raichur District Human Development Report 2014
percentage of households using
modern fuel at 44 per cent and
lowest being in Mudgal TP at 14 per
cent. Thus, apart from
universalizing drinking water,
electricity and drainage
connections, challenges relating to
provision of decent housing,
sanitation and modern fuel are
really daunting.
11.4.2. Slum Population
An undesirable outcome of rapid
urbanization is the growth of slums
which represent manifestation of
severe deprivations and disparities.
Slums develop due to various
reasons. When people migrate to
cities temporarily for work, they do
not have place to live and they
settler on vacant sites. Since these
areas are not for regular settlement,
they are either not habitable or
cannot be provided with amenities.
Hence, slum dwellers are poor,
deprived of basic amenities and face
insecurity of tenancy and life. Often,
the slums are also the hotspots of
crime and anti-social activities.
Therefore, rehabilitation of slums
can bring about considerable HD of
these people. In this section, the
Table 11.7: Features of Slum Population in Raichur District, 2011
ULB
% of
Slum HHs
Slum
Population
%
Population
Sex Ratio % SC and ST Pop
in
Slum Gen Slum Total Urban
Mudgal (TP) 30.7 6806 29.9 943 968 28.4 13.7
Lingsugur (TMC) 22.2 7854 22.2 1008 1000 28.2 24.7
Devadurga (TMC) 69.0 19891 68.8 973 978 45.9 47.1
Raichur (CMC) 24.4 58988 25.2 1012 989 37.0 23.9
Manvi (TMC) 14.0 6452 13.9 1039 998 40.1 26.5
Sindhnur (CMC) 28.1 22043 29.1 996 994 22.6 15.1
District Total 26.7 122034 27.5 1000 990 35.0 23.7
characteristics of slum population
of Raichur district are studied and
Table 11.7 furnishes the
information.
More than 23,000 households lived
in slums which had a population
of about 1.22 lakhs. Raichur CMC
shares about half of the district’s
slum population. Devadurga TMC
reported the highest proportion of
households living in slums (69 per
cent). Mudgal TOP and Sindhnur
CMC are the other two ULBs which
had higher slum population ratios.
A notable point is the higher and
favorable sex ratio in slum areas.
Except Mudgal TP and Devadurga
TMC all the ULBs had favorable sex
ratio. So the number of women
residing in slums is more than that
of men.
The share of SC and ST groups is
also disproportionately higher in
slums, with 35 percent of slum
residents belonging to those
communities compared to 24 per
cent for the total urban population.
This scenario is true for all ULBs.
Devadurga and Manvi TMCs and
Raichur CMC have higher
proportion of SC and ST people
Source: Census Documents
The share of SC
and ST groups is
also
disproportionately
higher in
slums, with 35
percent of slum
residents belong-
ing to those
communities
compared to 24
per cent for the
total urban
population.
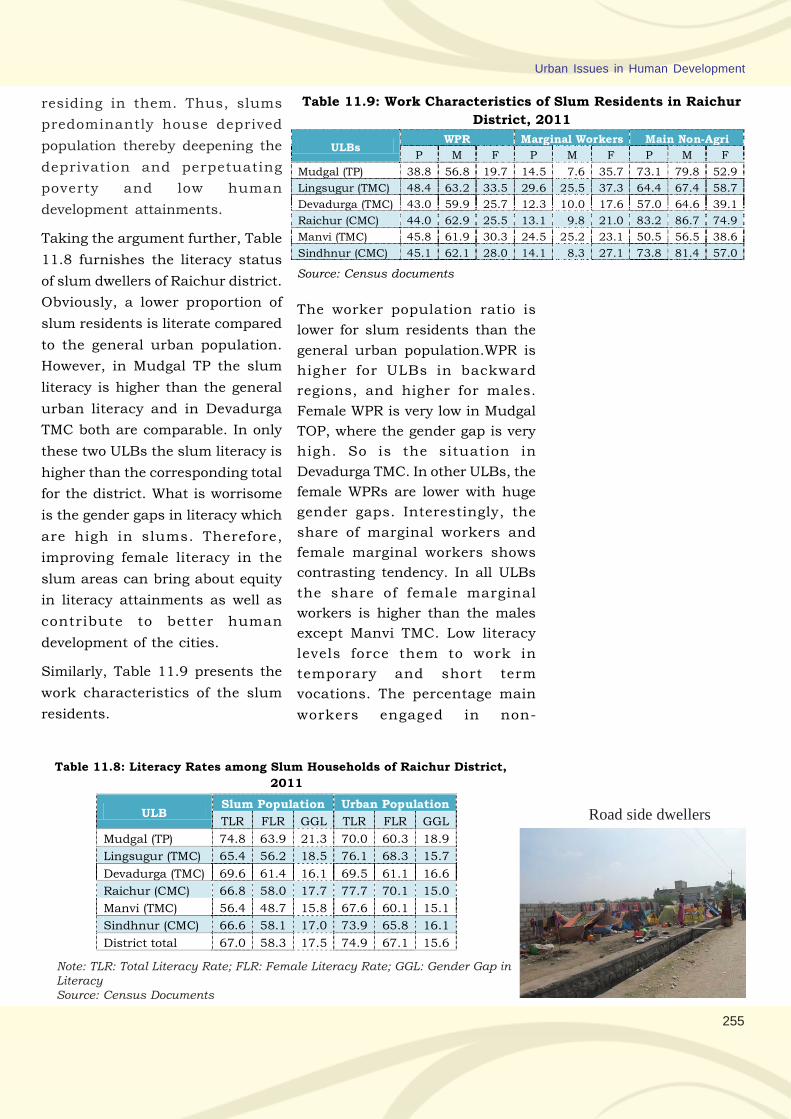
255
Urban Issues in Human Development
residing in them. Thus, slums
predominantly house deprived
population thereby deepening the
deprivation and perpetuating
poverty and low human
development attainments.
Taking the argument further, Table
11.8 furnishes the literacy status
of slum dwellers of Raichur district.
Obviously, a lower proportion of
slum residents is literate compared
to the general urban population.
However, in Mudgal TP the slum
literacy is higher than the general
urban literacy and in Devadurga
TMC both are comparable. In only
these two ULBs the slum literacy is
higher than the corresponding total
for the district. What is worrisome
is the gender gaps in literacy which
are high in slums. Therefore,
improving female literacy in the
slum areas can bring about equity
in literacy attainments as well as
contribute to better human
development of the cities.
Similarly, Table 11.9 presents the
work characteristics of the slum
residents.
Table 11.8: Literacy Rates among Slum Households of Raichur District,
2011
ULB Slum Population Urban Population
TLR FLR GGL TLR FLR GGL
Mudgal (TP) 74.8 63.9 21.3 70.0 60.3 18.9
Lingsugur (TMC) 65.4 56.2 18.5 76.1 68.3 15.7
Devadurga (TMC) 69.6 61.4 16.1 69.5 61.1 16.6
Raichur (CMC) 66.8 58.0 17.7 77.7 70.1 15.0
Manvi (TMC) 56.4 48.7 15.8 67.6 60.1 15.1
Sindhnur (CMC) 66.6 58.1 17.0 73.9 65.8 16.1
District total 67.0 58.3 17.5 74.9 67.1 15.6
Note: TLR: Total Literacy Rate; FLR: Female Literacy Rate; GGL: Gender Gap inLiteracySource: Census Documents
Table 11.9: Work Characteristics of Slum Residents in Raichur
District, 2011
ULBs WPR Marginal Workers Main Non-Agri
P M F P M F P M F
Mudgal (TP) 38.8 56.8 19.7 14.5 7.6 35.7 73.1 79.8 52.9
Lingsugur (TMC) 48.4 63.2 33.5 29.6 25.5 37.3 64.4 67.4 58.7
Devadurga (TMC) 43.0 59.9 25.7 12.3 10.0 17.6 57.0 64.6 39.1
Raichur (CMC) 44.0 62.9 25.5 13.1 9.8 21.0 83.2 86.7 74.9
Manvi (TMC) 45.8 61.9 30.3 24.5 25.2 23.1 50.5 56.5 38.6
Sindhnur (CMC) 45.1 62.1 28.0 14.1 8.3 27.1 73.8 81.4 57.0
Source: Census documents
The worker population ratio is
lower for slum residents than the
general urban population.WPR is
higher for ULBs in backward
regions, and higher for males.
Female WPR is very low in Mudgal
TOP, where the gender gap is very
high. So is the situation in
Devadurga TMC. In other ULBs, the
female WPRs are lower with huge
gender gaps. Interestingly, the
share of marginal workers and
female marginal workers shows
contrasting tendency. In all ULBs
the share of female marginal
workers is higher than the males
except Manvi TMC. Low literacy
levels force them to work in
temporary and short term
vocations. The percentage main
workers engaged in non-
Road side dwellers
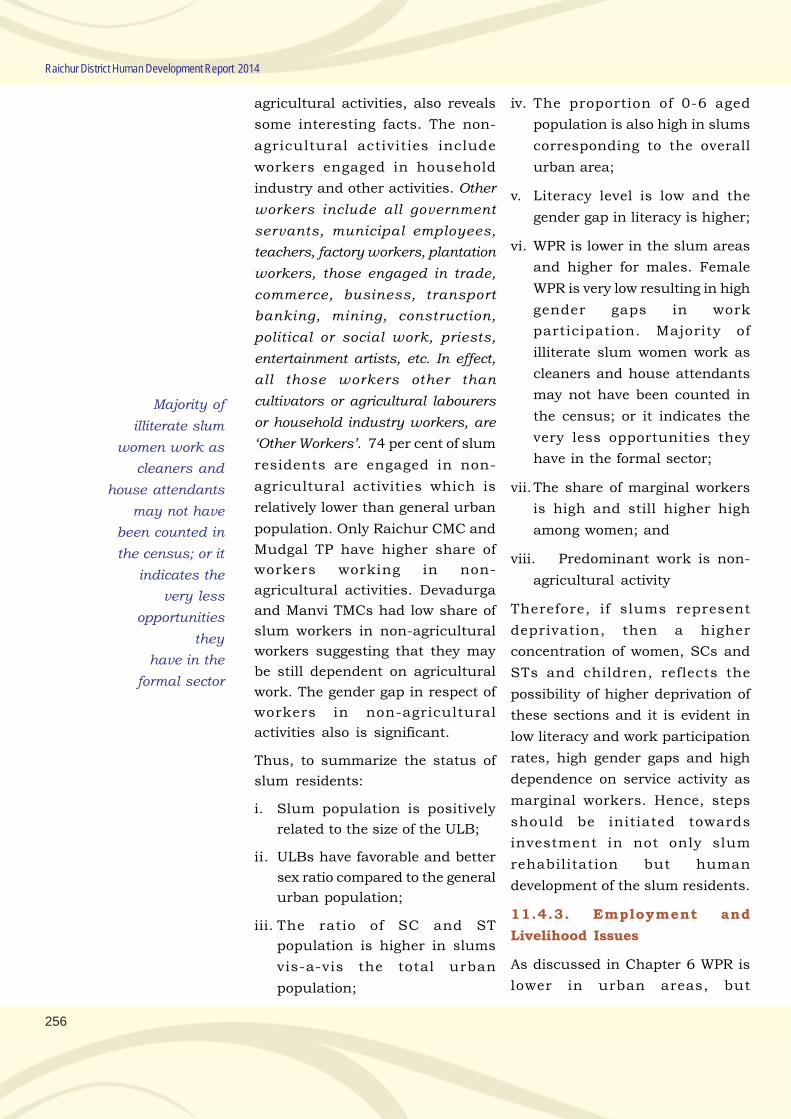
256
Raichur District Human Development Report 2014
agricultural activities, also reveals
some interesting facts. The non-
agricultural activities include
workers engaged in household
industry and other activities. Other
workers include all government
servants, municipal employees,
teachers, factory workers, plantation
workers, those engaged in trade,
commerce, business, transport
banking, mining, construction,
political or social work, priests,
entertainment artists, etc. In effect,
all those workers other than
cultivators or agricultural labourers
or household industry workers, are
‘Other Workers’. 74 per cent of slum
residents are engaged in non-
agricultural activities which is
relatively lower than general urban
population. Only Raichur CMC and
Mudgal TP have higher share of
workers working in non-
agricultural activities. Devadurga
and Manvi TMCs had low share of
slum workers in non-agricultural
workers suggesting that they may
be still dependent on agricultural
work. The gender gap in respect of
workers in non-agricultural
activities also is significant.
Thus, to summarize the status of
slum residents:
i. Slum population is positively
related to the size of the ULB;
ii. ULBs have favorable and better
sex ratio compared to the general
urban population;
iii. The ratio of SC and ST
population is higher in slums
vis-a-vis the total urban
population;
iv. The proportion of 0-6 aged
population is also high in slums
corresponding to the overall
urban area;
v. Literacy level is low and the
gender gap in literacy is higher;
vi. WPR is lower in the slum areas
and higher for males. Female
WPR is very low resulting in high
gender gaps in work
participation. Majority of
illiterate slum women work as
cleaners and house attendants
may not have been counted in
the census; or it indicates the
very less opportunities they
have in the formal sector;
vii.The share of marginal workers
is high and still higher high
among women; and
viii. Predominant work is non-
agricultural activity
Therefore, if slums represent
deprivation, then a higher
concentration of women, SCs and
STs and children, reflects the
possibility of higher deprivation of
these sections and it is evident in
low literacy and work participation
rates, high gender gaps and high
dependence on service activity as
marginal workers. Hence, steps
should be initiated towards
investment in not only slum
rehabilitation but human
development of the slum residents.
11.4.3. Employment and
Livelihood Issues
As discussed in Chapter 6 WPR is
lower in urban areas, but
Majority of
illiterate slum
women work as
cleaners and
house attendants
may not have
been counted in
the census; or it
indicates the
very less
opportunities
they
have in the
formal sector
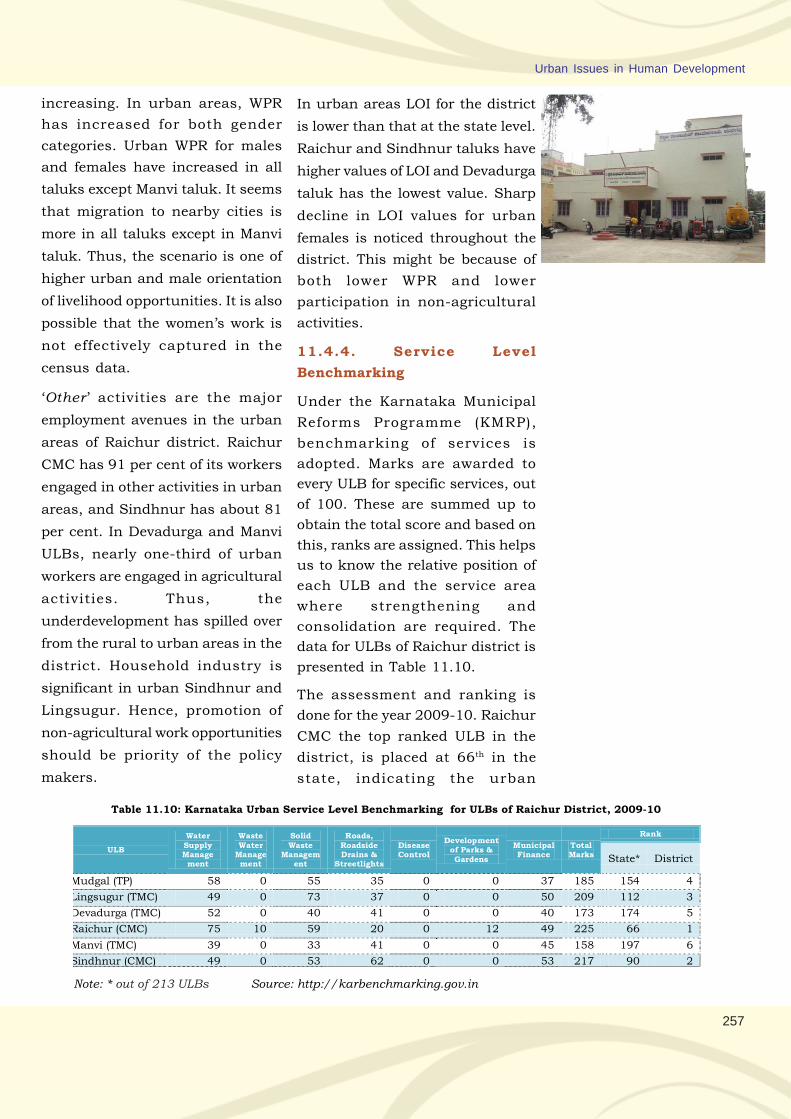
257
Urban Issues in Human Development
increasing. In urban areas, WPR
has increased for both gender
categories. Urban WPR for males
and females have increased in all
taluks except Manvi taluk. It seems
that migration to nearby cities is
more in all taluks except in Manvi
taluk. Thus, the scenario is one of
higher urban and male orientation
of livelihood opportunities. It is also
possible that the women’s work is
not effectively captured in the
census data.
‘Other ’ activities are the major
employment avenues in the urban
areas of Raichur district. Raichur
CMC has 91 per cent of its workers
engaged in other activities in urban
areas, and Sindhnur has about 81
per cent. In Devadurga and Manvi
ULBs, nearly one-third of urban
workers are engaged in agricultural
activities. Thus, the
underdevelopment has spilled over
from the rural to urban areas in the
district. Household industry is
significant in urban Sindhnur and
Lingsugur. Hence, promotion of
non-agricultural work opportunities
should be priority of the policy
makers.
In urban areas LOI for the district
is lower than that at the state level.
Raichur and Sindhnur taluks have
higher values of LOI and Devadurga
taluk has the lowest value. Sharp
decline in LOI values for urban
females is noticed throughout the
district. This might be because of
both lower WPR and lower
participation in non-agricultural
activities.
11.4.4. Service Level
Benchmarking
Under the Karnataka Municipal
Reforms Programme (KMRP),
benchmarking of services is
adopted. Marks are awarded to
every ULB for specific services, out
of 100. These are summed up to
obtain the total score and based on
this, ranks are assigned. This helps
us to know the relative position of
each ULB and the service area
where strengthening and
consolidation are required. The
data for ULBs of Raichur district is
presented in Table 11.10.
The assessment and ranking is
done for the year 2009-10. Raichur
CMC the top ranked ULB in the
district, is placed at 66th in the
state, indicating the urban
Table 11.10: Karnataka Urban Service Level Benchmarking for ULBs of Raichur District, 2009-10
Note: * out of 213 ULBs Source: http://karbenchmarking.gov.in
ULB
Water Supply Manage ment
Waste Water
Manage ment
Solid Waste
Managem ent
Roads, Roadside Drains &
Streetlights
Disease Control
Development of Parks & Gardens
Municipal Finance
Total Marks
Rank
State* District
Mudgal (TP) 58 0 55 35 0 0 37 185 154 4
Lingsugur (TMC) 49 0 73 37 0 0 50 209 112 3
Devadurga (TMC) 52 0 40 41 0 0 40 173 174 5
Raichur (CMC) 75 10 59 20 0 12 49 225 66 1
Manvi (TMC) 39 0 33 41 0 0 45 158 197 6
Sindhnur (CMC) 49 0 53 62 0 0 53 217 90 2
258
Raichur District Human Development Report 2014
development in Raichur district is
not very much encouraging. The
CMC fares relatively better in water
supply management, SWM and
finances. Sindhnur CMC is the
second ranked city in the district,
placed at 90 in the whole state. No
ULB has been awarded marks for
disease control and awarded almost
no marks for development of parks
and gardens as well as waste water
management, which is a stark
neglect of environmental issues.
Hence apart from usual services,
the focus of all ULBs has to be on
waste water treatment,
development of parks and gardens
and disease control programmes.
Mudgal TP and Devadurga TMC
score very less on generation and
utilization of finances as well and
this is another area of suggested
improvement.
11.4.5. Urban Development Index
(UDI)
The composite UDI presented in
Figure 3.6 (chapter 3) reveals that
Raichur CMC has the highest high
UDI among ULBs owing to higher
urban population, better basic
amenities and infrastructure,
higher own resource mobilization
and lower crime and accident rates.
Sindhnur CMC has the next highest
UDI value. Among the TMCs, Manvi
followed by Lingsugur have higher
UDI, but lesser than Raichur and
Sindhnur. Devadurga TMC has the
least UDI among the TMCs as well
as all ULBs. Mudgal TP stands in
the last but one position. Hence,
Raichur CMC is the most developed
and Devadurga TMC is the least
developed.
Correlating UDI with the indicators
reveals that UDI is highly
associated with size of urban
population, basic amenities like
housing, drinking water and
sanitation availability, health and
road infrastructure. Crime rate and
accidents are negatively associated
with UDI and so also slum
population and development
expenditure. This indicates that for
improving liveability in urban
areas, it is essential to strengthen
infrastructure, enhance access to
basic amenities and step up
spending on developmental
activities. A higher UDI tends to
reduce crime and accident rates.
Thus, spending must increase in all
the ULBs especially on basic
amenities and health and road
development. This will not only
improve urban living conditions but
will also bring down crime and
accident rates, thereby further
improving the standard of life of
people.
11.5. Concluding Remarks
Backwardness of Raichur district is
also evident in its low and slow
urbanization status. Due to a
slower increase in urban
population between 2001 and
2011, the percentage of population
residing in urban areas has only
marginally increased and the share
of Raichur in state’s urban
population has come down. It is
noticed that urbanization is highly
unequally distributed with Raichur
No ULB has
been awarded
marks for
disease control
and awarded
almost no
marks for
development
of parks and
gardens as
well as waste
water
management,
which is a
stark
neglect of
environmental
issues.
259
Urban Issues in Human Development
CMC accounting for half of the
district’s urban population. But low
urbanized talukss have recorded
higher increase in urban
population.
In terms of access to basic
amenities, ULBs report differential
access to pucca houses, tap water,
electricity, toilets, drainage and
clean cooking fuel. Lingsugur and
Raichur have more than 90 per cent
of households having access to tap
water, it is as low as 62 per cent in
Devadurga TMC, in the remaining
ULBs it is between 80-90 per cent.
The availability of toilets within the
premises is very low, so also
drainage and clean cooking fuel.
While electricity is the most
accessible amenity, availability of
clean fuels is the least accessible
one.
Further, no ULB has undertaken
reliable estimates of solid waste
and sewage generated and there is
also no foolproof system of
management of SW and sewage
water because of which, no ULB is
awarded marks for waste water
management (except Raichur CMC)
as well as disease control and
management in the ‘Benchmarking
of ULBs for the year 2009-10.
WPR is higher for ULBs in backward
regions, and higher for males. In all
ULBs the share of female marginal
workers is higher than the males
except Manvi TMC. Low literacy
levels force them to work in
temporary and short term vocations.
The in LOI values for urban females
have sharply declined throughout
the district. This might be because
of both lower WPR and lower
participation in non-agricultural
activities.
Slum population is not related to
the size of the ULB; they have
favorable and better sex ratio
compared to the general urban
population; the ratio of SC and ST
population is higher in slums vis-
a-vis the total urban population;
the proportion of 0-6 aged
population is also high in slums
corresponding to the overall urban
area; literacy level is low and the
gender gap in literacy is higher;
WPR is lower in the slum areas and
higher for males. Because of these
characteristics, slums represent
multiple deprivations and hence
steps should be initiated to improve
and rehabilitate slums. Therefore,
if slums represent deprivation, then
a higher concentration of women,
SCs and STs and children, reflects
the possibility of higher deprivation
of these sections and it is evident
in low literacy and work
participation rates, high gender
gaps and high dependence on
service activity as marginal
workers. Hence, steps should be
initiated towards investment in not
only slum rehabilitation but human
development of the slum residents.
The Urban Service Level
Benckmarking has not awarded
marks for disease control and
awarded almost no marks for
development of parks and gardens
as well as waste water
management, which indicates
neglect of environmental issues.
Mudgal TP and Devadurga TMC
score very less on generation and
utilization of finances as well and
this is another area of suggested
improvement.
260
Raichur District Human Development Report 2014
WAY FORWARD
Chapter 12

.
263
Chapter 12
Way Forward
12.1. Introduction
Any development programme
should enhance the opportunities
and choices available to the people.
Income is obviously one of the
indicators of development and is
only a means for achieving other
broader ends of human well-being.
Therefore, people should be the
centre of development process
because they are both the
beneficiaries and the agents of that
process. Development will be more
equitable and more meaningful if it
is by the people of the people and
for the people. This is the basis of
HD paradigm that has been
accepted widely by academicians as
well as practitioners.
Based on Sen’s capabilities
approach HD defines development
as a process that enhances the
basic capabilities and choices
available to the people. The basic
capabilities are education, health
and livelihood. UNDP, in its HDRs,
combined these to form the HDI.
More specifically, the average
attainments in health (LEB);
education (mean and expected
years of schooling); and per capita
income (US $ at PPP) - are used to
compute HDI for countries, groups
of population and even regional
groupings. HDI is being extensively
used by the policy makers to
compare the performance of their
own country/region in various HD
dimensions. Because of the
robustness of HDI as an analytical
tool to guide policy making for
human progress, the computation
of HDI has been extended to micro-
regions as well. Many countries
have prepared HDRs at provincial
and sub-provincial levels as well as
for groupings of population. The UN
Millennium Development Goals
(MDGs) also predominantly
emphasize HD aspects. Thus HD
paradigm has become the pivot of
all development discourses.
As one of the early adopters of HD
strategy and also having committed
to the achievement of UNMDGs,
India has prepared HDRs at various
levels at regular intervals. Many
state and local governments have
also initiated the preparation of
HDRs. Government of Karnataka,
in order to strengthen its own plans
for purposeful development, has
prepared two state level HDRs (the
first in 1999 and the second in
2006) and district level HDRs (in
2008). Experience gained in these
processes and the need to go
further below for documenting
achievements and identifying the
gaps, have prompted the
Government to compute HDI at
taluk (block) level. The present
exercise aims at constructing
human and other composite
development indices with the taluk
as the unit of analysis. This is the
first of its kind in the whole country.
Development
will be more
equitable and
more
meaningful if it
is by the
people of the
people and
for the people.
264
Raichur District Human Development Report 2014
Fundamentally, the exercise seeks
to build a reliable data set at the
taluk level, make the officials HD
sensitive in their approach to
implementation of programmes and
involve local stakeholders in the
process of preparation and
implementation of HD plans.
The methodology of computation of
indices has been customized to
capture the local problems and
priorities in the light of the nature
of data available. Hence, with 2011-
12 as the reference year, Human
Development Index (HDI), Gender
Inequality Index (GII) Child
Development Index (CDI), Food
Security Index (FSI), Composite
Taluk Development Index (CTDI)
and Urban Development Index
(HDI) have been computed at taluk
level and analysed. A District
Comprehensive Index (DCDI) is also
constructed.
The data has been compiled from
the Census documents, DSO,
DLHS, publications of individual
departments at the district level like
HMIS, SSA/RMSA and unpublished
data available with them. The HDD
of the Planning Department shared
a huge amount of standardized data
and provided detailed guidelines
and training regarding the process
involved in preparation of HDRs. At
the district level, the District Core
Committee was responsible for
collection, compilation and
validation of data and reviewing the
progress. Thus, the Raichur District
Human Development Report has
been the result of a participative
and consultative process prepared
with the help of all stakeholders
and dedicated to the people of
Raichur district.
12.2. Discussion and Analysis
12.2.1: Analysis and Explanation
of Various Indices
i. Human Development Index
(HDI): Raichur district depicts a
dismal picture of development as it
continues to be a low developed
district. It is ranked at 30th place in
the state with a HDI value of 0.165.
There are three distinct regions of
development with Raichur and
Lingsugur taluks being relatively
developed; Manvi and Devadurga
less developed and Sindhnur falling
in the middle level. Human
deprivation is high in Devadurga,
Manvi and Sindhnur. Devadurg’s
HDI value is half of Raichur’s. The
district has the highest mortality
values for the state - IMR, CMR and
MMR and the health index has
influenced the performance in HD,
followed by education and standard
of living. The district also records
the lowest GER in whole of the
state. Similarly, percentage
households having access to clean
fuel and toilets is abysmally low as
is the percentage of non-
agricultural workers. Hence, very
high mortality rates, very low SOL
indicators have been responsible
for the least HD of the district. HD
status among SCs and STs is lower
than that for the total population
in the district. In Raichur, rural SCs
are at a greater disadvantage than
their urban counterparts. But STs
Human
Development
Index (HDI),
Gender
Inequality Index
(GII) Child
Development
Index (CDI),
Food
Security Index
(FSI), Composite
Taluk
Development
Index (CTDI) and
Urban
Development
Index
(HDI) are
computed at
taluk level
HDI Rankings
Raichur - 1
Lingsugur - 2
Manvi - 3
Sindhnur - 4
Devadurga -5
265
Way Forward
are more deprived than SCs
compared to the general
population.
ii. Gender Inequality Index (GII):
The GII for district is 0.150 and is
ranked at 28th position. Sindhnur
has the least gender inequality
followed by Devadurga; Manvi
having the highest inequality. The
observed gender inequality is
because of relatively adverse
empowerment index and more
adverse labour market index.
Female health is index very low in
Manvi taluk, therefore, GII is quite
high there. The predominantly rural
nature and also higher degree of
poverty in Devadurga, Manvi and
Sindhnur taluks, women are
compelled to participate more in
work. Crimes against women
though declining are still
considerable.
iii. Child Development Index (CDI):
The district’s CDI calculated at
0.231 and is ranked last in the
state. Lingsugur has the highest
CDI followed by Raichur; Devadurga
has the lowest CDI (almost two and
half times less than Lingsugur
taluka); which is because of high
CMR and percentage of children
born underweight, and the least per
cent dropout children
mainstreamed. Lingsugur has the
lowest CMR and per cent children
born underweight. Hence, efforts at
reducing CMR and mainstreaming
of all dropped out children needs
to be emphasized along with
strengthening nutrition.
iv. Food Security Index (FSI): Food
security is defined to comprise of
availability (local production
capacity), accessibility (making
food available to people) and
absorption (complementary factors
that make nutrition a realistic goal).
Raichur district has a very low FSI
at 0.266 and is ranked at 29th
position. The district not only has
very low availability, the absorption
parameters are also of very low
magnitude. Even with a better
accessibility index FSI for the
taluks is lower spreading the food
insecurity wide in the district. Since
accessibility and absorption have
determined the value of FSI to a
greater extent improving income,
non-agricultural employment
avenues, female literacy and
provision of drinking water can
enhance the food security in the
district.
v. Composite Taluk Development
Index (CTDI): Sindhnur taluk has
the highest CTDI followed by
Raichur, Lingsugur, Manvi and
Devadurga. That there is not much
variation in the values of CTDI
shows that all taluks are more or
less equally backward.
Educational development has
predominantly affected the CTDI in
Raichur district.
vi. Urban Development Index
(UDI): Raichur CMC has a high UDI
among ULBs of the district owing
to higher urban population, better
basic amenities and infrastructure,
higher own resource mobilization
and lower crime and accident rates.
GII Rankings
Sindhnur - 1
Devadurga -2
Lingsugur - 3
Raichur - 4
Manvi - 5
CDI Rankings
Lingsugur - 1
Raichur - 2
Sindhnur - 3
Manvi - 4
Devadurga -5
FSI Rankings
Raichur - 1
Lingsugur - 2
Sindhnur - 3
Manvi - 4
Devadurga - 5
CTDI Rankings
Sindhnur - 1
Raichur - 2
Lingsugur - 3
Manvi - 4
Devadurga -5
UDI Rankings
Raichur CMC - 1
Sindhnur CMC - 2
Manvi TMC - 3
Lingsugur TMC - 4
Mudgal TP - 5
Devadurga TMC - 6
266
Raichur District Human Development Report 2014
Sindhnur CMC has the next highest
UDI value. Among the TMCs, Manvi
followed by Lingsugur have higher
UDI, but lower than Raichur and
Sindhnur. Devadurga TMC has the
least UDI among the TMCs. Mudgal
TP stands in the last but one
position. Hence, Raichur CMC is the
most developed and Devadurga
TMC is the least developed.
12.2.2. Achievements and Gaps
12.2.2.1. Education
Less than 50 per cent of population
is literate in Devadurga; in other
taluks too illiteracy is high ranging
from 35 to 45 per cent. This is
because NER in elementary stage
is generally lower but dropout rate
is higher suggesting that not all
children get enrolled in schools and
they do not complete the schooling.
Gender gaps though declining are
still higher; with those in rural areas
being almost double than the urban
areas. With literacy rates for SC and
ST population being lower than
others, social group disparity in
education is also considerable. The
gaps have been lower for SC
population compared to ST
population, but gaps for females are
still quite high compared to that for
males.
The extent of dropping out is higher
Devadurga, Lingsugur and Manvi
taluks. This distress deepens in the
secondary stage of education.
Secondary school enrolment is 25
per cent of that prevailing in the best
performing taluk of the state. Except
Sindhnur, in no other taluk it has
crossed 50 per cent. This is a severe
gap. A more distressing fact is the
extent of dropout rate in the
secondary stage which is more than
10 per cent in all taluks with as
high as a rate as 21 per cent in
Devadurga taluk. Thus, not joining
higher level of schooling and not
completing it is a quite severe
problem in the district. To add to
this is the lower percentage of
children mainstreamed which is
lower in Devadurga and Manvi;
medium in Raichur and better in
Lingsugur and Sindhnur taluks.
Despite satisfactory PTR, SSLC
pass percentage generally low. But
the SSLC pass percentage higher
in low literate taluks; and an
opposite scenario may be observed
with respect to PUC pass
percentage. School infrastructure
index is lower in Manvi, Lingsugur
and Sindhnur. Along with
strengthening of school
infrastructure, especially drinking
water and toilets, additional
primary schools need to be started
in Manvi and Raichur taluks.
The expenditure per capita for the
district at Rs. 467 per capita is very
low when compared to the amount
spent in other districts; and is also
generally lower in the district but
relatively higher in less literate
taluks.
12.2.2.2. Health
The district has about 3.5 per cent
of the state’s population; has a lower
urbanization ratio; but a higher
proportion of both SC and ST
267
Way Forward
populations. MMR is higher
throughout the district owing a
higher incidence of anaemia among
pregnant women. It is as high as
71 per cent in Manvi. The reported
ANC coverage is high but quality in
terms of number of visits and
nutritional supplements provided
need to be enhanced. The share of
institutional delivery is around 90
per cent and the MMR is higher
wherever the incidence of
institutional delivery is lower.
Additional number of sub-centres
and PHCs anganwadis need to be
set up in Devadurga and Manvi;
medical personnel to be appointed
in Manvi, Lingsugur and Sindhnur;
and health expenditure needs to be
enhanced, especially in Lingsugur,
Raichur, Sindhnur and Devadurga.
Males have to be encouraged to
share birth control burden to
reduce population growth and
improve the health of women.
12.2.2.3. Livelihood
Livelihood security depends a lot
on income and employment
characteristics of the population.
The district’s share in state’s income
decreased to 1.7 per cent between
2004-05 and 2008-09. The per
capita DDP of the district continued
to be lower than the state PCSDP.
The percentage change in PCI was
also lower in the district compared
to the state. There are also
considerable inter-taluk
disparities in level and growth of
income. Contrary to the usual
tendency, agriculture has
increased its share; manufacturing
is a very small component of the
district’s economy and major
services are declining. This
traditional economic structure is
reflected in employment too with
the percentage of workers engaged
in agricultural activities as
cultivators and agricultural
labourers being very high at 70 per
cent in the district compared to 49
per cent in the state and the change
also being marginal in the district.
Food grains dominate the district
with an area share of more than 73
per cent of NSA. Among the food
grains, cereals are predominantly
grown which occupy more than half
of the NSA; Paddy and Jowar are
the major crops. The district is
endowed with a vast canal irrigated
area and the NIA is 42 per cent. But
despite this, per capita food grains
produced is very less indicating low
productivity in the district. The
households are also dependent on
allied activities and alternative
employment sources for
supplementing their livelihood
options.
With respect to work characteri-
stics, the growth of workers is
comparable to that at the state level.
While the number of main workers
has grown at 18 per cent, that of
marginal workers has declined by
4 per cent. Female workers have
recorded higher growth in the main
category, but decelerated in
marginal category. Significantly,
the non-workers ratio has declined
throughout the district and steeply
for females; and in urban areas.
268
Raichur District Human Development Report 2014
The urban workforce has grown at
a faster rate than the rural
workforce. Among taluks,
Devadurga and Lingsugur have
registered very high growth of
workers, especially in rural areas.
Although generally females are
facing declining work
opportunities or greater degree of
unemployment; in urban areas the
employment opportunities to
women are increasing.
Work participation rate is relatively
higher in the district. Low literacy
and low non-agricultural
development implies that is more of
a distress driven participation,
more so in backward taluks like
Devadurga, Manvi and Sindhnur.
To support this argument, if the
proportion of workers engaged in
agriculture as cultivators and
agricultural laborers, it comes to
nearly 80 per cent in Manvi and
Devadurga; 74 per cent in
Sindhnur and 67 per cent in
Lingsugur. Diversification into
non-agriculture is non-existent in
the district.
The percentage of workers engaged
in agricultural activities is
declining but still high in taluks of
Devadurga and Manvi. Low level of
urbanization has slackened the
diversification of the occupational
structure. Agricultural labour is the
single largest employment option
in the rural areas of Raichur
district.
The data shows that 37.3 per cent
of households were issued job cards
by 31-3-2012, but the average
number of person days worked
amounts to a mere 36 days per
household. Participation by the ST
households was lower. With
migration being still extensive,
MGNREGS has not performed as
expected in the district.
12.2.2.4. Quality of Living
The condition with respect to
housing, amenities and assets is
very deplorable in Raichur District.
Except Raichur taluk, in all others,
the percentage of households living
in non-pucca houses is more than
two-thirds. The proportion of site-
less households is more than 10 per
cent in Devadurga, Manvi and
Sindhnur taluks. Hence, housing
schemes have to be vigorously
implemented in Devadurga,
Lingsugur, Manvi and Sindhnur
taluks.
Very less proportion of the
households uses clean/modern
cooking fuel. It is as low as hardly
5 per cent in Devadurga taluk and
the highest is in Raichur taluk at
25 per cent. Except Raichur very
less households have access to safe
drinking water, the situation being
worse in Manvi, Sindhnur and
Devadurga. Sanitation is in a worst
condition as access to toilets is
paltry. Raichur taluk which has the
highest proportion of households
having access to toilets has hardly
about one-third households
possessing toilets and in the
remaining taluks 77 to 93 per cent
of households do not possess toilets,
which is a distressing picture. With
269
Way Forward
respect to drainage also, the
condition is not different with less
than one-third households
reporting access to drainage in all
taluks except Raichur, where it is
more than half. Hence, the burden
of provision of providing basic
amenities is very high. This is what
is to be emphasized in the days to
come, especially in Devadurga,
Manvi, Sindhnur and Lingsugur
taluks. Adequate water and
sanitation, if stressed, will also
improve health, productivity and
livelihood of the people of Raichur
district. Possibilities of using
alternative energy sources like
solar power may be explored
because even as late as 2011 more
than 10 per cent of households did
not have access to electricity in the
district.
If ownership of assets like
Telephone, TV, 2 wheelers and
4wheelers means prosperity, then
nearly one-fourth of households in
Devadurga and Lingsugur; and
one-fifth of households in Manvi
did not own any of these assets; in
Raichur and Sindhnur this
proportion was about 15 per cent. If
we can call them ultra poor or
destitutes majority of them live in
Devadurga and Lingsugur.
Immediate attention needs to be
given by increasing employment
and income of these people as well
as by strengthening government
support to these people.
12.2.3. Combined HD Analysis
In HD Raichur and Lingsugur
taluks are relatively developed,
Devadurga and Manvi are least
developed and Sindhnur falls in
the middle level. Gender inequality
is lower in all taluks, but more so
in Lingsugur, Manvi and Sindhnur
taluks. Child development also
does not go with HD status. Raichur
taluk has the highest value for CTDI
and lowest value for CDI. FSI is
lower in all taluks except Raichur
and Sindhnur.
Thus, there seems to be no
compatibility, in general, in the
taluk rankings based on various
indices. The district performs low
in CDDI as it is ranked 29 out of
30.
12.2.4. Regional Disparity of the
present HD situation
The development is not expected to
be uniform. However, as we go
down the regional units, the
disparity is likely to be smaller.
However, HD attainments of taluks
do represent significant
inequalities as already hinted.
Across the various indicators, child
development is highly unequal
followed by human development
itself. Gender inequality is least
unequal across regions followed by
CTDI and FSI. It may be inferred
that while human development is
disparate, gender inequality is
more or less equally spread, despite
overall development also more
evenly spread. Hence, Overall
development has not been
satisfactory and whatever
development has occurred, has
basically bypassed women and
children.
270
Raichur District Human Development Report 2014
12.2.5: The Way Ahead:
1. Future HD Strategy for the
Education Sector
i. Universalize enrolment and
increase enrolment at higher
levels, especially of girls in
taluks like Devadurga and
Manvi.
ii. Investment on improvement of
school infrastructure in all
taluks
iii. Dropout rate still being high
intensification of programmes
for retention and mainstreaming
is necessary in all taluks
iv. Extent of vacancy of teachers at
primary level is 22 per cent and
that at high school level is 14
per cent, this immediately needs
to be corrected. Appointment of
more number of female teachers
to attract all girl children
v. Coaching to rural students for
SSLC and PUC examinations
2. Future HD strategy for Health
Sector
i. Steps to reduce MMR by
attacking anaemia through
adequate supplementary
nutrition in all taluks
ii. Reducing IMR and CMR by
strengthening RCH services in
PHCs
iii. Increasing the awareness about
use of contraceptives, this may
be added as a part of ‘Arogya
Kavacha’
iv. Appointing more number of
doctors and other health
personnel and motivating them
to work in rural areas
3. Future HD Strategy for
Livelihood Sector
i. Increasing agricultural
productivity, especially in the
irrigated areas through better
water management;
ii. Promoting non-agricultural
avenues of employment in rural
areas of all taluks
iii. Incentives and sanctions for
construction of toilets in all
taluks
iv. Provision of treated and safe
drinking water throughout the
district has to be a priority
4. Future HD Strategy for Dalits,
Tribals, and Minorities
i. Measures to reduce fertility
rates among SC and ST
communities by providing
extended RCH services to them.
ii. Encouraging enrolment,
attendance and transition to
higher grades of children of
these sections and
discouraging dropping out of
school
iii. Promoting non-farm
diversification by encouraging
them to start enterprises/
businesses of their own
iv. Increasing the number of
personnel form SC/ST
271
Way Forward
communities in social sectors
like education and health
v. Promoting women
organizations of these sections
for socio-economic
empowerment
vi. Enhancing awareness about
the schemes and benefits; if
necessary separate gram sabhas
and such other meetings for
review of these programmes
should be organized
5. Future HD Strategy for Gender
Development
i. Focus on enhancing female
literacy rate in all taluks
ii. Promoting non-agricultural
avenues of employment for
women through skill
development
iii. Ensure that all SHGs are active
and set up many more such
groups
iv. Provision of facilities necessary
for starting and running of
enterprises by women
v. Increasing lady police strength
to tackle increasing crimes
against women
vi. Enhancing social security of
women
6. HD Strategy for other sectors
6.1. Children
i. Raichur having one of the
highest incidence of
malnourishment, immediate
steps should be initiated to
enhance nutritional support to
children, pregnant women and
lactating mothers.
ii. Increasing the number of AWCs
and strengthening them with
basic amenities
6.2. Urban issues
i. Controlling the growth of slums
ii. Improving road facilities,
surveillance facilities and
police strength in all ULBs to
control crimes and reduce
incidence of accidents
iii. Investment in treating liquid
and solid wastes
iv. Measures to increase own
resource mobilization and so
that ULBs are able to spend more
on basic amenities.
6.3. Governance
i. In the wake of Article 371 (j)
status, vacancies need to be
filled up
ii. Regular training of officials and
staff to make them sensitive to
the the needs of women,
children and disadvantaged
sections as well as using the
new technology
iii. Awareness generation for
people to be strengthened to
enable them to participate in
decision making
iv. Seeking avenues for public
private partnership in
implementation of human
development activities
v. Ensuring complete utilization
of grants towards HD activities
272
Raichur District Human Development Report 2014
12.3 Concluding Remarks
Raichur district is a manifestation
of multiple deprivations which is
reflected in lower level of DCDI and
still lower levels of HD. The causes
for this deplorable situation are not
far to seek. The district’s weather
conditions are adverse not allowing
the people to be employed
throughout the year. In fact,
migration is still unabated from
parts of Devadurga and Lingsugur
to distant cities. With livelihood still
being rural and agri-related, the
low agricultural productivity has
kept them poor and
undernourished. It is, therefore, not
surprising that mortality rates are
among the highest in the state.
Within the rural economy there is
hardly any non-agricultural
development. Of course skills
required for non-agricultural
enterprises are not built and the
infrastructure is also inadequate to
support them. Therefore,
agricultural labour is the
predominant occupation which is
not only casual, but also less
remunerative.
A four-fold strategy could be
suggested for higher HD in Raichur
district comprising of:
i. Accelerating job creation: In order
to absorb the increasing working-
age population, rising WPR and
expected reduction in agriculture’s
share of employment. Non-farm
sector is a very promising area with
construction and natural resource
development being the better
options for unskilled labour. Rural
industries and services also need
to be promoted. Suitable jobs for
females in urban areas also need
to be generated. For this purpose
widening literacy and deepening
skill base are important.
ii. Raising farm productivity:
Increase in investment in
agricultural infrastructure,
research and extension services,
will help in raising the farm yields.
Especially in Raichur, water
management needs to be
emphasized. Gains in agricultural
productivity would also accelerate
the transition of labour to more
productive non-farm jobs.
iii. Strengthening basic services:
A higher HD is not possible without
making available the basic
amenities to as large a population
as possible. This assumes a lot of
significance in Raichur as it is
significantly poor with regard to the
accessibility of basic services.
Priority needs to be assigned to
provision of good housing, safe
drinking water and sanitation in all
parts of the district. Health and
educational services should also
be part of this initiative.
iv. Effective delivery of the basic
services: Creation of basic services
is one thing and making them
available to the intended
beneficiaries is another.
273
Way Forward
Governance holds the key here.
Especially, in Raichur district
illiteracy being high, the
government machinery has to take
lead in making these services used
by the people. In this regard, best
practices and innovative examples
can be adopted. Some of the most
promising strategies include
forming partnerships with the
private and social sectors,
mobilising community
participation, and using
technology to streamline and
monitor operations. Appointment of
adequate staff is also an important
precondition in Raichur’s
development.
274
Raichur District Human Development Report 2014

ANNEXURES

.
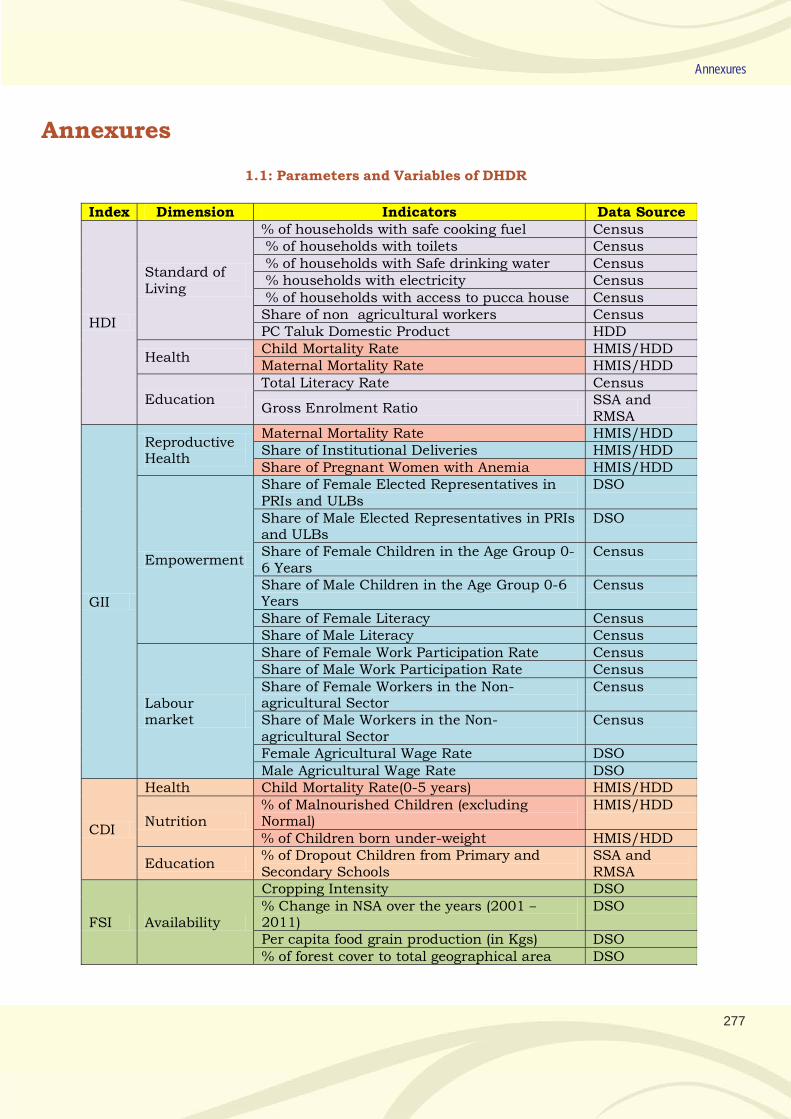
277
Annexures
Annexures
Index Dimension Indicators Data Source
HDI
Standard of Living
% of households with safe cooking fuel Census % of households with toilets Census % of households with Safe drinking water Census % households with electricity Census % of households with access to pucca house Census Share of non agricultural workers Census PC Taluk Domestic Product HDD
Health Child Mortality Rate HMIS/HDD Maternal Mortality Rate HMIS/HDD
Education Total Literacy Rate Census
Gross Enrolment Ratio SSA and RMSA
GII
Reproductive Health
Maternal Mortality Rate HMIS/HDD Share of Institutional Deliveries HMIS/HDD Share of Pregnant Women with Anemia HMIS/HDD
Empowerment
Share of Female Elected Representatives in PRIs and ULBs
DSO
Share of Male Elected Representatives in PRIs and ULBs
DSO
Share of Female Children in the Age Group 0-6 Years
Census
Share of Male Children in the Age Group 0-6 Years
Census
Share of Female Literacy Census Share of Male Literacy Census
Labour market
Share of Female Work Participation Rate Census Share of Male Work Participation Rate Census Share of Female Workers in the Non-agricultural Sector
Census
Share of Male Workers in the Non-agricultural Sector
Census
Female Agricultural Wage Rate DSO Male Agricultural Wage Rate DSO
CDI
Health Child Mortality Rate(0-5 years) HMIS/HDD
Nutrition % of Malnourished Children (excluding Normal)
HMIS/HDD
% of Children born under-weight HMIS/HDD
Education % of Dropout Children from Primary and Secondary Schools
SSA and RMSA
FSI Availability
Cropping Intensity DSO % Change in NSA over the years (2001 – 2011)
DSO
Per capita food grain production (in Kgs) DSO % of forest cover to total geographical area DSO
1.1: Parameters and Variables of DHDR
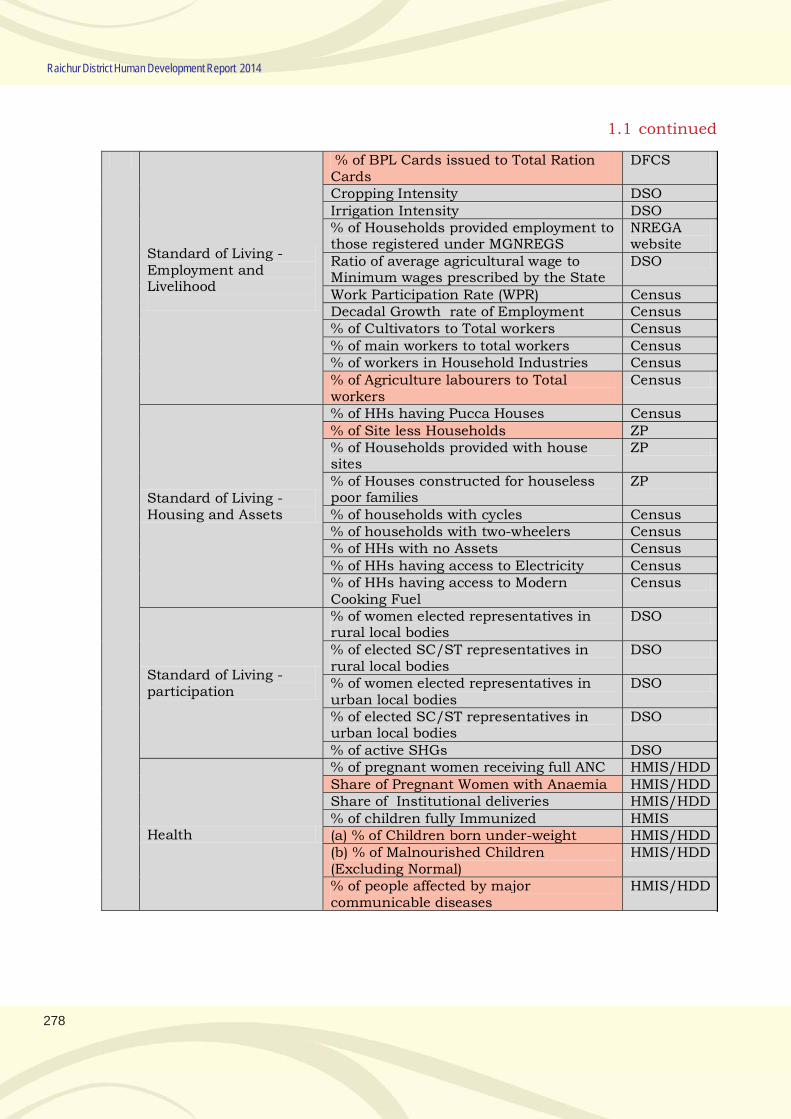
278
Raichur District Human Development Report 2014
Standard of Living - Employment and Livelihood
% of BPL Cards issued to Total Ration Cards
DFCS
Cropping Intensity DSO Irrigation Intensity DSO % of Households provided employment to those registered under MGNREGS
NREGA website
Ratio of average agricultural wage to Minimum wages prescribed by the State
DSO
Work Participation Rate (WPR) Census Decadal Growth rate of Employment Census % of Cultivators to Total workers Census % of main workers to total workers Census % of workers in Household Industries Census % of Agriculture labourers to Total workers
Census
Standard of Living - Housing and Assets
% of HHs having Pucca Houses Census % of Site less Households ZP % of Households provided with house sites
ZP
% of Houses constructed for houseless poor families
ZP
% of households with cycles Census % of households with two-wheelers Census % of HHs with no Assets Census % of HHs having access to Electricity Census % of HHs having access to Modern Cooking Fuel
Census
Standard of Living - participation
% of women elected representatives in rural local bodies
DSO
% of elected SC/ST representatives in rural local bodies
DSO
% of women elected representatives in urban local bodies
DSO
% of elected SC/ST representatives in urban local bodies
DSO
% of active SHGs DSO
Health
% of pregnant women receiving full ANC HMIS/HDD Share of Pregnant Women with Anaemia HMIS/HDD Share of Institutional deliveries HMIS/HDD % of children fully Immunized HMIS (a) % of Children born under-weight HMIS/HDD (b) % of Malnourished Children (Excluding Normal)
HMIS/HDD
% of people affected by major communicable diseases
HMIS/HDD
1.1 continued
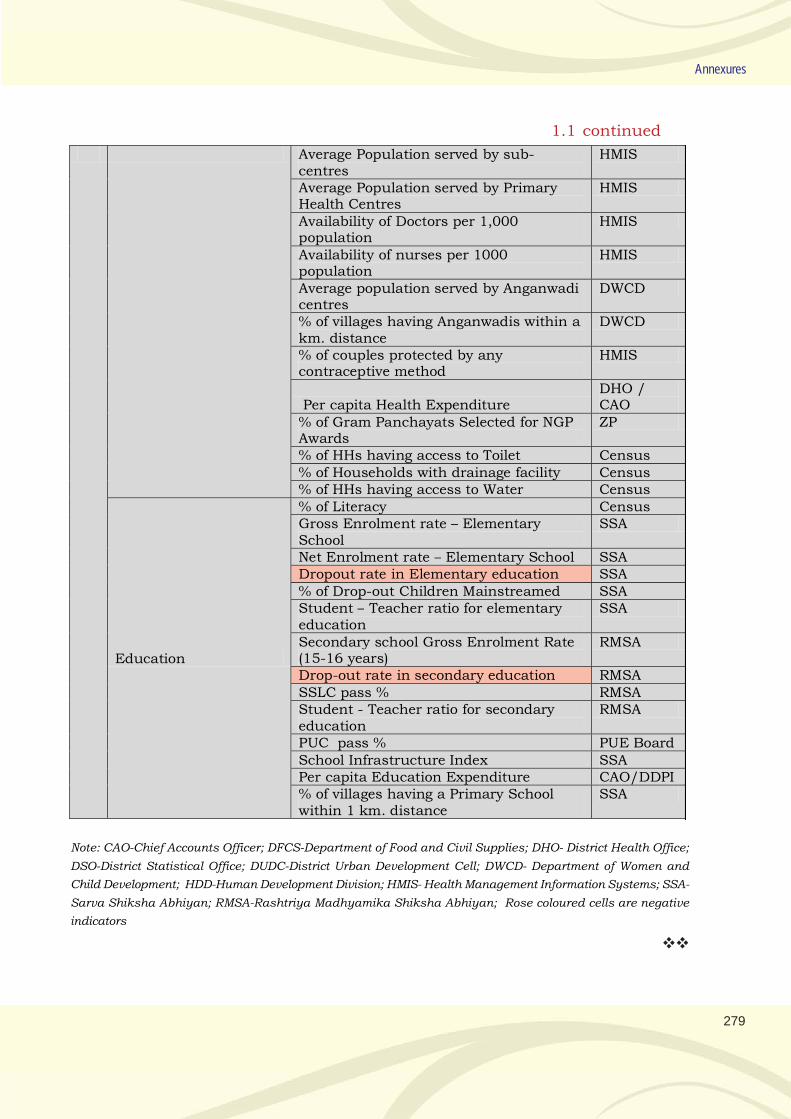
279
Annexures
Average Population served by sub-centres
HMIS
Average Population served by Primary Health Centres
HMIS
Availability of Doctors per 1,000 population
HMIS
Availability of nurses per 1000 population
HMIS
Average population served by Anganwadi centres
DWCD
% of villages having Anganwadis within a km. distance
DWCD
% of couples protected by any contraceptive method
HMIS
Per capita Health Expenditure DHO / CAO
% of Gram Panchayats Selected for NGP Awards
ZP
% of HHs having access to Toilet Census % of Households with drainage facility Census % of HHs having access to Water Census
Education
% of Literacy Census Gross Enrolment rate – Elementary School
SSA
Net Enrolment rate – Elementary School SSA Dropout rate in Elementary education SSA % of Drop-out Children Mainstreamed SSA Student – Teacher ratio for elementary education
SSA
Secondary school Gross Enrolment Rate (15-16 years)
RMSA
Drop-out rate in secondary education RMSA SSLC pass % RMSA Student - Teacher ratio for secondary education
RMSA
PUC pass % PUE Board School Infrastructure Index SSA Per capita Education Expenditure CAO/DDPI % of villages having a Primary School within 1 km. distance
SSA
Note: CAO-Chief Accounts Officer; DFCS-Department of Food and Civil Supplies; DHO- District Health Office;
DSO-District Statistical Office; DUDC-District Urban Development Cell; DWCD- Department of Women and
Child Development; HDD-Human Development Division; HMIS- Health Management Information Systems; SSA-
Sarva Shiksha Abhiyan; RMSA-Rashtriya Madhyamika Shiksha Abhiyan; Rose coloured cells are negative
indicators
1.1 continued
280
Raichur District Human Development Report 2014
1.2: Note on Estimation of IMR, CMR and MMR
There are two types of service
statistics on mortality are available
with the Department of Health,
Karnataka (DHO). First, the data
provided by the respective health
institutions and entered into the
Health Management Information
System (HMIS) portal. Because this
is a facility based reporting, the
mortality indicators are higher in
those districts and sub-districts
with more facilities and does not
represent the performance of a
particular area. Moreover, the
facilities not reporting the deaths as
well as the deaths taking place at
home will not become part of the
HMIS in most cases. Second, the
mortality information is also
maintained for respective
geographical area based on the
ANM reporting. This is found to be
grossly underestimated. Thirdly,
the Civil Registration System (CRS)
also provide data on mortality. The
analysis of this data also showed
gross underestimate particularly
the infant mortality rate (IMR), child
mortality rate (CMR) and maternal
mortality ratio (MMR). Thus it is
essential to rework the estimates by
adjusting for underestimation to
find out the real IMR and MMR in
different regions of Karnataka.
SRS estimates on mortality
indicators are widely accepted but
they are available only at State
levels. Reliable estimate of IMR at
the district level are available only
from 2001 census. As the District
level Human Development Reports
(DHDR) requires district and sub-
district level estimates of these
indicators, a method is developed
to provide reasonable quality
estimates of IMR, CMR and MMR at
the district and sub-district level.
Methodology
Indirect estimates of infant and
child mortality is feasible using the
information on children ever born
and children surviving by age of
the mother from surveys and
census. The census estimates of
IMR and CMR are based on this
information. District Level
Household Surveys (DLHS)
conducted in 2007-08 have
collected this information. Ram et
al (2013) have already estimated
neonatal mortality rate and CMR
using this information and
adjusted the estimate for the year
2012 using a ratio method of
distributing the total deaths
computed for India to states and
districts. But the estimates they
used are from the UN estimate of
neonatal and child mortality for
India for the year 2012.
Ratio method is adopted here for
estimating district and sub-district
IMR, CMR and MMR for Karnataka.
We have used the SRS estimate of
IMR, CMR and MMR for Karnataka
and distributed the corresponding
deaths across district and sub-
districts. First, the IMR, CMR and
MMR for Karnataka are obtained
from SRS for the period 2011 which
281
Annexures
has been 35, 40 and 144
respectively. Second, the same
number of deaths have been
distributed across districts using
ratio method. The ratio is obtained
considering the neonatal and CMR
estimated by Ram et al (2013)
across districts of Karnataka. For
distributing IMR and CMR, data
from Ram et al (2013) on CMR is
used while for MMR the neonatal
mortality rate from the same source
is used. Thus we have computed the
IMR, CMR and MMR across districts
of Karnataka considering that the
state level is same as the SRS
figures for 2011. Third, the
corresponding district IMR, CMR
and MMR are distributed across
sub-districts using ratio method.
The ratio is obtained from the data
gathered from the DHO on these
three indicators across sub-
districts. Thus the IMR, CMR and
MMR obtained from DHO have been
adjusted upward to match with the
district IMR, CMR and MMR
computed for the district based on
the similar methodology.
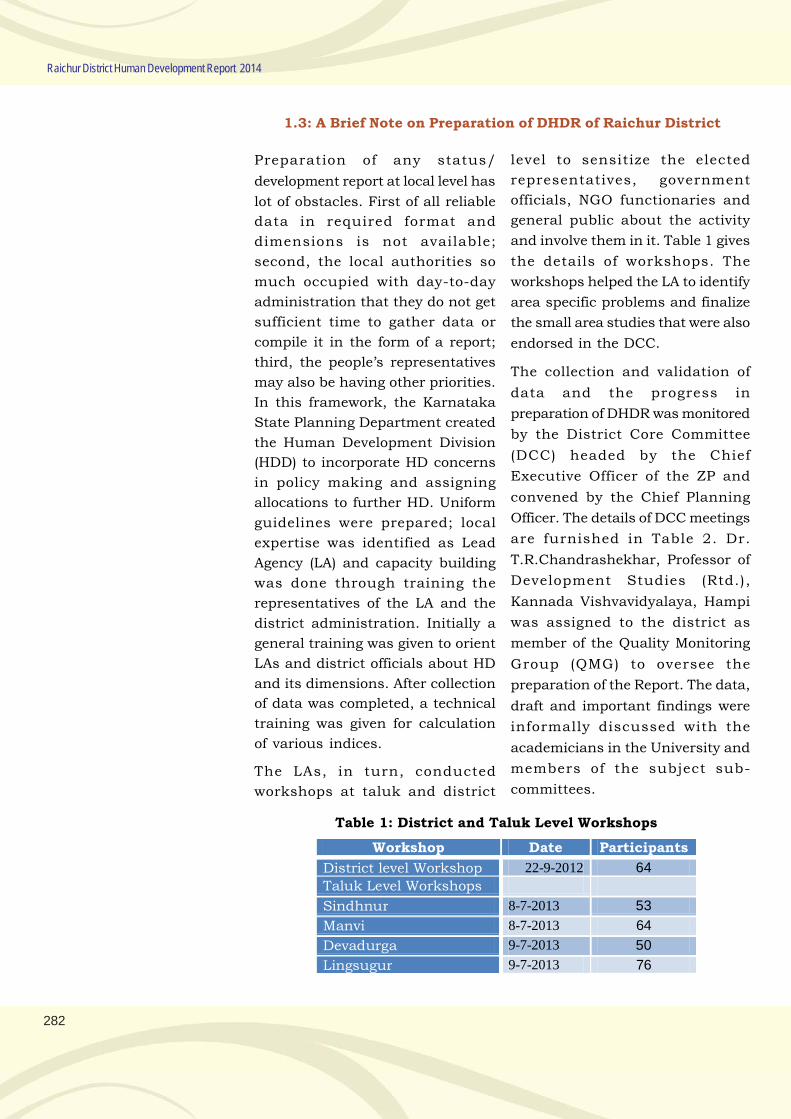
282
Raichur District Human Development Report 2014
1.3: A Brief Note on Preparation of DHDR of Raichur District
Preparation of any status/
development report at local level has
lot of obstacles. First of all reliable
data in required format and
dimensions is not available;
second, the local authorities so
much occupied with day-to-day
administration that they do not get
sufficient time to gather data or
compile it in the form of a report;
third, the people’s representatives
may also be having other priorities.
In this framework, the Karnataka
State Planning Department created
the Human Development Division
(HDD) to incorporate HD concerns
in policy making and assigning
allocations to further HD. Uniform
guidelines were prepared; local
expertise was identified as Lead
Agency (LA) and capacity building
was done through training the
representatives of the LA and the
district administration. Initially a
general training was given to orient
LAs and district officials about HD
and its dimensions. After collection
of data was completed, a technical
training was given for calculation
of various indices.
The LAs, in turn, conducted
workshops at taluk and district
Table 1: District and Taluk Level Workshops
Workshop Date Participants
District level Workshop 22-9-2012 64
Taluk Level Workshops
Sindhnur 8-7-2013 53
Manvi 8-7-2013 64
Devadurga 9-7-2013 50
Lingsugur 9-7-2013 76
level to sensitize the elected
representatives, government
officials, NGO functionaries and
general public about the activity
and involve them in it. Table 1 gives
the details of workshops. The
workshops helped the LA to identify
area specific problems and finalize
the small area studies that were also
endorsed in the DCC.
The collection and validation of
data and the progress in
preparation of DHDR was monitored
by the District Core Committee
(DCC) headed by the Chief
Executive Officer of the ZP and
convened by the Chief Planning
Officer. The details of DCC meetings
are furnished in Table 2. Dr.
T.R.Chandrashekhar, Professor of
Development Studies (Rtd.),
Kannada Vishvavidyalaya, Hampi
was assigned to the district as
member of the Quality Monitoring
Group (QMG) to oversee the
preparation of the Report. The data,
draft and important findings were
informally discussed with the
academicians in the University and
members of the subject sub-
committees.
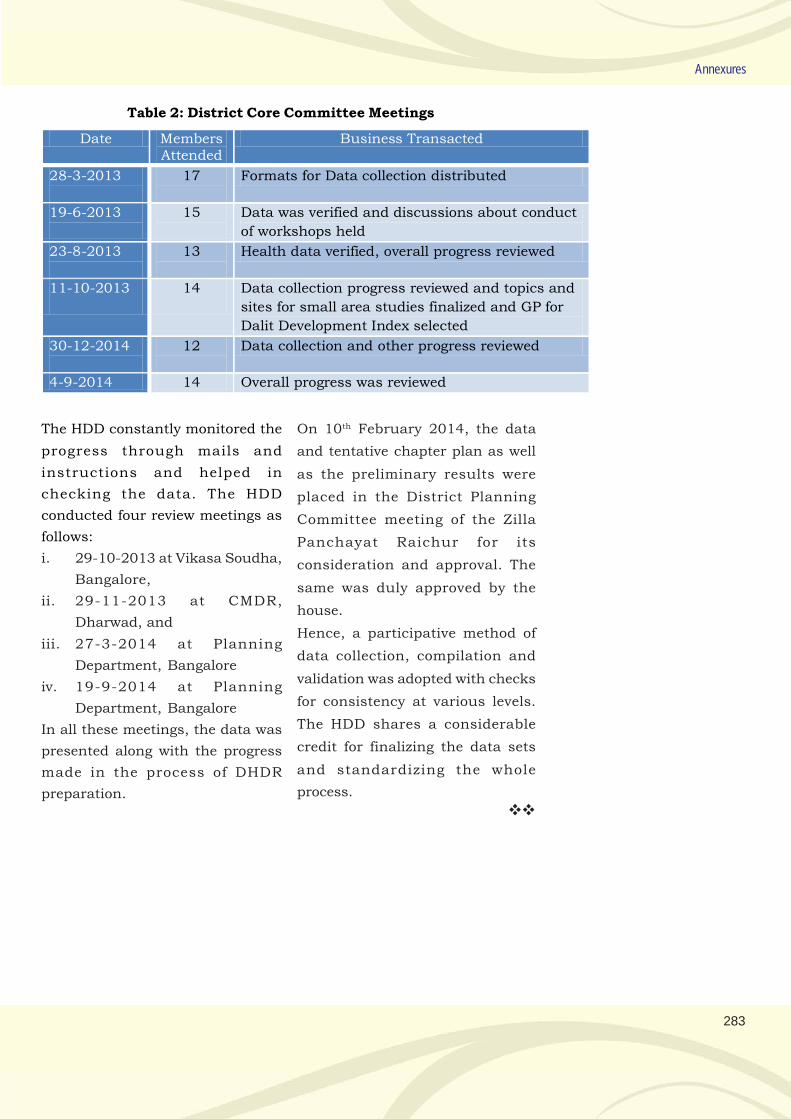
283
Annexures
Table 2: District Core Committee Meetings
Date Members Attended
Business Transacted
28-3-2013
17
Formats for Data collection distributed
19-6-2013
15
Data was verified and discussions about conduct
of workshops held
23-8-2013
13
Health data verified, overall progress reviewed
11-10-2013
14
Data collection progress reviewed and topics and
sites for small area studies finalized and GP for
Dalit Development Index selected
30-12-2014
12
Data collection and other progress reviewed
4-9-2014 14 Overall progress was reviewed
The HDD constantly monitored the
progress through mails and
instructions and helped in
checking the data. The HDD
conducted four review meetings as
follows:
i. 29-10-2013 at Vikasa Soudha,
Bangalore,
ii. 29-11-2013 at CMDR,
Dharwad, and
iii. 27-3-2014 at Planning
Department, Bangalore
iv. 19-9-2014 at Planning
Department, Bangalore
In all these meetings, the data was
presented along with the progress
made in the process of DHDR
preparation.
On 10th February 2014, the data
and tentative chapter plan as well
as the preliminary results were
placed in the District Planning
Committee meeting of the Zilla
Panchayat Raichur for its
consideration and approval. The
same was duly approved by the
house.
Hence, a participative method of
data collection, compilation and
validation was adopted with checks
for consistency at various levels.
The HDD shares a considerable
credit for finalizing the data sets
and standardizing the whole
process.
284
Raichur District Human Development Report 2014
1.4: Data Quality and Limitations
For a study of this kind huge
amount of data is necessary on
demography, health, education,
livelihood and other issues
disaggreagated by residence,
gender and social groups. The
database available at the district
and taluk levels has some
limitations to serve the purpose in
a satisfactory manner.
i. The census data is
predominantly used and by
and large it is reliable but not
all details are available for the
year 2011.
ii. The education data as available
in DISE (SSA) and RMSA
documents has improved a lot
but there is some
inconsistency in terms of
census of children and hence
enrolment ratios. Similar is the
case with out of school children
and child labour. It was later
reconciled with the help of
education department and
labour department officials.
iii. There is a tendency to
misreport mortality rates and
it was corrected by the data
given by the HDD
iv. In many cases, data by rural-
urban; male-female and social
group categorization is not
available and, it remains a
valid limitation and it needs to
be improved in the future
v. Taluk level data on landless
households is difficult to get,
hence only district level data
is used.
vi. The District Statistical Office is
successful in generating
substantial data but it needs to
focus on disaggregations for a
better analysis.
The overall impression is that the
availability of data has improved but
efforts have to be made to compile
and publish it for general reference.
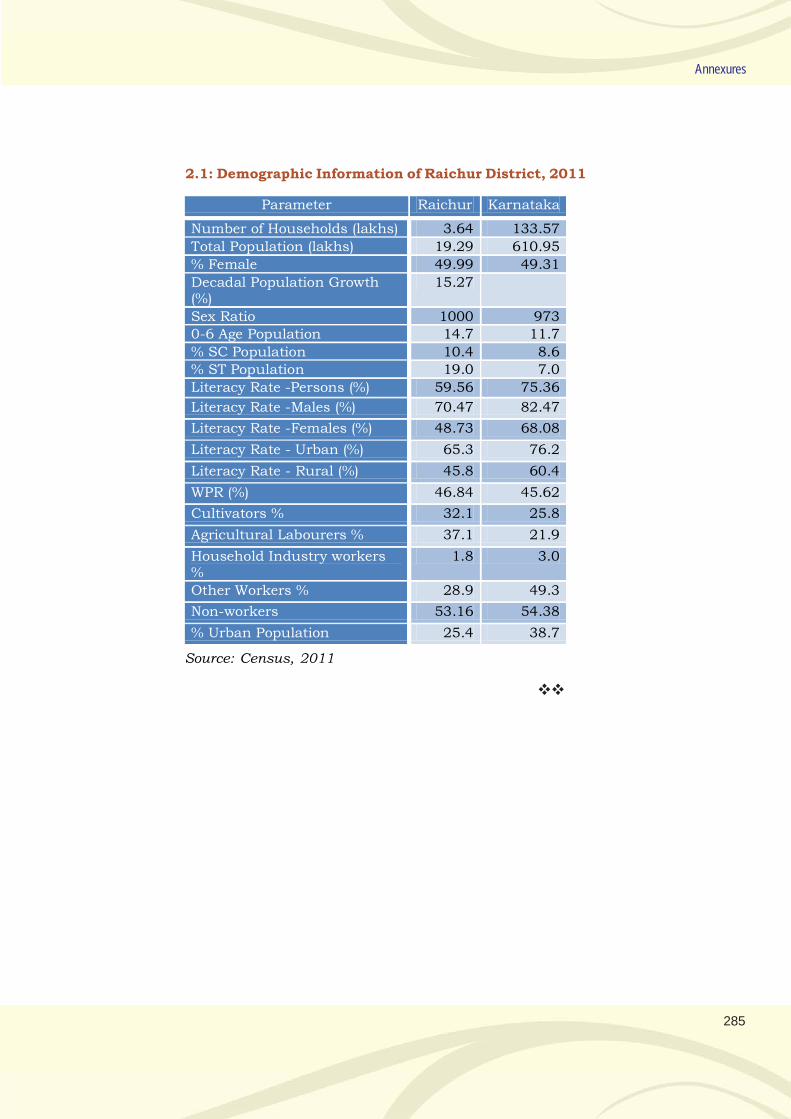
285
Annexures
2.1: Demographic Information of Raichur District, 2011
Parameter Raichur Karnataka
Number of Households (lakhs) 3.64 133.57
Total Population (lakhs) 19.29 610.95
% Female 49.99 49.31
Decadal Population Growth (%)
15.27
Sex Ratio 1000 973 0-6 Age Population 14.7 11.7
% SC Population 10.4 8.6 % ST Population 19.0 7.0
Literacy Rate -Persons (%) 59.56 75.36
Literacy Rate -Males (%) 70.47 82.47
Literacy Rate -Females (%) 48.73 68.08
Literacy Rate - Urban (%) 65.3 76.2
Literacy Rate - Rural (%) 45.8 60.4
WPR (%) 46.84 45.62
Cultivators % 32.1 25.8
Agricultural Labourers % 37.1 21.9
Household Industry workers %
1.8 3.0
Other Workers % 28.9 49.3
Non-workers 53.16 54.38
% Urban Population 25.4 38.7
Source: Census, 2011
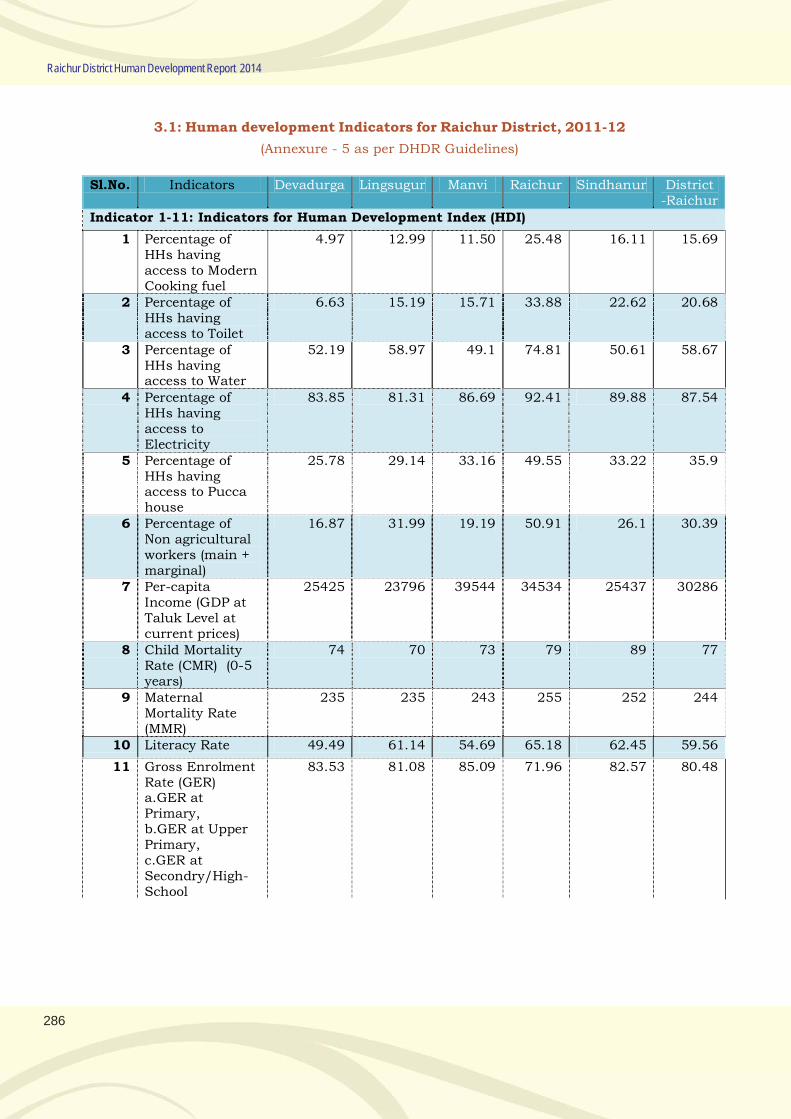
286
Raichur District Human Development Report 2014
3.1: Human development Indicators for Raichur District, 2011-12
(Annexure - 5 as per DHDR Guidelines)
Sl.No. Indicators Devadurga Lingsugur Manvi Raichur Sindhanur District -Raichur
Indicator 1-11: Indicators for Human Development Index (HDI)
1 Percentage of HHs having access to Modern Cooking fuel
4.97 12.99 11.50 25.48 16.11 15.69
2 Percentage of HHs having access to Toilet
6.63 15.19 15.71 33.88 22.62 20.68
3 Percentage of HHs having access to Water
52.19 58.97 49.1 74.81 50.61 58.67
4 Percentage of HHs having access to Electricity
83.85 81.31 86.69 92.41 89.88 87.54
5 Percentage of HHs having access to Pucca house
25.78 29.14 33.16 49.55 33.22 35.9
6 Percentage of Non agricultural workers (main + marginal)
16.87 31.99 19.19 50.91 26.1 30.39
7 Per-capita Income (GDP at Taluk Level at current prices)
25425 23796 39544 34534 25437 30286
8 Child Mortality Rate (CMR) (0-5 years)
74 70 73 79 89 77
9 Maternal Mortality Rate (MMR)
235 235 243 255 252 244
10 Literacy Rate 49.49 61.14 54.69 65.18 62.45 59.56
11 Gross Enrolment Rate (GER) a.GER at Primary, b.GER at Upper Primary, c.GER at Secondry/High-School
83.53 81.08 85.09 71.96 82.57 80.48
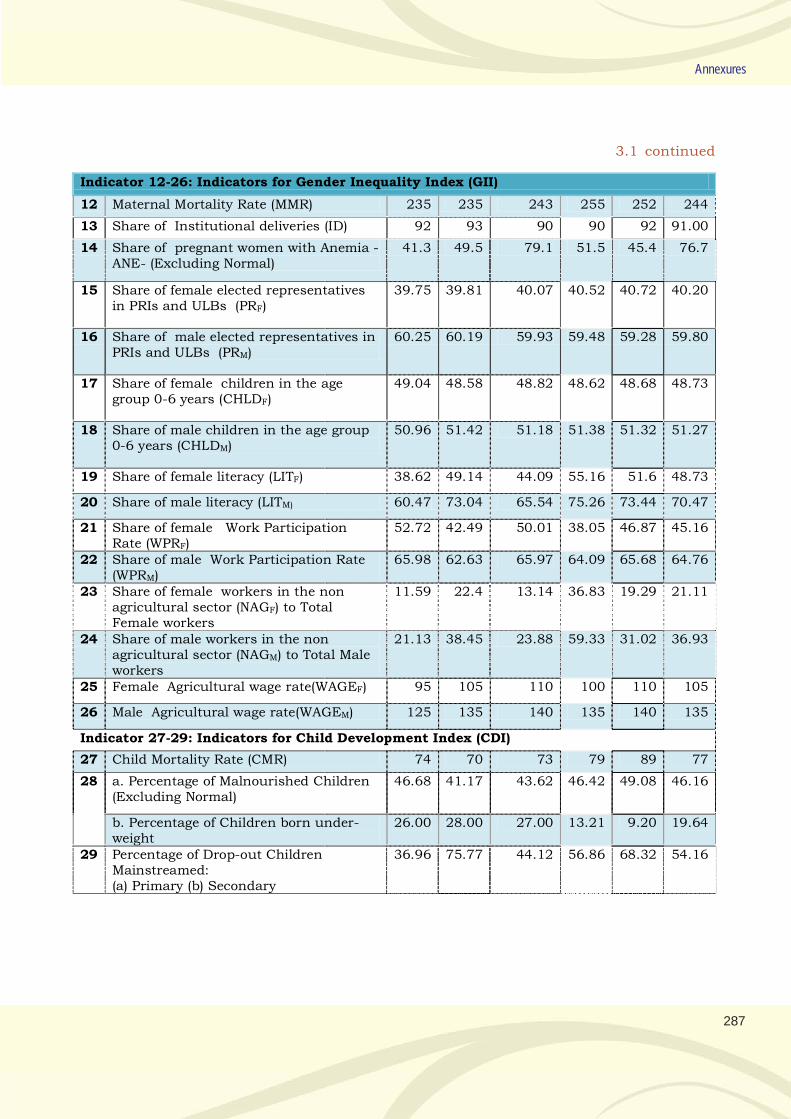
287
Annexures
Indicator 12-26: Indicators for Gender Inequality Index (GII)
12 Maternal Mortality Rate (MMR) 235 235 243 255 252 244
13 Share of Institutional deliveries (ID) 92 93 90 90 92 91.00
14 Share of pregnant women with Anemia -ANE- (Excluding Normal)
41.3 49.5 79.1 51.5 45.4 76.7
15 Share of female elected representatives in PRIs and ULBs (PRF)
39.75 39.81 40.07 40.52 40.72 40.20
16 Share of male elected representatives in PRIs and ULBs (PRM)
60.25 60.19 59.93 59.48 59.28 59.80
17 Share of female children in the age group 0-6 years (CHLDF)
49.04 48.58 48.82 48.62 48.68 48.73
18 Share of male children in the age group 0-6 years (CHLDM)
50.96 51.42 51.18 51.38 51.32 51.27
19 Share of female literacy (LITF) 38.62 49.14 44.09 55.16 51.6 48.73
20 Share of male literacy (LITM) 60.47 73.04 65.54 75.26 73.44 70.47
21 Share of female Work Participation Rate (WPRF)
52.72 42.49 50.01 38.05 46.87 45.16
22 Share of male Work Participation Rate (WPRM)
65.98 62.63 65.97 64.09 65.68 64.76
23 Share of female workers in the non agricultural sector (NAGF) to Total Female workers
11.59 22.4 13.14 36.83 19.29 21.11
24 Share of male workers in the non agricultural sector (NAGM) to Total Male workers
21.13 38.45 23.88 59.33 31.02 36.93
25 Female Agricultural wage rate(WAGEF) 95 105 110 100 110 105
26 Male Agricultural wage rate(WAGEM) 125 135 140 135 140 135
Indicator 27-29: Indicators for Child Development Index (CDI)
27 Child Mortality Rate (CMR) 74 70 73 79 89 77
28 a. Percentage of Malnourished Children (Excluding Normal)
46.68 41.17 43.62 46.42 49.08 46.16
b. Percentage of Children born under-weight
26.00 28.00 27.00 13.21 9.20 19.64
29 Percentage of Drop-out Children Mainstreamed: (a) Primary (b) Secondary
36.96 75.77 44.12 56.86 68.32 54.16
3.1 continued
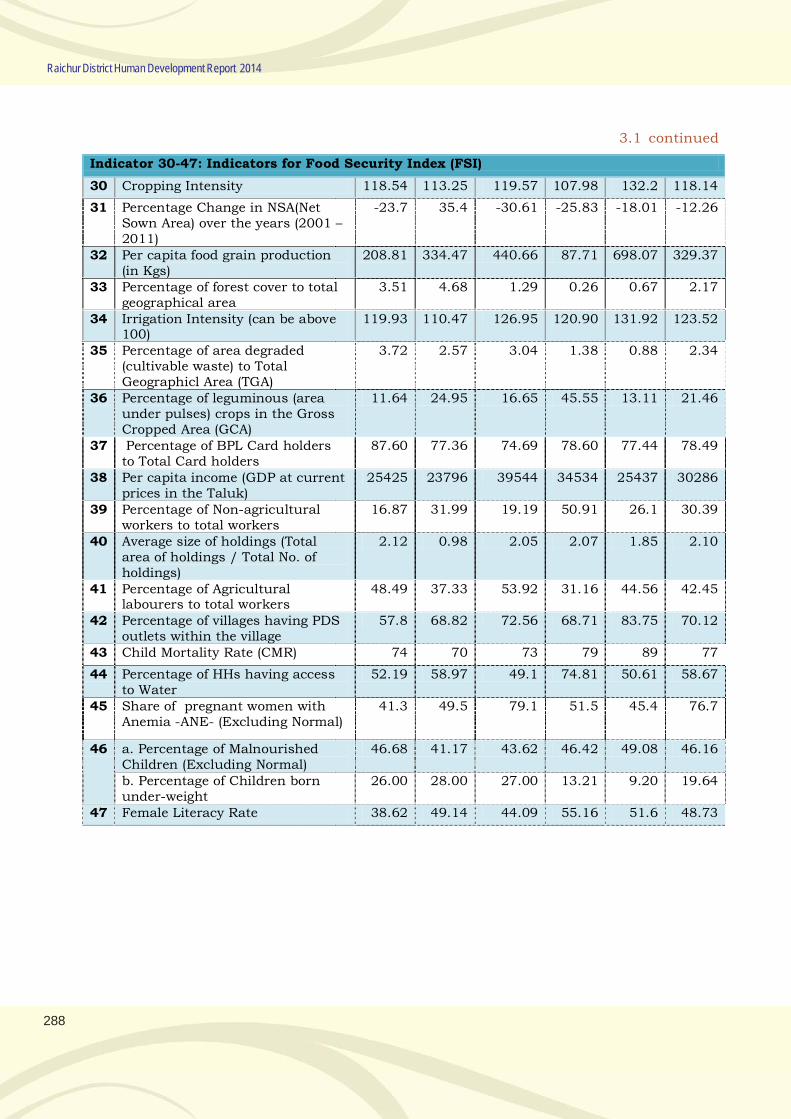
288
Raichur District Human Development Report 2014
Indicator 30-47: Indicators for Food Security Index (FSI)
30 Cropping Intensity 118.54 113.25 119.57 107.98 132.2 118.14
31 Percentage Change in NSA(Net Sown Area) over the years (2001 – 2011)
-23.7 35.4 -30.61 -25.83 -18.01 -12.26
32 Per capita food grain production (in Kgs)
208.81 334.47 440.66 87.71 698.07 329.37
33 Percentage of forest cover to total geographical area
3.51 4.68 1.29 0.26 0.67 2.17
34 Irrigation Intensity (can be above 100)
119.93 110.47 126.95 120.90 131.92 123.52
35 Percentage of area degraded (cultivable waste) to Total Geographicl Area (TGA)
3.72 2.57 3.04 1.38 0.88 2.34
36 Percentage of leguminous (area under pulses) crops in the Gross Cropped Area (GCA)
11.64 24.95 16.65 45.55 13.11 21.46
37 Percentage of BPL Card holders to Total Card holders
87.60 77.36 74.69 78.60 77.44 78.49
38 Per capita income (GDP at current prices in the Taluk)
25425 23796 39544 34534 25437 30286
39 Percentage of Non-agricultural workers to total workers
16.87 31.99 19.19 50.91 26.1 30.39
40 Average size of holdings (Total area of holdings / Total No. of holdings)
2.12 0.98 2.05 2.07 1.85 2.10
41 Percentage of Agricultural labourers to total workers
48.49 37.33 53.92 31.16 44.56 42.45
42 Percentage of villages having PDS outlets within the village
57.8 68.82 72.56 68.71 83.75 70.12
43 Child Mortality Rate (CMR) 74 70 73 79 89 77
44 Percentage of HHs having access to Water
52.19 58.97 49.1 74.81 50.61 58.67
45 Share of pregnant women with Anemia -ANE- (Excluding Normal)
41.3 49.5 79.1 51.5 45.4 76.7
46 a. Percentage of Malnourished Children (Excluding Normal)
46.68 41.17 43.62 46.42 49.08 46.16
b. Percentage of Children born under-weight
26.00 28.00 27.00 13.21 9.20 19.64
47 Female Literacy Rate 38.62 49.14 44.09 55.16 51.6 48.73
3.1 continued
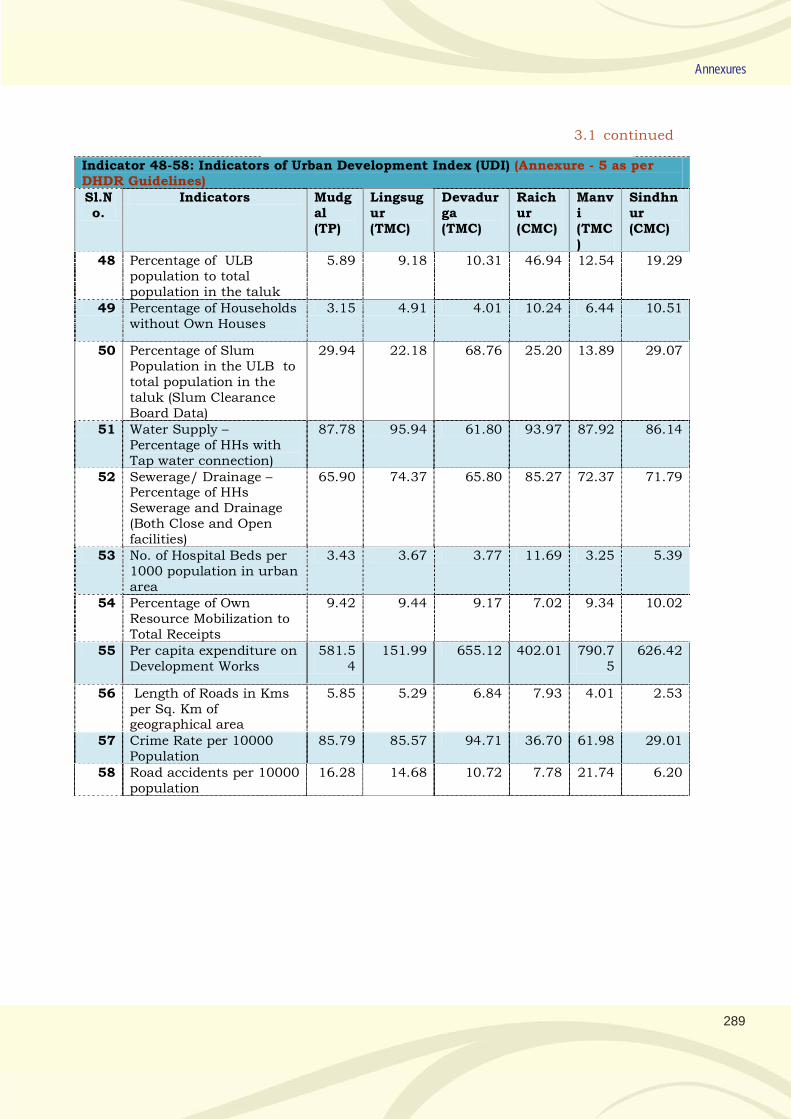
289
Annexures
Indicator 48-58: Indicators of Urban Development Index (UDI) (Annexure - 5 as per DHDR Guidelines) Sl.No.
Indicators Mudgal (TP)
Lingsugur (TMC)
Devadurga (TMC)
Raichur (CMC)
Manvi (TMC)
Sindhnur (CMC)
48 Percentage of ULB population to total population in the taluk
5.89 9.18 10.31 46.94 12.54 19.29
49 Percentage of Households without Own Houses
3.15 4.91 4.01 10.24 6.44 10.51
50 Percentage of Slum Population in the ULB to total population in the taluk (Slum Clearance Board Data)
29.94 22.18 68.76 25.20 13.89 29.07
51 Water Supply – Percentage of HHs with Tap water connection)
87.78 95.94 61.80 93.97 87.92 86.14
52 Sewerage/ Drainage – Percentage of HHs Sewerage and Drainage (Both Close and Open facilities)
65.90 74.37 65.80 85.27 72.37 71.79
53 No. of Hospital Beds per 1000 population in urban area
3.43 3.67 3.77 11.69 3.25 5.39
54 Percentage of Own Resource Mobilization to Total Receipts
9.42 9.44 9.17 7.02 9.34 10.02
55 Per capita expenditure on Development Works
581.54
151.99 655.12 402.01 790.75
626.42
56 Length of Roads in Kms per Sq. Km of geographical area
5.85 5.29 6.84 7.93 4.01 2.53
57 Crime Rate per 10000 Population
85.79 85.57 94.71 36.70 61.98 29.01
58 Road accidents per 10000 population
16.28 14.68 10.72 7.78 21.74 6.20
3.1 continued
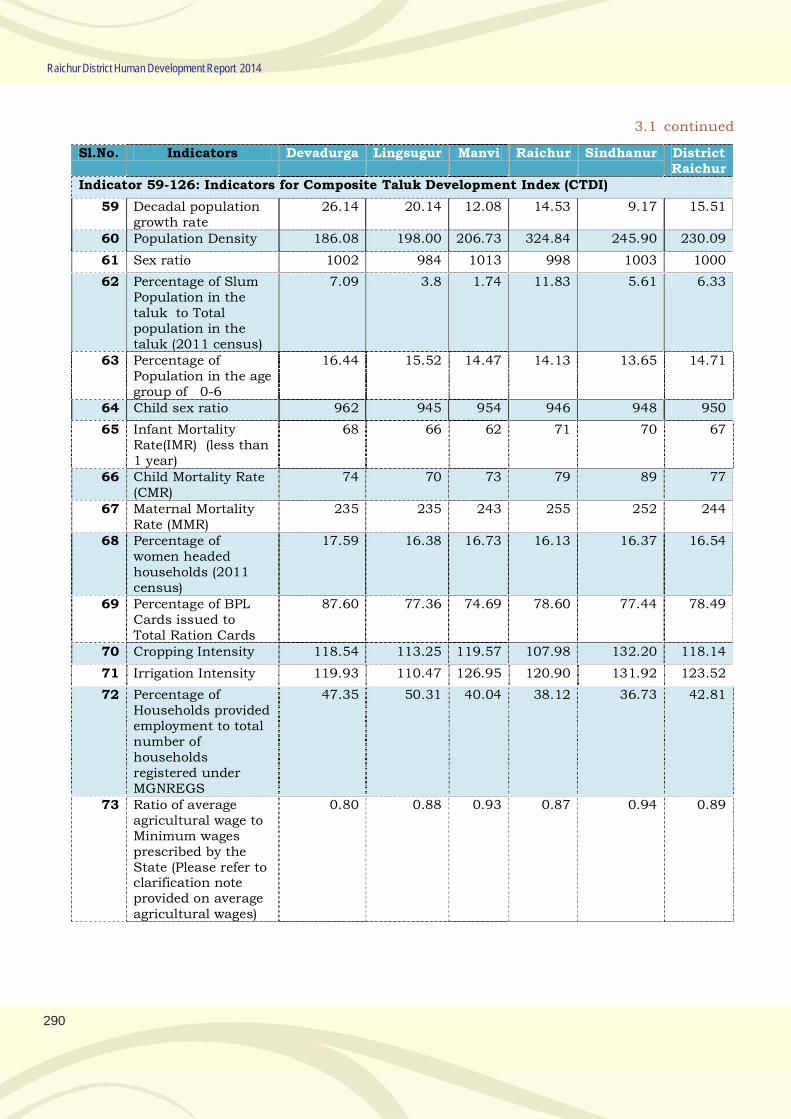
290
Raichur District Human Development Report 2014
Sl.No. Indicators Devadurga Lingsugur Manvi Raichur Sindhanur District Raichur
Indicator 59-126: Indicators for Composite Taluk Development Index (CTDI)
59 Decadal population growth rate
26.14 20.14 12.08 14.53 9.17 15.51
60 Population Density 186.08 198.00 206.73 324.84 245.90 230.09
61 Sex ratio 1002 984 1013 998 1003 1000
62 Percentage of Slum Population in the taluk to Total population in the taluk (2011 census)
7.09 3.8 1.74 11.83 5.61 6.33
63 Percentage of Population in the age group of 0-6
16.44 15.52 14.47 14.13 13.65 14.71
64 Child sex ratio 962 945 954 946 948 950
65 Infant Mortality Rate(IMR) (less than 1 year)
68 66 62 71 70 67
66 Child Mortality Rate (CMR)
74 70 73 79 89 77
67 Maternal Mortality Rate (MMR)
235 235 243 255 252 244
68 Percentage of women headed households (2011 census)
17.59 16.38 16.73 16.13 16.37 16.54
69 Percentage of BPL Cards issued to Total Ration Cards
87.60 77.36 74.69 78.60 77.44 78.49
70 Cropping Intensity 118.54 113.25 119.57 107.98 132.20 118.14
71 Irrigation Intensity 119.93 110.47 126.95 120.90 131.92 123.52
72 Percentage of Households provided employment to total number of households registered under MGNREGS
47.35 50.31 40.04 38.12 36.73 42.81
73 Ratio of average agricultural wage to Minimum wages prescribed by the State (Please refer to clarification note provided on average agricultural wages)
0.80 0.88 0.93 0.87 0.94 0.89
3.1 continued
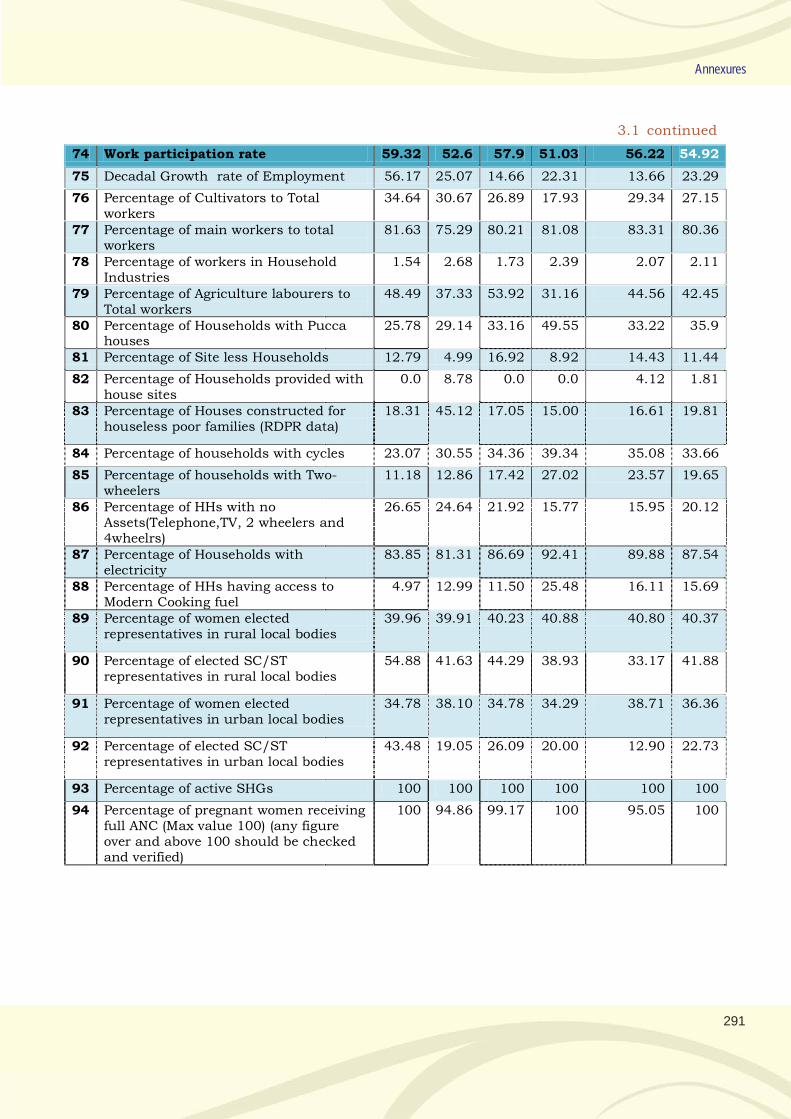
291
Annexures
74 Work participation rate 59.32 52.6 57.9 51.03 56.22 54.92
75 Decadal Growth rate of Employment 56.17 25.07 14.66 22.31 13.66 23.29
76 Percentage of Cultivators to Total workers
34.64 30.67 26.89 17.93 29.34 27.15
77 Percentage of main workers to total workers
81.63 75.29 80.21 81.08 83.31 80.36
78 Percentage of workers in Household Industries
1.54 2.68 1.73 2.39 2.07 2.11
79 Percentage of Agriculture labourers to Total workers
48.49 37.33 53.92 31.16 44.56 42.45
80 Percentage of Households with Pucca houses
25.78 29.14 33.16 49.55 33.22 35.9
81 Percentage of Site less Households 12.79 4.99 16.92 8.92 14.43 11.44
82 Percentage of Households provided with house sites
0.0 8.78 0.0 0.0 4.12 1.81
83 Percentage of Houses constructed for houseless poor families (RDPR data)
18.31 45.12 17.05 15.00 16.61 19.81
84 Percentage of households with cycles 23.07 30.55 34.36 39.34 35.08 33.66
85 Percentage of households with Two- wheelers
11.18 12.86 17.42 27.02 23.57 19.65
86 Percentage of HHs with no Assets(Telephone,TV, 2 wheelers and 4wheelrs)
26.65 24.64 21.92 15.77 15.95 20.12
87 Percentage of Households with electricity
83.85 81.31 86.69 92.41 89.88 87.54
88 Percentage of HHs having access to Modern Cooking fuel
4.97 12.99 11.50 25.48 16.11 15.69
89 Percentage of women elected representatives in rural local bodies
39.96 39.91 40.23 40.88 40.80 40.37
90 Percentage of elected SC/ST representatives in rural local bodies
54.88 41.63 44.29 38.93 33.17 41.88
91 Percentage of women elected representatives in urban local bodies
34.78 38.10 34.78 34.29 38.71 36.36
92 Percentage of elected SC/ST representatives in urban local bodies
43.48 19.05 26.09 20.00 12.90 22.73
93 Percentage of active SHGs 100 100 100 100 100 100
94 Percentage of pregnant women receiving full ANC (Max value 100) (any figure over and above 100 should be checked and verified)
100 94.86 99.17 100 95.05 100
3.1 continued
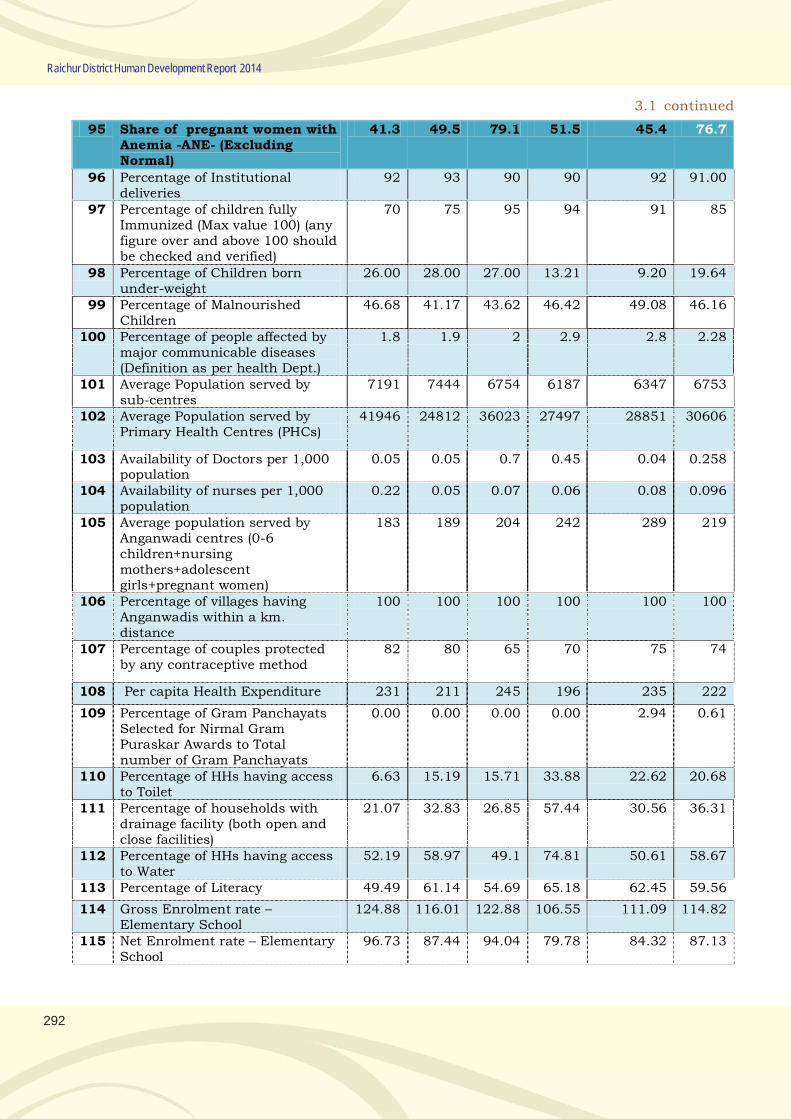
292
Raichur District Human Development Report 2014
95 Share of pregnant women with Anemia -ANE- (Excluding Normal)
41.3 49.5 79.1 51.5 45.4 76.7
96 Percentage of Institutional deliveries
92 93 90 90 92 91.00
97 Percentage of children fully Immunized (Max value 100) (any figure over and above 100 should be checked and verified)
70 75 95 94 91 85
98 Percentage of Children born under-weight
26.00 28.00 27.00 13.21 9.20 19.64
99 Percentage of Malnourished Children
46.68 41.17 43.62 46.42 49.08 46.16
100 Percentage of people affected by major communicable diseases (Definition as per health Dept.)
1.8 1.9 2 2.9 2.8 2.28
101 Average Population served by sub-centres
7191 7444 6754 6187 6347 6753
102 Average Population served by Primary Health Centres (PHCs)
41946 24812 36023 27497 28851 30606
103 Availability of Doctors per 1,000 population
0.05 0.05 0.7 0.45 0.04 0.258
104 Availability of nurses per 1,000 population
0.22 0.05 0.07 0.06 0.08 0.096
105 Average population served by Anganwadi centres (0-6 children+nursing mothers+adolescent girls+pregnant women)
183 189 204 242 289 219
106 Percentage of villages having Anganwadis within a km. distance
100 100 100 100 100 100
107 Percentage of couples protected by any contraceptive method
82 80 65 70 75 74
108 Per capita Health Expenditure 231 211 245 196 235 222
109 Percentage of Gram Panchayats Selected for Nirmal Gram Puraskar Awards to Total number of Gram Panchayats
0.00 0.00 0.00 0.00 2.94 0.61
110 Percentage of HHs having access to Toilet
6.63 15.19 15.71 33.88 22.62 20.68
111 Percentage of households with drainage facility (both open and close facilities)
21.07 32.83 26.85 57.44 30.56 36.31
112 Percentage of HHs having access to Water
52.19 58.97 49.1 74.81 50.61 58.67
113 Percentage of Literacy 49.49 61.14 54.69 65.18 62.45 59.56
114 Gross Enrolment rate – Elementary School
124.88 116.01 122.88 106.55 111.09 114.82
115 Net Enrolment rate – Elementary School
96.73 87.44 94.04 79.78 84.32 87.13
3.1 continued
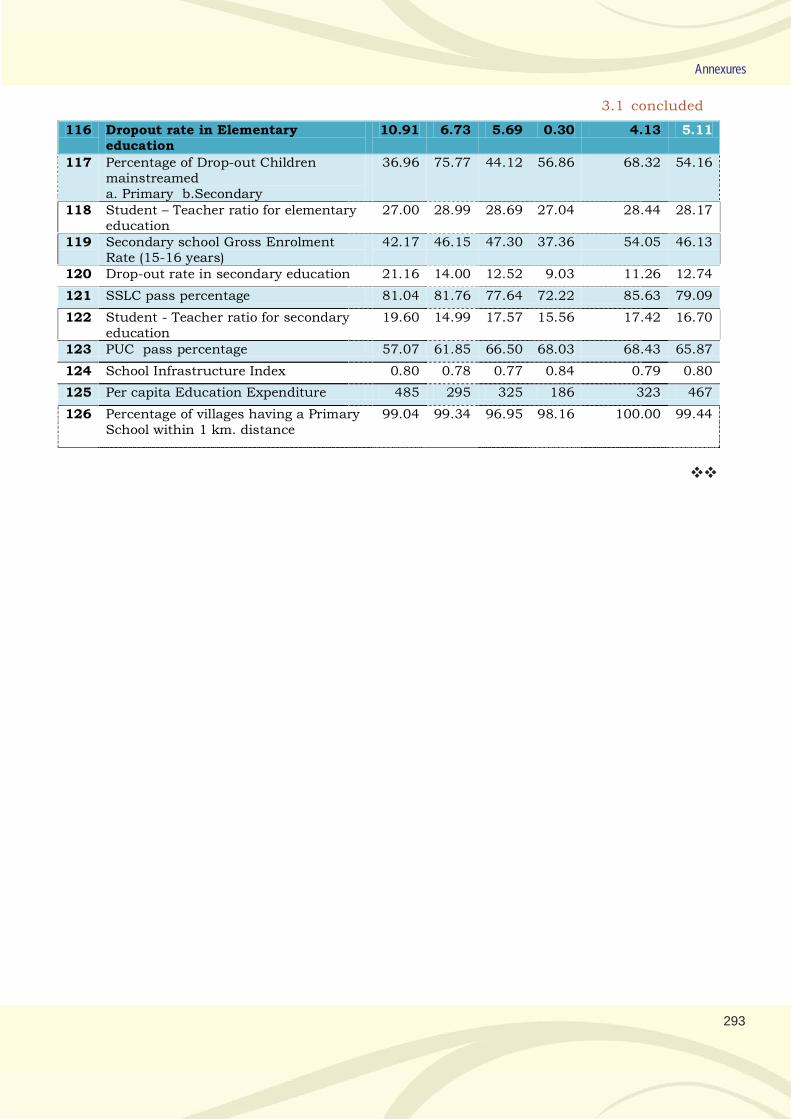
293
Annexures
116 Dropout rate in Elementary education
10.91 6.73 5.69 0.30 4.13 5.11
117 Percentage of Drop-out Children mainstreamed a. Primary b.Secondary
36.96 75.77 44.12 56.86 68.32 54.16
118 Student – Teacher ratio for elementary education
27.00 28.99 28.69 27.04 28.44 28.17
119 Secondary school Gross Enrolment Rate (15-16 years)
42.17 46.15 47.30 37.36 54.05 46.13
120 Drop-out rate in secondary education 21.16 14.00 12.52 9.03 11.26 12.74
121 SSLC pass percentage 81.04 81.76 77.64 72.22 85.63 79.09
122 Student - Teacher ratio for secondary education
19.60 14.99 17.57 15.56 17.42 16.70
123 PUC pass percentage 57.07 61.85 66.50 68.03 68.43 65.87
124 School Infrastructure Index 0.80 0.78 0.77 0.84 0.79 0.80
125 Per capita Education Expenditure 485 295 325 186 323 467
126 Percentage of villages having a Primary School within 1 km. distance
99.04 99.34 96.95 98.16 100.00 99.44
3.1 concluded
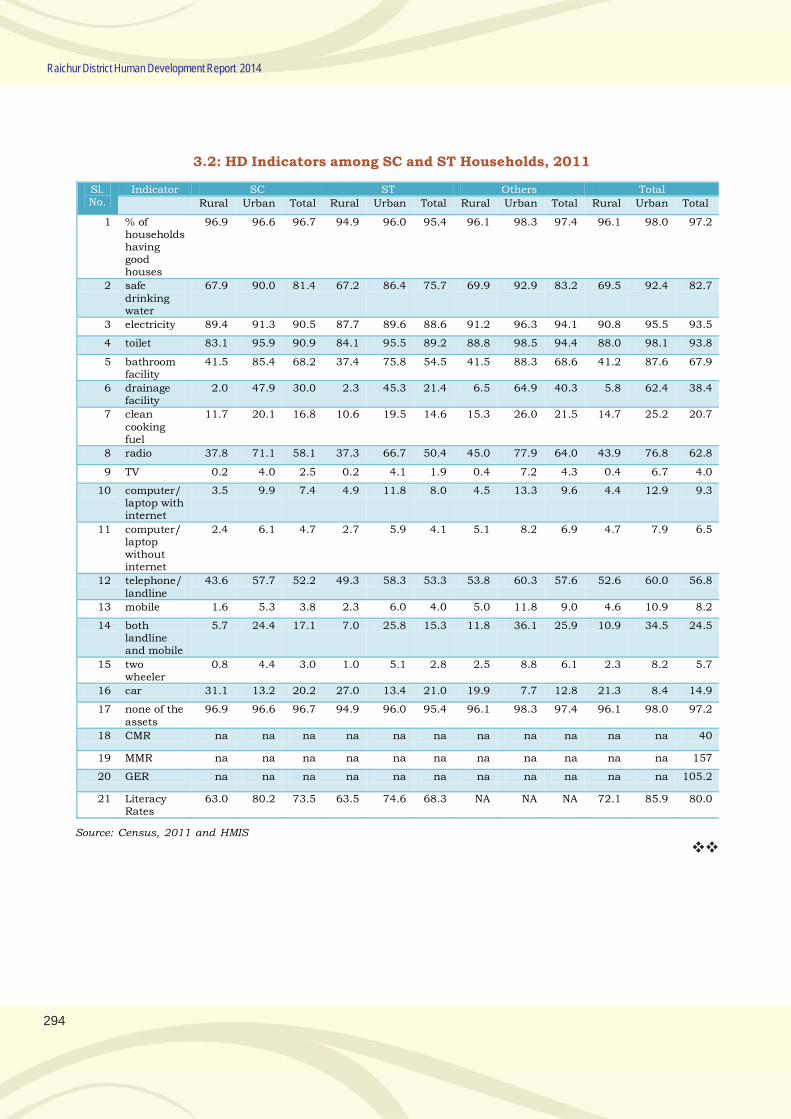
294
Raichur District Human Development Report 2014
3.2: HD Indicators among SC and ST Households, 2011
Sl. No.
Indicator SC ST Others Total
Rural Urban Total Rural Urban Total Rural Urban Total Rural Urban Total
1 % of households having good houses
96.9 96.6 96.7 94.9 96.0 95.4 96.1 98.3 97.4 96.1 98.0 97.2
2 safe drinking water
67.9 90.0 81.4 67.2 86.4 75.7 69.9 92.9 83.2 69.5 92.4 82.7
3 electricity 89.4 91.3 90.5 87.7 89.6 88.6 91.2 96.3 94.1 90.8 95.5 93.5
4 toilet 83.1 95.9 90.9 84.1 95.5 89.2 88.8 98.5 94.4 88.0 98.1 93.8
5 bathroom facility
41.5 85.4 68.2 37.4 75.8 54.5 41.5 88.3 68.6 41.2 87.6 67.9
6 drainage facility
2.0 47.9 30.0 2.3 45.3 21.4 6.5 64.9 40.3 5.8 62.4 38.4
7 clean cooking fuel
11.7 20.1 16.8 10.6 19.5 14.6 15.3 26.0 21.5 14.7 25.2 20.7
8 radio 37.8 71.1 58.1 37.3 66.7 50.4 45.0 77.9 64.0 43.9 76.8 62.8
9 TV 0.2 4.0 2.5 0.2 4.1 1.9 0.4 7.2 4.3 0.4 6.7 4.0
10 computer/ laptop with internet
3.5 9.9 7.4 4.9 11.8 8.0 4.5 13.3 9.6 4.4 12.9 9.3
11 computer/ laptop without internet
2.4 6.1 4.7 2.7 5.9 4.1 5.1 8.2 6.9 4.7 7.9 6.5
12 telephone/ landline
43.6 57.7 52.2 49.3 58.3 53.3 53.8 60.3 57.6 52.6 60.0 56.8
13 mobile 1.6 5.3 3.8 2.3 6.0 4.0 5.0 11.8 9.0 4.6 10.9 8.2
14 both landline and mobile
5.7 24.4 17.1 7.0 25.8 15.3 11.8 36.1 25.9 10.9 34.5 24.5
15 two wheeler
0.8 4.4 3.0 1.0 5.1 2.8 2.5 8.8 6.1 2.3 8.2 5.7
16 car 31.1 13.2 20.2 27.0 13.4 21.0 19.9 7.7 12.8 21.3 8.4 14.9
17 none of the assets
96.9 96.6 96.7 94.9 96.0 95.4 96.1 98.3 97.4 96.1 98.0 97.2
18 CMR na na na na na na na na na na na 40
19 MMR na na na na na na na na na na na 157
20 GER na na na na na na na na na na na 105.2
21 Literacy Rates
63.0 80.2 73.5 63.5 74.6 68.3 NA NA NA 72.1 85.9 80.0
Source: Census, 2011 and HMIS
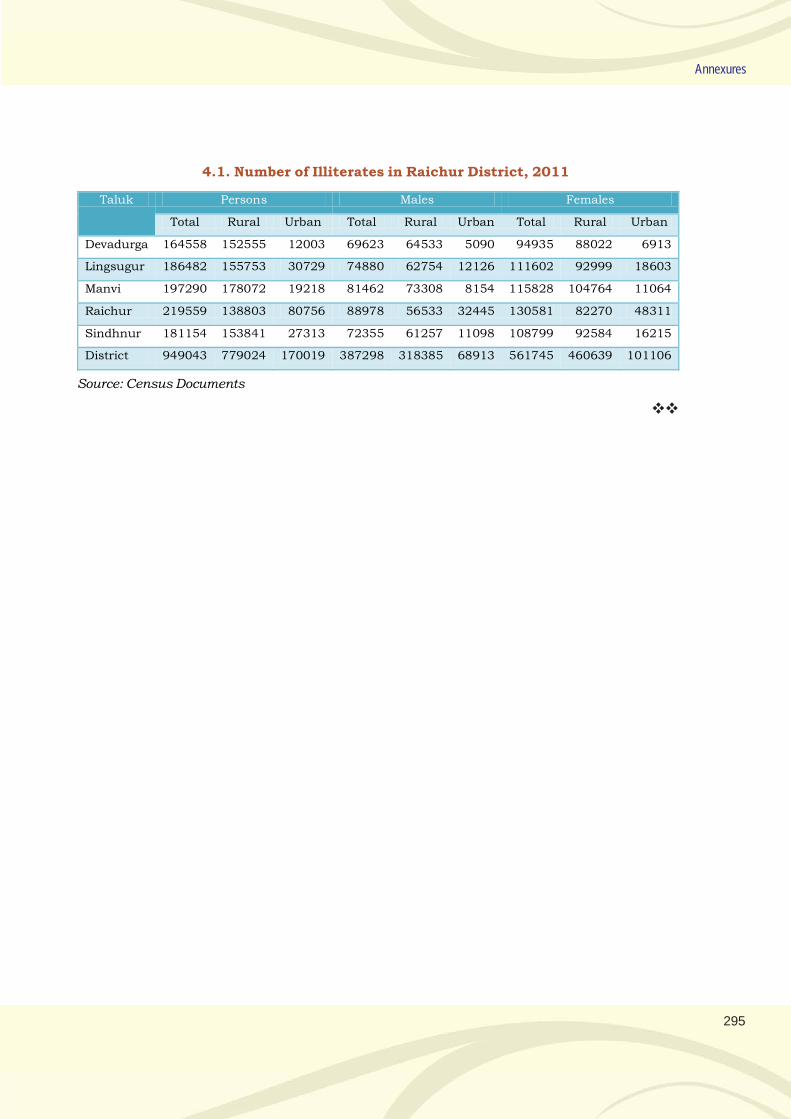
295
Annexures
4.1. Number of Illiterates in Raichur District, 2011
Taluk Persons Males Females
Total Rural Urban Total Rural Urban Total Rural Urban
Devadurga 164558 152555 12003 69623 64533 5090 94935 88022 6913
Lingsugur 186482 155753 30729 74880 62754 12126 111602 92999 18603
Manvi 197290 178072 19218 81462 73308 8154 115828 104764 11064
Raichur 219559 138803 80756 88978 56533 32445 130581 82270 48311
Sindhnur 181154 153841 27313 72355 61257 11098 108799 92584 16215
District 949043 779024 170019 387298 318385 68913 561745 460639 101106
Source: Census Documents
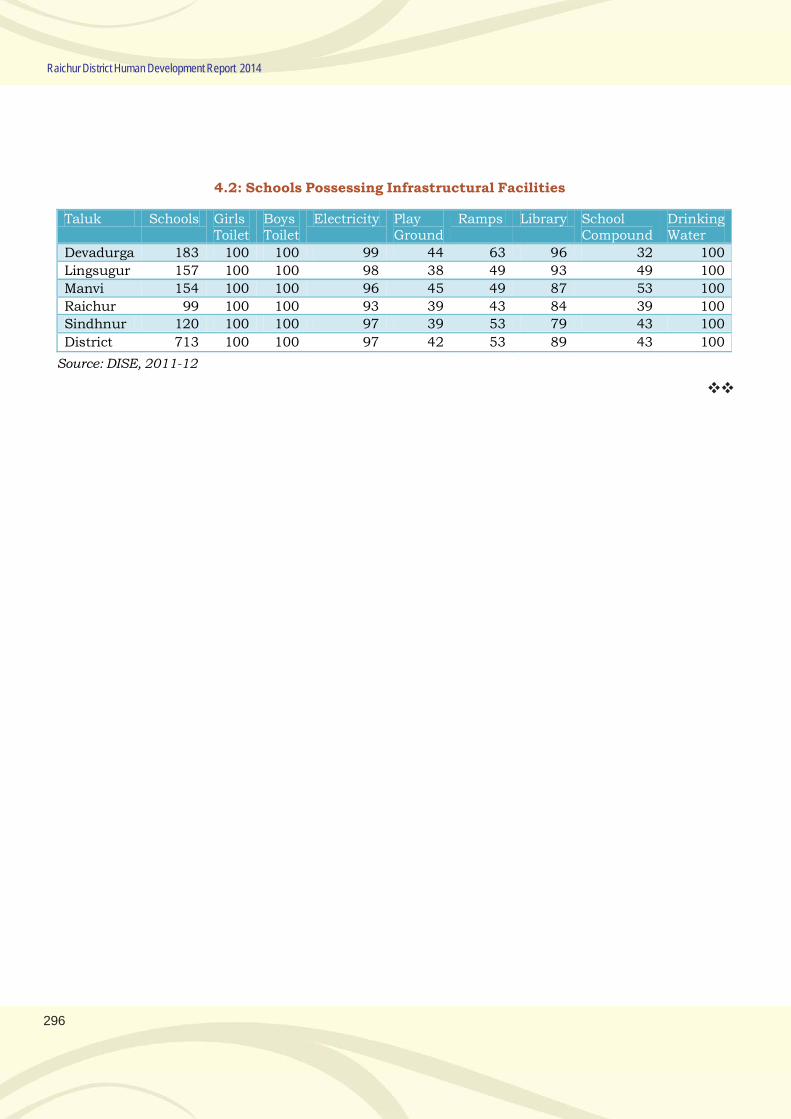
296
Raichur District Human Development Report 2014
4.2: Schools Possessing Infrastructural Facilities
Taluk Schools Girls Toilet
Boys Toilet
Electricity Play Ground
Ramps Library School Compound
Drinking Water
Devadurga 183 100 100 99 44 63 96 32 100
Lingsugur 157 100 100 98 38 49 93 49 100
Manvi 154 100 100 96 45 49 87 53 100
Raichur 99 100 100 93 39 43 84 39 100
Sindhnur 120 100 100 97 39 53 79 43 100
District 713 100 100 97 42 53 89 43 100
Source: DISE, 2011-12
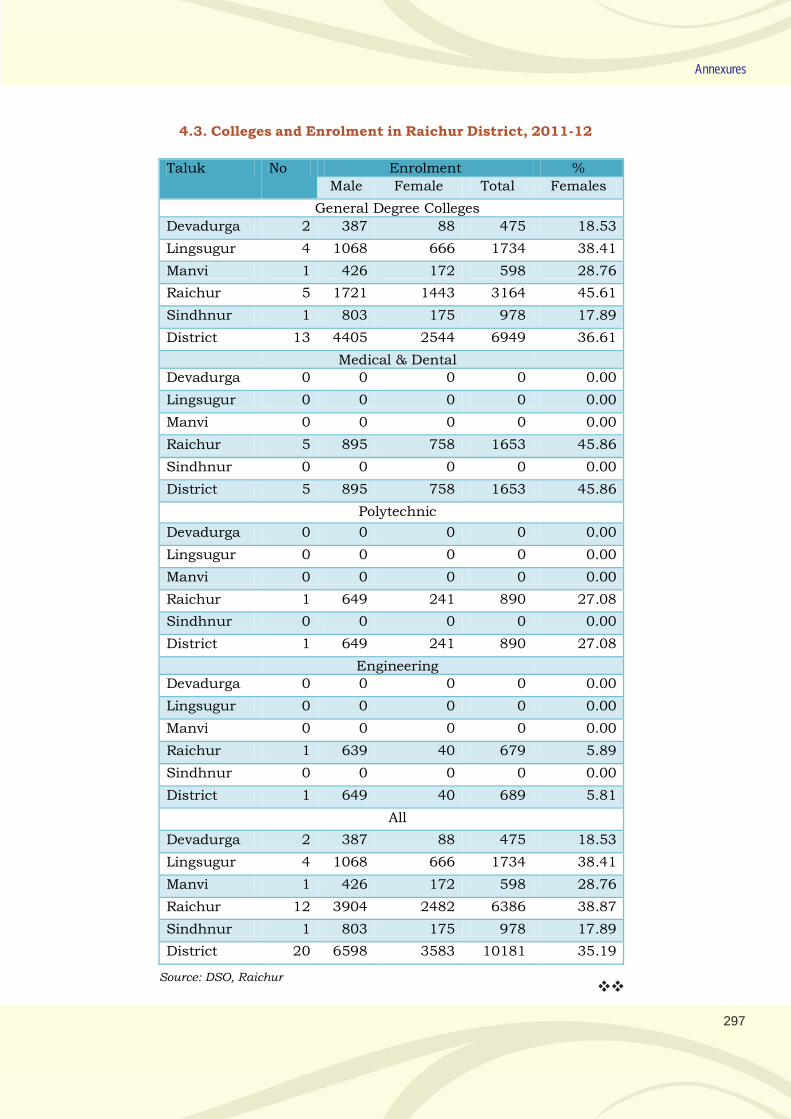
297
Annexures
4.3. Colleges and Enrolment in Raichur District, 2011-12
Taluk No Enrolment %
Male Female Total Females
General Degree Colleges
Devadurga 2 387 88 475 18.53
Lingsugur 4 1068 666 1734 38.41
Manvi 1 426 172 598 28.76
Raichur 5 1721 1443 3164 45.61
Sindhnur 1 803 175 978 17.89
District 13 4405 2544 6949 36.61
Medical & Dental Devadurga 0 0 0 0 0.00
Lingsugur 0 0 0 0 0.00
Manvi 0 0 0 0 0.00
Raichur 5 895 758 1653 45.86
Sindhnur 0 0 0 0 0.00
District 5 895 758 1653 45.86
Polytechnic
Devadurga 0 0 0 0 0.00
Lingsugur 0 0 0 0 0.00
Manvi 0 0 0 0 0.00
Raichur 1 649 241 890 27.08
Sindhnur 0 0 0 0 0.00
District 1 649 241 890 27.08
Engineering Devadurga 0 0 0 0 0.00
Lingsugur 0 0 0 0 0.00
Manvi 0 0 0 0 0.00
Raichur 1 639 40 679 5.89
Sindhnur 0 0 0 0 0.00
District 1 649 40 689 5.81
All
Devadurga 2 387 88 475 18.53
Lingsugur 4 1068 666 1734 38.41
Manvi 1 426 172 598 28.76
Raichur 12 3904 2482 6386 38.87
Sindhnur 1 803 175 978 17.89
District 20 6598 3583 10181 35.19
Source: DSO, Raichur
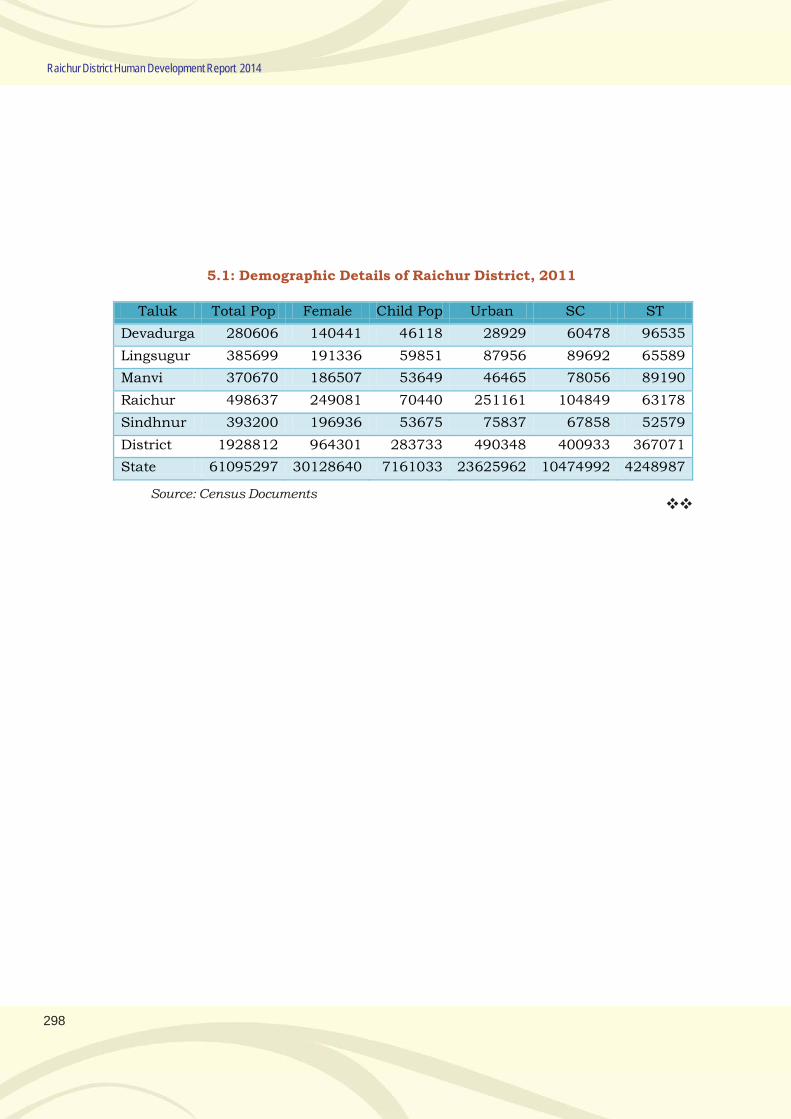
298
Raichur District Human Development Report 2014
5.1: Demographic Details of Raichur District, 2011
Taluk Total Pop Female Child Pop Urban SC ST
Devadurga 280606 140441 46118 28929 60478 96535
Lingsugur 385699 191336 59851 87956 89692 65589
Manvi 370670 186507 53649 46465 78056 89190
Raichur 498637 249081 70440 251161 104849 63178
Sindhnur 393200 196936 53675 75837 67858 52579
District 1928812 964301 283733 490348 400933 367071
State 61095297 30128640 7161033 23625962 10474992 4248987
Source: Census Documents
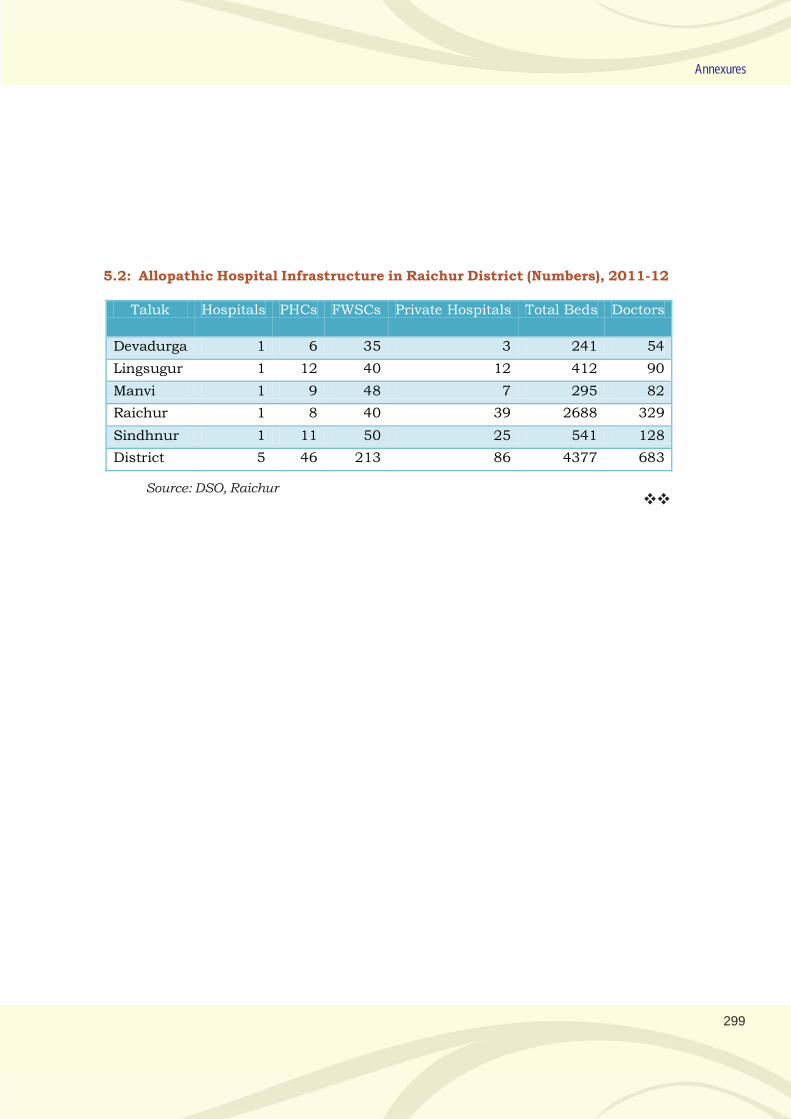
299
Annexures
5.2: Allopathic Hospital Infrastructure in Raichur District (Numbers), 2011-12
Taluk Hospitals PHCs FWSCs Private Hospitals Total Beds Doctors
Devadurga 1 6 35 3 241 54
Lingsugur 1 12 40 12 412 90
Manvi 1 9 48 7 295 82
Raichur 1 8 40 39 2688 329
Sindhnur 1 11 50 25 541 128
District 5 46 213 86 4377 683
Source: DSO, Raichur
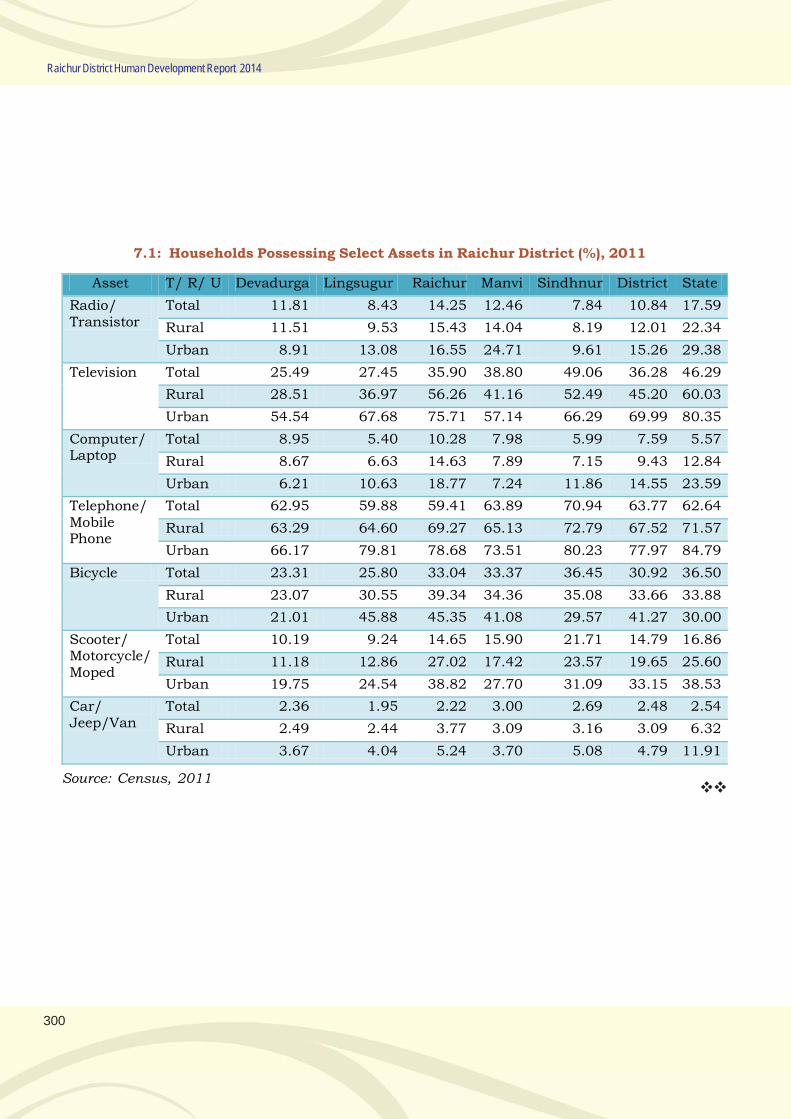
300
Raichur District Human Development Report 2014
7.1: Households Possessing Select Assets in Raichur District (%), 2011
Asset T/ R/ U Devadurga Lingsugur Raichur Manvi Sindhnur District State
Radio/ Transistor
Total 11.81 8.43 14.25 12.46 7.84 10.84 17.59
Rural 11.51 9.53 15.43 14.04 8.19 12.01 22.34
Urban 8.91 13.08 16.55 24.71 9.61 15.26 29.38
Television Total 25.49 27.45 35.90 38.80 49.06 36.28 46.29
Rural 28.51 36.97 56.26 41.16 52.49 45.20 60.03
Urban 54.54 67.68 75.71 57.14 66.29 69.99 80.35
Computer/ Laptop
Total 8.95 5.40 10.28 7.98 5.99 7.59 5.57
Rural 8.67 6.63 14.63 7.89 7.15 9.43 12.84
Urban 6.21 10.63 18.77 7.24 11.86 14.55 23.59
Telephone/ Mobile Phone
Total 62.95 59.88 59.41 63.89 70.94 63.77 62.64
Rural 63.29 64.60 69.27 65.13 72.79 67.52 71.57
Urban 66.17 79.81 78.68 73.51 80.23 77.97 84.79
Bicycle Total 23.31 25.80 33.04 33.37 36.45 30.92 36.50
Rural 23.07 30.55 39.34 34.36 35.08 33.66 33.88
Urban 21.01 45.88 45.35 41.08 29.57 41.27 30.00
Scooter/ Motorcycle/ Moped
Total 10.19 9.24 14.65 15.90 21.71 14.79 16.86
Rural 11.18 12.86 27.02 17.42 23.57 19.65 25.60
Urban 19.75 24.54 38.82 27.70 31.09 33.15 38.53
Car/ Jeep/Van
Total 2.36 1.95 2.22 3.00 2.69 2.48 2.54
Rural 2.49 2.44 3.77 3.09 3.16 3.09 6.32
Urban 3.67 4.04 5.24 3.70 5.08 4.79 11.91
Source: Census, 2011
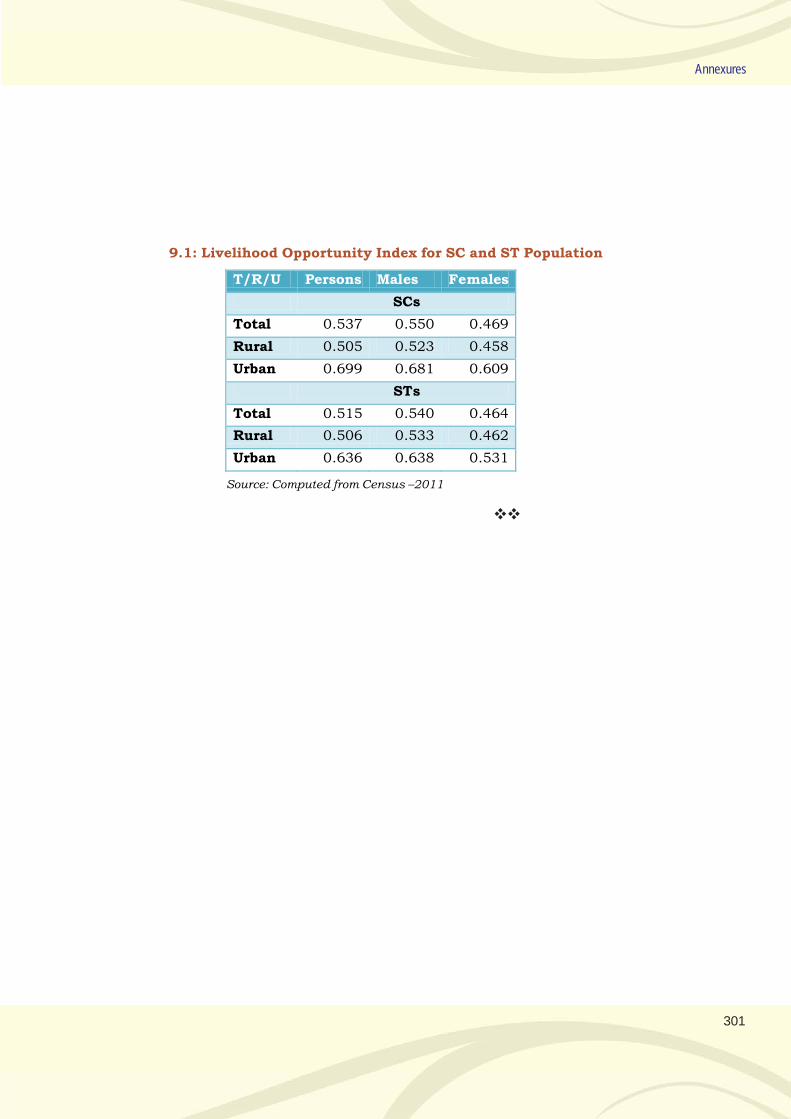
301
Annexures
9.1: Livelihood Opportunity Index for SC and ST Population
T/R/U Persons Males Females
SCs
Total 0.537 0.550 0.469
Rural 0.505 0.523 0.458
Urban 0.699 0.681 0.609
STs
Total 0.515 0.540 0.464
Rural 0.506 0.533 0.462
Urban 0.636 0.638 0.531
Source: Computed from Census –2011
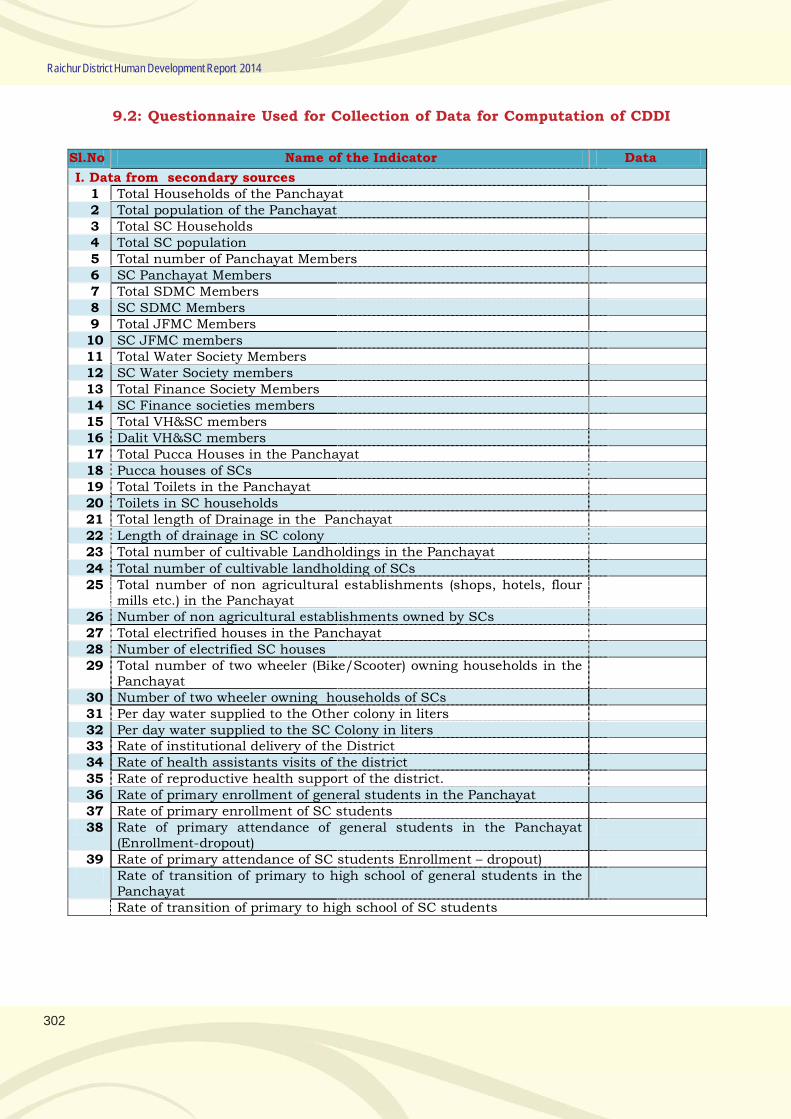
302
Raichur District Human Development Report 2014
9.2: Questionnaire Used for Collection of Data for Computation of CDDI
Sl.No Name of the Indicator Data
I. Data from secondary sources 1 Total Households of the Panchayat 2 Total population of the Panchayat 3 Total SC Households 4 Total SC population 5 Total number of Panchayat Members 6 SC Panchayat Members 7 Total SDMC Members 8 SC SDMC Members 9 Total JFMC Members 10 SC JFMC members 11 Total Water Society Members 12 SC Water Society members 13 Total Finance Society Members 14 SC Finance societies members 15 Total VH&SC members 16 Dalit VH&SC members 17 Total Pucca Houses in the Panchayat 18 Pucca houses of SCs 19 Total Toilets in the Panchayat 20 Toilets in SC households 21 Total length of Drainage in the Panchayat 22 Length of drainage in SC colony 23 Total number of cultivable Landholdings in the Panchayat
24 Total number of cultivable landholding of SCs 25 Total number of non agricultural establishments (shops, hotels, flour
mills etc.) in the Panchayat
26 Number of non agricultural establishments owned by SCs 27 Total electrified houses in the Panchayat 28 Number of electrified SC houses 29 Total number of two wheeler (Bike/Scooter) owning households in the
Panchayat
30 Number of two wheeler owning households of SCs 31 Per day water supplied to the Other colony in liters 32 Per day water supplied to the SC Colony in liters 33 Rate of institutional delivery of the District 34 Rate of health assistants visits of the district 35 Rate of reproductive health support of the district. 36 Rate of primary enrollment of general students in the Panchayat 37 Rate of primary enrollment of SC students 38 Rate of primary attendance of general students in the Panchayat
(Enrollment-dropout)
39 Rate of primary attendance of SC students Enrollment – dropout) Rate of transition of primary to high school of general students in the
Panchayat
Rate of transition of primary to high school of SC students
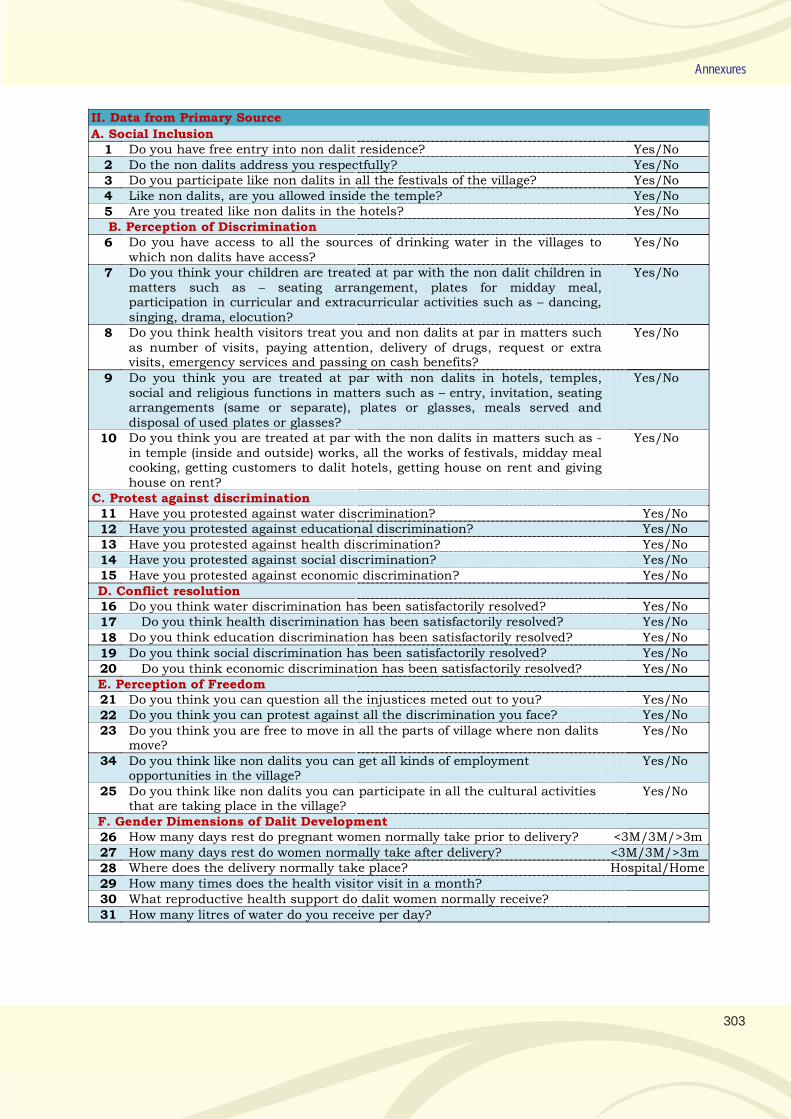
303
Annexures
II. Data from Primary Source
A. Social Inclusion 1 Do you have free entry into non dalit residence? Yes/No 2 Do the non dalits address you respectfully? Yes/No 3 Do you participate like non dalits in all the festivals of the village? Yes/No 4 Like non dalits, are you allowed inside the temple? Yes/No 5 Are you treated like non dalits in the hotels? Yes/No B. Perception of Discrimination 6 Do you have access to all the sources of drinking water in the villages to
which non dalits have access? Yes/No
7 Do you think your children are treated at par with the non dalit children in matters such as – seating arrangement, plates for midday meal, participation in curricular and extracurricular activities such as – dancing, singing, drama, elocution?
Yes/No
8 Do you think health visitors treat you and non dalits at par in matters such as number of visits, paying attention, delivery of drugs, request or extra visits, emergency services and passing on cash benefits?
Yes/No
9 Do you think you are treated at par with non dalits in hotels, temples, social and religious functions in matters such as – entry, invitation, seating arrangements (same or separate), plates or glasses, meals served and disposal of used plates or glasses?
Yes/No
10 Do you think you are treated at par with the non dalits in matters such as - in temple (inside and outside) works, all the works of festivals, midday meal cooking, getting customers to dalit hotels, getting house on rent and giving house on rent?
Yes/No
C. Protest against discrimination 11 Have you protested against water discrimination? Yes/No 12 Have you protested against educational discrimination? Yes/No 13 Have you protested against health discrimination? Yes/No 14 Have you protested against social discrimination? Yes/No 15 Have you protested against economic discrimination? Yes/No D. Conflict resolution 16 Do you think water discrimination has been satisfactorily resolved? Yes/No 17 Do you think health discrimination has been satisfactorily resolved? Yes/No
18 Do you think education discrimination has been satisfactorily resolved? Yes/No
19 Do you think social discrimination has been satisfactorily resolved? Yes/No 20 Do you think economic discrimination has been satisfactorily resolved? Yes/No E. Perception of Freedom 21 Do you think you can question all the injustices meted out to you? Yes/No 22 Do you think you can protest against all the discrimination you face? Yes/No 23 Do you think you are free to move in all the parts of village where non dalits
move? Yes/No
34 Do you think like non dalits you can get all kinds of employment opportunities in the village?
Yes/No
25 Do you think like non dalits you can participate in all the cultural activities that are taking place in the village?
Yes/No
F. Gender Dimensions of Dalit Development 26 How many days rest do pregnant women normally take prior to delivery? <3M/3M/>3m 27 How many days rest do women normally take after delivery? <3M/3M/>3m 28 Where does the delivery normally take place? Hospital/Home
29 How many times does the health visitor visit in a month? 30 What reproductive health support do dalit women normally receive? 31 How many litres of water do you receive per day?
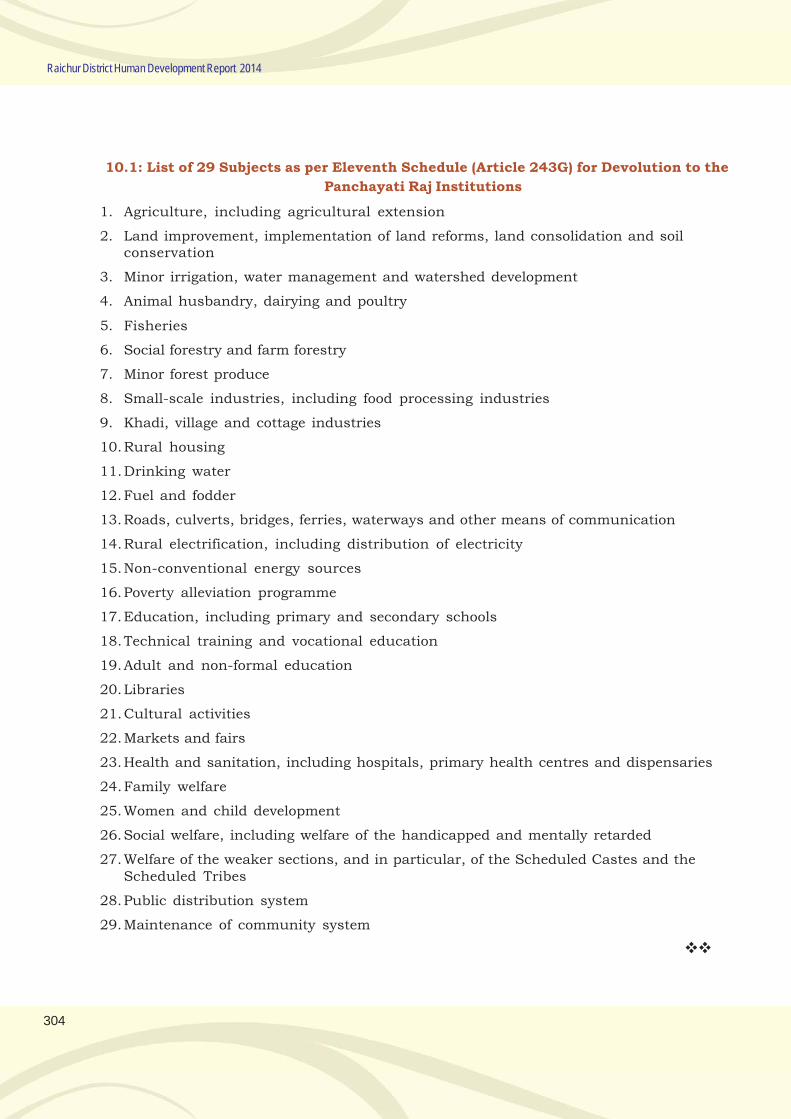
304
Raichur District Human Development Report 2014
10.1: List of 29 Subjects as per Eleventh Schedule (Article 243G) for Devolution to the
Panchayati Raj Institutions
1. Agriculture, including agricultural extension
2. Land improvement, implementation of land reforms, land consolidation and soilconservation
3. Minor irrigation, water management and watershed development
4. Animal husbandry, dairying and poultry
5. Fisheries
6. Social forestry and farm forestry
7. Minor forest produce
8. Small-scale industries, including food processing industries
9. Khadi, village and cottage industries
10.Rural housing
11.Drinking water
12.Fuel and fodder
13.Roads, culverts, bridges, ferries, waterways and other means of communication
14.Rural electrification, including distribution of electricity
15.Non-conventional energy sources
16.Poverty alleviation programme
17.Education, including primary and secondary schools
18.Technical training and vocational education
19.Adult and non-formal education
20.Libraries
21.Cultural activities
22.Markets and fairs
23.Health and sanitation, including hospitals, primary health centres and dispensaries
24.Family welfare
25.Women and child development
26.Social welfare, including welfare of the handicapped and mentally retarded
27.Welfare of the weaker sections, and in particular, of the Scheduled Castes and theScheduled Tribes
28.Public distribution system
29.Maintenance of community system
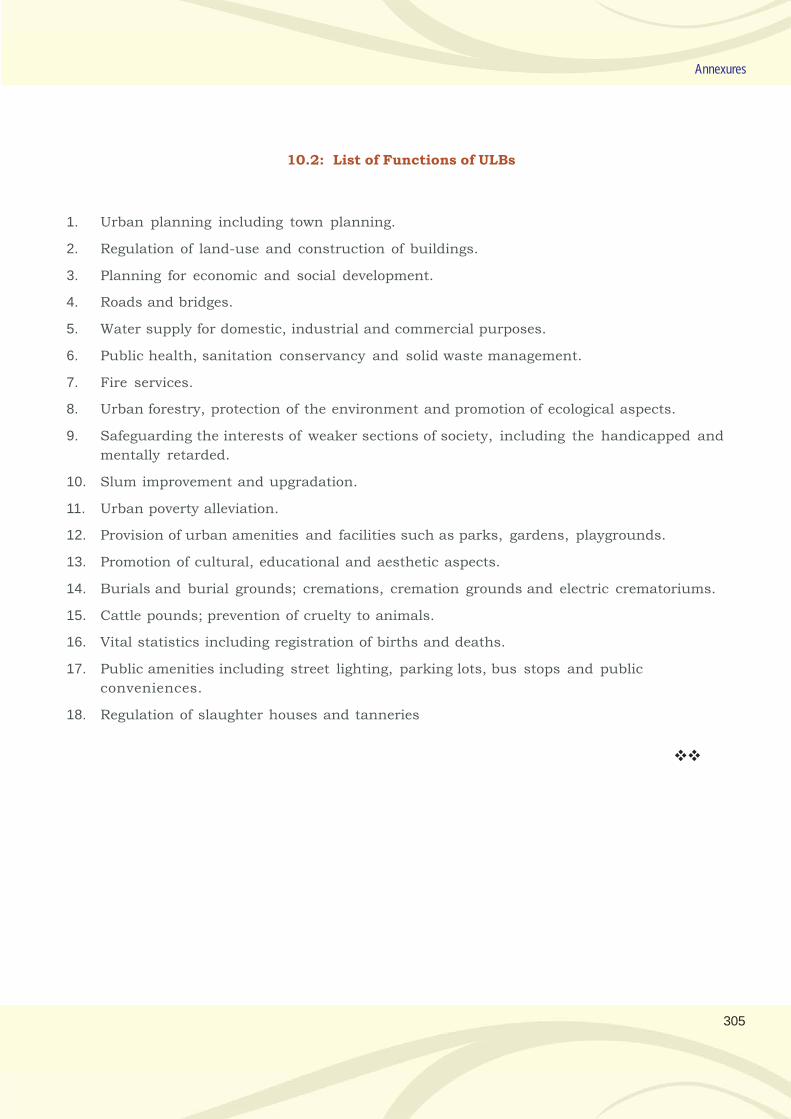
305
Annexures
10.2: List of Functions of ULBs
1. Urban planning including town planning.
2. Regulation of land-use and construction of buildings.
3. Planning for economic and social development.
4. Roads and bridges.
5. Water supply for domestic, industrial and commercial purposes.
6. Public health, sanitation conservancy and solid waste management.
7. Fire services.
8. Urban forestry, protection of the environment and promotion of ecological aspects.
9. Safeguarding the interests of weaker sections of society, including the handicapped and
mentally retarded.
10. Slum improvement and upgradation.
11. Urban poverty alleviation.
12. Provision of urban amenities and facilities such as parks, gardens, playgrounds.
13. Promotion of cultural, educational and aesthetic aspects.
14. Burials and burial grounds; cremations, cremation grounds and electric crematoriums.
15. Cattle pounds; prevention of cruelty to animals.
16. Vital statistics including registration of births and deaths.
17. Public amenities including street lighting, parking lots, bus stops and public
conveniences.
18. Regulation of slaughter houses and tanneries
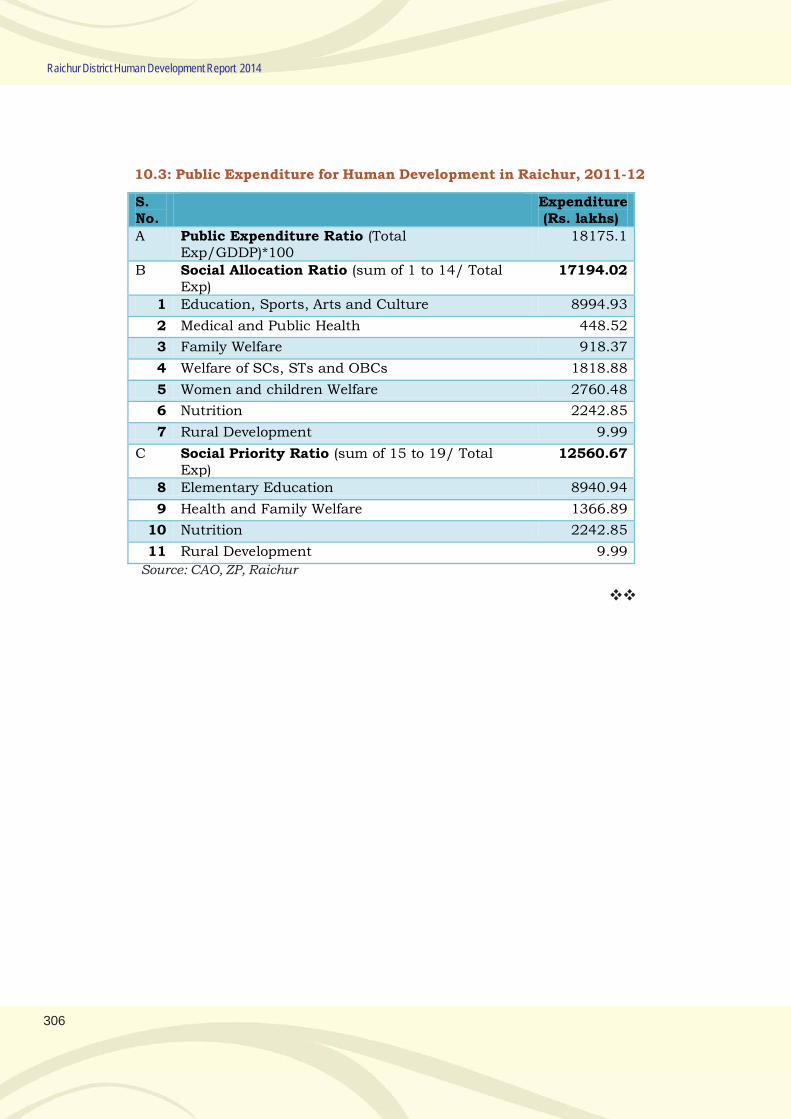
306
Raichur District Human Development Report 2014
10.3: Public Expenditure for Human Development in Raichur, 2011-12
S. No.
Expenditure (Rs. lakhs)
A Public Expenditure Ratio (Total Exp/GDDP)*100
18175.1
B Social Allocation Ratio (sum of 1 to 14/ Total Exp)
17194.02
1 Education, Sports, Arts and Culture 8994.93
2 Medical and Public Health 448.52
3 Family Welfare 918.37
4 Welfare of SCs, STs and OBCs 1818.88
5 Women and children Welfare 2760.48
6 Nutrition 2242.85
7 Rural Development 9.99
C Social Priority Ratio (sum of 15 to 19/ Total Exp)
12560.67
8 Elementary Education 8940.94
9 Health and Family Welfare 1366.89
10 Nutrition 2242.85
11 Rural Development 9.99
Source: CAO, ZP, Raichur
307
Annexures
References
• Alkire, Sabina, 2009: Conceptual
Overview of Human Development:
Definitions, Critiques, and Related
Concepts, Background paper for
the 2010 Human Development
Report
• Ariana, Proochista and Arif
Naveed, 2009: “Health” in
Deneulin, Séverine and Lila
Shahani(Eds): An Introduction to
the Human Development and
Capability Approach: Freedom
and Agency, Earthscan, New
Delhi 2009
• Banerjee, Nirmala, 1998
“Whatever Happened to the
Dreams of Modernity? The
Nehruvian Era and Woman’s
Position”, Economic and Political
Weekly, Vol. 33, No. 17.
• Biradar R.R. 2012: Incidence of
Poverty among Social Groups in
Rural India: Who are the Poorest
and Why?, Monograph Series 24,
Institute for Social and
Economic Change, Bangalore,
2012,
• Chambers, R. 1989: “Editorial
introduction”, Vulnerability,
Coping and Policy, IDS Bulletin,
2(2): 1-7
• Chambers, Robert and Gregor
von Medeazza, 2013: “Sanitation
and Stunting in India:
Undernutrition’s Blind Spot”
Economic & Political Weekly June
22, 2013 vol XLVIII no 25
• Commission of the European
Communities, 2009: GDP and
beyond: Measuring progress in a
changing world, Communication
from the commission to the
council and the European
parliament, Brussels
• Commission on the
Measurement of Economic
Performance and Social
Progress, 2009, “Survey of
Existing Approaches to Measuring
Socio-economic Progress,” p. 2.
• Daly, H. 2008: A Steady-State
Economy. UK Sustainable
Development Commission.
• Department for International
Development, 2010, ‘Access to
Safe Water for the Bottom of the
Pyramid: Strategies for
Disseminating Technology
Research Benefits’, UK: DFID,
available at: http://
w w w . d f i d . g o v . u k / R 4 D / P D F /
O u t p u t s / w a t e r /
Secondary_Research_Report.pdf
• DES, 2012: State and District
Domestic Product of Karnataka
New Series (Base Year 2004-05)
2010-2011
• DES, 2013: State and District
Domestic Product of Karnataka
New Series (Base Year 2004-05),
2010-2011, Govt.of Karnataka ,
Bangalore
• GOI, 1974: Towards Equality :
Report of the Committee on the
Status of Women in India,
Ministry of Education & Social
Welfare, Department of Social
Welfare, Government of India.
308
Raichur District Human Development Report 2014
• GOI, 1993: National Nutrition
Policy, Food and Nutrition Board,
Ministry of Women and Child
Development, Government of
India
• GOI, 2011: Census of India 2011,
Instruction Manual For House
listing and Housing, Government
of India
• GOI, 2012: Census of India
2011,Houses, Household
Amenities and Assets,
Government of India
• GOI (nd): Handbook on Service
Level Benchmarking, Ministry of
Urban Development,
Government of India, undated
• GOK, 2006: Karnataka Human
Development Report: Investing in
Human Development, Planning
and Statistics Department,
Bangalore
• GOK, 2008: District Human
Development Report, Bijapur,
Planning, Programme
Monitoring and Statistics
Department, Government of
Karnataka, Bangalore, 2008
• GOK, 2013: Economic Survey of
Karnataka:2012-13, Government
of Karnataka, Department of
Finance, Bangalore
• GOWB, 2007: District Human
Development Report, Malda,
Development and Planning
Department, Government of West
Bengal, 2007
• Hallad et al., 2012:
“Socioeconomic differentials of
neonatal mortality in Northern
Karnataka: Implications” BMC
Proceedings 2012 6(Suppl 5):P6.
• Haq, M.1995, Reflections on
Human Development, Oxford
University Press, Chapt. 4.
• Haq, Mahbub ul. n.d. The Human
Development concept. Retrieved
on November 3, 2013 from http:/
/hdr.undp.org/en/humandev/
• HPEC Report (Report on Indian
Urban Infrastructure and
Services; The High Powered
Expert Committee (HPEC) for
Estimating the Investment
Requirements for Urban
Infrastructure Services, Ministry of
Urban Development, Government
of India, 2011)
• IDFC, 2009: Round-the-Clock
Water Supply: Lessons from
Karnataka, Policy Group
Quarterly, No. 5 / Sep 2009,
Infrastructure Development and
Finance Corporation (IDFC)
• International Institute for
Population Sciences and Macro
International, 2007: ‘National
Family Health Survey (NFHS-3),
2005-06: India: Volume I’,
Mumbai: IIPS
• John, Richard Layard and Jeffrey
Sachs, 2013 (Ed): World
Happiness Report, 2013,
UNSDSN Sustainable
Development Solutions Network,
New York
• KHPT, 2011: Maternal, Newborn
and Child Health in Raichur
District: A Situation Analysis,
Karnataka Health Promotion
Trust, Bangalore
309
Annexures
• KPMG: Project Samudaya:
Assessing ‘Impact Potential’
Cisco Systems, Inc. April
2012;http://newsroom.cisco.
c o m / p r e s s - r e l e a s e -
c o n t e n t ; j s e s s i o n i d =
8 E 7 E D 8 D F 9 0 B E A 7 8 D 1 6 4
D4E9A341A3C8E?type=webconten
t&articleId=5878382
• Maddison, A. 2010. Historical
Statistics of the World Economy:
1–2008 AD. Organisation for
Economic Co-operation and
Development, Paris.
• Mazumdar, Indrani and Neetha
N, 2011: Gender Dimensions:
Employment Trends in India,
1993-94 to 2009-10, Occasional
Paper No.56, Centre For
Women’s Development Studies,
New Delhi
• Mehta, A.K. and Shah, A. 2001
‘Chronic Poverty in India:
Overview Study.’ CPRC-IIPA
Working Paper 7. New Delhi:
Chronic Poverty Research
Centre, University of Manchester
and Indian Institute of Public
Administration
• Ministry of Health and Family
Welfare (MOHFW), 1997:
Reproductive and Child Health
Programme: Schemes for
Implementation, Department of
Family Welfare, MOHFW, New
Delhi.
• Naik, Vidya, 2013: “Special
Status to Hyderabad-Karnataka”
March of Karnataka, The Director
of Information, Bangalore
November 2013
• NCEUS, 2009: The Challenge of
Employment in India: An Informal
Economy Perspective, National
Commission for Enterprises in
the Unorganised Sectors, New
Delhi: Academic Foundation.
• Patil, Shivraj, 2011: Report on
Prevention of Adolescent
Marriages in the State of
Karnataka, Report of the Core
Committee headed By Justice
Shivraj V. Patil Former Judge,
Supreme Court of India ,Volume I
• Pineda, José, 2013: Measuring
Human Progress: Challenges and
Prospects, UNDP-HDRO, New
York.
• Planning Commission, 2007:
Karnataka Development Report,
Academic Foundation for
Government of India, New Delhi
• Planning Commission, 2008:
‘Eleventh Five-Year Plan:
Inclusive Growth.’ New Delhi:
Planning Commission.
• R.B.Bhagat, R.B. 2011:
“Emerging Pattern of
Urbanisation in India” Economic
& Political Weekly August 20,
2011 vol xlvI no 34
• Ranis, G., Stewart, F., and
Samman, E. 2006. “Human
Development: Beyond the
Human Development Index”
Journal of Human Development
and Capabilities, 7(3), 323-358.
• Ram, F. 1995. Maternal Mortality
and its Demographic
Determinants. International
Institute for Population Sciences
(IIPS), Bombay.
310
Raichur District Human Development Report 2014
• Riley, J.C. 2005. Poverty and Life
Expectancy. Cambridge, UK:
Cambridge University Press.
• Roy, Manas P., Uday
Mohan, Shivendra K.
Singh, Vijay K.
Singh, and Anand K. Srivastava,
2013: ‘Determinants of
Utilization of Antenatal Care
Services in Rural Lucknow,
India’, Journal of Family Medicine
and Primary Care, January-
March 2 (1) pp. 55-59
• Sahoo, Harihar, 2011: Fertility
Behaviour Among Adolescents
In India, The Journal of Family
Welfare Vol. 57, No.1, June -
2011
• Sen, Amartya 1999: Development
as Freedom, Oxford University
Press, New Delhi
• Sen, Amartya, 2000: “Social
Exclusion: Concept, Application
and Scrutiny” Working Paper,
Social Development Paper No. 1,
Asian Development Bank,
Bangkok, June
• Simms, Andrew, Victoria
Johbson and Peter Chowla, 201):
Growth Isn’t Possible: Why We
Need a New Economic Direction.
London: New Economics
Foundation
• Sen, A. K. 2002 ‘Why health
equity?’ Health Economics, vol
11, pp659–666
• Srinivasan, T. N. 1994: ‘Human
development: A new paradigm or
reinvention of the wheel?’, The
American Economic Review, vol
84, no 2, pp238–243
• Stohr, Walter B, 2001:
“Subsidiarity: A Key Concept for
Regional Development Policy”
New Regional Development
Paradigms Volume 3, UNCRD,
2001.
• Talukdar, Sushanta, 2012: “Why
Are Women Disappearing From
Workforce”, The Hindu,
Guwahati, September 30, 2012.
• Thorat, Sukhdev and Katherine
S Newman, 2007: “Caste and
Economic Discrimination:
Causes. Consequences and
Remedies” Economic and Political
Weekly, October 12, 2007, pp
4121-4124.
• UN, 2010: The World’s Women in
2010, Trends and Statistics, UN
Department of Economics and
Social Affairs, (New York)
• UN, 2013: The World Economic
Social and Economic Survey,
pp.29-30
• UNDP, 1991: Human
Development Report, 1991,
Oxford University Press, New
York
• UNDP, 1997: “Governance for
Sustainable Development,” UNDP
Policy Paper Series 1997.
Available on http://
magnet.undp.org
• UNDP, 2002: Human
Development Report 2002. New
York: United Nations
Development Programme
• UNDP, 2006: Human
Development Report, 2006,
UNDP, New York
311
Annexures
• UNDP, 2010. Human
Development Report 2010. The
Real Wealth of Nations: Pathways
to Human Development. UNDP,
New York.
• UNDP, 2012: History of the
Human Development Report.
Retrieved on November 3, 2013
from http://hdr.undp.org/en/
humandev/reports/
• Ura, K. and K. Galay (eds). 2004:
Gross National Happiness and
Development.First International
Seminar on Operationalization
of Gross National Happiness,
Thimphu, Bhutan: The Centre for
Bhutan Studies.
• Vedachalam, S. 2012: ‘Water
Supply and Sanitation in India:
Meeting Targets and Beyond’,
Discussion Paper 1237, Global
Water Forum, Canberra,
Australia. Available online at: http:/
/www.globalwaterforum.org/2012/09/
23/water— supply— and—
sanitation— in— india— meeting—
targets— and— beyond/.
• WHO, 1946: WHO definition of
Health, Preamble to the
Constitution of the World Health
Organization as adopted by the
International Health
Conference, New York, 19–22
June 1946;
• WHO, 2004: Inheriting the world:
The Atlas of Children’s Health and
the Environment, Geneva, World
Health Organization
• Woodward, David and Andrew
Simms, 2006: Growth Isn’t
Working: The Unbalanced
Distribution of Benefits and Costs
from Growth. London: New
Economics Foundation
• Work, Robertson, 2002:
Overview of Decentralisation
Worldwide: A Stepping Stone to
Improved Governance and
Human Development. 2nd
International Conference on
Decentralisation Federalism: The
Future of Decentralizing States?
25–27 July 2002 Manila,
Philippines
• World Bank, 1992: Governance
and Development, Washington:
The World Bank