Rahimyar Khan Atlas 1 - NDMA
140
-
Upload
khangminh22 -
Category
Documents
-
view
0 -
download
0
Transcript of Rahimyar Khan Atlas 1 - NDMA


National Disaster Management Authority,Prime Minister’s Office, 2nd Floor, Sector G-5/1
Constitution Avenue, Islamabad - Pakistanwww.ndma.gov.pk
MULTI HAZARD VULNERABILITY & RISK ASSESSMENT(MHVRA)
MULTI HAZARD VULNERABILITY & RISK ASSESSMENT(MHVRA)
DISTRICTRAHIMYAR KHAN
PUNJAB - PAKISTAN
The National Disaster Management Authority (NDMA) is the lead federal agency to deal with the whole spectrum of Disaster Management in Pakistan. It was established in 2007 through NDM Ordinance and was finally provided parliamentary cover by an act of Parliament in 2010. The NDMA is the executive arm of the National Disaster Management Commission (NDMC), which was established under the Chairmanship of the Prime Minister of Pakistan, as an apex policy making body in the field of Disaster Management. The NDMA aims to develop sustainable operational capacity and
professional competence to coordinate the emergency response of Federal Government in the event of a national disaster.
Developed by Project Management Unit (PMU),
National Disaster Management Authority,Prime Minister's Office
Published in Pakistan (2018)ISBN: 978-969-7672-00-8
Disclaimer The designation employed and the presentations of material in this Atlas do not imply the expression of any opinion or official endorsement on the part of NDMA. While every effort has been made to ensure the accuracy and correctness of materials presented for this publication, the NDMA and its partners, disclaim any responsibility for the accuracy or correctness of the information and makes no representation of warranty as to information accuracy, and in particular, their accuracy in labeling, dimensions, contours, boundaries, or placement or location of any map features thereon. The areas depicted by maps are approximate, and are not necessarily accurate to surveying or engineering standards. The maps and tables shown here are for illustration purposes only and are not suitable for site-specific decision making. NDMA acknowledges and accepts all limitations, including the fact that
the information and maps are dynamic and in a constant state of revision.�
Copyright© All rights reserved. No part of this publication may be reproduced, copied, stored in a retrieval system or transmitted in any form or by any means without the prior written permission of the copyright holder. Enquiries concerning the reproduction, distribution or translation should be made to the Project
Management Unit (PMU), National Disaster Management Authority, Pakistan vide contact details given below.
We appreciate your feedback Questions and comments concerning this publication may be addressed to the Project Management Unit, National Disaster Management Authority,
Pakistan vide contact details given below.
Contacts Project Management Unit
National Disaster Management Authority Prime Minister's Office, 2nd Floor, Sector G-5/1
Constitution Avenue, Post Code 44000, Islamabad, Pakistan www.ndma.gov.pk

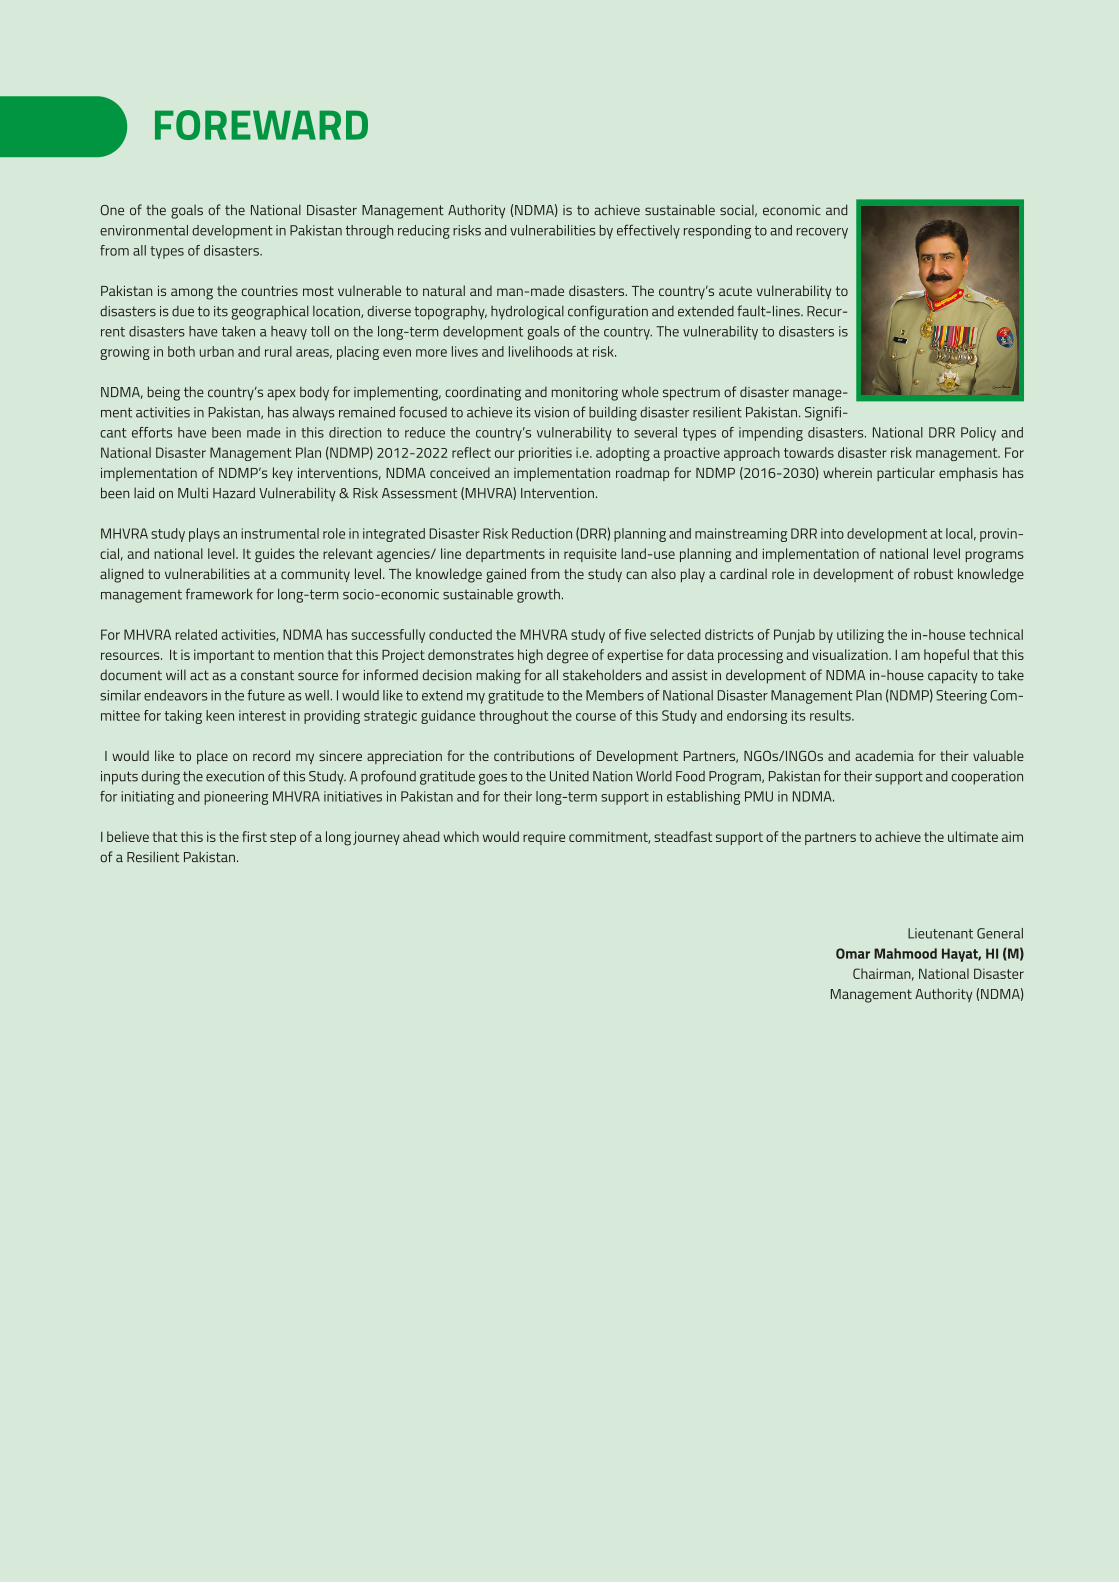
FOREWARD
One of the goals of the National Disaster Management Authority (NDMA) is to achieve sustainable social, economic and environmental development in Pakistan through reducing risks and vulnerabilities by effectively responding to and recovery from all types of disasters.
Pakistan is among the countries most vulnerable to natural and man-made disasters. The country’s acute vulnerability to disasters is due to its geographical location, diverse topography, hydrological configuration and extended fault-lines. Recur-rent disasters have taken a heavy toll on the long-term development goals of the country. The vulnerability to disasters is growing in both urban and rural areas, placing even more lives and livelihoods at risk.
NDMA, being the country’s apex body for implementing, coordinating and monitoring whole spectrum of disaster manage-ment activities in Pakistan, has always remained focused to achieve its vision of building disaster resilient Pakistan. Signifi-cant efforts have been made in this direction to reduce the country’s vulnerability to several types of impending disasters. National DRR Policy and National Disaster Management Plan (NDMP) 2012-2022 reflect our priorities i.e. adopting a proactive approach towards disaster risk management. For implementation of NDMP’s key interventions, NDMA conceived an implementation roadmap for NDMP (2016-2030) wherein particular emphasis has been laid on Multi Hazard Vulnerability & Risk Assessment (MHVRA) Intervention.
MHVRA study plays an instrumental role in integrated Disaster Risk Reduction (DRR) planning and mainstreaming DRR into development at local, provin-cial, and national level. It guides the relevant agencies/ line departments in requisite land-use planning and implementation of national level programs aligned to vulnerabilities at a community level. The knowledge gained from the study can also play a cardinal role in development of robust knowledge management framework for long-term socio-economic sustainable growth.
For MHVRA related activities, NDMA has successfully conducted the MHVRA study of five selected districts of Punjab by utilizing the in-house technical resources. It is important to mention that this Project demonstrates high degree of expertise for data processing and visualization. I am hopeful that this document will act as a constant source for informed decision making for all stakeholders and assist in development of NDMA in-house capacity to take similar endeavors in the future as well. I would like to extend my gratitude to the Members of National Disaster Management Plan (NDMP) Steering Com-mittee for taking keen interest in providing strategic guidance throughout the course of this Study and endorsing its results.
I would like to place on record my sincere appreciation for the contributions of Development Partners, NGOs/INGOs and academia for their valuable inputs during the execution of this Study. A profound gratitude goes to the United Nation World Food Program, Pakistan for their support and cooperation for initiating and pioneering MHVRA initiatives in Pakistan and for their long-term support in establishing PMU in NDMA.
I believe that this is the first step of a long journey ahead which would require commitment, steadfast support of the partners to achieve the ultimate aim of a Resilient Pakistan.
Lieutenant GeneralOmar Mahmood Hayat, HI (M)
Chairman, National DisasterManagement Authority (NDMA)
The National Disaster Management Authority (NDMA) is pleased to launch the Multi Hazards Vulnerability and Risk Assessment (MHVRA) Atlas of five selected districts of Punjab, prepared mainly as a dynamic planning tool for Disaster Risk Management (DRM) officials of Government, Humanitarian Agencies and Development Partners at provincial and district levels for improved and informed Disaster Risk Reduction (DRR), Preparedness and Contin-gency Planning.
An esteem of gratitude is owed to the Former Chairman NDMA, Major General (R) Asghar Nawaz HI(M) and the Current Chairman Lieutenant General Omar Mahmood Hayat HI(M), for their visionary approach, guidance and direction in constituting this Study. They remained a source of guidance at each stage of this project which ultimately had resulted in successful execution of this Project..
We profoundly acknowledge Senior DRM Officer, Mr. Sultan Mehmood of Disaster Risk Reduction (DRR) Unit and Program Officer Mr. Iftikhar Abbas of Vulnerability Analysis & Mapping (VAM) Unit of World Food Program (WFP) for their support and cooperation for all our initiatives and endeavors throughout the working of this project. We acknowledge and express our sincere and deep appreciation for their assistance in this regard.
Our sincere and passionate felicitations to Former Member Disaster Risk Reduction (DRR) NDMA, Mr. Ahmed Kamal, Current Member DRR, NDMA, Mr. Idrees Mehsud, Director Implementation Lieutenant Colonel (R) Raza Iqbal and Assistant Director Projects Mr. Shafi Agha for their continuous support, prized guidance and relevant inputs based on their vast experience and knowledge that contributed immensely in this endeavor.
We acknowledge significant contributions made by institutions and individuals at district, provincial, national by providing data and information required to smoothly carryout this project. In addition, the proficiencies provided by the consultant of different disciplines were crucial, as it helped to maintain precision throughout the assessment.
In the end, we would like to extend our heartiest gratitude to all our relevant stakeholders who rendered their full support, contribution and active partici-pation during execution of this Study. Their contributions are sincerely appreciated and acknowledged.
ACKNOWLEDGEMENT

Pakistan by virtue of its diverse topographic features is vulnerable to wide degree of natural and man-made disasters. Events exhibited under many forms in the past are the testimonies to the country’s susceptibility to disasters. Until recently, a reactive emergency response approach remained chiefly applicable to deal with disasters in Pakistan. However, disasters continued to exact a heavy toll on country’s economy, human lives and environment and, consequently, manifested the need for developing a different strategy towards Disaster Risk Reduction (DRR). Against this backdrop, a shift from hitherto response based approach to proactive disaster management was adopted through 2007 National Disaster Management Ordinance, now known as National Disaster Management (NDM) Act 2010.
National Disaster Management Authority (NDMA), with provision of NDMA Act 2010 and in-line with the DRR Policy, formulated a 10-year comprehensive National Disaster Management Plan (NDMP) 2012–2022 outlining ten priority areas and 118 specific interventions and projects for implementation over the span of ten years. The priority number 3 and 4 under NDMP 2012-2022 warrants execution of Multi Hazard Vulnerability and Risk Assessment (MHVRA) Intervention in the Country. In this regard, NDMP implementation roadmap 2016-2030 was chalked out for phase-wise execution of MHVRA Intervention at micro level, down to UC Level, for all districts of Pakistan and AJ&K.
In view of the Country’s vulnerability to multiple disasters, the implementation of MHVRA Intervention is considered essential for achieving national and global commitments, some of which are outlined in Millennium Development Goals (MDGs) & Sustainable Development Goals (SDGs), Sendai Framework for Disaster Risk Reduction (SFDRR), Climate Change Policy 2012, National Disaster Risk Reduction (DRR) Policy 2013, NDMP 2012-2022 and Pakistan Vision 2025.
Cognizance of the importance of MHVRA component, NDMA, being an apex body to deal with the whole spectrum of disaster management, embarked upon establishing holistic and well-structured methodology for country-specific MHVRA activity. To this end, Project Management Unit (PMU) has been established in NDMA for execution and monitoring of the MHVRA Studies in the Country, with an aim to clearly estimate and map the risk of communities nationwide. PMU, as the first step, laid down “NDMA Policy & Execution Guidelines for the conduct of MHVRA” to maintain unanimity in risk assessment methodology across the Country and AJ&K. The Guidelines constitute an important part of NDMA’s effort towards provision of unified standards and procedures for the hazard, exposure, vulnerability and risk assessments.
To test the various attributes of the MHVRA Guidelines, PMU with the support of World Food Programme (WFP), conducted a micro-level MHVRA intervention, down to Union Council level, for five selected districts of Punjab namely Bahawalpur, Jhang, Khushab, Multan and Rahim Yar Khan. This Project has a distinction of being the only study to be endorsed by Steering Committee formulated to oversee implementation of NDMP. The NDMP Steering Committee consists of members from all lead technical agencies of Pakistan including representatives from S/GB/F/PDMA, Pakistan Meteorological Department (PMD), Planning Commission, Planning Development & Reforms Division, Finance Division, Economic Affairs Division, Ministry of Water & Power, Ministry of Climate Change, Federal Flood Commission (FFC), Geological Survey of Pakistan (GSP), Space & Upper Atmosphere Research Commission (SUPARCO) and Survey of Pakistan (SOP) as well as representatives from academia.
This Study involved identification and analysis of prevailing hazards in the study districts through field level consultation with local stakeholders and analysis of historical records. Three hazards namely drought, flood, earthquake have been considered for hazard analysis owing to their frequent recurrence in the study districts. The project covered various scientific and technical activities, including a review of past and ongoing studies related to hydrological, seismological and geological phenomenon. For hazard modelling and analysis, probabilistic and scenario based hazard assessment tools have been employed in the project. Technical parameters used for hazard estimation include information concerning soil moisture condition, climatic, biotic & edaphic factors of soil, temperature condition, vegetation health, water flow paths, flood catchment area, streamline data, land use data, river discharge information, flood extent, flood velocity, precipitation, seismic sources, plate tectonics, geomorphology, soil data, bore hole data, fault zones, ground motion prediction equations, seismic intensity (PGA), soil ground motion amplification factor and so on.
Exposure has been mapped in the dimensions of population, physical elements, life lines, essential facilities, transportation facilities, socio-economic aspects, economic activities, environmental elements, critical infrastructure, agriculture and livestock elements; being termed as elements at risk. Various statistical tools such as projection equations, dissimilarity index, have been employed in the Project to extrapolate information beyond the available frame.
Vulnerability analysis has been conducted considering three dimensions i.e. physical, social and agriculture (Food Insecurity). For physical vulnerability, fragility curves have been developed using available technical and statistical tools (Probabilistic or Empirical fragility models). For social vulnerability, several technical tools such as Principal Component Analysis (PCA) and Social Vulnerability Indicator (SoVI) have been utilized to obtain possible driving factors contributing to the social vulnerability in the study area. Vulnerability analysis in the context of agriculture and food security have also also been undertaken to determine sets of contributing factors to food insecurity and agricultural vulnerability. The stressor covered epidemic, endemic, biotic and edaphic factors and sudden shocks such as earthquake, flood and drought.
Coping capacity has been anticipated by assessing existing capacities of organization to manage disasters. The coping capacity has further been divided into three main factors i.e. capacity to anticipate risk, capacity to respond and capacity recover. Adaptive capacity has been evaluated using fifteen indicators.
PREFACE
METHODOLOGY
(Continued)
For Risk Assessment, Analytical Hierarchy Process (AHP) and Multi Criteria Decision Making approaches have been employed in the Study. The risk assessment has been carried out using qualitative, quantities or semi quantitative approach. On basis of these factor components, the cumulative risk profile of the study districts (risk indexing down to UC Level) have been developed. Various DRR intervention and mitigation measures have formulated and finally Cost Benefit Analysis (CBA) of proposed DRR interventions have been performed to estimate their economic feasibility.
Close linkages with the National, provincial and district organizations have been established through stakeholder consultation arrangements in order to facilitate secondary data collection, hazard specific information exchange, and sharing of any other relevant data. For this purpose, several data collection tools have been utilized in the Study such as focus group discussion, key informant interviews, participatory rural appraisal, semi structured interviews and one-to-one interviews with community level stakeholders and line departments.
An accurate, easy-to-interpret and up-to-date information is one of the most fundamental elements of decision-making process. Information, particularly in the realm of disaster management, plays an instrumental role in the risk-informed Disaster Risk Reduction (DRR) planning. It makes the relevant departments aware of the likely losses, relative vulnerabilities, exposure and impending disaster risks in the study area, enabling them to effectively undertake prevention, mitigation, preparedness and response based measures before or at the onset of any emergency situation. However, compilation and visualization of information concerning Multi Hazard Vulnerability & Risk Assessment (MHVRA) study is fairly a challenging task since it demands multi-dimensional analysis of different natural processes to understand their composite effects over the study area. Similarly, presentation of the outputs of MHVRA study to the end user, in an easy manner, is yet another challenging task, which requires development of data visualizing tools, graphic aids, catalog of charts and map composition with effective cartographic language. This Atlas in one major step to achieve the said objectives. Much effort has been put in to provide easy to comprehend and interactive information to the users. This Atlas provides detailed baseline maps of the study district covering several dimensions to include geology, climatology, land use, land cover, elevation, population, settlements, buildings, transportation, telecommunication, health, education, irrigation infrastructure, industries, livestock, agriculture etc. Several graphical tools have been employed to produce easy to grasp charts, these include pie-charts, histograms, ring charts, matrix diagram, bar charts, line graphs, 3D charts and informative tables. The Atlas also provides brief hazard assessment methodologies for each selected hazards i.e. drought, earthquake and flood, along with maps for various return periods. Exposure Matrix Tables identifying the exposed elements at risk have also been developed along with the exposure maps. A brief risk assessment methodology is also provided in the atlas with the risk maps. All the study has been conducted at micro-level, down to the level of Union Council. This Study is first of its kind and demonstrates high level of expertise, arduous work and coordinated approach involving cross-sectorial stakeholder linkages.
The Product shall be useful for policymakers and practitioners for risk-informed land-use planning, mainstreaming DRR into development programs and implementation of national scale programs aligned to ground. The project would render substantial baseline information over which other micro level DRR plans could be devised and will serve as a state of the art planning tool enabling mapping of resources in the study district.
ABOUT THIS ATLAS
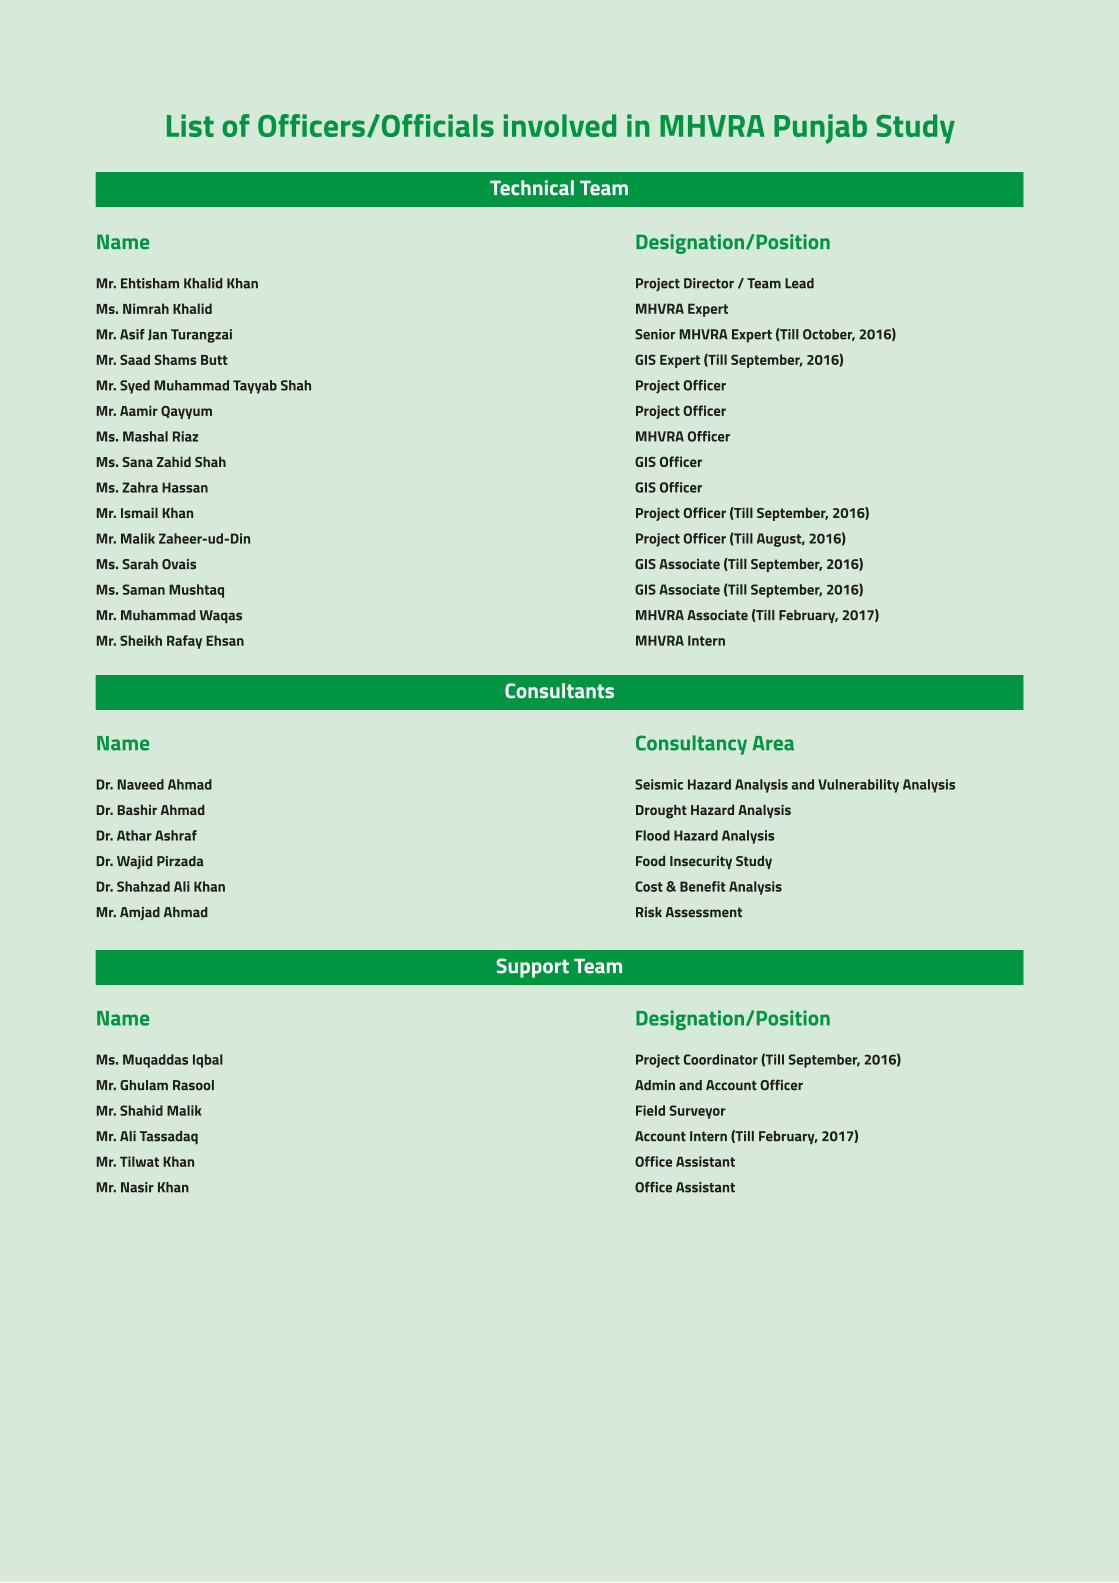
List of Officers/Officials involved in MHVRA Punjab Study
Name Designation/Position
Mr. Ehtisham Khalid Khan
Ms. Nimrah Khalid
Mr. Asif Jan Turangzai
Mr. Saad Shams Butt
Mr. Syed Muhammad Tayyab Shah
Mr. Aamir Qayyum
Ms. Mashal Riaz
Ms. Sana Zahid Shah
Ms. Zahra Hassan
Mr. Ismail Khan
Mr. Malik Zaheer-ud-Din
Ms. Sarah Ovais
Ms. Saman Mushtaq
Mr. Muhammad Waqas
Mr. Sheikh Rafay Ehsan
Project Director / Team Lead
MHVRA Expert
Senior MHVRA Expert (Till October, 2016)
GIS Expert (Till September, 2016)
Project Officer
Project Officer
MHVRA Officer
GIS Officer
GIS Officer
Project Officer (Till September, 2016)
Project Officer (Till August, 2016)
GIS Associate (Till September, 2016)
GIS Associate (Till September, 2016)
MHVRA Associate (Till February, 2017)
MHVRA Intern
Name Consultancy Area
Dr. Naveed Ahmad
Dr. Bashir Ahmad
Dr. Athar Ashraf
Dr. Wajid Pirzada
Dr. Shahzad Ali Khan
Mr. Amjad Ahmad
Seismic Hazard Analysis and Vulnerability Analysis
Drought Hazard Analysis
Flood Hazard Analysis
Food Insecurity Study
Cost & Benefit Analysis
Risk Assessment
Technical Team
Consultants
Name Designation/Position
Ms. Muqaddas Iqbal
Mr. Ghulam Rasool
Mr. Shahid Malik
Mr. Ali Tassadaq
Mr. Tilwat Khan
Mr. Nasir Khan
Project Coordinator (Till September, 2016)
Admin and Account Officer
Field Surveyor
Account Intern (Till February, 2017)
Office Assistant
Office Assistant
Support Team

National Disaster Management Plan (NDMP)Steering Committee - Participants List (19th Sep & 9th Dec 2016)
Name DesignationMaj. Gen. Asghar Nawaz
Mr. Ahmed Kamal
Brig. Ishtiaq Ahmed
Mr. Ehtisham Khalid Khan
Mr. Chaudhry Muhammad Anwar
Mr. Syed Zawad Haider Shah
Mr. Syed Zakria Ali Shah
Mr. Muhammad Saleem Khatak
Mr. Wasim Akhtar
Mr. Muhammad Afzal Shabzada
Mr. Arshad Ahmed
Mr. Malik Aman
Mr. Khalid Sher Dil
Mr. Hameedullah Malik
Mr. Nisar Ahmed Sani
Mr. Syed Ahmed Fawad
Mr. Amer Afaq
Mr. Wajid Ali Khan
Mr. Israr Muhammad
Mr. Faisal Khan Baloch
Mr. Muhammad Khalid Sherdil
Mr. Main Adil Zahoor
Mr. Zaheer-udin-Babar
Mr. Abdul Waheed Shah
Mr. Zaheer-udin-Qureshi
Dr. Muhammad Hanif
Mr. Zafar Iqbal
Mr. Alamgir
Mr. Muhammad Ishtiaq
Mr. Syed Zuhair Bukhari
Mr. Zafar Iqbal
Mr. Muhammad Farooq
Mr. Sardar Saeed Akhter
Mr. Simon Sadiq
Brig Sajid Naeem (R)
Dr. Talat Iqbal
Dr. Muhammad Ali Shah
Ms. Thai Van Hoary
Mr. Iftikhar Abbas
Ms. Umber Khan
Mr. Sherwan Asif
Mr. Shaukat Shafi
Chairman
Member (Disaster Risk Reduction)
Member (Operations)
Project Director/Team Lead
Chief (PPH)
Section Officer
Deputy Secretary (UN)
Deputy Secretary
Deputy Secretary (Development)
Deputy Director
Senior Joint Secretary
DSA (NDMA)
Director General
Project Director
Documentation Officer
Director (Operations)
Director General
Deputy Director (Relief)
Director (R&R)
Assistant Director
Director General
Assistant Director (Operations & Relief)
Deputy Director
Director General
Director General
Director (NWFC)
Senior Engineer
Chief Engineer
Director
Director
Director
General Manager
Director
Deputy Director
Senior Capacity Building Expert
Deputy Chief Scientist / Director
Manager (DM & R Division)
Head of Vulnerability Analysis & Mapping
Program Officer (Spatial Analyst)
Program Officer
Program Manager
Senior Project Officer
PositionChair
Member/ Secretary
Member
Member
Member
Member
Member
Member
Member
Member
Member
Member
Member
Member
Member
Member
Member
Member
Member
Member
Member
Co-opted Member
Co-opted Member
Observer
Observer
Observer
DepartmentNational Disaster ManagementAuthority (NDMA), Pakistan
Planning and Development Division
Economics Affairs Division
Ministry of Climate Change
Finance Division
Provincial Disaster ManagementAuthority, Punjab
Provincial Disaster ManagementAuthority, Sindh
Provinicial Disaster ManagementAuthority, Khyber Pakhtoonkha
Provincial Disaster ManagementAuthority, Balochistan
FATA Disaster Management Authority
Gilgit Baltistan Disaster ManagementAuthority
State Disaster Management AuthorityAzad Jammu & Kashmir
Pakistan Meteorological Department
Federal Flood Commission, Ministryof Water and Power
Survey of Pakistan
Pakistan Space and Upper AtmosphereResearch Commission (SUPARCO)
Geological Survey of Pakistan
National Institute of Disaster Management
Center for Earthquake Studies, PAEC
Micro Seismic Studies Program, PakistanAutomic Energy Commission (MSSP,PAEC)
World Food Program, Pakistan (UN- WFP)
Department for InternationalDevelopment (DFID)
Asian Development Bank (ADB)
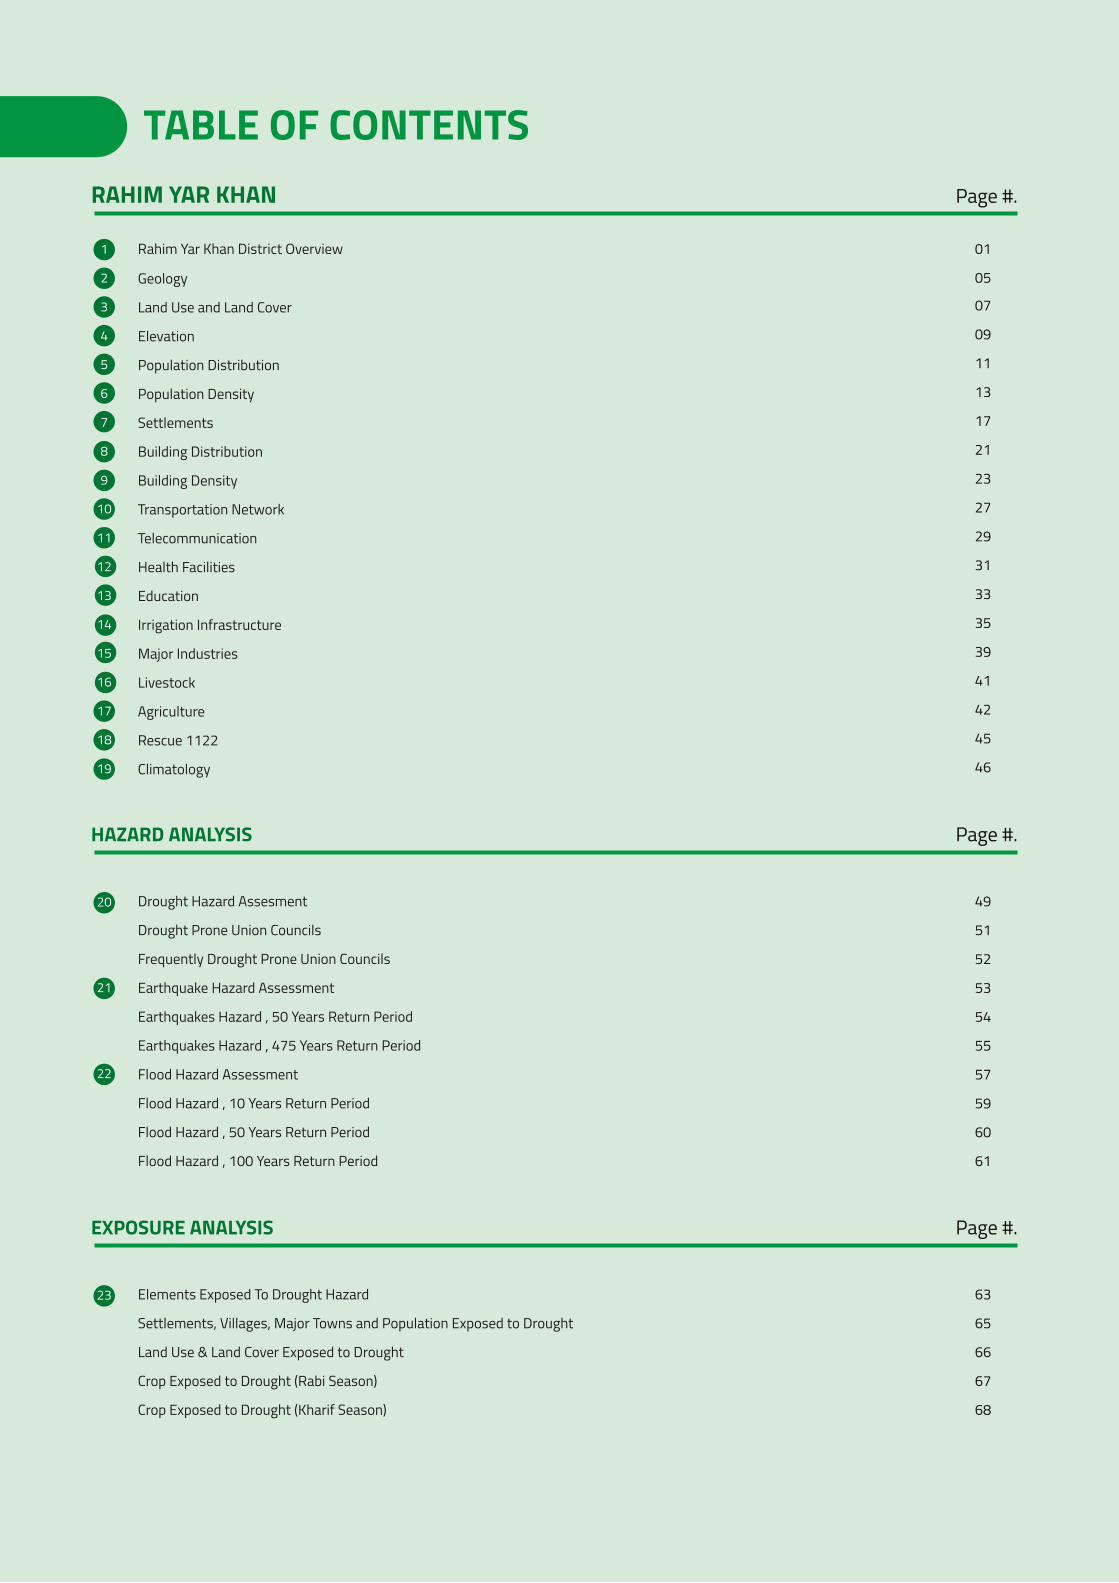
TABLE OF CONTENTSRAHIM YAR KHAN Page #.
Rahim Yar Khan District Overview 01
05
HAZARD ANALYSIS Page #.
Geology
Land Use and Land Cover
Elevation
Population Distribution
Population Density
Settlements
Building Distribution
Building Density
Transportation Network
Telecommunication
Health Facilities
Education
Irrigation Infrastructure
Major Industries
Livestock
Agriculture
Rescue 1122
Climatology
07
09
11
13
17
21
23
27
29
31
33
35
39
41
42
45
46
1
2
3
4
5
6
7
8
9
10
11
12
13
14
15
16
17
18
19
Drought Hazard Assesment
Drought Prone Union Councils
Frequently Drought Prone Union Councils
Earthquake Hazard Assessment
Earthquakes Hazard , 50 Years Return Period
Earthquakes Hazard , 475 Years Return Period
Flood Hazard Assessment
Flood Hazard , 10 Years Return Period
Flood Hazard , 50 Years Return Period
Flood Hazard , 100 Years Return Period
49
51
52
53
54
55
57
59
60
61
20
21
22
EXPOSURE ANALYSIS Page #.
Elements Exposed To Drought Hazard
Settlements, Villages, Major Towns and Population Exposed to Drought
Land Use & Land Cover Exposed to Drought
Crop Exposed to Drought (Rabi Season)
Crop Exposed to Drought (Kharif Season)
63
65
66
67
68
23
EXPOSURE ANALYSIS Page #.
Elements Exposed To Earthquake Hazard
Built-up Area, Major Industries & critical Infrastructure Exposed to Earthquake 50 Years Return Period
Built-up Area, Major Industries & critical Infrastructure Exposed to Earthquake 475 Years Return Period
Schools, Health and Building Exposed to Earthquake 50 Year Return Period
Schools, Health and Building Exposed to Earthquake 475 Year Return Period
Settlements, Villages, Major Towns and Population Exposed to Earthquake Return Period 50 Years
Settlements, Villages, Major Towns and Population Exposed to Earthquake Return Period 475 Years
Elements Exposed To Flood Hazard
Land Use & Land Cover Exposed to Flood Return Period 10 Years
Land Use & Land Cover Exposed to Flood Return Period 50 Years
Land Use & Land Cover Exposed to Flood Return Period 100 Years
Communication Towers and Transportation Network Exposed to Flood 10 Year Return Period
Communication Towers and Transportation Network Exposed to Flood 50 Year Return Period
Communication Towers and Transportation Network Exposed to Flood 100 Year Return Period
Schools, Health and Building Exposed to Flood 10 Year Return Period
Schools, Health and Building Exposed to Flood 50 Year Return Period
Schools, Health and Building Exposed to Flood 100 Year Return Period
Crop Exposed to Flood Return Period 10 Years (Kharif Season)
Crop Exposed to Flood Return Period 50 Years (Kharif Season)
Crop Exposed to Flood Return Period 100 Years (Kharif Season)
69
73
74
75
76
77
78
79
81
82
83
84
85
86
87
88
89
90
91
92
24
25
VULNERABILITY ASSESSMENT Page #.
Page #.
Physical and Social Vulnerability Assessment
Food Security against Drought
95
96
101
102
104
105
106
107
26
27
RISK ASSESSMENT
Integrated Risk Assessment
Risk Assessment by Hazard Type
Drought Risk
Earthquake Risk
Flood Risk
Composite Risk
28
29

BASELINEINFORMATIONA
1 RAHIM YAR KHAN DISTRICT OVERVIEW
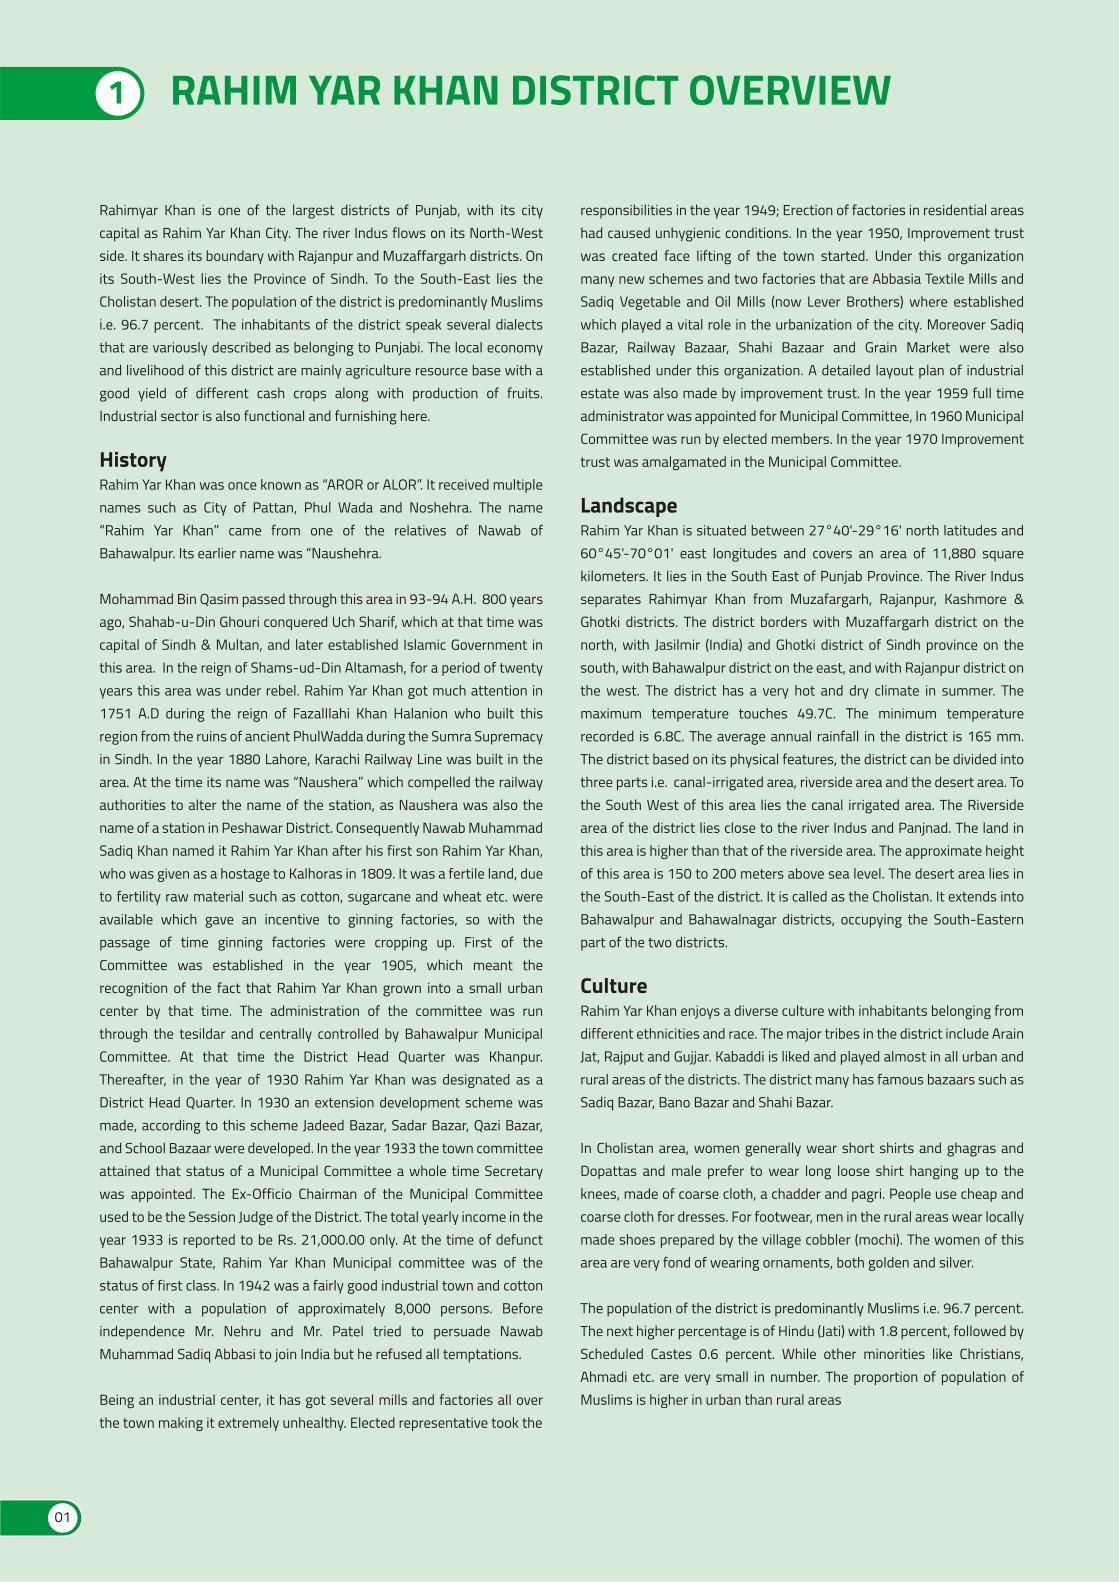
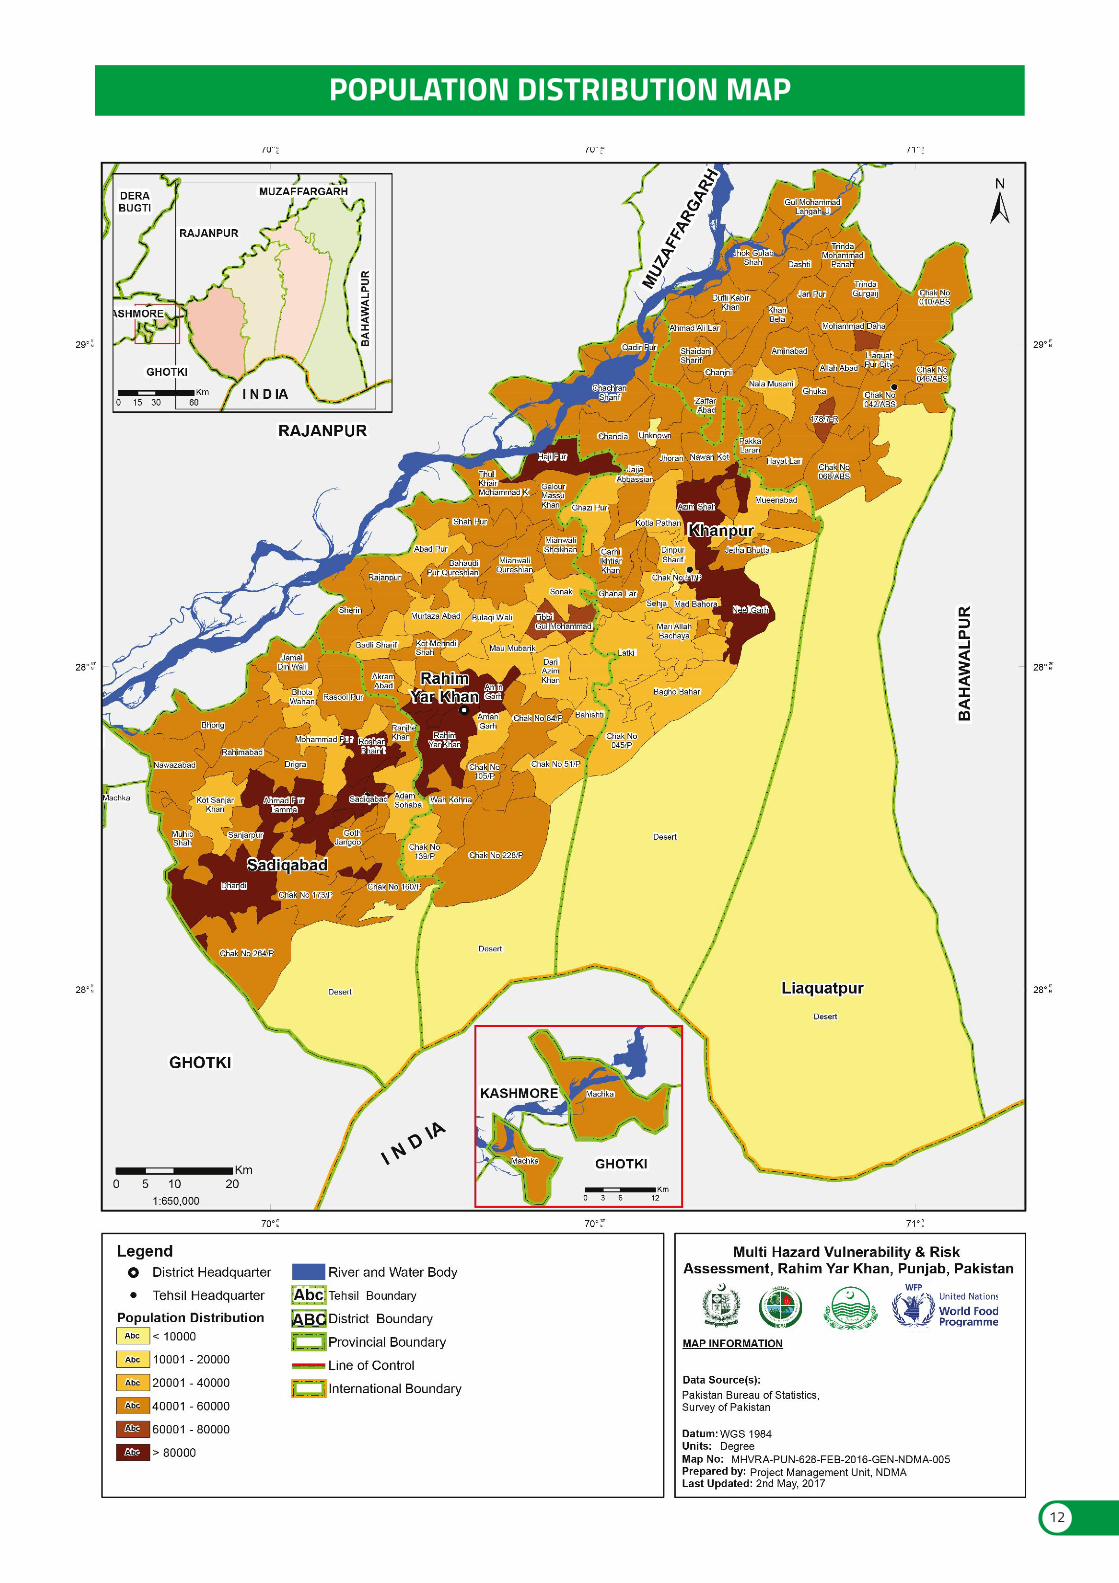
Rahimyar Khan is one of the largest districts of Punjab, with its city capital as Rahim Yar Khan City. The river Indus flows on its North-West side. It shares its boundary with Rajanpur and Muzaffargarh districts. On its South-West lies the Province of Sindh. To the South-East lies the Cholistan desert. The population of the district is predominantly Muslims i.e. 96.7 percent. The inhabitants of the district speak several dialects that are variously described as belonging to Punjabi. The local economy and livelihood of this district are mainly agriculture resource base with a good yield of different cash crops along with production of fruits. Industrial sector is also functional and furnishing here.
HistoryRahim Yar Khan was once known as “AROR or ALOR”. It received multiple names such as City of Pattan, Phul Wada and Noshehra. The name “Rahim Yar Khan” came from one of the relatives of Nawab of Bahawalpur. Its earlier name was “Naushehra.
Mohammad Bin Qasim passed through this area in 93-94 A.H. 800 years ago, Shahab-u-Din Ghouri conquered Uch Sharif, which at that time was capital of Sindh & Multan, and later established Islamic Government in this area. In the reign of Shams-ud-Din Altamash, for a period of twenty years this area was under rebel. Rahim Yar Khan got much attention in 1751 A.D during the reign of FazalIlahi Khan Halanion who built this region from the ruins of ancient PhulWadda during the Sumra Supremacy in Sindh. In the year 1880 Lahore, Karachi Railway Line was built in the area. At the time its name was “Naushera” which compelled the railway authorities to alter the name of the station, as Naushera was also the name of a station in Peshawar District. Consequently Nawab Muhammad Sadiq Khan named it Rahim Yar Khan after his first son Rahim Yar Khan, who was given as a hostage to Kalhoras in 1809. It was a fertile land, due to fertility raw material such as cotton, sugarcane and wheat etc. were available which gave an incentive to ginning factories, so with the passage of time ginning factories were cropping up. First of the Committee was established in the year 1905, which meant the recognition of the fact that Rahim Yar Khan grown into a small urban center by that time. The administration of the committee was run through the tesildar and centrally controlled by Bahawalpur Municipal Committee. At that time the District Head Quarter was Khanpur. Thereafter, in the year of 1930 Rahim Yar Khan was designated as a District Head Quarter. In 1930 an extension development scheme was made, according to this scheme Jadeed Bazar, Sadar Bazar, Qazi Bazar, and School Bazaar were developed. In the year 1933 the town committee attained that status of a Municipal Committee a whole time Secretary was appointed. The Ex-Officio Chairman of the Municipal Committee used to be the Session Judge of the District. The total yearly income in the year 1933 is reported to be Rs. 21,000.00 only. At the time of defunct Bahawalpur State, Rahim Yar Khan Municipal committee was of the status of first class. In 1942 was a fairly good industrial town and cotton center with a population of approximately 8,000 persons. Before independence Mr. Nehru and Mr. Patel tried to persuade Nawab Muhammad Sadiq Abbasi to join India but he refused all temptations.
Being an industrial center, it has got several mills and factories all over the town making it extremely unhealthy. Elected representative took the
01
responsibilities in the year 1949; Erection of factories in residential areas had caused unhygienic conditions. In the year 1950, Improvement trust was created face lifting of the town started. Under this organization many new schemes and two factories that are Abbasia Textile Mills and Sadiq Vegetable and Oil Mills (now Lever Brothers) where established which played a vital role in the urbanization of the city. Moreover Sadiq Bazar, Railway Bazaar, Shahi Bazaar and Grain Market were also established under this organization. A detailed layout plan of industrial estate was also made by improvement trust. In the year 1959 full time administrator was appointed for Municipal Committee, In 1960 Municipal Committee was run by elected members. In the year 1970 Improvement trust was amalgamated in the Municipal Committee.
LandscapeRahim Yar Khan is situated between 27°40'-29°16' north latitudes and 60°45'-70°01' east longitudes and covers an area of 11,880 square kilometers. It lies in the South East of Punjab Province. The River Indus separates Rahimyar Khan from Muzafargarh, Rajanpur, Kashmore & Ghotki districts. The district borders with Muzaffargarh district on the north, with Jasilmir (India) and Ghotki district of Sindh province on the south, with Bahawalpur district on the east, and with Rajanpur district on the west. The district has a very hot and dry climate in summer. The maximum temperature touches 49.7C. The minimum temperature recorded is 6.8C. The average annual rainfall in the district is 165 mm. The district based on its physical features, the district can be divided into three parts i.e. canal-irrigated area, riverside area and the desert area. To the South West of this area lies the canal irrigated area. The Riverside area of the district lies close to the river Indus and Panjnad. The land in this area is higher than that of the riverside area. The approximate height of this area is 150 to 200 meters above sea level. The desert area lies in the South-East of the district. It is called as the Cholistan. It extends into Bahawalpur and Bahawalnagar districts, occupying the South-Eastern part of the two districts.
CultureRahim Yar Khan enjoys a diverse culture with inhabitants belonging from different ethnicities and race. The major tribes in the district include Arain Jat, Rajput and Gujjar. Kabaddi is liked and played almost in all urban and rural areas of the districts. The district many has famous bazaars such as Sadiq Bazar, Bano Bazar and Shahi Bazar.
In Cholistan area, women generally wear short shirts and ghagras and Dopattas and male prefer to wear long loose shirt hanging up to the knees, made of coarse cloth, a chadder and pagri. People use cheap and coarse cloth for dresses. For footwear, men in the rural areas wear locally made shoes prepared by the village cobbler (mochi). The women of this area are very fond of wearing ornaments, both golden and silver.
The population of the district is predominantly Muslims i.e. 96.7 percent. The next higher percentage is of Hindu (Jati) with 1.8 percent, followed by Scheduled Castes 0.6 percent. While other minorities like Christians, Ahmadi etc. are very small in number. The proportion of population of Muslims is higher in urban than rural areas
02
LanguageMajor languages spoken in the district are Saraiki and variety of Punjabi dialects including thaochi, jandali, shanpuri Riasti, Majhi, Malwi, Bagri/Choolistani and Haryanvi. Urdu is spoken and understood by majority of population whereas English is understood by people with higher education background.
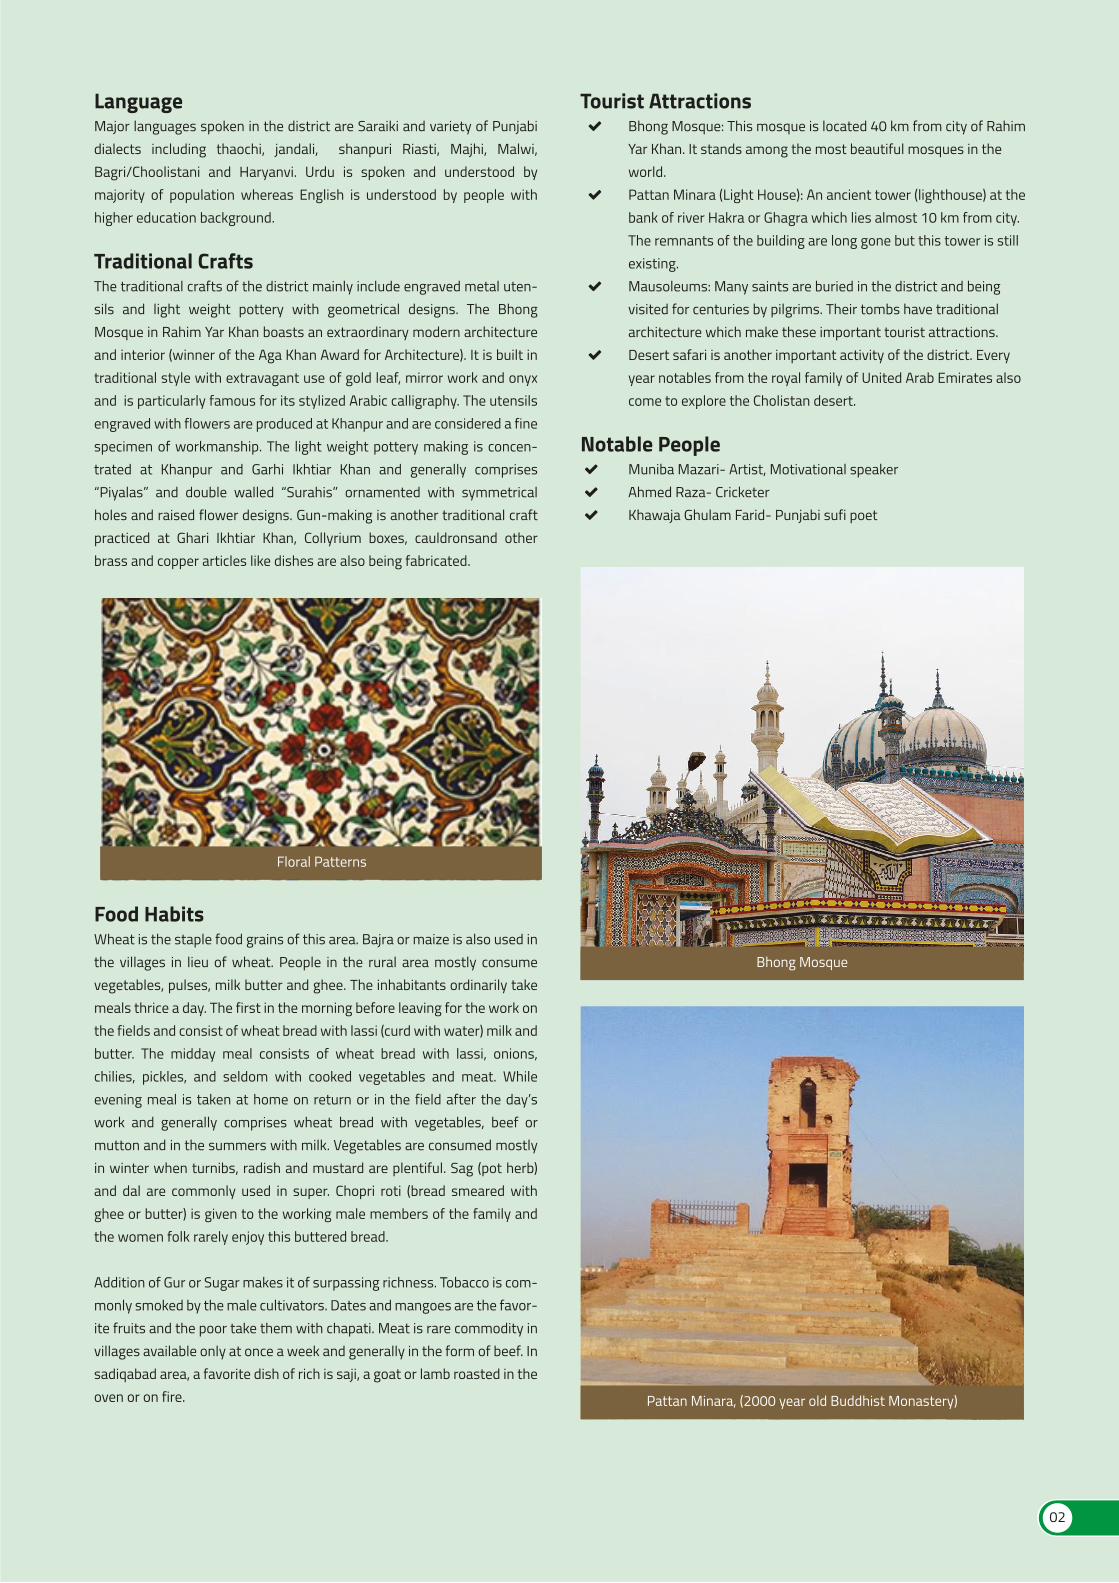
Traditional CraftsThe traditional crafts of the district mainly include engraved metal uten-sils and light weight pottery with geometrical designs. The Bhong Mosque in Rahim Yar Khan boasts an extraordinary modern architecture and interior (winner of the Aga Khan Award for Architecture). It is built in traditional style with extravagant use of gold leaf, mirror work and onyx and is particularly famous for its stylized Arabic calligraphy. The utensils engraved with flowers are produced at Khanpur and are considered a fine specimen of workmanship. The light weight pottery making is concen-trated at Khanpur and Garhi Ikhtiar Khan and generally comprises “Piyalas” and double walled “Surahis” ornamented with symmetrical holes and raised flower designs. Gun-making is another traditional craft practiced at Ghari Ikhtiar Khan, Collyrium boxes, cauldronsand other brass and copper articles like dishes are also being fabricated.
Tourist Attractions Bhong Mosque: This mosque is located 40 km from city of Rahim Yar Khan. It stands among the most beautiful mosques in the world. Pattan Minara (Light House): An ancient tower (lighthouse) at the bank of river Hakra or Ghagra which lies almost 10 km from city. The remnants of the building are long gone but this tower is still existing. Mausoleums: Many saints are buried in the district and being visited for centuries by pilgrims. Their tombs have traditional architecture which make these important tourist attractions. Desert safari is another important activity of the district. Every year notables from the royal family of United Arab Emirates also come to explore the Cholistan desert.
Notable People Muniba Mazari- Artist, Motivational speaker Ahmed Raza- Cricketer Khawaja Ghulam Farid- Punjabi sufi poet
Food HabitsWheat is the staple food grains of this area. Bajra or maize is also used in the villages in lieu of wheat. People in the rural area mostly consume vegetables, pulses, milk butter and ghee. The inhabitants ordinarily take meals thrice a day. The first in the morning before leaving for the work on the fields and consist of wheat bread with lassi (curd with water) milk and butter. The midday meal consists of wheat bread with lassi, onions, chilies, pickles, and seldom with cooked vegetables and meat. While evening meal is taken at home on return or in the field after the day’s work and generally comprises wheat bread with vegetables, beef or mutton and in the summers with milk. Vegetables are consumed mostly in winter when turnibs, radish and mustard are plentiful. Sag (pot herb) and dal are commonly used in super. Chopri roti (bread smeared with ghee or butter) is given to the working male members of the family and the women folk rarely enjoy this buttered bread.
Addition of Gur or Sugar makes it of surpassing richness. Tobacco is com-monly smoked by the male cultivators. Dates and mangoes are the favor-ite fruits and the poor take them with chapati. Meat is rare commodity in villages available only at once a week and generally in the form of beef. In sadiqabad area, a favorite dish of rich is saji, a goat or lamb roasted in the oven or on fire.
Bhong Mosque
Pattan Minara, (2000 year old Buddhist Monastery)
Floral Patterns
Govt. Schools Colleges Universities
3,236 10 2Educational
FacilitiesPublic Health Care Facilites
(Numbers)
137
Tourist Attractions
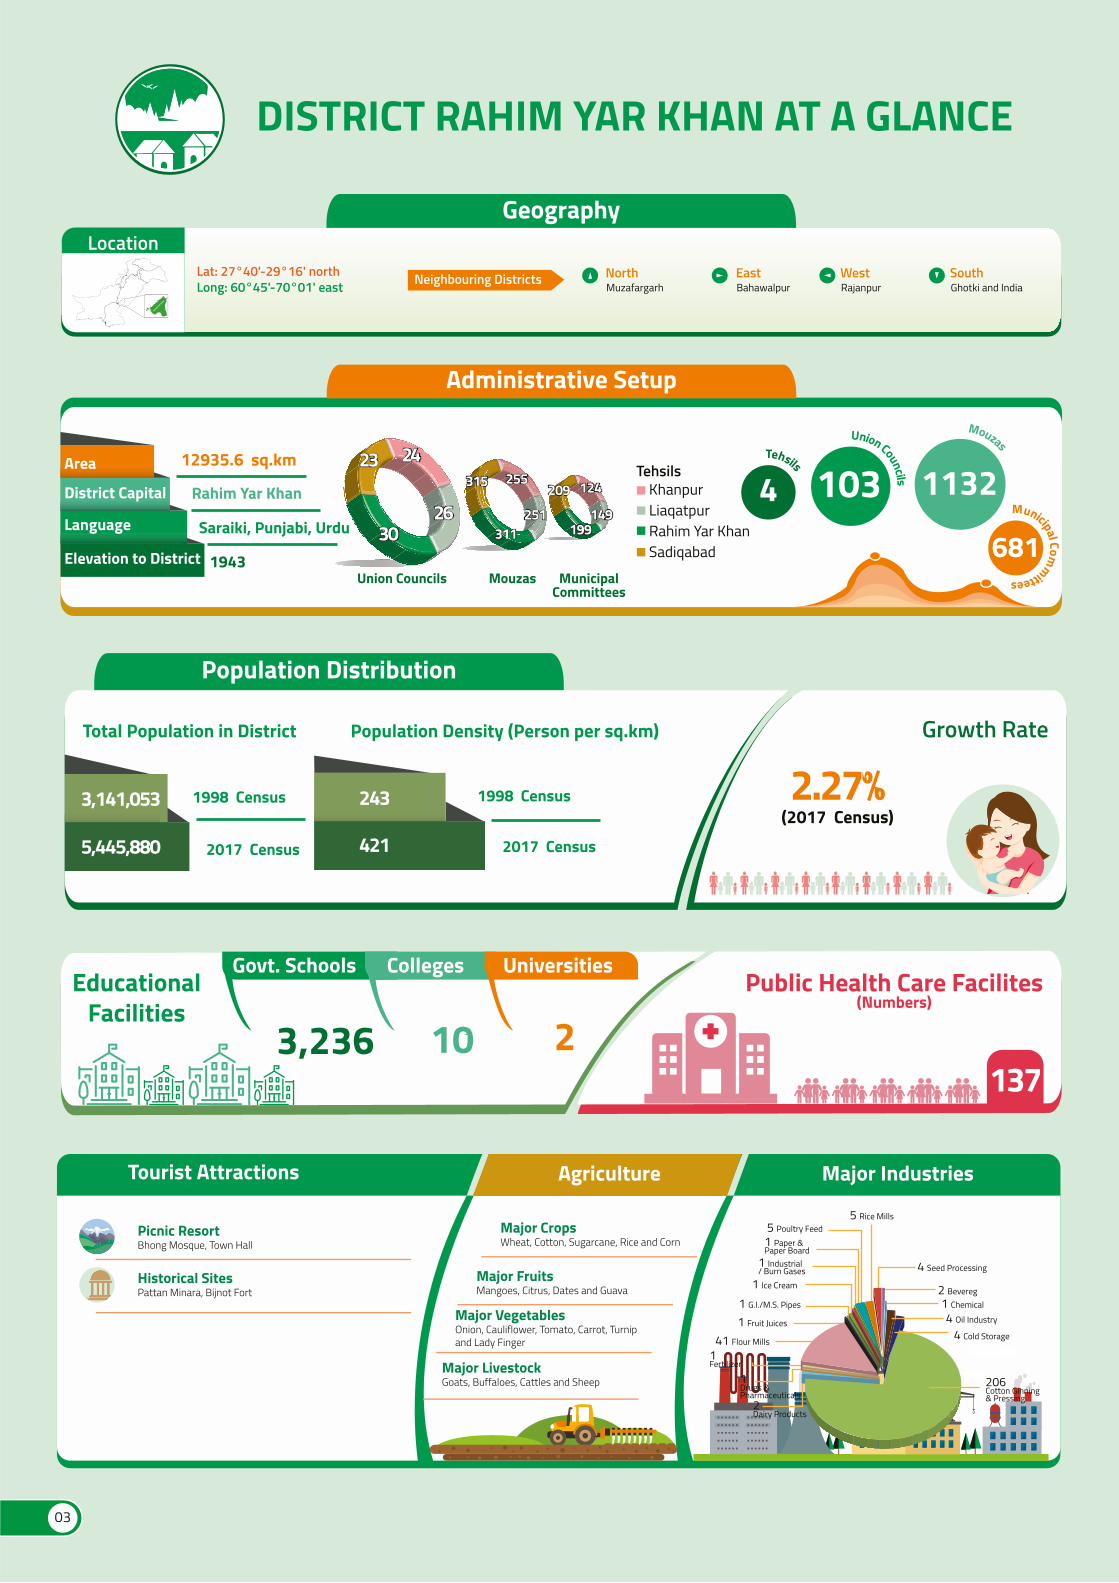
Major CropsWheat, Cotton, Sugarcane, Rice and Corn
Major FruitsMangoes, Citrus, Dates and Guava
Major VegetablesOnion, Cauliflower, Tomato, Carrot, Turnipand Lady Finger
Major LivestockGoats, Buffaloes, Cattles and Sheep
Agriculture Major Industries
Picnic ResortBhong Mosque, Town Hall
Historical SitesPattan Minara, Bijnot Fort
2Dairy Products
1Drugs &Pharmaceuticals
1Fertilizer
1 Chemical 2 Bevereg
4 Seed Processing
5 Rice Mills 5 Poultry Feed 1 Paper &Paper Board
1 G.I./M.S. Pipes
1 Ice Cream
41 Flour Mills
1 Fruit Juices
1 Industrial/ Burn Gases
206Cotton Ginning& Pressing
4 Oil Industry
4 Cold Storage
DISTRICT RAHIM YAR KHAN AT A GLANCE
Lat: 27°40'-29°16' north Long: 60°45'-70°01' east Neighbouring Districts North
MuzafargarhEastBahawalpur
WestRajanpur
SouthGhotki and India
Geography
Tehsils
4
Union Councils103Mouzas
1132Municipal Com
mittees
681
Rahim Yar Khan
12935.6 sq.km
Saraiki, Punjabi, Urdu
District Capital
Language
Area
Elevation to District 1943
TehsilsKhanpurLiaqatpurRahim Yar KhanSadiqabad
Union Councils Mouzas MunicipalCommittees
2424
30302626
255255
251251311311
315315 124124
149149199199
209209
2323
Administrative Setup
Growth Rate
2.27%(2017 Census)
Total Population in District Population Density (Person per sq.km)
3,141,053
5,445,880
1998 Census
2017 Census
243
421
1998 Census
2017 Census
Population Distribution
Location
03
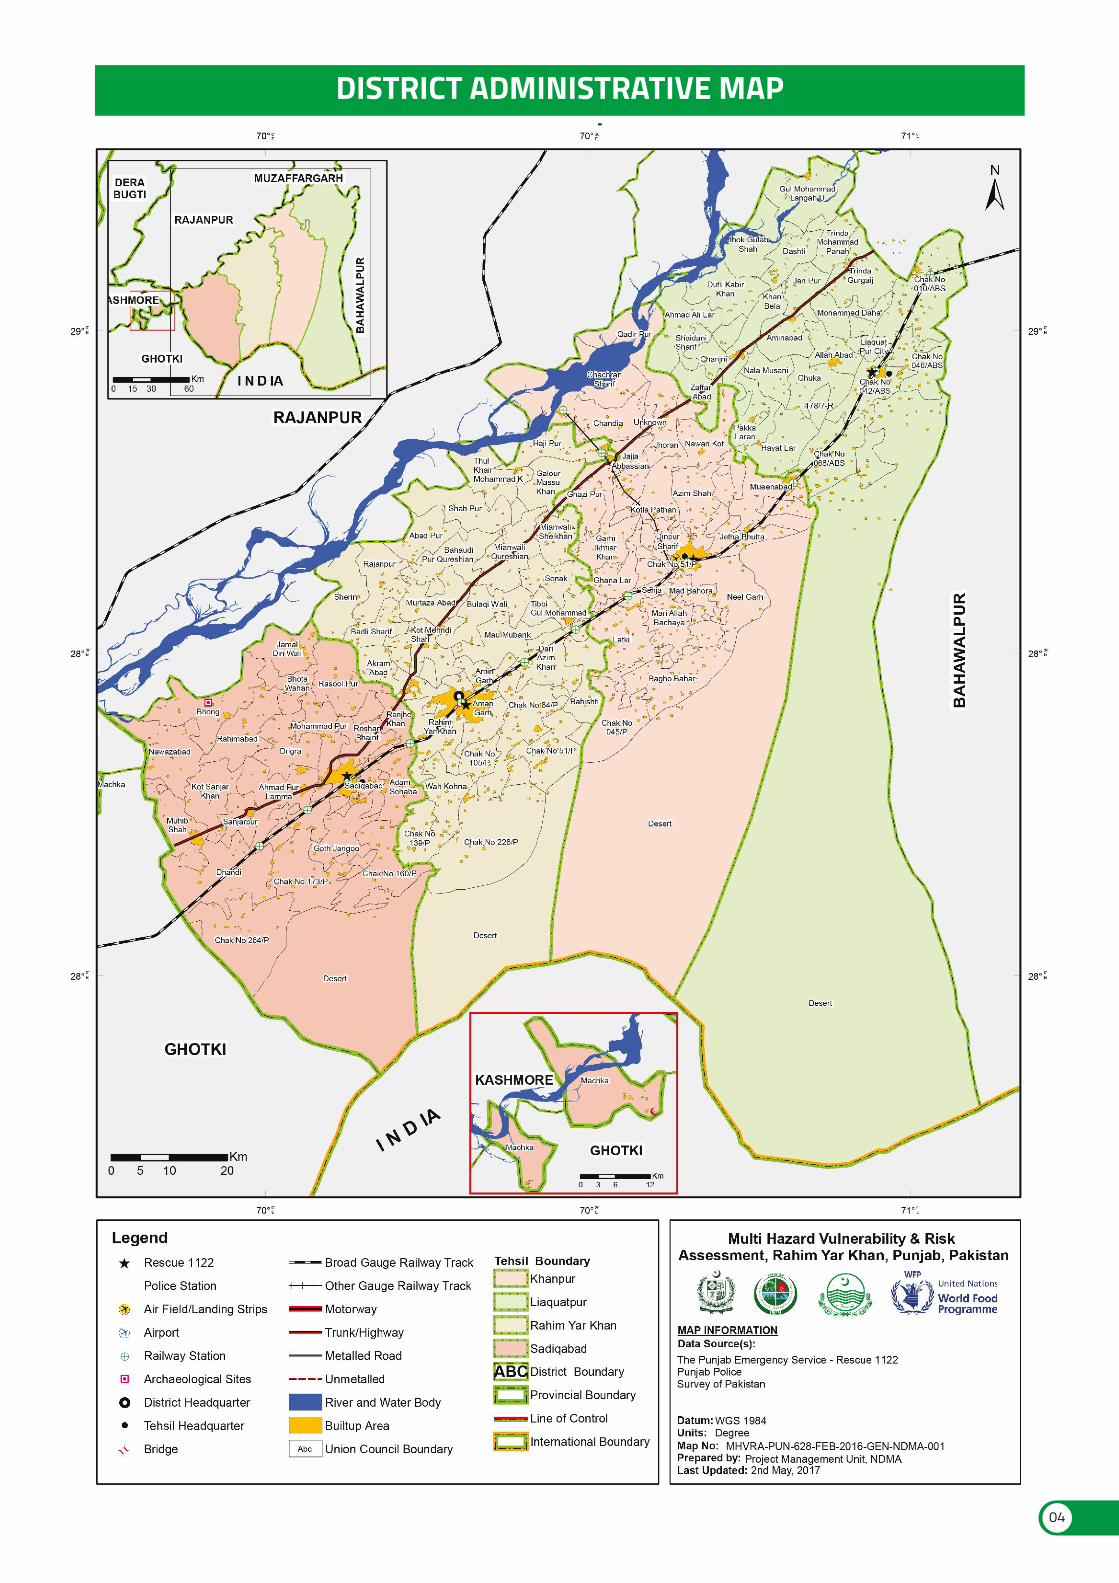
DISTRICT ADMINISTRATIVE MAP
04
28.04%
3.06%
13.24%
1.04%
17.70%
2.79%
13.55%
20.58%
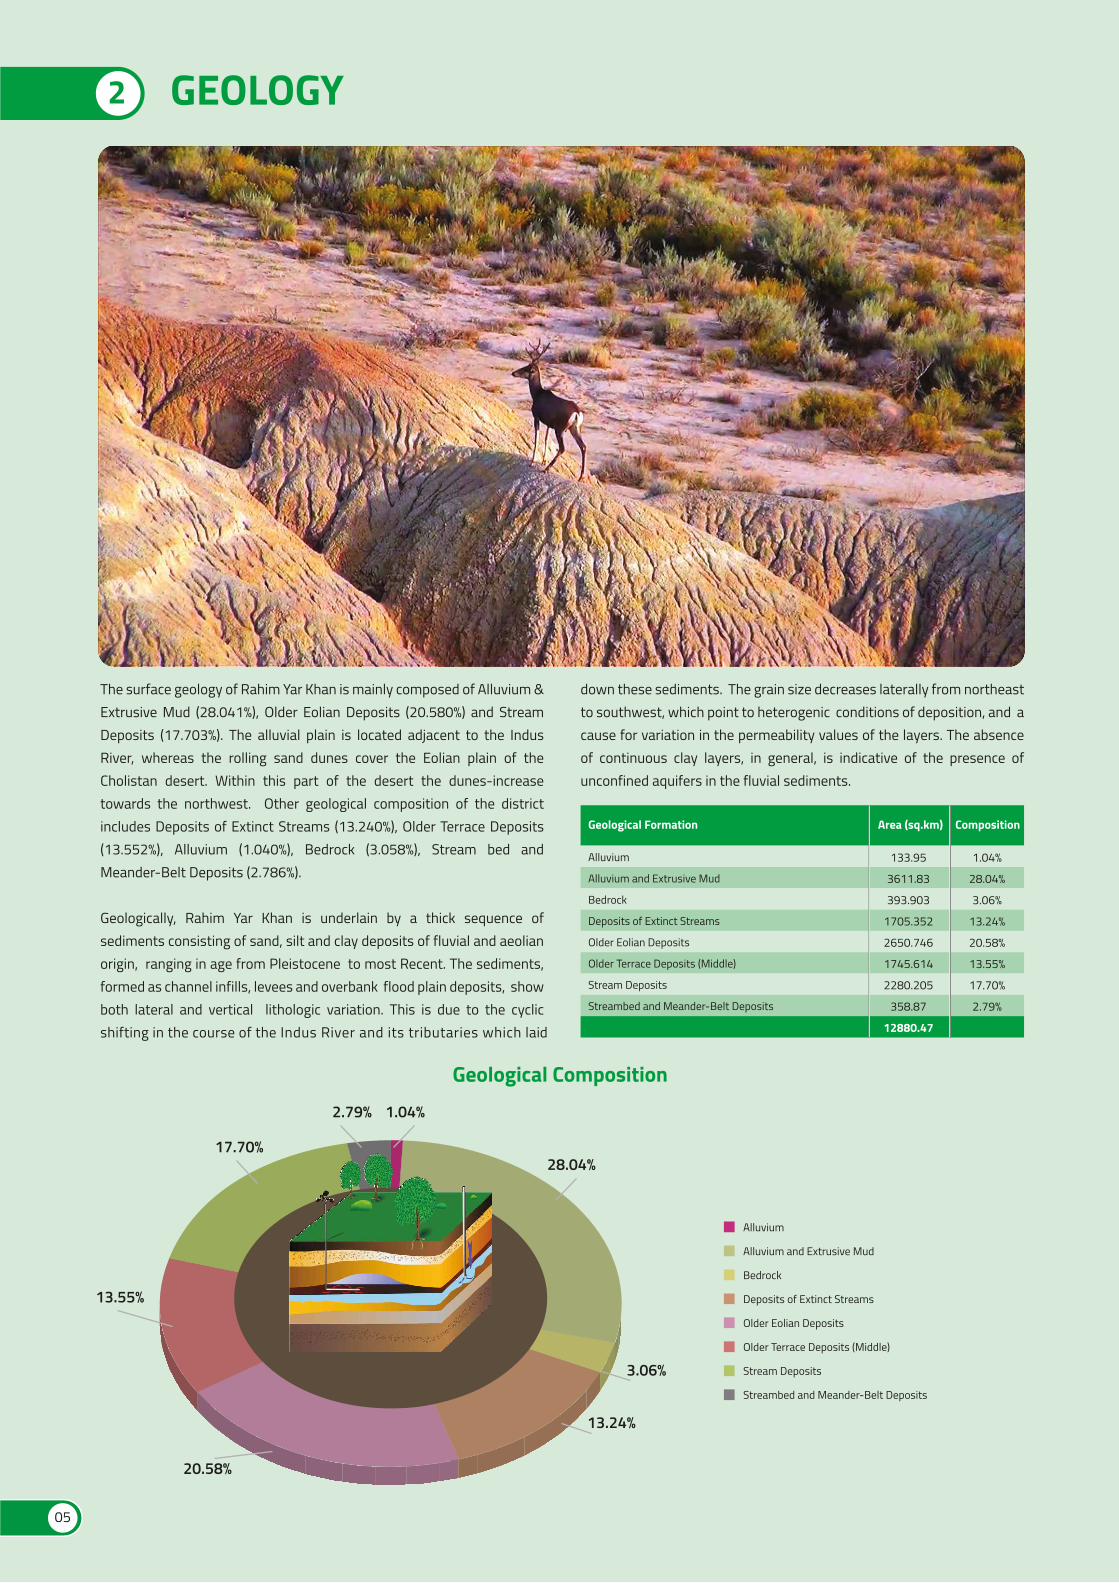
The surface geology of Rahim Yar Khan is mainly composed of Alluvium & Extrusive Mud (28.041%), Older Eolian Deposits (20.580%) and Stream Deposits (17.703%). The alluvial plain is located adjacent to the Indus River, whereas the rolling sand dunes cover the Eolian plain of the Cholistan desert. Within this part of the desert the dunes-increase towards the northwest. Other geological composition of the district includes Deposits of Extinct Streams (13.240%), Older Terrace Deposits (13.552%), Alluvium (1.040%), Bedrock (3.058%), Stream bed and Meander-Belt Deposits (2.786%).
Geologically, Rahim Yar Khan is underlain by a thick sequence of sediments consisting of sand, silt and clay deposits of fluvial and aeolian origin, ranging in age from Pleistocene to most Recent. The sediments, formed as channel infills, levees and overbank flood plain deposits, show both lateral and vertical lithologic variation. This is due to the cyclic shifting in the course of the Indus River and its tributaries which laid
2 GEOLOGY
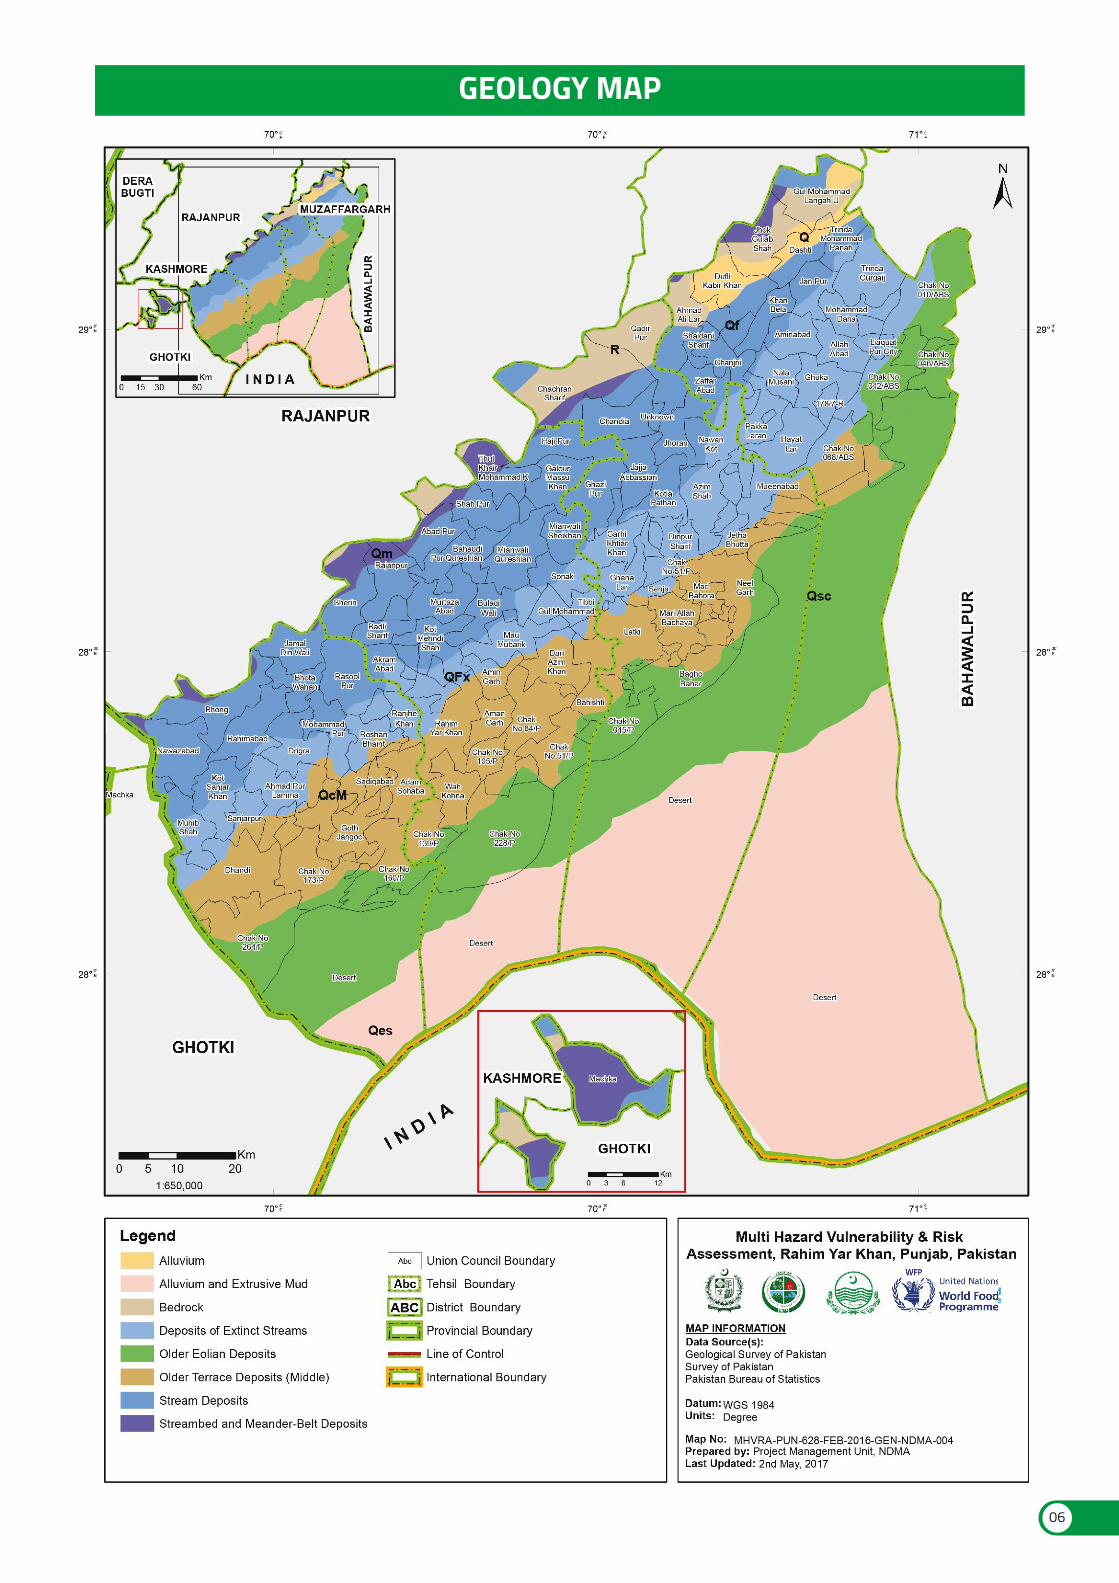
Alluvium
Alluvium and Extrusive Mud
Bedrock
Deposits of Extinct Streams
Older Eolian Deposits
Older Terrace Deposits (Middle)
Stream Deposits
Streambed and Meander-Belt Deposits
133.95
3611.83
393.903
1705.352
2650.746
1745.614
2280.205
358.87
12880.47
Geological Formation Area (sq.km) Composition
1.04%
28.04%
3.06%
13.24%
20.58%
13.55%
17.70%
2.79%
Geological Composition
Alluvium
Alluvium and Extrusive Mud
Bedrock
Deposits of Extinct Streams
Older Eolian Deposits
Older Terrace Deposits (Middle)
Stream Deposits
Streambed and Meander-Belt Deposits
down these sediments. The grain size decreases laterally from northeast to southwest, which point to heterogenic conditions of deposition, and a cause for variation in the permeability values of the layers. The absence of continuous clay layers, in general, is indicative of the presence of unconfined aquifers in the fluvial sediments.
05
06
GEOLOGY MAP
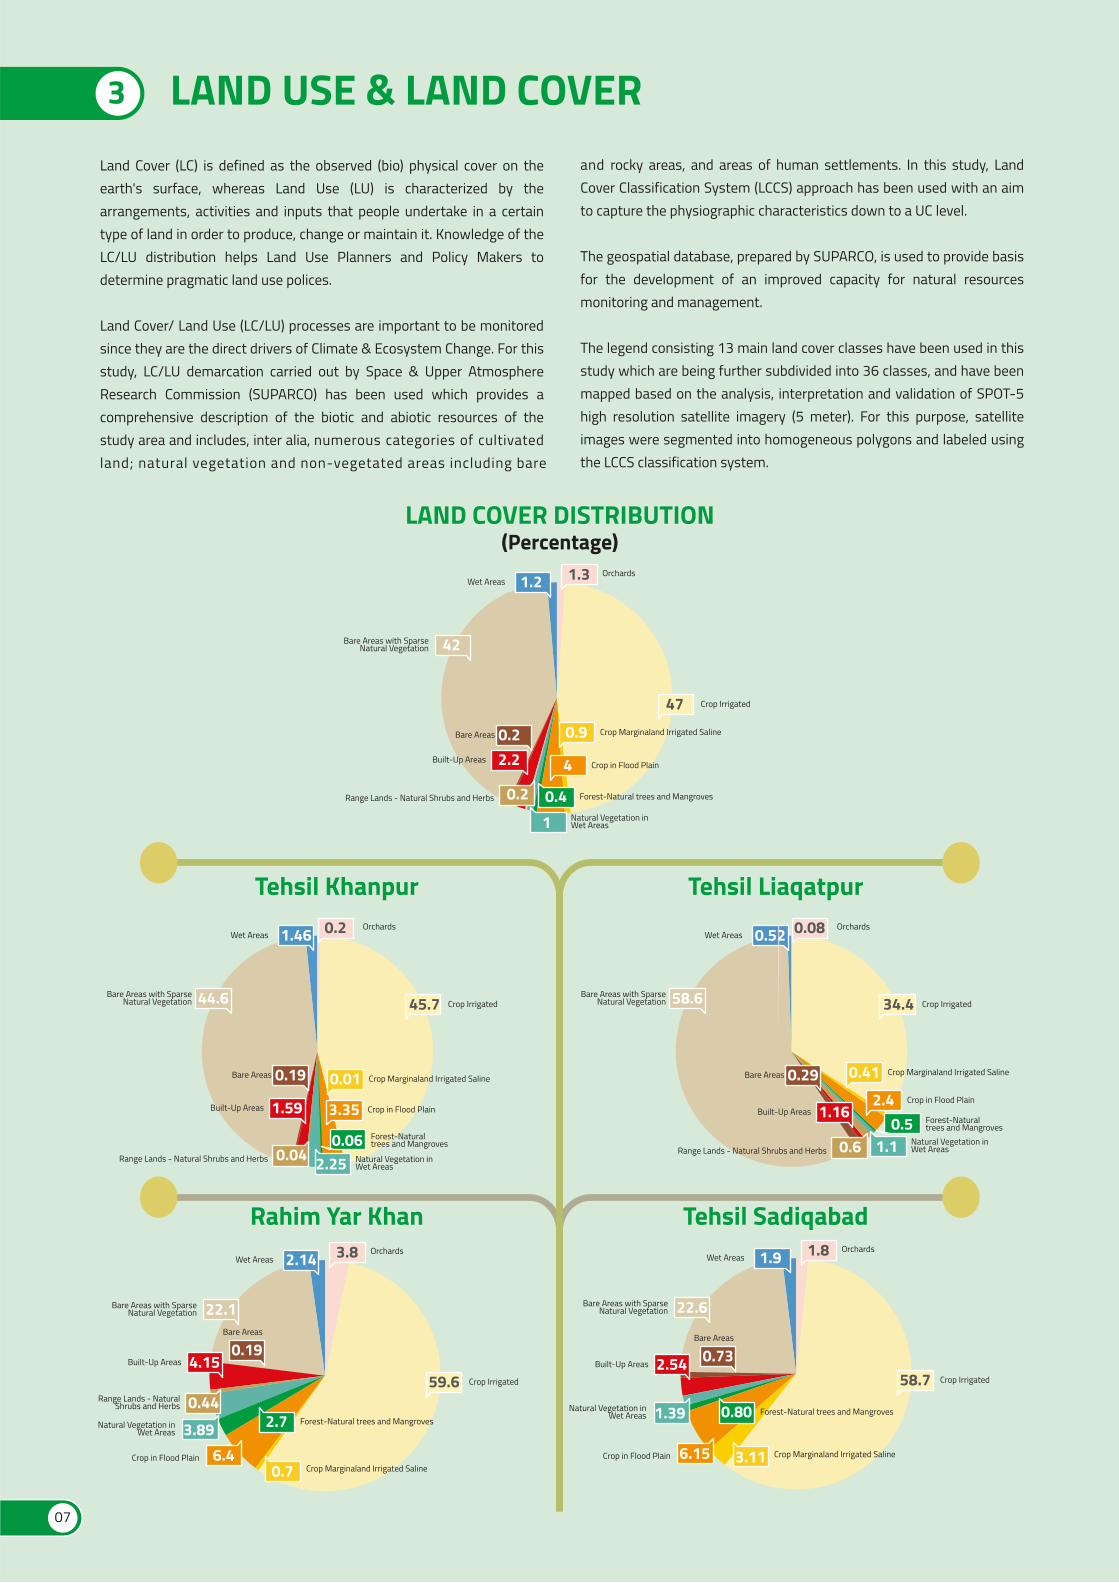
3 LAND USE & LAND COVERLand Cover (LC) is defined as the observed (bio) physical cover on the earth's surface, whereas Land Use (LU) is characterized by the arrangements, activities and inputs that people undertake in a certain type of land in order to produce, change or maintain it. Knowledge of the LC/LU distribution helps Land Use Planners and Policy Makers to determine pragmatic land use polices.
Land Cover/ Land Use (LC/LU) processes are important to be monitored since they are the direct drivers of Climate & Ecosystem Change. For this study, LC/LU demarcation carried out by Space & Upper Atmosphere Research Commission (SUPARCO) has been used which provides a comprehensive description of the biotic and abiotic resources of the study area and includes, inter alia, numerous categories of cultivated land; natural vegetation and non-vegetated areas including bare
and rocky areas, and areas of human settlements. In this study, Land Cover Classification System (LCCS) approach has been used with an aim to capture the physiographic characteristics down to a UC level.
The geospatial database, prepared by SUPARCO, is used to provide basis for the development of an improved capacity for natural resources monitoring and management.
The legend consisting 13 main land cover classes have been used in this study which are being further subdivided into 36 classes, and have been mapped based on the analysis, interpretation and validation of SPOT-5 high resolution satellite imagery (5 meter). For this purpose, satellite images were segmented into homogeneous polygons and labeled using the LCCS classification system.
07
LAND COVER DISTRIBUTION(Percentage)
Tehsil Khanpur Tehsil Liaqatpur
Rahim Yar Khan Tehsil Sadiqabad
Crop Marginaland Irrigated Saline
Orchards
Built-Up Areas
Crop Irrigated
Wet Areas 1.2
Bare Areas 0.2
Bare Areas with SparseNatural Vegetation 42
47
1.3
0.9
Crop in Flood Plain4
Forest-Natural trees and Mangroves0.4Natural Vegetation inWet Areas1
2.2
Range Lands - Natural Shrubs and Herbs 0.2
Crop Marginaland Irrigated Saline
Orchards
Built-Up Areas
Crop Irrigated
Wet Areas 2.14
Bare Areas
0.19
Bare Areas with SparseNatural Vegetation 22.1
59.6
3.8
0.7Crop in Flood Plain 6.4
Forest-Natural trees and Mangroves2.7Natural Vegetation inWet Areas 3.89
4.15
Range Lands - NaturalShrubs and Herbs 0.44
Crop Marginaland Irrigated Saline
Orchards
Built-Up Areas
Crop Irrigated
Wet Areas 1.9
Bare Areas
0.73
Bare Areas with SparseNatural Vegetation 22.6
58.7
1.8
3.11Crop in Flood Plain 6.15
Forest-Natural trees and Mangroves0.80Natural Vegetation inWet Areas 1.39
2.54
Crop Marginaland Irrigated Saline
Orchards
Built-Up Areas
Crop Irrigated
Wet Areas 0.52
Bare Areas 0.29
Bare Areas with SparseNatural Vegetation 58.6 34.4
0.08
0.41Crop in Flood Plain2.4
Forest-Naturaltrees and Mangroves0.5
Natural Vegetation inWet Areas1.1
1.16
Range Lands - Natural Shrubs and Herbs 0.6
Crop Marginaland Irrigated Saline
Orchards
Built-Up Areas
Crop Irrigated
Wet Areas 1.46
Bare Areas 0.19
Bare Areas with SparseNatural Vegetation 44.6 45.7
0.2
0.01
Crop in Flood Plain3.35Forest-Naturaltrees and Mangroves0.06
Natural Vegetation inWet Areas2.25
1.59
Range Lands - Natural Shrubs and Herbs 0.04
0808
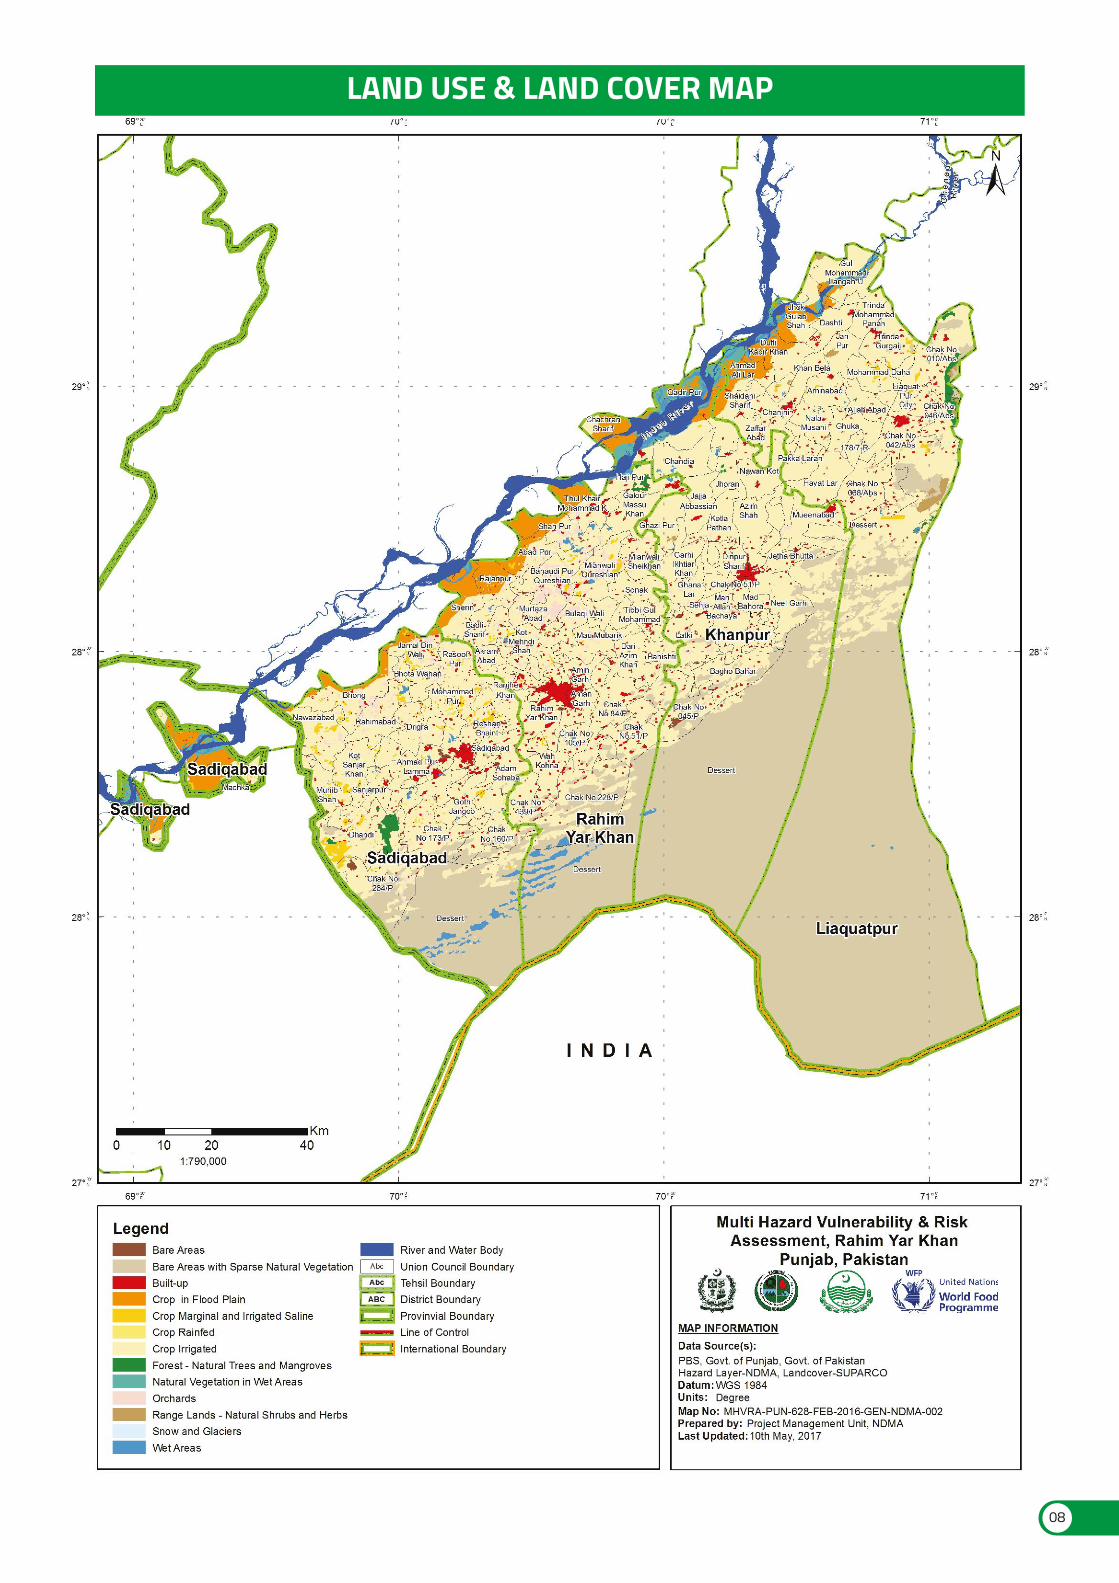
LAND USE & LAND COVER MAP
09
19 – 50m
51 – 100m
101 – 150m
151 – 200m
201 – 251m
0.72
10905.91
1979.34
49.35
0.12
ElevationBands
District Total(sq.km)
-
2957.87
118.57
0.00
-
-
2795.41
1814.77
48.67
-
0.70
2537.91
21.47
0.36
0.10
0.02
2614.28
24.40
0.31
0.01
Khanpur Liaquatpur Sadiqabad Rahim Yar Khan
Tehsil Wise Area Coverage (sq.km)
Khan
pur
Liaq
uatp
ur
Sadi
qaba
d
Rahi
m Y
ar K
han
83.7
104.12
84.84 78.67
Tehsil Wise Mean Height(Meter)
Elevation Distribution ofDistrict Rahim Yar Khan
2,000 4,000 6,000 8,000 10,000 12,0000
19 – 50m
51 – 100m
101 – 150m
151 – 200m
201 – 251m
Elev
atio
n (M
eter
)
Area in sq.km
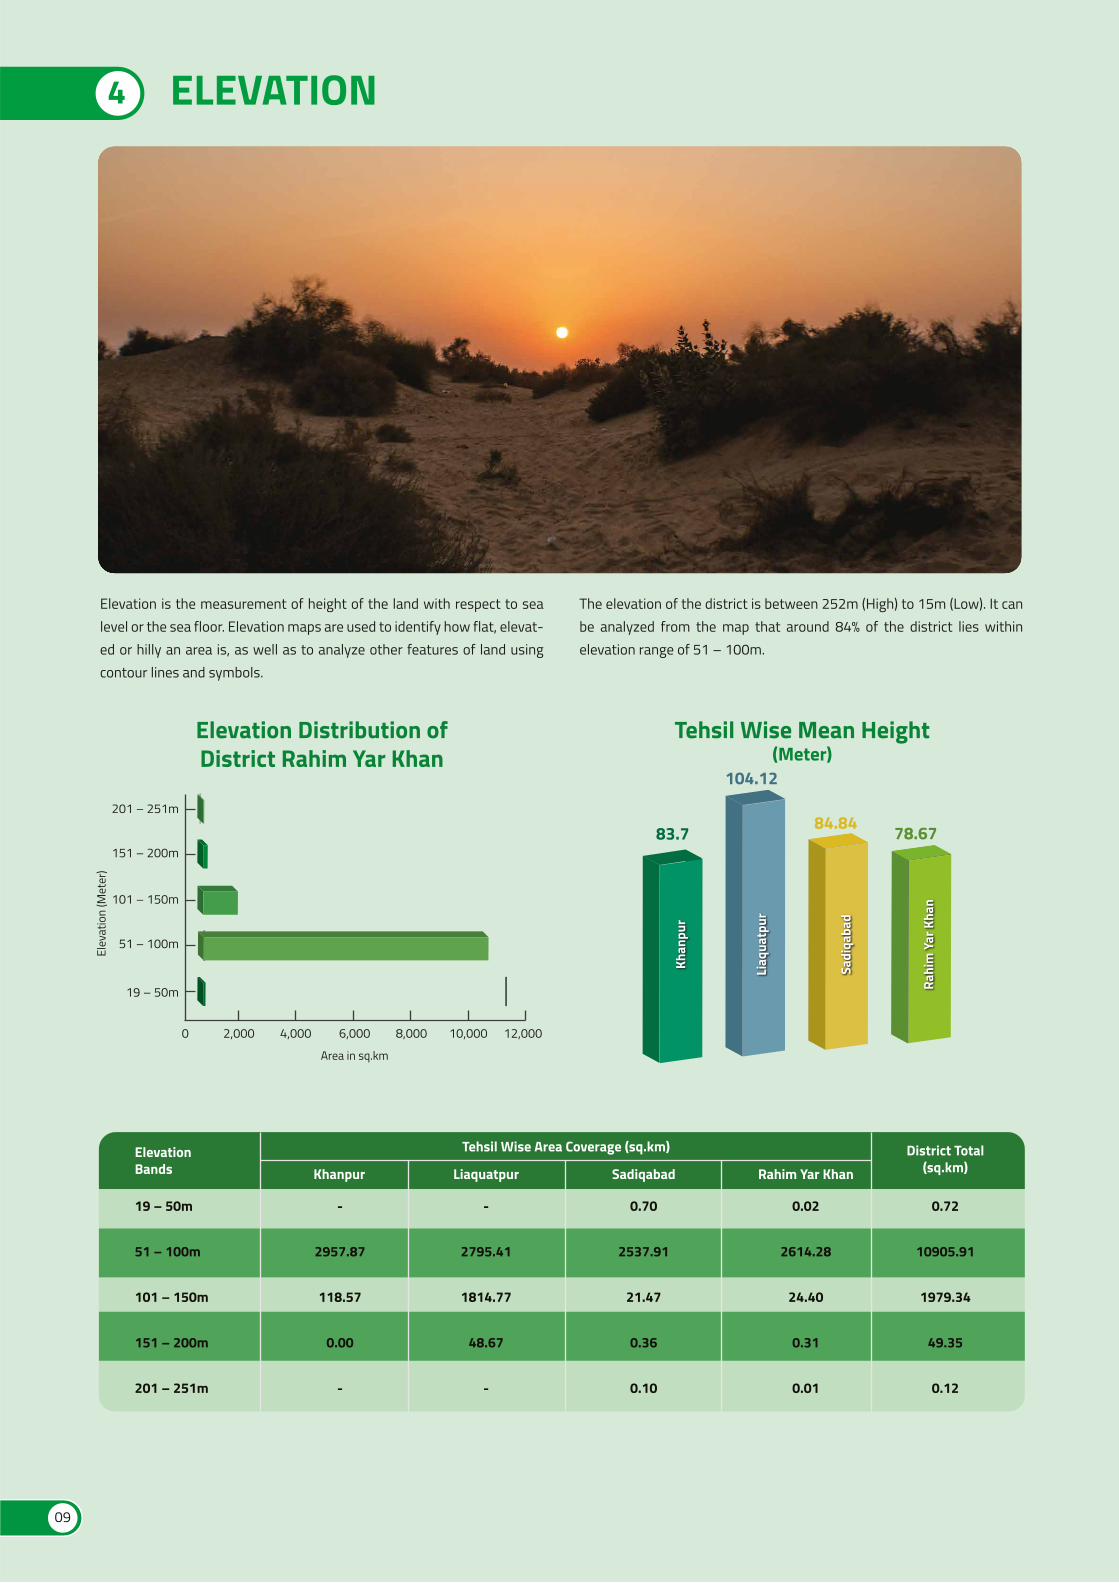
Elevation is the measurement of height of the land with respect to sea level or the sea floor. Elevation maps are used to identify how flat, elevat-ed or hilly an area is, as well as to analyze other features of land using contour lines and symbols.
The elevation of the district is between 252m (High) to 15m (Low). It can be analyzed from the map that around 84% of the district lies within elevation range of 51 – 100m.
4 ELEVATION
09
MUZAFFARGARHMUZAFFARGARH
SadiqabadSadiqabad
Rahim Yar KhanRahim Yar Khan
KhanpurKhanpur
LiaquatpurLiaquatpur
10
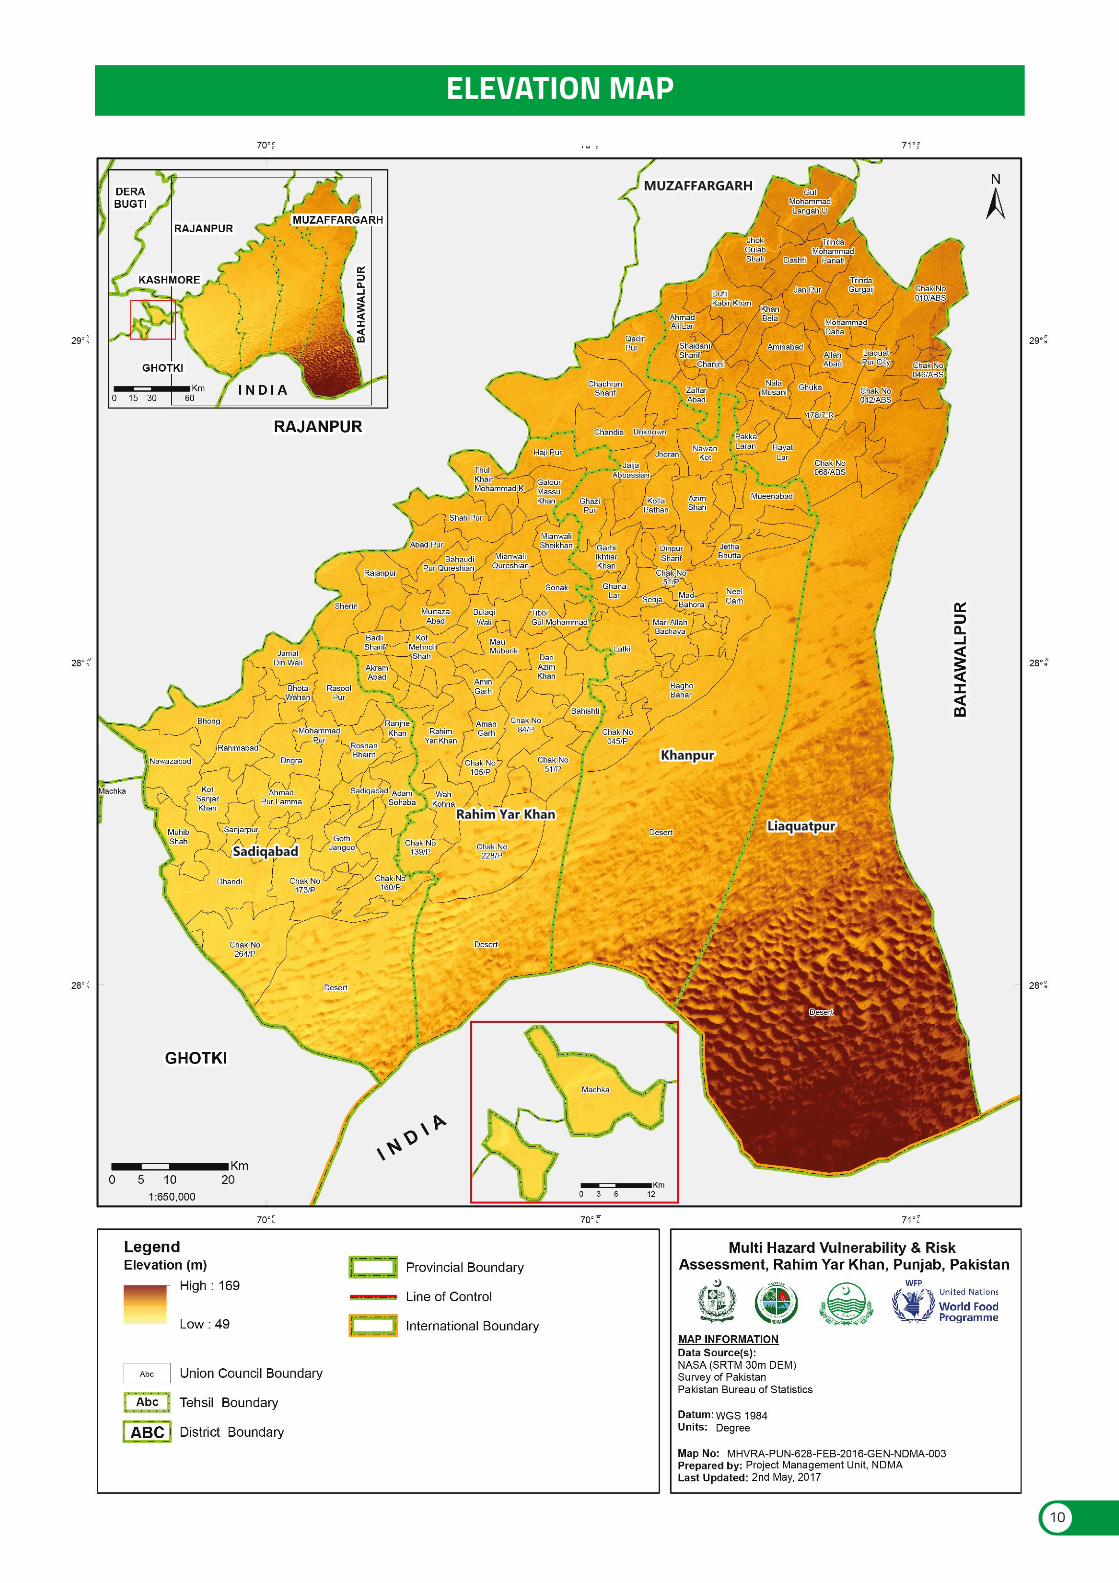
ELEVATION MAP
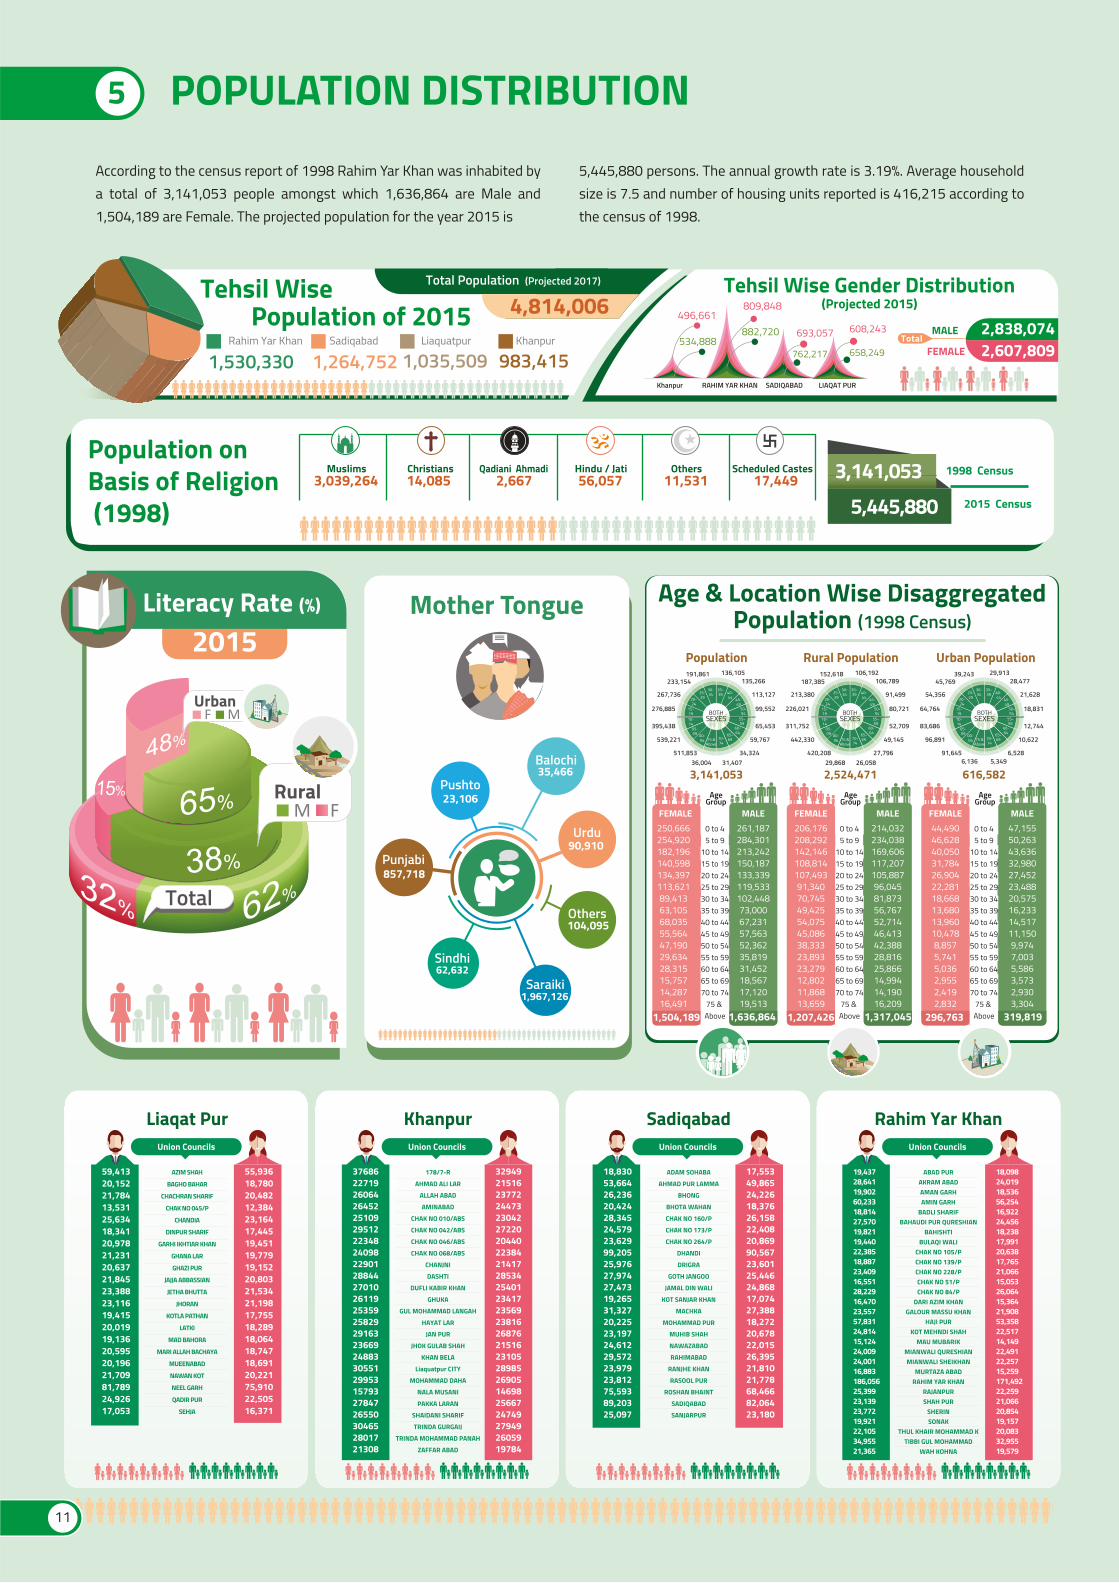
5 POPULATION DISTRIBUTION
Tehsil WisePopulation of 2015
1,530,330
496,661809,848
693,057534,888
762,217
RAHIM YAR KHAN Khanpur SADIQABAD LIAQAT PUR
Rahim Yar Khan Sadiqabad Liaquatpur Khanpur
1,264,752 1,035,509 983,415
Total Population (Projected 2017)
4,814,006608,243
658,249
MALE 2,838,0742,607,809FEMALE
Total
Tehsil Wise Gender Distribution(Projected 2015)
882,720
TotalTotalTotalTotalTotalTotal
T
Population onBasis of Religion (1998) 5,445,880
1998 Census
2015 Census
3,141,05314,085Christians
2,667Qadiani Ahmadi
56,057Hindu / Jati
3,039,264Muslims Others
11,531Scheduled Castes
17,449
48%
62%
65%
32%
RuralM F
Total38%
MFUrban
15%
2015Literacy Rate (%)
2015
Mother Tongue
857,718
Urdu90,910
Pushto
Punjabi
23,106
Sindhi62,632
Saraiki1,967,126
Balochi35,466
104,095Others
3,141,053 2,524,471 616,582Age
Group
250,666254,920182,196140,598134,397113,62189,41363,10568,03555,56447,19029,63428,31515,75714,28716,491
0 to 45 to 9
10 to 1415 to 1920 to 2425 to 2930 to 3435 to 3940 to 4445 to 4950 to 5455 to 5960 to 6465 to 6970 to 74
75 & Above
261,187284,301213,242150,187133,339119,533102,44873,00067,23157,56352,36235,81931,45218,56717,12019,513
1,636,8641,504,189
FEMALE MALE
AgeGroup
206,176208,292142,146108,814107,49391,34070,74549,42554,07545,08638,33323,89323,27912,80211,86813,659
0 to 45 to 9
10 to 1415 to 1920 to 2425 to 2930 to 3435 to 3940 to 4445 to 4950 to 5455 to 5960 to 6465 to 6970 to 74
75 & Above
214,032234,038169,606117,207105,88796,04581,87356,76752,71446,41342,38828,81625,86614,99414,19016,209
1,317,0451,207,426
FEMALE MALE
AgeGroup
44,49046,62840,05031,78426,90422,28118,66813,68013,96010,4788,8575,7415,0362,9552,4192,832
0 to 45 to 9
10 to 1415 to 1920 to 2425 to 2930 to 3435 to 3940 to 4445 to 4950 to 5455 to 5960 to 6465 to 6970 to 74
75 & Above
47,15550,26343,63632,98027,45223,48820,57516,23314,51711,1509,9747,0035,5863,5732,9303,304
319,819296,763
FEMALE MALE
Population Rural Population Urban Population
Age & Location Wise DisaggregatedPopulation (1998 Census)
BOTHSEXES
191,861233,154
267,736
276,885
395,438
136,105135,266
113,127
99,552
65,453
59,767539,221
34,32436,004 31,407
511,853
30-3425-
2940-4420-
2445-49
50-54
55-59
15-1910-14
05-09 00-
04 75 &Above
70-74
65-69
60-64
35-39
BOTHSEXES
152,618187,385
213,380
226,021
311,752
106,192106,789
91,499
80,721
52,709
49,145442,330
27,79629,868 26,058
420,208
30-3425-
2940-4420-
2445-49
50-54
55-59
15-1910-14
05-09 00-
04 75 &Above
70-74
65-69
60-64
35-39
BOTHSEXES
39,24345,769
54,356
64,764
83,686
29,91328,477
21,628
18,831
12,744
10,62296,891
6,5286,136 5,349
91,645
30-3425-
2940-4420-
2445-49
50-54
55-59
15-1910-14
05-09 00-
04 75 &Above
70-74
65-69
60-64
35-39
According to the census report of 1998 Rahim Yar Khan was inhabited by a total of 3,141,053 people amongst which 1,636,864 are Male and 1,504,189 are Female. The projected population for the year 2015 is
5,445,880 persons. The annual growth rate is 3.19%. Average household size is 7.5 and number of housing units reported is 416,215 according to the census of 1998.
Liaqat Pur
55,93618,78020,48212,38423,16417,44519,45119,77919,15220,80321,53421,19817,75518,28918,06418,74718,69120,22175,91022,50516,371
59,41320,15221,78413,53125,63418,34120,97821,23120,63721,84523,38823,11619,41520,01919,13620,59520,19621,70981,78924,92617,053
AZIM SHAH
BAGHO BAHAR
CHACHRAN SHARIF
CHAK NO 045/P
CHANDIA
DINPUR SHARIF
GARHI IKHTIAR KHAN
GHANA LAR
GHAZI PUR
JAJJA ABBASSIAN
JETHA BHUTTA
JHORAN
KOTLA PATHAN
LATKI
MAD BAHORA
MARI ALLAH BACHAYA
MUEENABAD
NAWAN KOT
NEEL GARH
QADIR PUR
SEHJA
Union Councils
Khanpur
32949215162377224473230422722020440223842141728534254012341723569238162687621516231052898526905146982566724749279492605919784
37686227192606426452251092951222348240982290128844270102611925359258292916323669248833055129953157932784726550304652801721308
178/7-R
AHMAD ALI LAR
ALLAH ABAD
AMINABAD
CHAK NO 010/ABS
CHAK NO 042/ABS
CHAK NO 046/ABS
CHAK NO 068/ABS
CHANJNI
DASHTI
DUFLI KABIR KHAN
GHUKA
GUL MOHAMMAD LANGAH
HAYAT LAR
JAN PUR
JHOK GULAB SHAH
KHAN BELA
Liaquatpur CITY
MOHAMMAD DAHA
NALA MUSANI
PAKKA LARAN
SHAIDANI SHARIF
TRINDA GURGAIJ
TRINDA MOHAMMAD PANAH
ZAFFAR ABAD
Union Councils
Rahim Yar Khan
18,09824,01918,53656,25416,92224,45618,23817,99120,63817,76521,06615,05326,06415,36421,90853,35822,51714,14922,49122,25715,259171,49222,25921,06620,85419,15720,08332,95519,579
19,43728,64119,90260,23318,81427,57019,82119,44022,38518,88723,40916,55128,22916,47023,55757,83124,81415,12424,00924,00116,883186,05625,39923,13923,77219,92122,10534,95521,365
ABAD PURAKRAM ABADAMAN GARHAMIN GARH
BADLI SHARIFBAHAUDI PUR QURESHIAN
BAHISHTIBULAQI WALI
CHAK NO 105/PCHAK NO 139/PCHAK NO 228/PCHAK NO 51/PCHAK NO 84/P
DARI AZIM KHANGALOUR MASSU KHAN
HAJI PURKOT MEHNDI SHAH
MAU MUBARIKMIANWALI QURESHIANMIANWALI SHEIKHAN
MURTAZA ABADRAHIM YAR KHAN
RAJANPURSHAH PUR
SHERINSONAK
THUL KHAIR MOHAMMAD KTIBBI GUL MOHAMMAD
WAH KOHNA
Union Councils
Sadiqabad
17,55349,86524,22618,37626,15822,40820,86990,56723,60125,44624,86817,07427,38818,27220,67822,01526,39521,81021,77868,46682,06423,180
18,83053,66426,23620,42428,34524,57923,62999,20525,97627,97427,47319,26531,32720,22523,19724,61229,57223,97923,81275,59389,20325,097
ADAM SOHABA
AHMAD PUR LAMMA
BHONG
BHOTA WAHAN
CHAK NO 160/P
CHAK NO 173/P
CHAK NO 264/P
DHANDI
DRIGRA
GOTH JANGOO
JAMAL DIN WALI
KOT SANJAR KHAN
MACHKA
MOHAMMAD PUR
MUHIB SHAH
NAWAZABAD
RAHIMABAD
RANJHE KHAN
RASOOL PUR
ROSHAN BHAINT
SADIQABAD
SANJARPUR
Union Councils
11
POPULATION DISTRIBUTION MAP
12
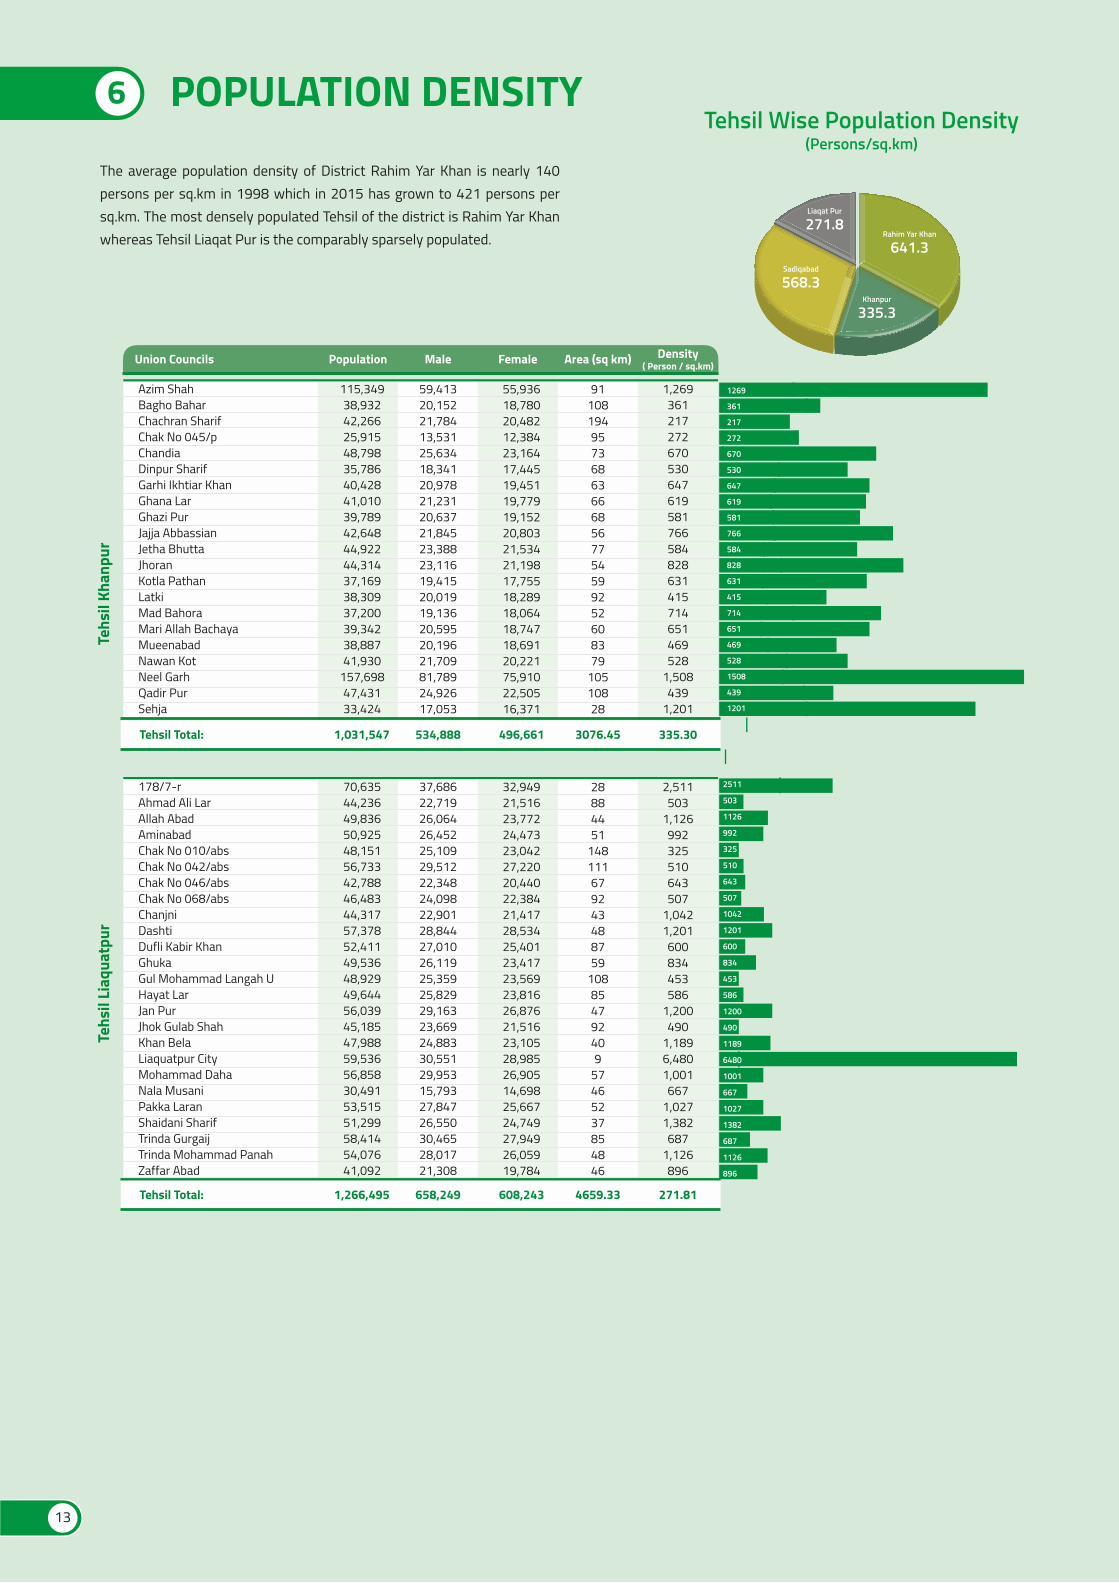
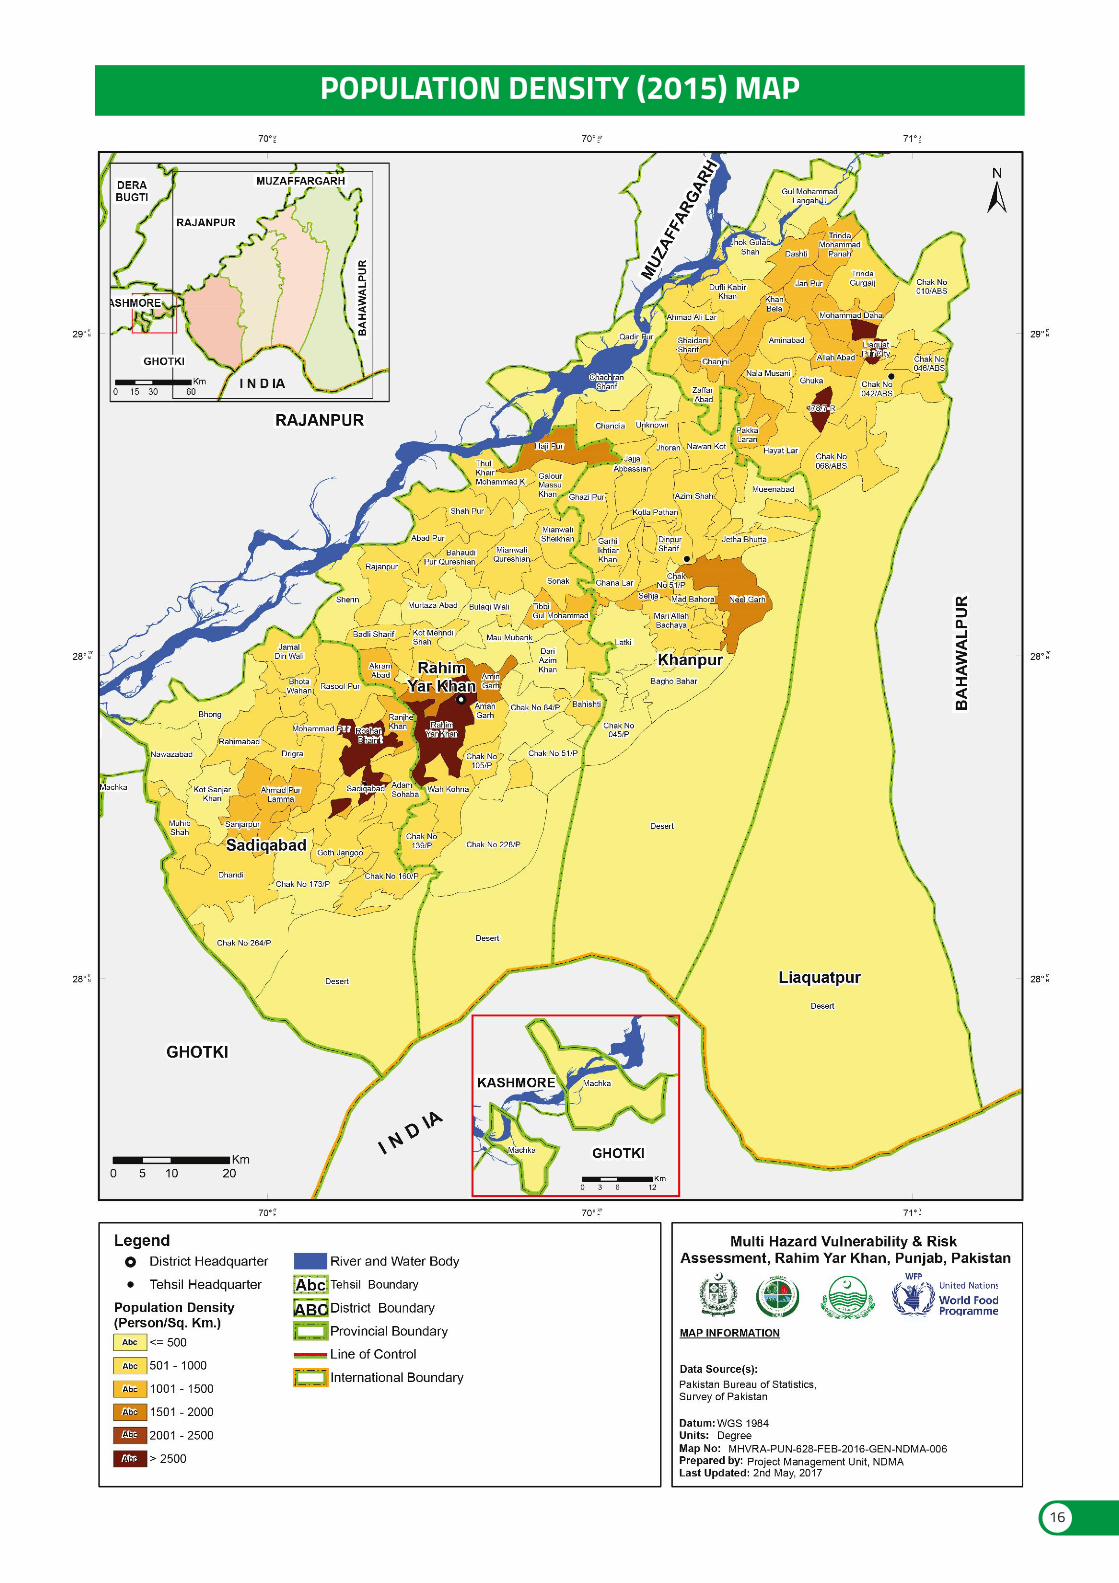
6 POPULATION DENSITYThe average population density of District Rahim Yar Khan is nearly 140 persons per sq.km in 1998 which in 2015 has grown to 421 persons per sq.km. The most densely populated Tehsil of the district is Rahim Yar Khan whereas Tehsil Liaqat Pur is the comparably sparsely populated.
Union Councils Population Male Female Area (sq km)
Azim ShahBagho BaharChachran SharifChak No 045/pChandiaDinpur SharifGarhi Ikhtiar KhanGhana LarGhazi PurJajja AbbassianJetha BhuttaJhoranKotla PathanLatkiMad BahoraMari Allah BachayaMueenabadNawan KotNeel GarhQadir PurSehja
115,34938,93242,26625,91548,79835,78640,42841,01039,78942,64844,92244,31437,16938,30937,20039,34238,88741,930
157,69847,43133,424
59,41320,15221,78413,53125,63418,34120,97821,23120,63721,84523,38823,11619,41520,01919,13620,59520,19621,70981,78924,92617,053
55,93618,78020,48212,38423,16417,44519,45119,77919,15220,80321,53421,19817,75518,28918,06418,74718,69120,22175,91022,50516,371
91108194957368636668567754599252608379
10510828
Tehsil Total: 1,031,547 534,888 496,661 3076.45
Density( Person / sq.km)
1,269361217272670530647619581766584828631415714651469528
1,508439
1,201
335.30
Tehs
il Kh
anpu
r
Rahim Yar Khan
641.3
Khanpur
335.3
Sadiqabad
568.3
Liaqat Pur
271.8
Tehsil Wise Population Density(Persons/sq.km)
13
1269
361
217
272
670
530
647
619
581
766
584
828
631
415
714
651
469
528
1508
439
1201
178/7-rAhmad Ali LarAllah AbadAminabadChak No 010/absChak No 042/absChak No 046/absChak No 068/absChanjniDashtiDufli Kabir KhanGhukaGul Mohammad Langah UHayat LarJan PurJhok Gulab ShahKhan BelaLiaquatpur CityMohammad DahaNala MusaniPakka LaranShaidani SharifTrinda GurgaijTrinda Mohammad PanahZaffar Abad
70,63544,23649,83650,92548,15156,73342,78846,48344,31757,37852,41149,53648,92949,64456,03945,18547,98859,53656,85830,49153,51551,29958,41454,07641,092
37,68622,71926,06426,45225,10929,51222,34824,09822,90128,84427,01026,11925,35925,82929,16323,66924,88330,55129,95315,79327,84726,55030,46528,01721,308
32,94921,51623,77224,47323,04227,22020,44022,38421,41728,53425,40123,41723,56923,81626,87621,51623,10528,98526,90514,69825,66724,74927,94926,05919,784
2,511503
1,126992325510643507
1,0421,201600834453586
1,200490
1,1896,4801,001667
1,0271,382687
1,126896
28884451
148111679243488759
108854792409
57465237854846
Tehsil Total: 1,266,495 658,249 608,243 271.814659.33
Tehs
il Li
aqua
tpur
2511
503
1126
992
325
510
643
507
1042
1201
600
834
453
586
1200
490
1189
6480
1001
667
1027
1382
687
1126
896
Adam SohabaAhmad Pur LammaBhongBhota WahanChak No 160/pChak No 173/pChak No 264/pDhandiDrigraGoth JangooJamal Din WaliKot Sanjar KhanMachkaMohammad PurMuhib ShahNawazabadRahimabadRanjhe KhanRasool PurRoshan BhaintSadiqabadSanjarpur
36,383103,52850,46238,80054,50346,98744,498
189,77249,57753,42052,34136,33858,71438,49743,87546,62755,96745,78845,589
144,059171,26748,277
18,83053,66426,23620,42428,34524,57923,62999,20525,97627,97427,47319,26531,32720,22523,19724,61229,57223,97923,81275,59389,20325,097
17,55349,86524,22618,37626,15822,40820,86990,56723,60125,44624,86817,07427,38818,27220,67822,01526,39521,81021,77868,46682,06423,180
6593
11042
10910316522072906273
2407673
103823690512346
5641,115459934500457269863687594850497245505604453686
1,275507
2,8357,5511,044
564
1115
459
934
500
457
269
863
687
594
850
497
245
505
604
453
686
1275
507
2835
7551
1044
Tehs
il Sh
ujab
ad
Tehsil Total: 1,455,269 762,217
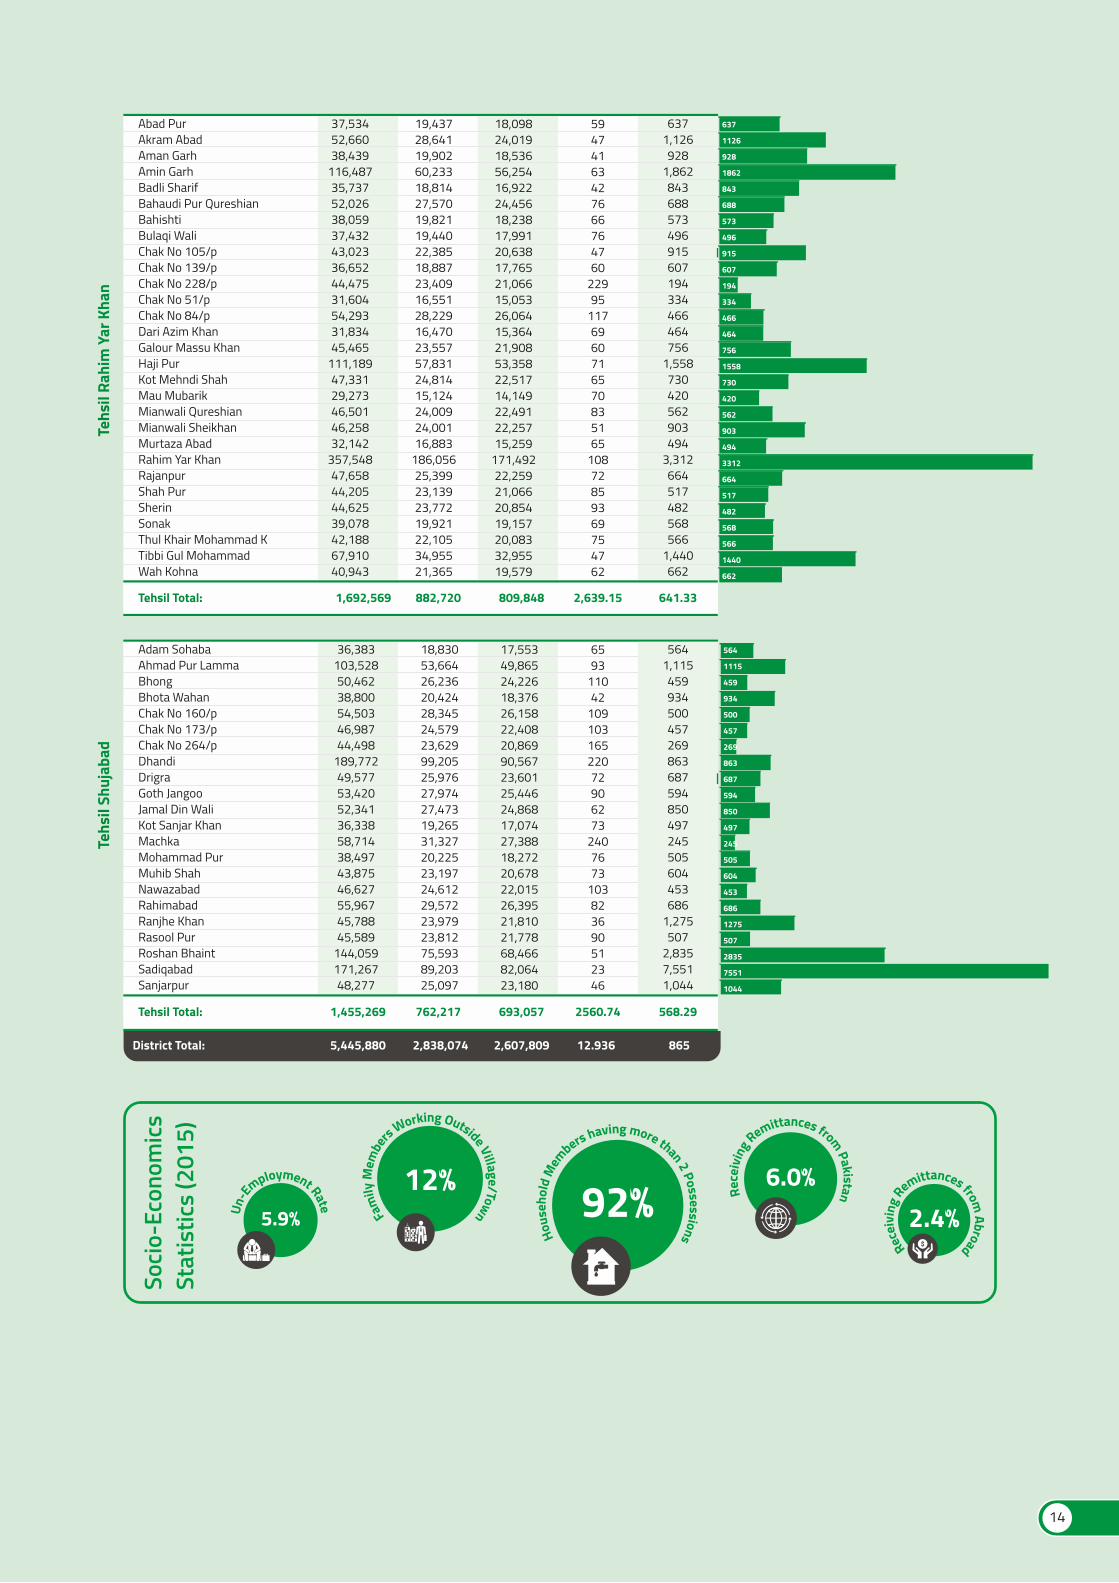
District Total: 5,445,880 2,838,074 2,607,809 12.936 865
693,057 2560.74
Abad PurAkram AbadAman GarhAmin GarhBadli SharifBahaudi Pur QureshianBahishtiBulaqi WaliChak No 105/pChak No 139/pChak No 228/pChak No 51/pChak No 84/pDari Azim KhanGalour Massu KhanHaji PurKot Mehndi ShahMau MubarikMianwali QureshianMianwali SheikhanMurtaza AbadRahim Yar KhanRajanpurShah PurSherinSonakThul Khair Mohammad KTibbi Gul MohammadWah Kohna
37,53452,66038,439
116,48735,73752,02638,05937,43243,02336,65244,47531,60454,29331,83445,465
111,18947,33129,27346,50146,25832,142
357,54847,65844,20544,62539,07842,18867,91040,943
19,43728,64119,90260,23318,81427,57019,82119,44022,38518,88723,40916,55128,22916,47023,55757,83124,81415,12424,00924,00116,883
186,05625,39923,13923,77219,92122,10534,95521,365
18,09824,01918,53656,25416,92224,45618,23817,99120,63817,76521,06615,05326,06415,36421,90853,35822,51714,14922,49122,25715,259
171,49222,25921,06620,85419,15720,08332,95519,579
59474163427666764760
22995
1176960716570835165
10872859369754762
637
1126
928
1862
843
688
573
496
915
607
194
334
466
464
756
1558
730
420
562
903
494
3312
664
517
482
568
566
1440
662
6371,126928
1,862843688573496915607194334466464756
1,558730420562903494
3,312664517482568566
1,440662
Tehs
il Ra
him
Yar
Kha
n
Tehsil Total: 1,692,569 882,720 809,848
Socio
-Eco
nom
icsSt
atis
tics
(201
5)
Un-E
mployment Rate
5.9% 2.4%
Recei
ving
Remittances from Abroad
12%
Fam
ily M
embe
rs Working Outside Village/Town
6.0%
Rece
ivin
g Remittances from Pakistan92%
Hous
ehol
d M
em
bers having more than 2 Possessions
14
568.29
2,639.15 641.33

15
POPULATION DENSITY (2015) MAP
16
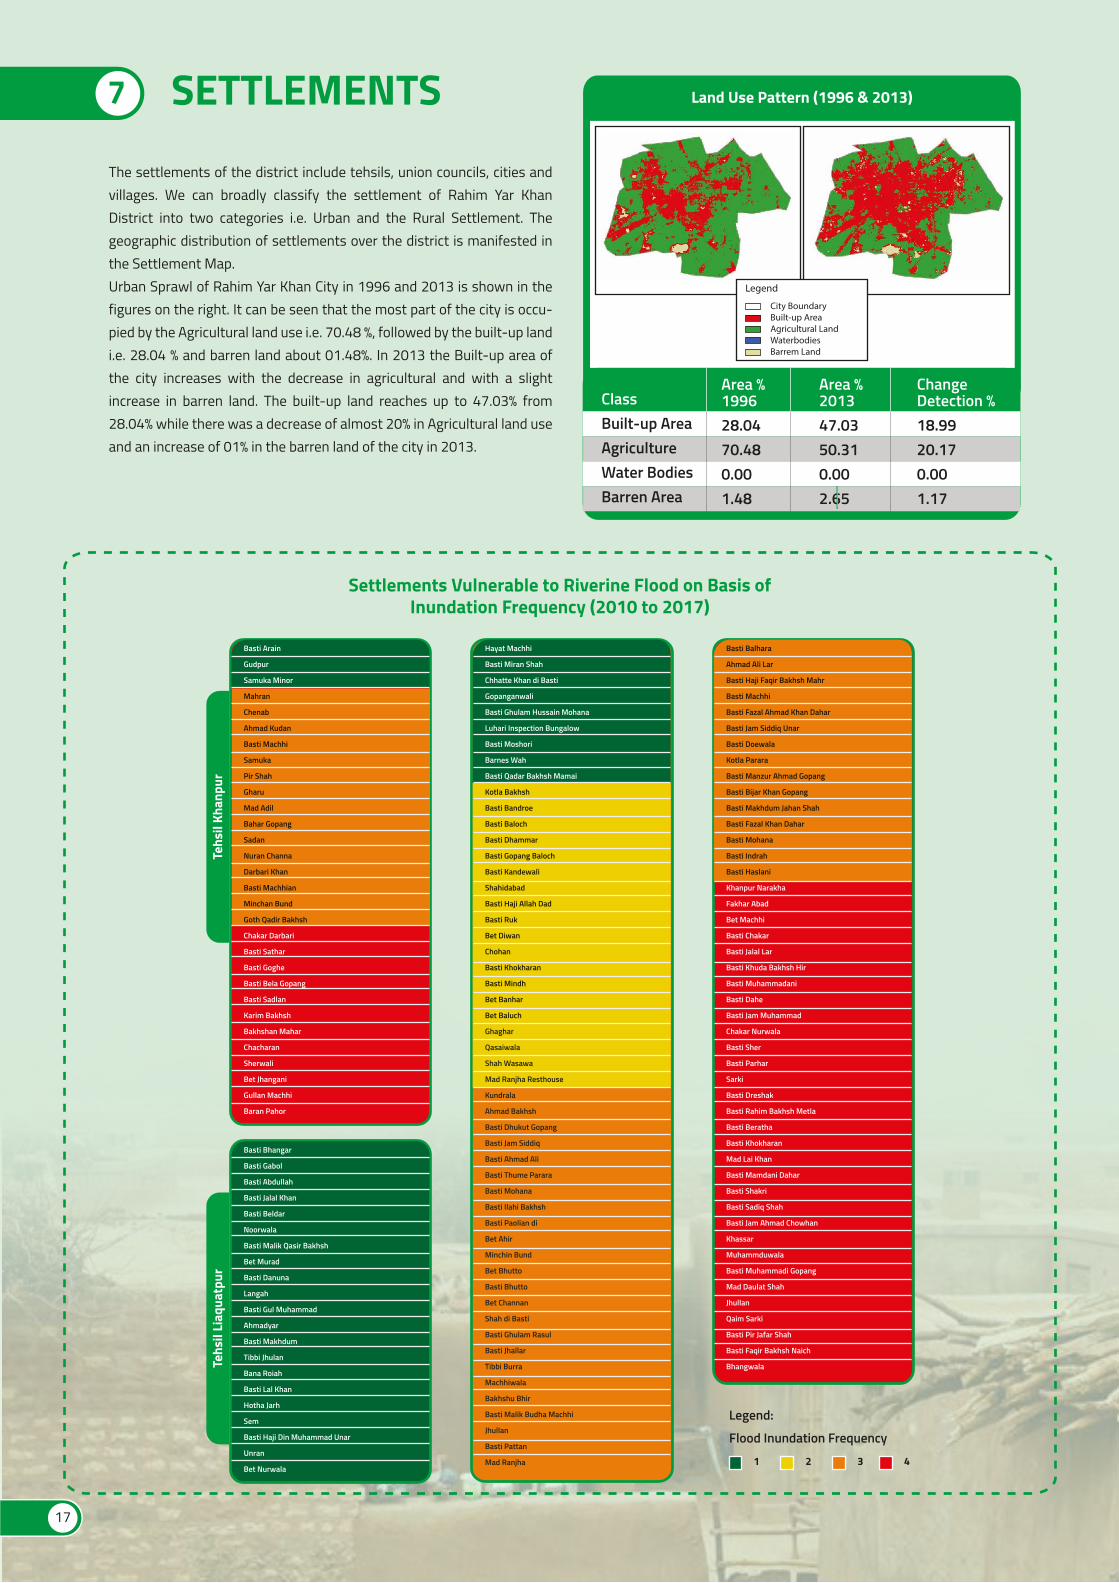
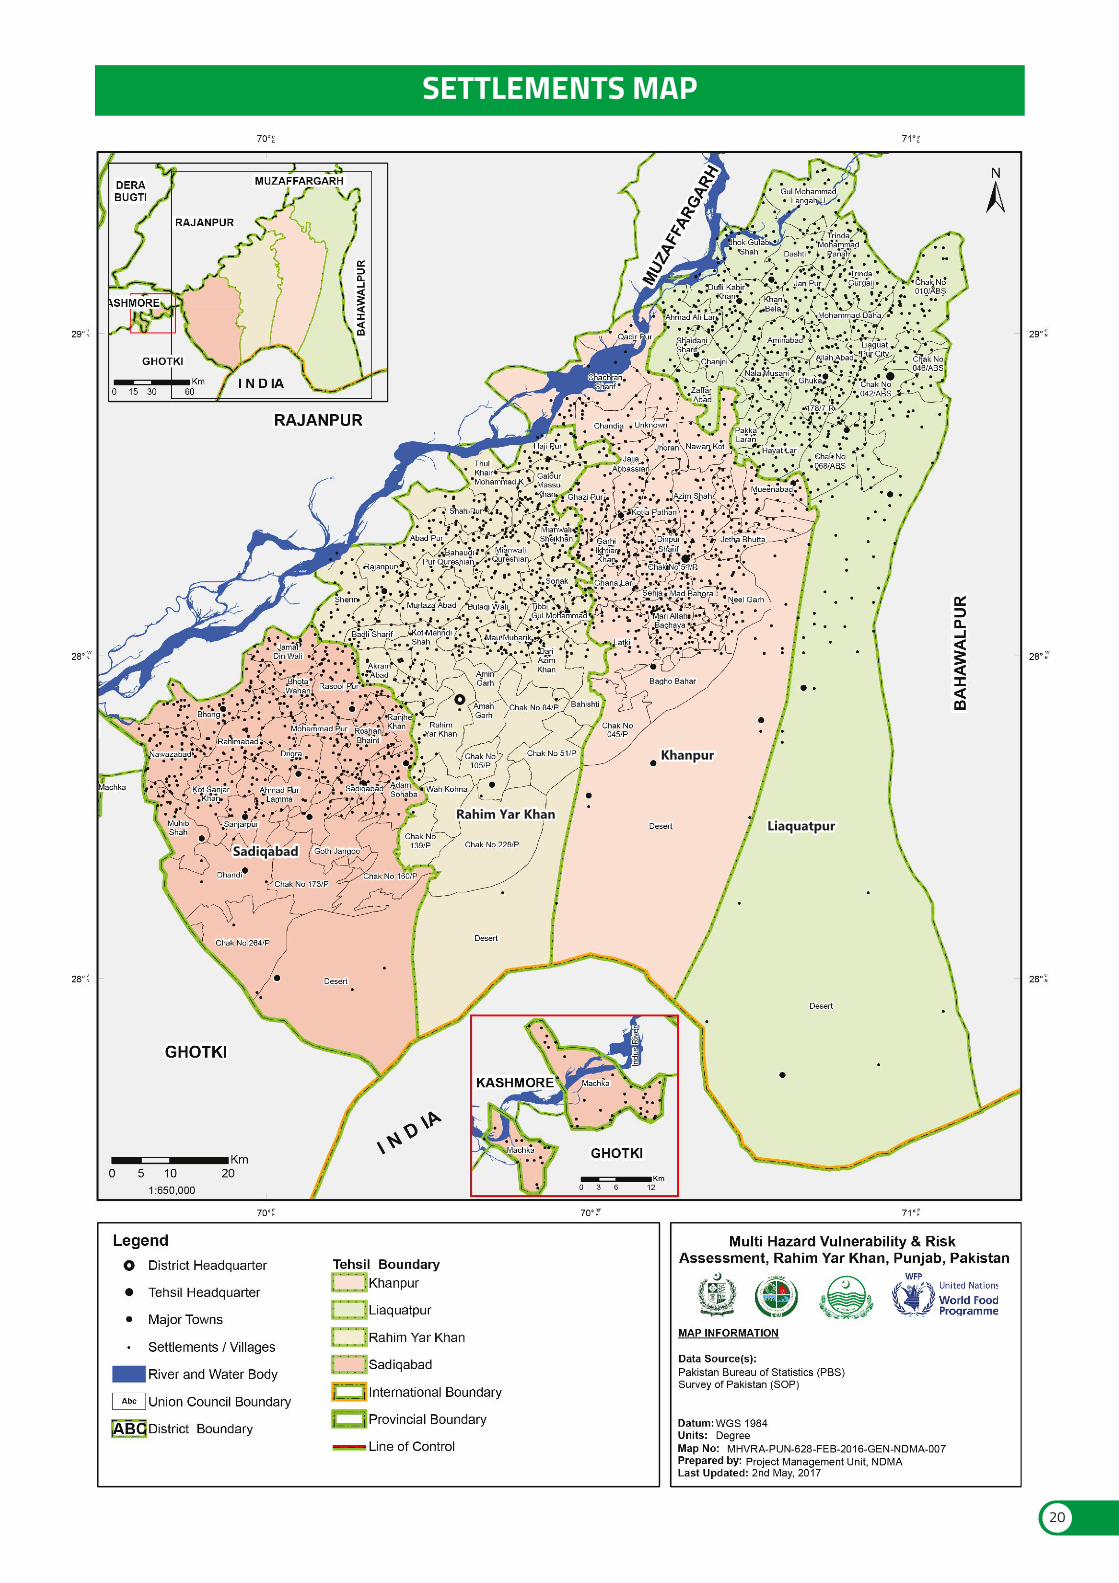
7 SETTLEMENTS
Settlements Vulnerable to Riverine Flood on Basis ofInundation Frequency (2010 to 2017)
The settlements of the district include tehsils, union councils, cities and villages. We can broadly classify the settlement of Rahim Yar Khan District into two categories i.e. Urban and the Rural Settlement. The geographic distribution of settlements over the district is manifested in the Settlement Map.Urban Sprawl of Rahim Yar Khan City in 1996 and 2013 is shown in the figures on the right. It can be seen that the most part of the city is occu-pied by the Agricultural land use i.e. 70.48 %, followed by the built-up land i.e. 28.04 % and barren land about 01.48%. In 2013 the Built-up area of the city increases with the decrease in agricultural and with a slight increase in barren land. The built-up land reaches up to 47.03% from 28.04% while there was a decrease of almost 20% in Agricultural land use and an increase of 01% in the barren land of the city in 2013.
Land Use Pattern (1996 & 2013)
Legend
City BoundaryBuilt-up AreaAgricultural Land WaterbodiesBarrem Land
ClassBuilt-up AreaAgricultureWater BodiesBarren Area
Area %199628.0470.480.001.48
Area %201347.0350.310.002.65
ChangeDetection %18.9920.170.001.17
Basti Arain
Gudpur
Samuka Minor
Mahran
Chenab
Ahmad Kudan
Basti Machhi
Samuka
Pir Shah
Gharu
Mad Adil
Bahar Gopang
Sadan
Nuran Channa
Darbari Khan
Basti Machhian
Minchan Bund
Goth Qadir Bakhsh
Chakar Darbari
Basti Sathar
Basti Goghe
Basti Bela Gopang
Basti Sadlan
Karim Bakhsh
Bakhshan Mahar
Chacharan
Sherwali
Bet Jhangani
Gullan Machhi
Baran Pahor
Tehs
il Kh
anpu
r
Basti Bhangar
Basti Gabol
Basti Abdullah
Basti Jalal Khan
Basti Beldar
Noorwala
Basti Malik Qasir Bakhsh
Bet Murad
Basti Danuna
Langah
Basti Gul Muhammad
Ahmadyar
Basti Makhdum
Tibbi Jhulan
Bana Roiah
Basti Lal Khan
Hotha Jarh
Sem
Basti Haji Din Muhammad Unar
Unran
Bet Nurwala
Tehs
il Li
aqua
tpur
Hayat Machhi
Basti Miran Shah
Chhatte Khan di Basti
Gopanganwali
Basti Ghulam Hussain Mohana
Luhari Inspection Bungalow
Basti Moshori
Barnes Wah
Basti Qadar Bakhsh Mamai
Kotla Bakhsh
Basti Bandroe
Basti Baloch
Basti Dhammar
Basti Gopang Baloch
Basti Kandewali
Shahidabad
Basti Haji Allah Dad
Basti Ruk
Bet Diwan
Chohan
Basti Khokharan
Basti Mindh
Bet Banhar
Bet Baluch
Ghaghar
Qasaiwala
Shah Wasawa
Mad Ranjha Resthouse
Kundrala
Ahmad Bakhsh
Basti Dhukut Gopang
Basti Jam Siddiq
Basti Ahmad Ali
Basti Thume Parara
Basti Mohana
Basti Ilahi Bakhsh
Basti Paolian di
Bet Ahir
Minchin Bund
Bet Bhutto
Basti Bhutto
Bet Channan
Shah di Basti
Basti Ghulam Rasul
Basti Jhallar
Tibbi Burra
Machhiwala
Bakhshu Bhir
Basti Malik Budha Machhi
Jhullan
Basti Pattan
Mad Ranjha
Basti Balhara
Ahmad Ali Lar
Basti Haji Faqir Bakhsh Mahr
Basti Machhi
Basti Fazal Ahmad Khan Dahar
Basti Jam Siddiq Unar
Basti Doewala
Kotla Parara
Basti Manzur Ahmad Gopang
Basti Bijar Khan Gopang
Basti Makhdum Jahan Shah
Basti Fazal Khan Dahar
Basti Mohana
Basti Indrah
Basti Haslani
Khanpur Narakha
Fakhar Abad
Bet Machhi
Basti Chakar
Basti Jalal Lar
Basti Khuda Bakhsh Hir
Basti Muhammadani
Basti Dahe
Basti Jam Muhammad
Chakar Nurwala
Basti Sher
Basti Parhar
Sarki
Basti Dreshak
Basti Rahim Bakhsh Metla
Basti Beratha
Basti Khokharan
Mad Lai Khan
Basti Mamdani Dahar
Basti Shakri
Basti Sadiq Shah
Basti Jam Ahmad Chowhan
Khassar
Muhammduwala
Basti Muhammadi Gopang
Mad Daulat Shah
Jhullan
Qaim Sarki
Basti Pir Jafar Shah
Basti Faqir Bakhsh Naich
Bhangwala
Flood Inundation Frequency
Legend:
1 2 3 4
17
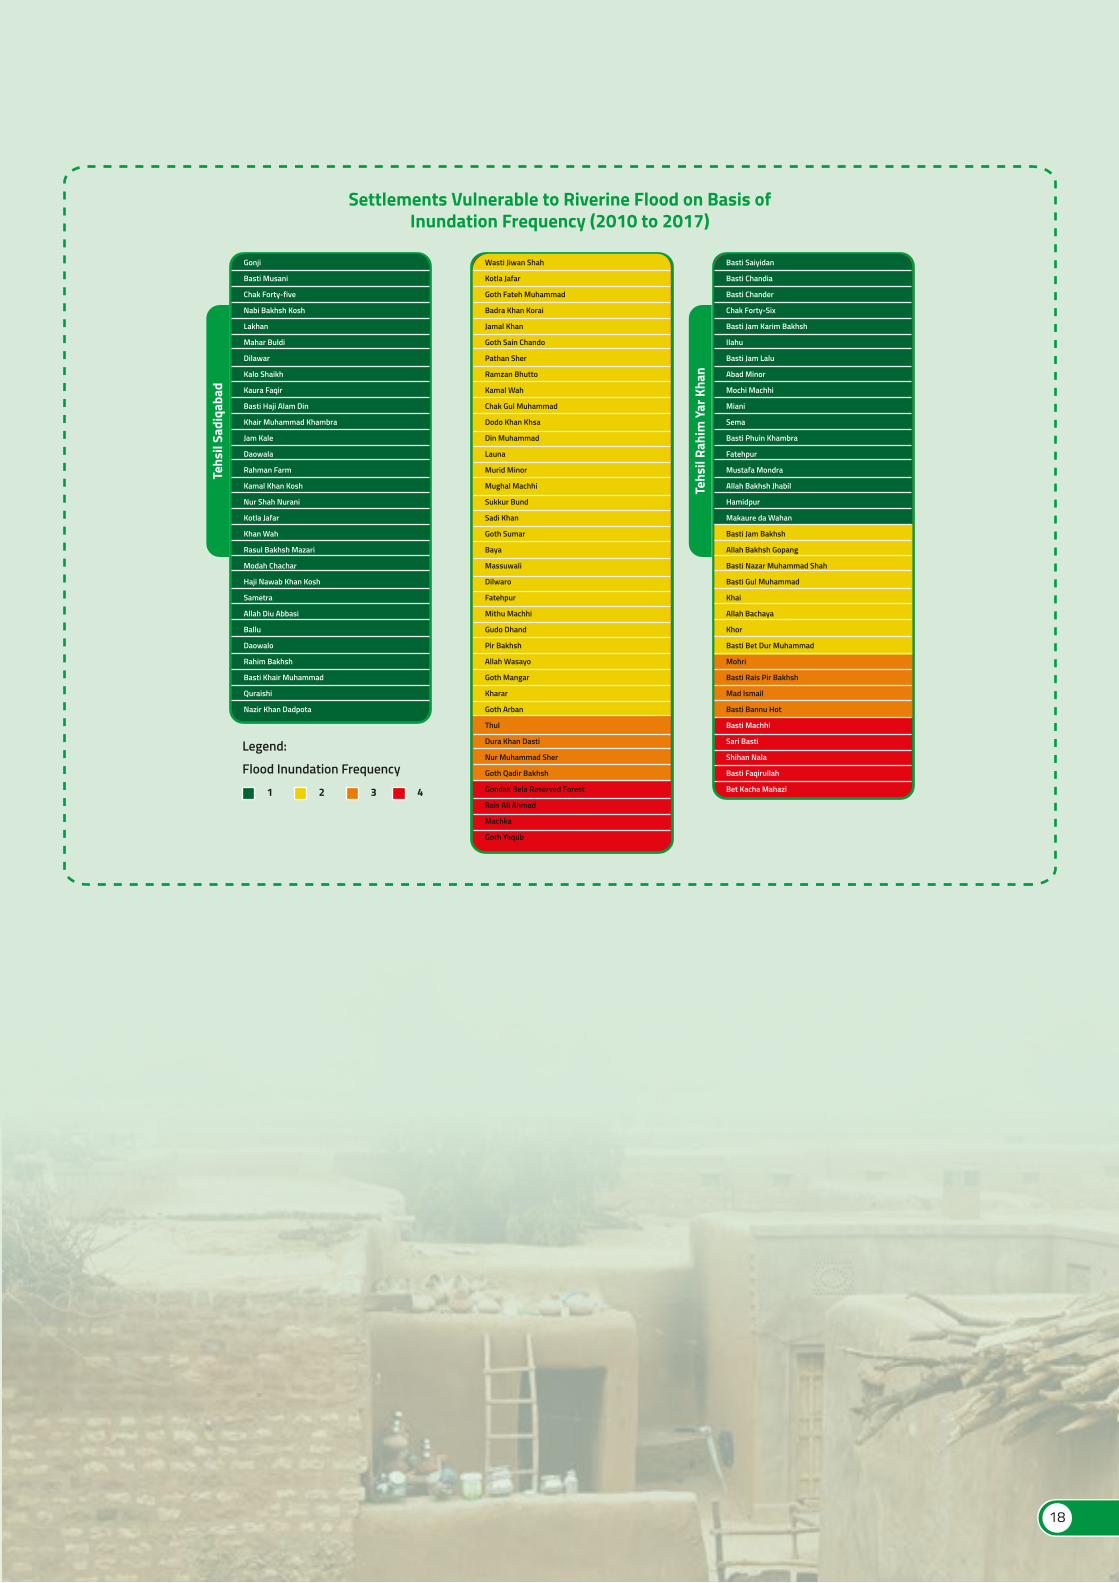
Settlements Vulnerable to Riverine Flood on Basis ofInundation Frequency (2010 to 2017)
Gonji
Basti Musani
Chak Forty-five
Nabi Bakhsh Kosh
Lakhan
Mahar Buldi
Dilawar
Kalo Shaikh
Kaura Faqir
Basti Haji Alam Din
Khair Muhammad Khambra
Jam Kale
Daowala
Rahman Farm
Kamal Khan Kosh
Nur Shah Nurani
Kotla Jafar
Khan Wah
Rasul Bakhsh Mazari
Modah Chachar
Haji Nawab Khan Kosh
Sametra
Allah Diu Abbasi
Ballu
Daowalo
Rahim Bakhsh
Basti Khair Muhammad
Quraishi
Nazir Khan Dadpota
Tehs
il Sa
diqa
bad
Wasti Jiwan Shah
Kotla Jafar
Goth Fateh Muhammad
Badra Khan Korai
Jamal Khan
Goth Sain Chando
Pathan Sher
Ramzan Bhutto
Kamal Wah
Chak Gul Muhammad
Dodo Khan Khsa
Din Muhammad
Launa
Murid Minor
Mughal Machhi
Sukkur Bund
Sadi Khan
Goth Sumar
Baya
Massuwali
Dilwaro
Fatehpur
Mithu Machhi
Gudo Dhand
Pir Bakhsh
Allah Wasayo
Goth Mangar
Kharar
Goth Arban
Thul
Dura Khan Dasti
Nur Muhammad Sher
Goth Qadir Bakhsh
Gondak Bela Reserved Forest
Rais Ali Ahmad
Machka
Goth Yaqub
Flood Inundation Frequency
Legend:
1 2 3 4
Basti Saiyidan
Basti Chandia
Basti Chander
Chak Forty-Six
Basti Jam Karim Bakhsh
Ilahu
Basti Jam Lalu
Abad Minor
Mochi Machhi
Miani
Sema
Basti Phuin Khambra
Fatehpur
Mustafa Mondra
Allah Bakhsh Jhabil
Hamidpur
Makaure da Wahan
Basti Jam Bakhsh
Allah Bakhsh Gopang
Basti Nazar Muhammad Shah
Basti Gul Muhammad
Khai
Allah Bachaya
Khor
Basti Bet Dur Muhammad
Mohri
Basti Rais Pir Bakhsh
Mad Ismail
Basti Bannu Hot
Basti Machhi
Sari Basti
Shihan Nala
Basti Faqirullah
Bet Kacha Mahazi
Tehs
il Ra
him
Yar
Kha
n
18

19
SadiqabadSadiqabad
Rahim Yar KhanRahim Yar Khan
KhanpurKhanpur
LiaquatpurLiaquatpur
SETTLEMENTS MAP
20
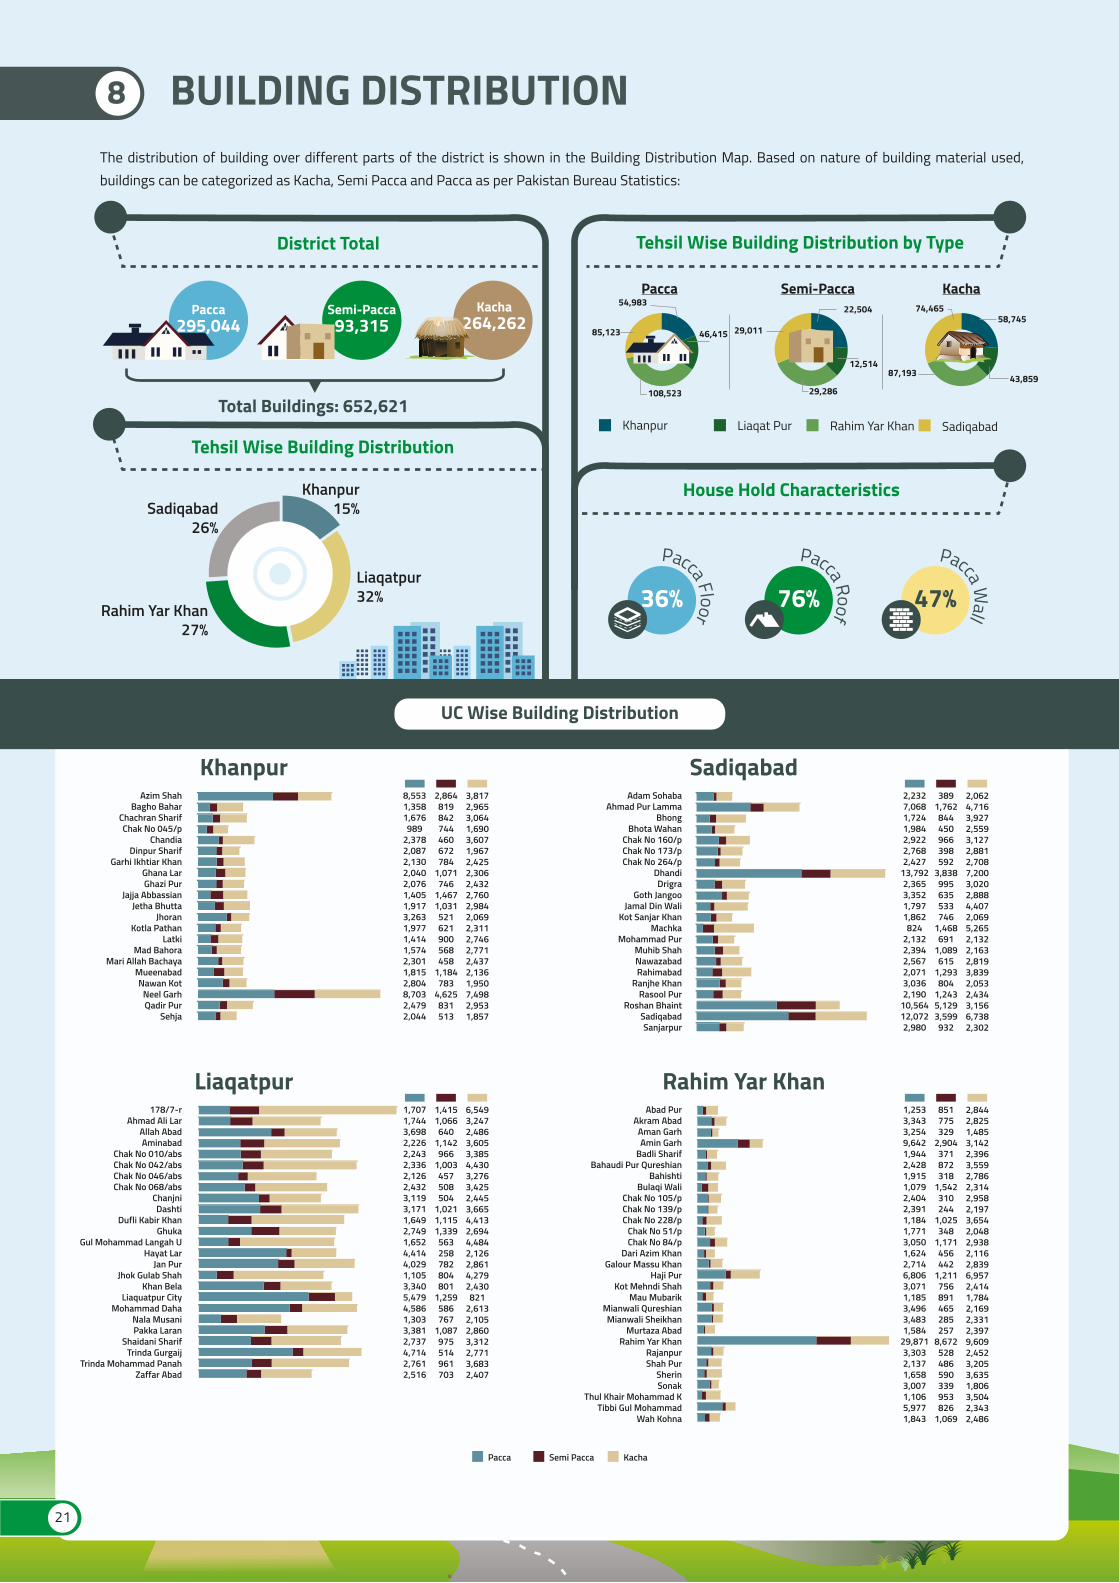
The distribution of building over different parts of the district is shown in the Building Distribution Map. Based on nature of building material used, buildings can be categorized as Kacha, Semi Pacca and Pacca as per Pakistan Bureau Statistics:
8 BUILDING DISTRIBUTION
House Hold Characteristics
Tehsil Wise Building Distribution
Tehsil Wise Building Distribution by TypeDistrict Total
29,011
22,504
12,514
29,286
Semi-Pacca
87,193
74,46558,745
43,859
Kacha
85,123
54,983
46,415
108,523
PaccaPacca
295,044Semi-Pacca93,315
Kacha264,262
Khanpur Liaqat Pur Rahim Yar Khan Sadiqabad
36%
Pacca Floor 76%
Pacca Roof 47%
Pacca Wall
Total Buildings: 652,621
Khanpur15%Sadiqabad
26%
Rahim Yar Khan27%
Liaqatpur32%
Pacca Semi Pacca Kacha
Khanpur8,5531,3581,676989
2,3782,0872,1302,0402,0761,4051,9173,2631,9771,4141,5742,3011,8152,8048,7032,4792,044
2,864819842744460672784
1,071746
1,4671,031521621900568458
1,184783
4,625831513
3,8172,9653,0641,6903,6071,9672,4252,3062,4322,7602,9842,0692,3112,7462,7712,4372,1361,9507,4982,9531,857
UC Wise Building Distribution
Azim ShahBagho Bahar
Chachran SharifChak No 045/p
ChandiaDinpur Sharif
Garhi Ikhtiar KhanGhana LarGhazi Pur
Jajja AbbassianJetha Bhutta
JhoranKotla Pathan
LatkiMad Bahora
Mari Allah BachayaMueenabadNawan Kot
Neel GarhQadir Pur
Sehja
Liaqatpur1,7071,7443,6982,2262,2432,3362,1262,4323,1193,1711,6492,7491,6524,4144,0291,1053,3405,4794,5861,3033,3812,7374,7142,7612,516
1,4151,066640
1,142966
1,003457508504
1,0211,1151,339563258782804801
1,259586767
1,087975514961703
6,5493,2472,4863,6053,3854,4303,2763,4252,4453,6654,4132,6944,4842,1262,8614,2792,430821
2,6132,1052,8603,3122,7713,6832,407
178/7-rAhmad Ali Lar
Allah AbadAminabad
Chak No 010/absChak No 042/absChak No 046/absChak No 068/abs
ChanjniDashti
Dufli Kabir KhanGhuka
Gul Mohammad Langah UHayat Lar
Jan PurJhok Gulab Shah
Khan BelaLiaquatpur City
Mohammad DahaNala MusaniPakka Laran
Shaidani SharifTrinda Gurgaij
Trinda Mohammad PanahZaffar Abad
Sadiqabad2,2327,0681,7241,9842,9222,7682,427
13,7922,3653,3521,7971,862824
2,1322,3942,5672,0713,0362,190
10,56412,0722,980
3891,762844450966398592
3,838995635533746
1,468691
1,089615
1,293804
1,2435,1293,599932
2,0624,7163,9272,5593,1272,8812,7087,2003,0202,8884,4072,0695,2652,1322,1632,8193,8392,0532,4343,1566,7382,302
Adam SohabaAhmad Pur Lamma
BhongBhota Wahan
Chak No 160/pChak No 173/pChak No 264/p
DhandiDrigra
Goth JangooJamal Din Wali
Kot Sanjar KhanMachka
Mohammad PurMuhib ShahNawazabadRahimabad
Ranjhe KhanRasool Pur
Roshan BhaintSadiqabadSanjarpur
Rahim Yar Khan1,2533,3433,2549,6421,9442,4281,9151,0792,4042,3911,1841,7713,0501,6242,7146,8063,0711,1853,4963,4831,584
29,8713,3032,1371,6583,0071,1065,9771,843
851775329
2,904371872318
1,542310244
1,025348
1,171456442
1,211756891465285257
8,672528486590339953826
1,069
2,8442,8251,4853,1422,3963,5592,7862,3142,9582,1973,6542,0482,9382,1162,8396,9572,4141,7842,1692,3312,3979,6092,4523,2053,6351,8063,5042,3432,486
Abad PurAkram Abad
Aman GarhAmin Garh
Badli SharifBahaudi Pur Qureshian
BahishtiBulaqi Wali
Chak No 105/pChak No 139/pChak No 228/p
Chak No 51/pChak No 84/p
Dari Azim KhanGalour Massu Khan
Haji PurKot Mehndi Shah
Mau MubarikMianwali QureshianMianwali Sheikhan
Murtaza AbadRahim Yar Khan
RajanpurShah Pur
SherinSonak
Thul Khair Mohammad KTibbi Gul Mohammad
Wah Kohna
21
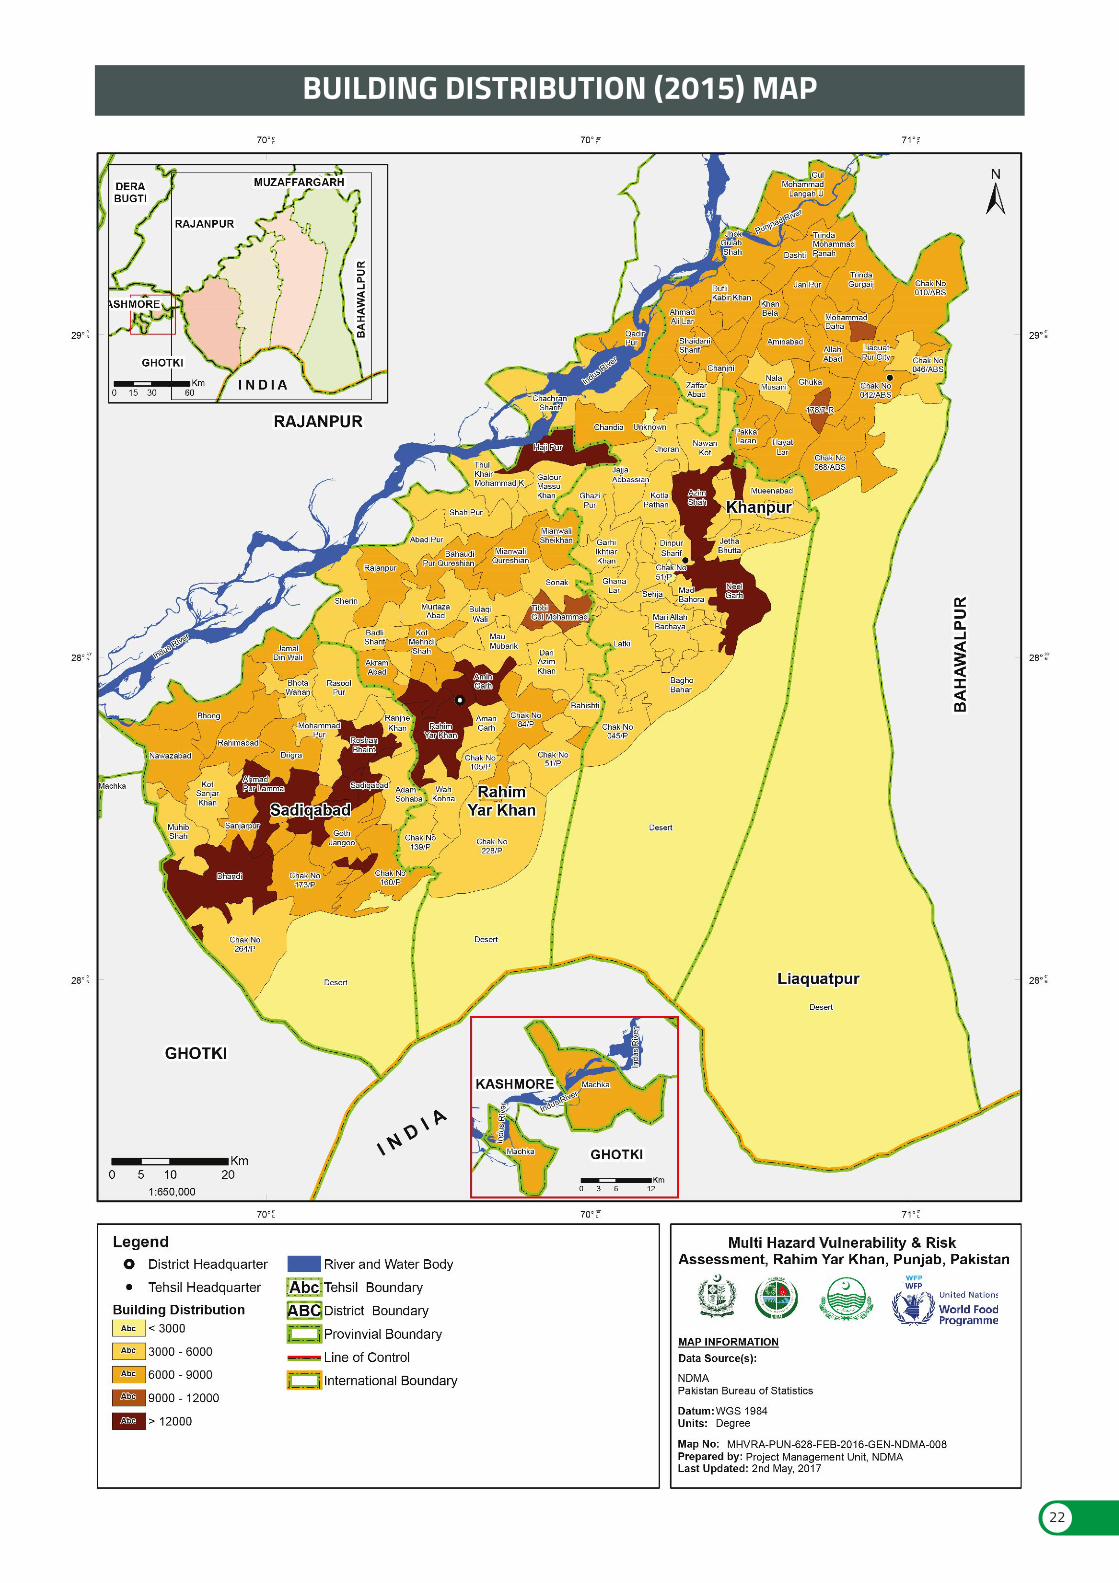
BUILDING DISTRIBUTION (2015) MAP
22
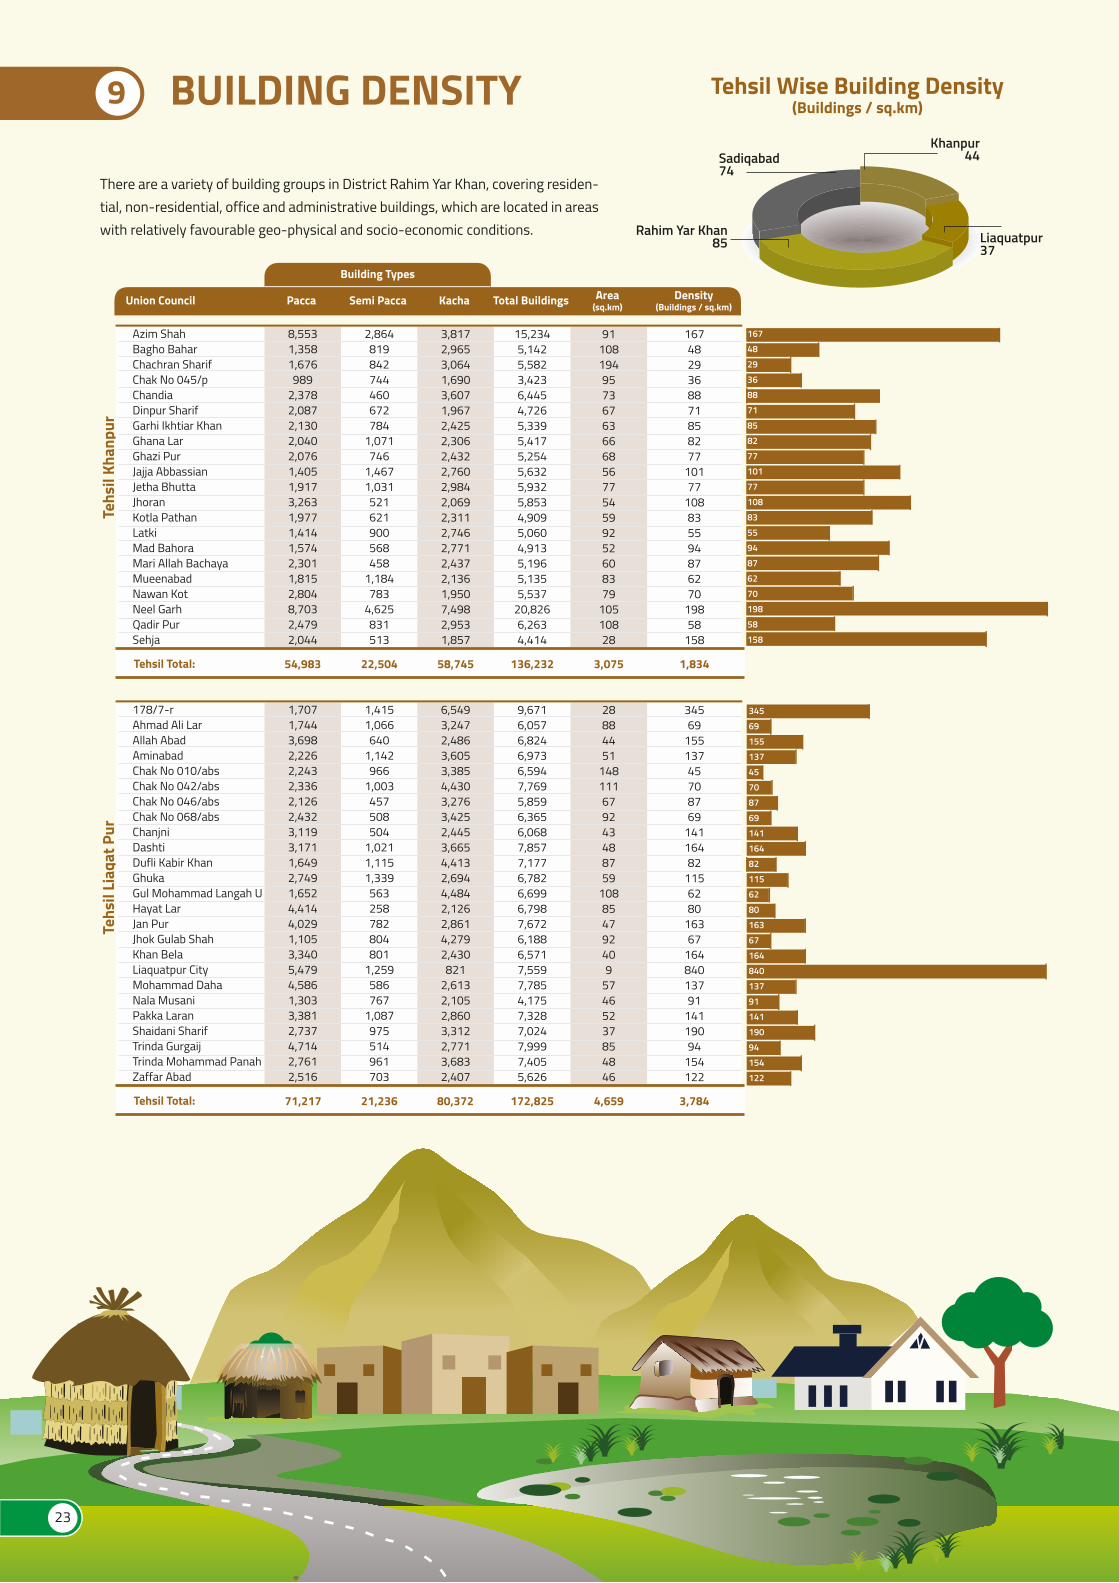
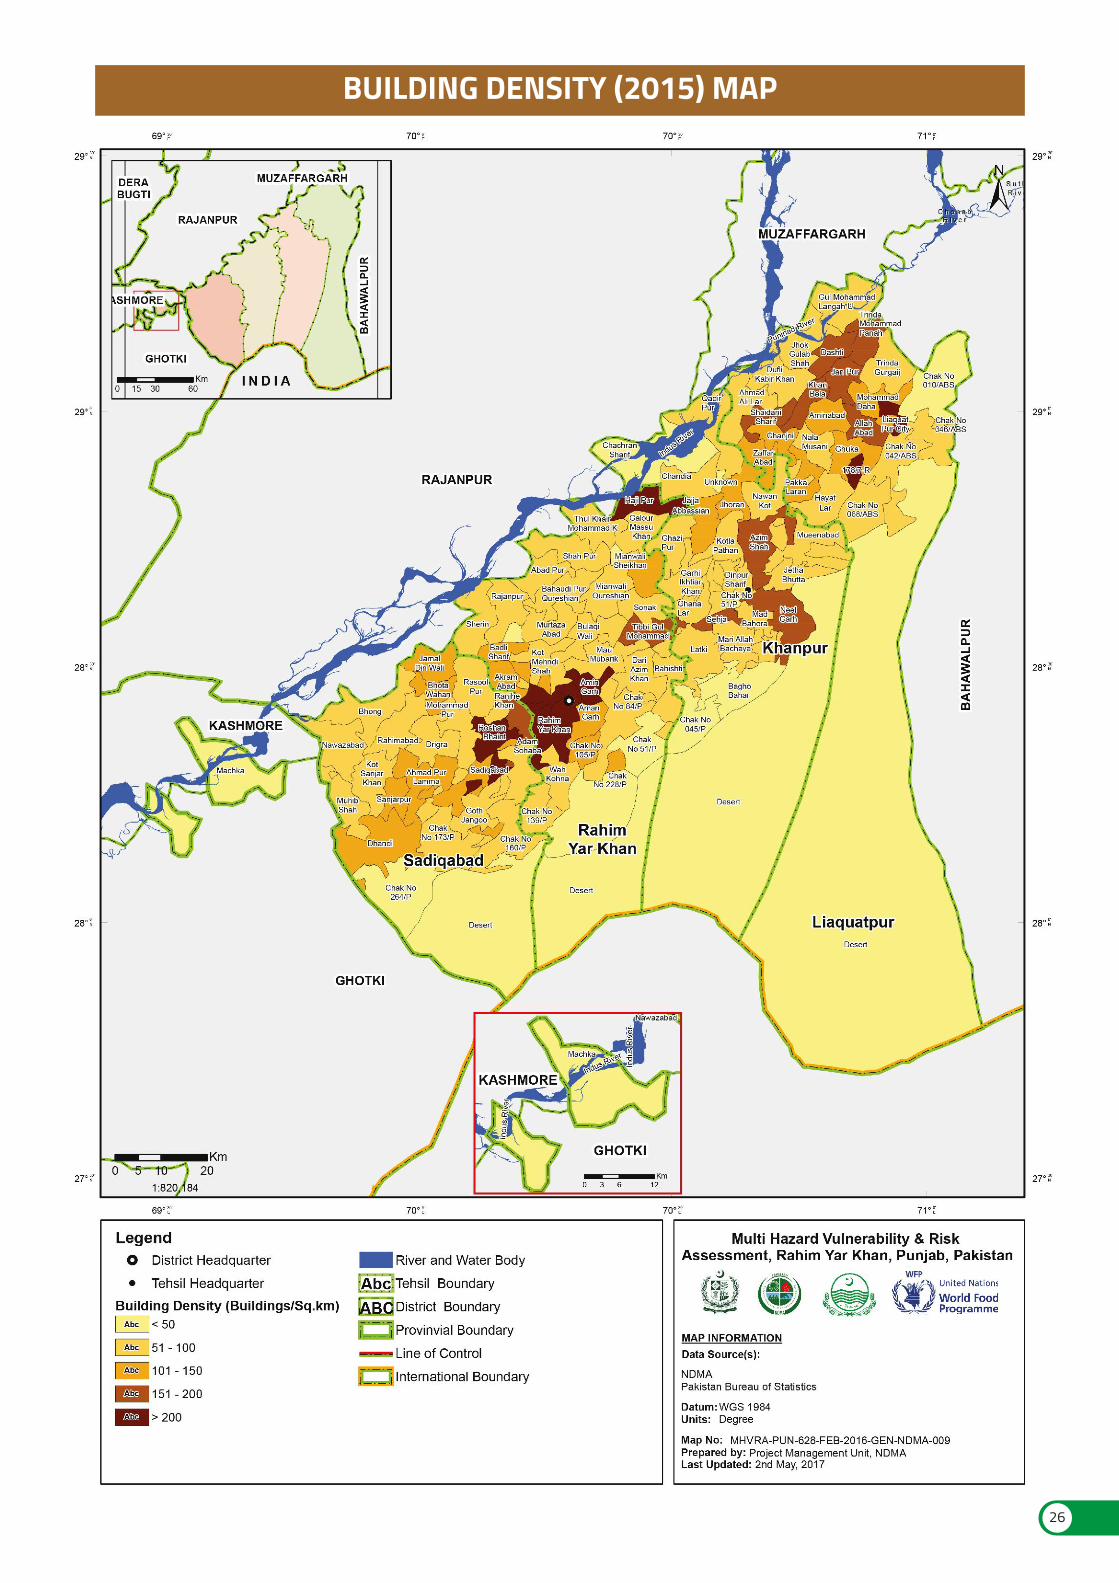
9 BUILDING DENSITY
There are a variety of building groups in District Rahim Yar Khan, covering residen-tial, non-residential, office and administrative buildings, which are located in areas with relatively favourable geo-physical and socio-economic conditions. Liaquatpur
37
Khanpur44Sadiqabad
74
Rahim Yar Khan85
Tehsil Wise Building Density(Buildings / sq.km)
Union Council Pacca Semi Pacca Kacha Total Buildings Area(sq.km)
Density(Buildings / sq.km)
Building Types
Tehsil Total:
Tehs
il Kh
anpu
r
Azim ShahBagho BaharChachran SharifChak No 045/pChandiaDinpur SharifGarhi Ikhtiar KhanGhana LarGhazi PurJajja AbbassianJetha BhuttaJhoranKotla PathanLatkiMad BahoraMari Allah BachayaMueenabadNawan KotNeel GarhQadir PurSehja
8,5531,3581,676989
2,3782,0872,1302,0402,0761,4051,9173,2631,9771,4141,5742,3011,8152,8048,7032,4792,044
2,864819842744460672784
1,071746
1,4671,031521621900568458
1,184783
4,625831513
3,8172,9653,0641,6903,6071,9672,4252,3062,4322,7602,9842,0692,3112,7462,7712,4372,1361,9507,4982,9531,857
15,2345,1425,5823,4236,4454,7265,3395,4175,2545,6325,9325,8534,9095,0604,9135,1965,1355,537
20,8266,2634,414
91108194957367636668567754599252608379
10510828
1674829368871858277
10177
108835594876270
19858
158
54,983 22,504 58,745 136,232 3,075 1,834
16748293688718582771017710883559487627019858158
Tehsil Total:
Tehs
il Li
aqat
Pur
178/7-rAhmad Ali LarAllah AbadAminabadChak No 010/absChak No 042/absChak No 046/absChak No 068/absChanjniDashtiDufli Kabir KhanGhukaGul Mohammad Langah UHayat LarJan PurJhok Gulab ShahKhan BelaLiaquatpur CityMohammad DahaNala MusaniPakka LaranShaidani SharifTrinda GurgaijTrinda Mohammad PanahZaffar Abad
1,7071,7443,6982,2262,2432,3362,1262,4323,1193,1711,6492,7491,6524,4144,0291,1053,3405,4794,5861,3033,3812,7374,7142,7612,516
1,4151,066640
1,142966
1,003457508504
1,0211,1151,339563258782804801
1,259586767
1,087975514961703
6,5493,2472,4863,6053,3854,4303,2763,4252,4453,6654,4132,6944,4842,1262,8614,2792,430821
2,6132,1052,8603,3122,7713,6832,407
9,6716,0576,8246,9736,5947,7695,8596,3656,0687,8577,1776,7826,6996,7987,6726,1886,5717,5597,7854,1757,3287,0247,9997,4055,626
28884451
148111679243488759
108854792409
57465237854846
34569
15513745708769
14116482
1156280
16367
16484013791
14119094
154122
71,217 21,236 80,372 172,825 4,659 3,784
3456915513745708769141164821156280163671648401379114119094154122
23
Adam SohabaAhmad Pur LammaBhongBhota WahanChak No 160/pChak No 173/pChak No 264/pDhandiDrigraGoth JangooJamal Din WaliKot Sanjar KhanMachkaMohammad PurMuhib ShahNawazabadRahimabadRanjhe KhanRasool PurRoshan BhaintSadiqabadSanjarpur
4,68313,5466,4954,9937,0156,0475,727
24,8306,3806,8756,7374,6777,5574,9555,6466,0017,2035,8935,867
18,84922,4096,214
6593
11042
10910316522072906273
2397673
103823690512346
7214659
119645935
1138976
109643265775888
16465
370974135
2,2327,0681,7241,9842,9222,7682,427
13,7922,3653,3521,7971,862824
2,1322,3942,5672,0713,0362,190
10,56412,0722,980
3891,762844450966398592
3,838995635533746
1,468691
1,089615
1,293804
1,2435,1293,599932
2,0624,7163,9272,5593,1272,8812,7087,2003,0202,8884,4072,0695,2652,1322,1632,8193,8392,0532,4343,1566,7382,302
7214659119645935113897610964326577588816465370974135
Tehs
il S
adiq
abad
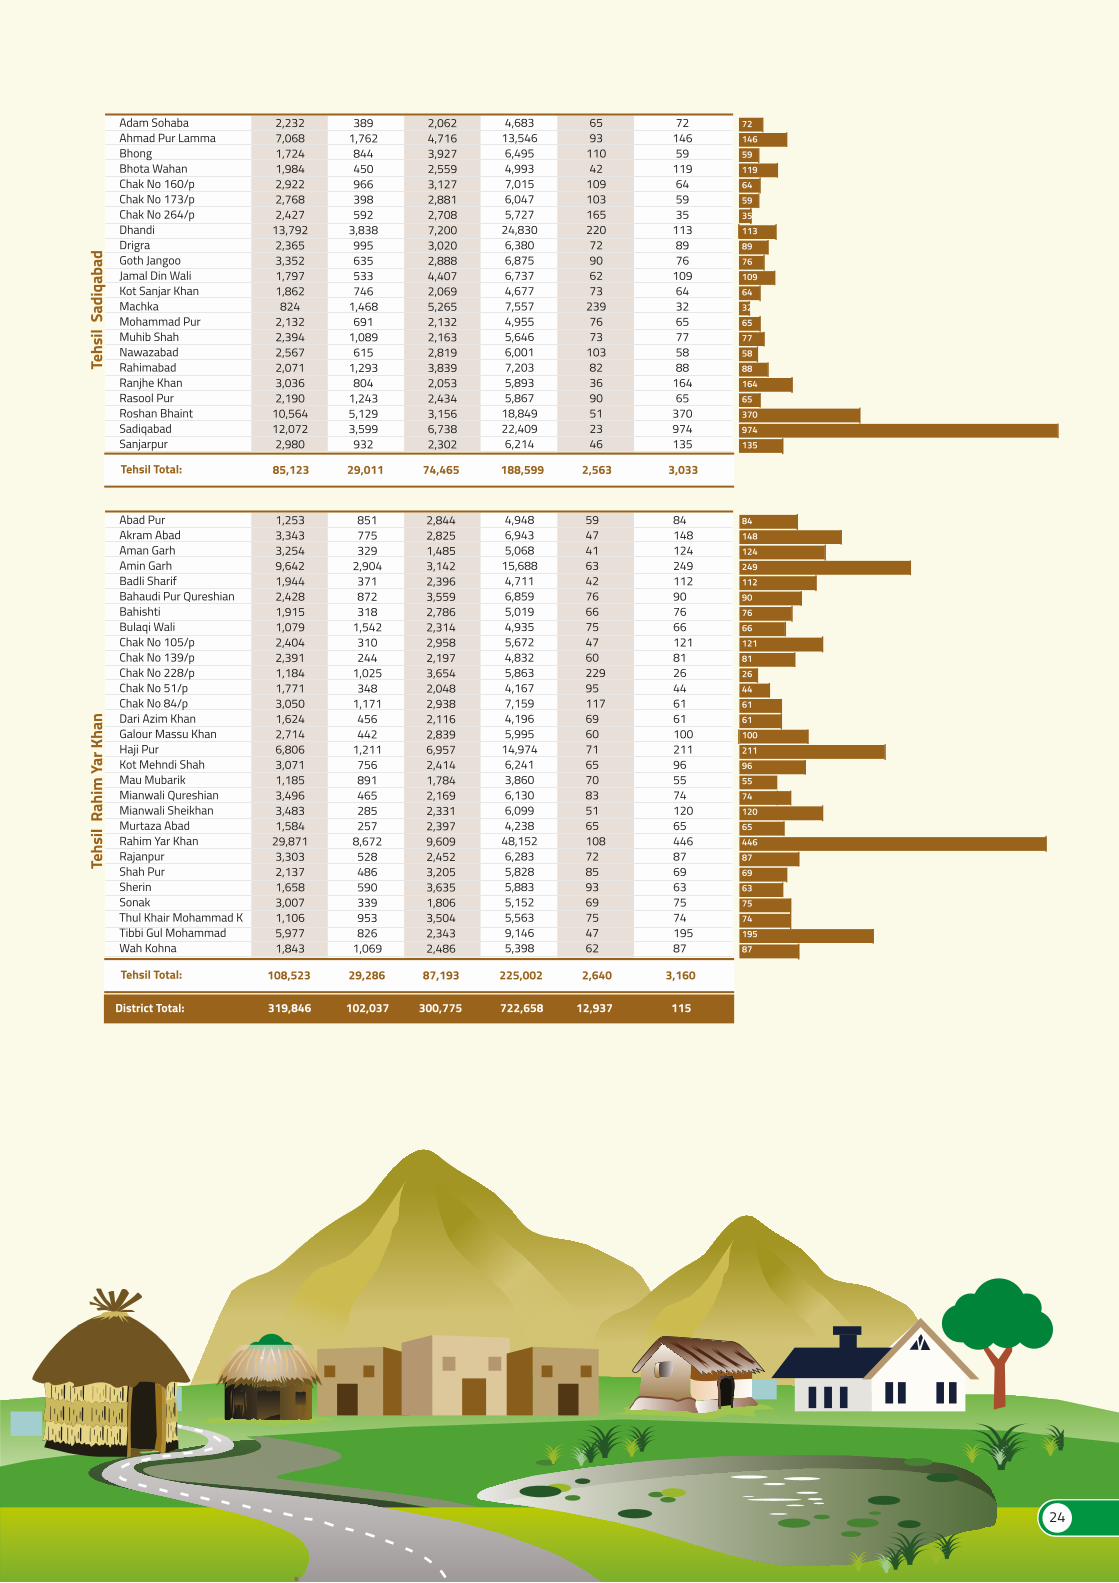
Tehsil Total: 85,123 29,011 74,465 188,599 2,563 3,033
Abad PurAkram AbadAman GarhAmin GarhBadli SharifBahaudi Pur QureshianBahishtiBulaqi WaliChak No 105/pChak No 139/pChak No 228/pChak No 51/pChak No 84/pDari Azim KhanGalour Massu KhanHaji PurKot Mehndi ShahMau MubarikMianwali QureshianMianwali SheikhanMurtaza AbadRahim Yar KhanRajanpurShah PurSherinSonakThul Khair Mohammad KTibbi Gul MohammadWah Kohna
4,9486,9435,068
15,6884,7116,8595,0194,9355,6724,8325,8634,1677,1594,1965,995
14,9746,2413,8606,1306,0994,238
48,1526,2835,8285,8835,1525,5639,1465,398
5947416342766675476022995117696071657083516510872859369754762
84148124249112907666121812644616110021196557412065446876963757419587
1,2533,3433,2549,6421,9442,4281,9151,0792,4042,3911,1841,7713,0501,6242,7146,8063,0711,1853,4963,4831,584
29,8713,3032,1371,6583,0071,1065,9771,843
851775329
2,904371872318
1,542310244
1,025348
1,171456442
1,211756891465285257
8,672528486590339953826
1,069
2,8442,8251,4853,1422,3963,5592,7862,3142,9582,1973,6542,0482,9382,1162,8396,9572,4141,7842,1692,3312,3979,6092,4523,2053,6351,8063,5042,3432,486
84148124249112907666121812644616110021196557412065446876963757419587
Tehs
il R
ahim
Yar
Kha
n
District Total: 319,846 102,037 300,775 722,658 12,937 115
Tehsil Total: 108,523 29,286 87,193 225,002 2,640 3,160
24

25
BUILDING DENSITY (2015) MAP
26
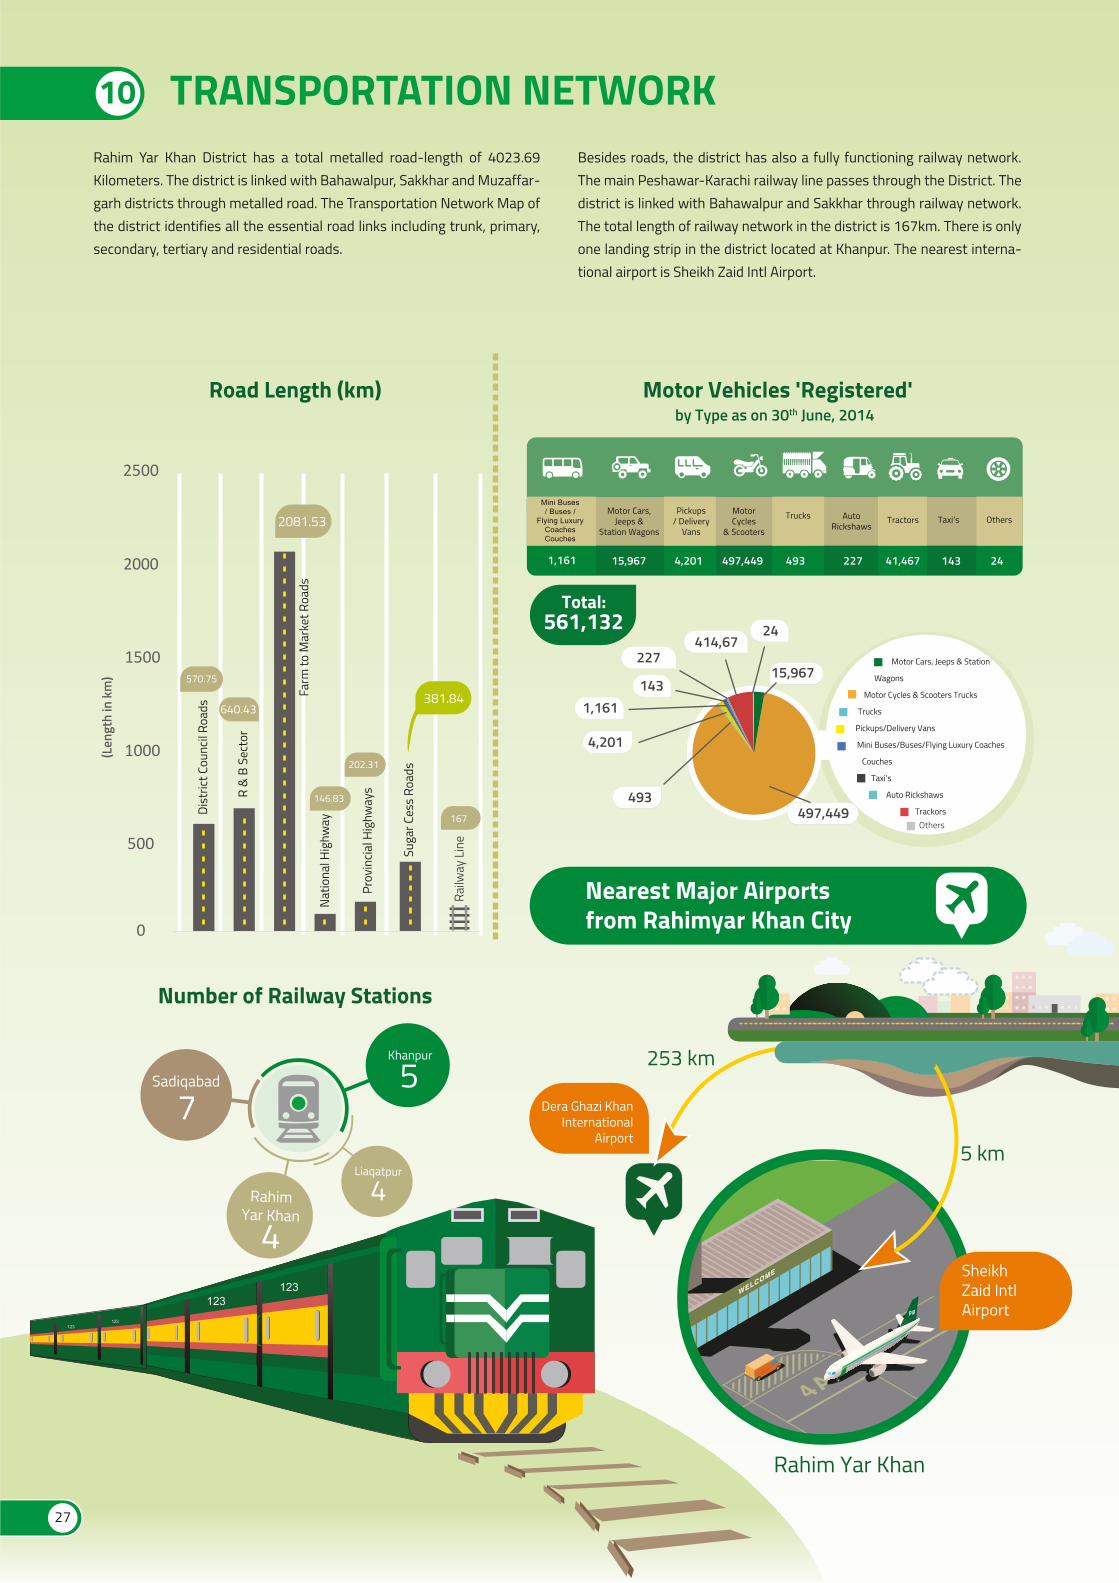
Rahim Yar Khan District has a total metalled road-length of 4023.69 Kilometers. The district is linked with Bahawalpur, Sakkhar and Muzaffar-garh districts through metalled road. The Transportation Network Map of the district identifies all the essential road links including trunk, primary, secondary, tertiary and residential roads.
Besides roads, the district has also a fully functioning railway network. The main Peshawar-Karachi railway line passes through the District. The district is linked with Bahawalpur and Sakkhar through railway network. The total length of railway network in the district is 167km. There is only one landing strip in the district located at Khanpur. The nearest interna-tional airport is Sheikh Zaid Intl Airport.
10 TRANSPORTATION NETWORK
561,132Total:
Motor Vehicles 'Registered'
123123
123123
Road Length (km)by Type as on 30th June, 2014
(Len
gth
in k
m)
0
500
1000
1500
2000
2500Ra
ilway
Lin
e
167
s
640.43
570.75
2081.53
146.83
202.31
381.84
Dist
rict C
ounc
il Roa
ds
R &
B S
ecto
r
Farm
to M
arke
t Roa
dsNa
tiona
l Hig
hway
Prov
incia
l Hig
hway
s
Suga
r Ces
s Ro
ads
Taxi’sAutoRickshaws
TrucksMini Buses/ Buses /
Flying LuxuryCoachesCouches
MotorCycles
& Scooters
Pickups/ Delivery
Vans
Motor Cars,Jeeps &
Station WagonsTractors
143 242271,161 497,4494,20115,967 41,467
Others
493
15,967
497,449
414,67227
1,161143
24
4,201
493
Motor Cars, Jeeps & Station
Wagons
Motor Cycles & Scooters Trucks
Trucks
Pickups/Delivery Vans
Mini Buses/Buses/Flying Luxury Coaches
Couches
Taxi’s
Auto Rickshaws
Trackors
Khanpur
5Sadiqabad
7
RahimYar Khan
4
Liaqatpur
4
253 km
Rahim Yar Khan
SheikhZaid IntlAirport
5 km
Nearest Major Airportsfrom Rahimyar Khan City
Number of Railway Stations
Dera Ghazi KhanInternational
Airport
Others
27
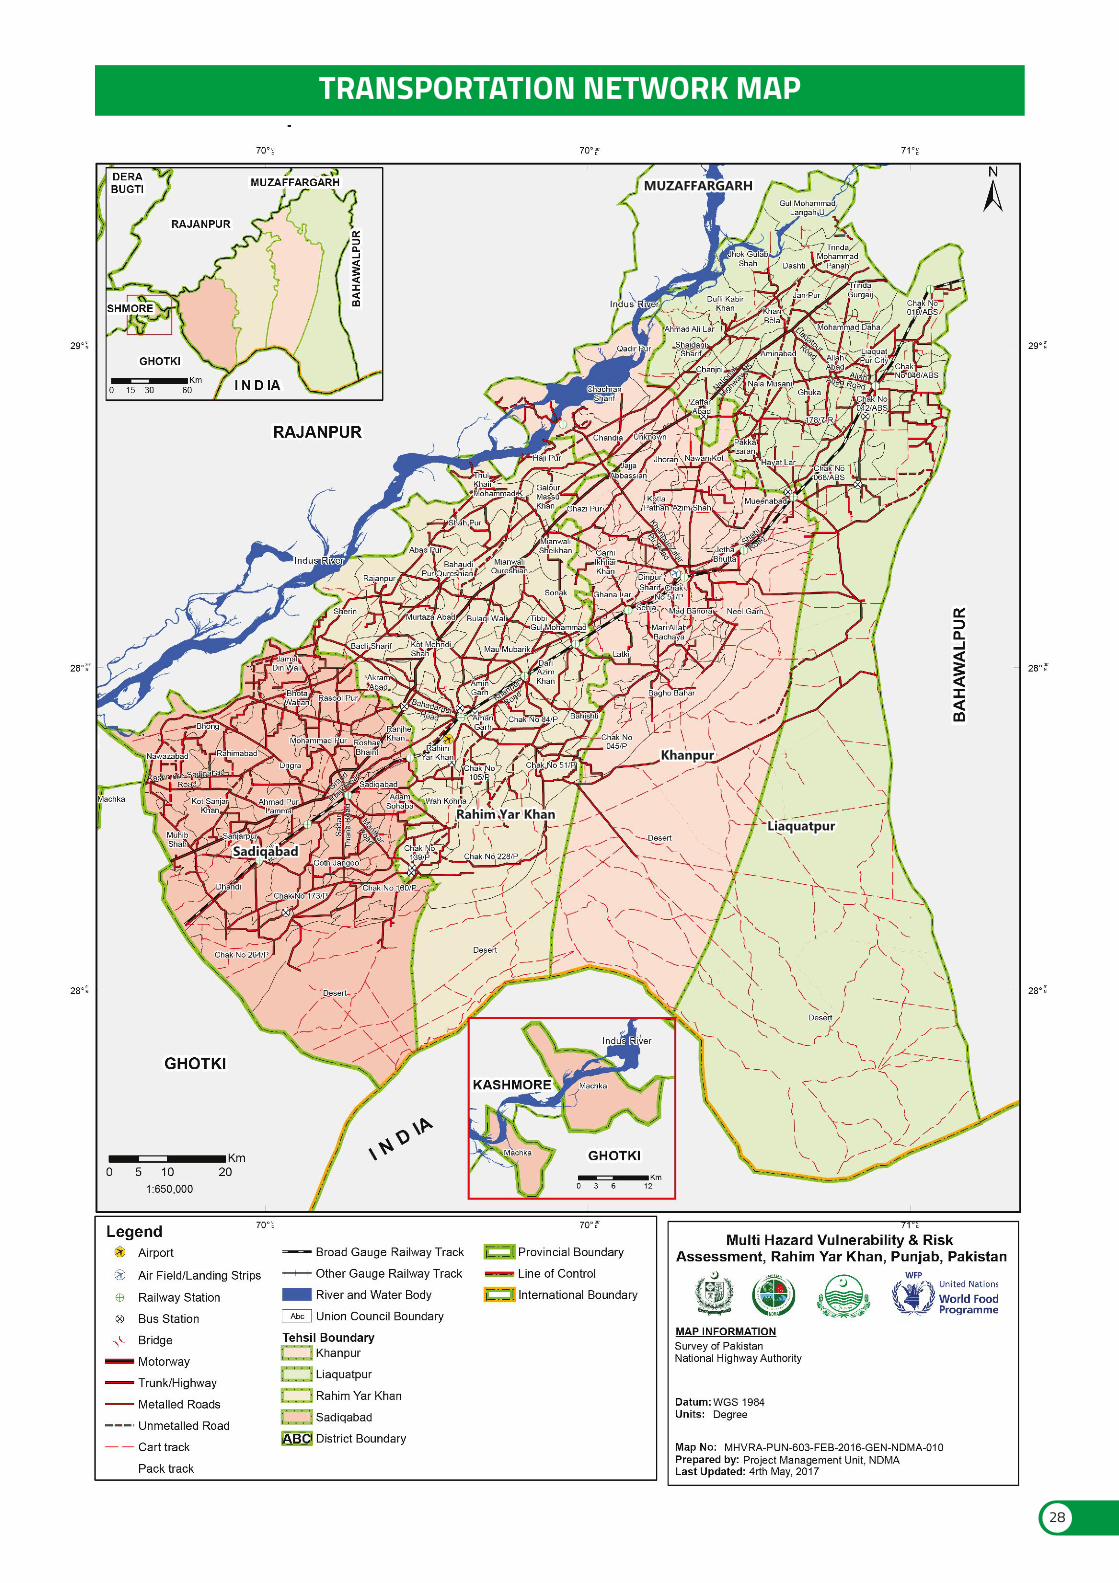
MUZAFFARGARHMUZAFFARGARH
SadiqabadSadiqabad
Rahim Yar KhanRahim Yar Khan
KhanpurKhanpur
LiaquatpurLiaquatpur
TRANSPORTATION NETWORK MAP
28
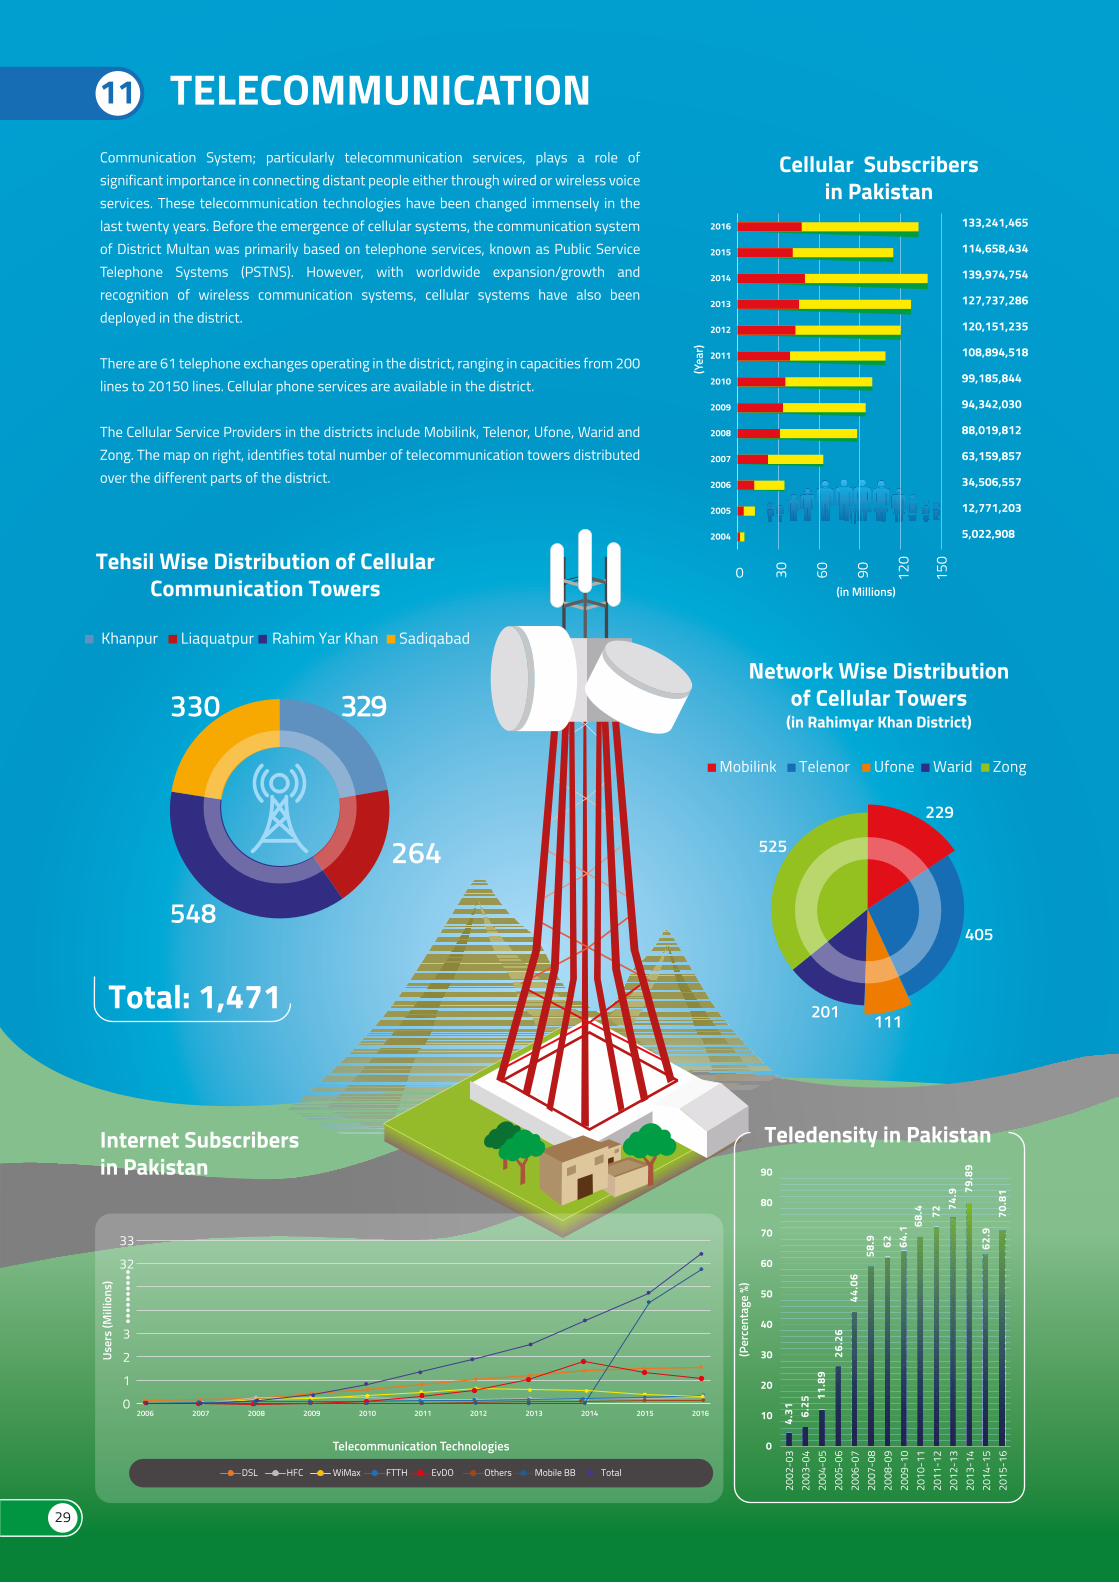
Communication System; particularly telecommunication services, plays a role of significant importance in connecting distant people either through wired or wireless voice services. These telecommunication technologies have been changed immensely in the last twenty years. Before the emergence of cellular systems, the communication system of District Multan was primarily based on telephone services, known as Public Service Telephone Systems (PSTNS). However, with worldwide expansion/growth and recognition of wireless communication systems, cellular systems have also been deployed in the district.
There are 61 telephone exchanges operating in the district, ranging in capacities from 200 lines to 20150 lines. Cellular phone services are available in the district.
The Cellular Service Providers in the districts include Mobilink, Telenor, Ufone, Warid and Zong. The map on right, identifies total number of telecommunication towers distributed over the different parts of the district.
11 TELECOMMUNICATION
Total: 1,471
150
0 30 60 90 120
2004
2005
2006
2007
2008
2009
2010
2011
2012
2013
2014
2015
2016
Cellular Subscribersin Pakistan
133,241,465
114,658,434
139,974,754
127,737,286
120,151,235
108,894,518
99,185,844
94,342,030
88,019,812
63,159,857
34,506,557
12,771,203
5,022,908
0
10
20
30
40
50
60
70
80
90
2002
-03
2003
-04
2004
-05
2005
-06
2006
-07
2007
-08
2008
-09
2009
-10
2010
-11
2011
-12
2012
-13
2013
-14
2014
-15
2015
-16
Teledensity in Pakistan
(Per
cent
age
%)
4.31 6.
2511
.89
26.2
644
.06
58.9 62 64
.168
.4 7274
.9 79.8
962
.970
.81
(Yea
r)
(in Millions)
Internet Subscribersin Pakistan
0
1
2
3
User
s (M
illio
ns)
32
33
2006 2007 2008 2009 2010 2011 2012 2013 2014 2015 2016
TotalDSL HFC WiMax FTTH EvDO Others Mobile BB
Telecommunication Technologies
Khanpur Liaquatpur SadiqabadRahim Yar Khan
264
548
330 329
Tehsil Wise Distribution of CellularCommunication Towers
Mobilink Telenor Ufone Warid Zong
Network Wise Distributionof Cellular Towers
(in Rahimyar Khan District)
229
405
111201
525
29
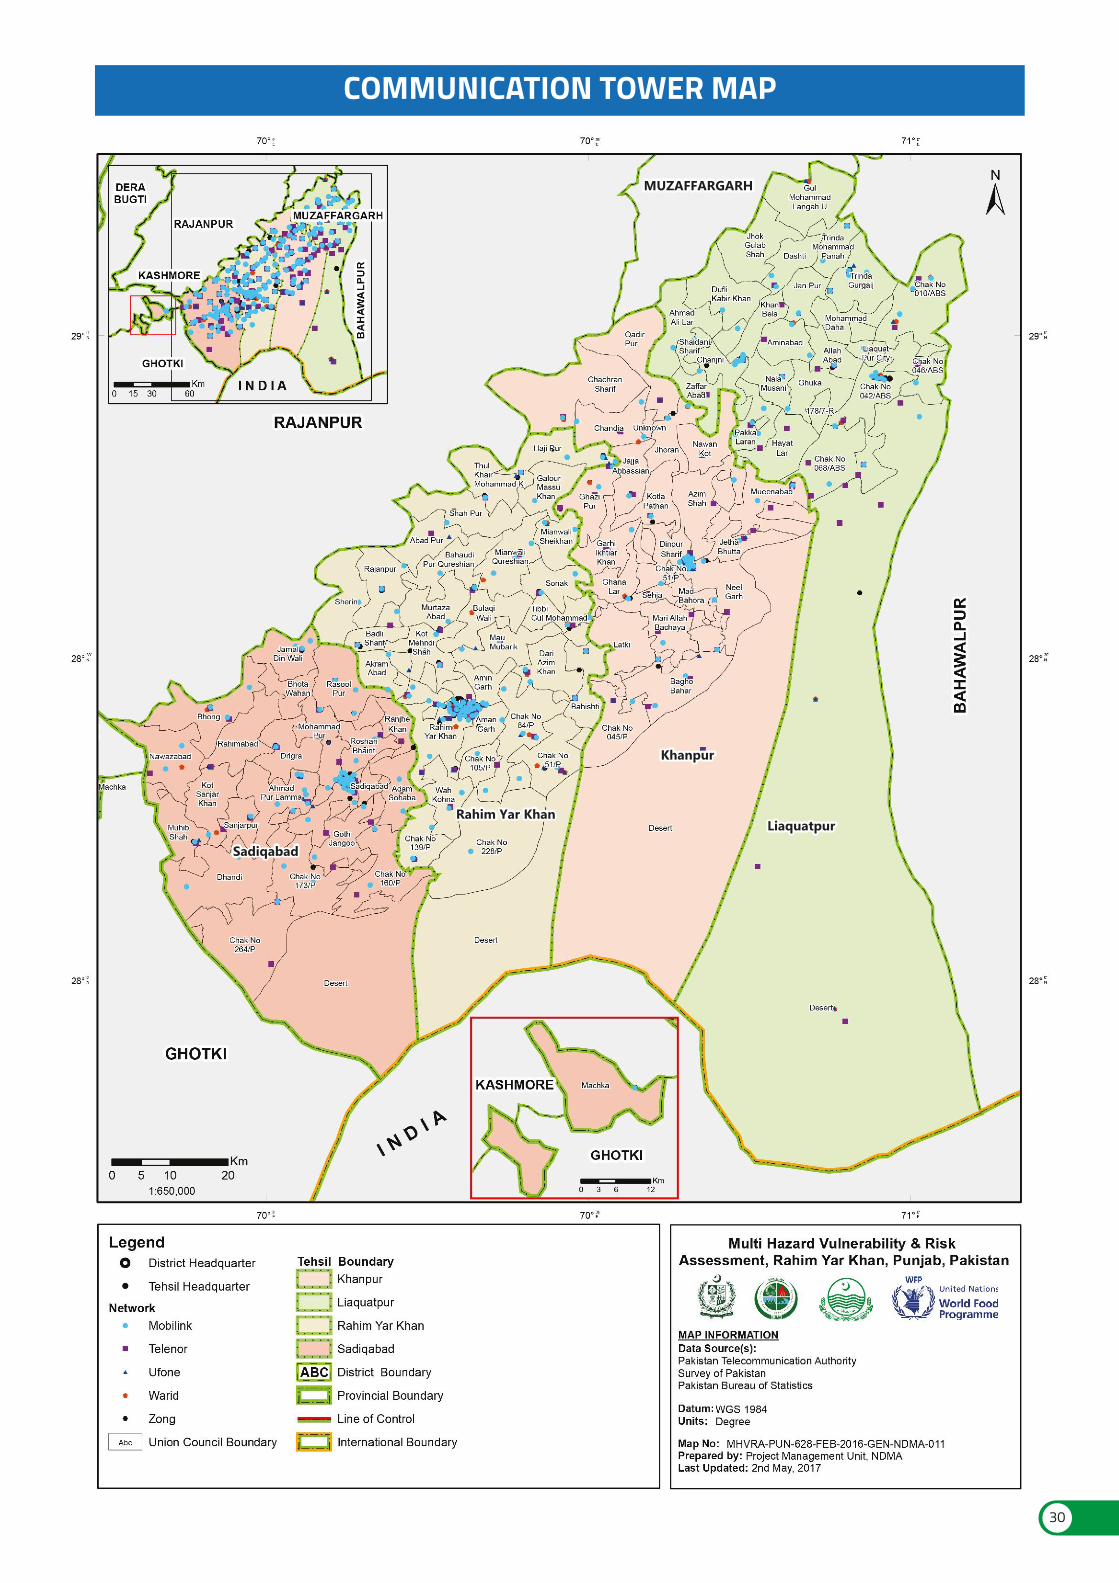
MUZAFFARGARHMUZAFFARGARH
SadiqabadSadiqabad
Rahim Yar KhanRahim Yar Khan
KhanpurKhanpur
LiaquatpurLiaquatpur
COMMUNICATION TOWER MAP
30
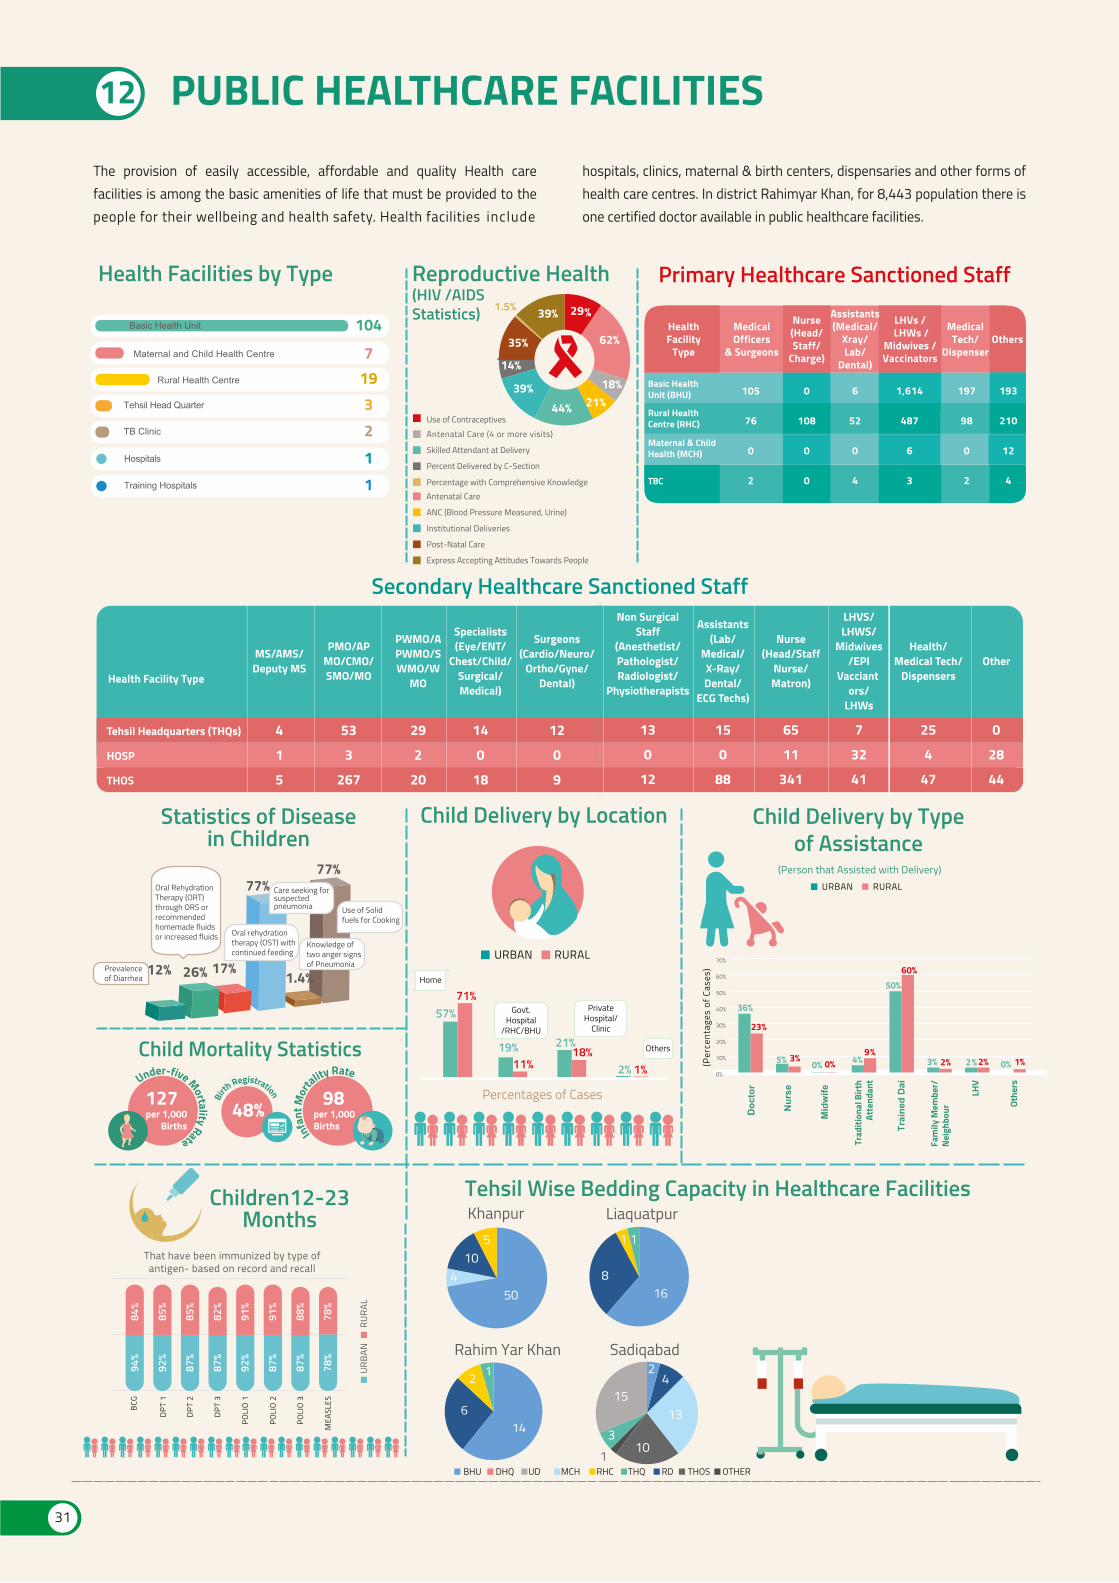
Health Facility Type
Tehsil Headquarters (THQs)
HOSP
THOS
MS/AMS/Deputy MS
4
1
5
PMO/APMO/CMO/SMO/MO
53
3
267
PWMO/APWMO/SWMO/W
MO
29
2
20
Specialists(Eye/ENT/
Chest/Child/Surgical/Medical)
14
0
18
Surgeons(Cardio/Neuro/
Ortho/Gyne/Dental)
12
0
9
Non SurgicalStaff
(Anesthetist/Pathologist/Radiologist/
Physiotherapists
Assistants(Lab/
Medical/X-Ray/Dental/
ECG Techs)
Nurse(Head/Staff
Nurse/Matron)
LHVS/LHWS/
Midwives/EPI
Vacciant ors/
LHWs
Health/Medical Tech/
DispensersOther
13
0
12
15
0
88
65
11
341
7
32
41
25
4
47
0
28
44
12 PUBLIC HEALTHCARE FACILITIES
36%
5% 0% 4%
50%
3% 2% 0%
23%
3% 0%9 %
60%
2% 2% 1%0%
10%
20%
30%
40%
50%
60%
70%
Child Delivery by Typeof Assistance
(Person that Assisted with Delivery)URBAN RURAL
(Per
cent
ages
of C
ases
)
Fam
ily M
embe
r/N
eigh
bour
LHV
Trad
ition
al B
irth
Atte
ndan
t
Othe
rs
Children12-23Months
That have been immunized by type ofantigen- based on record and recall
94%
92%
87%
87%
92%
87%
87%
78%
URBA
N
84%
85%
85%
82%
91%
91%
88%
78%
RURA
L
BCG
DPT
1
DPT
2
DPT
3
POLI
O 1
POLI
O 2
POLI
O 3
MEA
SLES
Under-five Mortality Rate
127per 1,000
Births Infan
t Mor
tality Rate
98per 1,000Births
Birth
Registration
48%
Child Mortality Statistics
Tehsil Wise Bedding Capacity in Healthcare FacilitiesKhanpur Liaquatpur
Rahim Yar Khan
504
105
168
1 1
146
2 1
10
13
415
31
2Sadiqabad
Statistics of Diseasein Children
1.4%
Oral RehydrationTherapy (ORT)through ORS orrecommendedhomemade fluidsor increased fluids
Knowledge oftwo anger signsof Pneumonia
Use of Solidfuels for Cooking
20%77%
77%
26% 17%12%Prevalenceof Diarrhea
Oral rehydrationtherapy (OST) withcontinued feeding
Care seeking forsuspectedpneumonia
Antenatal Care (4 or more visits)
Skilled Attendant at Delivery
29%
62%
18%21%44%
39%
14%
35%
1.5% 39%
Reproductive Health(HIV /AIDSStatistics)
Use of Contraceptives
Percent Delivered by C-Section
Percentage with Comprehensive KnowledgeAntenatal Care
ANC (Blood Pressure Measured, Urine)
Institutional Deliveries
Post-Natal Care
Express Accepting Attitudes Towards People
The provision of easily accessible, affordable and quality Health care facilities is among the basic amenities of life that must be provided to the people for their wellbeing and health safety. Health facilities include
hospitals, clinics, maternal & birth centers, dispensaries and other forms of health care centres. In district Rahimyar Khan, for 8,443 population there is one certified doctor available in public healthcare facilities.
Secondary Healthcare Sanctioned Staff
Primary Healthcare Sanctioned Staff
HealthFacility
Type
MedicalOfficers
& Surgeons
LHVs / LHWs /
Midwives /Vaccinators
Assistants(Medical/
Xray/Lab/
Dental)
MedicalTech/
DispenserOthers
Nurse(Head/Staff/
Charge)
Basic HealthUnit (BHU)
TBC
Maternal & ChildHealth (MCH)
Rural HealthCentre (RHC)
105
76
0
2
0
108
0
0
6
52
0
4
1,614
487
6
3
197
98
0
2
193
210
12
4
Child Delivery by Location
URBAN RURAL
19% 21%
2%
71%
11%18%
1%
Home
Govt.Hospital
/RHC/BHU
PrivateHospital/
Clinic
Others
Percentages of Cases
Rural Health Centre
104
71932
11
Health Facilities by Type
Basic Health Unit
Maternal and Child Health Centre
Tehsil Head Quarter
TB Clinic
Hospitals
Training Hospitals
57%
BHU DHQ UD MCH RHC THQ RD THOS OTHER
31
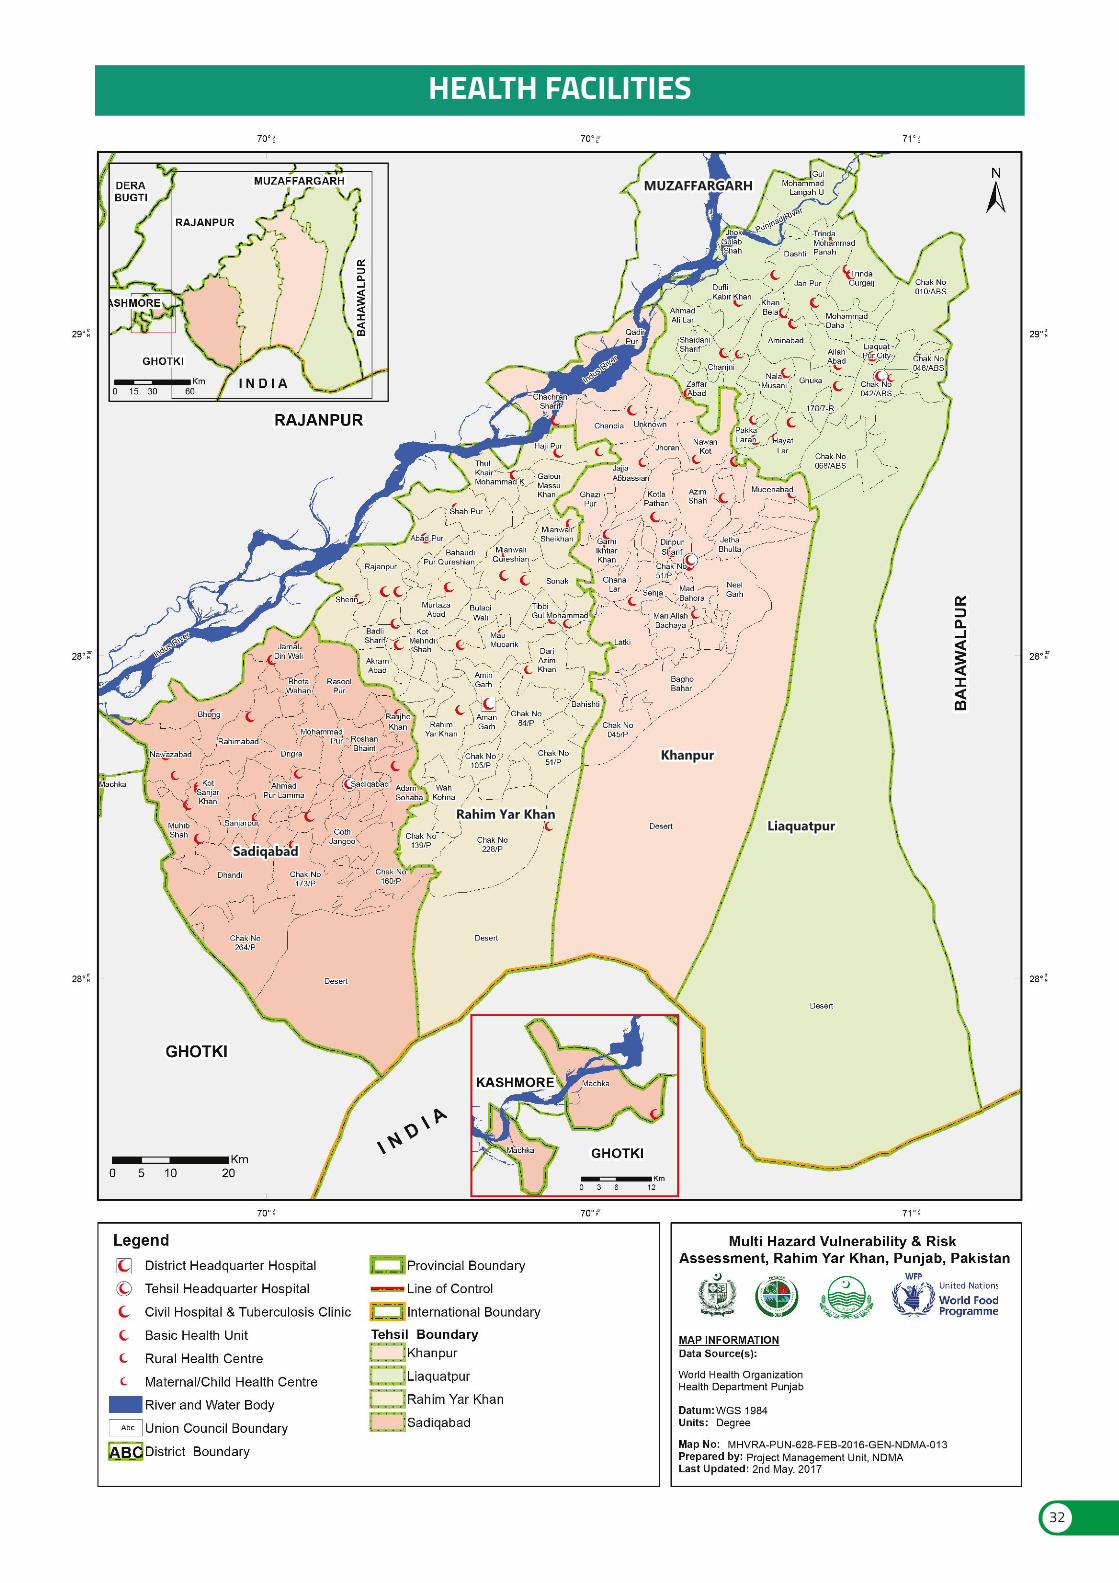
MUZAFFARGARHMUZAFFARGARH
SadiqabadSadiqabad
Rahim Yar KhanRahim Yar Khan
KhanpurKhanpur
LiaquatpurLiaquatpur
HEALTH FACILITIES
32
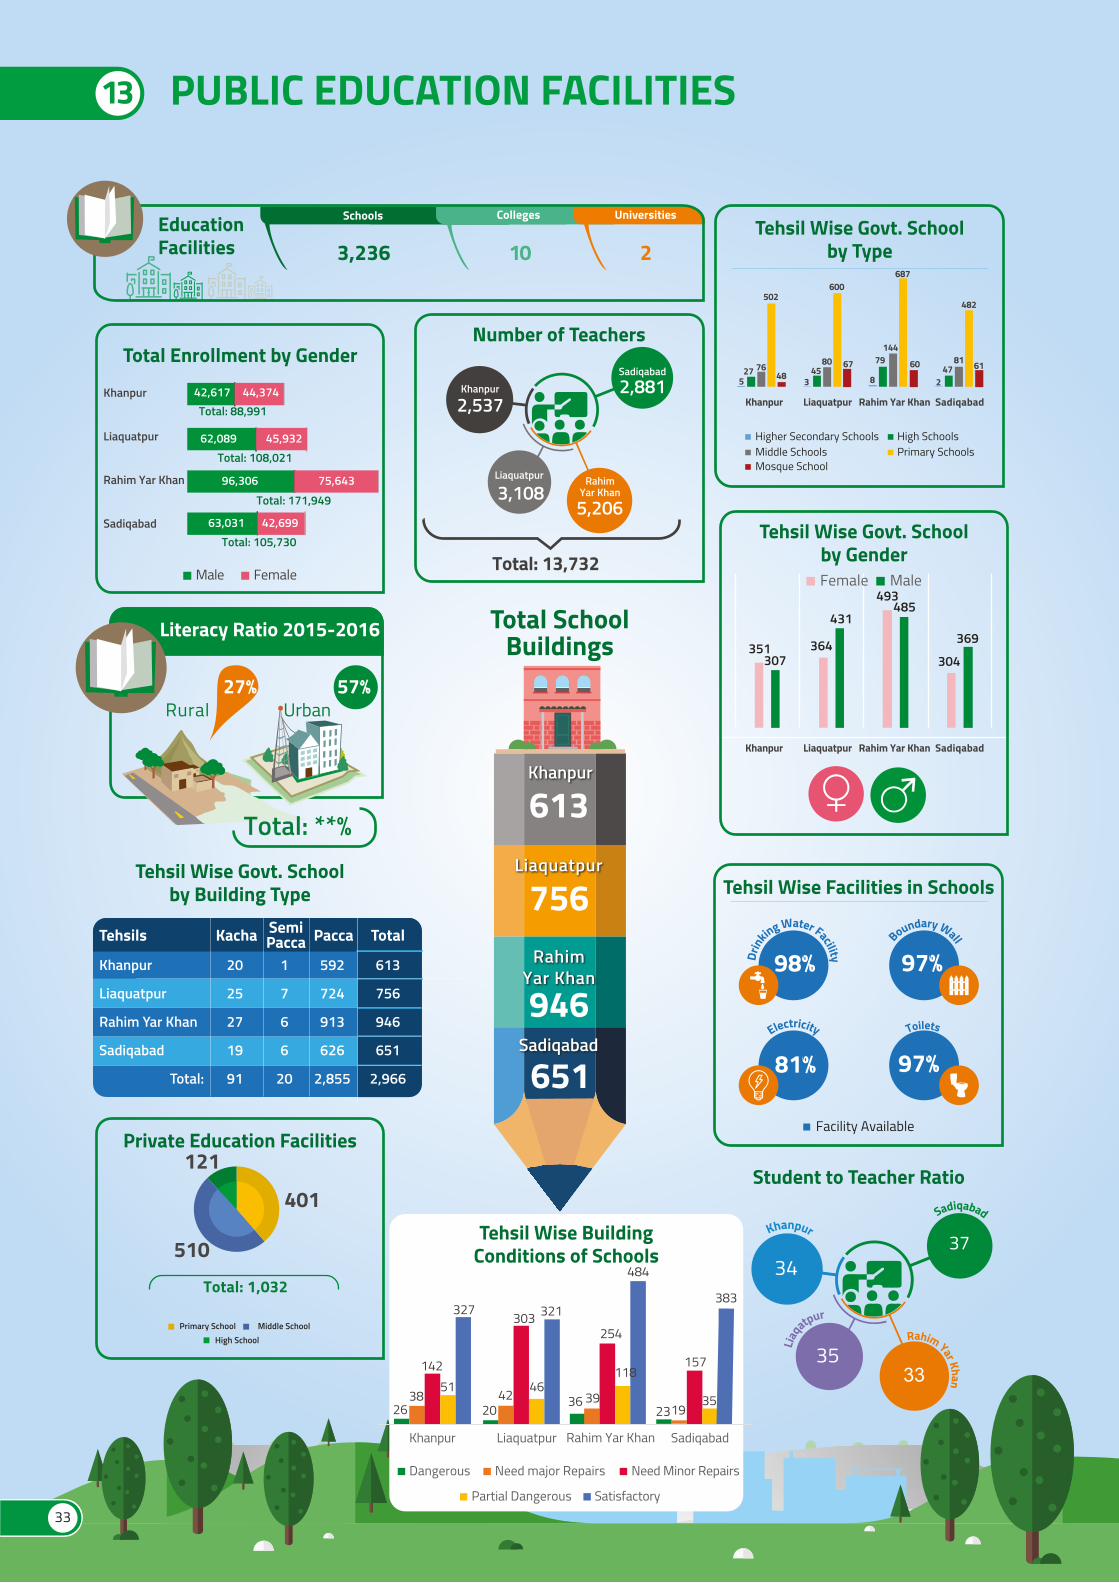
31
Tehsils
Khanpur
Liaquatpur
Rahim Yar Khan
Sadiqabad
Total:
Kacha SemiPacca Pacca Total
Private Education Facilities
Tehsil Wise Govt. Schoolby Building Type
Primary School Middle SchoolHigh School
121
401
510Total: 1,032
351 364
493
304307
431485
369
Female Male
Tehsil Wise Govt. Schoolby Gender
Tehsil Wise Govt. Schoolby Type
High SchoolsMiddle SchoolsMosque School
Primary SchoolsHigher Secondary Schools
Khanpur Liaquatpur SadiqabadRahim Yar Khan
Khanpur Liaquatpur SadiqabadRahim Yar Khan
527 76
345
80
8
79144
687
247
81
482
600502
4867 60 61
Male Female
Total Enrollment by GenderSadiqabad2,881 Khanpur
2,537
RahimYar Khan
5,206
Total: 13,732
3,108 Liaquatpur
Number of Teachers
3,236EducationFacilities 10 2
Schools
13 PUBLIC EDUCATION FACILITIES
Literacy Ratio 2015-2016
Rural Urban57%27%
Total: **%
Student to Teacher Ratio
Total SchoolBuildings
Khanpur
613Liaquatpur
756
946Sadiqabad
651
RahimYar Khan
Colleges Universities
Tehsil Wise Facilities in Schools
Facility Available
Drink
ing Water Facility98%
Electricity
81%
Boundary Wall
97%
Toilets
97%
Khanpur
Liaquatpur
Rahim Yar Khan
Sadiqabad
42,617 44,374 Total: 88,991
Total: 108,021
Total: 171,949
Total: 105,730
96,306 75,643
62,089 45,932
63,031 42,699
Tehsil Wise BuildingConditions of Schools
26 20 36 39
484
192338 42
142
303 321254
157
51
327
46118
35
383
Khanpur Liaquatpur Rahim Yar Khan Sadiqabad
Dangerous
SatisfactoryPartial Dangerous
Need Minor RepairsNeed major Repairs
3734
3335
20
25
27
19
91
1
7
6
6
20
592
724
913
626
2,855
613
756
946
651
2,966
33
KhanpurSadiqabad
Rahim Yar Khan
Liaqa
tpur
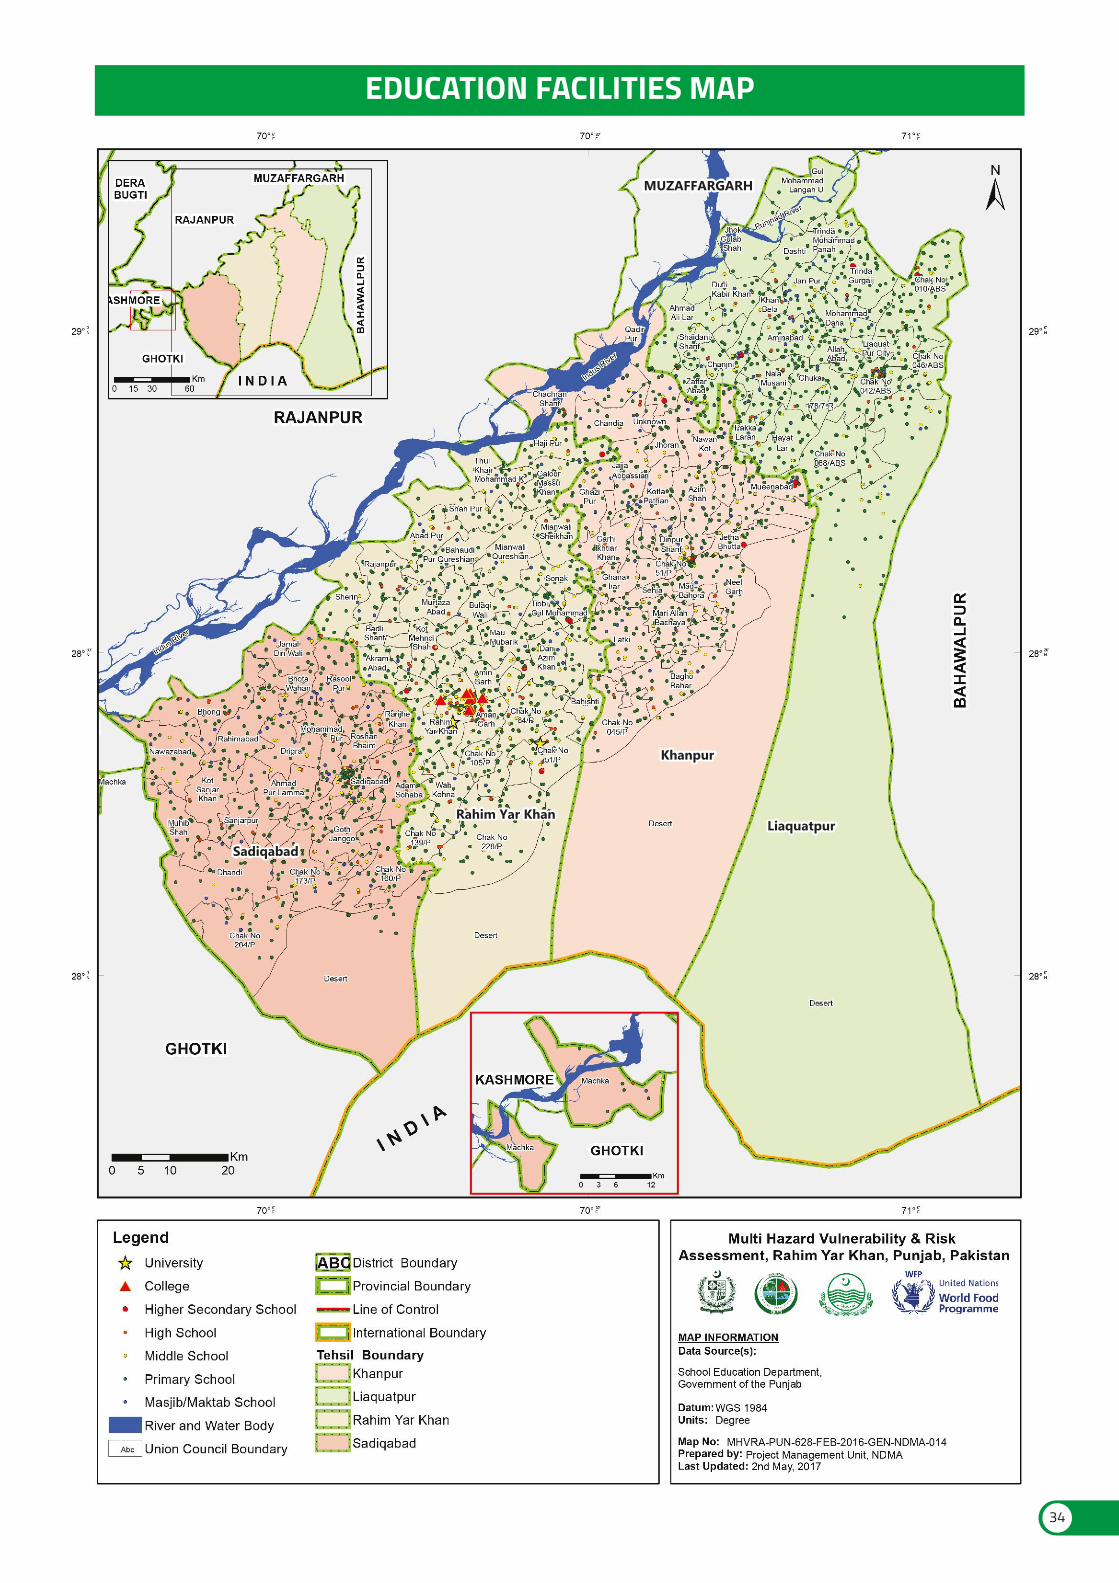
MUZAFFARGARHMUZAFFARGARH
SadiqabadSadiqabad
Rahim Yar KhanRahim Yar Khan
KhanpurKhanpur
LiaquatpurLiaquatpur
EDUCATION FACILITIES MAP
34
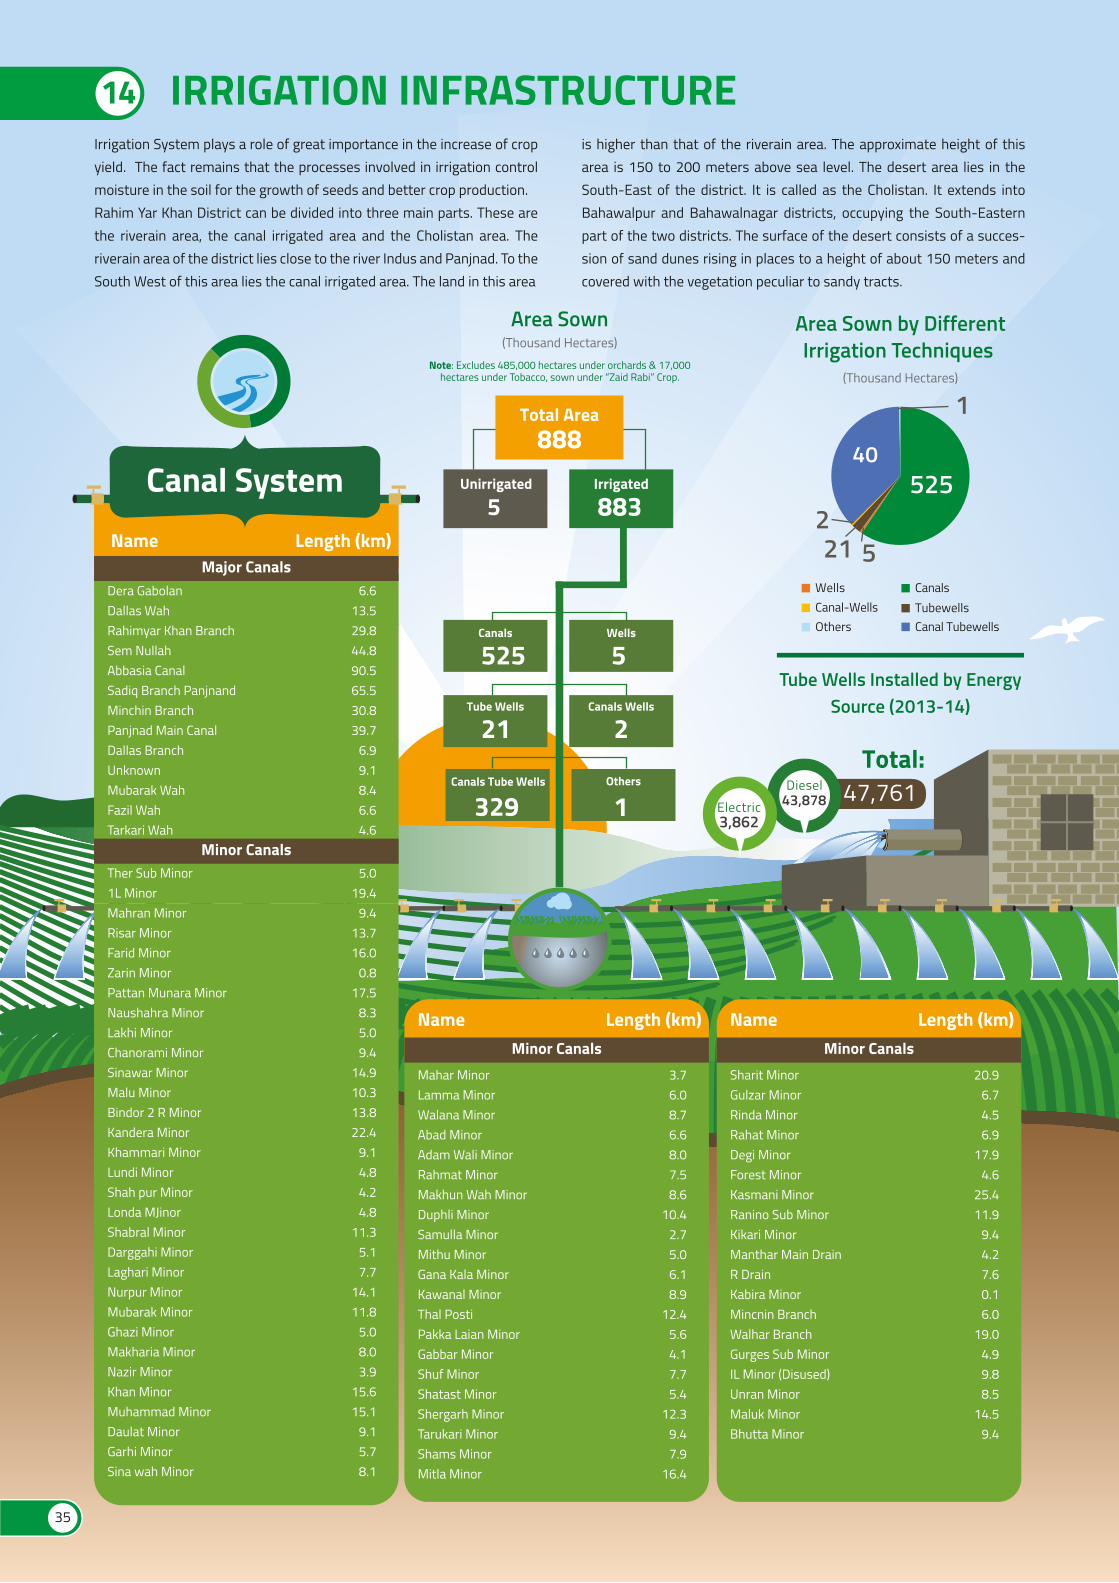
Irrigation System plays a role of great importance in the increase of crop yield. The fact remains that the processes involved in irrigation control moisture in the soil for the growth of seeds and better crop production. Rahim Yar Khan District can be divided into three main parts. These are the riverain area, the canal irrigated area and the Cholistan area. The riverain area of the district lies close to the river Indus and Panjnad. To the South West of this area lies the canal irrigated area. The land in this area
is higher than that of the riverain area. The approximate height of this area is 150 to 200 meters above sea level. The desert area lies in the South-East of the district. It is called as the Cholistan. It extends into Bahawalpur and Bahawalnagar districts, occupying the South-Eastern part of the two districts. The surface of the desert consists of a succes-sion of sand dunes rising in places to a height of about 150 meters and covered with the vegetation peculiar to sandy tracts.
)
14 IRRIGATION INFRASTRUCTURE
Area Sown(Thousand Hectares)
Note: Excludes 485,000 hectares under orchards & 17,000hectares under Tobacco, sown under “Zaid Rabi” Crop.
Tube Wells
21Canals Wells
2
Canals
525Wells
5
1Canals Tube Wells
329Others
1
Total Area888
Unirrigated
5Irrigated
883Canal System
Name Length (km)Major Canals
Dera GabolanDallas WahRahimyar Khan BranchSem NullahAbbasia CanalSadiq Branch PanjnandMinchin BranchPanjnad Main CanalDallas BranchUnknownMubarak WahFazil WahTarkari Wah
6.613.529.844.890.565.530.839.7
6.99.18.46.64.6
Minor CanalsTher Sub Minor1L MinorMahran MinorRisar MinorFarid MinorZarin MinorPattan Munara MinorNaushahra MinorLakhi MinorChanorami MinorSinawar MinorMalu MinorBindor 2 R MinorKandera MinorKhammari MinorLundi MinorShah pur MinorLonda MJinorShabral MinorDarggahi MinorLaghari MinorNurpur MinorMubarak MinorGhazi MinorMakharia MinorNazir MinorKhan MinorMuhammad MinorDaulat MinorGarhi MinorSina wah Minor
5.019.4
9.413.716.0
0.817.5
8.35.09.4
14.910.313.822.4
9.14.84.24.8
11.35.17.7
14.111.8
5.08.03.9
15.615.1
9.15.78.1
Area Sown by DifferentIrrigation Techniques
CanalsTubewellsCanal TubewellsOthers
WellsCanal-Wells
(Thousand Hectares)
Total:
Tube Wells Installed by EnergySource (2013-14)
47,761Diesel43,878Electric
3,862
5252
1
21
40
5
Name Length (km)Minor Canals
Mahar MinorLamma MinorWalana MinorAbad MinorAdam Wali MinorRahmat MinorMakhun Wah MinorDuphli MinorSamulla MinorMithu MinorGana Kala MinorKawanal MinorThal PostiPakka Laian MinorGabbar MinorShuf MinorShatast MinorShergarh MinorTarukari MinorShams MinorMitla Minor
3.76.08.76.68.07.58.6
10.42.75.06.18.9
12.45.64.17.75.4
12.39.47.9
16.4
Name Length (km)Minor Canals
Sharit MinorGulzar MinorRinda MinorRahat MinorDegi MinorForest MinorKasmani MinorRanino Sub MinorKikari MinorManthar Main DrainR DrainKabira MinorMincnin BranchWalhar BranchGurges Sub MinorIL Minor (Disused)Unran MinorMaluk MinorBhutta Minor
20.96.74.56.9
17.94.6
25.411.9
9.44.27.60.16.0
19.04.99.88.5
14.59.4
35
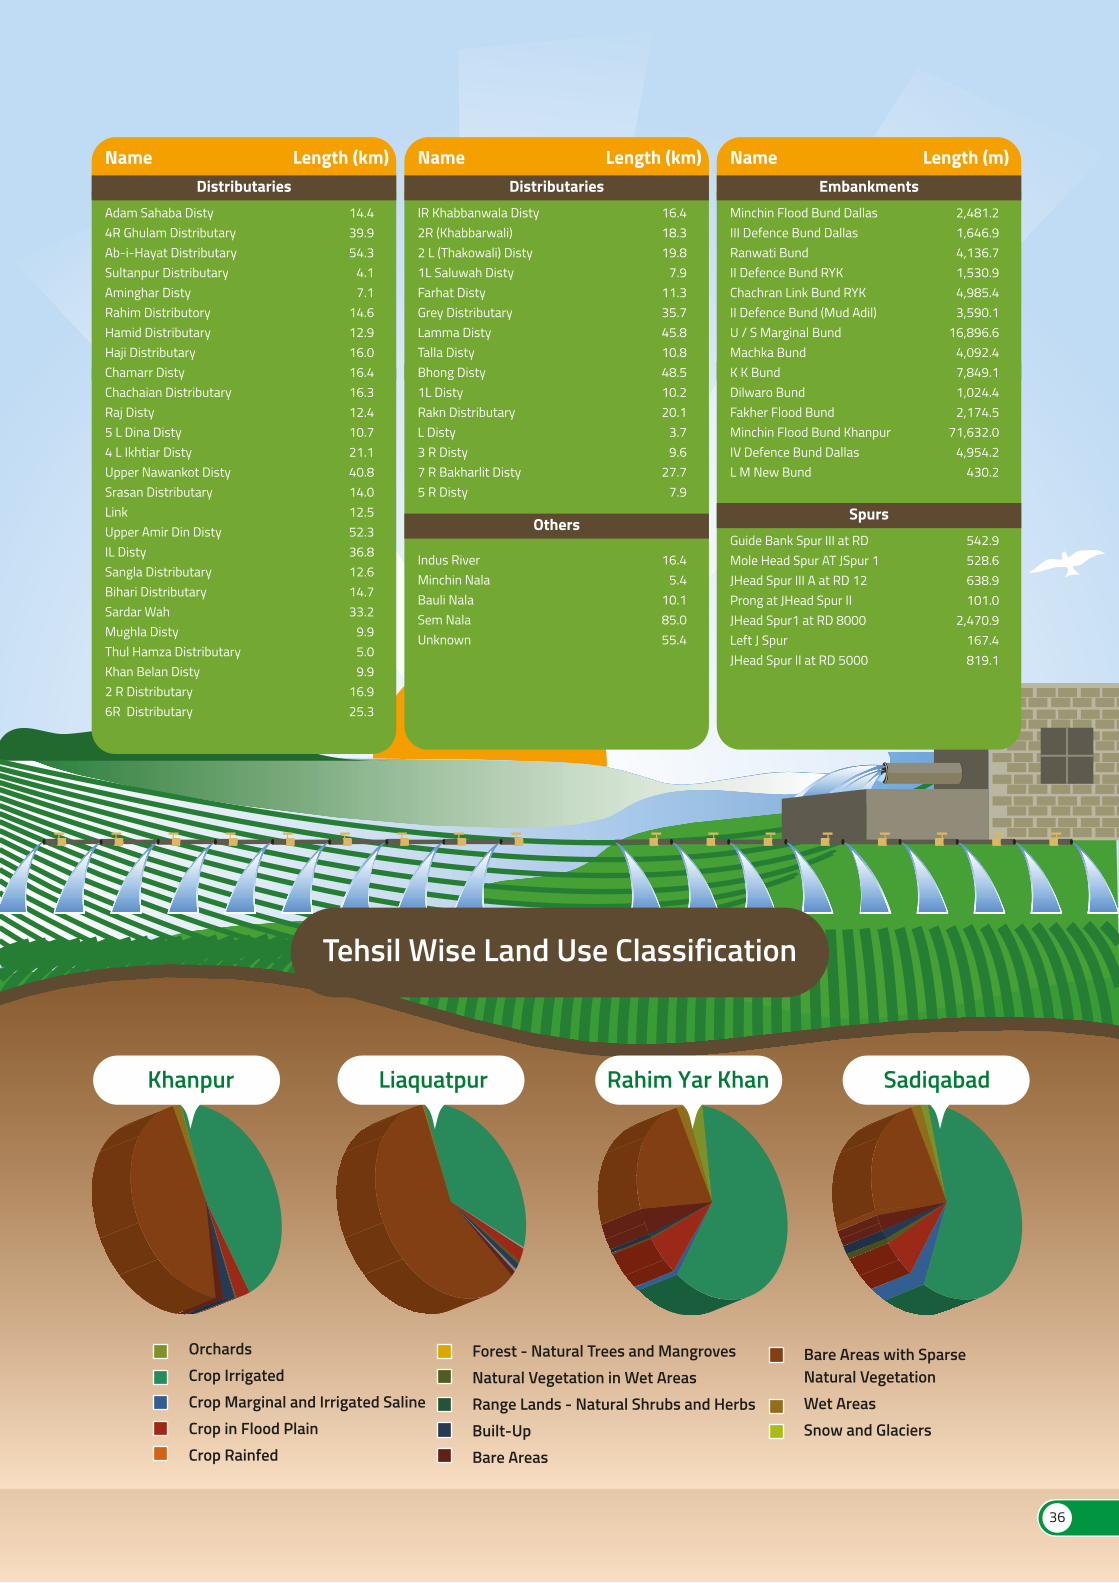
)
Name Length (km)Distributaries
IR Khabbanwala Disty2R (Khabbarwali)2 L (Thakowali) Disty1L Saluwah DistyFarhat DistyGrey DistributaryLamma DistyTalla DistyBhong Disty1L DistyRakn DistributaryL Disty3 R Disty7 R Bakharlit Disty5 R Disty
16.418.319.8
7.911.335.745.810.848.510.220.1
3.79.6
27.77.9
Indus RiverMinchin NalaBauli NalaSem NalaUnknown
16.45.4
10.185.055.4
Others
Name Length (km)Distributaries
Adam Sahaba Disty4R Ghulam DistributaryAb-i-Hayat DistributarySultanpur DistributaryAminghar DistyRahim DistributoryHamid DistributaryHaji DistributaryChamarr DistyChachaian DistributaryRaj Disty5 L Dina Disty4 L Ikhtiar DistyUpper Nawankot DistySrasan DistributaryLinkUpper Amir Din DistyIL DistySangla DistributaryBihari DistributarySardar WahMughla DistyThul Hamza DistributaryKhan Belan Disty2 R Distributary6R Distributary
14.439.954.3
4.17.1
14.612.916.016.416.312.410.721.140.814.012.552.336.812.614.733.2
9.95.09.9
16.925.3
Name Length (m)Embankments
Minchin Flood Bund DallasIII Defence Bund DallasRanwati BundII Defence Bund RYKChachran Link Bund RYKII Defence Bund (Mud Adil)U / S Marginal BundMachka BundK K BundDilwaro BundFakher Flood BundMinchin Flood Bund KhanpurIV Defence Bund DallasL M New Bund
2,481.21,646.94,136.71,530.94,985.43,590.1
16,896.64,092.47,849.11,024.42,174.5
71,632.04,954.2
430.2
SpursGuide Bank Spur III at RDMole Head Spur AT JSpur 1JHead Spur III A at RD 12Prong at JHead Spur II JHead Spur1 at RD 8000 Left J SpurJHead Spur II at RD 5000
542.9528.6638.9101.0
2,470.9167.4819.1
Khanpur Liaquatpur Rahim Yar Khan Sadiqabad
OrchardsCrop IrrigatedCrop Marginal and Irrigated SalineCrop in Flood PlainCrop Rainfed
Forest - Natural Trees and MangrovesNatural Vegetation in Wet AreasRange Lands - Natural Shrubs and HerbsBuilt-UpBare Areas
Bare Areas with SparseNatural VegetationWet AreasSnow and Glaciers
Tehsil Wise Land Use Classification
36

37
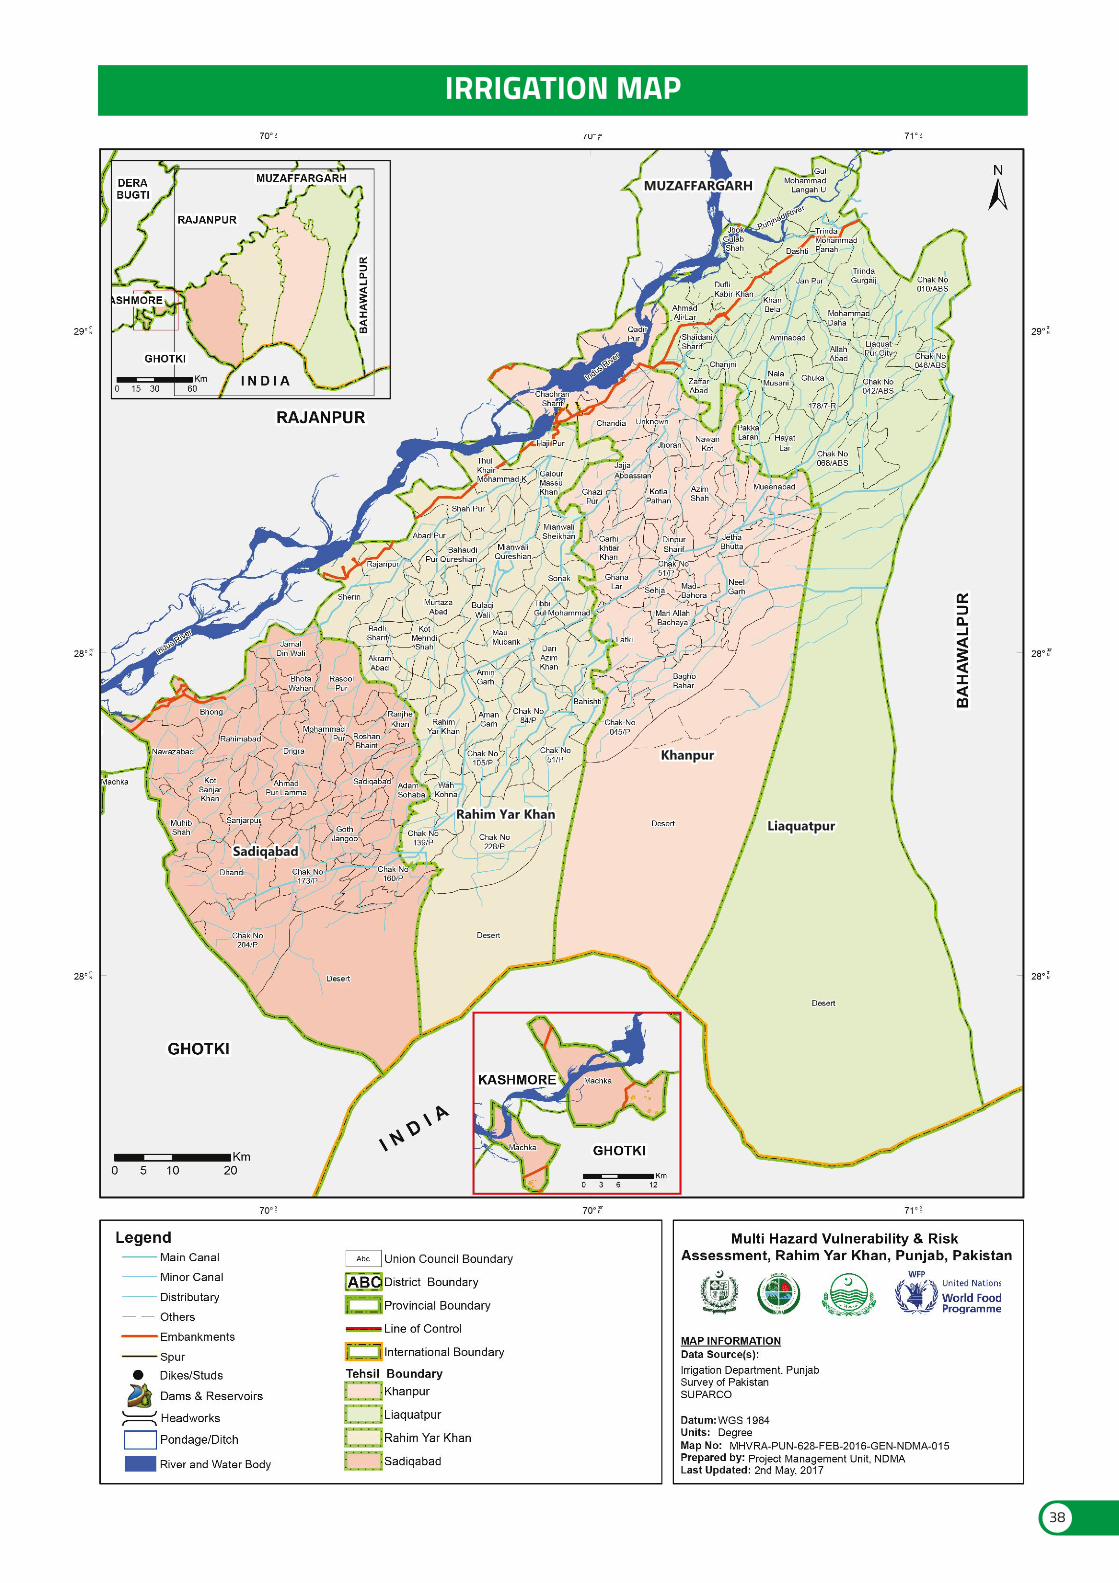
MUZAFFARGARHMUZAFFARGARH
SadiqabadSadiqabad
Rahim Yar KhanRahim Yar Khan
KhanpurKhanpur
LiaquatpurLiaquatpur
IRRIGATION MAP
38

221
13,211EstimatedEmployment
Number of Factories
Number of RegisteredFactories & Employment Level(As on 30th June 2014)
15 MAJOR INDUSTRIESThe main industries of the district are textile, cotton ginning and pressing, sugar, cottonseed oil, edible oil, soap, beverage making, agricultural implements manufacturing and fertilizer, manufacturing. Cottage indus-try includes ginning, pottery/clay products, electric desert cooler, agricul-tural machinery, handicrafts, food industry, and embroidery. Unilever, the international manufacturers of some famous brands of the world like Sunsilk shampoos, Walls ice cream, Lux, soaps etc. has one of their major factories of Pakistan in Rahim Yar khan. In view of the existing indus-tries, there exists good potential for sizing plant, good quality pack-
ing boxes, paper and paper board, high density polypropylene woven bags, paper cones and bobbins, tins for vegetable ghee / cooking oil pack-ing, hosiery, towels, etc.
There are no major minerals being mined in Rahim Yar Khan. Only lake salt is being recovered under the process of solar evaporation from various salt lakes in District Rahim Yar Khan and this is mainly used in tanneries and for refrigeration purposes
Beverage
Chemical
Cold Storage
Cotton Ginning & Pressing
Dairy Products
Drugs & Pharmaceuticals
Fertilizer
Flour Mills
Fruit Juices
G.I./M.S. Pipes
Ice Cream
Industrial / Burn Gases
Paper & Paper Board
Poultry Feed
Rice Mills
Seed Processing
Solvent Oil Extraction
Sugar
Textile Spinning
Textile Weaving
Vegetable Ghee & Cooking Oil
Woollen Textile Spinning / Weaving
90,000 Crates / Day
108 M.Tons
3,850 Bags
959 Sawgins, 206 Press, 39 Expellers
10,000 Th. Litres
390,000 Th. No. Tables, 1,200 Th. Litres Syrups,
1,200 Th. No. Injections 0.272 Th. Litres Galenicals
1,330,000 M.Tons
6,960 M.Tons /Day
2,860 Bottles
60,000 M.Tons
1,100 Litres
21,000 Cubic Meters
800 M.Tons
172,200 M.Tons
10 Hullers, 1 Sheller
21,900 M.Tons
30,000 M.Tons
56,000 Tcd
28,800 Spindles
1,268 Looms
92,000 M.Tons
414 Spindles
Industry No. of units Installed Capacity
2
1
4
206
2
1
1
41
1
1
1
1
1
5
5
4
1
3
2
15
2
1
39
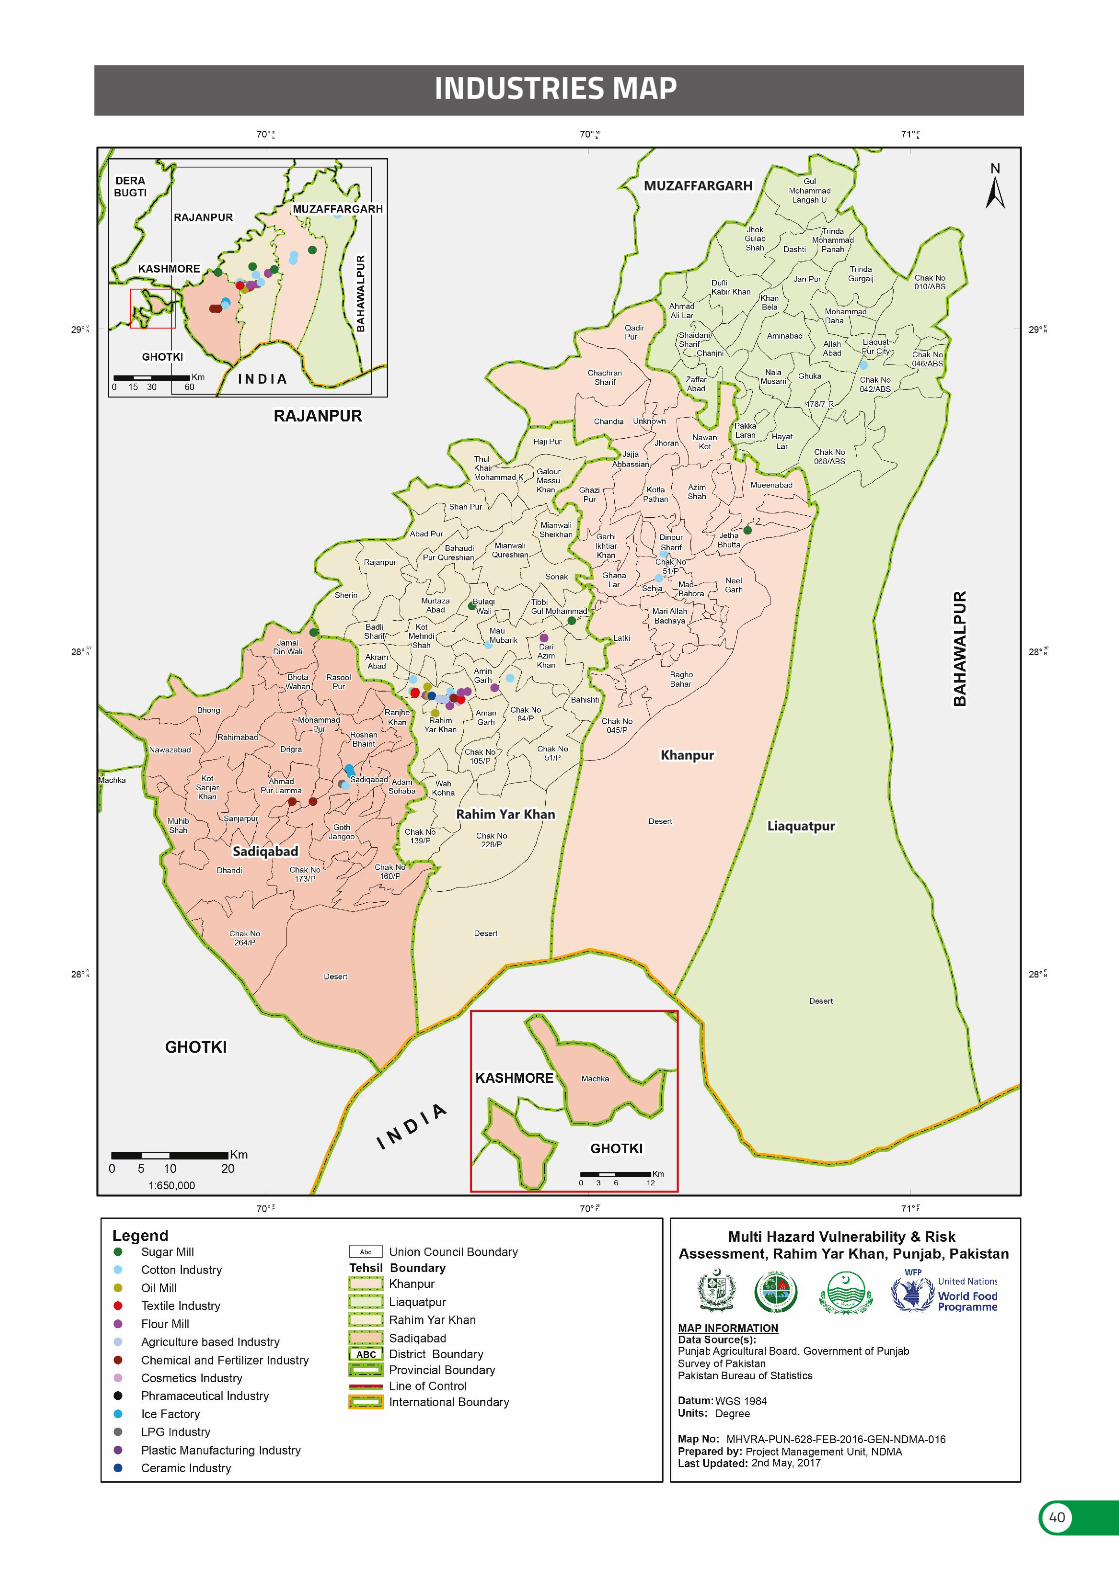
MUZAFFARGARHMUZAFFARGARH
SadiqabadSadiqabad
Rahim Yar KhanRahim Yar Khan
KhanpurKhanpur
LiaquatpurLiaquatpur
INDUSTRIES MAP
40
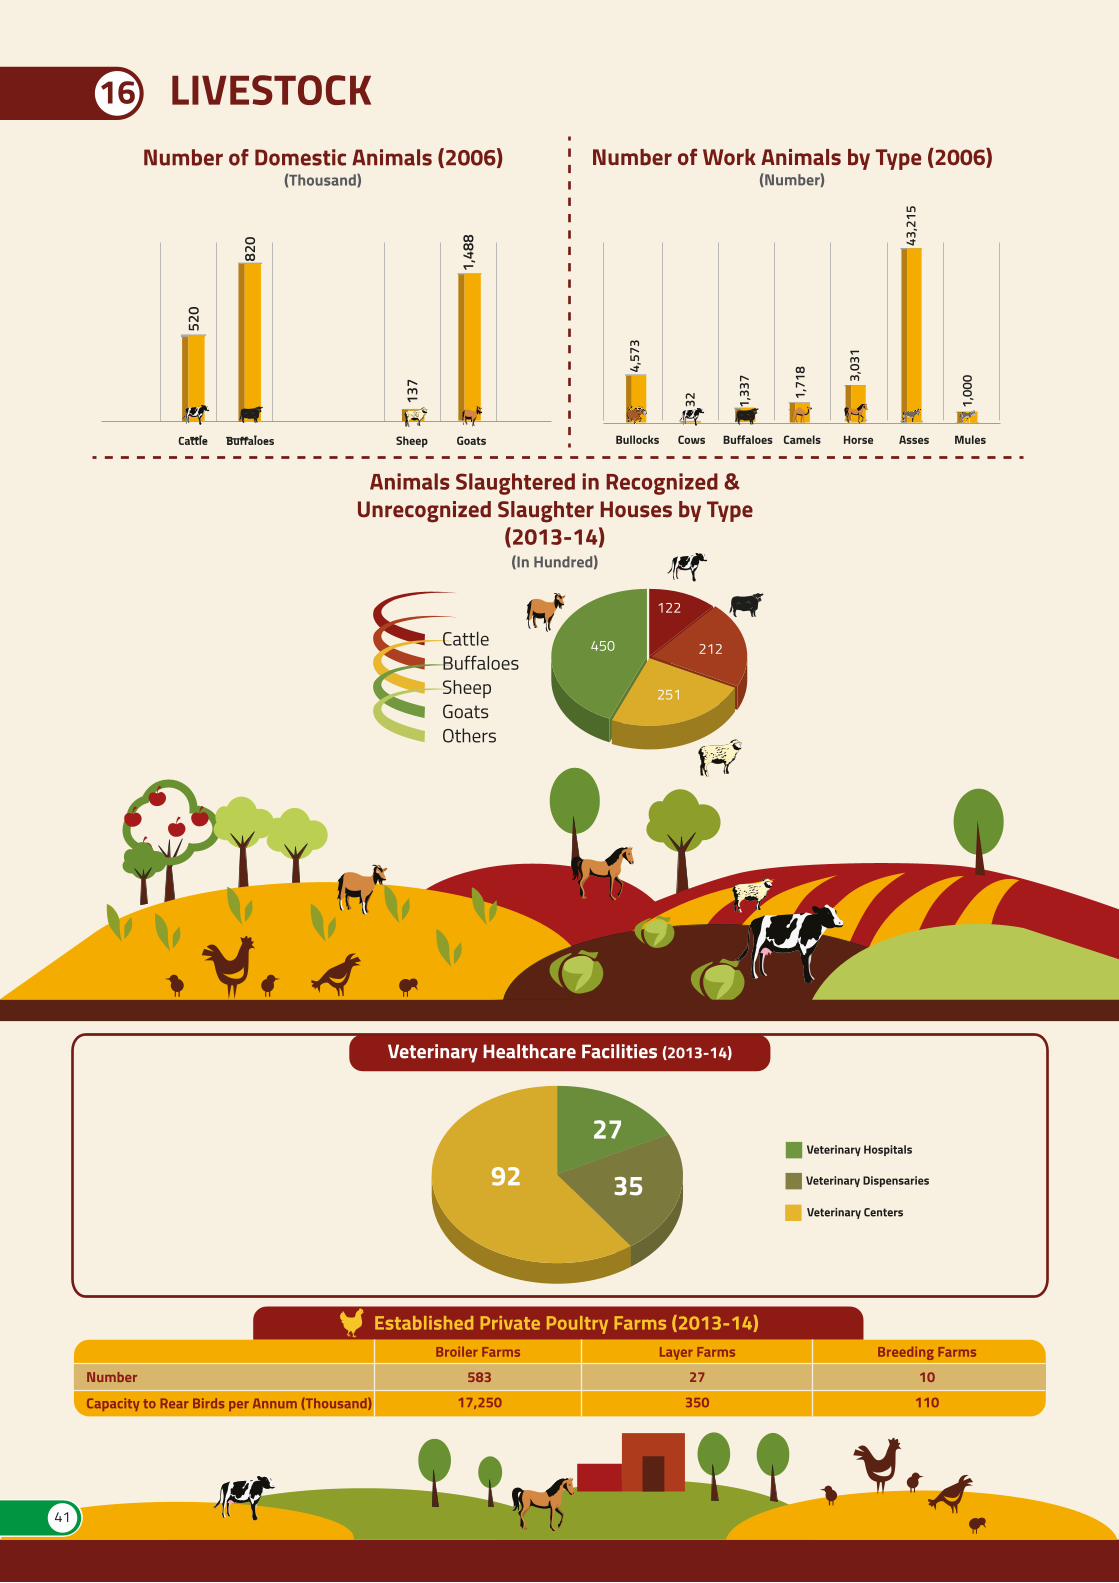
Veterinary Healthcare Facilities (2013-14)
Number
Broiler Farms
583
17,250
27
350
10
110
Layer Farms Breeding Farms
Capacity to Rear Birds per Annum (Thousand)
Established Private Poultry Farms (2013-14)
92
27
35Veterinary Hospitals
Veterinary Dispensaries
Veterinary Centers
Number of Domestic Animals (2006)(Thousand)
41
16 LIVESTOCK
520
820
Sheep Goats
137
1,48
8
Number of Work Animals by Type (2006)(Number)
Bullocks Cows Buffaloes Camels Horse Asses Mules
4,57
3
32 1,33
7
1,71
8 3,03
1
43,2
15
1,00
0
Animals Slaughtered in Recognized &Unrecognized Slaughter Houses by Type
(2013-14)(In Hundred)
CattleBuffaloesSheepGoatsOthers
450
251
212
122
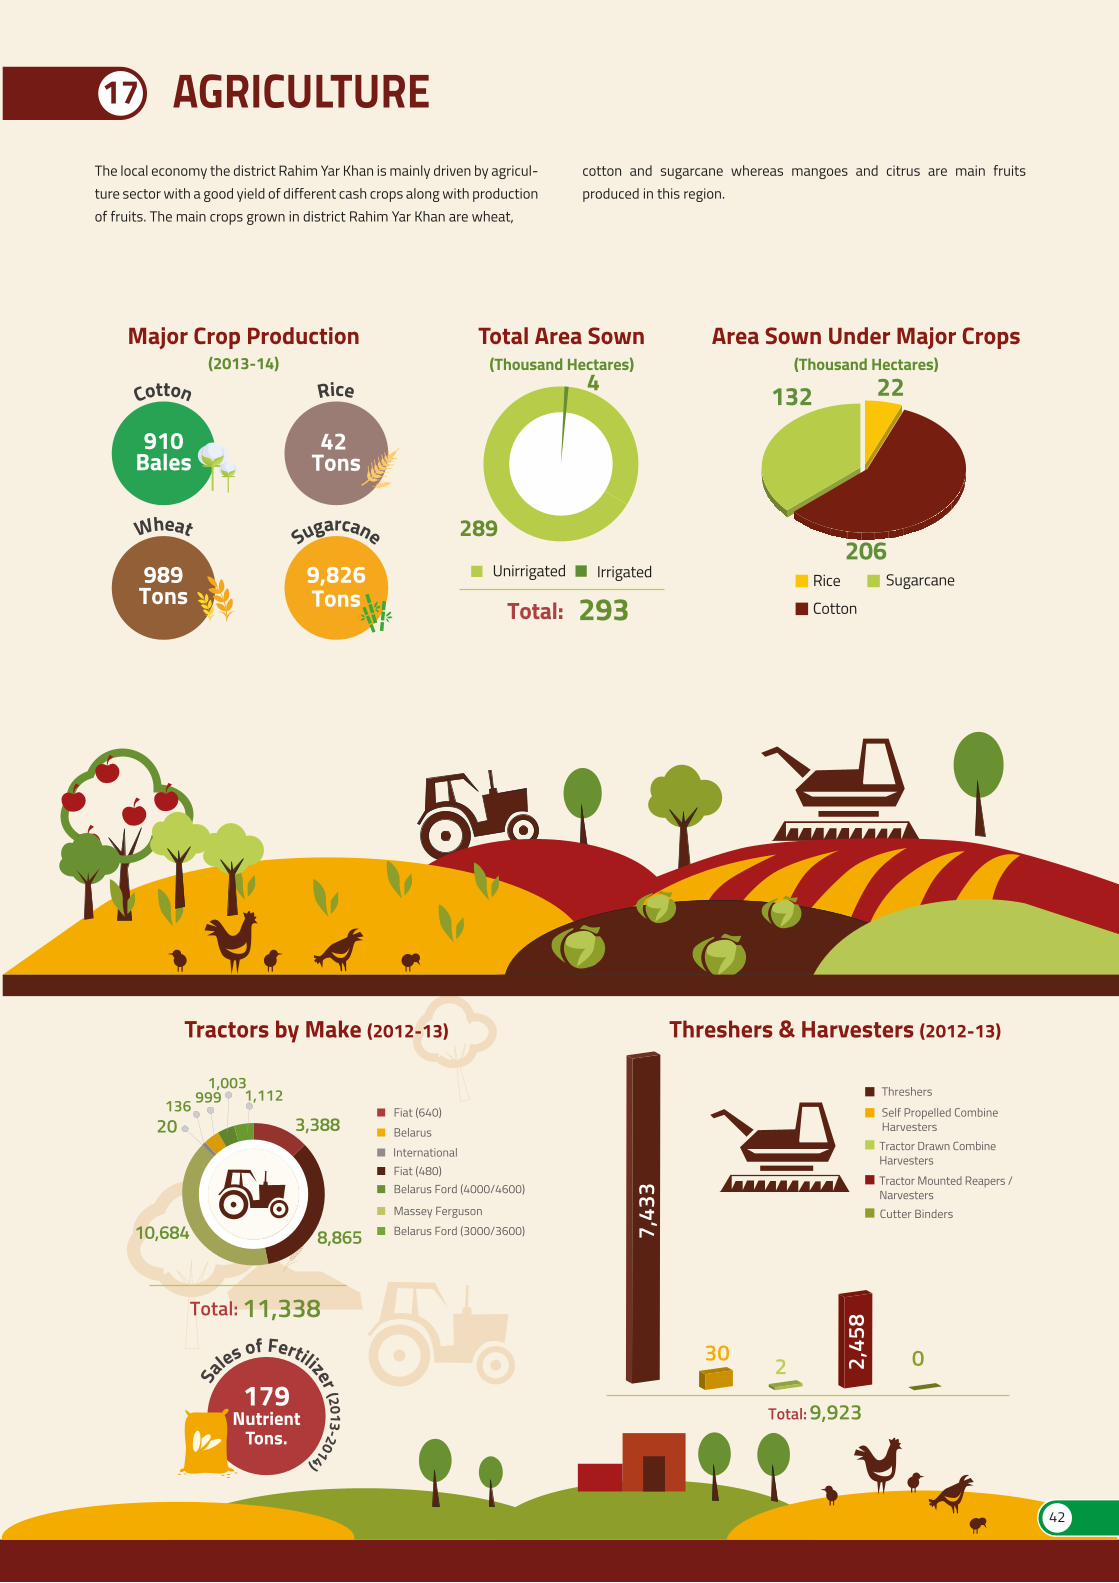
030
7,43
3
2 2,45
8
Area Sown Under Major Crops(Thousand Hectares)
132 22
206Rice Sugarcane
Cotton
Total Area Sown(Thousand Hectares)
4
289
Unirrigated Irrigated
Total: 293
11,338Total:
3,388
8,86510,684
20136 999
1,0031,112
Tractors by Make (2012-13) Threshers & Harvesters (2012-13)
The local economy the district Rahim Yar Khan is mainly driven by agricul-ture sector with a good yield of different cash crops along with production of fruits. The main crops grown in district Rahim Yar Khan are wheat,
cotton and sugarcane whereas mangoes and citrus are main fruits produced in this region.
17 AGRICULTURE
9,923Total:
Cutter Binders
Self Propelled CombineHarvesters
Threshers
Tractor Drawn CombineHarvestersTractor Mounted Reapers /Narvesters
Sa
les of Fertilizer (2013-2014)
179Nutrient
Tons.
International
Fiat (640)Belarus
Fiat (480)Belarus Ford (4000/4600)
Massey FergusonBelarus Ford (3000/3600)
Cotton
910Bales
Rice
42 Tons
Wheat
989Tons
Sugarcane
9,826Tons
Major Crop Production(2013-14)
42
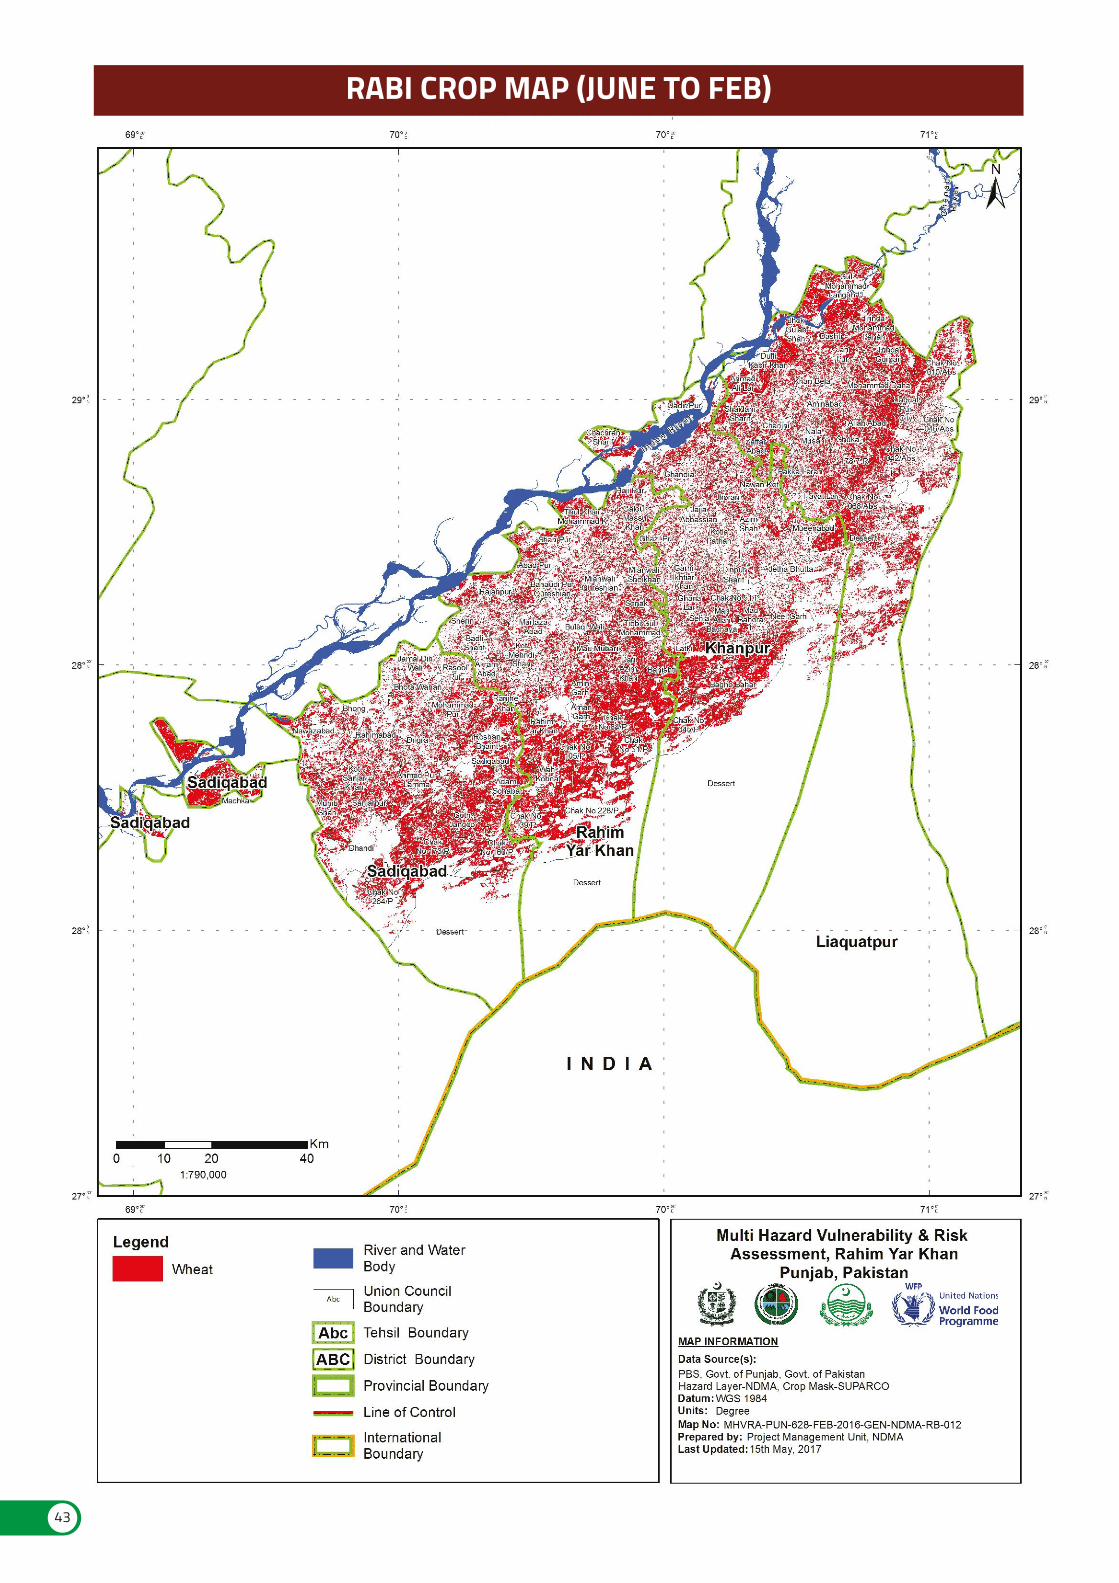
RABI CROP MAP (JUNE TO FEB)
43
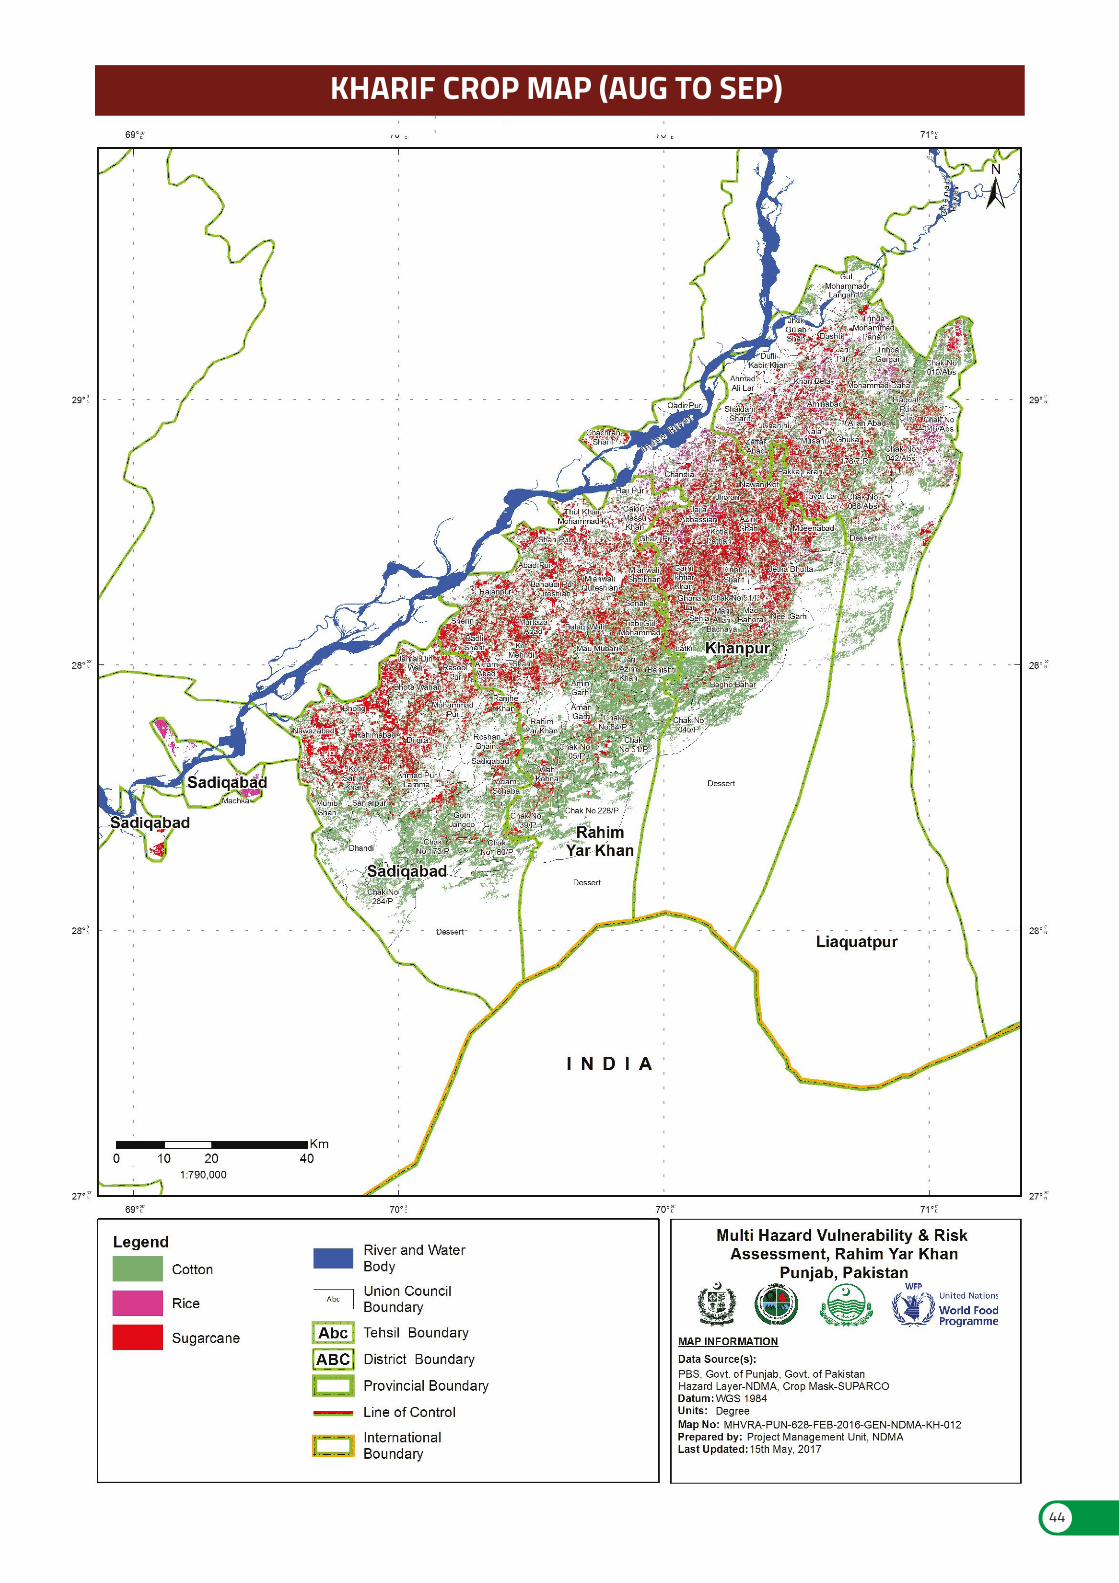
KHARIF CROP MAP (AUG TO SEP)
44
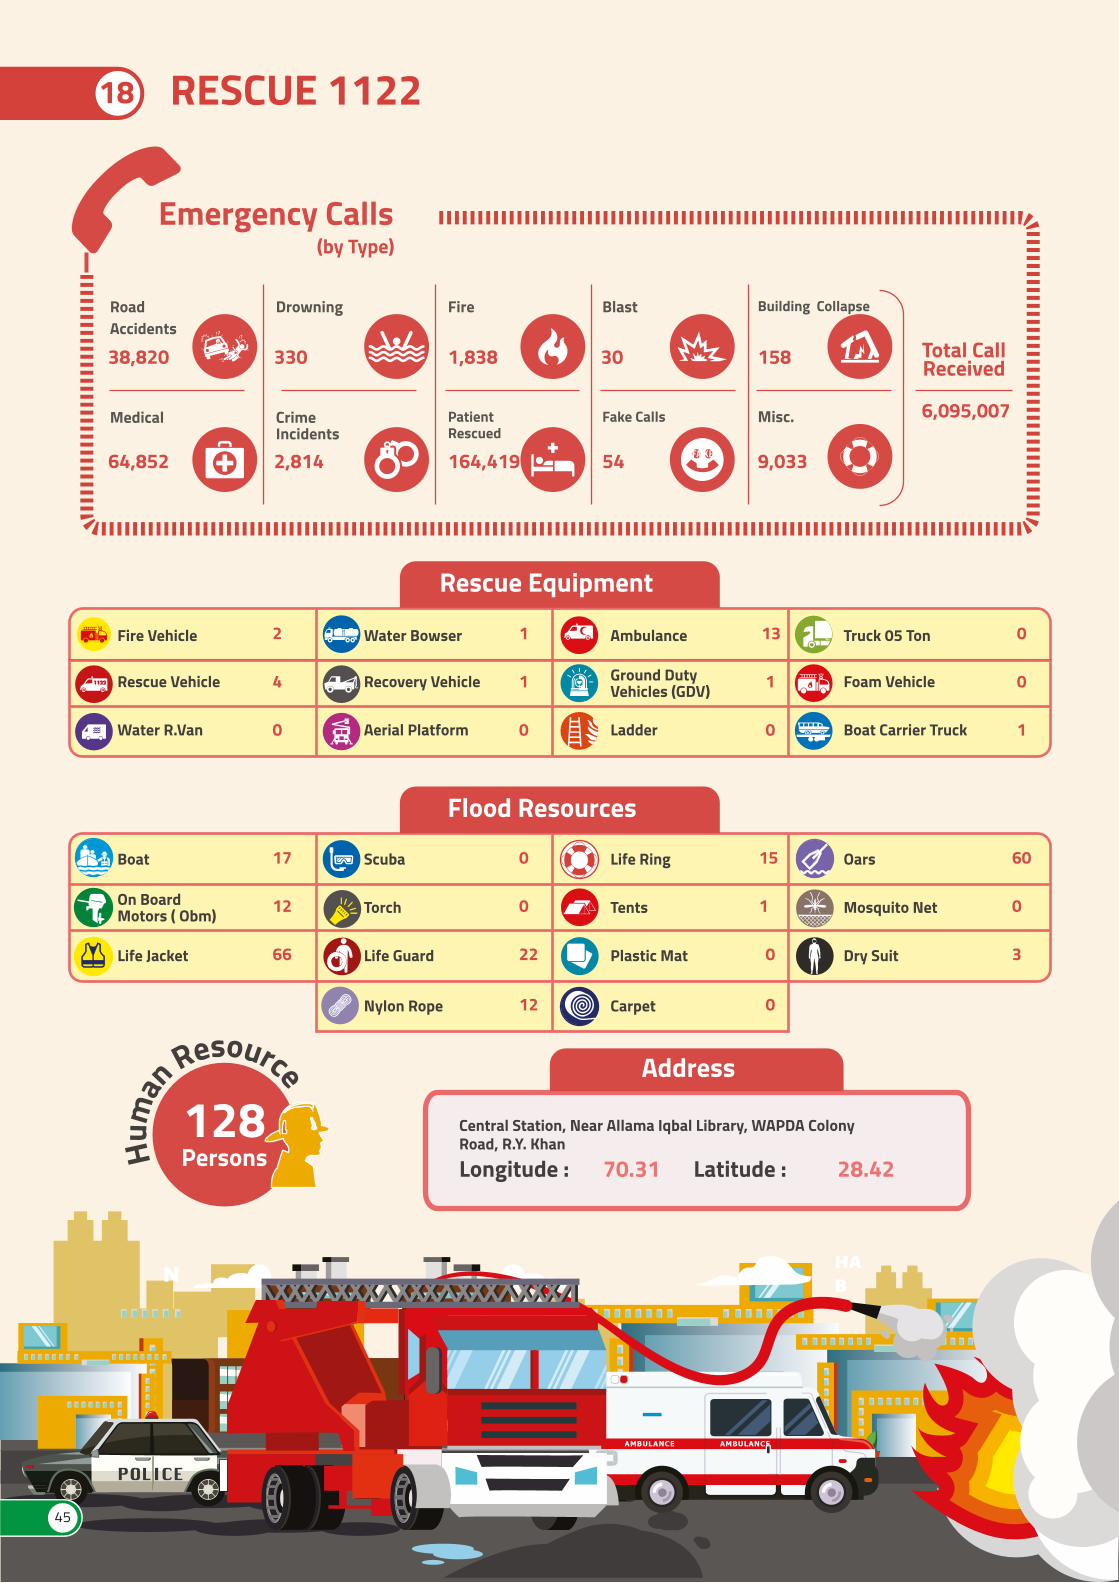
18 RESCUE 1122
RoadAccidents
38,820
Drowning
330
Fire
1,838
Blast
30
Building Collapse
158
Fake Calls
54
PatientRescued
164,419
CrimeIncidents
2,814
Medical
64,852
Misc.
9,033
Emergency Calls
Total CallReceived
6,095,007
Fire Vehicle 2
Rescue Vehicle 4
Water R.Van 0
Water Bowser 1
Recovery Vehicle 1
Aerial Platform 0
Ambulance 13
Ground DutyVehicles (GDV) 1
Ladder 0
Truck 05 Ton 0
Foam Vehicle 0
Boat Carrier Truck 1
NHAB
Boat 17
On BoardMotors ( Obm) 12
Life Jacket 66
Scuba 0
Torch 0
Life Guard 22
Life Ring 15
Tents 1
Plastic Mat 0
Oars 60
Mosquito Net 0
Dry Suit 3
Nylon Rope 12 Carpet 0
Central Station, Near Allama Iqbal Library, WAPDA ColonyRoad, R.Y. Khan
Longitude : 70.31 Latitude : 28.42
Address
Hum
an
Resource
128Persons
Rescue Equipment
Flood Resources
(by Type)
45
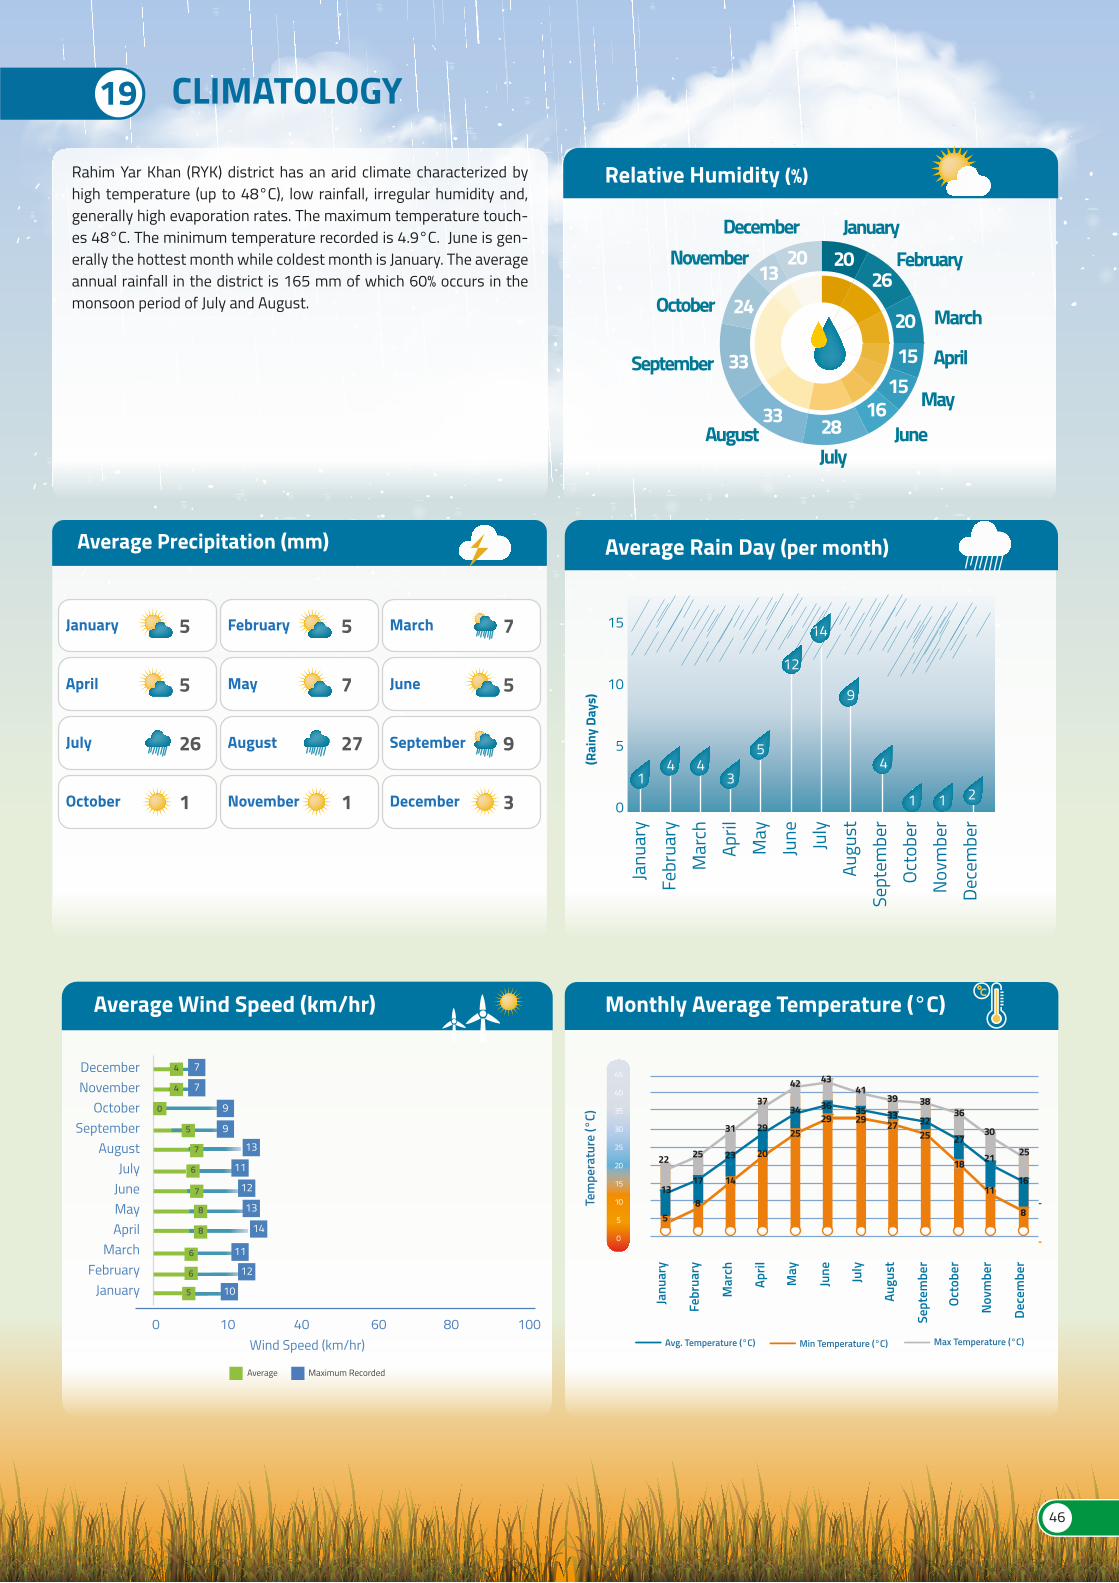
19 CLIMATOLOGY
20January
26February
20 March
15 April15 May16June28
July
33August
33September
24October13
November 20December
Relative Humidity (%)Rahim Yar Khan (RYK) district has an arid climate characterized by high temperature (up to 48°C), low rainfall, irregular humidity and, generally high evaporation rates. The maximum temperature touch-es 48°C. The minimum temperature recorded is 4.9°C. June is gen-erally the hottest month while coldest month is January. The average annual rainfall in the district is 165 mm of which 60% occurs in the monsoon period of July and August.
Average Wind Speed (km/hr)
Average Maximum Recorded
Wind Speed (km/hr)
January
0 10 40 60 80 100
FebruaryMarch
AprilMayJuneJuly
AugustSeptember
OctoberNovemberDecember 74
4
0
5
7
6
5
6
7
8
8
6
7
9
9
13
11
12
13
14
11
12
10
Monthly Average Temperature (°C)
Avg. Temperature (°C) Max Temperature (°C)Min Temperature (°C)
25
31
37
42 4341
39 3836
30
2522
17
23
29
34 36 35 33 32
27
21
1613
8
14
20
2529 29 27
25
18
11
85
Tem
pera
ture
(°C)
0
5
10
15
20
25
30
35
40
45
Janu
ary
Febr
uary
Mar
ch
April
May
June July
Augu
st
Sept
embe
r
Octo
ber
Novm
ber
Dece
mbe
r
Average Precipitation (mm)
5January 5February 7March
5April 7May 5June
26July 27August 9September
1October 1November 3December
Average Rain Day (per month)
(Rai
ny D
ays)
Janu
ary
Febr
uary
Mar
chAp
rilM
ayJu
ne July
Augu
stSe
ptem
ber
Octo
ber
Novm
ber
Dece
mbe
r
14 4
3
5
0
5
10
15
4
12
14
9
1 1 2
46

47
44
HAZARD ASSESSMENTDROUGHTEARTHQUAKEFLOOD
B
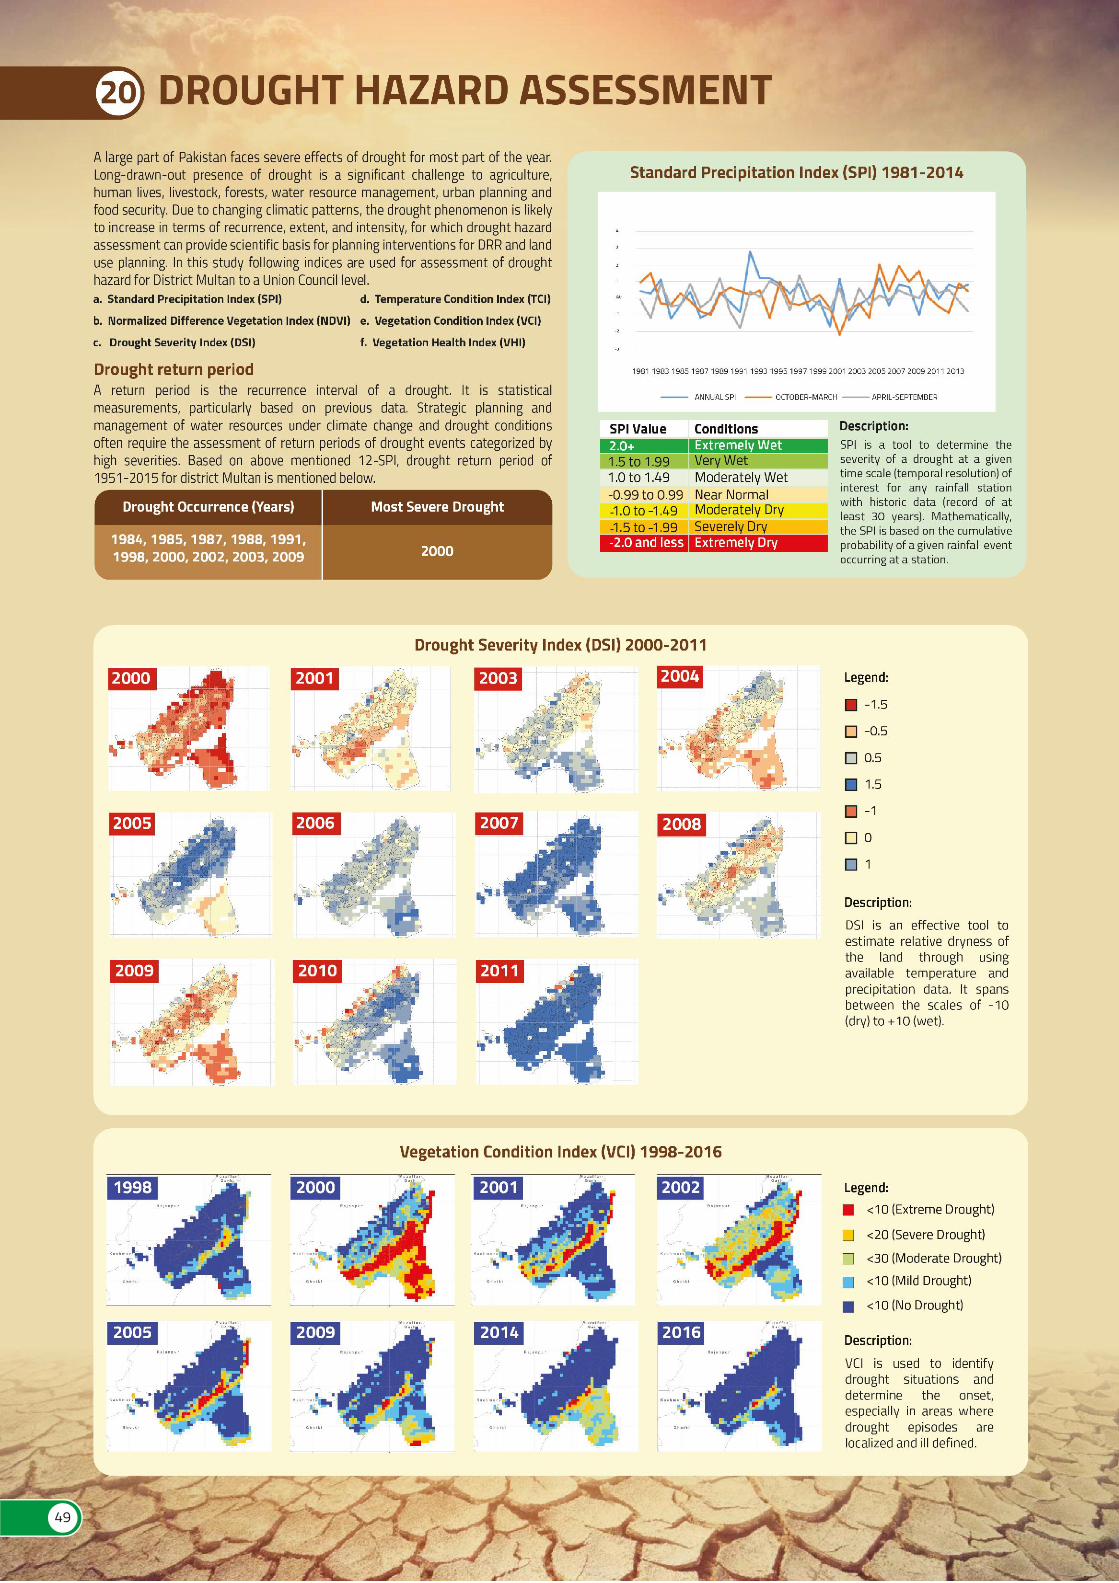
49
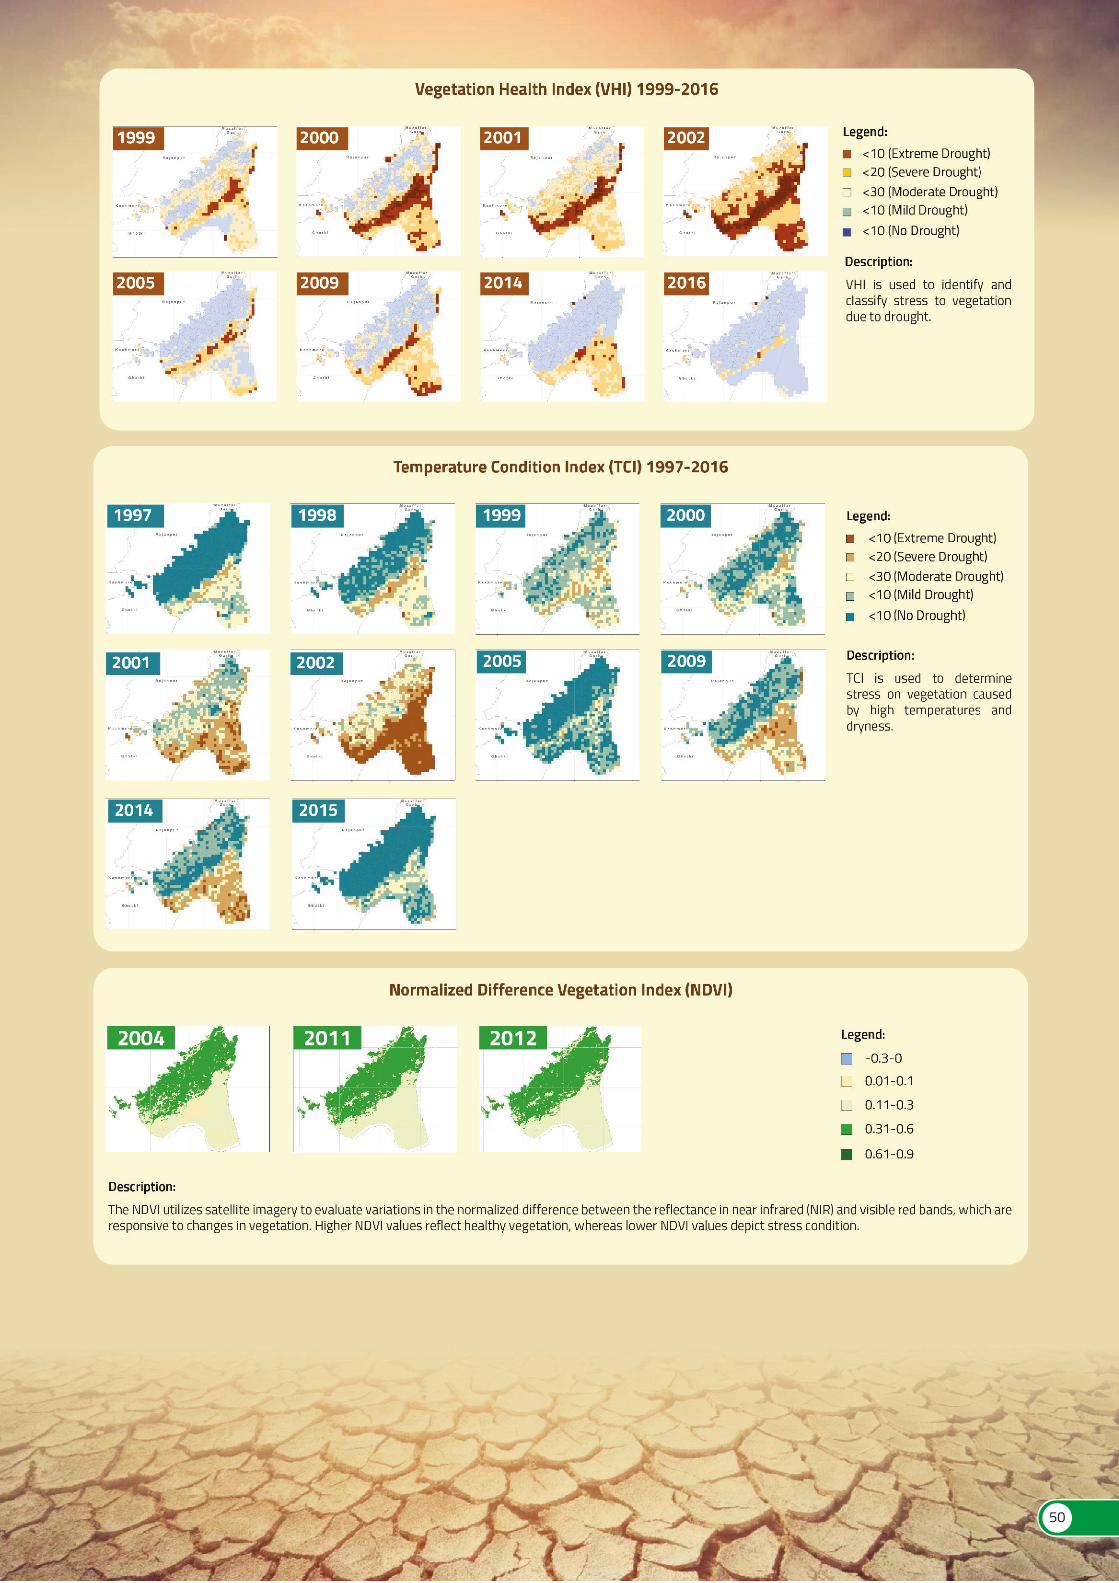
50
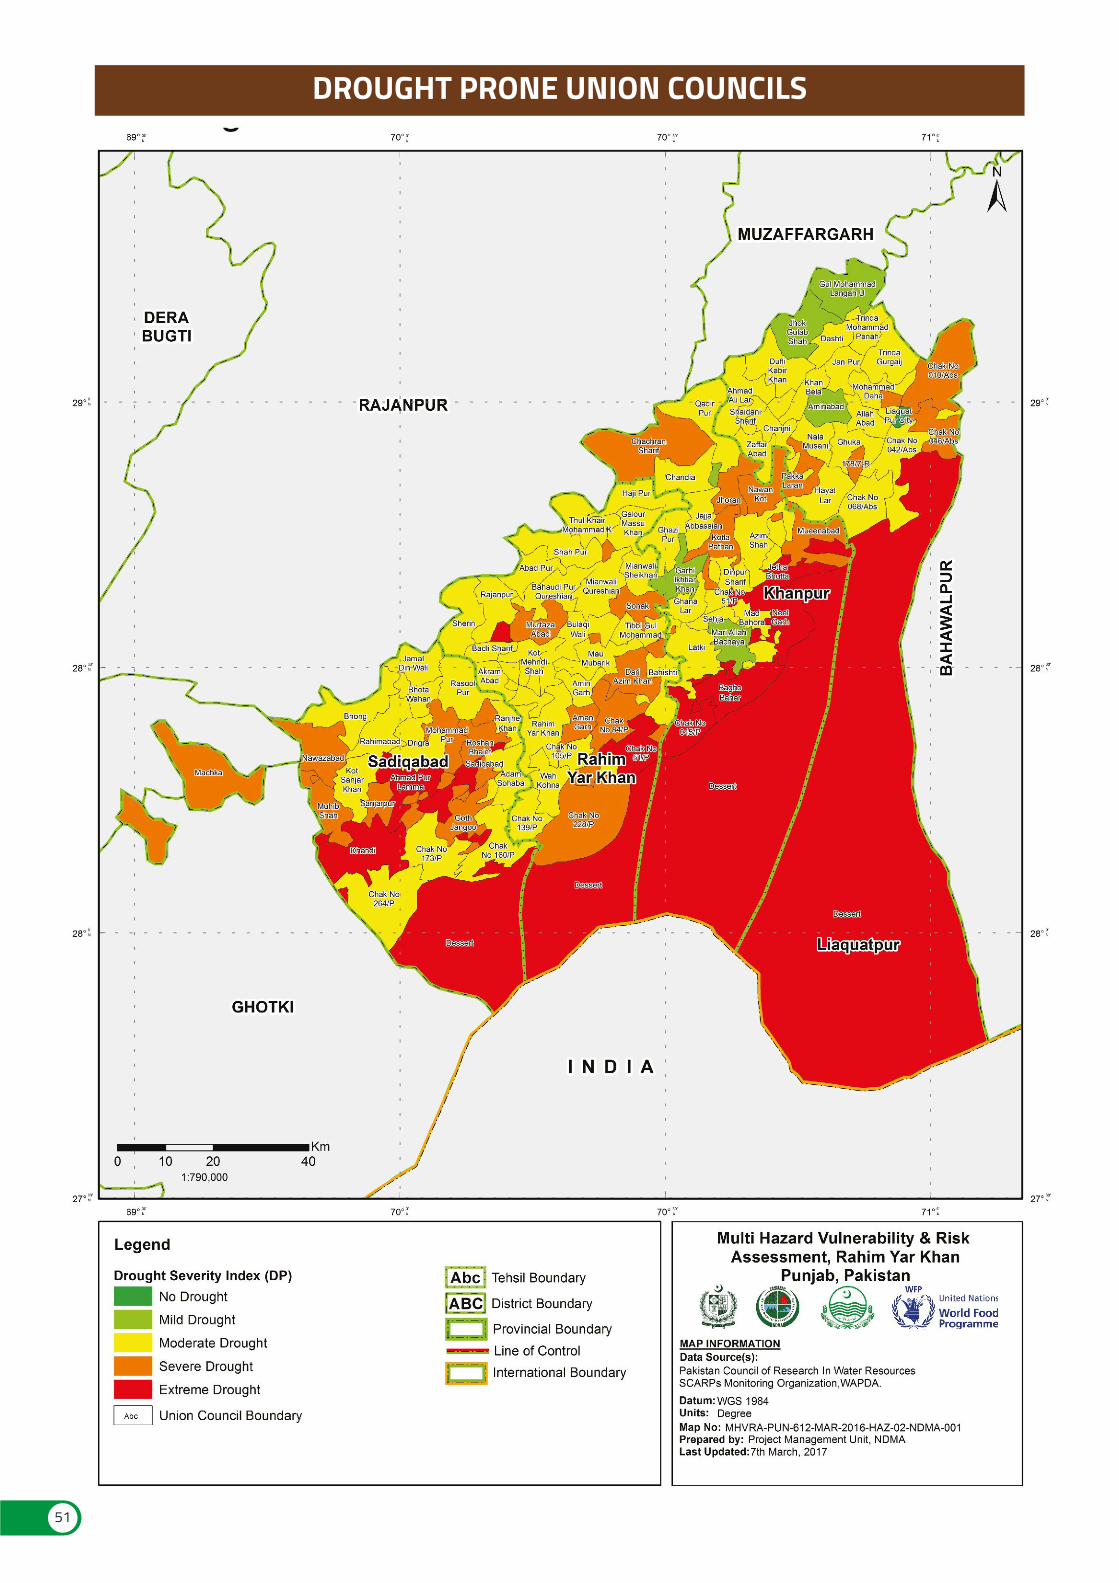
DROUGHT PRONE UNION COUNCILS
51
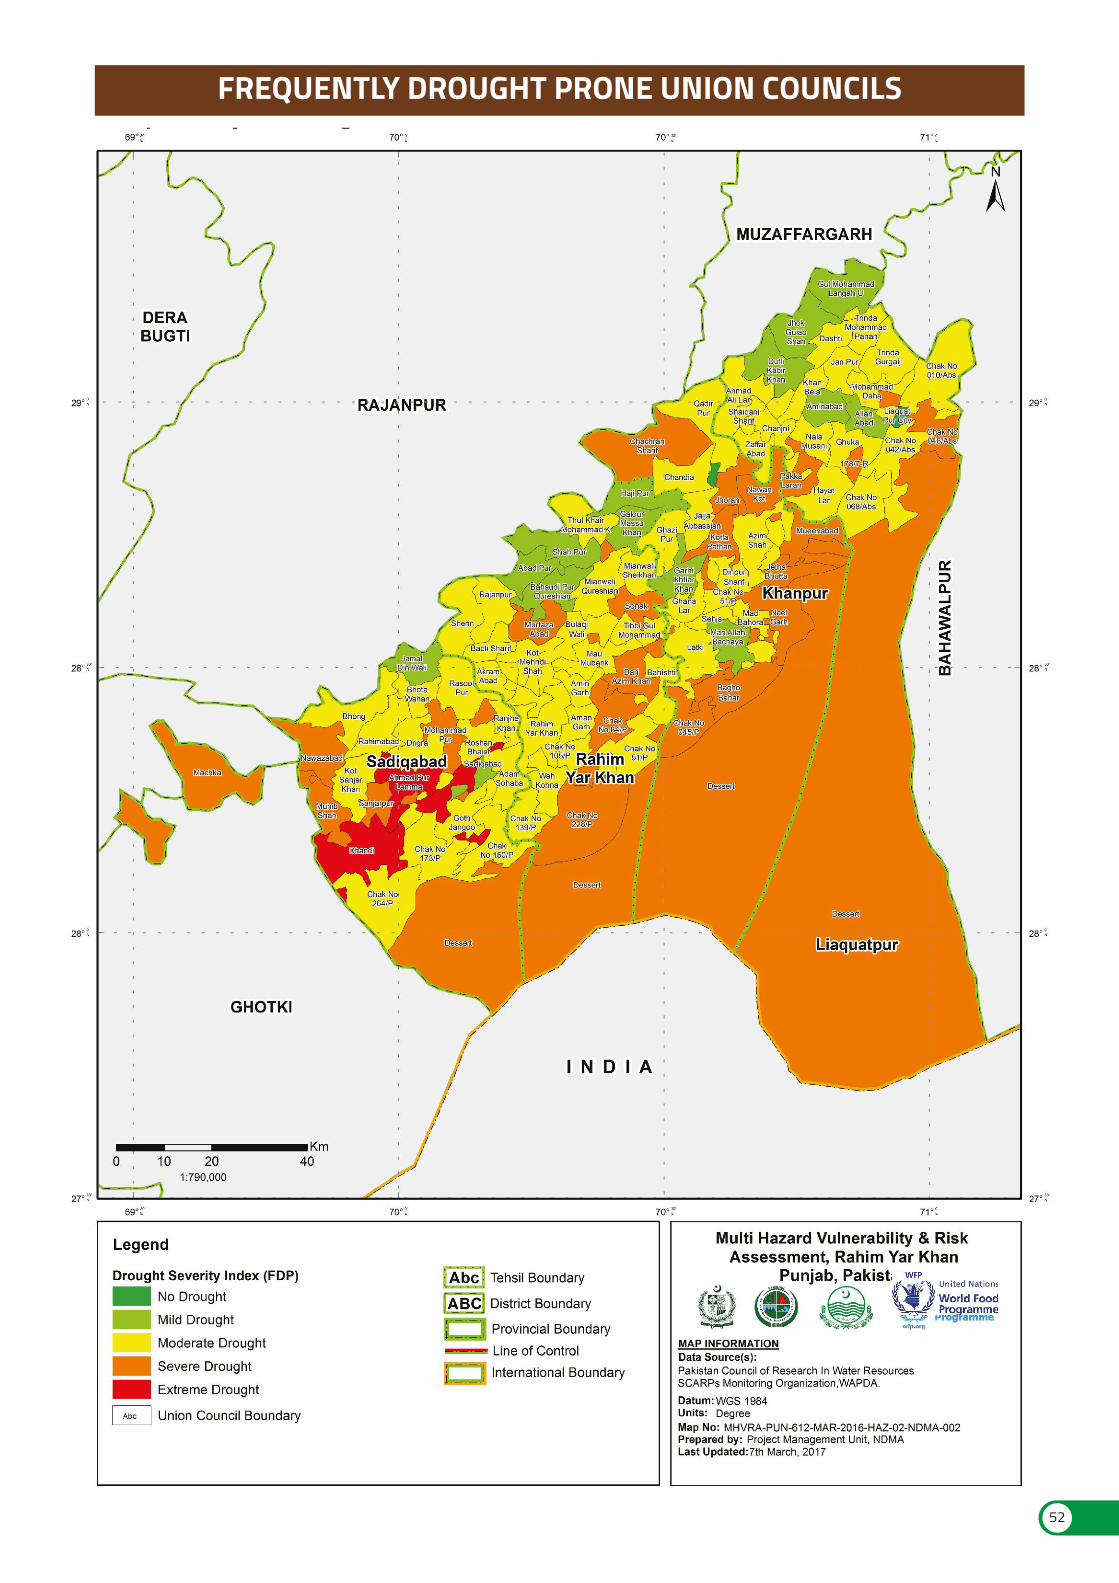
FREQUENTLY DROUGHT PRONE UNION COUNCILS
52
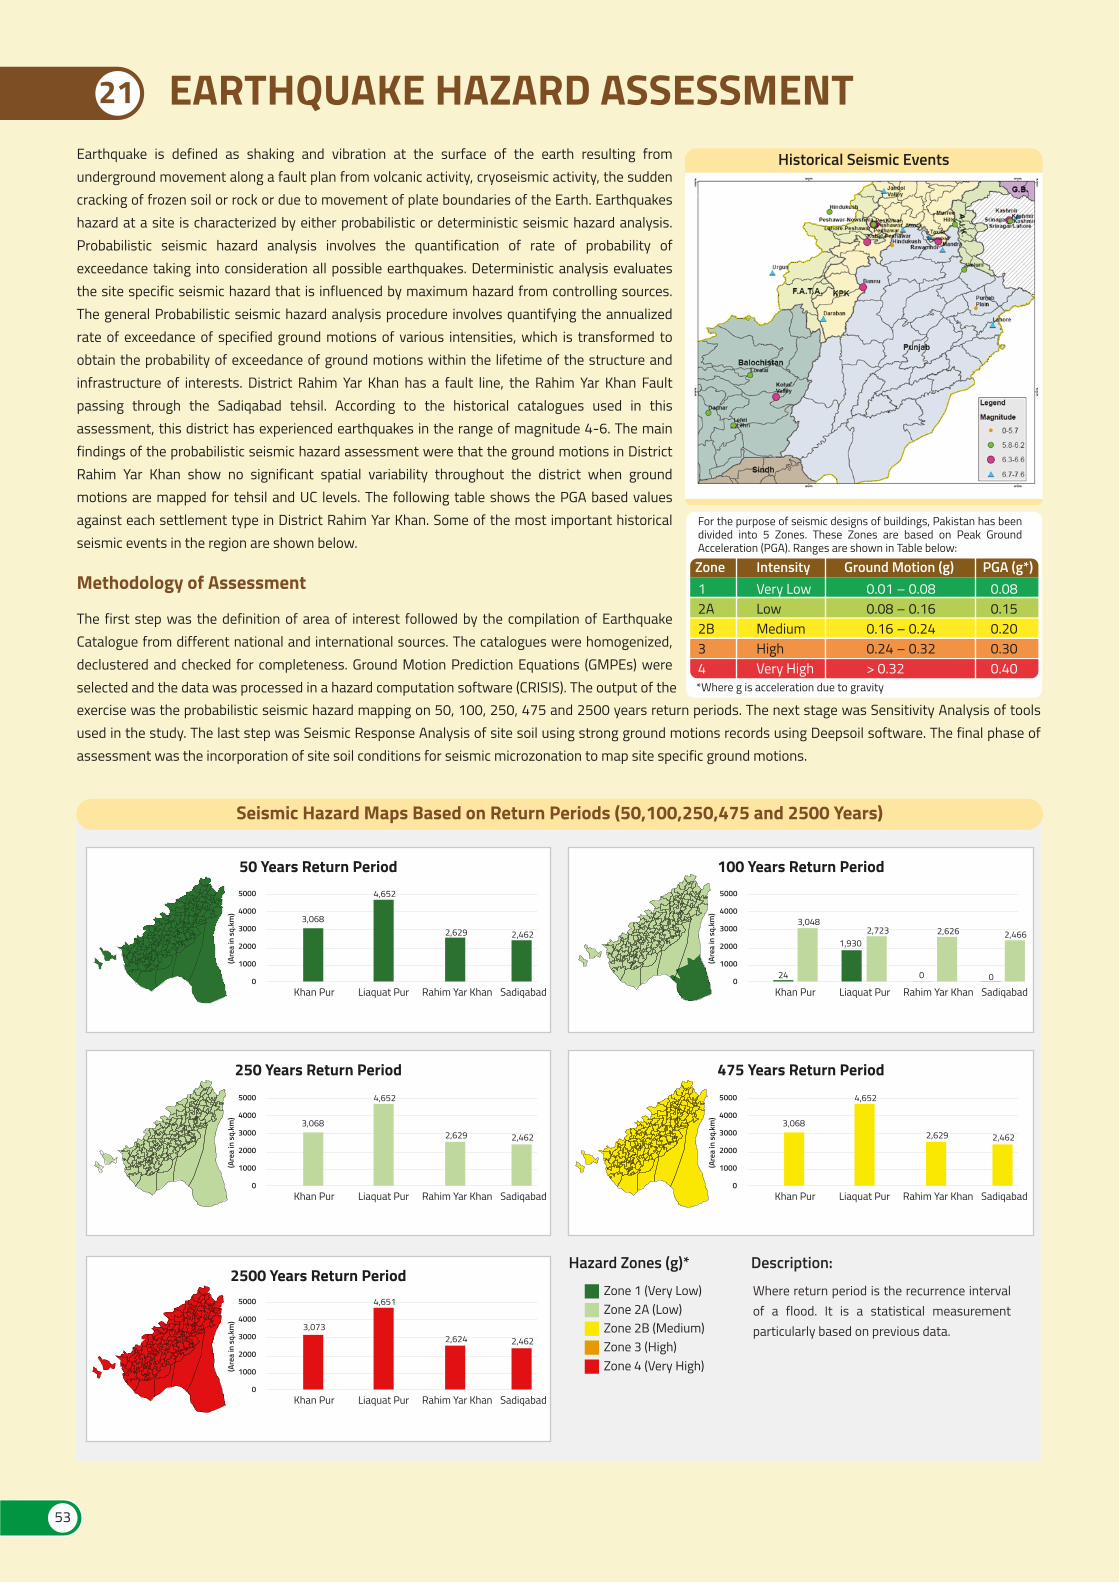
EARTHQUAKE HAZARD ASSESSMENT21
Earthquake is defined as shaking and vibration at the surface of the earth resulting from underground movement along a fault plan from volcanic activity, cryoseismic activity, the sudden cracking of frozen soil or rock or due to movement of plate boundaries of the Earth. Earthquakes hazard at a site is characterized by either probabilistic or deterministic seismic hazard analysis. Probabilistic seismic hazard analysis involves the quantification of rate of probability of exceedance taking into consideration all possible earthquakes. Deterministic analysis evaluates the site specific seismic hazard that is influenced by maximum hazard from controlling sources. The general Probabilistic seismic hazard analysis procedure involves quantifying the annualized rate of exceedance of specified ground motions of various intensities, which is transformed to obtain the probability of exceedance of ground motions within the lifetime of the structure and infrastructure of interests. District Rahim Yar Khan has a fault line, the Rahim Yar Khan Fault passing through the Sadiqabad tehsil. According to the historical catalogues used in this assessment, this district has experienced earthquakes in the range of magnitude 4-6. The main findings of the probabilistic seismic hazard assessment were that the ground motions in District Rahim Yar Khan show no significant spatial variability throughout the district when ground motions are mapped for tehsil and UC levels. The following table shows the PGA based values against each settlement type in District Rahim Yar Khan. Some of the most important historical seismic events in the region are shown below.
The first step was the definition of area of interest followed by the compilation of Earthquake Catalogue from different national and international sources. The catalogues were homogenized, declustered and checked for completeness. Ground Motion Prediction Equations (GMPEs) were selected and the data was processed in a hazard computation software (CRISIS). The output of the
Zone 1 (Very Low)Zone 2A (Low)Zone 2B (Medium)Zone 3 (High)Zone 4 (Very High)
Khan Pur Liaquat Pur Rahim Yar Khan Sadiqabad
3,068
4,652
2,629 2,462
5000
4000
3000
2000
1000
0
(Are
a in
sq.
km)
P u n j nadP u n j nad
R i v erR i v er
I n d usI n d us
R i v erR i v er
3,048
24
1,9302,723 2,626
0
2,466
0
5000
4000
3000
2000
1000
0Khan Pur Liaquat Pur Rahim Yar Khan Sadiqabad
(Are
a in
sq.
km)
100 Years Return Period50 Years Return Period
Khan Pur Liaquat Pur Rahim Yar Khan Sadiqabad
3,068
4,652
2,629 2,462
5000
4000
3000
2000
1000
0
(Are
a in
sq.
km)
Khan Pur Liaquat Pur Rahim Yar Khan Sadiqabad
3,068
4,652
2,629 2,462
5000
4000
3000
2000
1000
0
(Are
a in
sq.
km)
475 Years Return Period250 Years Return Period
Khan Pur Liaquat Pur Rahim Yar Khan Sadiqabad
3,073
4,651
2,624 2,462
5000
4000
3000
2000
1000
0
(Are
a in
sq.
km)
2500 Years Return PeriodHazard Zones (g)*
Seismic Hazard Maps Based on Return Periods (50,100,250,475 and 2500 Years)
Historical Seismic Events
Intensity Ground Motion (g) PGA (g*)0.01 – 0.080.08 – 0.160.16 – 0.240.24 – 0.32> 0.32
Very LowLowMediumHighVery High
Zone12A2B34
0.080.150.200.300.40
*Where g is acceleration due to gravity
For the purpose of seismic designs of buildings, Pakistan has been divided into 5 Zones. These Zones are based on Peak Ground Acceleration (PGA). Ranges are shown in Table below:
Methodology of Assessment
exercise was the probabilistic seismic hazard mapping on 50, 100, 250, 475 and 2500 years return periods. The next stage was Sensitivity Analysis of tools used in the study. The last step was Seismic Response Analysis of site soil using strong ground motions records using Deepsoil software. The final phase of assessment was the incorporation of site soil conditions for seismic microzonation to map site specific ground motions.
53
Description:Where return period is the recurrence interval of a flood. It is a statistical measurement particularly based on previous data.
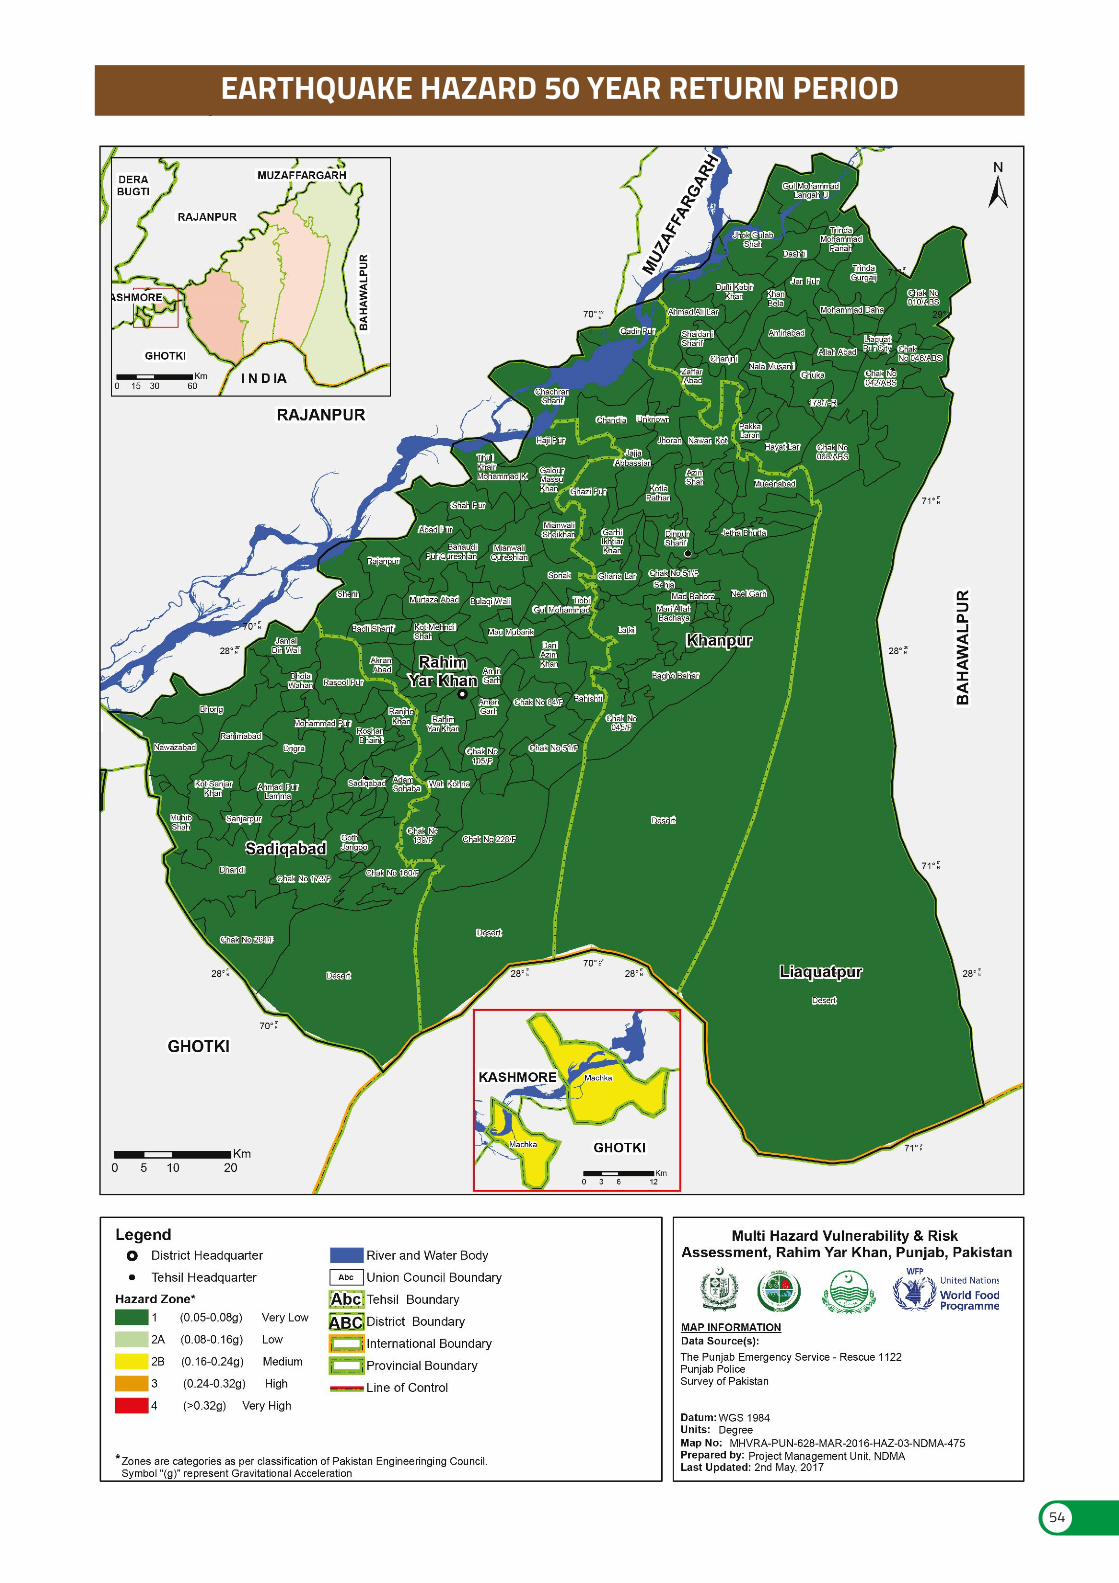
EARTHQUAKE HAZARD 50 YEAR RETURN PERIOD
54
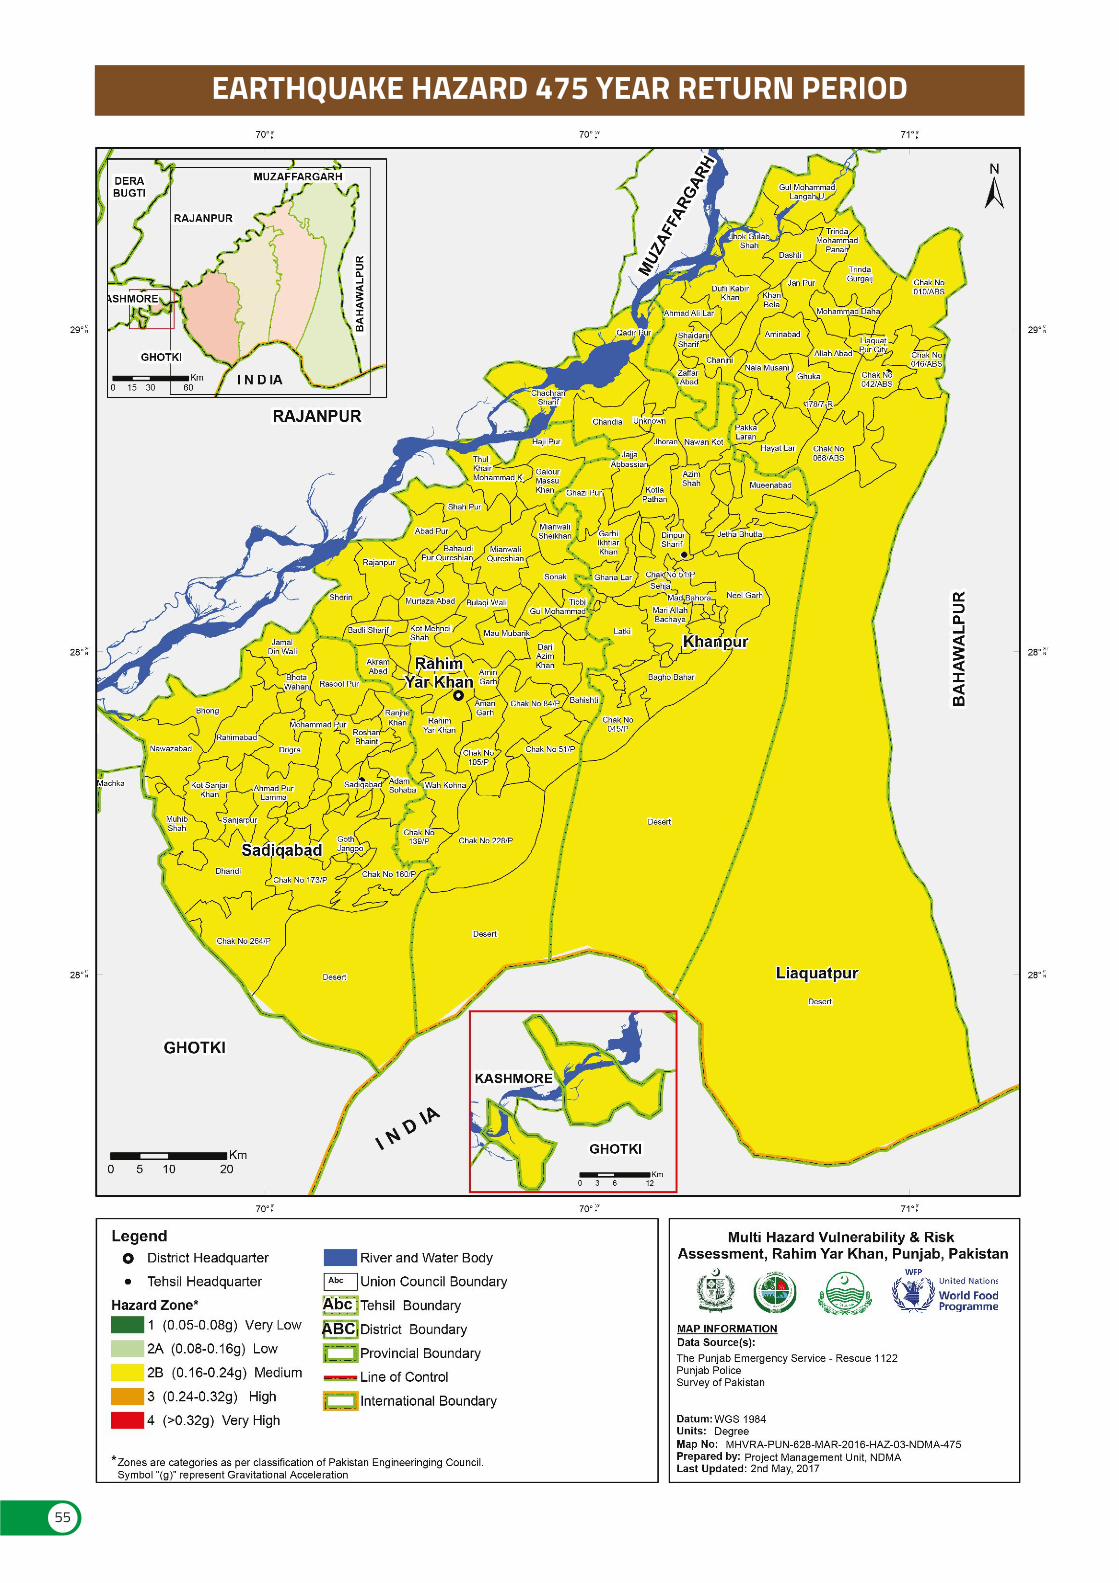
EARTHQUAKE HAZARD 475 YEAR RETURN PERIOD
55

56
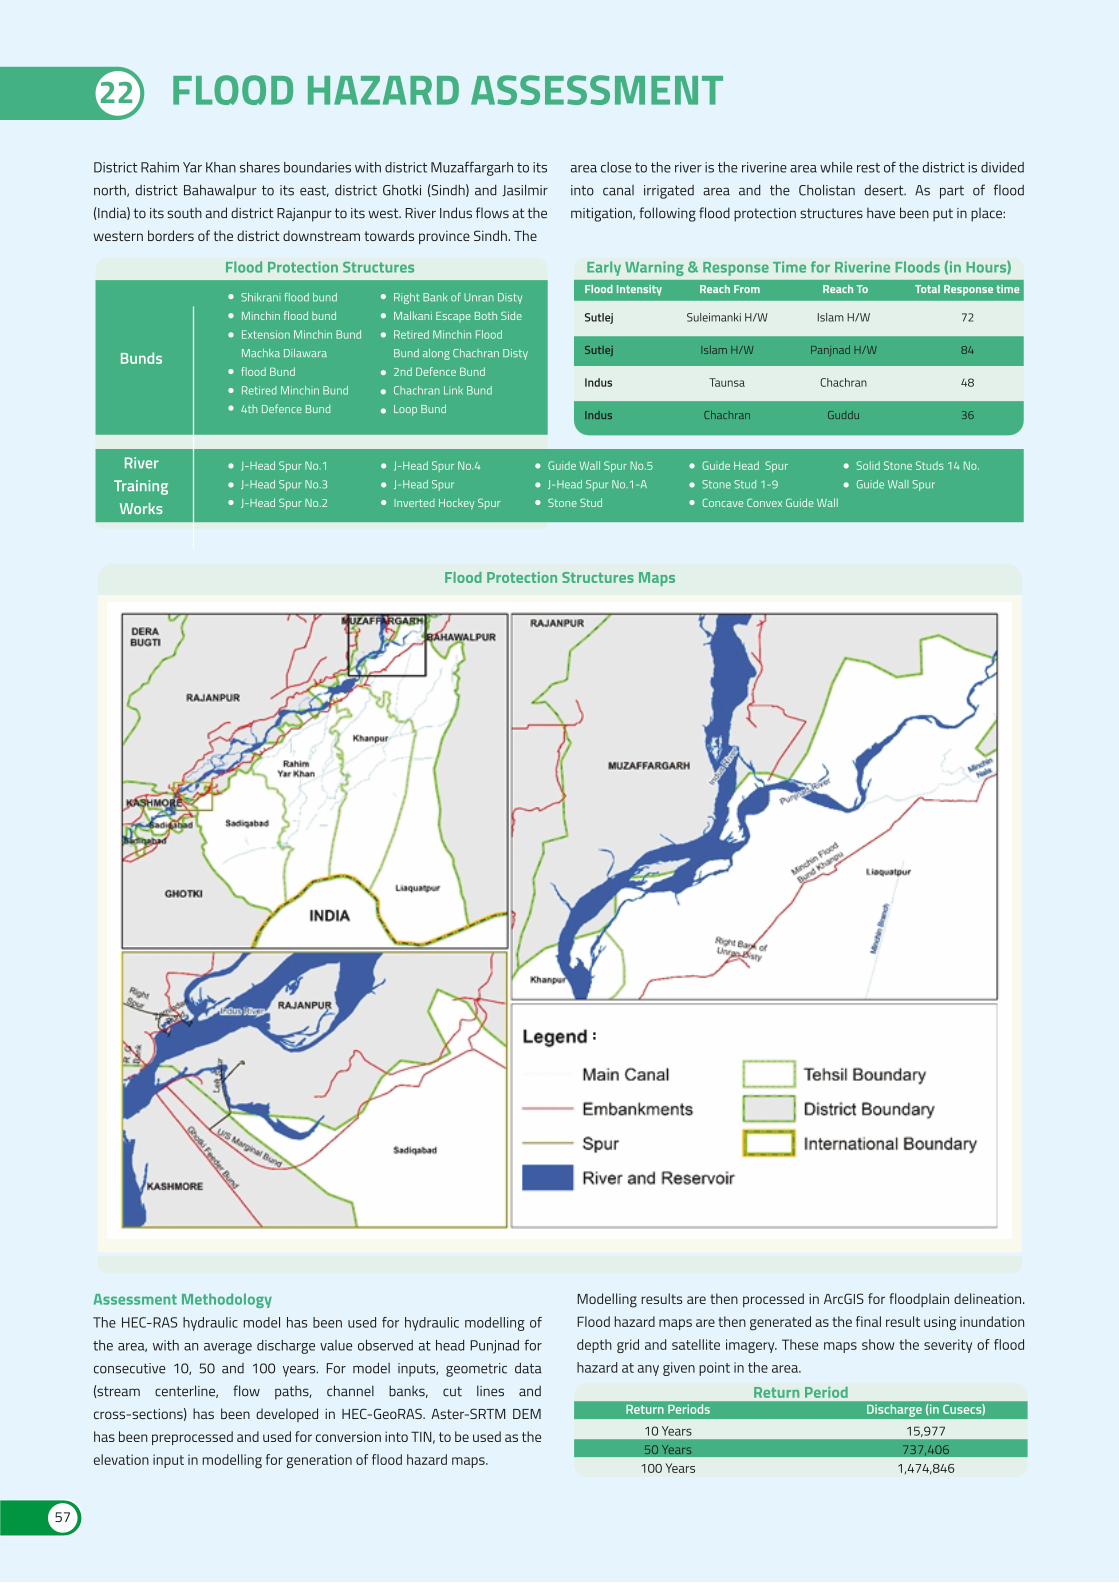
Early Warning & Response Time for Riverine Floods (in Hours)Flood Intensity
Sutlej
Sutlej
Indus
Indus
Reach From
Suleimanki H/W
Islam H/W
Taunsa
Chachran
Reach To
Islam H/W
Panjnad H/W
Chachran
Guddu
Total Response time
72
84
48
36
Flood Protection Structures
Bunds
RiverTrainingWorks
Shikrani flood bundMinchin flood bundExtension Minchin BundMachka Dilawaraflood BundRetired Minchin Bund4th Defence Bund
Right Bank of Unran DistyMalkani Escape Both SideRetired Minchin FloodBund along Chachran Disty2nd Defence BundChachran Link BundLoop Bund
J-Head Spur No.1J-Head Spur No.3J-Head Spur No.2
J-Head Spur No.4J-Head SpurInverted Hockey Spur
Guide Wall Spur No.5J-Head Spur No.1-AStone Stud
Guide Head SpurStone Stud 1-9Concave Convex Guide Wall
Solid Stone Studs 14 No.Guide Wall Spur
FLOOD HAZARD ASSESSMENT22
District Rahim Yar Khan shares boundaries with district Muzaffargarh to its north, district Bahawalpur to its east, district Ghotki (Sindh) and Jasilmir (India) to its south and district Rajanpur to its west. River Indus flows at the western borders of the district downstream towards province Sindh. The
Assessment MethodologyThe HEC-RAS hydraulic model has been used for hydraulic modelling of the area, with an average discharge value observed at head Punjnad for consecutive 10, 50 and 100 years. For model inputs, geometric data (stream centerline, flow paths, channel banks, cut lines and cross-sections) has been developed in HEC-GeoRAS. Aster-SRTM DEM has been preprocessed and used for conversion into TIN, to be used as the elevation input in modelling for generation of flood hazard maps.
Return PeriodReturn Periods Discharge (in Cusecs)
10 Years50 Years
100 Years
15,977737,406
1,474,846
Modelling results are then processed in ArcGIS for floodplain delineation. Flood hazard maps are then generated as the final result using inundation depth grid and satellite imagery. These maps show the severity of flood hazard at any given point in the area.
area close to the river is the riverine area while rest of the district is divided into canal irrigated area and the Cholistan desert. As part of flood mitigation, following flood protection structures have been put in place:
Flood Protection Structures Maps
57
:
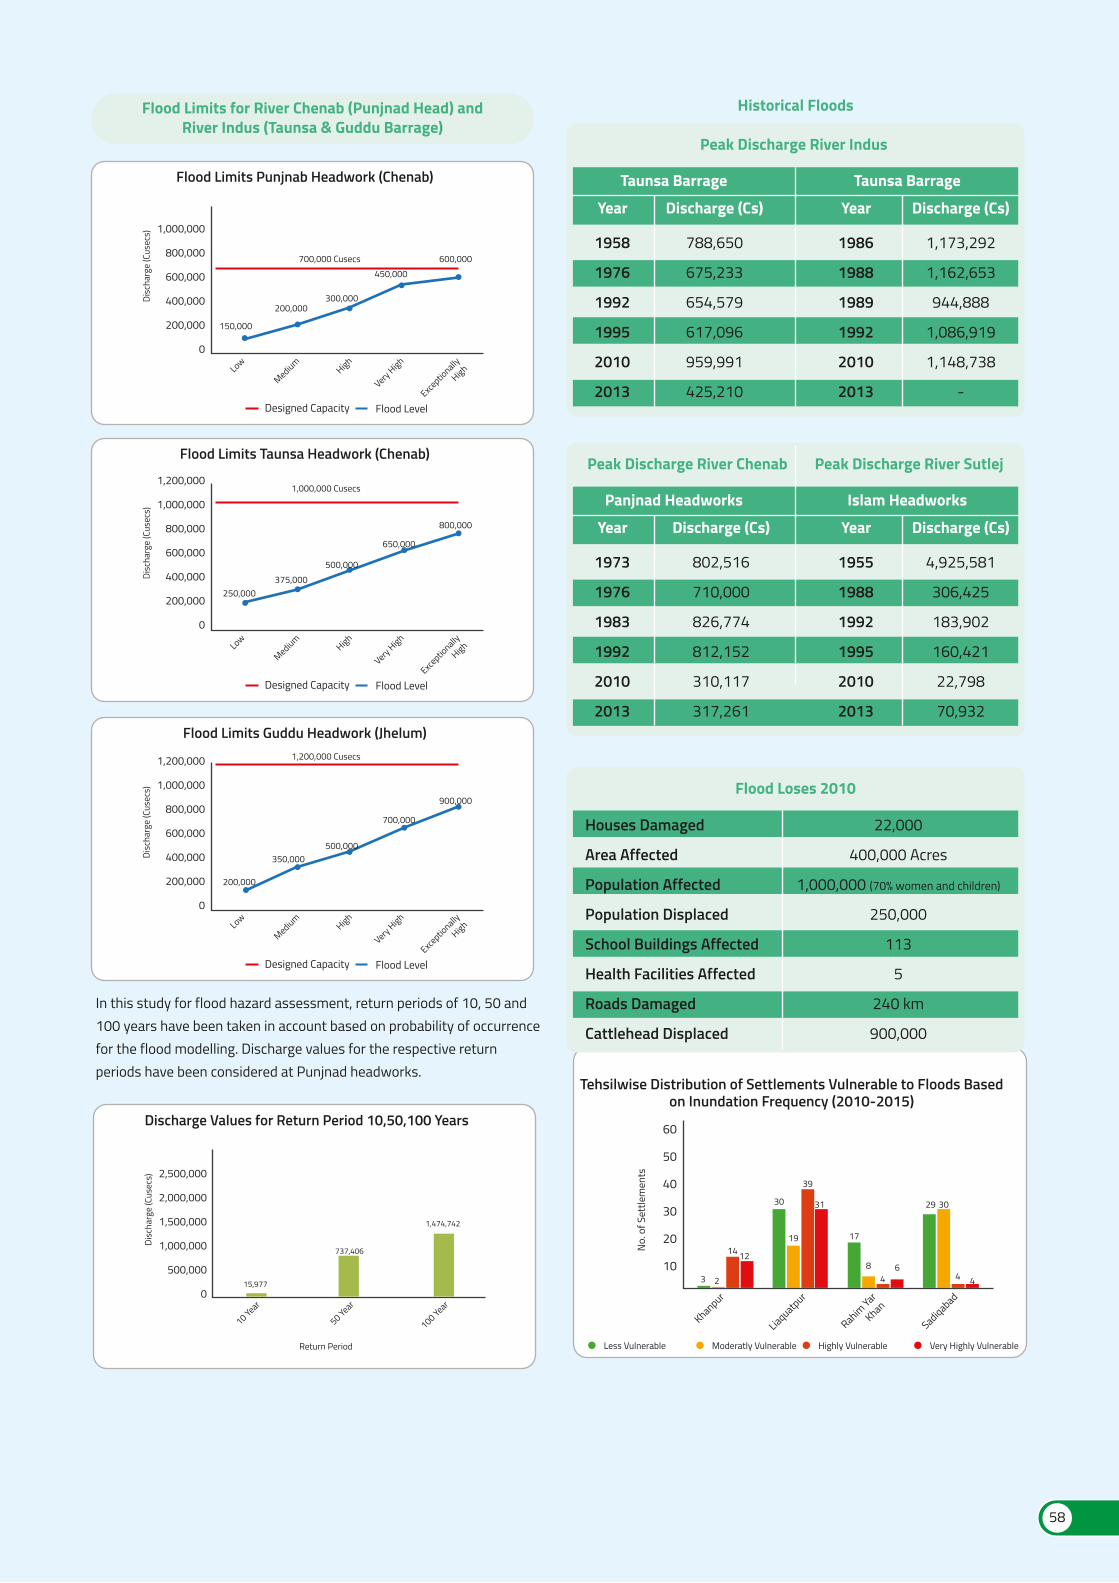
Tehsilwise Distribution of Settlements Vulnerable to Floods Basedon Inundation Frequency (2010-2015)
Less Vulnerable Moderatly Vulnerable Highly Vulnerable Very Highly Vulnerable
3 2
14 12
30
19
39
31
17
84
6
29 30
4 4
60
50
40
30
20
10
No. o
f Set
tlem
ents
Khanpur
Liaquatpur
Rahim Yar
Khan
Sadiqabad
Flood Loses 2010
Houses Damaged
Area Affected
Population Affected
Population Displaced
School Buildings Affected
Health Facilities Affected
Roads Damaged
Cattlehead Displaced
22,000
400,000 Acres
1,000,000 (70% women and children)
250,000
113
5
240 km
900,000
Historical Floods
Peak Discharge River Indus
Year
1958
1976
1992
1995
2010
2013
Discharge (Cs)
788,650
675,233
654,579
617,096
959,991
425,210
Year
1986
1988
1989
1992
2010
2013
Discharge (Cs)
1,173,292
1,162,653
944,888
1,086,919
1,148,738
-
Taunsa Barrage Taunsa Barrage
Peak Discharge River Chenab Peak Discharge River Sutlej
Year
1973
1976
1983
1992
2010
2013
Discharge (Cs)
802,516
710,000
826,774
812,152
310,117
317,261
Year
1955
1988
1992
1995
2010
2013
Discharge (Cs)
4,925,581
306,425
183,902
160,421
22,798
70,932
Panjnad Headworks Islam Headworks
Discharge Values for Return Period 10,50,100 Years
2,500,000
2,000,000
1,500,000
1,000,000
500,000
0
Disc
harg
e (C
usec
s)
10 Year
50 Year
100 Year
Return Period
15,977
737,406
1,474,742
Flood Limits Punjnab Headwork (Chenab)
1,000,000
800,000
600,000
400,000
200,000
0
Disc
harg
e (C
usec
s)
Low
MediumHigh
Very High
Exceptio
nally
High
150,000
200,000300,000
700,000 Cusecs450,000
600,000
Designed Capacity Flood Level
Flood Limits Taunsa Headwork (Chenab)
1,200,000
1,000,000
800,000
600,000
400,000
200,000
0
Disc
harg
e (C
usec
s)
Low
MediumHigh
Very High
Exceptio
nally
High
250,000375,000
500,000
1,000,000 Cusecs
650,000
800,000
Designed Capacity Flood Level
Flood Limits Guddu Headwork (Jhelum)
1,200,000
1,000,000
800,000
600,000
400,000
200,000
0
Disc
harg
e (C
usec
s)
Low
MediumHigh
Very High
Exceptio
nally
High
200,000
350,000500,000
1,200,000 Cusecs
700,000
900,000
Designed Capacity Flood Level
Flood Limits for River Chenab (Punjnad Head) andRiver Indus (Taunsa & Guddu Barrage)
In this study for flood hazard assessment, return periods of 10, 50 and 100 years have been taken in account based on probability of occurrence for the flood modelling. Discharge values for the respective return periods have been considered at Punjnad headworks.
58
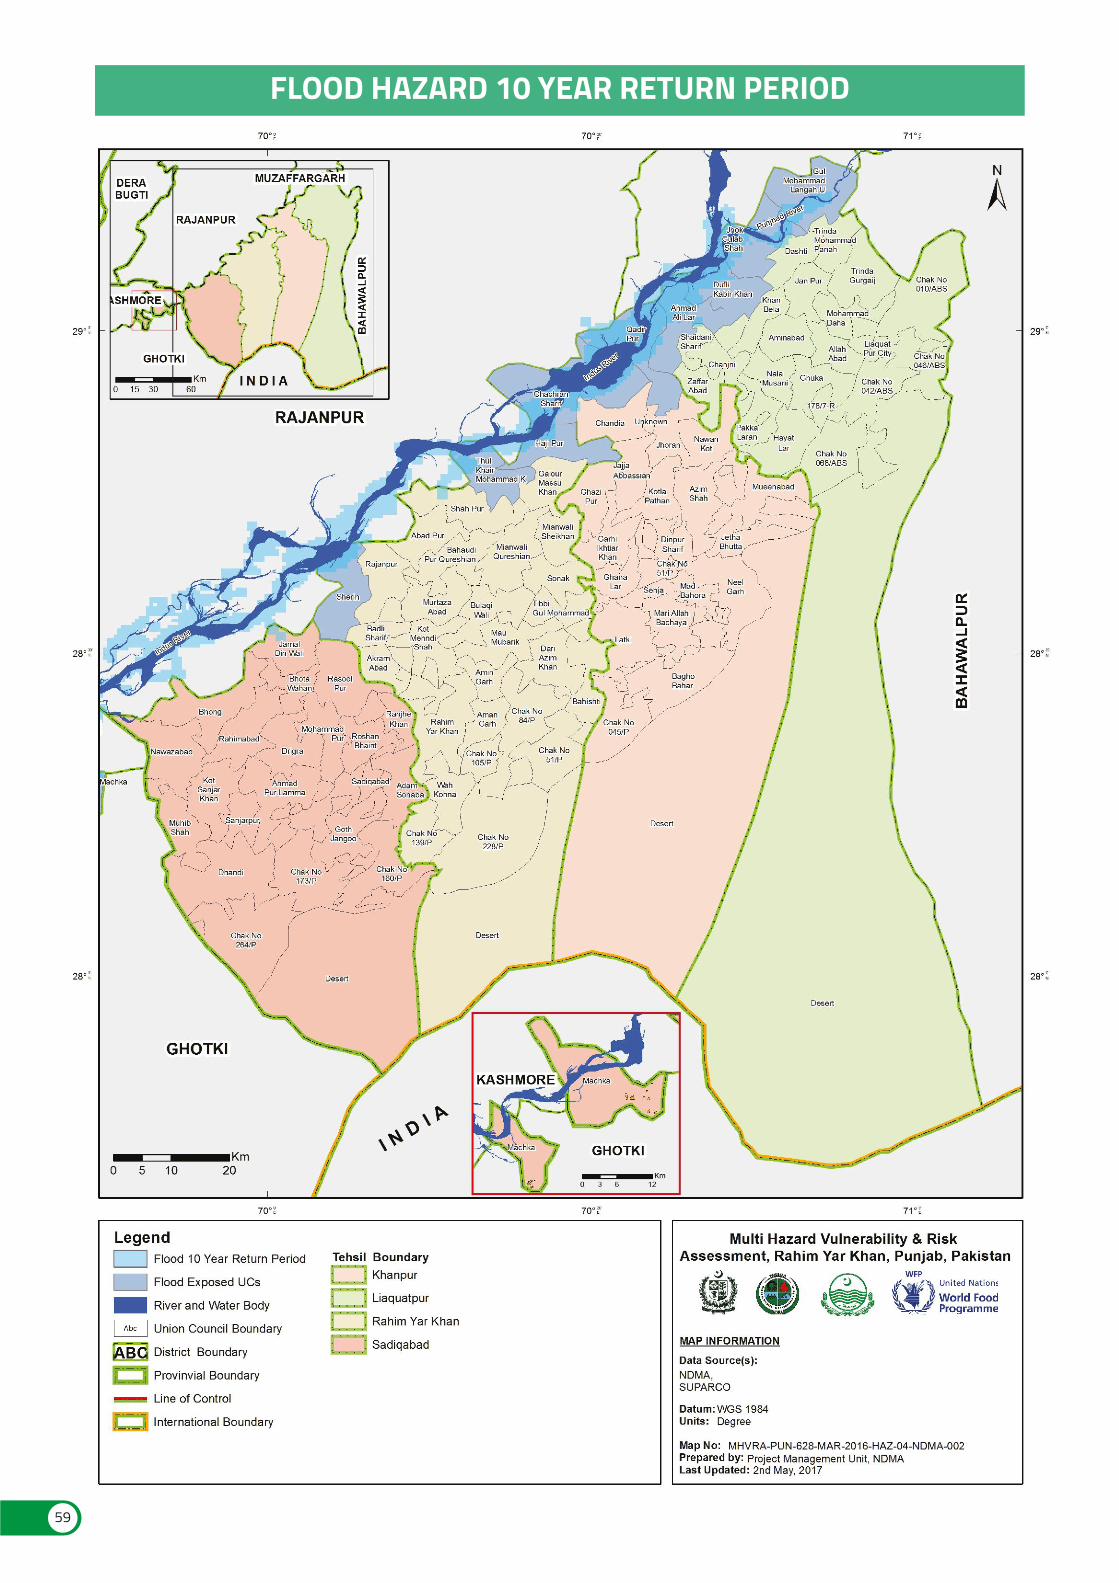
FLOOD HAZARD 10 YEAR RETURN PERIOD
59
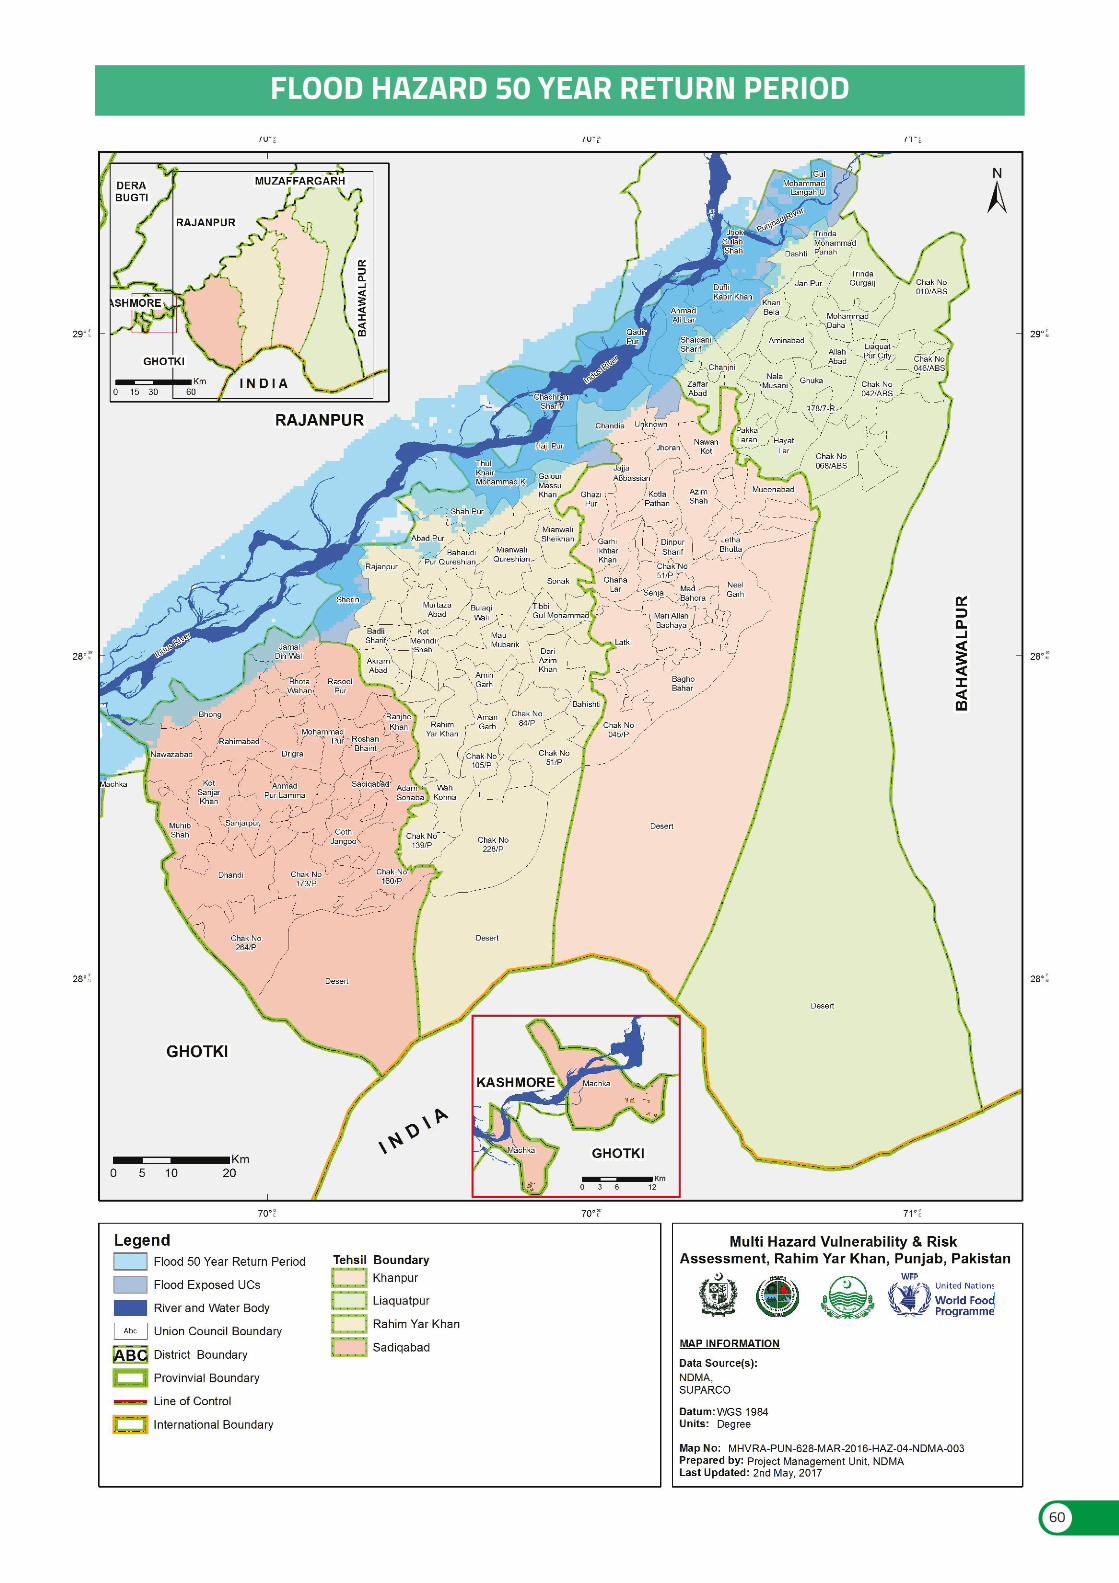
FLOOD HAZARD 50 YEAR RETURN PERIOD
60
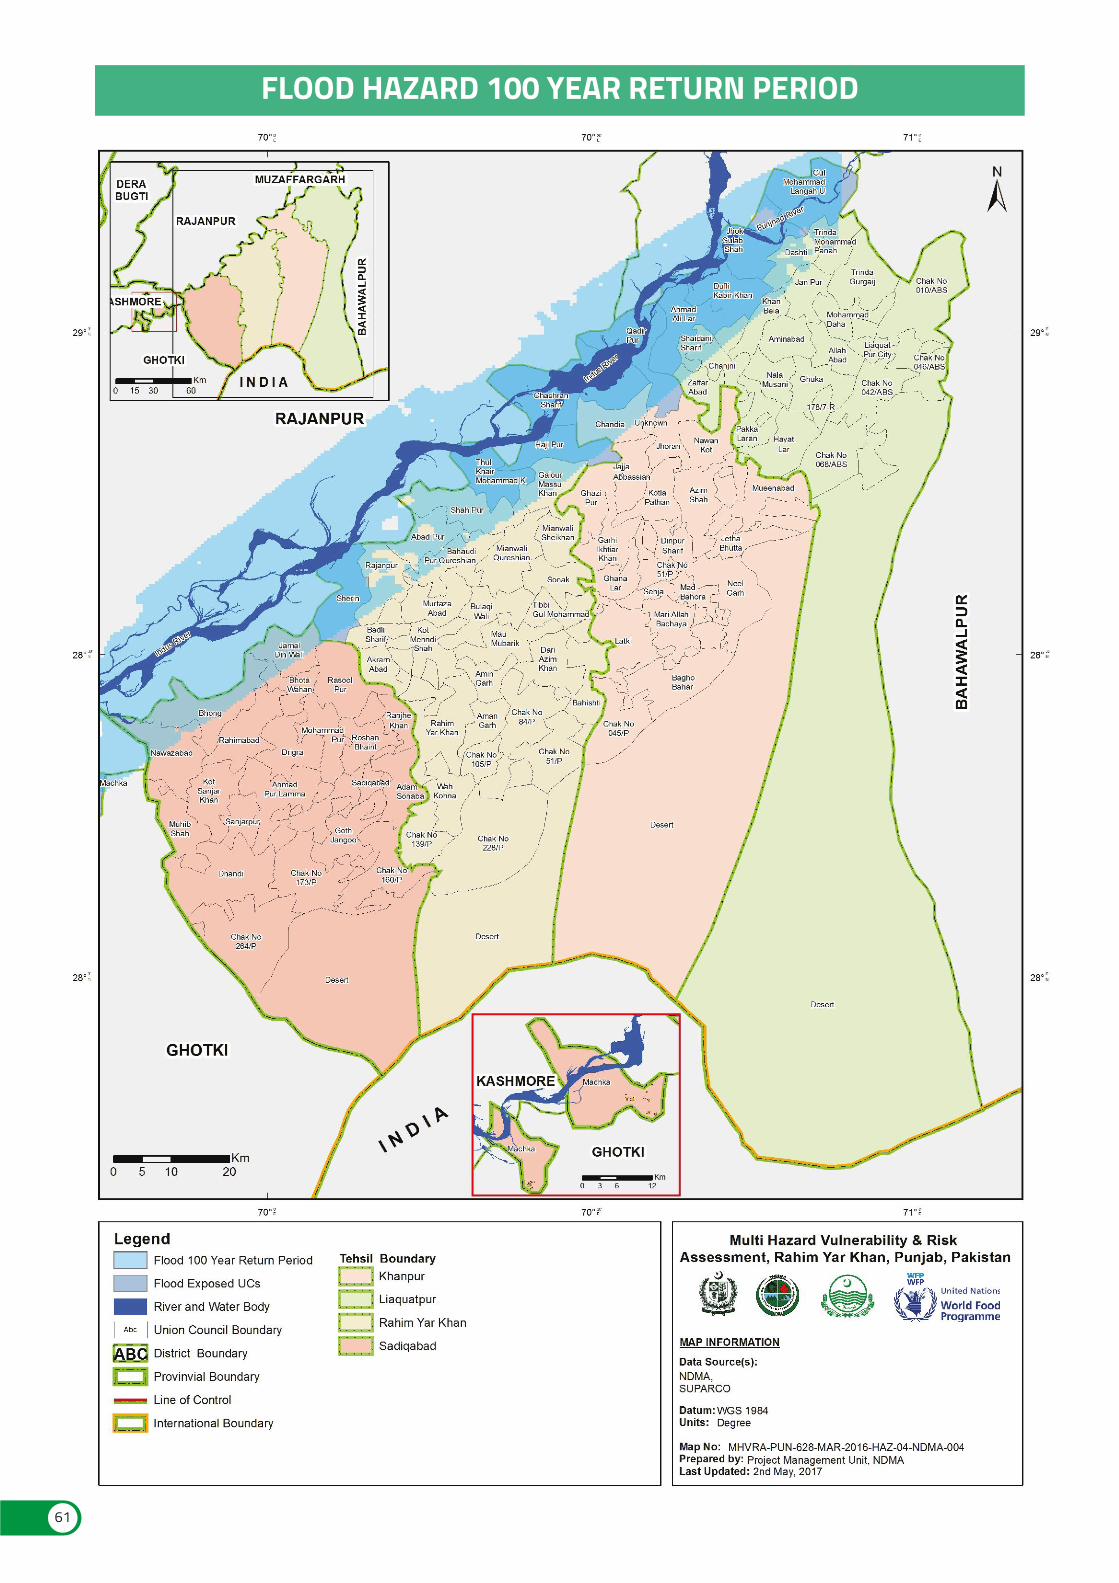
FLOOD HAZARD 100 YEAR RETURN PERIOD
61
58
EXPOSURE ASSESSMENTC DROUGHTEARTHQUAKEFLOOD
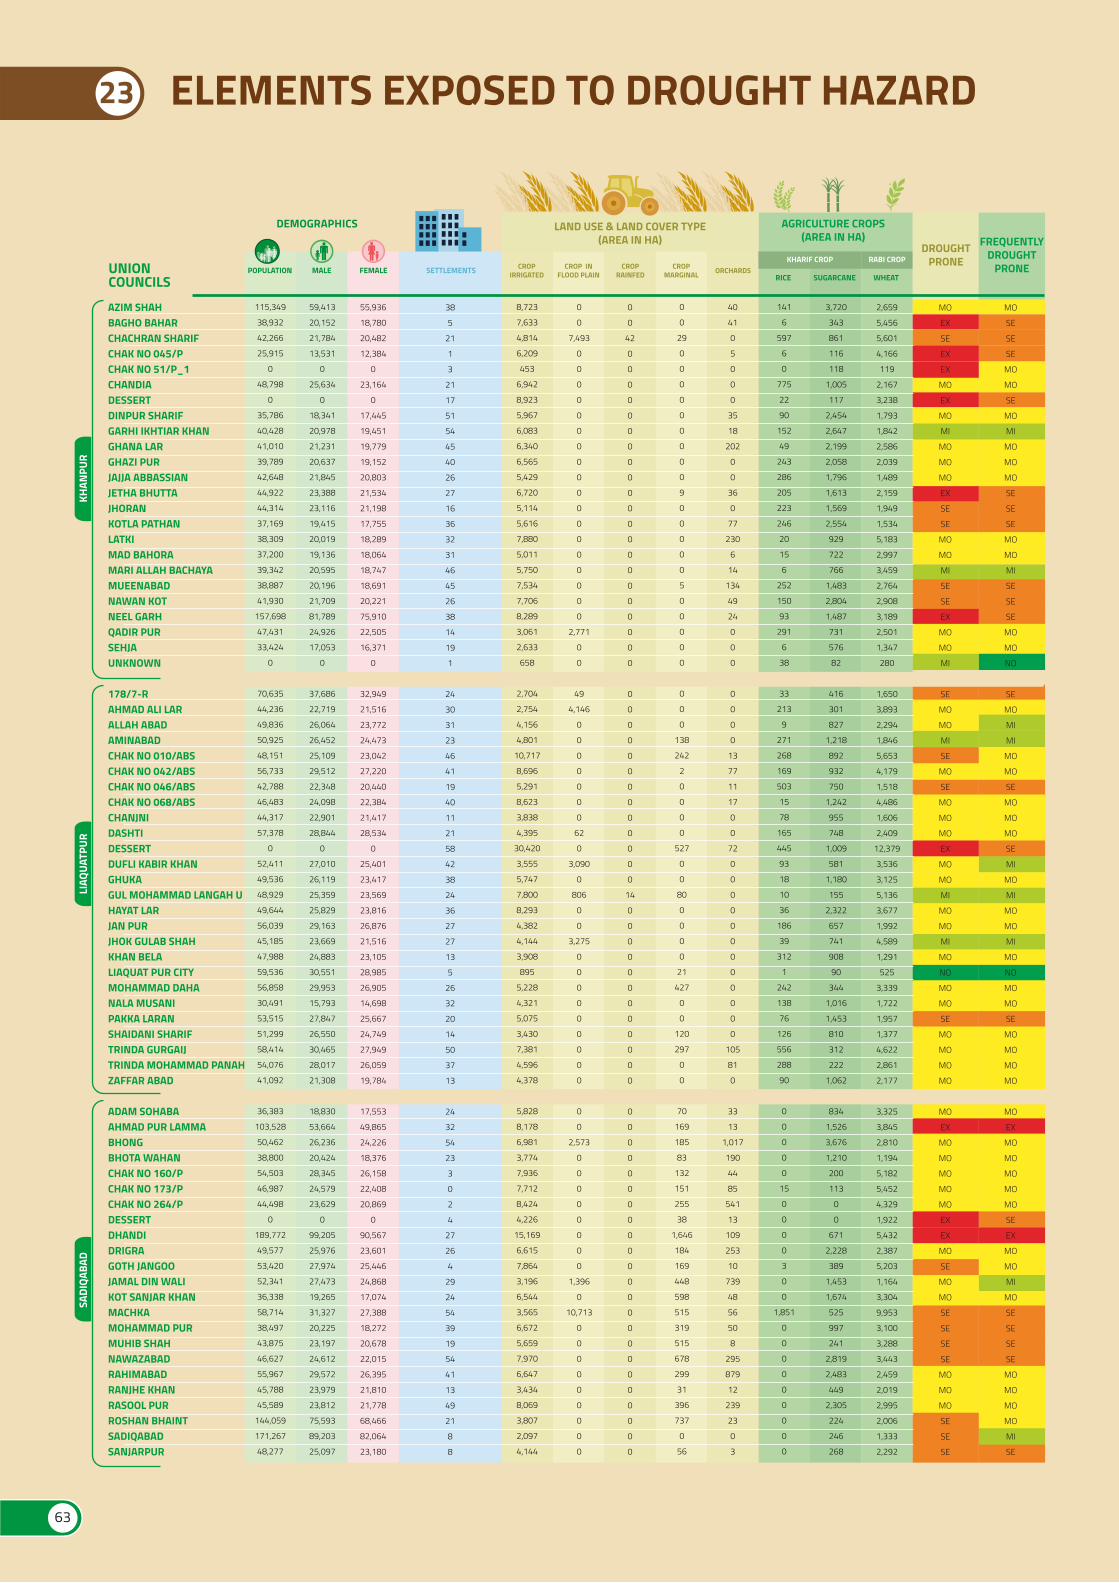
ELEMENTS EXPOSED TO DROUGHT HAZARD23
AZIM SHAHBAGHO BAHARCHACHRAN SHARIFCHAK NO 045/PCHAK NO 51/P_1CHANDIADESSERTDINPUR SHARIFGARHI IKHTIAR KHANGHANA LARGHAZI PURJAJJA ABBASSIANJETHA BHUTTAJHORANKOTLA PATHANLATKIMAD BAHORAMARI ALLAH BACHAYAMUEENABADNAWAN KOTNEEL GARHQADIR PURSEHJAUNKNOWN
178/7-RAHMAD ALI LARALLAH ABADAMINABADCHAK NO 010/ABSCHAK NO 042/ABSCHAK NO 046/ABSCHAK NO 068/ABSCHANJNIDASHTIDESSERTDUFLI KABIR KHANGHUKAGUL MOHAMMAD LANGAH UHAYAT LARJAN PURJHOK GULAB SHAHKHAN BELALIAQUAT PUR CITYMOHAMMAD DAHANALA MUSANIPAKKA LARANSHAIDANI SHARIFTRINDA GURGAIJTRINDA MOHAMMAD PANAHZAFFAR ABAD
ADAM SOHABAAHMAD PUR LAMMABHONGBHOTA WAHANCHAK NO 160/PCHAK NO 173/PCHAK NO 264/PDESSERTDHANDIDRIGRAGOTH JANGOOJAMAL DIN WALIKOT SANJAR KHANMACHKAMOHAMMAD PURMUHIB SHAHNAWAZABADRAHIMABADRANJHE KHANRASOOL PURROSHAN BHAINTSADIQABADSANJARPUR
UNIONCOUNCILS
KHAN
PUR
LIAQ
UATP
URSA
DIQA
BAD
POPULATION MALE FEMALE SETTLEMENTS
115,349
38,932
42,266
25,915
0
48,798
0
35,786
40,428
41,010
39,789
42,648
44,922
44,314
37,169
38,309
37,200
39,342
38,887
41,930
157,698
47,431
33,424
0
70,635
44,236
49,836
50,925
48,151
56,733
42,788
46,483
44,317
57,378
0
52,411
49,536
48,929
49,644
56,039
45,185
47,988
59,536
56,858
30,491
53,515
51,299
58,414
54,076
41,092
36,383
103,528
50,462
38,800
54,503
46,987
44,498
0
189,772
49,577
53,420
52,341
36,338
58,714
38,497
43,875
46,627
55,967
45,788
45,589
144,059
171,267
48,277
59,413
20,152
21,784
13,531
0
25,634
0
18,341
20,978
21,231
20,637
21,845
23,388
23,116
19,415
20,019
19,136
20,595
20,196
21,709
81,789
24,926
17,053
0
37,686
22,719
26,064
26,452
25,109
29,512
22,348
24,098
22,901
28,844
0
27,010
26,119
25,359
25,829
29,163
23,669
24,883
30,551
29,953
15,793
27,847
26,550
30,465
28,017
21,308
18,830
53,664
26,236
20,424
28,345
24,579
23,629
0
99,205
25,976
27,974
27,473
19,265
31,327
20,225
23,197
24,612
29,572
23,979
23,812
75,593
89,203
25,097
55,936
18,780
20,482
12,384
0
23,164
0
17,445
19,451
19,779
19,152
20,803
21,534
21,198
17,755
18,289
18,064
18,747
18,691
20,221
75,910
22,505
16,371
0
32,949
21,516
23,772
24,473
23,042
27,220
20,440
22,384
21,417
28,534
0
25,401
23,417
23,569
23,816
26,876
21,516
23,105
28,985
26,905
14,698
25,667
24,749
27,949
26,059
19,784
17,553
49,865
24,226
18,376
26,158
22,408
20,869
0
90,567
23,601
25,446
24,868
17,074
27,388
18,272
20,678
22,015
26,395
21,810
21,778
68,466
82,064
23,180
RICE SUGARCANE WHEAT
AGRICULTURE CROPS(AREA IN HA)
141
6
597
6
0
775
22
90
152
49
243
286
205
223
246
20
15
6
252
150
93
291
6
38
33
213
9
271
268
169
503
15
78
165
445
93
18
10
36
186
39
312
1
242
138
76
126
556
288
90
0
0
0
0
0
15
0
0
0
0
3
0
0
1,851
0
0
0
0
0
0
0
0
0
3,720
343
861
116
118
1,005
117
2,454
2,647
2,199
2,058
1,796
1,613
1,569
2,554
929
722
766
1,483
2,804
1,487
731
576
82
416
301
827
1,218
892
932
750
1,242
955
748
1,009
581
1,180
155
2,322
657
741
908
90
344
1,016
1,453
810
312
222
1,062
834
1,526
3,676
1,210
200
113
0
0
671
2,228
389
1,453
1,674
525
997
241
2,819
2,483
449
2,305
224
246
268
2,659
5,456
5,601
4,166
119
2,167
3,238
1,793
1,842
2,586
2,039
1,489
2,159
1,949
1,534
5,183
2,997
3,459
2,764
2,908
3,189
2,501
1,347
280
1,650
3,893
2,294
1,846
5,653
4,179
1,518
4,486
1,606
2,409
12,379
3,536
3,125
5,136
3,677
1,992
4,589
1,291
525
3,339
1,722
1,957
1,377
4,622
2,861
2,177
3,325
3,845
2,810
1,194
5,182
5,452
4,329
1,922
5,432
2,387
5,203
1,164
3,304
9,953
3,100
3,288
3,443
2,459
2,019
2,995
2,006
1,333
2,292
38
5
21
1
3
21
17
51
54
45
40
26
27
16
36
32
31
46
45
26
38
14
19
1
24
30
31
23
46
41
19
40
11
21
58
42
38
24
36
27
27
13
5
26
32
20
14
50
37
13
24
32
54
23
3
0
2
4
27
26
4
29
24
54
39
19
54
41
13
49
21
8
8
CROPIRRIGATED
CROP INFLOOD PLAIN
CROPRAINFED
LAND USE & LAND COVER TYPE(AREA IN HA)
8,723
7,633
4,814
6,209
453
6,942
8,923
5,967
6,083
6,340
6,565
5,429
6,720
5,114
5,616
7,880
5,011
5,750
7,534
7,706
8,289
3,061
2,633
658
2,704
2,754
4,156
4,801
10,717
8,696
5,291
8,623
3,838
4,395
30,420
3,555
5,747
7,800
8,293
4,382
4,144
3,908
895
5,228
4,321
5,075
3,430
7,381
4,596
4,378
5,828
8,178
6,981
3,774
7,936
7,712
8,424
4,226
15,169
6,615
7,864
3,196
6,544
3,565
6,672
5,659
7,970
6,647
3,434
8,069
3,807
2,097
4,144
0
0
7,493
0
0
0
0
0
0
0
0
0
0
0
0
0
0
0
0
0
0
2,771
0
0
49
4,146
0
0
0
0
0
0
0
62
0
3,090
0
806
0
0
3,275
0
0
0
0
0
0
0
0
0
0
0
2,573
0
0
0
0
0
0
0
0
1,396
0
10,713
0
0
0
0
0
0
0
0
0
0
0
42
0
0
0
0
0
0
0
0
0
0
0
0
0
0
0
0
0
0
0
0
0
0
0
0
0
0
0
0
0
0
0
0
0
0
14
0
0
0
0
0
0
0
0
0
0
0
0
0
0
0
0
0
0
0
0
0
0
0
0
0
0
0
0
0
0
0
0
0
0
0
CROPMARGINAL ORCHARDS
0
0
29
0
0
0
0
0
0
0
0
0
9
0
0
0
0
0
5
0
0
0
0
0
0
0
0
138
242
2
0
0
0
0
527
0
0
80
0
0
0
0
21
427
0
0
120
297
0
0
70
169
185
83
132
151
255
38
1,646
184
169
448
598
515
319
515
678
299
31
396
737
0
56
40
41
0
5
0
0
0
35
18
202
0
0
36
0
77
230
6
14
134
49
24
0
0
0
0
0
0
0
13
77
11
17
0
0
72
0
0
0
0
0
0
0
0
0
0
0
0
105
81
0
33
13
1,017
190
44
85
541
13
109
253
10
739
48
56
50
8
295
879
12
239
23
0
3
KHARIF CROP RABI CROPDROUGHT
PRONE
FREQUENTLYDROUGHT
PRONE
MO
EX
SE
EX
EX
MO
EX
MO
MI
MO
MO
MO
EX
SE
SE
MO
MO
MI
SE
SE
EX
MO
MO
MI
SE
MO
MO
MI
SE
MO
SE
MO
MO
MO
EX
MO
MO
MI
MO
MO
MI
MO
NO
MO
MO
SE
MO
MO
MO
MO
MO
EX
MO
MO
MO
MO
MO
EX
EX
MO
SE
MO
MO
SE
SE
SE
SE
MO
MO
MO
SE
SE
SE
MO
SE
SE
SE
MO
MO
SE
MO
MI
MO
MO
MO
SE
SE
SE
MO
MO
MI
SE
SE
SE
MO
MO
NO
SE
MO
MI
MI
MO
MO
SE
MO
MO
MO
SE
MI
MO
MI
MO
MO
MI
MO
NO
MO
MO
SE
MO
MO
MO
MO
MO
EX
MO
MO
MO
MO
MO
SE
EX
MO
MO
MI
MO
SE
SE
SE
SE
MO
MO
MO
MO
MI
SE
DEMOGRAPHICS
63
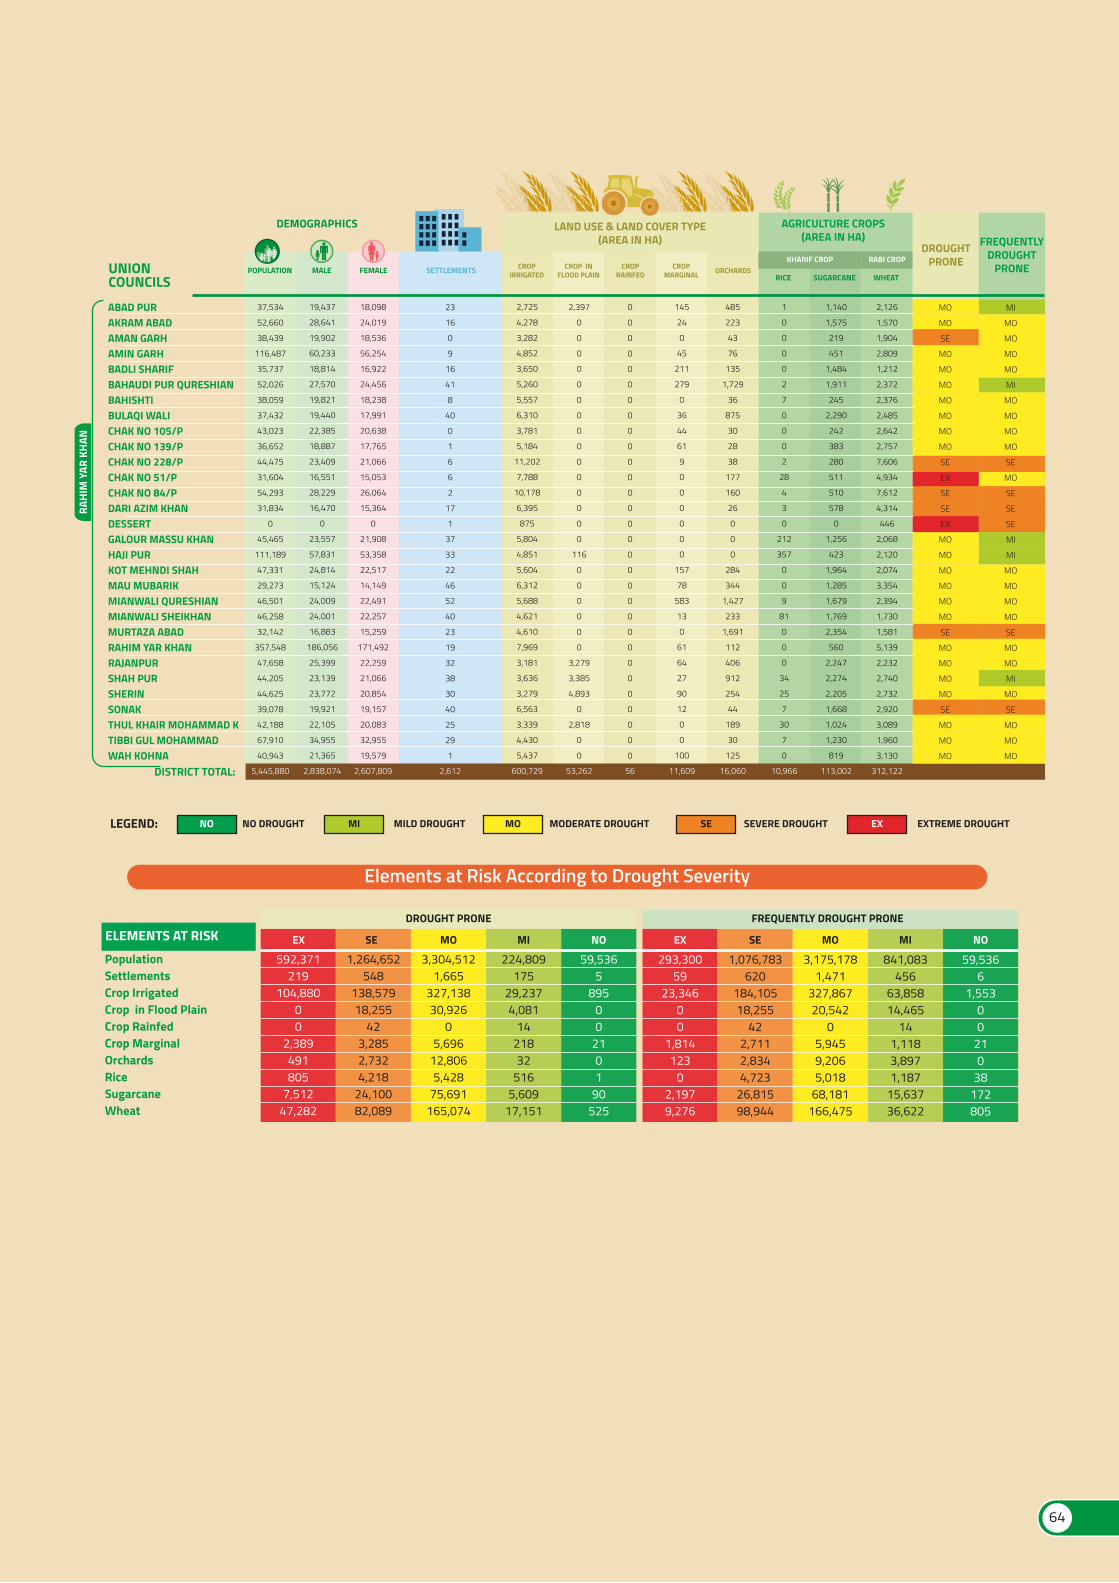
ABAD PURAKRAM ABADAMAN GARHAMIN GARHBADLI SHARIFBAHAUDI PUR QURESHIANBAHISHTIBULAQI WALICHAK NO 105/PCHAK NO 139/PCHAK NO 228/PCHAK NO 51/PCHAK NO 84/PDARI AZIM KHANDESSERTGALOUR MASSU KHANHAJI PURKOT MEHNDI SHAHMAU MUBARIKMIANWALI QURESHIANMIANWALI SHEIKHANMURTAZA ABADRAHIM YAR KHANRAJANPURSHAH PURSHERINSONAKTHUL KHAIR MOHAMMAD KTIBBI GUL MOHAMMADWAH KOHNA
UNIONCOUNCILS
RAHI
M Y
AR K
HAN
POPULATION MALE FEMALE SETTLEMENTS
19,437
28,641
19,902
60,233
18,814
27,570
19,821
19,440
22,385
18,887
23,409
16,551
28,229
16,470
0
23,557
57,831
24,814
15,124
24,009
24,001
16,883
186,056
25,399
23,139
23,772
19,921
22,105
34,955
21,365
2,838,074
18,098
24,019
18,536
56,254
16,922
24,456
18,238
17,991
20,638
17,765
21,066
15,053
26,064
15,364
0
21,908
53,358
22,517
14,149
22,491
22,257
15,259
171,492
22,259
21,066
20,854
19,157
20,083
32,955
19,579
2,607,809
RICE SUGARCANE WHEAT
AGRICULTURE CROPS(AREA IN HA)
1
0
0
0
0
2
7
0
0
0
2
28
4
3
0
212
357
0
0
9
81
0
0
0
34
25
7
30
7
0
10,966
1,140
1,575
219
451
1,484
1,911
245
2,290
242
383
280
511
510
578
0
1,256
423
1,964
1,285
1,679
1,769
2,354
560
2,247
2,274
2,205
1,668
1,024
1,230
819
113,002
2,126
1,570
1,904
2,809
1,212
2,372
2,376
2,485
2,642
2,757
7,606
4,934
7,612
4,314
446
2,068
2,120
2,074
3,354
2,394
1,730
1,581
5,139
2,232
2,740
2,732
2,920
3,089
1,960
3,130
312,122
23
16
0
9
16
41
8
40
0
1
6
6
2
17
1
37
33
22
46
52
40
23
19
32
38
30
40
25
29
1
2,612
CROPIRRIGATED
CROP INFLOOD PLAIN
CROPRAINFED
LAND USE & LAND COVER TYPE(AREA IN HA)
2,725
4,278
3,282
4,852
3,650
5,260
5,557
6,310
3,781
5,184
11,202
7,788
10,178
6,395
875
5,804
4,851
5,604
6,312
5,688
4,621
4,610
7,969
3,181
3,636
3,279
6,563
3,339
4,430
5,437
600,729
2,397
0
0
0
0
0
0
0
0
0
0
0
0
0
0
0
116
0
0
0
0
0
0
3,279
3,385
4,893
0
2,818
0
0
53,262
0
0
0
0
0
0
0
0
0
0
0
0
0
0
0
0
0
0
0
0
0
0
0
0
0
0
0
0
0
0
56
CROPMARGINAL ORCHARDS
145
24
0
45
211
279
0
36
44
61
9
0
0
0
0
0
0
157
78
583
13
0
61
64
27
90
12
0
0
100
11,609
485
223
43
76
135
1,729
36
875
30
28
38
177
160
26
0
0
0
284
344
1,427
233
1,691
112
406
912
254
44
189
30
125
16,060
37,534
52,660
38,439
116,487
35,737
52,026
38,059
37,432
43,023
36,652
44,475
31,604
54,293
31,834
0
45,465
111,189
47,331
29,273
46,501
46,258
32,142
357,548
47,658
44,205
44,625
39,078
42,188
67,910
40,943
5,445,880
KHARIF CROP RABI CROPDROUGHT
PRONE
FREQUENTLYDROUGHT
PRONE
MO
MO
SE
MO
MO
MO
MO
MO
MO
MO
SE
EX
SE
SE
EX
MO
MO
MO
MO
MO
MO
SE
MO
MO
MO
MO
SE
MO
MO
MO
MI
MO
MO
MO
MO
MI
MO
MO
MO
MO
SE
MO
SE
SE
SE
MI
MI
MO
MO
MO
MO
SE
MO
MO
MI
MO
SE
MO
MO
MO
DEMOGRAPHICS
PopulationSettlementsCrop IrrigatedCrop in Flood PlainCrop RainfedCrop Marginal OrchardsRice Sugarcane Wheat
ELEMENTS AT RISKDROUGHT PRONE FREQUENTLY DROUGHT PRONE
EX SE MO MI NO EX SE MO MI NO
592,371219
104,88000
2,389491805
7,51247,282
1,264,652548
138,57918,255
423,2852,7324,218
24,10082,089
3,304,5121,665
327,13830,926
05,696
12,8065,428
75,691165,074
224,809175
29,2374,081
1421832
5165,609
17,151
59,5365
89500
2101
90525
293,30059
23,34600
1,814123
02,1979,276
1,076,783620
184,10518,255
422,7112,8344,723
26,81598,944
3,175,1781,471
327,86720,542
05,9459,2065,018
68,181166,475
841,083456
63,85814,465
141,1183,8971,187
15,63736,622
59,5366
1,55300
210
38172805
Elements at Risk According to Drought Severity
LEGEND: NO NO DROUGHT MI MILD DROUGHT MO MODERATE DROUGHT SE SEVERE DROUGHT EX EXTREME DROUGHT
64
DISTRICT TOTAL:
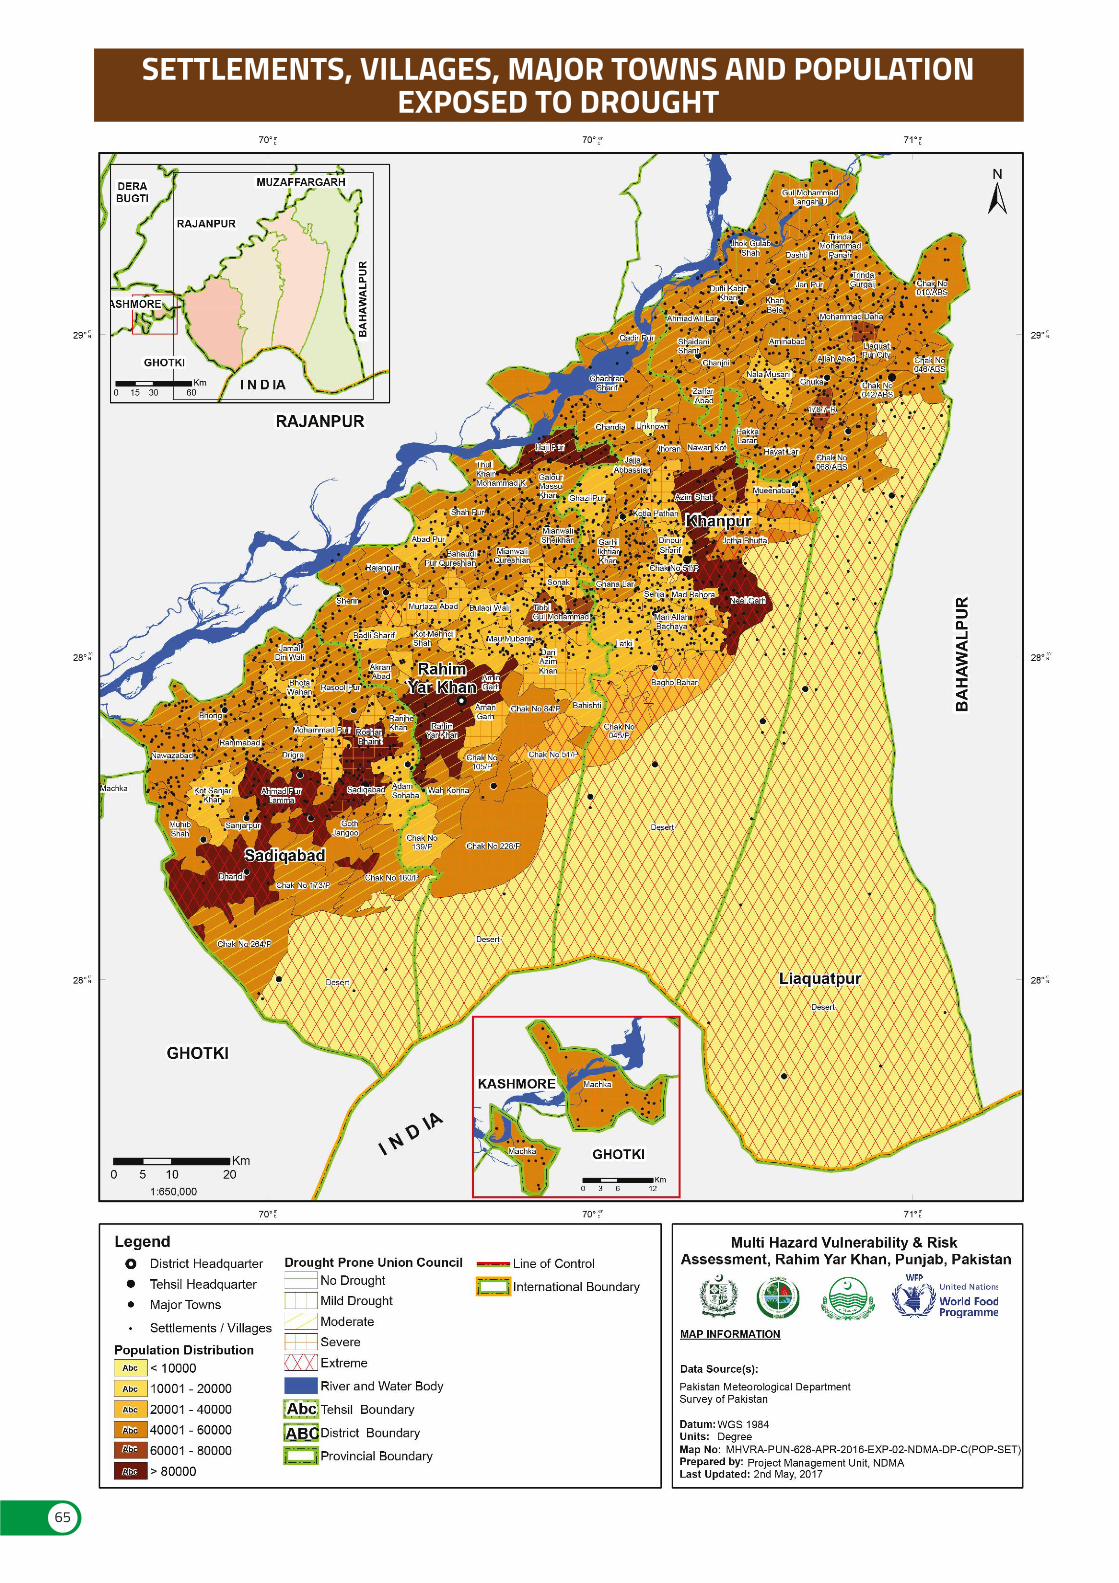
65
SETTLEMENTS, VILLAGES, MAJOR TOWNS AND POPULATIONEXPOSED TO DROUGHT
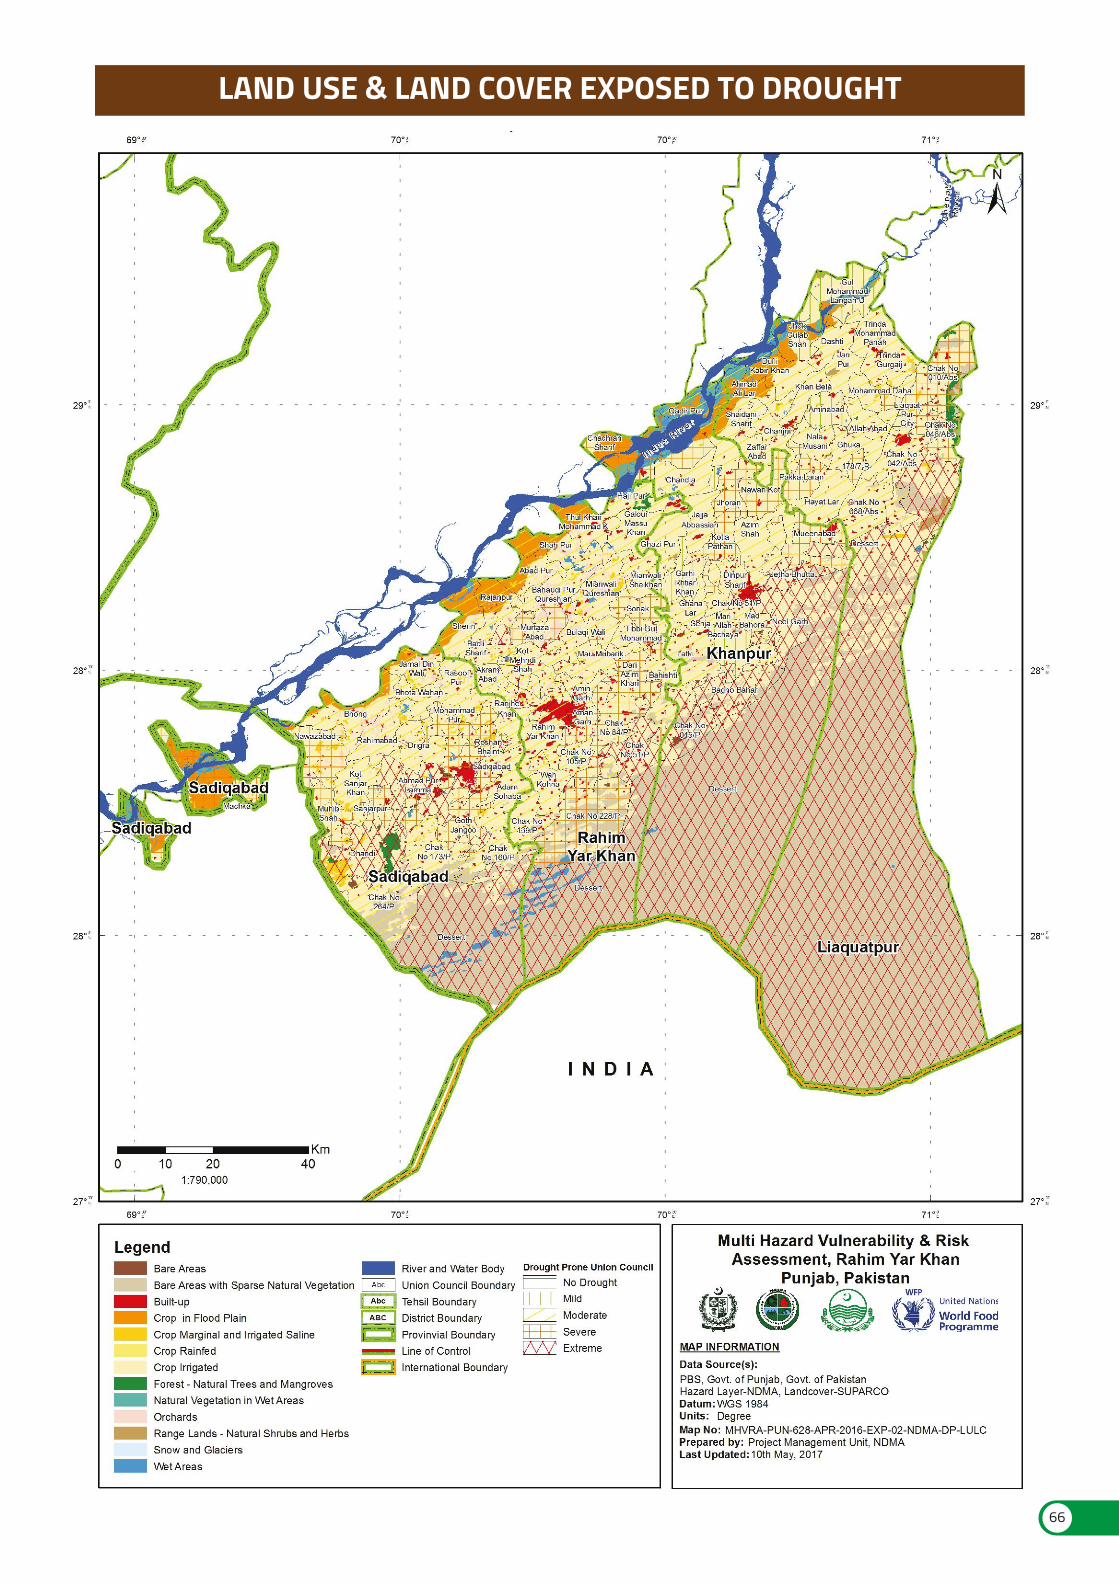
66
LAND USE & LAND COVER EXPOSED TO DROUGHT
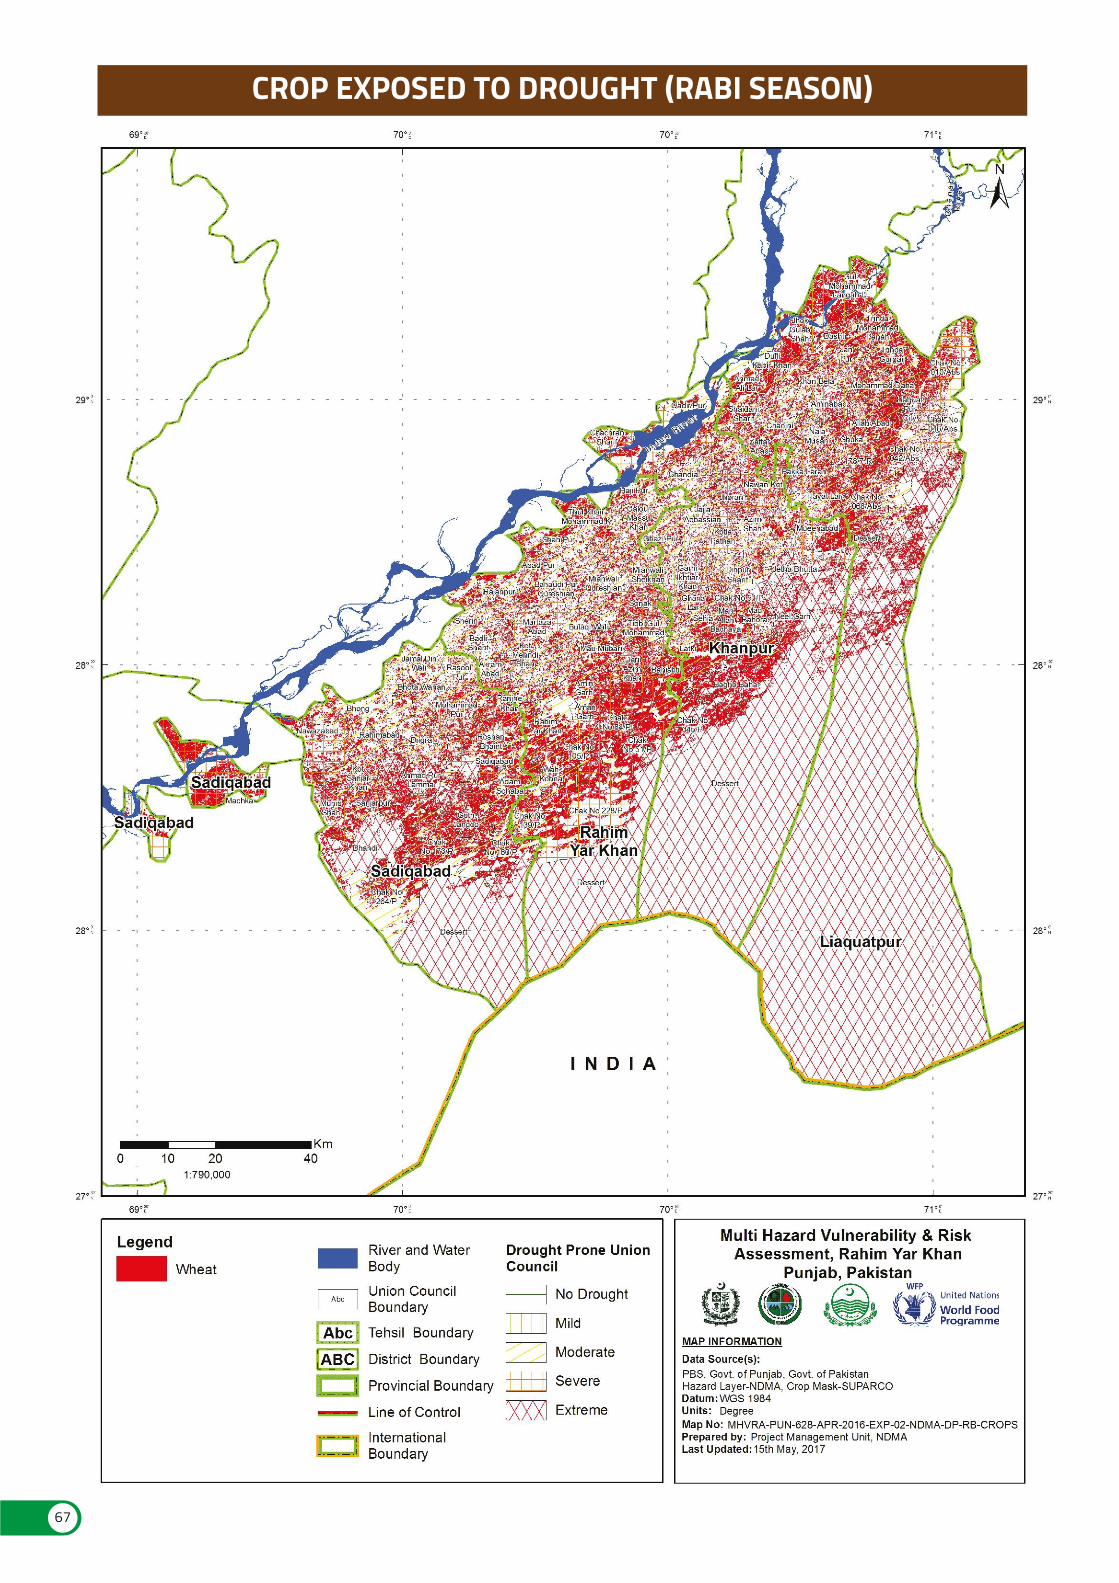
CROP EXPOSED TO DROUGHT (RABI SEASON)
67
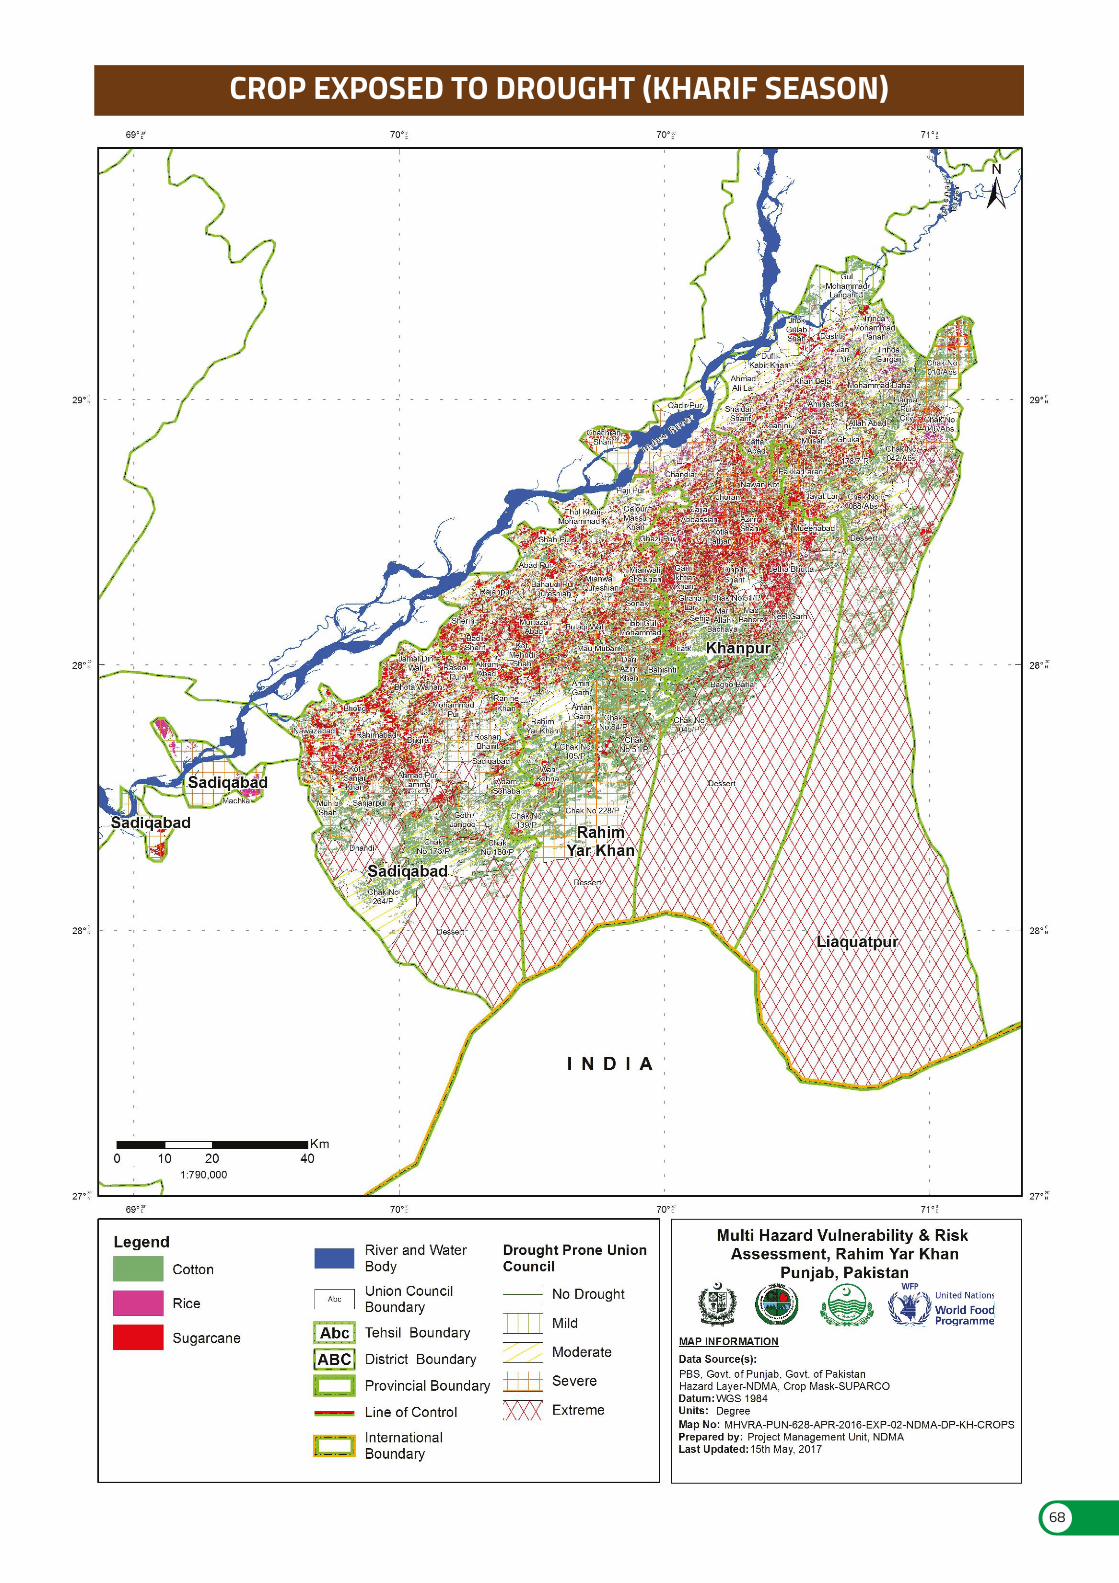
68
CROP EXPOSED TO DROUGHT (KHARIF SEASON)
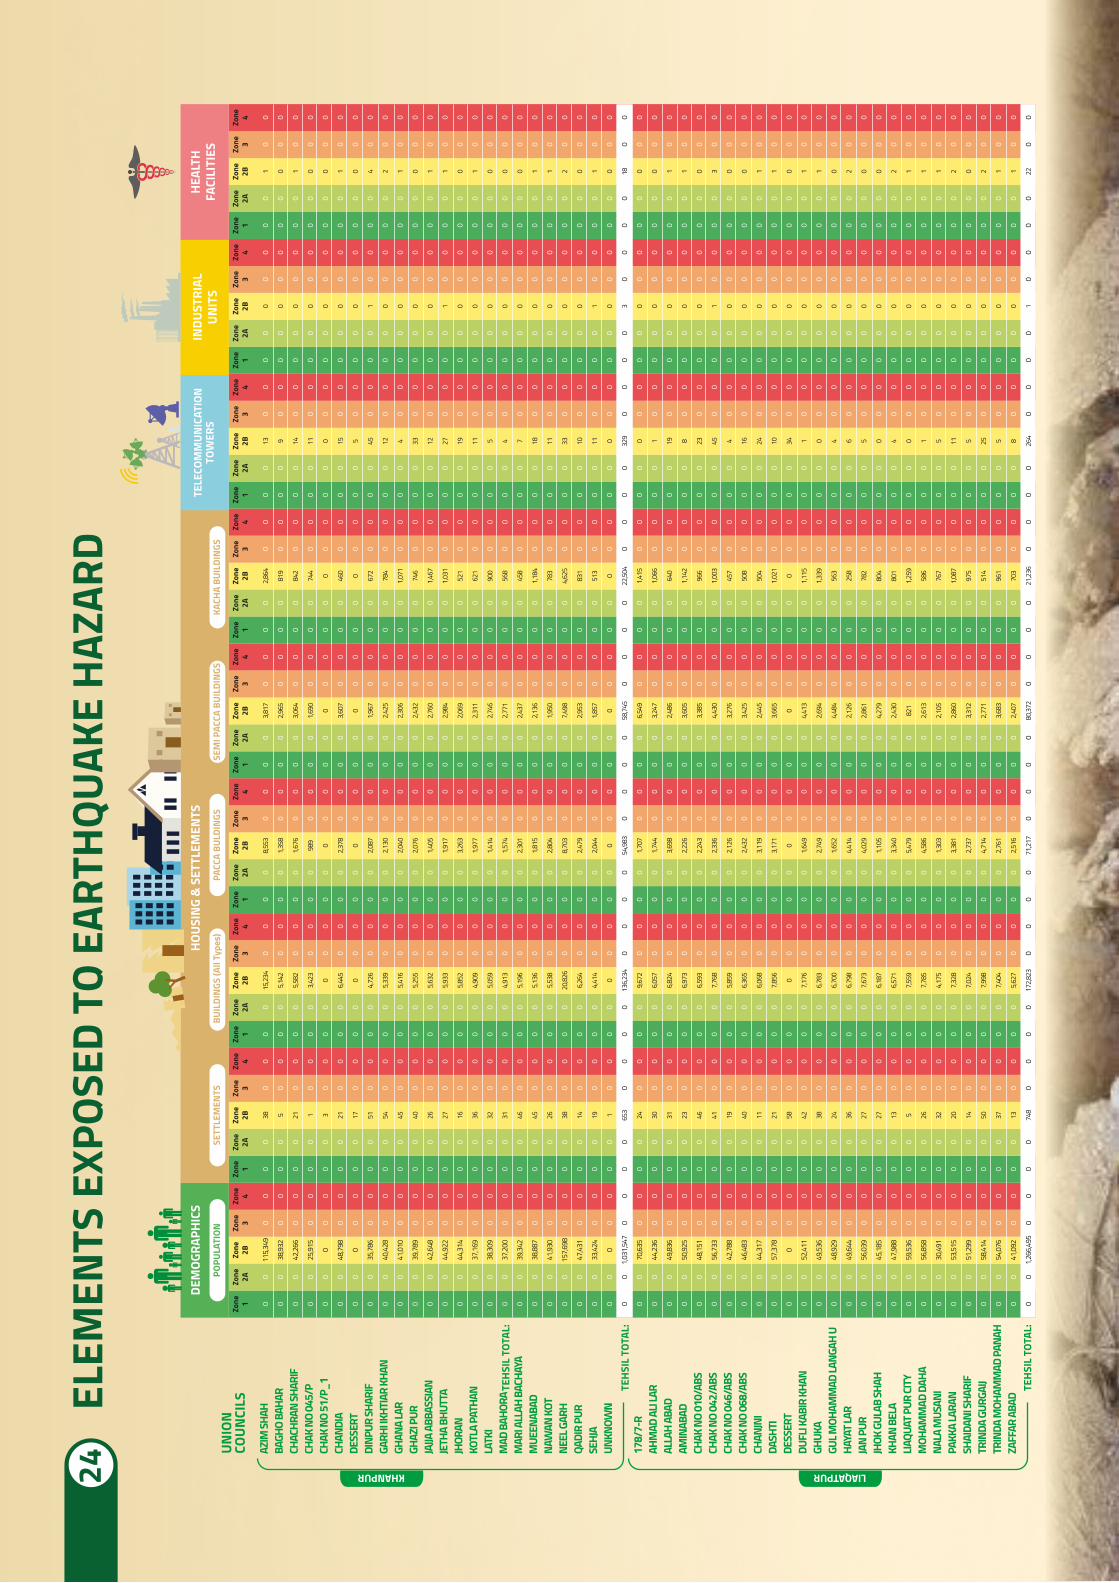
65
AZIM
SHAH
BAGH
O BA
HAR
CHAC
HRAN
SHAR
IFCH
AK N
O 04
5/P
CHAK
NO
51/P
_1CH
ANDI
ADE
SSER
TDI
NPUR
SHAR
IFGA
RHI IK
HTIA
R KH
ANGH
ANA
LAR
GHAZ
I PUR
JAJJA
ABB
ASSI
ANJE
THA
BHUT
TAJH
ORAN
KOTL
A PA
THAN
LATK
IM
AD B
AHOR
AM
ARI A
LLAH
BAC
HAYA
MUE
ENAB
ADNA
WAN
KOT
NEEL
GAR
HQA
DIR
PUR
SEHJ
AUN
KNOW
N
178/
7-R
AHM
AD A
LI LA
RAL
LAH
ABAD
AMIN
ABAD
CHAK
NO
010/
ABS
CHAK
NO
042/
ABS
CHAK
NO
046/
ABS
CHAK
NO
068/
ABS
CHAN
JNI
DASH
TIDE
SSER
TDU
FLI K
ABIR
KHA
NGH
UKA
GUL M
OHAM
MAD
LANG
AH U
HAYA
T LAR
JAN
PUR
JHOK
GUL
AB SH
AHKH
AN B
ELA
LIAQU
AT P
UR CI
TYM
OHAM
MAD
DAH
ANA
LA M
USAN
IPA
KKA
LARA
NSH
AIDA
NI SH
ARIF
TRIN
DA G
URGA
IJTR
INDA
MOH
AMM
AD PA
NAH
ZAFF
AR A
BAD
UNIO
NCO
UNCI
LS
KHANPUR LIAQATPUR
TEHS
IL T
OTAL
:
TEHS
IL T
OTAL
:
TEHS
IL T
OTAL
:
DEM
OGRA
PHIC
SPO
PULA
TION
Zone 1
Zone 2A
Zone 2B
Zone 3
Zone 4
TELE
COM
MUN
ICAT
ION
TOW
ERS
HOUS
ING
& S
ETTL
EMEN
TSSE
TTLE
MEN
TS B
UILD
INGS
(All
Type
s)PA
CCA
BULD
INGS
SEM
I PAC
CA B
UILD
INGS
KACH
A BU
ILDI
NGS
Zone 1
Zone 2A
Zone 2B
Zone 3
Zone 4
0 0 0 0 0 0 0 0 0 0 0 0 0 0 0 0 0 0 0 0 0 0 0 0 0 0 0 0 0 0 0 0 0 0 0 0 0 0 0 0 0 0 0 0 0 0 0 0 0 0 0 0
0 0 0 0 0 0 0 0 0 0 0 0 0 0 0 0 0 0 0 0 0 0 0 0 0 0 0 0 0 0 0 0 0 0 0 0 0 0 0 0 0 0 0 0 0 0 0 0 0 0 0 0
38 5 21 1 3 21 17 51 54 45 40 26 27 16 36 32 31 46 45 26 38 14 19 1 653
24 30 31 23 46 41 19 40 11 21 58 42 38 24 36 27 27 13 5 26 32 20 14 50 37 13 748
0 0 0 0 0 0 0 0 0 0 0 0 0 0 0 0 0 0 0 0 0 0 0 0 0 0 0 0 0 0 0 0 0 0 0 0 0 0 0 0 0 0 0 0 0 0 0 0 0 0 0 0
0 0 0 0 0 0 0 0 0 0 0 0 0 0 0 0 0 0 0 0 0 0 0 0 0 0 0 0 0 0 0 0 0 0 0 0 0 0 0 0 0 0 0 0 0 0 0 0 0 0 0 0
Zone 1
Zone 2A
Zone 2B
Zone 3
Zone 4
0 0 0 0 0 0 0 0 0 0 0 0 0 0 0 0 0 0 0 0 0 0 0 0 0 0 0 0 0 0 0 0 0 0 0 0 0 0 0 0 0 0 0 0 0 0 0 0 0 0 0 0
0 0 0 0 0 0 0 0 0 0 0 0 0 0 0 0 0 0 0 0 0 0 0 0 0 0 0 0 0 0 0 0 0 0 0 0 0 0 0 0 0 0 0 0 0 0 0 0 0 0 0 0
15,23
4
5,142
5,582
3,423 0
6,445 0
4,726
5,339
5,416
5,255
5,632
5,933
5,852
4,909
5,059
4,913
5,196
5,136
5,538
20,82
6
6,264
4,414 0
136,2
34
9,672
6,057
6,824
6,973
6,593
7,768
5,859
6,365
6,068
7,856 0
7,176
6,783
6,700
6,798
7,673
6,187
6,571
7,559
7,785
4,175
7,328
7,024
7,998
7,404
5,627
172,8
23
0 0 0 0 0 0 0 0 0 0 0 0 0 0 0 0 0 0 0 0 0 0 0 0 0 0 0 0 0 0 0 0 0 0 0 0 0 0 0 0 0 0 0 0 0 0 0 0 0 0 0 0
0 0 0 0 0 0 0 0 0 0 0 0 0 0 0 0 0 0 0 0 0 0 0 0 0 0 0 0 0 0 0 0 0 0 0 0 0 0 0 0 0 0 0 0 0 0 0 0 0 0 0 0
Zone 1
Zone 2A
Zone 2B
Zone 3
Zone 4
0 0 0 0 0 0 0 0 0 0 0 0 0 0 0 0 0 0 0 0 0 0 0 0 0 0 0 0 0 0 0 0 0 0 0 0 0 0 0 0 0 0 0 0 0 0 0 0 0 0 0 0
0 0 0 0 0 0 0 0 0 0 0 0 0 0 0 0 0 0 0 0 0 0 0 0 0 0 0 0 0 0 0 0 0 0 0 0 0 0 0 0 0 0 0 0 0 0 0 0 0 0 0 0
8,553
1,358
1,676
989 0
2,378 0
2,087
2,130
2,040
2,076
1,405
1,917
3,263
1,977
1,414
1,574
2,301
1,815
2,804
8,703
2,479
2,044 0
54,98
3
1,707
1,744
3,698
2,226
2,243
2,336
2,126
2,432
3,119
3,171 0
1,649
2,749
1,652
4,414
4,029
1,105
3,340
5,479
4,586
1,303
3,381
2,737
4,714
2,761
2,516
71,21
7
0 0 0 0 0 0 0 0 0 0 0 0 0 0 0 0 0 0 0 0 0 0 0 0 0 0 0 0 0 0 0 0 0 0 0 0 0 0 0 0 0 0 0 0 0 0 0 0 0 0 0 0
0 0 0 0 0 0 0 0 0 0 0 0 0 0 0 0 0 0 0 0 0 0 0 0 0 0 0 0 0 0 0 0 0 0 0 0 0 0 0 0 0 0 0 0 0 0 0 0 0 0 0 0
Zone 1
Zone 2A
Zone 2B
Zone 3
Zone 4
0 0 0 0 0 0 0 0 0 0 0 0 0 0 0 0 0 0 0 0 0 0 0 0 0 0 0 0 0 0 0 0 0 0 0 0 0 0 0 0 0 0 0 0 0 0 0 0 0 0 0 0
0 0 0 0 0 0 0 0 0 0 0 0 0 0 0 0 0 0 0 0 0 0 0 0 0 0 0 0 0 0 0 0 0 0 0 0 0 0 0 0 0 0 0 0 0 0 0 0 0 0 0 0
3,817
2,965
3,064
1,690 0
3,607 0
1,967
2,425
2,306
2,432
2,760
2,984
2,069
2,311
2,746
2,771
2,437
2,136
1,950
7,498
2,953
1,857 0
58,74
5
6,549
3,247
2,486
3,605
3,385
4,430
3,276
3,425
2,445
3,665 0
4,413
2,694
4,484
2,126
2,861
4,279
2,430
821
2,613
2,105
2,860
3,312
2,771
3,683
2,407
80,37
2
0 0 0 0 0 0 0 0 0 0 0 0 0 0 0 0 0 0 0 0 0 0 0 0 0 0 0 0 0 0 0 0 0 0 0 0 0 0 0 0 0 0 0 0 0 0 0 0 0 0 0 0
0 0 0 0 0 0 0 0 0 0 0 0 0 0 0 0 0 0 0 0 0 0 0 0 0 0 0 0 0 0 0 0 0 0 0 0 0 0 0 0 0 0 0 0 0 0 0 0 0 0 0 0
Zone 1
Zone 2A
Zone 2B
Zone 3
Zone 4
0 0 0 0 0 0 0 0 0 0 0 0 0 0 0 0 0 0 0 0 0 0 0 0 0 0 0 0 0 0 0 0 0 0 0 0 0 0 0 0 0 0 0 0 0 0 0 0 0 0 0 0
0 0 0 0 0 0 0 0 0 0 0 0 0 0 0 0 0 0 0 0 0 0 0 0 0 0 0 0 0 0 0 0 0 0 0 0 0 0 0 0 0 0 0 0 0 0 0 0 0 0 0 0
2,864
819
842
744 0 460 0 672
784
1,071
746
1,467
1,031
521
621
900
568
458
1,184
783
4,625
831
513 0
22,50
4
1,415
1,066
640
1,142
966
1,003
457
508
504
1,021 0
1,115
1,339
563
258
782
804
801
1,259
586
767
1,087
975
514
961
703
21,23
6
0 0 0 0 0 0 0 0 0 0 0 0 0 0 0 0 0 0 0 0 0 0 0 0 0 0 0 0 0 0 0 0 0 0 0 0 0 0 0 0 0 0 0 0 0 0 0 0 0 0 0 0
0 0 0 0 0 0 0 0 0 0 0 0 0 0 0 0 0 0 0 0 0 0 0 0 0 0 0 0 0 0 0 0 0 0 0 0 0 0 0 0 0 0 0 0 0 0 0 0 0 0 0 0
Zone 1
Zone 2A
Zone 2B
Zone 3
Zone 4
0 0 0 0 0 0 0 0 0 0 0 0 0 0 0 0 0 0 0 0 0 0 0 0 0 0 0 0 0 0 0 0 0 0 0 0 0 0 0 0 0 0 0 0 0 0 0 0 0 0 0 0
0 0 0 0 0 0 0 0 0 0 0 0 0 0 0 0 0 0 0 0 0 0 0 0 0 0 0 0 0 0 0 0 0 0 0 0 0 0 0 0 0 0 0 0 0 0 0 0 0 0 0 0
13 9 14 11 0 15 5 45 12 4 33 12 27 19 11 5 4 7 18 11 33 10 11 0 329 0 1 19 8 23 45 4 16 24 10 34 1 0 4 6 5 0 4 0 1 5 11 5 25 5 8 264
0 0 0 0 0 0 0 0 0 0 0 0 0 0 0 0 0 0 0 0 0 0 0 0 0 0 0 0 0 0 0 0 0 0 0 0 0 0 0 0 0 0 0 0 0 0 0 0 0 0 0 0
0 0 0 0 0 0 0 0 0 0 0 0 0 0 0 0 0 0 0 0 0 0 0 0 0 0 0 0 0 0 0 0 0 0 0 0 0 0 0 0 0 0 0 0 0 0 0 0 0 0 0 0
Zone 1
Zone 2A
Zone 2B
Zone 3
Zone 4
0 0 0 0 0 0 0 0 0 0 0 0 0 0 0 0 0 0 0 0 0 0 0 0 0 0 0 0 0 0 0 0 0 0 0 0 0 0 0 0 0 0 0 0 0 0 0 0 0 0 0 0
0 0 0 0 0 0 0 0 0 0 0 0 0 0 0 0 0 0 0 0 0 0 0 0 0 0 0 0 0 0 0 0 0 0 0 0 0 0 0 0 0 0 0 0 0 0 0 0 0 0 0 0
0 0 0 0 0 0 0 1 0 0 0 0 1 0 0 0 0 0 0 0 0 0 1 0 3 0 0 0 0 0 1 0 0 0 0 0 0 0 0 0 0 0 0 0 0 0 0 0 0 0 0 1
0 0 0 0 0 0 0 0 0 0 0 0 0 0 0 0 0 0 0 0 0 0 0 0 0 0 0 0 0 0 0 0 0 0 0 0 0 0 0 0 0 0 0 0 0 0 0 0 0 0 0 0
0 0 0 0 0 0 0 0 0 0 0 0 0 0 0 0 0 0 0 0 0 0 0 0 0 0 0 0 0 0 0 0 0 0 0 0 0 0 0 0 0 0 0 0 0 0 0 0 0 0 0 0
Zone 1
Zone 2A
Zone 2B
Zone 3
Zone 4
0 0 0 0 0 0 0 0 0 0 0 0 0 0 0 0 0 0 0 0 0 0 0 0 0 0 0 0 0 0 0 0 0 0 0 0 0 0 0 0 0 0 0 0 0 0 0 0 0 0 0 0
0 0 0 0 0 0 0 0 0 0 0 0 0 0 0 0 0 0 0 0 0 0 0 0 0 0 0 0 0 0 0 0 0 0 0 0 0 0 0 0 0 0 0 0 0 0 0 0 0 0 0 0
1 0 1 0 0 1 0 4 2 1 0 1 1 0 1 0 0 0 1 1 2 0 1 0 18 0 0 1 1 0 3 0 0 1 1 0 1 1 0 2 0 0 2 1 1 1 2 0 2 1 1 22
0 0 0 0 0 0 0 0 0 0 0 0 0 0 0 0 0 0 0 0 0 0 0 0 0 0 0 0 0 0 0 0 0 0 0 0 0 0 0 0 0 0 0 0 0 0 0 0 0 0 0 0
0 0 0 0 0 0 0 0 0 0 0 0 0 0 0 0 0 0 0 0 0 0 0 0 0 0 0 0 0 0 0 0 0 0 0 0 0 0 0 0 0 0 0 0 0 0 0 0 0 0 0 0
INDU
STRI
ALUN
ITS
HEAL
THFA
CILI
TIES
0 0 0 0 0 0 0 0 0 0 0 0 0 0 0 0 0 0 0 0 0 0 0 0 0 0 0 0 0 0 0 0 0 0 0 0 0 0 0 0 0 0 0 0 0 0 0 0 0 0 0 0
0 0 0 0 0 0 0 0 0 0 0 0 0 0 0 0 0 0 0 0 0 0 0 0 0 0 0 0 0 0 0 0 0 0 0 0 0 0 0 0 0 0 0 0 0 0 0 0 0 0 0 0
115,3
49
38,93
2
42,26
6
25,91
5
0
48,79
8
0
35,78
6
40,42
8
41,01
0
39,78
9
42,64
8
44,92
2
44,31
4
37,16
9
38,30
9
37,20
0
39,34
2
38,88
7
41,93
0
157,6
98
47,43
1
33,42
4
0
1,031
,547
70,63
5
44,23
6
49,83
6
50,92
5
48,15
1
56,73
3
42,78
8
46,48
3
44,31
7
57,37
8
0
52,41
1
49,53
6
48,92
9
49,64
4
56,03
9
45,18
5
47,98
8
59,53
6
56,85
8
30,49
1
53,51
5
51,29
9
58,41
4
54,07
6
41,09
2
1,266
,495
0 0 0 0 0 0 0 0 0 0 0 0 0 0 0 0 0 0 0 0 0 0 0 0 0 0 0 0 0 0 0 0 0 0 0 0 0 0 0 0 0 0 0 0 0 0 0 0 0 0 0 0
0 0 0 0 0 0 0 0 0 0 0 0 0 0 0 0 0 0 0 0 0 0 0 0 0 0 0 0 0 0 0 0 0 0 0 0 0 0 0 0 0 0 0 0 0 0 0 0 0 0 0 0
ELEM
ENTS
EXP
OSED
TO
EART
HQUA
KE H
AZAR
D24
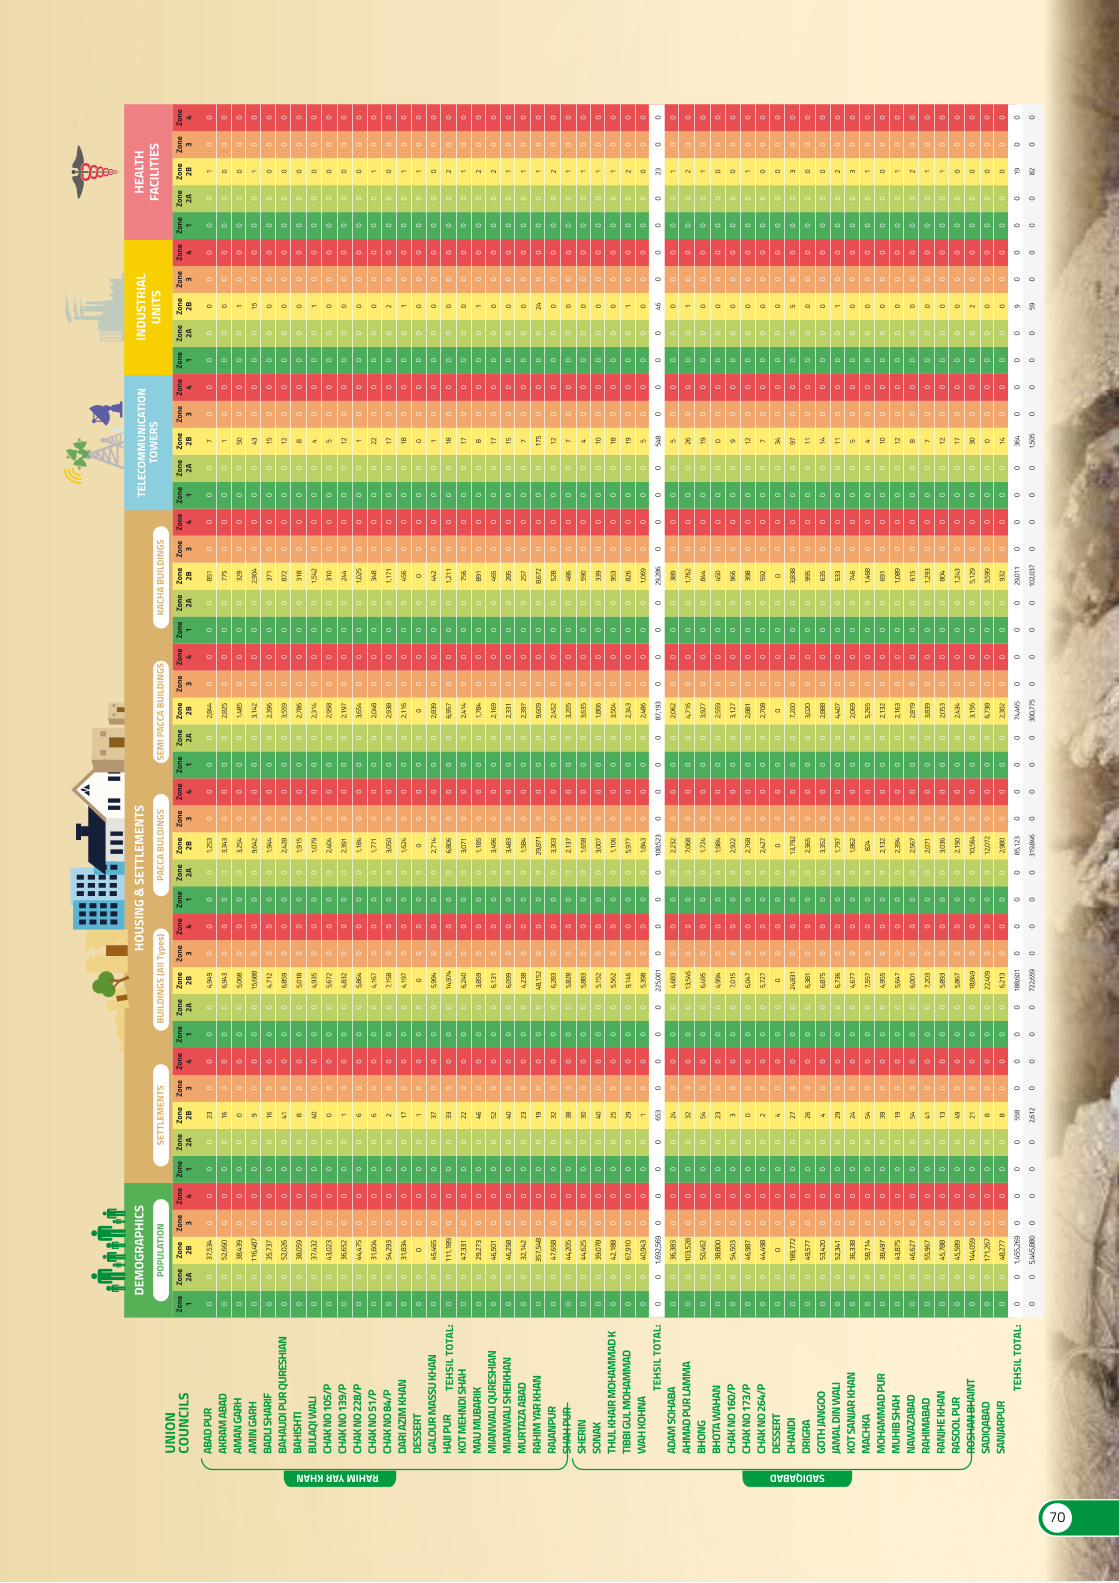
ABAD
PUR
AKRA
M A
BAD
AMAN
GAR
HAM
IN G
ARH
BADL
I SHA
RIF
BAHA
UDI P
UR Q
URES
HIAN
BAHI
SHTI
BULA
QI W
ALI
CHAK
NO
105/
PCH
AK N
O 13
9/P
CHAK
NO
228/
PCH
AK N
O 51
/PCH
AK N
O 84
/PDA
RI A
ZIM
KHA
NDE
SSER
TGA
LOUR
MAS
SU K
HAN
HAJI P
URKO
T MEH
NDI S
HAH
MAU
MUB
ARIK
MIA
NWAL
I QUR
ESHI
ANM
IANW
ALI S
HEIK
HAN
MUR
TAZA
ABA
DRA
HIM
YAR
KHAN
RAJA
NPUR
SHAH
PUR
SHER
INSO
NAK
THUL
KHA
IR M
OHAM
MAD
KTI
BBI G
UL M
OHAM
MAD
WAH
KOH
NA
ADAM
SOHA
BAAH
MAD
PUR
LAM
MA
BHON
GBH
OTA
WAH
ANCH
AK N
O 16
0/P
CHAK
NO
173/
PCH
AK N
O 26
4/P
DESS
ERT
DHAN
DIDR
IGRA
GOTH
JANG
OOJA
MAL
DIN
WAL
IKO
T SAN
JAR
KHAN
MAC
HKA
MOH
AMM
AD P
URM
UHIB
SHAH
NAW
AZAB
ADRA
HIM
ABAD
RANJ
HE K
HAN
RASO
OL P
URRO
SHAN
BHA
INT
SADI
QABA
DSA
NJAR
PUR
UNIO
NCO
UNCI
LS
RAHIM YAR KHAN SADIQABAD
TEHS
IL T
OTAL
:
TEHS
IL T
OTAL
:
TEHS
IL T
OTAL
:
DEM
OGRA
PHIC
SPO
PULA
TION
Zone 1
Zone 2A
Zone 2B
Zone 3
Zone 4
TELE
COM
MUN
ICAT
ION
TOW
ERS
HOUS
ING
& S
ETTL
EMEN
TSSE
TTLE
MEN
TS B
UILD
INGS
(All
Type
s)PA
CCA
BULD
INGS
SEM
I PAC
CA B
UILD
INGS
KACH
A BU
ILDI
NGS
Zone 1
Zone 2A
Zone 2B
Zone 3
Zone 4
0 0 0 0 0 0 0 0 0 0 0 0 0 0 0 0 0 0 0 0 0 0 0 0 0 0 0 0 0 0 0 0 0 0 0 0 0 0 0 0 0 0 0 0 0 0 0 0 0 0 0 0 0 0 0 0
0 0 0 0 0 0 0 0 0 0 0 0 0 0 0 0 0 0 0 0 0 0 0 0 0 0 0 0 0 0 0 0 0 0 0 0 0 0 0 0 0 0 0 0 0 0 0 0 0 0 0 0 0 0 0 0
23 16 0 9 16 41 8 40 0 1 6 6 2 17 1 37 33 22 46 52 40 23 19 32 38 30 40 25 29 1 653
24 32 54 23 3 0 2 4 27 26 4 29 24 54 39 19 54 41 13 49 21 8 8 558
2,612
0 0 0 0 0 0 0 0 0 0 0 0 0 0 0 0 0 0 0 0 0 0 0 0 0 0 0 0 0 0 0 0 0 0 0 0 0 0 0 0 0 0 0 0 0 0 0 0 0 0 0 0 0 0 0 0
0 0 0 0 0 0 0 0 0 0 0 0 0 0 0 0 0 0 0 0 0 0 0 0 0 0 0 0 0 0 0 0 0 0 0 0 0 0 0 0 0 0 0 0 0 0 0 0 0 0 0 0 0 0 0 0
Zone 1
Zone 2A
Zone 2B
Zone 3
Zone 4
0 0 0 0 0 0 0 0 0 0 0 0 0 0 0 0 0 0 0 0 0 0 0 0 0 0 0 0 0 0 0 0 0 0 0 0 0 0 0 0 0 0 0 0 0 0 0 0 0 0 0 0 0 0 0 0
0 0 0 0 0 0 0 0 0 0 0 0 0 0 0 0 0 0 0 0 0 0 0 0 0 0 0 0 0 0 0 0 0 0 0 0 0 0 0 0 0 0 0 0 0 0 0 0 0 0 0 0 0 0 0 0
4,949
6,943
5,068
15,68
8
4,712
6,859
5,018
4,935
5,672
4,832
5,864
4,167
7,158
4,197 0
5,994
14,97
4
6,240
3,859
6,131
6,099
4,238
48,15
2
6,283
5,828
5,883
5,152
5,562
9,146
5,398
225,0
01
4,683
13,54
6
6,495
4,994
7,015
6,047
5,727 0
24,83
1
6,381
6,875
6,736
4,677
7,557
4,955
5,647
6,001
7,203
5,893
5,867
18,84
9
22,40
9
6,213
188,6
01
722,6
59
0 0 0 0 0 0 0 0 0 0 0 0 0 0 0 0 0 0 0 0 0 0 0 0 0 0 0 0 0 0 0 0 0 0 0 0 0 0 0 0 0 0 0 0 0 0 0 0 0 0 0 0 0 0 0 0
0 0 0 0 0 0 0 0 0 0 0 0 0 0 0 0 0 0 0 0 0 0 0 0 0 0 0 0 0 0 0 0 0 0 0 0 0 0 0 0 0 0 0 0 0 0 0 0 0 0 0 0 0 0 0 0
Zone 1
Zone 2A
Zone 2B
Zone 3
Zone 4
0 0 0 0 0 0 0 0 0 0 0 0 0 0 0 0 0 0 0 0 0 0 0 0 0 0 0 0 0 0 0 0 0 0 0 0 0 0 0 0 0 0 0 0 0 0 0 0 0 0 0 0 0 0 0 0
0 0 0 0 0 0 0 0 0 0 0 0 0 0 0 0 0 0 0 0 0 0 0 0 0 0 0 0 0 0 0 0 0 0 0 0 0 0 0 0 0 0 0 0 0 0 0 0 0 0 0 0 0 0 0 0
1,253
3,343
3,254
9,642
1,944
2,428
1,915
1,079
2,404
2,391
1,184
1,771
3,050
1,624 0
2,714
6,806
3,071
1,185
3,496
3,483
1,584
29,87
1
3,303
2,137
1,658
3,007
1,106
5,977
1,843
108,5
23
2,232
7,068
1,724
1,984
2,922
2,768
2,427 0
13,79
2
2,365
3,352
1,797
1,862
824
2,132
2,394
2,567
2,071
3,036
2,190
10,56
4
12,07
2
2,980
85,12
3
319,8
46
0 0 0 0 0 0 0 0 0 0 0 0 0 0 0 0 0 0 0 0 0 0 0 0 0 0 0 0 0 0 0 0 0 0 0 0 0 0 0 0 0 0 0 0 0 0 0 0 0 0 0 0 0 0 0 0
0 0 0 0 0 0 0 0 0 0 0 0 0 0 0 0 0 0 0 0 0 0 0 0 0 0 0 0 0 0 0 0 0 0 0 0 0 0 0 0 0 0 0 0 0 0 0 0 0 0 0 0 0 0 0 0
Zone 1
Zone 2A
Zone 2B
Zone 3
Zone 4
0 0 0 0 0 0 0 0 0 0 0 0 0 0 0 0 0 0 0 0 0 0 0 0 0 0 0 0 0 0 0 0 0 0 0 0 0 0 0 0 0 0 0 0 0 0 0 0 0 0 0 0 0 0 0 0
0 0 0 0 0 0 0 0 0 0 0 0 0 0 0 0 0 0 0 0 0 0 0 0 0 0 0 0 0 0 0 0 0 0 0 0 0 0 0 0 0 0 0 0 0 0 0 0 0 0 0 0 0 0 0 0
2,844
2,825
1,485
3,142
2,396
3,559
2,786
2,314
2,958
2,197
3,654
2,048
2,938
2,116 0
2,839
6,957
2,414
1,784
2,169
2,331
2,397
9,609
2,452
3,205
3,635
1,806
3,504
2,343
2,486
87,19
3
2,062
4,716
3,927
2,559
3,127
2,881
2,708 0
7,200
3,020
2,888
4,407
2,069
5,265
2,132
2,163
2,819
3,839
2,053
2,434
3,156
6,738
2,302
74,46
5
300,7
75
0 0 0 0 0 0 0 0 0 0 0 0 0 0 0 0 0 0 0 0 0 0 0 0 0 0 0 0 0 0 0 0 0 0 0 0 0 0 0 0 0 0 0 0 0 0 0 0 0 0 0 0 0 0 0 0
0 0 0 0 0 0 0 0 0 0 0 0 0 0 0 0 0 0 0 0 0 0 0 0 0 0 0 0 0 0 0 0 0 0 0 0 0 0 0 0 0 0 0 0 0 0 0 0 0 0 0 0 0 0 0 0
Zone 1
Zone 2A
Zone 2B
Zone 3
Zone 4
0 0 0 0 0 0 0 0 0 0 0 0 0 0 0 0 0 0 0 0 0 0 0 0 0 0 0 0 0 0 0 0 0 0 0 0 0 0 0 0 0 0 0 0 0 0 0 0 0 0 0 0 0 0 0 0
0 0 0 0 0 0 0 0 0 0 0 0 0 0 0 0 0 0 0 0 0 0 0 0 0 0 0 0 0 0 0 0 0 0 0 0 0 0 0 0 0 0 0 0 0 0 0 0 0 0 0 0 0 0 0 0
851
775
329
2,904
371
872
318
1,542
310
244
1,025
348
1,171
456 0 442
1,211
756
891
465
285
257
8,672
528
486
590
339
953
826
1,069
29,28
6
389
1,762
844
450
966
398
592 0
3,838
995
635
533
746
1,468
691
1,089
615
1,293
804
1,243
5,129
3,599
932
29,01
1
102,0
37
0 0 0 0 0 0 0 0 0 0 0 0 0 0 0 0 0 0 0 0 0 0 0 0 0 0 0 0 0 0 0 0 0 0 0 0 0 0 0 0 0 0 0 0 0 0 0 0 0 0 0 0 0 0 0 0
0 0 0 0 0 0 0 0 0 0 0 0 0 0 0 0 0 0 0 0 0 0 0 0 0 0 0 0 0 0 0 0 0 0 0 0 0 0 0 0 0 0 0 0 0 0 0 0 0 0 0 0 0 0 0 0
Zone 1
Zone 2A
Zone 2B
Zone 3
Zone 4
0 0 0 0 0 0 0 0 0 0 0 0 0 0 0 0 0 0 0 0 0 0 0 0 0 0 0 0 0 0 0 0 0 0 0 0 0 0 0 0 0 0 0 0 0 0 0 0 0 0 0 0 0 0 0 0
0 0 0 0 0 0 0 0 0 0 0 0 0 0 0 0 0 0 0 0 0 0 0 0 0 0 0 0 0 0 0 0 0 0 0 0 0 0 0 0 0 0 0 0 0 0 0 0 0 0 0 0 0 0 0 0
7 1 50 43 15 12 8 4 5 12 1 22 17 18 0 1 18 17 8 17 15 7 175
12 7 4 10 18 19 5 548 5 26 19 0 9 12 7 34 97 11 14 11 5 4 10 12 8 7 12 17 30 0 14 364
1,505
0 0 0 0 0 0 0 0 0 0 0 0 0 0 0 0 0 0 0 0 0 0 0 0 0 0 0 0 0 0 0 0 0 0 0 0 0 0 0 0 0 0 0 0 0 0 0 0 0 0 0 0 0 0 0 0
0 0 0 0 0 0 0 0 0 0 0 0 0 0 0 0 0 0 0 0 0 0 0 0 0 0 0 0 0 0 0 0 0 0 0 0 0 0 0 0 0 0 0 0 0 0 0 0 0 0 0 0 0 0 0 0
Zone 1
Zone 2A
Zone 2B
Zone 3
Zone 4
0 0 0 0 0 0 0 0 0 0 0 0 0 0 0 0 0 0 0 0 0 0 0 0 0 0 0 0 0 0 0 0 0 0 0 0 0 0 0 0 0 0 0 0 0 0 0 0 0 0 0 0 0 0 0 0
0 0 0 0 0 0 0 0 0 0 0 0 0 0 0 0 0 0 0 0 0 0 0 0 0 0 0 0 0 0 0 0 0 0 0 0 0 0 0 0 0 0 0 0 0 0 0 0 0 0 0 0 0 0 0 0
0 0 1 15 0 0 0 1 0 0 0 0 2 1 0 0 0 0 1 0 0 0 24 0 0 0 0 0 1 0 46 0 1 0 0 0 0 0 0 5 0 0 1 0 0 0 0 0 0 0 0 2 0 0 9 59
0 0 0 0 0 0 0 0 0 0 0 0 0 0 0 0 0 0 0 0 0 0 0 0 0 0 0 0 0 0 0 0 0 0 0 0 0 0 0 0 0 0 0 0 0 0 0 0 0 0 0 0 0 0 0 0
0 0 0 0 0 0 0 0 0 0 0 0 0 0 0 0 0 0 0 0 0 0 0 0 0 0 0 0 0 0 0 0 0 0 0 0 0 0 0 0 0 0 0 0 0 0 0 0 0 0 0 0 0 0 0 0
Zone 1
Zone 2A
Zone 2B
Zone 3
Zone 4
0 0 0 0 0 0 0 0 0 0 0 0 0 0 0 0 0 0 0 0 0 0 0 0 0 0 0 0 0 0 0 0 0 0 0 0 0 0 0 0 0 0 0 0 0 0 0 0 0 0 0 0 0 0 0 0
0 0 0 0 0 0 0 0 0 0 0 0 0 0 0 0 0 0 0 0 0 0 0 0 0 0 0 0 0 0 0 0 0 0 0 0 0 0 0 0 0 0 0 0 0 0 0 0 0 0 0 0 0 0 0 0
1 0 0 1 0 0 0 0 0 0 0 1 0 1 1 0 2 1 2 2 1 1 1 2 1 1 1 1 2 0 23 1 2 1 0 0 1 0 0 3 0 0 2 3 1 0 1 2 1 1 0 0 0 0 19 82
0 0 0 0 0 0 0 0 0 0 0 0 0 0 0 0 0 0 0 0 0 0 0 0 0 0 0 0 0 0 0 0 0 0 0 0 0 0 0 0 0 0 0 0 0 0 0 0 0 0 0 0 0 0 0 0
0 0 0 0 0 0 0 0 0 0 0 0 0 0 0 0 0 0 0 0 0 0 0 0 0 0 0 0 0 0 0 0 0 0 0 0 0 0 0 0 0 0 0 0 0 0 0 0 0 0 0 0 0 0 0 0
INDU
STRI
ALUN
ITS
HEAL
THFA
CILI
TIES
0 0 0 0 0 0 0 0 0 0 0 0 0 0 0 0 0 0 0 0 0 0 0 0 0 0 0 0 0 0 0 0 0 0 0 0 0 0 0 0 0 0 0 0 0 0 0 0 0 0 0 0 0 0 0 0
0 0 0 0 0 0 0 0 0 0 0 0 0 0 0 0 0 0 0 0 0 0 0 0 0 0 0 0 0 0 0 0 0 0 0 0 0 0 0 0 0 0 0 0 0 0 0 0 0 0 0 0 0 0 0 0
37,53
4
52,66
0
38,43
9
116,4
87
35,73
7
52,02
6
38,05
9
37,43
2
43,02
3
36,65
2
44,47
5
31,60
4
54,29
3
31,83
4
0
45,46
5
111,1
89
47,33
1
29,27
3
46,50
1
46,25
8
32,14
2
357,5
48
47,65
8
44,20
5
44,62
5
39,07
8
42,18
8
67,91
0
40,94
3
1,692
,569
36,38
3
103,5
28
50,46
2
38,80
0
54,50
3
46,98
7
44,49
8
0
189,7
72
49,57
7
53,42
0
52,34
1
36,33
8
58,71
4
38,49
7
43,87
5
46,62
7
55,96
7
45,78
8
45,58
9
144,0
59
171,2
67
48,27
7
1,455
,269
5,445
,880
0 0 0 0 0 0 0 0 0 0 0 0 0 0 0 0 0 0 0 0 0 0 0 0 0 0 0 0 0 0 0 0 0 0 0 0 0 0 0 0 0 0 0 0 0 0 0 0 0 0 0 0 0 0 0 0
0 0 0 0 0 0 0 0 0 0 0 0 0 0 0 0 0 0 0 0 0 0 0 0 0 0 0 0 0 0 0 0 0 0 0 0 0 0 0 0 0 0 0 0 0 0 0 0 0 0 0 0 0 0 0 0
70
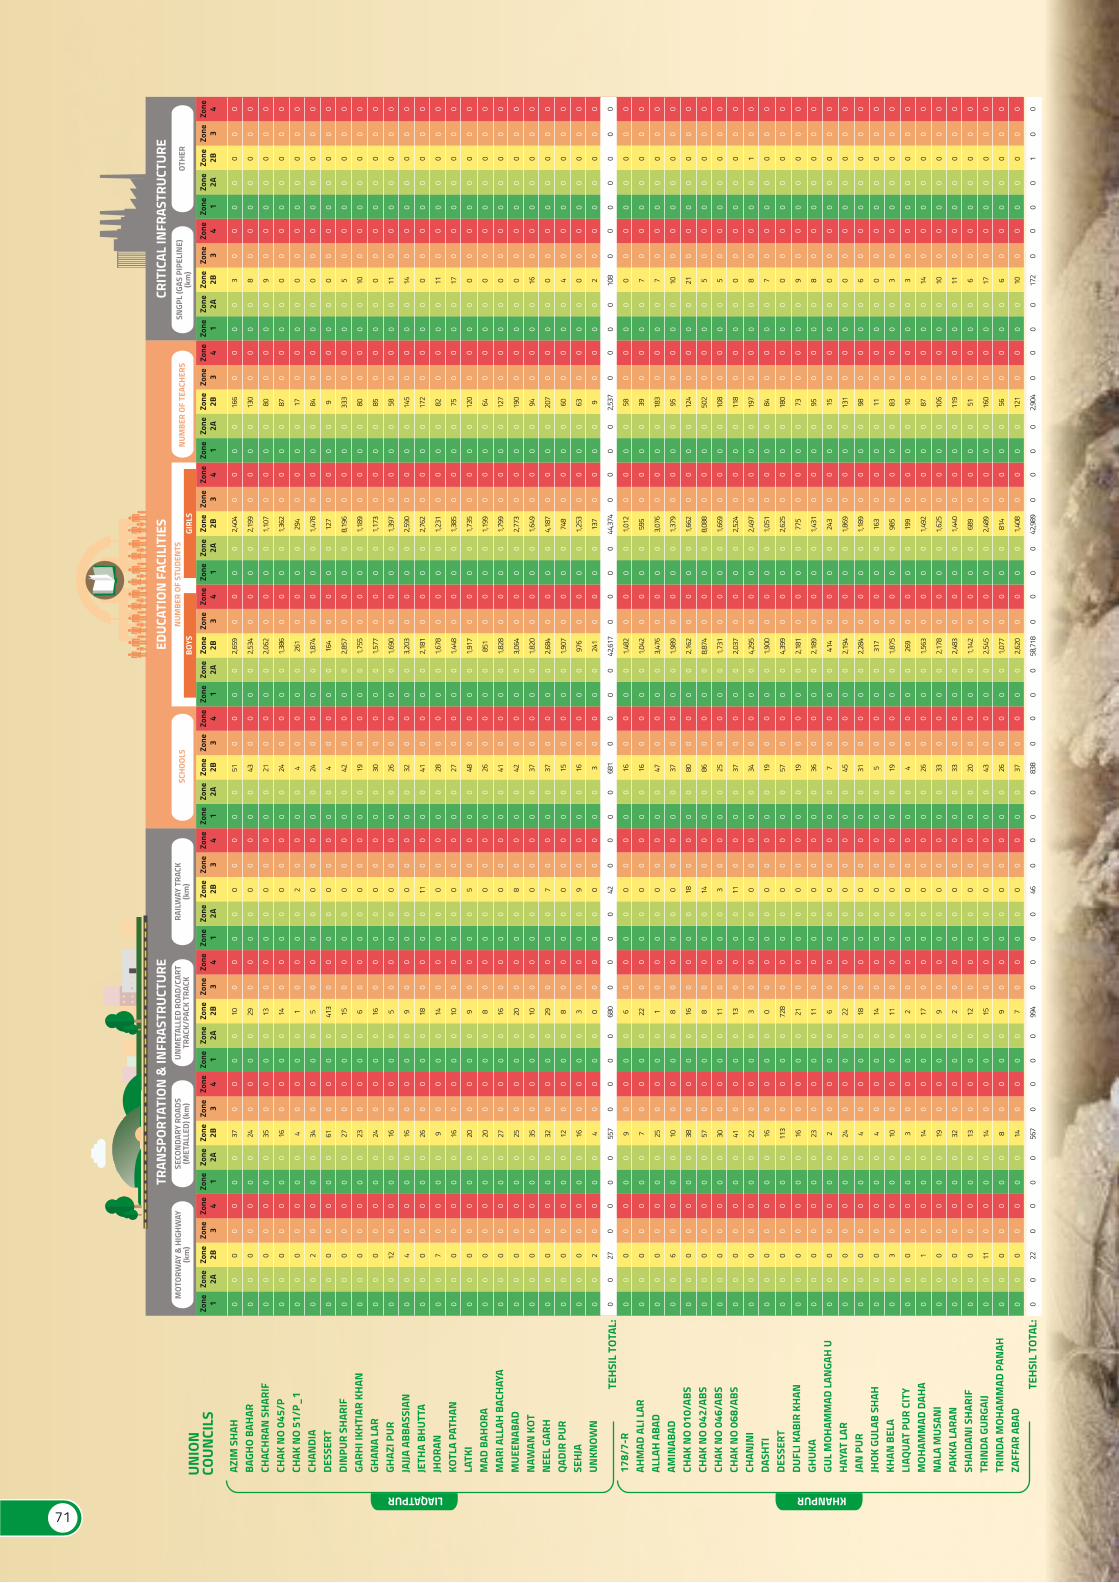
AZIM
SHA
HBA
GHO
BAHA
RCH
ACHR
AN S
HARI
FCH
AK N
O 04
5/P
CHAK
NO
51/P
_1CH
ANDI
ADE
SSER
TDI
NPU
R SH
ARIF
GARH
I IKH
TIAR
KHA
NGH
ANA
LAR
GHAZ
I PUR
JAJJA
ABB
ASSI
ANJE
THA
BHUT
TAJH
ORAN
KOTL
A PA
THAN
LATK
IM
AD B
AHOR
AM
ARI A
LLAH
BAC
HAYA
MUE
ENAB
ADN
AWAN
KOT
NEE
L GA
RHQA
DIR
PUR
SEHJ
AUN
KNOW
N
178/
7-R
AHM
AD A
LI L
ARAL
LAH
ABAD
AMIN
ABAD
CHAK
NO
010/
ABS
CHAK
NO
042/
ABS
CHAK
NO
046/
ABS
CHAK
NO
068/
ABS
CHAN
JNI
DASH
TIDE
SSER
TDU
FLI K
ABIR
KHA
NGH
UKA
GUL
MOH
AMM
AD L
ANGA
H U
HAYA
T LA
RJA
N P
URJH
OK G
ULAB
SHA
HKH
AN B
ELA
LIAQ
UAT
PUR
CITY
MOH
AMM
AD D
AHA
NAL
A M
USAN
IPA
KKA
LARA
NSH
AIDA
NI S
HARI
FTR
INDA
GUR
GAIJ
TRIN
DA M
OHAM
MAD
PAN
AHZA
FFAR
ABA
D
UNIO
NCO
UNCI
LS
LIAQATPUR KHANPUR
TEHS
IL T
OTAL
:
TEHS
IL T
OTAL
:
TRAN
SPOR
TATI
ON &
INFR
ASTR
UCTU
REM
OTOR
WAY
& H
IGHW
AY(k
m)
SECO
NDA
RY R
OADS
(MET
ALLE
D) (k
m)
UNM
ETAL
LED
ROAD
/CAR
TTR
ACK/
PACK
TRA
CKRA
ILW
AY T
RACK
(km
)
Zone 1
Zone 2A
Zone 2B
Zone 3
Zone 4
0 0 0 0 0 0 0 0 0 0 0 0 0 0 0 0 0 0 0 0 0 0 0 0 0 0 0 0 0 0 0 0 0 0 0 0 0 0 0 0 0 0 0 0 0 0 0 0 0 0 0 0
0 0 0 0 0 0 0 0 0 0 0 0 0 0 0 0 0 0 0 0 0 0 0 0 0 0 0 0 0 0 0 0 0 0 0 0 0 0 0 0 0 0 0 0 0 0 0 0 0 0 0 0
0 0 0 0 0 2 0 0 0 0 12 4 0 7 0 0 0 0 0 0 0 0 0 2 27 0 0 0 6 0 0 0 0 0 0 0 0 0 0 0 0 0 3 0 1 0 0 0 11 0 0 22
0 0 0 0 0 0 0 0 0 0 0 0 0 0 0 0 0 0 0 0 0 0 0 0 0 0 0 0 0 0 0 0 0 0 0 0 0 0 0 0 0 0 0 0 0 0 0 0 0 0 0 0
0 0 0 0 0 0 0 0 0 0 0 0 0 0 0 0 0 0 0 0 0 0 0 0 0 0 0 0 0 0 0 0 0 0 0 0 0 0 0 0 0 0 0 0 0 0 0 0 0 0 0 0
Zone 1
Zone 2A
Zone 2B
Zone 3
Zone 4
0 0 0 0 0 0 0 0 0 0 0 0 0 0 0 0 0 0 0 0 0 0 0 0 0 0 0 0 0 0 0 0 0 0 0 0 0 0 0 0 0 0 0 0 0 0 0 0 0 0 0 0
0 0 0 0 0 0 0 0 0 0 0 0 0 0 0 0 0 0 0 0 0 0 0 0 0 0 0 0 0 0 0 0 0 0 0 0 0 0 0 0 0 0 0 0 0 0 0 0 0 0 0 0
37 24 35 16 4 34 61 27 23 24 16 16 26 9 16 20 20 27 25 35 32 12 16 4 557 9 7 25 10 38 57 30 41 22 16 113
16 23 2 24 4 4 10 3 14 19 32 13 14 8 14 567
0 0 0 0 0 0 0 0 0 0 0 0 0 0 0 0 0 0 0 0 0 0 0 0 0 0 0 0 0 0 0 0 0 0 0 0 0 0 0 0 0 0 0 0 0 0 0 0 0 0 0 0
0 0 0 0 0 0 0 0 0 0 0 0 0 0 0 0 0 0 0 0 0 0 0 0 0 0 0 0 0 0 0 0 0 0 0 0 0 0 0 0 0 0 0 0 0 0 0 0 0 0 0 0
Zone 1
Zone 2A
Zone 2B
Zone 3
Zone 4
0 0 0 0 0 0 0 0 0 0 0 0 0 0 0 0 0 0 0 0 0 0 0 0 0 0 0 0 0 0 0 0 0 0 0 0 0 0 0 0 0 0 0 0 0 0 0 0 0 0 0 0
0 0 0 0 0 0 0 0 0 0 0 0 0 0 0 0 0 0 0 0 0 0 0 0 0 0 0 0 0 0 0 0 0 0 0 0 0 0 0 0 0 0 0 0 0 0 0 0 0 0 0 0
10 29 13 14 1 5 413
15 6 16 5 9 18 14 10 9 8 16 20 10 29 8 3 0 680 6 22 1 8 16 8 11 13 3 0 728
21 11 6 22 18 14 11 2 17 9 2 12 15 9 7 994
0 0 0 0 0 0 0 0 0 0 0 0 0 0 0 0 0 0 0 0 0 0 0 0 0 0 0 0 0 0 0 0 0 0 0 0 0 0 0 0 0 0 0 0 0 0 0 0 0 0 0 0
0 0 0 0 0 0 0 0 0 0 0 0 0 0 0 0 0 0 0 0 0 0 0 0 0 0 0 0 0 0 0 0 0 0 0 0 0 0 0 0 0 0 0 0 0 0 0 0 0 0 0 0
Zone 1
Zone 2A
Zone 2B
Zone 3
Zone 4
0 0 0 0 0 0 0 0 0 0 0 0 0 0 0 0 0 0 0 0 0 0 0 0 0 0 0 0 0 0 0 0 0 0 0 0 0 0 0 0 0 0 0 0 0 0 0 0 0 0 0 0
0 0 0 0 0 0 0 0 0 0 0 0 0 0 0 0 0 0 0 0 0 0 0 0 0 0 0 0 0 0 0 0 0 0 0 0 0 0 0 0 0 0 0 0 0 0 0 0 0 0 0 0
0 0 0 0 2 0 0 0 0 0 0 0 11 0 0 5 0 0 8 0 7 0 9 0 42 0 0 0 0 18 14 3 11 0 0 0 0 0 0 0 0 0 0 0 0 0 0 0 0 0 0 46
0 0 0 0 0 0 0 0 0 0 0 0 0 0 0 0 0 0 0 0 0 0 0 0 0 0 0 0 0 0 0 0 0 0 0 0 0 0 0 0 0 0 0 0 0 0 0 0 0 0 0 0
0 0 0 0 0 0 0 0 0 0 0 0 0 0 0 0 0 0 0 0 0 0 0 0 0 0 0 0 0 0 0 0 0 0 0 0 0 0 0 0 0 0 0 0 0 0 0 0 0 0 0 0
CRIT
ICAL
INFR
ASTR
UCTU
RESN
GPL
(GAS
PIP
ELIN
E)(k
m)
OTHE
R
Zone 1
Zone 2A
Zone 2B
Zone 3
Zone 4
0 0 0 0 0 0 0 0 0 0 0 0 0 0 0 0 0 0 0 0 0 0 0 0 0 0 0 0 0 0 0 0 0 0 0 0 0 0 0 0 0 0 0 0 0 0 0 0 0 0 0 0
0 0 0 0 0 0 0 0 0 0 0 0 0 0 0 0 0 0 0 0 0 0 0 0 0 0 0 0 0 0 0 0 0 0 0 0 0 0 0 0 0 0 0 0 0 0 0 0 0 0 0 0
3 8 9 0 0 0 0 5 10 0 11 14 0 11 17 0 0 0 0 16 0 4 0 2 108 0 7 7 10 21 5 5 0 8 7 0 9 8 0 0 6 0 3 3 14 10 11 6 17 6 10 172
0 0 0 0 0 0 0 0 0 0 0 0 0 0 0 0 0 0 0 0 0 0 0 0 0 0 0 0 0 0 0 0 0 0 0 0 0 0 0 0 0 0 0 0 0 0 0 0 0 0 0 0
0 0 0 0 0 0 0 0 0 0 0 0 0 0 0 0 0 0 0 0 0 0 0 0 0 0 0 0 0 0 0 0 0 0 0 0 0 0 0 0 0 0 0 0 0 0 0 0 0 0 0 0
Zone 1
Zone 2A
Zone 2B
Zone 3
Zone 4
0 0 0 0 0 0 0 0 0 0 0 0 0 0 0 0 0 0 0 0 0 0 0 0 0 0 0 0 0 0 0 0 0 0 0 0 0 0 0 0 0 0 0 0 0 0 0 0 0 0 0 0
0 0 0 0 0 0 0 0 0 0 0 0 0 0 0 0 0 0 0 0 0 0 0 0 0 0 0 0 0 0 0 0 0 0 0 0 0 0 0 0 0 0 0 0 0 0 0 0 0 0 0 0
0 0 0 0 0 0 0 0 0 0 0 0 0 0 0 0 0 0 0 0 0 0 0 0 0 0 0 0 0 0 0 0 0 1 0 0 0 0 0 0 0 0 0 0 0 0 0 0 0 0 0 1
0 0 0 0 0 0 0 0 0 0 0 0 0 0 0 0 0 0 0 0 0 0 0 0 0 0 0 0 0 0 0 0 0 0 0 0 0 0 0 0 0 0 0 0 0 0 0 0 0 0 0 0
0 0 0 0 0 0 0 0 0 0 0 0 0 0 0 0 0 0 0 0 0 0 0 0 0 0 0 0 0 0 0 0 0 0 0 0 0 0 0 0 0 0 0 0 0 0 0 0 0 0 0 0
EDUC
ATIO
N F
ACIL
ITIE
S S
CHOO
LSN
UMBE
R OF
TEA
CHER
S
Zone 1
Zone 2A
Zone 2B
Zone 3
Zone 4
0 0 0 0 0 0 0 0 0 0 0 0 0 0 0 0 0 0 0 0 0 0 0 0 0 0 0 0 0 0 0 0 0 0 0 0 0 0 0 0 0 0 0 0 0 0 0 0 0 0 0 0
0 0 0 0 0 0 0 0 0 0 0 0 0 0 0 0 0 0 0 0 0 0 0 0 0 0 0 0 0 0 0 0 0 0 0 0 0 0 0 0 0 0 0 0 0 0 0 0 0 0 0 0
51 43 21 24 4 24 4 42 19 30 26 32 41 28 27 48 26 41 42 37 37 15 16 3 681
16 16 47 37 80 86 25 37 34 19 57 19 36 7 45 31 5 19 4 26 33 33 20 43 26 37 838
0 0 0 0 0 0 0 0 0 0 0 0 0 0 0 0 0 0 0 0 0 0 0 0 0 0 0 0 0 0 0 0 0 0 0 0 0 0 0 0 0 0 0 0 0 0 0 0 0 0 0 0
0 0 0 0 0 0 0 0 0 0 0 0 0 0 0 0 0 0 0 0 0 0 0 0 0 0 0 0 0 0 0 0 0 0 0 0 0 0 0 0 0 0 0 0 0 0 0 0 0 0 0 0
Zone 1
Zone 2A
Zone 2B
Zone 3
Zone 4
0 0 0 0 0 0 0 0 0 0 0 0 0 0 0 0 0 0 0 0 0 0 0 0 0 0 0 0 0 0 0 0 0 0 0 0 0 0 0 0 0 0 0 0 0 0 0 0 0 0 0 0
0 0 0 0 0 0 0 0 0 0 0 0 0 0 0 0 0 0 0 0 0 0 0 0 0 0 0 0 0 0 0 0 0 0 0 0 0 0 0 0 0 0 0 0 0 0 0 0 0 0 0 0
2,659
2,534
2,062
1,386
261
1,874
164
2,857
1,755
1,577
1,690
3,203
2,181
1,678
1,448
1,917
851
1,828
3,064
1,820
2,684
1,907
976
241
42,61
7
1,482
1,042
3,476
1,989
2,162
8,874
1,731
2,037
4,295
1,900
4,399
2,181
2,189
414
2,194
2,284
317
1,875
269
1,563
2,178
2,483
1,142
2,545
1,077
2,620
58,71
8
0 0 0 0 0 0 0 0 0 0 0 0 0 0 0 0 0 0 0 0 0 0 0 0 0 0 0 0 0 0 0 0 0 0 0 0 0 0 0 0 0 0 0 0 0 0 0 0 0 0 0 0
0 0 0 0 0 0 0 0 0 0 0 0 0 0 0 0 0 0 0 0 0 0 0 0 0 0 0 0 0 0 0 0 0 0 0 0 0 0 0 0 0 0 0 0 0 0 0 0 0 0 0 0
Zone 1
Zone 2A
Zone 2B
Zone 3
Zone 4
0 0 0 0 0 0 0 0 0 0 0 0 0 0 0 0 0 0 0 0 0 0 0 0 0 0 0 0 0 0 0 0 0 0 0 0 0 0 0 0 0 0 0 0 0 0 0 0 0 0 0 0
0 0 0 0 0 0 0 0 0 0 0 0 0 0 0 0 0 0 0 0 0 0 0 0 0 0 0 0 0 0 0 0 0 0 0 0 0 0 0 0 0 0 0 0 0 0 0 0 0 0 0 0
2,404
2,199
1,107
1,362
294
1,478
127
8,196
1,189
1,173
1,397
2,590
2,762
1,231
1,385
1,735
1,199
1,799
2,773
1,649
4,187
748
1,253
137
44,37
4
1,012
595
3,076
1,379
1,662
8,088
1,669
2,524
2,497
1,051
2,625
775
1,431
243
1,869
1,189
163
985
199
1,492
1,625
1,440
689
2,489
814
1,408
42,98
9
0 0 0 0 0 0 0 0 0 0 0 0 0 0 0 0 0 0 0 0 0 0 0 0 0 0 0 0 0 0 0 0 0 0 0 0 0 0 0 0 0 0 0 0 0 0 0 0 0 0 0 0
0 0 0 0 0 0 0 0 0 0 0 0 0 0 0 0 0 0 0 0 0 0 0 0 0 0 0 0 0 0 0 0 0 0 0 0 0 0 0 0 0 0 0 0 0 0 0 0 0 0 0 0
Zone 1
Zone 2A
Zone 2B
Zone 3
Zone 4
0 0 0 0 0 0 0 0 0 0 0 0 0 0 0 0 0 0 0 0 0 0 0 0 0 0 0 0 0 0 0 0 0 0 0 0 0 0 0 0 0 0 0 0 0 0 0 0 0 0 0 0
0 0 0 0 0 0 0 0 0 0 0 0 0 0 0 0 0 0 0 0 0 0 0 0 0 0 0 0 0 0 0 0 0 0 0 0 0 0 0 0 0 0 0 0 0 0 0 0 0 0 0 0
166
130
80 87 17 84 9 333
80 85 58 145
172
82 75 120
64 127
190
94 207
60 63 9
2,537 58 39 183
95 124
502
108
118
197
84 180
73 95 15 131
98 11 83 10 87 106
119
51 160
56 121
2,904
0 0 0 0 0 0 0 0 0 0 0 0 0 0 0 0 0 0 0 0 0 0 0 0 0 0 0 0 0 0 0 0 0 0 0 0 0 0 0 0 0 0 0 0 0 0 0 0 0 0 0 0
0 0 0 0 0 0 0 0 0 0 0 0 0 0 0 0 0 0 0 0 0 0 0 0 0 0 0 0 0 0 0 0 0 0 0 0 0 0 0 0 0 0 0 0 0 0 0 0 0 0 0 0
NUM
BER
OF S
TUDE
NTS
BOYS
GIRL
S
71
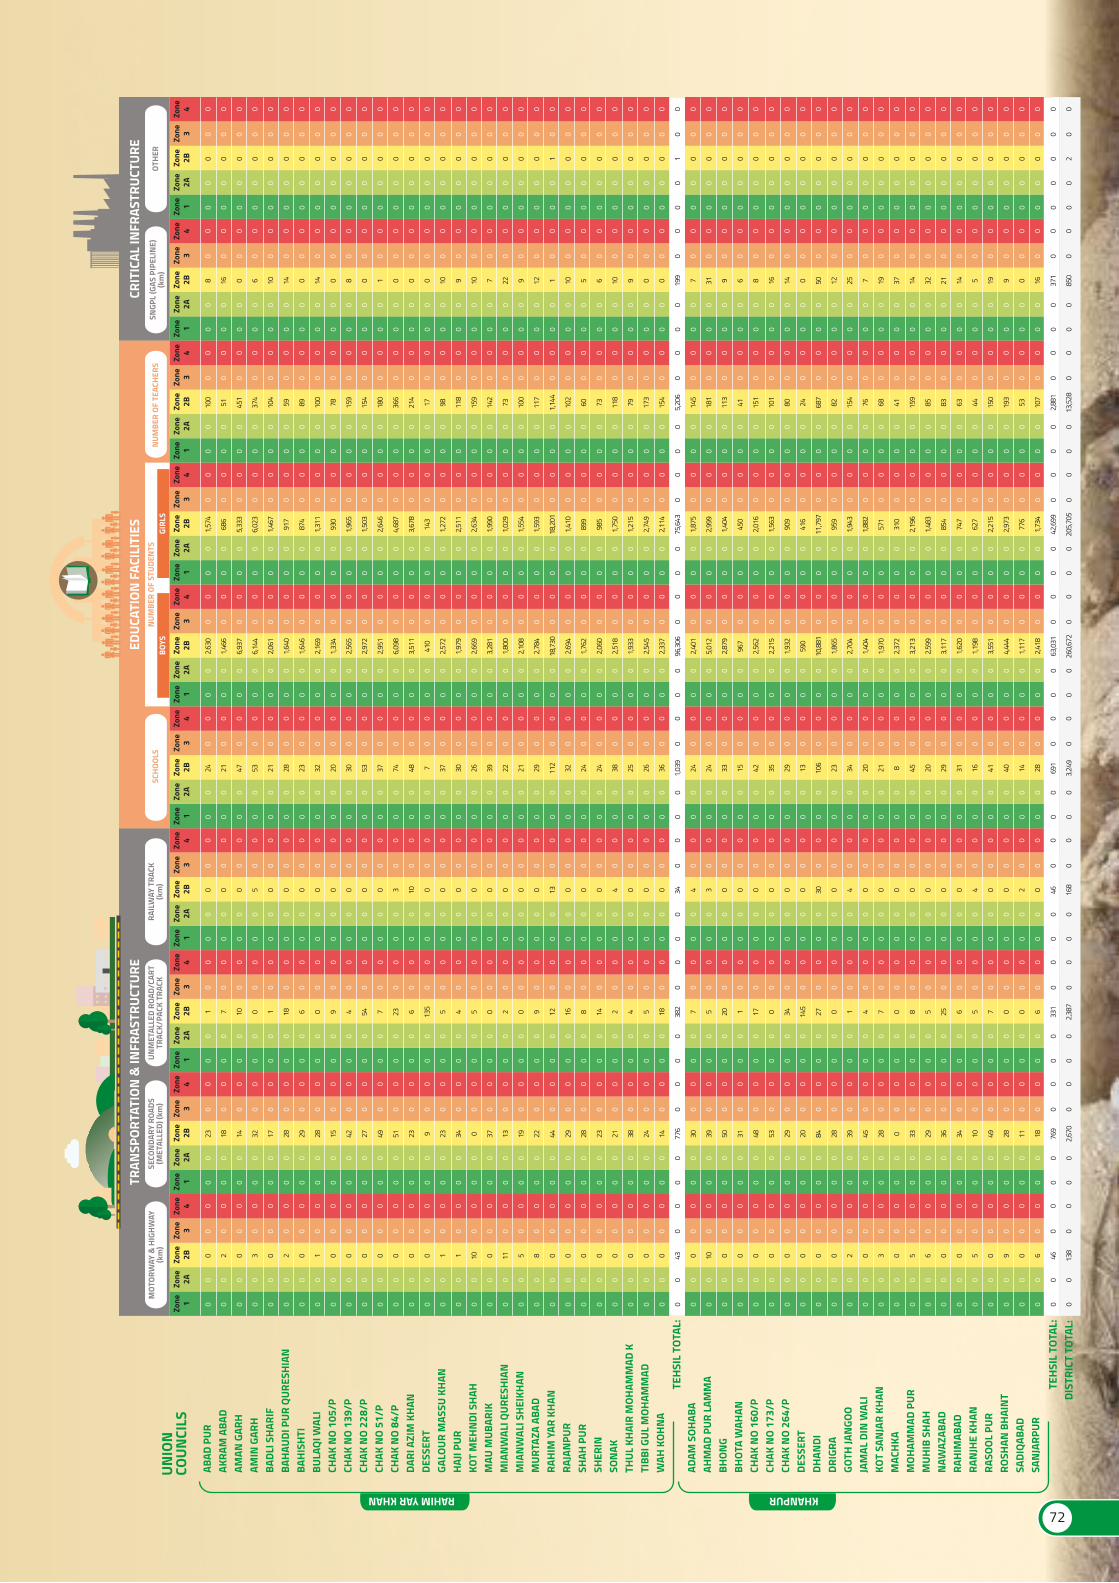
ABAD
PUR
AKRA
M A
BAD
AMAN
GAR
HAM
IN G
ARH
BADL
I SHA
RIF
BAHA
UDI P
UR Q
URES
HIAN
BAHI
SHTI
BULA
QI W
ALI
CHAK
NO
105/
PCH
AK N
O 13
9/P
CHAK
NO
228/
PCH
AK N
O 51
/PCH
AK N
O 84
/PDA
RI A
ZIM
KHA
NDE
SSER
TGA
LOUR
MAS
SU K
HAN
HAJI
PUR
KOT
MEH
NDI
SHA
HM
AU M
UBAR
IKM
IAN
WAL
I QUR
ESHI
ANM
IAN
WAL
I SHE
IKHA
NM
URTA
ZA A
BAD
RAHI
M Y
AR K
HAN
RAJA
NPU
RSH
AH P
URSH
ERIN
SON
AKTH
UL K
HAIR
MOH
AMM
AD K
TIBB
I GUL
MOH
AMM
ADW
AH K
OHN
A
ADAM
SOH
ABA
AHM
AD P
UR L
AMM
ABH
ONG
BHOT
A W
AHAN
CHAK
NO
160/
PCH
AK N
O 17
3/P
CHAK
NO
264/
PDE
SSER
TDH
ANDI
DRIG
RAGO
TH JA
NGO
OJA
MAL
DIN
WAL
IKO
T SA
NJA
R KH
ANM
ACHK
AM
OHAM
MAD
PUR
MUH
IB S
HAH
NAW
AZAB
ADRA
HIM
ABAD
RAN
JHE
KHAN
RASO
OL P
URRO
SHAN
BHA
INT
SADI
QABA
DSA
NJA
RPUR
UNIO
NCO
UNCI
LS
RAHIM YAR KHAN KHANPUR
TEHS
IL T
OTAL
:DI
STRI
CT T
OTAL
:
TEHS
IL T
OTAL
:
TRAN
SPOR
TATI
ON &
INFR
ASTR
UCTU
REM
OTOR
WAY
& H
IGHW
AY(k
m)
SECO
NDA
RY R
OADS
(MET
ALLE
D) (k
m)
UNM
ETAL
LED
ROAD
/CAR
TTR
ACK/
PACK
TRA
CKRA
ILW
AY T
RACK
(km
)
Zone 1
Zone 2A
Zone 2B
Zone 3
Zone 4
0 0 0 0 0 0 0 0 0 0 0 0 0 0 0 0 0 0 0 0 0 0 0 0 0 0 0 0 0 0 0 0 0 0 0 0 0 0 0 0 0 0 0 0 0 0 0 0 0 0 0 0 0 0 0 0
0 0 0 0 0 0 0 0 0 0 0 0 0 0 0 0 0 0 0 0 0 0 0 0 0 0 0 0 0 0 0 0 0 0 0 0 0 0 0 0 0 0 0 0 0 0 0 0 0 0 0 0 0 0 0 0
0 2 0 3 0 2 0 1 0 0 0 0 0 0 0 1 1 10 0 11 5 8 0 0 0 0 0 0 0 0 43 0 10 0 0 0 0 0 0 0 0 2 0 3 0 5 6 0 0 5 0 9 0 6 46 138
0 0 0 0 0 0 0 0 0 0 0 0 0 0 0 0 0 0 0 0 0 0 0 0 0 0 0 0 0 0 0 0 0 0 0 0 0 0 0 0 0 0 0 0 0 0 0 0 0 0 0 0 0 0 0 0
0 0 0 0 0 0 0 0 0 0 0 0 0 0 0 0 0 0 0 0 0 0 0 0 0 0 0 0 0 0 0 0 0 0 0 0 0 0 0 0 0 0 0 0 0 0 0 0 0 0 0 0 0 0 0 0
Zone 1
Zone 2A
Zone 2B
Zone 3
Zone 4
0 0 0 0 0 0 0 0 0 0 0 0 0 0 0 0 0 0 0 0 0 0 0 0 0 0 0 0 0 0 0 0 0 0 0 0 0 0 0 0 0 0 0 0 0 0 0 0 0 0 0 0 0 0 0 0
0 0 0 0 0 0 0 0 0 0 0 0 0 0 0 0 0 0 0 0 0 0 0 0 0 0 0 0 0 0 0 0 0 0 0 0 0 0 0 0 0 0 0 0 0 0 0 0 0 0 0 0 0 0 0 0
23 18 14 32 17 28 29 28 15 42 27 49 51 23 9 23 34 0 37 13 19 22 44 29 28 23 21 38 24 14 776
30 39 50 31 48 53 29 20 84 28 39 45 28 0 33 29 36 34 10 49 28 11 18 769
2,670
0 0 0 0 0 0 0 0 0 0 0 0 0 0 0 0 0 0 0 0 0 0 0 0 0 0 0 0 0 0 0 0 0 0 0 0 0 0 0 0 0 0 0 0 0 0 0 0 0 0 0 0 0 0 0 0
0 0 0 0 0 0 0 0 0 0 0 0 0 0 0 0 0 0 0 0 0 0 0 0 0 0 0 0 0 0 0 0 0 0 0 0 0 0 0 0 0 0 0 0 0 0 0 0 0 0 0 0 0 0 0 0
Zone 1
Zone 2A
Zone 2B
Zone 3
Zone 4
0 0 0 0 0 0 0 0 0 0 0 0 0 0 0 0 0 0 0 0 0 0 0 0 0 0 0 0 0 0 0 0 0 0 0 0 0 0 0 0 0 0 0 0 0 0 0 0 0 0 0 0 0 0 0 0
0 0 0 0 0 0 0 0 0 0 0 0 0 0 0 0 0 0 0 0 0 0 0 0 0 0 0 0 0 0 0 0 0 0 0 0 0 0 0 0 0 0 0 0 0 0 0 0 0 0 0 0 0 0 0 0
1 7 10 0 1 18 6 0 9 4 54 7 23 6 135 5 4 5 0 2 0 9 12 16 8 14 2 4 5 18 382 7 5 20 1 17 0 34 145
27 0 1 4 7 0 8 5 25 6 5 7 0 0 6 331
2,387
0 0 0 0 0 0 0 0 0 0 0 0 0 0 0 0 0 0 0 0 0 0 0 0 0 0 0 0 0 0 0 0 0 0 0 0 0 0 0 0 0 0 0 0 0 0 0 0 0 0 0 0 0 0 0 0
0 0 0 0 0 0 0 0 0 0 0 0 0 0 0 0 0 0 0 0 0 0 0 0 0 0 0 0 0 0 0 0 0 0 0 0 0 0 0 0 0 0 0 0 0 0 0 0 0 0 0 0 0 0 0 0
Zone 1
Zone 2A
Zone 2B
Zone 3
Zone 4
0 0 0 0 0 0 0 0 0 0 0 0 0 0 0 0 0 0 0 0 0 0 0 0 0 0 0 0 0 0 0 0 0 0 0 0 0 0 0 0 0 0 0 0 0 0 0 0 0 0 0 0 0 0 0 0
0 0 0 0 0 0 0 0 0 0 0 0 0 0 0 0 0 0 0 0 0 0 0 0 0 0 0 0 0 0 0 0 0 0 0 0 0 0 0 0 0 0 0 0 0 0 0 0 0 0 0 0 0 0 0 0
0 0 0 5 0 0 0 0 0 0 0 0 3 10 0 0 0 0 0 0 0 0 13 0 0 0 4 0 0 0 34 4 3 0 0 0 0 0 0 30 0 4 0 0 0 0 0 0 0 4 0 0 2 0 46 168
0 0 0 0 0 0 0 0 0 0 0 0 0 0 0 0 0 0 0 0 0 0 0 0 0 0 0 0 0 0 0 0 0 0 0 0 0 0 0 0 0 0 0 0 0 0 0 0 0 0 0 0 0 0 0 0
0 0 0 0 0 0 0 0 0 0 0 0 0 0 0 0 0 0 0 0 0 0 0 0 0 0 0 0 0 0 0 0 0 0 0 0 0 0 0 0 0 0 0 0 0 0 0 0 0 0 0 0 0 0 0 0
CRIT
ICAL
INFR
ASTR
UCTU
RESN
GPL
(GAS
PIP
ELIN
E)(k
m)
OTHE
R
Zone 1
Zone 2A
Zone 2B
Zone 3
Zone 4
0 0 0 0 0 0 0 0 0 0 0 0 0 0 0 0 0 0 0 0 0 0 0 0 0 0 0 0 0 0 0 0 0 0 0 0 0 0 0 0 0 0 0 0 0 0 0 0 0 0 0 0 0 0 0 0
0 0 0 0 0 0 0 0 0 0 0 0 0 0 0 0 0 0 0 0 0 0 0 0 0 0 0 0 0 0 0 0 0 0 0 0 0 0 0 0 0 0 0 0 0 0 0 0 0 0 0 0 0 0 0 0
8 16 0 6 10 14 0 14 0 8 0 1 0 0 0 10 9 10 7 22 9 12 1 10 5 6 10 9 0 0 199 7 31 9 6 8 16 14 0 50 12 25 7 19 37 14 32 21 14 5 19 9 0 16 371
850
0 0 0 0 0 0 0 0 0 0 0 0 0 0 0 0 0 0 0 0 0 0 0 0 0 0 0 0 0 0 0 0 0 0 0 0 0 0 0 0 0 0 0 0 0 0 0 0 0 0 0 0 0 0 0 0
0 0 0 0 0 0 0 0 0 0 0 0 0 0 0 0 0 0 0 0 0 0 0 0 0 0 0 0 0 0 0 0 0 0 0 0 0 0 0 0 0 0 0 0 0 0 0 0 0 0 0 0 0 0 0 0
Zone 1
Zone 2A
Zone 2B
Zone 3
Zone 4
0 0 0 0 0 0 0 0 0 0 0 0 0 0 0 0 0 0 0 0 0 0 0 0 0 0 0 0 0 0 0 0 0 0 0 0 0 0 0 0 0 0 0 0 0 0 0 0 0 0 0 0 0 0 0 0
0 0 0 0 0 0 0 0 0 0 0 0 0 0 0 0 0 0 0 0 0 0 0 0 0 0 0 0 0 0 0 0 0 0 0 0 0 0 0 0 0 0 0 0 0 0 0 0 0 0 0 0 0 0 0 0
0 0 0 0 0 0 0 0 0 0 0 0 0 0 0 0 0 0 0 0 0 0 1 0 0 0 0 0 0 0 1 0 0 0 0 0 0 0 0 0 0 0 0 0 0 0 0 0 0 0 0 0 0 0 0 2
0 0 0 0 0 0 0 0 0 0 0 0 0 0 0 0 0 0 0 0 0 0 0 0 0 0 0 0 0 0 0 0 0 0 0 0 0 0 0 0 0 0 0 0 0 0 0 0 0 0 0 0 0 0 0 0
0 0 0 0 0 0 0 0 0 0 0 0 0 0 0 0 0 0 0 0 0 0 0 0 0 0 0 0 0 0 0 0 0 0 0 0 0 0 0 0 0 0 0 0 0 0 0 0 0 0 0 0 0 0 0 0
EDUC
ATIO
N F
ACIL
ITIE
S S
CHOO
LSN
UMBE
R OF
TEA
CHER
S
Zone 1
Zone 2A
Zone 2B
Zone 3
Zone 4
0 0 0 0 0 0 0 0 0 0 0 0 0 0 0 0 0 0 0 0 0 0 0 0 0 0 0 0 0 0 0 0 0 0 0 0 0 0 0 0 0 0 0 0 0 0 0 0 0 0 0 0 0 0 0 0
0 0 0 0 0 0 0 0 0 0 0 0 0 0 0 0 0 0 0 0 0 0 0 0 0 0 0 0 0 0 0 0 0 0 0 0 0 0 0 0 0 0 0 0 0 0 0 0 0 0 0 0 0 0 0 0
24 21 47 53 21 28 23 32 20 30 53 37 74 48 7 37 30 26 39 22 21 29 112
32 24 24 38 25 26 36 1,039 24 24 33 15 42 35 29 13 106
23 34 20 21 8 45 20 29 31 16 41 40 14 28 691
3,249
0 0 0 0 0 0 0 0 0 0 0 0 0 0 0 0 0 0 0 0 0 0 0 0 0 0 0 0 0 0 0 0 0 0 0 0 0 0 0 0 0 0 0 0 0 0 0 0 0 0 0 0 0 0 0 0
0 0 0 0 0 0 0 0 0 0 0 0 0 0 0 0 0 0 0 0 0 0 0 0 0 0 0 0 0 0 0 0 0 0 0 0 0 0 0 0 0 0 0 0 0 0 0 0 0 0 0 0 0 0 0 0
Zone 1
Zone 2A
Zone 2B
Zone 3
Zone 4
0 0 0 0 0 0 0 0 0 0 0 0 0 0 0 0 0 0 0 0 0 0 0 0 0 0 0 0 0 0 0 0 0 0 0 0 0 0 0 0 0 0 0 0 0 0 0 0 0 0 0 0 0 0 0 0
0 0 0 0 0 0 0 0 0 0 0 0 0 0 0 0 0 0 0 0 0 0 0 0 0 0 0 0 0 0 0 0 0 0 0 0 0 0 0 0 0 0 0 0 0 0 0 0 0 0 0 0 0 0 0 0
2,630
1,466
6,937
6,144
2,061
1,640
1,646
2,169
1,334
2,565
2,972
2,951
6,098
3,511
410
2,572
1,979
2,669
3,281
1,800
2,108
2,784
18,73
0
2,694
1,762
2,060
2,518
1,933
2,545
2,337
96,30
6
2,401
5,012
2,879
967
2,562
2,215
1,932
590
10,88
1
1,865
2,704
1,404
1,970
2,372
3,213
2,599
3,117
1,620
1,198
3,551
4,444
1,117
2,418
63,03
1
260,6
72
0 0 0 0 0 0 0 0 0 0 0 0 0 0 0 0 0 0 0 0 0 0 0 0 0 0 0 0 0 0 0 0 0 0 0 0 0 0 0 0 0 0 0 0 0 0 0 0 0 0 0 0 0 0 0 0
0 0 0 0 0 0 0 0 0 0 0 0 0 0 0 0 0 0 0 0 0 0 0 0 0 0 0 0 0 0 0 0 0 0 0 0 0 0 0 0 0 0 0 0 0 0 0 0 0 0 0 0 0 0 0 0
Zone 1
Zone 2A
Zone 2B
Zone 3
Zone 4
0 0 0 0 0 0 0 0 0 0 0 0 0 0 0 0 0 0 0 0 0 0 0 0 0 0 0 0 0 0 0 0 0 0 0 0 0 0 0 0 0 0 0 0 0 0 0 0 0 0 0 0 0 0 0 0
0 0 0 0 0 0 0 0 0 0 0 0 0 0 0 0 0 0 0 0 0 0 0 0 0 0 0 0 0 0 0 0 0 0 0 0 0 0 0 0 0 0 0 0 0 0 0 0 0 0 0 0 0 0 0 0
1,574
686
5,333
6,023
1,467
917
874
1,311
930
1,965
1,503
2,646
4,687
3,678
143
1,272
2,511
2,634
1,990
1,029
1,554
1,593
18,20
1
1,410
899
985
1,750
1,215
2,749
2,114
75,64
3
1,875
2,999
1,404
450
2,016
1,563
909
416
11,79
7
959
1,943
1,882
571
310
2,196
1,483
854
747
627
2,215
2,973
776
1,734
42,69
9
205,7
05
0 0 0 0 0 0 0 0 0 0 0 0 0 0 0 0 0 0 0 0 0 0 0 0 0 0 0 0 0 0 0 0 0 0 0 0 0 0 0 0 0 0 0 0 0 0 0 0 0 0 0 0 0 0 0 0
0 0 0 0 0 0 0 0 0 0 0 0 0 0 0 0 0 0 0 0 0 0 0 0 0 0 0 0 0 0 0 0 0 0 0 0 0 0 0 0 0 0 0 0 0 0 0 0 0 0 0 0 0 0 0 0
Zone 1
Zone 2A
Zone 2B
Zone 3
Zone 4
0 0 0 0 0 0 0 0 0 0 0 0 0 0 0 0 0 0 0 0 0 0 0 0 0 0 0 0 0 0 0 0 0 0 0 0 0 0 0 0 0 0 0 0 0 0 0 0 0 0 0 0 0 0 0 0
0 0 0 0 0 0 0 0 0 0 0 0 0 0 0 0 0 0 0 0 0 0 0 0 0 0 0 0 0 0 0 0 0 0 0 0 0 0 0 0 0 0 0 0 0 0 0 0 0 0 0 0 0 0 0 0
100
51 451
374
104
59 89 100
78 159
154
180
366
214
17 98 118
159
142
73 100
117
1,144
102
60 73 118
79 173
154
5,206
145
181
113
41 151
101
80 24 687
82 154
76 68 41 159
85 83 63 44 150
193
53 107
2,881
13,52
8
0 0 0 0 0 0 0 0 0 0 0 0 0 0 0 0 0 0 0 0 0 0 0 0 0 0 0 0 0 0 0 0 0 0 0 0 0 0 0 0 0 0 0 0 0 0 0 0 0 0 0 0 0 0 0 0
0 0 0 0 0 0 0 0 0 0 0 0 0 0 0 0 0 0 0 0 0 0 0 0 0 0 0 0 0 0 0 0 0 0 0 0 0 0 0 0 0 0 0 0 0 0 0 0 0 0 0 0 0 0 0 0
NUM
BER
OF S
TUDE
NTS
BOYS
GIRL
S
72
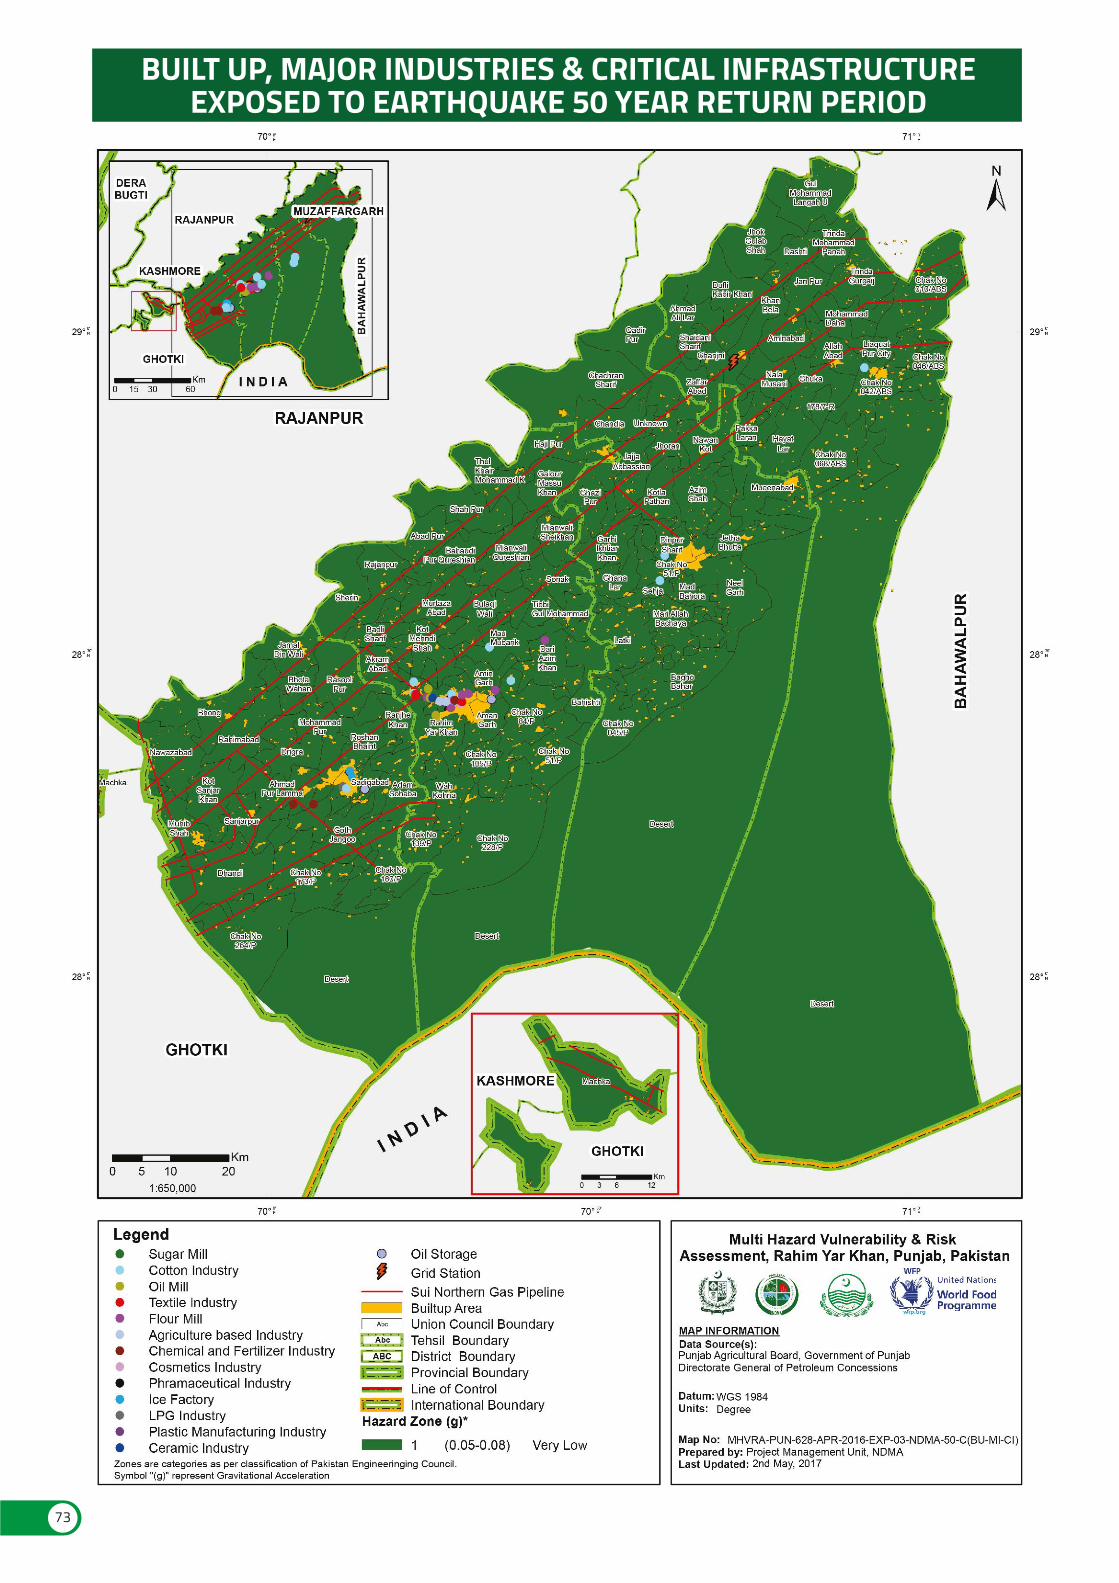
73
BUILT UP, MAJOR INDUSTRIES & CRITICAL INFRASTRUCTUREEXPOSED TO EARTHQUAKE 50 YEAR RETURN PERIOD
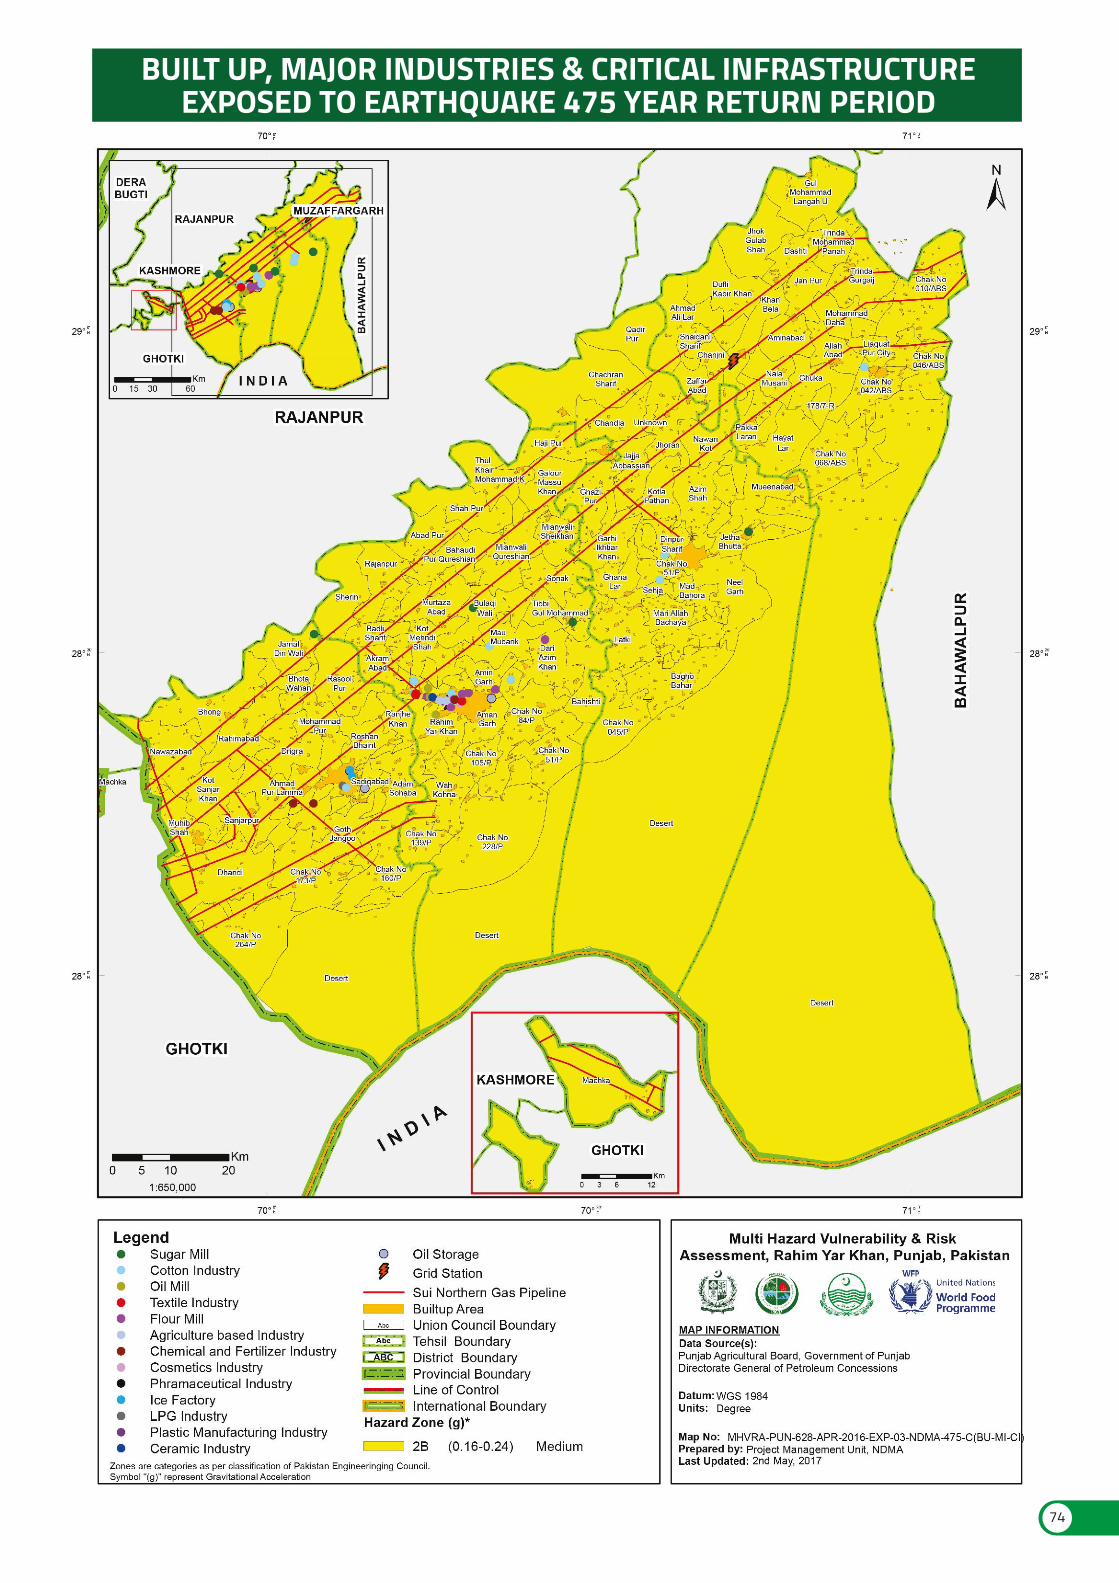
BUILT UP, MAJOR INDUSTRIES & CRITICAL INFRASTRUCTUREEXPOSED TO EARTHQUAKE 475 YEAR RETURN PERIOD
74
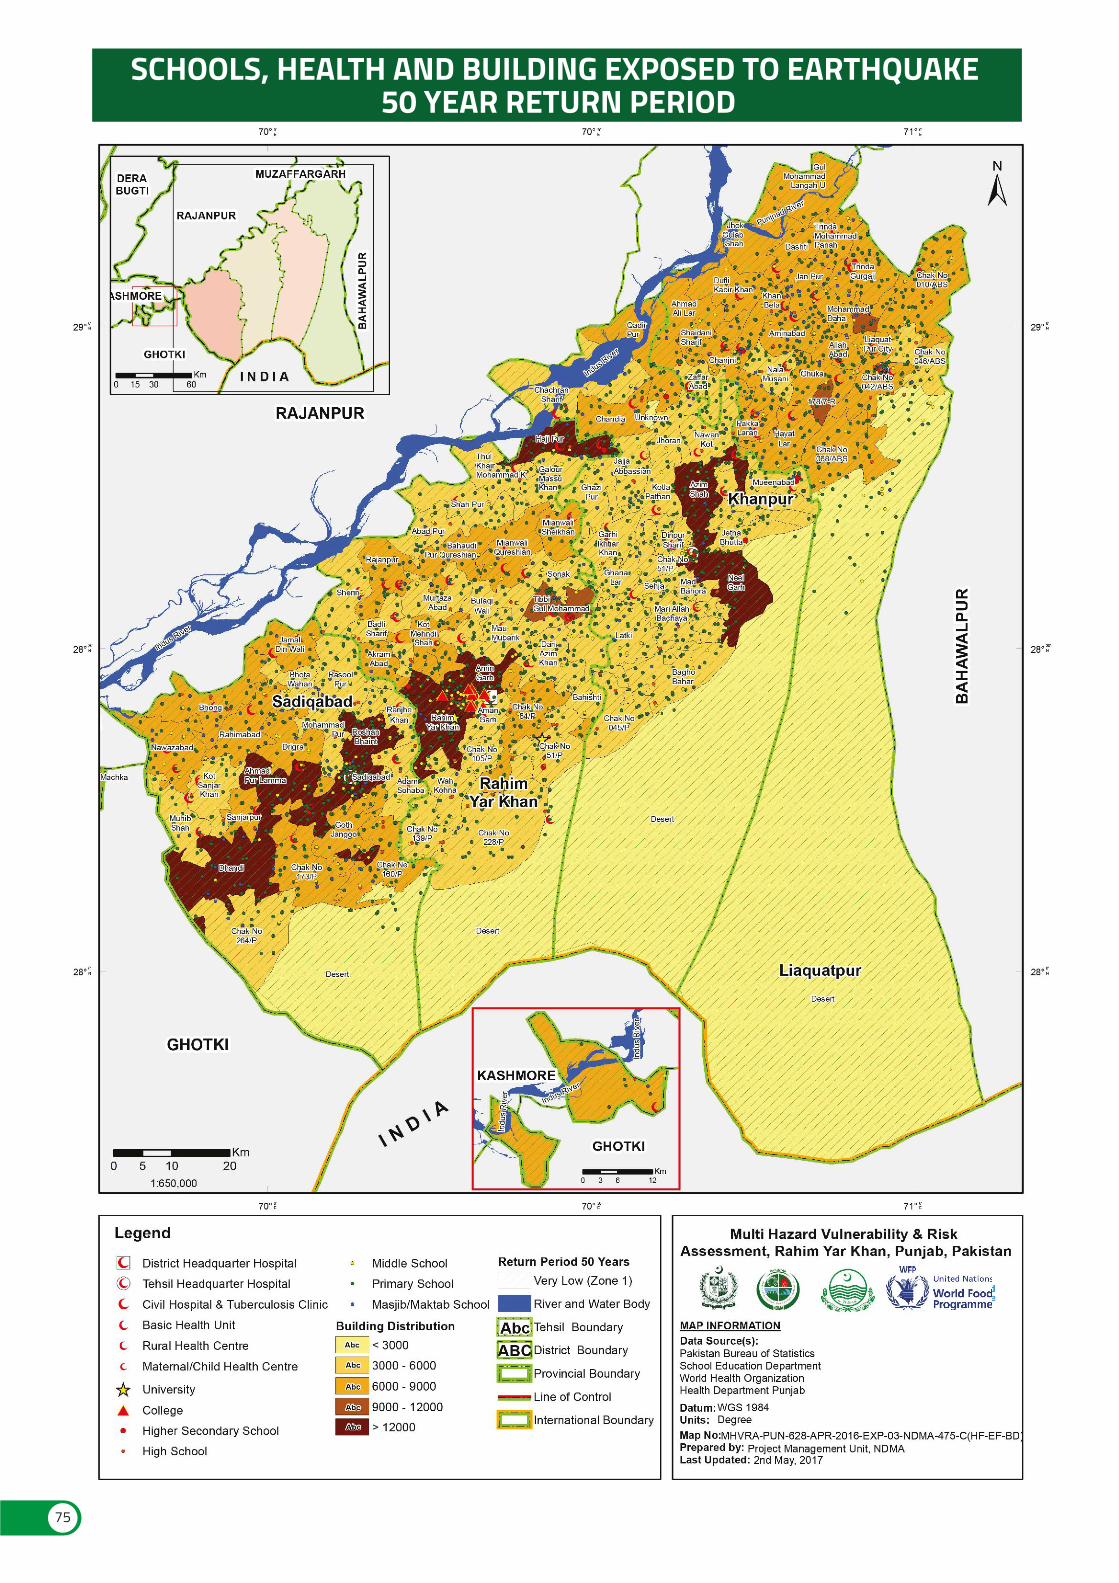
75
SCHOOLS, HEALTH AND BUILDING EXPOSED TO EARTHQUAKE 50 YEAR RETURN PERIOD
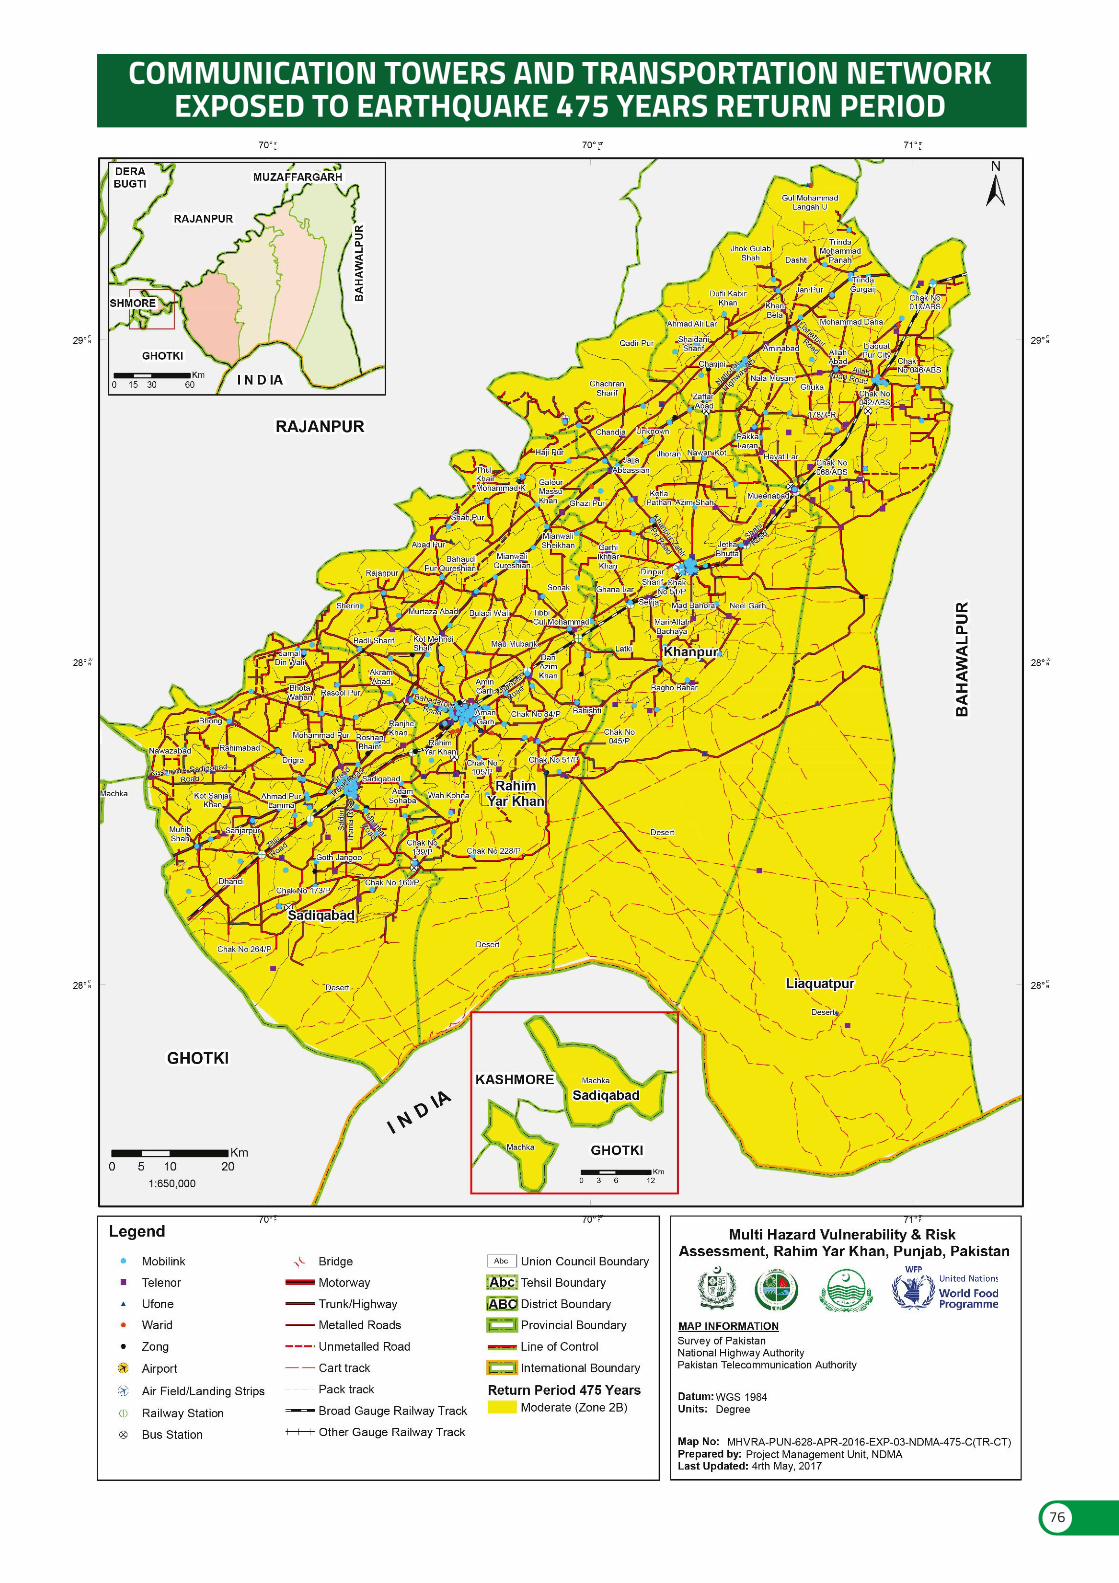
COMMUNICATION TOWERS AND TRANSPORTATION NETWORKEXPOSED TO EARTHQUAKE 475 YEARS RETURN PERIOD
76
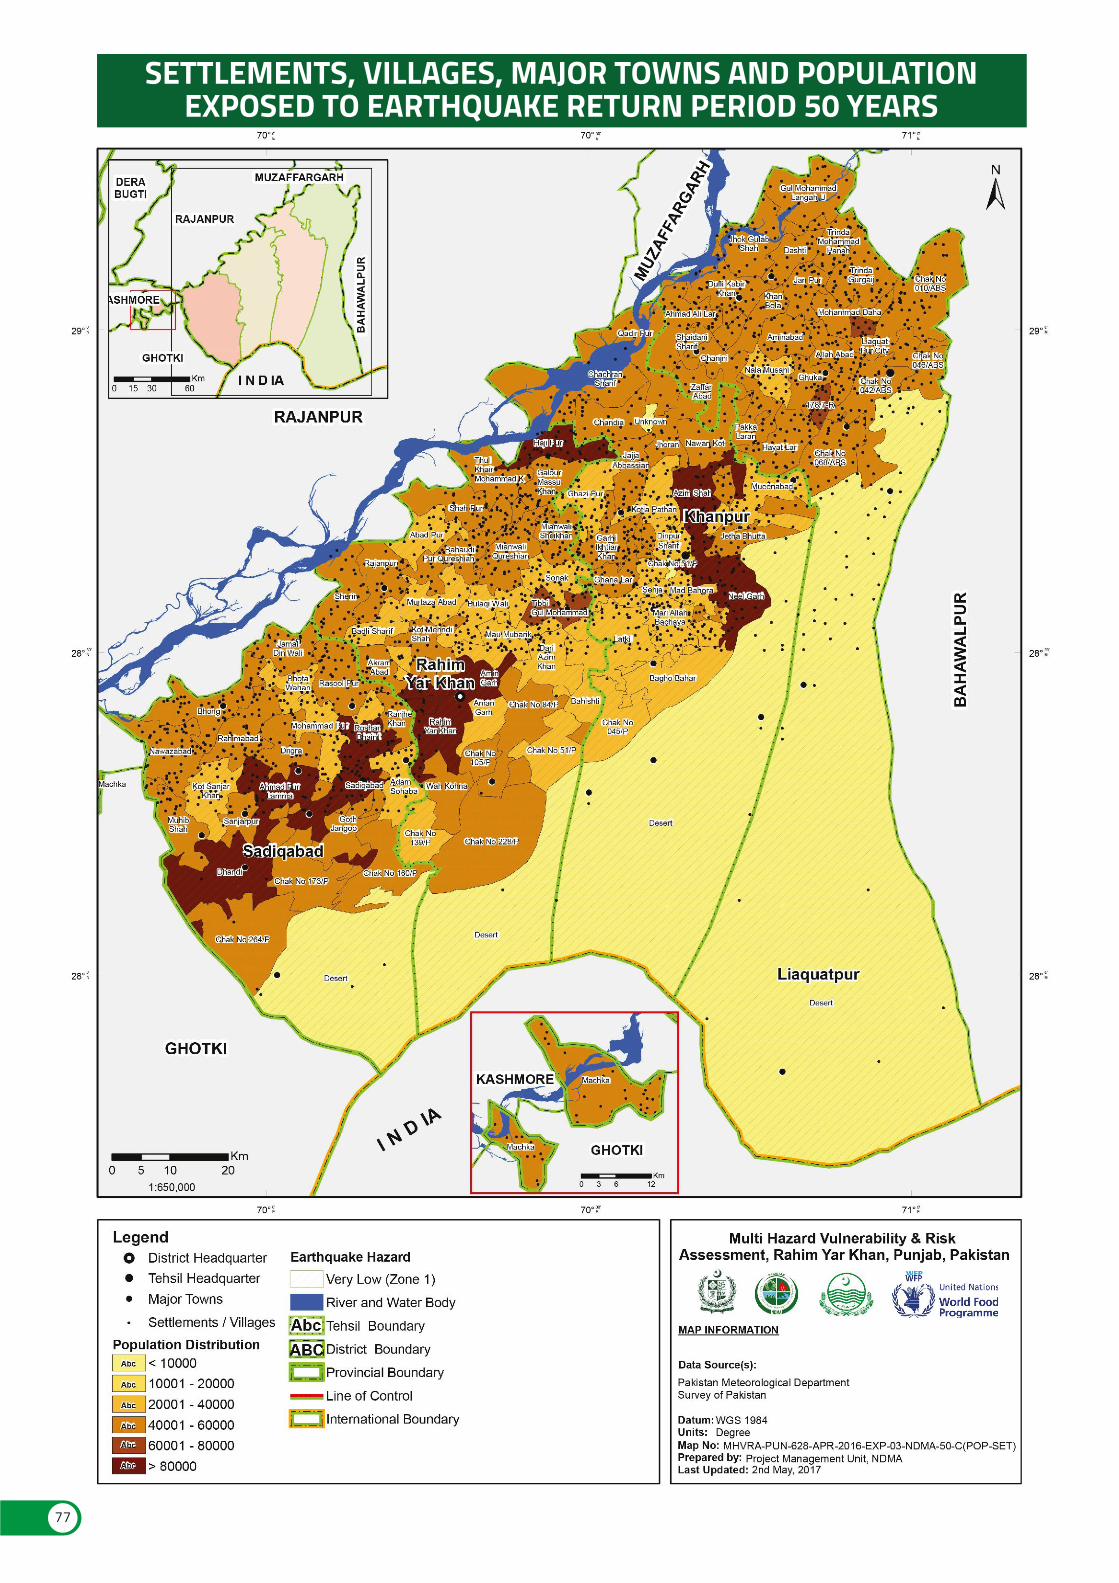
SETTLEMENTS, VILLAGES, MAJOR TOWNS AND POPULATIONEXPOSED TO EARTHQUAKE RETURN PERIOD 50 YEARS
77
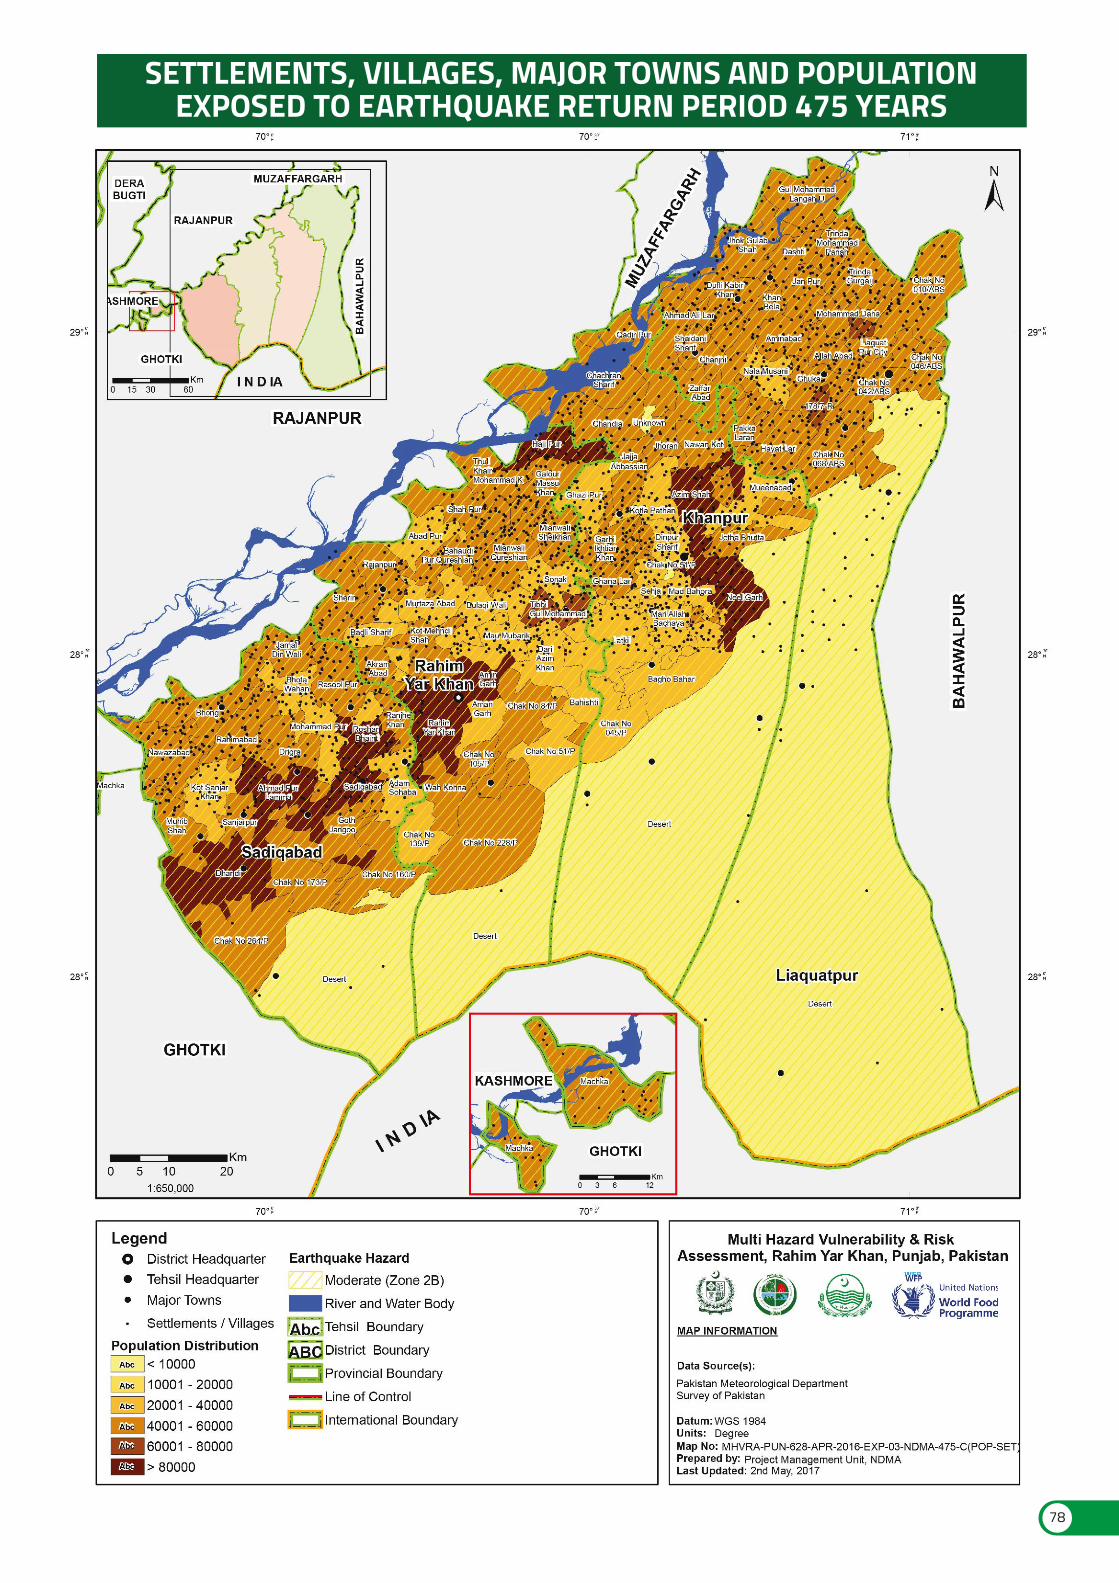
SETTLEMENTS, VILLAGES, MAJOR TOWNS AND POPULATIONEXPOSED TO EARTHQUAKE RETURN PERIOD 475 YEARS
78
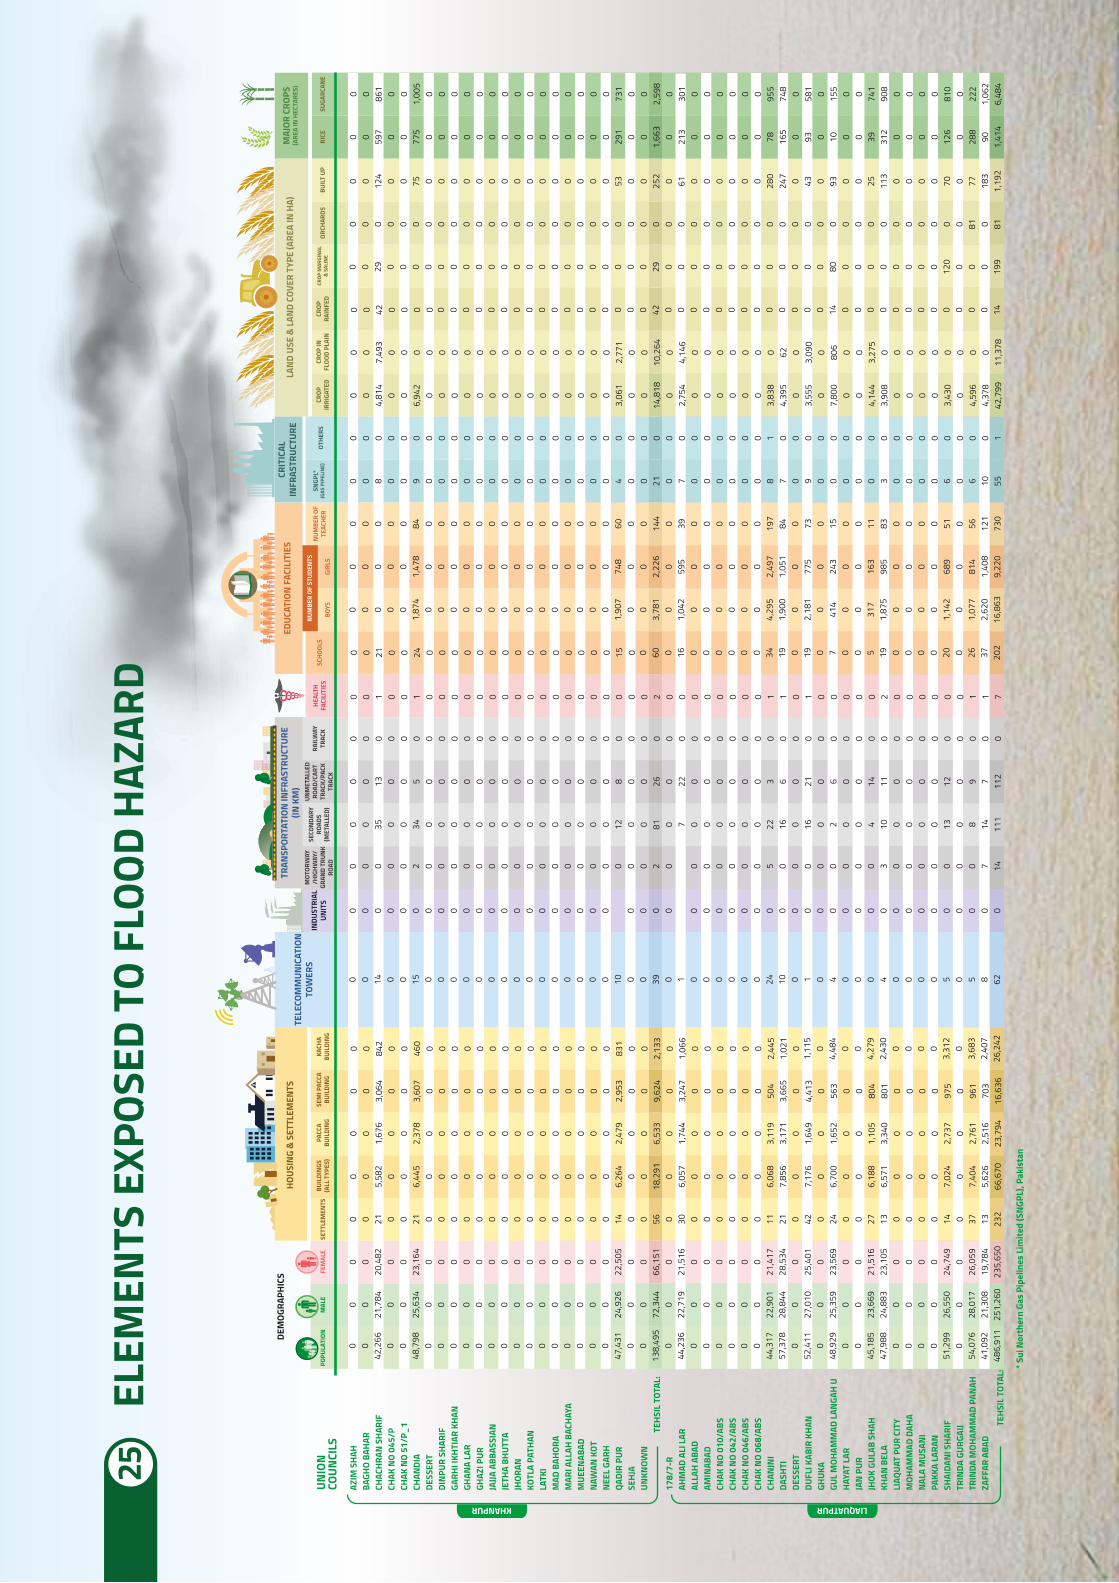
ELEM
ENTS
EXP
OSED
TO
FLOO
D HA
ZARD
25
AZIM
SHA
HBA
GHO
BAHA
RCH
ACHR
AN S
HARI
FCH
AK N
O 04
5/P
CHAK
NO
51/P
_1CH
ANDI
ADE
SSER
TDI
NPU
R SH
ARIF
GARH
I IKH
TIAR
KHA
NGH
ANA
LAR
GHAZ
I PUR
JAJJA
ABB
ASSI
ANJE
THA
BHUT
TAJH
ORAN
KOTL
A PA
THAN
LATK
IM
AD B
AHOR
AM
ARI A
LLAH
BAC
HAYA
MUE
ENAB
ADN
AWAN
KOT
NEE
L GA
RHQA
DIR
PUR
SEHJ
AUN
KNOW
N
178/
7-R
AHM
AD A
LI L
ARAL
LAH
ABAD
AMIN
ABAD
CHAK
NO
010/
ABS
CHAK
NO
042/
ABS
CHAK
NO
046/
ABS
CHAK
NO
068/
ABS
CHAN
JNI
DASH
TIDE
SSER
TDU
FLI K
ABIR
KHA
NGH
UKA
GUL
MOH
AMM
AD L
ANGA
H U
HAYA
T LA
RJA
N P
URJH
OK G
ULAB
SHA
HKH
AN B
ELA
LIAQ
UAT
PUR
CITY
MOH
AMM
AD D
AHA
NAL
A M
USAN
IPA
KKA
LARA
NSH
AIDA
NI S
HARI
FTR
INDA
GUR
GAIJ
TRIN
DA M
OHAM
MAD
PAN
AHZA
FFAR
ABA
D
UNIO
NCO
UNCI
LS
KHANPUR LIAQUATPUR
POPU
LATI
ONM
ALE
FEM
ALE
SETT
LEM
ENTS
BUIL
DIN
GS(A
LL T
YPES
)PA
CCA
BUIL
DIN
G
HOUS
ING
& S
ETTL
EMEN
TSDE
MOG
RAPH
ICS
TELE
COM
MUN
ICAT
ION
TOW
ERS
TRAN
SPOR
TATI
ON IN
FRAS
TRUC
TURE
(IN K
M)
EDUC
ATIO
N F
ACIL
ITIE
SCR
ITIC
ALIN
FRAS
TRUC
TURE
LAN
D US
E &
LAN
D CO
VER
TYPE
(ARE
A IN
HA)
MAJ
OR C
ROPS
(ARE
A IN
HEC
TARE
S)
SEM
I PAC
CABU
ILDI
NG
KACH
ABU
ILDI
NG
INDU
STRI
ALUN
ITS
MOT
ORW
AY/H
IGHW
AY/
GRAN
D TR
UNK
ROAD
SECO
NDA
RYRO
ADS
(MET
ALLE
D)
UNM
ETAL
LED
ROAD
/CAR
TTR
ACK/
PACK
TRAC
K
RAIL
WAY
TRAC
KHE
ALTH
FACI
LITI
ESSC
HOOL
SN
UMBE
R OF
TEAC
HER
SNGP
L*(G
AS P
IPEL
INE)
OTHE
RSCR
OPIR
RIGA
TED
CROP
INFL
OOD
PLAI
NCR
OPRA
INFE
DCR
OP M
ARGI
NAL
& S
ALIN
EOR
CHAR
DSBU
ILT
UPRI
CESU
GARC
ANE
BOYS
NUM
BER
OF S
TUDE
NTS
GIRL
S
0 042
,266 0 0
48,7
98 0 0 0 0 0 0 0 0 0 0 0 0 0 0 047
,431 0 0
138,
495
044
,236 0 0 0 0 0 0
44,3
1757
,378 0
52,4
11 048
,929 0 0
45,1
8547
,988 0 0 0 0
51,2
99 054
,076
41,0
9248
6,91
1
0 021
,784 0 0
25,6
34 0 0 0 0 0 0 0 0 0 0 0 0 0 0 024
,926 0 0
72,3
44 022
,719 0 0 0 0 0 0
22,9
0128
,844 0
27,0
10 025
,359 0 0
23,6
6924
,883 0 0 0 0
26,5
50 028
,017
21,3
0825
1,26
0
0 020
,482 0 0
23,1
64 0 0 0 0 0 0 0 0 0 0 0 0 0 0 022
,505 0 0
66,1
51 021
,516 0 0 0 0 0 0
21,4
1728
,534 0
25,4
01 023
,569 0 0
21,5
1623
,105 0 0 0 0
24,7
49 026
,059
19,7
8423
5,65
0
0 0 21 0 0 21 0 0 0 0 0 0 0 0 0 0 0 0 0 0 0 14 0 0 56 0 30 0 0 0 0 0 0 11 21 0 42 0 24 0 0 27 13 0 0 0 0 14 0 37 13 232
0 05,
582
0 06,
445
0 0 0 0 0 0 0 0 0 0 0 0 0 0 06,
264
0 018
,291 0
6,05
70 0 0 0 0 0
6,06
87,
856
07,
176
06,
700
0 06,
188
6,57
10 0 0 0
7,02
40
7,40
45,
626
66,6
70
0 01,
676
0 02,
378
0 0 0 0 0 0 0 0 0 0 0 0 0 0 02,
479
0 06,
533
01,
744
0 0 0 0 0 03,
119
3,17
10
1,64
90
1,65
20 0
1,10
53,
340
0 0 0 02,
737
02,
761
2,51
623
,794
0 03,
064
0 03,
607
0 0 0 0 0 0 0 0 0 0 0 0 0 0 02,
953
0 09,
624
03,
247
0 0 0 0 0 0 504
3,66
50
4,41
30 56
3 0 0 804
801 0 0 0 0 975 0 961
703
16,6
36
0 0 842 0 0 460 0 0 0 0 0 0 0 0 0 0 0 0 0 0 0 831 0 0
2,13
30
1,06
60 0 0 0 0 0
2,44
51,
021
01,
115
04,
484
0 04,
279
2,43
00 0 0 0
3,31
20
3,68
32,
407
26,2
42
0 0 14 0 0 15 0 0 0 0 0 0 0 0 0 0 0 0 0 0 0 10 0 0 39 0 1 0 0 0 0 0 0 24 10 0 1 0 4 0 0 0 4 0 0 0 0 5 0 5 8 62
0 0 0 0 0 0 0 0 0 0 0 0 0 0 0 0 0 0 0 0 0 0 0 0 0 0 0 0 0 0 0 0 0 0 0 0 0 0 0 0 0 0 0 0 0 0 0 0 0 0
0 0 0 0 0 2 0 0 0 0 0 0 0 0 0 0 0 0 0 0 0 0 0 0 2 0 0 0 0 0 0 0 5 0 0 0 0 0 0 0 0 3 0 0 0 0 0 0 0 7 14
0 0 35 0 0 34 0 0 0 0 0 0 0 0 0 0 0 0 0 0 0 12 0 0 81 0 7 0 0 0 0 0 0 22 16 0 16 0 2 0 0 4 10 0 0 0 0 13 0 8 14 111
0 0 13 0 0 5 0 0 0 0 0 0 0 0 0 0 0 0 0 0 0 8 0 0 26 0 22 0 0 0 0 0 0 3 6 0 21 0 6 0 0 14 11 0 0 0 0 12 0 9 7 112
0 0 0 0 0 0 0 0 0 0 0 0 0 0 0 0 0 0 0 0 0 0 0 0 0 0 0 0 0 0 0 0 0 0 0 0 0 0 0 0 0 0 0 0 0 0 0 0 0 0 0 0
0 0 1 0 0 1 0 0 0 0 0 0 0 0 0 0 0 0 0 0 0 0 0 0 2 0 0 0 0 0 0 0 0 1 1 0 1 0 0 0 0 0 2 0 0 0 0 0 0 1 1 7
0 0 21 0 0 24 0 0 0 0 0 0 0 0 0 0 0 0 0 0 0 15 0 0 60 0 16 0 0 0 0 0 0 34 19 0 19 0 7 0 0 5 19 0 0 0 0 20 0 26 37 202
0 0 0 0 01,
874
0 0 0 0 0 0 0 0 0 0 0 0 0 0 01,
907
0 03,
781
01,
042
0 0 0 0 0 04,
295
1,90
00
2,18
10 41
4 0 0 317
1,87
50 0 0 0
1,14
20
1,07
72,
620
16,8
63
0 0 0 0 01,
478
0 0 0 0 0 0 0 0 0 0 0 0 0 0 0 748 0 0
2,22
60 59
5 0 0 0 0 0 02,
497
1,05
10 77
5 0 243 0 0 163
985 0 0 0 0 689 0 814
1,40
89,
220
0 0 0 0 0 84 0 0 0 0 0 0 0 0 0 0 0 0 0 0 0 60 0 0 144 0 39 0 0 0 0 0 0 197
84 0 73 0 15 0 0 11 83 0 0 0 0 51 0 56 121
730
0 0 8 0 0 9 0 0 0 0 0 0 0 0 0 0 0 0 0 0 0 4 0 0 21 0 7 0 0 0 0 0 0 8 7 0 9 0 0 0 0 0 3 0 0 0 0 6 0 6 10 55
0 0 0 0 0 0 0 0 0 0 0 0 0 0 0 0 0 0 0 0 0 0 0 0 0 0 0 0 0 0 0 0 0 1 0 0 0 0 0 0 0 0 0 0 0 0 0 0 0 0 0 1
0 04,
814
0 06,
942
0 0 0 0 0 0 0 0 0 0 0 0 0 0 03,
061
0 014
,818 0
2,75
40 0 0 0 0 0
3,83
84,
395
03,
555
07,
800
0 04,
144
3,90
80 0 0 0
3,43
00
4,59
64,
378
42,7
99
0 07,
493
0 0 0 0 0 0 0 0 0 0 0 0 0 0 0 0 0 02,
771
0 010
,264 0
4,14
60 0 0 0 0 0 0 62 0
3,09
00 80
6 0 03,
275
0 0 0 0 0 0 0 0 011
,378
0 0 42 0 0 0 0 0 0 0 0 0 0 0 0 0 0 0 0 0 0 0 0 0 42 0 0 0 0 0 0 0 0 0 0 0 0 0 14 0 0 0 0 0 0 0 0 0 0 0 0 14
0 0 29 0 0 0 0 0 0 0 0 0 0 0 0 0 0 0 0 0 0 0 0 0 29 0 0 0 0 0 0 0 0 0 0 0 0 0 80 0 0 0 0 0 0 0 0 120 0 0 0 199
0 0 0 0 0 0 0 0 0 0 0 0 0 0 0 0 0 0 0 0 0 0 0 0 0 0 0 0 0 0 0 0 0 0 0 0 0 0 0 0 0 0 0 0 0 0 0 0 0 81 0 81
0 0 124 0 0 75 0 0 0 0 0 0 0 0 0 0 0 0 0 0 0 53 0 0 252 0 61 0 0 0 0 0 0 280
247 0 43 0 93 0 0 25 113 0 0 0 0 70 0 77 183
1,19
2
0 0 597 0 0 775 0 0 0 0 0 0 0 0 0 0 0 0 0 0 0 291 0 0
1,66
30 21
3 0 0 0 0 0 0 78 165 0 93 0 10 0 0 39 312 0 0 0 0 126 0 288
90 1,41
4
0 0 861 0 0
1,00
50 0 0 0 0 0 0 0 0 0 0 0 0 0 0 73
1 0 02,
598
0 301 0 0 0 0 0 0 955
748 0 581 0 155 0 0 741
908 0 0 0 0 810 0 222
1,06
26,
484
* Sui
Nor
ther
n Ga
s Pi
pelin
es L
imite
d (S
NGP
L), P
akis
tan
TEHS
IL T
OTAL
:
TEHS
IL T
OTAL
:
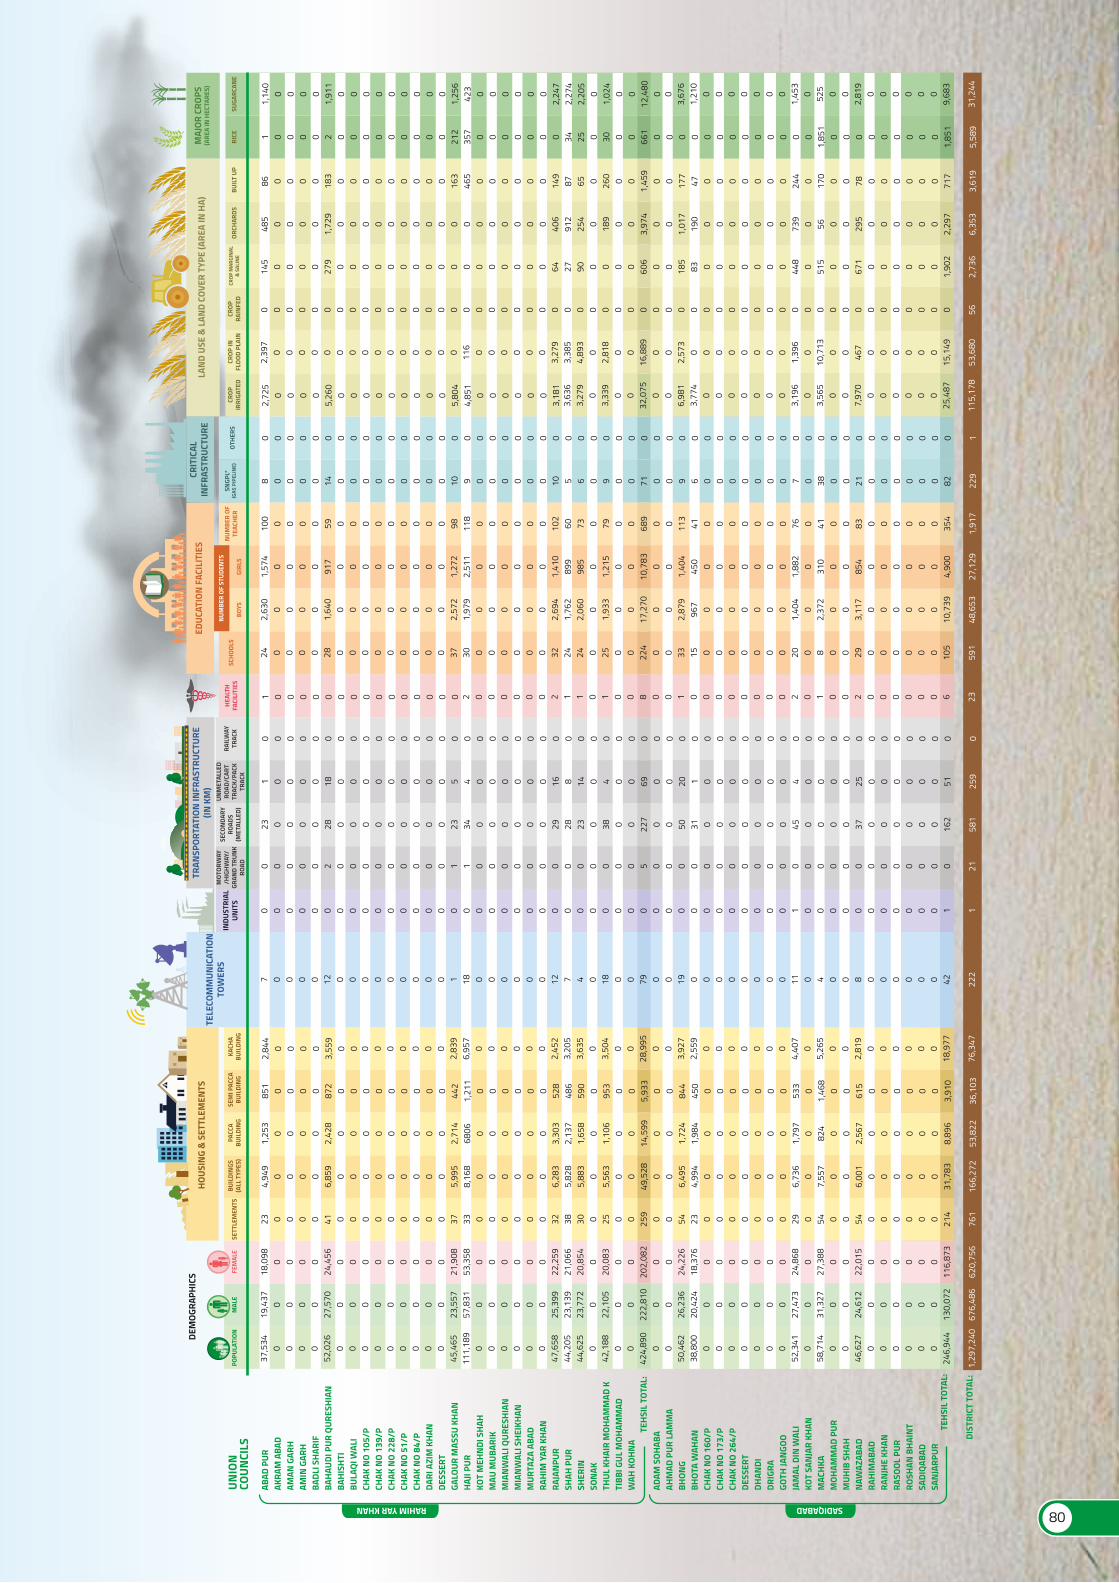
ABAD
PUR
AKRA
M A
BAD
AMAN
GAR
HAM
IN G
ARH
BADL
I SHA
RIF
BAHA
UDI P
UR Q
URES
HIAN
BAHI
SHTI
BULA
QI W
ALI
CHAK
NO
105/
PCH
AK N
O 13
9/P
CHAK
NO
228/
PCH
AK N
O 51
/PCH
AK N
O 84
/PDA
RI A
ZIM
KHA
NDE
SSER
TGA
LOUR
MAS
SU K
HAN
HAJI
PUR
KOT
MEH
NDI
SHA
HM
AU M
UBAR
IKM
IAN
WAL
I QUR
ESHI
ANM
IAN
WAL
I SHE
IKHA
NM
URTA
ZA A
BAD
RAHI
M Y
AR K
HAN
RAJA
NPU
RSH
AH P
URSH
ERIN
SON
AKTH
UL K
HAIR
MOH
AMM
AD K
TIBB
I GUL
MOH
AMM
ADW
AH K
OHN
A
ADAM
SOH
ABA
AHM
AD P
UR L
AMM
ABH
ONG
BHOT
A W
AHAN
CHAK
NO
160/
PCH
AK N
O 17
3/P
CHAK
NO
264/
PDE
SSER
TDH
ANDI
DRIG
RAGO
TH JA
NGO
OJA
MAL
DIN
WAL
IKO
T SA
NJA
R KH
ANM
ACHK
AM
OHAM
MAD
PUR
MUH
IB S
HAH
NAW
AZAB
ADRA
HIM
ABAD
RAN
JHE
KHAN
RASO
OL P
URRO
SHAN
BHA
INT
SADI
QABA
DSA
NJA
RPUR
UNIO
NCO
UNCI
LS
RAHIM YAR KHAN SADIQABAD
POPU
LATI
ONM
ALE
FEM
ALE
SETT
LEM
ENTS
BUIL
DIN
GS(A
LL T
YPES
)PA
CCA
BUIL
DIN
G
HOUS
ING
& S
ETTL
EMEN
TSDE
MOG
RAPH
ICS
TELE
COM
MUN
ICAT
ION
TOW
ERS
TRAN
SPOR
TATI
ON IN
FRAS
TRUC
TURE
(IN K
M)
EDUC
ATIO
N F
ACIL
ITIE
SCR
ITIC
ALIN
FRAS
TRUC
TURE
LAN
D US
E &
LAN
D CO
VER
TYPE
(ARE
A IN
HA)
MAJ
OR C
ROPS
(ARE
A IN
HEC
TARE
S)
SEM
I PAC
CABU
ILDI
NG
KACH
ABU
ILDI
NG
INDU
STRI
ALUN
ITS
MOT
ORW
AY/H
IGHW
AY/
GRAN
D TR
UNK
ROAD
SECO
NDA
RYRO
ADS
(MET
ALLE
D)
UNM
ETAL
LED
ROAD
/CAR
TTR
ACK/
PACK
TRAC
K
RAIL
WAY
TRAC
KHE
ALTH
FACI
LITI
ESSC
HOOL
SN
UMBE
R OF
TEAC
HER
SNGP
L*(G
AS P
IPEL
INE)
OTHE
RSCR
OPIR
RIGA
TED
CROP
INFL
OOD
PLAI
NCR
OPRA
INFE
DCR
OP M
ARGI
NAL
& S
ALIN
EOR
CHAR
DSBU
ILT
UPRI
CESU
GARC
ANE
BOYS
NUM
BER
OF S
TUDE
NTS
GIRL
S
37,5
34 0 0 0 052
,026 0 0 0 0 0 0 0 0 0
45,4
6511
1,18
90 0 0 0 0 0
47,6
5844
,205
44,6
25 042
,188 0 0
424,
890
0 050
,462
38,8
00 0 0 0 0 0 0 052
,341 0
58,7
14 0 046
,627 0 0 0 0 0 0
246,
944
1,29
7,24
0
19,4
37 0 0 0 027
,570 0 0 0 0 0 0 0 0 0
23,5
5757
,831 0 0 0 0 0 0
25,3
9923
,139
23,7
72 022
,105 0 0
222,
810
0 026
,236
20,4
24 0 0 0 0 0 0 027
,473 0
31,3
27 0 024
,612 0 0 0 0 0 0
130,
072
676,
486
18,0
98 0 0 0 024
,456 0 0 0 0 0 0 0 0 0
21,9
0853
,358 0 0 0 0 0 0
22,2
5921
,066
20,8
54 020
,083 0 0
202,
082
0 024
,226
18,3
76 0 0 0 0 0 0 024
,868 0
27,3
88 0 022
,015 0 0 0 0 0 0
116,
873
620,
756
23 0 0 0 0 41 0 0 0 0 0 0 0 0 0 37 33 0 0 0 0 0 0 32 38 30 0 25 0 0 259 0 0 54 23 0 0 0 0 0 0 0 29 0 54 0 0 54 0 0 0 0 0 0 214
761
4,94
90 0 0 0
6,85
90 0 0 0 0 0 0 0 0
5,99
58,
168
0 0 0 0 0 06,
283
5,82
85,
883
05,
563
0 049
,528 0 0
6,49
54,
994
0 0 0 0 0 0 06,
736
07,
557
0 06,
001
0 0 0 0 0 031
,783
166,
272
1,25
30 0 0 0
2,42
80 0 0 0 0 0 0 0 0
2,71
468
06 0 0 0 0 0 03,
303
2,13
71,
658
01,
106
0 014
,599 0 0
1,72
41,
984
0 0 0 0 0 0 01,
797
0 824 0 0
2,56
70 0 0 0 0 0
8,89
6
53,8
22
851 0 0 0 0 872 0 0 0 0 0 0 0 0 0 442
1,21
10 0 0 0 0 0 52
848
659
0 0 953 0 0
5,93
30 0 84
445
0 0 0 0 0 0 0 0 533 0
1,46
80 0 61
5 0 0 0 0 0 03,
910
36,1
03
2,84
40 0 0 0
3,55
90 0 0 0 0 0 0 0 0
2,83
96,
957
0 0 0 0 0 02,
452
3,20
53,
635
03,
504
0 028
,995 0 0
3,92
72,
559
0 0 0 0 0 0 04,
407
05,
265
0 02,
819
0 0 0 0 0 018
,977
76,3
47
7 0 0 0 0 12 0 0 0 0 0 0 0 0 0 1 18 0 0 0 0 0 0 12 7 4 0 18 0 0 79 0 0 19 0 0 0 0 0 0 0 0 11 0 4 0 0 8 0 0 0 0 0 0 42 222
0 0 0 0 0 0 0 0 0 0 0 0 0 0 0 0 0 0 0 0 0 0 0 0 0 0 0 0 0 0 0 0 0 0 0 0 0 0 0 0 0 0 1 0 0 0 0 0 0 0 0 0 0 0 1 1
0 0 0 0 0 2 0 0 0 0 0 0 0 0 0 1 1 0 0 0 0 0 0 0 0 0 0 0 0 0 5 0 0 0 0 0 0 0 0 0 0 0 0 0 0 0 0 0 0 0 0 0 0 0 0 21
23 0 0 0 0 28 0 0 0 0 0 0 0 0 0 23 34 0 0 0 0 0 0 29 28 23 0 38 0 0 227 0 0 50 31 0 0 0 0 0 0 0 45 0 0 0 0 37 0 0 0 0 0 0 162
581
1 0 0 0 0 18 0 0 0 0 0 0 0 0 0 5 4 0 0 0 0 0 0 16 8 14 0 4 0 0 69 0 0 20 1 0 0 0 0 0 0 0 4 0 0 0 0 25 0 0 0 0 0 0 51 259
0 0 0 0 0 0 0 0 0 0 0 0 0 0 0 0 0 0 0 0 0 0 0 0 0 0 0 0 0 0 0 0 0 0 0 0 0 0 0 0 0 0 0 0 0 0 0 0 0 0 0 0 0 0 0 0
1 0 0 0 0 0 0 0 0 0 0 0 0 0 0 0 2 0 0 0 0 0 0 2 1 1 0 1 0 0 8 0 0 1 0 0 0 0 0 0 0 0 2 0 1 0 0 2 0 0 0 0 0 0 6 23
24 0 0 0 0 28 0 0 0 0 0 0 0 0 0 37 30 0 0 0 0 0 0 32 24 24 0 25 0 0 224 0 0 33 15 0 0 0 0 0 0 0 20 0 8 0 0 29 0 0 0 0 0 0 105
591
2,63
00 0 0 0
1,64
00 0 0 0 0 0 0 0 0
2,57
21,
979
0 0 0 0 0 02,
694
1,76
22,
060
01,
933
0 017
,270 0 0
2,87
996
7 0 0 0 0 0 0 01,
404
02,
372
0 03,
117
0 0 0 0 0 010
,739
48,6
53
1,57
40 0 0 0 91
7 0 0 0 0 0 0 0 0 01,
272
2,51
10 0 0 0 0 0
1,41
089
998
5 01,
215
0 010
,783 0 0
1,40
445
0 0 0 0 0 0 0 01,
882
0 310 0 0 854 0 0 0 0 0 0
4,90
0
27,1
29
100 0 0 0 0 59 0 0 0 0 0 0 0 0 0 98 118 0 0 0 0 0 0 102
60 73 0 79 0 0 689 0 0 113
41 0 0 0 0 0 0 0 76 0 41 0 0 83 0 0 0 0 0 0 354
1,91
7
8 0 0 0 0 14 0 0 0 0 0 0 0 0 0 10 9 0 0 0 0 0 0 10 5 6 0 9 0 0 71 0 0 9 6 0 0 0 0 0 0 0 7 0 38 0 0 21 0 0 0 0 0 0 82 229
0 0 0 0 0 0 0 0 0 0 0 0 0 0 0 0 0 0 0 0 0 0 0 0 0 0 0 0 0 0 0 0 0 0 0 0 0 0 0 0 0 0 0 0 0 0 0 0 0 0 0 0 0 0 0 1
2,72
50 0 0 0
5,26
00 0 0 0 0 0 0 0 0
5,80
44,
851
0 0 0 0 0 03,
181
3,63
63,
279
03,
339
0 032
,075 0 0
6,98
13,
774
0 0 0 0 0 0 03,
196
03,
565
0 07,
970
0 0 0 0 0 025
,487
115,
178
2,39
70 0 0 0 0 0 0 0 0 0 0 0 0 0 0 11
6 0 0 0 0 0 03,
279
3,38
54,
893
02,
818
0 016
,889 0 0
2,57
30 0 0 0 0 0 0 0
1,39
60
10,7
13 0 0 467 0 0 0 0 0 0
15,1
49
53,6
80
0 0 0 0 0 0 0 0 0 0 0 0 0 0 0 0 0 0 0 0 0 0 0 0 0 0 0 0 0 0 0 0 0 0 0 0 0 0 0 0 0 0 0 0 0 0 0 0 0 0 0 0 0 0 0 56
145 0 0 0 0 279 0 0 0 0 0 0 0 0 0 0 0 0 0 0 0 0 0 64 27 90 0 0 0 0 606 0 0 185
83 0 0 0 0 0 0 0 448 0 515 0 0 671 0 0 0 0 0 0
1,90
2
2,73
6
485 0 0 0 0
1,72
90 0 0 0 0 0 0 0 0 0 0 0 0 0 0 0 0 40
691
225
4 0 189 0 0
3,97
40 0
1,01
719
0 0 0 0 0 0 0 0 739 0 56 0 0 295 0 0 0 0 0 0
2,29
7
6,35
3
86 0 0 0 0 183 0 0 0 0 0 0 0 0 0 163
465 0 0 0 0 0 0 149
87 65 0 260 0 0
1,45
90 0 17
747 0 0 0 0 0 0 0 24
4 0 170 0 0 78 0 0 0 0 0 0 717
3,61
9
1 0 0 0 0 2 0 0 0 0 0 0 0 0 0 212
357 0 0 0 0 0 0 0 34 25 0 30 0 0 661 0 0 0 0 0 0 0 0 0 0 0 0 0
1,85
10 0 0 0 0 0 0 0 0
1,85
1
5,58
9
1,14
00 0 0 0
1,91
10 0 0 0 0 0 0 0 0
1,25
642
3 0 0 0 0 0 02,
247
2,27
42,
205
01,
024
0 012
,480 0 0
3,67
61,
210
0 0 0 0 0 0 01,
453
0 525 0 0
2,81
90 0 0 0 0 0
9,68
3
31,2
44
TEHS
IL T
OTAL
:
TEHS
IL T
OTAL
:
DIST
RICT
TOT
AL:
80
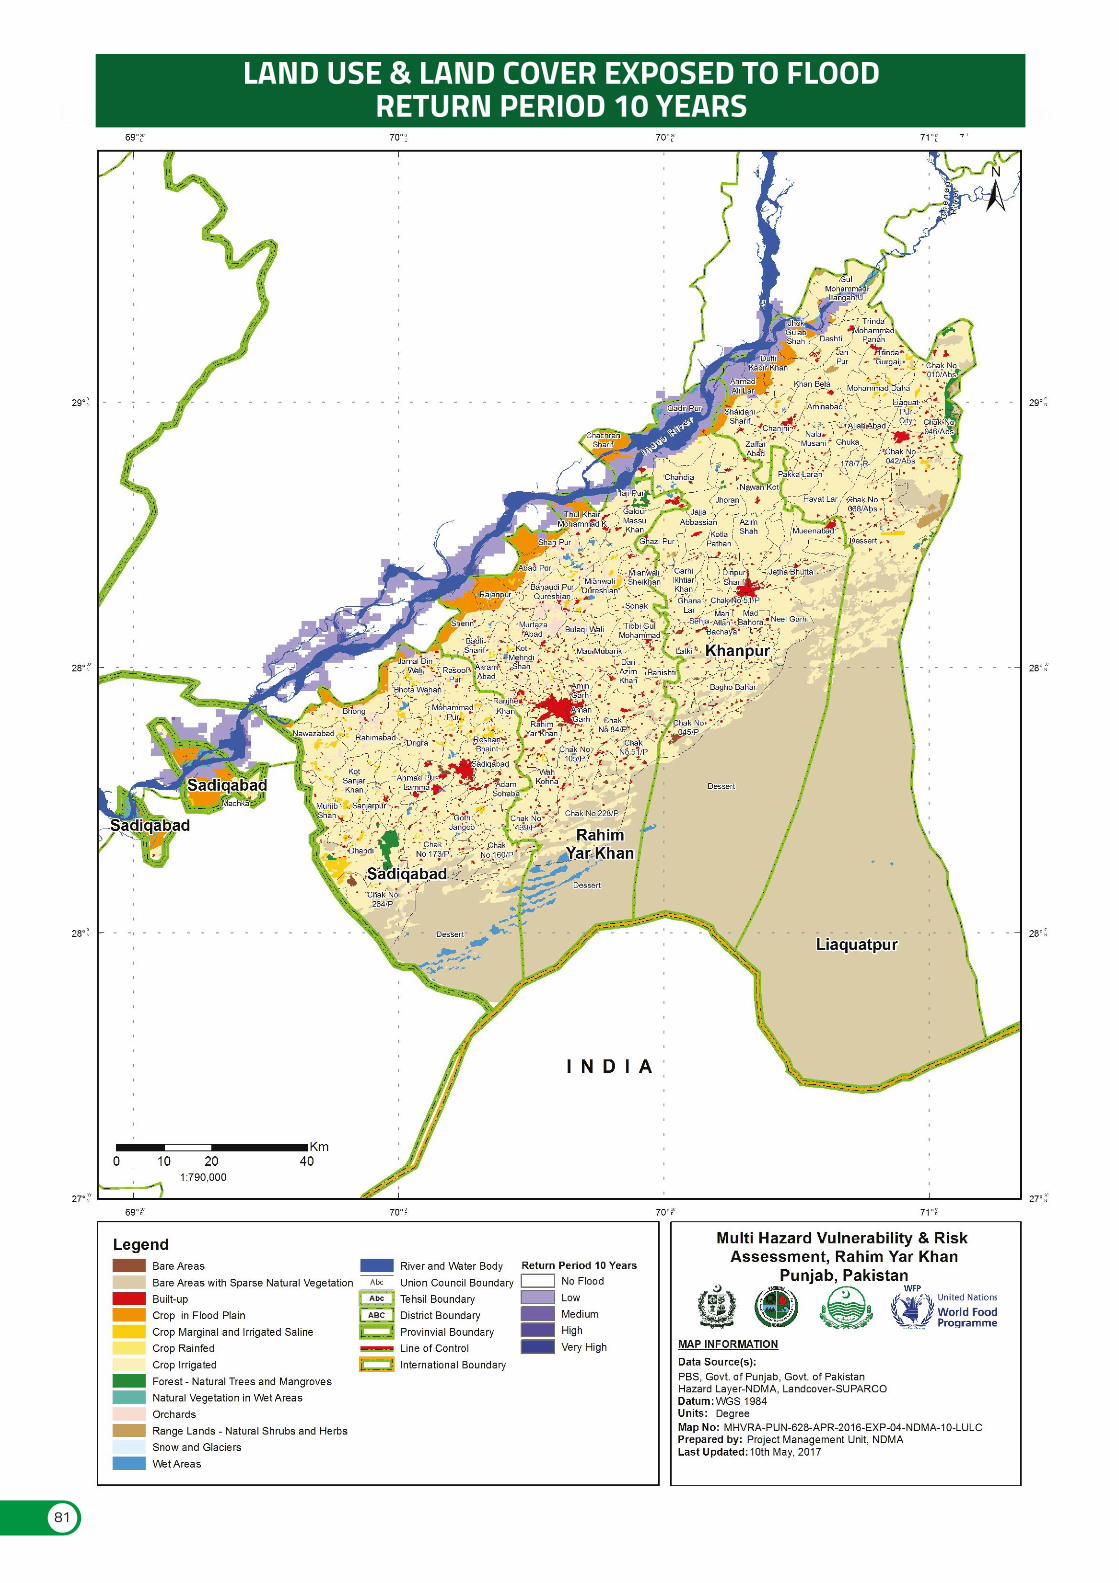
LAND USE & LAND COVER EXPOSED TO FLOODRETURN PERIOD 10 YEARS
81
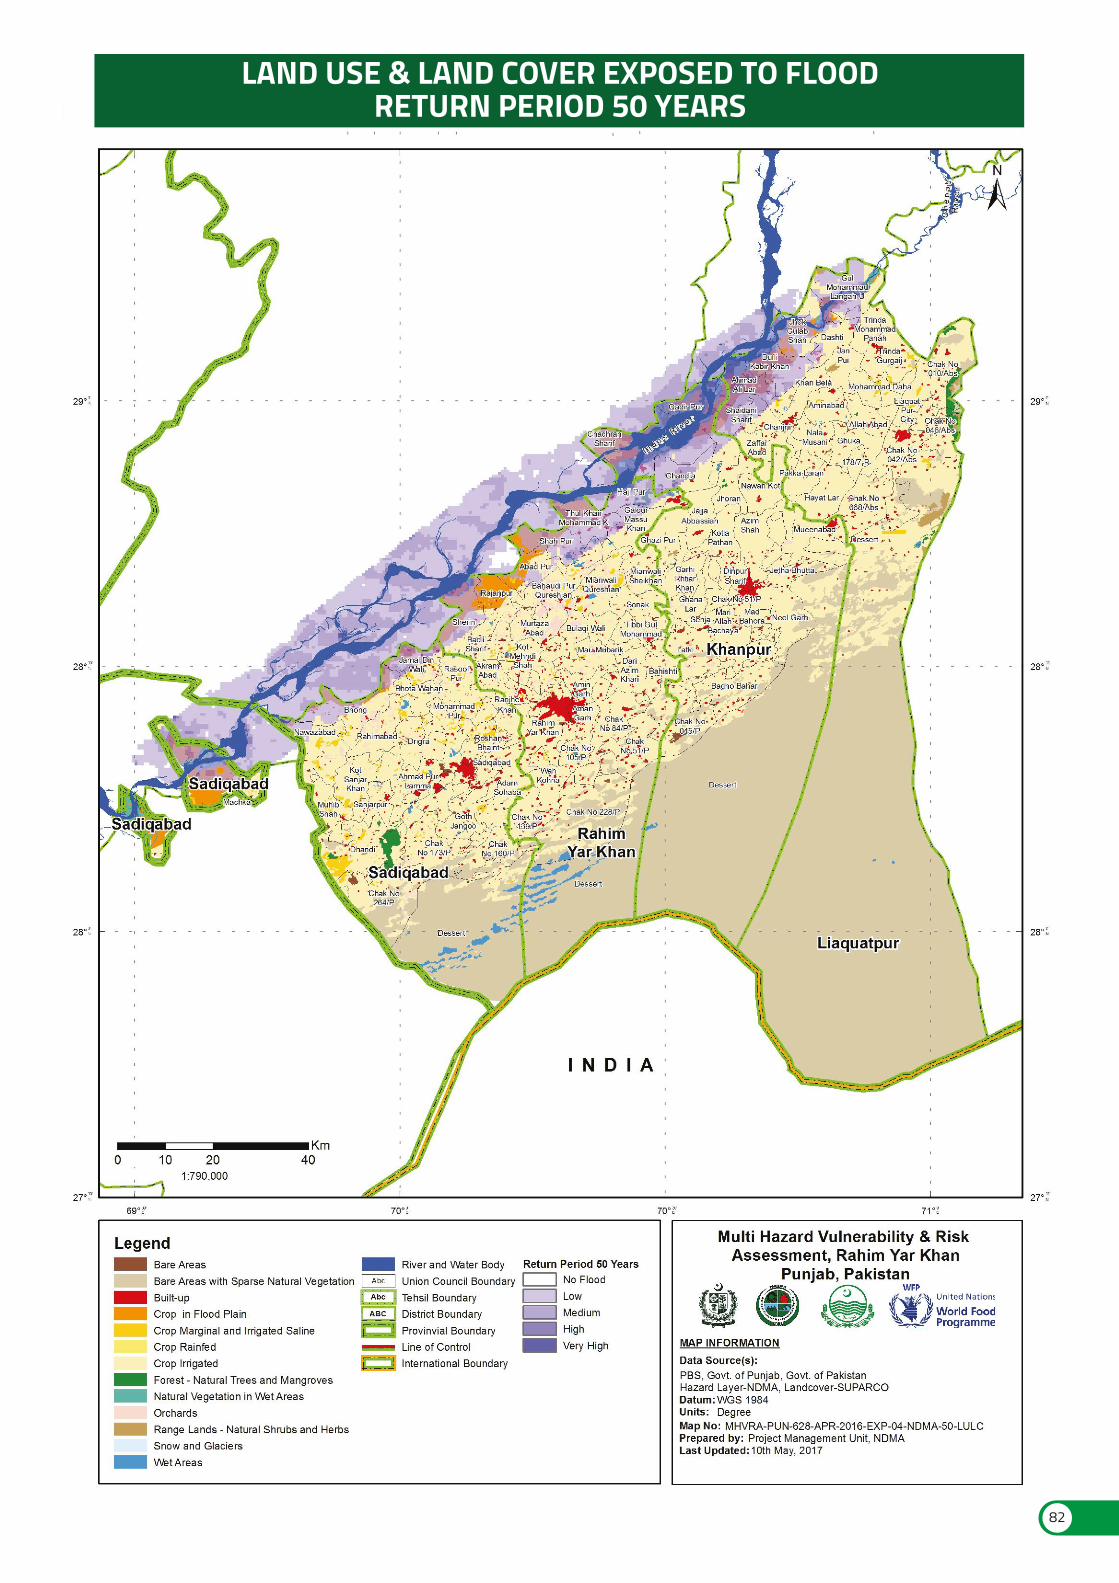
LAND USE & LAND COVER EXPOSED TO FLOODRETURN PERIOD 50 YEARS
82
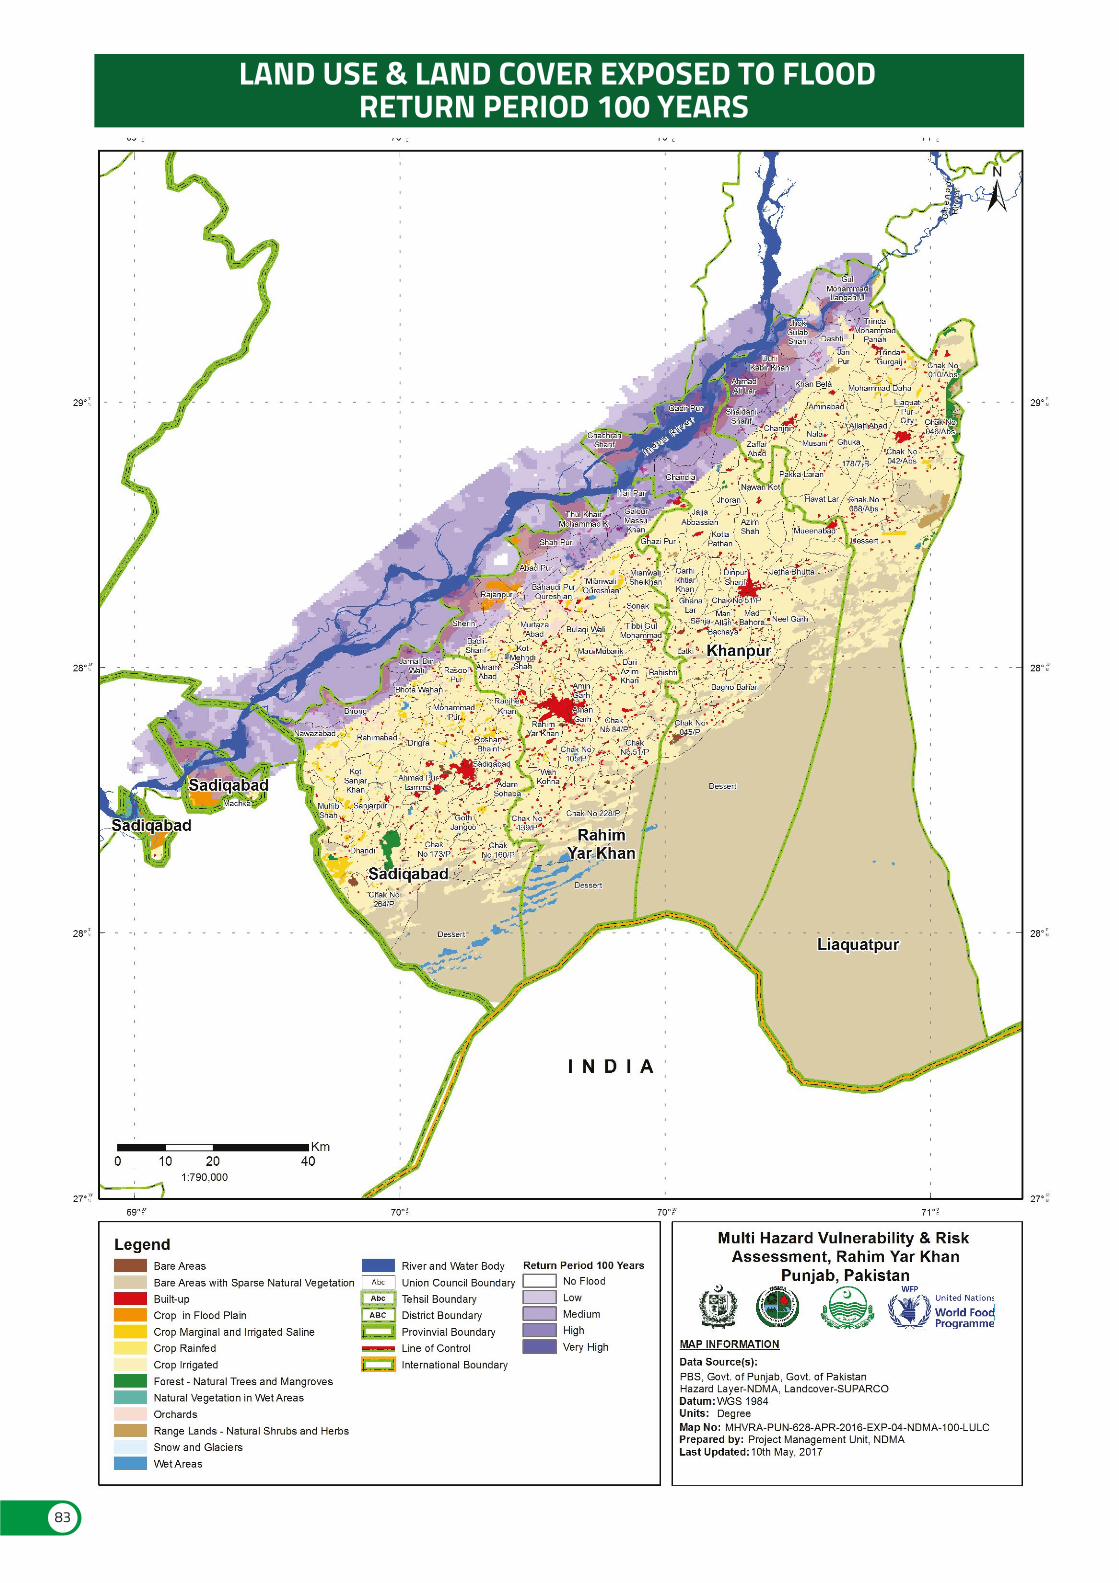
83
LAND USE & LAND COVER EXPOSED TO FLOODRETURN PERIOD 100 YEARS
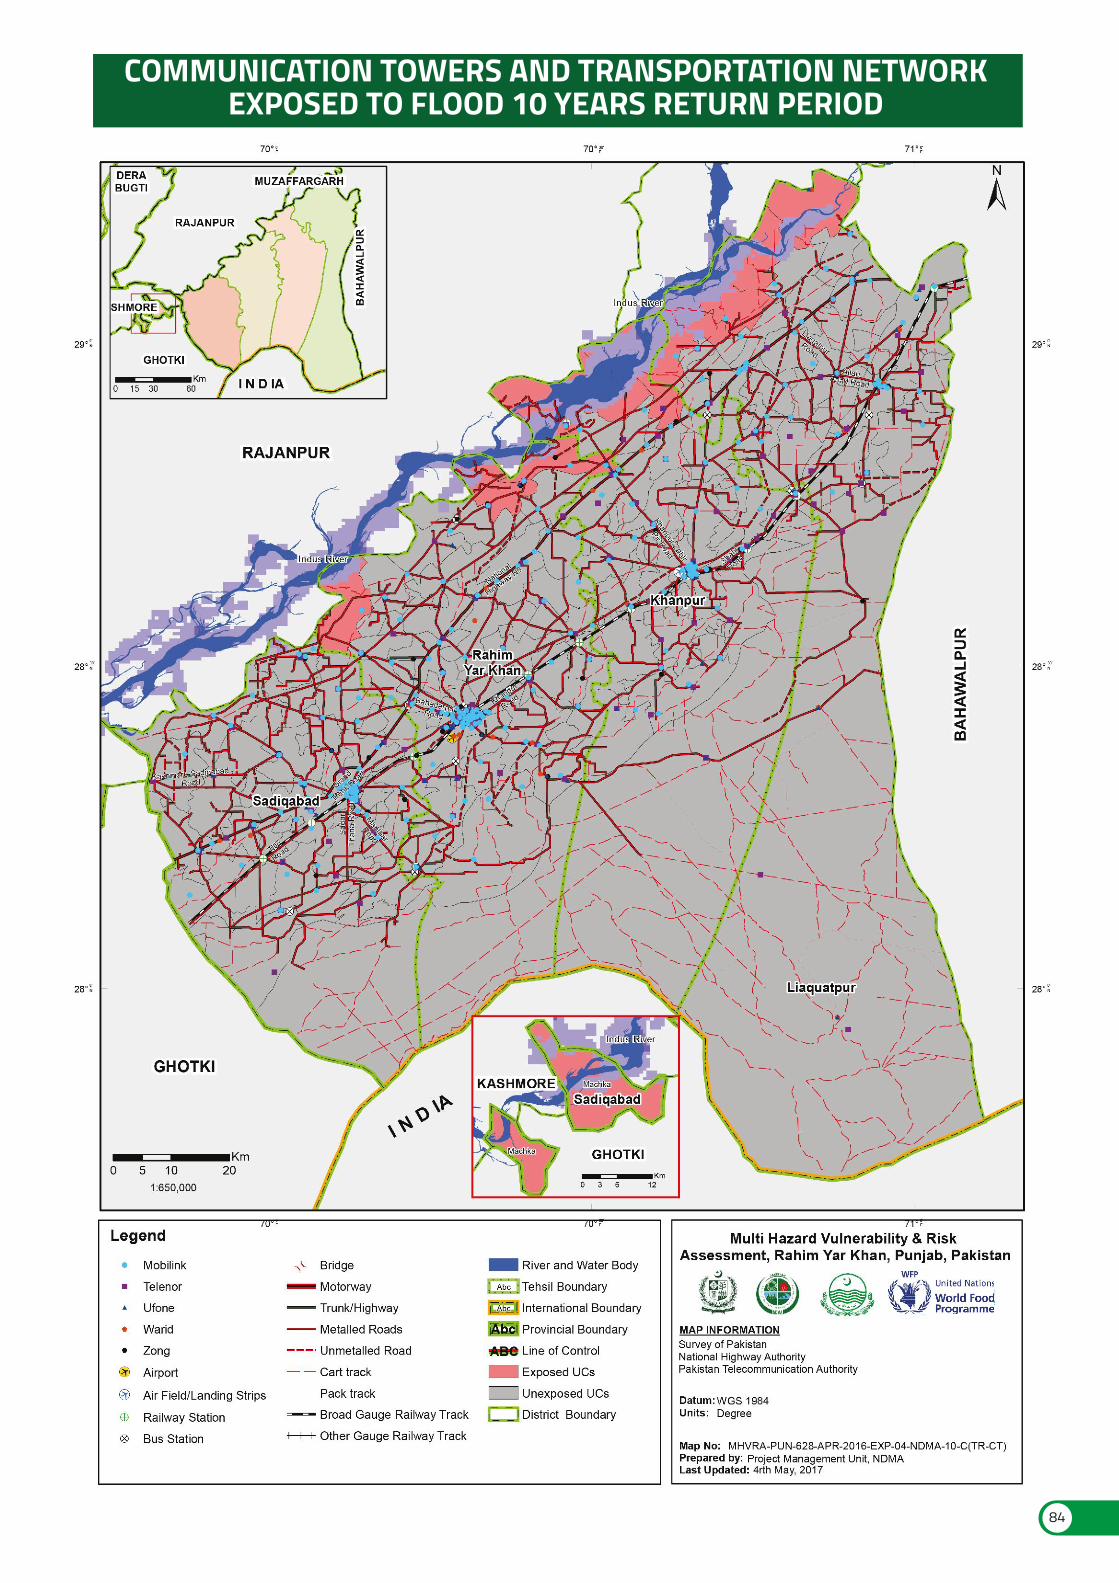
84
COMMUNICATION TOWERS AND TRANSPORTATION NETWORKEXPOSED TO FLOOD 10 YEARS RETURN PERIOD
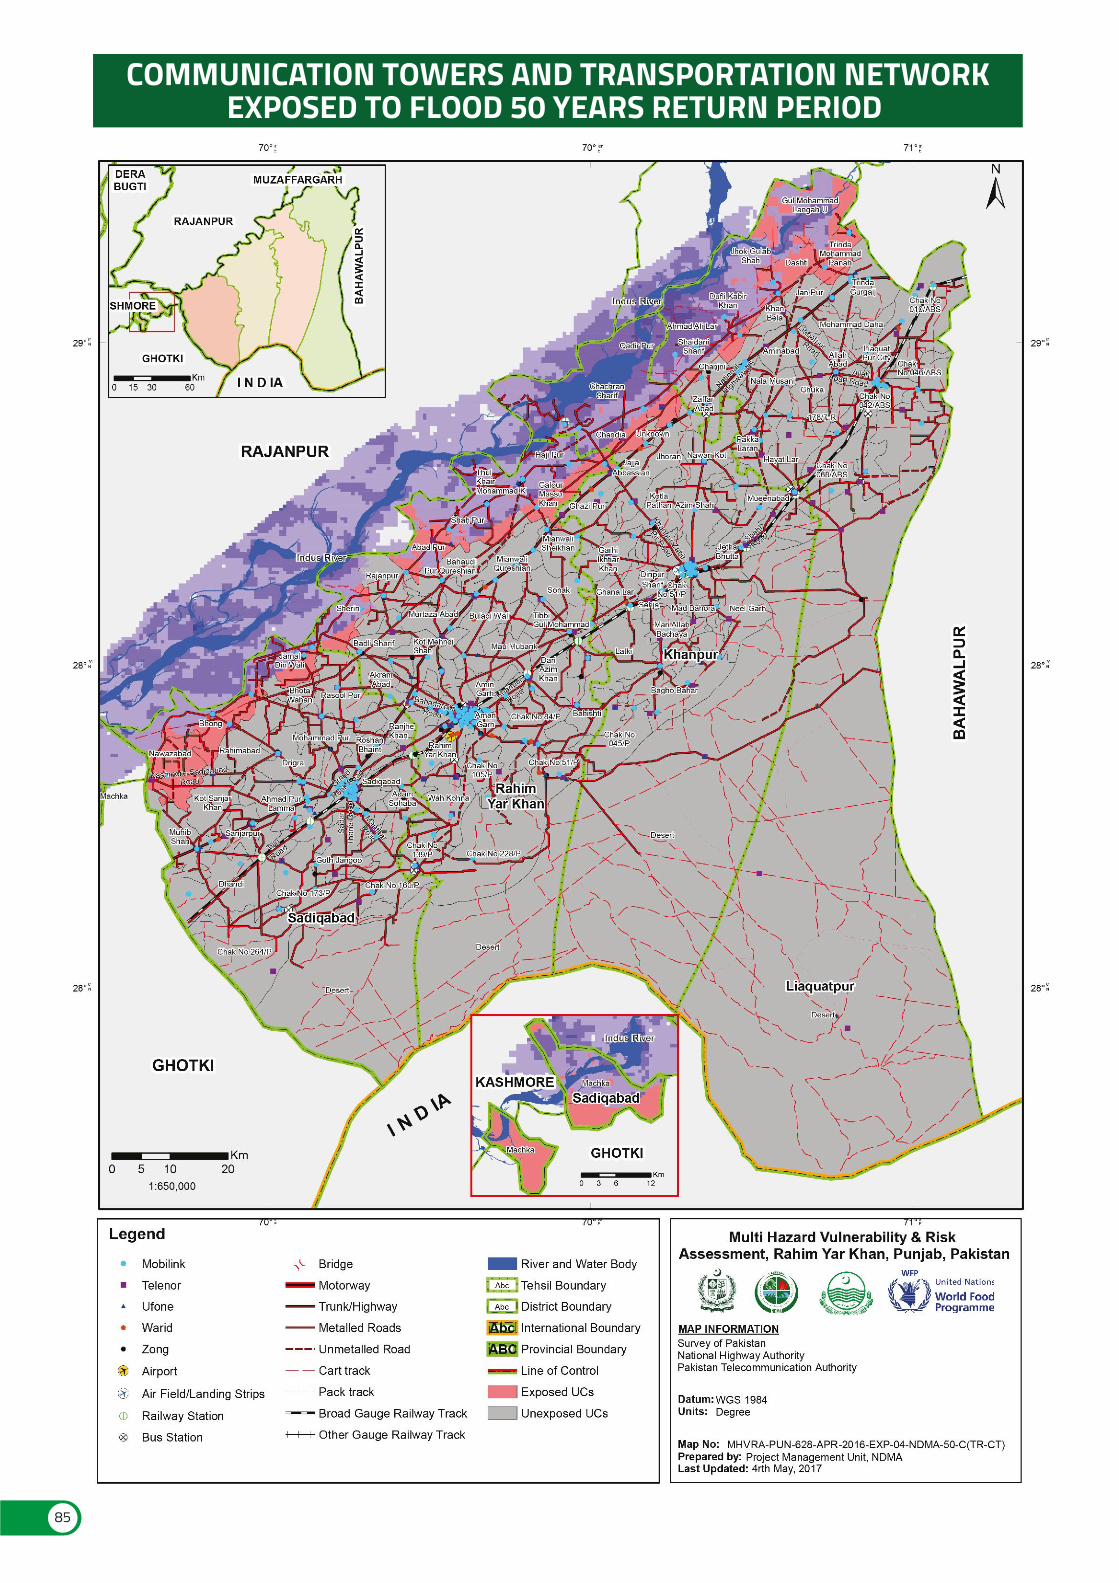
85
COMMUNICATION TOWERS AND TRANSPORTATION NETWORKEXPOSED TO FLOOD 50 YEARS RETURN PERIOD
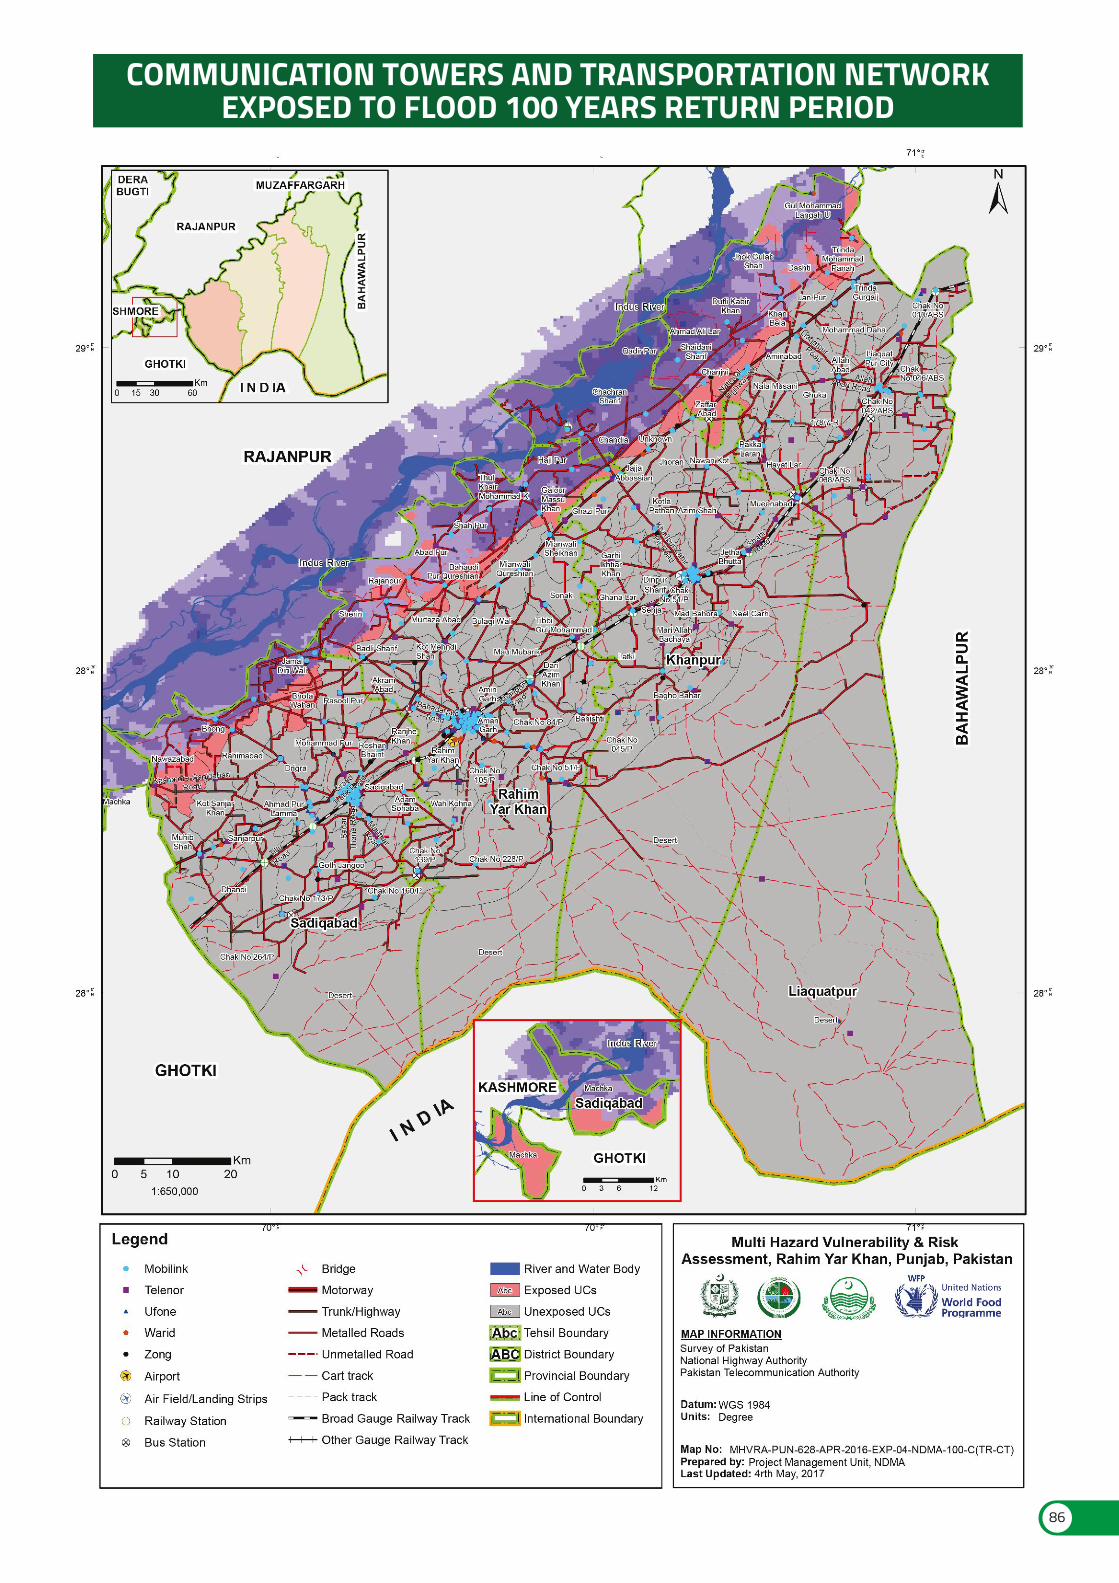
86
COMMUNICATION TOWERS AND TRANSPORTATION NETWORKEXPOSED TO FLOOD 100 YEARS RETURN PERIOD
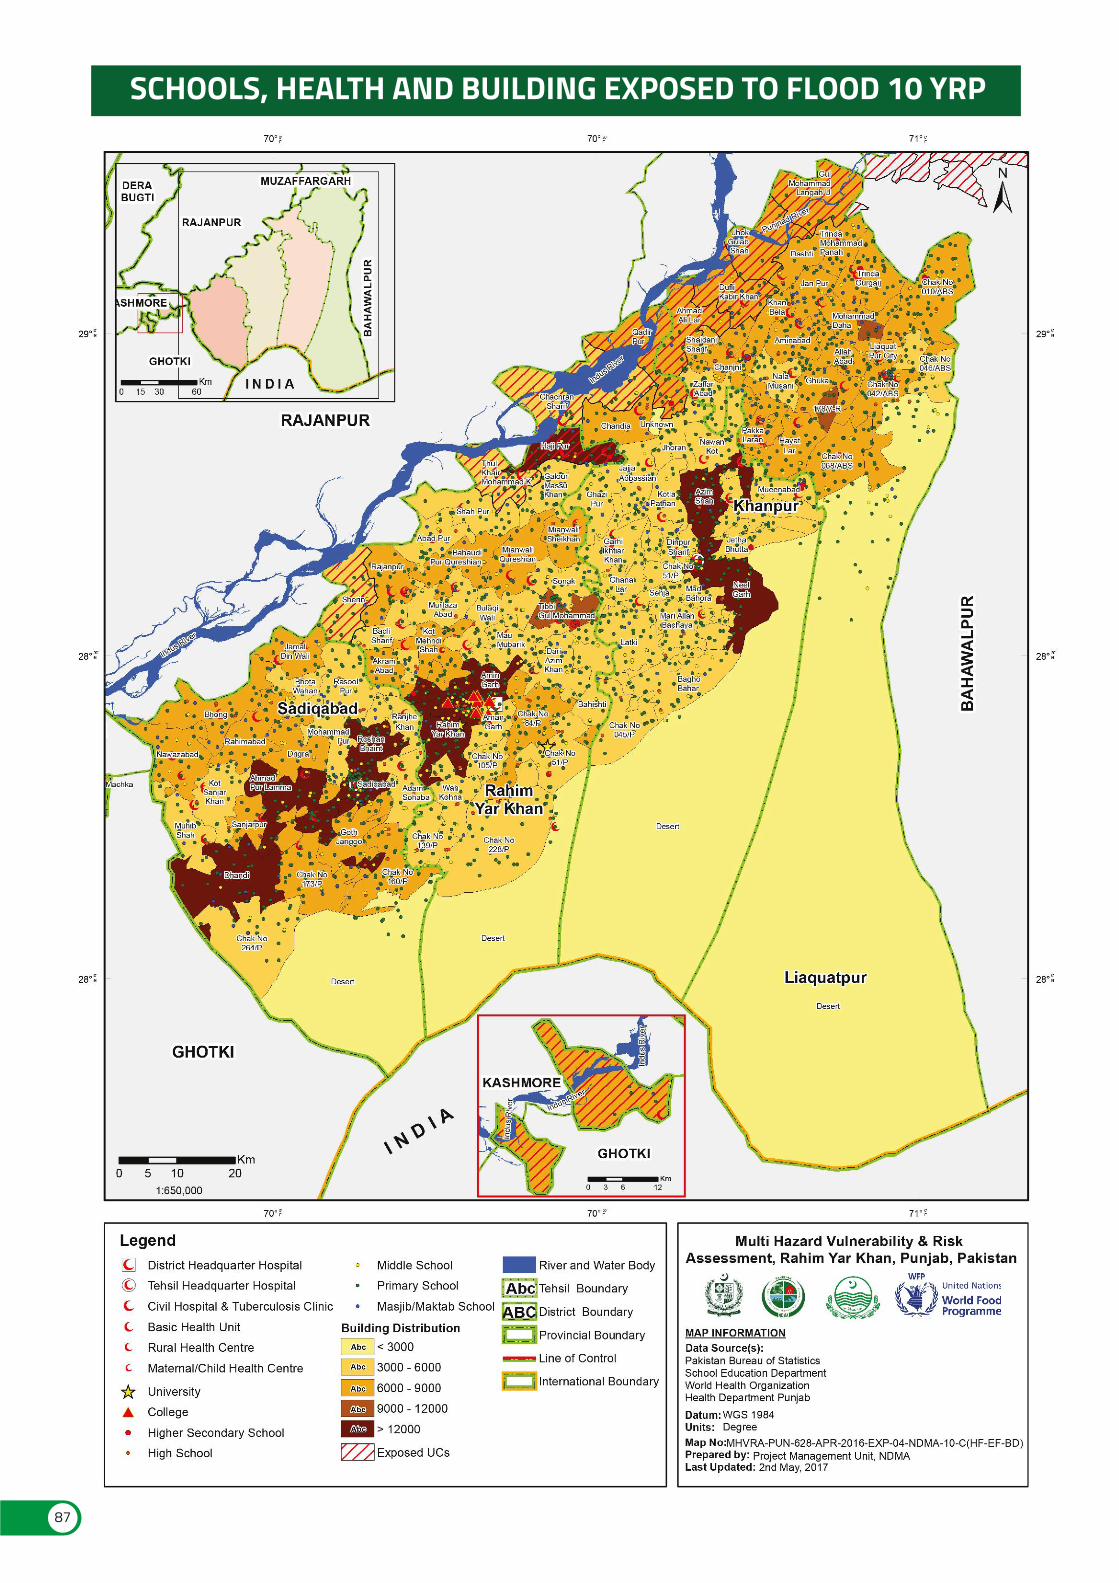
87
SCHOOLS, HEALTH AND BUILDING EXPOSED TO FLOOD 10 YRP
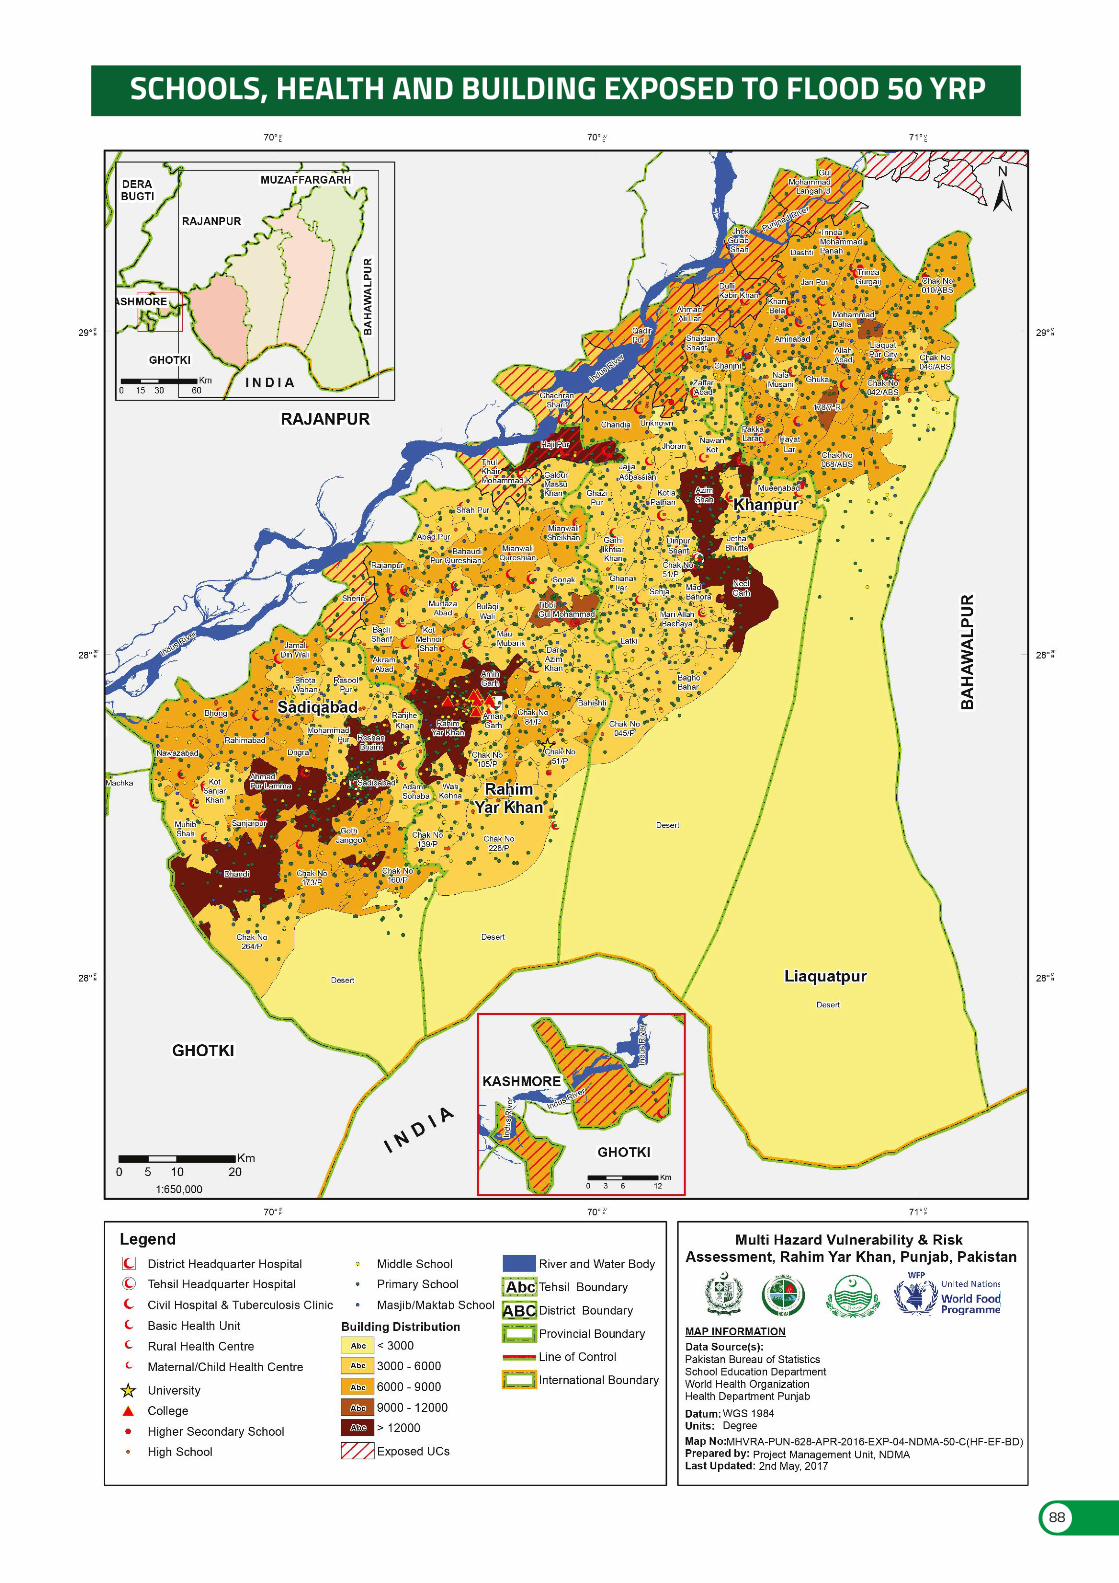
88
SCHOOLS, HEALTH AND BUILDING EXPOSED TO FLOOD 50 YRP

89
SCHOOLS, HEALTH AND BUILDING EXPOSED TO FLOOD 100 YRP
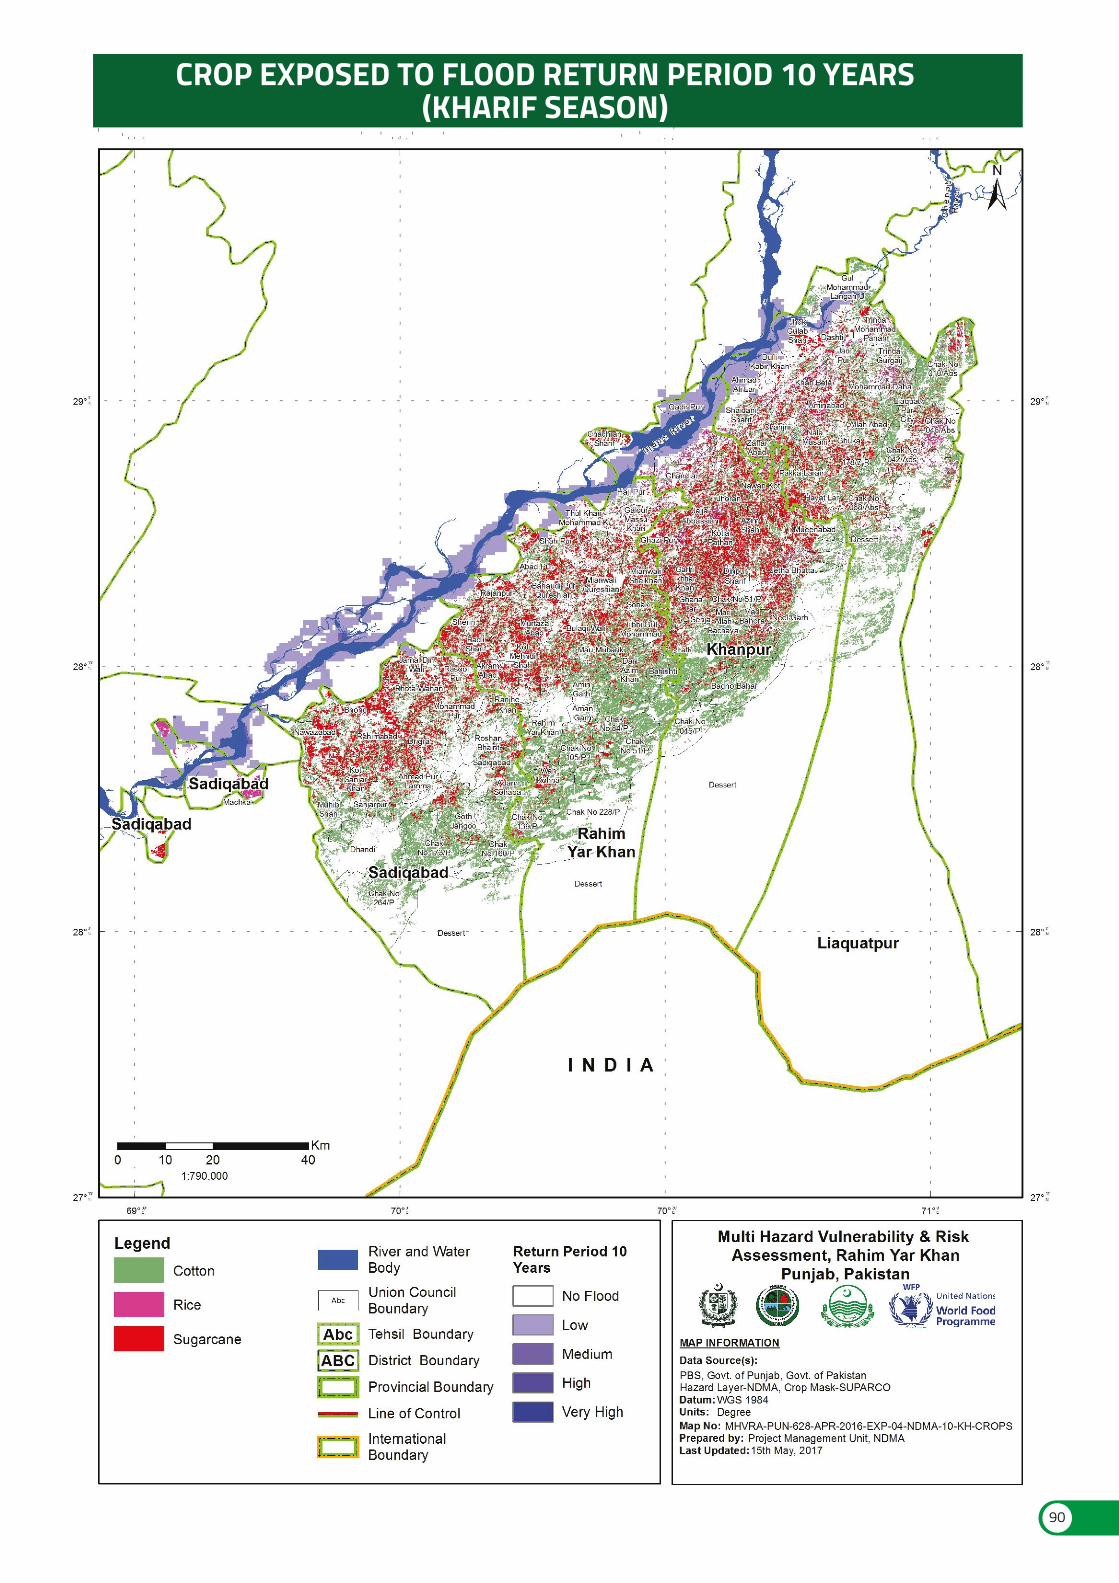
90
CROP EXPOSED TO FLOOD RETURN PERIOD 10 YEARS(KHARIF SEASON)
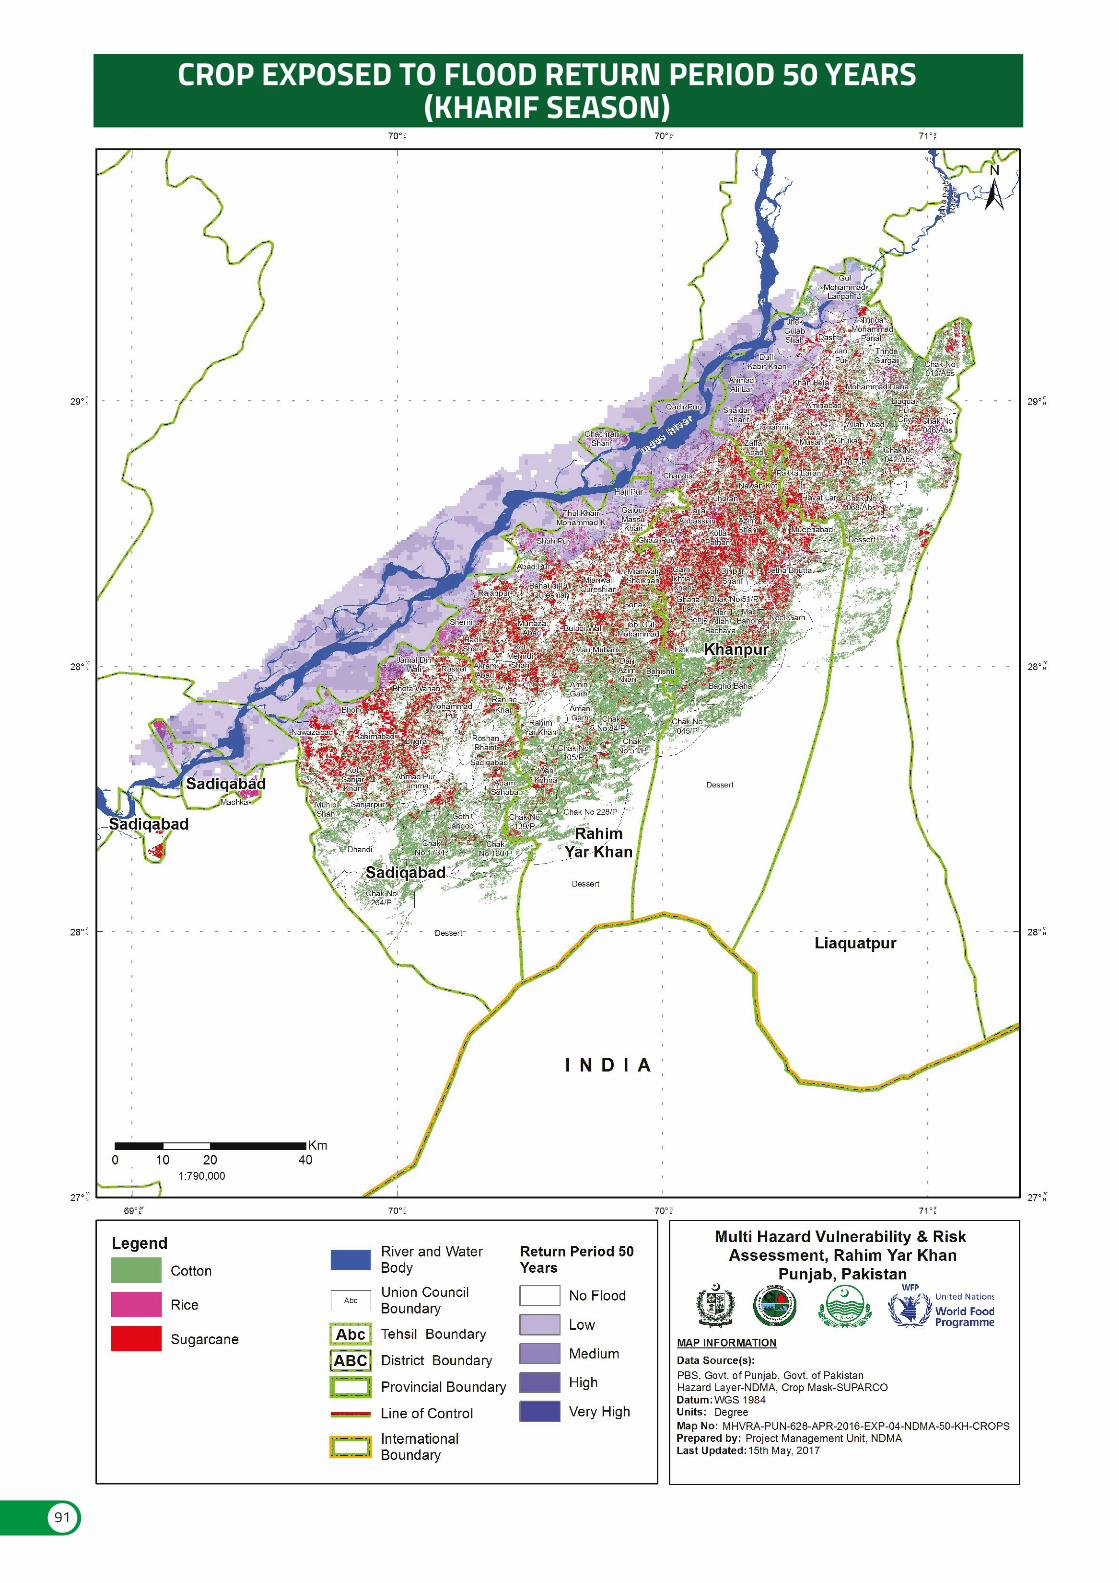
CROP EXPOSED TO FLOOD RETURN PERIOD 50 YEARS(KHARIF SEASON)
91
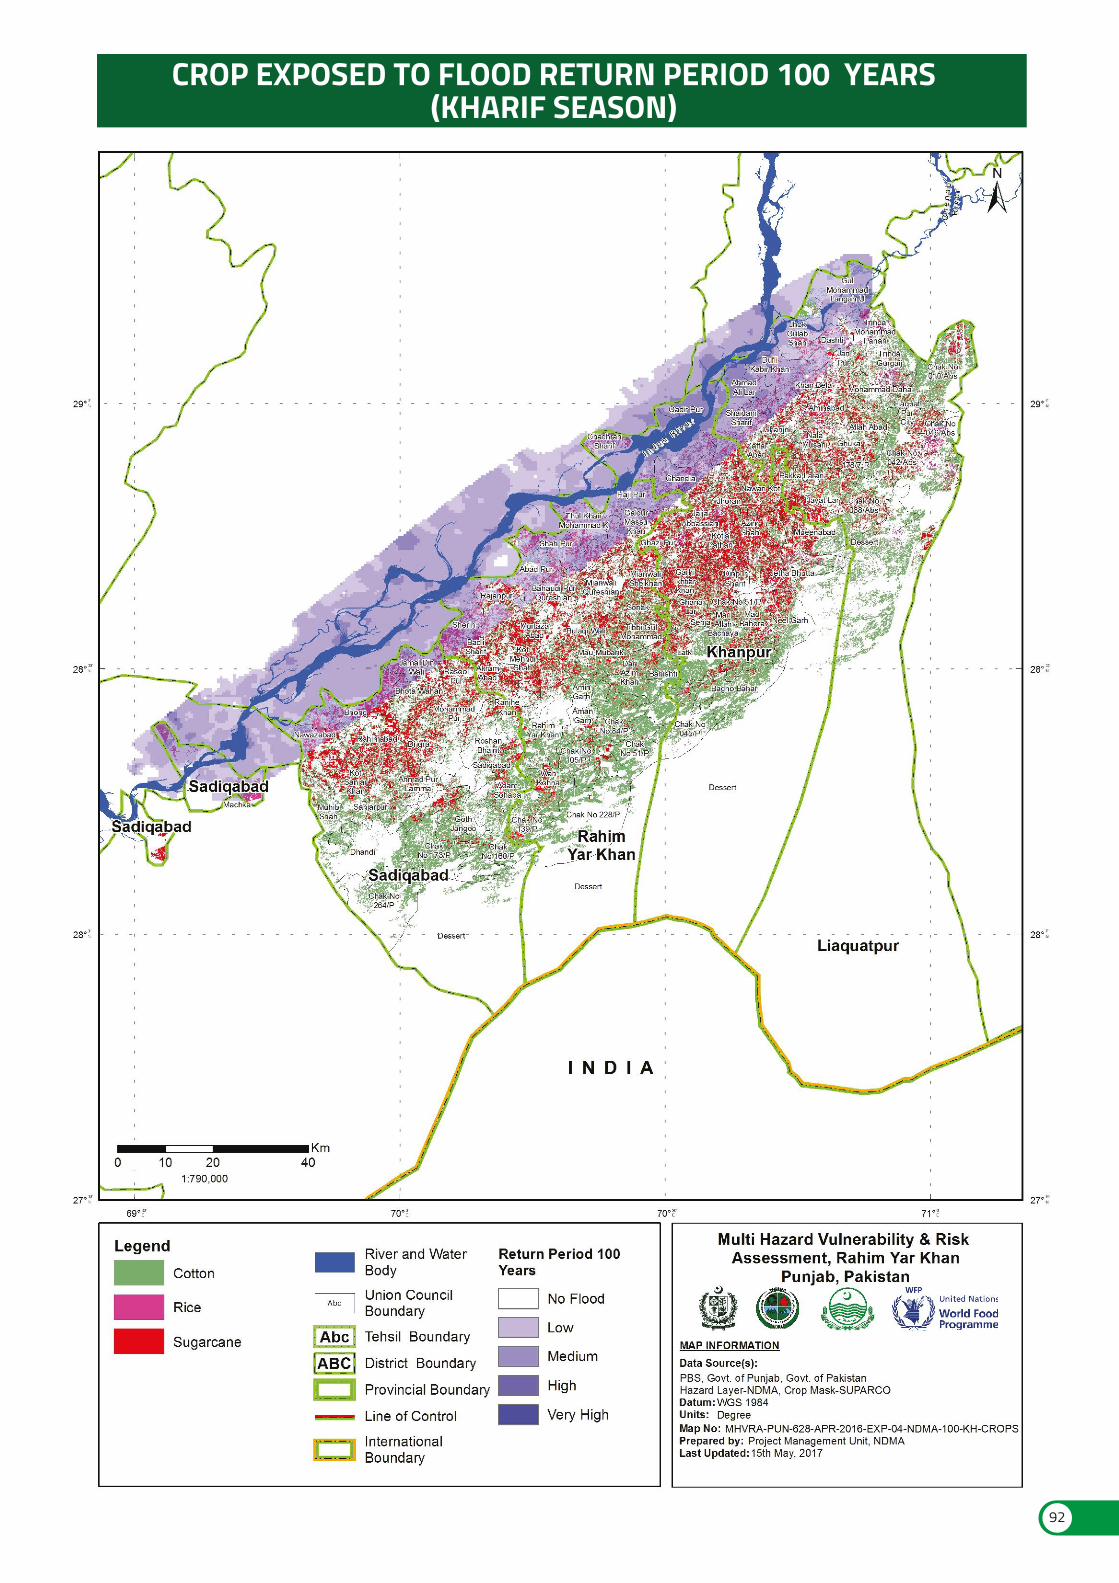
CROP EXPOSED TO FLOOD RETURN PERIOD 100 YEARS(KHARIF SEASON)
92

93
94
VULNERABILITY ASSESSMENTSOCIAL VULNERABILITYFOOD SECURITYD
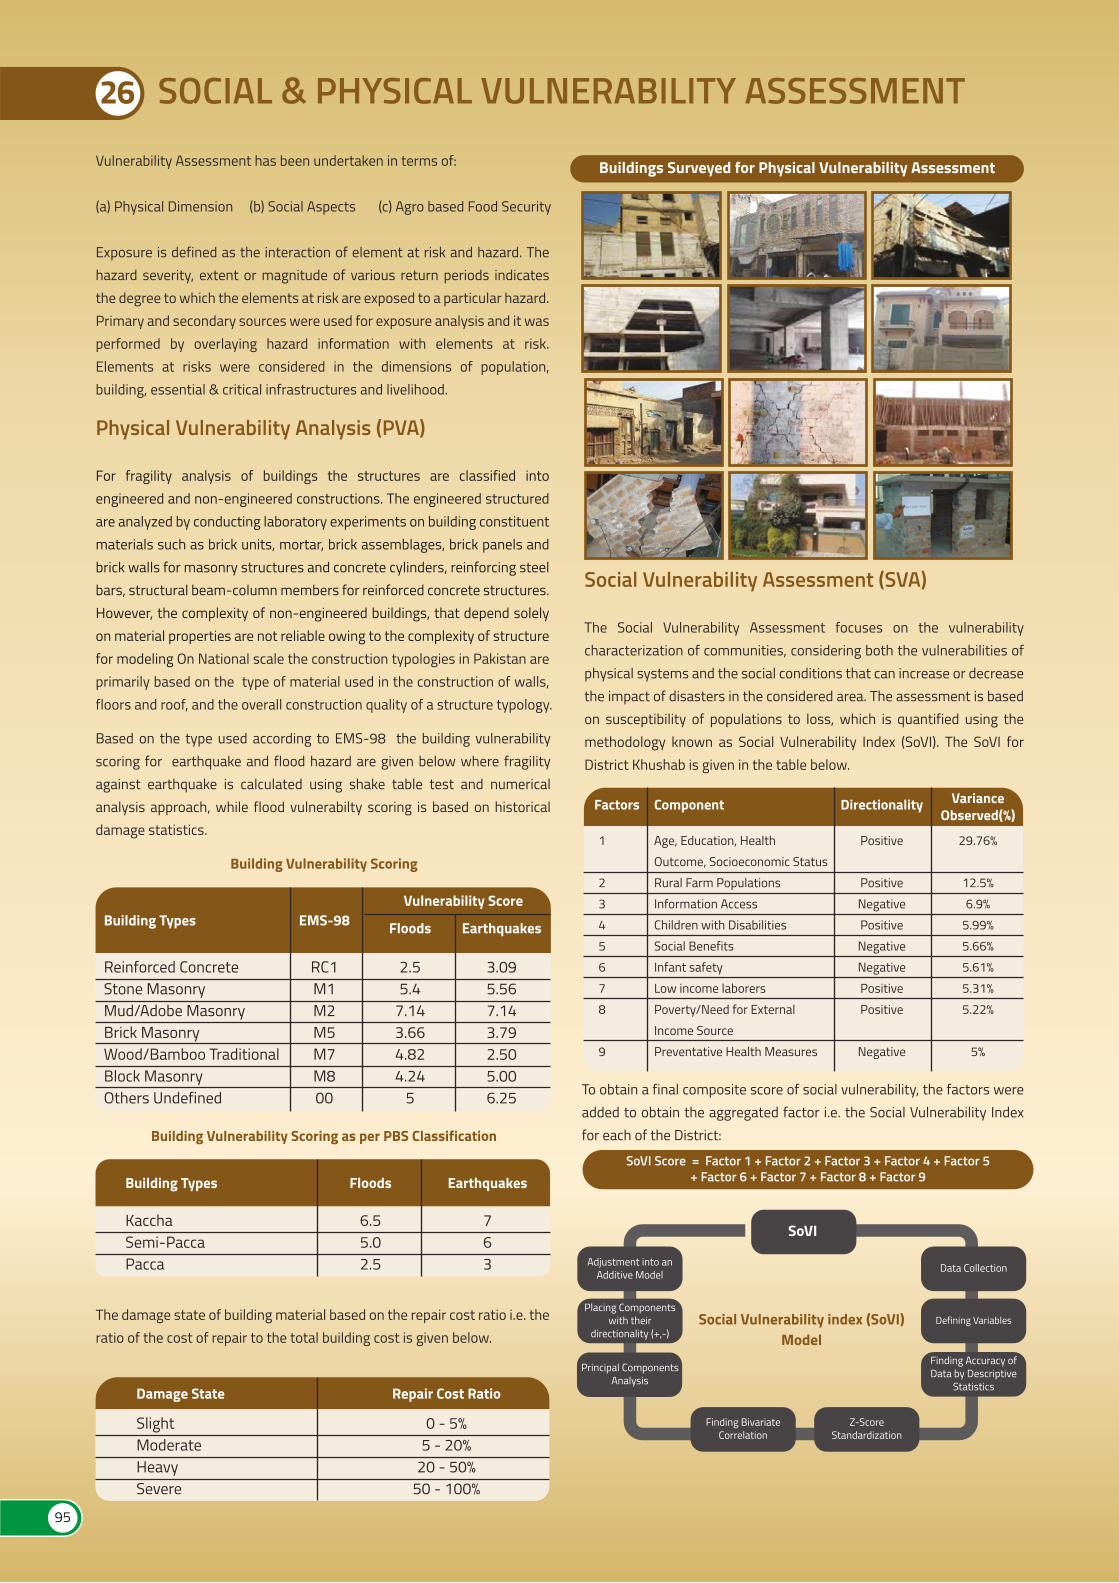
26 SOCIAL & PHYSICAL VULNERABILITY ASSESSMENT
Physical Vulnerability Analysis (PVA)
For fragility analysis of buildings the structures are classified into engineered and non-engineered constructions. The engineered structured are analyzed by conducting laboratory experiments on building constituent materials such as brick units, mortar, brick assemblages, brick panels and brick walls for masonry structures and concrete cylinders, reinforcing steel bars, structural beam-column members for reinforced concrete structures. However, the complexity of non-engineered buildings, that depend solely on material properties are not reliable owing to the complexity of structure for modeling On National scale the construction typologies in Pakistan are primarily based on the type of material used in the construction of walls, floors and roof, and the overall construction quality of a structure typology.
Vulnerability Assessment has been undertaken in terms of:
(a) Physical Dimension (b) Social Aspects (c) Agro based Food Security
Exposure is defined as the interaction of element at risk and hazard. The hazard severity, extent or magnitude of various return periods indicates the degree to which the elements at risk are exposed to a particular hazard. Primary and secondary sources were used for exposure analysis and it was performed by overlaying hazard information with elements at risk. Elements at risks were considered in the dimensions of population, building, essential & critical infrastructures and livelihood.
Buildings Surveyed for Physical Vulnerability Assessment
The damage state of building material based on the repair cost ratio i.e. the ratio of the cost of repair to the total building cost is given below.
Based on the type used according to EMS-98 the building vulnerability scoring for earthquake and flood hazard are given below where fragility against earthquake is calculated using shake table test and numerical analysis approach, while flood vulnerabilty scoring is based on historical damage statistics.
To obtain a final composite score of social vulnerability, the factors were added to obtain the aggregated factor i.e. the Social Vulnerability Index for each of the District:
Social Vulnerability Assessment (SVA)
The Social Vulnerability Assessment focuses on the vulnerability characterization of communities, considering both the vulnerabilities of physical systems and the social conditions that can increase or decrease the impact of disasters in the considered area. The assessment is based on susceptibility of populations to loss, which is quantified using the methodology known as Social Vulnerability Index (SoVI). The SoVI for District Khushab is given in the table below.
Damage State Repair Cost Ratio
SlightModerateHeavySevere
0 - 5%5 - 20%
20 - 50%50 - 100%
Building Vulnerability Scoring
Building Vulnerability Scoring as per PBS Classification
Building TypesVulnerability Score
Earthquakes
Reinforced ConcreteStone MasonryMud/Adobe MasonryBrick MasonryWood/Bamboo TraditionalBlock MasonryOthers Undefined
3.095.567.143.792.505.006.25
Floods
2.55.4
7.143.664.824.24
5
EMS-98
RC1M1M2M5M7M800
Building Types Earthquakes
KacchaSemi-PaccaPacca
763
Floods
6.55.02.5
ComponentFactors VarianceObserved(%)
Directionality
Age, Education, HealthOutcome, Socioeconomic StatusRural Farm PopulationsInformation AccessChildren with DisabilitiesSocial BenefitsInfant safetyLow income laborersPoverty/Need for ExternalIncome SourcePreventative Health Measures
Positive
PositiveNegativePositiveNegativeNegativePositivePositive
Negative
29.76%
12.5%6.9%
5.99%5.66%5.61%5.31%5.22%
5%
1
2345678
9
SoVI Score = Factor 1 + Factor 2 + Factor 3 + Factor 4 + Factor 5+ Factor 6 + Factor 7 + Factor 8 + Factor 9
SoVI
Adjustment into anAdditive Model
Placing Componentswith their
directionality (+,-)
Principal ComponentsAnalysis
Data Collection
Defining Variables
Finding Accuracy ofData by Descriptive
Statistics
Finding BivariateCorrelation
Z-ScoreStandardization
Social Vulnerability index (SoVI)Model
95
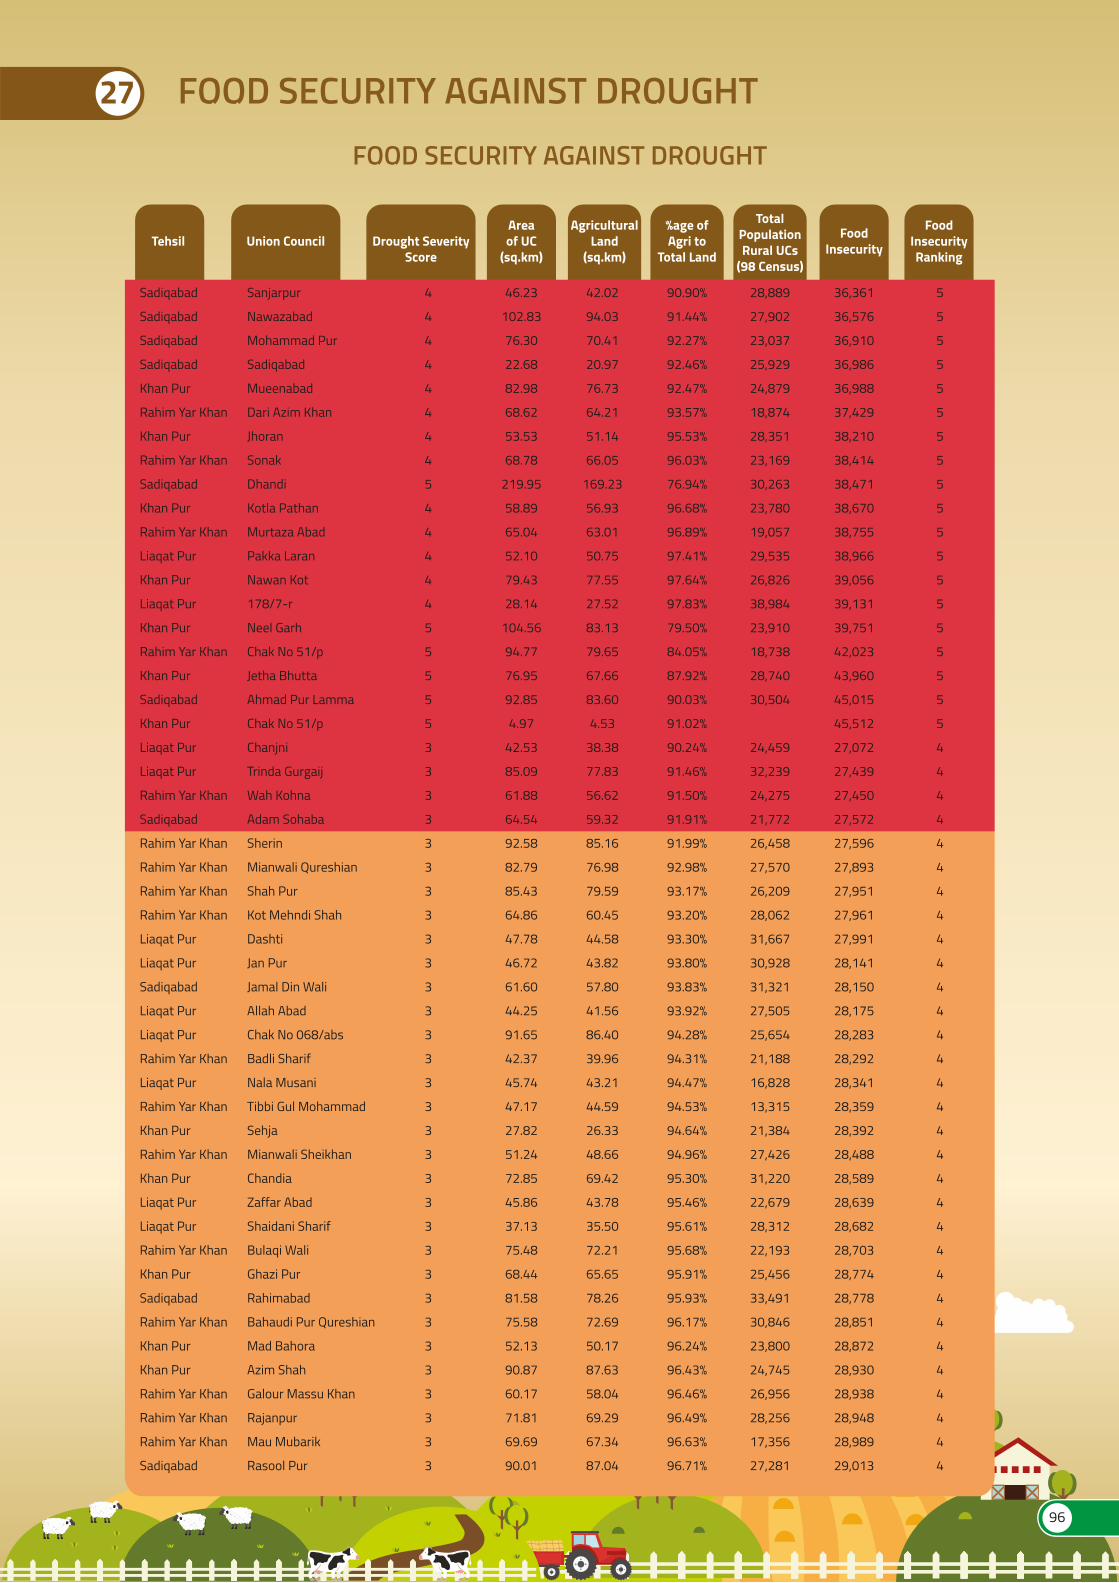
FOOD SECURITY AGAINST DROUGHTFOOD SECURITY AGAINST DROUGHT
27
AgriculturalLand
(sq.km)
%age ofAgri to
Total Land
TotalPopulationRural UCs
(98 Census)
FoodInsecurity
FoodInsecurityRanking
Sadiqabad
Sadiqabad
Sadiqabad
Sadiqabad
Khan Pur
Rahim Yar Khan
Khan Pur
Rahim Yar Khan
Sadiqabad
Khan Pur
Rahim Yar Khan
Liaqat Pur
Khan Pur
Liaqat Pur
Khan Pur
Rahim Yar Khan
Khan Pur
Sadiqabad
Khan Pur
Liaqat Pur
Liaqat Pur
Rahim Yar Khan
Sadiqabad
Rahim Yar Khan
Rahim Yar Khan
Rahim Yar Khan
Rahim Yar Khan
Liaqat Pur
Liaqat Pur
Sadiqabad
Liaqat Pur
Liaqat Pur
Rahim Yar Khan
Liaqat Pur
Rahim Yar Khan
Khan Pur
Rahim Yar Khan
Khan Pur
Liaqat Pur
Liaqat Pur
Rahim Yar Khan
Khan Pur
Sadiqabad
Rahim Yar Khan
Khan Pur
Khan Pur
Rahim Yar Khan
Rahim Yar Khan
Rahim Yar Khan
Sadiqabad
46.23
102.83
76.30
22.68
82.98
68.62
53.53
68.78
219.95
58.89
65.04
52.10
79.43
28.14
104.56
94.77
76.95
92.85
4.97
42.53
85.09
61.88
64.54
92.58
82.79
85.43
64.86
47.78
46.72
61.60
44.25
91.65
42.37
45.74
47.17
27.82
51.24
72.85
45.86
37.13
75.48
68.44
81.58
75.58
52.13
90.87
60.17
71.81
69.69
90.01
42.02
94.03
70.41
20.97
76.73
64.21
51.14
66.05
169.23
56.93
63.01
50.75
77.55
27.52
83.13
79.65
67.66
83.60
4.53
38.38
77.83
56.62
59.32
85.16
76.98
79.59
60.45
44.58
43.82
57.80
41.56
86.40
39.96
43.21
44.59
26.33
48.66
69.42
43.78
35.50
72.21
65.65
78.26
72.69
50.17
87.63
58.04
69.29
67.34
87.04
90.90%
91.44%
92.27%
92.46%
92.47%
93.57%
95.53%
96.03%
76.94%
96.68%
96.89%
97.41%
97.64%
97.83%
79.50%
84.05%
87.92%
90.03%
91.02%
90.24%
91.46%
91.50%
91.91%
91.99%
92.98%
93.17%
93.20%
93.30%
93.80%
93.83%
93.92%
94.28%
94.31%
94.47%
94.53%
94.64%
94.96%
95.30%
95.46%
95.61%
95.68%
95.91%
95.93%
96.17%
96.24%
96.43%
96.46%
96.49%
96.63%
96.71%
28,889
27,902
23,037
25,929
24,879
18,874
28,351
23,169
30,263
23,780
19,057
29,535
26,826
38,984
23,910
18,738
28,740
30,504
24,459
32,239
24,275
21,772
26,458
27,570
26,209
28,062
31,667
30,928
31,321
27,505
25,654
21,188
16,828
13,315
21,384
27,426
31,220
22,679
28,312
22,193
25,456
33,491
30,846
23,800
24,745
26,956
28,256
17,356
27,281
36,361
36,576
36,910
36,986
36,988
37,429
38,210
38,414
38,471
38,670
38,755
38,966
39,056
39,131
39,751
42,023
43,960
45,015
45,512
27,072
27,439
27,450
27,572
27,596
27,893
27,951
27,961
27,991
28,141
28,150
28,175
28,283
28,292
28,341
28,359
28,392
28,488
28,589
28,639
28,682
28,703
28,774
28,778
28,851
28,872
28,930
28,938
28,948
28,989
29,013
5
5
5
5
5
5
5
5
5
5
5
5
5
5
5
5
5
5
5
4
4
4
4
4
4
4
4
4
4
4
4
4
4
4
4
4
4
4
4
4
4
4
4
4
4
4
4
4
4
4
Sanjarpur
Nawazabad
Mohammad Pur
Sadiqabad
Mueenabad
Dari Azim Khan
Jhoran
Sonak
Dhandi
Kotla Pathan
Murtaza Abad
Pakka Laran
Nawan Kot
178/7-r
Neel Garh
Chak No 51/p
Jetha Bhutta
Ahmad Pur Lamma
Chak No 51/p
Chanjni
Trinda Gurgaij
Wah Kohna
Adam Sohaba
Sherin
Mianwali Qureshian
Shah Pur
Kot Mehndi Shah
Dashti
Jan Pur
Jamal Din Wali
Allah Abad
Chak No 068/abs
Badli Sharif
Nala Musani
Tibbi Gul Mohammad
Sehja
Mianwali Sheikhan
Chandia
Zaffar Abad
Shaidani Sharif
Bulaqi Wali
Ghazi Pur
Rahimabad
Bahaudi Pur Qureshian
Mad Bahora
Azim Shah
Galour Massu Khan
Rajanpur
Mau Mubarik
Rasool Pur
4
4
4
4
4
4
4
4
5
4
4
4
4
4
5
5
5
5
5
3
3
3
3
3
3
3
3
3
3
3
3
3
3
3
3
3
3
3
3
3
3
3
3
3
3
3
3
3
3
3
Tehsil Drought SeverityScore
Union CouncilAreaof UC
(sq.km)
96
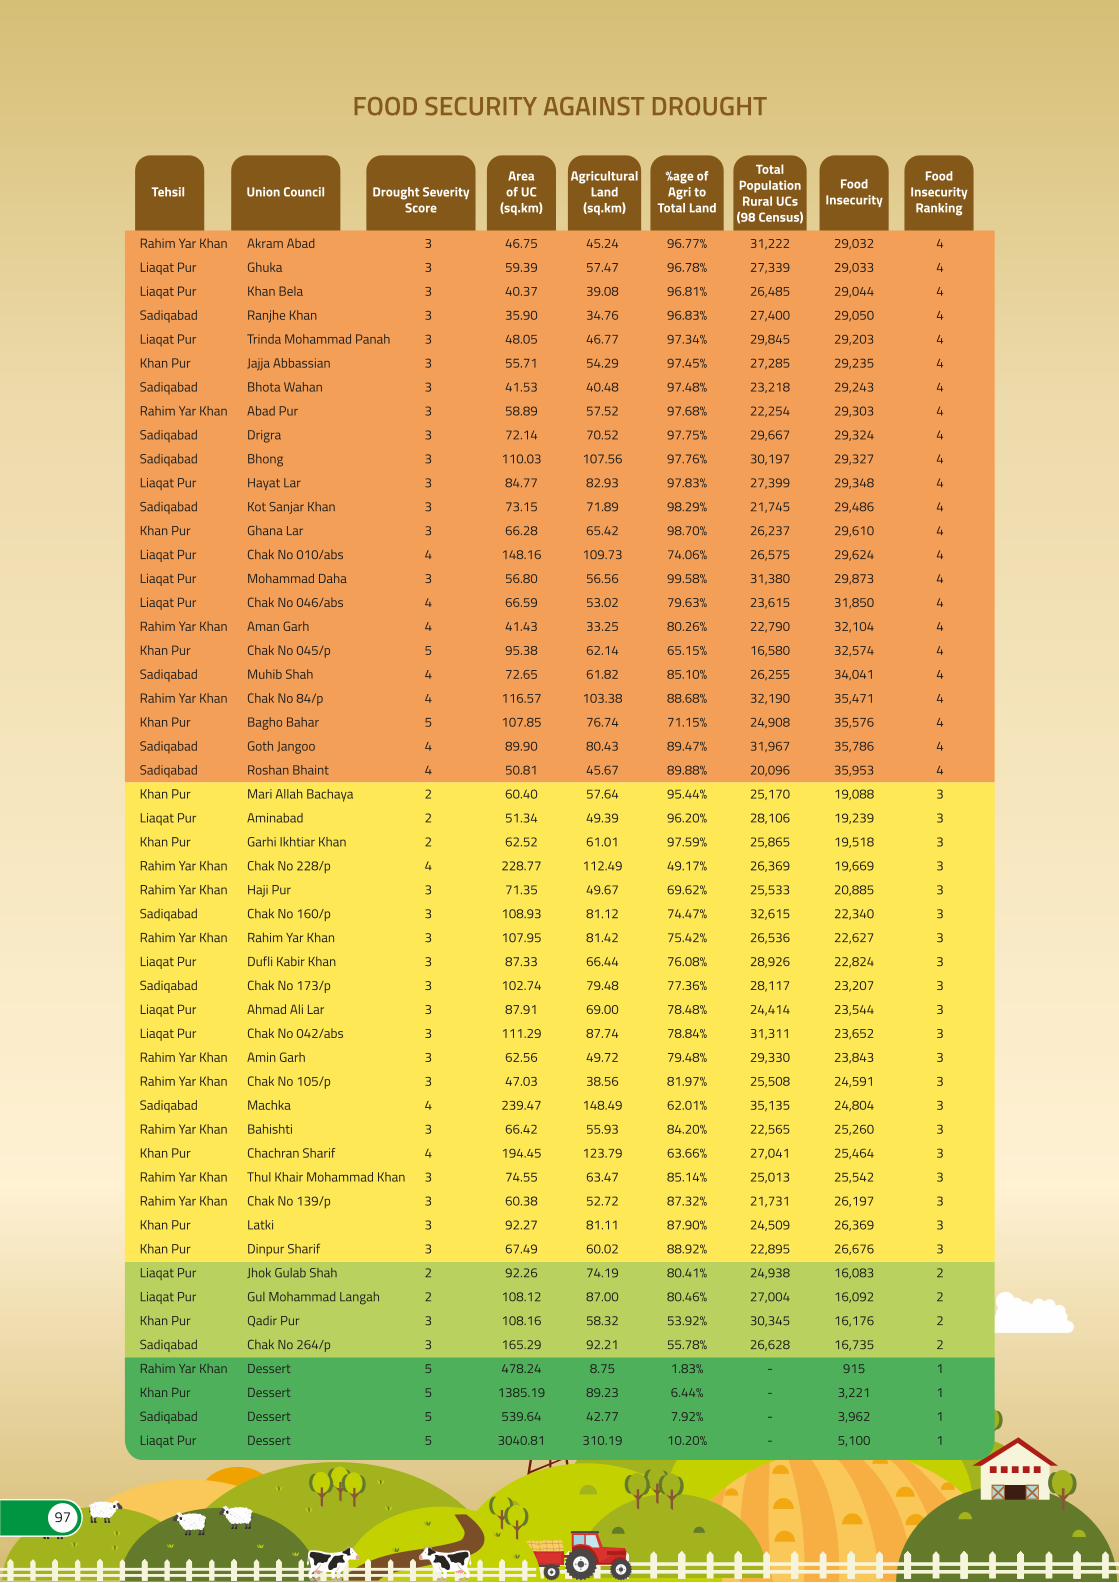
FOOD SECURITY AGAINST DROUGHT
AgriculturalLand
(sq.km)
%age ofAgri to
Total Land
TotalPopulationRural UCs
(98 Census)
FoodInsecurity
FoodInsecurityRanking
Rahim Yar Khan
Liaqat Pur
Liaqat Pur
Sadiqabad
Liaqat Pur
Khan Pur
Sadiqabad
Rahim Yar Khan
Sadiqabad
Sadiqabad
Liaqat Pur
Sadiqabad
Khan Pur
Liaqat Pur
Liaqat Pur
Liaqat Pur
Rahim Yar Khan
Khan Pur
Sadiqabad
Rahim Yar Khan
Khan Pur
Sadiqabad
Sadiqabad
Khan Pur
Liaqat Pur
Khan Pur
Rahim Yar Khan
Rahim Yar Khan
Sadiqabad
Rahim Yar Khan
Liaqat Pur
Sadiqabad
Liaqat Pur
Liaqat Pur
Rahim Yar Khan
Rahim Yar Khan
Sadiqabad
Rahim Yar Khan
Khan Pur
Rahim Yar Khan
Rahim Yar Khan
Khan Pur
Khan Pur
Liaqat Pur
Liaqat Pur
Khan Pur
Sadiqabad
Rahim Yar Khan
Khan Pur
Sadiqabad
Liaqat Pur
46.75
59.39
40.37
35.90
48.05
55.71
41.53
58.89
72.14
110.03
84.77
73.15
66.28
148.16
56.80
66.59
41.43
95.38
72.65
116.57
107.85
89.90
50.81
60.40
51.34
62.52
228.77
71.35
108.93
107.95
87.33
102.74
87.91
111.29
62.56
47.03
239.47
66.42
194.45
74.55
60.38
92.27
67.49
92.26
108.12
108.16
165.29
478.24
1385.19
539.64
3040.81
45.24
57.47
39.08
34.76
46.77
54.29
40.48
57.52
70.52
107.56
82.93
71.89
65.42
109.73
56.56
53.02
33.25
62.14
61.82
103.38
76.74
80.43
45.67
57.64
49.39
61.01
112.49
49.67
81.12
81.42
66.44
79.48
69.00
87.74
49.72
38.56
148.49
55.93
123.79
63.47
52.72
81.11
60.02
74.19
87.00
58.32
92.21
8.75
89.23
42.77
310.19
96.77%
96.78%
96.81%
96.83%
97.34%
97.45%
97.48%
97.68%
97.75%
97.76%
97.83%
98.29%
98.70%
74.06%
99.58%
79.63%
80.26%
65.15%
85.10%
88.68%
71.15%
89.47%
89.88%
95.44%
96.20%
97.59%
49.17%
69.62%
74.47%
75.42%
76.08%
77.36%
78.48%
78.84%
79.48%
81.97%
62.01%
84.20%
63.66%
85.14%
87.32%
87.90%
88.92%
80.41%
80.46%
53.92%
55.78%
1.83%
6.44%
7.92%
10.20%
31,222
27,339
26,485
27,400
29,845
27,285
23,218
22,254
29,667
30,197
27,399
21,745
26,237
26,575
31,380
23,615
22,790
16,580
26,255
32,190
24,908
31,967
20,096
25,170
28,106
25,865
26,369
25,533
32,615
26,536
28,926
28,117
24,414
31,311
29,330
25,508
35,135
22,565
27,041
25,013
21,731
24,509
22,895
24,938
27,004
30,345
26,628
-
-
-
-
29,032
29,033
29,044
29,050
29,203
29,235
29,243
29,303
29,324
29,327
29,348
29,486
29,610
29,624
29,873
31,850
32,104
32,574
34,041
35,471
35,576
35,786
35,953
19,088
19,239
19,518
19,669
20,885
22,340
22,627
22,824
23,207
23,544
23,652
23,843
24,591
24,804
25,260
25,464
25,542
26,197
26,369
26,676
16,083
16,092
16,176
16,735
915
3,221
3,962
5,100
4
4
4
4
4
4
4
4
4
4
4
4
4
4
4
4
4
4
4
4
4
4
4
3
3
3
3
3
3
3
3
3
3
3
3
3
3
3
3
3
3
3
3
2
2
2
2
1
1
1
1
Akram Abad
Ghuka
Khan Bela
Ranjhe Khan
Trinda Mohammad Panah
Jajja Abbassian
Bhota Wahan
Abad Pur
Drigra
Bhong
Hayat Lar
Kot Sanjar Khan
Ghana Lar
Chak No 010/abs
Mohammad Daha
Chak No 046/abs
Aman Garh
Chak No 045/p
Muhib Shah
Chak No 84/p
Bagho Bahar
Goth Jangoo
Roshan Bhaint
Mari Allah Bachaya
Aminabad
Garhi Ikhtiar Khan
Chak No 228/p
Haji Pur
Chak No 160/p
Rahim Yar Khan
Dufli Kabir Khan
Chak No 173/p
Ahmad Ali Lar
Chak No 042/abs
Amin Garh
Chak No 105/p
Machka
Bahishti
Chachran Sharif
Thul Khair Mohammad Khan
Chak No 139/p
Latki
Dinpur Sharif
Jhok Gulab Shah
Gul Mohammad Langah
Qadir Pur
Chak No 264/p
Dessert
Dessert
Dessert
Dessert
3
3
3
3
3
3
3
3
3
3
3
3
3
4
3
4
4
5
4
4
5
4
4
2
2
2
4
3
3
3
3
3
3
3
3
3
4
3
4
3
3
3
3
2
2
3
3
5
5
5
5
Tehsil Drought SeverityScore
Union CouncilAreaof UC
(sq.km)
97
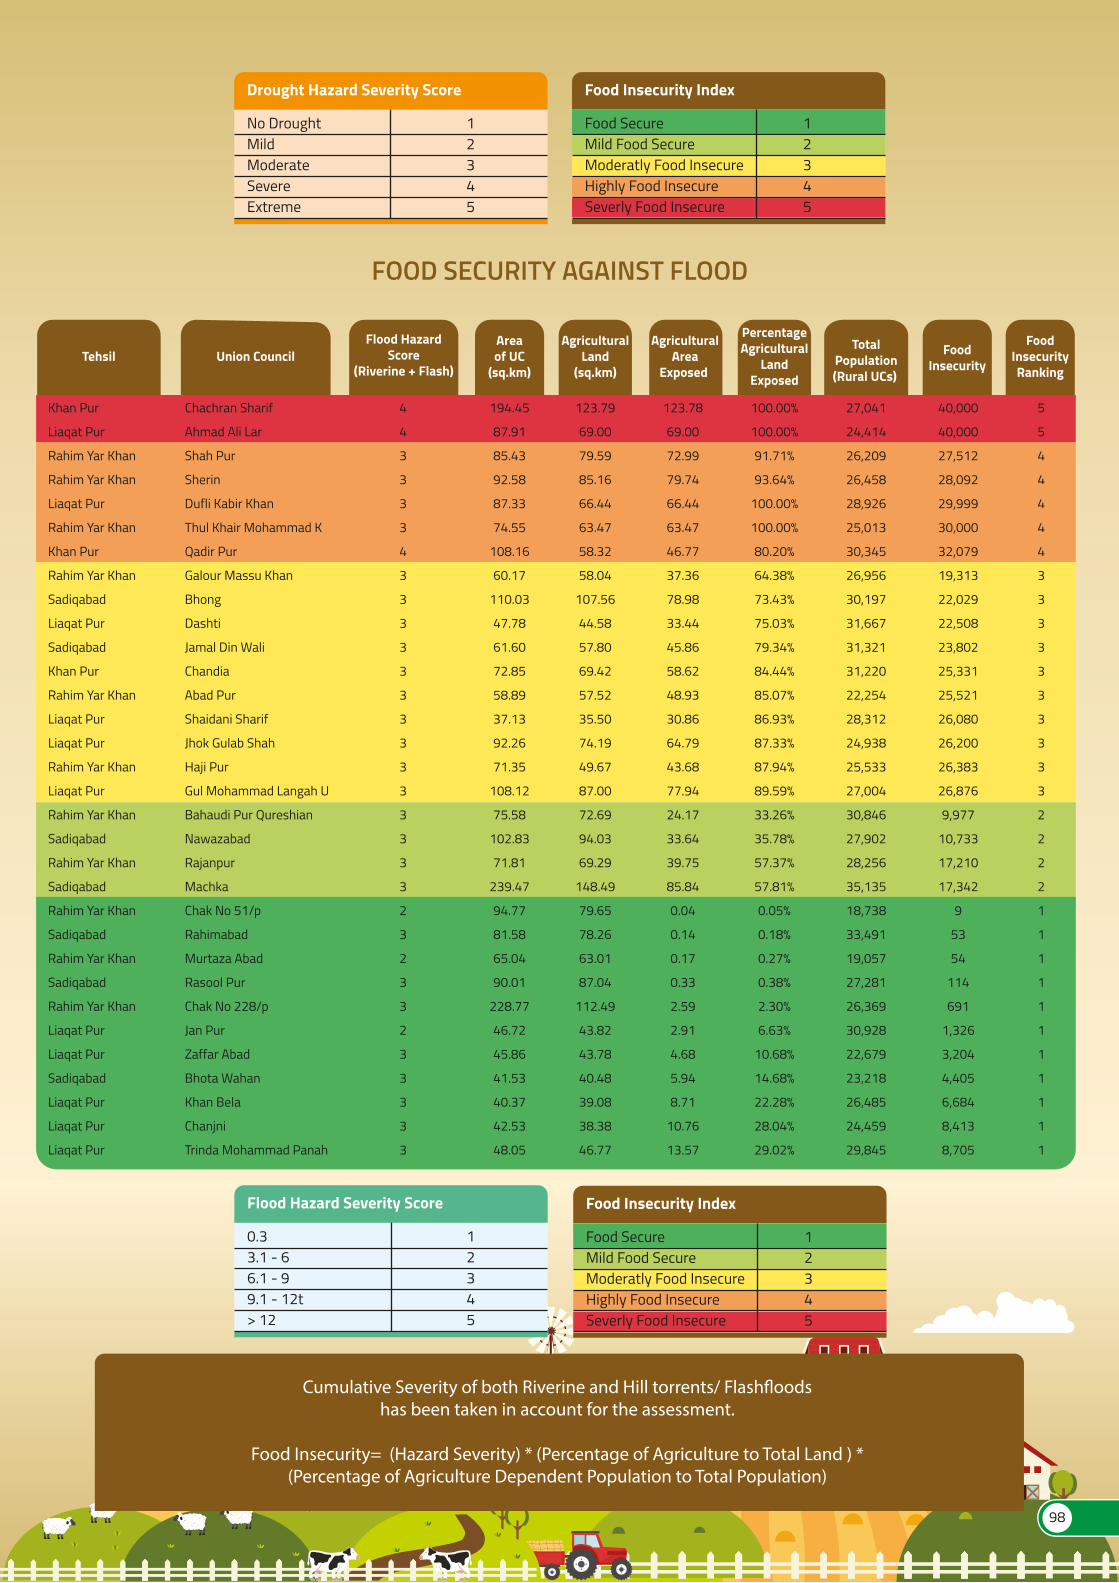
Drought Hazard Severity Score
No DroughtMildModerateSevereExtreme
12345
Food Insecurity Index
Food SecureMild Food SecureModeratly Food InsecureHighly Food InsecureSeverly Food Insecure
12345
FOOD SECURITY AGAINST FLOOD
FoodInsecurityRanking
AgriculturalArea
Exposed
AgriculturalLand
(sq.km)
PercentageAgricultural
LandExposed
TotalPopulation(Rural UCs)
FoodInsecurity
Khan Pur
Liaqat Pur
Rahim Yar Khan
Rahim Yar Khan
Liaqat Pur
Rahim Yar Khan
Khan Pur
Rahim Yar Khan
Sadiqabad
Liaqat Pur
Sadiqabad
Khan Pur
Rahim Yar Khan
Liaqat Pur
Liaqat Pur
Rahim Yar Khan
Liaqat Pur
Rahim Yar Khan
Sadiqabad
Rahim Yar Khan
Sadiqabad
Rahim Yar Khan
Sadiqabad
Rahim Yar Khan
Sadiqabad
Rahim Yar Khan
Liaqat Pur
Liaqat Pur
Sadiqabad
Liaqat Pur
Liaqat Pur
Liaqat Pur
194.45
87.91
85.43
92.58
87.33
74.55
108.16
60.17
110.03
47.78
61.60
72.85
58.89
37.13
92.26
71.35
108.12
75.58
102.83
71.81
239.47
94.77
81.58
65.04
90.01
228.77
46.72
45.86
41.53
40.37
42.53
48.05
123.78
69.00
72.99
79.74
66.44
63.47
46.77
37.36
78.98
33.44
45.86
58.62
48.93
30.86
64.79
43.68
77.94
24.17
33.64
39.75
85.84
0.04
0.14
0.17
0.33
2.59
2.91
4.68
5.94
8.71
10.76
13.57
123.79
69.00
79.59
85.16
66.44
63.47
58.32
58.04
107.56
44.58
57.80
69.42
57.52
35.50
74.19
49.67
87.00
72.69
94.03
69.29
148.49
79.65
78.26
63.01
87.04
112.49
43.82
43.78
40.48
39.08
38.38
46.77
100.00%
100.00%
91.71%
93.64%
100.00%
100.00%
80.20%
64.38%
73.43%
75.03%
79.34%
84.44%
85.07%
86.93%
87.33%
87.94%
89.59%
33.26%
35.78%
57.37%
57.81%
0.05%
0.18%
0.27%
0.38%
2.30%
6.63%
10.68%
14.68%
22.28%
28.04%
29.02%
27,041
24,414
26,209
26,458
28,926
25,013
30,345
26,956
30,197
31,667
31,321
31,220
22,254
28,312
24,938
25,533
27,004
30,846
27,902
28,256
35,135
18,738
33,491
19,057
27,281
26,369
30,928
22,679
23,218
26,485
24,459
29,845
40,000
40,000
27,512
28,092
29,999
30,000
32,079
19,313
22,029
22,508
23,802
25,331
25,521
26,080
26,200
26,383
26,876
9,977
10,733
17,210
17,342
9
53
54
114
691
1,326
3,204
4,405
6,684
8,413
8,705
5
5
4
4
4
4
4
3
3
3
3
3
3
3
3
3
3
2
2
2
2
1
1
1
1
1
1
1
1
1
1
1
Chachran Sharif
Ahmad Ali Lar
Shah Pur
Sherin
Dufli Kabir Khan
Thul Khair Mohammad K
Qadir Pur
Galour Massu Khan
Bhong
Dashti
Jamal Din Wali
Chandia
Abad Pur
Shaidani Sharif
Jhok Gulab Shah
Haji Pur
Gul Mohammad Langah U
Bahaudi Pur Qureshian
Nawazabad
Rajanpur
Machka
Chak No 51/p
Rahimabad
Murtaza Abad
Rasool Pur
Chak No 228/p
Jan Pur
Zaffar Abad
Bhota Wahan
Khan Bela
Chanjni
Trinda Mohammad Panah
4
4
3
3
3
3
4
3
3
3
3
3
3
3
3
3
3
3
3
3
3
2
3
2
3
3
2
3
3
3
3
3
TehsilFlood Hazard
Score(Riverine + Flash)
Union CouncilAreaof UC
(sq.km)
98
Flood Hazard Severity Score
0.33.1 - 66.1 - 99.1 - 12t> 12
12345
Food Insecurity Index
Food SecureMild Food SecureModeratly Food InsecureHighly Food InsecureSeverly Food Insecure
12345
Cumulative Severity of both Riverine and Hill torrents/ Flash�oodshas been taken in account for the assessment.
Food Insecurity= (Hazard Severity) * (Percentage of Agriculture to Total Land ) *(Percentage of Agriculture Dependent Population to Total Population)

99
100
PopulationDensity
BuildingDensity
HealthFacilities
CommunicationTowers
MajorIndustries
Roads
EducationFacilities
Railway CriticalInfrastructure
E RISK ASSESSMENT
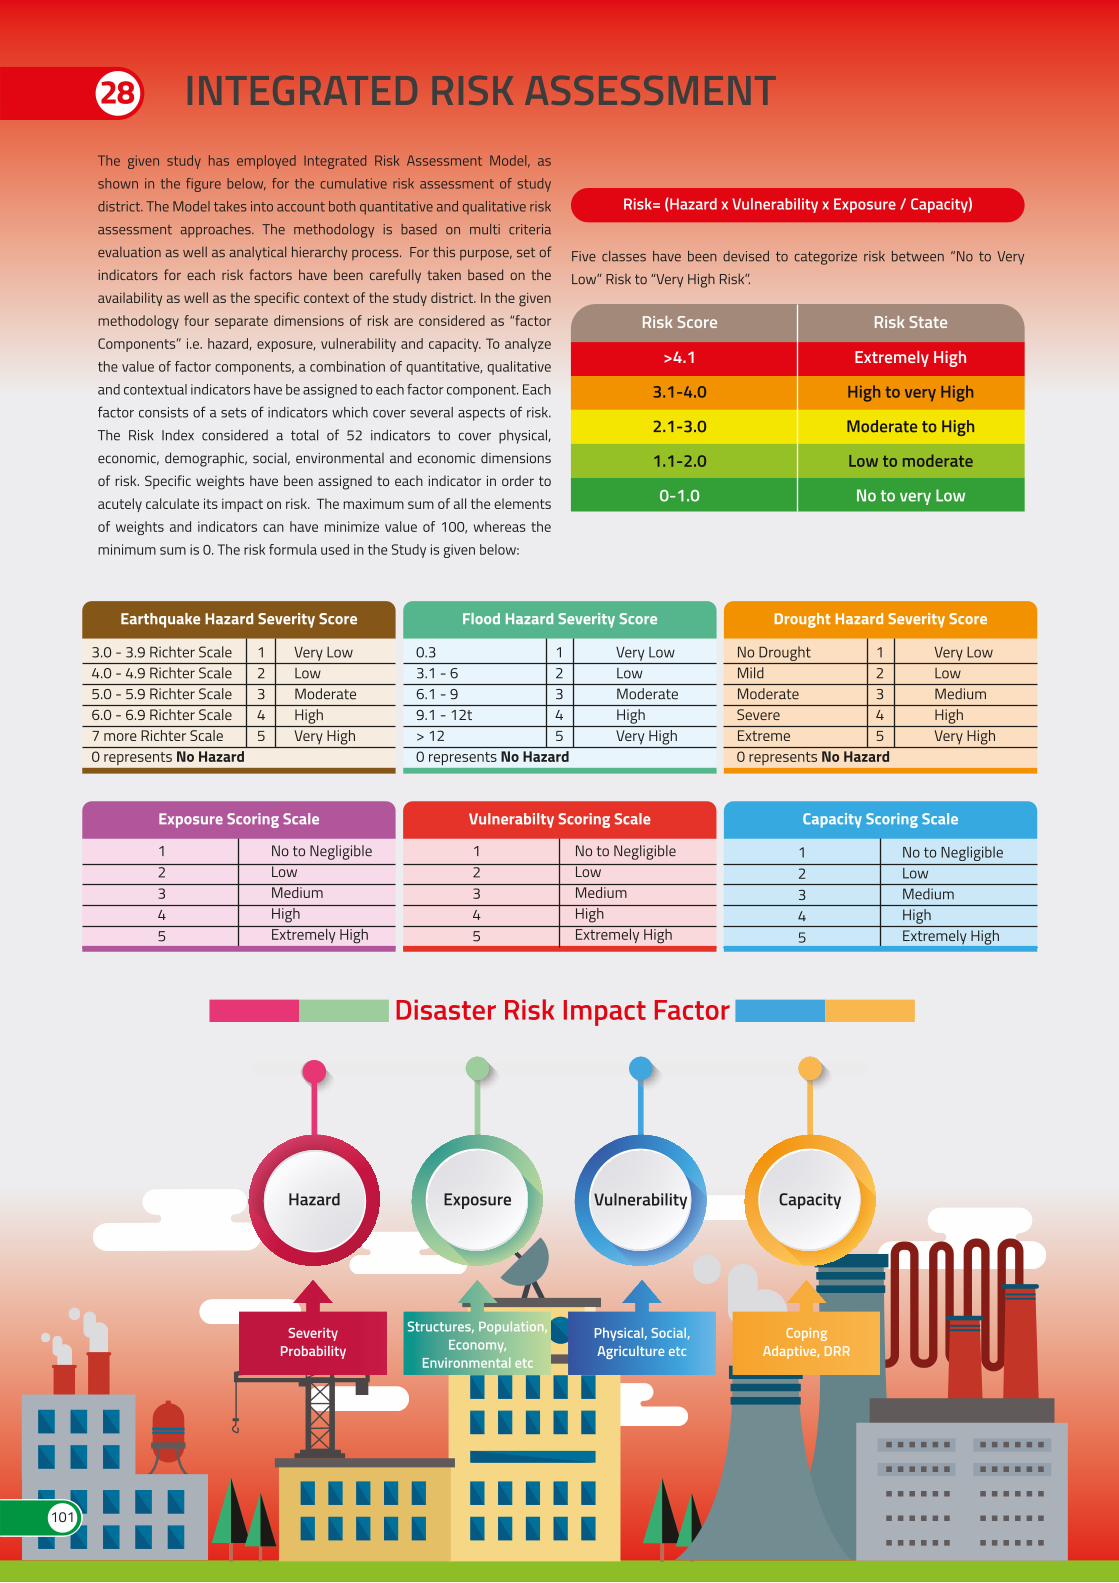
INTEGRATED RISK ASSESSMENTThe given study has employed Integrated Risk Assessment Model, as shown in the figure below, for the cumulative risk assessment of study district. The Model takes into account both quantitative and qualitative risk assessment approaches. The methodology is based on multi criteria evaluation as well as analytical hierarchy process. For this purpose, set of indicators for each risk factors have been carefully taken based on the availability as well as the specific context of the study district. In the given methodology four separate dimensions of risk are considered as “factor Components” i.e. hazard, exposure, vulnerability and capacity. To analyze the value of factor components, a combination of quantitative, qualitative and contextual indicators have be assigned to each factor component. Each factor consists of a sets of indicators which cover several aspects of risk. The Risk Index considered a total of 52 indicators to cover physical, economic, demographic, social, environmental and economic dimensions of risk. Specific weights have been assigned to each indicator in order to acutely calculate its impact on risk. The maximum sum of all the elements of weights and indicators can have minimize value of 100, whereas the minimum sum is 0. The risk formula used in the Study is given below:
Five classes have been devised to categorize risk between “No to Very Low” Risk to “Very High Risk”.
Risk= (Hazard x Vulnerability x Exposure / Capacity)
28
Disaster Risk Impact Factor
Hazard Exposure Vulnerability Capacity
SeverityProbability
Structures, Population,Economy,
Environmental etc
Physical, Social,Agriculture etc
CopingAdaptive, DRR
Earthquake Hazard Severity Score
3.0 - 3.9 Richter Scale4.0 - 4.9 Richter Scale5.0 - 5.9 Richter Scale6.0 - 6.9 Richter Scale7 more Richter Scale0 represents No Hazard
12345
Very LowLowModerateHighVery High
Flood Hazard Severity Score
0.33.1 - 66.1 - 99.1 - 12t> 120 represents No Hazard
Very LowLowModerateHighVery High
12345
Drought Hazard Severity Score
No DroughtMildModerateSevereExtreme0 represents No Hazard
Very LowLowMediumHighVery High
12345
Exposure Scoring Scale
12345
No to NegligibleLowMediumHighExtremely High
Vulnerabilty Scoring Scale
12345
No to NegligibleLowMediumHighExtremely High
Capacity Scoring Scale
12345
No to NegligibleLowMediumHighExtremely High
Risk Score Risk State
>4.1
3.1-4.0
2.1-3.0
1.1-2.0
0-1.0
Extremely High
High to very High
Moderate to High
Low to moderate
No to very Low
101
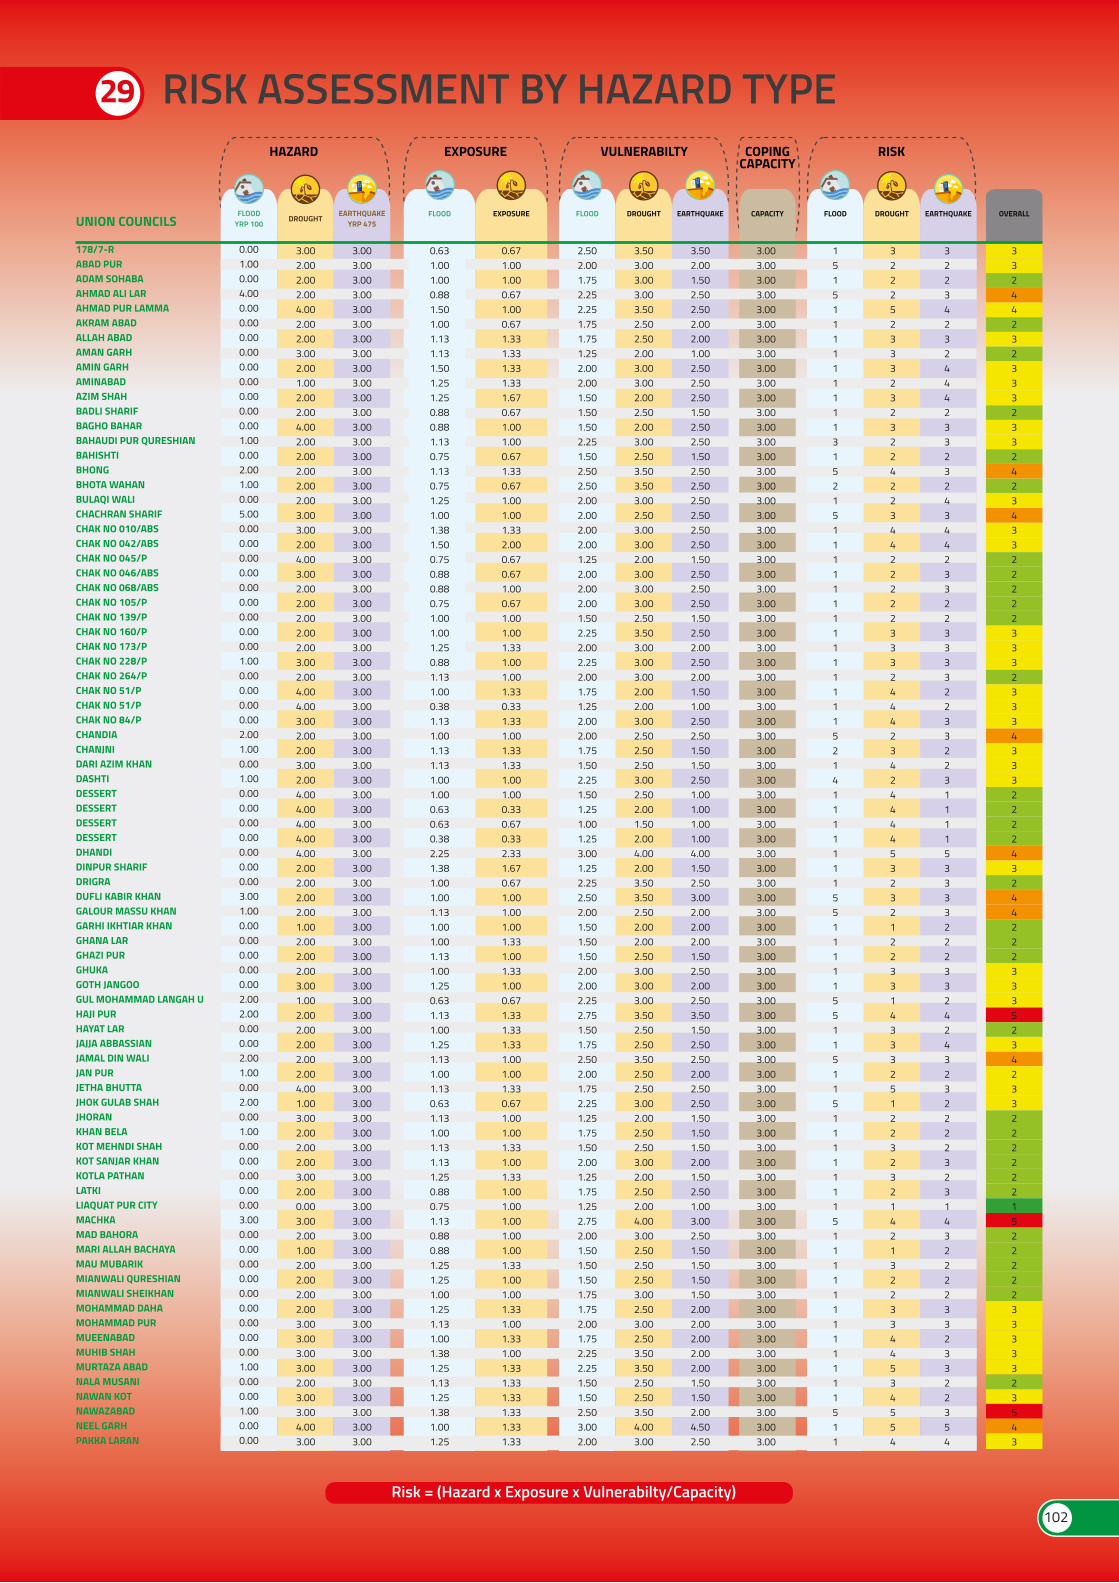
Risk = (Hazard x Exposure x Vulnerabilty/Capacity)
CAPACITY OVERALLFLOOD DROUGHT EARTHQUAKEFLOODYRP 100
DROUGHTEARTHQUAKE
YRP 475FLOOD DROUGHTFLOOD EXPOSURE EARTHQUAKE
3.002.002.002.004.002.002.003.002.001.002.002.004.002.002.002.002.002.003.003.002.004.003.002.002.002.002.002.003.002.004.004.003.002.002.003.002.004.004.004.004.004.002.002.002.002.001.002.002.002.003.001.002.002.002.002.002.004.001.003.002.002.002.003.002.000.003.002.001.002.002.002.002.003.003.003.003.002.003.003.004.003.00
3.003.003.003.003.003.003.003.003.003.003.003.003.003.003.003.003.003.003.003.003.003.003.003.003.003.003.003.003.003.003.003.003.003.003.003.003.003.003.003.003.003.003.003.003.003.003.003.003.003.003.003.003.003.003.003.003.003.003.003.003.003.003.003.003.003.003.003.003.003.003.003.003.003.003.003.003.003.003.003.003.003.00
0.001.000.004.000.000.000.000.000.000.000.000.000.001.000.002.001.000.005.000.000.000.000.000.000.000.000.000.001.000.000.000.000.002.001.000.001.000.000.000.000.000.000.000.003.001.000.000.000.000.000.002.002.000.000.002.001.000.002.000.001.000.000.000.000.000.003.000.000.000.000.000.000.000.000.000.001.000.000.001.000.000.00
0.631.001.000.881.501.001.131.131.501.251.250.880.881.130.751.130.751.251.001.381.500.750.880.880.751.001.001.250.881.131.000.381.131.001.131.131.001.000.630.630.382.251.381.001.001.131.001.001.131.001.250.631.131.001.251.131.001.130.631.131.001.131.131.250.880.751.130.880.881.251.251.001.251.131.001.381.251.131.251.381.001.25
0.671.001.000.671.000.671.331.331.331.331.670.671.001.000.671.330.671.001.001.332.000.670.671.000.671.001.001.331.001.001.330.331.331.001.331.331.001.000.330.670.332.331.670.671.001.001.001.331.001.331.000.671.331.331.331.001.001.330.671.001.001.331.001.331.001.001.001.001.001.331.001.001.331.001.331.001.331.331.331.331.331.33
2.502.001.752.252.251.751.751.252.002.001.501.501.502.251.502.502.502.002.002.002.001.252.002.002.001.502.252.002.252.001.751.252.002.001.751.502.251.501.251.001.253.001.252.252.502.001.501.501.502.002.002.252.751.501.752.502.001.752.251.251.751.502.001.251.751.252.752.001.501.501.501.751.752.001.752.252.251.501.502.503.002.00
3.503.003.003.003.502.502.502.003.003.002.002.502.003.002.503.503.503.002.503.003.002.003.003.003.002.503.503.003.003.002.002.003.002.502.502.503.002.502.001.502.004.002.003.503.502.502.002.002.503.003.003.003.502.502.503.502.502.503.002.002.502.503.002.002.502.004.003.002.502.502.503.002.503.002.503.503.502.502.503.504.003.00
3.502.001.502.502.502.002.001.002.502.502.501.502.502.501.502.502.502.502.502.502.501.502.502.502.501.502.502.002.502.001.501.002.502.501.501.502.501.001.001.001.004.001.502.503.002.002.002.001.502.502.002.503.501.502.502.502.002.502.501.501.501.502.001.502.501.003.002.501.501.501.501.502.002.002.002.002.001.501.502.004.502.50
1515111111111315215111111111111115214111111155111115511511511111115111111111111511
3222523332323224223442222233324442342444453232122331433325122323214213223344534554
3223423244423323243442332233332233223111153333222332424323222232314322223323322354
3324423233323324234332222233323334333222243244222333523423322222215222223333323543
3.003.003.003.003.003.003.003.003.003.003.003.003.003.003.003.003.003.003.003.003.003.003.003.003.003.003.003.003.003.003.003.003.003.003.003.003.003.003.003.003.003.003.003.003.003.003.003.003.003.003.003.003.003.003.003.003.003.003.003.003.003.003.003.003.003.003.003.003.003.003.003.003.003.003.003.003.003.003.003.003.003.00
178/7-RABAD PURADAM SOHABAAHMAD ALI LARAHMAD PUR LAMMAAKRAM ABADALLAH ABADAMAN GARHAMIN GARHAMINABADAZIM SHAHBADLI SHARIFBAGHO BAHARBAHAUDI PUR QURESHIANBAHISHTIBHONGBHOTA WAHANBULAQI WALICHACHRAN SHARIFCHAK NO 010/ABSCHAK NO 042/ABSCHAK NO 045/PCHAK NO 046/ABSCHAK NO 068/ABSCHAK NO 105/PCHAK NO 139/PCHAK NO 160/PCHAK NO 173/PCHAK NO 228/PCHAK NO 264/PCHAK NO 51/PCHAK NO 51/PCHAK NO 84/PCHANDIACHANJNIDARI AZIM KHANDASHTIDESSERTDESSERTDESSERTDESSERTDHANDIDINPUR SHARIFDRIGRADUFLI KABIR KHANGALOUR MASSU KHANGARHI IKHTIAR KHANGHANA LARGHAZI PURGHUKAGOTH JANGOOGUL MOHAMMAD LANGAH UHAJI PURHAYAT LARJAJJA ABBASSIANJAMAL DIN WALIJAN PURJETHA BHUTTAJHOK GULAB SHAHJHORANKHAN BELAKOT MEHNDI SHAHKOT SANJAR KHANKOTLA PATHANLATKILIAQUAT PUR CITYMACHKAMAD BAHORAMARI ALLAH BACHAYAMAU MUBARIKMIANWALI QURESHIANMIANWALI SHEIKHANMOHAMMAD DAHAMOHAMMAD PURMUEENABADMUHIB SHAHMURTAZA ABADNALA MUSANINAWAN KOTNAWAZABADNEEL GARHPAKKA LARAN
UNION COUNCILS
HAZARD EXPOSURE VULNERABILTY RISKCOPINGCAPACITY
29 RISK ASSESSMENT BY HAZARD TYPE
102
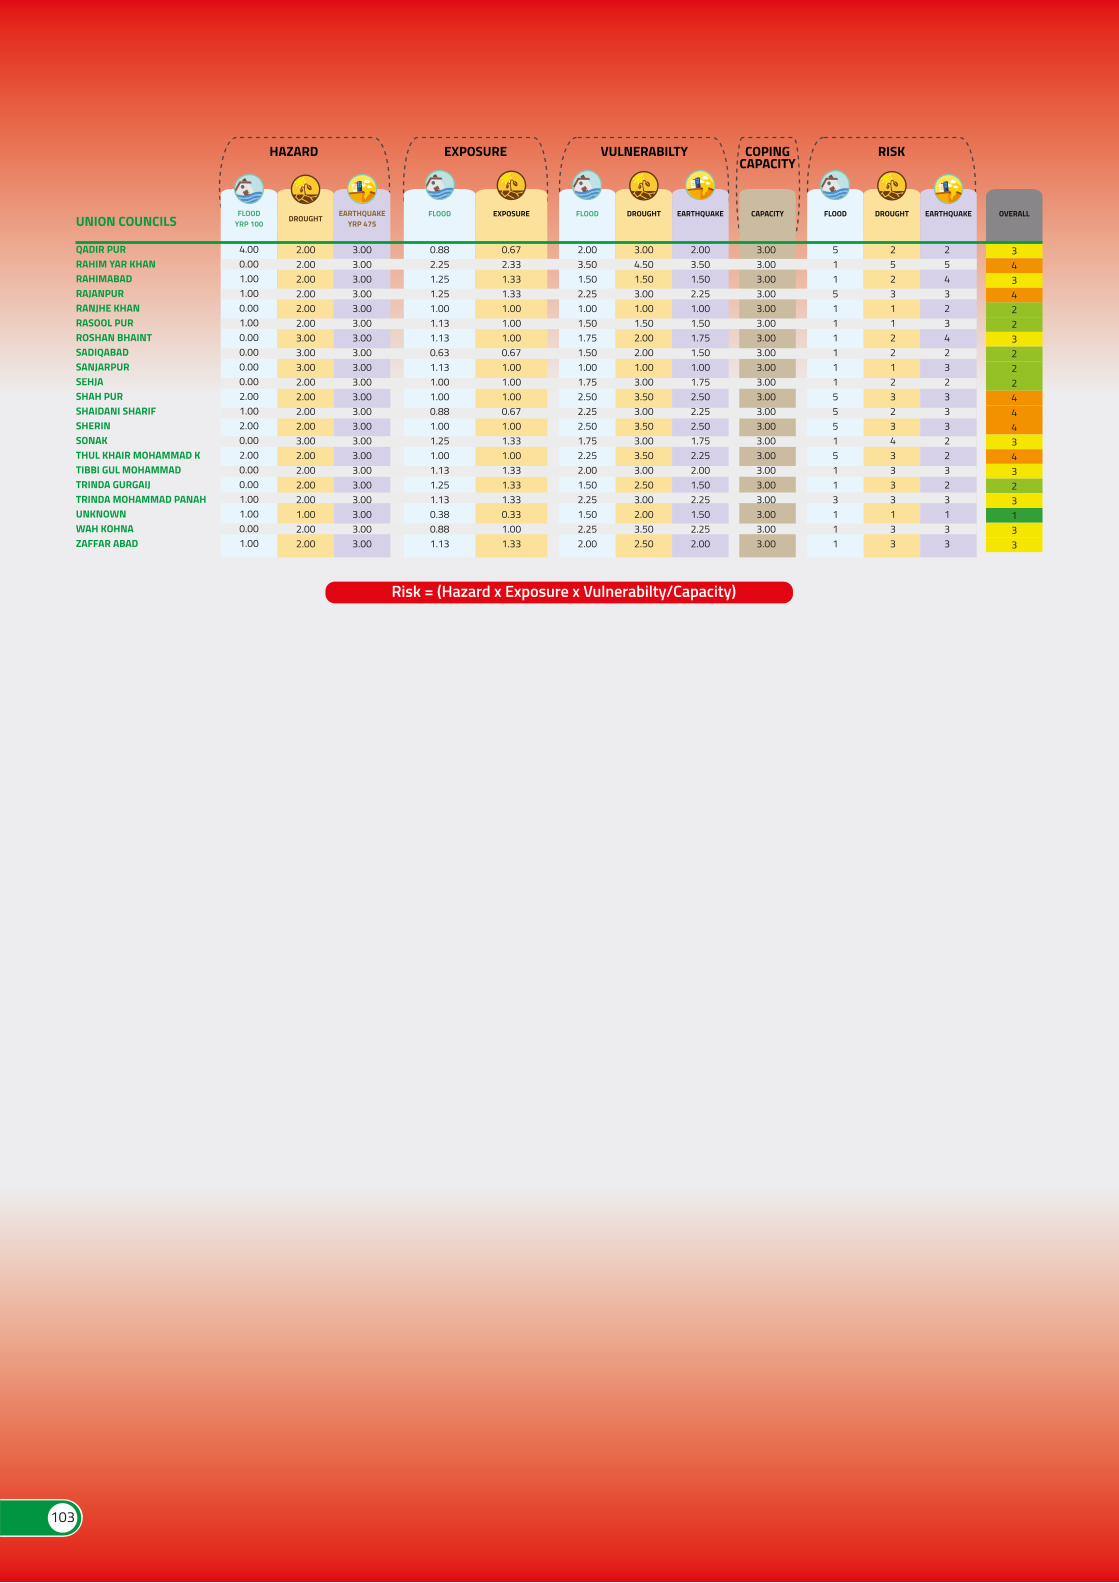
Risk = (Hazard x Exposure x Vulnerabilty/Capacity)
CAPACITY OVERALLFLOOD DROUGHT EARTHQUAKEFLOODYRP 100
DROUGHTEARTHQUAKE
YRP 475FLOOD DROUGHTFLOOD EXPOSURE EARTHQUAKE
2.002.002.002.002.002.003.003.003.002.002.002.002.003.002.002.002.002.001.002.002.00
3.003.003.003.003.003.003.003.003.003.003.003.003.003.003.003.003.003.003.003.003.00
4.000.001.001.000.001.000.000.000.000.002.001.002.000.002.000.000.001.001.000.001.00
0.882.251.251.251.001.131.130.631.131.001.000.881.001.251.001.131.251.130.380.881.13
0.672.331.331.331.001.001.000.671.001.001.000.671.001.331.001.331.331.330.331.001.33
2.003.501.502.251.001.501.751.501.001.752.502.252.501.752.252.001.502.251.502.252.00
3.004.501.503.001.001.502.002.001.003.003.503.003.503.003.503.002.503.002.003.502.50
2.003.501.502.251.001.501.751.501.001.752.502.252.501.752.252.001.502.251.502.252.00
511511111155515113111
252311221232343333133
254323423233322323133
343422322244434323133
3.003.003.003.003.003.003.003.003.003.003.003.003.003.003.003.003.003.003.003.003.00
QADIR PURRAHIM YAR KHANRAHIMABADRAJANPURRANJHE KHANRASOOL PURROSHAN BHAINTSADIQABADSANJARPURSEHJASHAH PURSHAIDANI SHARIFSHERINSONAKTHUL KHAIR MOHAMMAD KTIBBI GUL MOHAMMADTRINDA GURGAIJTRINDA MOHAMMAD PANAHUNKNOWNWAH KOHNAZAFFAR ABAD
UNION COUNCILS
HAZARD EXPOSURE VULNERABILTY RISKCOPINGCAPACITY
103
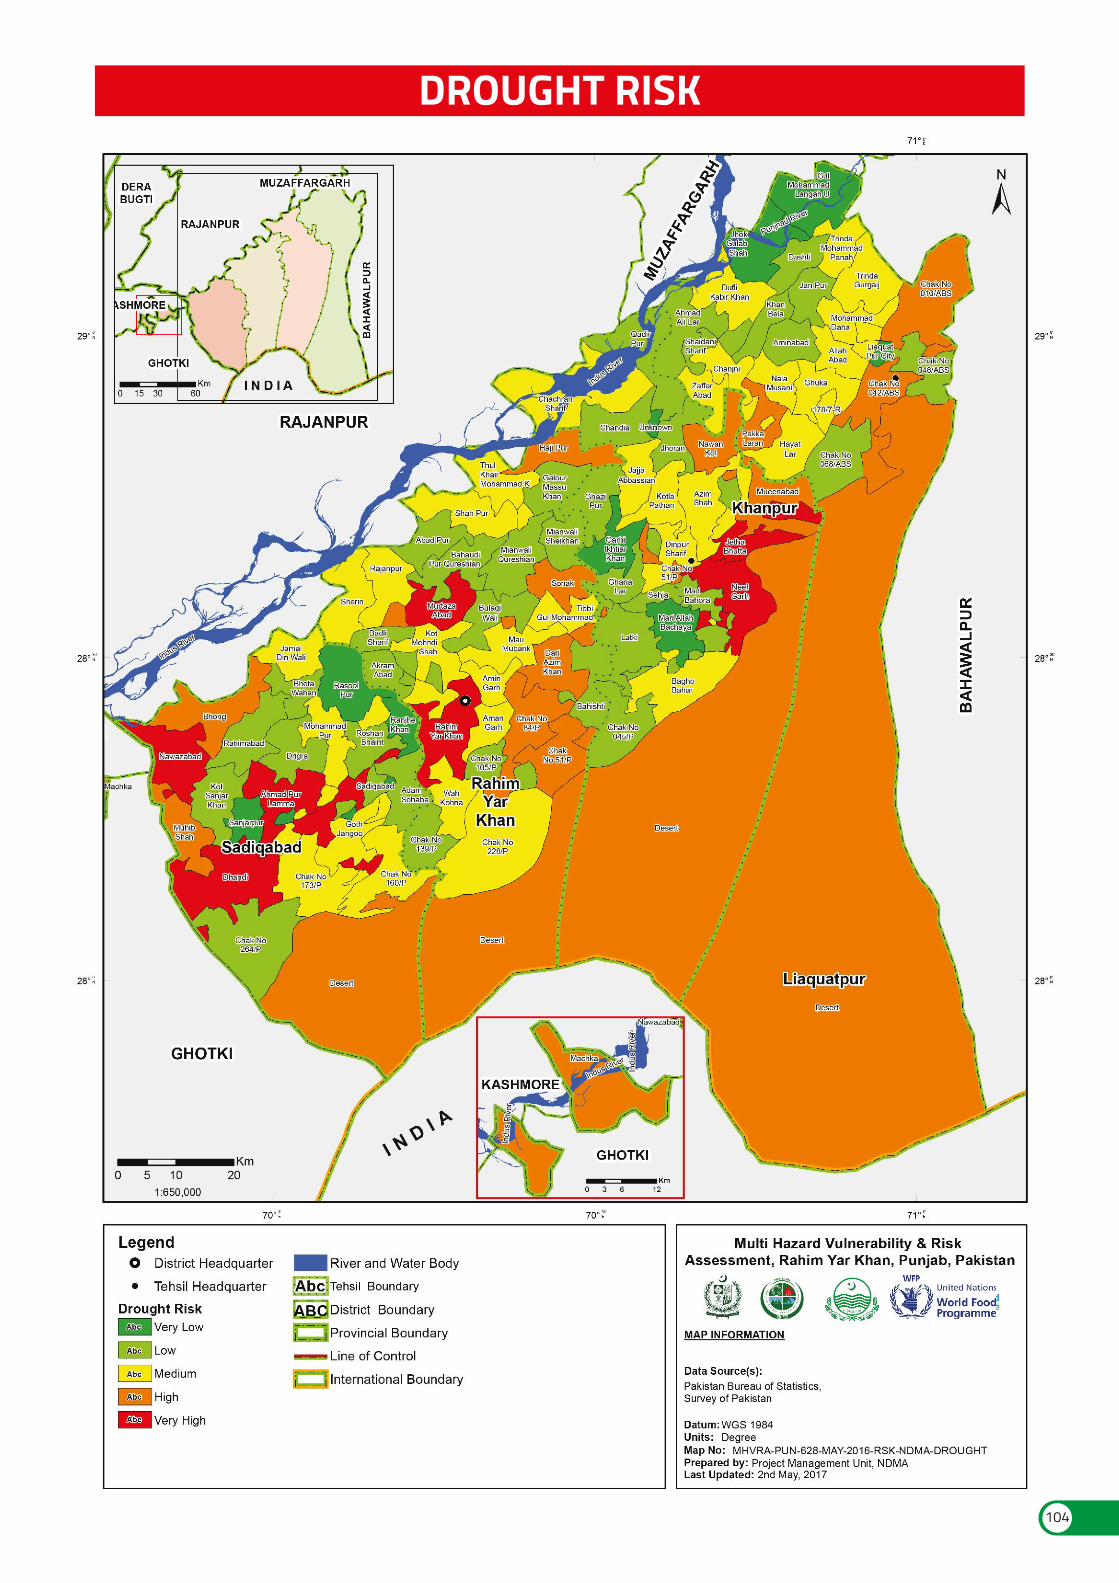
104
DROUGHT RISK Human-Made Disasters
Impacts
Indicators
Indices
Infant Mortality Rate
Irrigated Area
Irrigation Sources
Land Cover
Land Use
Land Use Planning
Landslide
Latitude
Longitude
Meander-Belt
Middle Schools
Mitigation
Monitoring & Evaluation (M&E)
Mortality Rate
Mouza / Deh
Multi Hazard Vulnerability and Risk Assessment (MHVRA)
Multi Hazards
National Authority
Natural Disasters
Nullah
Performance Indicator
Physical / Structural Vulnerability
Piedmont
Population Growth Rate
Population Projections
Precipitation
Preparedness
Prevention
Primary Healthcare
Primary School
Quality Assurance
Range Lands
Recovery
Relative Humidity
Reliability
Relief / Response
Residual Risk
Resilience
Retrofitting
Risk
Risk Assessment
Risk Management
Risk Transfer
River
Riverine Flood
Rural Area
Rural Health Centre (RHC)
Secondary Health Care
Secondary School or Higher School
Sedimentary Rocks
Slope Failure
Social Vulnerability
Steppe Climate
Storm Surge
Streambed
Structural / Non-Structural Measures
Sustainable Development
Tehsil Head Quarter (THQ)
Tertiary Healthcare
Tsunami
Unemployment
Urban Area
Urban Flood
Veterinary Facility
Vulnerability
Wet Areas
Wheat Procurement Centre
Acceptable Risk
Accountability
Activity
Adaptation
Affected Area
Alluvium Deposits
Avalanche
Average Household Size
Bare Area with Sparse Natural Vegetation
Bare Areas
Base-Line Study
Basic Health Unit (BHU)
Built-up Area
Capacity
Capacity Building
Census
Climate Change
Climatology
Coping Capacity
Craton
Critical Facilities
Crop Irrigated
Crop Marginal and Irrigated Saline
Crop Rainfed
Cyclone
Debris Flow
Demographics
Density
Disaster
Disaster Management
Disaster Risk
Disaster Risk Management (DRM)
Disaster Risk Reduction(DRR)
District Head Quarter (DHQ)
Drought
Early Warning
Earthquake
Effectiveness
Efficiency
Element at Risks
Elevation
Emergency Management
Employment
Entity
Eolian Deposits
Evaluation
Evaporites
Exposure
Flash Flood
Flood
Flood Plain Deposits
Food Insecurity
Forecast
Geography
Geological Composition
Geology
Geospatial Data Bank
GLOF
Hazard
Hazard Analysis
Hill Torrent (Flood)
Household
Human-Induced Disasters
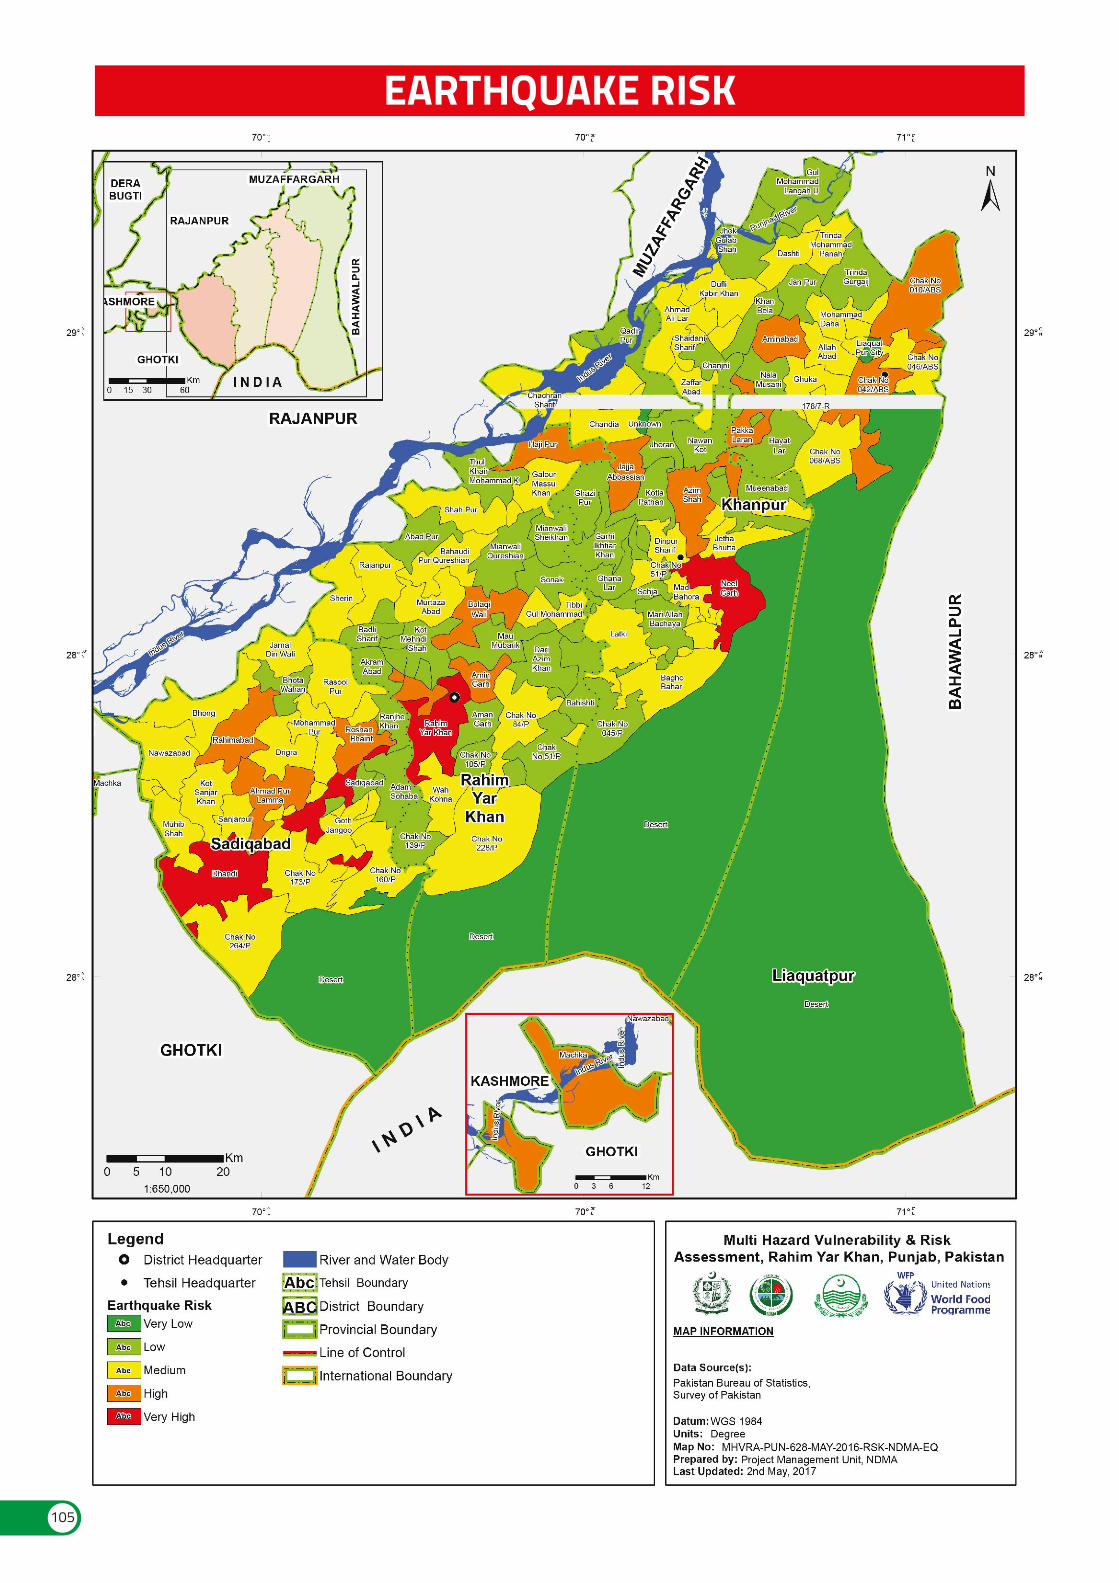
105
EARTHQUAKE RISK Human-Made Disasters
Impacts
Indicators
Indices
Infant Mortality Rate
Irrigated Area
Irrigation Sources
Land Cover
Land Use
Land Use Planning
Landslide
Latitude
Longitude
Meander-Belt
Middle Schools
Mitigation
Monitoring & Evaluation (M&E)
Mortality Rate
Mouza / Deh
Multi Hazard Vulnerability and Risk Assessment (MHVRA)
Multi Hazards
National Authority
Natural Disasters
Nullah
Performance Indicator
Physical / Structural Vulnerability
Piedmont
Population Growth Rate
Population Projections
Precipitation
Preparedness
Prevention
Primary Healthcare
Primary School
Quality Assurance
Range Lands
Recovery
Relative Humidity
Reliability
Relief / Response
Residual Risk
Resilience
Retrofitting
Risk
Risk Assessment
Risk Management
Risk Transfer
River
Riverine Flood
Rural Area
Rural Health Centre (RHC)
Secondary Health Care
Secondary School or Higher School
Sedimentary Rocks
Slope Failure
Social Vulnerability
Steppe Climate
Storm Surge
Streambed
Structural / Non-Structural Measures
Sustainable Development
Tehsil Head Quarter (THQ)
Tertiary Healthcare
Tsunami
Unemployment
Urban Area
Urban Flood
Veterinary Facility
Vulnerability
Wet Areas
Wheat Procurement Centre
Acceptable Risk
Accountability
Activity
Adaptation
Affected Area
Alluvium Deposits
Avalanche
Average Household Size
Bare Area with Sparse Natural Vegetation
Bare Areas
Base-Line Study
Basic Health Unit (BHU)
Built-up Area
Capacity
Capacity Building
Census
Climate Change
Climatology
Coping Capacity
Craton
Critical Facilities
Crop Irrigated
Crop Marginal and Irrigated Saline
Crop Rainfed
Cyclone
Debris Flow
Demographics
Density
Disaster
Disaster Management
Disaster Risk
Disaster Risk Management (DRM)
Disaster Risk Reduction(DRR)
District Head Quarter (DHQ)
Drought
Early Warning
Earthquake
Effectiveness
Efficiency
Element at Risks
Elevation
Emergency Management
Employment
Entity
Eolian Deposits
Evaluation
Evaporites
Exposure
Flash Flood
Flood
Flood Plain Deposits
Food Insecurity
Forecast
Geography
Geological Composition
Geology
Geospatial Data Bank
GLOF
Hazard
Hazard Analysis
Hill Torrent (Flood)
Household
Human-Induced Disasters
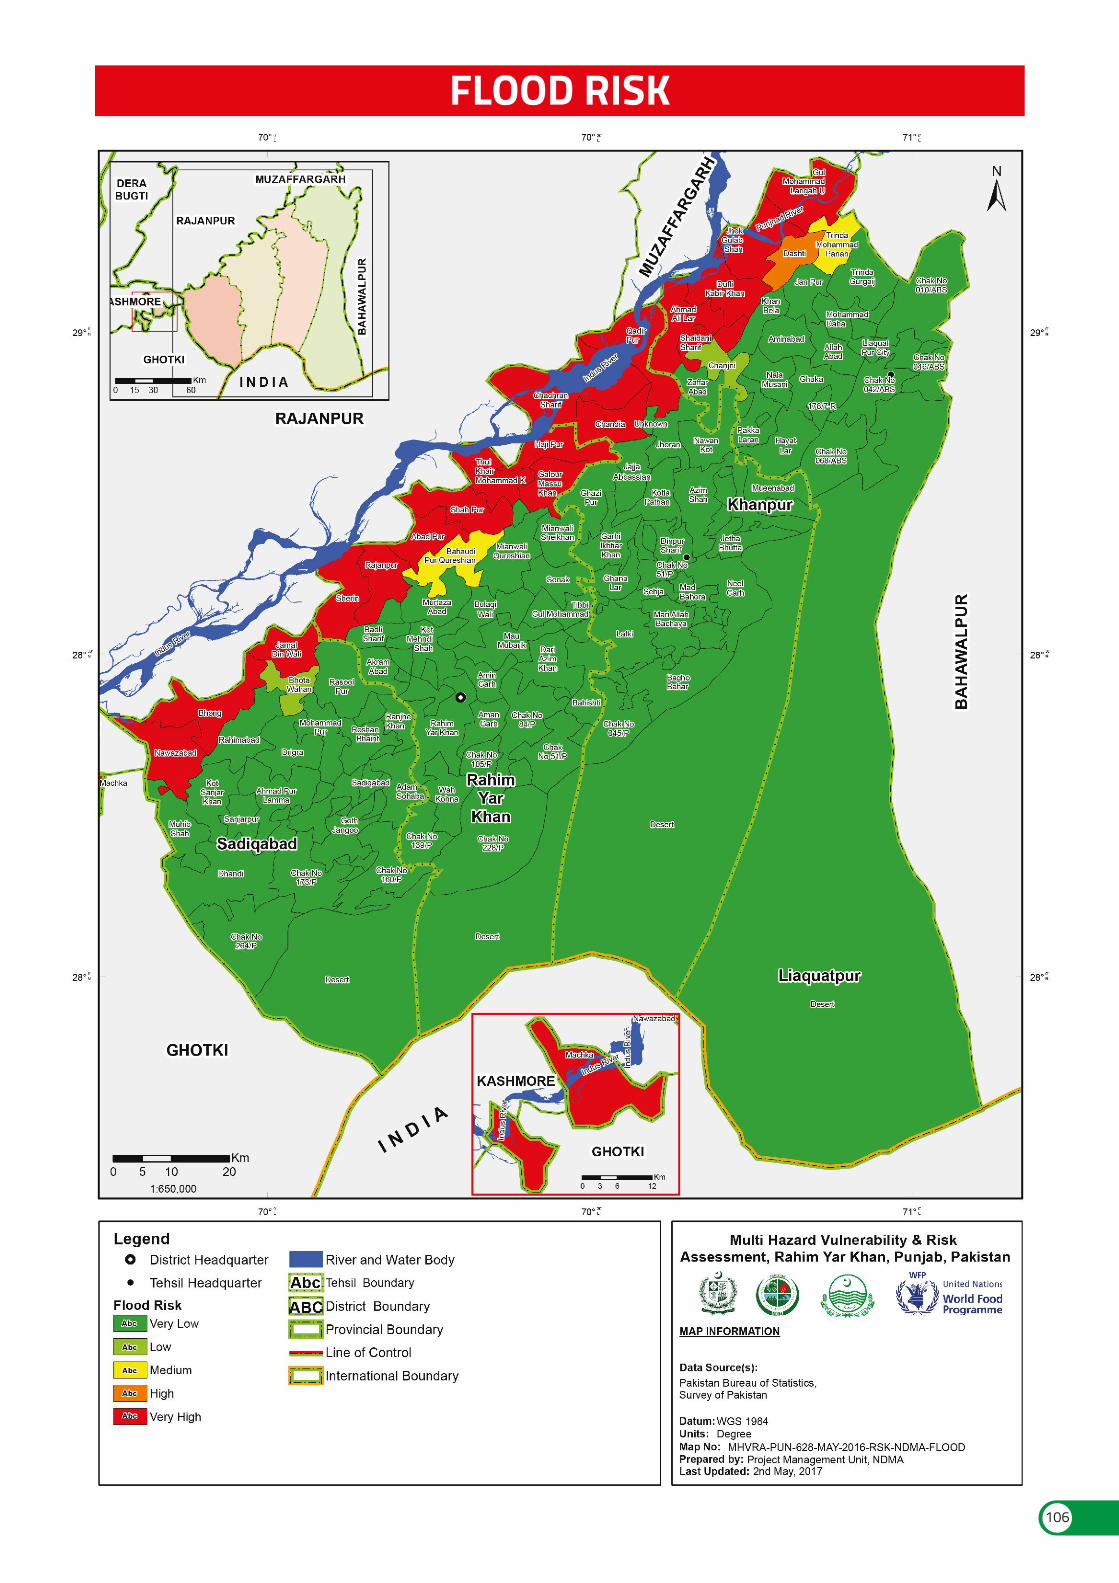
106
FLOOD RISK Human-Made Disasters
Impacts
Indicators
Indices
Infant Mortality Rate
Irrigated Area
Irrigation Sources
Land Cover
Land Use
Land Use Planning
Landslide
Latitude
Longitude
Meander-Belt
Middle Schools
Mitigation
Monitoring & Evaluation (M&E)
Mortality Rate
Mouza / Deh
Multi Hazard Vulnerability and Risk Assessment (MHVRA)
Multi Hazards
National Authority
Natural Disasters
Nullah
Performance Indicator
Physical / Structural Vulnerability
Piedmont
Population Growth Rate
Population Projections
Precipitation
Preparedness
Prevention
Primary Healthcare
Primary School
Quality Assurance
Range Lands
Recovery
Relative Humidity
Reliability
Relief / Response
Residual Risk
Resilience
Retrofitting
Risk
Risk Assessment
Risk Management
Risk Transfer
River
Riverine Flood
Rural Area
Rural Health Centre (RHC)
Secondary Health Care
Secondary School or Higher School
Sedimentary Rocks
Slope Failure
Social Vulnerability
Steppe Climate
Storm Surge
Streambed
Structural / Non-Structural Measures
Sustainable Development
Tehsil Head Quarter (THQ)
Tertiary Healthcare
Tsunami
Unemployment
Urban Area
Urban Flood
Veterinary Facility
Vulnerability
Wet Areas
Wheat Procurement Centre
Acceptable Risk
Accountability
Activity
Adaptation
Affected Area
Alluvium Deposits
Avalanche
Average Household Size
Bare Area with Sparse Natural Vegetation
Bare Areas
Base-Line Study
Basic Health Unit (BHU)
Built-up Area
Capacity
Capacity Building
Census
Climate Change
Climatology
Coping Capacity
Craton
Critical Facilities
Crop Irrigated
Crop Marginal and Irrigated Saline
Crop Rainfed
Cyclone
Debris Flow
Demographics
Density
Disaster
Disaster Management
Disaster Risk
Disaster Risk Management (DRM)
Disaster Risk Reduction(DRR)
District Head Quarter (DHQ)
Drought
Early Warning
Earthquake
Effectiveness
Efficiency
Element at Risks
Elevation
Emergency Management
Employment
Entity
Eolian Deposits
Evaluation
Evaporites
Exposure
Flash Flood
Flood
Flood Plain Deposits
Food Insecurity
Forecast
Geography
Geological Composition
Geology
Geospatial Data Bank
GLOF
Hazard
Hazard Analysis
Hill Torrent (Flood)
Household
Human-Induced Disasters
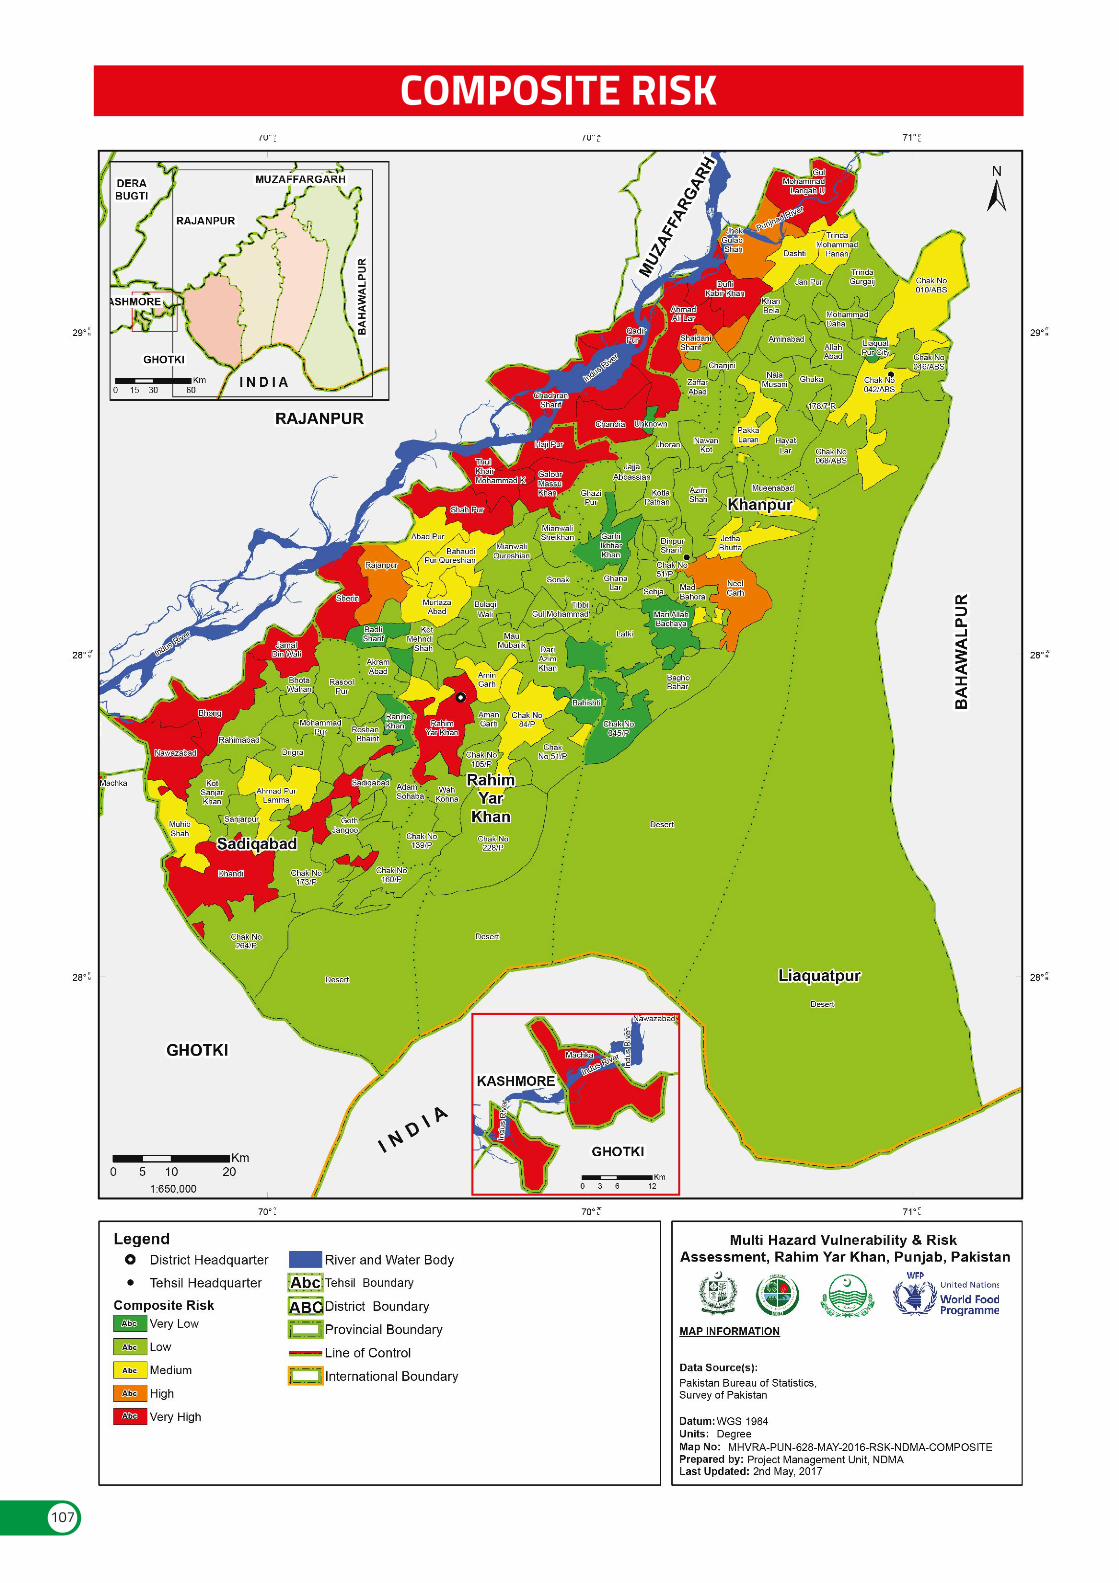
107
COMPOSITE RISK Human-Made Disasters
Impacts
Indicators
Indices
Infant Mortality Rate
Irrigated Area
Irrigation Sources
Land Cover
Land Use
Land Use Planning
Landslide
Latitude
Longitude
Meander-Belt
Middle Schools
Mitigation
Monitoring & Evaluation (M&E)
Mortality Rate
Mouza / Deh
Multi Hazard Vulnerability and Risk Assessment (MHVRA)
Multi Hazards
National Authority
Natural Disasters
Nullah
Performance Indicator
Physical / Structural Vulnerability
Piedmont
Population Growth Rate
Population Projections
Precipitation
Preparedness
Prevention
Primary Healthcare
Primary School
Quality Assurance
Range Lands
Recovery
Relative Humidity
Reliability
Relief / Response
Residual Risk
Resilience
Retrofitting
Risk
Risk Assessment
Risk Management
Risk Transfer
River
Riverine Flood
Rural Area
Rural Health Centre (RHC)
Secondary Health Care
Secondary School or Higher School
Sedimentary Rocks
Slope Failure
Social Vulnerability
Steppe Climate
Storm Surge
Streambed
Structural / Non-Structural Measures
Sustainable Development
Tehsil Head Quarter (THQ)
Tertiary Healthcare
Tsunami
Unemployment
Urban Area
Urban Flood
Veterinary Facility
Vulnerability
Wet Areas
Wheat Procurement Centre
Acceptable Risk
Accountability
Activity
Adaptation
Affected Area
Alluvium Deposits
Avalanche
Average Household Size
Bare Area with Sparse Natural Vegetation
Bare Areas
Base-Line Study
Basic Health Unit (BHU)
Built-up Area
Capacity
Capacity Building
Census
Climate Change
Climatology
Coping Capacity
Craton
Critical Facilities
Crop Irrigated
Crop Marginal and Irrigated Saline
Crop Rainfed
Cyclone
Debris Flow
Demographics
Density
Disaster
Disaster Management
Disaster Risk
Disaster Risk Management (DRM)
Disaster Risk Reduction(DRR)
District Head Quarter (DHQ)
Drought
Early Warning
Earthquake
Effectiveness
Efficiency
Element at Risks
Elevation
Emergency Management
Employment
Entity
Eolian Deposits
Evaluation
Evaporites
Exposure
Flash Flood
Flood
Flood Plain Deposits
Food Insecurity
Forecast
Geography
Geological Composition
Geology
Geospatial Data Bank
GLOF
Hazard
Hazard Analysis
Hill Torrent (Flood)
Household
Human-Induced Disasters

108
Human-Made Disasters
Impacts
Indicators
Indices
Infant Mortality Rate
Irrigated Area
Irrigation Sources
Land Cover
Land Use
Land Use Planning
Landslide
Latitude
Longitude
Meander-Belt
Middle Schools
Mitigation
Monitoring & Evaluation (M&E)
Mortality Rate
Mouza / Deh
Multi Hazard Vulnerability and Risk Assessment (MHVRA)
Multi Hazards
National Authority
Natural Disasters
Nullah
Performance Indicator
Physical / Structural Vulnerability
Piedmont
Population Growth Rate
Population Projections
Precipitation
Preparedness
Prevention
Primary Healthcare
Primary School
Quality Assurance
Range Lands
Recovery
Relative Humidity
Reliability
Relief / Response
Residual Risk
Resilience
Retrofitting
Risk
Risk Assessment
Risk Management
Risk Transfer
River
Riverine Flood
Rural Area
Rural Health Centre (RHC)
Secondary Health Care
Secondary School or Higher School
Sedimentary Rocks
Slope Failure
Social Vulnerability
Steppe Climate
Storm Surge
Streambed
Structural / Non-Structural Measures
Sustainable Development
Tehsil Head Quarter (THQ)
Tertiary Healthcare
Tsunami
Unemployment
Urban Area
Urban Flood
Veterinary Facility
Vulnerability
Wet Areas
Wheat Procurement Centre
Acceptable Risk
Accountability
Activity
Adaptation
Affected Area
Alluvium Deposits
Avalanche
Average Household Size
Bare Area with Sparse Natural Vegetation
Bare Areas
Base-Line Study
Basic Health Unit (BHU)
Built-up Area
Capacity
Capacity Building
Census
Climate Change
Climatology
Coping Capacity
Craton
Critical Facilities
Crop Irrigated
Crop Marginal and Irrigated Saline
Crop Rainfed
Cyclone
Debris Flow
Demographics
Density
Disaster
Disaster Management
Disaster Risk
Disaster Risk Management (DRM)
Disaster Risk Reduction(DRR)
District Head Quarter (DHQ)
Drought
Early Warning
Earthquake
Effectiveness
Efficiency
Element at Risks
Elevation
Emergency Management
Employment
Entity
Eolian Deposits
Evaluation
Evaporites
Exposure
Flash Flood
Flood
Flood Plain Deposits
Food Insecurity
Forecast
Geography
Geological Composition
Geology
Geospatial Data Bank
GLOF
Hazard
Hazard Analysis
Hill Torrent (Flood)
Household
Human-Induced Disasters
Human-Made Disasters
Impacts
Indicators
Indices
Infant Mortality Rate
Irrigated Area
Irrigation Sources
Land Cover
Land Use
Land Use Planning
Landslide
Latitude
Longitude
Meander-Belt
Middle Schools
Mitigation
Monitoring & Evaluation (M&E)
Mortality Rate
Mouza / Deh
Multi Hazard Vulnerability and Risk Assessment (MHVRA)
Multi Hazards
National Authority
Natural Disasters
Nullah
Performance Indicator
Physical / Structural Vulnerability
Piedmont
Population Growth Rate
Population Projections
Precipitation
Preparedness
Prevention
Primary Healthcare
Primary School
Quality Assurance
Range Lands
Recovery
Relative Humidity
Reliability
Relief / Response
Residual Risk
Resilience
Retrofitting
Risk
Risk Assessment
Risk Management
Risk Transfer
River
Riverine Flood
Rural Area
Rural Health Centre (RHC)
Secondary Health Care
Secondary School or Higher School
Sedimentary Rocks
Slope Failure
Social Vulnerability
Steppe Climate
Storm Surge
Streambed
Structural / Non-Structural Measures
Sustainable Development
Tehsil Head Quarter (THQ)
Tertiary Healthcare
Tsunami
Unemployment
Urban Area
Urban Flood
Veterinary Facility
Vulnerability
Wet Areas
Wheat Procurement Centre
The level of potential losses that a society or community considers acceptable given existing social, economic, political, cultural, technical and environmental conditions.
Obligation to demonstrate that work has been conducted in compliance with agreed rules and standards or to report fairly and accurately on performance results vis a vis mandated roles and/or plans. This may require a careful, even legally defensible, demonstration that the work is consistent with the contract terms.
Actions taken or work performed through which inputs, such as funds, technical assistance and other types of resources.
The adjustment in natural or human systems in response to actual or expected climatic stimuli or their effects, which moderates harm or exploits beneficial opportunities.
An area or part of country affected by disaster.
A deposit of clay, silt, and sand left by flowing floodwater in a river valley or delta, typically producing fertile soil.
An avalanche (also called a snow slide) is a rapid flow of snow down a sloping surface of a mountain. Avalanches are triggered due to mechanical failure of the snow when the forces on the snow exceed its cohesion strength.
Average Number of persons per household.
Sand Dunes with natural vegetation, bare rocks (with sparse vegetation) and desert flat pains are included in this class.
This class describes areas that have very less natural and manmade vegetation cover which include sand dunes and barren land.
An analysis describing the situation prior to a development intervention, against which progress can be assessed or comparisons made.
The BHU is located at a Union Council and serves a catchment population of up to 25,000. Services provided at BHU are promotive, preventive, curative and referral. BHU provides all PHC services along with in tegral services that include basic medical and surgical care. MCH services are also part of the services package being provided at BHU. BHU provides first level referral to patients referred by LHWs. BHU refers patients to higher level facilities as and when necessary.
It defines all built areas (urban, industrial, airport etc.) with all vegetated areas linked to the built-ups such as gardens, golf courses, urban recreation parks, plots devoted to urban expansion etc.
The combination of all the strengths, attributes and resources available within a community, society or organization that can be used to achieve agreed goals.
Efforts aimed to develop human skills or societal infrastructure within a community or organization needed to reduce the level of risk. In extended understanding, capacity building also includes development of institutional, financial, political and other resources, at different levels of the society.
Census is an official count or a survey, especially of a population.
(a) The Inter-governmental Panel on Climate Change (IPCC) defines climate change as: “a change in the state of the climate that can be identified (e.g., by using statistical tests) by changes in the mean and/or the variability of its properties, and that persists for an extended period, typically decades or longer. Climate change may be due to natural internal processes or external force or to persistent anthropogenic changes in the composition of the atmosphere or in land use”.
(b) The United Nations Framework Convention on Climate Change (UNFCCC) defines climate change as “a change of climate which is attributed directly or indirectly to human activity that alters the composition of the global atmosphere and which is in addition to natural climate variability observed over comparable time periods”.
Climatology or climate science is the scientific study of climate, scientifically defined as weather conditions averaged over a period of time.
The means by which people or organizations use available resources and abilities to face a disaster. In general, this involves managing resources, both in normal times as well as during crises or adverse conditions.
The term craton is used to distinguish the stable portion of the continental crust from regions that are more geologically active and unstable. Cratons can be described as shields, in which the basement rock crops out at the surface, and platforms, in which the
Acceptable Risk
Accountability
Activity
Adaptation
Affected Area
Alluvium Deposits
Avalanche
Average Household Size
Bare Area with Sparse Natural Vegetation
Bare Areas
Base-Line Study
Basic Health Unit (BHU)
Built-up Area
Capacity
Capacity Building
Census
Climate Change
Climatology
Coping Capacity
Craton
GLOSSARY OF TERMS Critical Facilities
Crop Irrigated
Crop Marginal and Irrigated Saline
Crop Rainfed
Cyclone
Debris Flow
Demographics
Density
Disaster
Disaster Management
Disaster Risk
Disaster Risk Management (DRM)
Disaster Risk Reduction(DRR)
District Head Quarter (DHQ)
Drought
Early Warning
Earthquake
Effectiveness
Efficiency
Element at Risks
Elevation
Emergency Management
Employment
Entity
Eolian Deposits
Evaluation
Evaporites
Exposure
Flash Flood
Flood
Flood Plain Deposits
Food Insecurity
Forecast
Geography
Geological Composition
Geology
Geospatial Data Bank
GLOF
Hazard
Hazard Analysis
Hill Torrent (Flood)
Household
Human-Induced Disasters
Human-Made Disasters
Impacts
Indicators
Indices
Infant Mortality Rate
Irrigated Area
Irrigation Sources
Land Cover
Land Use
Land Use Planning
Landslide
Latitude
Longitude
Meander-Belt
Middle Schools
Mitigation
Monitoring & Evaluation (M&E)
Mortality Rate
Mouza / Deh
Multi Hazard Vulnerability and Risk Assessment (MHVRA)
Multi Hazards
National Authority
Natural Disasters
Nullah
Performance Indicator
Physical / Structural Vulnerability
Piedmont
Population Growth Rate
Population Projections
Precipitation
Preparedness
Prevention
Primary Healthcare
Primary School
Quality Assurance
Range Lands
Recovery
Relative Humidity
Reliability
Relief / Response
Residual Risk
Resilience
Retrofitting
Risk
Risk Assessment
Risk Management
Risk Transfer
River
Riverine Flood
Rural Area
Rural Health Centre (RHC)
Secondary Health Care
Secondary School or Higher School
Sedimentary Rocks
Slope Failure
Social Vulnerability
Steppe Climate
Storm Surge
Streambed
Structural / Non-Structural Measures
Sustainable Development
Tehsil Head Quarter (THQ)
Tertiary Healthcare
Tsunami
Unemployment
Urban Area
Urban Flood
Veterinary Facility
Vulnerability
Wet Areas
Wheat Procurement Centre
Acceptable Risk
Accountability
Activity
Adaptation
Affected Area
Alluvium Deposits
Avalanche
Average Household Size
Bare Area with Sparse Natural Vegetation
Bare Areas
Base-Line Study
Basic Health Unit (BHU)
Built-up Area
Capacity
Capacity Building
Census
Climate Change
Climatology
Coping Capacity
Craton
Critical Facilities
Crop Irrigated
Crop Marginal and Irrigated Saline
Crop Rainfed
Cyclone
Debris Flow
Demographics
Density
Disaster
Disaster Management
Disaster Risk
Disaster Risk Management (DRM)
Disaster Risk Reduction(DRR)
District Head Quarter (DHQ)
Drought
Early Warning
Earthquake
Effectiveness
Efficiency
Element at Risks
Elevation
basement is overlaid by sediments and sedimentary rock.
The primary physical structures, technical facilities and systems which are socially, economically or operationally essential to the functioning of a society or community, both in routine circumstances and in the extreme circumstances of an emergency.
Areas used for the production of annual crops, such as corn, vegetables, soybeans, tobacco and cotton. This class also includes all land being actively tilled.
Crop marginal and irrigated saline are identified as those areas which are currently used for agriculture with low and unstable rainfall or higher rainfall areas intensively used, relative to user capability, under existing population densities, traditional technologies and institutional structures.
The term rainfed agriculture is used to describe farming practicesthat rely only on rainfall for water.
A large-scale system of winds that spiral in toward a region of low atmospheric pressure. Because low-pressure systems generally produce clouds and precipitation, cyclones are often simply referred to as storms. A tropical cyclone is one that forms over warm tropical waters. Such a system is characterized by a warm, well-defined core and can range in intensity from a tropical depression to a tropical cyclone. While tropical cyclones can produce extremely powerful winds and torrential rain, they are also able to produce high waves and damaging storm surge.
This is a phenomenon in which soil and rock on the hillside or in the riverbed are carried downward at a dash under the influence of continuous rain or torrential rain. It is the statistical data relating to the population and particular groups within it.
Density refers to number of elements (population, buildings, roads etc.) per unit area.
A catastrophe or a calamity in an affected area arising from natural or man-made causes or by accident which results in substantial loss of life or human suffering or damage to, and destruction of property.A serious disruption of the functioning of a community or a society involving widespread human, material, economic or environmental losses and impacts, which exceeds the ability of the affected community or society to cope using its own resources.
Managing the complete spectrum of disaster including preparedness, mitigation, response, recovery, relief and rehabilitation.
The potential disaster losses, in lives, health status, livelihoods, assets and services, which could occur to a particular community or a society over some specified future time period.
The systematic process of using administrative directives, organizations, and operational skills and capacities to implement strategies, policies and improved coping capacities in order to lessen the adverse impacts of hazards and the possibility of disaster.
The concept and practice of reducing disaster risks through systematic efforts to analyses and manage the causal factors of disasters, including through reduced exposure to hazards, lessened vulnerability of people and property, wise management of land and the environment, and improved preparedness for adverse events.
The District Head Quarters (DHQ) Hospital is located at District headquarters level and serves a population of 1 to 3 million, depending upon the category of the hospital. The DHQ hospital provides promotive, preventive, curative, advance diagnostics, inpatient services, advance specialist and referral services. All DHQ hospitals are supposed to provide basic and comprehensive care.
A drought is an extended period when an area notes a deficiency in its water supply when the demand for water exceeds the supply. Generally, this occurs when an area receives consistently below average precipitation. It can have a substantial impact on the ecosystem and agriculture of the affected region.
The provision of timely and effective information, through identified institutions, to communities and individuals so that they could take action to reduce their risks and prepare for effective response.
Earthquake is defined as shaking and vibration at the surface of the earth resulting from underground movement along a fault plane of from volcanic activity or due to movement of plate boundaries of the Earth. The scale of earthquakes is measured by moment magnitude and the shaking intensity at each location is usually reported by Mercalli intensity scale.
The extent to which the development intervention’s objectives were achieved, or are expected to be achieved, taking into account their relative importance.
A measure of how economically resources/inputs (funds, expertise, time, etc.) are converted to results.
Elements at Risk include all tangible (population, essential and critical infrastructure, building, crops and so on) and intangible elements (monetary values) that are at risk to any potential damage during extreme events.
The measurement of height of a surface above sea level or ground level.
Emergency Management
Employment
Entity
Eolian Deposits
Evaluation
Evaporites
Exposure
Flash Flood
Flood
Flood Plain Deposits
Food Insecurity
Forecast
Geography
Geological Composition
Geology
Geospatial Data Bank
GLOF
Hazard
Hazard Analysis
Hill Torrent (Flood)
Household
Human-Induced Disasters

Human-Made Disasters
Impacts
Indicators
Indices
Infant Mortality Rate
Irrigated Area
Irrigation Sources
Land Cover
Land Use
Land Use Planning
Landslide
Latitude
Longitude
Meander-Belt
Middle Schools
Mitigation
Monitoring & Evaluation (M&E)
Mortality Rate
Mouza / Deh
Multi Hazard Vulnerability and Risk Assessment (MHVRA)
Multi Hazards
National Authority
Natural Disasters
Nullah
Performance Indicator
Physical / Structural Vulnerability
Piedmont
Population Growth Rate
Population Projections
Precipitation
Preparedness
Prevention
Primary Healthcare
Primary School
Quality Assurance
Range Lands
Recovery
Relative Humidity
Reliability
Relief / Response
Residual Risk
Resilience
Retrofitting
Risk
Risk Assessment
Risk Management
Risk Transfer
River
Riverine Flood
Rural Area
Rural Health Centre (RHC)
Secondary Health Care
Secondary School or Higher School
Sedimentary Rocks
Slope Failure
Social Vulnerability
Steppe Climate
Storm Surge
Streambed
Structural / Non-Structural Measures
Sustainable Development
Tehsil Head Quarter (THQ)
Tertiary Healthcare
Tsunami
Unemployment
Urban Area
Urban Flood
Veterinary Facility
Vulnerability
Wet Areas
Wheat Procurement Centre
Acceptable Risk
Accountability
Activity
Adaptation
Affected Area
Alluvium Deposits
Avalanche
Average Household Size
Bare Area with Sparse Natural Vegetation
Bare Areas
Base-Line Study
Basic Health Unit (BHU)
Built-up Area
Capacity
Capacity Building
Census
Climate Change
Climatology
Coping Capacity
Craton
Critical Facilities
Crop Irrigated
Crop Marginal and Irrigated Saline
Crop Rainfed
Cyclone
Debris Flow
Demographics
Density
Disaster
Disaster Management
Disaster Risk
Disaster Risk Management (DRM)
Disaster Risk Reduction(DRR)
District Head Quarter (DHQ)
Drought
Early Warning
Earthquake
Effectiveness
Efficiency
Element at Risks
Elevation
Emergency Management
Employment
Entity
Eolian Deposits
Evaluation
Evaporites
Exposure
Flash Flood
Flood
Flood Plain Deposits
Food Insecurity
Forecast
Geography
Geological Composition
Geology
Geospatial Data Bank
GLOF
Hazard
Hazard Analysis
Hill Torrent (Flood)
Household
Human-Induced Disasters
The management and deployment of resources for dealing with all aspects of emergencies, in particularly preparedness, response and rehabilitation.
The “employed” comprises all persons ten years of age and above who worked at least one hour during the reference period and were either “paid employed” or “self-employed”. Persons, employed on permanent/regular footings, who have not worked for any reason during the reference period are however, treated as employed.
Any government or non-government organization, national or international stakeholders including Federal, Provincial and District agencies and United Nations’ agencies relevant to Disaster Management as described in Section 23-2 [(a) and (d)] of NDM Act 2010, which is interested in the execution of MHVRA activity hereinafter referred to as Entity.
Eolian Deposits are the Wind-blown deposits on Planetary surface.
The systematic and objective assessment of an on-going or completed project, program or policy, its design, implementation and results. The aim is to determine the relevance and fulfillment of objectives, development efficiency, effectiveness, impact and sustainability. An evaluation should provide information that is credible and useful, enabling the incorporation of lessons learned into the decision making process of both recipients and donors.
Evaporites are individual minerals found in the sedimentary deposit of soluble salts that results from the evaporation of water.
People, property, systems, or other elements present in hazard zones that are subject to potential losses.
A flash flood is a phenomenon of rapid flooding (mostly less than 6 hours) of geomorphic low-lying areas due to downpour or heavy rains caused by low depression, climate front line (thunderstorm) or cyclone.
Flood is a phenomenon of inundation by water coming from a direct rainfall or river, drainage or other water bodies, such as lakes or seas due to overflowing from ordinary boundary between land and water or water surging. Floodplain deposits are also called as Alluvial Plain, flat land area adjacent to a stream, composed of unconsolidated sedimentary deposits (alluvium) and subject to periodic inundation by the stream.
The state of being without reliable access to a sufficient quantity of affordable and nutritious food.
Estimate of the occurrence of a future event (UNESCO, WMO). The term is used with different meanings in different disciplines. Geography is the study of the Earth and its features, its inhabitants, and its phenomena.
Geological composition is the fundamental unit of lithostratigraphy that contain certain amount of rock strata that have a comparable lithology, facies or other similar properties.
Geology is an earth science concerned with the solid Earth, the rocks of which it is composed and the processes by which they change over time.
Spatial Data and Geographic Information Management System (GIS) data relevant to disaster and the corresponding data integration in the form of geospatial data bank. In the context of disaster management, following types of data is required:i. Data on the disastrous phenomena (e.g. landslides, floods, earthquakes), their location, frequency, magnitude etc.ii. Data on the environment in which the disastrous events might take place: topography, geology, geomorphology, soils, hydrology, land use, vegetation etc.iii. Data on the elements that might be destroyed if the event takes place: infrastructure, settlements, population, socioeconomic data etc.iv. Data on the emergency relief resources, such as hospitals, fire brigades, police stations, warehouses etc.
“GLOF” refers to a Glacial Lake Outburst Flood that occurs when water in a glacier lake suddenly discharges due to a breach of a moraine dam (glacier lake). The results can be catastrophic to the downstream riparian area. (Richardson and Reynolds 2000).
A dangerous phenomenon, substance, human activity or condition that may cause loss of life, injury or other health impacts, property damage, loss of livelihoods and services, social and economic disruption, or environmental damage.
Identification, studies and monitoring of any hazard to determine its potential, origin, characteristics and behavior.
Hill torrent floods are basically a rapid flooding of geomorphic steep surface areas at alluvial cones or floodplain areas caused by overflowing water from channels due to rapid velocity and any amount of flow quantity.
A household is defined to be constituted of all those persons who usually live together and share their meals. A household may consist of one person or more than one person who may or may not be related to each other.
Natural disasters that are accelerated/ aggravated by human influence. A landslide, for example, may be purely natural, as a result of a heavy rainfall or earthquake, but it may also be human induced, as a result of an over steepened road-cut.
Human-Made Disasters
Impacts
Indicators
Indices
Infant Mortality Rate
Irrigated Area
Irrigation Sources
Land Cover
Land Use
Land Use Planning
Landslide
Latitude
Longitude
Meander-Belt
Middle Schools
Mitigation
Monitoring & Evaluation (M&E)
Mortality Rate
Mouza / Deh
Multi Hazard Vulnerability and Risk Assessment (MHVRA)
Multi Hazards
Events which are caused by human activities (such as atmospheric pollution, industrial chemical accidents, major armed conflicts, nuclear accidents, oil spills etc.)
Positive and negative, primary and secondary long-term effects produced by a development intervention, directly or indirectly, intended or unintended.
Indicators are variables or parameters used to describe drought conditions. Examples include precipitation, temperature, streamflow, groundwater and reservoir levels, soil moisture, snowpack, etc.
Indices are typically a computed numerical representation of drought severity, assessed using climatic or hydro-meteorological inputs including the indicators listed above. In short, they aim to measure the qualitative state of drought on the landscape for a given time period. Indices are technically indicators as well. Monitoring the climate at various timescales allows identification of short-term wet periods within long-term droughts or short-term dry spells within long-term wet periods.
The number of deaths of infants under one year of age per 1000 live births in a given year.
Irrigated agricultural area refers to the area in which the moisture of soil is controlled for the better growth of seeds and better crop production by providing water through different mode of water supply such as rivers, major, minor or distributary canals, tube wells, wells, spraying or other water to the crops.
It refers to the source(s) by means of which the cultivated area is irrigated partially or wholly.
Land Cover is defined as the observed (bio) physical cover on the earth’s surface.
Land Use is characterized by the arrangements, activities and inputs that people undertake in a certain type of land in order to produce, change or maintain it.
The process undertaken by public authorities to identify, evaluate and decide on different options for the use of land, including consideration of long term economic, social and environmental objectives and the implications for different communities and interest groups, and the subsequent formulation and promulgation of plans that describe the permitted or acceptable uses. Land-use planning can help to mitigate disasters and reduce risks by discouraging high-density settlements and construction of key installations in hazard-prone areas, control of population density and expansion Mitigation Structural and non-structural measures undertaken to limit the adverse impact of natural hazards, environmental degradation and technological hazards.
A landslide is a phenomenon in which the movement of a mass of rock, debris, or earth down a slope due to gravity. The materials may move by falling, toppling, sliding, spreading, or flowing. Since a large amount of soil mass usually moves, serious damage can occur.
Latitude is a geographic coordinate that specifies the north–south position of a point on the Earth's surface. Latitude is an angle (defined below) which ranges from 0° at the Equator to 90° (North or South) at the poles.
Longitude is a geographic coordinate that specifies the east-west position of a point on the Earth's surface. It is an angular measurement, usually expressed in degrees
The part of a valley bottom across which a stream shifts its channel from time to time especially in flood.
Middle Schools are the schools that provide education from 5th to 8th grade.
The lessening or limitation of the adverse impacts of hazards and related disasters.
A continuing function that uses systematic collection of data on specified indicators to provide management and the main stakeholders of an ongoing development intervention with indications of the extent of progress and achievement of objectives and progress in the use of allocated funds.Number of deaths recorded in a population of particular region in a year.
It is a territorial unit with a separate name, definite boundaries, and area precisely measured and divided into plots / khasras / survey numbers. Each mouza is a revenue estate and has a cadastral map maintained in the land revenue record with a Hadbast Number except Sindh Province. Mouza, Deh, Village, Killi and Chak are the names commonly used for it. The term mouza / deh is widely used in the settled areas while the term village and or killi are used in the unsettled areas. There may be one or more settlements, abadies, basties, dhokes, goths, etc. in the territory of a mouza / deh. The mouzas / dehs may also have scattered inhabitation while there may be some mouzas without population as well.
Multi Hazard Vulnerability and Risk Assessment is a comprehensive study which intends to evaluate the expected vulnerabilities, risks and losses due to different hazardous events; both natural or man-induced.
The term Multi Hazards, as the name would suggest, are the hazards evolved from multiple sources, either inter-related or independent phenomena, and are subject to joint probability theory and analysis.
National Authority
Natural Disasters
Nullah
Performance Indicator
Physical / Structural Vulnerability
Piedmont
Population Growth Rate
Population Projections
Precipitation
Preparedness
Prevention
Primary Healthcare
Primary School
Quality Assurance
Range Lands
Recovery
Relative Humidity
Reliability
Relief / Response
Residual Risk
Resilience
Retrofitting
Risk
Risk Assessment
Risk Management
Risk Transfer
River
Riverine Flood
Rural Area
Rural Health Centre (RHC)
Secondary Health Care
Secondary School or Higher School
Sedimentary Rocks
Slope Failure
Social Vulnerability
Steppe Climate
Storm Surge
Streambed
Structural / Non-Structural Measures
Sustainable Development
Tehsil Head Quarter (THQ)
Tertiary Healthcare
Tsunami
Unemployment
Urban Area
Urban Flood
Veterinary Facility
Vulnerability
Wet Areas
Wheat Procurement Centre
Acceptable Risk
Accountability
Activity
Adaptation
Affected Area
Alluvium Deposits
Avalanche
Average Household Size
Bare Area with Sparse Natural Vegetation
Bare Areas
Base-Line Study
Basic Health Unit (BHU)
Built-up Area
Capacity
Capacity Building
Census
Climate Change
Climatology
Coping Capacity
Craton
Critical Facilities
Crop Irrigated
Crop Marginal and Irrigated Saline
Crop Rainfed
Cyclone
Debris Flow
Demographics
Density
Disaster
Disaster Management
Disaster Risk
Disaster Risk Management (DRM)
Disaster Risk Reduction(DRR)
District Head Quarter (DHQ)
Drought
Early Warning
Earthquake
Effectiveness
Efficiency
Element at Risks
Elevation
Emergency Management
Employment
Entity
Eolian Deposits
Evaluation
Evaporites
Exposure
Flash Flood
Flood
Flood Plain Deposits
Food Insecurity
Forecast
Geography
Geological Composition
Geology
Geospatial Data Bank
GLOF
Hazard
Hazard Analysis
Hill Torrent (Flood)
Household
Human-Induced Disasters
Human-Made Disasters
Impacts
Indicators
Indices
Infant Mortality Rate
Irrigated Area
Irrigation Sources
Land Cover
Land Use
Land Use Planning
Landslide
Latitude
Longitude
Meander-Belt
Middle Schools
Mitigation
Monitoring & Evaluation (M&E)
Mortality Rate
Mouza / Deh
Multi Hazard Vulnerability and Risk Assessment (MHVRA)
Multi Hazards
National Authority
Natural Disasters
Nullah
Performance Indicator
Physical / Structural Vulnerability
Piedmont
Population Growth Rate
Population Projections
Precipitation
Preparedness
Prevention
Primary Healthcare
Primary School
Quality Assurance
Range Lands
Recovery
Relative Humidity
Reliability
Relief / Response
Residual Risk
Resilience
Retrofitting
Risk
Risk Assessment
Risk Management
Risk Transfer
National Authority means National Disaster Management Authority (NDMA).
Events which are caused purely by natural phenomena such as earthquakes, floods, cyclones etc.
A Pakistani term, used for small rivers a streams carrying fresh water or sewerage disposal.
A variable that allows the verification of changes in the development intervention or shows results relative to what was planned.
The measure of the fragility structure, engineered or non-engineered, and its associated susceptibility to the natural stresses such as earthquake, flood etc.
Piedmont, in geology, landform created at the foot of a mountain or mountains by debris deposited by shifting streams.
The growth rate is the rate at which a population is increasing (or decreasing) in a given year.
Population Projections are estimates of population number typically based on an estimated population consistent with most recent decennial census and are produced using cohort-component method.
Precipitation is the water that falls from the clouds towards the ground, especially as rain or snow.
Activities and measures taken in advance to ensure effective response to the impact of hazards, including the issuance of timely and effective early warnings and the temporary evacuation of people and property from threatened locations.
Activities to ensure complete avoidance of the adverse impact of hazards.
The primary care facilities include Basic Health Units (BHUs) and Rural Health Centers (RHCs) mainly preventive, outpatient and basic inpatient care..A primary school is an education facility in which children receive primary or elementary education, coming after preschool and before secondary school.
Quality assurance encompasses any activity that is concerned with assessing and improving the merit or the worth of a development intervention or its compliance with given standards. Note: examples of quality assurance activities include appraisal, RBM, reviews during implementation, evaluations, etc.
Range Lands are vast natural landscapes grasslands, shrub lands and wood lands.
Decisions and actions taken after a disaster with a view to restoring or improving the pre-disaster living conditions of the stricken community, while encouraging and facilitating necessary adjustments to reduce disaster risk. The amount of water vapour present in air expressed as a percentage of the amount needed for saturation at the same temperature.
Consistency or dependability of data and evaluation judgments, with reference to the quality of the instruments, procedures and analyses used to collect and interpret evaluation data.
The provision of assistance during or immediately after a disaster to meet the life preservation and basic subsistence needs of those people affected. It can be of an immediate, short-term, or protracted duration.
The risk that remains in unmanaged form, even when effective disaster risk reduction measures are in place, and for which emergency response and recovery capacities must be maintained.
The ability of a system, community or society exposed to hazards to resist, absorb, accommodate to and recover from the effects of a hazard in a timely and efficient manner, including through the preservation and restoration of its essential basic structures and functions.
Reinforcement of existing buildings and structures to become more resistant and resilient to the forces of natural hazards.
The combination of the probability of an event and its negative consequences.
A methodology to determine the nature and extent of risk by analyzing potential hazards and evaluating existing conditions of vulnerability that together could potentially harm exposed people, property, services, livelihoods and the environment on which they depend.
The systematic approach and practice of managing uncertainty to minimize potential harm and loss.
The process of formally or informally shifting the financial consequences of particular risks from one party to another whereby a household, community, enterprise or state authority will obtain resources from the other party after a disaster occurs, in exchange for ongoing or compensatory social or financial benefits provided to that other party.
River
Riverine Flood
Rural Area
Rural Health Centre (RHC)
Secondary Health Care
Secondary School or Higher School
Sedimentary Rocks
Slope Failure
Social Vulnerability
Steppe Climate
Storm Surge
Streambed
Structural / Non-Structural Measures
Sustainable Development
Tehsil Head Quarter (THQ)
Tertiary Healthcare
Tsunami
Unemployment
Urban Area
Urban Flood
Veterinary Facility
Vulnerability
Wet Areas
Wheat Procurement Centre
Acceptable Risk
Accountability
Activity
Adaptation
Affected Area
Alluvium Deposits
Avalanche
Average Household Size
Bare Area with Sparse Natural Vegetation
Bare Areas
Base-Line Study
Basic Health Unit (BHU)
Built-up Area
Capacity
Capacity Building
Census
Climate Change
Climatology
Coping Capacity
Craton
Critical Facilities
Crop Irrigated
Crop Marginal and Irrigated Saline
Crop Rainfed
Cyclone
Debris Flow
Demographics
Density
Disaster
Disaster Management
Disaster Risk
Disaster Risk Management (DRM)
Disaster Risk Reduction(DRR)
District Head Quarter (DHQ)
Drought
Early Warning
Earthquake
Effectiveness
Efficiency
Element at Risks
Elevation
Emergency Management
Employment
Entity
Eolian Deposits
Evaluation
Evaporites
Exposure
Flash Flood
Flood
Flood Plain Deposits
Food Insecurity
Forecast
Geography
Geological Composition
Geology
Geospatial Data Bank
GLOF
Hazard
Hazard Analysis
Hill Torrent (Flood)
Household
Human-Induced Disasters
Human-Made Disasters
Impacts
Indicators
Indices
Infant Mortality Rate
Irrigated Area
Irrigation Sources
Land Cover
Land Use
Land Use Planning
Landslide
Latitude
Longitude
Meander-Belt
Middle Schools
Mitigation
Monitoring & Evaluation (M&E)
Mortality Rate
Mouza / Deh
Multi Hazard Vulnerability and Risk Assessment (MHVRA)
Multi Hazards
National Authority
Natural Disasters
Nullah
Performance Indicator
Physical / Structural Vulnerability
Piedmont
Population Growth Rate
Population Projections
Precipitation
Preparedness
Prevention
Primary Healthcare
Primary School
Quality Assurance
Range Lands
Recovery
Relative Humidity
Reliability
Relief / Response
Residual Risk
Resilience
Retrofitting
Risk
Risk Assessment
Risk Management
Risk Transfer
River
Riverine Flood
Rural Area
Rural Health Centre (RHC)
Secondary Health Care
Secondary School or Higher School
Sedimentary Rocks
Slope Failure
Social Vulnerability
Steppe Climate
Storm Surge
Streambed
Structural / Non-Structural Measures
Sustainable Development
Tehsil Head Quarter (THQ)
Tertiary Healthcare
Tsunami
Unemployment
Urban Area
Urban Flood
A river is a natural waterway, usually freshwater, flowing toward lower level of water surface such as a lake, a sea, or another river.
Flood is a phenomenon of inundation by water coming from a river, drainage or other water bodies, such as lakes or seas due to overflowing from ordinary boundary between land and water or water surging.
A rural area is an open area that has very low population and building density. Generally rural areas are away from cities/towns and its inhabitants are mostly linked with agriculture based livelihood.
The RHCs have 10-20 inpatients beds and each serves a catchment population of up to 100,000 people. The RHC provides promotive, preventive, curative, diagnostics and referral services along with inpatient services. The RHC also provides clinical, logistical and managerial support to the BHUs, LHWs, MCH Centers, and Dispensaries that fall within its geographical limits. RHC also provides medico-legal, basic surgical, dental and ambulance services.
It is an intermediate level of health care that is concerned with the provision of specific technical, therapeutic or diagnostic services. It is the first referral level serving a district or a tehsil. Specialist consultation procedures and hospital admissions fall into this category of care. The role of a district hospital in primary health care has been expanded beyond being dominantly curative and rehabilitative to include promotional, preventive and educational roles as part of a primary health care approach.
Secondary Schools are the schools which provide education from grade 8 till Intermediate Level, i.e. 12th Grade or FSc.
Sedimentary rocks are types of rock that are formed by the deposition and subsequent cementation of that material at the Earth's surface and within bodies of water.
In this phenomenon, a slope abruptly collapses when the soil that has already been weakened by moisture in the ground loses its self-cohesiveness under the influence of rain or an earthquake. Due to sudden collapse, many people fail to escape if it occurs near a residential area, thus leading to a higher rate of fatalities.
Characteristics of social systems that create the potential for harm or loss to it
A semi-arid climate or steppe climate is the climate of a region that receives precipitation below potential evapotranspiration, but not as low as a desert climate.
A Storm Surge is phenomena of sea level rise associated with a low-pressure weather system, typically a tropical cyclone. Therefore, an early warning plan for “storm surge” should be incorporated with that of “cyclone”.
A stream bed is the channel bottom of a stream or river, the physical confine of the normal water flow
Structural measures refer to any physical construction to reduce or avoid possible impacts of hazards, which include engineering measures and construction of hazard-resistant and protective structures and infrastructure.Non-structural measures refer to policies, awareness, knowledge development, public commitment, and methods and operating practices, including participatory mechanisms and the provision of information, which can reduce risk and related impacts.
Development that meets the needs of the present without compromising the ability of future generations to meet their own needs. It contains within it two key concepts: the concept of "needs", in particular the essential needs of the world's poor, to which overriding priority should be given; and the idea of limitations imposed by the state of technology and social organization on the environment's ability to meet present and the future needs. (Brundtland Commission, 1987)
These hospitals are located at each THQ and serves a population of 0.5 to 1.0 million. At present majority of THQ hospitals have 40 to 60 beds. The THQ hospital provides promotive, preventive, curative, diagnostics, in patients, referral services and also specialist care. THQ hospitals are supposed to provide basic and comprehensive Emergency Obstetric and New born Care (EmONC). THQ hospital provides referral care to the patients including those referred by the Rural Health Centers, Basic Health Units, Lady Health Workers and other primary care facilities.
Tertiary care hospitals are located in the major cities for more specialized inpatient care. Tertiary care is specialized consultative health care, usually for inpatients and on referral from a primary or secondary health professional.
A tsunami is a series of waves in a water body caused by the displacement of a large volume of water, generally in an ocean or a large lake. Earthquakes, volcanic eruptions and other underwater explosions, landslides, avalanche, meteorite impacts and other disturbances above or below water all have the potential to generate a tsunami.
The “unemployed” comprises all the persons ten years of age and above who during the reference period were without work, currently available for work and are seeking work.
An Urban area is human settlement with high population density and infrastructure of built environment. Urban areas are created through urbanization and are categorized by urban morphology as cities, towns, conurbations and suburbs.
Flood and inundation phenomena occurring in the city or built-up areas.
Veterinary Facility
Vulnerability
Wet Areas
Wheat Procurement Centre
Acceptable Risk
Accountability
Activity
Adaptation
Affected Area
Alluvium Deposits
Avalanche
Average Household Size
Bare Area with Sparse Natural Vegetation
Bare Areas
Base-Line Study
Basic Health Unit (BHU)
Built-up Area
Capacity
Capacity Building
Census
Climate Change
Climatology
Coping Capacity
Craton
Critical Facilities
Crop Irrigated
Crop Marginal and Irrigated Saline
Crop Rainfed
Cyclone
Debris Flow
Demographics
Density
Disaster
Disaster Management
Disaster Risk
Disaster Risk Management (DRM)
Disaster Risk Reduction(DRR)
District Head Quarter (DHQ)
Drought
Early Warning
Earthquake
Effectiveness
Efficiency
Element at Risks
Elevation
Emergency Management
Employment
Entity
Eolian Deposits
Evaluation
Evaporites
Exposure
Flash Flood
Flood
Flood Plain Deposits
Food Insecurity
Forecast
Geography
Geological Composition
Geology
Geospatial Data Bank
GLOF
Hazard
Hazard Analysis
Hill Torrent (Flood)
Household
Human-Induced Disasters

Human-Made Disasters
Impacts
Indicators
Indices
Infant Mortality Rate
Irrigated Area
Irrigation Sources
Land Cover
Land Use
Land Use Planning
Landslide
Latitude
Longitude
Meander-Belt
Middle Schools
Mitigation
Monitoring & Evaluation (M&E)
Mortality Rate
Mouza / Deh
Multi Hazard Vulnerability and Risk Assessment (MHVRA)
Multi Hazards
National Authority
Natural Disasters
Nullah
Performance Indicator
Physical / Structural Vulnerability
Piedmont
Population Growth Rate
Population Projections
Precipitation
Preparedness
Prevention
Primary Healthcare
Primary School
Quality Assurance
Range Lands
Recovery
Relative Humidity
Reliability
Relief / Response
Residual Risk
Resilience
Retrofitting
Risk
Risk Assessment
Risk Management
Risk Transfer
River
Riverine Flood
Rural Area
Rural Health Centre (RHC)
Secondary Health Care
Secondary School or Higher School
Sedimentary Rocks
Slope Failure
Social Vulnerability
Steppe Climate
Storm Surge
Streambed
Structural / Non-Structural Measures
Sustainable Development
Tehsil Head Quarter (THQ)
Tertiary Healthcare
Tsunami
Unemployment
Urban Area
Urban Flood
Veterinary Facility
Vulnerability
Wet Areas
Wheat Procurement Centre
It refers to the availability of veterinary facilities for livestock with qualified veterinarian (Doctor / Assistant) for provision of medical facilities for farm animals.
The characteristics and circumstances of a community, system or asset that make it susceptible to the damaging effects of a hazard.
Areas which are naturally covered with fresh or saline water such as river and lakes are grouped in this class.
These centres are established every year at the time of wheat harvest in surplus wheat producing areas particularly of the Punjab and Sindh provinces by the Provincial Food Departments and or Pakistan Agricultural Services and Storage Corporation (PASSCO) at appropriate locations. These centres are not permanent in nature and their number in a tehsil / district varies on year to year basis depending upon the procurement policy.
Acceptable Risk
Accountability
Activity
Adaptation
Affected Area
Alluvium Deposits
Avalanche
Average Household Size
Bare Area with Sparse Natural Vegetation
Bare Areas
Base-Line Study
Basic Health Unit (BHU)
Built-up Area
Capacity
Capacity Building
Census
Climate Change
Climatology
Coping Capacity
Craton
Critical Facilities
Crop Irrigated
Crop Marginal and Irrigated Saline
Crop Rainfed
Cyclone
Debris Flow
Demographics
Density
Disaster
Disaster Management
Disaster Risk
Disaster Risk Management (DRM)
Disaster Risk Reduction(DRR)
District Head Quarter (DHQ)
Drought
Early Warning
Earthquake
Effectiveness
Efficiency
Element at Risks
Elevation
Emergency Management
Employment
Entity
Eolian Deposits
Evaluation
Evaporites
Exposure
Flash Flood
Flood
Flood Plain Deposits
Food Insecurity
Forecast
Geography
Geological Composition
Geology
Geospatial Data Bank
GLOF
Hazard
Hazard Analysis
Hill Torrent (Flood)
Household
Human-Induced Disasters

Human-Made Disasters
Impacts
Indicators
Indices
Infant Mortality Rate
Irrigated Area
Irrigation Sources
Land Cover
Land Use
Land Use Planning
Landslide
Latitude
Longitude
Meander-Belt
Middle Schools
Mitigation
Monitoring & Evaluation (M&E)
Mortality Rate
Mouza / Deh
Multi Hazard Vulnerability and Risk Assessment (MHVRA)
Multi Hazards
National Authority
Natural Disasters
Nullah
Performance Indicator
Physical / Structural Vulnerability
Piedmont
Population Growth Rate
Population Projections
Precipitation
Preparedness
Prevention
Primary Healthcare
Primary School
Quality Assurance
Range Lands
Recovery
Relative Humidity
Reliability
Relief / Response
Residual Risk
Resilience
Retrofitting
Risk
Risk Assessment
Risk Management
Risk Transfer
River
Riverine Flood
Rural Area
Rural Health Centre (RHC)
Secondary Health Care
Secondary School or Higher School
Sedimentary Rocks
Slope Failure
Social Vulnerability
Steppe Climate
Storm Surge
Streambed
Structural / Non-Structural Measures
Sustainable Development
Tehsil Head Quarter (THQ)
Tertiary Healthcare
Tsunami
Unemployment
Urban Area
Urban Flood
Veterinary Facility
Vulnerability
Wet Areas
Wheat Procurement Centre
Acceptable Risk
Accountability
Activity
Adaptation
Affected Area
Alluvium Deposits
Avalanche
Average Household Size
Bare Area with Sparse Natural Vegetation
Bare Areas
Base-Line Study
Basic Health Unit (BHU)
Built-up Area
Capacity
Capacity Building
Census
Climate Change
Climatology
Coping Capacity
Craton
Critical Facilities
Crop Irrigated
Crop Marginal and Irrigated Saline
Crop Rainfed
Cyclone
Debris Flow
Demographics
Density
Disaster
Disaster Management
Disaster Risk
Disaster Risk Management (DRM)
Disaster Risk Reduction(DRR)
District Head Quarter (DHQ)
Drought
Early Warning
Earthquake
Effectiveness
Efficiency
Element at Risks
Elevation
Emergency Management
Employment
Entity
Eolian Deposits
Evaluation
Evaporites
Exposure
Flash Flood
Flood
Flood Plain Deposits
Food Insecurity
Forecast
Geography
Geological Composition
Geology
Geospatial Data Bank
GLOF
Hazard
Hazard Analysis
Hill Torrent (Flood)
Household
Human-Induced Disasters
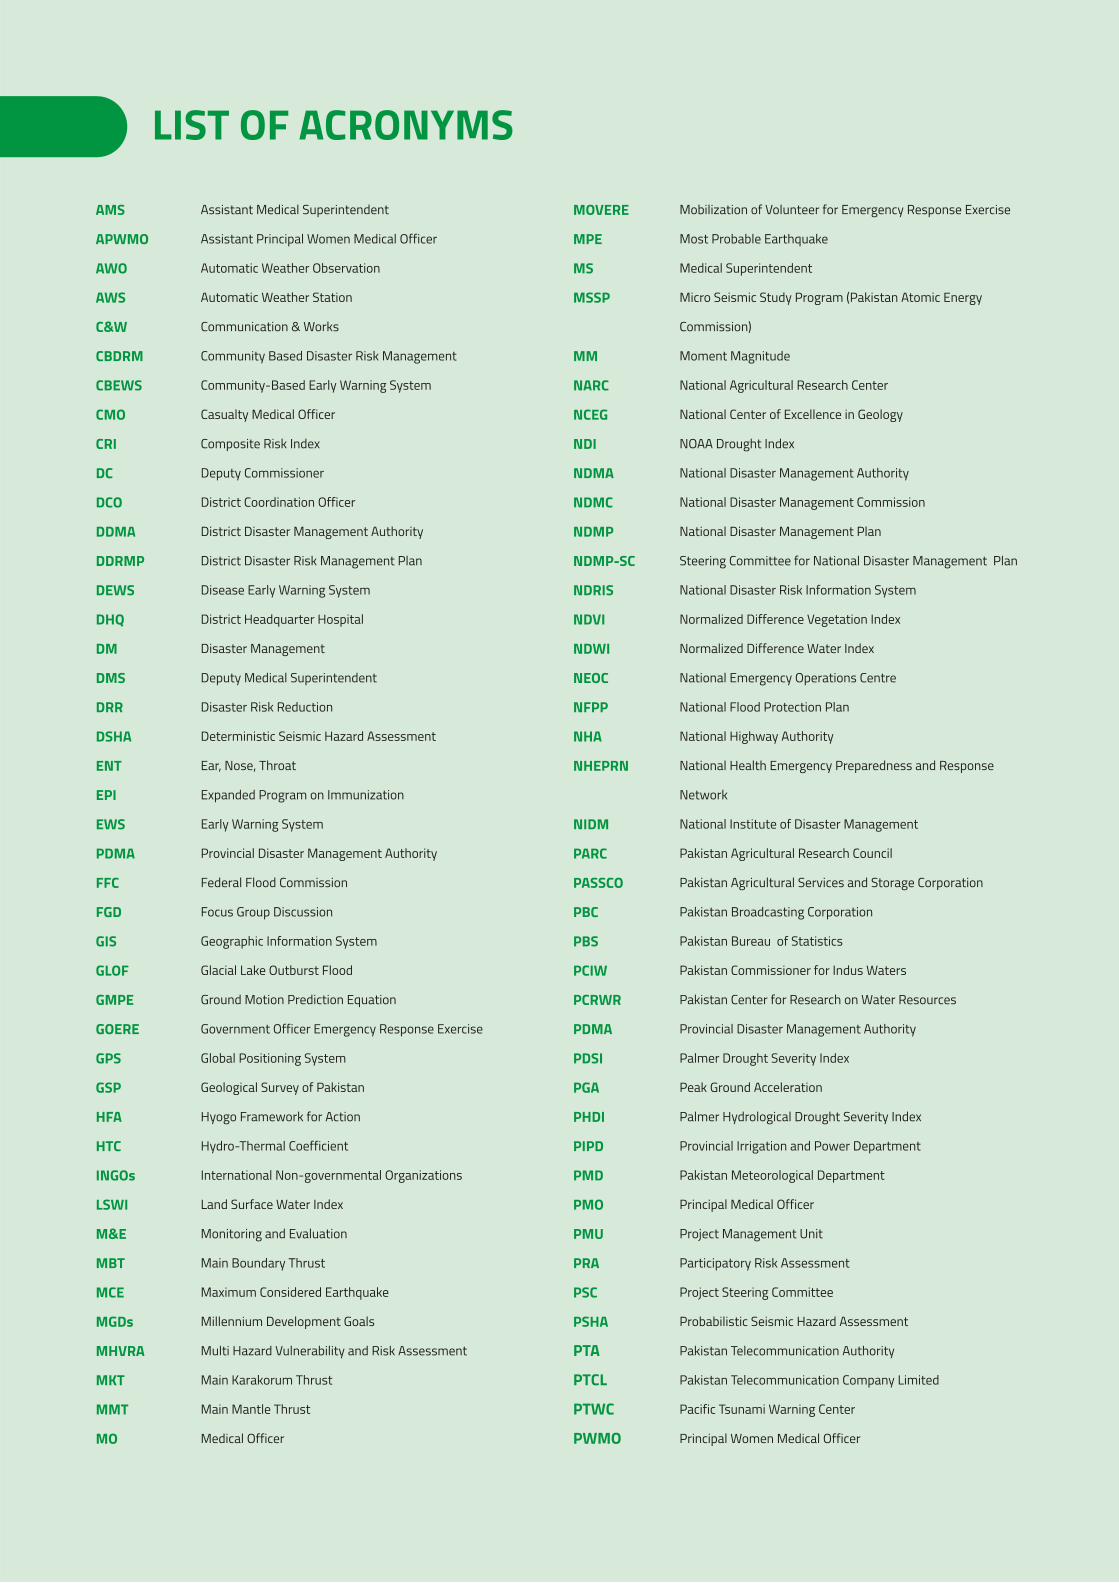
Human-Made Disasters
Impacts
Indicators
Indices
Infant Mortality Rate
Irrigated Area
Irrigation Sources
Land Cover
Land Use
Land Use Planning
Landslide
Latitude
Longitude
Meander-Belt
Middle Schools
Mitigation
Monitoring & Evaluation (M&E)
Mortality Rate
Mouza / Deh
Multi Hazard Vulnerability and Risk Assessment (MHVRA)
Multi Hazards
National Authority
Natural Disasters
Nullah
Performance Indicator
Physical / Structural Vulnerability
Piedmont
Population Growth Rate
Population Projections
Precipitation
Preparedness
Prevention
Primary Healthcare
Primary School
Quality Assurance
Range Lands
Recovery
Relative Humidity
Reliability
Relief / Response
Residual Risk
Resilience
Retrofitting
Risk
Risk Assessment
Risk Management
Risk Transfer
River
Riverine Flood
Rural Area
Rural Health Centre (RHC)
Secondary Health Care
Secondary School or Higher School
Sedimentary Rocks
Slope Failure
Social Vulnerability
Steppe Climate
Storm Surge
Streambed
Structural / Non-Structural Measures
Sustainable Development
Tehsil Head Quarter (THQ)
Tertiary Healthcare
Tsunami
Unemployment
Urban Area
Urban Flood
Veterinary Facility
Vulnerability
Wet Areas
Wheat Procurement Centre
Acceptable Risk
Accountability
Activity
Adaptation
Affected Area
Alluvium Deposits
Avalanche
Average Household Size
Bare Area with Sparse Natural Vegetation
Bare Areas
Base-Line Study
Basic Health Unit (BHU)
Built-up Area
Capacity
Capacity Building
Census
Climate Change
Climatology
Coping Capacity
Craton
Critical Facilities
Crop Irrigated
Crop Marginal and Irrigated Saline
Crop Rainfed
Cyclone
Debris Flow
Demographics
Density
Disaster
Disaster Management
Disaster Risk
Disaster Risk Management (DRM)
Disaster Risk Reduction(DRR)
District Head Quarter (DHQ)
Drought
Early Warning
Earthquake
Effectiveness
Efficiency
Element at Risks
Elevation
Emergency Management
Employment
Entity
Eolian Deposits
Evaluation
Evaporites
Exposure
Flash Flood
Flood
Flood Plain Deposits
Food Insecurity
Forecast
Geography
Geological Composition
Geology
Geospatial Data Bank
GLOF
Hazard
Hazard Analysis
Hill Torrent (Flood)
Household
Human-Induced Disasters
Assistant Medical Superintendent
Assistant Principal Women Medical Officer
Automatic Weather Observation
Automatic Weather Station
Communication & Works
Community Based Disaster Risk Management
Community-Based Early Warning System
Casualty Medical Officer
Composite Risk Index
Deputy Commissioner
District Coordination Officer
District Disaster Management Authority
District Disaster Risk Management Plan
Disease Early Warning System
District Headquarter Hospital
Disaster Management
Deputy Medical Superintendent
Disaster Risk Reduction
Deterministic Seismic Hazard Assessment
Ear, Nose, Throat
Expanded Program on Immunization
Early Warning System
Provincial Disaster Management Authority
Federal Flood Commission
Focus Group Discussion
Geographic Information System
Glacial Lake Outburst Flood
Ground Motion Prediction Equation
Government Officer Emergency Response Exercise
Global Positioning System
Geological Survey of Pakistan
Hyogo Framework for Action
Hydro-Thermal Coefficient
International Non-governmental Organizations
Land Surface Water Index
Monitoring and Evaluation
Main Boundary Thrust
Maximum Considered Earthquake
Millennium Development Goals
Multi Hazard Vulnerability and Risk Assessment
Main Karakorum Thrust
Main Mantle Thrust
Medical Officer
AMS
APWMO
AWO
AWS
C&W
CBDRM
CBEWS
CMO
CRI
DC
DCO
DDMA
DDRMP
DEWS
DHQ
DM
DMS
DRR
DSHA
ENT
EPI
EWS
PDMA
FFC
FGD
GIS
GLOF
GMPE
GOERE
GPS
GSP
HFA
HTC
INGOs
LSWI
M&E
MBT
MCE
MGDs
MHVRA
MKT
MMT
MO
LIST OF ACRONYMS
MOVERE
MPE
MS
MSSP
MM
NARC
NCEG
NDI
NDMA
NDMC
NDMP
NDMP-SC
NDRIS
NDVI
NDWI
NEOC
NFPP
NHA
NHEPRN
NIDM
PARC
PASSCO
PBC
PBS
PCIW
PCRWR
PDMA
PDSI
PGA
PHDI
PIPD
PMD
PMO
PMU
PRA
PSC
PSHA
PTA
PTCL
PTWC
PWMO
Mobilization of Volunteer for Emergency Response Exercise
Most Probable Earthquake
Medical Superintendent
Micro Seismic Study Program (Pakistan Atomic Energy
Commission)
Moment Magnitude
National Agricultural Research Center
National Center of Excellence in Geology
NOAA Drought Index
National Disaster Management Authority
National Disaster Management Commission
National Disaster Management Plan
Steering Committee for National Disaster Management Plan
National Disaster Risk Information System
Normalized Difference Vegetation Index
Normalized Difference Water Index
National Emergency Operations Centre
National Flood Protection Plan
National Highway Authority
National Health Emergency Preparedness and Response
Network
National Institute of Disaster Management
Pakistan Agricultural Research Council
Pakistan Agricultural Services and Storage Corporation
Pakistan Broadcasting Corporation
Pakistan Bureau of Statistics
Pakistan Commissioner for Indus Waters
Pakistan Center for Research on Water Resources
Provincial Disaster Management Authority
Palmer Drought Severity Index
Peak Ground Acceleration
Palmer Hydrological Drought Severity Index
Provincial Irrigation and Power Department
Pakistan Meteorological Department
Principal Medical Officer
Project Management Unit
Participatory Risk Assessment
Project Steering Committee
Probabilistic Seismic Hazard Assessment
Pakistan Telecommunication Authority
Pakistan Telecommunication Company Limited
Pacific Tsunami Warning Center
Principal Women Medical Officer
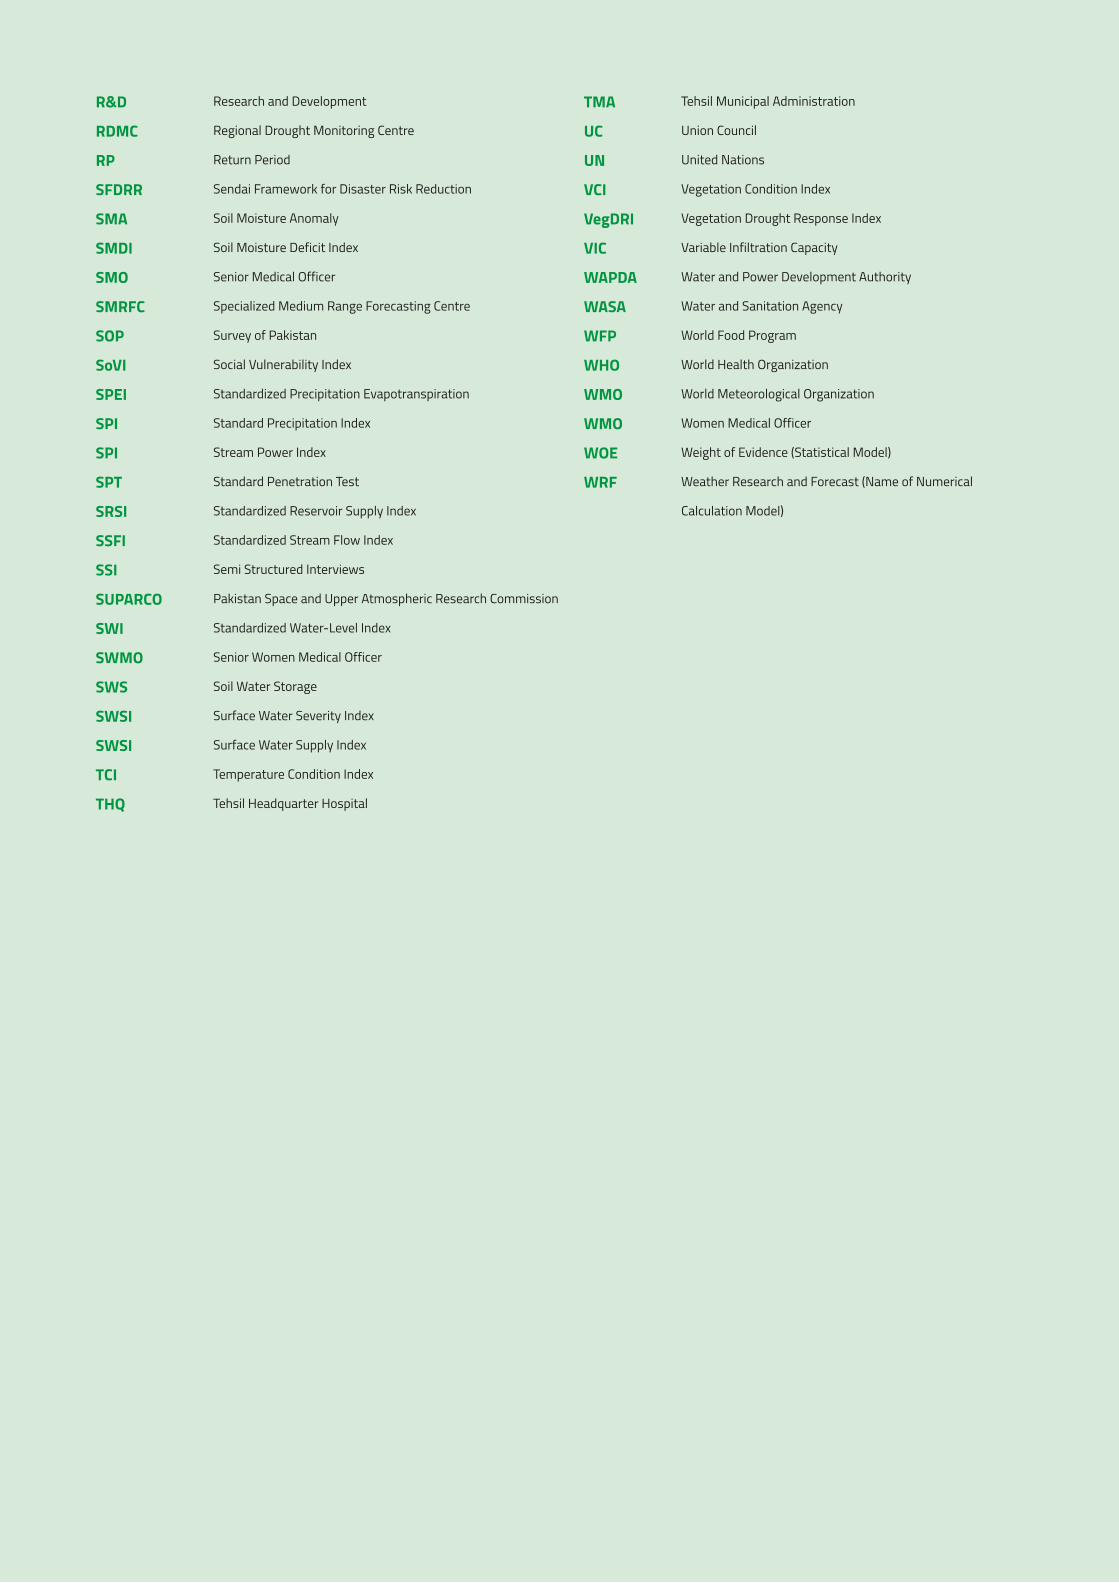
Human-Made Disasters
Impacts
Indicators
Indices
Infant Mortality Rate
Irrigated Area
Irrigation Sources
Land Cover
Land Use
Land Use Planning
Landslide
Latitude
Longitude
Meander-Belt
Middle Schools
Mitigation
Monitoring & Evaluation (M&E)
Mortality Rate
Mouza / Deh
Multi Hazard Vulnerability and Risk Assessment (MHVRA)
Multi Hazards
National Authority
Natural Disasters
Nullah
Performance Indicator
Physical / Structural Vulnerability
Piedmont
Population Growth Rate
Population Projections
Precipitation
Preparedness
Prevention
Primary Healthcare
Primary School
Quality Assurance
Range Lands
Recovery
Relative Humidity
Reliability
Relief / Response
Residual Risk
Resilience
Retrofitting
Risk
Risk Assessment
Risk Management
Risk Transfer
River
Riverine Flood
Rural Area
Rural Health Centre (RHC)
Secondary Health Care
Secondary School or Higher School
Sedimentary Rocks
Slope Failure
Social Vulnerability
Steppe Climate
Storm Surge
Streambed
Structural / Non-Structural Measures
Sustainable Development
Tehsil Head Quarter (THQ)
Tertiary Healthcare
Tsunami
Unemployment
Urban Area
Urban Flood
Veterinary Facility
Vulnerability
Wet Areas
Wheat Procurement Centre
Acceptable Risk
Accountability
Activity
Adaptation
Affected Area
Alluvium Deposits
Avalanche
Average Household Size
Bare Area with Sparse Natural Vegetation
Bare Areas
Base-Line Study
Basic Health Unit (BHU)
Built-up Area
Capacity
Capacity Building
Census
Climate Change
Climatology
Coping Capacity
Craton
Critical Facilities
Crop Irrigated
Crop Marginal and Irrigated Saline
Crop Rainfed
Cyclone
Debris Flow
Demographics
Density
Disaster
Disaster Management
Disaster Risk
Disaster Risk Management (DRM)
Disaster Risk Reduction(DRR)
District Head Quarter (DHQ)
Drought
Early Warning
Earthquake
Effectiveness
Efficiency
Element at Risks
Elevation
Emergency Management
Employment
Entity
Eolian Deposits
Evaluation
Evaporites
Exposure
Flash Flood
Flood
Flood Plain Deposits
Food Insecurity
Forecast
Geography
Geological Composition
Geology
Geospatial Data Bank
GLOF
Hazard
Hazard Analysis
Hill Torrent (Flood)
Household
Human-Induced Disasters
R&D
RDMC
RP
SFDRR
SMA
SMDI
SMO
SMRFC
SOP
SoVI
SPEI
SPI
SPI
SPT
SRSI
SSFI
SSI
SUPARCO
SWI
SWMO
SWS
SWSI
SWSI
TCI
THQ
Research and Development
Regional Drought Monitoring Centre
Return Period
Sendai Framework for Disaster Risk Reduction
Soil Moisture Anomaly
Soil Moisture Deficit Index
Senior Medical Officer
Specialized Medium Range Forecasting Centre
Survey of Pakistan
Social Vulnerability Index
Standardized Precipitation Evapotranspiration
Standard Precipitation Index
Stream Power Index
Standard Penetration Test
Standardized Reservoir Supply Index
Standardized Stream Flow Index
Semi Structured Interviews
Pakistan Space and Upper Atmospheric Research Commission
Standardized Water-Level Index
Senior Women Medical Officer
Soil Water Storage
Surface Water Severity Index
Surface Water Supply Index
Temperature Condition Index
Tehsil Headquarter Hospital
TMA
UC
UN
VCI
VegDRI
VIC
WAPDA
WASA
WFP
WHO
WMO
WMO
WOE
WRF
Tehsil Municipal Administration
Union Council
United Nations
Vegetation Condition Index
Vegetation Drought Response Index
Variable Infiltration Capacity
Water and Power Development Authority
Water and Sanitation Agency
World Food Program
World Health Organization
World Meteorological Organization
Women Medical Officer
Weight of Evidence (Statistical Model)
Weather Research and Forecast (Name of Numerical
Calculation Model)
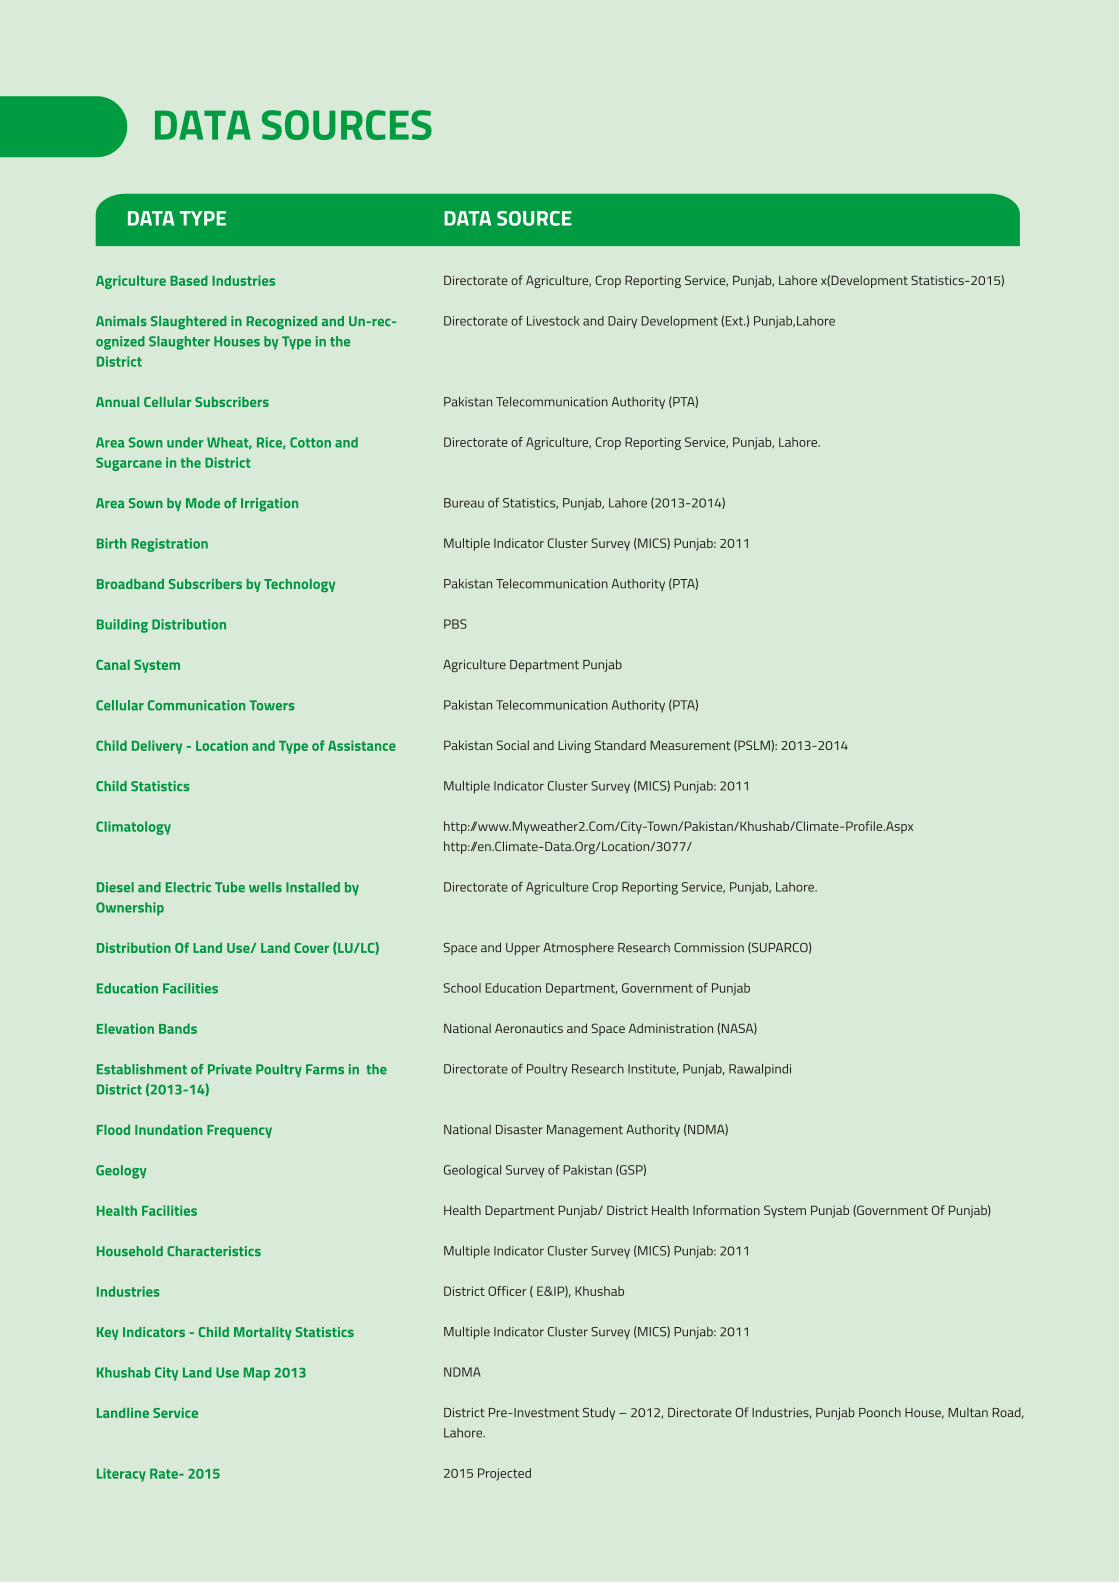
DATA TYPE DATA SOURCE
Directorate of Agriculture, Crop Reporting Service, Punjab, Lahore x(Development Statistics-2015)
Directorate of Livestock and Dairy Development (Ext.) Punjab,Lahore
Pakistan Telecommunication Authority (PTA)
Directorate of Agriculture, Crop Reporting Service, Punjab, Lahore.
Bureau of Statistics, Punjab, Lahore (2013-2014)
Multiple Indicator Cluster Survey (MICS) Punjab: 2011
Pakistan Telecommunication Authority (PTA)
PBS
Agriculture Department Punjab
Pakistan Telecommunication Authority (PTA)
Pakistan Social and Living Standard Measurement (PSLM): 2013-2014
Multiple Indicator Cluster Survey (MICS) Punjab: 2011
http://www.Myweather2.Com/City-Town/Pakistan/Khushab/Climate-Profile.Aspxhttp://en.Climate-Data.Org/Location/3077/
Directorate of Agriculture Crop Reporting Service, Punjab, Lahore.
Space and Upper Atmosphere Research Commission (SUPARCO)
School Education Department, Government of Punjab
National Aeronautics and Space Administration (NASA)
Directorate of Poultry Research Institute, Punjab, Rawalpindi
National Disaster Management Authority (NDMA)
Geological Survey of Pakistan (GSP)
Health Department Punjab/ District Health Information System Punjab (Government Of Punjab)
Multiple Indicator Cluster Survey (MICS) Punjab: 2011
District Officer ( E&IP), Khushab
Multiple Indicator Cluster Survey (MICS) Punjab: 2011
NDMA
District Pre-Investment Study – 2012, Directorate Of Industries, Punjab Poonch House, Multan Road, Lahore.
2015 Projected
Agriculture Based Industries
Animals Slaughtered in Recognized and Un-rec-ognized Slaughter Houses by Type in the District
Annual Cellular Subscribers
Area Sown under Wheat, Rice, Cotton and Sugarcane in the District
Area Sown by Mode of Irrigation
Birth Registration
Broadband Subscribers by Technology
Building Distribution
Canal System
Cellular Communication Towers
Child Delivery - Location and Type of Assistance
Child Statistics
Climatology
Diesel and Electric Tube wells Installed by Ownership
Distribution Of Land Use/ Land Cover (LU/LC)
Education Facilities
Elevation Bands
Establishment of Private Poultry Farms in the District (2013-14)
Flood Inundation Frequency
Geology
Health Facilities
Household Characteristics
Industries
Key Indicators - Child Mortality Statistics
Khushab City Land Use Map 2013
Landline Service
Literacy Rate- 2015
DATA SOURCES
Literacy Ratio
Major Industries
Metaled Roads Length By Type Zone and District
Mineral Productions
Motor Vehicles 'Registered' By Type
Number of Cattle, Sheep and Buffaloes in the District
Number of Registered Factories & Employment Level
Number of Work Animals by Type in the District (2006)
Percentage of children that have been immu-nized by Type of Antigen- Based on record and recall
Population
Population by Age Group, Gender and Rural /Urban
Population by Mother Tongue- 2015
Population Distribution
Population on Basis of Religion-1998
Post-Natal consultations of the District
Railway Network
Sales of Fertilizer by year 2013-2014
Socio-Economic Statistics of The District Khushab (In Percentage)
Threshers and Harvesters in the District (2012-13)
Total tractors in the District by 2004 Census
Tractors by Make in District (2012-13)
Types Of Health Facility
Veterinary Institution in the District
Human-Made Disasters
Impacts
Indicators
Indices
Infant Mortality Rate
Irrigated Area
Irrigation Sources
Land Cover
Land Use
Land Use Planning
Landslide
Latitude
Longitude
Meander-Belt
Middle Schools
Mitigation
Monitoring & Evaluation (M&E)
Mortality Rate
Mouza / Deh
Multi Hazard Vulnerability and Risk Assessment (MHVRA)
Multi Hazards
National Authority
Natural Disasters
Nullah
Performance Indicator
Physical / Structural Vulnerability
Piedmont
Population Growth Rate
Population Projections
Precipitation
Preparedness
Prevention
Primary Healthcare
Primary School
Quality Assurance
Range Lands
Recovery
Relative Humidity
Reliability
Relief / Response
Residual Risk
Resilience
Retrofitting
Risk
Risk Assessment
Risk Management
Risk Transfer
River
Riverine Flood
Rural Area
Rural Health Centre (RHC)
Secondary Health Care
Secondary School or Higher School
Sedimentary Rocks
Slope Failure
Social Vulnerability
Steppe Climate
Storm Surge
Streambed
Structural / Non-Structural Measures
Sustainable Development
Tehsil Head Quarter (THQ)
Tertiary Healthcare
Tsunami
Unemployment
Urban Area
Urban Flood
Veterinary Facility
Vulnerability
Wet Areas
Wheat Procurement Centre
Acceptable Risk
Accountability
Activity
Adaptation
Affected Area
Alluvium Deposits
Avalanche
Average Household Size
Bare Area with Sparse Natural Vegetation
Bare Areas
Base-Line Study
Basic Health Unit (BHU)
Built-up Area
Capacity
Capacity Building
Census
Climate Change
Climatology
Coping Capacity
Craton
Critical Facilities
Crop Irrigated
Crop Marginal and Irrigated Saline
Crop Rainfed
Cyclone
Debris Flow
Demographics
Density
Disaster
Disaster Management
Disaster Risk
Disaster Risk Management (DRM)
Disaster Risk Reduction(DRR)
District Head Quarter (DHQ)
Drought
Early Warning
Earthquake
Effectiveness
Efficiency
Element at Risks
Elevation
Emergency Management
Employment
Entity
Eolian Deposits
Evaluation
Evaporites
Exposure
Flash Flood
Flood
Flood Plain Deposits
Food Insecurity
Forecast
Geography
Geological Composition
Geology
Geospatial Data Bank
GLOF
Hazard
Hazard Analysis
Hill Torrent (Flood)
Household
Human-Induced Disasters
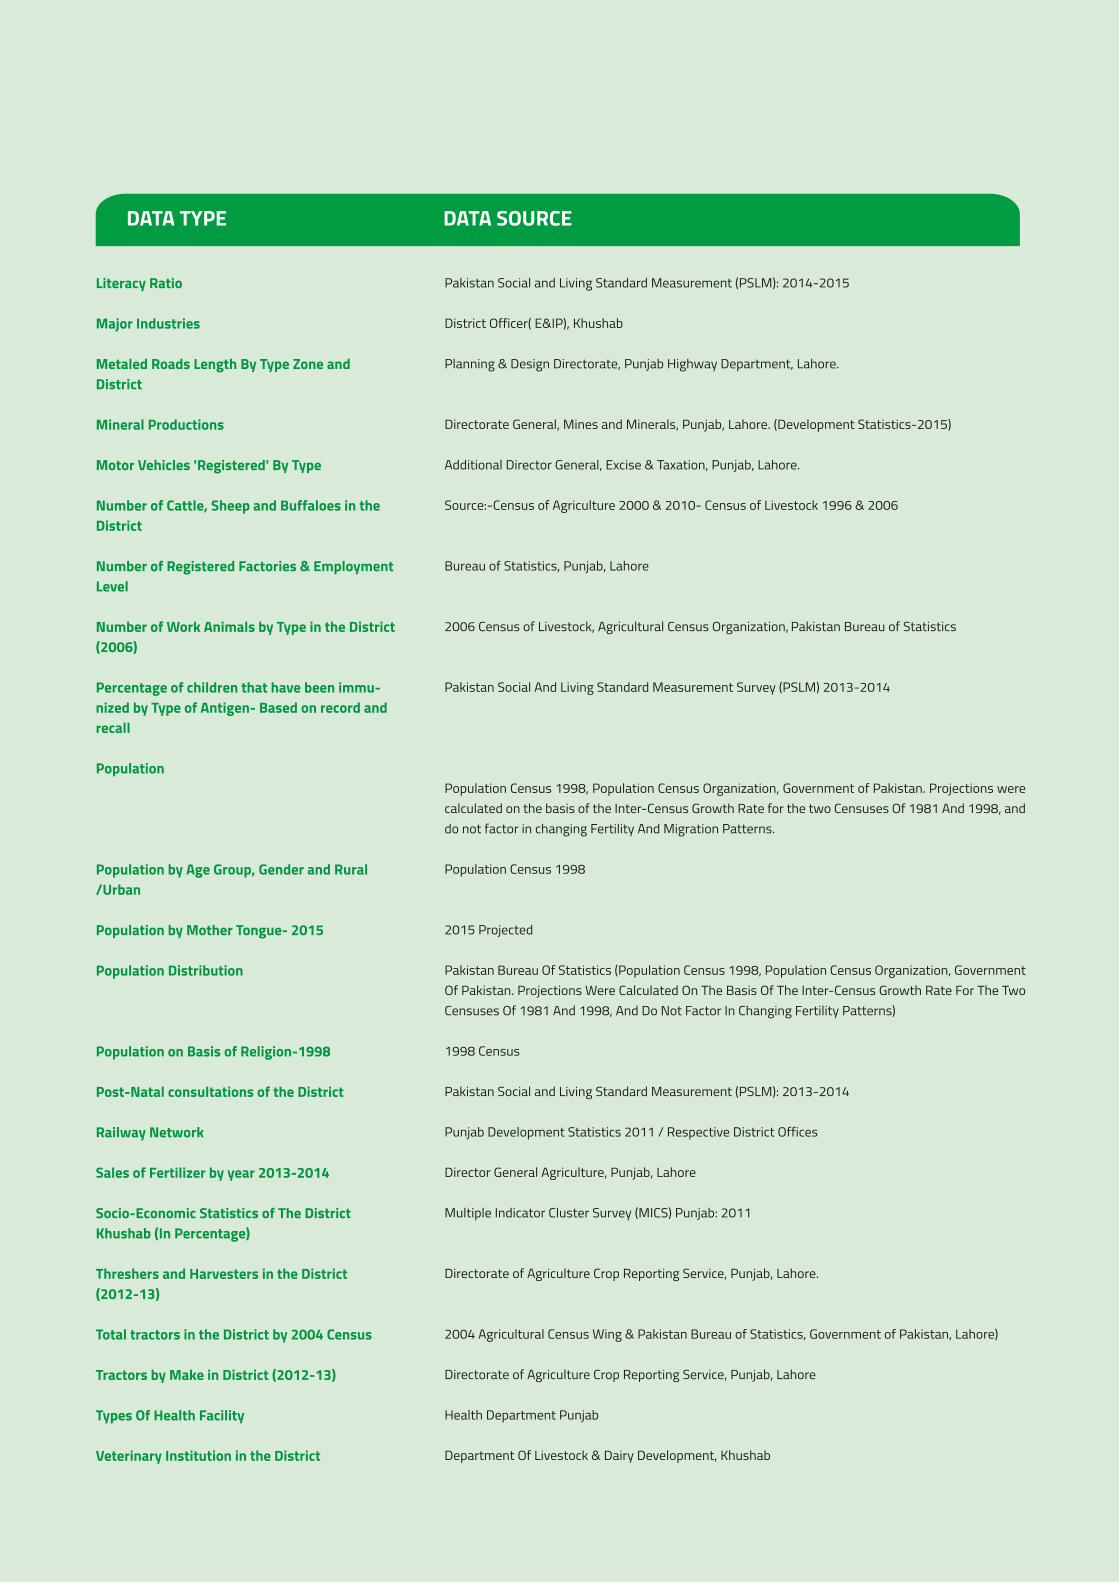
Agriculture Based Industries
Animals Slaughtered in Recognized and Un-rec-ognized Slaughter Houses by Type in the District
Annual Cellular Subscribers
Area Sown under Wheat, Rice, Cotton and Sugarcane in the District
Area Sown by Mode of Irrigation
Birth Registration
Broadband Subscribers by Technology
Building Distribution
Canal System
Cellular Communication Towers
Child Delivery - Location and Type of Assistance
Child Statistics
Climatology
Diesel and Electric Tube wells Installed by Ownership
Distribution Of Land Use/ Land Cover (LU/LC)
Education Facilities
Elevation Bands
Establishment of Private Poultry Farms in the District (2013-14)
Flood Inundation Frequency
Geology
Health Facilities
Household Characteristics
Industries
Key Indicators - Child Mortality Statistics
Khushab City Land Use Map 2013
Landline Service
Literacy Rate- 2015
DATA TYPE DATA SOURCE
Literacy Ratio
Major Industries
Metaled Roads Length By Type Zone and District
Mineral Productions
Motor Vehicles 'Registered' By Type
Number of Cattle, Sheep and Buffaloes in the District
Number of Registered Factories & Employment Level
Number of Work Animals by Type in the District (2006)
Percentage of children that have been immu-nized by Type of Antigen- Based on record and recall
Population
Population by Age Group, Gender and Rural /Urban
Population by Mother Tongue- 2015
Population Distribution
Population on Basis of Religion-1998
Post-Natal consultations of the District
Railway Network
Sales of Fertilizer by year 2013-2014
Socio-Economic Statistics of The District Khushab (In Percentage)
Threshers and Harvesters in the District (2012-13)
Total tractors in the District by 2004 Census
Tractors by Make in District (2012-13)
Types Of Health Facility
Veterinary Institution in the District
Pakistan Social and Living Standard Measurement (PSLM): 2014-2015
District Officer( E&IP), Khushab
Planning & Design Directorate, Punjab Highway Department, Lahore.
Directorate General, Mines and Minerals, Punjab, Lahore. (Development Statistics-2015)
Additional Director General, Excise & Taxation, Punjab, Lahore.
Source:-Census of Agriculture 2000 & 2010- Census of Livestock 1996 & 2006
Bureau of Statistics, Punjab, Lahore
2006 Census of Livestock, Agricultural Census Organization, Pakistan Bureau of Statistics
Pakistan Social And Living Standard Measurement Survey (PSLM) 2013-2014
Population Census 1998, Population Census Organization, Government of Pakistan. Projections were calculated on the basis of the Inter-Census Growth Rate for the two Censuses Of 1981 And 1998, and do not factor in changing Fertility And Migration Patterns.
Population Census 1998
2015 Projected
Pakistan Bureau Of Statistics (Population Census 1998, Population Census Organization, Government Of Pakistan. Projections Were Calculated On The Basis Of The Inter-Census Growth Rate For The Two Censuses Of 1981 And 1998, And Do Not Factor In Changing Fertility Patterns)
1998 Census
Pakistan Social and Living Standard Measurement (PSLM): 2013-2014
Punjab Development Statistics 2011 / Respective District Offices
Director General Agriculture, Punjab, Lahore
Multiple Indicator Cluster Survey (MICS) Punjab: 2011
Directorate of Agriculture Crop Reporting Service, Punjab, Lahore.
2004 Agricultural Census Wing & Pakistan Bureau of Statistics, Government of Pakistan, Lahore)
Directorate of Agriculture Crop Reporting Service, Punjab, Lahore
Health Department Punjab
Department Of Livestock & Dairy Development, Khushab
Human-Made Disasters
Impacts
Indicators
Indices
Infant Mortality Rate
Irrigated Area
Irrigation Sources
Land Cover
Land Use
Land Use Planning
Landslide
Latitude
Longitude
Meander-Belt
Middle Schools
Mitigation
Monitoring & Evaluation (M&E)
Mortality Rate
Mouza / Deh
Multi Hazard Vulnerability and Risk Assessment (MHVRA)
Multi Hazards
National Authority
Natural Disasters
Nullah
Performance Indicator
Physical / Structural Vulnerability
Piedmont
Population Growth Rate
Population Projections
Precipitation
Preparedness
Prevention
Primary Healthcare
Primary School
Quality Assurance
Range Lands
Recovery
Relative Humidity
Reliability
Relief / Response
Residual Risk
Resilience
Retrofitting
Risk
Risk Assessment
Risk Management
Risk Transfer
River
Riverine Flood
Rural Area
Rural Health Centre (RHC)
Secondary Health Care
Secondary School or Higher School
Sedimentary Rocks
Slope Failure
Social Vulnerability
Steppe Climate
Storm Surge
Streambed
Structural / Non-Structural Measures
Sustainable Development
Tehsil Head Quarter (THQ)
Tertiary Healthcare
Tsunami
Unemployment
Urban Area
Urban Flood
Veterinary Facility
Vulnerability
Wet Areas
Wheat Procurement Centre
Acceptable Risk
Accountability
Activity
Adaptation
Affected Area
Alluvium Deposits
Avalanche
Average Household Size
Bare Area with Sparse Natural Vegetation
Bare Areas
Base-Line Study
Basic Health Unit (BHU)
Built-up Area
Capacity
Capacity Building
Census
Climate Change
Climatology
Coping Capacity
Craton
Critical Facilities
Crop Irrigated
Crop Marginal and Irrigated Saline
Crop Rainfed
Cyclone
Debris Flow
Demographics
Density
Disaster
Disaster Management
Disaster Risk
Disaster Risk Management (DRM)
Disaster Risk Reduction(DRR)
District Head Quarter (DHQ)
Drought
Early Warning
Earthquake
Effectiveness
Efficiency
Element at Risks
Elevation
Emergency Management
Employment
Entity
Eolian Deposits
Evaluation
Evaporites
Exposure
Flash Flood
Flood
Flood Plain Deposits
Food Insecurity
Forecast
Geography
Geological Composition
Geology
Geospatial Data Bank
GLOF
Hazard
Hazard Analysis
Hill Torrent (Flood)
Household
Human-Induced Disasters

Developed byProject Management Unit (PMU),
National Disaster Management Authority,Prime Minister’s Office, 2nd Floor, Sector G-5/1
Constitution Avenue, Islamabad - Pakistanwww.ndma.gov.pk
Human-Made Disasters
Impacts
Indicators
Indices
Infant Mortality Rate
Irrigated Area
Irrigation Sources
Land Cover
Land Use
Land Use Planning
Landslide
Latitude
Longitude
Meander-Belt
Middle Schools
Mitigation
Monitoring & Evaluation (M&E)
Mortality Rate
Mouza / Deh
Multi Hazard Vulnerability and Risk Assessment (MHVRA)
Multi Hazards
National Authority
Natural Disasters
Nullah
Performance Indicator
Physical / Structural Vulnerability
Piedmont
Population Growth Rate
Population Projections
Precipitation
Preparedness
Prevention
Primary Healthcare
Primary School
Quality Assurance
Range Lands
Recovery
Relative Humidity
Reliability
Relief / Response
Residual Risk
Resilience
Retrofitting
Risk
Risk Assessment
Risk Management
Risk Transfer
River
Riverine Flood
Rural Area
Rural Health Centre (RHC)
Secondary Health Care
Secondary School or Higher School
Sedimentary Rocks
Slope Failure
Social Vulnerability
Steppe Climate
Storm Surge
Streambed
Structural / Non-Structural Measures
Sustainable Development
Tehsil Head Quarter (THQ)
Tertiary Healthcare
Tsunami
Unemployment
Urban Area
Urban Flood
Veterinary Facility
Vulnerability
Wet Areas
Wheat Procurement Centre
Acceptable Risk
Accountability
Activity
Adaptation
Affected Area
Alluvium Deposits
Avalanche
Average Household Size
Bare Area with Sparse Natural Vegetation
Bare Areas
Base-Line Study
Basic Health Unit (BHU)
Built-up Area
Capacity
Capacity Building
Census
Climate Change
Climatology
Coping Capacity
Craton
Critical Facilities
Crop Irrigated
Crop Marginal and Irrigated Saline
Crop Rainfed
Cyclone
Debris Flow
Demographics
Density
Disaster
Disaster Management
Disaster Risk
Disaster Risk Management (DRM)
Disaster Risk Reduction(DRR)
District Head Quarter (DHQ)
Drought
Early Warning
Earthquake
Effectiveness
Efficiency
Element at Risks
Elevation
Emergency Management
Employment
Entity
Eolian Deposits
Evaluation
Evaporites
Exposure
Flash Flood
Flood
Flood Plain Deposits
Food Insecurity
Forecast
Geography
Geological Composition
Geology
Geospatial Data Bank
GLOF
Hazard
Hazard Analysis
Hill Torrent (Flood)
Household
Human-Induced Disasters