Oxford Bookworms Library: Starter: Survive!, Helen Brooke ...

R6/2 Neurons with IntranuclearInclusions Survive for Prolonged Periods
in the Brains of Chimeric Mice
ANTON REINER,* NOBEL DEL MAR, YUN-PING DENG, CHRISTOPHER A. MEADE,
ZHIQIANG SUN, AND DANIEL GOLDOWITZ
Department of Anatomy & Neurobiology, College of Medicine, University of TennesseeHealth Science Center, Memphis, Tennessee 38163
ABSTRACTThe R6/2 mouse possesses mutant exon 1 of human Hdh, and R6/2 mice with 150 CAG
repeats show neurological abnormalities by 10 weeks and die by 15 weeks. Few brainabnormalities, however, are evident at death, other than widespread ubiquitinated neuronalintranuclear inclusions (NIIs). We constructed R6/2t�/t�7 wildtype (WT) chimeric mice toprolong survival of R6/2 cells and determine if neuronal death and/or neuronal injury becomeevident with longer survival. ROSA26 mice (which bear a lacZ transgene) were used as WTto distinguish between R6/2 and WT neurons. Chimeric mice consisting partly of R6/2 cellslived longer than pure R6/2 mice (up to 10 months), with the survival proportional to the R6/2contribution. Genotypically R6/2 cells formed NIIs in the chimeras, and these NIIs grew onlyslightly larger than in 12-week pure R6/2 mice, even after 10 months. Additionally, neuropilaggregates formed near R6/2 neurons in chimeric mice older than 15 weeks. Thus, R6/2neurons could survive well beyond 15 weeks in chimeras. Moreover, little neuronal degen-eration was evident in either cortex or striatum by routine histological stains. Nonetheless,striatal shrinkage and ventricular enlargement occurred, and striatal projection neuronmarkers characteristically reduced in Huntington’s disease were diminished. Consistent withsuch abnormalities, cortex and striatum in chimeras showed increased astrocytic glial fibril-lary acidic protein. These results suggest that while cortical and striatal neurons can survivenearly a year with nuclear and extranuclear aggregates of mutant huntingtin, such lengthysurvival does reveal cortical and striatal abnormality brought on by the truncated mutantprotein. J. Comp. Neurol. 505:603–629, 2007. © 2007 Wiley-Liss, Inc.
Indexing terms: Huntington’s disease; aggregates; neurodegeneration; pathogenesis; CAG repeats
Huntington’s disease (HD) is a dominant hereditaryneurodegenerative disorder characterized by progressivecognitive decline and motor dysfunction (Bruyn and Went,1986; Wilson et al., 1987; Albin and Tagle, 1995). Themajor site of neuron loss in HD is the striatal part of thebasal ganglia, and it is specifically the loss of striatalprojection neurons that accounts for the progressive move-ment disorder (Vonsattel et al., 1985; De La Monte et al.,1988; Hedreen et al., 1991; Storey et al., 1992). The dis-ease process, however, does not affect striatal projectionneurons uniformly, since enkephalinergic striatal projec-tion neurons and their terminals in the external pallidalsegment (GPe) and substance P (SP)-containing striatalprojection neurons and their terminals in the substantianigra are affected earlier in the disease than are SP-containing striatal projection neurons and their terminalsin the internal pallidal segment (GPi) (Reiner et al., 1988;
Albin et al., 1990a,b, 1992; Kiyama et al., 1990; Richfieldet al., 1995; Sapp et al., 1995; Glass et al., 2000; Deng et
Grant sponsor: Cure HD Contract from the Hereditary Disease Founda-tion (to D.G., A.R.); Grant sponsor: National Institutes of Health (NIH);Grant numbers: NS19620, NS28721 (to A.R.).
Current address for C.A. Meade: Department of Natural Sciences, Shaw-nee State University, Portsmouth, OH 45662.
Current address for Z. Sun: Department of Psychiatry, University ofTennessee Health Science Center, Memphis, TN 38163.
*Correspondence to: Dr. Anton Reiner, Dept. of Anatomy & Neurobiol-ogy, University of Tennessee – Memphis, 855 Monroe Ave., Memphis, TN38163. E-mail: [email protected]
Received 10 January 2007; Revised 1 June 2007; Accepted 22 August2007
DOI 10.1002/cne.21515Published online in Wiley InterScience (www.interscience.wiley.com).
THE JOURNAL OF COMPARATIVE NEUROLOGY 505:603–629 (2007)
© 2007 WILEY-LISS, INC.
al., 2004). Additionally, parvalbuminergic striatal inter-neurons appear to be as vulnerable in HD as striatalprojection neurons (Harrington and Kowall, 1991; Ferreret al., 1994). By contrast, two other major types of striatalinterneurons, namely, cholinergic interneurons and inter-neurons co-containing somatostatin, neuropeptide Y,and/or neuronal nitric oxide synthase, survive withoutapparent loss even in advanced HD (Ferrante et al., 1985,1986, 1987a,b; Albin et al., 1990a).
The gene and the specific mutation responsible for HDare known (Huntington’s Disease Collaborative ResearchGroup, 1993). The HD gene product huntingtin is thoughtto be a cell membrane-associated scaffolding protein in-volved in vesicular trafficking (DiFiglia et al., 1995; Sharpet al., 1995; Wood et al., 1996; Velier et al., 1998; Qin etal., 2004). The pathogenic mutation in the HD gene in-volves an expansion of a polymorphic CAG repeat in exon1 of the HD gene, beyond its normal 35 repeat upper limit(Huntington’s Disease Collaborative Research Group,1993; Albin and Tagle, 1995). The means by which thismutation causes preferential destruction of the striatumis uncertain. The facts that HD shows autosomal domi-nant inheritance and that neither partial nor completeknockout of the gene yields HD-like symptoms suggestthat, whatever its precise mechanism of action, the HDmutation acts in a “gain-of-function” manner (Wexler,1987; Myers et al., 1989; Ambrose et al., 1994; Duyao etal., 1995; Nasir et al., 1995; Zeitlin et al., 1995; Gusellaand MacDonald, 1996; Persichetti et al., 1996; White etal., 1997; Reiner et al., 2003).
Neuropathological studies suggest that the gain of func-tion in HD could be the formation of ubiquitinated aggre-gates of the N-terminal fragment of mutated huntingtin(Htt), which is thought to occur due to enhanced cleavageand/or aggregation of the polyglutamine rich part of themutant Htt N-terminus (DiFiglia et al., 1997; Li and Li,1998; Martindale et al., 1998; Gutekunst et al., 1999;Maat-Schieman et al., 1999). Both cytoplasmic and in-tranuclear aggregation have been observed, but it is un-certain which of these, if either, is involved in HD patho-genesis (Kuemmerle et al., 1999). Several of thetransgenic mouse models of HD in which the insertedtransgene codes for all or part of mutated Htt or knockinmouse models of HD show accumulation of the N-terminalfragment in nuclear and cytoplasmic aggregates (Mangia-rini et al., 1996; Reddy et al., 1998; Hodgson et al., 1999;Schilling et al., 1999; Li et al., 2000; Laforet et al., 2001;Lin et al., 2001; Menalled et al., 2002; Slow et al., 2003).The best characterized of these is the Bates R6/2 trans-genic (t�) mouse (Mangiarini et al., 1996; Davies et al.,1997; Carter et al., 1999; Bibb et al., 2000; Morton et al.,2000; Tabrizi et al., 2000; Meade et al., 2002; Stack et al.,2005), which in its original state expressed exon 1 ofhuman Hdh with about 150 CAG repeats under the hu-man Hdh promoter. Heterozygous R6/2 mice with 150repeats show evident nuclear aggregates in cortex andstriatum by 6 weeks, neurological signs by about 10weeks, and evident cytoplasmic aggregates by 14 weeks,with mouse death occurring typically between 12 and 15weeks. Despite the early development of neuronal aggre-gates and animal morbidity, little clearcut neuronal losshas commonly been noted by the time of animal death(Davies et al., 1997; Tabrizi et al., 2000; Turmaine et al.,2000). In other mutant mouse models of HD as well,formation of prominent nuclear and/or cytoplasmic aggre-
gates has not been clearly linked to neuronal loss (Reddyet al., 1998; Hodgson et al., 1999; Li et al., 2000; Laforet etal., 2001; Lin et al., 2001; Menalled et al., 2002; Slow et al.,2003). These findings and several in vitro studies haveraised doubts about whether aggregation of theN-terminal fragment in HD is deleterious and is truly thekey pathogenic event in HD (Kim and Tanzi, 1998; Saudouet al., 1998; Sisodia, 1998; Arrasate et al., 2004).
The failure to find widespread death of neurons in R6/2mice when nearly all neurons form large nuclear aggre-gates may be a reflection of the rapidity with which themice experience decline leading to death. The pervasivedysfunction caused by the mutant protein may kill themouse before the aggregates have enough time to causepervasive neuronal loss. We constructed R6/2t�/t� 7wildtype (WT) chimeric mice to prolong survival of R6/2cells (by prolonging animal survival) and thereby deter-mine if extensive neuronal death would be observed ifNIIs remained in residence for longer. We found that R6/2chimeras could survive up to 10 months of age, and neu-rons containing prominent intranuclear aggregates sur-vived for as long as the mice survived, with no obvioussigns of significant neuron loss. Nonetheless, there wasprominent astrocytic upregulation of glial fibrillary acidicprotein (GFAP) in cortex and striatum, as well as neuro-transmitter alterations among striatal projection neurons,indicating that prolonging survival of the R6/2 neuronshad led to heightened abnormality in cortex and striatum.
MATERIALS AND METHODS
Subjects
R6/2 mice [B6CBA-Tg(Hdexon1)62] (Mangiarini et al.,1996) and ROSA26 mice were obtained from the JacksonLaboratories (Bar Harbor, ME) and bred in our colony atthe University of Tennessee. The R6/2 mice used in thesestudies possessed a transgene for exon 1 of the human HDgene with about 150 CAG repeats and were bred with(CBA � C57BL/6) F1 (B6CBAF1) mice to obtain miceheterozygous for the transgene. All R6/2 mice from ourcolony were genotyped using a polymerase chain reaction(PCR)-based amplification method modified from Mangia-rini et al. (1996), described in further detail below. RO-SA26 mice bear a lacZ transgene on a B6CBA background(Friedrich and Soriano, 1991) and served as the source ofWT cells (i.e., lacking the R6/2 transgene) for the majorityof our aggregation chimeras. In some instances, ICR mice(obtained from Harlan, Indianapolis, IN), or WT offspringfrom R6/2 litters were used as the WT component in thechimera construction. The R6/2 mice were used togetherwith WT mice to create chimeras by the method of earlyembryo aggregation, as also described in more detail be-low. All studies were conducted in accordance with NIHand Society for Neuroscience policies on the ethical use ofanimals in research. We made 137 chimeras for the anal-yses presented in this article.
Production of aggregation chimeras
Aggregation chimeras were created by standard meth-ods (Goldowitz et al., 1992) with the goal of making micethat consisted of varying ratios of R6/2 cells and WT cells.Briefly, R6/2 females were superovulated and mated with(B6xCBA)F1 males, or (B6xCBA)F1 females were super-ovulated and mated with R6/2 males. Females were taken
The Journal of Comparative Neurology. DOI 10.1002/cne
604 REINER ET AL.
2 days after the presence of a vaginal plug that indicatedsuccessful coitus and their oviducts flushed with mediumto harvest the 4–8 cell stage embryos used to make thechimeras. The WT contribution to the chimeras was typ-ically derived from embryos of ROSA26 mice, as notedabove, which allowed identification of cells from the WTcontribution to the chimeras by an X-gal histochemicalprocedure for the lacZ transgene protein product(Friedrich and Soriano, 1991). The WT cells in the chime-ras in which ICR or B6xCBA were used as the source ofthe WT contribution were identified as the neurons lack-ing NIIs.
PCR genotyping
PCR genotyping was performed as described previouslyto identify R6/2 mice for breeding purposes, or to identifychimeric mice possessing R6/2t�/t� cells (Duyao et al.,1995; Chen et al., 1997; Fusco et al., 1999). Genomic DNAextracted from tail biopsies was analyzed by PCR for exon1 of the human HD gene. PCR amplification was carriedout using primers directed toward the transgene (5�-CGGCTGAGGCAGCAGCGGCTGT-3� and 5�-GCAGCA-GCAGCAGCAACAGCCGCCACCGCC-3�), resulting in a120-bp fragment. One-half of a microliter of DNA templatewas used. The PCR reaction was carried out in thin-walledPCR tubes, each containing 5.0 �L 10� AM Buffer, 3.0 �L25 mM MgCl2, 1.0 �L 10 mM dNTPs, 5.0 �L each of 20 �Mof primers, 5 �L DMSO, 6.9 �L DNA dye, 18.9 �L dH20,0.2 �L TAQ polymerase, and 0.5 �L DNA template. Con-tamination from extraneous DNA was assessed by replac-ing the tail DNA with distilled water. A thermal cyclerwas used for amplification (MJ Research, Watertown, MA)with the following cycle conditions: denaturation at 94°Cfor 30 seconds, annealing at 65°C for 30 seconds, andextension at 72°C for 90 seconds each for 30 cycles. Fol-lowing amplification, aliquots of reaction product wereanalyzed by electrophoresis on ethidium bromide-impregnated 1.5% agarose gels. Note that in some chime-ras the PCR based on tail biopsy failed to detect the R6/2transgene, yet subsequent immunohistochemistry forubiquitin revealed the presence of NIIs in brain. Underthese circumstances the presence of NIIs was taken asdefinitive evidence that the given chimeric mouse pos-sessed R6/2 cells. Chimeric animals that were R6/2-negative by PCR assay of the tail snip and brain-positivefor the presence of the R6/2 transgene by ubiquitin-positive immunolabeling of NIIs tended to be those chime-ras most enriched in contribution from the WT strain.
In selected R6/2 mice from the colony used to create thechimeras, we assessed the size of the CAG repeat region ofthe transgene. To do this, a second PCR analysis wasconducted using a primer pair that amplified across theCAG repeat (5�-CCG CTC AGG TTC TGC TTT TA-3� and5�-GGC TGA GGA AGC TGA GGA G-3�). For this PCRamplification, a GC-rich PCR system (Roche, Indianapo-lis, IN) was used following the manufacturer’s instruc-tions. Amplification was carried out according to the fol-lowing cycle conditions: at 94°C for 30 seconds, 58°C for 30seconds, and 68°C for 90 seconds, for 40 cycles, followed bya final extension at 68°C for 7 minutes. These analysesshowed that the repeat size in the R6/2 mice used to makethe chimeras was typically about 150 and only in rareinstances as high as 200. Other investigators have alsonoted that CAG repeats in the 160–225 range do not
significantly affect the phenotype of R6/2 mice (Hockly etal., 2003; Stack et al., 2005).
Tissue fixation
Under deep Avertin anesthesia, mice were perfusedtranscardially with sodium phosphate-buffered saline(PB; 0.1 M sodium phosphate at pH 7.4 with 0.9% NaCl)followed by 4% paraformaldehyde in 0.1 M lysine, 0.1 Msodium periodate, 0.1 M sodium phosphate (pH 7.4).These mice included R6/2t�/t� 7 WT chimeric mice,R6/2t-/t� (WT R6/2 littermate) 7 WT chimeric mice,100% nonchimeric R6/2 mice, and 100% nonchimeric WTlittermates of pure R6/2t�/t� mice. The fixed brains wereremoved after perfusion and stored in a 20% sucrose / 10%glycerol solution at 4°C. Brains were sectioned frozen on asliding microtome in the transverse plane at 35 �m. Eachof these brains was collected as 6–12 separate series in 0.1M PB, 0.02% sodium azide, and stored until processed forimmunohistochemistry, as described in further detail be-low. A series of sections from the brain of each mouse wasstained for cresyl violet to study normal brain histology.The brains of a few chimeric R6/2 and chimeric WT micewere fixed by cardiac perfusion with Bouin’s fixative, de-hydrated, embedded in paraffin, sectioned at 10 �m witha rotary microtome, mounted on slides, and alternate se-ries stained for cresyl violet or hematoxylin and eosin(H&E).
Demonstration of cell genotype using �-galactosidase histochemistry
At least one series of sections through the anterior-to-posterior extent of the brain for each R6/2 7 ROSA26chimeric mouse was processed for the X-gal marker usingthe procedure of Oberdick et al. (1994), in which sectionswere incubated at 30–35°C overnight in buffer (containing5 mM of potassium ferricyanide and ferrocyanide, 2 mMmagnesium chloride, 0.02% Nonidet P-40, and 0.01% so-dium deoxycholate) with 0.1% X-gal substrate in dimethylsulfoxide (Boehringer-Mannheim, Indianapolis, IN).Slides were rinsed and counterstained with neutral red toidentify and quantify X-gal-labeled and unlabeled cells.Tissue was dehydrated, cleared in xylene, and coverslipsapplied with Permount.
Immunohistochemistry
Immunohistochemical labeling was carried out to char-acterize aggregate formation in the chimeras, as well asassess if increased longevity of R6/2 neurons yielded anyabnormalities in neuropeptide and neurotransmitter ex-pression in cortex or striatum, or increased astrocyticexpression of GFAP, a marker of cellular stress. Conven-tional immunofluorescence or the peroxidase-antiperoxidase(PAP) procedures were employed (Anderson and Reiner,1990; Figueredo-Cardenas et al., 1994; Fusco et al., 1999).Ubiquitinated aggregates of the N-terminal fragment of mu-tant huntingtin were visualized using a mouse monoclonalantibody against ubiquitin (Davies et al., 1997; Meade et al.,2002) or using the mouse monoclonal antibody EM48against the N-terminus of huntingtin (Li and Li, 1998;Meade et al., 2002). Antigen retrieval (Jiao et al., 1999) wasused to enhance immunolabeling for ubiquitin and hunting-tin. Striatal neuropeptides and calcium-binding proteinsthat are affected in HD (Reiner et al., 1988; Kiyama et al.,1990; Harrington and Kowall, 1991; Ferrer et al., 1994) were
The Journal of Comparative Neurology. DOI 10.1002/cne
605R6/2 NEURONS SURVIVE IN ADULT MOUSE BRAIN
screened to assess the normalcy of the striatum in chimericbrains. Markers examined included calbindin (CALB), parv-albumin (PARV), SP, and enkephalin (ENK) (Reiner andAnderson, 1990; Figueredo-Cardenas et al., 1994, 1998;Kawaguchi et al., 1995). The antisera used to detect CALB,PARV, SP, and ENK are the same as used in several of ourprior studies (Reiner et al., 1991; Figueredo-Cardenas et al.,1994, 1998; Deng et al., 2004). GFAP immunolabeling wasused to assess any neural injury in the chimeric mice by thedetection of the reactive astroglial response to neural injury(Eddleston and Mucke, 1993; Eng and Ghirnikar, 1994).
Antisera specificity
The precise antigenic target, the host species, the com-mercial source, the catalog and lot numbers, and the doc-umentation of specificity (by radioimmunoassay, Westernblot, blocked control, or validation of the labeling patternby comparison to that obtained with antibodies of previ-ously documented specificity) for all antibodies used in thepresent study are summarized in Table 1.
The anti-ubiquitin antibody used was a mouse monoclo-nal antibody generated using purified bovine ubiquitin (76amino acids, 8.5 kD) conjugated to KLH (keyhole lymphethemocyanin) as the immunogen. The manufacturer re-ports that the antibody detects ubiquitin in humans, cows,rats, mice, and chickens. Western blot confirms antibodyspecificity by showing that this antibody detects polyubiq-uitination of proteins mediated by E3 ubiquitin ligase inin vitro assays (Yeh et al., 2001). Additionally, the immu-nolabeling pattern we obtained with this antibodymatches that obtained with diverse other antibodiesagainst ubiquitin (Perry et al., 1987; Davies et al., 1997;Meade et al., 2002; Neumann et al., 2006).
The anti-GFAP antibody used was a rabbit polyclonalantibody generated using bovine GFAP (MW 50 kD) ex-tracted from spinal cord as the immunogen. The manufac-turer reports that the antibody immunolabels astrocytesin neural tissue from humans, rats, mice, guinea pigs,hamsters, kangaroos, sheep, cats, and monkeys. The im-
munolabeling pattern we obtained with this antibodymatches that obtained with diverse other validated anti-bodies against GFAP (Liem et al., 1978; Debus et al., 1983;Stack et al., 2005).
The anti-CALB used was a mouse monoclonal antibodygenerated using calbindin-D28 purified from chicken du-odenum conjugated to tetanus toxoid as the immunogenwith carbodiimide as a coupling agent (clone CL-300). Theantibody specifically detects calbindin-D28 in brain andkidney from humans, monkeys, rabbits, rats, mice, chick-ens, hamsters, sheep, guinea pigs, and fish. By radioim-munoassay (RIA), the antibody has high affinity forcalbindin-D28 in extracts of rat cerebellum and kidney,and by Western blot of rat brain the antibody detects a28-kD MW band corresponding to calbindin-D28 (Celio etal., 1990). Immunolabeling of rat brain sections with thisantibody can be completely blocked with rat calbindin andthe labeling pattern the antibody yields matches that ob-tained with diverse other antibodies against calbindin(Celio, 1990; Celio et al., 1990; Deng et al., 2007). Theanti-CALB does not detect other calcium-binding proteinssuch as PARV or calretinin, since neither PARV, calmod-ulin, oncomodulin, nor S-100 block labeling (Celio, 1990).Moreover, the immunolabeling pattern the mouse anti-CALB yields differs markedly from that for either PARVor calretinin (Celio, 1990; Deng et al., 2007).
The anti-PARV antibody used was a mouse monoclonalantibody generated using parvalbumin purified from carpmuscle conjugated to tetanus toxoid as the immunogenwith carbodiimide as a coupling agent (clone PA-235). ByRIA, the antibody has high affinity for rat brain parval-bumin (Celio et al., 1988). By RIA, the antibody also de-tects PARV from human, monkey, mouse, chicken, andcarp with high affinity. By Western blots, the antibodydetects a 12-kD MW protein corresponding to parvalbu-min in rat cerebellum. Immunolabeling of rat brain sec-tions with this antibody can be completely blocked withrat muscle parvalbumin and the labeling pattern it yieldsmatches that obtained with diverse other antibodies
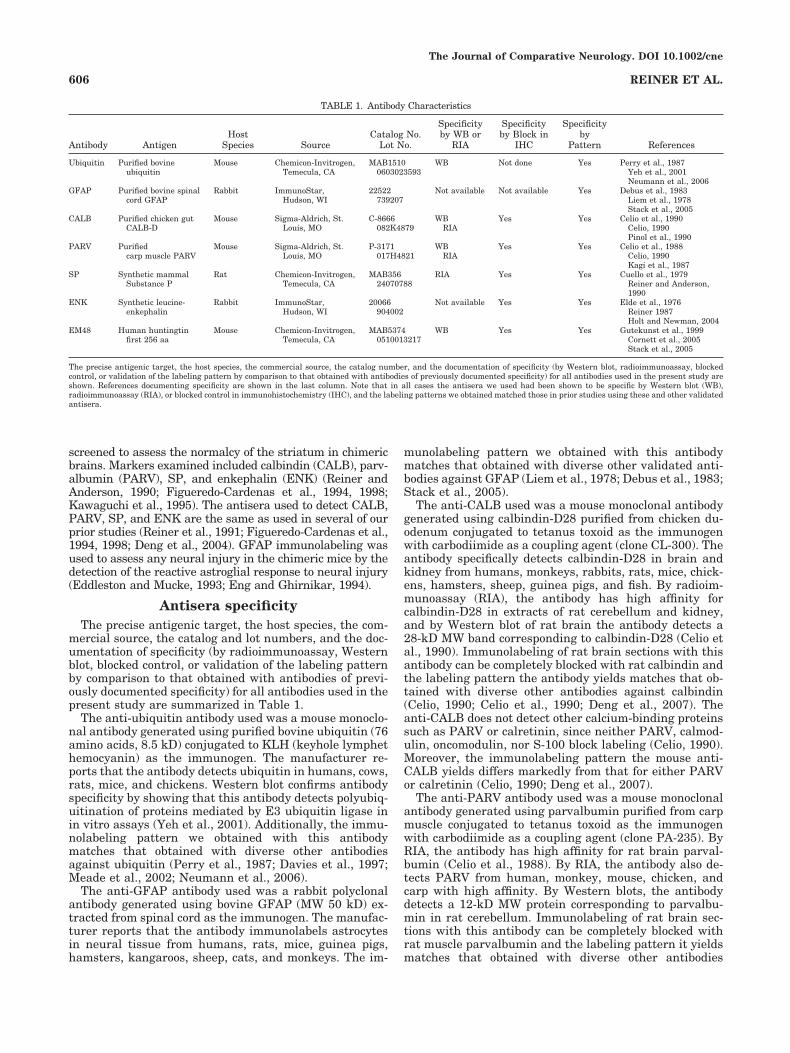
TABLE 1. Antibody Characteristics
Antibody AntigenHost
Species SourceCatalog No.
Lot No.
Specificityby WB or
RIA
Specificityby Block in
IHC
Specificityby
Pattern References
Ubiquitin Purified bovineubiquitin
Mouse Chemicon-Invitrogen,Temecula, CA
MAB15100603023593
WB Not done Yes Perry et al., 1987Yeh et al., 2001Neumann et al., 2006
GFAP Purified bovine spinalcord GFAP
Rabbit ImmunoStar,Hudson, WI
22522739207
Not available Not available Yes Debus et al., 1983Liem et al., 1978Stack et al., 2005
CALB Purified chicken gutCALB-D
Mouse Sigma-Aldrich, St.Louis, MO
C-8666082K4879
WBRIA
Yes Yes Celio et al., 1990Celio, 1990Pinol et al., 1990
PARV Purifiedcarp muscle PARV
Mouse Sigma-Aldrich, St.Louis, MO
P-3171017H4821
WBRIA
Yes Yes Celio et al., 1988Celio, 1990Kagi et al., 1987
SP Synthetic mammalSubstance P
Rat Chemicon-Invitrogen,Temecula, CA
MAB35624070788
RIA Yes Yes Cuello et al., 1979Reiner and Anderson,1990
ENK Synthetic leucine-enkephalin
Rabbit ImmunoStar,Hudson, WI
20066904002
Not available Yes Yes Elde et al., 1976Reiner 1987Holt and Newman, 2004
EM48 Human huntingtinfirst 256 aa
Mouse Chemicon-Invitrogen,Temecula, CA
MAB53740510013217
WB Yes Yes Gutekunst et al., 1999Cornett et al., 2005Stack et al., 2005
The precise antigenic target, the host species, the commercial source, the catalog number, and the documentation of specificity (by Western blot, radioimmunoassay, blockedcontrol, or validation of the labeling pattern by comparison to that obtained with antibodies of previously documented specificity) for all antibodies used in the present study areshown. References documenting specificity are shown in the last column. Note that in all cases the antisera we used had been shown to be specific by Western blot (WB),radioimmunoassay (RIA), or blocked control in immunohistochemistry (IHC), and the labeling patterns we obtained matched those in prior studies using these and other validatedantisera.
The Journal of Comparative Neurology. DOI 10.1002/cne
606 REINER ET AL.
against PARV (Celio, 1990; Deng et al., 2007). The anti-PARV does not detect other calcium-binding proteins suchas calbindin or calretinin, since neither CALB, calmodu-lin, oncomodulin, nor S-100 block labeling (Celio, 1990).Additionally, the immunolabeling pattern the mouse anti-PARV yields differs markedly from that for either calbi-ndin or calretinin (Celio, 1990; Deng et al., 2007).
The anti-SP used was a rat monoclonal antibody gener-ated using SP (an 11 amino acid peptide) conjugated tobovine serum albumin using carbodiimide as the couplingagent. The specificity of the antibody was assessed usingRIA. The antibody, termed NC1/34 by Cuello et al. (1979),avidly binds SP and the 5–8 amino acids at itsC-terminus, but shows no crossreactivity for leucine-enkephalin, methionine-enkephalin, somatostatin, orbeta-endorphin. The antibody does have a 5% crossreac-tivity with the SP-related peptide eledoisin, which is ab-sent from rat brain in any event (Cuello et al., 1979).Additionally, due to the similarities of neurokinin A to SPin the last five amino acids of the carboxy terminus, themonoclonal anti-SP may crossreact with neurokinin A.This concern, however, is mitigated by the fact that SPand neurokinin A derive from the same precursor (prepro-tachykinin) and are entirely colocalized in striatum(Krause et al., 1987; Anderson and Reiner, 1990). Immu-nolabeling of rat brain sections with this antibody can becompletely blocked with synthetic SP, and the labelingpattern it yields matches that obtained with diverse otherantibodies against SP (Cuello et al., 1979; Reiner andAnderson, 1990). Finally, the distribution of labeledperikarya obtained with this antibody in the forebrainmatches that obtained by in situ hybridization for prepro-tachykinin (Gerfen and Young, 1988; Reiner and Ander-son, 1990).
The anti-ENK used was a rabbit polyclonal antibodygenerated against a mixture of glutaraldehyde conjugatesof leucine-enkephalin (a pentapeptide) as the immunogen:leucine-enkephalin–KLH, leucine-enkephalin–bovine se-rum albumin, and leucine-enkephalin–bovine thyroglob-ulin. Immunolabeling with this leucine-enkephalin(LENK) antibody in rat and hamster brain is completelyeliminated by blocking with synthetic leucine-enkephalin(Holt and Newman, 2004), as is also demonstrated forprior lots of this antibody (Elde et al., 1976; Reiner, 1987).While the antibody also crossreacts slightly withmethionine-enkephalin, as shown in blocking studies(Holt and Newman, 2004), this concern is mitigated by thefact that leucine-enkephalin and methionine-enkephalinderive from the same precursor (preproenkephalin) andare thus entirely colocalized in striatum (Reiner, 1987;Reiner and Anderson, 1990). The labeling pattern thisanti-LENK antibody yields matches that obtained withdiverse other antibodies against leucine-enkephalin (Eldeet al., 1976; Reiner, 1987; Reiner and Anderson, 1990).Finally, the distribution of labeled perikarya obtainedwith this antibody in the forebrain matches that obtainedby in situ hybridization for preproenkephalin (Gerfen andYoung, 1988; Reiner and Anderson, 1990).
The EM48 anti-huntingtin used was a mouse monoclo-nal antibody generated using a GST fusion protein fromthe first 256 amino acids (i.e., the N-terminus) of humanhuntingtin (with the polyglutamine tract deleted) as theimmunogen. In Western blots of extracts of tsBN2 cellstransfected with N-terminal huntingtin, EM48 detected asingle band of the molecular weight of the transfected
N-terminal huntingtin construct (Cornett et al., 2005).Moreover, immunostaining of mouse brain sections withthis antibody is blocked by N-terminal huntingtin (Stacket al., 2005). Finally, the immunolabeling pattern we ob-tained with this antibody matches that obtained withdiverse other antibodies against the N-terminus of hun-tingtin (Davies et al., 1997; Gutekunst et al., 1999; Meadeet al., 2002).
Quantitative image analysis of NII size
Images of individual fields of view of motor cortex, sen-sory cortex, striatum, and the ventroposterior thalamicnucleus in material in which NIIs had been immunola-beled for ubiquitin were captured using a 40� objective, aNewvicon video camera, a Mac IIci computer, and theprogram NIH Image (v. 1.57). This magnification allowedus to capture fields of view in which many NIIs could bedistinctly visualized. NIIs were highlighted using thethresholding capabilities of Image and the diameter of theNIIs measured via the image analysis capabilities of thissoftware. Measurements were made for each structure ineach of several fields of view in several sections in two12-week-old R6/2 mice, three 13-week-old R6/2 chimeras,three 20-week-old R6/2 chimeras and three 30-week-oldR6/2 chimeras. NIIs were thus measured in �200–500neurons per region per animal, and the mean for eachregion per group is thus based on over 1,000 neurons. Theresults were analyzed by analysis of variance (ANOVA)followed by planned comparisons by Fisher’s ProtectedLeast Squares Design (PLSD).
Quantitative regional analysis
Examination of sections through the rostral telenceph-alon suggested lateral ventricular expansion and striataland septal shrinkage in the R6/2 chimera brains. To eval-uate this quantitatively, image analysis was carried outand the Cavalieri method used (Petersen et al., 1997;Pakkenberg et al., 2002; Zhang and Oorschot, 2006) todetermine the volume of the telencephalon, cerebral cor-tex, lateral ventricle, striatum, and septum for the rostraltelencephalon (i.e., from the end of the olfactory bulb tothe level of the anterior commissure) in 10 R6/2 chimerasand 10 age-matched WT chimeras (23.2 vs. 25.6 weeks ofage, respectively), and in 10 R6/2 mice and 10 age-matched WT mice (12.2 vs. 13.2 weeks of age, respec-tively). For each mouse an image of each section in aone-in-six series from the rostral telencephalic pole to thelevel of the anterior commissure, at which levels the lat-eral ventricles are narrow in normal mice, was captured athigh resolution using a MikroTek II scanner. NIH Imagewas used to measure the areas occupied by the entiretelencephalon, the cerebral cortex, the lateral ventricles,the striata, and the septa on each side of the brain. Thecerebral cortex was measured from the midline to therhinal fissure from pial surface to external capsule. Thestriatum was defined by the contours of the external cap-sule and globus pallidus, while the septum was defined asthe region between the corpus callosum and a horizontalline connecting the ventral tips of the ventral horns of thelateral ventricles. Section thickness and spacing wereused to determine the volume of each structure from theareal measurements in the cross-section. Cortical, ventric-ular, striatal, and septal volume were then expressed as apercent of total rostral telencephalic volume for compari-
The Journal of Comparative Neurology. DOI 10.1002/cne
607R6/2 NEURONS SURVIVE IN ADULT MOUSE BRAIN

sons among groups. The results were analyzed by ANOVAfollowed by planned comparisons by Fisher’s PLSD.
Quantitative image analysis ofimmunolabeling in striatal target areas
To assess injury to the neurons of origin of the striatalprojection systems, quantitative computer-assisted imageanalysis was carried out on immunolabeled striatal termi-nals in each of the main striatal projection targets. Forthese studies the areal extent and immunolabeling inten-sity of the ENK� fiber plexus in the GPe and the SP�fiber plexuses in the GPi and substantia nigra were quan-tified. Images of individual fields were captured using a4� objective, a Newvicon video camera, a Mac IIci com-puter, and the program Image (v. 1.57), as in prior studies(Meade et al., 2000; Sun et al., 2002). This magnificationallowed us to capture the entire GPe, GPi, and SN withinthe section. For GPe, its ENK� plexus in the 4–6 sectionsspanning its rostrocaudal extent were captured bilater-ally. For GPi, images of the entire GPi from 2–4 sectionsspanning its rostrocaudal extent were bilaterally capturedfor analysis. For substantia nigra, the entire nigra in 4–6sections spanning its rostrocaudal extent were capturedand analyzed bilaterally. The immunolabeled fibers inthese striatal target areas were highlighted and the areaoccupied by them and their labeling intensity determinedusing the thresholding and optical density measuring ca-pabilities of Image. The area of the nucleus was deter-mined by circumscribing the nucleus with the marqueetool. The percent of the nucleus occupied by labeled fiberswas calculated from this information for each image and amean calculated for all measures of the nucleus for eachanimal. To correct for slight variations in image intensitystemming from variations in lighting during image cap-ture and/or from variations in the staining protocol, thebackground intensity of the captured images was stan-dardized to a value of 100 on the 0–255 gray scale em-ployed by the Image program using the image editingcapabilities of this program. The region of each imageused to set the background intensity was an area of unla-beled white matter within the field of view. For GPe andGPi the internal capsule was used for optical densitystandardization, while for images of the substantia nigrathe cerebral peduncle was used. The measurements of thecross-sectional area of the three striatal target structureswere also use to determine if differential shrinkage of anyof the target areas that might affect fiber density occurredin any of the groups. In brief, no significant differenceswere found between R6/2 chimeras and the WT chimeras,or between R6/2 mice and their WT controls in the size ofthe GPe, GPi, or nigra, expressed as a percent of forebrain(GPe and GPi) or midbrain (nigra). All results were ana-lyzed by ANOVA followed by planned comparisons byFisher’s PLSD.
Preparation of illustrations
All images used for the illustrations presented herewere captured digitally, and illustrations were preparedusing Adobe Photoshop (v. 6.0, San Jose, CA). Minor im-perfections were removed, contrast enhanced, and imagessharpened as needed to obtain illustrations that presentedthe results with clarity and verisimilitude.
RESULTS
General traits of chimeras
From our efforts to create aggregation chimeras con-taining R6/2 cells, 137 chimeric animals were born, ofwhich 54 (39%) were identified as including cells contain-ing the R6/2 transgene either by a positive PCR signal orby immunolabeling of NIIs in brain. Of the 54 identified asR6/2 chimeras, nine were negative for the transgene bythe tailsnip PCR assay. These tended to be low in R6/2contribution as judged by the few NII� neurons in brain.Among the chimeras testing positive for the R6/2 trans-gene by the tailsnip PCR test, 24 possessed no NII� brainneurons and were categorized as nonchimeric in the brainanalysis. These chimeric mice either were instances of aspurious signal from tail, or more likely demonstratedthat it was possible for R6/2 cells to colonize tail but avoidbrain. The remainder of the mice (n � 59) were chimericassemblages of PCR-negative cells from the R6/2 line andcells from the WT strain that showed no R6/2 signal in thetailsnip PCR and possessed no R6/2 neurons in brain.Note that because we bred R6/2 females with WT males toproduce the blastocysts used in chimera production, halfof our chimeras would be expected to bear R6/2 cells. Sincethe frequency of chimeric mice with R6/2 neurons in thebrain was well less than half, it may be that R6/2 cells areat a disadvantage in colonizing the chimeric brain.
We found that many chimeric mice possessing an R6/2contribution confirmed by PCR genotyping or NII immu-nolabeling lived considerably longer than nonchimericR6/2 mice, while others had a lifespan similar or onlyslightly longer than that of the nonchimeric R6/2 mice.The body weight of the chimeras showing greatest longev-ity was similar to that of the WT chimeras (i.e., R6/2t�/t�7 ROSA26) and nonchimeric WT mice through much oftheir lifespan. While some R6/2 chimeras were sacrificedat specific timepoints, the vast majority were allowed tolive until they showed morbidity. All R6/2 chimeras al-lowed to live their full lifespan did eventually show typicalR6/2 morbidity, although the age at which this occurredranged from 12–42 weeks. The behavioral abnormalitieswere those typical of nonchimeric R6/2 mice—tremors, atendency to be seizure-prone, clasping of the forelimbswith hindlimbs and curling of the body when held by thetail, and impaired balance and righting reflexes. Weightloss was present at morbidity, but was only slight for thelonger-lived chimeras. For example, a cohort of 20 R6/2chimeras that lived a mean of 182.2 � 12.5 days weighed24.6 � 1.7 g, while a cohort of WT chimeras that lived amean of 187.9 � 11.8 days weighed 26.2 �1.5 g. Anychimeric mice that began to show severe R6/2-type mor-bidity were sacrificed and transcardially perfused withfixative as described in Materials and Methods. Thebrains were histologically processed as free-floating slide-mounted sections for ubiquitin immunolabeling and/orX-gal histochemistry and the overall prevalence of mutantand WT cells in brain determined. The length of survivalwas found to be inversely related to the overall contribu-tion of genetically R6/2 cells to the chimera brain (r ��0.487; P 0.05), although some animals were exceptionsto this rule. This issue will be analyzed further in depth ina subsequent article.
The Journal of Comparative Neurology. DOI 10.1002/cne
608 REINER ET AL.
Histological analysis of R6/2 chimeras: R6/2neurons and NIIs
The brains of the chimeras appeared largely normal ingross morphology, cytoarchitecture, and regional packingdensity of neurons (Fig. 1). As noted by others (Stack etal., 2005), the brains of the R6/2 mice were significantlysmaller than those of the age-matched R6/2 littermates, asconfirmed by statistical comparison of rostral telence-phalic volume (R6/2 was 19.6% smaller) (Table 2). While asimilar trend was observed in comparing the R6/2 7 WTchimeras to the age-matched WT 7 WT chimeras, thedifference in rostral telencephalic volume (R6/2 chimerawas 11.4% less) was not significantly different betweenthese two groups (P � 0.0586). Thus, the brains of R6/2chimeric mice were not as much smaller than WT as wastrue of the R6/2 mice. Lateral ventricle volume (as a per-cent of rostral telencephalic volume), however, was signif-icantly greater in the R6/2t�/t� chimeras than in WTchimeras (94.6% greater), WT R6/2 littermates (74.8%greater), and R6/2 mice (47.5% greater) (Table 2). While atrend was present as well toward greater lateral ventriclevolume (as a percent of rostral telencephalic volume) inthe R6/2 mice than in WT R6/2 littermates (18.5% greater)and WT chimeras (32.1%), these trends were not signifi-cant for this sample size. The considerable ventricularenlargement in the R6/2 chimeras seems explained by theoccurrence of both striatal and septal shrinkage in theR6/2t�/t� chimeras. For example, striatal volume wassignificantly less (9.49%) in the R6/2t�/t� chimeras thanin WT chimeras (as a percent of rostral telencephalicvolume). Similarly, septal volume was significantly less(as a percent of rostral telencephalic volume) in R6/2t�/t� chimeras than in the R6/2 mice (24.37% less inR6/2t�/t� chimeras) and than in the WT littermates ofR6/2 mice (22.64% less in R6/2t�/t� chimeras). Whileseptal volume as a percent of rostral telencephalic wasalso less in R6/2t�/t� chimeras than in the WT chimeras(11.68% less), this trend was not significant at the 0.05level (P � 0.1095). By contrast, striatal volume was sig-nificantly less (11.0%) in the R6/2 mice than in WT mice(as a percent of rostral telencephalic volume), but septalvolume was not significantly different between these twogroups (2.4% more in R6/2 mice), nor did it differ signifi-cantly between R6/2 chimeras and WT chimeras. Thus,while comparable striatal volume reduction occurred inthe R6/2t�/t� chimeras and the R6/2 mice, the septalshrinkage was greater in the former. No reduction incortical volume (as a percent of rostral telencephalic vol-ume) was observed in either the R6/2t�/t� chimeras orthe R6/2 mice compared to their age-matched controls(Table 2). Despite the striatal and septal shrinkage, noovertly degenerating neurons were observed in these re-gions (or in cerebral cortex) in sections from R6/2 chimerabrains that had been stained for cresyl violet or H&E.
In the R6/2t�/t� chimeras numerous R6/2 cells (asevidenced by the presence of an NII in each) were foundthroughout the brain (Fig. 2), but the abundance of theR6/2 cells in brain varied from case to case. For example,in some cases R6/2 neurons were extremely abundant,apparently making up 95–100% of the neurons in thecerebral cortex, while in others R6/2 perikarya appearedto make up no more than about 1–5% of the neurons incortex. Of note with respect to the relationship of NIIs tothe pathogenesis of neuronal injury, many NII-containing
neurons were evident in even the longest-lived (42 weeks)of the ROSA26 7 R6/2 chimeras. The regional mixing ofR6/2 and WT cells was examined in ROSA26 7 R6/2chimeras, in which ROSA26 was the WT source. Withinthe cerebral cortex and hippocampus, ROSA26 and neu-rons from the R6/2 strain were commonly segregated toadjacent columns of varying width (largely dependent onthe relative abundance of the R6/2 and ROSA26 contribu-tions), although with some degree of mixing at the columninterfaces (Fig. 3). This was evident both from the indi-vidual distributions of X-gal-labeled ROSA26 neurons andthe NII-containing R6/2 neurons in single-labeled tissue,as well as by comparisons of the distributions of these twoin adjacent sections from individual animals.
By contrast, ROSA26 and R6/2 neurons in the striatumwere interspersed without evident signs of a greater re-gional accumulation of one or the other in any part ofstriatum. This uniform intermingling was also true inother subpallial telencephalic regions, as well as in thediencephalon, midbrain, and hindbrain. The Purkinje celllayer of the cerebellum, however, showed organizationinto adjacent zones enriched in ROSA26 or R6/2. In tissuefrom ROSA26 7 R6/2 chimeras that had been double-labeled for these two markers, it was directly observedthat individual neurons labeled for X-gal did not possessNIIs (and vice versa) (Fig. 4). Moreover, the banding ofcerebral cortex into R6/2-rich and ROSA-rich slabs wasconfirmed in the double-labeled material. The double-labeled material also confirmed the more uniform mixingof the neurons from the two different sources in the stri-atum, although in low-ROSA chimeras it was observedthat neurons of the ROSA lineage tended to occur inclusters of 5–10 cells in the striatum. It seems likely,therefore, that clonally related R6/2 neurons also occurredin clusters of 5–10 cells.
Given the opportunity by the chimeric circumstances tosurvive longer (due to enhanced animal longevity), theNIIs in genotypically R6/2t�/t� neurons grew larger thanthose in the 12-week nonchimeric R6/2 mice (Table 3). Forexample, in 30-week-old R6/2 chimeras, mean NII sizewas about 30% greater in cortex, striatum, and thalamusthan in 12-week-old nonchimeric R6/2 mice (Table 3).Since NIIs discernible at the LM level have been shown tobegin to form in cortical and striatal neurons in nonchi-meric R6/2t�/t� by 4 weeks and be large in size (typicallyabout 2 �m in diameter) by 8–10 weeks (Table 3) (Meadeet al., 2002), our findings indicate that R6/2t�/t� neuronsare able survive for up to 8 months with large ubiquiti-nated NIIs. With the increased animal longevity, we alsoobserved that ubiquitinated neuropil aggregates formedin proximity to R6/2t�/t� cell bodies. These becamehighly numerous and prominent in chimeric mice olderthan 15 weeks (Fig. 5).
Histological analysis of R6/2 chimeras:immunolabeling for markers of brain
normalcy
We used various immunomarkers to assess the nor-malcy of brain functional architecture in the R6/2 chime-ras. In light of the prominent involvement of the basalganglia in HD, the possible effect of R6/2 cells on thestriatum and its projection systems was of particular in-terest. While the chimeric animals varied in their abun-dance of R6/2 neurons in the striatum (from about 5% to
The Journal of Comparative Neurology. DOI 10.1002/cne
609R6/2 NEURONS SURVIVE IN ADULT MOUSE BRAIN

Fig. 1. Images of transverse sections through the telencephalonslightly rostral to the anterior commissure of a chimera (A) with noR6/2t�/t� neurons (0% R6/2), a chimera with 50% R6/2 neurons (B),and a chimera with nearly 100% R6/2 neurons (C). The brains of thechimeras appeared largely normal in gross morphology and cytoar-chitecture, but brain size, striatal size, and septal size were slightly
less and lateral ventricular size slightly greater in chimeras possess-ing a substantial R6/2 (35%) component than those of WT litter-mates of R6/2 mice and WT 7 WT chimeras. Moreover, the ventric-ular enlargement in the 30–70% R6/2 chimeras (which were longer-lived than pure R6/2 mice) tended to be slightly greater than in pureR6/2 mice or chimeras with 90% R6/2.
The Journal of Comparative Neurology. DOI 10.1002/cne

Fig. 2. In the R6/2t�/t� chimeras, R6/2 cells (as evidenced by thepresence of an NII in each) were found intermingled among WT cellsthroughout the brain, as illustrated in these images of layer 5 of motorcortex (A), ventrolateral striatum ((B), the dorsal lateral geniculatenucleus (GLD) of the thalamus (C), and the cerebellum (D), all from achimera with about 40% R6/2t�/t� neurons in the brain. Arrowsindicate some of the NII� neurons and arrowheads indicate some of
the NII-lacking presumptive WT type neurons in the fields shown.The sections had been immunostained for ubiquitin to reveal the NIIs,and all images are from an R6/2 chimera possessing about 35% R6/2t�/t� neurons. Note that in addition to the NII� and NII-lackingPurkinje cells indicated in image D, numerous NII� and NII-lackingneurons are also evident in the cerebellar granule cell layer.
TABLE 2. Volumetric Analysis of Telencephalic Structures
GroupR6/2 Chimera
(n�10)WT Chimera
(n�10)R6/2
(n�10)WT
(n�10)
Rostral telen vol 48.51 � 0.99 mm3 54.74 � 1.95mm3 43.53 � 1.79mm3 54.13 � 3.83mm3
Rostral telen vol as % rostral telen vol 100% 100% 100% 100%Rostral cerebral cortex vol 19.06 � 0.35 mm3 22.12 � 0.63mm3 16.95 � 0.78mm3 20.88 � 1.72mm3
Rostral cerebral cortex vol as % rostral telen vol 39.30% 40.41% 38.95% 38.56%Rostral striatal vol 8.27 � 0.28 mm3 10.31 � 0.37mm3 7.48 � 0.44mm3 10.37 � 0.74mm3
Rostral str vol as % rostral telen vol 17.08% 18.87% 17.09% 19.19%Rostral lat vent vol 3.15 � 0.26mm3 1.84 � 0.31mm3 1.91 � 0.25mm3 2.08 � 0.44mm3
Rostral lat vent vol as % rostral telen vol 6.50% 3.34% 4.41% 3.72%Septal vol 1.69 � 0.08mm3 2.13 � 0.10mm3 2.00 � 0.11mm3 2.414 � 0.21mm3
Sept vol as % rostral telen vol 3.48% 3.94% 4.60% 4.49%
Table comparing the volume (vol) of rostral telencephalon (telen), cerebral cortex, striatum (str), lateral ventricle (lat vent), and septum (sept), expressed in mm3 (�SEM) and asa percent of rostral telencephalic volume. Values significantly different from genotype-matched controls are in bold.
The Journal of Comparative Neurology. DOI 10.1002/cne
611R6/2 NEURONS SURVIVE IN ADULT MOUSE BRAIN
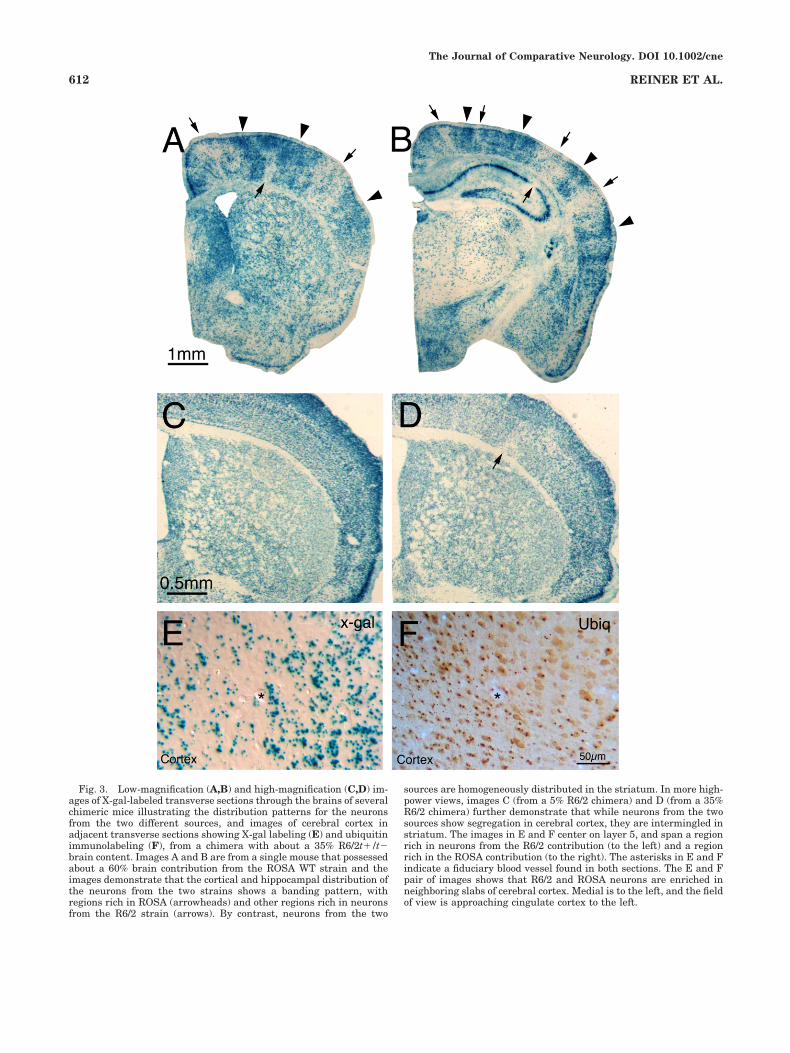
Fig. 3. Low-magnification (A,B) and high-magnification (C,D) im-ages of X-gal-labeled transverse sections through the brains of severalchimeric mice illustrating the distribution patterns for the neuronsfrom the two different sources, and images of cerebral cortex inadjacent transverse sections showing X-gal labeling (E) and ubiquitinimmunolabeling (F), from a chimera with about a 35% R6/2t�/t�brain content. Images A and B are from a single mouse that possessedabout a 60% brain contribution from the ROSA WT strain and theimages demonstrate that the cortical and hippocampal distribution ofthe neurons from the two strains shows a banding pattern, withregions rich in ROSA (arrowheads) and other regions rich in neuronsfrom the R6/2 strain (arrows). By contrast, neurons from the two
sources are homogeneously distributed in the striatum. In more high-power views, images C (from a 5% R6/2 chimera) and D (from a 35%R6/2 chimera) further demonstrate that while neurons from the twosources show segregation in cerebral cortex, they are intermingled instriatum. The images in E and F center on layer 5, and span a regionrich in neurons from the R6/2 contribution (to the left) and a regionrich in the ROSA contribution (to the right). The asterisks in E and Findicate a fiduciary blood vessel found in both sections. The E and Fpair of images shows that R6/2 and ROSA neurons are enriched inneighboring slabs of cerebral cortex. Medial is to the left, and the fieldof view is approaching cingulate cortex to the left.
The Journal of Comparative Neurology. DOI 10.1002/cne
612 REINER ET AL.

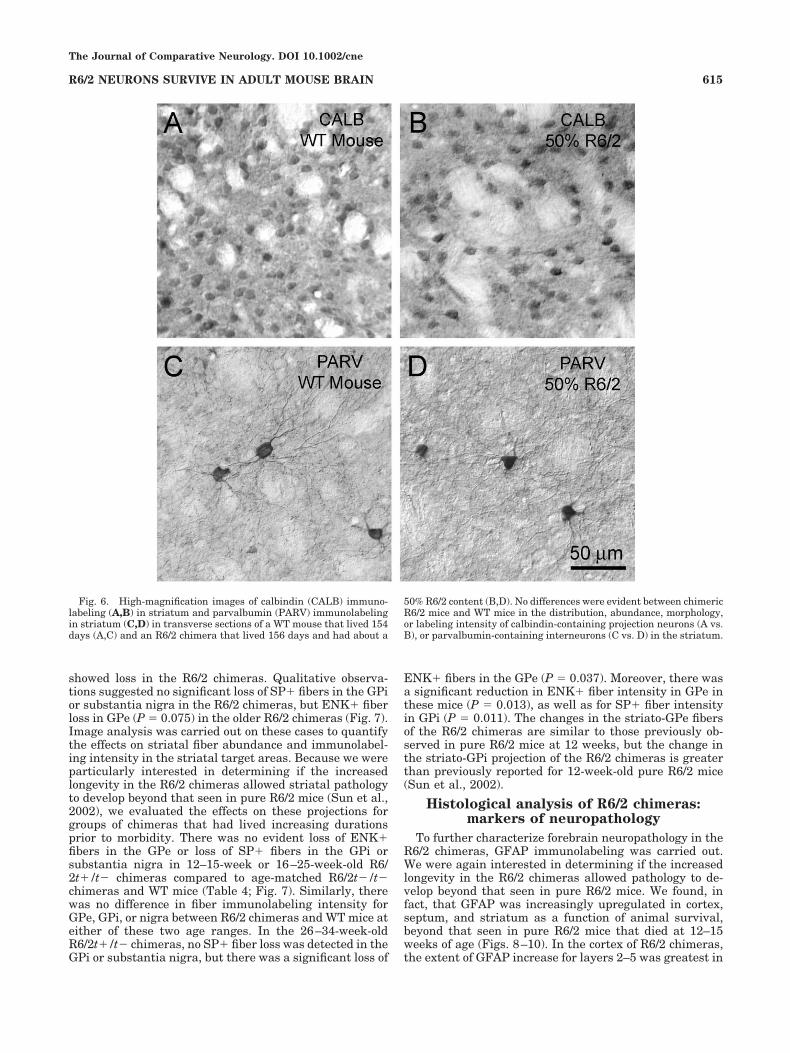
about 95%), we observed no evident differences betweenchimeric R6/2 mice and WT normal or WT chimeric micein the distribution, abundance, morphology, or labelingintensity of calbindin-containing striatal projection neu-rons, or parvalbumin-containing interneurons in the stri-
atum (Fig. 6). Parvalbuminergic neuron abundance wasalso not notably abnormal in the GPe, as was also true forcalbindinergic fibers in GPe, GPi, and the nigra arisingfrom calbindinergic striatal neurons. Similarly, we ob-served no evident differences between chimeric mice and
Fig. 4. High-magnification images of cerebral cortex (A) and stri-atum (B) showing combined X-gal labeling and ubiquitin immunola-beling, from a chimera with about a 50% R6/2t�/t� brain content.The image of cerebral cortex (A) centers on layers 2 and 3 of a regionpoor in the ROSA contribution, and shows that NIIs (large densebrown dots) and X-gal labeling (large blue-green dots) are confined toseparate neurons, reflecting their separate genotypes. Neuropil ag-gregates are also evident in the cortex of this mouse, which lived 127
days. Similarly, the image of striatum (B), which is at a slightly lowermagnification, shows that brown punctate NIIs and the slightly largerblue/green X-gal puncta are confined to separate neurons, reflectingtheir separate genotypes. Note that the X-gal labeling shows that theROSA striatal neurons occur interspersed with the NII-containingR6/2t�/t� neurons derived from the R6/2 line and occur in clusters of5–10 cells. Presumably, clonally related R6/2 neurons in striatumoccur in small clusters as well.
The Journal of Comparative Neurology. DOI 10.1002/cne
613R6/2 NEURONS SURVIVE IN ADULT MOUSE BRAIN
WT normal or WT chimeric mice in the distribution, abun-dance, morphology, or labeling intensity of CALB-containing or PARV-containing neurons in the cortex,even when R6/2-enriched columns of cortex were com-pared to WT-enriched columns in the oldest chimeras.Calbindinergic perikarya and neuropil were dense in lay-ers 2 and 3 of cortex, with scattered calbindinergic neu-rons in the deeper layers in all mice. Similarly, parvalbu-
minergic neurons were abundant in all layers of cortex inthe R6/2 chimeras.
Because of the involvement of striatal projection neu-rons in HD (Reiner et al., 1988; Albin et al., 1990a,b, 1992;Glass et al., 2000; Deng et al., 2004), we examined 33R6/2t�/t� mice (mean survival � 151.5 days) in compar-ison to 15 chimeric and nonchimeric WT mice (mean sur-vival � 162 days) to assess if striatal projection systems
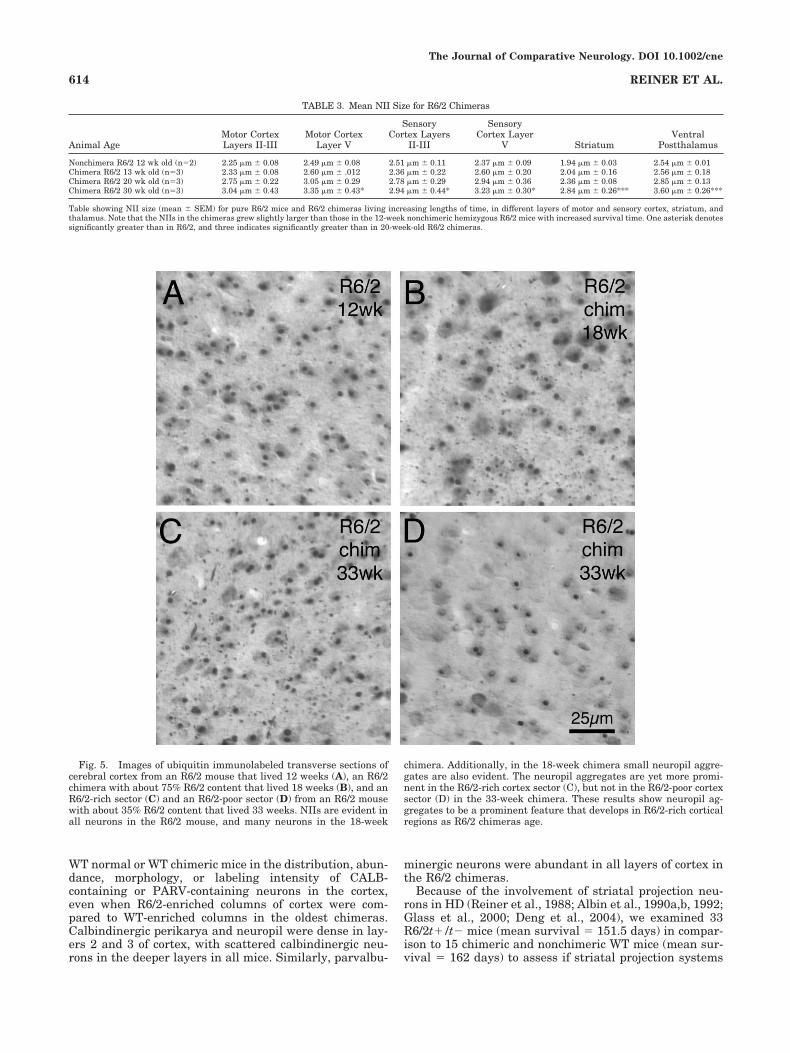
Fig. 5. Images of ubiquitin immunolabeled transverse sections ofcerebral cortex from an R6/2 mouse that lived 12 weeks (A), an R6/2chimera with about 75% R6/2 content that lived 18 weeks (B), and anR6/2-rich sector (C) and an R6/2-poor sector (D) from an R6/2 mousewith about 35% R6/2 content that lived 33 weeks. NIIs are evident inall neurons in the R6/2 mouse, and many neurons in the 18-week
chimera. Additionally, in the 18-week chimera small neuropil aggre-gates are also evident. The neuropil aggregates are yet more promi-nent in the R6/2-rich cortex sector (C), but not in the R6/2-poor cortexsector (D) in the 33-week chimera. These results show neuropil ag-gregates to be a prominent feature that develops in R6/2-rich corticalregions as R6/2 chimeras age.
TABLE 3. Mean NII Size for R6/2 Chimeras
Animal AgeMotor CortexLayers II-III
Motor CortexLayer V
SensoryCortex Layers
II-III
SensoryCortex Layer
V StriatumVentral
Postthalamus
Nonchimera R6/2 12 wk old (n�2) 2.25 �m � 0.08 2.49 �m � 0.08 2.51 �m � 0.11 2.37 �m � 0.09 1.94 �m � 0.03 2.54 �m � 0.01Chimera R6/2 13 wk old (n�3) 2.33 �m � 0.08 2.60 �m � .012 2.36 �m � 0.22 2.60 �m � 0.20 2.04 �m � 0.16 2.56 �m � 0.18Chimera R6/2 20 wk old (n�3) 2.75 �m � 0.22 3.05 �m � 0.29 2.78 �m � 0.29 2.94 �m � 0.36 2.36 �m � 0.08 2.85 �m � 0.13Chimera R6/2 30 wk old (n�3) 3.04 �m � 0.43 3.35 �m � 0.43* 2.94 �m � 0.44* 3.23 �m � 0.30* 2.84 �m � 0.26*** 3.60 �m � 0.26***
Table showing NII size (mean � SEM) for pure R6/2 mice and R6/2 chimeras living increasing lengths of time, in different layers of motor and sensory cortex, striatum, andthalamus. Note that the NIIs in the chimeras grew slightly larger than those in the 12-week nonchimeric hemizygous R6/2 mice with increased survival time. One asterisk denotessignificantly greater than in R6/2, and three indicates significantly greater than in 20-week-old R6/2 chimeras.
The Journal of Comparative Neurology. DOI 10.1002/cne
614 REINER ET AL.
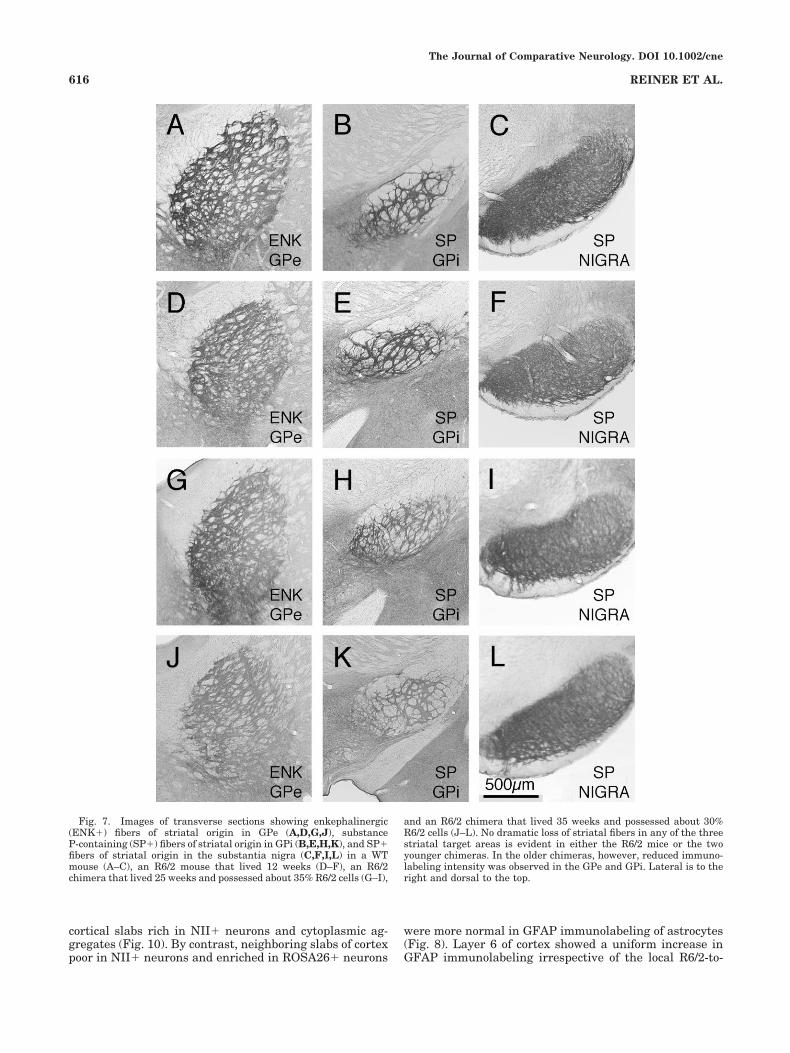
showed loss in the R6/2 chimeras. Qualitative observa-tions suggested no significant loss of SP� fibers in the GPior substantia nigra in the R6/2 chimeras, but ENK� fiberloss in GPe (P � 0.075) in the older R6/2 chimeras (Fig. 7).Image analysis was carried out on these cases to quantifythe effects on striatal fiber abundance and immunolabel-ing intensity in the striatal target areas. Because we wereparticularly interested in determining if the increasedlongevity in the R6/2 chimeras allowed striatal pathologyto develop beyond that seen in pure R6/2 mice (Sun et al.,2002), we evaluated the effects on these projections forgroups of chimeras that had lived increasing durationsprior to morbidity. There was no evident loss of ENK�fibers in the GPe or loss of SP� fibers in the GPi orsubstantia nigra in 12–15-week or 16–25-week-old R6/2t�/t� chimeras compared to age-matched R6/2t�/t�chimeras and WT mice (Table 4; Fig. 7). Similarly, therewas no difference in fiber immunolabeling intensity forGPe, GPi, or nigra between R6/2 chimeras and WT mice ateither of these two age ranges. In the 26–34-week-oldR6/2t�/t� chimeras, no SP� fiber loss was detected in theGPi or substantia nigra, but there was a significant loss of
ENK� fibers in the GPe (P � 0.037). Moreover, there wasa significant reduction in ENK� fiber intensity in GPe inthese mice (P � 0.013), as well as for SP� fiber intensityin GPi (P � 0.011). The changes in the striato-GPe fibersof the R6/2 chimeras are similar to those previously ob-served in pure R6/2 mice at 12 weeks, but the change inthe striato-GPi projection of the R6/2 chimeras is greaterthan previously reported for 12-week-old pure R6/2 mice(Sun et al., 2002).
Histological analysis of R6/2 chimeras:markers of neuropathology
To further characterize forebrain neuropathology in theR6/2 chimeras, GFAP immunolabeling was carried out.We were again interested in determining if the increasedlongevity in the R6/2 chimeras allowed pathology to de-velop beyond that seen in pure R6/2 mice. We found, infact, that GFAP was increasingly upregulated in cortex,septum, and striatum as a function of animal survival,beyond that seen in pure R6/2 mice that died at 12–15weeks of age (Figs. 8–10). In the cortex of R6/2 chimeras,the extent of GFAP increase for layers 2–5 was greatest in
Fig. 6. High-magnification images of calbindin (CALB) immuno-labeling (A,B) in striatum and parvalbumin (PARV) immunolabelingin striatum (C,D) in transverse sections of a WT mouse that lived 154days (A,C) and an R6/2 chimera that lived 156 days and had about a
50% R6/2 content (B,D). No differences were evident between chimericR6/2 mice and WT mice in the distribution, abundance, morphology,or labeling intensity of calbindin-containing projection neurons (A vs.B), or parvalbumin-containing interneurons (C vs. D) in the striatum.
The Journal of Comparative Neurology. DOI 10.1002/cne
615R6/2 NEURONS SURVIVE IN ADULT MOUSE BRAIN
cortical slabs rich in NII� neurons and cytoplasmic ag-gregates (Fig. 10). By contrast, neighboring slabs of cortexpoor in NII� neurons and enriched in ROSA26� neurons
were more normal in GFAP immunolabeling of astrocytes(Fig. 8). Layer 6 of cortex showed a uniform increase inGFAP immunolabeling irrespective of the local R6/2-to-
Fig. 7. Images of transverse sections showing enkephalinergic(ENK�) fibers of striatal origin in GPe (A,D,G,J), substanceP-containing (SP�) fibers of striatal origin in GPi (B,E,H,K), and SP�fibers of striatal origin in the substantia nigra (C,F,I,L) in a WTmouse (A–C), an R6/2 mouse that lived 12 weeks (D–F), an R6/2chimera that lived 25 weeks and possessed about 35% R6/2 cells (G–I),
and an R6/2 chimera that lived 35 weeks and possessed about 30%R6/2 cells (J–L). No dramatic loss of striatal fibers in any of the threestriatal target areas is evident in either the R6/2 mice or the twoyounger chimeras. In the older chimeras, however, reduced immuno-labeling intensity was observed in the GPe and GPi. Lateral is to theright and dorsal to the top.
The Journal of Comparative Neurology. DOI 10.1002/cne
616 REINER ET AL.

ROSA26 neuron ratio (Figs. 9, 10). An increase in layer 6GFAP was common in pure R6/2 mice as well, although ittended to be more intense in the R6/2 chimeras. An in-crease in GFAP was also observed in septum and stria-tum. The GFAP increase in striatum was conspicuous inand around the cortical fiber bundles coursing through it(Figs. 11, 12). Additionally, GFAP was upregulated in thestriatal neuropil itself, especially in the dorsolateral anddorsomedial sectors of the striatum (Fig. 11). The increasein GFAP in striatum could not be associated with anyregional enrichments in NII� neurons or cytoplasmic ag-gregates, since such regional enrichments themselveswere not evident, and since the GFAP immunolabeledastrocytes and their processes occurred without evidentpreference over both WT (i.e., ROSA or NII-negative neu-rons) neurons and R6/2t�/t� neurons (Fig. 12).
DISCUSSION
To better understand the possible contributions to HDpathogenesis of ubiquitinated NIIs and neuropil aggre-gates containing the N-terminal fragment of mutant hun-tingtin, we used a chimeric strategy to extend the lifespanof R6/2 neurons possessing a 150 repeat transgene. Theseneurons form ubiquitinated NIIs containing theN-terminal fragment of mutant huntingtin by 4–8 weeksof age and neuropil aggregates after 12 weeks of age(Davies et al., 1997; Morton et al., 2000; Meade et al.,2002). Nonchimeric R6/2 transgenic mice with CAG re-peats in the 150 range typically die at 12–15 weeks with-out clear signs of HD type pathology, i.e., without evidenceof extensive striatal projection neuron loss and lesser cor-tical neuron loss (Mangiarini et al., 1996; Davies et al.,1997). By creating chimeric mice bearing R6/2 neurons,we sought to address three questions: 1) Would the NIIsthat form in R6/2 neurons be associated with neurondeath if given a longer opportunity; 2) Would the mutanttransgene protein produce progressive HD-type corticaland striatal pathology (irrespective of the role of aggre-gate formation in the process) if provided a greater timewindow in which to affect neurons; and 3) Does theinjury process only occur in neurons possessing themutant protein? Our findings reveal that even after 8months, neurons containing NIIs survive well. Nonethe-less, there is evidence of striatal atrophy, some HD-likestriatal neurotransmitter abnormalities, and markedastrocytosis in cortex and striatum. In cortex but notstriatum the astrocytosis is associated with sites rich inmutant neurons. These various points and their impli-
cations for HD pathogenesis are discussed in greaterdetail below.
Are NIIs lethal?
The R6/1, R6/2, and R6/5 lines of transgenic mice, whichexpress a mutant human huntingtin exon 1 with 115–150repeats, using a human huntingtin promoter, show a pro-gressive neurological phenotype culminating in animaldeath (Mangiarini et al., 1996). The phenotype is charac-terized by irregular gait, resting tremor, seizures, andweight loss. The symptoms as originally described appearin hemizygous R6/1 mice (115 repeats) at about 5 months,in hemizygous R6/2 mice (150 repeats) at 2 months, and inhemizygous R6/5 mice (about 135 repeats) at beyond 1year. The earliest symptoms have their onset at about thetime when ubiquitinated NIIs form throughout the brain(Davies et al., 1997; Stack et al., 2005). By the time ofanimal demise, however, neuronal loss has typically beenfound to be minor (Mangiarini et al., 1996; Davies et al.,1997). Nonetheless, the behavioral phenotype in the threeR6 lines of mice, and the evidence of striatal shrinkage,neurotransmitter changes, and free radical damage inR6/2 mice suggests that some type of neuronal injury isoccurring (Cha et al., 1998, 1999; Reynolds et al., 1999;Menalled et al., 2000; Bibb et al., 2000; Tabrizi et al., 2000;Sun et al., 2002; Stack et al., 2005). In addition, shrinkageand darkening of neurons (presumably reflective of ongo-ing degeneration) in cortex, hippocampus, and striatumhas been described in these mice as well (Iannicola et al.,2000; Turmaine et al., 2000; Stack et al., 2005). For thesereasons, it seemed possible that the large ubiquitinatedintranuclear aggregates containing mutant huntingtinthat form early in the life of R6/2 mice, if given enoughtime, might be associated with the widespread death andloss of the neurons that contain them.
We therefore extended the life span of mice that possessR6/2 neurons by creating R6/2 7 WT chimeras, by thismeans elongating the life of R6/2 neurons as well. Some ofthe chimeric animals we created lived as long as 10months, and we observed that their R6/2 neurons lived forabout 8 months with 2–3-�m diameter intranuclear inclu-sions and for about 7 months with cytoplasmic aggregates.While it is possible that some R6/2 neurons in the brainsof the chimeras had died, it was evident from comparisonsof WT and R6/2 neuron distributions in our R6/2 7 RO-SA26 chimeras that many, if not the majority, of R6/2neurons were able to survive these circumstances, and fewof the surviving neurons exhibited abnormalities detect-able in cresyl violet or H&E-stained LM sections. These
TABLE 4. Abundance and Intensity of Striatofugal Fibers in Striatal Target Areas
Animal Group
No.of
Mice
ENK�Fibers
Abundantin GPe
ENK�Fiber
Intensityin GPe
SP�Fibers
Abundantin GPi
SP� FiberIntensity
in GPi
SP�Fibers
Abundantin Nigra
SP�Fiber
Intensityin Nigra
Chimera & nonchimera WT mice 12-15 wk 5 73.7 � 3.3% 141.3 � 4.5 58.1 � 3.6% 143.1 � 6.5 81.9 � 2.3% 152.3 � 8.1Chimera R6/2 mice 12-15 wk 12 71.3 � 1.9% 135.9 � 2.4 57.4 � 1.8% 141.8 � 4.6 78.5 � 1.5% 150.8 � 6.7Chimera & nonchimera WT mice 16-25 wk 5 71.9 � 5.1% 146.5 � 4.1 50.4 � 5.9% 139.6 � 6.3 79.9 � 3.3% 147.4 � 12.0Chimera R6/2 mice 16-25 wk 11 72.6 � 1.8 140.3 � 4.9 58.9 � 3.4% 142.1 � 4.3 78.9 � 1.6% 145.5 � 3.6Chimera & nonchimera WT mice 26-34 wk 5 75.9 � 2.5% 150.0 � 4.1 54.0 � 2.0% 150.3 � 5.7 80.1 � 2.8% 147.4 � 11.4Chimera R6/2 mice 26-34 wk 10 69.5 � 2.4% 135.5 � 4.6* 54.0 � 1.8% 132.0 � 4.6* 77.9 � 1.9% 137.9 � 5.1
Image analysis of fiber abundance and immunolabeling intensity for the (mean � SEM) major striatal target areas, the GPe, the GPi, and the substantia nigra, in wildtype (WT)(chimeric and nonchimeric combined) and R6/2 chimeric mice living increasing lengths of time. Asterisk denotes significant decrease in chimeric mice compared to age-matchedwild-type mice.
The Journal of Comparative Neurology. DOI 10.1002/cne
617R6/2 NEURONS SURVIVE IN ADULT MOUSE BRAIN
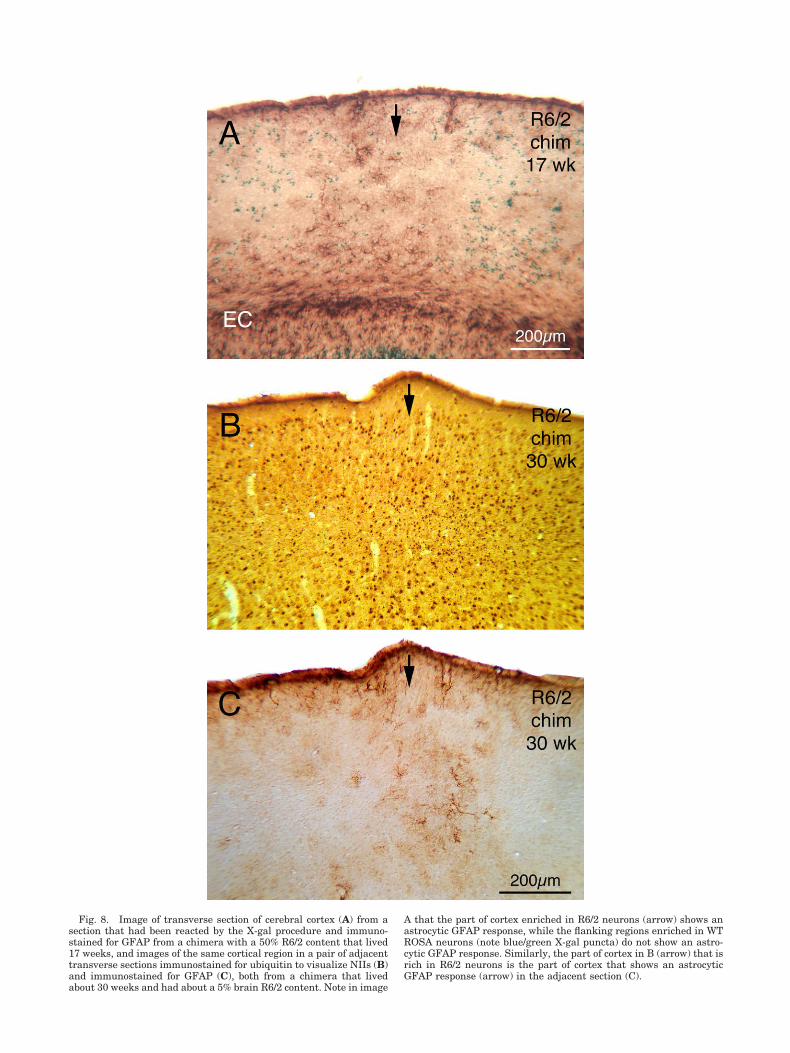
Fig. 8. Image of transverse section of cerebral cortex (A) from asection that had been reacted by the X-gal procedure and immuno-stained for GFAP from a chimera with a 50% R6/2 content that lived17 weeks, and images of the same cortical region in a pair of adjacenttransverse sections immunostained for ubiquitin to visualize NIIs (B)and immunostained for GFAP (C), both from a chimera that livedabout 30 weeks and had about a 5% brain R6/2 content. Note in image
A that the part of cortex enriched in R6/2 neurons (arrow) shows anastrocytic GFAP response, while the flanking regions enriched in WTROSA neurons (note blue/green X-gal puncta) do not show an astro-cytic GFAP response. Similarly, the part of cortex in B (arrow) that isrich in R6/2 neurons is the part of cortex that shows an astrocyticGFAP response (arrow) in the adjacent section (C).

results then fail to show any significantly lethal impact ofintranuclear aggregates of mutant huntingtin on neuronsin the chimeric brains. In this regard, the findings arereminiscent of those of Ordway et al. (1997), who intro-duced a 146 CAG repeat unit into the HPRT gene ofmouse, which resulted in a progressive neurological phe-notype, widespread inclusion formation, but no evidenceof neuronal loss at survival times comparable to those
observed in our chimeric mice. On this basis, they wereamong the first to suggest that NIIs might actually beprotective. Similarly, Slow et al. (2005) created a trans-genic mouse (dubbed shortstop) that expresses anN-terminal fragment (exon 1 and part of exon 2) of mutanthuman huntingtin with 120 CAG repeats under the con-trol of the endogenous human Hdh promoter and its reg-ulatory elements. Although NIIs formed at 12 months and
Fig. 9. Images of layer 6 of the cerebral cortex and the subcorticalwhite matter of the external capsule (EC) from sections that had beenimmunostained for GFAP from a WT chimera that lived 30 weeks (A)and a chimera with 20% R6/2 brain content that lived 30 weeks (B).
Note that astrocytic GFAP expression is minimal in layer 6 of the WTmouse, but much more prominent in the R6/2 chimera. Moreover,GFAP expression in glia of the subcortical white matter is also in-creased in the R6/2 chimera.
The Journal of Comparative Neurology. DOI 10.1002/cne
619R6/2 NEURONS SURVIVE IN ADULT MOUSE BRAIN

Fig. 10. Images of the temporal part of cerebral cortex from trans-verse sections immunostained for GFAP from a WT mouse that lived30 weeks (A), a pure R6/2 mouse that lived 13 weeks (B), and an R6/2chimera with about a 50% R6/2 brain content that lived 22 weeks (C).Note that GFAP expression is largely restricted to the subcortical
white in the WT mouse, while some GFAP� astrocytes are evident inthe cerebral cortex of the R6/2 mouse, especially in layer 6. In the R6/2chimera GFAP expression is higher in both the cerebral cortex andthe subcortical white matter than in the WT or R6/2 mouse. Lateral isto the right and dorsal to the top.

Fig. 11. Images of dorsolateral striatum in transverse sectionsimmunolabeled for GFAP, from a WT mouse that lived 30 weeks (A),a pure R6/2 mouse that lived 13 weeks (B), and an R6/2 chimera witha 50% R6/2 brain content that lived 30 weeks (C). Note that GFAPexpression is low normally in striatum (A), slightly higher in pure
R6/2 mice (B), and considerably elevated in R6/2 chimeras (C). TheGFAP elevation was associated both with the fiber bundles passingthrough the striatum (some indicated in C with asterisks), as well aswith the gray matter of the striatum. Lateral is to the right and dorsalto the top.
were widespread by 18 months in the shortstop mouse, noevidence of behavioral abnormality, neuron loss, or brainshrinkage was seen. The shortstop mouse contrasts withthe YAC128 mouse, which possesses a full-length versionof mutant human Hdh with the same number of repeatsand the same regulatory elements as shortstop (Slow etal., 2003). In contrast to the shortstop mouse, the YAC128mouse shows much slower and milder NII formation, butsevere behavioral abnormalities, and cortical and striatal
pathology by 12 months. Thus, neurons can survive, insome cases with no evident harm, for at least 6–8 monthsafter NIIs become prominent within them.
In many of the other transgenic or knockin models ofHD there is also no clear evidence of a causal link betweenaggregate formation and any of the observed abnormali-ties (Reddy et al., 1998, 1999; Schilling et al., 1999; Li etal., 2000; Laforet et al., 2001; Lin et al., 2001; Menalled etal., 2002). In the case of mouse models expressing full-
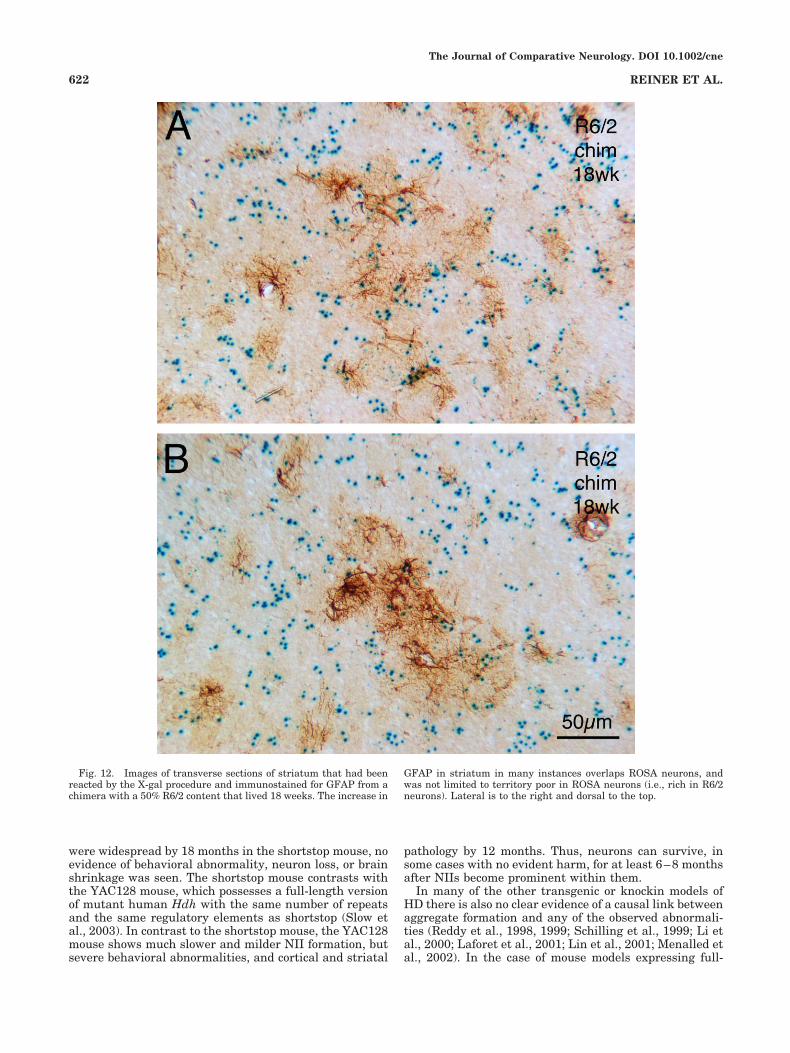
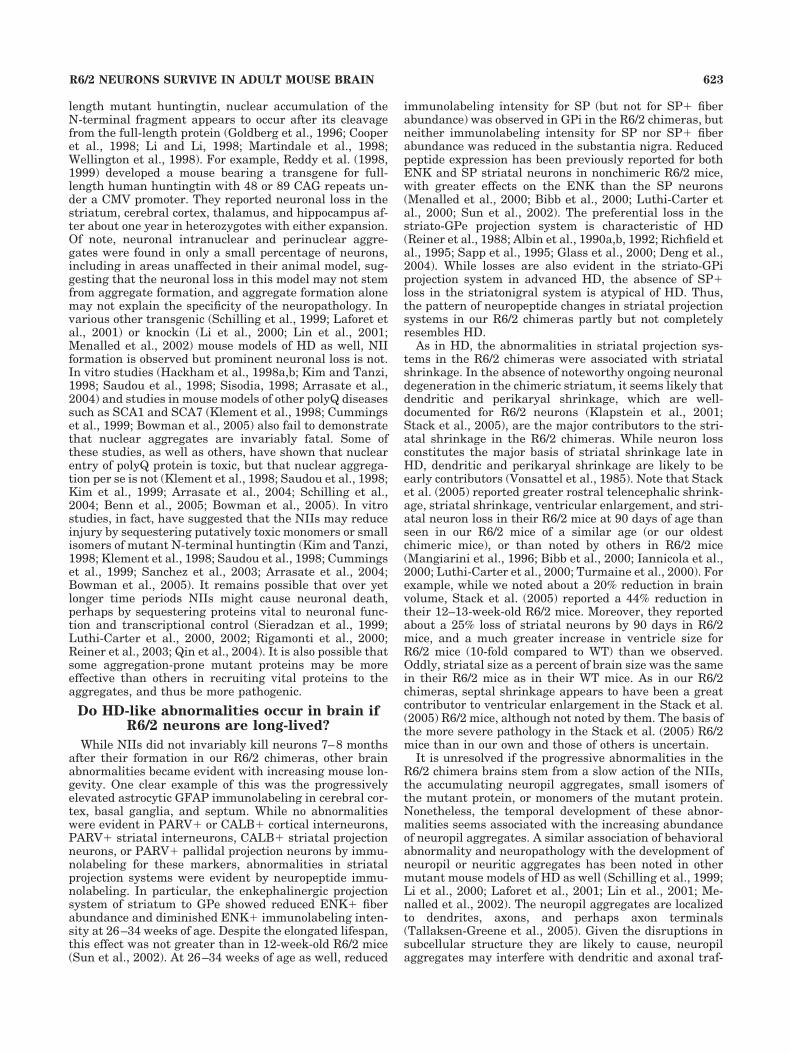
Fig. 12. Images of transverse sections of striatum that had beenreacted by the X-gal procedure and immunostained for GFAP from achimera with a 50% R6/2 content that lived 18 weeks. The increase in
GFAP in striatum in many instances overlaps ROSA neurons, andwas not limited to territory poor in ROSA neurons (i.e., rich in R6/2neurons). Lateral is to the right and dorsal to the top.
The Journal of Comparative Neurology. DOI 10.1002/cne
622 REINER ET AL.
length mutant huntingtin, nuclear accumulation of theN-terminal fragment appears to occur after its cleavagefrom the full-length protein (Goldberg et al., 1996; Cooperet al., 1998; Li and Li, 1998; Martindale et al., 1998;Wellington et al., 1998). For example, Reddy et al. (1998,1999) developed a mouse bearing a transgene for full-length human huntingtin with 48 or 89 CAG repeats un-der a CMV promoter. They reported neuronal loss in thestriatum, cerebral cortex, thalamus, and hippocampus af-ter about one year in heterozygotes with either expansion.Of note, neuronal intranuclear and perinuclear aggre-gates were found in only a small percentage of neurons,including in areas unaffected in their animal model, sug-gesting that the neuronal loss in this model may not stemfrom aggregate formation, and aggregate formation alonemay not explain the specificity of the neuropathology. Invarious other transgenic (Schilling et al., 1999; Laforet etal., 2001) or knockin (Li et al., 2000; Lin et al., 2001;Menalled et al., 2002) mouse models of HD as well, NIIformation is observed but prominent neuronal loss is not.In vitro studies (Hackham et al., 1998a,b; Kim and Tanzi,1998; Saudou et al., 1998; Sisodia, 1998; Arrasate et al.,2004) and studies in mouse models of other polyQ diseasessuch as SCA1 and SCA7 (Klement et al., 1998; Cummingset al., 1999; Bowman et al., 2005) also fail to demonstratethat nuclear aggregates are invariably fatal. Some ofthese studies, as well as others, have shown that nuclearentry of polyQ protein is toxic, but that nuclear aggrega-tion per se is not (Klement et al., 1998; Saudou et al., 1998;Kim et al., 1999; Arrasate et al., 2004; Schilling et al.,2004; Benn et al., 2005; Bowman et al., 2005). In vitrostudies, in fact, have suggested that the NIIs may reduceinjury by sequestering putatively toxic monomers or smallisomers of mutant N-terminal huntingtin (Kim and Tanzi,1998; Klement et al., 1998; Saudou et al., 1998; Cummingset al., 1999; Sanchez et al., 2003; Arrasate et al., 2004;Bowman et al., 2005). It remains possible that over yetlonger time periods NIIs might cause neuronal death,perhaps by sequestering proteins vital to neuronal func-tion and transcriptional control (Sieradzan et al., 1999;Luthi-Carter et al., 2000, 2002; Rigamonti et al., 2000;Reiner et al., 2003; Qin et al., 2004). It is also possible thatsome aggregation-prone mutant proteins may be moreeffective than others in recruiting vital proteins to theaggregates, and thus be more pathogenic.
Do HD-like abnormalities occur in brain ifR6/2 neurons are long-lived?
While NIIs did not invariably kill neurons 7–8 monthsafter their formation in our R6/2 chimeras, other brainabnormalities became evident with increasing mouse lon-gevity. One clear example of this was the progressivelyelevated astrocytic GFAP immunolabeling in cerebral cor-tex, basal ganglia, and septum. While no abnormalitieswere evident in PARV� or CALB� cortical interneurons,PARV� striatal interneurons, CALB� striatal projectionneurons, or PARV� pallidal projection neurons by immu-nolabeling for these markers, abnormalities in striatalprojection systems were evident by neuropeptide immu-nolabeling. In particular, the enkephalinergic projectionsystem of striatum to GPe showed reduced ENK� fiberabundance and diminished ENK� immunolabeling inten-sity at 26–34 weeks of age. Despite the elongated lifespan,this effect was not greater than in 12-week-old R6/2 mice(Sun et al., 2002). At 26–34 weeks of age as well, reduced
immunolabeling intensity for SP (but not for SP� fiberabundance) was observed in GPi in the R6/2 chimeras, butneither immunolabeling intensity for SP nor SP� fiberabundance was reduced in the substantia nigra. Reducedpeptide expression has been previously reported for bothENK and SP striatal neurons in nonchimeric R6/2 mice,with greater effects on the ENK than the SP neurons(Menalled et al., 2000; Bibb et al., 2000; Luthi-Carter etal., 2000; Sun et al., 2002). The preferential loss in thestriato-GPe projection system is characteristic of HD(Reiner et al., 1988; Albin et al., 1990a,b, 1992; Richfield etal., 1995; Sapp et al., 1995; Glass et al., 2000; Deng et al.,2004). While losses are also evident in the striato-GPiprojection system in advanced HD, the absence of SP�loss in the striatonigral system is atypical of HD. Thus,the pattern of neuropeptide changes in striatal projectionsystems in our R6/2 chimeras partly but not completelyresembles HD.
As in HD, the abnormalities in striatal projection sys-tems in the R6/2 chimeras were associated with striatalshrinkage. In the absence of noteworthy ongoing neuronaldegeneration in the chimeric striatum, it seems likely thatdendritic and perikaryal shrinkage, which are well-documented for R6/2 neurons (Klapstein et al., 2001;Stack et al., 2005), are the major contributors to the stri-atal shrinkage in the R6/2 chimeras. While neuron lossconstitutes the major basis of striatal shrinkage late inHD, dendritic and perikaryal shrinkage are likely to beearly contributors (Vonsattel et al., 1985). Note that Stacket al. (2005) reported greater rostral telencephalic shrink-age, striatal shrinkage, ventricular enlargement, and stri-atal neuron loss in their R6/2 mice at 90 days of age thanseen in our R6/2 mice of a similar age (or our oldestchimeric mice), or than noted by others in R6/2 mice(Mangiarini et al., 1996; Bibb et al., 2000; Iannicola et al.,2000; Luthi-Carter et al., 2000; Turmaine et al., 2000). Forexample, while we noted about a 20% reduction in brainvolume, Stack et al. (2005) reported a 44% reduction intheir 12–13-week-old R6/2 mice. Moreover, they reportedabout a 25% loss of striatal neurons by 90 days in R6/2mice, and a much greater increase in ventricle size forR6/2 mice (10-fold compared to WT) than we observed.Oddly, striatal size as a percent of brain size was the samein their R6/2 mice as in their WT mice. As in our R6/2chimeras, septal shrinkage appears to have been a greatcontributor to ventricular enlargement in the Stack et al.(2005) R6/2 mice, although not noted by them. The basis ofthe more severe pathology in the Stack et al. (2005) R6/2mice than in our own and those of others is uncertain.
It is unresolved if the progressive abnormalities in theR6/2 chimera brains stem from a slow action of the NIIs,the accumulating neuropil aggregates, small isomers ofthe mutant protein, or monomers of the mutant protein.Nonetheless, the temporal development of these abnor-malities seems associated with the increasing abundanceof neuropil aggregates. A similar association of behavioralabnormality and neuropathology with the development ofneuropil or neuritic aggregates has been noted in othermutant mouse models of HD as well (Schilling et al., 1999;Li et al., 2000; Laforet et al., 2001; Lin et al., 2001; Me-nalled et al., 2002). The neuropil aggregates are localizedto dendrites, axons, and perhaps axon terminals(Tallaksen-Greene et al., 2005). Given the disruptions insubcellular structure they are likely to cause, neuropilaggregates may interfere with dendritic and axonal traf-
623R6/2 NEURONS SURVIVE IN ADULT MOUSE BRAIN
ficking of protein, leading to the dendritic pathologies andaxonal dystrophies observed in HD victims and transgenicmice (Graveland et al., 1985; Sapp et al., 1997, 1999;Guidetti et al., 2001; Klapstein et al., 2001; Laforet et al.,2001; Spires et al., 2004). This, in turn, could cause dys-function of the neurons containing the aggregates, as wellas cause a deleterious disturbance in communication be-tween those neurons and their target neurons (Cepeda etal., 2001, 2003; Gauthier et al., 2004). A trafficking dis-ruption would be consistent with the observation thatmany of the proteins that interact with mutant huntingtinare cytoplasmic proteins (Faber et al., 1998), the findingthat expression of many trafficking and cytoplasmic pro-teins are affected early in HD (Sipione et al., 2002), andthe evidence that microtubule destabilization is toxic andcan be driven by mutant huntingtin (Trushina et al., 2003,2004).
Patterns of neuropathology in R6/2 chimeras
Two aspects of the brain abnormalities were of interestwith respect to the genesis of the behavioral symptoms inthe R6/2 chimeras. First, while the survival of the chi-meric mice was significantly correlated with the overallabundance of R6/2 neurons in brain, some animals devi-ated from this simple pattern. This raises the possibilitythat animal viability is inversely correlated with R6/2 cellenrichment in some key neural or nonneural regions, andenrichment in these regions does not necessarily correlatewith overall brain enrichment. Since we found some chi-meras with no R6/2 cells in the tail biopsy but many inbrain, and some with R6/2 cells in tail and none in brain,it does seem the case that the regional and bodily distri-bution of R6/2 cells varied from case to case, as is knownto occur in aggregation chimeras (Kuan et al., 1997;Reiner et al., 2001). In any event, it will be of importancefor understanding the basis of R6/2 mouse morbidity todetermine if R6/2 cell enrichment in some particular brainregions more so than others is correlated with reducedanimal viability. This may provide insight into novel brainregions involved in the genesis of the symptoms and mor-bidity of HD. Second, we found that the abnormalities inthe cerebral cortex, notably the GFAP upregulation, oc-curred in the slabs that were enriched in R6/2 neurons,while in striatum no such association between GFAP up-regulation and mutant neuron location was obvious. Thisobservation is consistent with recent suggestions that cor-tical injury occurs earlier in HD than striatal injury, basedon human studies and mutant mouse studies (Gutekunstet al., 1999; Kuemmerle et al., 1999; Maat-Schieman etal., 1999; Sapp et al., 1999; Guidetti et al., 2001; Laforet etal., 2001; Rosas et al., 2002, 2003; Spires et al., 2004), andthat striatal injury in HD may be driven by an action ofthe mutation at the level of the cerebral cortex (Fusco etal., 1999; Sapp et al., 1999; Cattaneo et al., 2005). Therecent MRI studies of Rosas et al. (2005), in particular,show cortical thinning associated with cognitive decline inpresymptomatic HD patients. Mechanisms by which mu-tant cortex might injure striatum include excitotoxicitystemming from excess corticostriatal glutamatergic acti-vation of striatal neurons (Cha et al., 1998; Fusco et al.,1999; Cepeda et al., 2001, 2003) and deprivation of striatalneurons of BDNF neurotrophic support (Reiner et al.,2003; Baquet et al., 2004; Gauthier et al., 2004; Cattaneoet al., 2005). Such mechanisms of HD pathogenesis involv-ing defective function of axon terminals have been re-
ferred to as synaptopathies (Li et al., 2003). Further stud-ies will be needed to determine if mutant cortical neuronsdrive injury in both mutant and WT striatal neurons inour R6/2 chimeras to critically assess the role of cortex indriving striatal injury in HD.
Implications for the pathogenesis of HD
The discoveries that the N-terminal fragment of mu-tant huntingtin aggregates in intranuclear inclusions inboth HD victims and in the R6/2 transgenic mousefocused interest on the possible role of these aggregatesin HD pathogenesis (DiFiglia et al., 1997; Davies et al.,1997). These findings coincided with reports that theCAG repeat expansion in the HD gene yielded a mutantprotein whose N-terminal fragment was more readilycleaved than the normal protein (Goldberg et al., 1996;Cooper et al., 1998; Li and Li, 1998; Martindale et al.,1998; Wellington et al., 1998). In vitro studies showedthat this mutant fragment tended to self-aggregate viaits polyglutamine tract in a repeat length-dependentfashion into amyloid-like fibrils of a cross beta-sheetstructure (Scherzinger et al., 1997; Hackham et al.,1998a,b; Martindale et al., 1998). These findings sug-gested that the gain of function putatively underlyingHD might be the aggregation of the N-terminal frag-ment of mutated huntingtin, with either the nuclearlocalization or the cytoplasmic localization being toxicto neurons (Martindale et al., 1998; Hackham et al.,1999; Sanchez et al., 1999, 2003). The evidence that theaggregates themselves might be injurious, however, haslargely been circumstantial (i.e., that they are found inregions or in neurons that degenerate in humans, mu-tated animals, and culture models of HD) (Jackson etal., 1998; DiFiglia et al., 1997; Schilling et al., 1995;Trottier et al., 1995; Chen et al., 2002; Yang et al.,2002). The fact that we found prominent survival ofNII-bearing R6/2 neurons in mice with no evidence ofneuron death even up to 10 months after birth (withfull-sized aggregates extant for up to 8 months) sug-gests that intranuclear aggregation of mutant hunting-tin is not highly toxic at the single-cell level. Thesefindings argue against the notion that the formation oflarge aggregates of the N-terminal fragment of mutanthuntingtin within the nucleus or cytoplasm accounts forthe death of striatal projection neurons in HD. Ourfindings are consistent with a number of lines of evi-dence that nuclear aggregates themselves do not killneurons that contain them (Hackham et al., 1998a,b;Saudou et al., 1998; Sisodia, 1998; Arrasate et al.,2004), and with neuropathological studies showing thatformation of NIIs in HD victims is not prominent incortex until advanced stages of HD and is never prom-inent in striatum at any stage (DiFiglia et al., 1997;Kuemmerle et al., 1999; Gutekunst et al., 1999; Sapp etal., 1999). Nonetheless, the conclusion that NIIs are notlethal over a 6 – 8-month period and are not the primarycause of HD neuronal death does not rule out the pos-sibility that the stress they produce over a period ofyears is one of among several contributors to a multi-factorial process culminating in neuronal demise (Aro-nin et al., 1999). Moreover, several studies show thatnuclear entry per se may be a late-occurring event inHD, as the mutant protein is increasingly cleaved byactivated caspases, which contributes to pathogenesis,
The Journal of Comparative Neurology. DOI 10.1002/cne
624 REINER ET AL.

with monomers or small isomers being the toxic entity(Trushina et al., 2003, 2004; Benn et al., 2005).
Nonetheless, the occurrence of a neurological phenotypein our chimeric mice and the development of GFAP im-munoreactivity in cortex and striatum in an age- and R6/2neuron dose-dependent fashion indicate that the mutanttransgene is harmful. It remains unresolved whether thefree mutant huntingtin, small isomers, or neuropil aggre-gates are the harmful agents. In any event, one or more ofthese may adversely disrupt diverse cellular functions,such as dendritic and axonal trafficking of protein(Guidetti et al., 2001; Spires et al., 2004). This, in turn,could directly cause dysfunction of the neurons containingthe mutant protein, as well as cause a deleterious distur-bance in communication between those neurons and theirtarget neurons. This would be consistent with our obser-vation in the chimeras that the mutant protein directlyaffects the cortical neurons that contain it, but that ab-normalities in the striatum appear to include mutant andWT neurons. An implication of our findings for HD treat-ment, then, would be that therapies targeted at prevent-ing aggregation of mutant protein in striatum might beless effective than therapies targeted at preventing actionof the mutant protein at the level of cortex. Additionally,since we saw an amelioration of the R6/2 phenotype withoverall brain dilution of mutant protein by WT neurons inour chimeras, our results at least encourage a therapeuticstrategy involving knockdown of mutant protein produc-tion.
ACKNOWLEDGMENTS
We thank Lydia Hu, Jianping Xie, Sherry Cuthbertson-Coates, Amanda Taylor, Kim Ries, Aminah Henderson,Kevin Walters, Amanda Walters, and Bhavin Vadodariafor excellent technical assistance, and Dr. Jonathan Coff-man for assistance with some of the genotyping.
LITERATURE CITED
Albin RL, Tagle DA. 1995. Genetics and molecular biology of Huntington’sdisease. Trends Neurosci 18:11–14.
Albin RL, Reiner A, Anderson KD, Penney JB, Young AB. 1990a. Striataland nigral neuron subpopulations in rigid Huntington’s disease: impli-cations for the functional anatomy of chorea and rigidity-akinesia. AnnNeurol 27:357–365.
Albin RL, Young AB, Penney JB, Handelin B, Balfour R, Anderson KD,Markel DS, Tourtellotte WW, Reiner A. 1990b. Abnormalities of stri-atal projection neurons and N-methyl-D-aspartate receptors in pr-esymptomatic Huntington’s disease. N Engl J Med 332:1923–1298.
Albin RL, Reiner A, Anderson KD, Dure LS IV, Handelin B, Balfour R,Whetsell WO Jr, Penney JB, Young AB. 1992. Preferential loss ofstriato-external pallidal projection neurons in presymptomatic Hun-tington’s disease. Ann Neurol 31:425–430.
Ambrose CM, Duyao MP, Barnes G, Bates GP, Lin CS, Srinidhi J, Baxen-dale S, Hummerich H, Lehrach H, Atherr M, Wasmuth J, Buckler A,Church D, Housman D, Berks M, Micklem G, Durbin R, Dodge A, ReadA, Gusella J, MacDonald ME. 1994. Evidence against simple inactiva-tion due to an expanded CAG repeat. Somat Cell Mol Gen 20:27–38.
Anderson KD, Reiner A. 1990. The extensive co-occurrence of substance Pand dynorphin in striatal projection neurons: An evolutionarily con-served feature of basal ganglia organization. J Comp Neurol 295:339–369.
Aronin N, Kim M, Laforet G, DiFiglia M. 1999. Are there multiple path-ways in the pathogenesis of Huntington’s disease? Philos Trans R SocLond B 354:995–1003.
Arrasate M, Mitra S, Schweitzer ES, Segal MR, Finkbeiner S. 2004. Inclu-sion body formation reduces levels of mutant huntingtin and the risk ofneuronal death. Nature 431:805–810.
Baquet ZC, Gorski JA, Jones KR. 2004. Early striatal dendrite deficitsfollowed by neuron loss with advanced age in the absence of antero-grade cortical brain derived neurotrophic factor. J Neurosci 24:4250–4258.
Benn CL, Landles C, Li H, Strand AD, Woodman B, Sathasivam K, Li SH,Ghazi-Noori S, Hockly E, Faruque SMNN, Cha JHJ, Sharpe PT, OlsonJM, Li XJ, Bates GP. 2005. Contribution of nuclear and extranuclearpolyQ to neurological phenotypes in mouse models of Huntington’sdisease. Hum Mol Gen 14:3065–3078.
Bibb JA, Yan Z, Svenningsson P, Snyder GL, Pieribone VA, Horiuchi A,Nairn AC, Messer A, Greengard P. 2000. Severe deficiencies in dopa-mine signaling in presymptomatic Huntington’s disease mice. ProcNatl Acad Sci U S A 97:6809–6812.
Bowman AB, Yoo SY, Dantuma NP, Zoghbi HY. 2005. Neuronal dysfunc-tion in a polyglutamine disease model occurs in the absence ofubiquitin-proteosome system impairment and inversely correlates withdegree of nuclear inclusion formation. Hum Mol Gen 14:679–691.
Bruyn GW, Went LN. 1986. Huntington’s chorea. In: Vinken PJ, BruynLW, Klawans HL, editors. Handbook of clinical neurology. Amsterdam:Elsevier; 5:267–313.
Carter RJ, Lione LA, Humby T, Mangiarini L, Mahal A, Bates GP, DunnettSB, Morton AJ. 1999. Characterization of progressive motor deficits inmice transgenic for the human Huntington’s disease mutation. J Neu-rosci 19:3248–3257.
Cattaneo E, Zuccato C, Tartari M. 2005. Normal huntingtin function: Analternative approach to Huntington’s disease. Nat Rev Neurosci 6:919–930.
Celio MR. 1990. Calbindin D-28 and parvalbumin in the rat nervoussystem. Neuroscience 35:375–475.
Celio MR, Baier W, Scharer L, de Viragh PA, Gerday C. 1988. Monoclonalantibodies directed against the calcium binding protein parvalbumin.Cell Calcium 9:81–86.
Celio MR, Baier W, Scharer L, Gregersen HJ, de Viragh PA, Norman AW.1990. Monoclonal antibodies directed against the calcium binding pro-tein calbindin D-28k. Cell Calcium 11:599–602.
Cepeda C, Ariano MA, Calvert CR, Flores-Hernandez J, Chandler SH,Leavitt BR, Hayden MR, Levine MS. 2001. NMDA receptor function inmouse models of Huntington Disease. J Neurosci Res 66:525–539.
Cepeda C, Hurst RS, Calvert CR, Hernandez-Echeagaray E, Nguyen OK,Jocoy E, Christian LJ, Ariano MA, Levine MS. 2003. Transient andprogressive electrophysiological alterations in the corticostriatal path-way in a mouse model of Huntington’s disease. J Neurosci 23:961–969.
Cha JHJ, Kosinski CM, Kerner JA, Alsdorf SA, Mangiarini L, DaviesSW, Penney JB, Bates GP, Young AB. 1998. Altered brain neuro-transmitter receptors in transgenic mice expressing a portion of anabnormal human Huntington disease gene. Proc Natl Acad SciU S A 95:6480 – 6485.
Cha JHJ, Frey AS, Alsdorf SA, Kerner JA, Kosinski CM, Mangiarini L,Penney JB Jr, Davies SW, Bates GP, Young AB. 1999. Altered neuro-transmitter receptor expression in transgenic mouse models of Hun-tington’s disease. Philos Trans R Soc Lond 354:981–989.
Chen Q, Veenman CL, Knopp K, Yan Z, Medina L, Song WJ, Surmeier DJ,Reiner A. 1997. Evidence for the preferential localization of GluR1subunits of AMPA receptors to the dendritic spines of medium spinyneurons in rat striatum. Neuroscience 83:749–761.
Chen S, Ferrone FA, Wetzel R. 2002. Huntington’s disease age-of-onsetlinked to polyglutamine aggregation nucleation. Proc Natl Acad SciU S A 99:11884–11889.
Cooper JK, Schilling G, Peters MF, Herring WJ, Sharp AH, Kaminsky Z,Masone J, Khan FA, Delanoy M, Borchelt DR, Dawson VL, DawsonTM, Ross CA. 1998. Truncated N-terminal fragments of huntingtinwith expanded glutamine repeats form nuclear and cytoplasmic aggre-gates in cell culture. Hum Mol Genet 7:783–790.
Cornett J, Cao F, Wang CE, Ross CA, Bates GP, Li SH, Li XJ. 2005.Polyglutamine expansion of huntingtin impairs its nuclear export. NatGenet 37:198–204.
Cuello AC, Galfre G, Milstein C. 1979. Detection of substance P in thecentral nervous system by a monoclonal antibody. Proc Natl Acad SciU S A 76:3532–3536.
Cummings CJ, Reinstein E, Sun Y, Antalffy B, Jiang Y, Ciechanover A,Orr HT, Beaudet AL, Zoghbi HY. 1999. Mutation of the E6-APubiquitin ligase reduces nuclear inclusion frequency while acceler-ating polyglutamine-induced pathology in SCA1 mice. Neuron 24:879 – 892.
Davies SW, Turmaine M, Cozens BA, DiFiglia M, Sharp AH, Ross CA,Scherzinger E, Wanker EE, Mangiarini L, Bates GP. 1997. Formation
The Journal of Comparative Neurology. DOI 10.1002/cne
625R6/2 NEURONS SURVIVE IN ADULT MOUSE BRAIN

of neuronal intranuclear inclusions underlies the neurological dysfunc-tion in mice transgenic for the HD mutation. Cell 90:537–548.
Debus E, Weber K, Osborn M. 1983. Monoclonal antibodies specific for glialfibrillary acidic (GFA) protein and for each of the neurofilament tripletpolypeptides. Differentiation 25:193–203.
De La Monte SM, Vonsattel JP, Richardson EP Jr. 1988. Morphometricdemonstrations of atrophic changes in the cerebral cortex, white mat-ter, and neostriatum in Huntington’s disease. J Neuropathol Exp Neu-rol 44:516–525.
Deng YP, Albin RL, Penney JB, Young AB, Anderson KD, Reiner A. 2004.Differential loss of striatal projection systems in Huntington’s disease:a quantitative immunohistochemical study. J Chem Neuroanat 27:143–164.
Deng YP, Xie JP, Wang HB, Chen Q, Reiner A. 2007. Differential localiza-tion of the GluR1 and GluR2 subunits of the AMPA-type glutamatereceptor among striatal neuron types in rats. J Chem 33:167–192.
DiFiglia M, Sapp E, Chase K, Schwarts C, Meloni A, Young C, Martin E,Vonsattel JP, Carraway R, Reeves SA, Boyce FM, Aronin N. 1995.Huntingtin is a cytoplasmatic protein associated with vesicles in hu-man and rat brain neurons. Neuron 14:1075–1081.
DiFiglia M, Sapp E, Chase KO, Davies SW, Bates GP, Vonsattel JP, AroninJP. 1997. Aggregation of huntingtin in neuronal intranuclear inclu-sions and dystrophic neurites in brain. Science 277:1990–1993.
Duyao MP, Auerbach AB, Ryan A, Persichetti F, Barnes GT, McNeil SM,Ge P, Vonsattel JP, Gusella JF, Joyner AL, MacDonald ME. 1995.Inactivation of the mouse Huntington’s disease gene homolog Hdh.Science 269:407–410.
Eddleston M, Mucke L. 1993. Molecular profile of reactive astrocytes —implications for their role in neurologic disease. Neuroscience 54:15–36.
Elde R, Hokfelt T, Johansson O, Terenius L. 1976. Immunohistochemicalstudies using antibodies to leucine-enkephalin: initial observations onthe nervous system of the rat. Neuroscience 1:349–351.
Eng LF, Ghirnikar RS. 1994. GFAP and astrogliosis. Brain Pathol 4:229–237.
Faber PW, Barnes GT, Srinidhi J, Chen J, Gusella JF, MacDonald ME.1998. Huntingtin interacts with a family of WW domain proteins. HumMol Gen 7:1463–1474.
Ferrante RJ, Kowall NW, Beal MF, Richardson EP Jr, Bird ED, Martin JB.1985. Selective sparing of a class of striatal neurons in Huntington’sdisease. Science 230:561–563.
Ferrante RJ, Kowall NW, Richardson EP, Bird ED, Martin JB. 1986.Topography of enkephalin, substance P, and acetylcholinesterase inHuntington’s disease striatum. Neurosci Lett 71:283–288.
Ferrante RJ, Kowall NW, Beal MF, Martin JB, Bird ED, Richardson EP Jr.1987a. Morphological and histochemical characteristics of a sparedsubset of striatal neurons in Huntington’s disease. J Neuropathol ExpNeurol 46:12–27.
Ferrante RJ, Beal MF, Kowall NW, Richardson EP, Martin JB Jr. 1987b.Sparing of acetylcholinesterase-containing striatal neurons in Hun-tington’s disease. Brain Res 411:162–166.
Ferrer I, Kulisevsky J, Gonzalez G, Escartin A, Chivite A, Casas R. 1994.Parvalbumin-immunoreactive neurons in the cerebral cortex and stri-atum in Huntington’s disease. Neurodegeneration 3:169–173.
Figueredo-Cardenas G, Anderson KD, Chen Q, Veeman CL, Reiner A.1994. Relative survival of striatal projection neurons and interneuronsafter intrastriatal injection of quinolinic acid in rats. Exp Neurol 129:37–56.
Figueredo-Cardenas G, Harris C, Anderson KD, Reiner A. 1998. Relativeresistance of striatal neurons containing calbindin or parvalbumin toquinolinic acid-mediated excitotoxicity compared to other striatal neu-ron types. Exp Neurol 149:356–372.
Friedrich G, Soriano P. 1991. Promoter traps in embryonic stem cells: agenetic screen to identify and mutate developmental genes in mice.Genes Dev 5:1513–1523.
Fusco FR, Chen Q, Lamoreaux WJ, Figueredo-Cardenas G, Jiao Y, Coff-man J, Surmeier DJ, Honig MG, Carlock LR, Reiner A. 1999. Cellularlocalization of huntingtin in striatal and cortical neurons in rats: lackof correlation with neuronal vulnerability in Huntington’s disease.J Neurosci 19:1189–1202.
Gauthier LR, Charrin BC, Borrell-Pages M, Dompierre JP, Rangone H,MacDondald ME, Lessmann V, Humbert S, Saudou F. 2004. Hunting-tin controls neurotrophic support and survival of neurons by enhancingBDNF vesicular transport along microtubules. Cell 118:127–138.
Gerfen CR, Young WS. 1988. Distribution of striatonigral and striatopal-
lidal peptidergic neurons in both patch and matrix compartments: anin situ hybridization histochemistry and fluorescence retrograde trac-ing study. Brain Res 460:161–167.
Glass M, Dragunow M, Faull RLM. 2000. The pattern of neurodegenera-tion in Huntington’s disease: a comparative study of cannabinoid,dopamine, adenosine and GABAA receptor alterations in the humanbasal ganglia in Huntington’s disease. Neuroscience 97:505–519.
Goldberg YP, Nicholson DW, Rasper DM, Kalchman MA, Koide HB, Gra-ham RK, Bromm M, Kazemi-Esfarjani P, Thornberry NA, VaillancourtJP, Hayden MR. 1996. Cleavage of Huntingtin by apopain, a proapop-totic cystein protease, is modulated by the polyglutamine tract. NatGen 13:442–449.
Goldowitz D, Moran TH, Wetts R. 1992. Mouse chimeras in the study ofgenetic and structural determinants of behavior. In: Goldowitz D,Wahlsten D, Wimer RE, editors. Techniques for the genetic analysis ofbrain and behavior. Amsterdam: Elsevier Science. p 271–290.
Graveland GA, Williams RS, DiFiglia M. 1985. Evidence for degenerativeand regenerative changes in neostriatal spiny neurons in Huntington’sdisease. Science 227:770–773.
Guidetti P, Charles V, Chen EY, Reddy PH, Kordower JH, Whetsell WO Jr,Schwarcz R, Tagle DA. 2001. Early degenerative changes in transgenicmice expressing mutant huntingtin involve dendritic abnormalities butno impairment of mitochondrial energy production. Exper Neurol 169:340–350.
Gusella JF, MacDonald ME. 1996. Trinucleotide instability: a repeatingtheme in human inherited disorders. Annu Rev Med 47:201–209.
Gutekunst CA, Li SH, Yi H, Mulroy JS, Kuemmerle S, Jones R, Rye D,Ferrante RJ, Hersch SM, Li XJ. 1999. Nuclear and neuropil aggregatesin Huntington’s disease: relationship to neuropathology. J Neurosci19:2522–2534.
Hackham AS, Wellington CL, Hayden MR. 1998a. The fatal attraction ofpolyglutamine-containing proteins. Clin Gen 53:233–242.
Hackham AS, Singaraja R, Wellington CL, Metzler M, McCutcheon K,Zhang T, Kalchman M, Hayden MR. 1998b. The influence of huntingtinprotein size on nuclear localization and cellular toxicity. J Cell Biol141:1097–1105.
Hackham AS, Singaraja R, Zhang T, Gan L, Hayden MR. 1999. In vitroevidence for both the nucleus and cytoplasm as subcellular sites ofpathogenesis in Huntington’s disease. Hum Mol Gen 8:25–33.
Harrington KM, Kowall NW. 1991. Parvalbumin immunoreactive neuronsresist degeneration in Huntington’s disease striatum. J NeuropatholExp Neurol 50:309.
Hedreen JC, Peyser CE, Folstein SE, Ross CA. 1991. Neuronal loss inlayers V and VI of cerebral cortex in Huntington’s disease. NeurosciLett 133:257–261.
Hockly E, Woodman B, Mahhal A, Lewis CM, Bates G. 2003. Standardiza-tion and statistical approaches to therapeutic trials in the R6/2 mouse.Brain Res Bull 61:469–479.
Hodgson JG, Agopyan N, Gutekunst CA, Leavitt BR, LePiane F, SingarajaR, Smith DJ, Bissada N, McCutcheon K, Nasir J, Jamot L, Li XJ,Stevens ME, Rosemond E, Roder JC, Phillips AG, Rubin EM, HerschSM, Hayden MR. 1999. A YAC mouse model for Huntington’s diseasewith full-length mutant huntingtin, cytoplasmic toxicity, and selectivestriatal neurodegeneration. Neuron 23:181–192.
Holt AG, NewmanSW. 2004. Distribution of methionine and leucine en-kephalin neurons within the social behavior circuitry of the male Syr-ian hamster brain. Brain Res 1030:28–48.
Huntington’s Disease Collaborative Research Group. 1993. A novel genecontaining a trinucleotide repeat that is expanded and unstable on theHD chromosome. Cell 72:971–983.
Iannicola C, Moreno S, Oliverio S, Narducci R, Ciofi-Luzatto A, PiacentiniM. 2000. Early alterations in gene expression and cell morphology in amouse model of Huntington’s disease. J Neurochem 75:830–839.
Jackson GR, Salecker I, Dong X, Yao X, Arnheim N, Faber PW, MacDonaldME, Lipursky SL. 1998. Polyglutamine-expanded human huntingtintransgenes induce degeneration of Drosophila photoreceptor neurons.Neuron 21:633–642.
Jiao Y, Sun Z, Lee T, Fusco FR, Kimble TD, Meade CA, Cuthbertson S,Reiner A. 1999. A simple and sensitive antigen retrieval method forfree-floating and slide-mounted tissue sections. J Neurosci Methods93:149–162.
Kagi U, Berchtold MW, Heizmann CW. 1987. Ca2�-binding parvalbuminin rat testis. Characterization, localization, and expression during de-velopment. J Biol Chem 262:7314–7320.
Kawaguchi Y, Wilson CJ, Augood SJ, Emson PC. 1995. Striatal interneu-
The Journal of Comparative Neurology. DOI 10.1002/cne
626 REINER ET AL.
rons: chemical, physiological and morphological characterization.Trends Neurosci 18:527–535.
Kim TW, Tanzi RE. 1998. Neuronal intranuclear inclusions in polyglu-tamine diseases: nuclear weapons or nuclear fallout. Neuron 21:657–659.
Kim M, Lee HS, LaForet G, McIntyre C, Martin EJ, Chang P, Kim TW,Williams M, Reddy PH, Tagle D, Boyce FM, Won L, Heller A, Aronin N,DiFiglia M. 1999. Mutant huntingtin expression in clonal striatal cells:dissociation of inclusion formation and neuronal survival by caspaseinhibition. J Neurosci 19:964–973.
Kiyama H, Seto-Ohshima A, Emson PC. 1990. Calbindin D28k as a markerfor the degeneration of striatonigral pathway in Huntington’s disease.Brain Res 525:209–214.
Klapstein GJ, Fisher RS, Zanjani H, Cepeda C, Jokel ES, Chesselet MF,Levine MS. 2001. Electrophysiological and morphological changes instriatal spiny neurons in R6/2 Huntington’s disease transgenic mice.J Neurophysiol 86:2667–2677.
Klement IA, Skinner PJ, Kaytor MD, Yi H, Hersch SM, Clark HB, ZoghbiHY, Orr HT. 1998. Ataxin-1 nuclear localization and aggregation: rolein polyglutamine-induced disease in SCA1 transgenic mice. Cell 95:41–53.
Krause JE, Chirgwin JM, Carter MS, Xu ZS, Hershey AD. 1987. Three ratpreprotachykinin mRNAs encode the neuropeptides substance P andneurokinin A. Proc Natl Acad Sci U S A 84:811–885.
Kuan CY, Elliott EA, Flavell RA, Rakic P. 1997. Restrictive clonal alloca-tion in the chimeric mouse brain. Proc Natl Acad Sci U S A 94:3374–3379.
Kuemmerle S, Gutekunst CA, Klein AM, Li XJ, LI SH, Beal MF, Yi H,Hersch SM, Ferrante RJ. 1999. Huntingtin aggregates may not predictneuronal death in Huntington’s disease. Ann Neurol 46:842–849.
Laforet GA, Sapp E, Chase K, McIntyre C, Boyce FM, Campbell M, Cadi-gan BA, Warzecki L, Tagle DA, Reddy PH, Cepeda C, Calvert CR, JokelES, Klapstein GJ, Ariano MA, Levine MS, DiFiglia M, Aronin N. 2001.Changes in cortical and striatal neurons predict behavioral and elec-trophysiological abnormalities in a transgenic marine model of Hun-tington’s disease. J Neurosci 21:9112–9123.
Li SH, Li XJ. 1998. Aggregation of N-terminal huntingtin is dependent onthe length of its glutamine repeats. Hum Mol Gen 7:777–782.
Li H, Li SH, Johnston H, Shelbourne PF, Li XJ. 2000. Amino-terminalfragments of mutant Huntingtin show selective accumulation in stri-atal neurons and synaptic toxicity. Nat Gen 25:385–389.
Li JY, Plomann M, Brundin Patrik. 2003. Huntington’s disease: a synap-topathy? Trends Mol Med 9:414–420.
Liem RKH, Yen SH, Salomon GD, Shelanski ML. 1978. Intermediatefilaments in nervous tissues. J Cell Biol 79:637–745.
Lin CH, Tallaksen-Greene S, Chien WM, Cearley JA, Jackson WS, CrouseAB, Ren S, Li XJ, Albin RL, Detloff PJ. 2001. Neurological abnormal-ities in a knock-in mouse model of Huntington’s disease. Hum Mol Gen10:137–144.
Luthi-Carter R, Strand A, Peters NL, Solano SM, Hollingsworth ZR, Me-non AS, Frey AS, Spektor BS, Penney EB, Schilling G, Ross CA,Borchelt DR, Tapscott SJ, Young AB, Cha JH, Olson JM. 2000. De-creased expression of striatal signaling genes in a mouse model ofHuntington’s disease. Hum Mol Gen 9:1259–1271.
Luthi-Carter R, Hanson SA, Strand AD, Bergstrom DA, Chun W, PetersNL, Woods AM, Chan Kooperberg EY, Krainc CD, Young AB, TapscottSJ, Olson JM. 2002. Dysregulation of gene expression in the R6/2model of polyglutamine disease: parallel changes in muscle and brain.Hum Mol Gen 11:1911–1926.
Maat-Schieman ML, Dorsman JC, Smoor MA, Siesling S, Van Duinen SG,Verschuuren JJ, den Dunnen JT, Van Ommen GJ, Roos RA. 1999.Distribution of inclusions in neuronal nuclei and dystrophic neurites inHuntington disease brain. J Neuropathol Exp Neurol 58:129–137.
Mangiarini L, Sathasivam K, Seller M, Cozens B, Harper A, HetheringtonC, Lawton M, Trottier Y, Lehrbach H, Davies SW, Bates G. 1996. Exon1 of the HD gene with an expanded CAG repeat is sufficient to cause aprogressive neurological phenotype in transgenic mice. Cell 87:493–506.
Martindale D, Hackham A, Wiczorek A, Ellerby L, Wellington C, McCutch-eon K, Singaraja R, Kazemi-Esfariani P, Devon R, Kim SU, BredesenDE, Tufaro F, Hayden MR. 1998. Length of huntingtin and its poly-glutamine tract influences localization and frequency of intracellularaggregates. Nat Gen 18:150–154.
Meade CA, Figueredo-Cardenas G, Fusco FR, Nowak TS, Pulsinelli W,Reiner A. 2000. Transient global ischemia in rats yields striatal pro-
jection neuron and interneuron loss resembling that in Huntington’sdisease. Exp Neurol 166:307–323.
Meade CA, Deng YP, Fusco F, Del Mar N, Hersch S, Goldowitz D, ReinerA. 2002. Localization of neuronal intranuclear inclusions (NIIs) in thestriatum and cortex of the Bates R6/2 transgenic mouse. J CompNeurol 449:241–269.
Menalled L, Zanjani H, MacKenzie L, Koppel A, Carpenter E, Zeitlin S,Chesselet MF. 2000. Decrease in striatal enkephalin mRNA in mousemodels of Huntington’s disease. Exp Neurol 162:328–342.
Menalled L, Sison JD, Ying W, Olivieri M, Li XJ, Li H, Zeitlin S, ChesseletMF. 2002. Early motor dysfunction and striosomal distribution of hun-tingtin microaggregates in Huntington’s disease knock-in mice. J Neu-rosci 22:8266–8276.
Morton AJ, Lagan MA, Skepper JN, Dunnett SB. 2000. Progressive for-mation of inclusions in the striatum and hippocampus of mice trans-genic for the human Huntington’s disease mutation. J Neurocytol29:679–702.
Myers RH, Leavitt J, Farrer LA, Jagadeesh J, McFarlane H, MastromauroCA, Mark RJ, Gusella JF. 1989. Homozygote for Huntington’s disease.Am J Hum Genet 45:615–618.
Nasir J, Floresco SB, O’Kusky JR, Borowski A, Richman JM, Zeisler J,Phillips AG, Hayden MR. 1995. Targeted disruption of the Hunting-ton’s disease gene results in embryonic lethality and behavioral andmorphological changes in heterozygotes. Cell 81:811–823.
Neumann M, Sampathu DM, Kwong LK, Truax AC, Micsenyi MC, ChouTT, Bruce J, Schuck T, Grossman M, Clark CM, McCluskey LF, MillerBL, Masliah E, Mackenzie IR, Feldman H, Feiden W, Kretzschmar HA,Trojanowski JQ, Lee VM. 2006. Ubiquitinated TDP-43 in frontotempo-ral lobar degeneration and amyotrophic lateral sclerosis. Science 314:130–133.
Oberdick J, Wallace JD, Lewin A, Smeyne RJ. 1994. Transgenic expressionto monitor dynamic organization of neuronal development: use of the E.coli lacZ gene product, �-galactosidase. Neuroprotocols 5:54–62.
Ordway JM, Tallaksen-Greene S, Gutekunst, CA, Bernstein EM, CearleyJA, Wiener HW, Dure LS IV, Lindsey R, Hersch SM, Jope RS, AlbinRL, Detloff PJ. 1997. Ectopically expressed CAG repeats cause intranu-clear inclusions and a progressive late onset neurological phenotype inthe mouse. Cell 91:753–763.
Pakkenberg B, Regeur L, Jørgen H, Gundersen G. 2002. Quantitativestructural changes in the ageing brain. In: Copeland JRM, Abou-SalehMT, Blazer DG, editors. Principles and practice of geriatric psychiatry,2nd ed. New York: John Wiley & Sons. p 45–46.
Perry G, Friedman R, Shaw G, Chau V. 1987. Ubiquitin is detected inneurofibrillary tangles and senile plaque neurites of Alzheimer diseasebrains. Proc Natl Acad Sci U S A 84:3033–3036.
Persichetti F, Carlee L, Faber PW, McNeil SM, Ambrose CM, Srinidhi J,Anderson MA, Barnes GT, Gusella JF, MacDonald ME. 1996. Differ-ential expression of normal and mutant Huntington’s disease genealleles. Neurobiol Dis 3:183–190.
Peterson DA, Leppert JT, Lee KF, Gage FH. 1997. Basal forebrain neuro-nal loss in mice lacking neurotrophin receptor p75. Science 277:837–839.
Pinol MR, Kagi U, Heizmann CW, Vogel B, Sequier JM, Haas W, HunzikerW. 1990. Poly- and monoclonal antibodies against recombinant ratbrain calbindin D-28K were produced to map its selective distributionin the central nervous system. J Neurochem 54:1827–1833.
Qin ZH, Wang Y, Sapp E, Cuiffo B, Wanker E, Hayden MR, Kegel KB,Aronin N, DiFiglia M. 2004. Huntingtin bodies sequester vesicle-associated proteins by a polyproline-dependent interaction. J Neurosci24:269–281.
Reddy PH, Williams M, Charles V, Garrett L, Pike-Buchanan L, WhetsellWO Jr, Miller G, Tagle DA. 1998. Behavioral abnormalities and selec-tive neuronal loss in HD transgenic mice expressing mutated full-length HD cDNA. Nat Gen 20:198–202.
Reddy PH, Charles V, Williams M, Miller G, Garrett L, Whetsell WO Jr,Tagle DA. 1999. Transgenic mice expressing mutated full-length HDcDNA: a paradigm for locomotor changes and selective neuronal loss inHuntington’s disease. Proc R Soc Lond 354:20:1035–1045.
Reiner A. 1987. The distribution of proenkephalin-derived peptides in thecentral nervous system of turtle. J Comp Neurol 259:65–91.
Reiner A. 1991. A comparison of the neurotransmitter-specific andneuropeptide-specific neuronal cell types present in turtle cortex tothose present in mammalian isocortex: implications for the evolution ofisocortex. Brain Behav Evol 38:53–91.
Reiner A, Anderson KD. 1990. The patterns of neurotransmitter and neu-
The Journal of Comparative Neurology. DOI 10.1002/cne
627R6/2 NEURONS SURVIVE IN ADULT MOUSE BRAIN
ropeptide co-occurrence among striatal projection neurons: conclusionsbased on recent findings. Brain Res Rev 15:251–265.
Reiner A, Albin RL, Anderson KD, D’Amato CJ Penney JB, Young AB.1988. Differential loss of striatal projection neurons in Huntington’sdisease. Proc Natl Acad Sci U S A 85:5733–5737.
Reiner A, Del Mar N, Meade CA, Yang H, Dragatsis I, Zeitlin S, GoldowitzD. 2001. Neurons lacking huntingtin differentially colonize brain andsurvive in chimeric mice. J Neurosci 21:7608–7618.
Reiner A, Dragatsis I, Zeitlin S, Goldowitz D. 2003. Wild-type huntingtinplays a role in brain development and neuronal survival. Mol Neurobiol28:259–275.
Reynolds GP, Dalton CF, Tillery CL, Mangiarini L, Davies SW, Bates GP.1999. Brain neurotransmitter deficits in mice transgenic for the Hun-tington’s mutation. J Neurochem 72:1773–1776.
Richfield EK, Maguire-Zeiss KA, Cox C Gilmore J, Voorn P. 1995. Reducedexpression of preproenkephalin in striatal neurons from Huntington’sdisease patients. Ann Neurol 37:335–343.
Rigamonti D, Bauer JH, De-Fraja C, Conti L, Sipione S, Sciorati C, Clem-enti E, Hackam A, Hayden MR, Li Y, Cooper JK, Ross CA, Govoni S,Vincenz C, Cattaneo E. 2000. Wild-type huntingtin protects from apo-ptosis upstream of caspase-3. J Neurosci 20:3705–3713.
Rosas HD, Liu AK, Hersch S, Glessner M, Ferrante RJ, Salat DH, van derKouwe A, Jenkins BG, Dale AM, Fischl B. 2002. Regional and progres-sive thinning of the cortical ribbon in Huntington’s disease. Neurology58:695–701.
Rosas HD, Koroshetz WJ, Chen YI, Skeuse C, Vangel M, Cudkowicz ME,Caplan K, Marek K, Seidman LJ, Makris N, Jenkins BG, GoldsteinJM. 2003. Evidence for more widespread cerebral pathology in earlyHD. An MRI-based morphometric analysis. Neurology 60:1615–1620.
Rosas HD, Hevelone ND, Zaleta AK, Greve DN, Salat DH, Fischl B. 2005.Regional cortical thinning in preclinical Huntington disease and itsrelationship to cognition. Neurology 65:745–747.
Sanchez I, Xu CJ, Juo P, Kakizaka A, Blenis J, Yuan J. 1999. Caspase-8 isrequired for cell death induced by expanded polygluamine repeats.Neuron 22:623–633.
Sanchez I, Mahlke C, Yuan J. 2003. Pivotal role of oligomerization inexpanded polyglutamine neurodegenerative disorders. Science 421:373–379.
Sapp E, Ge P, Aizawa H, Bird E, Penney JB, Young AB, Vonsattel JP,DiFiglia M. 1995. Evidence for a preferential loss of enkephalin immu-noreactivity in the external globus pallidus in low grade Huntington’sdisease using high resolution image analysis. Neuroscience 64:397–404.
Sapp E, Schwarz C, Chase K, Bhide PG, Young AB, Penney J, VonsattelJP, Aronin N, DiFiglia M. 1997. Huntingtin localization in brains ofnormal and Huntington’s disease patients. Ann Neurol 42:604 – 612.
Sapp E, Penney J, Young A, Aronin N, Vonsattel JP, DiFiglia M. 1999.Axonal transport of N-terminal huntingtin suggests early pathology ofcorticostriatal projections in Huntington’s disease. J Neuropathol ExpNeurol 58:165–173.
Saudou F, Finkbeiner S, Devys D, Greenberg ME. 1998. Huntingtin acts inthe nucleus to induce apoptosis but death does not correlate with theformation of intranuclear inclusions. Cell 95:55–66.
Scherzinger E, Luz R, Turmaine M, Mangiarini L, Hollenbach B, Hasen-bank R, Bates GP, Davies SW, Lehrbach H, Wanker EE. 1997. Hun-tingtin encoded polyglutamine expansions form amyloid-like proteinaggregates in vitro and vivo. Cell 90:549–558.
Schilling G, Sharp AH, Loev SJ, Wagster MV, Li SH, Stine OC, Ross CA.1995. Expression of the Huntington’s disease protein product in HDpatients. Hum Mol Genet 4:1365–1371.
Schilling G, Becher MW, Sharp AH, Jinnah HA, Duan K, Kotzuk JA, SluntHH, Ratovitski T, Cooper JK, Jenkins NA, Copeland NG, Price DL,Ross CA, Borchelt DR. 1999. Intranuclear inclusions and neuritic ag-gregates in transgenic mice expressing a mutant N-terminal fragmentof huntingtin. Hum Mol Gen 8:397–407.
Schilling G, Savonenko AV, Klevytska A, Morton JL, Tucker SM, PoirierM, Gale A, Chan N, Gonzales V, Slunt HH, Coonfield ML, Jenkins NA,Copeland NG, Ross CA, Borchelt DR. 2004. Nuclear-targeting of mu-tant huntingtin fragments produces Huntington’s disease-like pheno-types in transgenic mice. Hum Mol Gen 13:1599–1610.
Sharp AH, Loev SJ, Schiling G, Li SH, Li XJ, Bao J, Wagster MV,Kotzuk JA, Steiner JP, Lo A, Hedreen J, Sisodia S, Snyder SH,Dawson TM, Ryugo DDK, Ross CA. 1995. Widespread expression ofHuntington’s disease gene (IT15) protein product. Neuron 14:1065–174.
Sieradzan KA, Mechan AO, Jones L, Wanker EE, Nukina N, Mann DM.1999. Huntington’s disease intranuclear inclusions contain truncated,ubiquitinated huntingtin protein. Exp Neurol 156:92–99.
Sipione S, Rigamonti D, Valenza M, Zuccato C, Conti L, Pritchard J,Kooperberg C, Olson JM, Cattaneo E. 2002. Early transcriptional pro-files in huntingtin-inducible striatal cells by microarray analyses. HumMol Gen 11:1953–1965.
Sisodia SS. 1998. Nuclear inclusion in glutamine repeat disorders: are theypernicious, coincidental or beneficial? Cell 95:1–4.
Slow EJ, van Raamsdonk J, Rogers D, Coleman SH, Graham RK, Deng Y,Oh R, Bissada N, Hossain SM, Yang YZ, Li XJ, Simpson EM,Gutekunst CA, Leavitt BR, Hayden MR. 2003. Selective striatal neu-ronal loss in a YAC128 mouse model of Huntington disease. Hum MolGen 12:1555–1567.
Slow EJ, Graham RK, Osmand AP, Devon RS, Lu G, Deng Y, Pearson J,Vaid K, Bissada N, Wetzel R, Leavitt BR, Hayden MR. 2005. Absenceof behavioral abnormalities and neurodegeneration in vivo despitewidespread neuronal huntingtin inclusions. Proc Natl Acad Sci U S A102:11402–11407.
Spires TL, Grote HE, Garry S, Cordery PM, Van Dellen A, Blakemore C,Hannan AJ. 2004. Dendritic spine pathology and deficits in experience-dependent dendritic plasticity in R6/1 Huntington’s disease transgenicmice. Eur J Neurosci 19:2799–2807.
Stack EC, Kubilus JK, Smith K, Cormier K, Del Signore SJ, Guelin E, RyuH, Hersch SM, Ferrante RJ. 2005. Chronology of behavioral symptomsand neuropathological sequela in R6/2 Huntington’s disease transgenicmice. J Comp Neurol 490:354–370.
Storey E, Kowall NW, Finn SF, Mazurek MF, Beal MF. 1992. The corticallesion of Huntington’s disease: further neurochemical characterizationand reproduction of some of the histological and neurochemical fea-tures by N-methyl-D-aspartate. Ann Neurol 32:526–534.
Sun Z, Del Mar N, Meade C, Goldowitz D, Reiner A. 2002. Differentialchanges in striatal projection neurons in R6/2 mice transgenic forHuntington’s disease. Neurobiol Dis 11:369–385.
Tabrizi SJ, Workman J, Hart PE, Mangiarini L, Mahal A, Bates G, CooperJM, Schapira AHV. 2000. Mitochondrial dysfunction and free radicaldamage in the Huntington R6/2 transgenic mouse. Ann Neurol 47:80–86.
Tallaksen-Greene SJ, Crouse AB, Hunter JM, Detloff PJ, Albin RL. 2005.Neuronal intranuclear inclusions and neuropil aggregates in Hdh-CAG(150) knockin mice. Neuroscience 131:843–852.
Trottier Y, Devys D, Imbert G, Saudou F, An I, Lutz Y, Weber C, Agid Y,Hirsch EC, Mandel JL. 1995. Cellular localization of the Huntington’sdisease protein and discrimination of the normal and mutated form.Nat Gen 10:104–110.
Trushina E, Heldebrant MP, Perez-Terzic CM, Bortolon R, Kovtun IV,Badger JD 2nd, Terzic A, Estevez A, Windebank AJ, Dyer RB, Yao J,McMurray CT. 2003. Microtubule destabilization and nuclear entry aresequential steps leading to toxicity in Huntington’s disease. Proc NatlAcad Sci U S A 100:12171–12176.
Trushina E, Dyer RB, Badger JD 2nd, Ure D, Eide L, Tran DD, Vrieze BT,Legendre-Guillemin V, McPherson PS, Mandavilli BS, Van Houten B,Zeitlin S, McNiven M, Aebersold R, Hayden M, Parisi JE, Seeberg E,Dragatsis I, Doyle K, Bender A, Chacko C, McMurray CT. 2004. Mu-tant huntingtin impairs axonal trafficking in mammalian neurons invivo and in vitro. Mol Cell Biol 24:8195–8209.
Turmaine M, Raza A, Mahal A, Mangiarini L, Bates GP, Davies SW. 2000.Nonapoptotic neurodegeneration in a transgenic mouse model of Hun-tington’s disease. Proc Natl Acad Sci U S A 97:8093–8097.
Velier J, Kim M, Schwarz C, Kim TW, Sapp E, Chase K, Aronin N, DiFigliaM. 1998. Wild-type and mutant huntingtin function in vesicle traffick-ing in the secretory and endocytotic pathways. Exp Neurol 152:34–40.
Vonsattel JP, Myers RH, Stevens TJ, Ferrante RJ, Bird ED, RichardsonEP. 1985. Neuropathological classification of Huntington’s disease.J Neuropathol Exp Neurol 44:559–577.
Wellington CL, Ellerby LM, Hackham AS, Margolis RL, Trifiro MA, Sin-garaja R, McCutcheon, Salvesen GS, Propp SS, Bromm M, RowlandKJ, Zhang T, Rasper D, Roy S, Thornberry N, Pinsky L, Kakizuka A,Ross CA, Nicholson DW, Bredesen DE, Hayden MR. 1998. Caspasecleavage of gene products associated with triplet expansion disordersgenerates truncated fragments containing the polygluamine tract.J Biol Chem 273:9159–9167.
Wexler NS, Young AB, Tanzi RE, Travers H, Starosta-Rubinstein S, Pen-ney JB, Snodgrass SR, Shoulson I, Gomez F, Ramos Arroyo MA, Pen-chaszadeh GK, Moreno H, Gibbons K, Faryniarz A, Hobbs W, Anderson
The Journal of Comparative Neurology. DOI 10.1002/cne
628 REINER ET AL.

MA, Bonilla E, Conneally PM, Gusella JF. 1987. Homozygotes forHuntington’s disease. Nature 326:194–197.
White JK, Auerbach W, Duyao MP, Vonsattel JP, Gusella JF, Joyner AL,MacDonald ME. 1997. Huntingtin is required for neurogenesis and isnot impaired by the Huntington’s disease CAG expansion. Nat Gen17:404–410.
Wilson RS, Como PG, Garron DC, Klawans HL, Barr A, Klawans D. 1987.Memory failure in Huntington’s disease. J Clin Exp Neuropsychol9:147–154.
Wood JD, McLaughlin JC, Harper PS, Lowenstein PR, Jones AL. 1996.Partial characterization of marine huntingtin and apparent variationsin the subcellular localization of huntingtin in human, mouse and ratbrain. Hum Mol Gen 5:481–487.
Yang W, Dunlap JR, Andrews RB, Wetzel R. 2002. Aggregated polyglu-tamine peptides delivered to nuclei are toxic to mammalian cells. HumMol Gen 11:2905–2917.
Yeh E, Dermer M, Commisso C, Zhou L, McGlade CJ, Boulianne GL. 2001.Neuralized functions as N E3 ubiquitin ligase during Drosophila de-velopment. Curr Biol 11:1675–1679.
Zeitlin S, Liu JP, Chapman DL, Papaiopnnou VE, Efstratiadis A. 1995.Increased apoptosis and early embryonic lethality in mice nullizy-gous for the Huntington’s disease gene homologue. Nat Gen 11:155–163.
Zhang R, Oorschot DE. 2006. Total number of neurons in the habenularnuclei of the rat epithalamus: a stereological study. J Anat 208:577–585.
The Journal of Comparative Neurology. DOI 10.1002/cne
629R6/2 NEURONS SURVIVE IN ADULT MOUSE BRAIN
Copyright © 2022 FDOKUMEN