Brain gene expression correlates with changes in behavior in the R6/1 mouse model of Huntington’s...
12
Genes, Brain and Behavior (2008) # 2007 The Authors Journal compilation # 2007 Blackwell Publishing Ltd Brain gene expression correlates with changes in behavior in the R6/1 mouse model of Huntington’s disease A. Hodges †,‡ , G. Hughes † , S. Brooks § , L. Elliston † , P. Holmans †,¶ , S. B. Dunnett § and L. Jones †,#, * † Department of Psychological Medicine, Wales School of Med- icine, Cardiff University, Cardiff, United Kingdom, ‡ Present address: MRC Centre for Neurodegeneration Research, Depart- ment of Psychological Medicine, Box PO 70, Institute of Psychi- atry, King’s College London, De Crespigny Park, London, United Kingdom, § Brain Repair Group, School of Biosciences, ¶ Bioinformatics and Biostatistics Unit, Wales School of Medicine, and # Institute of Medical Genetics, Wales School of Medicine, Cardiff University, Cardiff, United Kingdom *Corresponding author: L. Jones, Department of Psychological Medicine, Henry Wellcome Building, Wales School of Medicine, Cardiff University, Cardiff, CF14 4XN, UK. E-mail: [email protected] Huntington’s disease (HD) is an inherited neurodegenera- tion that causes a severe progressive illness and early death. Several animal models of the disease have been generated carrying the causative mutation and these have shown that one of the earliest molecular signs of the disease process is a substantial transcriptional deficit. We examined the alterations in brain gene expression in the R6/1 mouse line over the course of the development of phenotypic signs from 18 to 27 weeks. Changes in R6/1 mice were similar to those previously reported in R6/2 mice, and gene ontology analysis shows that pathways related to intracellular and electrical signaling are altered among downregulated genes and lipid biosynthesis and RNA processes among upregulated genes. The R6/1 mice showed deficits in rotarod performance, locomotor activ- ity and exploratory behavior over the time–course. We have correlated the alterations in gene expression with changes in behavior seen in the mice and find that few alterations in gene expression correlate with all behav- ioral changes but rather that different subsets of the changes are uniquely correlated with one behavior only. This indicates that multiple behavioral tasks assessing different behavioral domains are likely to be necessary in therapeutic trials in mouse models of HD. Keywords: Behavior, gene expression, Huntington’s disease, neurodegeneration, R6/1 Received 17 April 2007, revised 16 July 2007, accepted for publication 16 July 2007 Huntington’s disease (HD) is a neurodegeneration caused by an expanded CAG repeat in the HD gene. Patients typically have a characteristic movement disorder, decline of cognitive function and variable psychiatric manifestations. Huntington’s disease usually onsets in midlife and is relentlessly progres- sive with death following inexorably 10–20 years later (Bates et al. 2002). The neurodegeneration starts first and is most severe in the caudate nucleus and putamen, with first loss of the striatal medium spiny projection neurons observed before the manifestation of clinical symptoms (Vonsattel et al. 1985). A series of mouse models of HD have been generated that recapitulate aspects of the clinical disease, including its progression and the observation of huntingtin-containing neuronal inclusions (Beal & Ferrante 2004; Davies et al. 1997; Mangiarini et al. 1996). Many of the mice have a movement disorder that can be measured by performance on an accelerating rotarod (Bates & Murphy 2002; Carter et al. 1999) and in addition, where it has been examined, most mice also have cognitive deficits (Lione et al. 1999; Spires et al. 2004; Trueman et al. 2007). The timing of onset and progres- sion of the phenotype depends on the mouse line, with longer repeats and the expression of truncated fragments of the huntingtin protein generally giving earlier deficits (Hersch & Ferrante 2004). One of the earliest observable molecular changes to occur in the brain of HD model mice is an alteration in gene expression (Chan et al. 2002; Luthi-Carter et al. 2000, 2002a, 2002b). In R6/2 mice, changes in gene expression were already present at 6 weeks (Luthi-Carter et al. 2002a). In R6/1 mice, downregulation of caudate-specific genes was first seen in 10-week-old mice and most such genes were further downregulated by 6 months (Desplats et al. 2006). Human HD caudate also shows substantial alterations in gene expression that cannot be accounted for by cell loss (Hodges et al. 2006). In the present study, we examine the relationship between changes in gene expression and the emergence of the behavioral phenotype in the R6/1 mouse model of HD. The R6 models carry a truncated human HD gene encoded by exon 1 of the human gene, with expanded CAG repeats of > 150 CAG in the R6/2 and around 115 CAG in the R6/1 model (Mangiarini et al. 1996). The R6/2 model is the best charac- terized and has a very rapid disease course; the R6/1 model has been less well characterized but has a slower disease trajectory, with death not occurring until at least 8 months, although the phenotype seems similar to that of R6/2. Motor defects can be detected around 3 months in R6/1 mice (Hansson et al. 2001) and detailed investigation showed that exploratory behaviors were altered as early as 4 weeks 288 doi: 10.1111/j.1601-183X.2007.00350.x
Transcript of Brain gene expression correlates with changes in behavior in the R6/1 mouse model of Huntington’s...
Genes, Brain and Behavior (2008) # 2007 The AuthorsJournal compilation # 2007 Blackwell Publishing Ltd
Brain gene expression correlates with changes inbehavior in the R6/1 mouse model of Huntington’sdisease
A. Hodges†,‡, G. Hughes†, S. Brooks§,
L. Elliston†, P. Holmans†,¶, S. B. Dunnett§
and L. Jones†,#,*
†Department of Psychological Medicine, Wales School of Med-
icine, Cardiff University, Cardiff, United Kingdom, ‡Present
address: MRC Centre for Neurodegeneration Research, Depart-
ment of Psychological Medicine, Box PO 70, Institute of Psychi-
atry, King’s College London, De Crespigny Park, London, United
Kingdom, §Brain Repair Group, School of Biosciences,¶Bioinformatics and Biostatistics Unit, Wales School of Medicine,
and #Institute of Medical Genetics, Wales School of Medicine,
Cardiff University, Cardiff, United Kingdom
*Corresponding author: L. Jones, Department of Psychological
Medicine, Henry Wellcome Building, Wales School of Medicine,
Cardiff University, Cardiff, CF14 4XN, UK. E-mail: [email protected]
Huntington’s disease (HD) is an inherited neurodegenera-
tion that causes a severe progressive illness and early
death. Several animal models of the disease have been
generated carrying the causativemutation and these have
shown that one of the earliest molecular signs of the
disease process is a substantial transcriptional deficit. We
examined the alterations in brain gene expression in the
R6/1 mouse line over the course of the development of
phenotypic signs from 18 to 27 weeks. Changes in R6/1
mice were similar to those previously reported in R6/2
mice, and gene ontology analysis shows that pathways
related to intracellular and electrical signaling are altered
among downregulated genes and lipid biosynthesis and
RNA processes among upregulated genes. The R6/1 mice
showed deficits in rotarod performance, locomotor activ-
ity and exploratory behavior over the time–course. We
have correlated the alterations in gene expression with
changes in behavior seen in the mice and find that few
alterations in gene expression correlate with all behav-
ioral changes but rather that different subsets of the
changes are uniquely correlated with one behavior only.
This indicates that multiple behavioral tasks assessing
different behavioral domains are likely to be necessary in
therapeutic trials in mouse models of HD.
Keywords: Behavior, gene expression, Huntington’s disease,neurodegeneration, R6/1
Received 17 April 2007, revised 16 July 2007, accepted forpublication 16 July 2007
Huntington’s disease (HD) is a neurodegeneration caused byan expanded CAG repeat in the HD gene. Patients typically
have a characteristic movement disorder, decline of cognitivefunction and variable psychiatric manifestations. Huntington’s
disease usually onsets in midlife and is relentlessly progres-sive with death following inexorably 10–20 years later (Bates
et al. 2002). The neurodegeneration starts first and is mostsevere in the caudate nucleus and putamen, with first loss of
the striatal medium spiny projection neurons observed beforethe manifestation of clinical symptoms (Vonsattel et al. 1985).
A series of mouse models of HD have been generated thatrecapitulate aspects of the clinical disease, including its
progression and the observation of huntingtin-containingneuronal inclusions (Beal & Ferrante 2004; Davies et al.
1997; Mangiarini et al. 1996). Many of the mice havea movement disorder that can be measured by performance
on an accelerating rotarod (Bates &Murphy 2002; Carter et al.1999) and in addition, where it has been examined, most mice
also have cognitive deficits (Lione et al. 1999; Spires et al.2004; Trueman et al. 2007). The timing of onset and progres-
sion of the phenotype depends on themouse line, with longerrepeats and the expression of truncated fragments of the
huntingtin protein generally giving earlier deficits (Hersch &Ferrante 2004).
One of the earliest observable molecular changes to occurin the brain of HD model mice is an alteration in gene
expression (Chan et al. 2002; Luthi-Carter et al. 2000,2002a, 2002b). In R6/2 mice, changes in gene expression
were already present at 6 weeks (Luthi-Carter et al. 2002a). InR6/1 mice, downregulation of caudate-specific genes was
first seen in 10-week-old mice and most such genes werefurther downregulated by 6 months (Desplats et al. 2006).
Human HD caudate also shows substantial alterations in geneexpression that cannot be accounted for by cell loss (Hodges
et al. 2006).
In the present study, we examine the relationship betweenchanges in gene expression and the emergence of the
behavioral phenotype in the R6/1 mouse model of HD. TheR6 models carry a truncated human HD gene encoded by
exon 1 of the human gene, with expanded CAG repeats of >150 CAG in the R6/2 and around 115 CAG in the R6/1 model
(Mangiarini et al. 1996). The R6/2 model is the best charac-terized and has a very rapid disease course; the R6/1 model
has been less well characterized but has a slower diseasetrajectory, with death not occurring until at least 8 months,
although the phenotype seems similar to that of R6/2. Motordefects can be detected around 3 months in R6/1 mice
(Hansson et al. 2001) and detailed investigation showed thatexploratory behaviors were altered as early as 4 weeks
288 doi: 10.1111/j.1601-183X.2007.00350.x

(Bolivar et al. 2004). We carried out a battery of behavioraltests longitudinally from 18 weeks of age and we also
examined brain gene expression at 18, 22 and 27 weeks ofage in these animals.
Methods
Animals
The mice used in this study came from our colony of R6/1 miceroutinely maintained by breeding male R6/1s from our colony withB6CBA F1 (isolator breed: offspring of a cross between the C57BL/6JOlaHsd inbred female and the CBA/CaOlaHsd inbred male) fromHarlan. The study was based on 16 R6/1 mice and 16 wild-type littermate offspring (7 males and 9 females of each genotype) from fiveclosely spaced litters. The transgenic R6/1 mice had CAG repeatlengths of 126.5� 3.0 (range 122–131 repeats). Themicewere housedin group cages three to four mice per cage, on sawdust flooring, andcontaining a cardboard tube to provide modest enrichment. Food andwater were available ad libitum. The behavioral batteries were appliedover 1-week blocks of testing at 18, 22 and 27 weeks of age, followingwhich three mice from each group were killed for gene expressionanalysis. At the end of the experiment, remaining mice were killed forhistological confirmation of huntingtin inclusion pathology.
Gene expression
Three sex-matched mice from each genotype (R6/1 and wild type)were killed at 18, 22 and 27 weeks of age. Brain samples werecollected, snap frozen in liquid nitrogen and stored at �808C. TotalRNA was extracted from one hemisphere for microarray analysis, asdescribed previously (Morton et al. 2005a). Microarray analysis ofglobal gene expression was carried out using 10 mg of total RNA andmurine genome 430 2.0 Arrays, according to the GeneChip Expres-sion Analysis Technical Manual (Affymetrix UK Ltd, High Wycombe,UK). Quantitative real-time polymerase chain reaction (PCR) wascarried out essentially as in Morton et al. (2005a). mRNA expressionlevels were quantified using QuantiTect SYBR Green RT-PCR Kit(Qiagen, GmbH, Hilden, Germany) for Penk 1, Arpp19, Gria 3, Adnpand Fads 1 according to the manufacturer’s instructions. Gene-specific oligonucleotide primer pairs spanning exons were designedusing PRIMER3 software (www.genome.wi.mit.edu/cgibin/primer/pri-mer3_www.cgi) and using sequence data from the NCBI database.Primers were as in Morton et al. (2005a) and in addition the followingprimers were purchased from Invitrogen (Carlsbad, CA, USA): Fads 1AAGCACATGCCATACAACCA and CAGCGGCATGTAAGTGAAGA;Adnp AGAAAAGCCCGGAAAACTGT and AAGCACTGCAG-CAAAAAGGT.
DNAsed total RNA at 20, 50 or 100 ng/ml for each sample,whichever was optimal, was accurately diluted using a NanoDrop�
ND 1000A Spectrophotometer (NanoDrop Technologies, Inc.,Wilmington, DE, USA) before being amplified in duplicate. The defaultamplification program using the QuantiTect SYBR Green RT-PCR Kitwas 508C 30.0 min, 958C 15 min and 948C 15 seconds, 608C 30seconds, 728C 30 seconds for 35 cycles except for Adnp and Fads 1,which had an annealing temperature of 588C.
Behavior
RotarodThe rotarod apparatus (Ugo Basile, Biological Research Apparatus,Varese, Italy) was used to measure the animals’ balance and motorcoordination, as previously described (Brooks et al. 2004b; Carteret al. 1999). The 3-cm-diameter beam was coated in soft rubber (froma bicycle tire inner tube) to prevent the animals from clinging to thebeam in the event of them failing to maintain their balance. The micewere trained on the apparatus across 2 days prior to the first testexposure. On the test day, each mouse underwent two test runs, and
the mean score of these runs was used for statistical analysis. Micewere initially placed on the stationary beam and then the beam startedto rotate at a constantly accelerating rate of 3 r.p.m./30 seconds toa maximum velocity of 44 r.p.m. All mice fell before the maximumvelocity was reached, and a trip switch records the latency to fall sincethe start of the trial. Approximately 45–60 min separated the two trialson each test day, which were spent in the home cage.
Locomotor activityGeneral levels of 24-h motor activity were measured using anEthovision automated video recording system (Noldus InformationTechnology, Wageningen, the Netherlands), as previously described.Levels of motor activity were also assessed after 30 min in the arenaas a measure of nonhabituated motor activation. A single open fieldarea (100 � 100 � 29 cm) with white walls and floor (to aid theautomated detection of the animals) was divided into four separateand equally sized square arenas (50 � 50 � 29 cm) with the use ofwooden partition slides, allowing four mice to be tested at once. Toprevent the mice from escaping a wire, meshed roof was placed overthe top of the open field. Each of the partition walls had a water bottlemounted on it to allow the mice access to water over the 24-hmonitoring period, and pellets of standard laboratory chow (5 g inweight) were randomly placed in each of the arenas. The 24-hmonitoring began soon after the 07:00 start of the light period (lightson 07:00 and off at 19:00 daily).
Object recognition test/exploratory behaviorAn open field arena (30 � 30 � 15 cm) was constructed of whitePerspex with a clear Perspex lid. The floor of the arena was lightlycovered with sawdust. The objects that the mice were required todiscriminate between consisted of several sets (four identical objectsin each set) of identical objects, e.g. two sets of household orna-ments, one set of fizzy drink cans and one set of tea cups. The objecttypes were pseudorandomly allocated within and between animalgroups so that each object was evenly represented across theexperimental conditions. Prior to the onset of each experiment, eachmouse was habituated to the test arena, initially as pairs of animals ina 15-min session and then as individuals for a single 10-min session. Inboth cases, novel objects that were not to be used later in theexperiment were placed in the arena to aid habituation.
At the onset of the experiment, the initial object familiarizationstage, two identical objects were placed in the arena equidistant fromthe walls and each other. The mouse was then placed in the arena fora maximum of 5 min or until it had completed 30 seconds ofexploration of the objects. Because the objects at this stage wereidentical, the required 30 seconds of exploration was the sum of theexploration time of both objects. Episodes of object recognition wererecorded as the time that the animals’ nose was within approximately0.5 cm of the object. In some instances, the animal would rear abovethe object with its nose in the air; this was not deemed to beexploration. After 5 min had elapsed or 30 seconds of explorationhad been completed, the animal was removed from the arena andretuned to the home cage.
To assess recognition memory, two time delays were used in theexperiment; these were 1 and 4 h after the initial object familiarizationstage. For the animals at the youngest age point, these time delayswere run as separate experiments with an initial exploration phase foreach delay. The results from this initial test suggested that thisapproach was counterproductive resulting in excessive variance bothwithin and between animals; consequently, at later age points, a single‘initial exposure’ methodology was adopted. At the 1- and 4-h time-points, the animals were reintroduced to the arena, which againcontained two objects, a third (for the 1-h delay) replicate of the originalobject and a novel object that the animal had never seen before. Theanimal was permitted to explore the objects for 3 min. Over the courseof the 3min, the time spent exploring each of the objectswas recordedseparately. After 3 min, the animal was removed from the arena. Thisprocedure was repeated using a 4-h delay.
Startle responseThe primary acoustic startle response and the inhibition associatedwith a prepulse warning stimulus were tested in an automated startle
Genes, Brain and Behavior (2008) 7: 288–299 289
Gene expression and behavior in R6/1 mice
chamber (San Diego Instruments, San Diego, CA, USA) that recordedthe startle response by a force-sensitive floor plate to random deliveryof 105- and 120-dB 50-msecond bursts of white noise. Prepulseinhibition of the startle response was assessed by delivering brief 20-msecond 85-dB warning stimuli 0–100 mseconds prior to the primarystimulus. Stimulus delivery and data recording was controlled byonline connection to a PC microcomputer in a series of counter-balanced trials, as described previously (Brooks et al. 2004a; Carteret al. 1999).
Inverted grid testThe latency of a mouse to fall from an inverted standard laboratorymetal runged cage lid was taken as a measure of grip strength. Themouse was placed on the lid, which was then inverted slowly, suchthat the mouse had to cling to the underside of the lid to prevent itselffrom falling on to padded landing area below. The time that the animalremained on the inverted cage lid was recorded up to a maximum of60 seconds when the trial was terminated.
Statistical methods
BehaviorThe data from each dependent behavioral variable was analyzed bythree- and four- factor analyses of variance (ANOVAS) (Genstat forWindows v9.1; Lawes Agricultural Trust, Rothamsted, Oxon), withgenotype and sex as between-subject variables, and ages plus anytest-specific repeated measure as within-subject variables. Data foranimals removed for genetic analysis before the second and thirdtests were entered as missing values, for which the Genstat programcorrects, using an unbiased estimator algorithm that corrects for thereduced degrees of freedom that are thereby introduced. Althoughthere were a number of main effects of sex, because of differences inbody weight and size, interactions with genotype were small. Conse-quently, although the factor sex was included in all analyses, thevarious interactions with this factor are not reported in the Results.
Gene expressionProbeset summary values, normalization and linear modeling wereimplemented using the Bioconductor software (www.bioconductor.org). Specifically, probeset normalization and summary values werecalculated using the Robust multichip average (RMA) from the affypackage (Gautier et al. 2004). Tests of differential gene expression bygenotype were performed using moderated t-tests in LIMMA (Smyth2004). Quality control of samples was investigated by examiningperfect match density plots, affy QC control probeset summaries,pseudochip RMA weight plots (affyPLM package) and MA plots(Bolstad et al. 2005; Gautier et al. 2004; Irizarry et al. 2003).Quantitative PCR results were analyzed as in Morton et al. (2005a).
Correlation of behavior and expressionTo reduce multiple testing, correlation analyses were restricted togene expression probesets and behaviors exhibiting significant geno-type effects (P < 0.001 for probesets, P < 0.05 for behaviors).Behavior/probeset combinations whose P values for correlationsatisfied false discovery rate (FDR) < 0.05 (Benjamini & Hochberg1995) were selected for further analysis (see below).
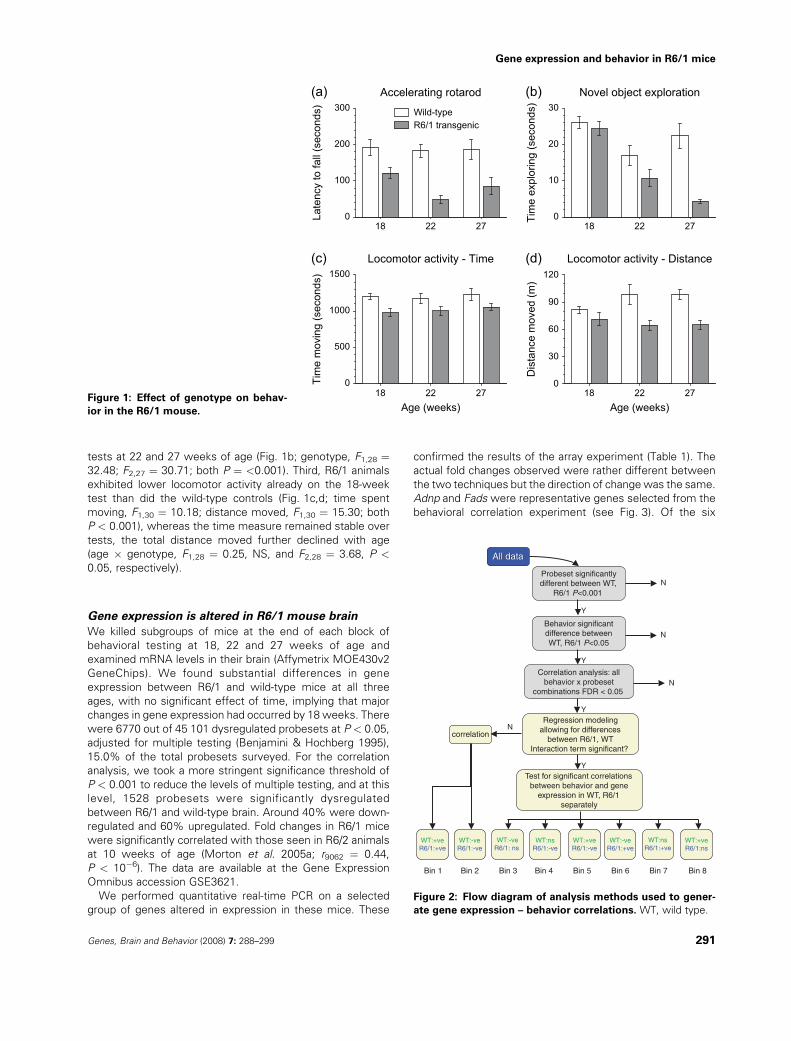
Variation of behavior/expression correlation with genotypeThe effect of genotype on behavior and gene expression for eachmouse in the study was tested using linear regression. Two modelswere fitted, using the behavioral results generated most recently priorto killing as the dependent variable. A flow diagram of the analysisprocedure for testing behavior/gene expression correlations is shownin Fig. 2. One model contained genotype main effects only, thesecond contained main effects of both genotype and gene expres-sion, together with their interaction. The difference in fit between thetwo models was assessed by ANOVA, providing a test of the effects ofexpression on behavior after allowing for genotype effects. If thedifference in the models was not significant, then the whole of theeffect of gene expression on behavior was considered to be as
a result of genotype alone. If the difference in themodels proved to besignificant (P < 0.05), the behavior/gene expression probeset combi-nation was assigned to one of eight bins as follows: first, thesignificance of the gene expression/genotype interaction term wastested – this measures the difference in correlation between expres-sion and behavior in the two genotype groups. If the interaction termwas non-significant (P > 0.05), the behavior/probeset combinationwas assigned to Bins 1 or 2, depending on the direction of thecorrelation in the sample as a whole. If the interaction term wassignificant (P < 0.05), behavior/gene expression correlation wastested in each genotype group separately and the behavior/probesetcombination assigned to one of Bins 3–8 depending on the signifi-cance and the direction of correlation in each genotype group. Graphsof the correlation between behavior and expression for representativeprobesets in each bin are shown in Fig. 3.
Overlap in dysregulated probesets between behaviorsThe overlap in gene expression associated with each pair of behaviorswas tested by comparing the observed number of probes in theoverlap to a hypergeometric distribution. The overlap between allthree distributions was tested by randomly simulating lists of dysre-gulated probesets for each behavior equal in length to that observed inthe actual data and counting the number of probesets in the overlap.This process was repeated 5000 times to build an expected distribu-tion for the number of probesets in the overlap, and the significance ofthe observed overlap estimated by comparing it to this distribution.
Significance of overrepresented gene ontology categoriesFor each gene ontology (GO) category, the total number of probes inthat category and the number of probes appearing on a list of dif-ferentially expressed probes (P < 0.001) were calculated. A P valuefor overrepresentation of each category was calculated (Fisher’sexact if either the number of probes on the list or the number noton the list was less than 10, otherwise a Pearson chi square). Thenumber of categories achieving a given P value for overrepresentationwas calculated, and significance assessed by permutation (to accountfor the overlap in categories). The permutation procedure was asfollows: a list of differentially expressed probes of equal length to theactual list was generated by sampling probes at random (withoutreplacement). The number of probes on the list for each GO categoryand hence a P value for overrepresentation was calculated. Thenumber of categories with a P value for overrepresentation less thanthe specified criterion was counted and compared with that in theactual data. The process was repeated 5000 times. A significantlyhigh number of overrepresented categories were found for bothdirections of differential expression (up and down).
Results
Behavior is altered in R6/1 mice
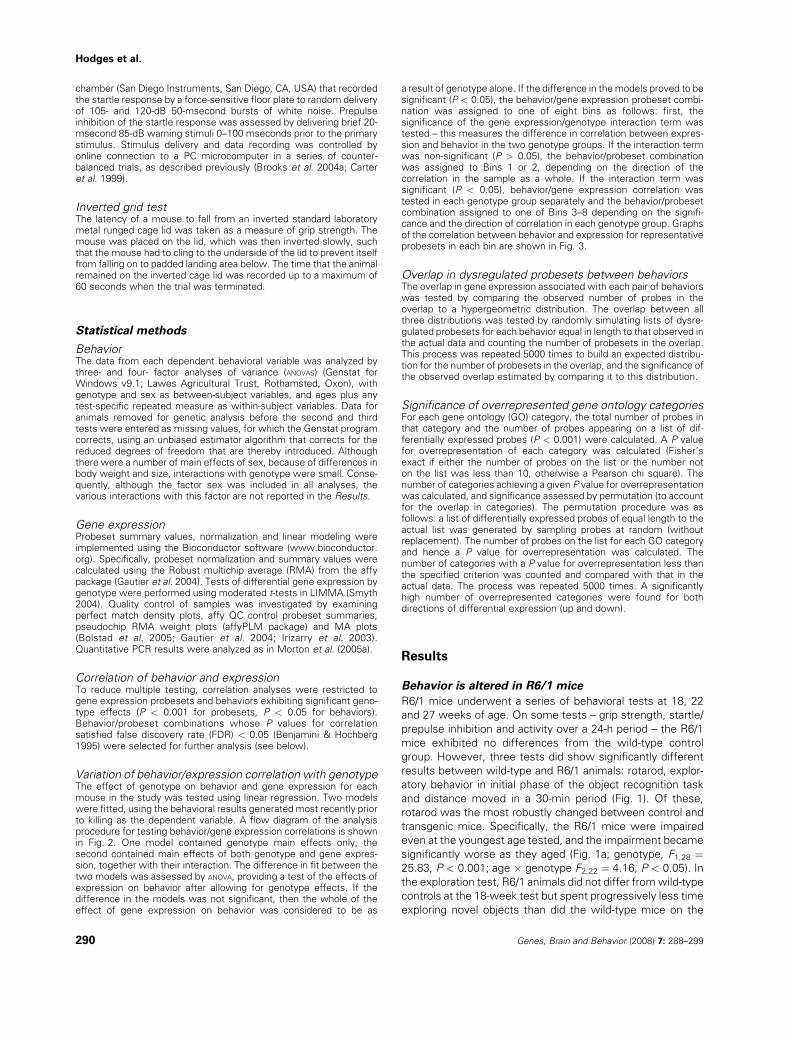
R6/1 mice underwent a series of behavioral tests at 18, 22and 27 weeks of age. On some tests – grip strength, startle/
prepulse inhibition and activity over a 24-h period – the R6/1
mice exhibited no differences from the wild-type controlgroup. However, three tests did show significantly different
results between wild-type and R6/1 animals: rotarod, explor-atory behavior in initial phase of the object recognition task
and distance moved in a 30-min period (Fig. 1). Of these,rotarod was the most robustly changed between control and
transgenic mice. Specifically, the R6/1 mice were impairedeven at the youngest age tested, and the impairment became
significantly worse as they aged (Fig. 1a; genotype, F1,28 ¼25.83, P < 0.001; age � genotype F2,22 ¼ 4.16, P < 0.05). In
the exploration test, R6/1 animals did not differ fromwild-typecontrols at the 18-week test but spent progressively less time
exploring novel objects than did the wild-type mice on the
290 Genes, Brain and Behavior (2008) 7: 288–299
Hodges et al.
tests at 22 and 27 weeks of age (Fig. 1b; genotype, F1,28 ¼32.48; F2,27 ¼ 30.71; both P ¼ <0.001). Third, R6/1 animals
exhibited lower locomotor activity already on the 18-weektest than did the wild-type controls (Fig. 1c,d; time spent
moving, F1,30 ¼ 10.18; distance moved, F1,30 ¼ 15.30; bothP < 0.001), whereas the time measure remained stable over
tests, the total distance moved further declined with age(age � genotype, F1,28 ¼ 0.25, NS, and F2,28 ¼ 3.68, P <
0.05, respectively).
Gene expression is altered in R6/1 mouse brain
We killed subgroups of mice at the end of each block of
behavioral testing at 18, 22 and 27 weeks of age andexamined mRNA levels in their brain (Affymetrix MOE430v2
GeneChips). We found substantial differences in geneexpression between R6/1 and wild-type mice at all three
ages, with no significant effect of time, implying that majorchanges in gene expression had occurred by 18 weeks. There
were 6770 out of 45 101 dysregulated probesets at P < 0.05,adjusted for multiple testing (Benjamini & Hochberg 1995),
15.0% of the total probesets surveyed. For the correlationanalysis, we took a more stringent significance threshold of
P < 0.001 to reduce the levels of multiple testing, and at thislevel, 1528 probesets were significantly dysregulated
between R6/1 and wild-type brain. Around 40% were down-regulated and 60% upregulated. Fold changes in R6/1 mice
were significantly correlated with those seen in R6/2 animalsat 10 weeks of age (Morton et al. 2005a; r9062 ¼ 0.44,
P < 10�6). The data are available at the Gene ExpressionOmnibus accession GSE3621.
We performed quantitative real-time PCR on a selectedgroup of genes altered in expression in these mice. These
confirmed the results of the array experiment (Table 1). Theactual fold changes observed were rather different between
the two techniques but the direction of changewas the same.Adnp and Fads were representative genes selected from the
behavioral correlation experiment (see Fig. 3). Of the six
18 22 27
Locomotor activity - Time
Age (weeks)
Tim
e m
ovin
g (s
econ
ds)
0
500
1000
1500(c) Locomotor activity - Distance
Dis
tanc
e m
oved
(m)
0
30
60
90
120
18 22 27Age (weeks)
(d)
(a) Accelerating rotarod
18 22 27
Late
ncy
to fa
ll (s
econ
ds)
0
100
200
300 Wild-typeR6/1 transgenic
18 22 270
10
20
30(b) Novel object exploration
Tim
e ex
plor
ing
(sec
onds
)
Figure 1: Effect of genotype on behav-
ior in the R6/1 mouse.
All dataAll data
Probeset significantlydifferent between WT,
R6/1 P<0.001 N
Y
Behavior significantdifference betweenWT, R6/1 P<0.05
N
Y
Correlation analysis: allbehavior x probeset
combinations FDR < 0.05 N
Y
correlation
Regression modelingallowing for differences
between R6/1, WTInteraction term significant?
YTest for significant correlations
between behavior and geneexpression in WT, R6/1
separately
N
WT:-veR6/1: ns
WT:nsR6/1:-ve
WT:+veR6/1:-ve
WT:-veR6/1:+ve
WT:nsR6/1:+ve
WT:+veR6/1:ns
WT:-veR6/1:-ve
WT:+veR6/1:+ve
Bin 1 Bin 2 Bin 3 Bin 4 Bin 5 Bin 6 Bin 7 Bin 8
Figure 2: Flow diagram of analysis methods used to gener-
ate gene expression – behavior correlations. WT, wild type.
Genes, Brain and Behavior (2008) 7: 288–299 291
Gene expression and behavior in R6/1 mice
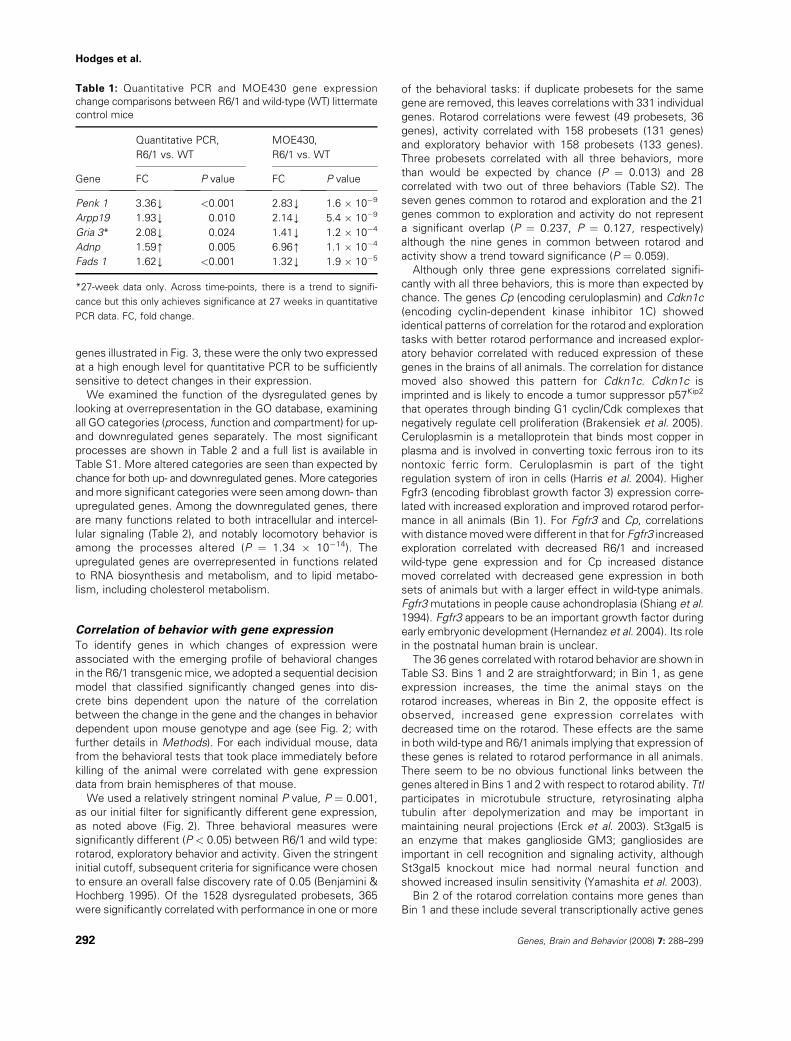
genes illustrated in Fig. 3, these were the only two expressed
at a high enough level for quantitative PCR to be sufficientlysensitive to detect changes in their expression.
We examined the function of the dysregulated genes bylooking at overrepresentation in the GO database, examining
all GO categories (process, function and compartment) for up-and downregulated genes separately. The most significant
processes are shown in Table 2 and a full list is available inTable S1. More altered categories are seen than expected by
chance for both up- and downregulated genes. More categoriesandmore significant categories were seen among down- than
upregulated genes. Among the downregulated genes, thereare many functions related to both intracellular and intercel-
lular signaling (Table 2), and notably locomotory behavior isamong the processes altered (P ¼ 1.34 � 10�14). The
upregulated genes are overrepresented in functions relatedto RNA biosynthesis and metabolism, and to lipid metabo-
lism, including cholesterol metabolism.
Correlation of behavior with gene expression
To identify genes in which changes of expression were
associated with the emerging profile of behavioral changesin the R6/1 transgenic mice, we adopted a sequential decision
model that classified significantly changed genes into dis-crete bins dependent upon the nature of the correlation
between the change in the gene and the changes in behaviordependent upon mouse genotype and age (see Fig. 2; with
further details in Methods). For each individual mouse, datafrom the behavioral tests that took place immediately before
killing of the animal were correlated with gene expressiondata from brain hemispheres of that mouse.
We used a relatively stringent nominal P value, P ¼ 0.001,as our initial filter for significantly different gene expression,
as noted above (Fig. 2). Three behavioral measures weresignificantly different (P < 0.05) between R6/1 and wild type:
rotarod, exploratory behavior and activity. Given the stringentinitial cutoff, subsequent criteria for significance were chosen
to ensure an overall false discovery rate of 0.05 (Benjamini &Hochberg 1995). Of the 1528 dysregulated probesets, 365
were significantly correlated with performance in one or more
of the behavioral tasks: if duplicate probesets for the samegene are removed, this leaves correlations with 331 individual
genes. Rotarod correlations were fewest (49 probesets, 36genes), activity correlated with 158 probesets (131 genes)
and exploratory behavior with 158 probesets (133 genes).Three probesets correlated with all three behaviors, more
than would be expected by chance (P ¼ 0.013) and 28correlated with two out of three behaviors (Table S2). The
seven genes common to rotarod and exploration and the 21genes common to exploration and activity do not represent
a significant overlap (P ¼ 0.237, P ¼ 0.127, respectively)although the nine genes in common between rotarod and
activity show a trend toward significance (P ¼ 0.059).Although only three gene expressions correlated signifi-
cantly with all three behaviors, this is more than expected bychance. The genes Cp (encoding ceruloplasmin) and Cdkn1c
(encoding cyclin-dependent kinase inhibitor 1C) showedidentical patterns of correlation for the rotarod and exploration
tasks with better rotarod performance and increased explor-atory behavior correlated with reduced expression of these
genes in the brains of all animals. The correlation for distancemoved also showed this pattern for Cdkn1c. Cdkn1c is
imprinted and is likely to encode a tumor suppressor p57Kip2
that operates through binding G1 cyclin/Cdk complexes that
negatively regulate cell proliferation (Brakensiek et al. 2005).Ceruloplasmin is a metalloprotein that binds most copper in
plasma and is involved in converting toxic ferrous iron to its
nontoxic ferric form. Ceruloplasmin is part of the tightregulation system of iron in cells (Harris et al. 2004). Higher
Fgfr3 (encoding fibroblast growth factor 3) expression corre-lated with increased exploration and improved rotarod perfor-
mance in all animals (Bin 1). For Fgfr3 and Cp, correlationswith distancemovedwere different in that for Fgfr3 increased
exploration correlated with decreased R6/1 and increasedwild-type gene expression and for Cp increased distance
moved correlated with decreased gene expression in bothsets of animals but with a larger effect in wild-type animals.
Fgfr3mutations in people cause achondroplasia (Shiang et al.1994). Fgfr3 appears to be an important growth factor during
early embryonic development (Hernandez et al. 2004). Its rolein the postnatal human brain is unclear.
The 36 genes correlated with rotarod behavior are shown inTable S3. Bins 1 and 2 are straightforward; in Bin 1, as gene
expression increases, the time the animal stays on therotarod increases, whereas in Bin 2, the opposite effect is
observed, increased gene expression correlates withdecreased time on the rotarod. These effects are the same
in both wild-type and R6/1 animals implying that expression ofthese genes is related to rotarod performance in all animals.
There seem to be no obvious functional links between thegenes altered in Bins 1 and 2with respect to rotarod ability. Ttl
participates in microtubule structure, retyrosinating alphatubulin after depolymerization and may be important in
maintaining neural projections (Erck et al. 2003). St3gal5 isan enzyme that makes ganglioside GM3; gangliosides are
important in cell recognition and signaling activity, althoughSt3gal5 knockout mice had normal neural function and
showed increased insulin sensitivity (Yamashita et al. 2003).Bin 2 of the rotarod correlation contains more genes than
Bin 1 and these include several transcriptionally active genes
Table 1: Quantitative PCR and MOE430 gene expression
change comparisons between R6/1 and wild-type (WT) littermate
control mice
Gene
Quantitative PCR,
R6/1 vs. WT
MOE430,
R6/1 vs. WT
FC P value FC P value
Penk 1 3.36Y <0.001 2.83Y 1.6 � 10�9
Arpp19 1.93Y 0.010 2.14Y 5.4 � 10�9
Gria 3* 2.08Y 0.024 1.41Y 1.2 � 10�4
Adnp 1.59[ 0.005 6.96[ 1.1 � 10�4
Fads 1 1.62Y <0.001 1.32Y 1.9 � 10�5
*27-week data only. Across time-points, there is a trend to signifi-
cance but this only achieves significance at 27 weeks in quantitative
PCR data. FC, fold change.
292 Genes, Brain and Behavior (2008) 7: 288–299
Hodges et al.

for instance Zfp28 and Sin3b, although when GO categories
are examined, proteins involved in transcriptional processesare significantly overrepresented in the genes upregulated
rather than downregulated in R6/1 brain. There is a subunit ofthe immunoproteasome and a mitochondrial thioesterase as
well as ceruloplasmin that may implicate mitochondrial pro-cesses in rotarod performance.
Bin 3 genes define a correlation pattern where decreases ingene expression in the wild-type animals correlate with
increased time on the rotarod, as in Bin 2. However, unlike
Bin 2, this effect is much less in the R6/1 animals, implyingthat those genes increased in expression in wild-type mice
might improve rotarod performance but that the ability to alter
the expression of these genes has been lost in R6/1 animals.Consistent with this observation, there are no genes that
show a significantly bigger decrease in R6/1 than wild-typeanimals correlated with increased rotarod performance (Bin
4). Genes in Bin 3 include two that are important in neuro-development and maintaining neuronal function, Adnp and
Nnat.Bin 5 contains genes that show decreased expression in
R6/1 animals and increased expression in wild-type animals
correlated with increased time on the rotarod. The genesnormally correlated with improved rotarod performance in
Figure 3: Correlation plots of behavior
against brain gene expression in R6/1
mice. These plots are for representative
genes from each of the Bins for the
rotarod-gene expression correlation. Each
point is the data for an individual mouse.
The dashed line represents the linear
regression of gene expression and behav-
ior for wild-type (WT) mice and the dotted
line that for R6/1 mice in each plot.
Genes, Brain and Behavior (2008) 7: 288–299 293
Gene expression and behavior in R6/1 mice

Table 2: Overrepresentation of GO processes in genes with altered expression in R6/1 mouse brain
GO number
No. of
probes
No. of correlated
probes P value Process
Downregulated genes
6816 207 24 0.00 Calcium ion transport
7186 823 62 0.00 G-protein coupled receptor protein signaling pathway
9968 75 16 0.00 Negative regulation of signal transduction
7242 864 58 5.55 � 10�17 Intracellular signaling cascade
6813 283 27 2.55 � 10�15 Potassium ion transport
7626 87 13 1.34 � 10�14 Locomotory behavior
7165 1576 82 1.18 � 10�13 Signal transduction
6836 88 12 3.50 � 10�12 Neurotransmitter transport
7218 144 16 5.16 � 10�12 Neuropeptide signaling pathway
7399 348 26 3.62 � 10�10 Nervous system development
7216 11 7 1.44 � 10�9 Metabotropic glutamate receptor signaling pathway
1764 155 15 1.89 � 10�9 Neuron migration
7409 111 11 1.34 � 10�7 Axonogenesis
6811 895 45 1.42 � 10�7 Ion transport
1558 147 13 1.89 � 10�7 Regulation of cell growth
6468 1293 56 2.76 � 10�6 Protein amino acid phosphorylation
46928 19 6 4.08 � 10�6 Regulation of neurotransmitter secretion
6937 37 7 2.59 � 10�5 Regulation of muscle contraction
46488 26 6 3.00 � 10�5 Phosphatidylinositol metabolism
8016 29 6 5.81 � 10�5 Regulation of heart contraction
42552 42 7 6.11 � 10�5 Myelination
16486 10 4 6.35 � 10�5 Peptide hormone processing
35050 22 5 1.53 � 10�4 Embryonic heart tube development
48514 23 5 1.92 � 10�4 Blood vessel morphogenesis
42755 13 4 2.04 � 10�4 Eating behavior
7264 476 23 2.84 � 10�4 Small GTPase-mediated signal transduction
7631 15 4 3.75 � 10�4 Feeding behavior
46777 75 8 4.59 � 10�4 Protein amino acid autophosphorylation
6887 94 9 4.63 � 10�4 Exocytosis
6695 58 7 4.87 � 10�4 Cholesterol biosynthesis
43154 16 4 4.90 � 10�4 Negative regulation of caspase activity
82 77 8 5.49 � 10�4 G1/S transition of mitotic cell cycle
16126 43 6 5.60 � 10�4 Sterol biosynthesis
6725 29 5 6.00 � 10�4 Aromatic compound metabolism
19222 17 4 6.29 � 10�4 Regulation of metabolism
7189 45 6 7.18 � 10�4 G-protein signaling, adenylate cyclase activating pathway
7267 104 9 9.67 � 10�4 Cell–cell signaling
1662 19 4 9.86 � 10�4 Behavioral fear response
Upregulated genes
16568 288 15 3.54 � 10�11 Chromatin modification
6955 443 17 3.96 � 10�8 Immune response
6350 3110 63 7.45 � 10�7 Transcription
7049 852 24 1.67 � 10�6 Cell cycle
6355 3917 74 1.99 � 10�6 Regulation of transcription, DNA dependent
51301 452 15 5.93 � 10�6 Cell division
6281 342 11 1.44 � 10�4 DNA repair
30301 10 3 1.67 � 10�4 Cholesterol transport
8630 11 3 2.28 � 10�4 DNA damage response, signal transduction resulting in
induction of apoptosis
2 11 3 2.28 � 10�4 Mitochondrial genome maintenance
294 Genes, Brain and Behavior (2008) 7: 288–299
Hodges et al.

mice appear to be downregulated in the R6/1 animals. Thesegenes include Bdnf and two genes involved in ubiquitin-
mediated protein degradation. Genes in Bin 6 are thosewhere increased expression in R6/1 brain is correlated with
increased time on the rotarod, but the reverse is true for wild-type animals where decreased expression correlates with
better performance on the rotarod. One interpretation is thatthere is increased expression of these genes in R6/1 brain to
compensate for other deficiencies and that this is unneces-sary in wild-type animals, which are physiologically normal.
These genes include some chaperone-type proteins, twoproteins involved in lipid metabolism and Ak5, which encodes
a protein responsible for regulating adenine-nucleotide phos-phate transfer, i.e. the proportions of high-energy intermedi-
ates in cells. Bin 8 contains only one known gene and thisencodes a subunit of Complex IV of the mitochondrial
electron transport chain. Increased gene expression of thisgene is correlated with increased time on the rotarod in wild-
type mice but no change in R6/1 expression. There are no
genes that show increased expression correlated withincreased time on the rotarod in R6/1 mice but no change in
gene expression in wild-type mice (Bin 7), which could reflectdirect compensatory changes.
Relatively few GO functions were significantly overrepre-sented in the rotarod correlated genes. This is almost
certainly because there are only 49 genes correlated withrotarod behavior. Table S4 shows the functions associated
with correlation of rotarod behavior including several protei-nases, and three genes that are related to energy metabolism
and oxidation, iron ion binding, nucleoside triphosphataseactivity and oxidoreductase activity.
There are far more genes correlated with performancein the exploration task than with the rotarod in the R6/1
animals (n ¼ 158: Table S5). The majority of these fall intoBins 1 and 2, where increased gene expression correlates
with increased exploration in wild-type and R6/1 animals, orwhere decreased gene expression correlates with
increased exploration in all animals (111/145, 77%). Thereare no genes in Bin 3 where decreased gene expression
correlates with increased time exploring with a biggereffect in wild-type animals although there are a small
number of genes in Bin 4 where there is a bigger effect inR6/1 animals. These genes are involved with cell polarity
and exocytosis. Genes that showed increased expressionin R6/1 and decreased expression in wild-type brain with
increased exploration include several glycosylated or gly-cosylating proteins. The opposite pattern in Bin 6 includes
Mgll, which is responsible for hydrolysis of triglycerides
and may indicate a need for increased energy metabolism inthe R6/1 animals. In Bin 7 with a similar pattern except no
change in wild-type expression, genes are related tocytoskeletal alterations and include Kalrn, which encodes
kalirin, a Hap1 interacting protein (Colomer et al. 1997) thatis required for the formation of dendritic spines (Rabiner
et al. 2005).More GO functions were correlated with exploratory
behavior than with rotarod activity, partly at least a conse-quence of having more genes correlated with this behavior
(Table S6). There are many categories relevant to intracellularand extracellular signaling activities, especially ion channels.
Like the rotarod, this behavior appears to be related to variouspeptidase activities although these are a different set of
degradative pathways.Like exploration, activity has a relatively large number of
correlated genes (n ¼ 158: Table S7). In contrast to explora-tion, however, Bins 1 and 2 contain proportionately fewer
genes (89/157, 56.7%) and there are more in Bins 3, 5, 6 and
7. Bin 3 includes genes that are decreased in expression withincreased distance moved with a significantly larger effect in
wild-type animals. Some of these genes are transcriptionallyactive, and some may relate to energy metabolism. Bin 5
contains most genes after Bins 1 and 2 (33 genes) whereincreased distance moved correlates with decreased gene
expression in R6/1 animals and increased gene expression inwild-type animals. These may be genes that are decreased in
the large batch of genes downregulated in R6/1 brain but thattend to lead to more activity when increased in the wild-type
animals. These include many intracellular signaling mole-cules, along with some effector molecules. Several transcrip-
tionally active proteins are altered and a couple of genesrelated to circadian rhythm, known to be altered in many HD
model animals (Morton et al. 2005a, 2005b). Genes increasedin R6/1 and decreased in wild-type animals fall into Bin 6. Here
too there are some transcriptionally active proteins as well asCbr1 that might be upregulated in response to the down-
regulation of Cbr3 (Bin 5) as these two genes have similarfunctions reducing carbonyls to hydroxyl groups and are
closely linked genetically (Hattori et al. 2000). These upregu-lations may be compensatory changes in R6/1 animals. Bin 7
may also contain genes upregulated in R6/1 animals asa compensatory change – these genes are increased in
R6/1 animals with increased distance moved but there is nochange in wild-type animals.
The GO functions associated with genes correlated withdistance moved include the major pathways that transduce
external signals in the cell, plus those involved in binding of
Table 2: Continued
GO number
No. of
probes
No. of correlated
probes P value Process
9048 12 3 3.01 � 10�4 Dosage compensation, by inactivation
of X chromosome
6974 363 11 3.34 � 10�4 Response to DNA damage stimulus
7067 243 10 5.31 � 10�4 Mitosis
Genes, Brain and Behavior (2008) 7: 288–299 295
Gene expression and behavior in R6/1 mice

effector molecules. There is also some evidence for alteredenergy metabolism at the level of gene expression.
Discussion
There is a widespread and substantial gene expressiondysregulation in human HD (Hodges et al. 2006) and in most
of the mouse models of the disease that have been examined(Chan et al. 2002; Luthi-Carter et al. 2000, 2002a, 2002b;
Zucker et al. 2005). Such models are being widely used todevelop potential therapeutics (Hersch & Ferrante 2004) but it
is not clear whether the behavioral tests currently used reflectthe complex signs of the human disease. These studies may
also identify biomarkers that underlie important behaviorsthat could be further developed to monitor disease progres-
sion. For example, increased ceruloplasmin expression isfound in the brains of these mice and correlates with poorer
behavioral performance. Ceruloplasmin has been found to beincreased in plasma and cerebrospinal fluid of Alzheimer’s
disease (AD) patients and may be a biomarker for progressionof degenerative processes (Hye et al. 2006).
The R6/1 mouse we used in these experiments shows adefect in rotarod performance by 18 weeks (van Dellen et al.
2000; Hansson et al. 2001). The deficit in R6/1 exploratoryactivity occurred later consistent with the results of Mazarakis
et al. (2005) who saw no differences between 10 and 14
weeks, in contrast to a previous report that showed differ-ences from 4 weeks (Bolivar et al. 2004). We did find changes
at 22 and 27 weeks. Differences in the testing protocol mayaccount for these discrepant findings. Mazarakis et al. (2005)
examined R6/1 behavioral changes at 10–14 weeks overa number of tasks including open field, rotarod and locomo-
tor activity and saw no differences by 14 weeks. We detecteda difference in activity measured by distance moved that
was significant at 18 weeks. Several other tasks showed nodeficit at all over the time–course of the experiment imply-
ing that the deficits in behavior onset at different ages in broadagreement with the previously published work in this line (van
Dellen et al. 2000; Mazarakis et al. 2005; Spires et al. 2004) andin R6/2 mice (Carter et al. 1999; Lione et al. 1999).
The gene expression profiles of the R6/1 mouse weresimilar to those seen in the R6/2 mouse (Luthi-Carter et al.
2002a; Morton et al. 2005a) although occurring later, asexpected for this line with delayed appearance of deficits
and longer life span (Mangiarini et al. 1996). We used brainhemisphere homogenates to generate gene expression data
so we are only seeing the largest alterations: changes thatoccur in selected neuronal populations or are regionally
restricted will not be detected. However, in the R/6 lines,the expanded repeat in the transgene causes a widespread
pathology that appears not to be striatum specific (Li et al.1999; Morton et al. 2000), and gene expression alterations
have substantial overlaps in different brain areas assayed(Luthi-Carter et al. 2002a), so changes in gene expression are
likely to occur widely throughout the brain. Gene expressiondifferences based on R6/2 whole brain samples (Morton et al.
2005a) correlate well both with those seen in only thestriatum (Luthi-Carter et al. 2002a) and with those seen in
these R6/1 whole brain homogenates. This consistency
corroborates our use of whole brain samples to correlategene expression with behavioral changes in the present
experiment.One notable feature was that more genes correlated with
exploratory behavior and activity than with the rotarod task.This was not simply attributable to greater intrinsic variability
or unreliability in the individual animals’ scores on the rotarodtest because the proportional standard errors of measure-
ment were within similar ranges to those observed on theother tests, and variance ratios of both main effects and
interactions on this test exceeded those calculated on any ofthe other tests. It is likely therefore that this reflects some
neurological differences between the tasks. Whereas therotarod drives a ‘forced’ motor skill, the exploration and
locomotor activity tests have a much higher ‘voluntary’component, which are correspondingly likely to recruit more
diverse brain circuits in the decision and selection of appro-priate actions.
Genes correlated with rotarod performance notablyinclude those related to protein degradation and oxidative
activity and may reflect compensatory changes to increaseprotein clearance and energy production, both altered in HD
and HDmodels (Cui et al. 2006; Lin & Beal 2006; Rubinsztein2006). The association of these genes with rotarod perfor-
mance may reflect the increased motor control required forsuccessful rotarod balance, on which the transgenic mice
show early deficits. The genes correlated with activity and
exploration are largely different genes from those correlatedwith rotarod performance, as well as different from each other,
and more likely reflect the different motivational and cognitiveprocesses associated with generalized voluntary activity, and
the exploration of familiar environments and novel objects. TheGO analysis shows a common alteration in signaling. For
activity, these processes relate to the major intracellular path-ways that transduce extracellular-ligand-activated signals. In
contrast, for the exploration task, similar pathways are over-represented but several of these are ion channels implying
activation of effector pathways in the brain.One interesting observation is that Bdnf expression
changes only correlate with rotarod activity. Bdnf expressionis mediated by the wild-type huntingtin protein but this
activity is lost from the mutant protein and Bdnf expressionreduced (Zuccato et al. 2001, 2003). Bdnf transport is also
reduced (Gauthier et al. 2004) and the removal of neuro-trophic support contributes to neurodegeneration. In R6/1
mice, Bdnf protein levels are severely decreased in thehippocampus and striatum by 5 months and this can be
rescued by enriching the mouse environment (Spires et al.2004). The mice in our study had some enrichment of their
home cages as part of their standard husbandry (cardboardtubes and paper were provided). The rescue of the Bdnf
deficit by enrichment in R6/1 animals gave improved perfor-mance on the rotarod and this is entirely consistent with our
results. Crossing R6/1 animals with Bdnfþ/� mice markedlyreduced the age at which deficits in rotarod performance
appeared (Canals et al. 2004) although no deficits were seenin the heterozygous Bdnfþ/� control animals and the perfor-
mance of the R6/1x Bdnfþ/� animals in other tasks wasunimpaired. We also find no correlation with the other tasks
we used where performance appears to correlate with other
296 Genes, Brain and Behavior (2008) 7: 288–299
Hodges et al.
factors. Bdnfþ/� mice have abnormalities of eating behaviorand locomotor activity (Kernie et al. 2000) and a recent report
of a subject with haploinsufficiency of the BDNF geneshowed a similar pattern with obesity and hyperactivity and
some cognitive deficits (Gray et al. 2006). Thus, the pheno-type of the HD model mice is unlikely to be accounted for
simply by Bdnf deficits.P57Kip2 has been shown to promote differentiation of
dopaminergic neurons, through cofactor binding to the tran-scription factor Nurr1 (Joseph et al. 2003). This activity is likely
to be important for dopamine synthesis and storage. It ispossible the link between ceruloplasmin and the behaviors
measured in this study could be through its crucial role inbinding copper that has previously been shown to affect the
dopamine and the GABA systems of the basal ganglia andsubsequent control of movement. Higher levels of expression
correlated with poorer behavior measures seen in the currentstudy for ceruloplasmin and p57Kip2 may reflect an attempt by
the cell to boost their activity to improve motor behavior,which cannot be realized as a result of a deficit in response
elsewhere in the molecular cascade. Consistent with theresults here, Cp and Cdkn1c were also increased in early-
stage postmortem HD caudate (Hodges et al. 2006).The correlational analysis conducted here establishes asso-
ciations between changes in gene expression and in behavior.As such, it cannot establish causative relationships, although
many of the demonstrated correlations are suggestive. This
approach has been successfully applied in drosophila wherea correlation analysis of survival after nicotine exposure and
altered gene expression showed the gene encoding ornithineaminotransferase to be most highly correlated with nicotine
resistance (Passador-Gurgel et al. 2007). Subsequent experi-ments showed that ornithine and GABA levels modified
survival times indicating the functional nature of the observedcorrelation.
It is also likely that complex compensatory changes are inoperation; indeed, our results show some evidence that
compensatory changes are occurring. Nevertheless, wehave examined a global readout of the transcriptional
activity of the brain and have detected a pool of geneswhose transcriptional activity may affect that behavior.
There are transcription factors and transcriptional modula-tory proteins that correlate with individual behaviors but it is
difficult to link these directly to the gene expressionchanges observed. We were surprised how few genes
there were in common between the different correlations.This, too, indicates that specific groups of genes may have
co-ordinated expression that gives rise to particular re-sponses in animals and suggests a variety of molecular
targets for further more detailed analysis. This workstrongly supports the use of multiple behavioral readouts
in HD models and tasks that examine different aspects ofthe behavioral phenotype should be included in any behav-
ioral battery that examines the effect of potential therapeu-tic interventions.
References
Bates, G., Harper, P.S. & Jones, L. (2002) Huntington’s Disease,3rd Edn. OUP, Oxford.
Bates, G.P. & Murphy, P.S.J. (2002) Mouse models of Huntington’sdisease. In Bates, G., Harper, P. & Jones, L. (eds), Huntington’sDisease. OUP, Oxford, pp. 387–426.
Beal, M.F. & Ferrante, R.J. (2004) Experimental therapeutics intransgenic mouse models of Huntington’s disease. Nat Rev Neuro-sci 5, 373–384.
Benjamini, Y. & Hochberg, Y. (1995) Controlling the false discoveryrate: a practical and powerful appraoch to multiple testing. J RStatist Soc B 57, 289–300.
Bolivar, V.J., Manley, K. & Messer, A. (2004) Early exploratorybehavior abnormalities in R6/1 Huntington’s disease transgenicmice. Brain Res 1005, 29–35.
Bolstad, B.M., Collin, F., Brettschneider, J., Simpson, K., Cope, L.,Irizarry, R. & Speed, T.P. (2005) Quality assessment of AffymetrixGeneChip data. In Gentleman, R., Carey, V., Huber, W., Irizarry, R. &Dutoit, S. (eds), Bioinformatics and Computational Biology Solu-tions Using R and Bioconductor. Springer, Heidelberg, pp. 33–48.
Brakensiek, K., Langer, F., Kreipe, H. & Lehmann, U. (2005) Absenceof p21CIP1, p27KIP1 and p57KIP2 methylation in MDS and AML.Leukemia Res 29, 1357–1360.
Brooks, S.P., Pask, T., Jones, L. & Dunnett, S.B. (2004a) Behaviouralprofiles of inbred mouse strains used as transgenic backgrounds. I:motor tests. Genes Brain Behav 3, 206–215.
Brooks, S.P., Pask, T., Jones, L. & Dunnett, S.B. (2004b) Behaviouralprofiles of inbred mouse strains used as transgenic backgrounds. I:motor tests. Genes Brain Behav 3, 206–215.
Canals, J.M., Pineda, J.R., Torres-Peraza, J.F., Bosch, M., Martin-Ibanez, R., Munoz, M.T., Mengod, G., Ernfors, P. & Alberch, J.(2004) Brain-derived neurotrophic factor regulates the onset andseverity of motor dysfunction associated with enkephalinergicneuronal degeneration in Huntington’s disease. J Neurosci 24,7727–7739.
Carter, R.J., Lione, L.A., Humby, T., Mangiarini, L., Mahal, A., Bates,G.P., Dunnett, S.B. & Morton, A.J. (1999) Characterization ofprogressive motor deficits in mice transgenic for the humanHuntington’s disease mutation. J Neurosci 19, 3248–3257.
Chan, E.Y.W., Luthi-Carter, R., Strand, A., Solano, S.M., Hanson, S.A.,DeJohn, M.M., Kooperberg, C., Chase, K.O., DiFiglia, M., Young,A.B., Leavitt, B.R., Cha, J.-H.J., Aronin, N., Hayden, M.R. & Olson,J.M. (2002) Increased huntingtin protein length reduces the num-ber of polyglutamine-induced gene expression changes in mousemodels of Huntington’s disease. Hum Mol Genet 11, 1939–1951.
Colomer, V., Engelender, S., Sharp, A.H., Duan, K., Cooper, J.K.,Lanahan, A., Lyford, G., Worley, P. & Ross, C.A. (1997) Huntingtin-associated protein 1 (HAP1) binds to a Trio-like polypeptide, witha rac1 guanine nucleotide exchange factor domain. HumMol Genet6, 1519–1525.
Cui, L., Jeong, H., Borovecki, F., Parkhurst, C.N., Tanese, N. & Krainc,D. (2006) Transcriptional repression of PGC-1[alpha] by mutanthuntingtin leads to mitochondrial dysfunction and neurodegenera-tion. Cell 127, 59–69.
Davies, S.W., Turmaine, M., Cozens, B.A., DiFiglia, M., Sharp, A.H.,Ross, C.A., Scherzinger, E., Wanker, E.E., Mangiarini, L. & Bates,G.P. (1997) Formation of neuronal intranuclear inclusions underliesthe neurological dysfunction in mice transgenic for the HD muta-tion. Cell 90, 537–548.
van Dellen, A., Blakemore, C., Deacon, R., York, D. & Hannan, A.J.(2000) Delaying the onset of Huntington’s in mice. Nature 404,721–722.
Desplats, P.A., Kass, K.E., Gilmartin, T., Stanwood, G.D., Woodward,E.L., Head, S.R., Sutcliffe, J.G. & Thomas, E.A. (2006) Selectivedeficits in the expression of striatal-enriched mRNAs in Hunting-ton’s disease. J Neurochem 96, 743–757.
Erck, C., MacLeod, R.A. & Wehland, J. (2003) Cloning and genomicorganization of the TTL gene on mouse chromosome 2 and humanchromosome 2q13. Cytogenet Genome Res 101, 47–53.
Gauthier, L.R., Charrin, B.C., Borrell-Pages, M., Dompierre, J.P.,Rangone, H., Cordelieres, F.P., De Mey, J., MacDonald, M.E.,Lemann, V., Humbert, S. & Saudou, F. (2004) Huntingtin controlsneurotrophic support and survival of neurons by enhancing BDNFvesicular transport along microtubules. Cell 118, 127–138.
Gautier, L., Cope, L., Bolstad, B.M. & Irizarry, R.A. (2004) affy –analysis of Affymetrix GeneChip data at the probe level. Bioinfor-matics 20, 307–315.
Genes, Brain and Behavior (2008) 7: 288–299 297
Gene expression and behavior in R6/1 mice
Gray, J., Yeo, G.S.H., Cox, J.J., Morton, J., Adlam, A.-L.R., Keogh,J.M., Yanovski, J.A., El Gharbawy, A., Han, J.C., Tung, Y.C.L.,Hodges, J.R., Raymond, F.L., O’Rahilly, S. & Farooqi, I.S. (2006)Hyperphagia, severe obesity, impaired cognitive function, andhyperactivity associated with functional loss of one copy of thebrain-derived neurotrophic factor (BDNF) gene. Diabetes 55,3366–3371.
Hansson, O., Castilho, R.F., Korhonen, L., Lindholm, D., Bates, G.P. &Brundin, P. (2001) Partial resistance to malonate-induced striatalcell death in transgenic mouse models of Huntington’s disease isdependent on age and CAG repeat length. J Neurochem 78,694–703.
Harris, Z.L., Davis-Kaplan, S.R., Gitlin, J.D. & Kaplan, J. (2004) A fungalmulticopper oxidase restores iron homeostasis in aceruloplasmi-nemia. Blood 103, 4672–4673.
Hattori, M., Fujiyama, A., Taylor, T.D. et al. (2000) The DNA sequenceof human chromosome 21. Nature 405, 311–319.
Hernandez, R.E., Rikhof, H.A., Bachmann, R. & Moens, C.B. (2004)vhnf1 integrates global RA patterning and local FGF signals to directposterior hindbrain development in zebrafish. Development 131,4511–4520.
Hersch, S.M. & Ferrante, R.J. (2004) Translating therapies forHuntington’s disease from genetic animal models to clinical trials.NeuroRx 1, 298–306.
Hodges, A., Strand, A.D., Aragaki, A.K. et al. (2006) Regional andcellular gene expression changes in human Huntington’s diseasebrain. Hum Mol Genet 15, 965–977.
Hye, A., Lynham, S., Thambisetty, M. et al. (2006) Proteome-basedplasma biomarkers for Alzheimer’s disease. Brain 129, 3042–3050.
Irizarry, R.A., Hobbs, B., Collin, F., Beazer-Barclay, Y.D., Antonellis,K.J., Scherf, U. & Speed, T.P. (2003) Exploration, normalization, andsummaries of high density oligonucleotide array probe level data.Biostat 4, 249–264.
Joseph, B., Wallen-Mackenzie, A., Benoit, G., Murata, T., Joodmardi,E., Okret, S. & Perlmann, T. (2003) p57Kip2 cooperates with Nurr1in developing dopamine cells. PNAS 100, 15619–15624.
Kernie, S.G., Liebl, D.J. & Parada, L.F. (2000) BDNF regulates eatingbehavior and locomotor activity in mice. Embo J 19, 1290–1300.
Li, H., Li, S.H., Cheng, A.L., Mangiarini, L., Bates, G.P. & Li, X.J. (1999)Ultrastructural localization and progressive formation of neuropilaggregates in Huntington’s disease transgenic mice. HumMolGenet 8, 1227–1236.
Lin, M.T. & Beal, M.F. (2006) Mitochondrial dysfunction and oxidativestress in neurodegenerative diseases. Nature 443, 787–795.
Lione, L.A., Carter, R.J., Hunt, M.J., Bates, G.P., Morton, A.J. &Dunnett, S.B. (1999) Selective discrimination learning impairmentsin mice expressing the human Huntington’s disease mutation.J Neurosci 19, 10428–10437.
Luthi-Carter, R., Strand, A., Peters, N.L., Solano, S.M., Hollingsworth,Z.R., Menon, A.S., Frey, A.S., Spektor, B.S., Penney, E.B., Schilling,G., Ross, C.A., Borchelt, D.R., Tapscott, S.J., Young, A.B., Cha, J.H. &Olson, J.M. (2000) Decreased expression of striatal signaling genesin a mouse model of Huntington’s disease. Hum Mol Genet 9,1259–1271.
Luthi-Carter, R., Hanson, S.A., Strand, A.D., Bergstrom,D.A., Chun,W.,Peters, N.L., Woods, A.M., Chan, E.Y., Kooperberg, C., Krainc, D.,Young, A.B., Tapscott, S.J. & Olson, J.M. (2002a) Dysregulation ofgene expression in the R6/2 model of polyglutamine disease: parallelchanges in muscle and brain. Hum Mol Genet 11, 1911–1926.
Luthi-Carter, R., Strand, A.D., Hanson, S.A., Kooperberg, C., Schilling, G.,La Spada, A.R., Merry, D.E., Young, A.B., Ross, C.A., Borchelt, D.R. &Olson, J.M. (2002b) Polyglutamine and transcription: gene expressionchanges shared by DRPLA and Huntington’s disease mouse modelsreveal context-independent effects. Hum Mol Genet 11, 1927–1937.
Mangiarini, L., Sathasivam, K., Seller, M., Cozens, B., Harper, A.,Hetherington, C., Lawton, M., Trottier, Y., Lehrach, H., Davies,S.W. & Bates, G.P. (1996) Exon 1 of the HD gene with an expandedCAG repeat is sufficient to cause a progressive neurologicalphenotype in transgenic mice. Cell 87, 493–506.
Mazarakis, N.K., Cybulska-Klosowicz, A., Grote, H., Pang, T., VanDellen, A., Kossut, M., Blakemore, C. & Hannan, A.J. (2005)Deficits in experience-dependent cortical plasticity and sensory--discrimination learning in presymptomatic Huntington’s diseasemice. J Neurosci 25, 3059–3066.
Morton, A.J., Lagan, M.A., Skepper, J.N. & Dunnett, S.B. (2000)Progressive formation of inclusions in the striatum and hippocam-pus of mice transgenic for the human Huntington’s diseasemutation. J Neurocytol 29, 679–702.
Morton, A.J., Hunt, M.J., Hodges, A.K., Lewis, P.D., Redfern, A.J.,Dunnett, S.B. & Jones, L. (2005a) A combination drug therapyimproves cognition and reverses gene expression changes ina mouse model of Huntington’s disease. Eur J Neurosci 21,855–870.
Morton, A.J., Wood, N.I., Hastings, M.H., Hurelbrink, C., Barker, R.A. &Maywood, E.S. (2005b) Disintegration of the sleep-wake cycleand circadian timing in Huntington’s disease. J Neurosci 25,157–163.
Passador-Gurgel, G., Hsieh, W.-P., Hunt, P., Deighton, N. & Gibson,G. (2007) Quantitative trait transcripts for nicotine resistance inDrosophila melanogaster. Nat Genet 39, 264–268.
Rabiner, C.A., Mains, R.E. & Eipper, B.A. (2005) Kalirin: a dual Rhoguanine nucleotide exchange factor that is so much more than thesum of its many parts. Neuroscientist 11, 148–160.
Rubinsztein, D.C. (2006) The roles of intracellular protein-degradationpathways in neurodegeneration. Nature 443, 780–786.
Shiang, R., Thompson, L.M., Zhu, Y.-Z., Church, D.M., Fielder, T.J.,Bocian, M., Winokur, S.T. & Wasmuth, J.J. (1994) Mutations in thetransmembrane domain of FGFR3 cause the most commongenetic form of dwarfism, achondroplasia. Cell 78, 335–342.
Smyth, G.K. (2004) Linear models and empirical Bayes methods forassessing differential expression in micorarray experiments. StatMeth Genet Mol Biol 3, Article 3.
Spires, T.L., Grote, H.E., Varshney, N.K., Cordery, P.M., van Dellen, A.,Blakemore, C. & Hannan, A.J. (2004) Environmental enrichmentrescues protein deficits in a mouse model of Huntington’s disease,indicating a possible disease mechanism. J Neurosci 24, 2270–2276.
Trueman, R.C., Brooks, S.P., Jones, L. & Dunnett, S.B. (2007) Theoperant serial implicit learning task reveals early onset motorlearning deficits in the HdhQ92 knock-in mouse model of Hunting-ton’s disease. Eur J Neurosci 25, 551–558.
Vonsattel, J.P., Myers, R.H., Stevens, T.J., Ferrante, R.J., Bird, E.D. &Richardson, E.P. Jr. (1985) Neuropathological classification ofHuntington’s disease. J Neuropathol Exp Neurol 44, 559–577.
Yamashita, T., Hashiramoto, A., Haluzik, M., Mizukami, H., Beck, S.,Norton, A., Kono, M., Tsuji, S., Daniotti, J.L., Werth, N., Sandhoff,R., Sandhoff, K. & Proia, R.L. (2003) Enhanced insulin sensitivity inmice lacking ganglioside GM3. PNAS 100, 3445–3449.
Zuccato, C., Ciammola, A., Rigamonti, D., Leavitt, B.R., Goffredo, D.,Conti, L., MacDonald, M.E., Friedlander, R.M., Silani, V., Hayden,M.R., Timmusk, T., Sipione, S. & Cattaneo, E. (2001) Loss ofhuntingtin-mediated BDNF gene transcription in Huntington’s dis-ease. Science 293, 493–498.
Zuccato, C., Tartari, M., Crotti, A., Goffredo, D., Valenza, M., Conti, L.,Cataudella, T., Leavitt, B.R., Hayden, M.R., Timmusk, T., Rigamonti,D. & Cattaneo, E. (2003) Huntingtin interacts with REST/NRSF tomodulate the transcription of NRSE-controlled neuronal genes. NatGenet 35, 76–83.
Zucker, B., Luthi-Carter, R., Kama, J.A., Dunah, A.W., Stern, E.A., Fox,J.H., Standaert, D.G., Young, A.B. & Augood, S.J. (2005) Transcrip-tional dysregulation in striatal projection- and interneurons in amousemodel of Huntington’s disease: neuronal selectivity and potentialneuroprotective role of HAP1. Hum Mol Genet 14, 179–189.
Acknowledgments
This work was funded by the BBSRC, HighQ foundation and theHereditary Disease Foundation. We thank Poly Cheng for mousegenotyping. The authors declare that they have no conflicts ofinterest.
Supplementary material
The following supplementary material is available for this
article:
298 Genes, Brain and Behavior (2008) 7: 288–299
Hodges et al.

Table S1. Overrepresentation of GO processes in geneswith altered expression in R6/1 mouse brain.
Table S2. Genes correlated with more than one significantbehaviour in R6/1 mice.
Table S3. Gene expression changes in R6/1 and wild typelittermate brains correlated with rotorod performance.
Table S4. Gene ontology categories significantly over-represented amongst genes correlated with the three behav-
ioural tasks.Table S5. Gene expression changes in R6/1 and wild-type
littermate brains correlated with initial exploration (4 h).
Table S6. Gene expression changes in RG/1 and wild-typelittermate brains correlated with distance moved (30 min).
This material is available as part of the online article fromhttp://www.blackwell-synergy.com/doi/abs/10.1111/j.1601-
183X.2007.00350.x(This link will take you to the article abstract).
Please note Blackwell Publishing are not responsible forthe content or functionality of any supplementary materials
supplied by the authors. Any queries (other than missingmaterial) should be directed to the corresponding author for
the article.
Genes, Brain and Behavior (2008) 7: 288–299 299
Gene expression and behavior in R6/1 mice