
Neural correlates of ‘pessimistic’ attitude in depression
12
Neural correlates of ‘pessimistic’ attitude in depression U. Herwig 1,2 *, A. B. Bru ¨ hl 1 , T. Kaffenberger 1,2 , T. Baumgartner 3,4 , H. Boeker 1 and L. Ja ¨ncke 3 1 Psychiatric University Hospital Zu ¨ rich, Switzerland 2 Department of Psychiatry, University of Ulm, Germany 3 Department of Neuropsychology, University of Zu ¨ rich, Switzerland 4 Institute for Empirical Research in Economics, University of Zu ¨ rich, Switzerland Background. Preparing for potentially threatening events in the future is essential for survival. Anticipating the future to be unpleasant is also a cognitive key feature of depression. We hypothesized that ‘ pessimism ’-related emotion processing would characterize brain activity in major depression. Method. During functional magnetic resonance imaging, depressed patients and a healthy control group were cued to expect and then perceive pictures of known emotional valences – pleasant, unpleasant and neutral – and stimuli of unknown valence that could have been either pleasant or unpleasant. Brain activation associated with the ‘ unknown ’ expectation was compared with the ‘ known ’ expectation conditions. Results. While anticipating pictures of unknown valence, activation patterns in depressed patients within the medial and dorsolateral prefrontal areas, inferior frontal gyrus, insula and medial thalamus were similar to activations associated with expecting unpleasant pictures, but not with expecting positive pictures. The activity within a majority of these areas correlated with the depression scores. Differences between healthy and depressed persons were found particularly for medial and dorsolateral prefrontal and insular activations. Conclusions. Brain activation in depression during expecting events of unknown emotional valence was comparable with activation while expecting certainly negative, but not positive events. This neurobiological finding is consistent with cognitive models supposing that depressed patients develop a ‘ pessimistic ’ attitude towards events with an unknown emotional meaning. Thereby, particularly the role of brain areas associated with the processing of cognitive and executive control and of the internal state is emphasized in contributing to major depression. Received 12 November 2008 ; Revised 26 May 2009 ; Accepted 16 July 2009 ; First published online 7 September 2009 Key words : Depression, emotion processing, functional neuroimaging, insula, pessimism, prefrontal cortex. Introduction Anticipation is a basic human cognitive function involving the preparation for future events (Gilbert & Wilson, 2007). As we do not know what the future holds, we prepare for expected events in order to deal with the associated pleasant or unpleasant outcome. To be able to cope, it makes sense to consider the worst-case scenario. This appears to be valid also from an evolutionary perspective, as our antecedents had a better chance to survive when they were prepared to cope, for instance, with predators or a hard winter. Thus, pessimism, meaning to expect the disadvan- tageous outcome when facing events of unknown emotional impact, seems to have positive facets (Nesse, 2000), such as diminishing of risk behaviour (Gibson & Sanbonmatsu, 2004) and avoidance of dis- appointment by setting low expectations (Norem & Cantor, 1986 ; Shepperd & McNulty, 2002). However, the overly pronounced expectation that the future will be unpleasant also represents a key cognitive feature in major depression (Pyszczynski et al. 1987 ; Lavender & Watkins, 2004). This is expressed in the concept of the cognitive triad which comprises a negative atti- tude towards oneself, the environment and the future (Beck, 1967). Recent reports have shown an altered emotion processing in depression compared with the healthy state concerning the perception and also the anticipation of emotional events (e.g. for reviews, see Drevets, 2001 ; Davidson et al. 2002 ; Phillips et al. 2003 ; Leppanen, 2006 ; for recent reports, see Keedwell et al. 2005; Abler et al. 2006 ; Johnstone et al. 2007; Langenecker et al. 2007; Lee et al. 2007 ; Dannlowski et al. 2008 ; Fales et al. 2008 ; Grimm et al. 2008 ; Knutson et al. 2008 ; Mitterschiffthaler et al. 2008). However, the * Address for correspondence : U. Herwig, M.D., M.A., Psychiatric University Hospital, University of Zu ¨ rich, Lenggstrasse 31, CH – 8032 Zu ¨ rich, Switzerland. (Email : [email protected]) Psychological Medicine (2010), 40, 789–800. f Cambridge University Press 2009 doi:10.1017/S0033291709991073 ORIGINAL ARTICLE
Transcript of Neural correlates of ‘pessimistic’ attitude in depression

Neural correlates of ‘pessimistic’ attitudein depression
U. Herwig1,2*, A. B. Bruhl1, T. Kaffenberger1,2, T. Baumgartner3,4, H. Boeker1 and L. Jancke3
1 Psychiatric University Hospital Zurich, Switzerland2 Department of Psychiatry, University of Ulm, Germany3 Department of Neuropsychology, University of Zurich, Switzerland4 Institute for Empirical Research in Economics, University of Zurich, Switzerland
Background. Preparing for potentially threatening events in the future is essential for survival. Anticipating the
future to be unpleasant is also a cognitive key feature of depression. We hypothesized that ‘pessimism’-related
emotion processing would characterize brain activity in major depression.
Method. During functional magnetic resonance imaging, depressed patients and a healthy control group were cued
to expect and then perceive pictures of known emotional valences – pleasant, unpleasant and neutral – and stimuli of
unknown valence that could have been either pleasant or unpleasant. Brain activation associated with the ‘unknown’
expectation was compared with the ‘known’ expectation conditions.
Results. While anticipating pictures of unknown valence, activation patterns in depressed patients within the medial
and dorsolateral prefrontal areas, inferior frontal gyrus, insula and medial thalamus were similar to activations
associated with expecting unpleasant pictures, but not with expecting positive pictures. The activity within a majority
of these areas correlated with the depression scores. Differences between healthy and depressed persons were found
particularly for medial and dorsolateral prefrontal and insular activations.
Conclusions. Brain activation in depression during expecting events of unknown emotional valence was comparable
with activation while expecting certainly negative, but not positive events. This neurobiological finding is consistent
with cognitive models supposing that depressed patients develop a ‘pessimistic ’ attitude towards events with an
unknown emotional meaning. Thereby, particularly the role of brain areas associated with the processing of cognitive
and executive control and of the internal state is emphasized in contributing to major depression.
Received 12 November 2008 ; Revised 26 May 2009 ; Accepted 16 July 2009 ; First published online 7 September 2009
Key words : Depression, emotion processing, functional neuroimaging, insula, pessimism, prefrontal cortex.
Introduction
Anticipation is a basic human cognitive function
involving the preparation for future events (Gilbert &
Wilson, 2007). As we do not know what the future
holds, we prepare for expected events in order to deal
with the associated pleasant or unpleasant outcome.
To be able to cope, it makes sense to consider the
worst-case scenario. This appears to be valid also from
an evolutionary perspective, as our antecedents had
a better chance to survive when they were prepared
to cope, for instance, with predators or a hard winter.
Thus, pessimism, meaning to expect the disadvan-
tageous outcome when facing events of unknown
emotional impact, seems to have positive facets
(Nesse, 2000), such as diminishing of risk behaviour
(Gibson & Sanbonmatsu, 2004) and avoidance of dis-
appointment by setting low expectations (Norem &
Cantor, 1986 ; Shepperd & McNulty, 2002). However,
the overly pronounced expectation that the future will
be unpleasant also represents a key cognitive feature
in major depression (Pyszczynski et al. 1987 ; Lavender
& Watkins, 2004). This is expressed in the concept of
the cognitive triad which comprises a negative atti-
tude towards oneself, the environment and the future
(Beck, 1967). Recent reports have shown an altered
emotion processing in depression compared with the
healthy state concerning the perception and also the
anticipation of emotional events (e.g. for reviews,
see Drevets, 2001; Davidson et al. 2002 ; Phillips et al.
2003 ; Leppanen, 2006 ; for recent reports, see Keedwell
et al. 2005; Abler et al. 2006; Johnstone et al. 2007 ;
Langenecker et al. 2007 ; Lee et al. 2007 ; Dannlowski
et al. 2008 ; Fales et al. 2008; Grimm et al. 2008 ; Knutson
et al. 2008 ; Mitterschiffthaler et al. 2008). However, the
* Address for correspondence : U. Herwig, M.D., M.A., Psychiatric
University Hospital, University of Zurich, Lenggstrasse 31, CH – 8032
Zurich, Switzerland.
(Email : [email protected])
Psychological Medicine (2010), 40, 789–800. f Cambridge University Press 2009doi:10.1017/S0033291709991073
ORIGINAL ARTICLE

direct comparison of anticipating events of known
positive and negative valence with an unknown
valence as a model of ‘pessimistic ’ expectation has
not yet been performed in depressed patients. In a
previous report in healthy subjects, we demonstrated
that in the case of expecting an event of unknown
emotional valence, emotion processing brain areas are
activated in a way that is comparable with the expec-
tation of an event known to be unpleasant but not with
that of an event known to be positive (Herwig et al.
2007b). Further, distinct activations in that study
correlated with individual depressiveness : the more
depressed, the higher the activity. This finding of a
‘pessimistic ’ bias towards expected unknown emo-
tional events may be interpreted as a neural correlate
of our propensity to prepare for a negative outcome.
Given this context, we hypothesized that patients with
major depression would show a ‘pessimistic ’ bias in
their brain activation as measured with functional
magnetic resonance imaging (fMRI), meaning a higher
activation in key brain regions during the expectation
of events with negative and unknown valence than
when expecting neutral or positive events. Those ac-
tivations also were assumed to be more prominent in
depressed patients compared with healthy subjects.
Apart from the regions found in the healthy subjects to
be related to ‘pessimism’, regions of key interest were
also those known to be affected in depression and
involved in planning and emotion processing, par-
ticularly the amygdala, dorsolateral prefrontal cortex
(DLPFC), medial prefrontal cortex (MPFC) and an-
terior cingulate cortex (ACC) (e.g. Baxter et al. 1989 ;
Fuster, 2000 ; Phillips et al. 2003 ; Paulus et al. 2005 ;
Vogt, 2005; Abler et al. 2006 ; Siegle et al. 2007; Knutson
et al. 2008).
Methods
Subjects
A total of 16 in-patients (14-included in analysis) with
a current diagnosis of a major depressive episode
were recruited at the Psychiatric University Hospital
of Zurich, Switzerland (for demographic and psycho-
metric data, see Table 1). A diagnosis of mildly to
moderately severe depressive episode was made
by trained psychiatrists according to ICD-10 and
DSM-IV criteria. Psychiatric Axis I and other co-
morbidities such as neurological disorders and MRI
contraindications were excluded in a semi-structured
interview prior to scanning. After receiving complete
description of the study, all participants gave writ-
ten informed consent. The study was approved by
the local ethics committee. The patients were on
stable antidepressant medication. They had been off
benzodiazepines and neuroleptics for at least four
half-lives, and they were not taking any mood-
stabilizingmedication. Thepatient groupwas analysed
on its own and it was additionally compared with
a group of 14 healthy subjects from a previous report
(Table 1; Herwig et al. 2007b).
Experimental design
During fMRI scanning, the patients performed a
cueing task (programmed with PresentationTM, Neuro-
behavioral Systems, USA) consisting of 56 trials with
expectation and presentation of emotional pictures
(Fig. 1). The trials comprised of two main conditions :
‘known’ or ‘unknown’. The ‘known’ condition con-
sisted of three subconditions (negative, positive,
neutral). For each trial of the ‘known’ subconditions a
small cue was presented that depicted either a smiling
‘^‘ (‘positive ’ or ‘pleasant ’, ps), a non-smiling ‘_‘
(‘negative ’ or ‘unpleasant ’, ng) or a neutral symbol
‘x‘ (nt) that indicated the emotional valence of the
pictures presented after an anticipation period. In the
‘unknown condition’, ‘ j‘ (uk), either pleasant or un-
pleasant pictures appeared randomly. The cues were
of 1/40 of screen height and the pictures filled the
screen. The cues were presented for 1000 ms followed
by an anticipation period of a further 6920 ms [cue and
Table 1. Demographic and psychometric data of included subjects
Depressed Healthy pa
n 14 14
Gender, n
Female 8 8
Male 6 6
Mean age, years (S.D.) 40.4 (10.7) 27.6 (3.6) <0.01
Episodes of
depression, n
1–3 9 –
>3 5 –
Mean scale scores (S.D.)
BDI 24.8 (9.9) –
HAMD 24.4 (7.2) –
MADRS 26.9 (8.1) –
SDS – 35.4 (6.6)
Mean picture
ratings (S.D.)
Negative 2.58 (0.61) 2.96 (1.35) 0.10
Positive 7.40 (0.85) 7.20 (1.25) 0.533
Neutral 5.22 (0.54) 5.10 (0.67) 0.51
S.D., Standard deviation ; BDI, Beck Depression
Inventory ; HAMD, Hamilton Depression Scale ; MADRS,
Montgomery–Asberg Depression Rating Scale ; SDS,
Self-rating Depression Scale (score<50 : not depressed).a Difference by t test.
790 U. Herwig et al.
anticipation : four times of MR volume repetitions ;
repetition time (TR) 1980 ms], during which a blank
screen with a small fixation point was shown. Sub-
sequently, emotional pictures (International Affective
Picture System; Lang, 1995) were presented for
7920 ms (4 TRs). During the following baseline period
of 15 840 ms (8 TR) the blood oxygen level-dependent
signal could wear off before the next trial. Altogether,
56 pre-cued pictures were shown, 14 for each ‘known’
trial as positive, negative and neutral, and 14 for ‘un-
known’ (seven ps, seven ng). The different trials ap-
peared in a randomized order. All participants were
instructed to expect the emotional stimuli after the cue
and to be aware of the emotional valence indicated,
and to subsequently look at the following picture. The
stimuli were matched for complexity, content of faces,
scenery, food and nature, and concerning intensity of
positive and negative valence with the same difference
in valence ratings from neutral. Arousal was matched
as far as possible for pleasant and unpleasant stimuli
(Herwig et al. 2007a). All participants rated the pres-
ented pictures after the scanning according to the
subjective valence on a visual analogue scale (1 most
negative, 9 most positive).
fMRI acquisition and data analysis
Imaging was performed with a 1.5 T Siemens Sonata
whole-body scanner (Erlangen, Germany) equipped
with a head coil. T1* weighted anatomical volumes
(1r1r1 mm) were acquired for co-registration with
the fMRI. T2* weighted functional magnetic resonance
images were obtained using echoplanar imaging in an
axial orientation (image size 64r64 pixels, 22 slices
covering the whole brain, field of view of 220 mm, flip
angle 90x, slice thickness 4 mm with 1 mm gap, voxel
size 3.4r3.4r5 mm, repetition time/echo time (TR/
TE) 1980/40 ms, 908 volumes). The subjects watched
the stimuli in a mirror attached to the head coil and
directed to a screen onto which the stimuli were pro-
jected by a video beamer.
fMRI data were analysed using BrainVoyagerTM
QX 1.8.6 (Brain Innovation, The Netherlands). Pre-
processing included motion correction, slice scan
time correction, high-frequency temporal filtering and
removal of linear trends. Functional images were
superimposed on the two-dimensional anatomical
images and incorporated into three-dimensional (3D)
datasets. The individual 3D datasets were transformed
into Talairach space (Talairach & Tournoux, 1988)
resulting in a voxel size of 3r3r3 mm and then
spatially smoothed with an 8 mm Gaussian kernel
for subsequent group analysis. Eight predictors rep-
resenting the expectation (exp) and presentation (pres)
of each valence (ng, uk, ps, nt) were used to build
the design matrix. Expectation period and picture
presentation periods were modelled as epochs using
the standard two-c haemodynamic response function
provided by BrainVoyager (Glover, 1999).
The fMRI data analysis based on the general
linear model (GLM) comprised of the following steps :
Fixed-effects analyses were calculated separately for
each subject for the six contrasts comparing the emo-
tion expectation conditions ‘negative versus neutral ’,
‘positive versus neutral ’, ‘unknown versus neutral ’,
‘unknown versus negative ’, ‘unknown versus positive ’
and ‘negative versus positive ’, resulting in summary
images. The summary images were subjected to
second-level analyses, separately for both the groups
of the depressed patients and of the healthy subjects.
Addressing our main question to evaluate which of
the ‘known’ emotion expectation conditions (ng, ps,
nt) revealed activations similar to those in the ‘un-
known’ expectation condition (uk), we applied con-
junction analyses based on the single contrasts. These
were done with fixed-effects conjunction analyses with
separate subject predictors in order to address the
Pleasant
Unpleasant
Neutral
Unknown
1000 ms
6920 ms
15840 ms
7920 ms
or
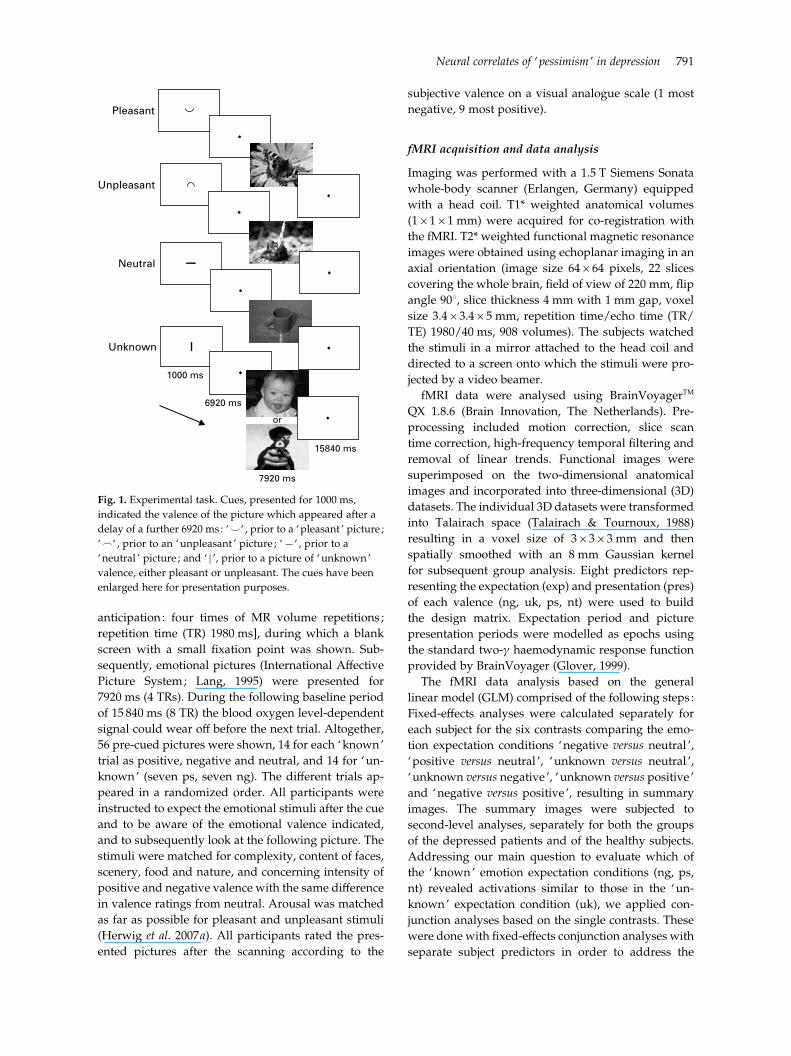
Fig. 1. Experimental task. Cues, presented for 1000 ms,
indicated the valence of the picture which appeared after a
delay of a further 6920 ms : ‘^‘ , prior to a ‘pleasant ’ picture ;
‘_‘ , prior to an ‘unpleasant ’ picture ; ‘x‘ , prior to a
‘neutral ’ picture ; and ‘ j ’, prior to a picture of ‘unknown’
valence, either pleasant or unpleasant. The cues have been
enlarged here for presentation purposes.
Neural correlates of ‘pessimism ’ in depression 791

minimum-t problem (Nichols et al. 2005). We defined
‘unknown’ expectation-related activity in a certain
brain region as being similar to one of the ‘known’
expectation-related activations, when in this region
both activations were significantly different from the
activations associated with both remaining ‘known’
emotion expectation conditions, but were not different
in the corresponding single contrast. For example,
addressing similarity of the ‘unknown’ and the
‘negative ’ condition, the ‘unknown’ condition had
to differ significantly from ‘positive ’- (contrast exp
uk>ps) and also ‘neutral ’ (exp uk>nt)-related ac-
tivity, and ‘negative ’ also had to differ from ‘positive ’
(exp ng>ps) and ‘neutral ’ (exp ng>nt) expectation-
related activity. These contrasts therefore also com-
prised the direct comparisons between the ‘known’
expectation conditions as ‘negative versus positive ’.
The revealed brain regions further should not differ in
the direct comparison, for instance when using the
contrast exp ng>uk.
Accordingly, the following conjunctions were ana-
lysed:
(1) The ‘pessimism-contrast ’ : expecting unknown
events to be negative should be reflected by ac-
tivity during exp uk resembling the activity during
exp ng, but differ from ps and nt : exp uk>ps and
uk>nt and ng>ps and ng>nt.
(2) The ‘optimism-contrast ’ : assuming the upcoming
unknown event to be positive, the brain activity
during the exp uk should be similar to the activity
during exp ps: exp uk>ng and uk>nt and ps>ng
and ps>nt.
(3) The ‘ indifference-contrast ’ : if subjects anticipate
‘unknown’, thus either positive or negative events,
like neutral events, brain activity might be similar
to the ‘neutral ’ expectation : exp uk>ng and
uk>ps and nt>ng and nt>ps.
The statistical threshold for these conjunctions was
set at a level of p<0.001 (uncorrected considering the
conjunction approach with the application of four
single contrasts together) with a cluster size of 135
voxels of 1r1r1 mm corresponding to 5 voxels of
3r3r3 mm. The results obtained from the healthy
subjects have been reported previously (Herwig et al.
2007b). For the depressed patients, further explorative
results with lower cluster size are reported when they
complied with the results from the healthy subject
group. An analysis of the presentation period and
main-effect analyses of emotion and expectation were
performed on an exploratory basis not reported here.
Questionnaires and correlation statistics
The patients completed a handedness questionnaire
(Annett, 1967) and a depression self-rating [Beck’s
Depression Inventory (BDI) ; Beck et al. 1961]. Further,
depressiveness was assessed by the 21-item Hamilton
Depression Scale (HAMD; Hamilton, 1960) and
the Montgomery–Asberg Depression Rating Scales
(MADRS; Montgomery & Asberg, 1979). Immediately
after scanning, the patients rated the emotional val-
ence of the pictures (presented again as printouts) on
a visual analogue scale. Using Pearson’s correlation,
we correlated the rating score results of the depression
scales with the individual b-weights (mean from all
voxels of the respective activated cluster) of the emo-
tion expectation conditions in those regions resulting
from the conjunction analyses. Thus, within the
regions of interest (ROIs) derived from the conjunc-
tion analyses, we correlated the different individual
b-weights of the emotion conditions in each ROI with
the individual psychometric data. In order to control
for an influence of age, we also correlated the
b-weights with the age in both groups, healthy and
depressed participants, and performed an exploratory
partial correlation analysis with age as the control
variable.
Comparison between depressed patients and
healthy subjects
Activations in depressed patients and healthy subjects
were compared. Within the activated clusters in the
depressed patients and in the healthy subjects ran-
dom-effects analyses of the ‘emotion versus neutral ’
contrasts were performed by using separate subject
predictors and implementing the factor of being de-
pressed or healthy in the GLM. Additionally, we ex-
plored group differences of the single contrasts in the
bilateral insula based on ROIs derived from the con-
trast ps>nt in the depressed patients in order to assess
whether failing to find hypothesized activations in the
‘pessimism’-contrast might be due to an activation
during the positive expectation.
Results
Participants and behavioural data
From the 16 depressed patients, one had to be ex-
cluded because of movement artefacts (>3 mm in at
least one direction) and one patient reported after
scanning that she had not been able to identify the
cues correctly. Thus, 14 depressed patients were en-
tered into the analysis. All were right-handed. They
were also compared with 14 healthy subjects (Herwig
et al. 2007b), who were younger than the patients.
The picture ratings were not different (Table 1).
Medication in the depressed patients included mirta-
zapin (15–45 mg, n=5), venlafaxin (75–150 mg, n=2),
792 U. Herwig et al.

citalopram/escitalopram (60/20 mg, n=2), citalopram/
escitalopram (20–40 mg) plus mirtazapin (30–60 mg)
(n=3), trazodone (100 mg, n=1) and no medication
(n=1).
Conjointly activated areas during ‘unknown ’ and
‘known ’ emotion expectation
We performed conjunction analyses to discover which
of the ‘known’ emotion expectation conditions re-
vealed activations similar to those in the ‘unknown’
condition. Regarding the comparison ‘negative ’ and
‘unknown’ in the depressed patients we found ac-
tivity within the MPFC [Brodmann area (BA) 8], left
DLPFC (BA 9/46), bilateral inferior frontal gyrus (IFG,
BA 45) and insula (BA 13), in a region adjacent to the
anterior thalamus and head of the caudate nucleus
best fitting the area comprising the bed nucleus of
the stria terminalis (BNST; being aware that this
structure is small for the applied fMRI resolution), in
the anterior and medial thalamus, and in the nucleus
ruber (NR; Table 2, Fig. 2). These areas were not
different in the direct contrast exp ng>uk in either
direction. The equivalent analyses of the relation
of ‘unknown’ and ‘positive ’ expectation (‘optimism-
contrast ’) and of ‘unknown’ and ‘neutral ’ expectation
(‘ indifference-contrast ’) did not deliver any results
even at a level of p<0.01 uncorrected. Other regions
such as the amygdala were active in the single emotion
expectation contrasts not reported here. Results
from the healthy subjects have been reported earlier
(Herwig et al. 2007b). In brief, activated areas in that
group in the ‘pessimism’-contrast were within the
right IFG, insular regions, medial thalamus, BNST re-
gion, NR and temporo-occipital cortex.
Correlation of brain activation with
depression ratings
The assumption was made that subjects with a higher
level of depressiveness may exert stronger activity in
areas associated with ‘unknown’ and ‘negative ’ ex-
pectation. We tested this by correlating psychometric
data obtained from the BDI, HAMD and MADRS with
the mean b-weights obtained from the significantly
activated clusters of the conjunction analyses (one BDI
missing). This analysis revealed significant positive
correlations in the MPFC, left DLPFC, IFG/insula
regions and NR during ‘unknown’ and ‘negative ’
expectation (Fig. 2, Table 2). We did not find any cor-
relation of the activations with age, neither in the de-
pressed, nor in the healthy group, and the exploratory
correlation analysis controlled for age provided es-
sentially equivalent results as without this control
variable.
Comparison between depressed patients and
healthy subjects
We compared the activity in the revealed clusters from
the conjunction analysis in the depressed patients with
the activations in healthy subjects (Fig. 3, Table 2).
Compared with the healthy subjects, depressed pa-
tients showed increased activations during both the
negative and unknown conditions in the left DLPFC
and anterior MPFC, and for the unknown conditions
also in the bilateral IFG/insular regions and left BNST.
Concerning regions activated in healthy subjects but
not in the patients, the right BNST (p=0.04) and left
insula (p=0.04) were more strongly activated in the
respective contrasts in the healthy subjects. The ex-
ploratory analysis of group differences in the single
contrasts within the ROIs based on the ps>nt contrast
found a stronger insular activation in the depressed
patients (see Supplementary Fig. 1, available online).
Discussion
Assuming a ‘pessimistic ’ attitude in depression when
expecting upcoming events, our hypothesis was that
patients with major depression would show brain ac-
tivation while expecting events of unknown emotional
valence as if these events are known to be unpleasant.
Further, we assumed that distinct emotion-processing
brain areas known to be affected in depression would
be activated differently compared with healthy sub-
jects. Our main findings were: (i) while anticipating
pictures of unknown emotional valence, the brain ac-
tivity resembled that observed when expecting pic-
tures known to be negative but not when expecting
positive or neutral pictures ; (ii) the activity within a
prominent part of the corresponding brain regions,
particularly within the DLPFC, MPFC and insula/IFG
correlated with the grade of depression ; and (iii) the
activation in these regions differed significantly from
that in healthy subjects. This supports the assumption
of considering a negative outcome for future scenarios
to form a key cognitive feature of depression with
distinct neural representations.
Brain regions involved in ‘pessimistic ’ expectation
Activations within the DLPFC and MPFC were as-
sociated with ‘pessimistic ’ expectation in depressed
patients, which was not the case in the healthy sub-
jects. Further, the activity in these areas correlated
with the depression scores : the more depressed, the
higher the activation. Notably, the activation of the
DLPFC differed between the groups in all, and in
the anterior MPFC in most of the contrasts. This pro-
vides evidence that the ‘pessimistic ’ expectation in
Neural correlates of ‘pessimism ’ in depression 793

Table 2. Conjunction analyses of emotion expectation contrasts, correlations of b-weights with rating scores, and comparison of depressed and healthy groups
Anatomic
regions
Depressed patients : uk and ng>ps and nta
Correlations (p)Groups : depressed v. healthy, Fig. 3, p
BA
Voxel
size,
mm3
Talairach
coordinates
(x, y, z) tmax
uk with
BDI
uk with
HAMD
uk with
MADRS
ng with
BDI
ng with
HAMD
ng with
MADRS Fig. ng>nt ng>ps uk>nt uk>ps
DLPFC L 46 1021 x39, 31, 29 4.0 0.68 0.73 0.60 0.68 0.65 0.55 2a 0.03 0.003 0.002 0.0001
(0.01) (0.003) (0.02) (0.01) (0.01) (0.04)
DLPFC/PMC L 6/9 2161 x46, 5, 36 4.6 0.72 0.71 0.63 0.73 0.72 0.59 0.11 0.06 0.08 0.02
(0.006) (0.005) (0.02) (0.005) (0.004) (0.03)
IFG L 45/46 932 x47, 20, 2 4.3 0.50 0.55 0.50 0.56 0.68 0.60 2b 0.005 0.04 0.03 0.25
(0.08) (0.04) (0.07) (<0.05) (0.008) (0.02)
IFG/insula R 45/13 709 41, 24, x2 4.3 0.65 0.40 0.54 0.66 0.40 0.54 0.42 0.13 0.80 0.37
(0.02) (0.16) (<0.05) (0.01) (0.15) (0.04)
Insula L 13 383 x31, 17, x9 4.2 0.35 0.15 0.22 0.16 0.07 0.03 0.22 0.19 0.007 0.03
(0.24) (0.60) (0.46) (0.60) (0.81) (0.91)
MPFC ant R/L 8 414 0, 32, 41 3.9 0.57 0.48 0.50 0.42 0.46 0.43 0.35 0.41 0.04 0.21
(0.04) (0.08) (0.07) (0.15) (<0.10) (0.12)
MPFC post R/L 8 512 1, 7, 54 4.3 0.53 0.60 0.56 0.66 0.65 0.58 0.64 0.06 0.32 0.04
(0.06) (0.02) (0.04) (0.01) (0.01) (0.03)
BNST region L 392 x11, 0, 12 4.5 0.37 0.28 0.14 0.68 0.53 0.49 0.71 0.11 0.82 0.01
(0.21) (0.33) (0.63) (0.01) (0.05) (0.08)
IFG Rb 45 37 40, 18, 10 3.7 0.62 0.67 0.54 0.64 0.59 0.57 2c 0.71 0.47 0.24 0.07
(0.02) (0.01) (0.04) (0.19) (0.03) (0.03)
Medial
thalamusb112 1, x14, 5 3.8 0.31 0.51 0.37 0.50 0.26 0.20 2d 0.11 0.67 0.18 0.23
(0.31) (0.06) (0.19) (0.08) (0.37) (0.49)
Nucleus
ruber Rb
29 8, x21, x10 3.9 0.69 0.57 0.53 0.56 0.58 0.46 2e 0.21 0.96 0.71 0.46
(0.009) (0.04) (0.06) (<0.05) (0.03) (<0.10)
uk, Unknown expectation ; ng, negative expectation ; ps, positive expectation ; nt, neutral expectation ; BA, Brodmann area ; BDI, Beck depression inventory ; HAMD, Hamilton
depression scale ; MADRS, Montgomery–Asberg depression rating scale ; DLPFC, dorsolateral prefrontal cortex ; L, left ; PMC, premotor cortex ; IFG, inferior frontal gyrus ; R, right ;
MPFC, medial prefrontal cortex ; ant, anterior ; post, posterior ; BNST, bed nucleus striae terminals.
On the right, results from the random-effects group comparison of activations within the regions of interest from the ‘pessimism’-contrast.a Activated regions according to the conjunction analysis of expectation ‘unknown’ and ‘negative ’ stimuli, both versus expecting ‘positive ’ and versus ‘neutral ’ stimuli. Indicated are :
the amount of voxels (mm3) ; Talairach coordinates (x, y, z) of the centre of mass of the activation ; and maximal t-values of the voxels within the regions.b Results from explorative analysis.
794U.Herw
igetal.

1.41.21.00.80.60.40.20.0
–0.210 20 30 40
HAMD
β r = 0.73, p=0.003
1.41.21.00.80.60.40.20.0
–0.210 20 30 40
HAMD
β
r = 0.55, p=0.04
1.21.00.80.60.40.20.0
–0.210 20 30 40
HAMD
β
r = 0.51, p=0.06
1.0
0.8
0.6
0.4
0.2
0.010 20 30 40
HAMD
β r = 0.57, p=0.035
1.0
0.8
0.6
0.4
0.2
0.0
–0.210 20 30 40
HAMD
β
r = 0.67, p=0.01
DLPFC Ly=29
COR8.00
3.30
R
IFG Ry=18
COR8.00
3.30
R
IFG Ly=20
COR8.00
3.30
R
COR8.00
3.30
R
COR8.00
3.30
R
Med Thaly=–14
NR Ry=–10
0.5 % signal change
0.5 % signal change
0.5 % signal change
0.5 % signal change
0.5 % signal change
Expectscan 1–4
Presentscan 5–8
Time courses:
Unknown
Neutral
Unpleasant
Pleasant
(a)
(b)
(c)
(d)
(e)
Fig. 2. Comparison of ‘known’ and ‘unknown’ expectation. Conjunction analysis of the conditions ‘unknown’ and
‘unpleasant ’ expectation versus ‘pleasant ’ and versus ‘neutral ’ (exp uk>ps and uk>nt and ng>nt and ng>ps). The activated
voxels were co-registered using structural magnetic resonance imaging and colour coded (consider cross-hair, see coloured
version of this figure in Supplementary online material) according to their significance (t-value). Presented are coronal (COR)
slices of (a) the left dorsolateral prefrontal cortex (DLPFC L), (b) the right inferior frontal gyrus (IFG R), (c) the left IFG (IFG L),
(d) the medial thalamus (Med Thal) and (e) the right nucleus ruber (NR R) and cut-outs of the axial slices of the thalamus
and NR R in the lower left of the respective pictures. Further, on the right, the time courses of the activities within the
marked regions of interest are shown in percentage BOLD signal change, indicating the conjoint activity of the ‘unpleasant ’
expectation with the ‘unknown’ expectation. The vertical grey bars represent the beginning of the expectation (Expect) and
presentation (Present) periods, comprising each four volumes. When interpreting the time courses, the delayed haemodynamic
response function has to be considered. Further, the correlations of the b-weights of the activity during the ‘unknown’
expectation condition with the Hamilton depression scores (HAMD) are presented.
Neural correlates of ‘pessimism ’ in depression 795

depression may be associated with the functional
domains of the DLPFC andMPFC as a final evaluation
of situations, response planning, and cognitive and
executive control (Fuster, 2000 ; Gross & John, 2003).
The DLPFC has been associated with hypometabolism
in depression (Soares & Mann, 1997), or with hypo-
functionality in cognitive tasks (Siegle et al. 2007),
possibly leading also to compensatory activation
(Harvey et al. 2005). One may assume that DLPFC re-
sources in depression might be absorbed due to a bias
towards depressive cognition by focusing on corre-
sponding situations and stimuli (Grimm et al. 2008),
for instance, due to a negative attitude towards future
events according to the cognitive triad (Beck, 1967).
This may be represented within neural network
concepts by information processing modules in the
DLPFC acting as attractors (Yuste et al. 2005) for de-
pressive cognition. We also found the MPFC to be ac-
tive during unknown and negative expectation, with
the ‘unknown’-related activity being more prominent
in depressed than in healthy subjects. Whereas the
DLPFC is involved in evaluating and preparing action
in the external world (Fuster, 2000), the MPFC was
reported to be involved in the cognitive control of
internal emotional processes (Gross & John, 2003 ;
Herwig et al. 2007a). It might be recruited in de-
pression in order to exert cognitive control onto sub-
cortical emotion-associated areas, possibly with an
ineffective compensatory over-activation. Basically,
a complex disturbance of the information processing
within and between functional systems for integrating
emotional–cognitive information is assumed (Pessoa,
2008). In this context, one may consider primary
modulating regions on emotion processing such as the
DLPFC or the amygdala working as ‘connector hubs’
for information processing (Sporns et al. 2007).
In our previous study with healthy subjects, we
found the IFG, insular regions and the medial thala-
mus to be associated with ‘pessimistic ’ expectation
(Herwig et al. 2007b). This was essentially also the case
in the depressed patients, with the exception that
certain insular regions revealed different activation
patterns. The IFG, in the region of the ventrolateral
prefrontal cortex, was assumed to represent multi-
modal sensory cues with high emotional salience
(Yamasaki et al. 2002) and to be involved in emotional–
cognitive integration (Mayberg, 2003). It may provide
a link between the evaluation of the internal state as-
sociated with an emotional situation and its cognitive
processing, for instance, by propagating ‘ internal ’ in-
formation to upstream prefrontal areas. Medial thal-
amic regions receive input from viscero-sensitive and
pain-mediating brainstem areas and are considered
to form a relay within the visceroceptive pathway
towards, for example, insular regions (Craig, 2002 ;
Vogt, 2005). The insula was found to be involved in
the processing of multimodal sensory and emotional
stimuli, supporting views of a general role of the
insula in emotion processing (Damasio et al. 2000 ;
Calder et al. 2001 ; Craig, 2002 ; Critchley et al. 2004 ;
Paulus & Stein, 2006 ; Simmons et al. 2008). It was
proposed that the physical sensation of emotional re-
sponses depends on sensations from the viscera re-
presented in the insula (Critchley et al. 2004). In this
context, the insula may be involved in the mediation of
bodily viscero-sensitive signals for decision making
and behavioural planning according to emotional va-
lences. We found activations in the depressed patients
during both the ‘unknown’ and the ‘negative ’ expec-
tation as hypothesized, but also increased activation
during the ‘positive ’ expectation compared with the
healthy subjects. This may be interpreted as an insular
β-W
eig
ht
0.6
0.5
0.4
0.3
0.2
0.1
0
–0.1
–0.2
*0.03 **0.002 **0.005 *0.03 0.22 **0.007 0.35 *0.04
exp ngDLPFC L
exp ukDLPFC L
exp ngMPFC
exp ukMPFC
exp ngIFG L
exp ukIFG L
exp ngIFG R
exp ukIFG R
Fig. 3. Comparison of activity in regions of interest (b-weights) in depressed patients ( ) compared with healthy subjects (%).
Values are means, with standard errors represented by vertical bars. For the different regions and conditions, p values are given
for the difference between the depressed and healthy subjects (* p<0.05, ** p<0.01). DLPFC L, left dorsolateral prefrontal cortex ;
exp uk, expectation unknown; exp ng, expectation negative ; MPFC, medial prefrontal cortex ; IFG L, left inferior frontal gyrus ;
IFG R, right inferior frontal gyrus.
796 U. Herwig et al.
‘unpleasantness ’-signal not only during ‘negative ’ or
‘unknown’ expectation but also during ‘positive ’ ex-
pectation, and may be associated with anhedonia
(Keedwell et al. 2005). Being depressed is often associ-
ated with unpleasant somatic feelings and a negative
self-perception. This may result from a dysregulation
of interoceptive areas such as the insula due to a mis-
interpretation of external cues based on unpleasant
previous experiences, inducing subjective unpleasant-
ness (Davidson et al. 2003). These considerations lead
to further concepts of the insula to be involved in
self-representation and ‘self-awareness ’ (Churchland,
2002 ; Craig, 2002) and to disturbed ‘self ’ functions in
depression (Northoff & Bermpohl, 2004).
At the brainstem level, we found, in both the de-
pressed and the healthy group, a region covering the
NR to be associated with ‘negative ’ and ‘unknown’
expectation. The NR has been assumed to be involved
in psychomotor modulation and in behavioural at-
tendance (Horn et al. 2002). During expectation, it may
prime or facilitate the readiness for a later motor re-
action.
Two main brain regions hypothesized as being as-
sociated with functional disturbance in depression
were not found to be activated in the ‘pessimism’-
contrast : the amygdala (e.g. Abler et al. 2006 ; Lee et al.
2007) and the ACC (Bermpohl et al. 2006 ; Nitschke
et al. 2006). For the amygdala, this might be explained
by the fact that it also showed activation during the
positive expectation condition (Herwig et al. 2007b)
and thus not fulfilling the criteria for the ‘pessimism’-
contrast but being more generally associated with
valence-independent emotional arousal (Anderson
et al. 2003; McClure et al. 2004). However, though
being difficult to distinguish anatomically, a region
covering and best fitting the bed nucleus of the stria
terminalis was activated in the ‘pessimism’-contrast.
This region was considered to form a functional
unit with the ‘extended’ amygdala (Heimer & Van
Hoesen, 2006) and may be a link to further emotion-
processing circuits. The ACCmay be activated more in
the context of conflict monitoring between functional
state and perceived new information with potential
affective or motivational consequences (Carter et al.
2000 ; Vogt, 2005) and not in the specific context of
‘pessimistic ’ expectation.
Principally, one may assume that a circuit for bias-
ing the organism towards potentially disadvantageous
or even dangerous events makes evolutionary sense.
Whenever we may also have an optimistic bias for
certain personal long-term attitudes towards the
future (Sharot et al. 2007), the chances of survival for
our early ancestors who for instance anticipated a
predator when hearing a rustling sound in the vicinity,
and prepared for it appropriately, were conceivably
higher than for those who did not. Hence, one may
speculate that a certain degree of depressiveness may
be of evolutionary advantage (Nesse, 2000 ; Panksepp,
2006), in that uncertain future events are more likely
to be evaluated as unpleasant and that the person is
better prepared for when negative events actually do
occur.
Limitations
In reflecting on possible limitations, we addressed the
issue of the differing age of both groups. Whenever
the main analysis of this report was based on the
depressed group, we also performed a group com-
parison with the healthy subjects. One may argue
that the higher activation in the depressed patients
might be accounted for by their higher age. This,
however, would be in contrast with findings of atten-
uated emotion processing-related brain activity with
increasing age (Erk et al. 2008). Furthermore, age-
dependence is unlikely in view of the fact that the
activations correlated with depressiveness, but not
with age, which would have been the case if age had
an influence on the activation. The same holds true for
the medication in the depressed patients. The fact of
being medicated does not explain the correlations with
psychopathology, such that depressiveness, not age
or medication, can be accounted for by our results.
Nevertheless, our findings should be interpreted as
applying to medicated patients because any influence
of medication on activations cannot be excluded
entirely.
Emotional arousal (McClure et al. 2004) or experi-
ence of uncertainty (Simmons et al. 2008) may also
contribute to the revealed activation. However, again,
the correlations with depressiveness point to an as-
sociation of the activation with depression and not to
these factors. Further, valence-independent arousal
would also have occurred through positive expec-
tation and thus would have led to non-fulfilling
the criteria of ‘pessimism’. Nevertheless, uncertainty
and heightened arousal towards unpleasant events
might be inherent factors for ‘pessimistic ’ expectation
(Simmons et al. 2008).
The experimental task was designed to focus
on the mental process during expectation. Therefore,
the highly abstract and graphically comparable cues
were intuitively understandable, so that no prominent
working memory component was necessary to estab-
lish their meaning. Further, no motor reaction was re-
quired, the preparation and exertion of which might
have interfered with processes of emotional antici-
pation. However, the task thus did not comprise an
implemented behavioural control. We decided not to
use such a control, for instance by motor reaction, in
Neural correlates of ‘pessimism ’ in depression 797
order to avoid interfering and noisy other brain acti-
vation. On the other hand, a behavioural measure im-
plemented in our task demonstrating a ‘pessimistic ’
bias also on the level of behavioural outcome could
have further strengthened the assumption of ‘pessi-
mistic ’ expectation in depression. However, here we
focused on the neural correlates considering that
neural aspects, and also subjective emotional experi-
ence, must not necessarily be reflected by observable
behaviour. We asked the subjects and patients after-
wards whether if they had been able to attend to the
task and we attempted to verify this by checking ap-
propriate activation in the visual cortex. If the partici-
pants had not attended, one would have expected
noisy data and no specific activations.
In conclusion, the similarity of ‘unknown’ and
‘unpleasant ’ expectation-related brain activity may be
attributed to a ‘pessimistic ’ bias towards future events
as expressed particularly in depressed patients. This
supports cognitive models of a ‘pessimistic ’ attitude
in depression at the neurobiological level. Dorsolateral
and medial prefrontal regions, known to be involved
in executive and cognitive control, and viscero-
sensitive areas such as the insula appear to play a key
role in biasing the organism towards preparation for
the worst-case scenario and to contribute to depres-
siveness.
Acknowledgements
The study was performed at the Psychiatric University
Hospital Zurich in Switzerland. U.H. and L.J. were
funded by the Swiss National Foundation (SNF no.
3200B0-112631). The SNF had no further role in study
design, in collection, analysis or interpretation of
the data, in writing the report and in the decision to
submit the paper for publication. We are grateful to
Dr D. Huber and C. Sauerwald, Hirslanden Clinic,
Zurich, for providing the fMRI scanning.
Note
Supplementary material accompanies this paper on
the Journal’s website (http://journals.cambridge.org/
psm).
Declaration of Interest
None.
References
Abler B, Erk S, Herwig U, Walter H (2006). Anticipation of
aversive stimuli activates extended amygdala in unipolar
depression. Journal of Psychiatric Research 41, 511–522.
Anderson AK, Christoff K, Stappen I, Panitz D,
Ghahremani DG, Glover G, Gabrieli JD, Sobel N
(2003). Dissociated neural representations of intensity
and valence in human olfaction. Nature Neuroscience 6,
196–202.
Annett M (1967). The binomial distribution of right, mixed
and left handedness. Quarterly Journal of Experimental
Psychology 19, 327–333.
Baxter Jr LR, Schwartz JM, Phelps ME, Mazziotta JC,
Guze BH, Selin CE, Gerner RH, Sumida RM (1989).
Reduction of prefrontal cortex glucose metabolism
common to three types of depression. Archives of General
Psychiatry 46, 243–250.
Beck AT (1967). Depression : Clinical, Experimental and
Theoretical Aspects. Harper & Row: New York.
Beck AT, Ward CH, Mendelson M, Mock J, Erbaugh J
(1961). An inventory for measuring depression. Archives
of General Psychiatry 4, 561–571.
Bermpohl F, Pascual-Leone A, Amedi A, Merabet LB,
Fregni F, Gaab N, Alsop D, Schlaug G, Northoff G (2006).
Dissociable networks for the expectancy and perception
of emotional stimuli in the human brain. NeuroImage 30,
588–600.
Calder AJ, Lawrence AD, Young AW (2001).
Neuropsychology of fear and loathing. Nature Reviews
Neuroscience 2, 352–363.
Carter CS, Macdonald AM, Botvinick M, Ross LL,
Stenger VA, Noll D, Cohen JD (2000). Parsing executive
processes : strategic vs. evaluative functions of the anterior
cingulate cortex. Proceedings of the National Academy of
Sciences of the USA 97, 1944–1948.
Churchland PS (2002). Self-representation in nervous
systems. Science 296, 308–310.
Craig AD (2002). How do you feel ? Interoception : the sense
of the physiological condition of the body. Nature Reviews
Neuroscience 3, 655–666.
Critchley HD, Wiens S, Rotshtein P, Ohman A, Dolan RJ
(2004). Neural systems supporting interoceptive
awareness. Nature Neuroscience 7, 189–195.
Damasio AR, Grabowski TJ, Bechara A, Damasio H,
Ponto LL, Parvizi J, Hichwa RD (2000).
Subcortical and cortical brain activity during the feeling
of self-generated emotions. Nature Neuroscience 3,
1049–1056.
Dannlowski U, Ohrmann P, Bauer J, Deckert J, Hohoff C,
Kugel H, Arolt V, Heindel W, Kersting A, Baune BT,
Suslow T (2008). 5-HTTLPR biases amygdala activity in
response to masked facial expressions in major depression.
Neuropsychopharmacology 33, 418–424.
Davidson RJ, Irwin W, Anderle MJ, Kalin NH (2003). The
neural substrates of affective processing in depressed
patients treated with venlafaxine. American Journal of
Psychiatry 160, 64–75.
Davidson RJ, Pizzagalli D, Nitschke JB, Putnam K (2002).
Depression : perspectives from affective neuroscience.
Annual Reviews of Psychology 53, 545–574.
Drevets WC (2001). Neuroimaging and neuropathological
studies of depression : implications for the
cognitive-emotional features of mood disorders.
Current Opinions in Neurobiology 11, 240–249.
798 U. Herwig et al.

Erk S, Walter H, Abler B (2008). Age-related physiological
responses to emotion anticipation and exposure.
Neuroreport 19, 447–452.
Fales CL, Barch DM, Rundle MM, Mintun MA, Snyder AZ,
Cohen JD, Mathews J, Sheline YI (2008). Altered
emotional interference processing in affective and
cognitive-control brain circuitry in major depression.
Biological Psychiatry 63, 377–384.
Fuster JM (2000). Executive frontal functions. Experimental
Brain Research 133, 66–70.
Gibson B, Sanbonmatsu DM (2004). Optimism, pessimism,
and gambling : the downside of optimism. Personality and
Social Psychology Bulletin 30, 149–160.
Gilbert DT,Wilson TD (2007). Prospection : experiencing the
future. Science 317, 1351–1354.
Glover GH (1999). Deconvolution of impulse response in
event-related BOLD fMRI. NeuroImage 9, 416–429.
Grimm S, Beck J, Schuepbach D, Hell D, Boesiger P,
Bermpohl F, Niehaus L, Boeker H, Northoff G (2008).
Imbalance between left and right dorsolateral prefrontal
cortex in major depression is linked to negative emotional
judgment : an fMRI study in severe major depressive
disorder. Biological Psychiatry 63, 369–376.
Gross JJ, John OP (2003). Individual differences in two
emotion regulation processes : implications for affect,
relationships, and well-being. Journal of Personality and
Social Psychology 85, 348–362.
Hamilton M (1960). A rating scale for depression. Journal of
Neurology, Neurosurgery, and Psychiatry 23, 56–62.
Harvey PO, Fossati P, Pochon JB, Levy R, Lebastard G,
Lehericy S, Allilaire JF, Dubois B (2005). Cognitive control
and brain resources in major depression : an fMRI study
using the n-back task. NeuroImage 26, 860–869.
Heimer L, Van Hoesen GW (2006). The limbic lobe and its
output channels : implications for emotional functions and
adaptive behaviour. Neuroscience and Biobehavioral Reviews
30, 126–147.
Herwig U, Baumgartner T, Kaffenberger T, Bruhl A,
Kottlow M, Schreiter-Gasser U, Abler B, Jancke L,
Rufer M (2007a). Modulation of anticipatory emotion and
perception processing by cognitive control. NeuroImage 37,
652–662.
Herwig U, Kaffenberger T, Baumgartner T, Jancke L
(2007b). Neural correlates of a ‘pessimistic ’ attitude when
anticipating events of unknown emotional valence.
NeuroImage 34, 848–858.
Horn KM, Pong M, Batni SR, Levy SM, Gibson AR (2002).
Functional specialization within the cat red nucleus.
Journal of Neurophysiology 87, 469–477.
Johnstone T, van Reekum CM, Urry HL, Kalin NH,
Davidson RJ (2007). Failure to regulate : counterproductive
recruitment of top-down prefrontal-subcortical circuitry
in major depression. Journal of Neuroscience 27, 8877–8884.
Keedwell PA, Andrew C, Williams SC, Brammer MJ,
Phillips ML (2005). The neural correlates of anhedonia
in major depressive disorder. Biological Psychiatry 58,
843–853.
Knutson B, Bhanji JP, Cooney RE, Atlas LY, Gotlib IH
(2008). Neural responses to monetary incentives in major
depression. Biological Psychiatry 63, 686–692.
Lang PJ (1995). The emotion probe. Studies of motivation and
attention. American Psychologist 50, 372–385.
Langenecker SA, Kennedy SE, Guidotti LM, Briceno EM,
Own LS, Hooven T, Young EA, Akil H, Noll DC,
Zubieta JK (2007). Frontal and limbic activation during
inhibitory control predicts treatment response in major
depressive disorder. Biological Psychiatry 62, 1272–1280.
Lavender A, Watkins E (2004). Rumination and future
thinking in depression. British Journal of Clinical Psychology
43, 129–142.
Lee BT, Seong Whi C, Hyung Soo K, Lee BC, Choi IG,
Lyoo IK, Ham BJ (2007). The neural substrates of affective
processing toward positive and negative affective pictures
in patients with major depressive disorder. Progress in
Neuropsychopharmacology and Biological Psychiatry 31,
1487–1492.
Leppanen JM (2006). Emotional information processing in
mood disorders : a review of behavioral and neuroimaging
findings. Current Opinions in Psychiatry 19, 34–39.
Mayberg HS (2003). Positron emission tomography imaging
in depression : a neural systems perspective. Neuroimaging
Clinics of North America 13, 805–815.
McClure SM, York MK, Montague PR (2004). The neural
substrates of reward processing in humans : the modern
role of fMRI. Neuroscientist 10, 260–268.
Mitterschiffthaler MT, Williams SC, Walsh ND, Cleare AJ,
Donaldson C, Scott J, Fu CH (2008). Neural basis of the
emotional Stroop interference effect in major depression.
Psychological Medicine 38, 247–256.
Montgomery SA, Asberg M (1979). A new depression scale
designed to be sensitive to change. British Journal of
Psychiatry 134, 382–389.
Nesse RM (2000). Is depression an adaptation? Archives of
General Psychiatry 57, 14–20.
Nichols T, Brett M, Andersson J, Wager T, Poline JB (2005).
Valid conjunction inference with the minimum statistic.
NeuroImage 25, 653–660.
Nitschke JB, Sarinopoulos I, Mackiewicz KL, Schaefer HS,
Davidson RJ (2006). Functional neuroanatomy of aversion
and its anticipation. NeuroImage 29, 106–116.
Norem JK, Cantor N (1986). Defensive pessimism:
harnessing anxiety as motivation. Journal of Personality and
Social Psychology 51, 1208–1217.
Northoff G, Bermpohl F (2004). Cortical midline structures
and the self. Trends in Cognitive Sciences 8, 102–107.
Panksepp J (2006). Emotional endophenotypes
in evolutionary psychiatry. Progress in
Neuropsychopharmacology and Biological Psychiatry 30,
774–784.
Paulus MP, Feinstein JS, Castillo G, Simmons AN,
Stein MB (2005). Dose-dependent decrease of activation
in bilateral amygdala and insula by lorazepam during
emotion processing. Archives of General Psychiatry 62,
282–288.
Paulus MP, Stein MB (2006). An insular view of anxiety.
Biological Psychiatry 60, 383–387.
Pessoa L (2008). On the relationship between emotion and
cognition. Nature Reviews Neuroscience 9, 148–158.
Phillips ML, Drevets WC, Rauch SL, Lane R (2003).
Neurobiology of emotion perception II : Implications
Neural correlates of ‘pessimism ’ in depression 799

for major psychiatric disorders. Biological Psychiatry 54,
515–528.
Pyszczynski T, Holt K, Greenberg J (1987).
Depression, self-focused attention, and expectancies
for positive and negative future life events for self
and others. Journal of Personality and Social Psychology 52,
994–1001.
Sharot T, Riccardi AM, Raio CM, Phelps EA (2007).
Neural mechanisms mediating optimism bias. Nature 450,
102–105.
Shepperd JA,McNulty JK (2002). The affective consequences
of expected and unexpected outcomes. Psychological Science
13, 85–88.
Siegle GJ, Thompson W, Carter CS, Steinhauer SR,
Thase ME (2007). Increased amygdala and decreased
dorsolateral prefrontal BOLD responses in unipolar
depression : related and independent features. Biological
Psychiatry 61, 198–209.
Simmons A, Matthews SC, Paulus MP, Stein MB (2008).
Intolerance of uncertainty correlates with insula
activation during affective ambiguity. Neuroscience Letters
430, 92–97.
Soares JC, Mann JJ (1997). The anatomy of mood disorders –
review of structural neuroimaging studies. Biological
Psychiatry 41, 86–106.
Sporns O, Honey CJ, Kotter R (2007). Identification and
classification of hubs in brain networks. PLoS ONE 2,
e1049.
Talairach J, Tournoux P (1988). Co-planar Stereotaxic Atlas of
the Human Brain. Thieme : Stuttgart.
Vogt BA (2005). Pain and emotion interactions in subregions
of the cingulate gyrus. Nature Reviews Neuroscience 6,
533–544.
Yamasaki H, LaBar KS, McCarthy G (2002). Dissociable
prefrontal brain systems for attention and emotion.
Proceedings of the National Academy of Sciences of the USA 99,
11447–11451.
Yuste R, MacLean JN, Smith J, Lansner A (2005). The cortex
as a central pattern generator. Nature Reviews Neuroscience
6, 477–483.
800 U. Herwig et al.