R E G I O N V - Philippine Statistics Authority
156
2010 CENSUS POPULATION BY PROVINCE CITY/MUNICIPALITY BARANGAY OF POPULATION AND HOUSING R E G I O N National Statistics Office Republic of the Philippines REPORT NO. 1-H BICOL REGION V
-
Upload
khangminh22 -
Category
Documents
-
view
1 -
download
0
Transcript of R E G I O N V - Philippine Statistics Authority
2010 CENSUS
POPULATION BY
PROVINCE
CITY/MUNICIPALITY
BARANGAY
OF POPULATIONAND HOUSING
R EG I ON
National Statistics OfficeRepublic of the Philippines
REPORT NO. 1-H
BICOL REGION V
CITATION: National Statistics Office, 2010 Census of Population and Housing Report No. 1-H REGION V – BICOL REGION Population by Province, City/Municipality, and Barangay April 2012 ISSN 0117-1453
2010 Census of Population and Housing
Report No. 1 – H Population by Province, City/Municipality, and Barangay
REGION V
BICOL REGION
REPUBLIC OF THE PHILIPPINES
HIS EXCELLENCY
PRESIDENT BENIGNO S. AQUINO III
NATIONAL STATISTICAL COORDINATION BOARD
Honorable Cayetano W. Paderanga Jr. Chairperson
NATIONAL STATISTICS OFFICE
Carmelita N. Ericta Administrator
Paula Monina G. Collado
Deputy Administrator
Socorro D. Abejo Director III, Household Statistics Department
ISSN 0117-1453
FOREWORD
The 2010 Census of Population and Housing (2010 CPH) Report No. 1 is one of several publications designed to disseminate the results of the 2010 CPH. This report presents the population by province, city or municipality and barangay based on the 2010 CPH. This information will be useful for the formulation of the social and economic development policies, plans and programs of the Government. These are also important for purposes of the calculation of Internal Revenue Allocation, determination of number of congressional districts, and creation or conversion of various administrative geographic units.
The 2010 CPH is the 13th census of population and the 6th census of housing that was conducted in the country since the first census undertaken in 1903. It was designed to take an inventory of the total population and housing units in the country and collect information about their characteristics as of the reference period May 1, 2010.
The 2010 CPH data were gathered through house-to-house visit and interview of
a responsible member of every household visited. The data processing of the results of the 2010 CPH utilized a combination of Optical Mark Reader (OMR) technology and data encoding. The 2010 CPH results on population counts underwent careful evaluation for reasonableness and consistency with expected demographic patterns and trends in accordance with evaluation procedures of international standards. Unusual changes and deviations of 2010 CPH population counts and related indicators from expected patterns and trends were field-verified.
The successful completion of the 2010 CPH would not have been possible
without the unwavering support and services rendered by the local and national officials, government and private agencies, media, and non-government organizations. We acknowledge with gratitude the census coordinating boards at the national, regional, provincial, city, and municipal levels in ensuring agency logistic support and assistance, the dedication of teachers from the Department of Education, the hired census personnel, and our very own NSO personnel who acted as census enumerators and supervisors, and the cooperation of the general populace. The NSO extends its deep appreciation of their support to this important undertaking.
CARMELITA N. ERICTA Administrator
Manila, Philippines April 2012
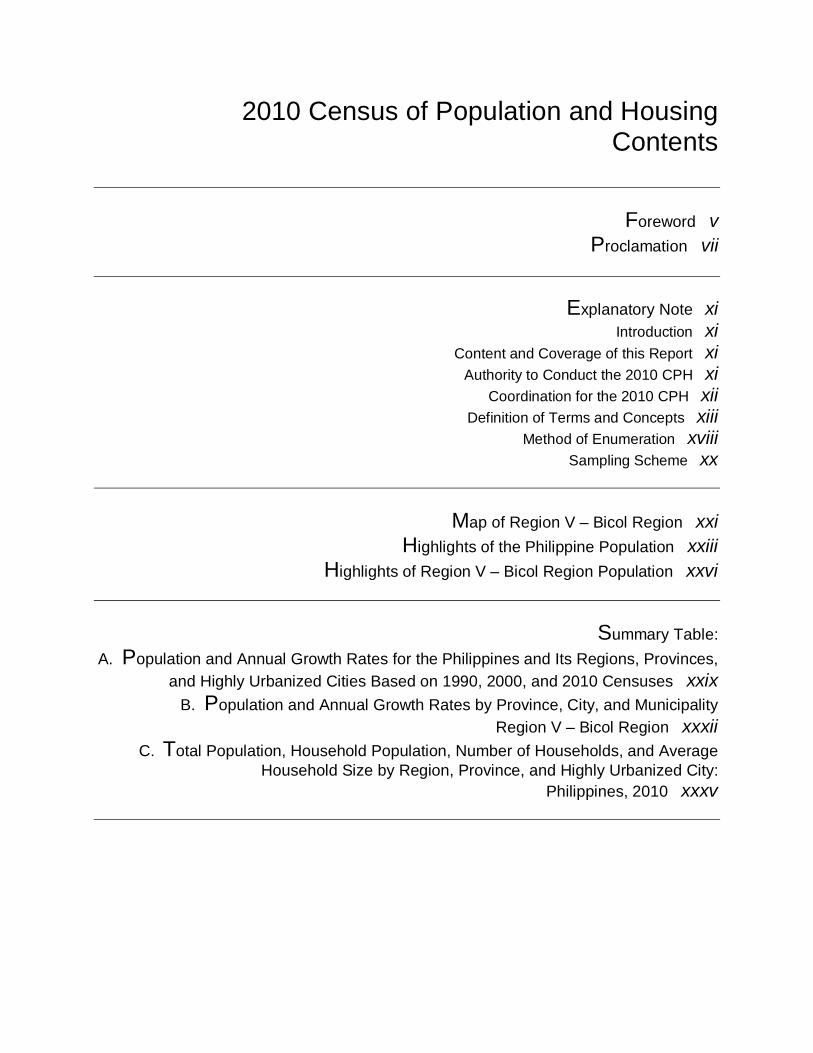
2010 Census of Population and Housing Contents
Foreword v
Proclamation vii
Explanatory Note xi Introduction xi
Content and Coverage of this Report xi Authority to Conduct the 2010 CPH xi
Coordination for the 2010 CPH xii Definition of Terms and Concepts xiii
Method of Enumeration xviii Sampling Scheme xx
Map of Region V – Bicol Region xxi Highlights of the Philippine Population xxiii
Highlights of Region V – Bicol Region Population xxvi
Summary Table: A. Population and Annual Growth Rates for the Philippines and Its Regions, Provinces,
and Highly Urbanized Cities Based on 1990, 2000, and 2010 Censuses xxix B. Population and Annual Growth Rates by Province, City, and Municipality
Region V – Bicol Region xxxii C. Total Population, Household Population, Number of Households, and Average
Household Size by Region, Province, and Highly Urbanized City: Philippines, 2010 xxxv
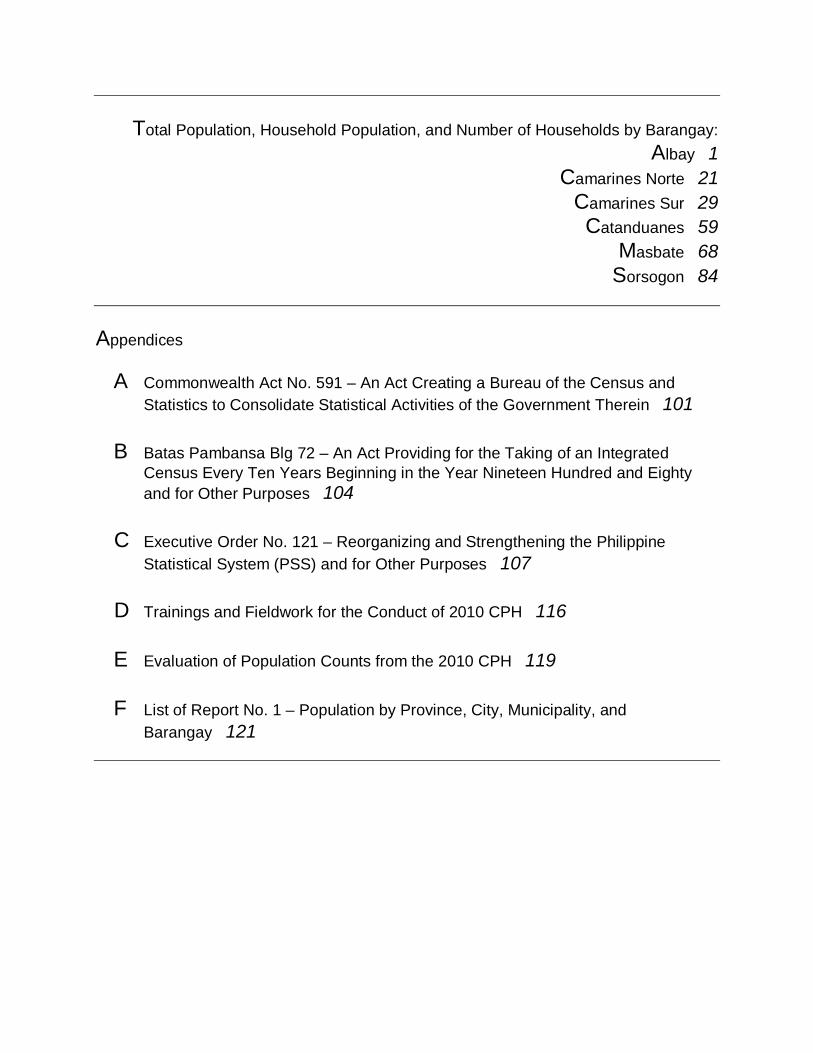
Total Population, Household Population, and Number of Households by Barangay:
Albay 1
Camarines Norte 21
Camarines Sur 29 Catanduanes 59
Masbate 68
Sorsogon 84
Appendices A Commonwealth Act No. 591 – An Act Creating a Bureau of the Census and Statistics to Consolidate Statistical Activities of the Government Therein 101 B Batas Pambansa Blg 72 – An Act Providing for the Taking of an Integrated Census Every Ten Years Beginning in the Year Nineteen Hundred and Eighty and for Other Purposes 104 C Executive Order No. 121 – Reorganizing and Strengthening the Philippine
Statistical System (PSS) and for Other Purposes 107 D Trainings and Fieldwork for the Conduct of 2010 CPH 116
E Evaluation of Population Counts from the 2010 CPH 119 F List of Report No. 1 – Population by Province, City, Municipality, and
Barangay 121
EXPLANATORY NOTE Introduction The National Statistics Office conducted the 2010 Census of Population and Housing or 2010 CPH in May 2010. This is the 13th census of population and the 6th census of housing undertaken in the country. Like the previous censuses conducted by the office, the 2010 CPH is designed to take an inventory of the total population and housing units in the Philippines and to collect information about their characteristics. Content and Coverage of this Report
In this report, the population counts by province, city/municipality and barangay
are presented. These population counts were declared official for all purposes by His Excellency President Benigno S. Aquino III under Proclamation No. 362 dated March 30, 2012.
Authority to Conduct the 2010 CPH Commonwealth Act (CA) No. 591, approved on August 19, 1940, authorized the
then Bureau of the Census and Statistics (now the National Statistics Office or NSO) to collect by enumeration, sampling or other methods, statistics and other information concerning the population and to conduct, for statistical purposes, investigations and studies of social and economic conditions in the country, among others (Section 2 of CA No. 591).
Batas Pambansa Blg. 72, approved on June 11, 1980, further accorded the NSO
the authority to conduct population censuses every ten years beginning in 1980, without prejudice to the undertaking of special censuses on agriculture, industry, commerce, housing, and other sectors as may be approved by the National Economic and Development Authority (NEDA).
Executive Order (EO) No. 121, otherwise known as the Reorganization Act of the
Philippine Statistical System, which was issued on January 30, 1987, declared that the NSO shall be the major statistical agency responsible for generating general purpose statistics and for undertaking such censuses and surveys as may be designated by the National Statistical Coordination Board (NSCB) (Section 9 of EO No. 121).
Presidential Proclamation No. 2028 “Declaring May 2010 as National Census
Month” enjoined all departments and other government agencies, including government-owned and controlled corporations, as well as LGUs, to implement and
Explanatory Note 2010 Census of Population and Housing
xii National Statistics Office
execute the operational plans, directives, and orders of the National Statistical Coordination Board (NSCB), through the NSO, relative to this Proclamation. Coordination for the 2010 CPH
Batas Pambansa Blg. 72 provides that the National Census Coordinating Board
(NCCB) at the national level, and local boards at the regional, provincial, city, and municipal levels shall be created to ensure the successful conduct of the census. For the 2010 CPH, the NSCB was designated as the NCCB pursuant to NSCB’s mandated function specified in Executive Order No. 121 to establish appropriate mechanisms for statistical coordination at the different geographic levels.
The Director General of NEDA was the Chairperson of the NCCB, and the
Secretaries from other Departments were the Members. The NSO Administrator, who served as the Executive Officer of the NCCB, was mandated to formulate and execute plans for the 2010 CPH.
In the field, the NSO Regional Director (RD) was the Executive Officer of the
Regional Census Coordinating Board (RCCB). He/she was responsible for the coordination, monitoring, and supervision of the census operations in all provinces within the region. The RCCB was chaired by the Regional Director of the NEDA. The Regional Director of the Department of Interior and Local Government (DILG) served as the Vice Chairperson. The members were the heads of the following: Regional Development Council, National Statistics Coordination Board, Department of Agrarian Reform, Department of Agriculture, Department of Education (DepEd), Department of Environment and Natural Resources, Department of Finance, Department of Foreign Affairs, Department of Justice, Department of Labor and Employment, Department of National Defense, Department of Public Works and Highways, Department of Social Welfare and Development, Department of Trade and Industry, Department of Transportation and Communications, Department of Tourism, Department of Science and Technology, Department of Health, Commission on Population, National Commission on Indigenous Peoples (NCIP), and Office of Muslim Affairs. Completing the membership of the RCCB was a representative from the private sector.
At the local government level, Provincial Census Coordinating Boards (PCCB)
and City/Municipality Census Coordinating Boards (C/MCCB) were created. The Provincial Governor was the Chairperson of the PCCB and the Division Superintendent of Schools, the Vice Chairperson. The District Highway Engineer, Provincial Commander (PNP), Provincial Planning and Development Officer, Provincial Assessor, Provincial Agriculturist, Provincial Population Officer, Provincial Environment and Natural Resources Officer, Provincial Social Welfare and Development Officer, Provincial Information Officer, NCIP Development Management Officer V, and three representatives from the private sector served as members. The Provincial Statistics Officer was the Executive Officer. He/she was also responsible for the field census operations in the province.
2010 Census of Population and Housing Explanatory Note
National Statistics Office xiii
The C/MCCB was chaired by the City/Municipal Mayor and co-chaired by the City Superintendent/District Supervisor of Schools by the DepEd. The members were composed of the following: The Station Commanders, City/Municipal Planning and Development Officer, City/Municipal Population Officer, City/Municipal Civil Registrar, City Assessor (for CCCB), Municipal Agriculture Officer (for MCCB), and a representative from the private sector. The District Statistics Officer served as Executive Officer.
Definition of Terms and Concepts The operational definitions and concepts adopted in the 2010 CPH have also been used in past censuses of population and housing. The use of the same operational definitions of terms and concepts in our population and housing censuses ensures comparability of census results. The 2010 CPH enumerators were instructed to adhere strictly to these operational definitions. Barangay A barangay is the smallest political unit in the country. Generally, one enumerator is assigned to enumerate one barangay. For enumeration purposes, a large barangay is usually divided into parts, and each part is called an enumeration area (EA). The official list of barangays of the DILG in the Philippine Standard Geographic Code as of March 2010 was used for the 2010 CPH. Enumeration Area
An enumeration area (EA) is a delineated geographic area usually consisting of about 350 to 500 households. It could be an entire barangay or part of a barangay. It is assigned to one enumerator.
Usual Place of Residence All persons were enumerated in their usual place of residence which refers to the geographic place (street, barangay, city/municipality or province) where the person usually resides. As a rule, a person’s usual place of residence is the place where that person sleeps most of the time. Hence, it may be the same as or different from the place where he/she was found at the time of the census. Household
A household is a social unit consisting of a person living alone or a group of
person who sleep in the same housing unit and have a common arrangement in the preparation and consumption of food.
Explanatory Note 2010 Census of Population and Housing
xiv National Statistics Office
In most cases, a household consists of persons who are related by kinship ties, like parents and their children. In some instances, several generations of familial ties are represented in one household while, still in others, even more distant relatives are members of the household. Household helpers, boarders, and nonrelatives are considered as members of the household provided they sleep in the same housing unit and have common arrangement for the preparation and consumption of food and do not usually go home to their family at least once a week. A person who shares a housing unit with a household but separately cooks his/her meals or consumes his/her food elsewhere is not considered a member of the household he/she shares the housing unit with. This person is listed as a separate household. Household Membership
In determining household membership, the basic criterion is the usual place of residence or the place where the person usually resides. This may be the same or different from the place where he/she is found at the time of the census. As a rule, it is the place where he/she usually sleeps. Household Population Household population refers to all persons who are members of the household. Institutional Living Quarter An institutional living quarter (ILQ) is a structurally separate and independent place of abode intended for habitation by large groups of individuals (10 or more). Such quarter usually has certain common facilities such as kitchen and dining rooms, toilet and bath, and lounging areas, which are shared by the occupants. Institutional Population An institutional population comprises of persons who are found living in ILQs. They may have their own families or households elsewhere but at the time of census, they are committed or confined in institutions, or they live in ILQs and are usually subject to a common authority or management, or are bound by either a common public objective or a common personal interest. Whom to Enumerate As in past population and housing censuses, enumerators of 2010 CPH were provided with guidelines on whom to list as members of a household and institutional population. This will ensure uniformity in determining household membership,
2010 Census of Population and Housing Explanatory Note
National Statistics Office xv
institutional population, and in identifying persons to be included in the enumeration or excluded from it. Furthermore, this will ensure that there is no omission or duplication in the enumeration of persons and households during census-taking. The following are the guidelines in determining household membership and institutional population:
Persons enumerated as members of the household 1. Those who are present at the time of visit and whose usual place of residence
is the housing unit where the household lives.
2. Family members who are overseas workers and who have been away at the time of the census for not more than five years from the date of departure and are expected to be back within five years from the date of last departure.
An overseas worker is a household member who is currently out of the
country due to overseas employment. He/she may or may not have a specific work contract or may be presently at home on vacation but has an existing overseas employment to return to. Undocumented overseas workers, or TNT for Tago Nang Tago, are considered as overseas workers for as long as they are still considered members of the household and had been away for less than five years. However, immigrants are excluded from the census.
3. Those whose usual place of residence is the place where the household lives
but are temporarily away at the time of the census for any of the following reasons:
a. on vacation, business/pleasure trip, or training somewhere in the
Philippines and are expected to be back within six months from the date of departure. An example is a person on training with the Armed Forces of the Philippines for not more than six months;
b. on vacation, business/pleasure trip, or studying/training abroad and are expected to be back within a year from the date of departure;
c. working or attending school in some other place but usually comes home at least once a week;
d. confined in hospitals for a period of not more than six months as of May 1, 2010, except when they are confined as patients in mental hospitals, leprosaria or leper colonies, or drug rehabilitation centers, regardless of the duration of confinement;
e. detained in national/provincial/city/municipal jails or in military camps for a period of not more than six months as of May 1, 2010, except when their sentence or detention is expected to exceed six months;
f. on board coastal, interisland, or fishing vessels within Philippine territories; and
g. on board in oceangoing vessels but are expected to be back within five years from the date of departure.
Explanatory Note 2010 Census of Population and Housing
xvi National Statistics Office
4. Boarders/lodgers of the household or employees of household-operated businesses who do not usually return/go to their respective homes weekly.
5. Citizens of foreign countries who have resided or are expected to reside in the Philippines for at least a year from their arrival, except members of diplomatic missions and non-Filipino members of international organizations.
6. Filipino balikbayans with usual place of residence in a foreign country but
have resided or are expected to reside in the Philippines for at least a year from their arrival.
7. Persons temporarily staying with the household who have no usual place of
residence or who are not certain to be enumerated elsewhere. Persons enumerated as members of the institutional population 1. Permanent lodgers in boarding houses;
2. Dormitory residents who do not usually go home to their respective
households at least once a week; 3. Hotel residents who have stayed in the hotel for more than six months at the
time of the census; 4. Boarders in residential houses provided that their number is 10 or more.
Otherwise, they will be considered as members of regular households; 5. Patients in hospitals who are confined for more than six months; 6. Patients confined in mental hospitals, leprosaria or leper colonies, and drug
rehabilitation centers, regardless of the length of confinement; 7. Wards in orphanages; 8. Inmates of penal colonies or prison cells; 9. Seminarians, nuns in convents, and monks; and 10. Workers in mining and similar camps. The following persons are not considered as members of the institutional population and should be included in the households to which they belong:
1. Military officials/enlisted men or draftees (and members of their households) who have housing units within military installations or camps;
2010 Census of Population and Housing Explanatory Note
National Statistics Office xvii
2. Managers (and members of their households) of refugee camps, dormitories, hotels, hospitals, and others, who occupy and regularly use as their place of abode a living quarter in the institution that they manage; and
3. Priests, who together with their relatives and/or household help, occupy and
regularly use as their place of abode a living quarter in the church or seminary.
Persons Included in the Census Enumeration
Included in the enumeration were those who were alive as of the census reference date, that is, 12:01 a.m. of May 1, 2010. Specifically they are the following:
1. Filipino nationals permanently residing in the Philippines;
2. Filipino nationals who, as of May 1, 2010, were temporarily at Philippine sea,
or were temporarily on vacation, business/pleasure trip or studying/training abroad and were expected to be back within a year from the date of departure;
3. Filipino overseas workers, including those on board in oceangoing vessels, who were away as of May 1, 2010 but were expected to be back within five years;
4. Philippine government officials, both military and civilian, including Philippine diplomatic personnel and their families, assigned abroad; and
5. Civilian citizens of foreign countries who have their usual residence in the Philippines, or foreign visitors who had stayed or are expected to stay for at least a year from the date of their arrival in this country.
Persons Excluded in the Census Enumeration
Excluded from the enumeration are the following persons, although they happened to be within the territorial jurisdiction of the Philippines at the time of the census enumeration: 1. Foreign ambassadors, ministers, consuls, or other diplomatic representatives,
and members of their families (except Filipino and non-Filipino employees who have been residents of the Philippines prior to said employment);
2. Citizens of foreign countries living within the premises of an embassy, legation, chancellery, or consulate;
Explanatory Note 2010 Census of Population and Housing
xviii National Statistics Office
3. Citizens of foreign countries who are chiefs or officials of international organizations, such as United Nations (UN), International Labor Organization (ILO), Asian Development Bank (ADB), Food and Agriculture Organization (FAO), or the United States Agency for International Development (USAID), as they may be subject to reassignment to other countries after their tour of duty in the Philippines, and members of their families;
4. Citizens of foreign countries, together with non-Filipino members of their
families, who are students, or who are employed or have business in the Philippines, but who have stayed or are expected to stay in the country for less than a year from arrival;
5. Citizens of foreign countries and Filipinos with usual place of residence in a
foreign country, who are visiting the Philippines and who have stayed or are expected to stay in the country for less than a year from arrival (for instance, a balikbayan who will return to his/her usual place of residence abroad after a short vacation or visit in the Philippines);
6. Citizens of foreign countries in refugee camps/vessels; and 7. Residents of the Philippines on vacation, pleasure or business trip, study or
training abroad who have been away or expected to be away from the Philippines for more than one year from departure.
Method of Enumeration The gathering of population and housing data was performed by census enumerators through house-to-house visits and interview of a responsible member of each household. Self-Administered Questionnaires (SAQ) were provided to households living in special areas such as exclusive subdivisions/villages, condominiums, and others, and institutions where personal interview was not possible. A complete listing of buildings which contain living quarters, including vacant ones, as well as housing units and institutional living quarters was also done. A combination of complete enumeration and sampling of households was done to obtain population count and data on basic characteristics of the household population and housing units. For institutional population, a complete enumeration was done. The non-sample households were interviewed using the Common Household Questionnaire (CPH Form 2) while the sample households were interviewed using the Sample Household Questionnaire (CPH Form 3). Institutional population in institutional living quarters was enumerated using the Institutional Population Questionnaire (CPH Form 4). These questionnaires were used to gather information on the demographic and socio-economic characteristics of the population, as well as the characteristics of households and housing units.
2010 Census of Population and Housing Explanatory Note
National Statistics Office xix
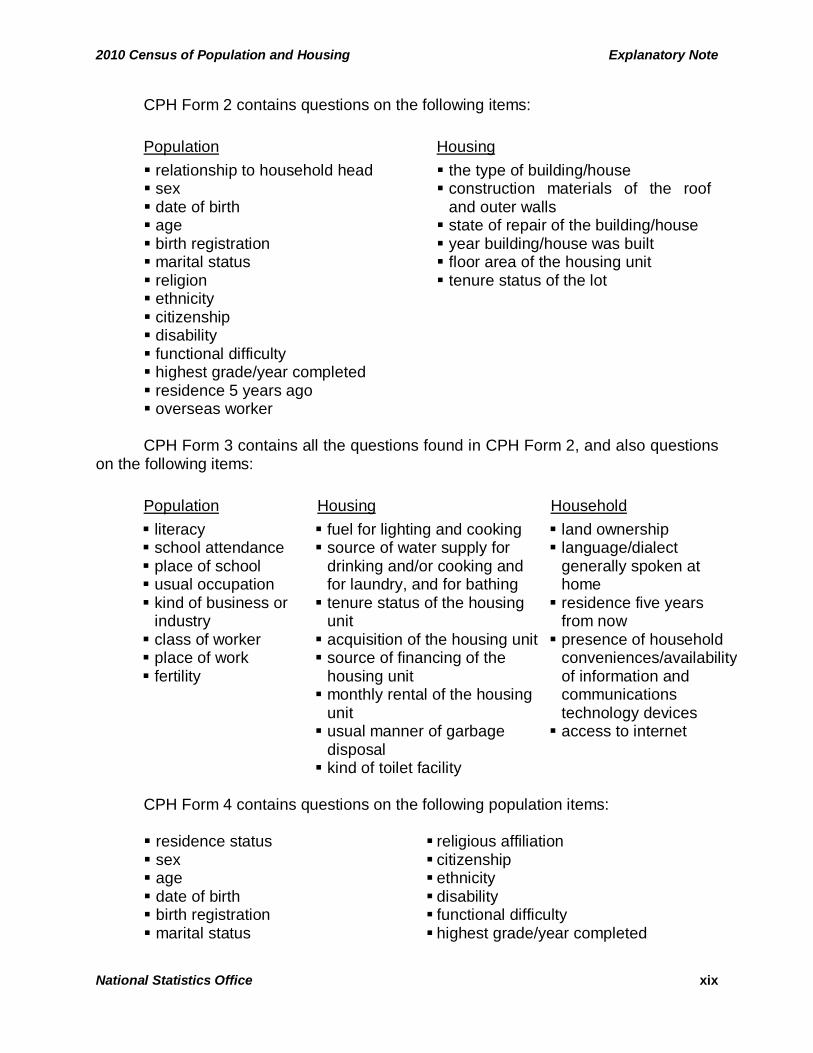
CPH Form 2 contains questions on the following items:
Population Housing relationship to household head sex date of birth age birth registration marital status religion ethnicity citizenship disability functional difficulty highest grade/year completed residence 5 years ago overseas worker
the type of building/house construction materials of the roof
and outer walls state of repair of the building/house year building/house was built floor area of the housing unit tenure status of the lot
CPH Form 3 contains all the questions found in CPH Form 2, and also questions
on the following items: Population Housing Household literacy school attendance place of school usual occupation kind of business or
industry class of worker place of work fertility
fuel for lighting and cooking source of water supply for
drinking and/or cooking and for laundry, and for bathing tenure status of the housing
unit acquisition of the housing unit source of financing of the
housing unit monthly rental of the housing
unit usual manner of garbage
disposal kind of toilet facility
land ownership language/dialect
generally spoken at home residence five years
from now presence of household
conveniences/availability of information and communications technology devices access to internet
CPH Form 4 contains questions on the following population items: residence status sex age date of birth birth registration marital status
religious affiliation citizenship ethnicity disability functional difficulty highest grade/year completed
Explanatory Note 2010 Census of Population and Housing
xx National Statistics Office
Information about households of Filipinos working in Philippine embassies in foreign countries, as well as those of homeless population were also gathered and included in the total population of the country. Sampling Scheme
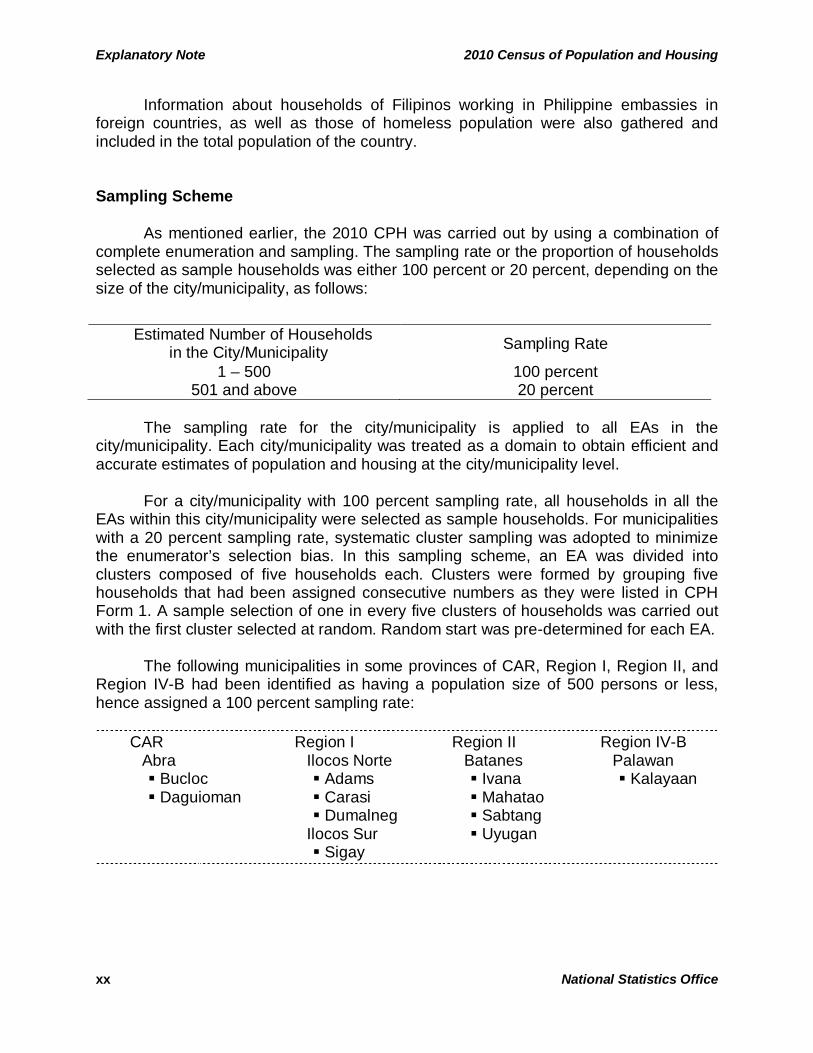
As mentioned earlier, the 2010 CPH was carried out by using a combination of complete enumeration and sampling. The sampling rate or the proportion of households selected as sample households was either 100 percent or 20 percent, depending on the size of the city/municipality, as follows:
The sampling rate for the city/municipality is applied to all EAs in the
city/municipality. Each city/municipality was treated as a domain to obtain efficient and accurate estimates of population and housing at the city/municipality level.
For a city/municipality with 100 percent sampling rate, all households in all the EAs within this city/municipality were selected as sample households. For municipalities with a 20 percent sampling rate, systematic cluster sampling was adopted to minimize the enumerator’s selection bias. In this sampling scheme, an EA was divided into clusters composed of five households each. Clusters were formed by grouping five households that had been assigned consecutive numbers as they were listed in CPH Form 1. A sample selection of one in every five clusters of households was carried out with the first cluster selected at random. Random start was pre-determined for each EA. The following municipalities in some provinces of CAR, Region I, Region II, and Region IV-B had been identified as having a population size of 500 persons or less, hence assigned a 100 percent sampling rate:
CAR Abra Bucloc Daguioman
Region I Ilocos Norte Adams Carasi Dumalneg
Ilocos Sur Sigay
Region II Batanes Ivana Mahatao Sabtang Uyugan
Region IV-B Palawan Kalayaan
Estimated Number of Households in the City/Municipality Sampling Rate
1 – 500 100 percent 501 and above 20 percent
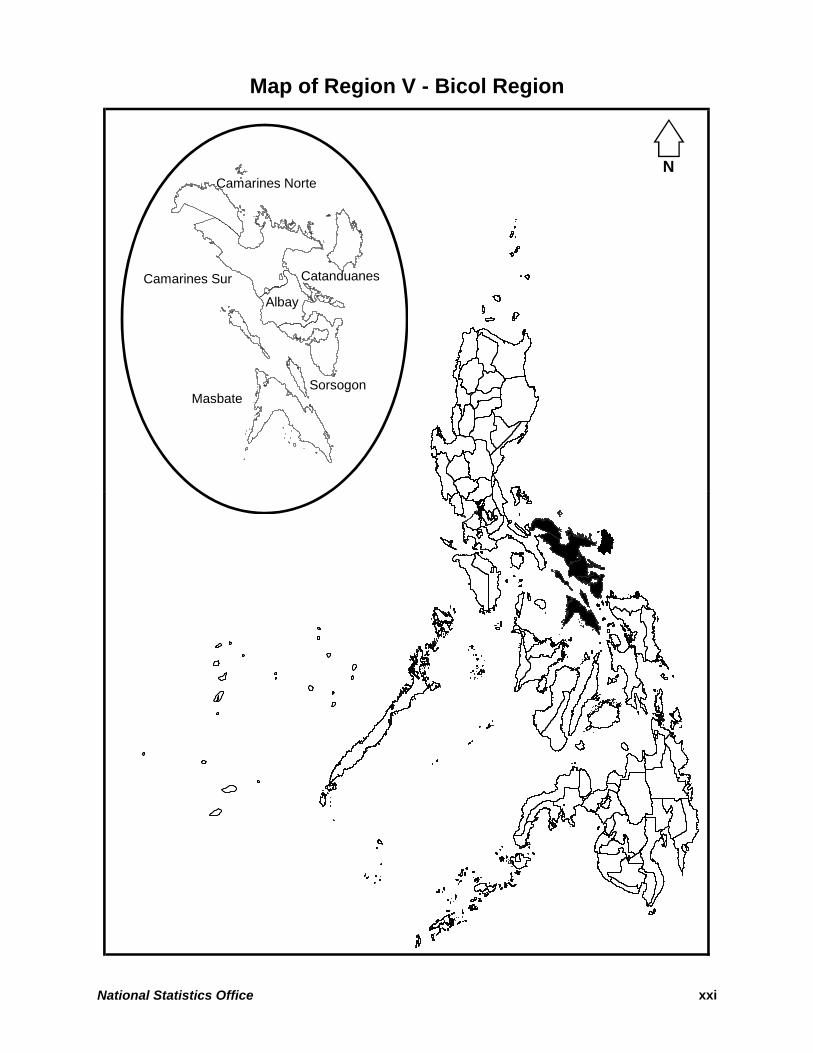
Map of Region V - Bicol Region
Camarines Norte
Camarines Sur Catanduanes
Albay
SorsogonMasbate
N
National Statistics Office xxi
2010 Census of Population and Housing Highlights
National Statistics Office xxiii
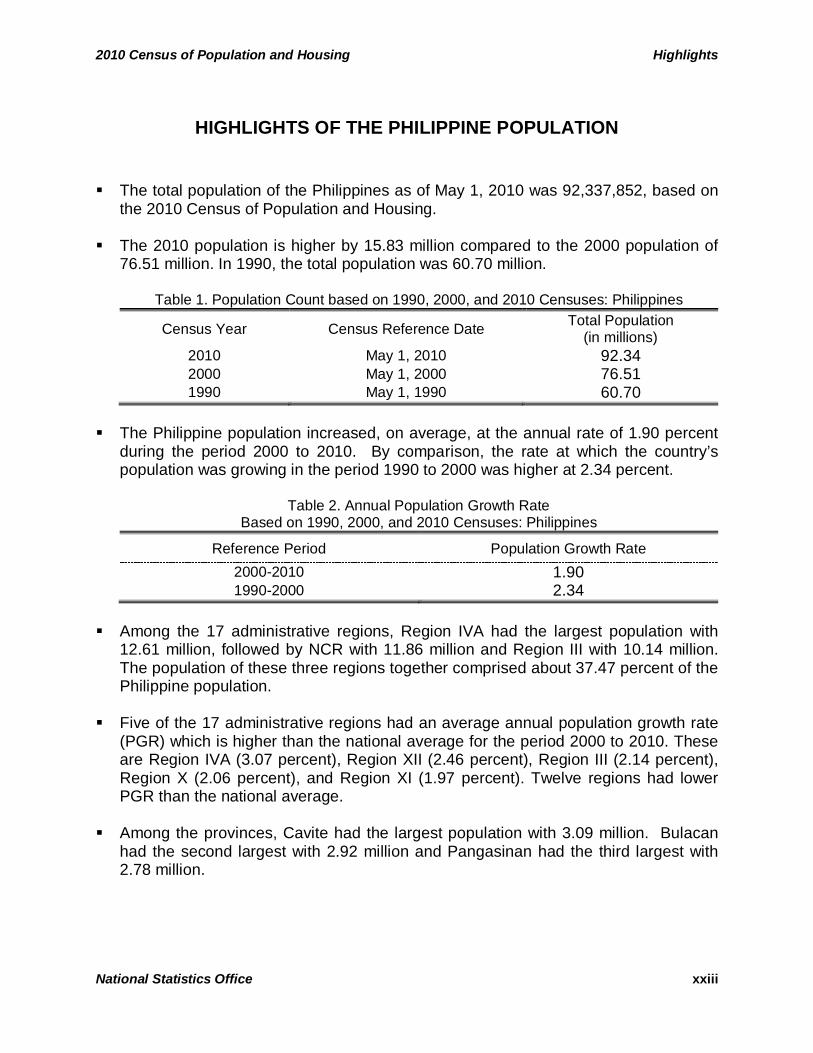
HIGHLIGHTS OF THE PHILIPPINE POPULATION
The total population of the Philippines as of May 1, 2010 was 92,337,852, based on the 2010 Census of Population and Housing.
The 2010 population is higher by 15.83 million compared to the 2000 population of 76.51 million. In 1990, the total population was 60.70 million.
Table 1. Population Count based on 1990, 2000, and 2010 Censuses: Philippines
Census Year Census Reference Date Total Population (in millions)
2010 May 1, 2010 92.34 2000 May 1, 2000 76.51 1990 May 1, 1990 60.70
The Philippine population increased, on average, at the annual rate of 1.90 percent
during the period 2000 to 2010. By comparison, the rate at which the country’s population was growing in the period 1990 to 2000 was higher at 2.34 percent.
Table 2. Annual Population Growth Rate
Based on 1990, 2000, and 2010 Censuses: Philippines Reference Period Population Growth Rate
2000-2010 1.90 1990-2000 2.34
Among the 17 administrative regions, Region IVA had the largest population with
12.61 million, followed by NCR with 11.86 million and Region III with 10.14 million. The population of these three regions together comprised about 37.47 percent of the Philippine population.
Five of the 17 administrative regions had an average annual population growth rate (PGR) which is higher than the national average for the period 2000 to 2010. These are Region IVA (3.07 percent), Region XII (2.46 percent), Region III (2.14 percent), Region X (2.06 percent), and Region XI (1.97 percent). Twelve regions had lower PGR than the national average.
Among the provinces, Cavite had the largest population with 3.09 million. Bulacan
had the second largest with 2.92 million and Pangasinan had the third largest with 2.78 million.
Highlights 2010 Census of Population and Housing
xxiv National Statistics Office
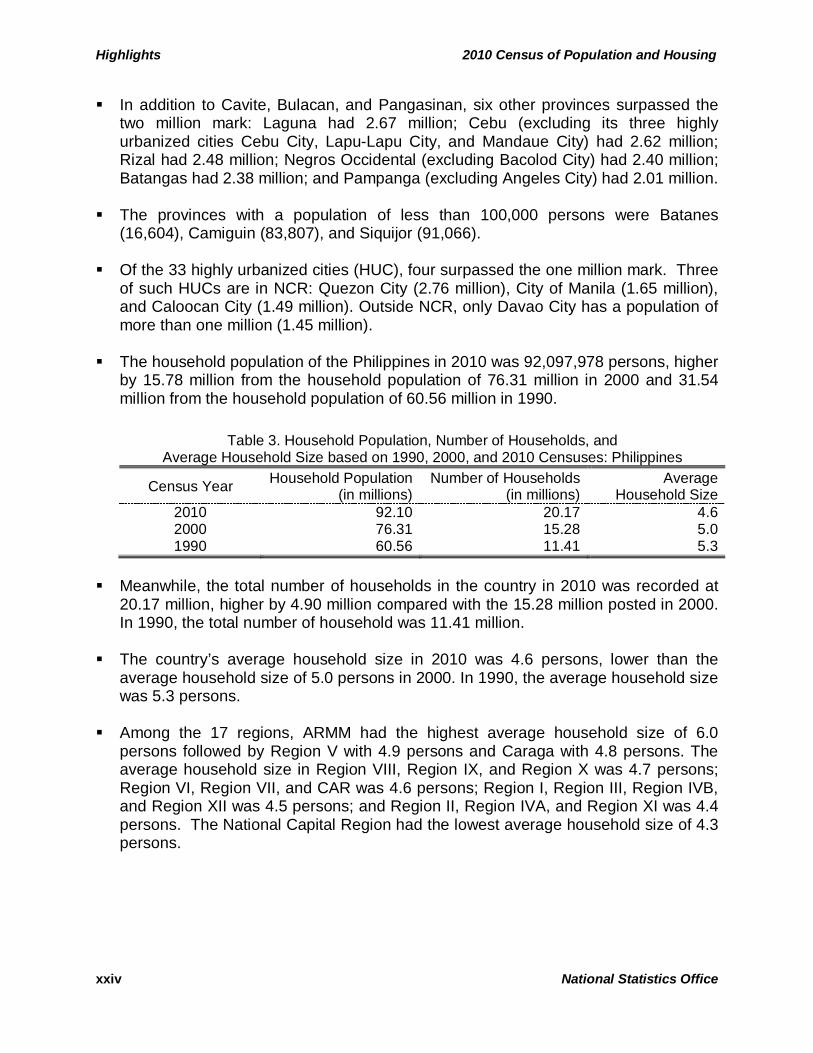
In addition to Cavite, Bulacan, and Pangasinan, six other provinces surpassed the two million mark: Laguna had 2.67 million; Cebu (excluding its three highly urbanized cities Cebu City, Lapu-Lapu City, and Mandaue City) had 2.62 million; Rizal had 2.48 million; Negros Occidental (excluding Bacolod City) had 2.40 million; Batangas had 2.38 million; and Pampanga (excluding Angeles City) had 2.01 million.
The provinces with a population of less than 100,000 persons were Batanes
(16,604), Camiguin (83,807), and Siquijor (91,066). Of the 33 highly urbanized cities (HUC), four surpassed the one million mark. Three
of such HUCs are in NCR: Quezon City (2.76 million), City of Manila (1.65 million), and Caloocan City (1.49 million). Outside NCR, only Davao City has a population of more than one million (1.45 million).
The household population of the Philippines in 2010 was 92,097,978 persons, higher
by 15.78 million from the household population of 76.31 million in 2000 and 31.54 million from the household population of 60.56 million in 1990.
Meanwhile, the total number of households in the country in 2010 was recorded at
20.17 million, higher by 4.90 million compared with the 15.28 million posted in 2000. In 1990, the total number of household was 11.41 million.
The country’s average household size in 2010 was 4.6 persons, lower than the average household size of 5.0 persons in 2000. In 1990, the average household size was 5.3 persons.
Among the 17 regions, ARMM had the highest average household size of 6.0 persons followed by Region V with 4.9 persons and Caraga with 4.8 persons. The average household size in Region VIII, Region IX, and Region X was 4.7 persons; Region VI, Region VII, and CAR was 4.6 persons; Region I, Region III, Region IVB, and Region XII was 4.5 persons; and Region II, Region IVA, and Region XI was 4.4 persons. The National Capital Region had the lowest average household size of 4.3 persons.
Table 3. Household Population, Number of Households, and Average Household Size based on 1990, 2000, and 2010 Censuses: Philippines
Census Year Household Population (in millions)
Number of Households (in millions)
Average Household Size
2010 92.10 20.17 4.6 2000 76.31 15.28 5.0 1990 60.56 11.41 5.3
2010 Census of Population and Housing Highlights
National Statistics Office xxv
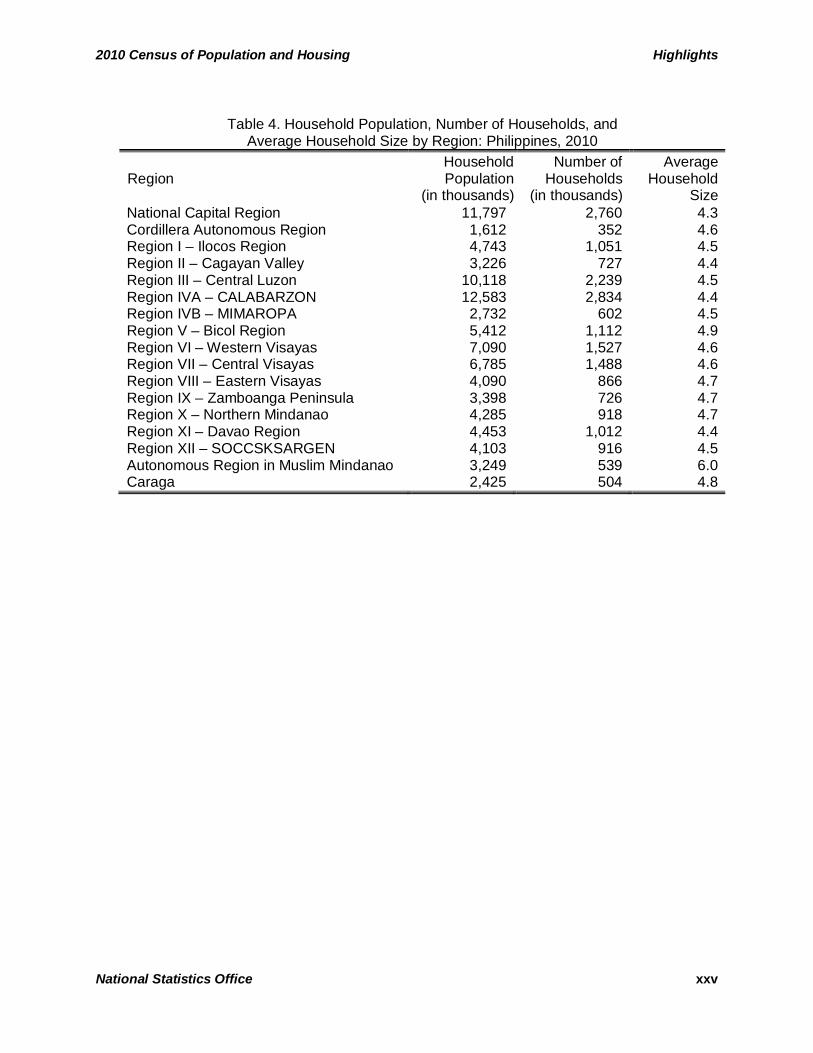
Table 4. Household Population, Number of Households, and Average Household Size by Region: Philippines, 2010
Region Household Population
(in thousands)
Number of Households
(in thousands)
Average Household
Size National Capital Region 11,797 2,760 4.3 Cordillera Autonomous Region 1,612 352 4.6 Region I – Ilocos Region 4,743 1,051 4.5 Region II – Cagayan Valley 3,226 727 4.4 Region III – Central Luzon 10,118 2,239 4.5 Region IVA – CALABARZON 12,583 2,834 4.4 Region IVB – MIMAROPA 2,732 602 4.5 Region V – Bicol Region 5,412 1,112 4.9 Region VI – Western Visayas 7,090 1,527 4.6 Region VII – Central Visayas 6,785 1,488 4.6 Region VIII – Eastern Visayas 4,090 866 4.7 Region IX – Zamboanga Peninsula 3,398 726 4.7 Region X – Northern Mindanao 4,285 918 4.7 Region XI – Davao Region 4,453 1,012 4.4 Region XII – SOCCSKSARGEN 4,103 916 4.5 Autonomous Region in Muslim Mindanao 3,249 539 6.0 Caraga 2,425 504 4.8
Highlights 2010 Census of Population and Housing
xxvi National Statistics Office
HIGHLIGHTS OF REGION V – BICOL REGION POPULATION
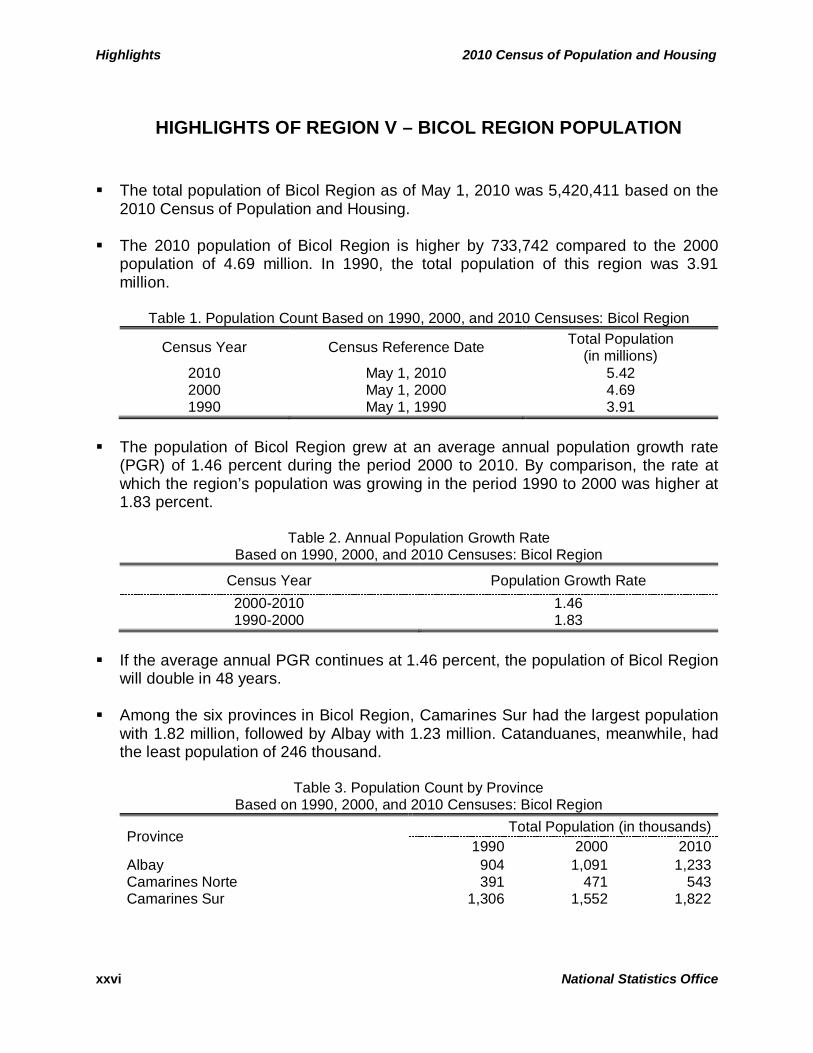
The total population of Bicol Region as of May 1, 2010 was 5,420,411 based on the 2010 Census of Population and Housing.
The 2010 population of Bicol Region is higher by 733,742 compared to the 2000
population of 4.69 million. In 1990, the total population of this region was 3.91 million.
Table 1. Population Count Based on 1990, 2000, and 2010 Censuses: Bicol Region
Census Year Census Reference Date Total Population (in millions)
2010 May 1, 2010 5.42 2000 May 1, 2000 4.69 1990 May 1, 1990 3.91
The population of Bicol Region grew at an average annual population growth rate
(PGR) of 1.46 percent during the period 2000 to 2010. By comparison, the rate at which the region’s population was growing in the period 1990 to 2000 was higher at 1.83 percent.
Table 2. Annual Population Growth Rate Based on 1990, 2000, and 2010 Censuses: Bicol Region
Census Year Population Growth Rate 2000-2010 1.46 1990-2000 1.83
If the average annual PGR continues at 1.46 percent, the population of Bicol Region
will double in 48 years. Among the six provinces in Bicol Region, Camarines Sur had the largest population
with 1.82 million, followed by Albay with 1.23 million. Catanduanes, meanwhile, had the least population of 246 thousand.
Table 3. Population Count by Province
Based on 1990, 2000, and 2010 Censuses: Bicol Region
Province Total Population (in thousands) 1990 2000 2010
Albay 904 1,091 1,233 Camarines Norte 391 471 543 Camarines Sur 1,306 1,552 1,822
2010 Census of Population and Housing Highlights
National Statistics Office xxvii
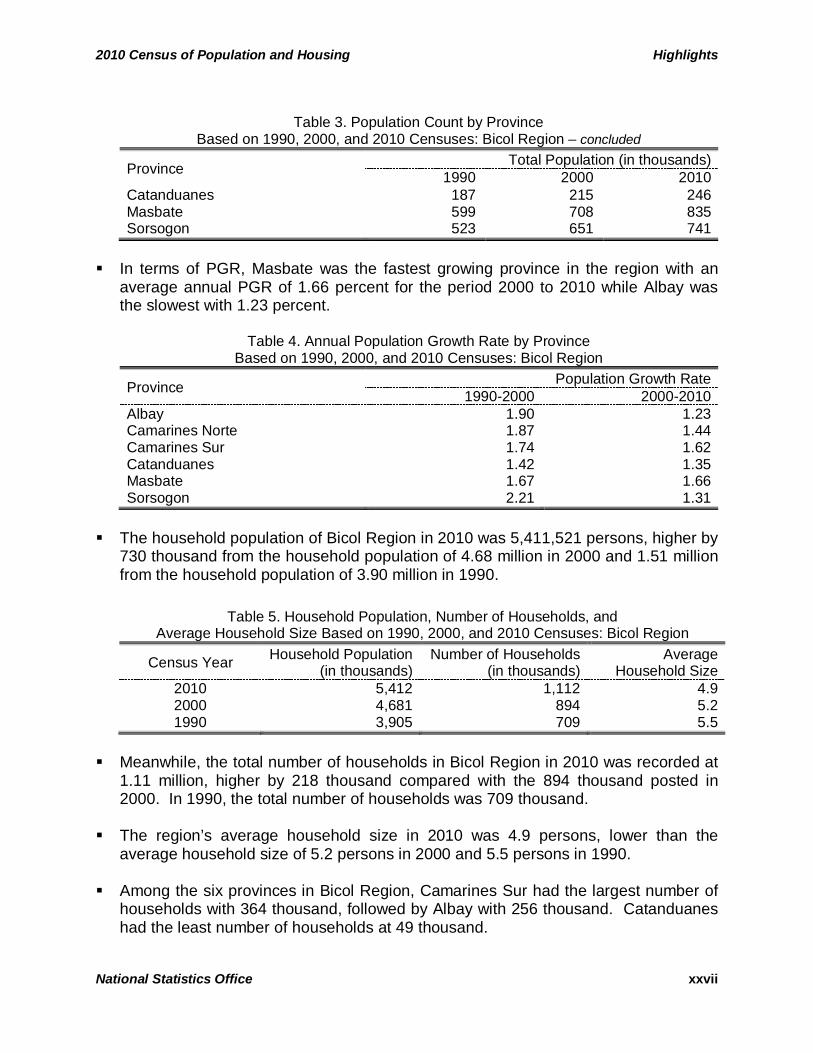
Table 3. Population Count by Province
Based on 1990, 2000, and 2010 Censuses: Bicol Region – concluded
Province Total Population (in thousands) 1990 2000 2010
Catanduanes 187 215 246 Masbate 599 708 835 Sorsogon 523 651 741
In terms of PGR, Masbate was the fastest growing province in the region with an
average annual PGR of 1.66 percent for the period 2000 to 2010 while Albay was the slowest with 1.23 percent.
Table 4. Annual Population Growth Rate by Province Based on 1990, 2000, and 2010 Censuses: Bicol Region
Province Population Growth Rate 1990-2000 2000-2010
Albay 1.90 1.23 Camarines Norte 1.87 1.44 Camarines Sur 1.74 1.62 Catanduanes 1.42 1.35 Masbate 1.67 1.66 Sorsogon 2.21 1.31
The household population of Bicol Region in 2010 was 5,411,521 persons, higher by
730 thousand from the household population of 4.68 million in 2000 and 1.51 million from the household population of 3.90 million in 1990.
Meanwhile, the total number of households in Bicol Region in 2010 was recorded at
1.11 million, higher by 218 thousand compared with the 894 thousand posted in 2000. In 1990, the total number of households was 709 thousand.
The region’s average household size in 2010 was 4.9 persons, lower than the average household size of 5.2 persons in 2000 and 5.5 persons in 1990.
Among the six provinces in Bicol Region, Camarines Sur had the largest number of households with 364 thousand, followed by Albay with 256 thousand. Catanduanes had the least number of households at 49 thousand.
Table 5. Household Population, Number of Households, and Average Household Size Based on 1990, 2000, and 2010 Censuses: Bicol Region
Census Year Household Population (in thousands)
Number of Households (in thousands)
Average Household Size
2010 5,412 1,112 4.9 2000 4,681 894 5.2 1990 3,905 709 5.5
Highlights 2010 Census of Population and Housing
xxviii National Statistics Office
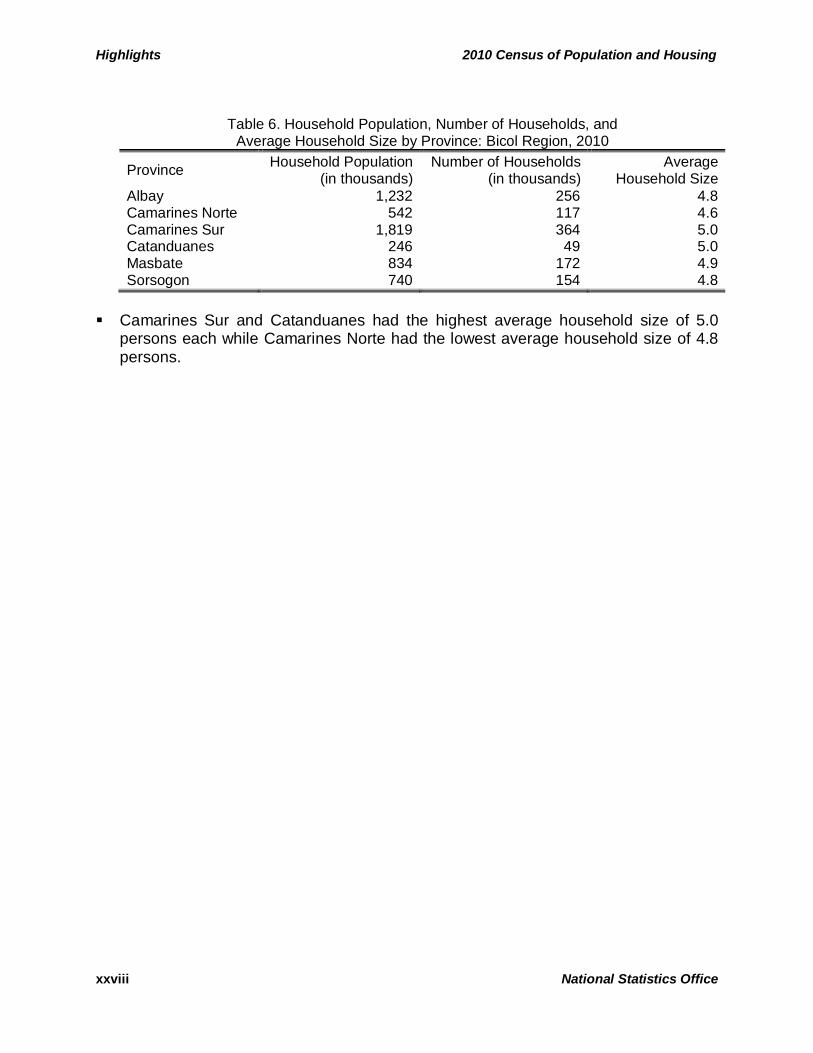
Camarines Sur and Catanduanes had the highest average household size of 5.0
persons each while Camarines Norte had the lowest average household size of 4.8 persons.
Table 6. Household Population, Number of Households, and Average Household Size by Province: Bicol Region, 2010
Province Household Population (in thousands)
Number of Households (in thousands)
Average Household Size
Albay 1,232 256 4.8 Camarines Norte 542 117 4.6 Camarines Sur 1,819 364 5.0 Catanduanes 246 49 5.0 Masbate 834 172 4.9 Sorsogon 740 154 4.8
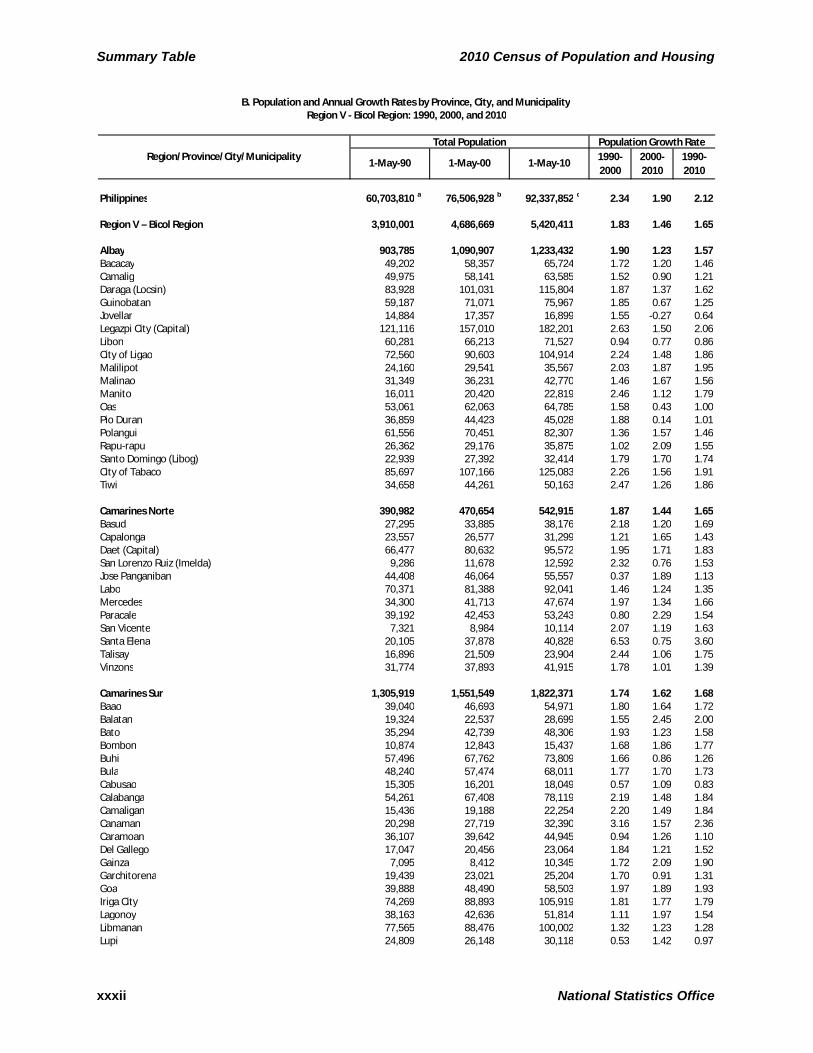
2010 Census of Population and Housing Summary Table
1990-2000
2000-2010
1990-2010
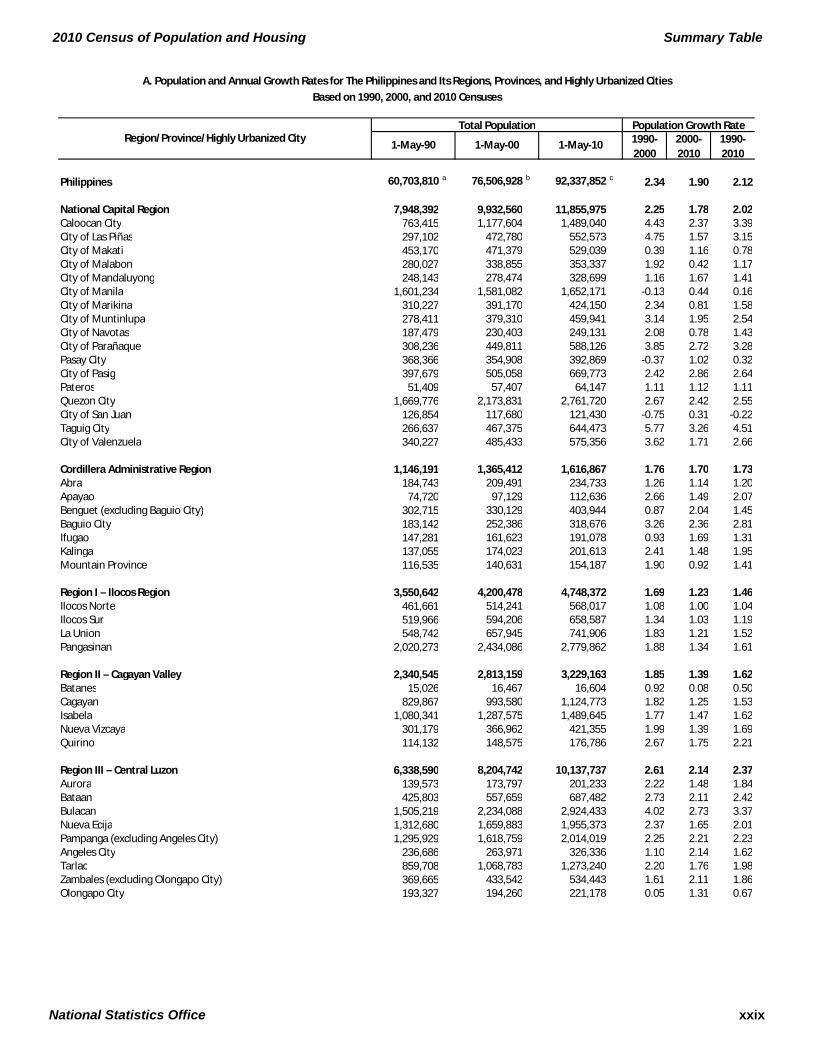
Philippines 60,703,810 a 76,506,928 b 92,337,852 c 2.34 1.90 2.12
National Capital Region 7,948,392 9,932,560 11,855,975 2.25 1.78 2.02Caloocan City 763,415 1,177,604 1,489,040 4.43 2.37 3.39City of Las Piñas 297,102 472,780 552,573 4.75 1.57 3.15City of Makati 453,170 471,379 529,039 0.39 1.16 0.78City of Malabon 280,027 338,855 353,337 1.92 0.42 1.17City of Mandaluyong 248,143 278,474 328,699 1.16 1.67 1.41City of Manila 1,601,234 1,581,082 1,652,171 -0.13 0.44 0.16City of Marikina 310,227 391,170 424,150 2.34 0.81 1.58City of Muntinlupa 278,411 379,310 459,941 3.14 1.95 2.54City of Navotas 187,479 230,403 249,131 2.08 0.78 1.43City of Parañaque 308,236 449,811 588,126 3.85 2.72 3.28Pasay City 368,366 354,908 392,869 -0.37 1.02 0.32City of Pasig 397,679 505,058 669,773 2.42 2.86 2.64Pateros 51,409 57,407 64,147 1.11 1.12 1.11Quezon City 1,669,776 2,173,831 2,761,720 2.67 2.42 2.55City of San Juan 126,854 117,680 121,430 -0.75 0.31 -0.22Taguig City 266,637 467,375 644,473 5.77 3.26 4.51City of Valenzuela 340,227 485,433 575,356 3.62 1.71 2.66
Cordillera Administrative Region 1,146,191 1,365,412 1,616,867 1.76 1.70 1.73Abra 184,743 209,491 234,733 1.26 1.14 1.20Apayao 74,720 97,129 112,636 2.66 1.49 2.07Benguet (excluding Baguio City) 302,715 330,129 403,944 0.87 2.04 1.45Baguio City 183,142 252,386 318,676 3.26 2.36 2.81Ifugao 147,281 161,623 191,078 0.93 1.69 1.31Kalinga 137,055 174,023 201,613 2.41 1.48 1.95Mountain Province 116,535 140,631 154,187 1.90 0.92 1.41
Region I – Ilocos Region 3,550,642 4,200,478 4,748,372 1.69 1.23 1.46Ilocos Norte 461,661 514,241 568,017 1.08 1.00 1.04Ilocos Sur 519,966 594,206 658,587 1.34 1.03 1.19La Union 548,742 657,945 741,906 1.83 1.21 1.52Pangasinan 2,020,273 2,434,086 2,779,862 1.88 1.34 1.61
Region II – Cagayan Valley 2,340,545 2,813,159 3,229,163 1.85 1.39 1.62Batanes 15,026 16,467 16,604 0.92 0.08 0.50Cagayan 829,867 993,580 1,124,773 1.82 1.25 1.53Isabela 1,080,341 1,287,575 1,489,645 1.77 1.47 1.62Nueva Vizcaya 301,179 366,962 421,355 1.99 1.39 1.69Quirino 114,132 148,575 176,786 2.67 1.75 2.21
Region III – Central Luzon 6,338,590 8,204,742 10,137,737 2.61 2.14 2.37Aurora 139,573 173,797 201,233 2.22 1.48 1.84Bataan 425,803 557,659 687,482 2.73 2.11 2.42Bulacan 1,505,219 2,234,088 2,924,433 4.02 2.73 3.37Nueva Ecija 1,312,680 1,659,883 1,955,373 2.37 1.65 2.01Pampanga (excluding Angeles City) 1,295,929 1,618,759 2,014,019 2.25 2.21 2.23Angeles City 236,686 263,971 326,336 1.10 2.14 1.62Tarlac 859,708 1,068,783 1,273,240 2.20 1.76 1.98Zambales (excluding Olongapo City) 369,665 433,542 534,443 1.61 2.11 1.86Olongapo City 193,327 194,260 221,178 0.05 1.31 0.67
A. Population and Annual Growth Rates for The Philippines and Its Regions, Provinces, and Highly Urbanized Cities
Based on 1990, 2000, and 2010 Censuses
Region/Province/Highly Urbanized CityPopulation Growth RateTotal Population
1-May-90 1-May-00 1-May-10
National Statistics Office xxix
Summary Table 2010 Census of Population and Housing
1990-2000
2000-2010
1990-2010
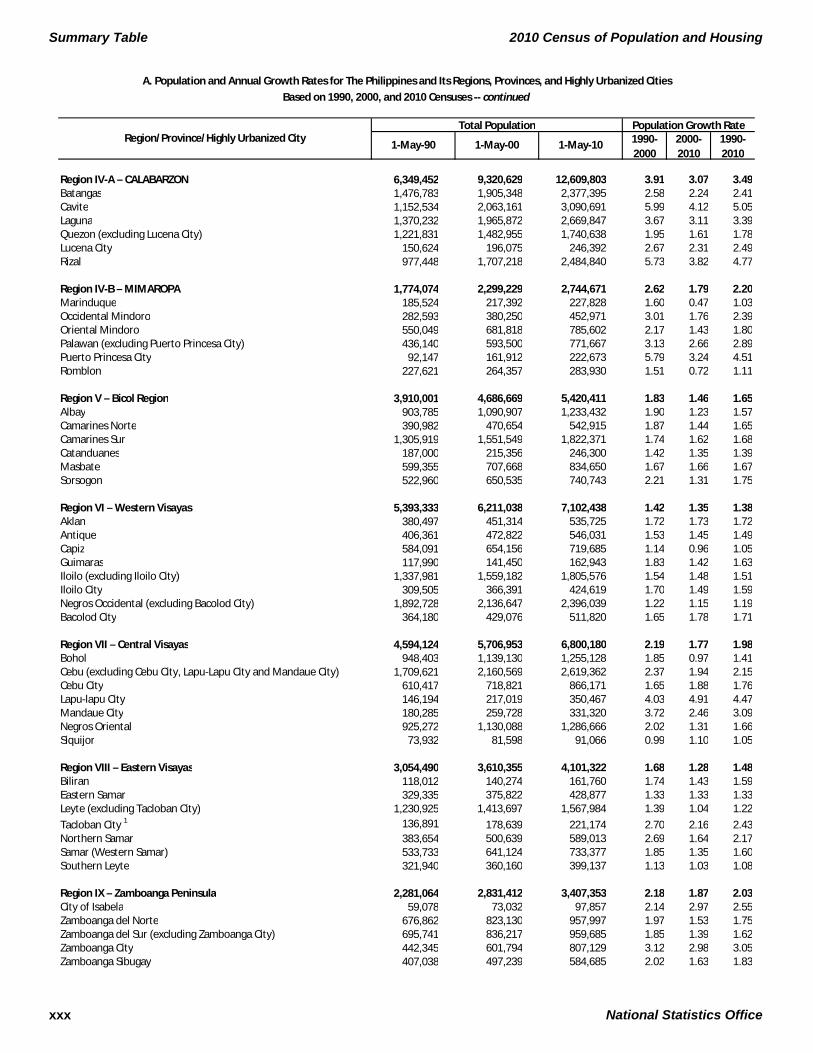
A. Population and Annual Growth Rates for The Philippines and Its Regions, Provinces, and Highly Urbanized Cities
Based on 1990, 2000, and 2010 Censuses -- continued
Region/Province/Highly Urbanized CityPopulation Growth RateTotal Population
1-May-90 1-May-00 1-May-10
Region IV-A – CALABARZON 6,349,452 9,320,629 12,609,803 3.91 3.07 3.49Batangas 1,476,783 1,905,348 2,377,395 2.58 2.24 2.41Cavite 1,152,534 2,063,161 3,090,691 5.99 4.12 5.05Laguna 1,370,232 1,965,872 2,669,847 3.67 3.11 3.39Quezon (excluding Lucena City) 1,221,831 1,482,955 1,740,638 1.95 1.61 1.78Lucena City 150,624 196,075 246,392 2.67 2.31 2.49Rizal 977,448 1,707,218 2,484,840 5.73 3.82 4.77
Region IV-B – MIMAROPA 1,774,074 2,299,229 2,744,671 2.62 1.79 2.20Marinduque 185,524 217,392 227,828 1.60 0.47 1.03Occidental Mindoro 282,593 380,250 452,971 3.01 1.76 2.39Oriental Mindoro 550,049 681,818 785,602 2.17 1.43 1.80Palawan (excluding Puerto Princesa City) 436,140 593,500 771,667 3.13 2.66 2.89Puerto Princesa City 92,147 161,912 222,673 5.79 3.24 4.51Romblon 227,621 264,357 283,930 1.51 0.72 1.11
Region V – Bicol Region 3,910,001 4,686,669 5,420,411 1.83 1.46 1.65Albay 903,785 1,090,907 1,233,432 1.90 1.23 1.57Camarines Norte 390,982 470,654 542,915 1.87 1.44 1.65Camarines Sur 1,305,919 1,551,549 1,822,371 1.74 1.62 1.68Catanduanes 187,000 215,356 246,300 1.42 1.35 1.39Masbate 599,355 707,668 834,650 1.67 1.66 1.67Sorsogon 522,960 650,535 740,743 2.21 1.31 1.75
Region VI – Western Visayas 5,393,333 6,211,038 7,102,438 1.42 1.35 1.38Aklan 380,497 451,314 535,725 1.72 1.73 1.72Antique 406,361 472,822 546,031 1.53 1.45 1.49Capiz 584,091 654,156 719,685 1.14 0.96 1.05Guimaras 117,990 141,450 162,943 1.83 1.42 1.63Iloilo (excluding Iloilo City) 1,337,981 1,559,182 1,805,576 1.54 1.48 1.51Iloilo City 309,505 366,391 424,619 1.70 1.49 1.59Negros Occidental (excluding Bacolod City) 1,892,728 2,136,647 2,396,039 1.22 1.15 1.19Bacolod City 364,180 429,076 511,820 1.65 1.78 1.71
Region VII – Central Visayas 4,594,124 5,706,953 6,800,180 2.19 1.77 1.98Bohol 948,403 1,139,130 1,255,128 1.85 0.97 1.41Cebu (excluding Cebu City, Lapu-Lapu City and Mandaue City) 1,709,621 2,160,569 2,619,362 2.37 1.94 2.15Cebu City 610,417 718,821 866,171 1.65 1.88 1.76Lapu-lapu City 146,194 217,019 350,467 4.03 4.91 4.47Mandaue City 180,285 259,728 331,320 3.72 2.46 3.09Negros Oriental 925,272 1,130,088 1,286,666 2.02 1.31 1.66Siquijor 73,932 81,598 91,066 0.99 1.10 1.05
Region VIII – Eastern Visayas 3,054,490 3,610,355 4,101,322 1.68 1.28 1.48Biliran 118,012 140,274 161,760 1.74 1.43 1.59Eastern Samar 329,335 375,822 428,877 1.33 1.33 1.33Leyte (excluding Tacloban City) 1,230,925 1,413,697 1,567,984 1.39 1.04 1.22
Tacloban City 1 136,891 178,639 221,174 2.70 2.16 2.43Northern Samar 383,654 500,639 589,013 2.69 1.64 2.17Samar (Western Samar) 533,733 641,124 733,377 1.85 1.35 1.60Southern Leyte 321,940 360,160 399,137 1.13 1.03 1.08
Region IX – Zamboanga Peninsula 2,281,064 2,831,412 3,407,353 2.18 1.87 2.03City of Isabela 59,078 73,032 97,857 2.14 2.97 2.55Zamboanga del Norte 676,862 823,130 957,997 1.97 1.53 1.75Zamboanga del Sur (excluding Zamboanga City) 695,741 836,217 959,685 1.85 1.39 1.62Zamboanga City 442,345 601,794 807,129 3.12 2.98 3.05Zamboanga Sibugay 407,038 497,239 584,685 2.02 1.63 1.83
xxx National Statistics Office
2010 Census of Population and Housing Summary Table
1990-2000
2000-2010
1990-2010
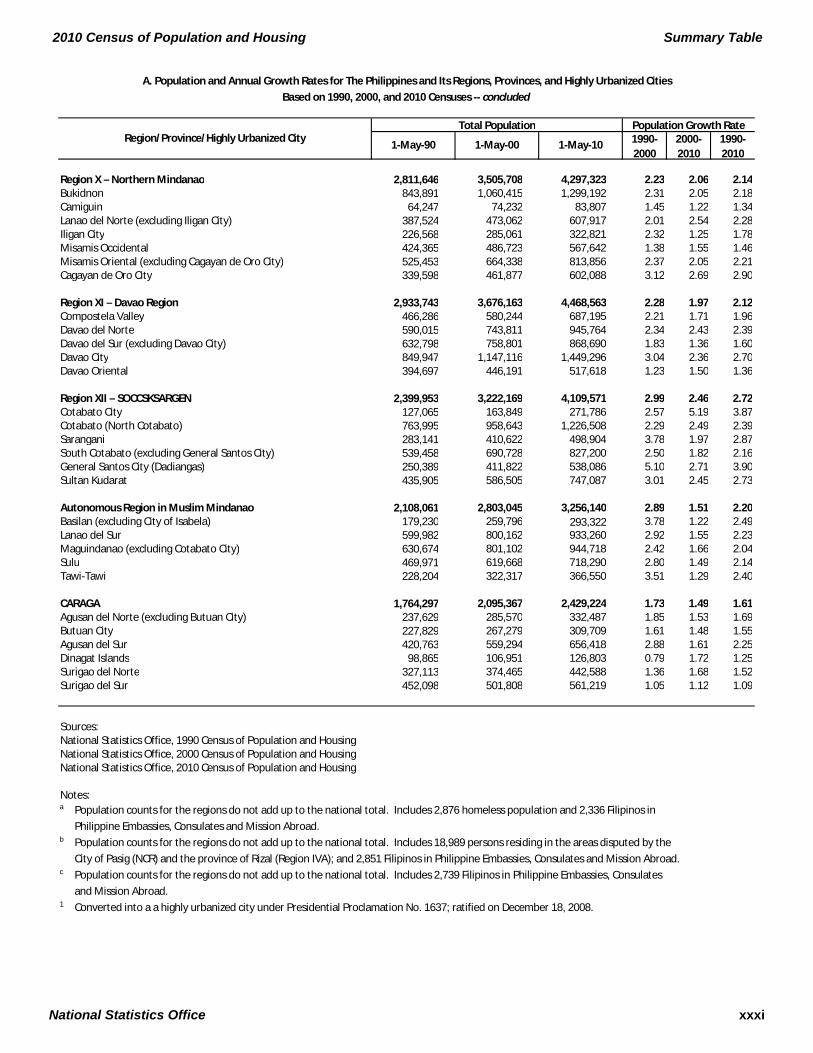
A. Population and Annual Growth Rates for The Philippines and Its Regions, Provinces, and Highly Urbanized Cities
Based on 1990, 2000, and 2010 Censuses -- concluded
Region/Province/Highly Urbanized CityPopulation Growth RateTotal Population
1-May-90 1-May-00 1-May-10
Region X – Northern Mindanao 2,811,646 3,505,708 4,297,323 2.23 2.06 2.14Bukidnon 843,891 1,060,415 1,299,192 2.31 2.05 2.18Camiguin 64,247 74,232 83,807 1.45 1.22 1.34Lanao del Norte (excluding Iligan City) 387,524 473,062 607,917 2.01 2.54 2.28Iligan City 226,568 285,061 322,821 2.32 1.25 1.78Misamis Occidental 424,365 486,723 567,642 1.38 1.55 1.46Misamis Oriental (excluding Cagayan de Oro City) 525,453 664,338 813,856 2.37 2.05 2.21Cagayan de Oro City 339,598 461,877 602,088 3.12 2.69 2.90
Region XI – Davao Region 2,933,743 3,676,163 4,468,563 2.28 1.97 2.12Compostela Valley 466,286 580,244 687,195 2.21 1.71 1.96Davao del Norte 590,015 743,811 945,764 2.34 2.43 2.39Davao del Sur (excluding Davao City) 632,798 758,801 868,690 1.83 1.36 1.60Davao City 849,947 1,147,116 1,449,296 3.04 2.36 2.70Davao Oriental 394,697 446,191 517,618 1.23 1.50 1.36
Region XII – SOCCSKSARGEN 2,399,953 3,222,169 4,109,571 2.99 2.46 2.72Cotabato City 127,065 163,849 271,786 2.57 5.19 3.87Cotabato (North Cotabato) 763,995 958,643 1,226,508 2.29 2.49 2.39Sarangani 283,141 410,622 498,904 3.78 1.97 2.87South Cotabato (excluding General Santos City) 539,458 690,728 827,200 2.50 1.82 2.16General Santos City (Dadiangas) 250,389 411,822 538,086 5.10 2.71 3.90Sultan Kudarat 435,905 586,505 747,087 3.01 2.45 2.73
Autonomous Region in Muslim Mindanao 2,108,061 2,803,045 3,256,140 2.89 1.51 2.20Basilan (excluding City of Isabela) 179,230 259,796 293,322 3.78 1.22 2.49Lanao del Sur 599,982 800,162 933,260 2.92 1.55 2.23Maguindanao (excluding Cotabato City) 630,674 801,102 944,718 2.42 1.66 2.04Sulu 469,971 619,668 718,290 2.80 1.49 2.14Tawi-Tawi 228,204 322,317 366,550 3.51 1.29 2.40
CARAGA 1,764,297 2,095,367 2,429,224 1.73 1.49 1.61Agusan del Norte (excluding Butuan City) 237,629 285,570 332,487 1.85 1.53 1.69Butuan City 227,829 267,279 309,709 1.61 1.48 1.55Agusan del Sur 420,763 559,294 656,418 2.88 1.61 2.25Dinagat Islands 98,865 106,951 126,803 0.79 1.72 1.25Surigao del Norte 327,113 374,465 442,588 1.36 1.68 1.52Surigao del Sur 452,098 501,808 561,219 1.05 1.12 1.09
Sources:National Statistics Office, 1990 Census of Population and HousingNational Statistics Office, 2000 Census of Population and Housing National Statistics Office, 2010 Census of Population and Housing
Notes:a Population counts for the regions do not add up to the national total. Includes 2,876 homeless population and 2,336 Filipinos in
Philippine Embassies, Consulates and Mission Abroad.b Population counts for the regions do not add up to the national total. Includes 18,989 persons residing in the areas disputed by the
City of Pasig (NCR) and the province of Rizal (Region IVA); and 2,851 Filipinos in Philippine Embassies, Consulates and Mission Abroad.c Population counts for the regions do not add up to the national total. Includes 2,739 Filipinos in Philippine Embassies, Consulates
and Mission Abroad.1 Converted into a a highly urbanized city under Presidential Proclamation No. 1637; ratified on December 18, 2008.
National Statistics Office xxxi
Summary Table 2010 Census of Population and Housing
1990-2000
2000-2010
1990-2010
Philippines 60,703,810 a 76,506,928 b 92,337,852 c 2.34 1.90 2.12
Region V – Bicol Region 3,910,001 4,686,669 5,420,411 1.83 1.46 1.65
Albay 903,785 1,090,907 1,233,432 1.90 1.23 1.57Bacacay 49,202 58,357 65,724 1.72 1.20 1.46Camalig 49,975 58,141 63,585 1.52 0.90 1.21Daraga (Locsin) 83,928 101,031 115,804 1.87 1.37 1.62Guinobatan 59,187 71,071 75,967 1.85 0.67 1.25Jovellar 14,884 17,357 16,899 1.55 -0.27 0.64Legazpi City (Capital) 121,116 157,010 182,201 2.63 1.50 2.06Libon 60,281 66,213 71,527 0.94 0.77 0.86City of Ligao 72,560 90,603 104,914 2.24 1.48 1.86Malilipot 24,160 29,541 35,567 2.03 1.87 1.95Malinao 31,349 36,231 42,770 1.46 1.67 1.56Manito 16,011 20,420 22,819 2.46 1.12 1.79Oas 53,061 62,063 64,785 1.58 0.43 1.00Pio Duran 36,859 44,423 45,028 1.88 0.14 1.01Polangui 61,556 70,451 82,307 1.36 1.57 1.46Rapu-rapu 26,362 29,176 35,875 1.02 2.09 1.55Santo Domingo (Libog) 22,939 27,392 32,414 1.79 1.70 1.74City of Tabaco 85,697 107,166 125,083 2.26 1.56 1.91Tiwi 34,658 44,261 50,163 2.47 1.26 1.86
Camarines Norte 390,982 470,654 542,915 1.87 1.44 1.65Basud 27,295 33,885 38,176 2.18 1.20 1.69Capalonga 23,557 26,577 31,299 1.21 1.65 1.43Daet (Capital) 66,477 80,632 95,572 1.95 1.71 1.83San Lorenzo Ruiz (Imelda) 9,286 11,678 12,592 2.32 0.76 1.53Jose Panganiban 44,408 46,064 55,557 0.37 1.89 1.13Labo 70,371 81,388 92,041 1.46 1.24 1.35Mercedes 34,300 41,713 47,674 1.97 1.34 1.66Paracale 39,192 42,453 53,243 0.80 2.29 1.54San Vicente 7,321 8,984 10,114 2.07 1.19 1.63Santa Elena 20,105 37,878 40,828 6.53 0.75 3.60Talisay 16,896 21,509 23,904 2.44 1.06 1.75Vinzons 31,774 37,893 41,915 1.78 1.01 1.39
Camarines Sur 1,305,919 1,551,549 1,822,371 1.74 1.62 1.68Baao 39,040 46,693 54,971 1.80 1.64 1.72Balatan 19,324 22,537 28,699 1.55 2.45 2.00Bato 35,294 42,739 48,306 1.93 1.23 1.58Bombon 10,874 12,843 15,437 1.68 1.86 1.77Buhi 57,496 67,762 73,809 1.66 0.86 1.26Bula 48,240 57,474 68,011 1.77 1.70 1.73Cabusao 15,305 16,201 18,049 0.57 1.09 0.83Calabanga 54,261 67,408 78,119 2.19 1.48 1.84Camaligan 15,436 19,188 22,254 2.20 1.49 1.84Canaman 20,298 27,719 32,390 3.16 1.57 2.36Caramoan 36,107 39,642 44,945 0.94 1.26 1.10Del Gallego 17,047 20,456 23,064 1.84 1.21 1.52Gainza 7,095 8,412 10,345 1.72 2.09 1.90Garchitorena 19,439 23,021 25,204 1.70 0.91 1.31Goa 39,888 48,490 58,503 1.97 1.89 1.93Iriga City 74,269 88,893 105,919 1.81 1.77 1.79Lagonoy 38,163 42,636 51,814 1.11 1.97 1.54Libmanan 77,565 88,476 100,002 1.32 1.23 1.28Lupi 24,809 26,148 30,118 0.53 1.42 0.97
B. Population and Annual Growth Rates by Province, City, and MunicipalityRegion V - Bicol Region: 1990, 2000, and 2010
Population Growth RateTotal PopulationRegion/Province/City/Municipality
1-May-001-May-90 1-May-10
xxxii National Statistics Office
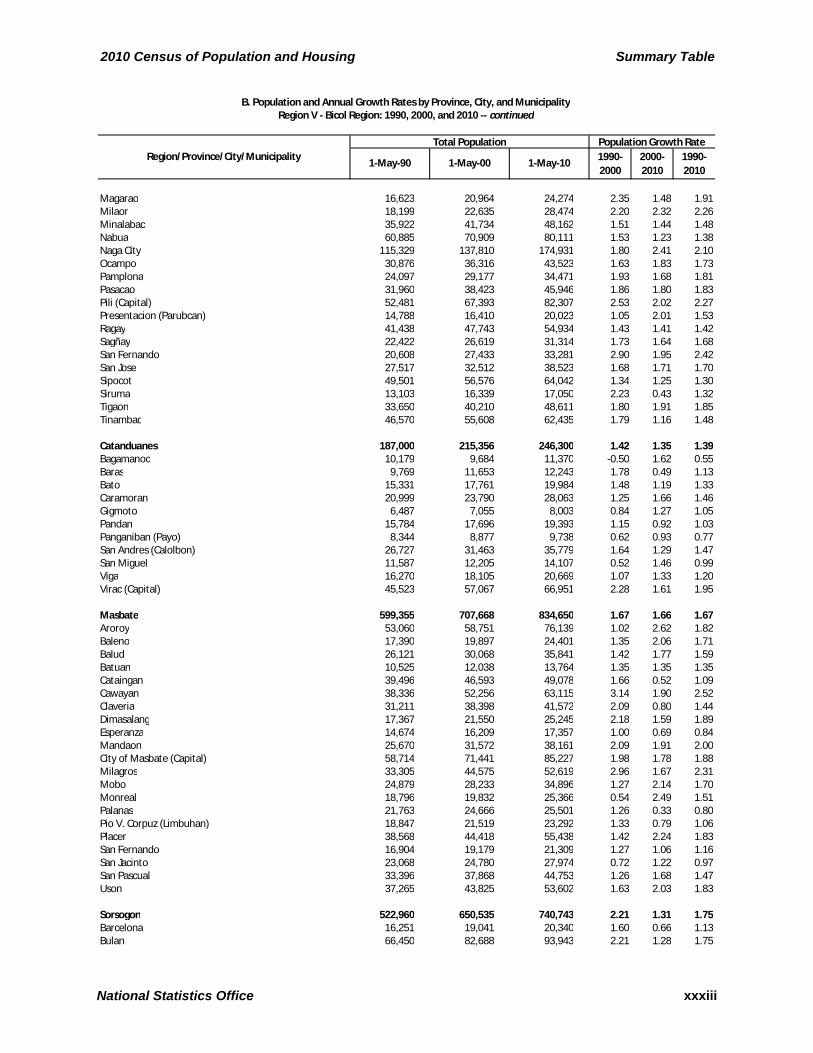
2010 Census of Population and Housing Summary Table
1990-2000
2000-2010
1990-2010
B. Population and Annual Growth Rates by Province, City, and MunicipalityRegion V - Bicol Region: 1990, 2000, and 2010 -- continued
Population Growth RateTotal PopulationRegion/Province/City/Municipality
1-May-001-May-90 1-May-10
Magarao 16,623 20,964 24,274 2.35 1.48 1.91Milaor 18,199 22,635 28,474 2.20 2.32 2.26Minalabac 35,922 41,734 48,162 1.51 1.44 1.48Nabua 60,885 70,909 80,111 1.53 1.23 1.38Naga City 115,329 137,810 174,931 1.80 2.41 2.10Ocampo 30,876 36,316 43,523 1.63 1.83 1.73Pamplona 24,097 29,177 34,471 1.93 1.68 1.81Pasacao 31,960 38,423 45,946 1.86 1.80 1.83Pili (Capital) 52,481 67,393 82,307 2.53 2.02 2.27Presentacion (Parubcan) 14,788 16,410 20,023 1.05 2.01 1.53Ragay 41,438 47,743 54,934 1.43 1.41 1.42Sagñay 22,422 26,619 31,314 1.73 1.64 1.68San Fernando 20,608 27,433 33,281 2.90 1.95 2.42San Jose 27,517 32,512 38,523 1.68 1.71 1.70Sipocot 49,501 56,576 64,042 1.34 1.25 1.30Siruma 13,103 16,339 17,050 2.23 0.43 1.32Tigaon 33,650 40,210 48,611 1.80 1.91 1.85Tinambac 46,570 55,608 62,435 1.79 1.16 1.48
Catanduanes 187,000 215,356 246,300 1.42 1.35 1.39Bagamanoc 10,179 9,684 11,370 -0.50 1.62 0.55Baras 9,769 11,653 12,243 1.78 0.49 1.13Bato 15,331 17,761 19,984 1.48 1.19 1.33Caramoran 20,999 23,790 28,063 1.25 1.66 1.46Gigmoto 6,487 7,055 8,003 0.84 1.27 1.05Pandan 15,784 17,696 19,393 1.15 0.92 1.03Panganiban (Payo) 8,344 8,877 9,738 0.62 0.93 0.77San Andres (Calolbon) 26,727 31,463 35,779 1.64 1.29 1.47San Miguel 11,587 12,205 14,107 0.52 1.46 0.99Viga 16,270 18,105 20,669 1.07 1.33 1.20Virac (Capital) 45,523 57,067 66,951 2.28 1.61 1.95
Masbate 599,355 707,668 834,650 1.67 1.66 1.67Aroroy 53,060 58,751 76,139 1.02 2.62 1.82Baleno 17,390 19,897 24,401 1.35 2.06 1.71Balud 26,121 30,068 35,841 1.42 1.77 1.59Batuan 10,525 12,038 13,764 1.35 1.35 1.35Cataingan 39,496 46,593 49,078 1.66 0.52 1.09Cawayan 38,336 52,256 63,115 3.14 1.90 2.52Claveria 31,211 38,398 41,572 2.09 0.80 1.44Dimasalang 17,367 21,550 25,245 2.18 1.59 1.89Esperanza 14,674 16,209 17,357 1.00 0.69 0.84Mandaon 25,670 31,572 38,161 2.09 1.91 2.00City of Masbate (Capital) 58,714 71,441 85,227 1.98 1.78 1.88Milagros 33,305 44,575 52,619 2.96 1.67 2.31Mobo 24,879 28,233 34,896 1.27 2.14 1.70Monreal 18,796 19,832 25,366 0.54 2.49 1.51Palanas 21,763 24,666 25,501 1.26 0.33 0.80Pio V. Corpuz (Limbuhan) 18,847 21,519 23,292 1.33 0.79 1.06Placer 38,568 44,418 55,438 1.42 2.24 1.83San Fernando 16,904 19,179 21,309 1.27 1.06 1.16San Jacinto 23,068 24,780 27,974 0.72 1.22 0.97San Pascual 33,396 37,868 44,753 1.26 1.68 1.47Uson 37,265 43,825 53,602 1.63 2.03 1.83
Sorsogon 522,960 650,535 740,743 2.21 1.31 1.75Barcelona 16,251 19,041 20,340 1.60 0.66 1.13Bulan 66,450 82,688 93,943 2.21 1.28 1.75
National Statistics Office xxxiii
Summary Table 2010 Census of Population and Housing
1990-2000
2000-2010
1990-2010
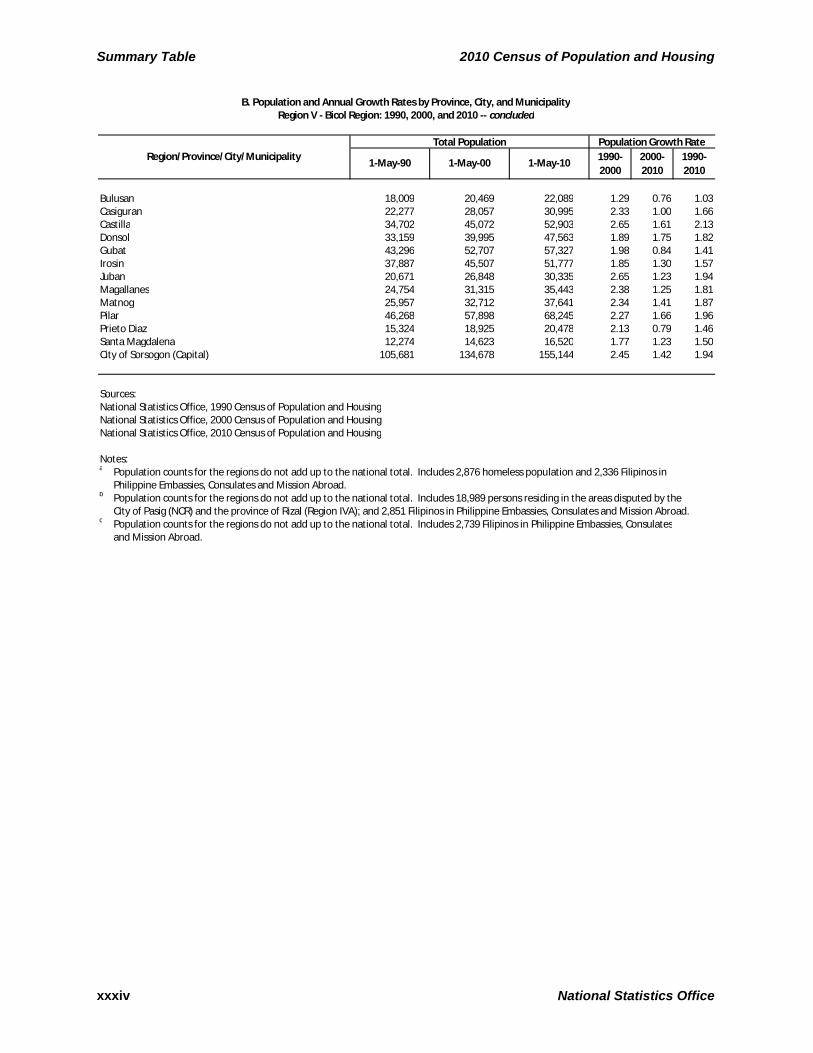
B. Population and Annual Growth Rates by Province, City, and MunicipalityRegion V - Bicol Region: 1990, 2000, and 2010 -- concluded
Population Growth RateTotal PopulationRegion/Province/City/Municipality
1-May-001-May-90 1-May-10
Bulusan 18,009 20,469 22,089 1.29 0.76 1.03Casiguran 22,277 28,057 30,995 2.33 1.00 1.66Castilla 34,702 45,072 52,903 2.65 1.61 2.13Donsol 33,159 39,995 47,563 1.89 1.75 1.82Gubat 43,296 52,707 57,327 1.98 0.84 1.41Irosin 37,887 45,507 51,777 1.85 1.30 1.57Juban 20,671 26,848 30,335 2.65 1.23 1.94Magallanes 24,754 31,315 35,443 2.38 1.25 1.81Matnog 25,957 32,712 37,641 2.34 1.41 1.87Pilar 46,268 57,898 68,245 2.27 1.66 1.96Prieto Diaz 15,324 18,925 20,478 2.13 0.79 1.46Santa Magdalena 12,274 14,623 16,520 1.77 1.23 1.50City of Sorsogon (Capital) 105,681 134,678 155,144 2.45 1.42 1.94
Sources:National Statistics Office, 1990 Census of Population and HousingNational Statistics Office, 2000 Census of Population and Housing National Statistics Office, 2010 Census of Population and Housing
Notes:a Population counts for the regions do not add up to the national total. Includes 2,876 homeless population and 2,336 Filipinos in
Philippine Embassies, Consulates and Mission Abroad.b Population counts for the regions do not add up to the national total. Includes 18,989 persons residing in the areas disputed by the
City of Pasig (NCR) and the province of Rizal (Region IVA); and 2,851 Filipinos in Philippine Embassies, Consulates and Mission Abroad.c Population counts for the regions do not add up to the national total. Includes 2,739 Filipinos in Philippine Embassies, Consulates
and Mission Abroad.
xxxiv National Statistics Office
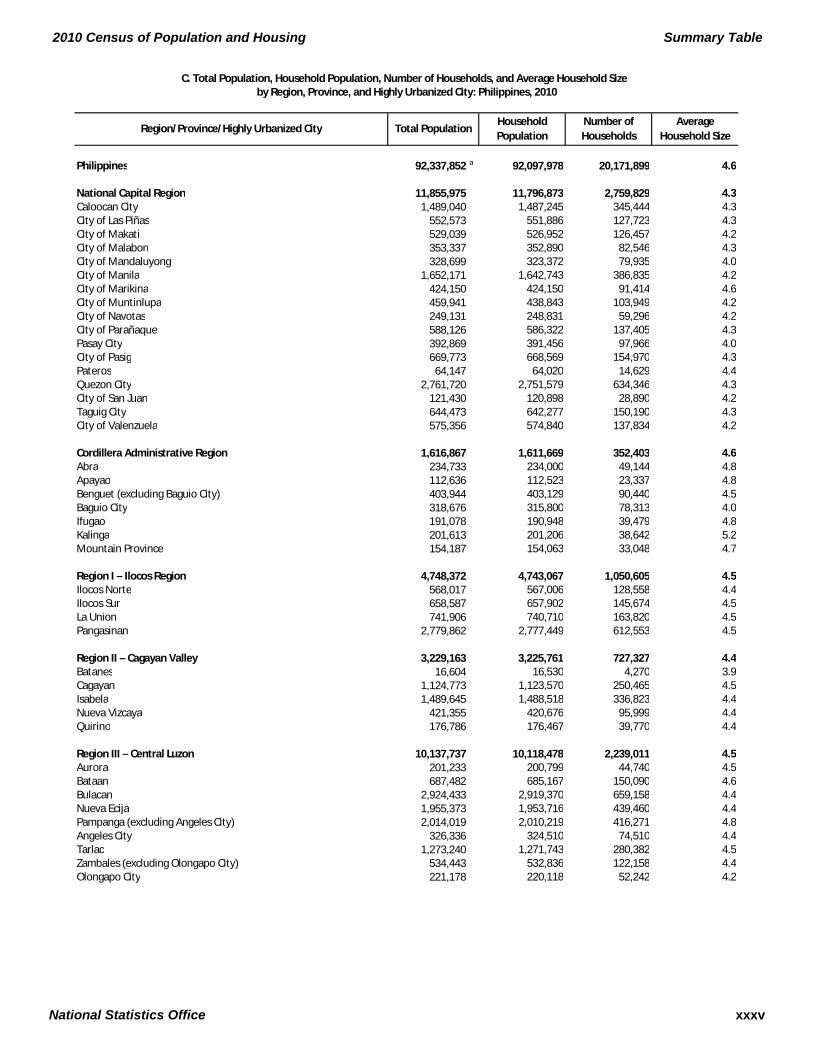
2010 Census of Population and Housing Summary Table
Philippines 92,337,852 a 92,097,978 20,171,899 4.6
National Capital Region 11,855,975 11,796,873 2,759,829 4.3Caloocan City 1,489,040 1,487,245 345,444 4.3City of Las Piñas 552,573 551,886 127,723 4.3City of Makati 529,039 526,952 126,457 4.2City of Malabon 353,337 352,890 82,546 4.3City of Mandaluyong 328,699 323,372 79,935 4.0City of Manila 1,652,171 1,642,743 386,835 4.2City of Marikina 424,150 424,150 91,414 4.6City of Muntinlupa 459,941 438,843 103,949 4.2City of Navotas 249,131 248,831 59,296 4.2City of Parañaque 588,126 586,322 137,405 4.3Pasay City 392,869 391,456 97,966 4.0City of Pasig 669,773 668,569 154,970 4.3Pateros 64,147 64,020 14,629 4.4Quezon City 2,761,720 2,751,579 634,346 4.3City of San Juan 121,430 120,898 28,890 4.2Taguig City 644,473 642,277 150,190 4.3City of Valenzuela 575,356 574,840 137,834 4.2
Cordillera Administrative Region 1,616,867 1,611,669 352,403 4.6Abra 234,733 234,000 49,144 4.8Apayao 112,636 112,523 23,337 4.8Benguet (excluding Baguio City) 403,944 403,129 90,440 4.5Baguio City 318,676 315,800 78,313 4.0Ifugao 191,078 190,948 39,479 4.8Kalinga 201,613 201,206 38,642 5.2Mountain Province 154,187 154,063 33,048 4.7
Region I – Ilocos Region 4,748,372 4,743,067 1,050,605 4.5Ilocos Norte 568,017 567,006 128,558 4.4Ilocos Sur 658,587 657,902 145,674 4.5La Union 741,906 740,710 163,820 4.5Pangasinan 2,779,862 2,777,449 612,553 4.5
Region II – Cagayan Valley 3,229,163 3,225,761 727,327 4.4Batanes 16,604 16,530 4,270 3.9Cagayan 1,124,773 1,123,570 250,465 4.5Isabela 1,489,645 1,488,518 336,823 4.4Nueva Vizcaya 421,355 420,676 95,999 4.4Quirino 176,786 176,467 39,770 4.4
Region III – Central Luzon 10,137,737 10,118,478 2,239,011 4.5Aurora 201,233 200,799 44,740 4.5Bataan 687,482 685,167 150,090 4.6Bulacan 2,924,433 2,919,370 659,158 4.4Nueva Ecija 1,955,373 1,953,716 439,460 4.4Pampanga (excluding Angeles City) 2,014,019 2,010,219 416,271 4.8Angeles City 326,336 324,510 74,510 4.4Tarlac 1,273,240 1,271,743 280,382 4.5Zambales (excluding Olongapo City) 534,443 532,836 122,158 4.4Olongapo City 221,178 220,118 52,242 4.2
Total PopulationHousehold Population
Number of Households
Average Household Size
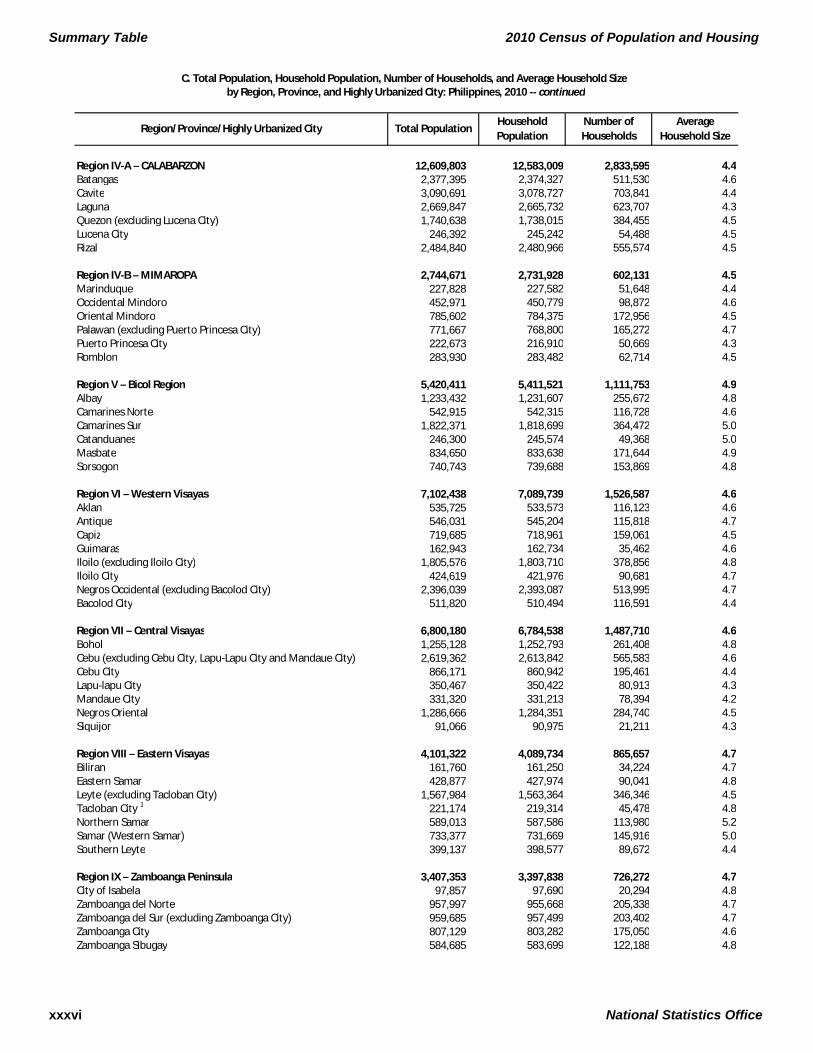
C. Total Population, Household Population, Number of Households, and Average Household Size by Region, Province, and Highly Urbanized City: Philippines, 2010
Region/Province/Highly Urbanized City
National Statistics Office xxxv
Summary Table 2010 Census of Population and Housing
Total PopulationHousehold Population
Number of Households
Average Household Size
C. Total Population, Household Population, Number of Households, and Average Household Size by Region, Province, and Highly Urbanized City: Philippines, 2010 -- continued
Region/Province/Highly Urbanized City
Region IV-A – CALABARZON 12,609,803 12,583,009 2,833,595 4.4Batangas 2,377,395 2,374,327 511,530 4.6Cavite 3,090,691 3,078,727 703,841 4.4Laguna 2,669,847 2,665,732 623,707 4.3Quezon (excluding Lucena City) 1,740,638 1,738,015 384,455 4.5Lucena City 246,392 245,242 54,488 4.5Rizal 2,484,840 2,480,966 555,574 4.5
Region IV-B – MIMAROPA 2,744,671 2,731,928 602,131 4.5Marinduque 227,828 227,582 51,648 4.4Occidental Mindoro 452,971 450,779 98,872 4.6Oriental Mindoro 785,602 784,375 172,956 4.5Palawan (excluding Puerto Princesa City) 771,667 768,800 165,272 4.7Puerto Princesa City 222,673 216,910 50,669 4.3Romblon 283,930 283,482 62,714 4.5
Region V – Bicol Region 5,420,411 5,411,521 1,111,753 4.9Albay 1,233,432 1,231,607 255,672 4.8Camarines Norte 542,915 542,315 116,728 4.6Camarines Sur 1,822,371 1,818,699 364,472 5.0Catanduanes 246,300 245,574 49,368 5.0Masbate 834,650 833,638 171,644 4.9Sorsogon 740,743 739,688 153,869 4.8
Region VI – Western Visayas 7,102,438 7,089,739 1,526,587 4.6Aklan 535,725 533,573 116,123 4.6Antique 546,031 545,204 115,818 4.7Capiz 719,685 718,961 159,061 4.5Guimaras 162,943 162,734 35,462 4.6Iloilo (excluding Iloilo City) 1,805,576 1,803,710 378,856 4.8Iloilo City 424,619 421,976 90,681 4.7Negros Occidental (excluding Bacolod City) 2,396,039 2,393,087 513,995 4.7Bacolod City 511,820 510,494 116,591 4.4
Region VII – Central Visayas 6,800,180 6,784,538 1,487,710 4.6Bohol 1,255,128 1,252,793 261,408 4.8Cebu (excluding Cebu City, Lapu-Lapu City and Mandaue City) 2,619,362 2,613,842 565,583 4.6Cebu City 866,171 860,942 195,461 4.4Lapu-lapu City 350,467 350,422 80,913 4.3Mandaue City 331,320 331,213 78,394 4.2Negros Oriental 1,286,666 1,284,351 284,740 4.5Siquijor 91,066 90,975 21,211 4.3
Region VIII – Eastern Visayas 4,101,322 4,089,734 865,657 4.7Biliran 161,760 161,250 34,224 4.7Eastern Samar 428,877 427,974 90,041 4.8Leyte (excluding Tacloban City) 1,567,984 1,563,364 346,346 4.5Tacloban City 1 221,174 219,314 45,478 4.8Northern Samar 589,013 587,586 113,980 5.2Samar (Western Samar) 733,377 731,669 145,916 5.0Southern Leyte 399,137 398,577 89,672 4.4
Region IX – Zamboanga Peninsula 3,407,353 3,397,838 726,272 4.7City of Isabela 97,857 97,690 20,294 4.8Zamboanga del Norte 957,997 955,668 205,338 4.7Zamboanga del Sur (excluding Zamboanga City) 959,685 957,499 203,402 4.7Zamboanga City 807,129 803,282 175,050 4.6Zamboanga Sibugay 584,685 583,699 122,188 4.8
xxxvi National Statistics Office
2010 Census of Population and Housing Summary Table
Total PopulationHousehold Population
Number of Households
Average Household Size
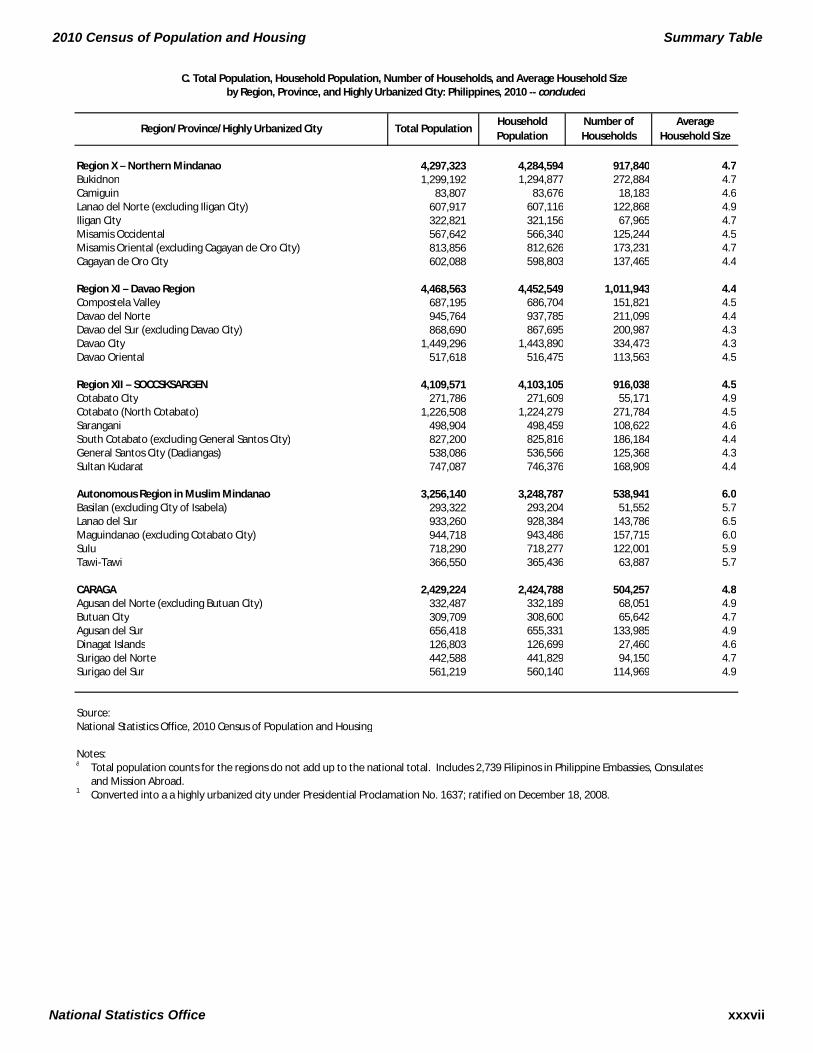
C. Total Population, Household Population, Number of Households, and Average Household Size by Region, Province, and Highly Urbanized City: Philippines, 2010 -- concluded
Region/Province/Highly Urbanized City
Region X – Northern Mindanao 4,297,323 4,284,594 917,840 4.7Bukidnon 1,299,192 1,294,877 272,884 4.7Camiguin 83,807 83,676 18,183 4.6Lanao del Norte (excluding Iligan City) 607,917 607,116 122,868 4.9Iligan City 322,821 321,156 67,965 4.7Misamis Occidental 567,642 566,340 125,244 4.5Misamis Oriental (excluding Cagayan de Oro City) 813,856 812,626 173,231 4.7Cagayan de Oro City 602,088 598,803 137,465 4.4
Region XI – Davao Region 4,468,563 4,452,549 1,011,943 4.4Compostela Valley 687,195 686,704 151,821 4.5Davao del Norte 945,764 937,785 211,099 4.4Davao del Sur (excluding Davao City) 868,690 867,695 200,987 4.3Davao City 1,449,296 1,443,890 334,473 4.3Davao Oriental 517,618 516,475 113,563 4.5
Region XII – SOCCSKSARGEN 4,109,571 4,103,105 916,038 4.5Cotabato City 271,786 271,609 55,171 4.9Cotabato (North Cotabato) 1,226,508 1,224,279 271,784 4.5Sarangani 498,904 498,459 108,622 4.6South Cotabato (excluding General Santos City) 827,200 825,816 186,184 4.4General Santos City (Dadiangas) 538,086 536,566 125,368 4.3Sultan Kudarat 747,087 746,376 168,909 4.4
Autonomous Region in Muslim Mindanao 3,256,140 3,248,787 538,941 6.0Basilan (excluding City of Isabela) 293,322 293,204 51,552 5.7Lanao del Sur 933,260 928,384 143,786 6.5Maguindanao (excluding Cotabato City) 944,718 943,486 157,715 6.0Sulu 718,290 718,277 122,001 5.9Tawi-Tawi 366,550 365,436 63,887 5.7
CARAGA 2,429,224 2,424,788 504,257 4.8Agusan del Norte (excluding Butuan City) 332,487 332,189 68,051 4.9Butuan City 309,709 308,600 65,642 4.7Agusan del Sur 656,418 655,331 133,985 4.9Dinagat Islands 126,803 126,699 27,460 4.6Surigao del Norte 442,588 441,829 94,150 4.7Surigao del Sur 561,219 560,140 114,969 4.9
Source:National Statistics Office, 2010 Census of Population and Housing
Notes:a Total population counts for the regions do not add up to the national total. Includes 2,739 Filipinos in Philippine Embassies, Consulates
and Mission Abroad.1 Converted into a a highly urbanized city under Presidential Proclamation No. 1637; ratified on December 18, 2008.
National Statistics Office xxxvii
2010 Census of Population and Housing Albay
Province, City, Municipality Total Household Number of and Barangay Population Population Households
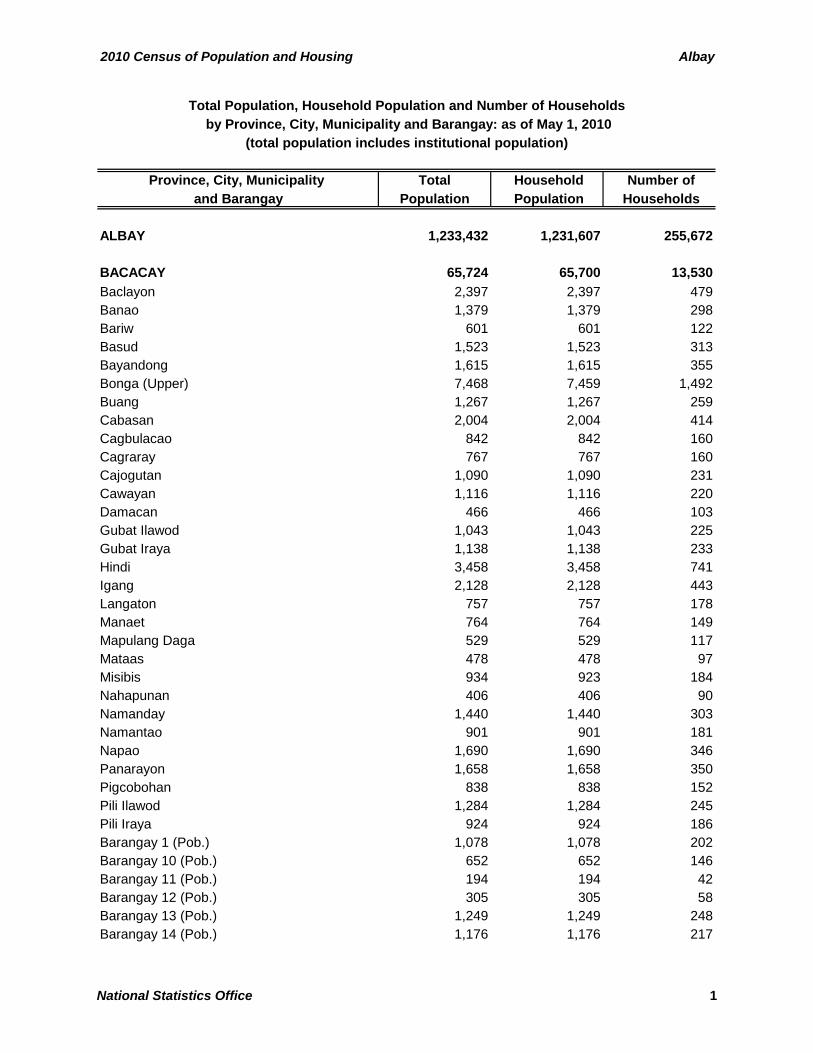
ALBAY 1,233,432 1,231,607 255,672
BACACAY 65,724 65,700 13,530Baclayon 2,397 2,397 479Banao 1,379 1,379 298Bariw 601 601 122Basud 1,523 1,523 313Bayandong 1,615 1,615 355Bonga (Upper) 7,468 7,459 1,492Buang 1,267 1,267 259Cabasan 2,004 2,004 414Cagbulacao 842 842 160Cagraray 767 767 160Cajogutan 1,090 1,090 231Cawayan 1,116 1,116 220Damacan 466 466 103Gubat Ilawod 1,043 1,043 225Gubat Iraya 1,138 1,138 233Hindi 3,458 3,458 741Igang 2,128 2,128 443Langaton 757 757 178Manaet 764 764 149Mapulang Daga 529 529 117Mataas 478 478 97Misibis 934 923 184Nahapunan 406 406 90Namanday 1,440 1,440 303Namantao 901 901 181Napao 1,690 1,690 346Panarayon 1,658 1,658 350Pigcobohan 838 838 152Pili Ilawod 1,284 1,284 245Pili Iraya 924 924 186Barangay 1 (Pob.) 1,078 1,078 202Barangay 10 (Pob.) 652 652 146Barangay 11 (Pob.) 194 194 42Barangay 12 (Pob.) 305 305 58Barangay 13 (Pob.) 1,249 1,249 248Barangay 14 (Pob.) 1,176 1,176 217
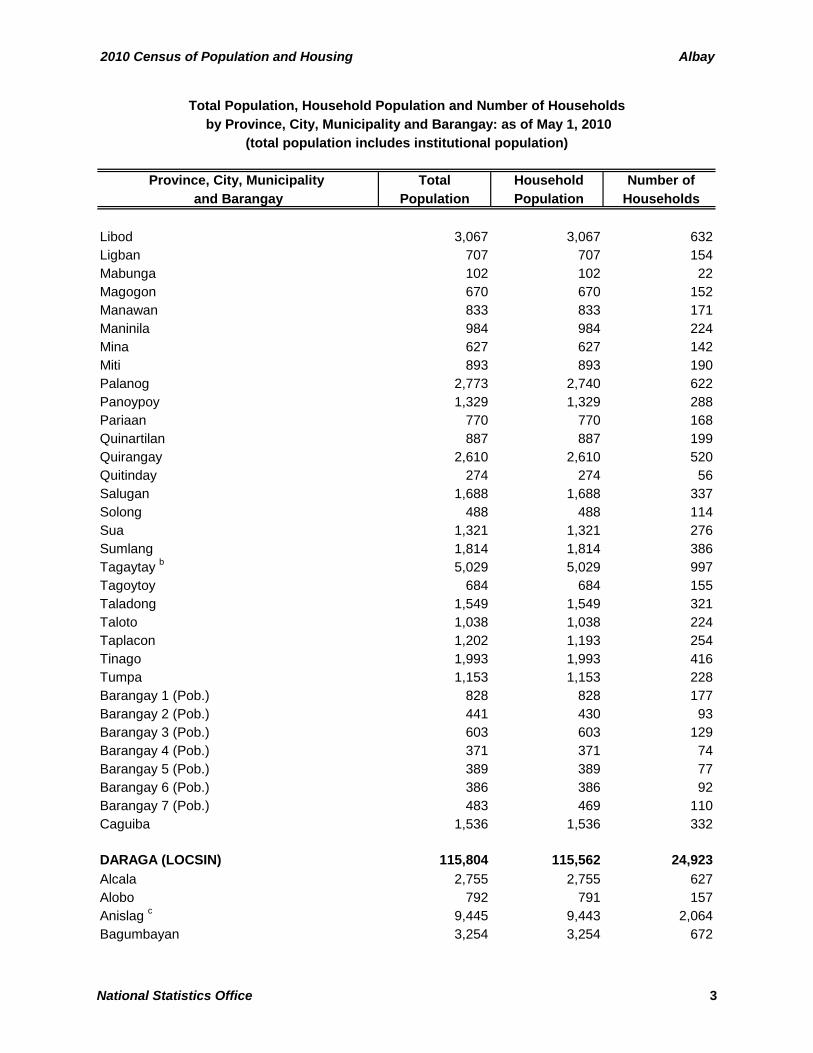
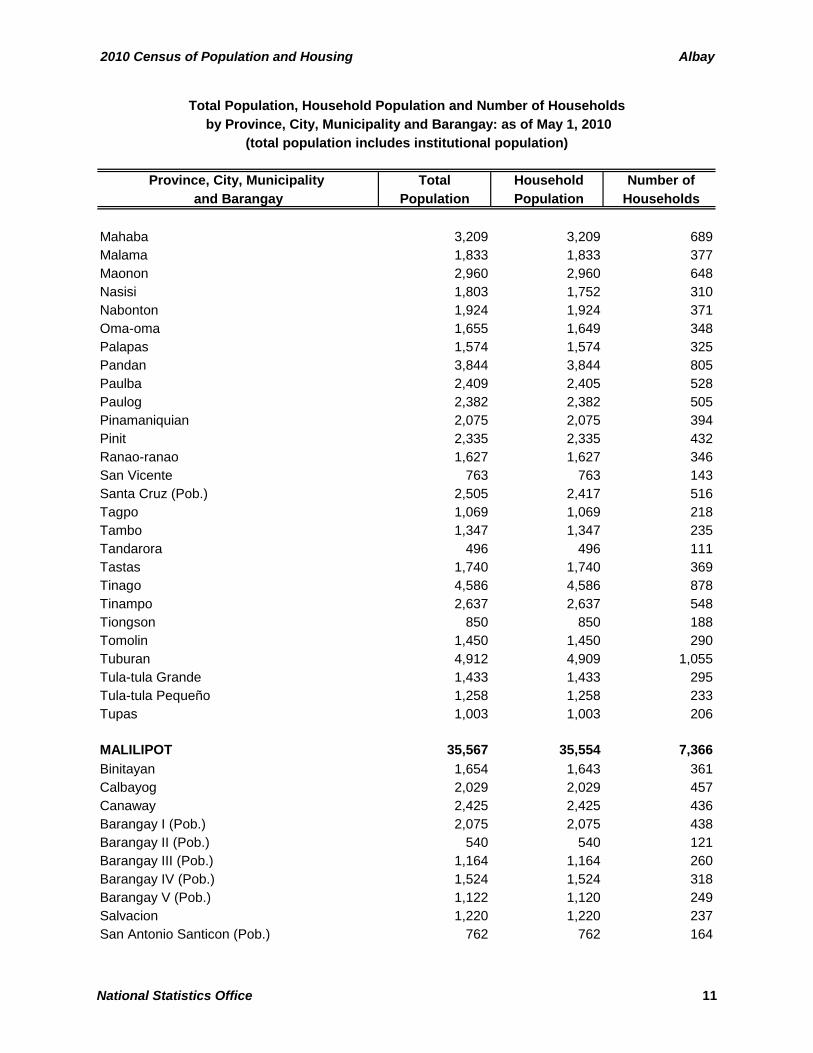
Total Population, Household Population and Number of Households
(total population includes institutional population) by Province, City, Municipality and Barangay: as of May 1, 2010
National Statistics Office 1
Albay 2010 Census of Population and Housing
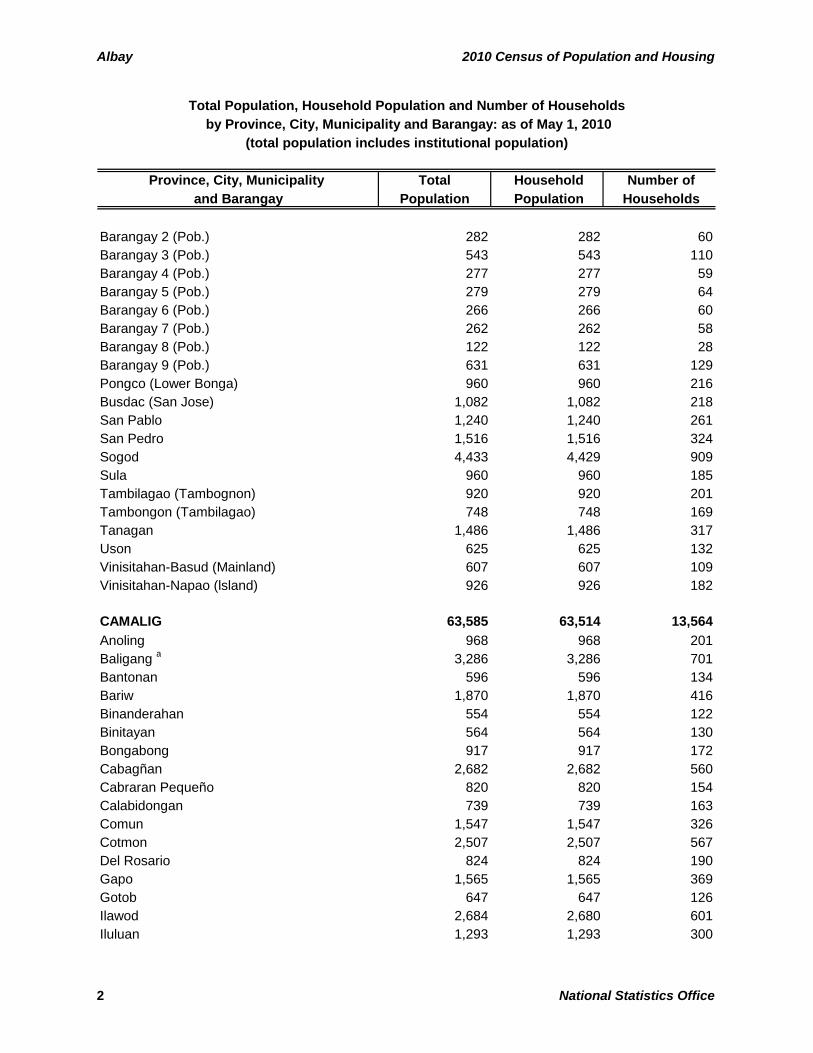
Province, City, Municipality Total Household Number of and Barangay Population Population Households
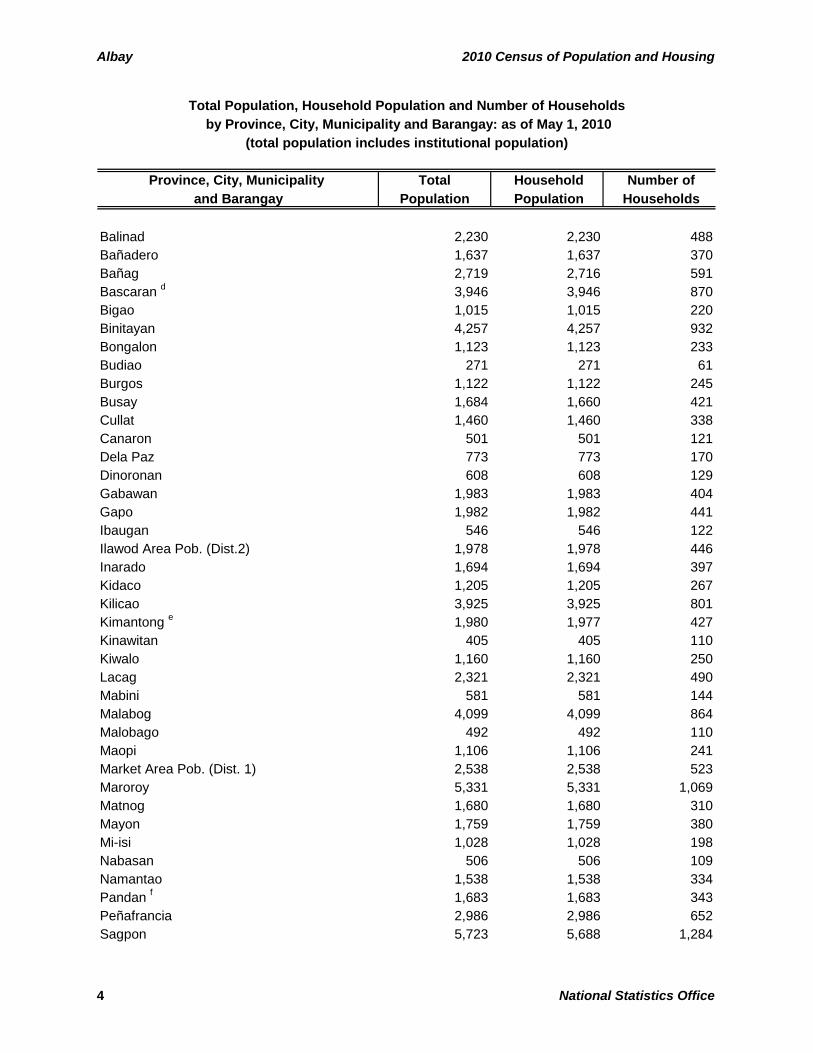
Total Population, Household Population and Number of Households
(total population includes institutional population) by Province, City, Municipality and Barangay: as of May 1, 2010
Barangay 2 (Pob.) 282 282 60Barangay 3 (Pob.) 543 543 110Barangay 4 (Pob.) 277 277 59Barangay 5 (Pob.) 279 279 64Barangay 6 (Pob.) 266 266 60Barangay 7 (Pob.) 262 262 58Barangay 8 (Pob.) 122 122 28Barangay 9 (Pob.) 631 631 129Pongco (Lower Bonga) 960 960 216Busdac (San Jose) 1,082 1,082 218San Pablo 1,240 1,240 261San Pedro 1,516 1,516 324Sogod 4,433 4,429 909Sula 960 960 185Tambilagao (Tambognon) 920 920 201Tambongon (Tambilagao) 748 748 169Tanagan 1,486 1,486 317Uson 625 625 132Vinisitahan-Basud (Mainland) 607 607 109Vinisitahan-Napao (lsland) 926 926 182
CAMALIG 63,585 63,514 13,564Anoling 968 968 201Baligang a 3,286 3,286 701Bantonan 596 596 134Bariw 1,870 1,870 416Binanderahan 554 554 122Binitayan 564 564 130Bongabong 917 917 172Cabagñan 2,682 2,682 560Cabraran Pequeño 820 820 154Calabidongan 739 739 163Comun 1,547 1,547 326Cotmon 2,507 2,507 567Del Rosario 824 824 190Gapo 1,565 1,565 369Gotob 647 647 126Ilawod 2,684 2,680 601Iluluan 1,293 1,293 300
2 National Statistics Office
2010 Census of Population and Housing Albay
Province, City, Municipality Total Household Number of and Barangay Population Population Households
Total Population, Household Population and Number of Households
(total population includes institutional population) by Province, City, Municipality and Barangay: as of May 1, 2010
Libod 3,067 3,067 632Ligban 707 707 154Mabunga 102 102 22Magogon 670 670 152Manawan 833 833 171Maninila 984 984 224Mina 627 627 142Miti 893 893 190Palanog 2,773 2,740 622Panoypoy 1,329 1,329 288Pariaan 770 770 168Quinartilan 887 887 199Quirangay 2,610 2,610 520Quitinday 274 274 56Salugan 1,688 1,688 337Solong 488 488 114Sua 1,321 1,321 276Sumlang 1,814 1,814 386Tagaytay b 5,029 5,029 997Tagoytoy 684 684 155Taladong 1,549 1,549 321Taloto 1,038 1,038 224Taplacon 1,202 1,193 254Tinago 1,993 1,993 416Tumpa 1,153 1,153 228Barangay 1 (Pob.) 828 828 177Barangay 2 (Pob.) 441 430 93Barangay 3 (Pob.) 603 603 129Barangay 4 (Pob.) 371 371 74Barangay 5 (Pob.) 389 389 77Barangay 6 (Pob.) 386 386 92Barangay 7 (Pob.) 483 469 110Caguiba 1,536 1,536 332
DARAGA (LOCSIN) 115,804 115,562 24,923Alcala 2,755 2,755 627Alobo 792 791 157Anislag c 9,445 9,443 2,064Bagumbayan 3,254 3,254 672
National Statistics Office 3
Albay 2010 Census of Population and Housing
Province, City, Municipality Total Household Number of and Barangay Population Population Households
Total Population, Household Population and Number of Households
(total population includes institutional population) by Province, City, Municipality and Barangay: as of May 1, 2010
Balinad 2,230 2,230 488Bañadero 1,637 1,637 370Bañag 2,719 2,716 591Bascaran d 3,946 3,946 870Bigao 1,015 1,015 220Binitayan 4,257 4,257 932Bongalon 1,123 1,123 233Budiao 271 271 61Burgos 1,122 1,122 245Busay 1,684 1,660 421Cullat 1,460 1,460 338Canaron 501 501 121Dela Paz 773 773 170Dinoronan 608 608 129Gabawan 1,983 1,983 404Gapo 1,982 1,982 441Ibaugan 546 546 122Ilawod Area Pob. (Dist.2) 1,978 1,978 446Inarado 1,694 1,694 397Kidaco 1,205 1,205 267Kilicao 3,925 3,925 801Kimantong e 1,980 1,977 427Kinawitan 405 405 110Kiwalo 1,160 1,160 250Lacag 2,321 2,321 490Mabini 581 581 144Malabog 4,099 4,099 864Malobago 492 492 110Maopi 1,106 1,106 241Market Area Pob. (Dist. 1) 2,538 2,538 523Maroroy 5,331 5,331 1,069Matnog 1,680 1,680 310Mayon 1,759 1,759 380Mi-isi 1,028 1,028 198Nabasan 506 506 109Namantao 1,538 1,538 334Pandan f 1,683 1,683 343Peñafrancia 2,986 2,986 652Sagpon 5,723 5,688 1,284
4 National Statistics Office
2010 Census of Population and Housing Albay
Province, City, Municipality Total Household Number of and Barangay Population Population Households
Total Population, Household Population and Number of Households
(total population includes institutional population) by Province, City, Municipality and Barangay: as of May 1, 2010
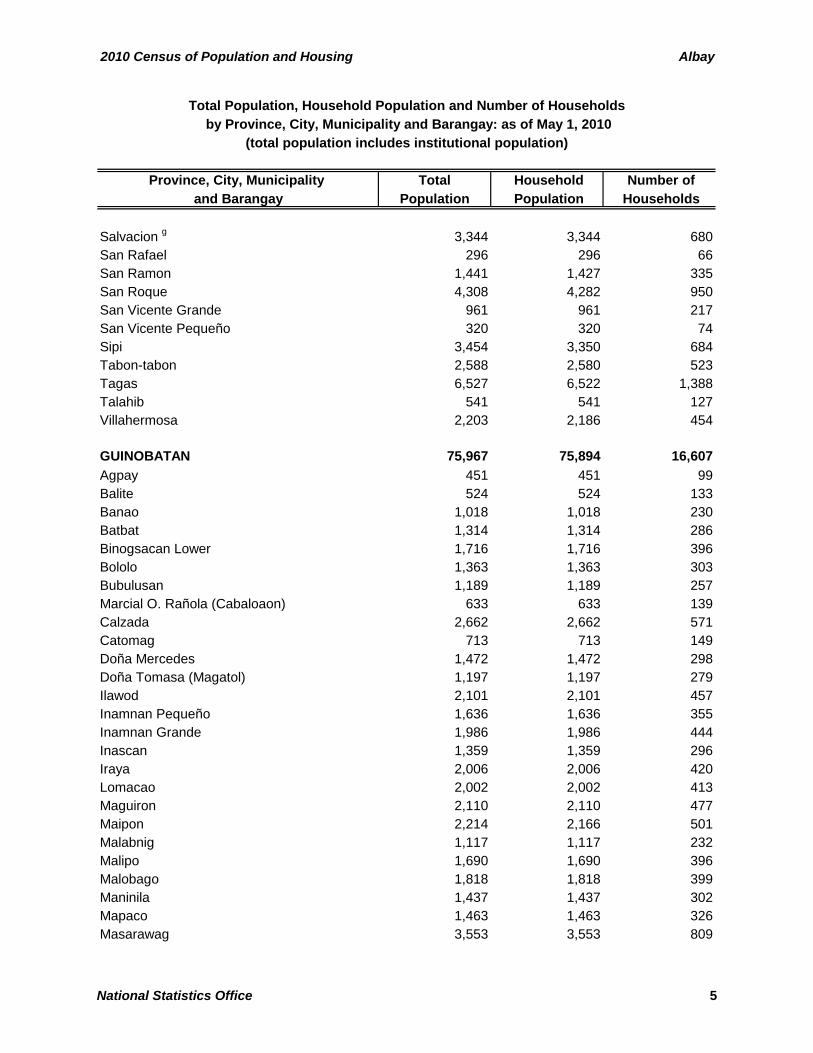
Salvacion g 3,344 3,344 680San Rafael 296 296 66San Ramon 1,441 1,427 335San Roque 4,308 4,282 950San Vicente Grande 961 961 217San Vicente Pequeño 320 320 74Sipi 3,454 3,350 684Tabon-tabon 2,588 2,580 523Tagas 6,527 6,522 1,388Talahib 541 541 127Villahermosa 2,203 2,186 454
GUINOBATAN 75,967 75,894 16,607Agpay 451 451 99Balite 524 524 133Banao 1,018 1,018 230Batbat 1,314 1,314 286Binogsacan Lower 1,716 1,716 396Bololo 1,363 1,363 303Bubulusan 1,189 1,189 257Marcial O. Rañola (Cabaloaon) 633 633 139Calzada 2,662 2,662 571Catomag 713 713 149Doña Mercedes 1,472 1,472 298Doña Tomasa (Magatol) 1,197 1,197 279Ilawod 2,101 2,101 457Inamnan Pequeño 1,636 1,636 355Inamnan Grande 1,986 1,986 444Inascan 1,359 1,359 296Iraya 2,006 2,006 420Lomacao 2,002 2,002 413Maguiron 2,110 2,110 477Maipon 2,214 2,166 501Malabnig 1,117 1,117 232Malipo 1,690 1,690 396Malobago 1,818 1,818 399Maninila 1,437 1,437 302Mapaco 1,463 1,463 326Masarawag 3,553 3,553 809
National Statistics Office 5
Albay 2010 Census of Population and Housing
Province, City, Municipality Total Household Number of and Barangay Population Population Households
Total Population, Household Population and Number of Households
(total population includes institutional population) by Province, City, Municipality and Barangay: as of May 1, 2010
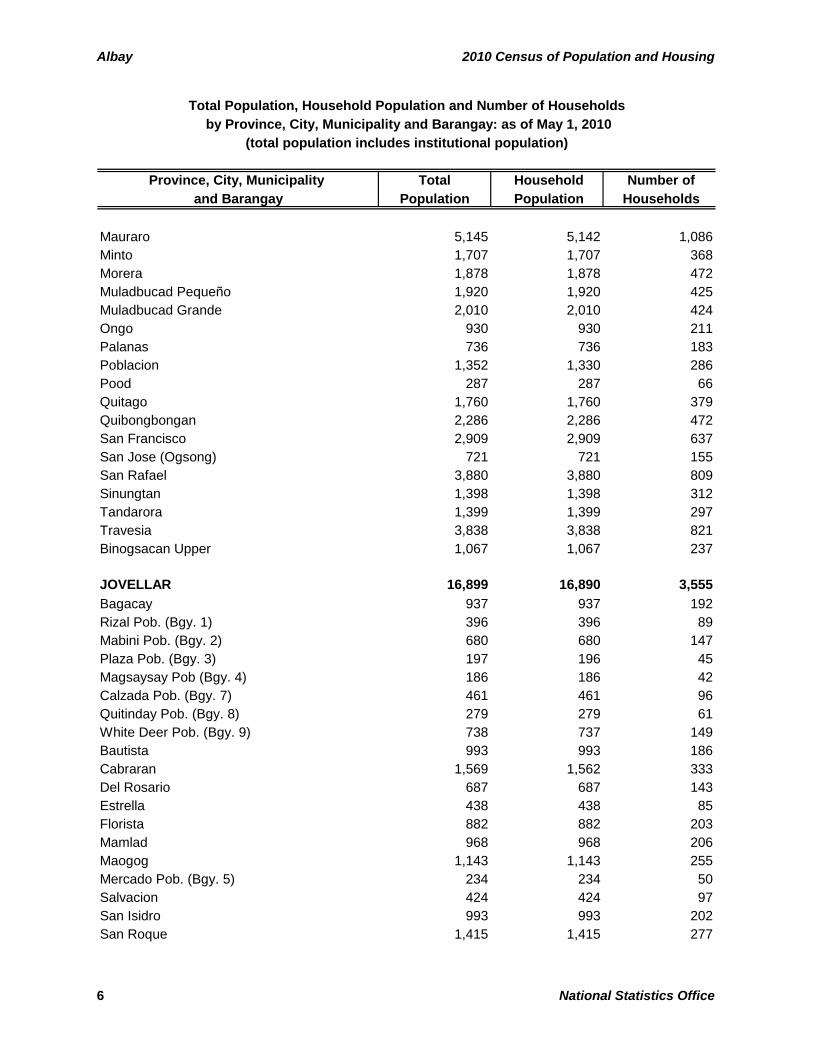
Mauraro 5,145 5,142 1,086Minto 1,707 1,707 368Morera 1,878 1,878 472Muladbucad Pequeño 1,920 1,920 425Muladbucad Grande 2,010 2,010 424Ongo 930 930 211Palanas 736 736 183Poblacion 1,352 1,330 286Pood 287 287 66Quitago 1,760 1,760 379Quibongbongan 2,286 2,286 472San Francisco 2,909 2,909 637San Jose (Ogsong) 721 721 155San Rafael 3,880 3,880 809Sinungtan 1,398 1,398 312Tandarora 1,399 1,399 297Travesia 3,838 3,838 821Binogsacan Upper 1,067 1,067 237
JOVELLAR 16,899 16,890 3,555Bagacay 937 937 192Rizal Pob. (Bgy. 1) 396 396 89Mabini Pob. (Bgy. 2) 680 680 147Plaza Pob. (Bgy. 3) 197 196 45Magsaysay Pob (Bgy. 4) 186 186 42Calzada Pob. (Bgy. 7) 461 461 96Quitinday Pob. (Bgy. 8) 279 279 61White Deer Pob. (Bgy. 9) 738 737 149Bautista 993 993 186Cabraran 1,569 1,562 333Del Rosario 687 687 143Estrella 438 438 85Florista 882 882 203Mamlad 968 968 206Maogog 1,143 1,143 255Mercado Pob. (Bgy. 5) 234 234 50Salvacion 424 424 97San Isidro 993 993 202San Roque 1,415 1,415 277
6 National Statistics Office
2010 Census of Population and Housing Albay
Province, City, Municipality Total Household Number of and Barangay Population Population Households
Total Population, Household Population and Number of Households
(total population includes institutional population) by Province, City, Municipality and Barangay: as of May 1, 2010
San Vicente 1,838 1,838 377Sinagaran 504 504 118Villa Paz 817 817 174Aurora Pob. (Bgy. 6) 120 120 28
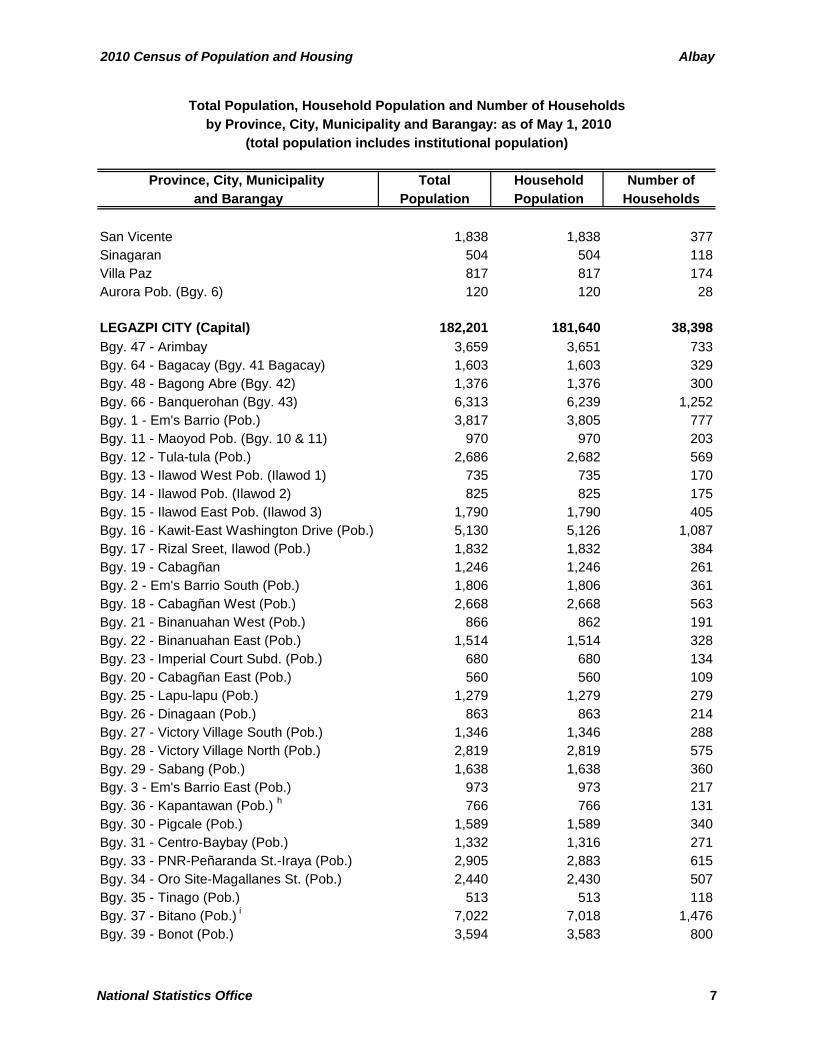
LEGAZPI CITY (Capital) 182,201 181,640 38,398Bgy. 47 - Arimbay 3,659 3,651 733Bgy. 64 - Bagacay (Bgy. 41 Bagacay) 1,603 1,603 329Bgy. 48 - Bagong Abre (Bgy. 42) 1,376 1,376 300Bgy. 66 - Banquerohan (Bgy. 43) 6,313 6,239 1,252Bgy. 1 - Em's Barrio (Pob.) 3,817 3,805 777Bgy. 11 - Maoyod Pob. (Bgy. 10 & 11) 970 970 203Bgy. 12 - Tula-tula (Pob.) 2,686 2,682 569Bgy. 13 - Ilawod West Pob. (Ilawod 1) 735 735 170Bgy. 14 - Ilawod Pob. (Ilawod 2) 825 825 175Bgy. 15 - Ilawod East Pob. (Ilawod 3) 1,790 1,790 405Bgy. 16 - Kawit-East Washington Drive (Pob.) 5,130 5,126 1,087Bgy. 17 - Rizal Sreet, Ilawod (Pob.) 1,832 1,832 384Bgy. 19 - Cabagñan 1,246 1,246 261Bgy. 2 - Em's Barrio South (Pob.) 1,806 1,806 361Bgy. 18 - Cabagñan West (Pob.) 2,668 2,668 563Bgy. 21 - Binanuahan West (Pob.) 866 862 191Bgy. 22 - Binanuahan East (Pob.) 1,514 1,514 328Bgy. 23 - Imperial Court Subd. (Pob.) 680 680 134Bgy. 20 - Cabagñan East (Pob.) 560 560 109Bgy. 25 - Lapu-lapu (Pob.) 1,279 1,279 279Bgy. 26 - Dinagaan (Pob.) 863 863 214Bgy. 27 - Victory Village South (Pob.) 1,346 1,346 288Bgy. 28 - Victory Village North (Pob.) 2,819 2,819 575Bgy. 29 - Sabang (Pob.) 1,638 1,638 360Bgy. 3 - Em's Barrio East (Pob.) 973 973 217Bgy. 36 - Kapantawan (Pob.) h 766 766 131Bgy. 30 - Pigcale (Pob.) 1,589 1,589 340Bgy. 31 - Centro-Baybay (Pob.) 1,332 1,316 271Bgy. 33 - PNR-Peñaranda St.-Iraya (Pob.) 2,905 2,883 615Bgy. 34 - Oro Site-Magallanes St. (Pob.) 2,440 2,430 507Bgy. 35 - Tinago (Pob.) 513 513 118Bgy. 37 - Bitano (Pob.) i 7,022 7,018 1,476Bgy. 39 - Bonot (Pob.) 3,594 3,583 800
National Statistics Office 7
Albay 2010 Census of Population and Housing
Province, City, Municipality Total Household Number of and Barangay Population Population Households
Total Population, Household Population and Number of Households
(total population includes institutional population) by Province, City, Municipality and Barangay: as of May 1, 2010
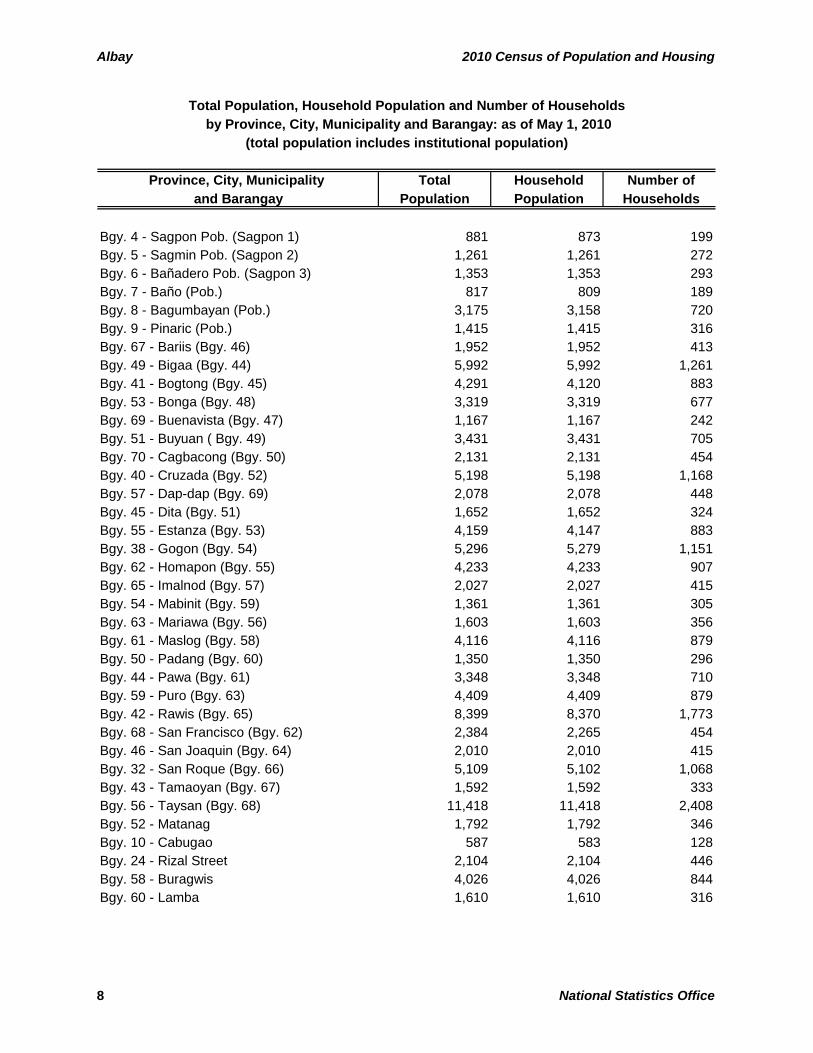
Bgy. 4 - Sagpon Pob. (Sagpon 1) 881 873 199Bgy. 5 - Sagmin Pob. (Sagpon 2) 1,261 1,261 272Bgy. 6 - Bañadero Pob. (Sagpon 3) 1,353 1,353 293Bgy. 7 - Baño (Pob.) 817 809 189Bgy. 8 - Bagumbayan (Pob.) 3,175 3,158 720Bgy. 9 - Pinaric (Pob.) 1,415 1,415 316Bgy. 67 - Bariis (Bgy. 46) 1,952 1,952 413Bgy. 49 - Bigaa (Bgy. 44) 5,992 5,992 1,261Bgy. 41 - Bogtong (Bgy. 45) 4,291 4,120 883Bgy. 53 - Bonga (Bgy. 48) 3,319 3,319 677Bgy. 69 - Buenavista (Bgy. 47) 1,167 1,167 242Bgy. 51 - Buyuan ( Bgy. 49) 3,431 3,431 705Bgy. 70 - Cagbacong (Bgy. 50) 2,131 2,131 454Bgy. 40 - Cruzada (Bgy. 52) 5,198 5,198 1,168Bgy. 57 - Dap-dap (Bgy. 69) 2,078 2,078 448Bgy. 45 - Dita (Bgy. 51) 1,652 1,652 324Bgy. 55 - Estanza (Bgy. 53) 4,159 4,147 883Bgy. 38 - Gogon (Bgy. 54) 5,296 5,279 1,151Bgy. 62 - Homapon (Bgy. 55) 4,233 4,233 907Bgy. 65 - Imalnod (Bgy. 57) 2,027 2,027 415Bgy. 54 - Mabinit (Bgy. 59) 1,361 1,361 305Bgy. 63 - Mariawa (Bgy. 56) 1,603 1,603 356Bgy. 61 - Maslog (Bgy. 58) 4,116 4,116 879Bgy. 50 - Padang (Bgy. 60) 1,350 1,350 296Bgy. 44 - Pawa (Bgy. 61) 3,348 3,348 710Bgy. 59 - Puro (Bgy. 63) 4,409 4,409 879Bgy. 42 - Rawis (Bgy. 65) 8,399 8,370 1,773Bgy. 68 - San Francisco (Bgy. 62) 2,384 2,265 454Bgy. 46 - San Joaquin (Bgy. 64) 2,010 2,010 415Bgy. 32 - San Roque (Bgy. 66) 5,109 5,102 1,068Bgy. 43 - Tamaoyan (Bgy. 67) 1,592 1,592 333Bgy. 56 - Taysan (Bgy. 68) 11,418 11,418 2,408Bgy. 52 - Matanag 1,792 1,792 346Bgy. 10 - Cabugao 587 583 128Bgy. 24 - Rizal Street 2,104 2,104 446Bgy. 58 - Buragwis 4,026 4,026 844Bgy. 60 - Lamba 1,610 1,610 316
8 National Statistics Office
2010 Census of Population and Housing Albay
Province, City, Municipality Total Household Number of and Barangay Population Population Households
Total Population, Household Population and Number of Households
(total population includes institutional population) by Province, City, Municipality and Barangay: as of May 1, 2010
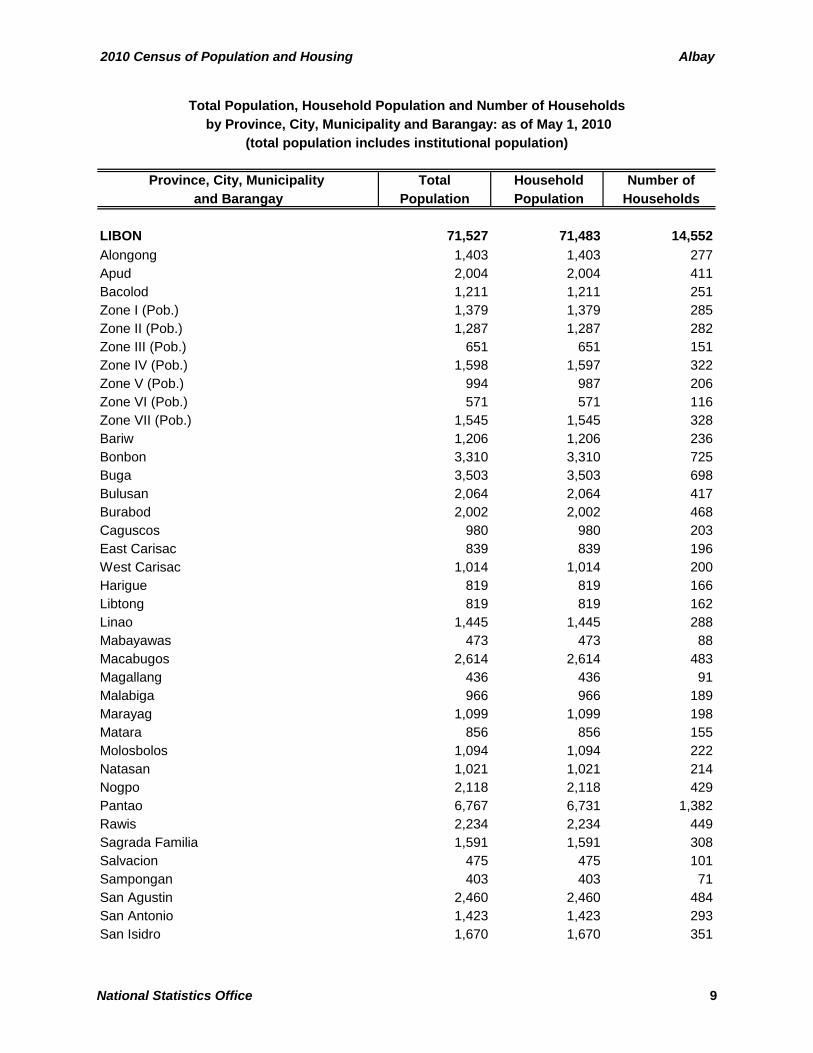
LIBON 71,527 71,483 14,552Alongong 1,403 1,403 277Apud 2,004 2,004 411Bacolod 1,211 1,211 251Zone I (Pob.) 1,379 1,379 285Zone II (Pob.) 1,287 1,287 282Zone III (Pob.) 651 651 151Zone IV (Pob.) 1,598 1,597 322Zone V (Pob.) 994 987 206Zone VI (Pob.) 571 571 116Zone VII (Pob.) 1,545 1,545 328Bariw 1,206 1,206 236Bonbon 3,310 3,310 725Buga 3,503 3,503 698Bulusan 2,064 2,064 417Burabod 2,002 2,002 468Caguscos 980 980 203East Carisac 839 839 196West Carisac 1,014 1,014 200Harigue 819 819 166Libtong 819 819 162Linao 1,445 1,445 288Mabayawas 473 473 88Macabugos 2,614 2,614 483Magallang 436 436 91Malabiga 966 966 189Marayag 1,099 1,099 198Matara 856 856 155Molosbolos 1,094 1,094 222Natasan 1,021 1,021 214Nogpo 2,118 2,118 429Pantao 6,767 6,731 1,382Rawis 2,234 2,234 449Sagrada Familia 1,591 1,591 308Salvacion 475 475 101Sampongan 403 403 71San Agustin 2,460 2,460 484San Antonio 1,423 1,423 293San Isidro 1,670 1,670 351
National Statistics Office 9
Albay 2010 Census of Population and Housing
Province, City, Municipality Total Household Number of and Barangay Population Population Households
Total Population, Household Population and Number of Households
(total population includes institutional population) by Province, City, Municipality and Barangay: as of May 1, 2010
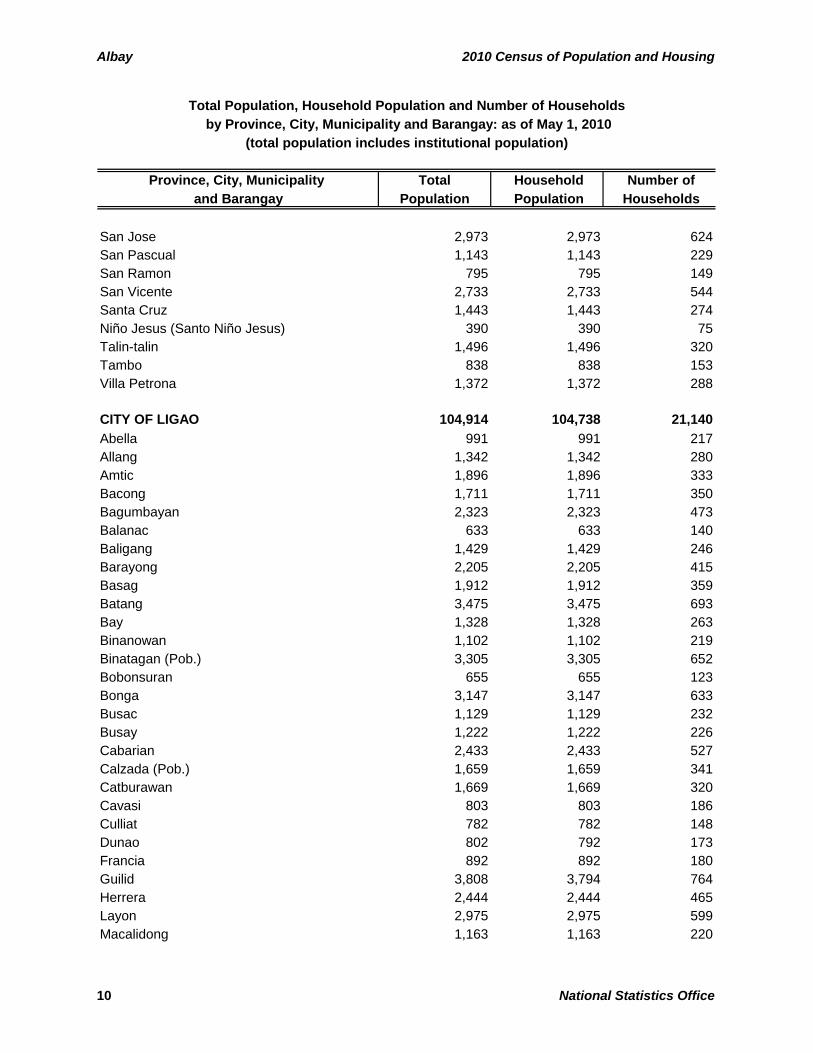
San Jose 2,973 2,973 624San Pascual 1,143 1,143 229San Ramon 795 795 149San Vicente 2,733 2,733 544Santa Cruz 1,443 1,443 274Niño Jesus (Santo Niño Jesus) 390 390 75Talin-talin 1,496 1,496 320Tambo 838 838 153Villa Petrona 1,372 1,372 288
CITY OF LIGAO 104,914 104,738 21,140Abella 991 991 217Allang 1,342 1,342 280Amtic 1,896 1,896 333Bacong 1,711 1,711 350Bagumbayan 2,323 2,323 473Balanac 633 633 140Baligang 1,429 1,429 246Barayong 2,205 2,205 415Basag 1,912 1,912 359Batang 3,475 3,475 693Bay 1,328 1,328 263Binanowan 1,102 1,102 219Binatagan (Pob.) 3,305 3,305 652Bobonsuran 655 655 123Bonga 3,147 3,147 633Busac 1,129 1,129 232Busay 1,222 1,222 226Cabarian 2,433 2,433 527Calzada (Pob.) 1,659 1,659 341Catburawan 1,669 1,669 320Cavasi 803 803 186Culliat 782 782 148Dunao 802 792 173Francia 892 892 180Guilid 3,808 3,794 764Herrera 2,444 2,444 465Layon 2,975 2,975 599Macalidong 1,163 1,163 220
10 National Statistics Office
2010 Census of Population and Housing Albay
Province, City, Municipality Total Household Number of and Barangay Population Population Households
Total Population, Household Population and Number of Households
(total population includes institutional population) by Province, City, Municipality and Barangay: as of May 1, 2010
Mahaba 3,209 3,209 689Malama 1,833 1,833 377Maonon 2,960 2,960 648Nasisi 1,803 1,752 310Nabonton 1,924 1,924 371Oma-oma 1,655 1,649 348Palapas 1,574 1,574 325Pandan 3,844 3,844 805Paulba 2,409 2,405 528Paulog 2,382 2,382 505Pinamaniquian 2,075 2,075 394Pinit 2,335 2,335 432Ranao-ranao 1,627 1,627 346San Vicente 763 763 143Santa Cruz (Pob.) 2,505 2,417 516Tagpo 1,069 1,069 218Tambo 1,347 1,347 235Tandarora 496 496 111Tastas 1,740 1,740 369Tinago 4,586 4,586 878Tinampo 2,637 2,637 548Tiongson 850 850 188Tomolin 1,450 1,450 290Tuburan 4,912 4,909 1,055Tula-tula Grande 1,433 1,433 295Tula-tula Pequeño 1,258 1,258 233Tupas 1,003 1,003 206
MALILIPOT 35,567 35,554 7,366Binitayan 1,654 1,643 361Calbayog 2,029 2,029 457Canaway 2,425 2,425 436Barangay I (Pob.) 2,075 2,075 438Barangay II (Pob.) 540 540 121Barangay III (Pob.) 1,164 1,164 260Barangay IV (Pob.) 1,524 1,524 318Barangay V (Pob.) 1,122 1,120 249Salvacion 1,220 1,220 237San Antonio Santicon (Pob.) 762 762 164
National Statistics Office 11
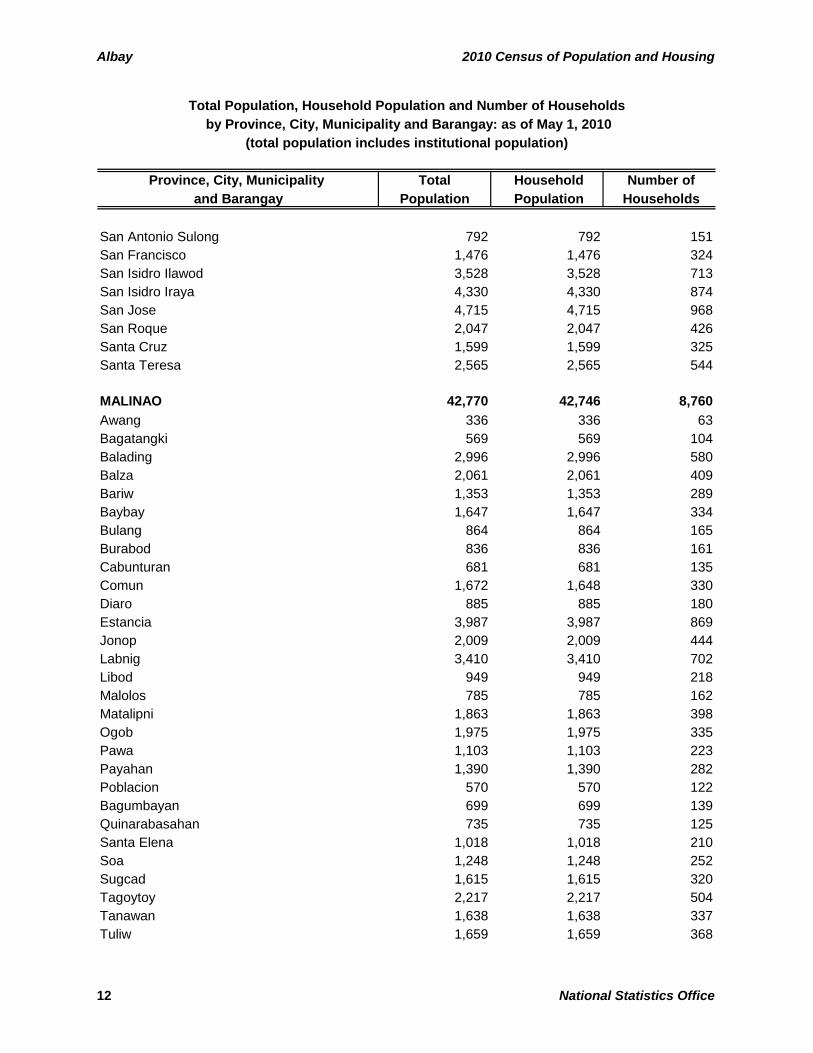
Albay 2010 Census of Population and Housing
Province, City, Municipality Total Household Number of and Barangay Population Population Households
Total Population, Household Population and Number of Households
(total population includes institutional population) by Province, City, Municipality and Barangay: as of May 1, 2010
San Antonio Sulong 792 792 151San Francisco 1,476 1,476 324San Isidro Ilawod 3,528 3,528 713San Isidro Iraya 4,330 4,330 874San Jose 4,715 4,715 968San Roque 2,047 2,047 426Santa Cruz 1,599 1,599 325Santa Teresa 2,565 2,565 544
MALINAO 42,770 42,746 8,760Awang 336 336 63Bagatangki 569 569 104Balading 2,996 2,996 580Balza 2,061 2,061 409Bariw 1,353 1,353 289Baybay 1,647 1,647 334Bulang 864 864 165Burabod 836 836 161Cabunturan 681 681 135Comun 1,672 1,648 330Diaro 885 885 180Estancia 3,987 3,987 869Jonop 2,009 2,009 444Labnig 3,410 3,410 702Libod 949 949 218Malolos 785 785 162Matalipni 1,863 1,863 398Ogob 1,975 1,975 335Pawa 1,103 1,103 223Payahan 1,390 1,390 282Poblacion 570 570 122Bagumbayan 699 699 139Quinarabasahan 735 735 125Santa Elena 1,018 1,018 210Soa 1,248 1,248 252Sugcad 1,615 1,615 320Tagoytoy 2,217 2,217 504Tanawan 1,638 1,638 337Tuliw 1,659 1,659 368
12 National Statistics Office
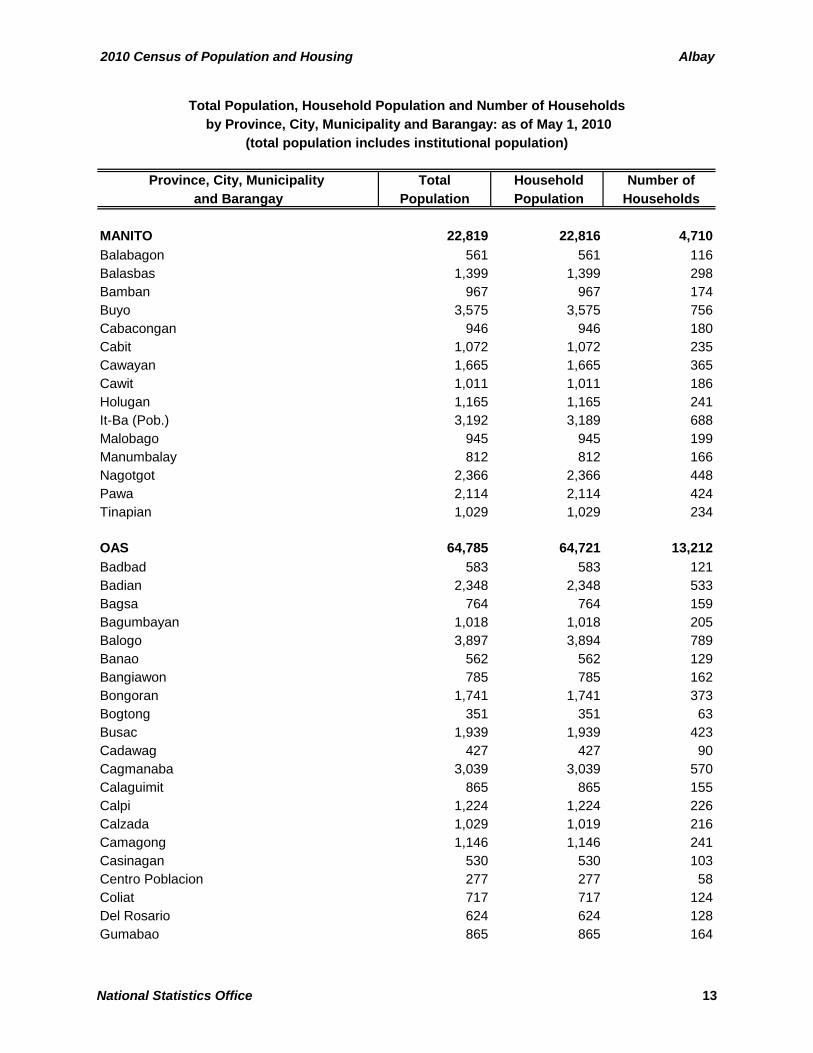
2010 Census of Population and Housing Albay
Province, City, Municipality Total Household Number of and Barangay Population Population Households
Total Population, Household Population and Number of Households
(total population includes institutional population) by Province, City, Municipality and Barangay: as of May 1, 2010
MANITO 22,819 22,816 4,710Balabagon 561 561 116Balasbas 1,399 1,399 298Bamban 967 967 174Buyo 3,575 3,575 756Cabacongan 946 946 180Cabit 1,072 1,072 235Cawayan 1,665 1,665 365Cawit 1,011 1,011 186Holugan 1,165 1,165 241It-Ba (Pob.) 3,192 3,189 688Malobago 945 945 199Manumbalay 812 812 166Nagotgot 2,366 2,366 448Pawa 2,114 2,114 424Tinapian 1,029 1,029 234
OAS 64,785 64,721 13,212Badbad 583 583 121Badian 2,348 2,348 533Bagsa 764 764 159Bagumbayan 1,018 1,018 205Balogo 3,897 3,894 789Banao 562 562 129Bangiawon 785 785 162Bongoran 1,741 1,741 373Bogtong 351 351 63Busac 1,939 1,939 423Cadawag 427 427 90Cagmanaba 3,039 3,039 570Calaguimit 865 865 155Calpi 1,224 1,224 226Calzada 1,029 1,019 216Camagong 1,146 1,146 241Casinagan 530 530 103Centro Poblacion 277 277 58Coliat 717 717 124Del Rosario 624 624 128Gumabao 865 865 164
National Statistics Office 13
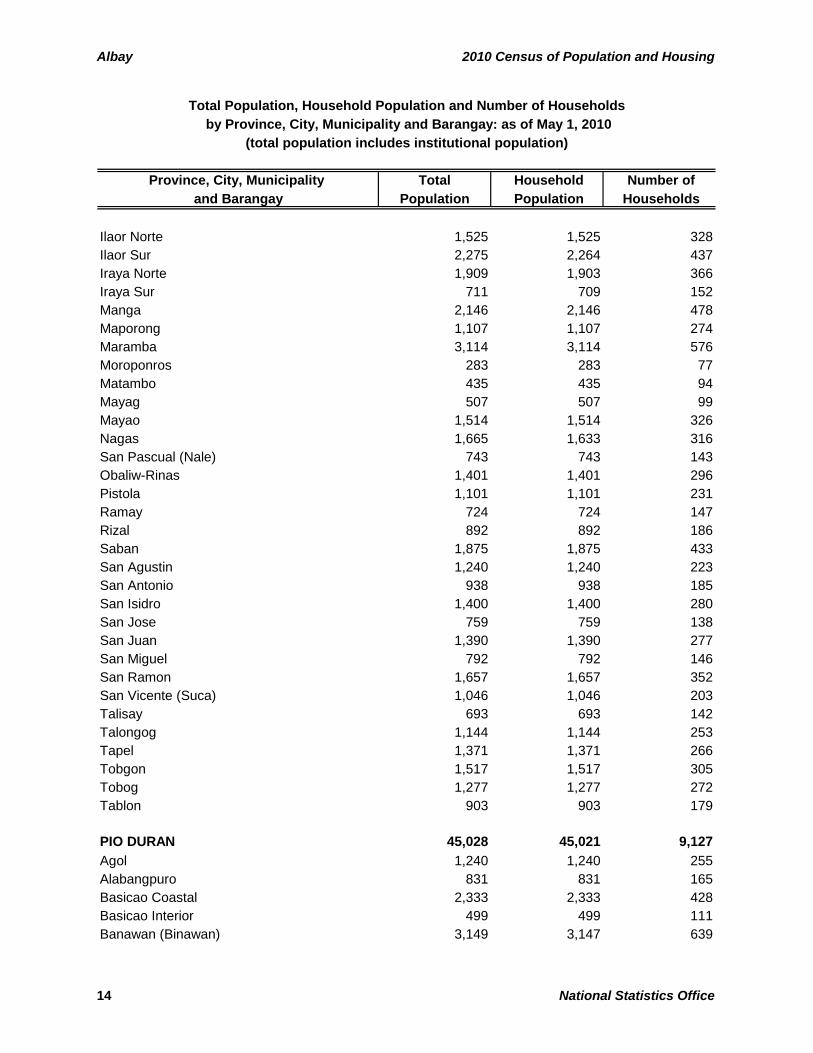
Albay 2010 Census of Population and Housing
Province, City, Municipality Total Household Number of and Barangay Population Population Households
Total Population, Household Population and Number of Households
(total population includes institutional population) by Province, City, Municipality and Barangay: as of May 1, 2010
Ilaor Norte 1,525 1,525 328Ilaor Sur 2,275 2,264 437Iraya Norte 1,909 1,903 366Iraya Sur 711 709 152Manga 2,146 2,146 478Maporong 1,107 1,107 274Maramba 3,114 3,114 576Moroponros 283 283 77Matambo 435 435 94Mayag 507 507 99Mayao 1,514 1,514 326Nagas 1,665 1,633 316San Pascual (Nale) 743 743 143Obaliw-Rinas 1,401 1,401 296Pistola 1,101 1,101 231Ramay 724 724 147Rizal 892 892 186Saban 1,875 1,875 433San Agustin 1,240 1,240 223San Antonio 938 938 185San Isidro 1,400 1,400 280San Jose 759 759 138San Juan 1,390 1,390 277San Miguel 792 792 146San Ramon 1,657 1,657 352San Vicente (Suca) 1,046 1,046 203Talisay 693 693 142Talongog 1,144 1,144 253Tapel 1,371 1,371 266Tobgon 1,517 1,517 305Tobog 1,277 1,277 272Tablon 903 903 179
PIO DURAN 45,028 45,021 9,127Agol 1,240 1,240 255Alabangpuro 831 831 165Basicao Coastal 2,333 2,333 428Basicao Interior 499 499 111Banawan (Binawan) 3,149 3,147 639
14 National Statistics Office
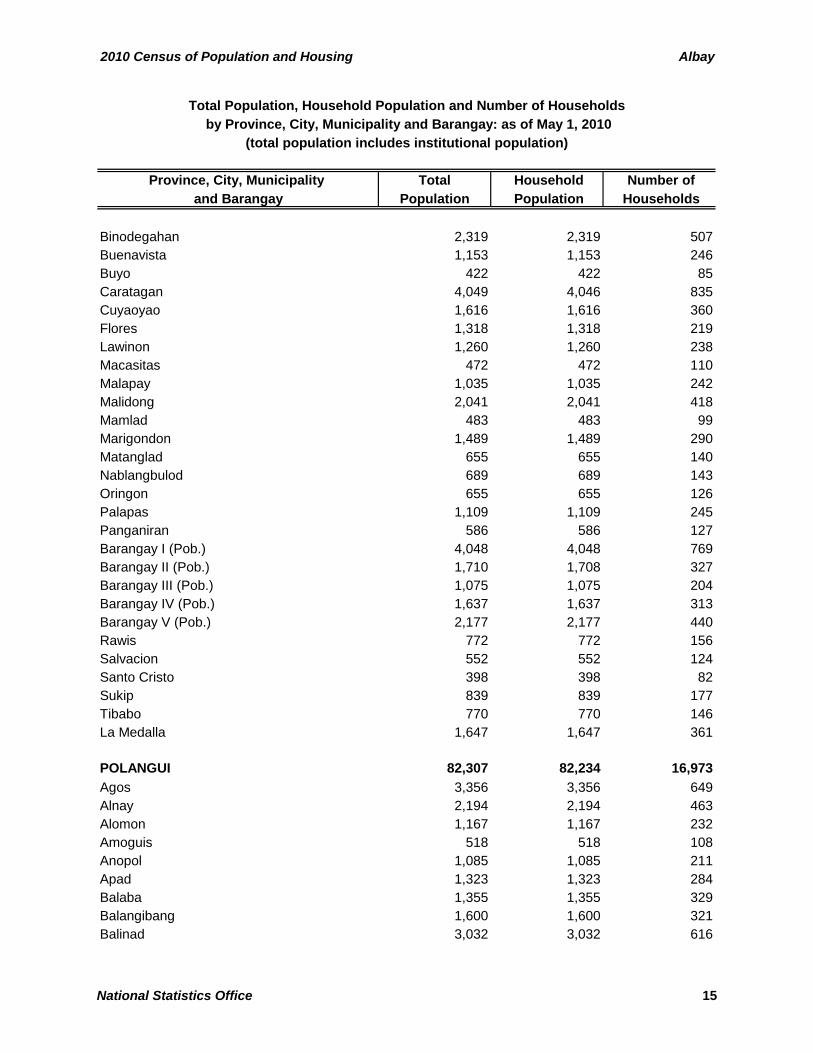
2010 Census of Population and Housing Albay
Province, City, Municipality Total Household Number of and Barangay Population Population Households
Total Population, Household Population and Number of Households
(total population includes institutional population) by Province, City, Municipality and Barangay: as of May 1, 2010
Binodegahan 2,319 2,319 507Buenavista 1,153 1,153 246Buyo 422 422 85Caratagan 4,049 4,046 835Cuyaoyao 1,616 1,616 360Flores 1,318 1,318 219Lawinon 1,260 1,260 238Macasitas 472 472 110Malapay 1,035 1,035 242Malidong 2,041 2,041 418Mamlad 483 483 99Marigondon 1,489 1,489 290Matanglad 655 655 140Nablangbulod 689 689 143Oringon 655 655 126Palapas 1,109 1,109 245Panganiran 586 586 127Barangay I (Pob.) 4,048 4,048 769Barangay II (Pob.) 1,710 1,708 327Barangay III (Pob.) 1,075 1,075 204Barangay IV (Pob.) 1,637 1,637 313Barangay V (Pob.) 2,177 2,177 440Rawis 772 772 156Salvacion 552 552 124Santo Cristo 398 398 82Sukip 839 839 177Tibabo 770 770 146La Medalla 1,647 1,647 361
POLANGUI 82,307 82,234 16,973Agos 3,356 3,356 649Alnay 2,194 2,194 463Alomon 1,167 1,167 232Amoguis 518 518 108Anopol 1,085 1,085 211Apad 1,323 1,323 284Balaba 1,355 1,355 329Balangibang 1,600 1,600 321Balinad 3,032 3,032 616
National Statistics Office 15
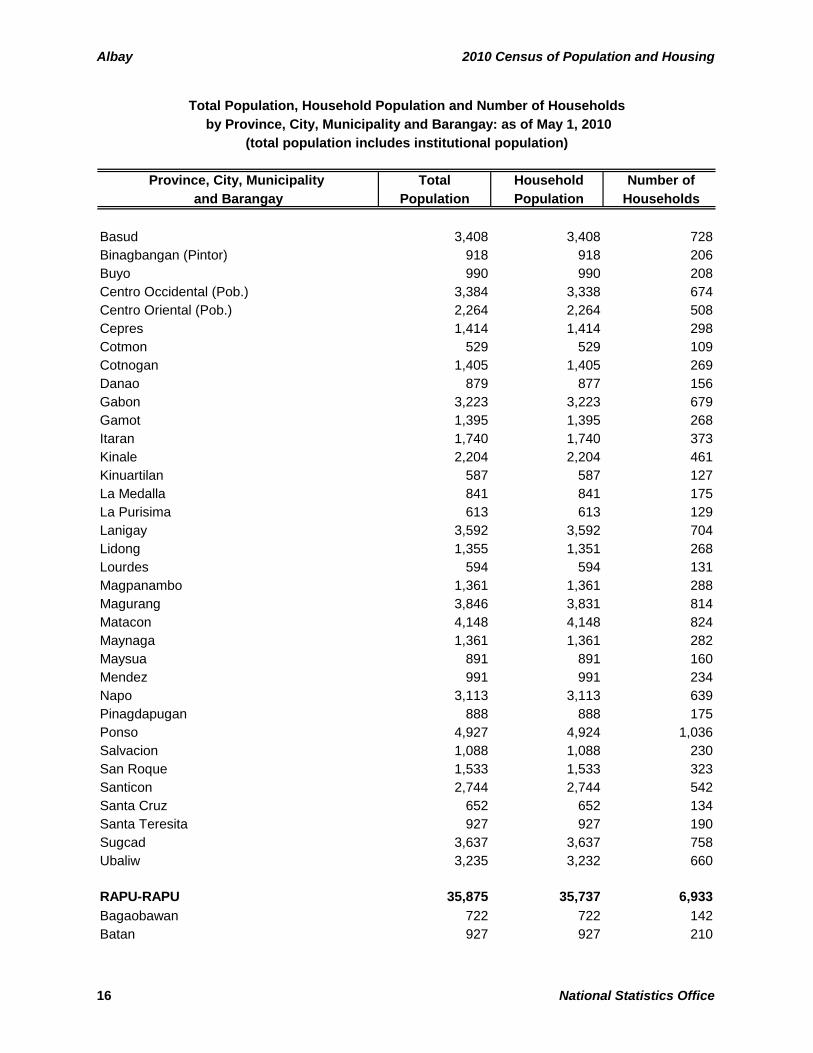
Albay 2010 Census of Population and Housing
Province, City, Municipality Total Household Number of and Barangay Population Population Households
Total Population, Household Population and Number of Households
(total population includes institutional population) by Province, City, Municipality and Barangay: as of May 1, 2010
Basud 3,408 3,408 728Binagbangan (Pintor) 918 918 206Buyo 990 990 208Centro Occidental (Pob.) 3,384 3,338 674Centro Oriental (Pob.) 2,264 2,264 508Cepres 1,414 1,414 298Cotmon 529 529 109Cotnogan 1,405 1,405 269Danao 879 877 156Gabon 3,223 3,223 679Gamot 1,395 1,395 268Itaran 1,740 1,740 373Kinale 2,204 2,204 461Kinuartilan 587 587 127La Medalla 841 841 175La Purisima 613 613 129Lanigay 3,592 3,592 704Lidong 1,355 1,351 268Lourdes 594 594 131Magpanambo 1,361 1,361 288Magurang 3,846 3,831 814Matacon 4,148 4,148 824Maynaga 1,361 1,361 282Maysua 891 891 160Mendez 991 991 234Napo 3,113 3,113 639Pinagdapugan 888 888 175Ponso 4,927 4,924 1,036Salvacion 1,088 1,088 230San Roque 1,533 1,533 323Santicon 2,744 2,744 542Santa Cruz 652 652 134Santa Teresita 927 927 190Sugcad 3,637 3,637 758Ubaliw 3,235 3,232 660
RAPU-RAPU 35,875 35,737 6,933Bagaobawan 722 722 142Batan 927 927 210
16 National Statistics Office
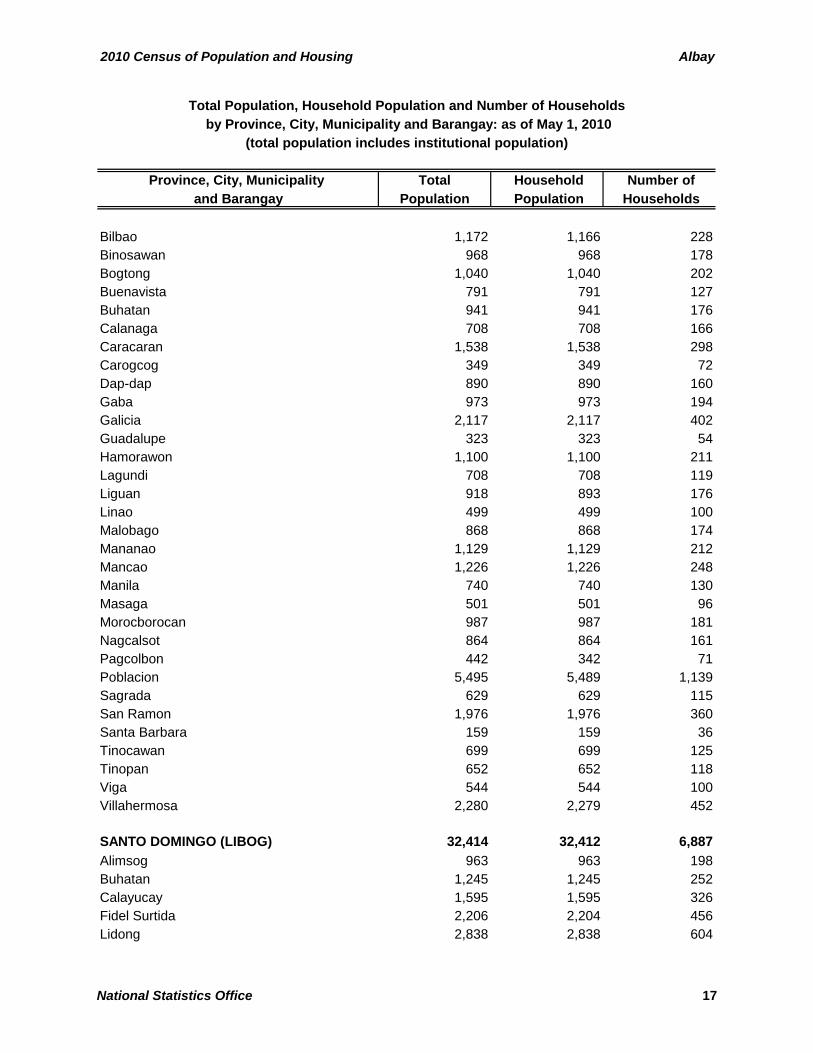
2010 Census of Population and Housing Albay
Province, City, Municipality Total Household Number of and Barangay Population Population Households
Total Population, Household Population and Number of Households
(total population includes institutional population) by Province, City, Municipality and Barangay: as of May 1, 2010
Bilbao 1,172 1,166 228Binosawan 968 968 178Bogtong 1,040 1,040 202Buenavista 791 791 127Buhatan 941 941 176Calanaga 708 708 166Caracaran 1,538 1,538 298Carogcog 349 349 72Dap-dap 890 890 160Gaba 973 973 194Galicia 2,117 2,117 402Guadalupe 323 323 54Hamorawon 1,100 1,100 211Lagundi 708 708 119Liguan 918 893 176Linao 499 499 100Malobago 868 868 174Mananao 1,129 1,129 212Mancao 1,226 1,226 248Manila 740 740 130Masaga 501 501 96Morocborocan 987 987 181Nagcalsot 864 864 161Pagcolbon 442 342 71Poblacion 5,495 5,489 1,139Sagrada 629 629 115San Ramon 1,976 1,976 360Santa Barbara 159 159 36Tinocawan 699 699 125Tinopan 652 652 118Viga 544 544 100Villahermosa 2,280 2,279 452
SANTO DOMINGO (LIBOG) 32,414 32,412 6,887Alimsog 963 963 198Buhatan 1,245 1,245 252Calayucay 1,595 1,595 326Fidel Surtida 2,206 2,204 456Lidong 2,838 2,838 604
National Statistics Office 17
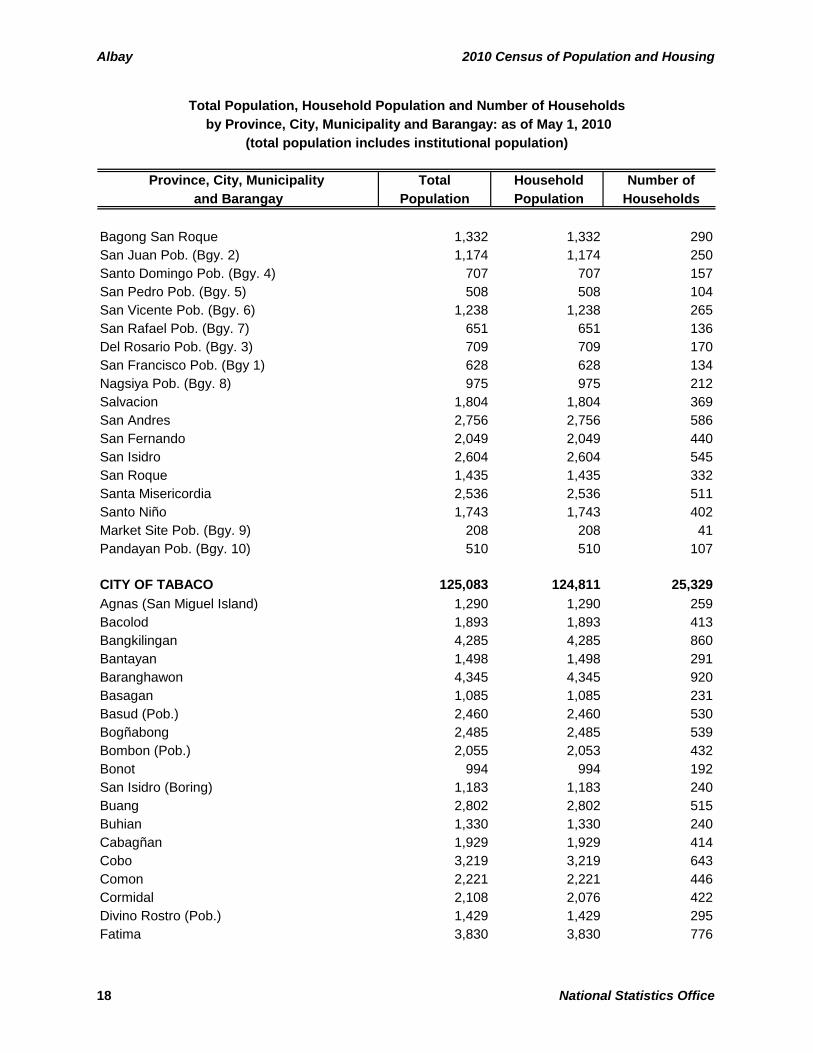
Albay 2010 Census of Population and Housing
Province, City, Municipality Total Household Number of and Barangay Population Population Households
Total Population, Household Population and Number of Households
(total population includes institutional population) by Province, City, Municipality and Barangay: as of May 1, 2010
Bagong San Roque 1,332 1,332 290San Juan Pob. (Bgy. 2) 1,174 1,174 250Santo Domingo Pob. (Bgy. 4) 707 707 157San Pedro Pob. (Bgy. 5) 508 508 104San Vicente Pob. (Bgy. 6) 1,238 1,238 265San Rafael Pob. (Bgy. 7) 651 651 136Del Rosario Pob. (Bgy. 3) 709 709 170San Francisco Pob. (Bgy 1) 628 628 134Nagsiya Pob. (Bgy. 8) 975 975 212Salvacion 1,804 1,804 369San Andres 2,756 2,756 586San Fernando 2,049 2,049 440San Isidro 2,604 2,604 545San Roque 1,435 1,435 332Santa Misericordia 2,536 2,536 511Santo Niño 1,743 1,743 402Market Site Pob. (Bgy. 9) 208 208 41Pandayan Pob. (Bgy. 10) 510 510 107
CITY OF TABACO 125,083 124,811 25,329Agnas (San Miguel Island) 1,290 1,290 259Bacolod 1,893 1,893 413Bangkilingan 4,285 4,285 860Bantayan 1,498 1,498 291Baranghawon 4,345 4,345 920Basagan 1,085 1,085 231Basud (Pob.) 2,460 2,460 530Bogñabong 2,485 2,485 539Bombon (Pob.) 2,055 2,053 432Bonot 994 994 192San Isidro (Boring) 1,183 1,183 240Buang 2,802 2,802 515Buhian 1,330 1,330 240Cabagñan 1,929 1,929 414Cobo 3,219 3,219 643Comon 2,221 2,221 446Cormidal 2,108 2,076 422Divino Rostro (Pob.) 1,429 1,429 295Fatima 3,830 3,830 776
18 National Statistics Office
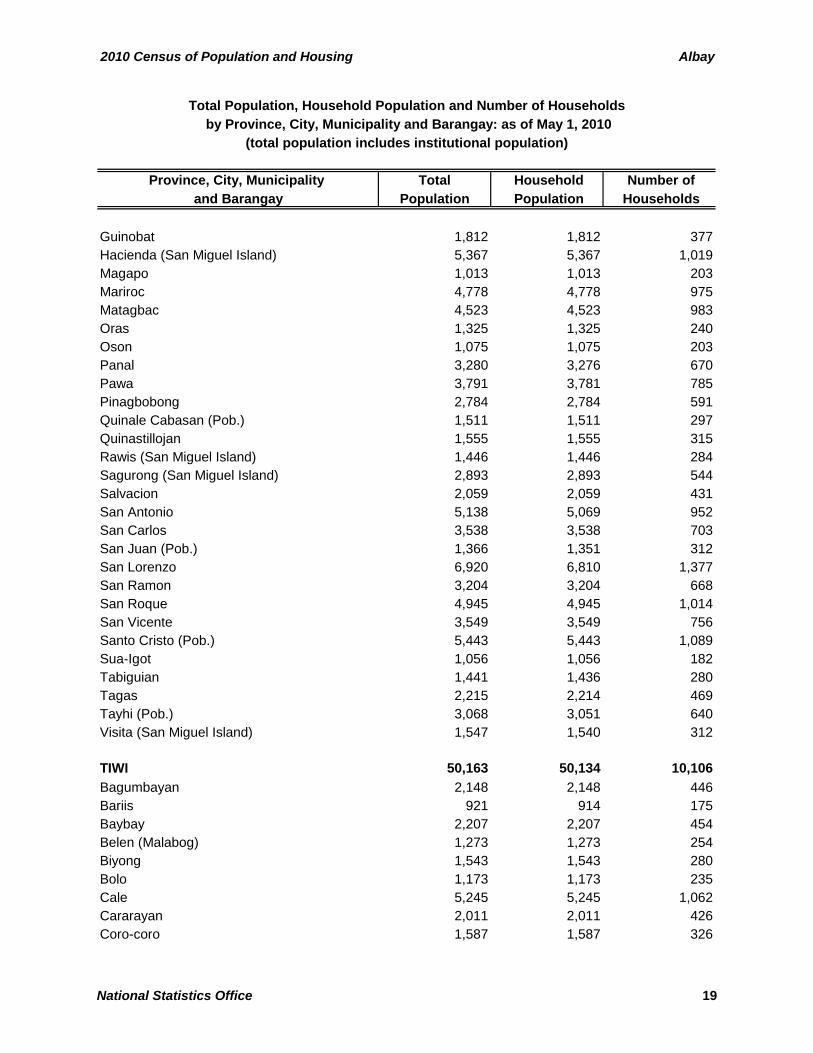
2010 Census of Population and Housing Albay
Province, City, Municipality Total Household Number of and Barangay Population Population Households
Total Population, Household Population and Number of Households
(total population includes institutional population) by Province, City, Municipality and Barangay: as of May 1, 2010
Guinobat 1,812 1,812 377Hacienda (San Miguel Island) 5,367 5,367 1,019Magapo 1,013 1,013 203Mariroc 4,778 4,778 975Matagbac 4,523 4,523 983Oras 1,325 1,325 240Oson 1,075 1,075 203Panal 3,280 3,276 670Pawa 3,791 3,781 785Pinagbobong 2,784 2,784 591Quinale Cabasan (Pob.) 1,511 1,511 297Quinastillojan 1,555 1,555 315Rawis (San Miguel Island) 1,446 1,446 284Sagurong (San Miguel Island) 2,893 2,893 544Salvacion 2,059 2,059 431San Antonio 5,138 5,069 952San Carlos 3,538 3,538 703San Juan (Pob.) 1,366 1,351 312San Lorenzo 6,920 6,810 1,377San Ramon 3,204 3,204 668San Roque 4,945 4,945 1,014San Vicente 3,549 3,549 756Santo Cristo (Pob.) 5,443 5,443 1,089Sua-Igot 1,056 1,056 182Tabiguian 1,441 1,436 280Tagas 2,215 2,214 469Tayhi (Pob.) 3,068 3,051 640Visita (San Miguel Island) 1,547 1,540 312
TIWI 50,163 50,134 10,106Bagumbayan 2,148 2,148 446Bariis 921 914 175Baybay 2,207 2,207 454Belen (Malabog) 1,273 1,273 254Biyong 1,543 1,543 280Bolo 1,173 1,173 235Cale 5,245 5,245 1,062Cararayan 2,011 2,011 426Coro-coro 1,587 1,587 326
National Statistics Office 19
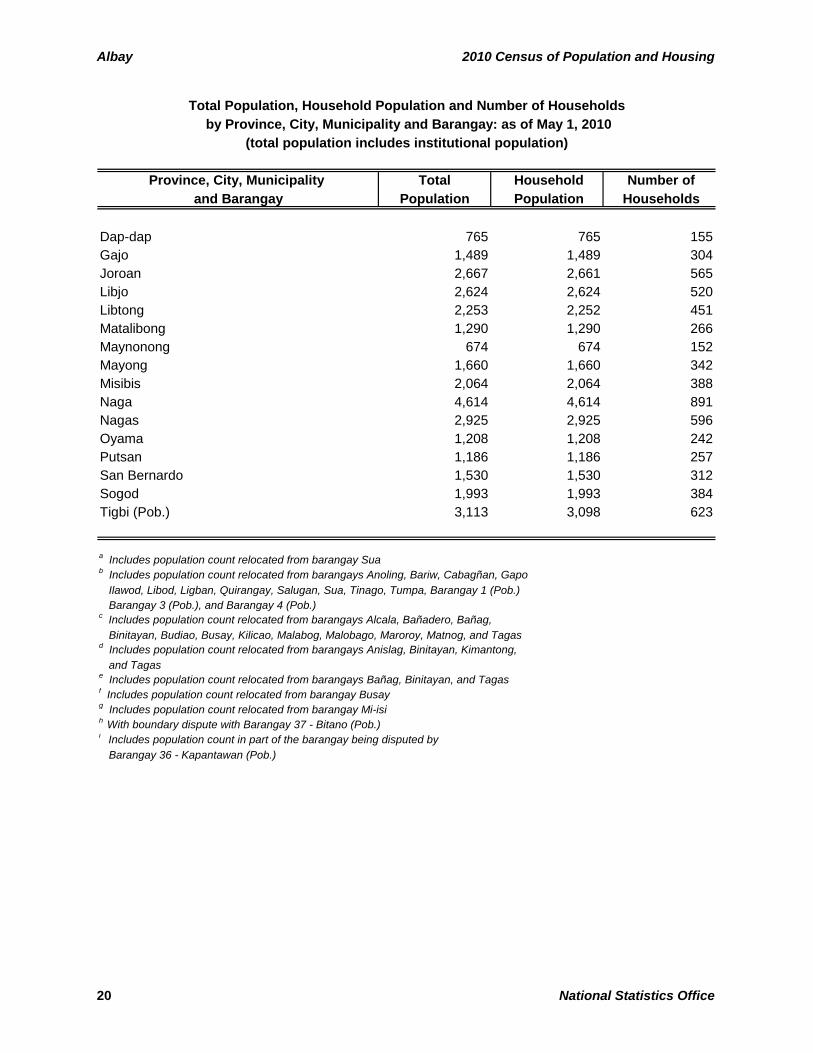
Albay 2010 Census of Population and Housing
Province, City, Municipality Total Household Number of and Barangay Population Population Households
Total Population, Household Population and Number of Households
(total population includes institutional population) by Province, City, Municipality and Barangay: as of May 1, 2010
Dap-dap 765 765 155Gajo 1,489 1,489 304Joroan 2,667 2,661 565Libjo 2,624 2,624 520Libtong 2,253 2,252 451Matalibong 1,290 1,290 266Maynonong 674 674 152Mayong 1,660 1,660 342Misibis 2,064 2,064 388Naga 4,614 4,614 891Nagas 2,925 2,925 596Oyama 1,208 1,208 242Putsan 1,186 1,186 257San Bernardo 1,530 1,530 312Sogod 1,993 1,993 384Tigbi (Pob.) 3,113 3,098 623
a Includes population count relocated from barangay Suab Includes population count relocated from barangays Anoling, Bariw, Cabagñan, Gapo
Ilawod, Libod, Ligban, Quirangay, Salugan, Sua, Tinago, Tumpa, Barangay 1 (Pob.)Barangay 3 (Pob.), and Barangay 4 (Pob.)
c Includes population count relocated from barangays Alcala, Bañadero, Bañag,Binitayan, Budiao, Busay, Kilicao, Malabog, Malobago, Maroroy, Matnog, and Tagas
d Includes population count relocated from barangays Anislag, Binitayan, Kimantong,and Tagas
e Includes population count relocated from barangays Bañag, Binitayan, and Tagasf Includes population count relocated from barangay Busayg Includes population count relocated from barangay Mi-isih With boundary dispute with Barangay 37 - Bitano (Pob.) i Includes population count in part of the barangay being disputed by
Barangay 36 - Kapantawan (Pob.)
20 National Statistics Office

2010 Census of Population and Housing Camarines Norte
Province, City, Municipality Total Household Number of and Barangay Population Population Households
CAMARINES NORTE 542,915 542,315 116,728
BASUD 38,176 38,176 8,283Angas 1,175 1,175 258Bactas 1,599 1,599 339Binatagan 397 397 100Caayunan 1,244 1,244 275Guinatungan 857 857 180Hinampacan 650 650 152Langa 830 830 182Laniton 1,490 1,490 308Lidong 401 401 93Mampili 1,110 1,110 249Mandazo 711 711 152Mangcamagong 1,400 1,400 300Manmuntay 669 669 147Mantugawe 1,056 1,056 223Matnog 2,963 2,963 662Mocong 847 847 190Oliva 928 928 191Pagsangahan 1,337 1,337 300Pinagwarasan 1,054 1,054 222Plaridel 1,089 1,089 237Poblacion 1 3,043 3,043 660San Felipe 3,282 3,282 714San Jose 995 995 236San Pascual 1,560 1,560 304Taba-taba 657 657 142Tacad 1,028 1,028 226Taisan 1,207 1,207 283Tuaca 1,896 1,896 364Poblacion 2 2,701 2,701 594
CAPALONGA 31,299 31,285 6,627Alayao 2,779 2,779 575Binawangan 1,620 1,620 332Calabaca 2,659 2,659 602Camagsaan 891 891 195Catabaguangan 652 652 132Catioan 3,226 3,226 662Del Pilar 1,504 1,504 341Itok 1,869 1,869 399Lucbanan 619 619 131
Total Population, Household Population and Number of Households
(total population includes institutional population) by Province, City, Municipality and Barangay: as of May 1, 2010
National Statistics Office 21
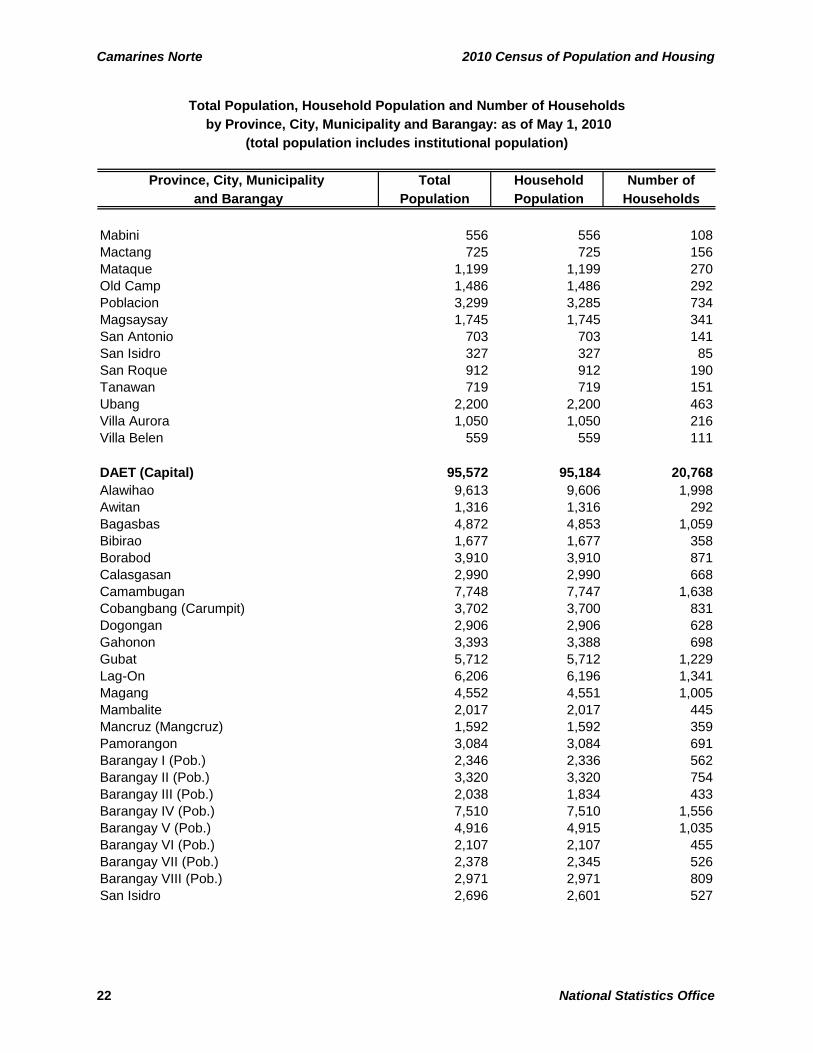
Camarines Norte 2010 Census of Population and Housing
Province, City, Municipality Total Household Number of and Barangay Population Population Households
Total Population, Household Population and Number of Households
(total population includes institutional population) by Province, City, Municipality and Barangay: as of May 1, 2010
Mabini 556 556 108Mactang 725 725 156Mataque 1,199 1,199 270Old Camp 1,486 1,486 292Poblacion 3,299 3,285 734Magsaysay 1,745 1,745 341San Antonio 703 703 141San Isidro 327 327 85San Roque 912 912 190Tanawan 719 719 151Ubang 2,200 2,200 463Villa Aurora 1,050 1,050 216Villa Belen 559 559 111
DAET (Capital) 95,572 95,184 20,768Alawihao 9,613 9,606 1,998Awitan 1,316 1,316 292Bagasbas 4,872 4,853 1,059Bibirao 1,677 1,677 358Borabod 3,910 3,910 871Calasgasan 2,990 2,990 668Camambugan 7,748 7,747 1,638Cobangbang (Carumpit) 3,702 3,700 831Dogongan 2,906 2,906 628Gahonon 3,393 3,388 698Gubat 5,712 5,712 1,229Lag-On 6,206 6,196 1,341Magang 4,552 4,551 1,005Mambalite 2,017 2,017 445Mancruz (Mangcruz) 1,592 1,592 359Pamorangon 3,084 3,084 691Barangay I (Pob.) 2,346 2,336 562Barangay II (Pob.) 3,320 3,320 754Barangay III (Pob.) 2,038 1,834 433Barangay IV (Pob.) 7,510 7,510 1,556Barangay V (Pob.) 4,916 4,915 1,035Barangay VI (Pob.) 2,107 2,107 455Barangay VII (Pob.) 2,378 2,345 526Barangay VIII (Pob.) 2,971 2,971 809San Isidro 2,696 2,601 527
22 National Statistics Office
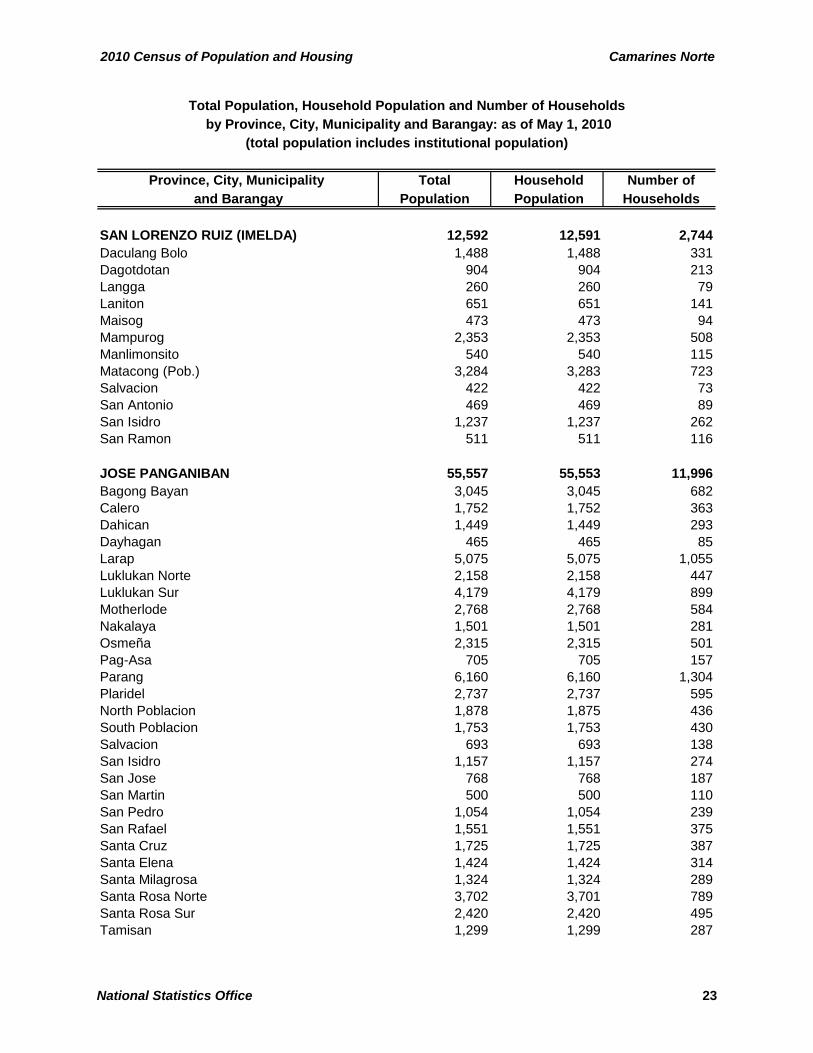
2010 Census of Population and Housing Camarines Norte
Province, City, Municipality Total Household Number of and Barangay Population Population Households
Total Population, Household Population and Number of Households
(total population includes institutional population) by Province, City, Municipality and Barangay: as of May 1, 2010
SAN LORENZO RUIZ (IMELDA) 12,592 12,591 2,744Daculang Bolo 1,488 1,488 331Dagotdotan 904 904 213Langga 260 260 79Laniton 651 651 141Maisog 473 473 94Mampurog 2,353 2,353 508Manlimonsito 540 540 115Matacong (Pob.) 3,284 3,283 723Salvacion 422 422 73San Antonio 469 469 89San Isidro 1,237 1,237 262San Ramon 511 511 116
JOSE PANGANIBAN 55,557 55,553 11,996Bagong Bayan 3,045 3,045 682Calero 1,752 1,752 363Dahican 1,449 1,449 293Dayhagan 465 465 85Larap 5,075 5,075 1,055Luklukan Norte 2,158 2,158 447Luklukan Sur 4,179 4,179 899Motherlode 2,768 2,768 584Nakalaya 1,501 1,501 281Osmeña 2,315 2,315 501Pag-Asa 705 705 157Parang 6,160 6,160 1,304Plaridel 2,737 2,737 595North Poblacion 1,878 1,875 436South Poblacion 1,753 1,753 430Salvacion 693 693 138San Isidro 1,157 1,157 274San Jose 768 768 187San Martin 500 500 110San Pedro 1,054 1,054 239San Rafael 1,551 1,551 375Santa Cruz 1,725 1,725 387Santa Elena 1,424 1,424 314Santa Milagrosa 1,324 1,324 289Santa Rosa Norte 3,702 3,701 789Santa Rosa Sur 2,420 2,420 495Tamisan 1,299 1,299 287
National Statistics Office 23
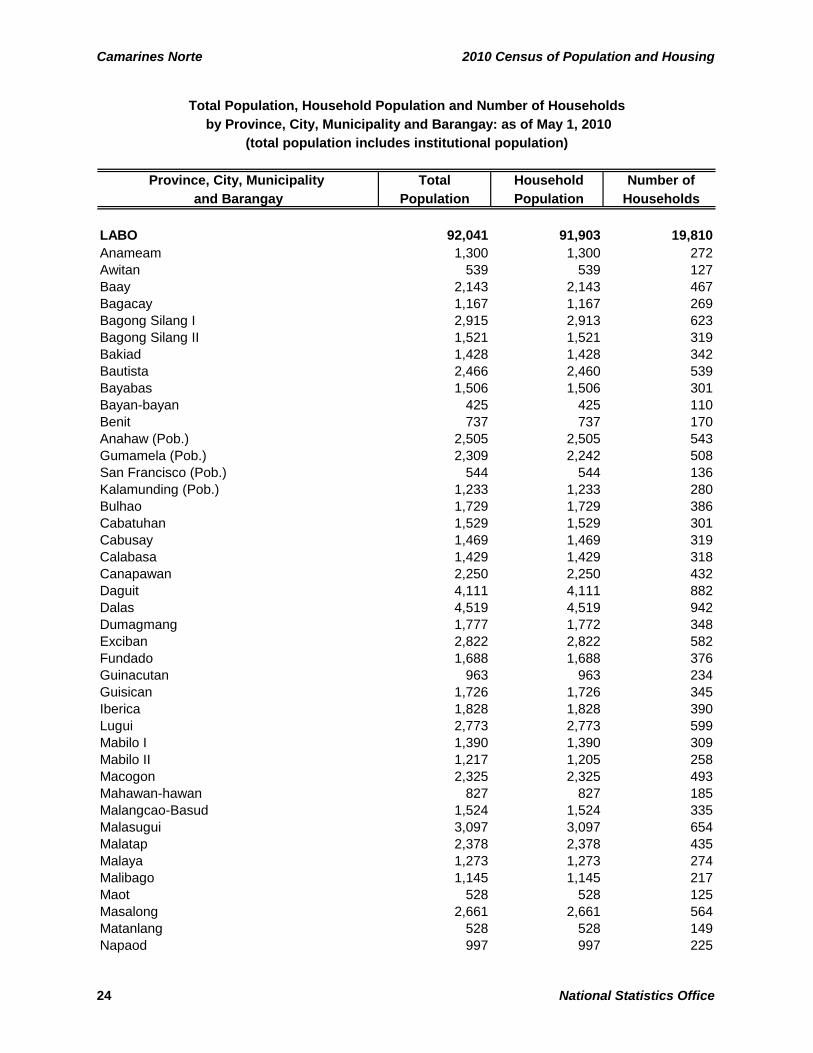
Camarines Norte 2010 Census of Population and Housing
Province, City, Municipality Total Household Number of and Barangay Population Population Households
Total Population, Household Population and Number of Households
(total population includes institutional population) by Province, City, Municipality and Barangay: as of May 1, 2010
LABO 92,041 91,903 19,810Anameam 1,300 1,300 272Awitan 539 539 127Baay 2,143 2,143 467Bagacay 1,167 1,167 269Bagong Silang I 2,915 2,913 623Bagong Silang II 1,521 1,521 319Bakiad 1,428 1,428 342Bautista 2,466 2,460 539Bayabas 1,506 1,506 301Bayan-bayan 425 425 110Benit 737 737 170Anahaw (Pob.) 2,505 2,505 543Gumamela (Pob.) 2,309 2,242 508San Francisco (Pob.) 544 544 136Kalamunding (Pob.) 1,233 1,233 280Bulhao 1,729 1,729 386Cabatuhan 1,529 1,529 301Cabusay 1,469 1,469 319Calabasa 1,429 1,429 318Canapawan 2,250 2,250 432Daguit 4,111 4,111 882Dalas 4,519 4,519 942Dumagmang 1,777 1,772 348Exciban 2,822 2,822 582Fundado 1,688 1,688 376Guinacutan 963 963 234Guisican 1,726 1,726 345Iberica 1,828 1,828 390Lugui 2,773 2,773 599Mabilo I 1,390 1,390 309Mabilo II 1,217 1,205 258Macogon 2,325 2,325 493Mahawan-hawan 827 827 185Malangcao-Basud 1,524 1,524 335Malasugui 3,097 3,097 654Malatap 2,378 2,378 435Malaya 1,273 1,273 274Malibago 1,145 1,145 217Maot 528 528 125Masalong 2,661 2,661 564Matanlang 528 528 149Napaod 997 997 225
24 National Statistics Office
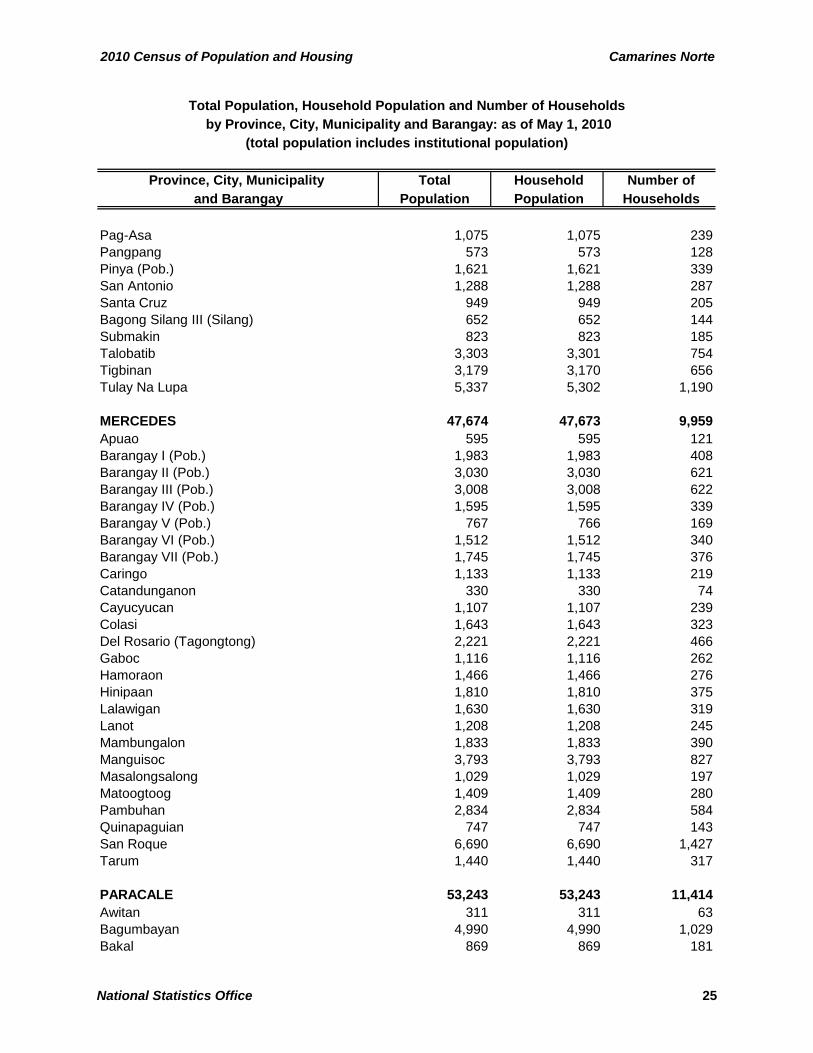
2010 Census of Population and Housing Camarines Norte
Province, City, Municipality Total Household Number of and Barangay Population Population Households
Total Population, Household Population and Number of Households
(total population includes institutional population) by Province, City, Municipality and Barangay: as of May 1, 2010
Pag-Asa 1,075 1,075 239Pangpang 573 573 128Pinya (Pob.) 1,621 1,621 339San Antonio 1,288 1,288 287Santa Cruz 949 949 205Bagong Silang III (Silang) 652 652 144Submakin 823 823 185Talobatib 3,303 3,301 754Tigbinan 3,179 3,170 656Tulay Na Lupa 5,337 5,302 1,190
MERCEDES 47,674 47,673 9,959Apuao 595 595 121Barangay I (Pob.) 1,983 1,983 408Barangay II (Pob.) 3,030 3,030 621Barangay III (Pob.) 3,008 3,008 622Barangay IV (Pob.) 1,595 1,595 339Barangay V (Pob.) 767 766 169Barangay VI (Pob.) 1,512 1,512 340Barangay VII (Pob.) 1,745 1,745 376Caringo 1,133 1,133 219Catandunganon 330 330 74Cayucyucan 1,107 1,107 239Colasi 1,643 1,643 323Del Rosario (Tagongtong) 2,221 2,221 466Gaboc 1,116 1,116 262Hamoraon 1,466 1,466 276Hinipaan 1,810 1,810 375Lalawigan 1,630 1,630 319Lanot 1,208 1,208 245Mambungalon 1,833 1,833 390Manguisoc 3,793 3,793 827Masalongsalong 1,029 1,029 197Matoogtoog 1,409 1,409 280Pambuhan 2,834 2,834 584Quinapaguian 747 747 143San Roque 6,690 6,690 1,427Tarum 1,440 1,440 317
PARACALE 53,243 53,243 11,414Awitan 311 311 63Bagumbayan 4,990 4,990 1,029Bakal 869 869 181
National Statistics Office 25
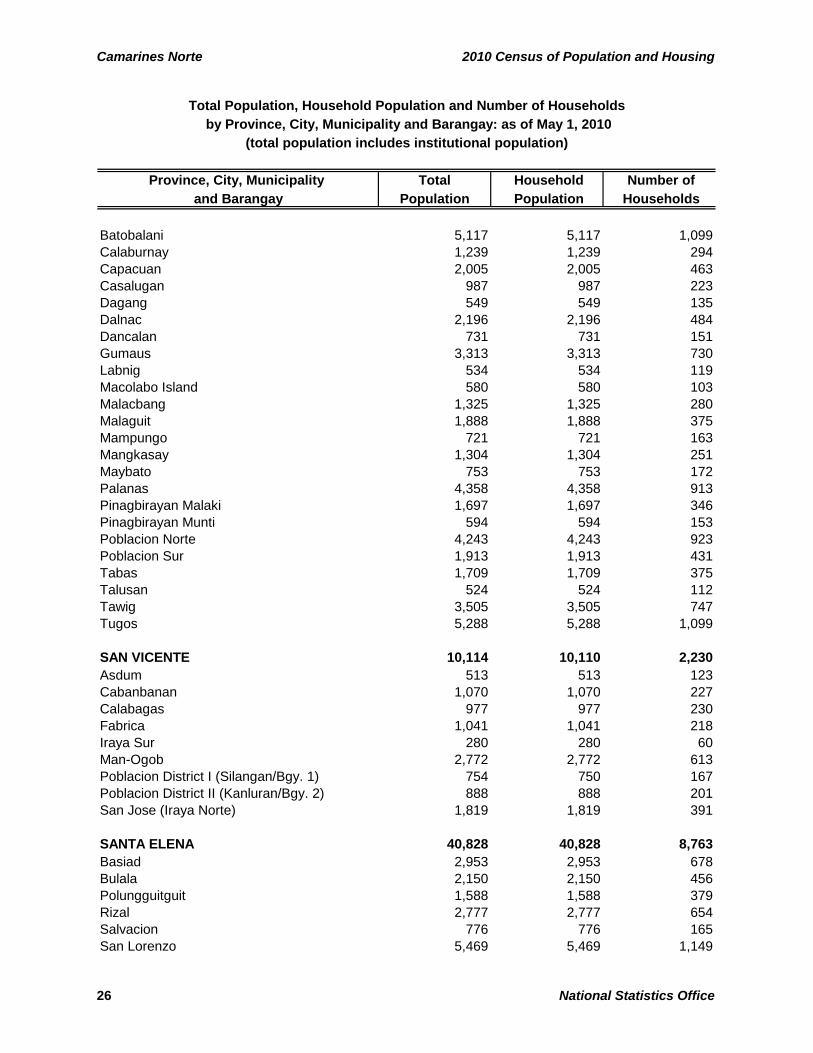
Camarines Norte 2010 Census of Population and Housing
Province, City, Municipality Total Household Number of and Barangay Population Population Households
Total Population, Household Population and Number of Households
(total population includes institutional population) by Province, City, Municipality and Barangay: as of May 1, 2010
Batobalani 5,117 5,117 1,099Calaburnay 1,239 1,239 294Capacuan 2,005 2,005 463Casalugan 987 987 223Dagang 549 549 135Dalnac 2,196 2,196 484Dancalan 731 731 151Gumaus 3,313 3,313 730Labnig 534 534 119Macolabo Island 580 580 103Malacbang 1,325 1,325 280Malaguit 1,888 1,888 375Mampungo 721 721 163Mangkasay 1,304 1,304 251Maybato 753 753 172Palanas 4,358 4,358 913Pinagbirayan Malaki 1,697 1,697 346Pinagbirayan Munti 594 594 153Poblacion Norte 4,243 4,243 923Poblacion Sur 1,913 1,913 431Tabas 1,709 1,709 375Talusan 524 524 112Tawig 3,505 3,505 747Tugos 5,288 5,288 1,099
SAN VICENTE 10,114 10,110 2,230Asdum 513 513 123Cabanbanan 1,070 1,070 227Calabagas 977 977 230Fabrica 1,041 1,041 218Iraya Sur 280 280 60Man-Ogob 2,772 2,772 613Poblacion District I (Silangan/Bgy. 1) 754 750 167Poblacion District II (Kanluran/Bgy. 2) 888 888 201San Jose (Iraya Norte) 1,819 1,819 391
SANTA ELENA 40,828 40,828 8,763Basiad 2,953 2,953 678Bulala 2,150 2,150 456Polungguitguit 1,588 1,588 379Rizal 2,777 2,777 654Salvacion 776 776 165San Lorenzo 5,469 5,469 1,149
26 National Statistics Office
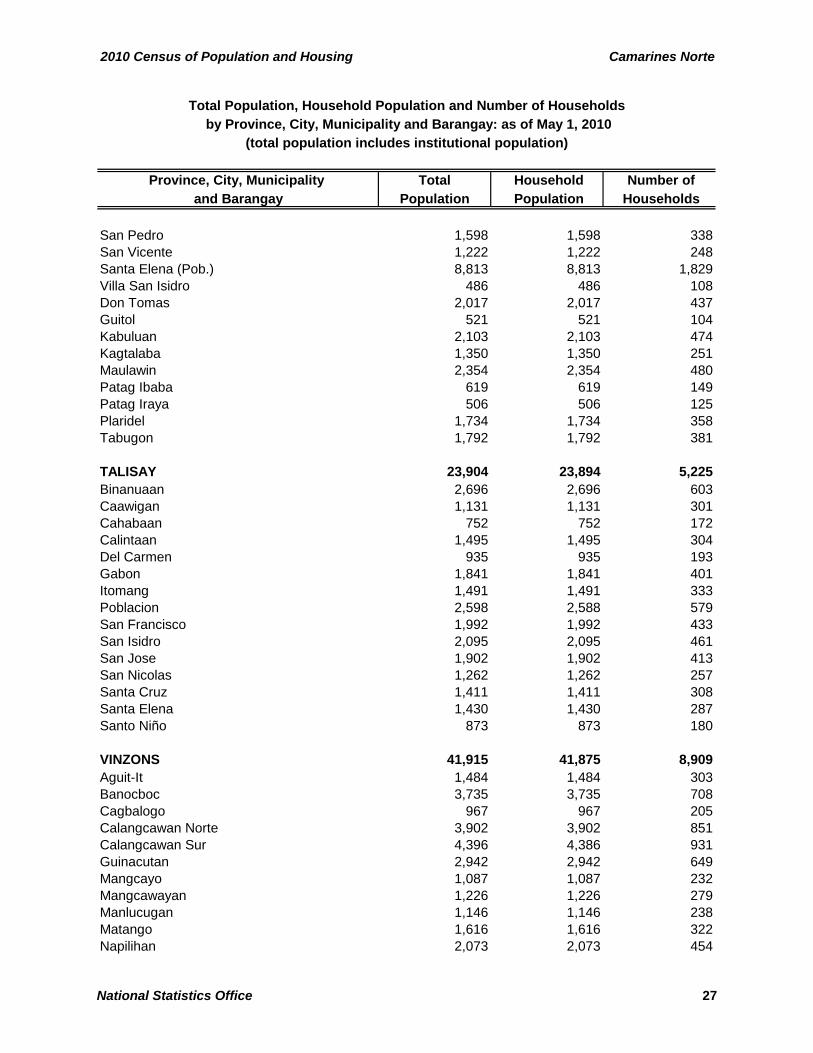
2010 Census of Population and Housing Camarines Norte
Province, City, Municipality Total Household Number of and Barangay Population Population Households
Total Population, Household Population and Number of Households
(total population includes institutional population) by Province, City, Municipality and Barangay: as of May 1, 2010
San Pedro 1,598 1,598 338San Vicente 1,222 1,222 248Santa Elena (Pob.) 8,813 8,813 1,829Villa San Isidro 486 486 108Don Tomas 2,017 2,017 437Guitol 521 521 104Kabuluan 2,103 2,103 474Kagtalaba 1,350 1,350 251Maulawin 2,354 2,354 480Patag Ibaba 619 619 149Patag Iraya 506 506 125Plaridel 1,734 1,734 358Tabugon 1,792 1,792 381
TALISAY 23,904 23,894 5,225Binanuaan 2,696 2,696 603Caawigan 1,131 1,131 301Cahabaan 752 752 172Calintaan 1,495 1,495 304Del Carmen 935 935 193Gabon 1,841 1,841 401Itomang 1,491 1,491 333Poblacion 2,598 2,588 579San Francisco 1,992 1,992 433San Isidro 2,095 2,095 461San Jose 1,902 1,902 413San Nicolas 1,262 1,262 257Santa Cruz 1,411 1,411 308Santa Elena 1,430 1,430 287Santo Niño 873 873 180
VINZONS 41,915 41,875 8,909Aguit-It 1,484 1,484 303Banocboc 3,735 3,735 708Cagbalogo 967 967 205Calangcawan Norte 3,902 3,902 851Calangcawan Sur 4,396 4,386 931Guinacutan 2,942 2,942 649Mangcayo 1,087 1,087 232Mangcawayan 1,226 1,226 279Manlucugan 1,146 1,146 238Matango 1,616 1,616 322Napilihan 2,073 2,073 454
National Statistics Office 27
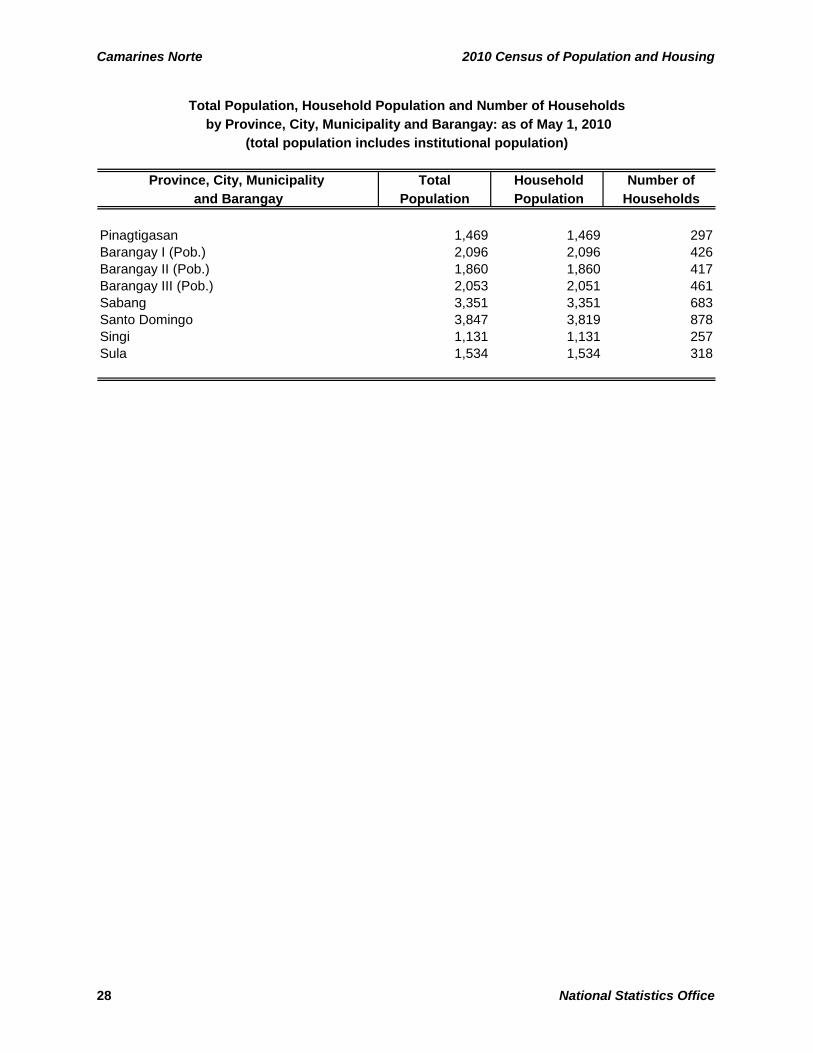
Camarines Norte 2010 Census of Population and Housing
Province, City, Municipality Total Household Number of and Barangay Population Population Households
Total Population, Household Population and Number of Households
(total population includes institutional population) by Province, City, Municipality and Barangay: as of May 1, 2010
Pinagtigasan 1,469 1,469 297Barangay I (Pob.) 2,096 2,096 426Barangay II (Pob.) 1,860 1,860 417Barangay III (Pob.) 2,053 2,051 461Sabang 3,351 3,351 683Santo Domingo 3,847 3,819 878Singi 1,131 1,131 257Sula 1,534 1,534 318
28 National Statistics Office
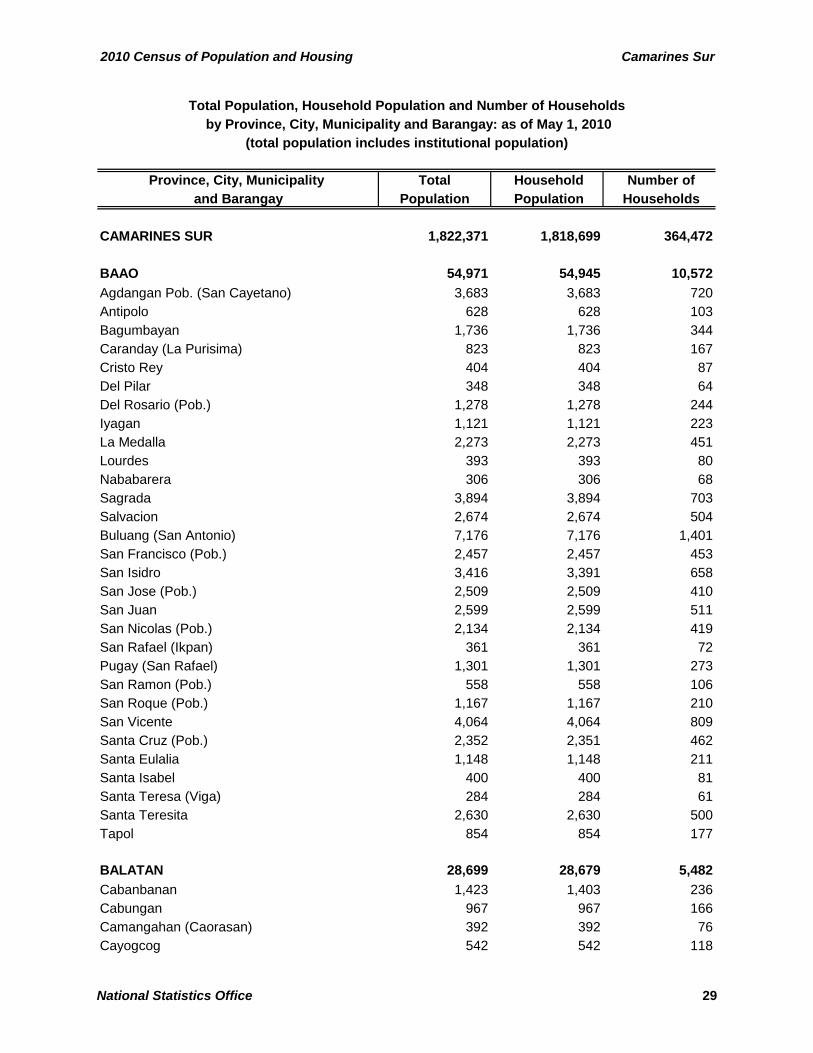
2010 Census of Population and Housing Camarines Sur
Province, City, Municipality Total Household Number of and Barangay Population Population Households
CAMARINES SUR 1,822,371 1,818,699 364,472
BAAO 54,971 54,945 10,572Agdangan Pob. (San Cayetano) 3,683 3,683 720Antipolo 628 628 103Bagumbayan 1,736 1,736 344Caranday (La Purisima) 823 823 167Cristo Rey 404 404 87Del Pilar 348 348 64Del Rosario (Pob.) 1,278 1,278 244Iyagan 1,121 1,121 223La Medalla 2,273 2,273 451Lourdes 393 393 80Nababarera 306 306 68Sagrada 3,894 3,894 703Salvacion 2,674 2,674 504Buluang (San Antonio) 7,176 7,176 1,401San Francisco (Pob.) 2,457 2,457 453San Isidro 3,416 3,391 658San Jose (Pob.) 2,509 2,509 410San Juan 2,599 2,599 511San Nicolas (Pob.) 2,134 2,134 419San Rafael (Ikpan) 361 361 72Pugay (San Rafael) 1,301 1,301 273San Ramon (Pob.) 558 558 106San Roque (Pob.) 1,167 1,167 210San Vicente 4,064 4,064 809Santa Cruz (Pob.) 2,352 2,351 462Santa Eulalia 1,148 1,148 211Santa Isabel 400 400 81Santa Teresa (Viga) 284 284 61Santa Teresita 2,630 2,630 500Tapol 854 854 177
BALATAN 28,699 28,679 5,482Cabanbanan 1,423 1,403 236Cabungan 967 967 166Camangahan (Caorasan) 392 392 76Cayogcog 542 542 118
Total Population, Household Population and Number of Households
(total population includes institutional population) by Province, City, Municipality and Barangay: as of May 1, 2010
National Statistics Office 29
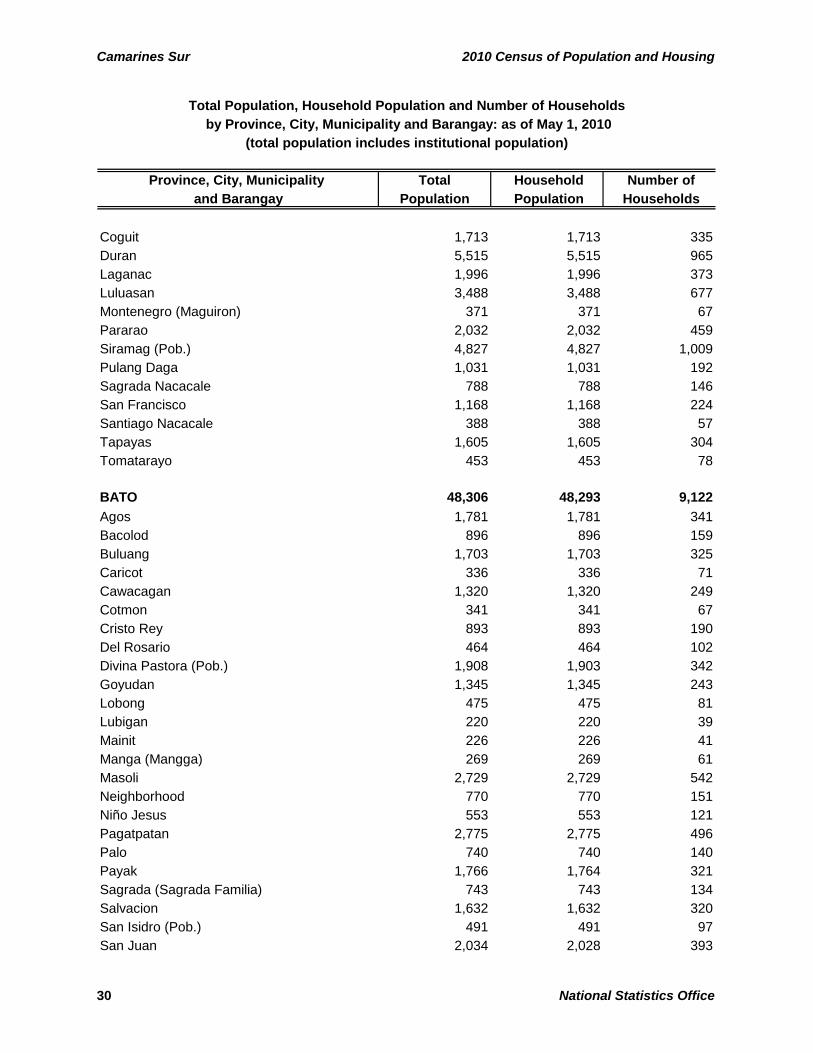
Camarines Sur 2010 Census of Population and Housing
Province, City, Municipality Total Household Number of and Barangay Population Population Households
Total Population, Household Population and Number of Households
(total population includes institutional population) by Province, City, Municipality and Barangay: as of May 1, 2010
Coguit 1,713 1,713 335Duran 5,515 5,515 965Laganac 1,996 1,996 373Luluasan 3,488 3,488 677Montenegro (Maguiron) 371 371 67Pararao 2,032 2,032 459Siramag (Pob.) 4,827 4,827 1,009Pulang Daga 1,031 1,031 192Sagrada Nacacale 788 788 146San Francisco 1,168 1,168 224Santiago Nacacale 388 388 57Tapayas 1,605 1,605 304Tomatarayo 453 453 78
BATO 48,306 48,293 9,122Agos 1,781 1,781 341Bacolod 896 896 159Buluang 1,703 1,703 325Caricot 336 336 71Cawacagan 1,320 1,320 249Cotmon 341 341 67Cristo Rey 893 893 190Del Rosario 464 464 102Divina Pastora (Pob.) 1,908 1,903 342Goyudan 1,345 1,345 243Lobong 475 475 81Lubigan 220 220 39Mainit 226 226 41Manga (Mangga) 269 269 61Masoli 2,729 2,729 542Neighborhood 770 770 151Niño Jesus 553 553 121Pagatpatan 2,775 2,775 496Palo 740 740 140Payak 1,766 1,764 321Sagrada (Sagrada Familia) 743 743 134Salvacion 1,632 1,632 320San Isidro (Pob.) 491 491 97San Juan 2,034 2,028 393
30 National Statistics Office
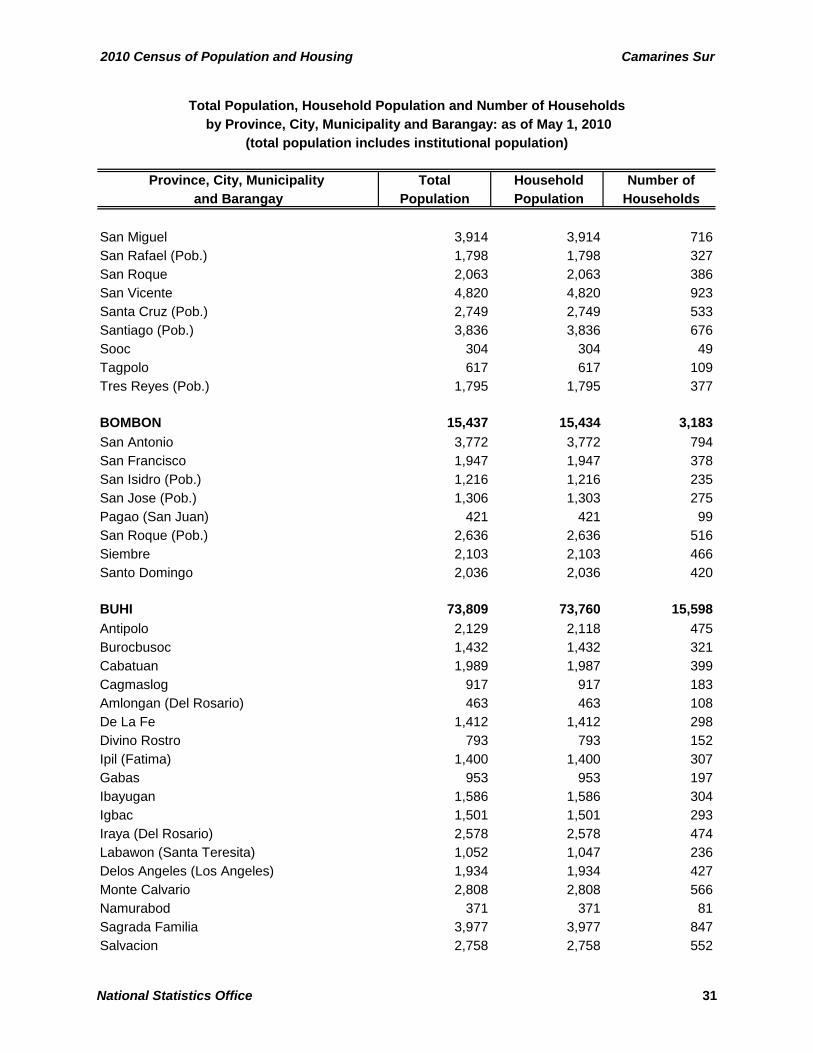
2010 Census of Population and Housing Camarines Sur
Province, City, Municipality Total Household Number of and Barangay Population Population Households
Total Population, Household Population and Number of Households
(total population includes institutional population) by Province, City, Municipality and Barangay: as of May 1, 2010
San Miguel 3,914 3,914 716San Rafael (Pob.) 1,798 1,798 327San Roque 2,063 2,063 386San Vicente 4,820 4,820 923Santa Cruz (Pob.) 2,749 2,749 533Santiago (Pob.) 3,836 3,836 676Sooc 304 304 49Tagpolo 617 617 109Tres Reyes (Pob.) 1,795 1,795 377
BOMBON 15,437 15,434 3,183San Antonio 3,772 3,772 794San Francisco 1,947 1,947 378San Isidro (Pob.) 1,216 1,216 235San Jose (Pob.) 1,306 1,303 275Pagao (San Juan) 421 421 99San Roque (Pob.) 2,636 2,636 516Siembre 2,103 2,103 466Santo Domingo 2,036 2,036 420
BUHI 73,809 73,760 15,598Antipolo 2,129 2,118 475Burocbusoc 1,432 1,432 321Cabatuan 1,989 1,987 399Cagmaslog 917 917 183Amlongan (Del Rosario) 463 463 108De La Fe 1,412 1,412 298Divino Rostro 793 793 152Ipil (Fatima) 1,400 1,400 307Gabas 953 953 197Ibayugan 1,586 1,586 304Igbac 1,501 1,501 293Iraya (Del Rosario) 2,578 2,578 474Labawon (Santa Teresita) 1,052 1,047 236Delos Angeles (Los Angeles) 1,934 1,934 427Monte Calvario 2,808 2,808 566Namurabod 371 371 81Sagrada Familia 3,977 3,977 847Salvacion 2,758 2,758 552
National Statistics Office 31
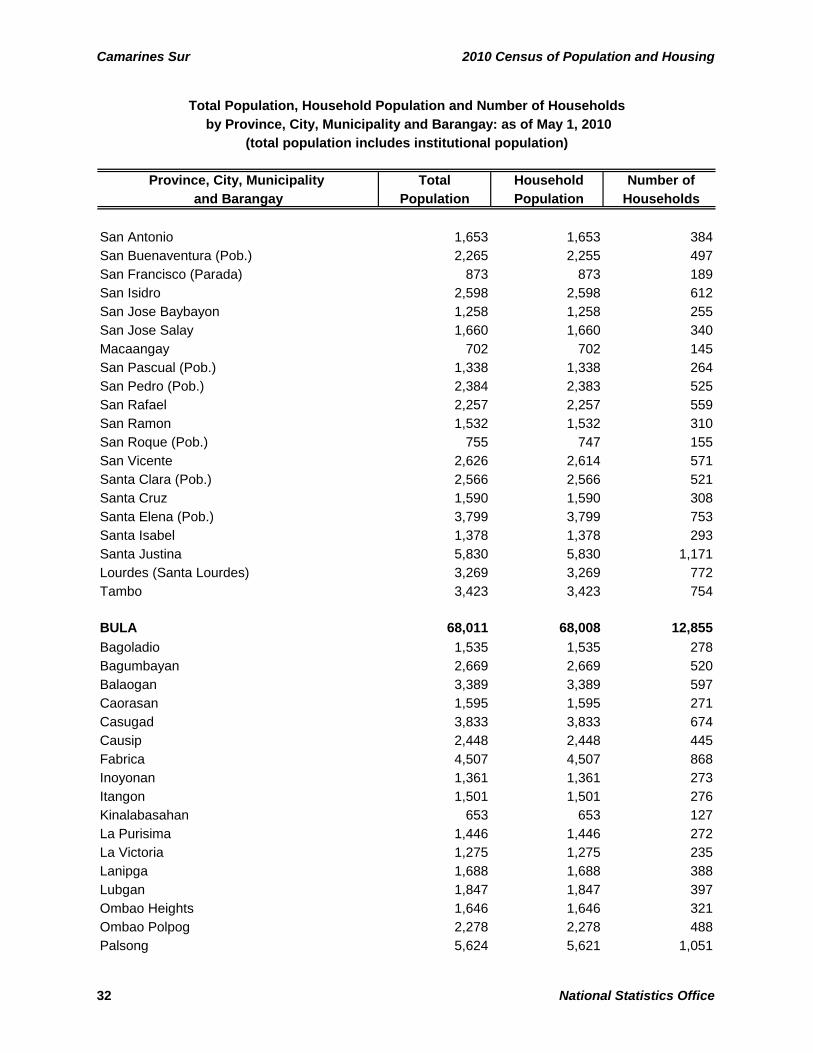
Camarines Sur 2010 Census of Population and Housing
Province, City, Municipality Total Household Number of and Barangay Population Population Households
Total Population, Household Population and Number of Households
(total population includes institutional population) by Province, City, Municipality and Barangay: as of May 1, 2010
San Antonio 1,653 1,653 384San Buenaventura (Pob.) 2,265 2,255 497San Francisco (Parada) 873 873 189San Isidro 2,598 2,598 612San Jose Baybayon 1,258 1,258 255San Jose Salay 1,660 1,660 340Macaangay 702 702 145San Pascual (Pob.) 1,338 1,338 264San Pedro (Pob.) 2,384 2,383 525San Rafael 2,257 2,257 559San Ramon 1,532 1,532 310San Roque (Pob.) 755 747 155San Vicente 2,626 2,614 571Santa Clara (Pob.) 2,566 2,566 521Santa Cruz 1,590 1,590 308Santa Elena (Pob.) 3,799 3,799 753Santa Isabel 1,378 1,378 293Santa Justina 5,830 5,830 1,171Lourdes (Santa Lourdes) 3,269 3,269 772Tambo 3,423 3,423 754
BULA 68,011 68,008 12,855Bagoladio 1,535 1,535 278Bagumbayan 2,669 2,669 520Balaogan 3,389 3,389 597Caorasan 1,595 1,595 271Casugad 3,833 3,833 674Causip 2,448 2,448 445Fabrica 4,507 4,507 868Inoyonan 1,361 1,361 273Itangon 1,501 1,501 276Kinalabasahan 653 653 127La Purisima 1,446 1,446 272La Victoria 1,275 1,275 235Lanipga 1,688 1,688 388Lubgan 1,847 1,847 397Ombao Heights 1,646 1,646 321Ombao Polpog 2,278 2,278 488Palsong 5,624 5,621 1,051
32 National Statistics Office
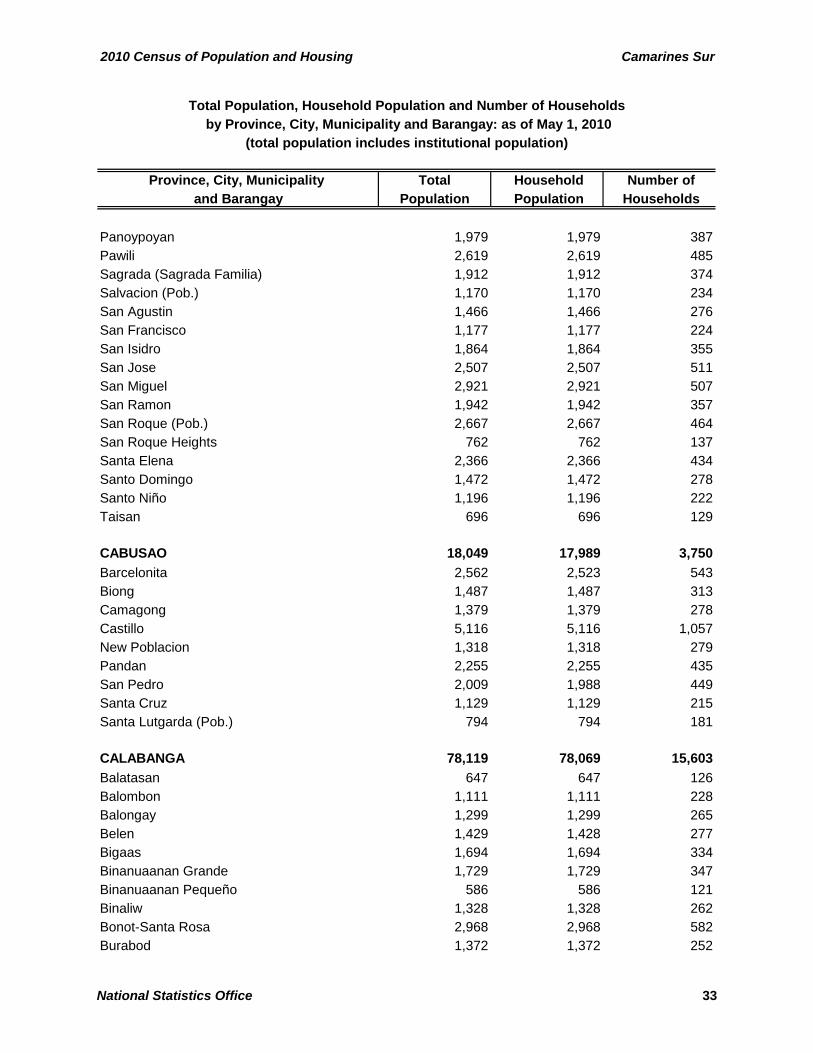
2010 Census of Population and Housing Camarines Sur
Province, City, Municipality Total Household Number of and Barangay Population Population Households
Total Population, Household Population and Number of Households
(total population includes institutional population) by Province, City, Municipality and Barangay: as of May 1, 2010
Panoypoyan 1,979 1,979 387Pawili 2,619 2,619 485Sagrada (Sagrada Familia) 1,912 1,912 374Salvacion (Pob.) 1,170 1,170 234San Agustin 1,466 1,466 276San Francisco 1,177 1,177 224San Isidro 1,864 1,864 355San Jose 2,507 2,507 511San Miguel 2,921 2,921 507San Ramon 1,942 1,942 357San Roque (Pob.) 2,667 2,667 464San Roque Heights 762 762 137Santa Elena 2,366 2,366 434Santo Domingo 1,472 1,472 278Santo Niño 1,196 1,196 222Taisan 696 696 129
CABUSAO 18,049 17,989 3,750Barcelonita 2,562 2,523 543Biong 1,487 1,487 313Camagong 1,379 1,379 278Castillo 5,116 5,116 1,057New Poblacion 1,318 1,318 279Pandan 2,255 2,255 435San Pedro 2,009 1,988 449Santa Cruz 1,129 1,129 215Santa Lutgarda (Pob.) 794 794 181
CALABANGA 78,119 78,069 15,603Balatasan 647 647 126Balombon 1,111 1,111 228Balongay 1,299 1,299 265Belen 1,429 1,428 277Bigaas 1,694 1,694 334Binanuaanan Grande 1,729 1,729 347Binanuaanan Pequeño 586 586 121Binaliw 1,328 1,328 262Bonot-Santa Rosa 2,968 2,968 582Burabod 1,372 1,372 252
National Statistics Office 33
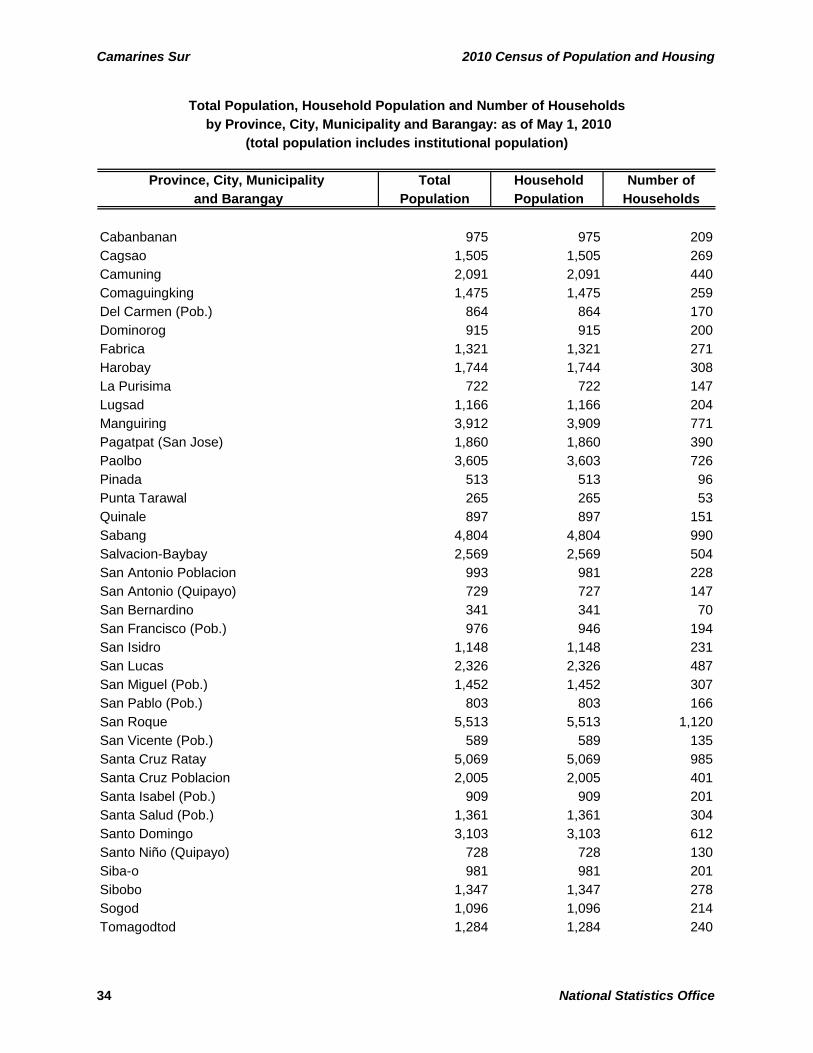
Camarines Sur 2010 Census of Population and Housing
Province, City, Municipality Total Household Number of and Barangay Population Population Households
Total Population, Household Population and Number of Households
(total population includes institutional population) by Province, City, Municipality and Barangay: as of May 1, 2010
Cabanbanan 975 975 209Cagsao 1,505 1,505 269Camuning 2,091 2,091 440Comaguingking 1,475 1,475 259Del Carmen (Pob.) 864 864 170Dominorog 915 915 200Fabrica 1,321 1,321 271Harobay 1,744 1,744 308La Purisima 722 722 147Lugsad 1,166 1,166 204Manguiring 3,912 3,909 771Pagatpat (San Jose) 1,860 1,860 390Paolbo 3,605 3,603 726Pinada 513 513 96Punta Tarawal 265 265 53Quinale 897 897 151Sabang 4,804 4,804 990Salvacion-Baybay 2,569 2,569 504San Antonio Poblacion 993 981 228San Antonio (Quipayo) 729 727 147San Bernardino 341 341 70San Francisco (Pob.) 976 946 194San Isidro 1,148 1,148 231San Lucas 2,326 2,326 487San Miguel (Pob.) 1,452 1,452 307San Pablo (Pob.) 803 803 166San Roque 5,513 5,513 1,120San Vicente (Pob.) 589 589 135Santa Cruz Ratay 5,069 5,069 985Santa Cruz Poblacion 2,005 2,005 401Santa Isabel (Pob.) 909 909 201Santa Salud (Pob.) 1,361 1,361 304Santo Domingo 3,103 3,103 612Santo Niño (Quipayo) 728 728 130Siba-o 981 981 201Sibobo 1,347 1,347 278Sogod 1,096 1,096 214Tomagodtod 1,284 1,284 240
34 National Statistics Office
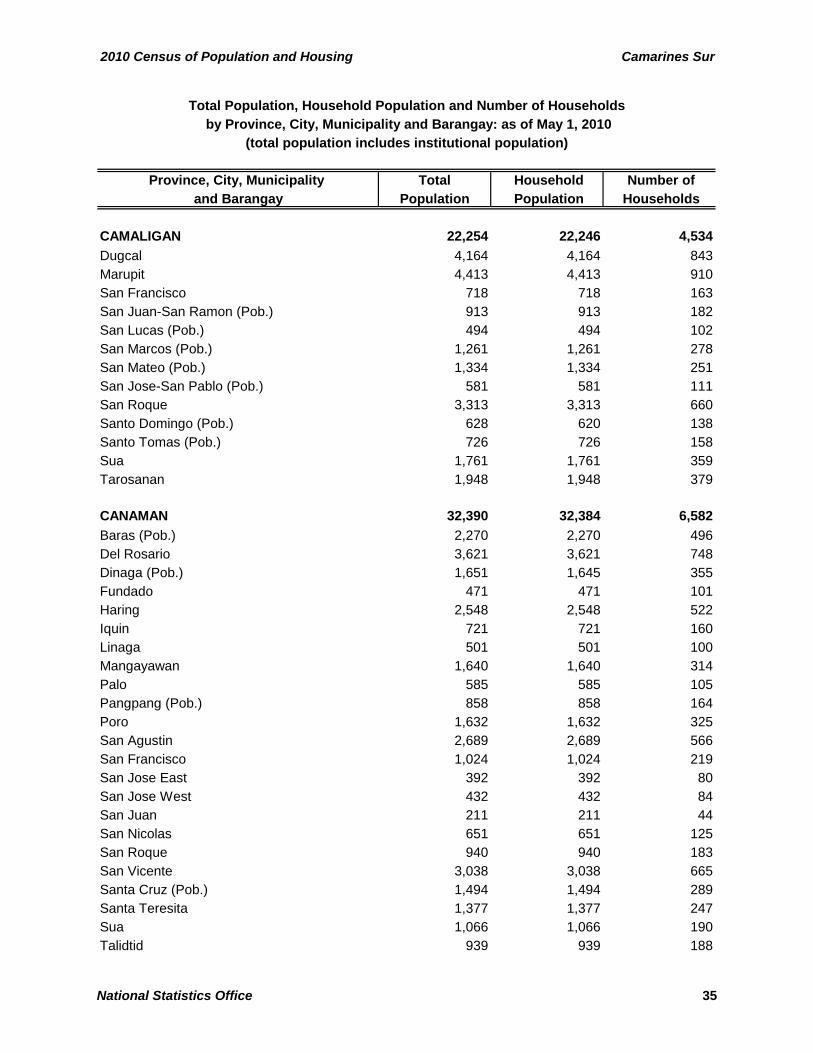
2010 Census of Population and Housing Camarines Sur
Province, City, Municipality Total Household Number of and Barangay Population Population Households
Total Population, Household Population and Number of Households
(total population includes institutional population) by Province, City, Municipality and Barangay: as of May 1, 2010
CAMALIGAN 22,254 22,246 4,534Dugcal 4,164 4,164 843Marupit 4,413 4,413 910San Francisco 718 718 163San Juan-San Ramon (Pob.) 913 913 182San Lucas (Pob.) 494 494 102San Marcos (Pob.) 1,261 1,261 278San Mateo (Pob.) 1,334 1,334 251San Jose-San Pablo (Pob.) 581 581 111San Roque 3,313 3,313 660Santo Domingo (Pob.) 628 620 138Santo Tomas (Pob.) 726 726 158Sua 1,761 1,761 359Tarosanan 1,948 1,948 379
CANAMAN 32,390 32,384 6,582Baras (Pob.) 2,270 2,270 496Del Rosario 3,621 3,621 748Dinaga (Pob.) 1,651 1,645 355Fundado 471 471 101Haring 2,548 2,548 522Iquin 721 721 160Linaga 501 501 100Mangayawan 1,640 1,640 314Palo 585 585 105Pangpang (Pob.) 858 858 164Poro 1,632 1,632 325San Agustin 2,689 2,689 566San Francisco 1,024 1,024 219San Jose East 392 392 80San Jose West 432 432 84San Juan 211 211 44San Nicolas 651 651 125San Roque 940 940 183San Vicente 3,038 3,038 665Santa Cruz (Pob.) 1,494 1,494 289Santa Teresita 1,377 1,377 247Sua 1,066 1,066 190Talidtid 939 939 188
National Statistics Office 35
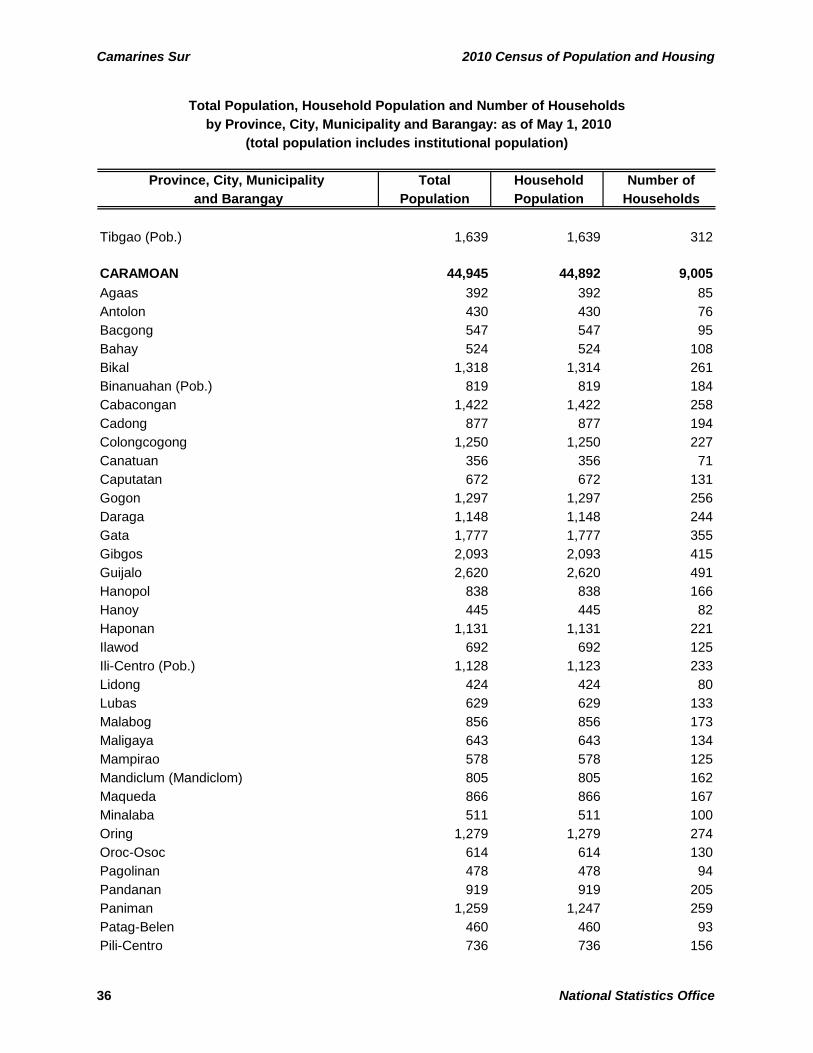
Camarines Sur 2010 Census of Population and Housing
Province, City, Municipality Total Household Number of and Barangay Population Population Households
Total Population, Household Population and Number of Households
(total population includes institutional population) by Province, City, Municipality and Barangay: as of May 1, 2010
Tibgao (Pob.) 1,639 1,639 312
CARAMOAN 44,945 44,892 9,005Agaas 392 392 85Antolon 430 430 76Bacgong 547 547 95Bahay 524 524 108Bikal 1,318 1,314 261Binanuahan (Pob.) 819 819 184Cabacongan 1,422 1,422 258Cadong 877 877 194Colongcogong 1,250 1,250 227Canatuan 356 356 71Caputatan 672 672 131Gogon 1,297 1,297 256Daraga 1,148 1,148 244Gata 1,777 1,777 355Gibgos 2,093 2,093 415Guijalo 2,620 2,620 491Hanopol 838 838 166Hanoy 445 445 82Haponan 1,131 1,131 221Ilawod 692 692 125Ili-Centro (Pob.) 1,128 1,123 233Lidong 424 424 80Lubas 629 629 133Malabog 856 856 173Maligaya 643 643 134Mampirao 578 578 125Mandiclum (Mandiclom) 805 805 162Maqueda 866 866 167Minalaba 511 511 100Oring 1,279 1,279 274Oroc-Osoc 614 614 130Pagolinan 478 478 94Pandanan 919 919 205Paniman 1,259 1,247 259Patag-Belen 460 460 93Pili-Centro 736 736 156
36 National Statistics Office
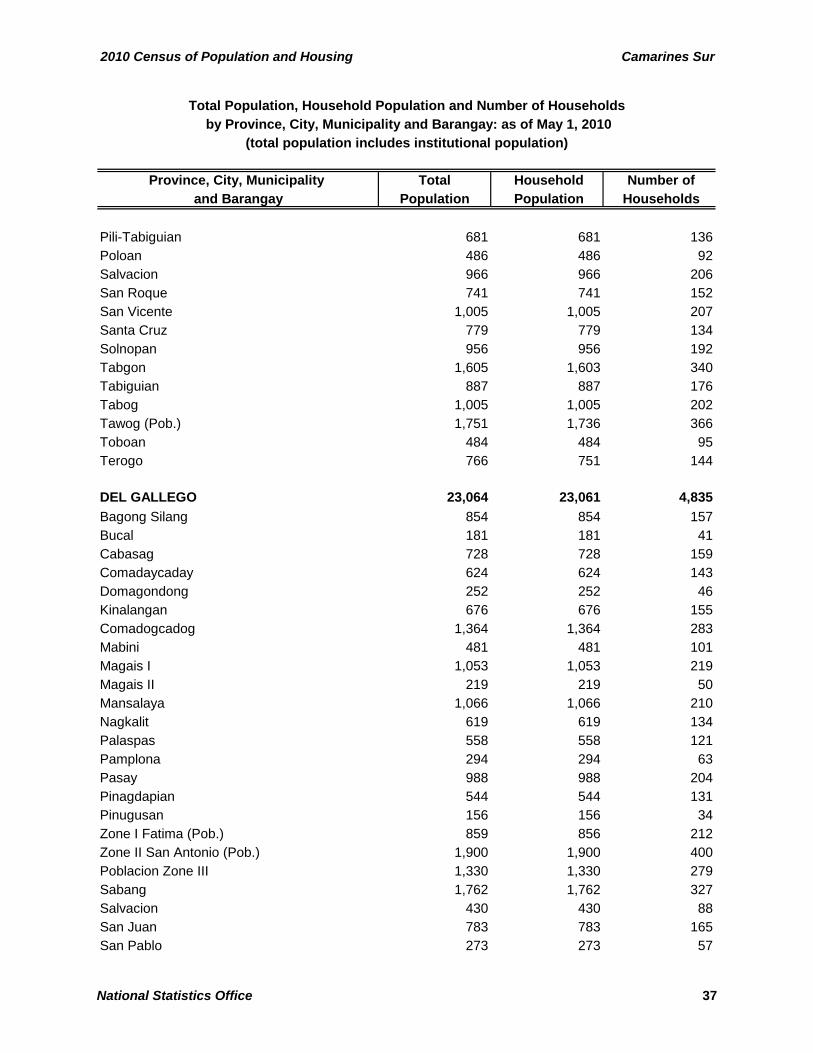
2010 Census of Population and Housing Camarines Sur
Province, City, Municipality Total Household Number of and Barangay Population Population Households
Total Population, Household Population and Number of Households
(total population includes institutional population) by Province, City, Municipality and Barangay: as of May 1, 2010
Pili-Tabiguian 681 681 136Poloan 486 486 92Salvacion 966 966 206San Roque 741 741 152San Vicente 1,005 1,005 207Santa Cruz 779 779 134Solnopan 956 956 192Tabgon 1,605 1,603 340Tabiguian 887 887 176Tabog 1,005 1,005 202Tawog (Pob.) 1,751 1,736 366Toboan 484 484 95Terogo 766 751 144
DEL GALLEGO 23,064 23,061 4,835Bagong Silang 854 854 157Bucal 181 181 41Cabasag 728 728 159Comadaycaday 624 624 143Domagondong 252 252 46Kinalangan 676 676 155Comadogcadog 1,364 1,364 283Mabini 481 481 101Magais I 1,053 1,053 219Magais II 219 219 50Mansalaya 1,066 1,066 210Nagkalit 619 619 134Palaspas 558 558 121Pamplona 294 294 63Pasay 988 988 204Pinagdapian 544 544 131Pinugusan 156 156 34Zone I Fatima (Pob.) 859 856 212Zone II San Antonio (Pob.) 1,900 1,900 400Poblacion Zone III 1,330 1,330 279Sabang 1,762 1,762 327Salvacion 430 430 88San Juan 783 783 165San Pablo 273 273 57
National Statistics Office 37

Camarines Sur 2010 Census of Population and Housing
Province, City, Municipality Total Household Number of and Barangay Population Population Households
Total Population, Household Population and Number of Households
(total population includes institutional population) by Province, City, Municipality and Barangay: as of May 1, 2010
Santa Rita I 470 470 86Santa Rita II 287 287 62Sinagawsawan 551 551 110Sinuknipan I 2,153 2,153 463Sinuknipan II 419 419 83Sugsugin 399 399 85Tabion 506 506 104Tomagoktok 285 285 63
GAINZA 10,345 10,341 2,020Cagbunga 1,652 1,652 296Dahilig 1,163 1,163 251Loob 1,403 1,403 266Malbong 1,402 1,402 261Namuat 498 498 102Sampaloc 1,882 1,882 382District I (Pob.) 1,183 1,183 232District II (Pob.) 1,162 1,158 230
GARCHITORENA 25,204 25,200 4,593Ason (Anson) 1,109 1,109 215Bahi 1,888 1,888 306Binagasbasan 1,118 1,118 219Burabod 706 706 118Cagamutan 550 550 103Cagnipa 720 720 116Canlong 733 733 137Dangla 529 529 96Del Pilar 1,022 1,022 192Denrica 1,521 1,521 258Harrison 1,839 1,839 337Mansangat 580 580 107Pambuhan 1,254 1,254 232Barangay I (Pob.) 1,437 1,437 273Barangay II (Pob.) 950 950 172Barangay III (Pob.) 562 558 105Barangay IV (Pob.) 2,373 2,373 438Sagrada 598 598 126Salvacion 456 456 85
38 National Statistics Office
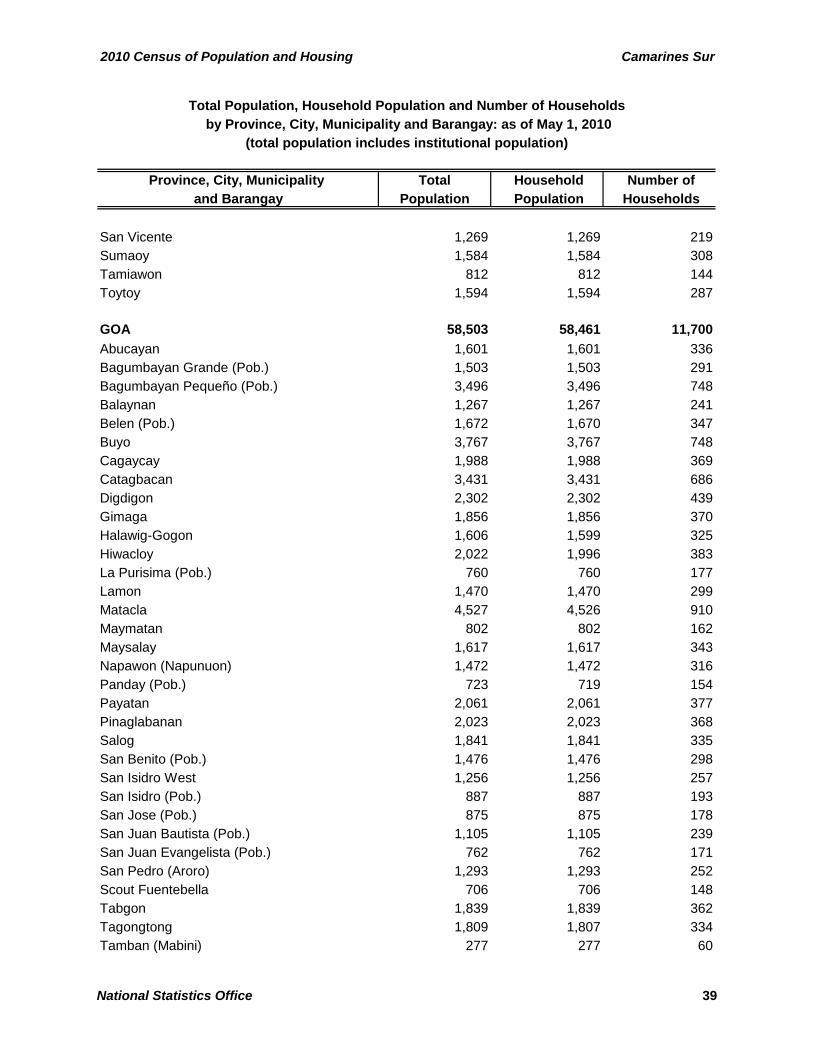
2010 Census of Population and Housing Camarines Sur
Province, City, Municipality Total Household Number of and Barangay Population Population Households
Total Population, Household Population and Number of Households
(total population includes institutional population) by Province, City, Municipality and Barangay: as of May 1, 2010
San Vicente 1,269 1,269 219Sumaoy 1,584 1,584 308Tamiawon 812 812 144Toytoy 1,594 1,594 287
GOA 58,503 58,461 11,700Abucayan 1,601 1,601 336Bagumbayan Grande (Pob.) 1,503 1,503 291Bagumbayan Pequeño (Pob.) 3,496 3,496 748Balaynan 1,267 1,267 241Belen (Pob.) 1,672 1,670 347Buyo 3,767 3,767 748Cagaycay 1,988 1,988 369Catagbacan 3,431 3,431 686Digdigon 2,302 2,302 439Gimaga 1,856 1,856 370Halawig-Gogon 1,606 1,599 325Hiwacloy 2,022 1,996 383La Purisima (Pob.) 760 760 177Lamon 1,470 1,470 299Matacla 4,527 4,526 910Maymatan 802 802 162Maysalay 1,617 1,617 343Napawon (Napunuon) 1,472 1,472 316Panday (Pob.) 723 719 154Payatan 2,061 2,061 377Pinaglabanan 2,023 2,023 368Salog 1,841 1,841 335San Benito (Pob.) 1,476 1,476 298San Isidro West 1,256 1,256 257San Isidro (Pob.) 887 887 193San Jose (Pob.) 875 875 178San Juan Bautista (Pob.) 1,105 1,105 239San Juan Evangelista (Pob.) 762 762 171San Pedro (Aroro) 1,293 1,293 252Scout Fuentebella 706 706 148Tabgon 1,839 1,839 362Tagongtong 1,809 1,807 334Tamban (Mabini) 277 277 60
National Statistics Office 39
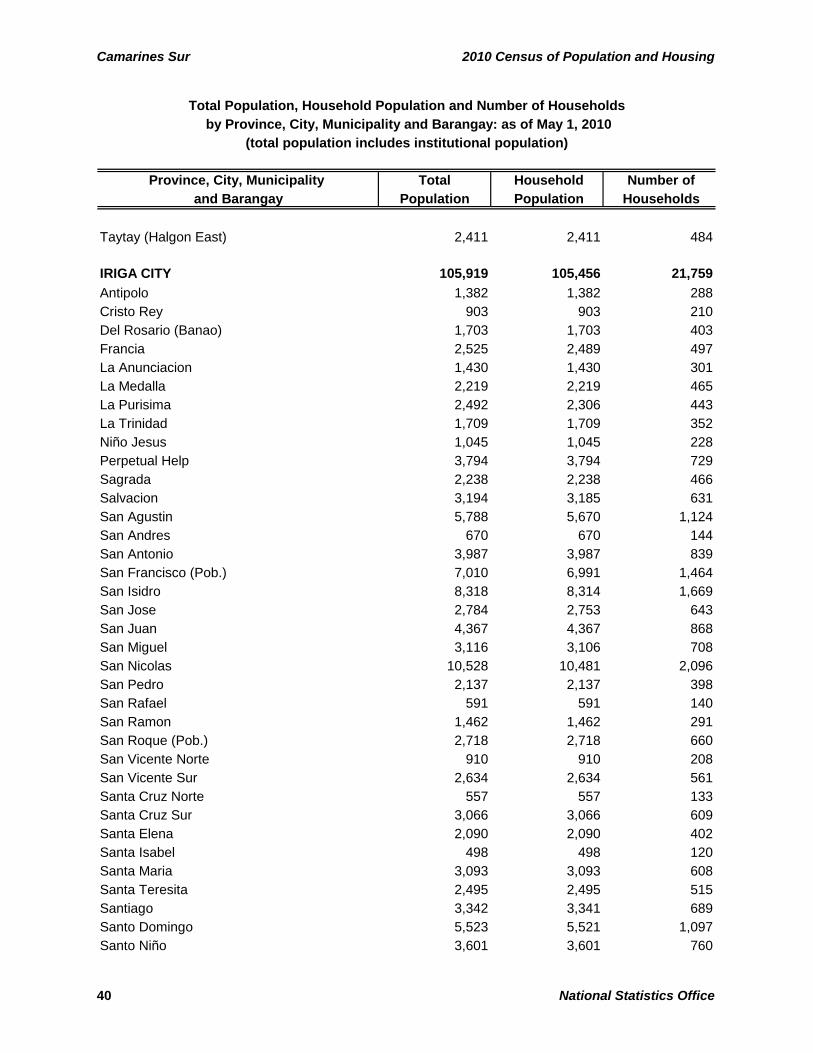
Camarines Sur 2010 Census of Population and Housing
Province, City, Municipality Total Household Number of and Barangay Population Population Households
Total Population, Household Population and Number of Households
(total population includes institutional population) by Province, City, Municipality and Barangay: as of May 1, 2010
Taytay (Halgon East) 2,411 2,411 484
IRIGA CITY 105,919 105,456 21,759Antipolo 1,382 1,382 288Cristo Rey 903 903 210Del Rosario (Banao) 1,703 1,703 403Francia 2,525 2,489 497La Anunciacion 1,430 1,430 301La Medalla 2,219 2,219 465La Purisima 2,492 2,306 443La Trinidad 1,709 1,709 352Niño Jesus 1,045 1,045 228Perpetual Help 3,794 3,794 729Sagrada 2,238 2,238 466Salvacion 3,194 3,185 631San Agustin 5,788 5,670 1,124San Andres 670 670 144San Antonio 3,987 3,987 839San Francisco (Pob.) 7,010 6,991 1,464San Isidro 8,318 8,314 1,669San Jose 2,784 2,753 643San Juan 4,367 4,367 868San Miguel 3,116 3,106 708San Nicolas 10,528 10,481 2,096San Pedro 2,137 2,137 398San Rafael 591 591 140San Ramon 1,462 1,462 291San Roque (Pob.) 2,718 2,718 660San Vicente Norte 910 910 208San Vicente Sur 2,634 2,634 561Santa Cruz Norte 557 557 133Santa Cruz Sur 3,066 3,066 609Santa Elena 2,090 2,090 402Santa Isabel 498 498 120Santa Maria 3,093 3,093 608Santa Teresita 2,495 2,495 515Santiago 3,342 3,341 689Santo Domingo 5,523 5,521 1,097Santo Niño 3,601 3,601 760
40 National Statistics Office
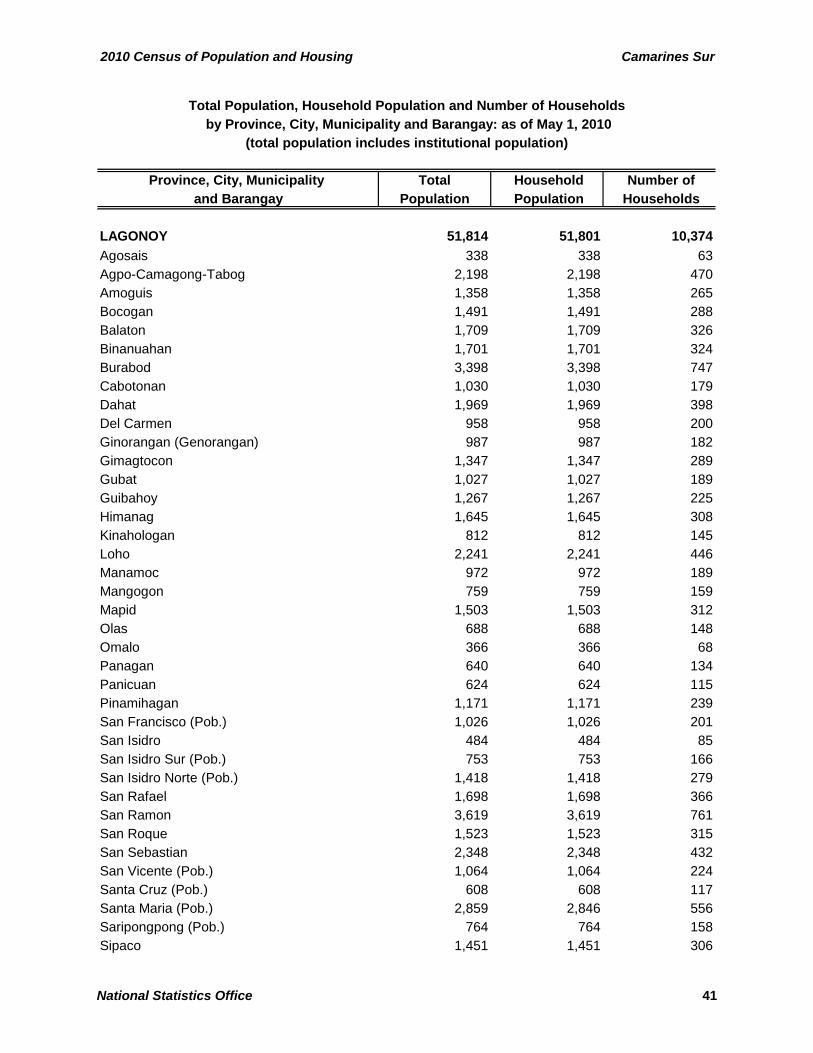
2010 Census of Population and Housing Camarines Sur
Province, City, Municipality Total Household Number of and Barangay Population Population Households
Total Population, Household Population and Number of Households
(total population includes institutional population) by Province, City, Municipality and Barangay: as of May 1, 2010
LAGONOY 51,814 51,801 10,374Agosais 338 338 63Agpo-Camagong-Tabog 2,198 2,198 470Amoguis 1,358 1,358 265Bocogan 1,491 1,491 288Balaton 1,709 1,709 326Binanuahan 1,701 1,701 324Burabod 3,398 3,398 747Cabotonan 1,030 1,030 179Dahat 1,969 1,969 398Del Carmen 958 958 200Ginorangan (Genorangan) 987 987 182Gimagtocon 1,347 1,347 289Gubat 1,027 1,027 189Guibahoy 1,267 1,267 225Himanag 1,645 1,645 308Kinahologan 812 812 145Loho 2,241 2,241 446Manamoc 972 972 189Mangogon 759 759 159Mapid 1,503 1,503 312Olas 688 688 148Omalo 366 366 68Panagan 640 640 134Panicuan 624 624 115Pinamihagan 1,171 1,171 239San Francisco (Pob.) 1,026 1,026 201San Isidro 484 484 85San Isidro Sur (Pob.) 753 753 166San Isidro Norte (Pob.) 1,418 1,418 279San Rafael 1,698 1,698 366San Ramon 3,619 3,619 761San Roque 1,523 1,523 315San Sebastian 2,348 2,348 432San Vicente (Pob.) 1,064 1,064 224Santa Cruz (Pob.) 608 608 117Santa Maria (Pob.) 2,859 2,846 556Saripongpong (Pob.) 764 764 158Sipaco 1,451 1,451 306
National Statistics Office 41

Camarines Sur 2010 Census of Population and Housing
Province, City, Municipality Total Household Number of and Barangay Population Population Households
Total Population, Household Population and Number of Households
(total population includes institutional population) by Province, City, Municipality and Barangay: as of May 1, 2010
LIBMANAN 100,002 99,837 20,670Aslong 672 672 138Awayan 1,464 1,464 299Bagacay 1,438 1,438 335Bagadion 1,539 1,539 327Bagamelon 889 889 173Bagumbayan 1,617 1,543 322Bahao 3,497 3,497 671Bahay 3,471 3,471 700Beguito Nuevo 805 805 164Beguito Viejo 1,245 1,245 253Begajo Norte 1,318 1,318 274Begajo Sur 1,058 1,058 197Bikal 1,774 1,774 349Busak 1,604 1,604 314Caima 1,205 1,202 271Calabnigan 1,248 1,248 243Camambugan 818 818 170Cambalidio 2,913 2,851 613Candami 339 339 73Candato 1,186 1,186 238Cawayan 989 989 195Concepcion 1,868 1,868 386Cuyapi 282 282 53Danawan 798 798 164Duang Niog 1,338 1,338 283Handong 1,350 1,350 282Ibid 1,781 1,781 338Inalahan 742 742 148Labao 1,900 1,900 385Libod I 548 548 126Libod II 642 642 132Loba-loba 1,537 1,537 303Mabini 634 634 133Malansad Nuevo 774 774 179Malansad Viejo 953 953 218Malbogon 767 767 171Malinao 1,873 1,870 387Mambalite 607 607 148
42 National Statistics Office
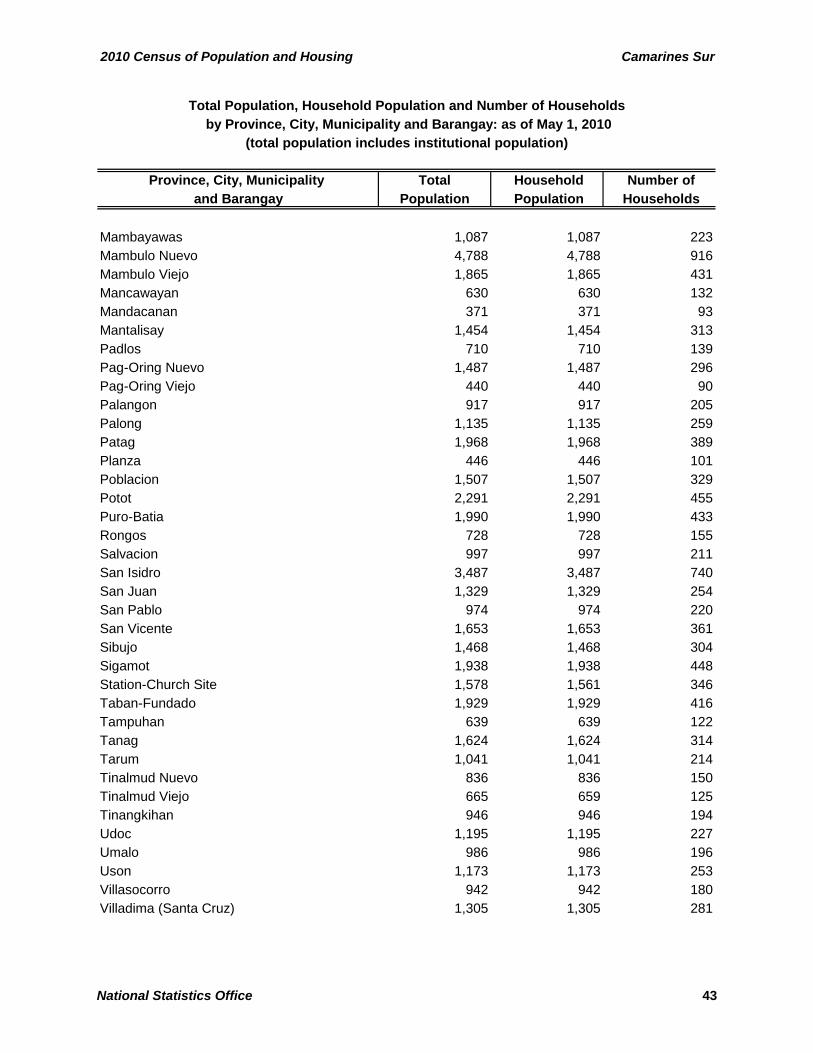
2010 Census of Population and Housing Camarines Sur
Province, City, Municipality Total Household Number of and Barangay Population Population Households
Total Population, Household Population and Number of Households
(total population includes institutional population) by Province, City, Municipality and Barangay: as of May 1, 2010
Mambayawas 1,087 1,087 223Mambulo Nuevo 4,788 4,788 916Mambulo Viejo 1,865 1,865 431Mancawayan 630 630 132Mandacanan 371 371 93Mantalisay 1,454 1,454 313Padlos 710 710 139Pag-Oring Nuevo 1,487 1,487 296Pag-Oring Viejo 440 440 90Palangon 917 917 205Palong 1,135 1,135 259Patag 1,968 1,968 389Planza 446 446 101Poblacion 1,507 1,507 329Potot 2,291 2,291 455Puro-Batia 1,990 1,990 433Rongos 728 728 155Salvacion 997 997 211San Isidro 3,487 3,487 740San Juan 1,329 1,329 254San Pablo 974 974 220San Vicente 1,653 1,653 361Sibujo 1,468 1,468 304Sigamot 1,938 1,938 448Station-Church Site 1,578 1,561 346Taban-Fundado 1,929 1,929 416Tampuhan 639 639 122Tanag 1,624 1,624 314Tarum 1,041 1,041 214Tinalmud Nuevo 836 836 150Tinalmud Viejo 665 659 125Tinangkihan 946 946 194Udoc 1,195 1,195 227Umalo 986 986 196Uson 1,173 1,173 253Villasocorro 942 942 180Villadima (Santa Cruz) 1,305 1,305 281
National Statistics Office 43
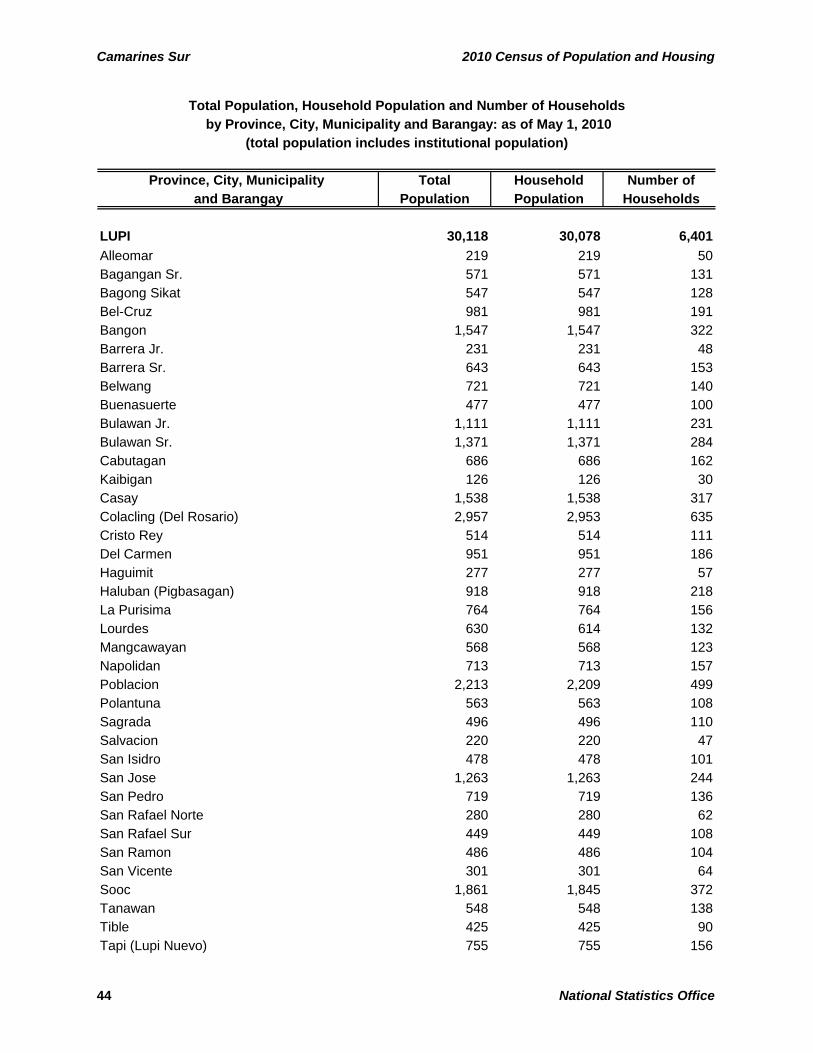
Camarines Sur 2010 Census of Population and Housing
Province, City, Municipality Total Household Number of and Barangay Population Population Households
Total Population, Household Population and Number of Households
(total population includes institutional population) by Province, City, Municipality and Barangay: as of May 1, 2010
LUPI 30,118 30,078 6,401Alleomar 219 219 50Bagangan Sr. 571 571 131Bagong Sikat 547 547 128Bel-Cruz 981 981 191Bangon 1,547 1,547 322Barrera Jr. 231 231 48Barrera Sr. 643 643 153Belwang 721 721 140Buenasuerte 477 477 100Bulawan Jr. 1,111 1,111 231Bulawan Sr. 1,371 1,371 284Cabutagan 686 686 162Kaibigan 126 126 30Casay 1,538 1,538 317Colacling (Del Rosario) 2,957 2,953 635Cristo Rey 514 514 111Del Carmen 951 951 186Haguimit 277 277 57Haluban (Pigbasagan) 918 918 218La Purisima 764 764 156Lourdes 630 614 132Mangcawayan 568 568 123Napolidan 713 713 157Poblacion 2,213 2,209 499Polantuna 563 563 108Sagrada 496 496 110Salvacion 220 220 47San Isidro 478 478 101San Jose 1,263 1,263 244San Pedro 719 719 136San Rafael Norte 280 280 62San Rafael Sur 449 449 108San Ramon 486 486 104San Vicente 301 301 64Sooc 1,861 1,845 372Tanawan 548 548 138Tible 425 425 90Tapi (Lupi Nuevo) 755 755 156
44 National Statistics Office
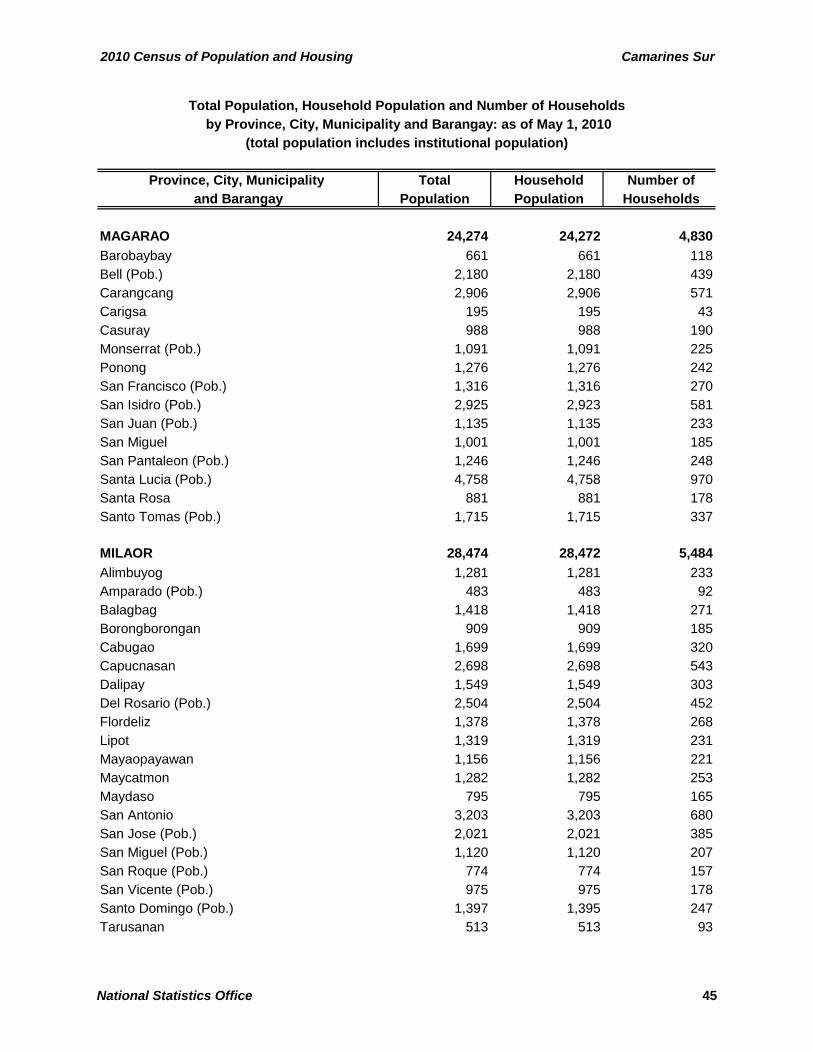
2010 Census of Population and Housing Camarines Sur
Province, City, Municipality Total Household Number of and Barangay Population Population Households
Total Population, Household Population and Number of Households
(total population includes institutional population) by Province, City, Municipality and Barangay: as of May 1, 2010
MAGARAO 24,274 24,272 4,830Barobaybay 661 661 118Bell (Pob.) 2,180 2,180 439Carangcang 2,906 2,906 571Carigsa 195 195 43Casuray 988 988 190Monserrat (Pob.) 1,091 1,091 225Ponong 1,276 1,276 242San Francisco (Pob.) 1,316 1,316 270San Isidro (Pob.) 2,925 2,923 581San Juan (Pob.) 1,135 1,135 233San Miguel 1,001 1,001 185San Pantaleon (Pob.) 1,246 1,246 248Santa Lucia (Pob.) 4,758 4,758 970Santa Rosa 881 881 178Santo Tomas (Pob.) 1,715 1,715 337
MILAOR 28,474 28,472 5,484Alimbuyog 1,281 1,281 233Amparado (Pob.) 483 483 92Balagbag 1,418 1,418 271Borongborongan 909 909 185Cabugao 1,699 1,699 320Capucnasan 2,698 2,698 543Dalipay 1,549 1,549 303Del Rosario (Pob.) 2,504 2,504 452Flordeliz 1,378 1,378 268Lipot 1,319 1,319 231Mayaopayawan 1,156 1,156 221Maycatmon 1,282 1,282 253Maydaso 795 795 165San Antonio 3,203 3,203 680San Jose (Pob.) 2,021 2,021 385San Miguel (Pob.) 1,120 1,120 207San Roque (Pob.) 774 774 157San Vicente (Pob.) 975 975 178Santo Domingo (Pob.) 1,397 1,395 247Tarusanan 513 513 93
National Statistics Office 45
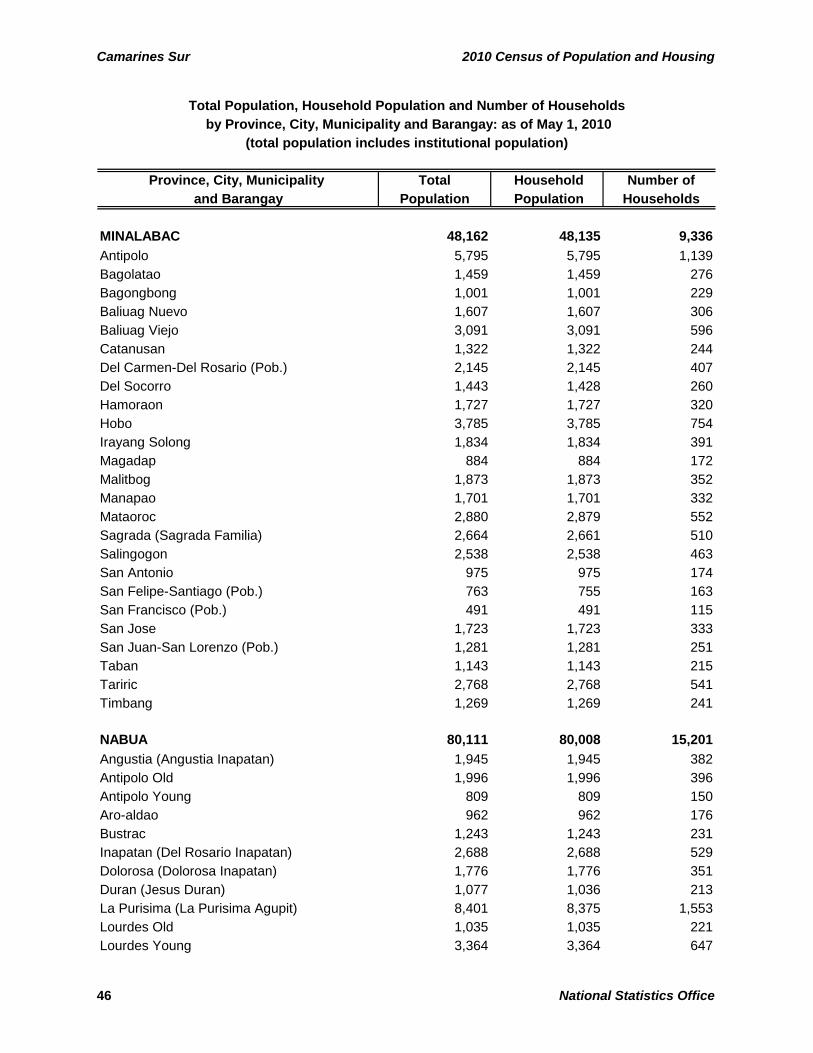
Camarines Sur 2010 Census of Population and Housing
Province, City, Municipality Total Household Number of and Barangay Population Population Households
Total Population, Household Population and Number of Households
(total population includes institutional population) by Province, City, Municipality and Barangay: as of May 1, 2010
MINALABAC 48,162 48,135 9,336Antipolo 5,795 5,795 1,139Bagolatao 1,459 1,459 276Bagongbong 1,001 1,001 229Baliuag Nuevo 1,607 1,607 306Baliuag Viejo 3,091 3,091 596Catanusan 1,322 1,322 244Del Carmen-Del Rosario (Pob.) 2,145 2,145 407Del Socorro 1,443 1,428 260Hamoraon 1,727 1,727 320Hobo 3,785 3,785 754Irayang Solong 1,834 1,834 391Magadap 884 884 172Malitbog 1,873 1,873 352Manapao 1,701 1,701 332Mataoroc 2,880 2,879 552Sagrada (Sagrada Familia) 2,664 2,661 510Salingogon 2,538 2,538 463San Antonio 975 975 174San Felipe-Santiago (Pob.) 763 755 163San Francisco (Pob.) 491 491 115San Jose 1,723 1,723 333San Juan-San Lorenzo (Pob.) 1,281 1,281 251Taban 1,143 1,143 215Tariric 2,768 2,768 541Timbang 1,269 1,269 241
NABUA 80,111 80,008 15,201Angustia (Angustia Inapatan) 1,945 1,945 382Antipolo Old 1,996 1,996 396Antipolo Young 809 809 150Aro-aldao 962 962 176Bustrac 1,243 1,243 231Inapatan (Del Rosario Inapatan) 2,688 2,688 529Dolorosa (Dolorosa Inapatan) 1,776 1,776 351Duran (Jesus Duran) 1,077 1,036 213La Purisima (La Purisima Agupit) 8,401 8,375 1,553Lourdes Old 1,035 1,035 221Lourdes Young 3,364 3,364 647
46 National Statistics Office
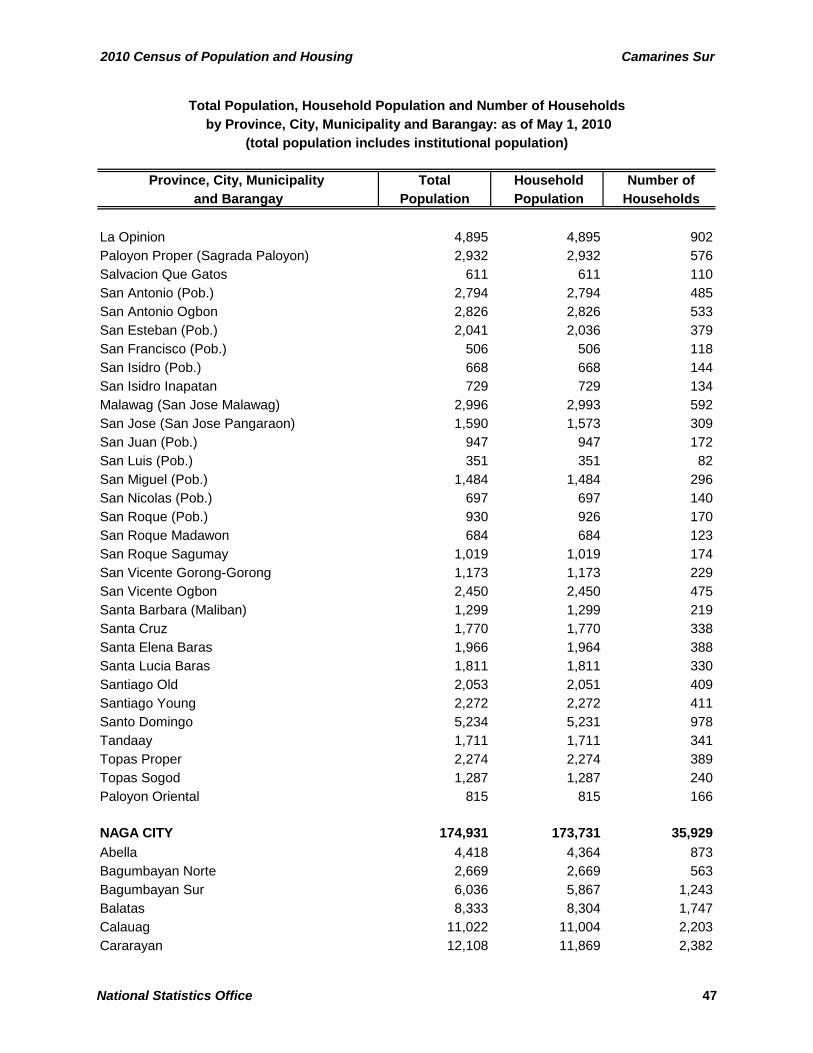
2010 Census of Population and Housing Camarines Sur
Province, City, Municipality Total Household Number of and Barangay Population Population Households
Total Population, Household Population and Number of Households
(total population includes institutional population) by Province, City, Municipality and Barangay: as of May 1, 2010
La Opinion 4,895 4,895 902Paloyon Proper (Sagrada Paloyon) 2,932 2,932 576Salvacion Que Gatos 611 611 110San Antonio (Pob.) 2,794 2,794 485San Antonio Ogbon 2,826 2,826 533San Esteban (Pob.) 2,041 2,036 379San Francisco (Pob.) 506 506 118San Isidro (Pob.) 668 668 144San Isidro Inapatan 729 729 134Malawag (San Jose Malawag) 2,996 2,993 592San Jose (San Jose Pangaraon) 1,590 1,573 309San Juan (Pob.) 947 947 172San Luis (Pob.) 351 351 82San Miguel (Pob.) 1,484 1,484 296San Nicolas (Pob.) 697 697 140San Roque (Pob.) 930 926 170San Roque Madawon 684 684 123San Roque Sagumay 1,019 1,019 174San Vicente Gorong-Gorong 1,173 1,173 229San Vicente Ogbon 2,450 2,450 475Santa Barbara (Maliban) 1,299 1,299 219Santa Cruz 1,770 1,770 338Santa Elena Baras 1,966 1,964 388Santa Lucia Baras 1,811 1,811 330Santiago Old 2,053 2,051 409Santiago Young 2,272 2,272 411Santo Domingo 5,234 5,231 978Tandaay 1,711 1,711 341Topas Proper 2,274 2,274 389Topas Sogod 1,287 1,287 240Paloyon Oriental 815 815 166
NAGA CITY 174,931 173,731 35,929Abella 4,418 4,364 873Bagumbayan Norte 2,669 2,669 563Bagumbayan Sur 6,036 5,867 1,243Balatas 8,333 8,304 1,747Calauag 11,022 11,004 2,203Cararayan 12,108 11,869 2,382
National Statistics Office 47

Camarines Sur 2010 Census of Population and Housing
Province, City, Municipality Total Household Number of and Barangay Population Population Households
Total Population, Household Population and Number of Households
(total population includes institutional population) by Province, City, Municipality and Barangay: as of May 1, 2010
Carolina 5,542 5,522 1,098Concepcion Grande 11,979 11,958 2,455Concepcion Pequeño 21,326 21,175 4,343Dayangdang 4,635 4,635 936Del Rosario 7,055 6,898 1,449Dinaga 485 465 112Igualdad Interior 3,775 3,775 766Lerma 2,056 2,056 444Liboton 2,870 2,857 600Mabolo 6,875 6,875 1,317Pacol 9,981 9,940 2,091Panicuason 2,033 2,033 396Peñafrancia 5,139 5,134 1,126Sabang 6,742 6,738 1,327San Felipe 14,196 14,167 3,049San Francisco (Pob.) 941 866 234San Isidro 2,301 2,301 457Santa Cruz 6,761 6,711 1,462Tabuco 4,265 4,240 889Tinago 3,403 3,403 730Triangulo 7,985 7,905 1,637
OCAMPO 43,523 43,521 8,587Ayugan 3,007 3,007 591Cabariwan 1,169 1,169 244Cagmanaba 1,711 1,711 340Del Rosario 1,577 1,577 306Gatbo 2,378 2,378 468Guinaban 1,352 1,352 264Hanawan 2,229 2,229 451Hibago 2,589 2,589 473La Purisima Nuevo 1,840 1,840 374May-Ogob 1,545 1,545 347New Moriones 1,671 1,671 327Old Moriones 1,959 1,959 408Pinit 3,664 3,664 693Poblacion Central 1,097 1,095 215Poblacion East 921 921 187Poblacion West 1,120 1,120 237
48 National Statistics Office
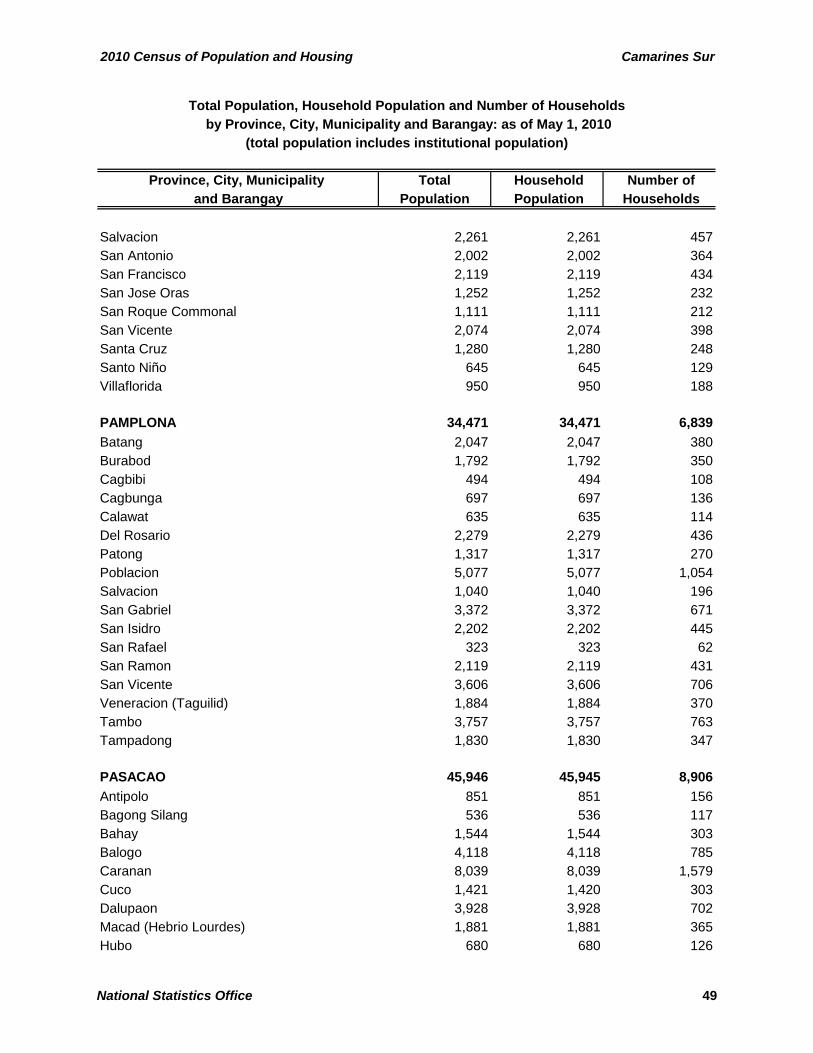
2010 Census of Population and Housing Camarines Sur
Province, City, Municipality Total Household Number of and Barangay Population Population Households
Total Population, Household Population and Number of Households
(total population includes institutional population) by Province, City, Municipality and Barangay: as of May 1, 2010
Salvacion 2,261 2,261 457San Antonio 2,002 2,002 364San Francisco 2,119 2,119 434San Jose Oras 1,252 1,252 232San Roque Commonal 1,111 1,111 212San Vicente 2,074 2,074 398Santa Cruz 1,280 1,280 248Santo Niño 645 645 129Villaflorida 950 950 188
PAMPLONA 34,471 34,471 6,839Batang 2,047 2,047 380Burabod 1,792 1,792 350Cagbibi 494 494 108Cagbunga 697 697 136Calawat 635 635 114Del Rosario 2,279 2,279 436Patong 1,317 1,317 270Poblacion 5,077 5,077 1,054Salvacion 1,040 1,040 196San Gabriel 3,372 3,372 671San Isidro 2,202 2,202 445San Rafael 323 323 62San Ramon 2,119 2,119 431San Vicente 3,606 3,606 706Veneracion (Taguilid) 1,884 1,884 370Tambo 3,757 3,757 763Tampadong 1,830 1,830 347
PASACAO 45,946 45,945 8,906Antipolo 851 851 156Bagong Silang 536 536 117Bahay 1,544 1,544 303Balogo 4,118 4,118 785Caranan 8,039 8,039 1,579Cuco 1,421 1,420 303Dalupaon 3,928 3,928 702Macad (Hebrio Lourdes) 1,881 1,881 365Hubo 680 680 126
National Statistics Office 49
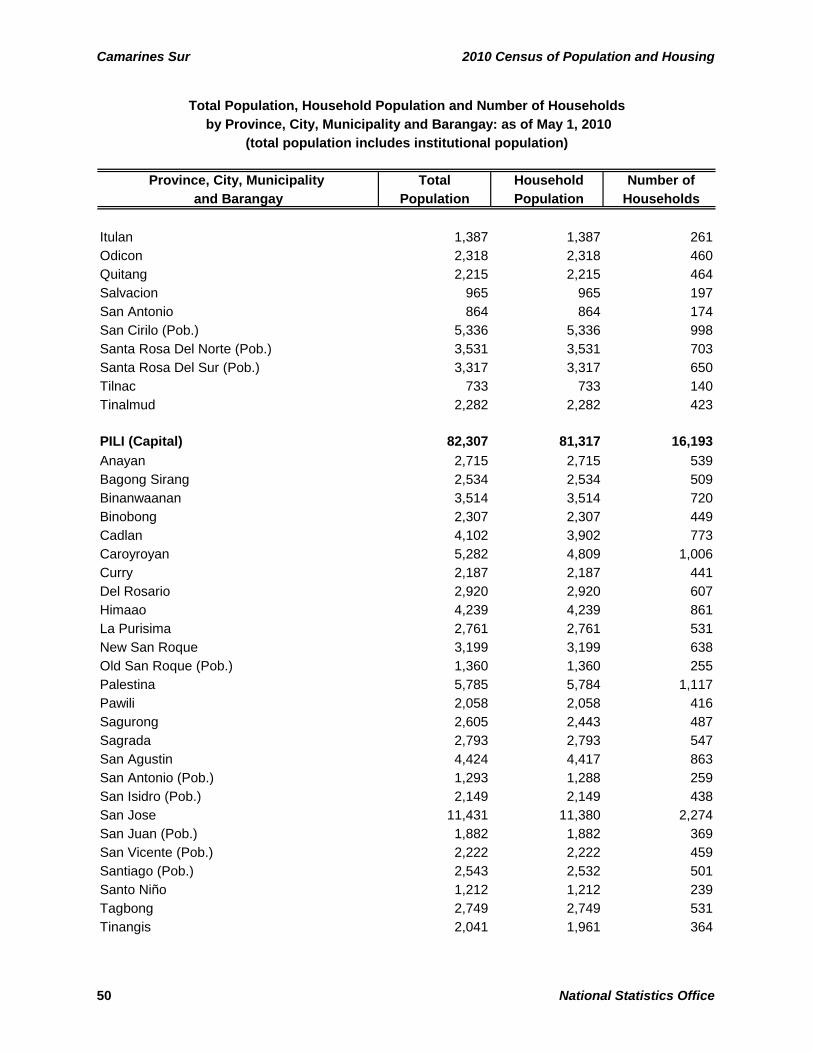
Camarines Sur 2010 Census of Population and Housing
Province, City, Municipality Total Household Number of and Barangay Population Population Households
Total Population, Household Population and Number of Households
(total population includes institutional population) by Province, City, Municipality and Barangay: as of May 1, 2010
Itulan 1,387 1,387 261Odicon 2,318 2,318 460Quitang 2,215 2,215 464Salvacion 965 965 197San Antonio 864 864 174San Cirilo (Pob.) 5,336 5,336 998Santa Rosa Del Norte (Pob.) 3,531 3,531 703Santa Rosa Del Sur (Pob.) 3,317 3,317 650Tilnac 733 733 140Tinalmud 2,282 2,282 423
PILI (Capital) 82,307 81,317 16,193Anayan 2,715 2,715 539Bagong Sirang 2,534 2,534 509Binanwaanan 3,514 3,514 720Binobong 2,307 2,307 449Cadlan 4,102 3,902 773Caroyroyan 5,282 4,809 1,006Curry 2,187 2,187 441Del Rosario 2,920 2,920 607Himaao 4,239 4,239 861La Purisima 2,761 2,761 531New San Roque 3,199 3,199 638Old San Roque (Pob.) 1,360 1,360 255Palestina 5,785 5,784 1,117Pawili 2,058 2,058 416Sagurong 2,605 2,443 487Sagrada 2,793 2,793 547San Agustin 4,424 4,417 863San Antonio (Pob.) 1,293 1,288 259San Isidro (Pob.) 2,149 2,149 438San Jose 11,431 11,380 2,274San Juan (Pob.) 1,882 1,882 369San Vicente (Pob.) 2,222 2,222 459Santiago (Pob.) 2,543 2,532 501Santo Niño 1,212 1,212 239Tagbong 2,749 2,749 531Tinangis 2,041 1,961 364
50 National Statistics Office
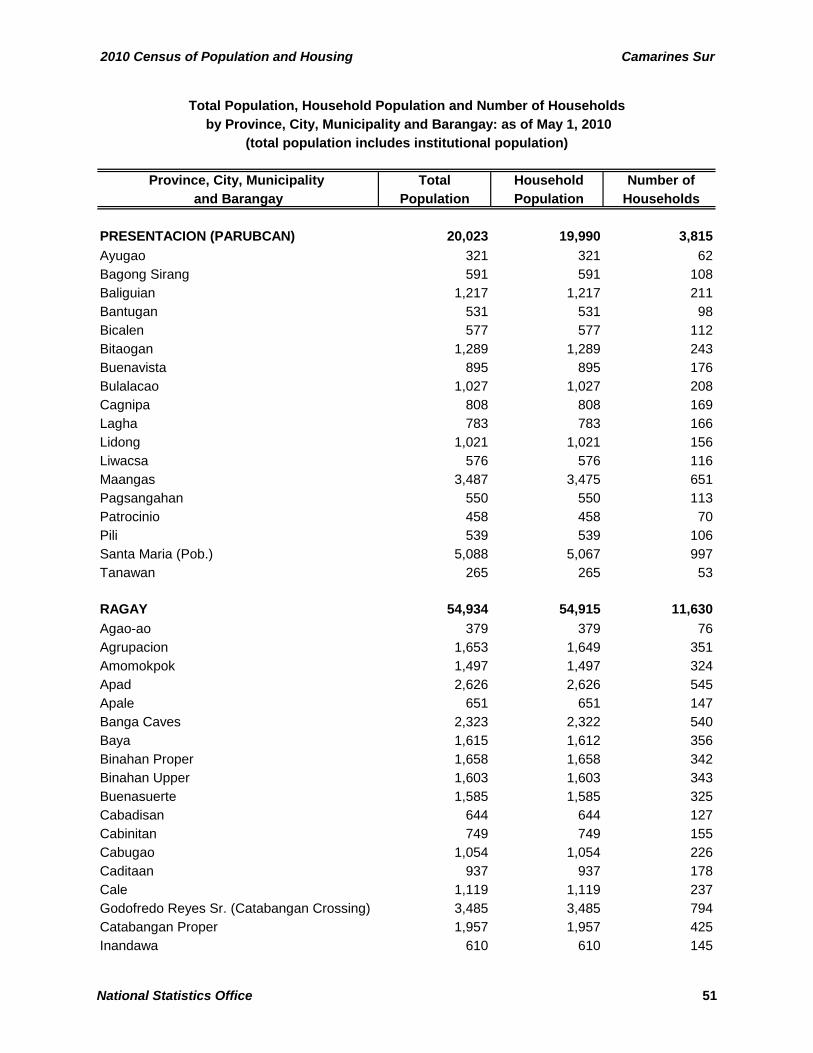
2010 Census of Population and Housing Camarines Sur
Province, City, Municipality Total Household Number of and Barangay Population Population Households
Total Population, Household Population and Number of Households
(total population includes institutional population) by Province, City, Municipality and Barangay: as of May 1, 2010
PRESENTACION (PARUBCAN) 20,023 19,990 3,815Ayugao 321 321 62Bagong Sirang 591 591 108Baliguian 1,217 1,217 211Bantugan 531 531 98Bicalen 577 577 112Bitaogan 1,289 1,289 243Buenavista 895 895 176Bulalacao 1,027 1,027 208Cagnipa 808 808 169Lagha 783 783 166Lidong 1,021 1,021 156Liwacsa 576 576 116Maangas 3,487 3,475 651Pagsangahan 550 550 113Patrocinio 458 458 70Pili 539 539 106Santa Maria (Pob.) 5,088 5,067 997Tanawan 265 265 53
RAGAY 54,934 54,915 11,630Agao-ao 379 379 76Agrupacion 1,653 1,649 351Amomokpok 1,497 1,497 324Apad 2,626 2,626 545Apale 651 651 147Banga Caves 2,323 2,322 540Baya 1,615 1,612 356Binahan Proper 1,658 1,658 342Binahan Upper 1,603 1,603 343Buenasuerte 1,585 1,585 325Cabadisan 644 644 127Cabinitan 749 749 155Cabugao 1,054 1,054 226Caditaan 937 937 178Cale 1,119 1,119 237Godofredo Reyes Sr. (Catabangan Crossing) 3,485 3,485 794Catabangan Proper 1,957 1,957 425Inandawa 610 610 145
National Statistics Office 51
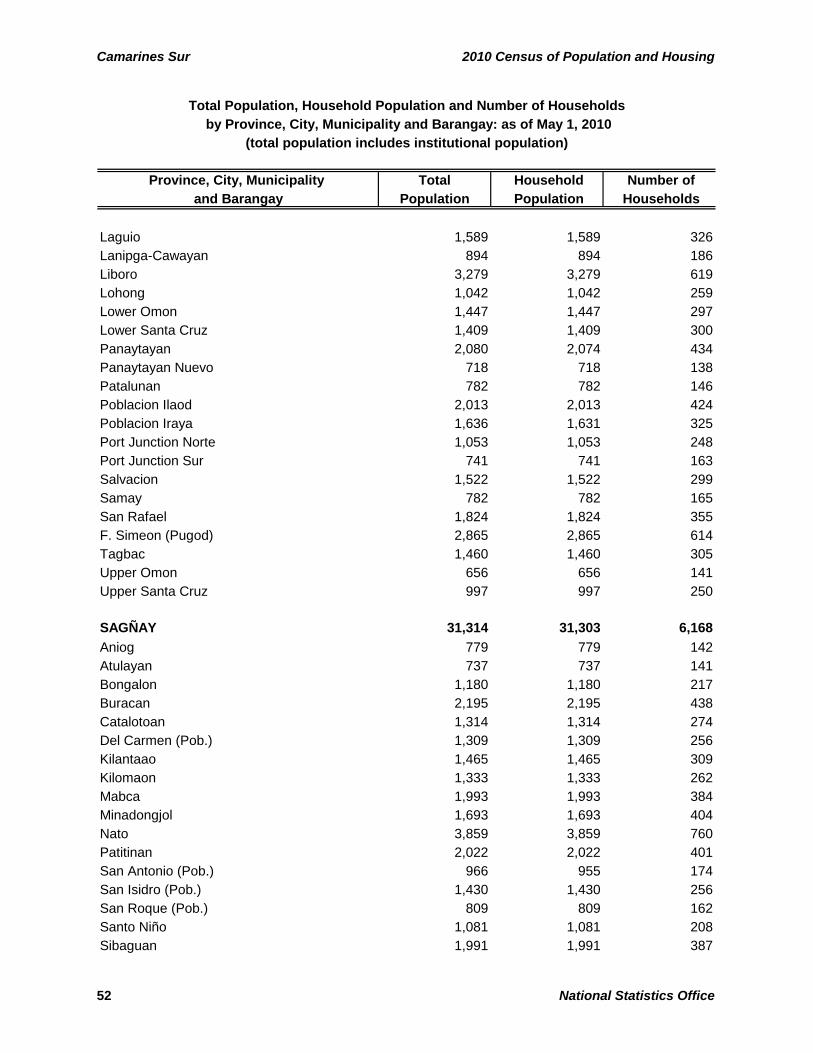
Camarines Sur 2010 Census of Population and Housing
Province, City, Municipality Total Household Number of and Barangay Population Population Households
Total Population, Household Population and Number of Households
(total population includes institutional population) by Province, City, Municipality and Barangay: as of May 1, 2010
Laguio 1,589 1,589 326Lanipga-Cawayan 894 894 186Liboro 3,279 3,279 619Lohong 1,042 1,042 259Lower Omon 1,447 1,447 297Lower Santa Cruz 1,409 1,409 300Panaytayan 2,080 2,074 434Panaytayan Nuevo 718 718 138Patalunan 782 782 146Poblacion Ilaod 2,013 2,013 424Poblacion Iraya 1,636 1,631 325Port Junction Norte 1,053 1,053 248Port Junction Sur 741 741 163Salvacion 1,522 1,522 299Samay 782 782 165San Rafael 1,824 1,824 355F. Simeon (Pugod) 2,865 2,865 614Tagbac 1,460 1,460 305Upper Omon 656 656 141Upper Santa Cruz 997 997 250
SAGÑAY 31,314 31,303 6,168Aniog 779 779 142Atulayan 737 737 141Bongalon 1,180 1,180 217Buracan 2,195 2,195 438Catalotoan 1,314 1,314 274Del Carmen (Pob.) 1,309 1,309 256Kilantaao 1,465 1,465 309Kilomaon 1,333 1,333 262Mabca 1,993 1,993 384Minadongjol 1,693 1,693 404Nato 3,859 3,859 760Patitinan 2,022 2,022 401San Antonio (Pob.) 966 955 174San Isidro (Pob.) 1,430 1,430 256San Roque (Pob.) 809 809 162Santo Niño 1,081 1,081 208Sibaguan 1,991 1,991 387
52 National Statistics Office
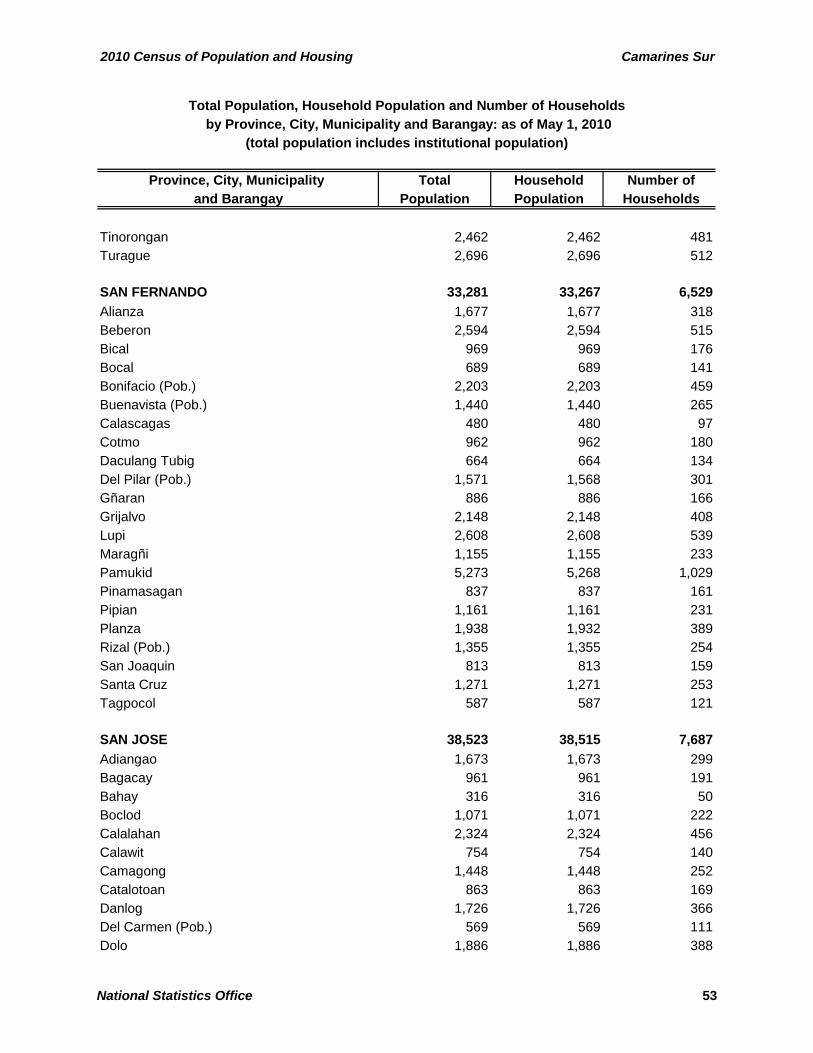
2010 Census of Population and Housing Camarines Sur
Province, City, Municipality Total Household Number of and Barangay Population Population Households
Total Population, Household Population and Number of Households
(total population includes institutional population) by Province, City, Municipality and Barangay: as of May 1, 2010
Tinorongan 2,462 2,462 481Turague 2,696 2,696 512
SAN FERNANDO 33,281 33,267 6,529Alianza 1,677 1,677 318Beberon 2,594 2,594 515Bical 969 969 176Bocal 689 689 141Bonifacio (Pob.) 2,203 2,203 459Buenavista (Pob.) 1,440 1,440 265Calascagas 480 480 97Cotmo 962 962 180Daculang Tubig 664 664 134Del Pilar (Pob.) 1,571 1,568 301Gñaran 886 886 166Grijalvo 2,148 2,148 408Lupi 2,608 2,608 539Maragñi 1,155 1,155 233Pamukid 5,273 5,268 1,029Pinamasagan 837 837 161Pipian 1,161 1,161 231Planza 1,938 1,932 389Rizal (Pob.) 1,355 1,355 254San Joaquin 813 813 159Santa Cruz 1,271 1,271 253Tagpocol 587 587 121
SAN JOSE 38,523 38,515 7,687Adiangao 1,673 1,673 299Bagacay 961 961 191Bahay 316 316 50Boclod 1,071 1,071 222Calalahan 2,324 2,324 456Calawit 754 754 140Camagong 1,448 1,448 252Catalotoan 863 863 169Danlog 1,726 1,726 366Del Carmen (Pob.) 569 569 111Dolo 1,886 1,886 388
National Statistics Office 53
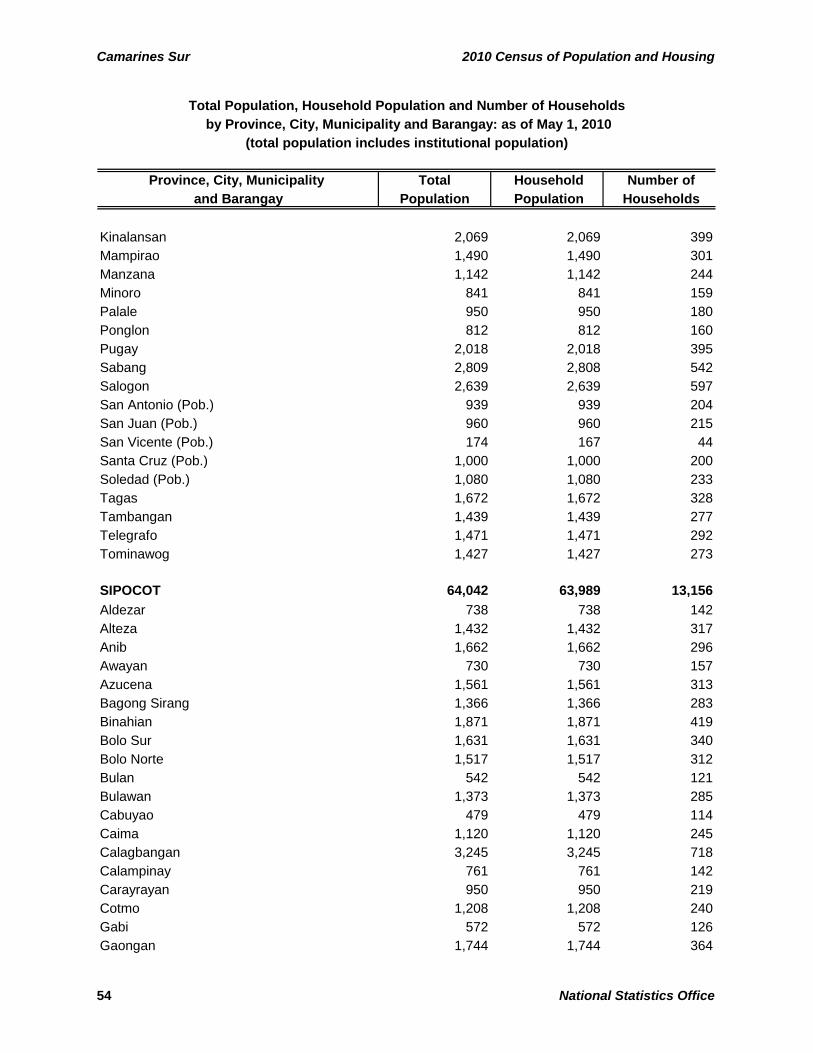
Camarines Sur 2010 Census of Population and Housing
Province, City, Municipality Total Household Number of and Barangay Population Population Households
Total Population, Household Population and Number of Households
(total population includes institutional population) by Province, City, Municipality and Barangay: as of May 1, 2010
Kinalansan 2,069 2,069 399Mampirao 1,490 1,490 301Manzana 1,142 1,142 244Minoro 841 841 159Palale 950 950 180Ponglon 812 812 160Pugay 2,018 2,018 395Sabang 2,809 2,808 542Salogon 2,639 2,639 597San Antonio (Pob.) 939 939 204San Juan (Pob.) 960 960 215San Vicente (Pob.) 174 167 44Santa Cruz (Pob.) 1,000 1,000 200Soledad (Pob.) 1,080 1,080 233Tagas 1,672 1,672 328Tambangan 1,439 1,439 277Telegrafo 1,471 1,471 292Tominawog 1,427 1,427 273
SIPOCOT 64,042 63,989 13,156Aldezar 738 738 142Alteza 1,432 1,432 317Anib 1,662 1,662 296Awayan 730 730 157Azucena 1,561 1,561 313Bagong Sirang 1,366 1,366 283Binahian 1,871 1,871 419Bolo Sur 1,631 1,631 340Bolo Norte 1,517 1,517 312Bulan 542 542 121Bulawan 1,373 1,373 285Cabuyao 479 479 114Caima 1,120 1,120 245Calagbangan 3,245 3,245 718Calampinay 761 761 142Carayrayan 950 950 219Cotmo 1,208 1,208 240Gabi 572 572 126Gaongan 1,744 1,744 364
54 National Statistics Office
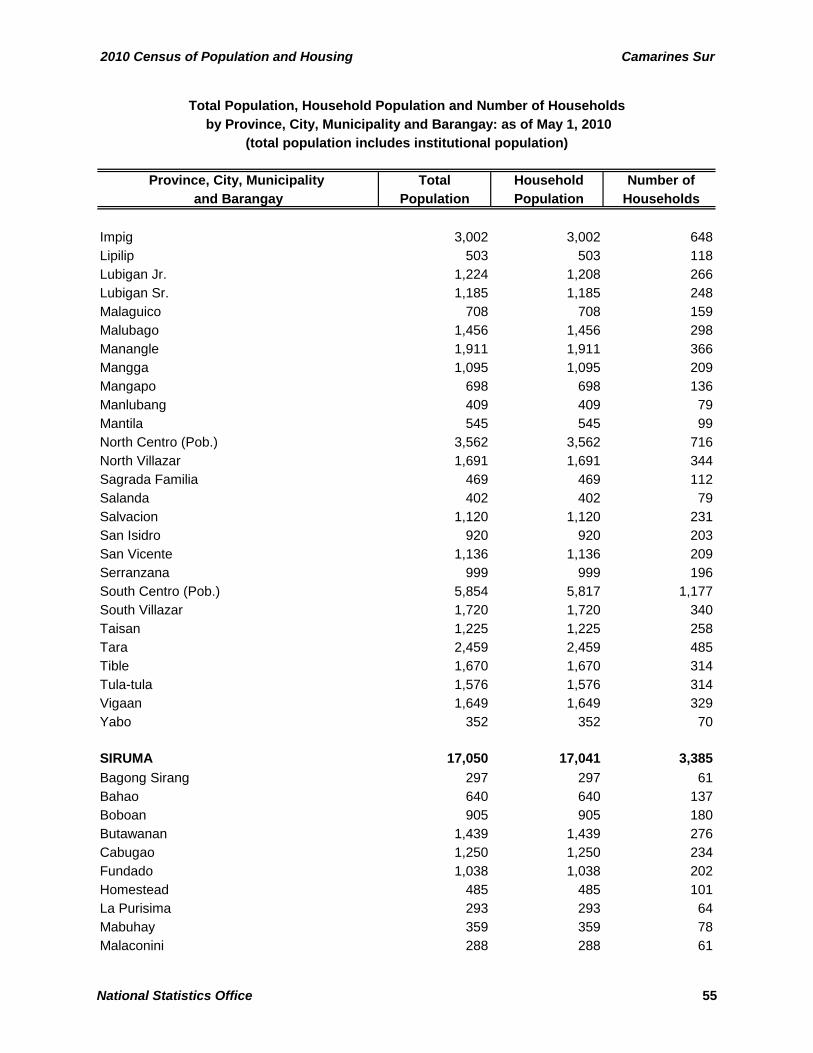
2010 Census of Population and Housing Camarines Sur
Province, City, Municipality Total Household Number of and Barangay Population Population Households
Total Population, Household Population and Number of Households
(total population includes institutional population) by Province, City, Municipality and Barangay: as of May 1, 2010
Impig 3,002 3,002 648Lipilip 503 503 118Lubigan Jr. 1,224 1,208 266Lubigan Sr. 1,185 1,185 248Malaguico 708 708 159Malubago 1,456 1,456 298Manangle 1,911 1,911 366Mangga 1,095 1,095 209Mangapo 698 698 136Manlubang 409 409 79Mantila 545 545 99North Centro (Pob.) 3,562 3,562 716North Villazar 1,691 1,691 344Sagrada Familia 469 469 112Salanda 402 402 79Salvacion 1,120 1,120 231San Isidro 920 920 203San Vicente 1,136 1,136 209Serranzana 999 999 196South Centro (Pob.) 5,854 5,817 1,177South Villazar 1,720 1,720 340Taisan 1,225 1,225 258Tara 2,459 2,459 485Tible 1,670 1,670 314Tula-tula 1,576 1,576 314Vigaan 1,649 1,649 329Yabo 352 352 70
SIRUMA 17,050 17,041 3,385Bagong Sirang 297 297 61Bahao 640 640 137Boboan 905 905 180Butawanan 1,439 1,439 276Cabugao 1,250 1,250 234Fundado 1,038 1,038 202Homestead 485 485 101La Purisima 293 293 64Mabuhay 359 359 78Malaconini 288 288 61
National Statistics Office 55
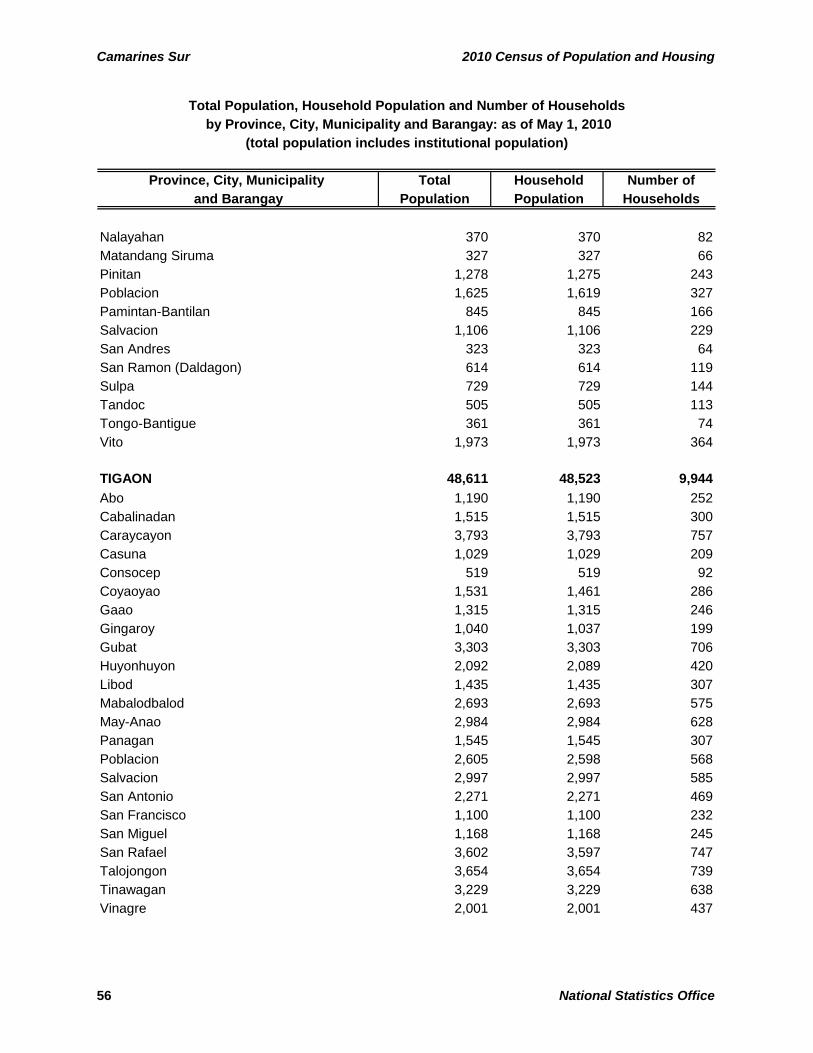
Camarines Sur 2010 Census of Population and Housing
Province, City, Municipality Total Household Number of and Barangay Population Population Households
Total Population, Household Population and Number of Households
(total population includes institutional population) by Province, City, Municipality and Barangay: as of May 1, 2010
Nalayahan 370 370 82Matandang Siruma 327 327 66Pinitan 1,278 1,275 243Poblacion 1,625 1,619 327Pamintan-Bantilan 845 845 166Salvacion 1,106 1,106 229San Andres 323 323 64San Ramon (Daldagon) 614 614 119Sulpa 729 729 144Tandoc 505 505 113Tongo-Bantigue 361 361 74Vito 1,973 1,973 364
TIGAON 48,611 48,523 9,944Abo 1,190 1,190 252Cabalinadan 1,515 1,515 300Caraycayon 3,793 3,793 757Casuna 1,029 1,029 209Consocep 519 519 92Coyaoyao 1,531 1,461 286Gaao 1,315 1,315 246Gingaroy 1,040 1,037 199Gubat 3,303 3,303 706Huyonhuyon 2,092 2,089 420Libod 1,435 1,435 307Mabalodbalod 2,693 2,693 575May-Anao 2,984 2,984 628Panagan 1,545 1,545 307Poblacion 2,605 2,598 568Salvacion 2,997 2,997 585San Antonio 2,271 2,271 469San Francisco 1,100 1,100 232San Miguel 1,168 1,168 245San Rafael 3,602 3,597 747Talojongon 3,654 3,654 739Tinawagan 3,229 3,229 638Vinagre 2,001 2,001 437
56 National Statistics Office
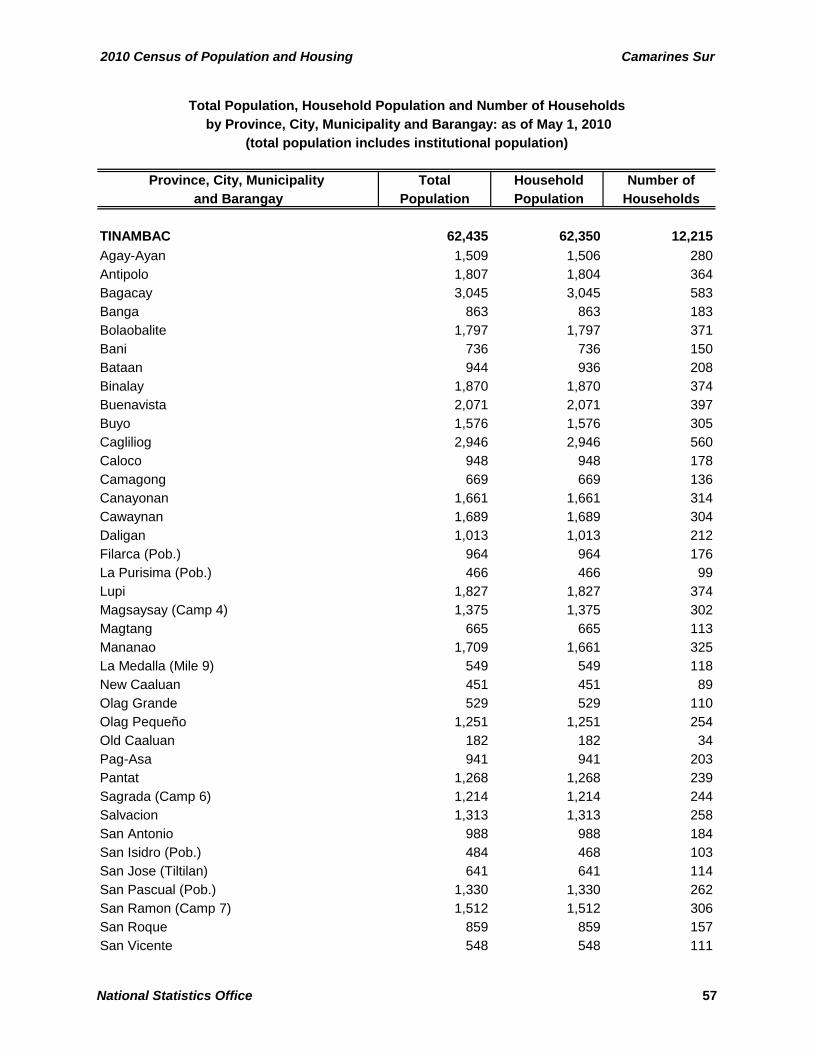
2010 Census of Population and Housing Camarines Sur
Province, City, Municipality Total Household Number of and Barangay Population Population Households
Total Population, Household Population and Number of Households
(total population includes institutional population) by Province, City, Municipality and Barangay: as of May 1, 2010
TINAMBAC 62,435 62,350 12,215Agay-Ayan 1,509 1,506 280Antipolo 1,807 1,804 364Bagacay 3,045 3,045 583Banga 863 863 183Bolaobalite 1,797 1,797 371Bani 736 736 150Bataan 944 936 208Binalay 1,870 1,870 374Buenavista 2,071 2,071 397Buyo 1,576 1,576 305Cagliliog 2,946 2,946 560Caloco 948 948 178Camagong 669 669 136Canayonan 1,661 1,661 314Cawaynan 1,689 1,689 304Daligan 1,013 1,013 212Filarca (Pob.) 964 964 176La Purisima (Pob.) 466 466 99Lupi 1,827 1,827 374Magsaysay (Camp 4) 1,375 1,375 302Magtang 665 665 113Mananao 1,709 1,661 325La Medalla (Mile 9) 549 549 118New Caaluan 451 451 89Olag Grande 529 529 110Olag Pequeño 1,251 1,251 254Old Caaluan 182 182 34Pag-Asa 941 941 203Pantat 1,268 1,268 239Sagrada (Camp 6) 1,214 1,214 244Salvacion 1,313 1,313 258San Antonio 988 988 184San Isidro (Pob.) 484 468 103San Jose (Tiltilan) 641 641 114San Pascual (Pob.) 1,330 1,330 262San Ramon (Camp 7) 1,512 1,512 306San Roque 859 859 157San Vicente 548 548 111
National Statistics Office 57
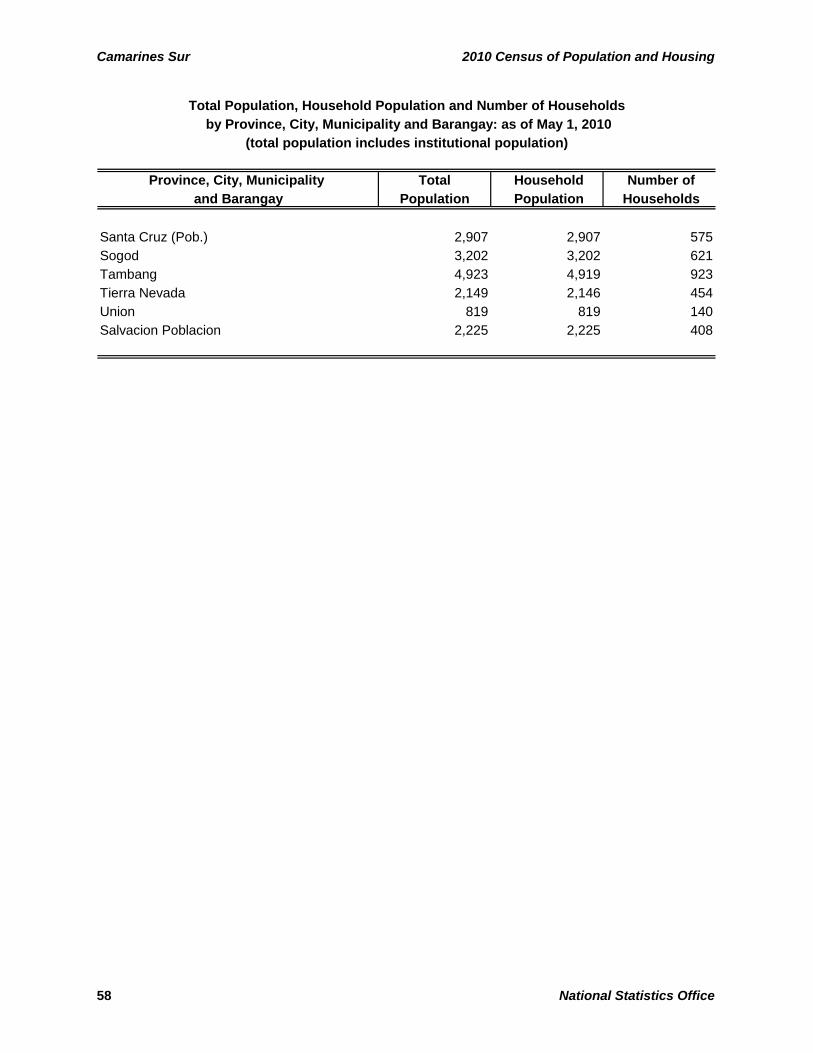
Camarines Sur 2010 Census of Population and Housing
Province, City, Municipality Total Household Number of and Barangay Population Population Households
Total Population, Household Population and Number of Households
(total population includes institutional population) by Province, City, Municipality and Barangay: as of May 1, 2010
Santa Cruz (Pob.) 2,907 2,907 575Sogod 3,202 3,202 621Tambang 4,923 4,919 923Tierra Nevada 2,149 2,146 454Union 819 819 140Salvacion Poblacion 2,225 2,225 408
58 National Statistics Office
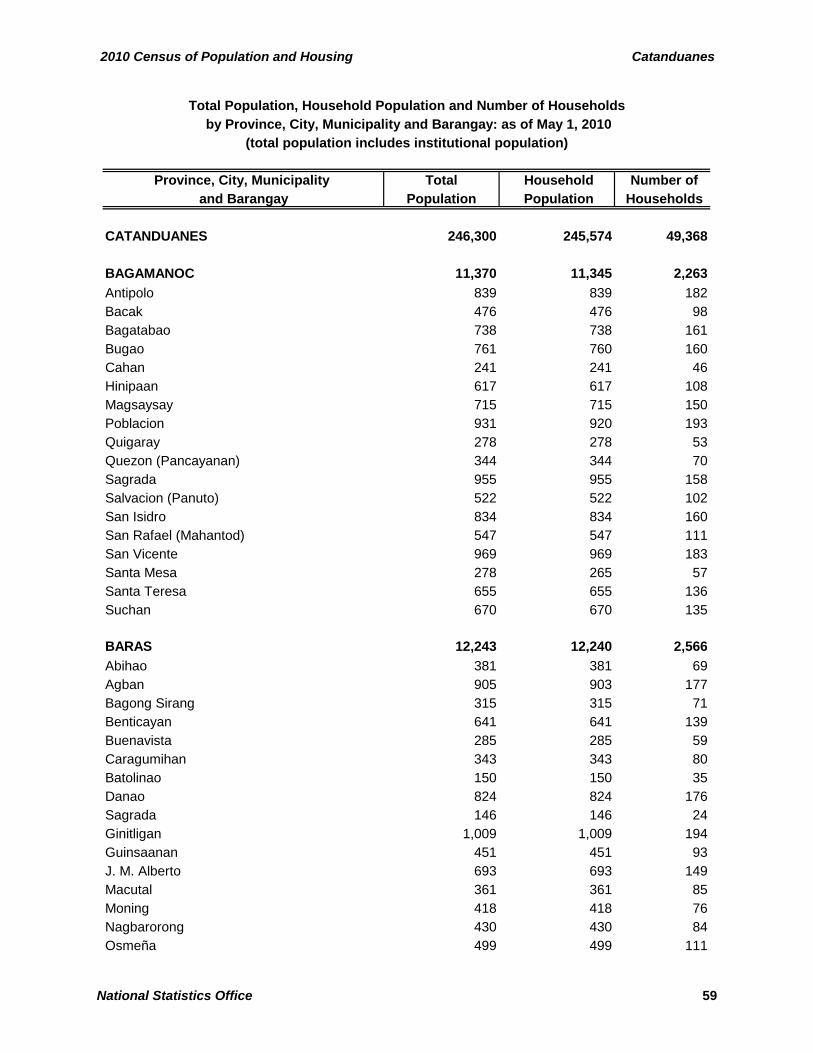
2010 Census of Population and Housing Catanduanes
Province, City, Municipality Total Household Number of and Barangay Population Population Households
CATANDUANES 246,300 245,574 49,368
BAGAMANOC 11,370 11,345 2,263Antipolo 839 839 182Bacak 476 476 98Bagatabao 738 738 161Bugao 761 760 160Cahan 241 241 46Hinipaan 617 617 108Magsaysay 715 715 150Poblacion 931 920 193Quigaray 278 278 53Quezon (Pancayanan) 344 344 70Sagrada 955 955 158Salvacion (Panuto) 522 522 102San Isidro 834 834 160San Rafael (Mahantod) 547 547 111San Vicente 969 969 183Santa Mesa 278 265 57Santa Teresa 655 655 136Suchan 670 670 135
BARAS 12,243 12,240 2,566Abihao 381 381 69Agban 905 903 177Bagong Sirang 315 315 71Benticayan 641 641 139Buenavista 285 285 59Caragumihan 343 343 80Batolinao 150 150 35Danao 824 824 176Sagrada 146 146 24Ginitligan 1,009 1,009 194Guinsaanan 451 451 93J. M. Alberto 693 693 149Macutal 361 361 85Moning 418 418 76Nagbarorong 430 430 84Osmeña 499 499 111
Total Population, Household Population and Number of Households
(total population includes institutional population) by Province, City, Municipality and Barangay: as of May 1, 2010
National Statistics Office 59
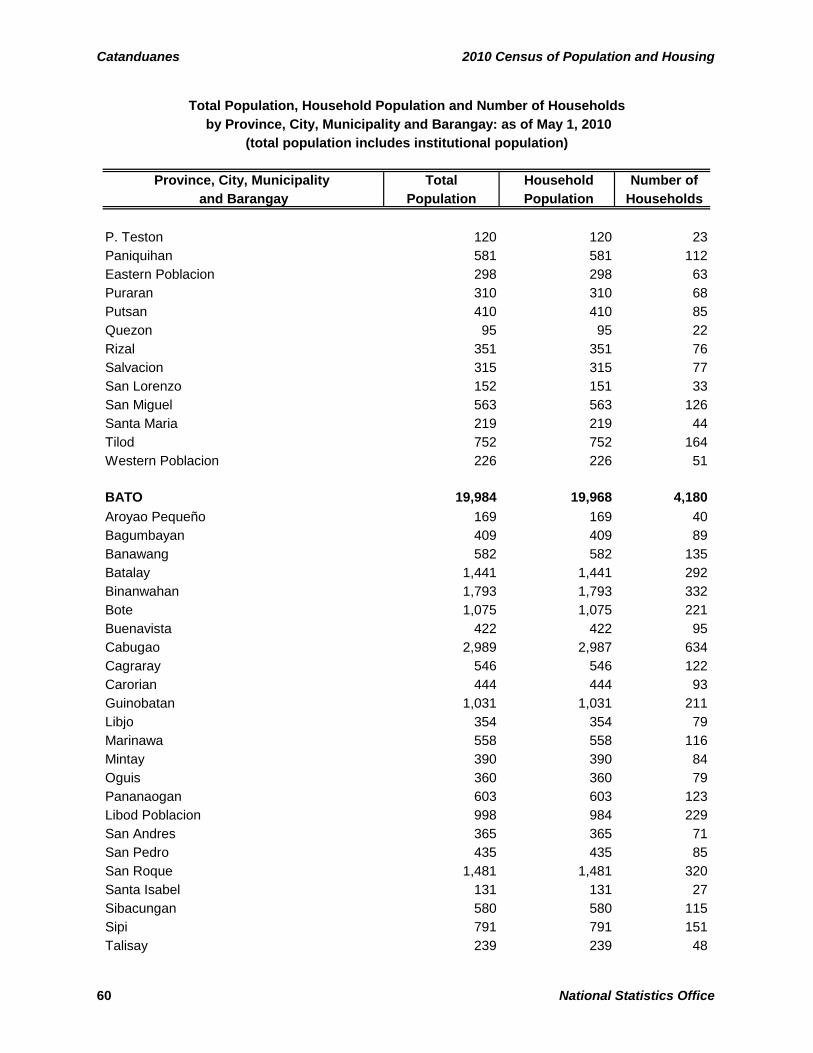
Catanduanes 2010 Census of Population and Housing
Province, City, Municipality Total Household Number of and Barangay Population Population Households
Total Population, Household Population and Number of Households
(total population includes institutional population) by Province, City, Municipality and Barangay: as of May 1, 2010
P. Teston 120 120 23Paniquihan 581 581 112Eastern Poblacion 298 298 63Puraran 310 310 68Putsan 410 410 85Quezon 95 95 22Rizal 351 351 76Salvacion 315 315 77San Lorenzo 152 151 33San Miguel 563 563 126Santa Maria 219 219 44Tilod 752 752 164Western Poblacion 226 226 51
BATO 19,984 19,968 4,180Aroyao Pequeño 169 169 40Bagumbayan 409 409 89Banawang 582 582 135Batalay 1,441 1,441 292Binanwahan 1,793 1,793 332Bote 1,075 1,075 221Buenavista 422 422 95Cabugao 2,989 2,987 634Cagraray 546 546 122Carorian 444 444 93Guinobatan 1,031 1,031 211Libjo 354 354 79Marinawa 558 558 116Mintay 390 390 84Oguis 360 360 79Pananaogan 603 603 123Libod Poblacion 998 984 229San Andres 365 365 71San Pedro 435 435 85San Roque 1,481 1,481 320Santa Isabel 131 131 27Sibacungan 580 580 115Sipi 791 791 151Talisay 239 239 48
60 National Statistics Office
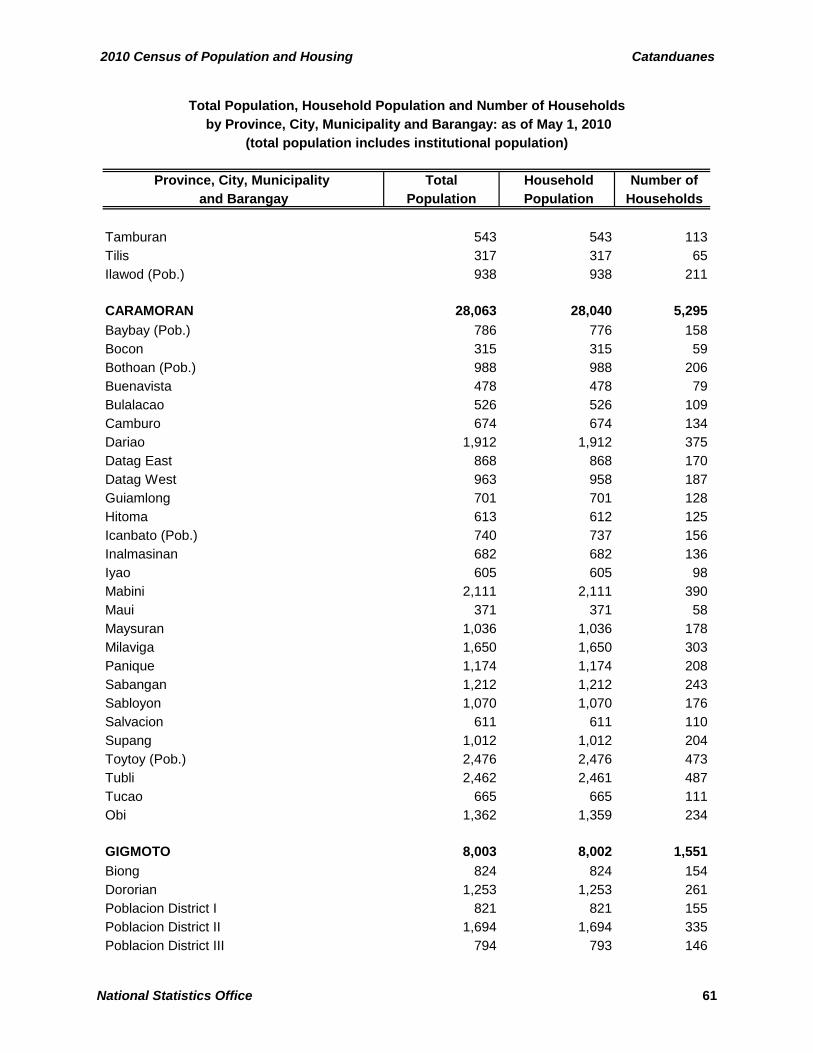
2010 Census of Population and Housing Catanduanes
Province, City, Municipality Total Household Number of and Barangay Population Population Households
Total Population, Household Population and Number of Households
(total population includes institutional population) by Province, City, Municipality and Barangay: as of May 1, 2010
Tamburan 543 543 113Tilis 317 317 65Ilawod (Pob.) 938 938 211
CARAMORAN 28,063 28,040 5,295Baybay (Pob.) 786 776 158Bocon 315 315 59Bothoan (Pob.) 988 988 206Buenavista 478 478 79Bulalacao 526 526 109Camburo 674 674 134Dariao 1,912 1,912 375Datag East 868 868 170Datag West 963 958 187Guiamlong 701 701 128Hitoma 613 612 125Icanbato (Pob.) 740 737 156Inalmasinan 682 682 136Iyao 605 605 98Mabini 2,111 2,111 390Maui 371 371 58Maysuran 1,036 1,036 178Milaviga 1,650 1,650 303Panique 1,174 1,174 208Sabangan 1,212 1,212 243Sabloyon 1,070 1,070 176Salvacion 611 611 110Supang 1,012 1,012 204Toytoy (Pob.) 2,476 2,476 473Tubli 2,462 2,461 487Tucao 665 665 111Obi 1,362 1,359 234
GIGMOTO 8,003 8,002 1,551Biong 824 824 154Dororian 1,253 1,253 261Poblacion District I 821 821 155Poblacion District II 1,694 1,694 335Poblacion District III 794 793 146
National Statistics Office 61
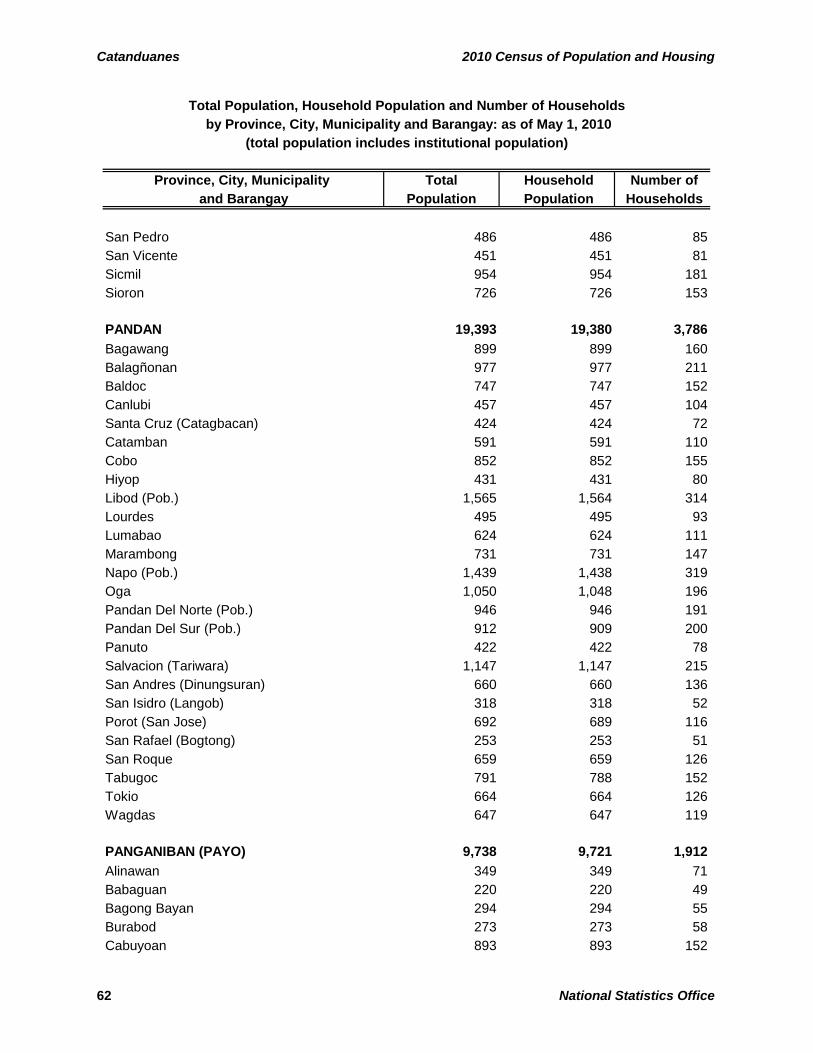
Catanduanes 2010 Census of Population and Housing
Province, City, Municipality Total Household Number of and Barangay Population Population Households
Total Population, Household Population and Number of Households
(total population includes institutional population) by Province, City, Municipality and Barangay: as of May 1, 2010
San Pedro 486 486 85San Vicente 451 451 81Sicmil 954 954 181Sioron 726 726 153
PANDAN 19,393 19,380 3,786Bagawang 899 899 160Balagñonan 977 977 211Baldoc 747 747 152Canlubi 457 457 104Santa Cruz (Catagbacan) 424 424 72Catamban 591 591 110Cobo 852 852 155Hiyop 431 431 80Libod (Pob.) 1,565 1,564 314Lourdes 495 495 93Lumabao 624 624 111Marambong 731 731 147Napo (Pob.) 1,439 1,438 319Oga 1,050 1,048 196Pandan Del Norte (Pob.) 946 946 191Pandan Del Sur (Pob.) 912 909 200Panuto 422 422 78Salvacion (Tariwara) 1,147 1,147 215San Andres (Dinungsuran) 660 660 136San Isidro (Langob) 318 318 52Porot (San Jose) 692 689 116San Rafael (Bogtong) 253 253 51San Roque 659 659 126Tabugoc 791 788 152Tokio 664 664 126Wagdas 647 647 119
PANGANIBAN (PAYO) 9,738 9,721 1,912Alinawan 349 349 71Babaguan 220 220 49Bagong Bayan 294 294 55Burabod 273 273 58Cabuyoan 893 893 152
62 National Statistics Office
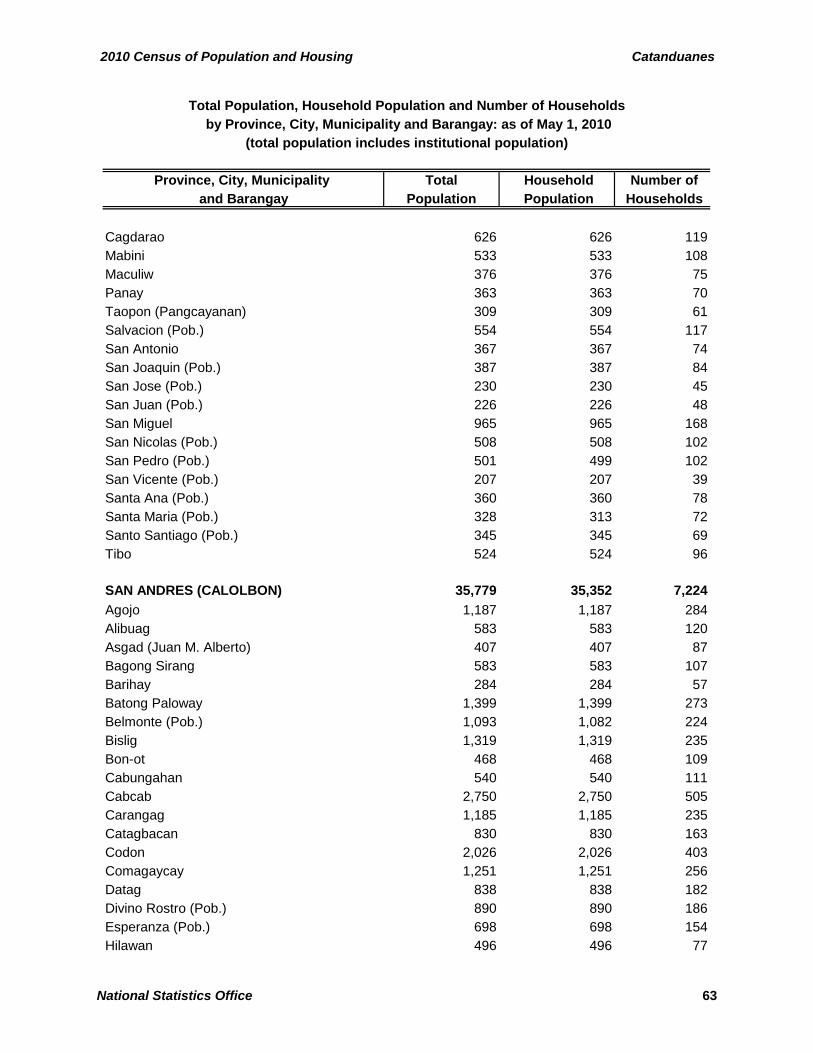
2010 Census of Population and Housing Catanduanes
Province, City, Municipality Total Household Number of and Barangay Population Population Households
Total Population, Household Population and Number of Households
(total population includes institutional population) by Province, City, Municipality and Barangay: as of May 1, 2010
Cagdarao 626 626 119Mabini 533 533 108Maculiw 376 376 75Panay 363 363 70Taopon (Pangcayanan) 309 309 61Salvacion (Pob.) 554 554 117San Antonio 367 367 74San Joaquin (Pob.) 387 387 84San Jose (Pob.) 230 230 45San Juan (Pob.) 226 226 48San Miguel 965 965 168San Nicolas (Pob.) 508 508 102San Pedro (Pob.) 501 499 102San Vicente (Pob.) 207 207 39Santa Ana (Pob.) 360 360 78Santa Maria (Pob.) 328 313 72Santo Santiago (Pob.) 345 345 69Tibo 524 524 96
SAN ANDRES (CALOLBON) 35,779 35,352 7,224Agojo 1,187 1,187 284Alibuag 583 583 120Asgad (Juan M. Alberto) 407 407 87Bagong Sirang 583 583 107Barihay 284 284 57Batong Paloway 1,399 1,399 273Belmonte (Pob.) 1,093 1,082 224Bislig 1,319 1,319 235Bon-ot 468 468 109Cabungahan 540 540 111Cabcab 2,750 2,750 505Carangag 1,185 1,185 235Catagbacan 830 830 163Codon 2,026 2,026 403Comagaycay 1,251 1,251 256Datag 838 838 182Divino Rostro (Pob.) 890 890 186Esperanza (Pob.) 698 698 154Hilawan 496 496 77
National Statistics Office 63
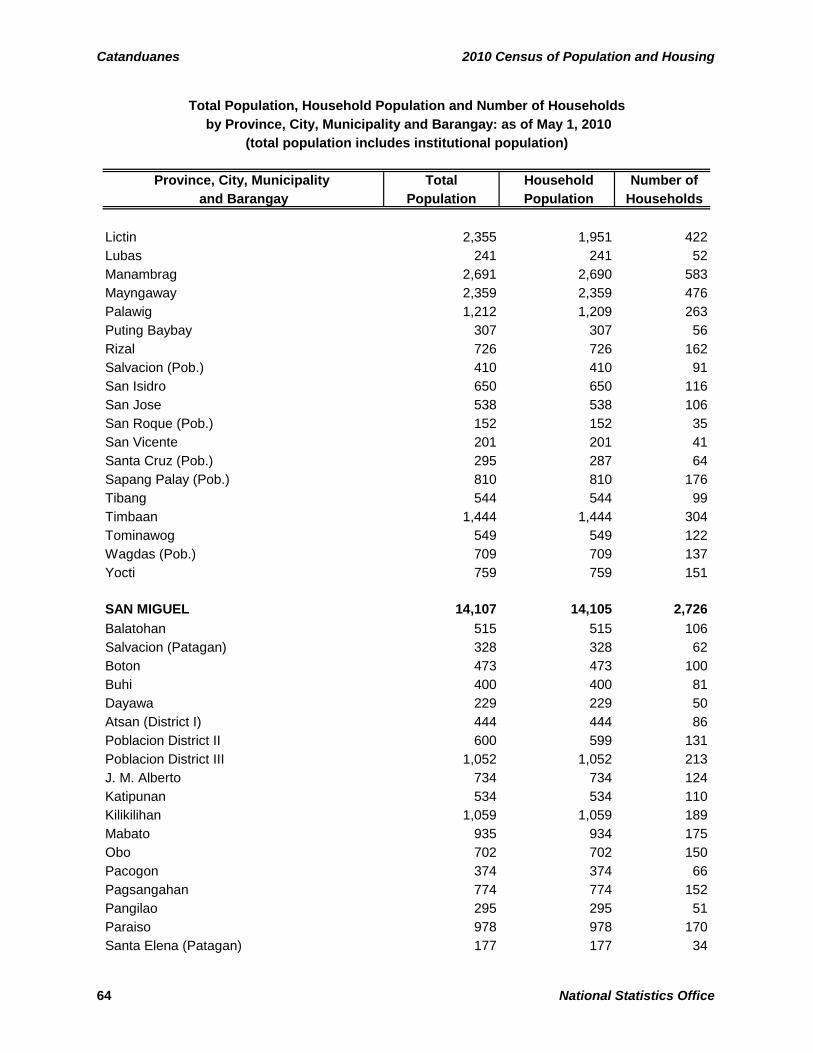
Catanduanes 2010 Census of Population and Housing
Province, City, Municipality Total Household Number of and Barangay Population Population Households
Total Population, Household Population and Number of Households
(total population includes institutional population) by Province, City, Municipality and Barangay: as of May 1, 2010
Lictin 2,355 1,951 422Lubas 241 241 52Manambrag 2,691 2,690 583Mayngaway 2,359 2,359 476Palawig 1,212 1,209 263Puting Baybay 307 307 56Rizal 726 726 162Salvacion (Pob.) 410 410 91San Isidro 650 650 116San Jose 538 538 106San Roque (Pob.) 152 152 35San Vicente 201 201 41Santa Cruz (Pob.) 295 287 64Sapang Palay (Pob.) 810 810 176Tibang 544 544 99Timbaan 1,444 1,444 304Tominawog 549 549 122Wagdas (Pob.) 709 709 137Yocti 759 759 151
SAN MIGUEL 14,107 14,105 2,726Balatohan 515 515 106Salvacion (Patagan) 328 328 62Boton 473 473 100Buhi 400 400 81Dayawa 229 229 50Atsan (District I) 444 444 86Poblacion District II 600 599 131Poblacion District III 1,052 1,052 213J. M. Alberto 734 734 124Katipunan 534 534 110Kilikilihan 1,059 1,059 189Mabato 935 934 175Obo 702 702 150Pacogon 374 374 66Pagsangahan 774 774 152Pangilao 295 295 51Paraiso 978 978 170Santa Elena (Patagan) 177 177 34
64 National Statistics Office
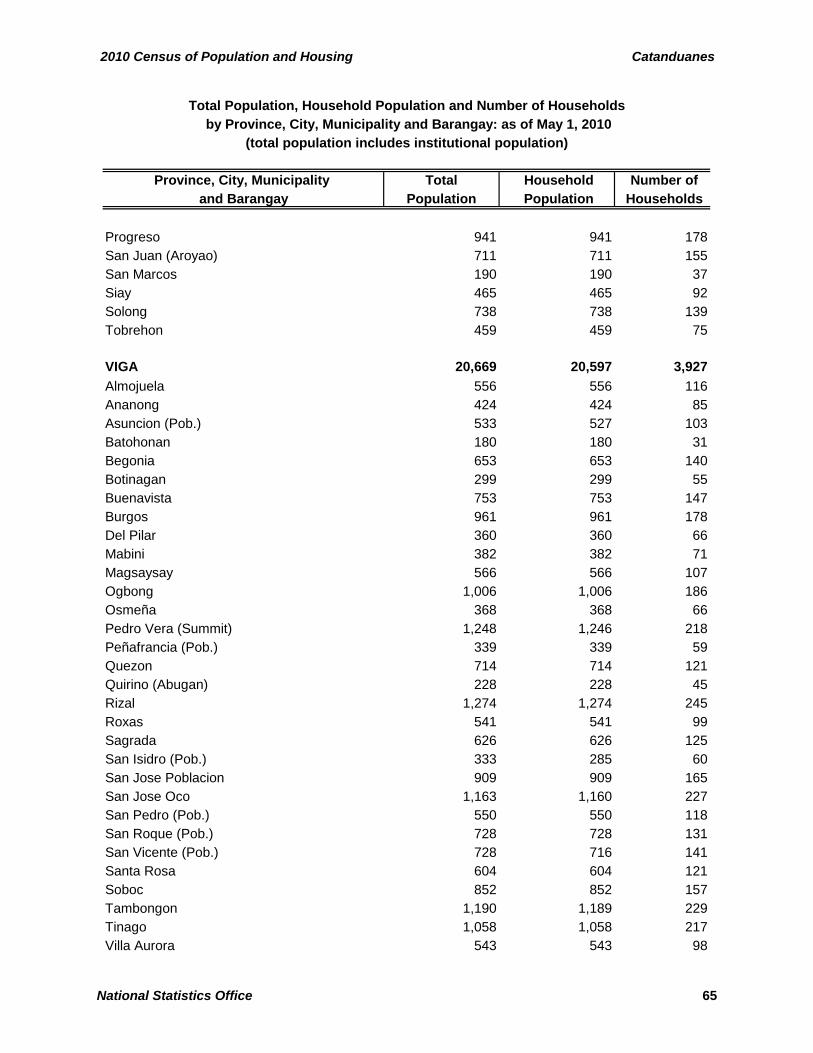
2010 Census of Population and Housing Catanduanes
Province, City, Municipality Total Household Number of and Barangay Population Population Households
Total Population, Household Population and Number of Households
(total population includes institutional population) by Province, City, Municipality and Barangay: as of May 1, 2010
Progreso 941 941 178San Juan (Aroyao) 711 711 155San Marcos 190 190 37Siay 465 465 92Solong 738 738 139Tobrehon 459 459 75
VIGA 20,669 20,597 3,927Almojuela 556 556 116Ananong 424 424 85Asuncion (Pob.) 533 527 103Batohonan 180 180 31Begonia 653 653 140Botinagan 299 299 55Buenavista 753 753 147Burgos 961 961 178Del Pilar 360 360 66Mabini 382 382 71Magsaysay 566 566 107Ogbong 1,006 1,006 186Osmeña 368 368 66Pedro Vera (Summit) 1,248 1,246 218Peñafrancia (Pob.) 339 339 59Quezon 714 714 121Quirino (Abugan) 228 228 45Rizal 1,274 1,274 245Roxas 541 541 99Sagrada 626 626 125San Isidro (Pob.) 333 285 60San Jose Poblacion 909 909 165San Jose Oco 1,163 1,160 227San Pedro (Pob.) 550 550 118San Roque (Pob.) 728 728 131San Vicente (Pob.) 728 716 141Santa Rosa 604 604 121Soboc 852 852 157Tambongon 1,190 1,189 229Tinago 1,058 1,058 217Villa Aurora 543 543 98
National Statistics Office 65
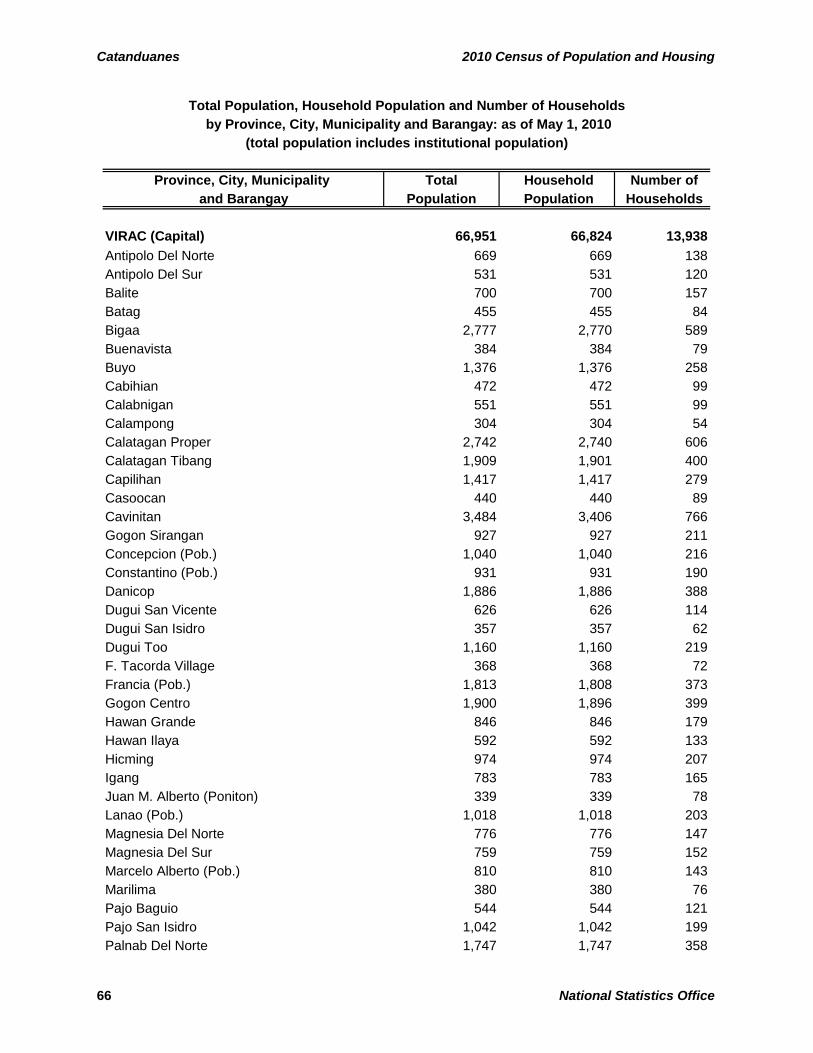
Catanduanes 2010 Census of Population and Housing
Province, City, Municipality Total Household Number of and Barangay Population Population Households
Total Population, Household Population and Number of Households
(total population includes institutional population) by Province, City, Municipality and Barangay: as of May 1, 2010
VIRAC (Capital) 66,951 66,824 13,938Antipolo Del Norte 669 669 138Antipolo Del Sur 531 531 120Balite 700 700 157Batag 455 455 84Bigaa 2,777 2,770 589Buenavista 384 384 79Buyo 1,376 1,376 258Cabihian 472 472 99Calabnigan 551 551 99Calampong 304 304 54Calatagan Proper 2,742 2,740 606Calatagan Tibang 1,909 1,901 400Capilihan 1,417 1,417 279Casoocan 440 440 89Cavinitan 3,484 3,406 766Gogon Sirangan 927 927 211Concepcion (Pob.) 1,040 1,040 216Constantino (Pob.) 931 931 190Danicop 1,886 1,886 388Dugui San Vicente 626 626 114Dugui San Isidro 357 357 62Dugui Too 1,160 1,160 219F. Tacorda Village 368 368 72Francia (Pob.) 1,813 1,808 373Gogon Centro 1,900 1,896 399Hawan Grande 846 846 179Hawan Ilaya 592 592 133Hicming 974 974 207Igang 783 783 165Juan M. Alberto (Poniton) 339 339 78Lanao (Pob.) 1,018 1,018 203Magnesia Del Norte 776 776 147Magnesia Del Sur 759 759 152Marcelo Alberto (Pob.) 810 810 143Marilima 380 380 76Pajo Baguio 544 544 121Pajo San Isidro 1,042 1,042 199Palnab Del Norte 1,747 1,747 358
66 National Statistics Office
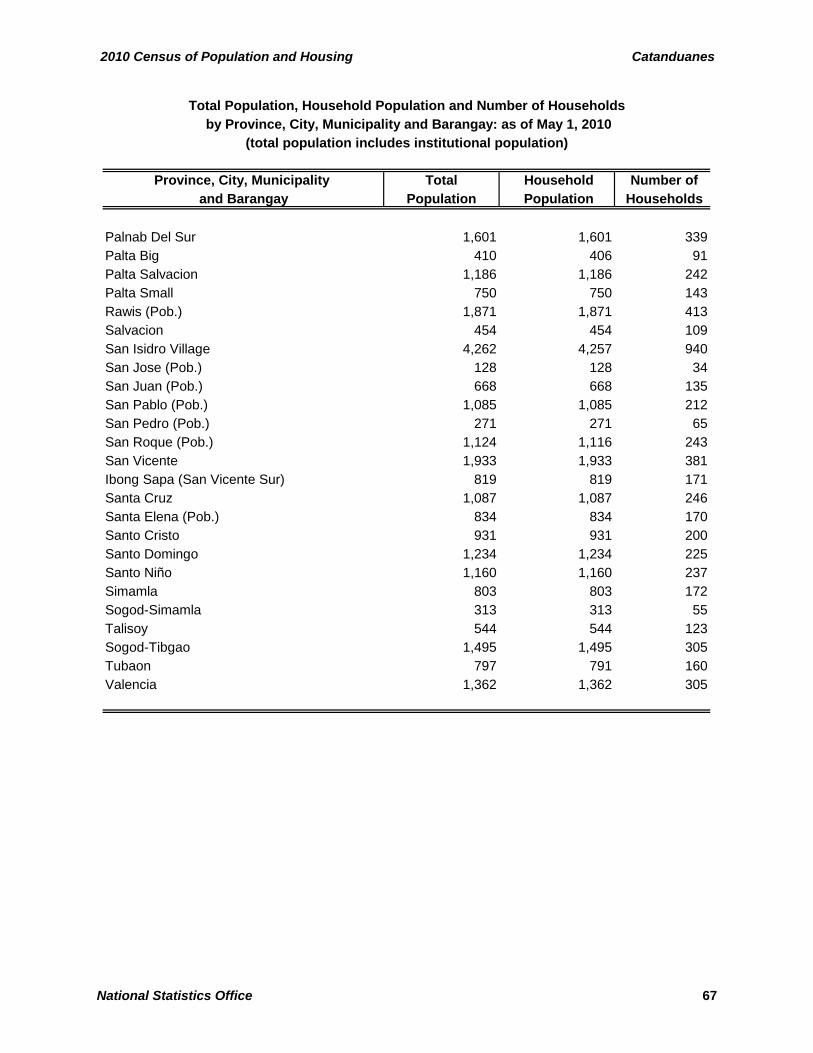
2010 Census of Population and Housing Catanduanes
Province, City, Municipality Total Household Number of and Barangay Population Population Households
Total Population, Household Population and Number of Households
(total population includes institutional population) by Province, City, Municipality and Barangay: as of May 1, 2010
Palnab Del Sur 1,601 1,601 339Palta Big 410 406 91Palta Salvacion 1,186 1,186 242Palta Small 750 750 143Rawis (Pob.) 1,871 1,871 413Salvacion 454 454 109San Isidro Village 4,262 4,257 940San Jose (Pob.) 128 128 34San Juan (Pob.) 668 668 135San Pablo (Pob.) 1,085 1,085 212San Pedro (Pob.) 271 271 65San Roque (Pob.) 1,124 1,116 243San Vicente 1,933 1,933 381Ibong Sapa (San Vicente Sur) 819 819 171Santa Cruz 1,087 1,087 246Santa Elena (Pob.) 834 834 170Santo Cristo 931 931 200Santo Domingo 1,234 1,234 225Santo Niño 1,160 1,160 237Simamla 803 803 172Sogod-Simamla 313 313 55Talisoy 544 544 123Sogod-Tibgao 1,495 1,495 305Tubaon 797 791 160Valencia 1,362 1,362 305
National Statistics Office 67
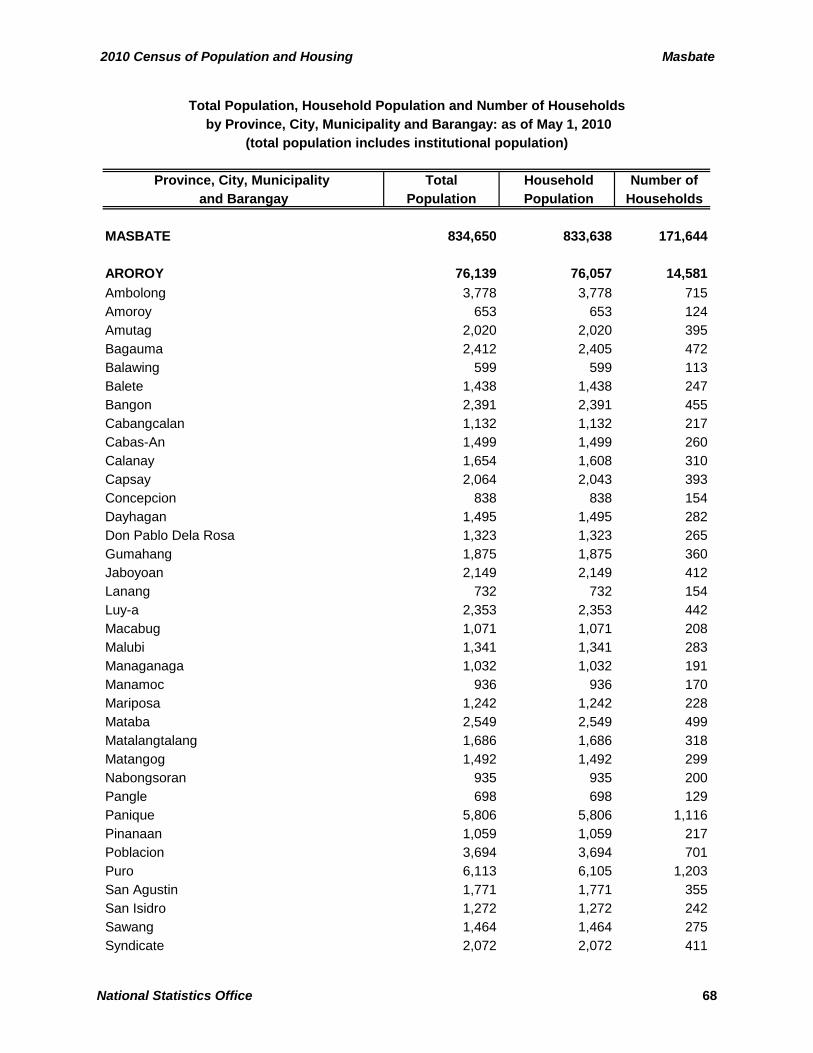
2010 Census of Population and Housing Masbate
Province, City, Municipality Total Household Number of and Barangay Population Population Households
MASBATE 834,650 833,638 171,644
AROROY 76,139 76,057 14,581Ambolong 3,778 3,778 715Amoroy 653 653 124Amutag 2,020 2,020 395Bagauma 2,412 2,405 472Balawing 599 599 113Balete 1,438 1,438 247Bangon 2,391 2,391 455Cabangcalan 1,132 1,132 217Cabas-An 1,499 1,499 260Calanay 1,654 1,608 310Capsay 2,064 2,043 393Concepcion 838 838 154Dayhagan 1,495 1,495 282Don Pablo Dela Rosa 1,323 1,323 265Gumahang 1,875 1,875 360Jaboyoan 2,149 2,149 412Lanang 732 732 154Luy-a 2,353 2,353 442Macabug 1,071 1,071 208Malubi 1,341 1,341 283Managanaga 1,032 1,032 191Manamoc 936 936 170Mariposa 1,242 1,242 228Mataba 2,549 2,549 499Matalangtalang 1,686 1,686 318Matangog 1,492 1,492 299Nabongsoran 935 935 200Pangle 698 698 129Panique 5,806 5,806 1,116Pinanaan 1,059 1,059 217Poblacion 3,694 3,694 701Puro 6,113 6,105 1,203San Agustin 1,771 1,771 355San Isidro 1,272 1,272 242Sawang 1,464 1,464 275Syndicate 2,072 2,072 411
Total Population, Household Population and Number of Households
(total population includes institutional population) by Province, City, Municipality and Barangay: as of May 1, 2010
National Statistics Office 68
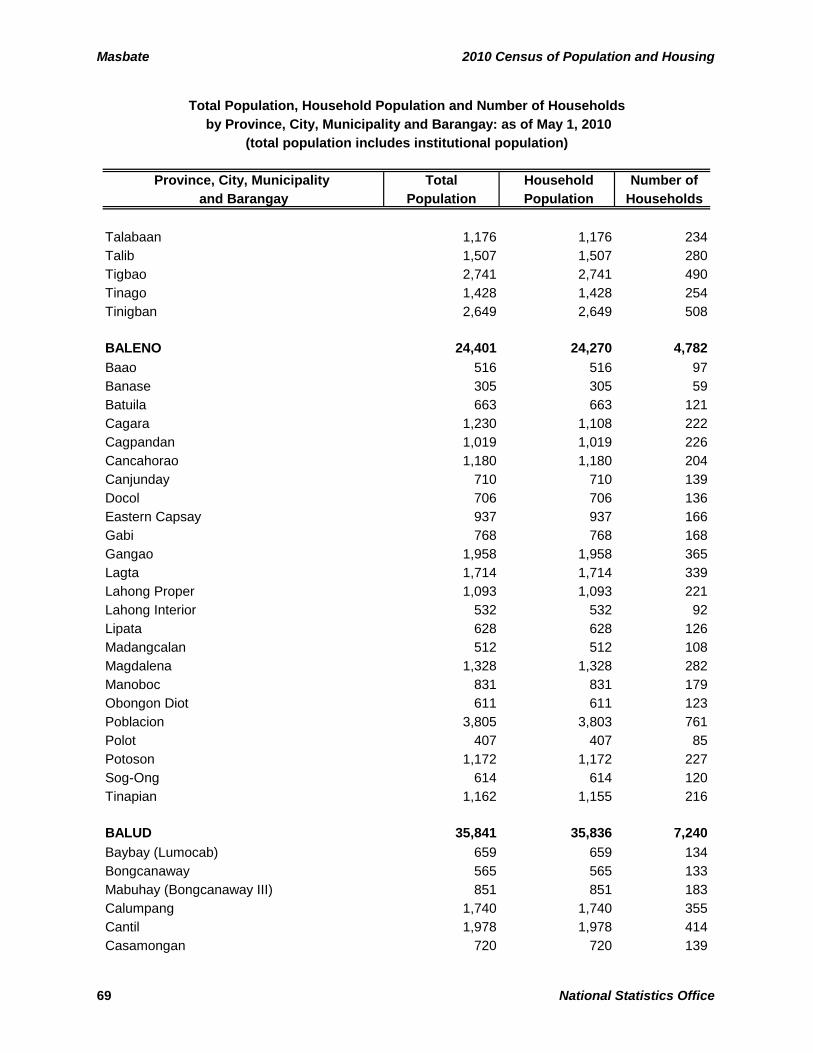
Masbate 2010 Census of Population and Housing
Province, City, Municipality Total Household Number of and Barangay Population Population Households
Total Population, Household Population and Number of Households
(total population includes institutional population) by Province, City, Municipality and Barangay: as of May 1, 2010
Talabaan 1,176 1,176 234Talib 1,507 1,507 280Tigbao 2,741 2,741 490Tinago 1,428 1,428 254Tinigban 2,649 2,649 508
BALENO 24,401 24,270 4,782Baao 516 516 97Banase 305 305 59Batuila 663 663 121Cagara 1,230 1,108 222Cagpandan 1,019 1,019 226Cancahorao 1,180 1,180 204Canjunday 710 710 139Docol 706 706 136Eastern Capsay 937 937 166Gabi 768 768 168Gangao 1,958 1,958 365Lagta 1,714 1,714 339Lahong Proper 1,093 1,093 221Lahong Interior 532 532 92Lipata 628 628 126Madangcalan 512 512 108Magdalena 1,328 1,328 282Manoboc 831 831 179Obongon Diot 611 611 123Poblacion 3,805 3,803 761Polot 407 407 85Potoson 1,172 1,172 227Sog-Ong 614 614 120Tinapian 1,162 1,155 216
BALUD 35,841 35,836 7,240Baybay (Lumocab) 659 659 134Bongcanaway 565 565 133Mabuhay (Bongcanaway III) 851 851 183Calumpang 1,740 1,740 355Cantil 1,978 1,978 414Casamongan 720 720 139
69 National Statistics Office
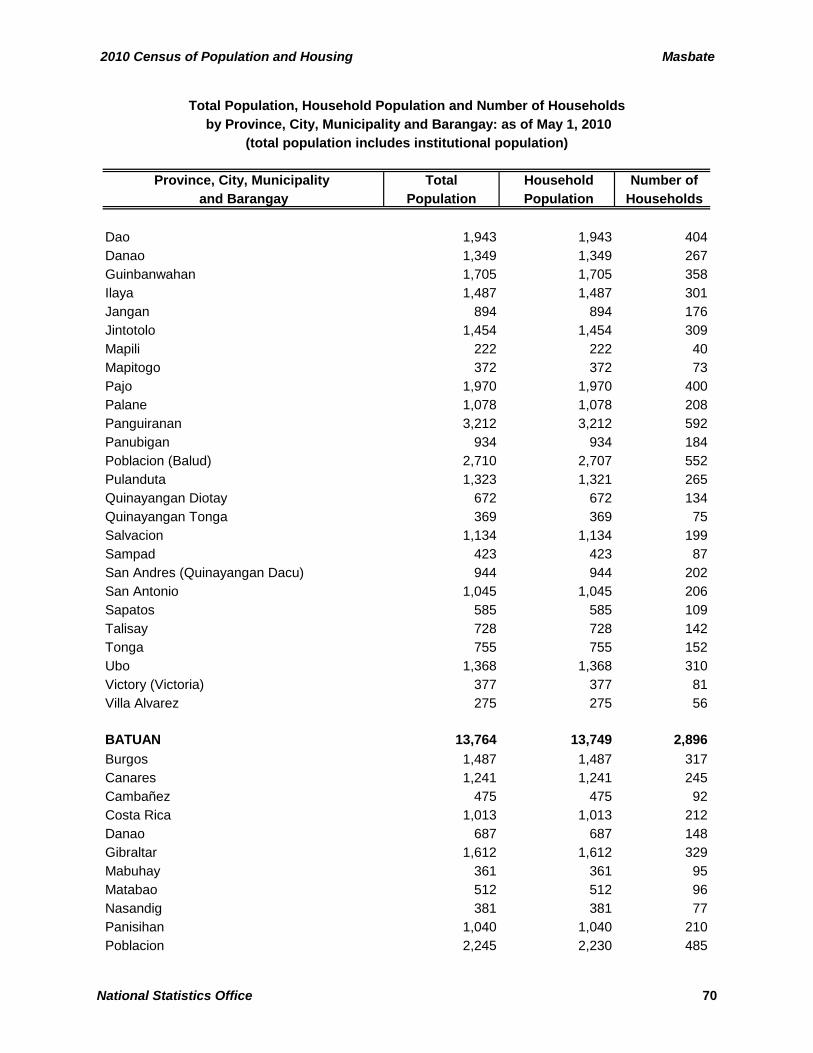
2010 Census of Population and Housing Masbate
Province, City, Municipality Total Household Number of and Barangay Population Population Households
Total Population, Household Population and Number of Households
(total population includes institutional population) by Province, City, Municipality and Barangay: as of May 1, 2010
Dao 1,943 1,943 404Danao 1,349 1,349 267Guinbanwahan 1,705 1,705 358Ilaya 1,487 1,487 301Jangan 894 894 176Jintotolo 1,454 1,454 309Mapili 222 222 40Mapitogo 372 372 73Pajo 1,970 1,970 400Palane 1,078 1,078 208Panguiranan 3,212 3,212 592Panubigan 934 934 184Poblacion (Balud) 2,710 2,707 552Pulanduta 1,323 1,321 265Quinayangan Diotay 672 672 134Quinayangan Tonga 369 369 75Salvacion 1,134 1,134 199Sampad 423 423 87San Andres (Quinayangan Dacu) 944 944 202San Antonio 1,045 1,045 206Sapatos 585 585 109Talisay 728 728 142Tonga 755 755 152Ubo 1,368 1,368 310Victory (Victoria) 377 377 81Villa Alvarez 275 275 56
BATUAN 13,764 13,749 2,896Burgos 1,487 1,487 317Canares 1,241 1,241 245Cambañez 475 475 92Costa Rica 1,013 1,013 212Danao 687 687 148Gibraltar 1,612 1,612 329Mabuhay 361 361 95Matabao 512 512 96Nasandig 381 381 77Panisihan 1,040 1,040 210Poblacion 2,245 2,230 485
National Statistics Office 70
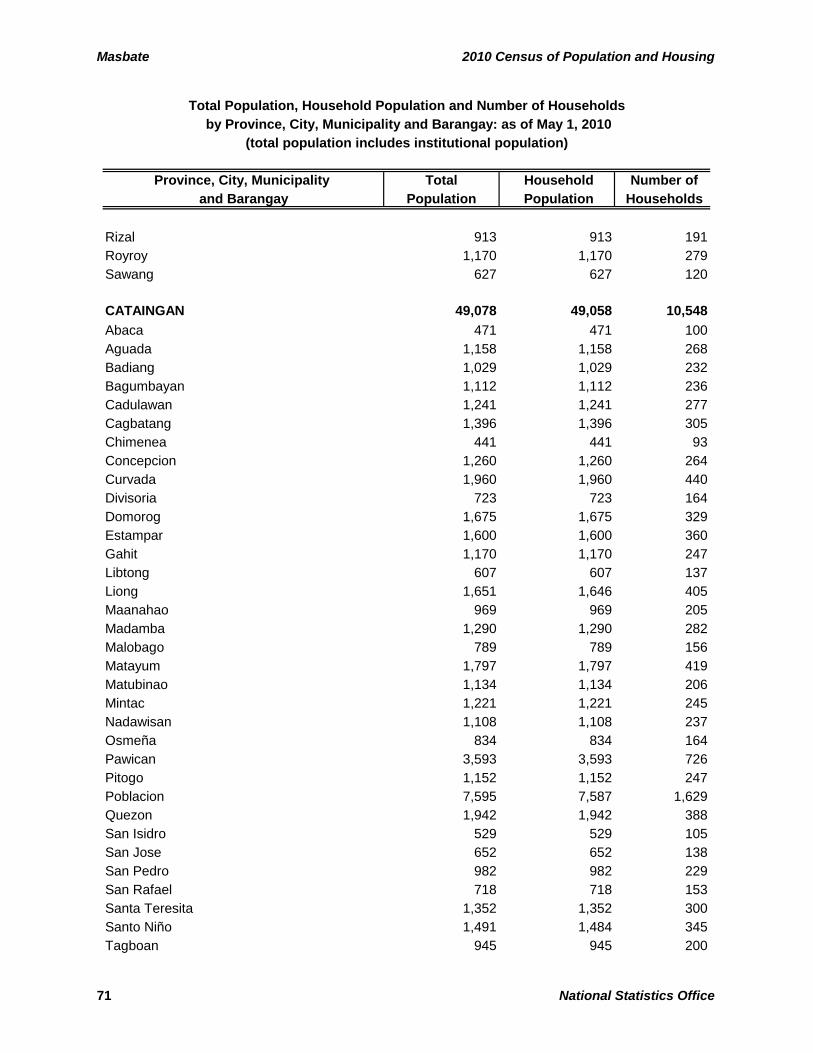
Masbate 2010 Census of Population and Housing
Province, City, Municipality Total Household Number of and Barangay Population Population Households
Total Population, Household Population and Number of Households
(total population includes institutional population) by Province, City, Municipality and Barangay: as of May 1, 2010
Rizal 913 913 191Royroy 1,170 1,170 279Sawang 627 627 120
CATAINGAN 49,078 49,058 10,548Abaca 471 471 100Aguada 1,158 1,158 268Badiang 1,029 1,029 232Bagumbayan 1,112 1,112 236Cadulawan 1,241 1,241 277Cagbatang 1,396 1,396 305Chimenea 441 441 93Concepcion 1,260 1,260 264Curvada 1,960 1,960 440Divisoria 723 723 164Domorog 1,675 1,675 329Estampar 1,600 1,600 360Gahit 1,170 1,170 247Libtong 607 607 137Liong 1,651 1,646 405Maanahao 969 969 205Madamba 1,290 1,290 282Malobago 789 789 156Matayum 1,797 1,797 419Matubinao 1,134 1,134 206Mintac 1,221 1,221 245Nadawisan 1,108 1,108 237Osmeña 834 834 164Pawican 3,593 3,593 726Pitogo 1,152 1,152 247Poblacion 7,595 7,587 1,629Quezon 1,942 1,942 388San Isidro 529 529 105San Jose 652 652 138San Pedro 982 982 229San Rafael 718 718 153Santa Teresita 1,352 1,352 300Santo Niño 1,491 1,484 345Tagboan 945 945 200
71 National Statistics Office

2010 Census of Population and Housing Masbate
Province, City, Municipality Total Household Number of and Barangay Population Population Households
Total Population, Household Population and Number of Households
(total population includes institutional population) by Province, City, Municipality and Barangay: as of May 1, 2010
Tuybo 714 714 168Villa Pogado 777 777 149
CAWAYAN 63,115 63,099 13,316Begia 2,574 2,574 526Cabayugan 1,059 1,059 202Cabungahan 1,517 1,517 354Calapayan 1,283 1,283 297Calumpang 1,189 1,189 265Dalipe 1,806 1,806 377Divisoria 3,338 3,338 725Guiom 1,897 1,897 414Gilotongan 3,328 3,328 662Itombato 1,142 1,142 264Libertad 1,223 1,223 278Looc 2,540 2,540 465Mactan 1,082 1,082 238Madbad 1,219 1,219 275R.M. Magbalon (Bebinan) 893 893 183Mahayahay 2,411 2,411 479Maihao 1,414 1,414 347Malbug 2,978 2,978 610Naro 3,026 3,026 590Pananawan 1,622 1,622 332Poblacion 3,669 3,653 779Pulot 842 842 176Recodo 2,139 2,139 486San Jose 620 620 128San Vicente 1,197 1,197 261Taberna 1,445 1,445 280Talisay 1,185 1,185 244Tuburan 1,603 1,603 332Villahermosa 938 938 228Chico Island 2,338 2,338 491Lague-lague 883 883 183Palobandera 636 636 135Peña Island 2,199 2,199 470Pin-As 1,286 1,286 259Iraya 1,068 1,068 234
National Statistics Office 72
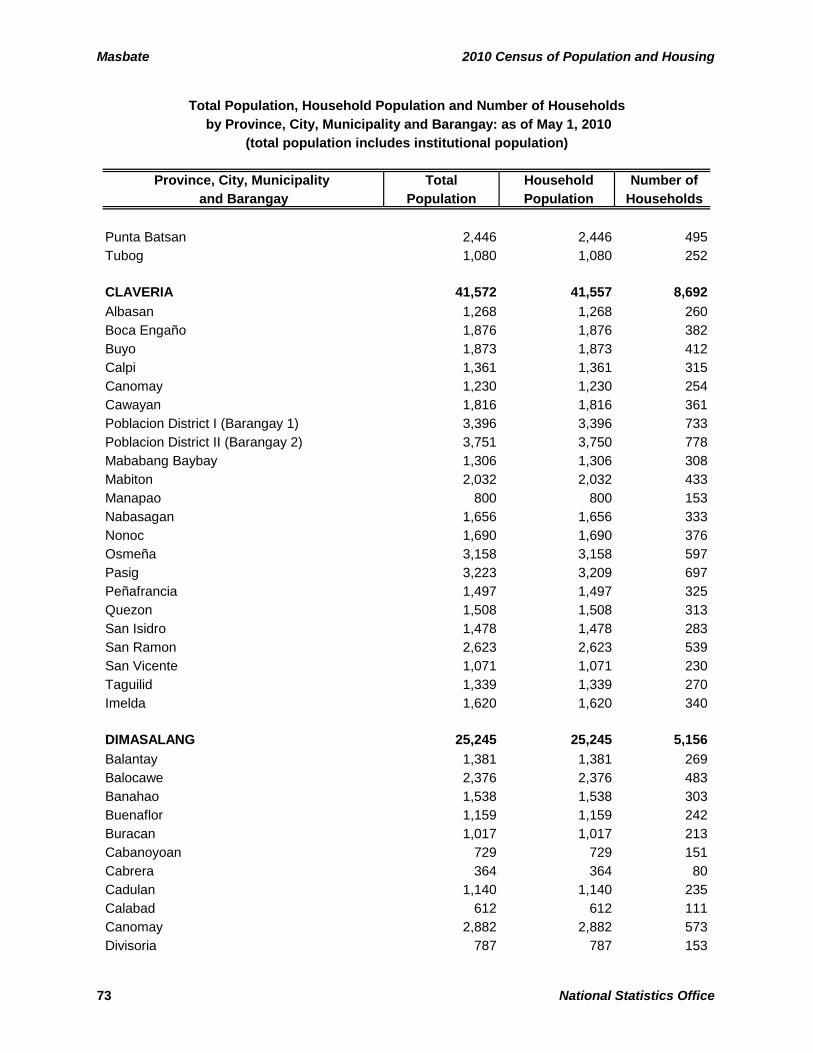
Masbate 2010 Census of Population and Housing
Province, City, Municipality Total Household Number of and Barangay Population Population Households
Total Population, Household Population and Number of Households
(total population includes institutional population) by Province, City, Municipality and Barangay: as of May 1, 2010
Punta Batsan 2,446 2,446 495Tubog 1,080 1,080 252
CLAVERIA 41,572 41,557 8,692Albasan 1,268 1,268 260Boca Engaño 1,876 1,876 382Buyo 1,873 1,873 412Calpi 1,361 1,361 315Canomay 1,230 1,230 254Cawayan 1,816 1,816 361Poblacion District I (Barangay 1) 3,396 3,396 733Poblacion District II (Barangay 2) 3,751 3,750 778Mababang Baybay 1,306 1,306 308Mabiton 2,032 2,032 433Manapao 800 800 153Nabasagan 1,656 1,656 333Nonoc 1,690 1,690 376Osmeña 3,158 3,158 597Pasig 3,223 3,209 697Peñafrancia 1,497 1,497 325Quezon 1,508 1,508 313San Isidro 1,478 1,478 283San Ramon 2,623 2,623 539San Vicente 1,071 1,071 230Taguilid 1,339 1,339 270Imelda 1,620 1,620 340
DIMASALANG 25,245 25,245 5,156Balantay 1,381 1,381 269Balocawe 2,376 2,376 483Banahao 1,538 1,538 303Buenaflor 1,159 1,159 242Buracan 1,017 1,017 213Cabanoyoan 729 729 151Cabrera 364 364 80Cadulan 1,140 1,140 235Calabad 612 612 111Canomay 2,882 2,882 573Divisoria 787 787 153
73 National Statistics Office
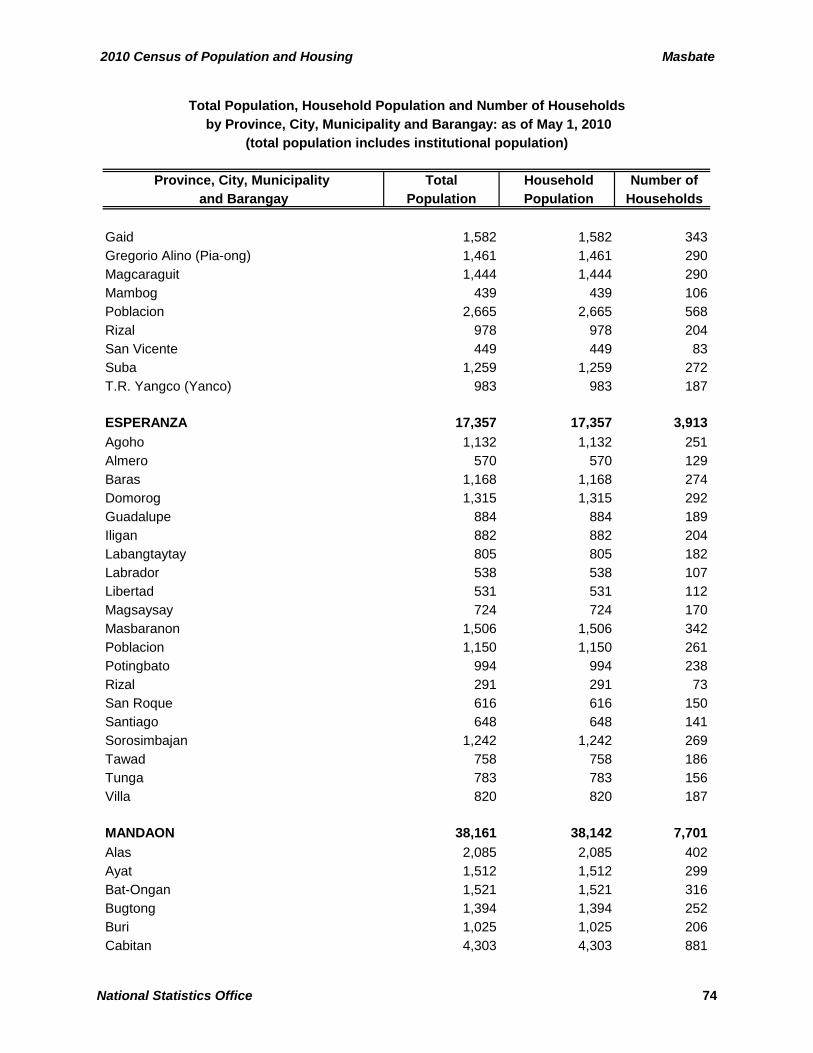
2010 Census of Population and Housing Masbate
Province, City, Municipality Total Household Number of and Barangay Population Population Households
Total Population, Household Population and Number of Households
(total population includes institutional population) by Province, City, Municipality and Barangay: as of May 1, 2010
Gaid 1,582 1,582 343Gregorio Alino (Pia-ong) 1,461 1,461 290Magcaraguit 1,444 1,444 290Mambog 439 439 106Poblacion 2,665 2,665 568Rizal 978 978 204San Vicente 449 449 83Suba 1,259 1,259 272T.R. Yangco (Yanco) 983 983 187
ESPERANZA 17,357 17,357 3,913Agoho 1,132 1,132 251Almero 570 570 129Baras 1,168 1,168 274Domorog 1,315 1,315 292Guadalupe 884 884 189Iligan 882 882 204Labangtaytay 805 805 182Labrador 538 538 107Libertad 531 531 112Magsaysay 724 724 170Masbaranon 1,506 1,506 342Poblacion 1,150 1,150 261Potingbato 994 994 238Rizal 291 291 73San Roque 616 616 150Santiago 648 648 141Sorosimbajan 1,242 1,242 269Tawad 758 758 186Tunga 783 783 156Villa 820 820 187
MANDAON 38,161 38,142 7,701Alas 2,085 2,085 402Ayat 1,512 1,512 299Bat-Ongan 1,521 1,521 316Bugtong 1,394 1,394 252Buri 1,025 1,025 206Cabitan 4,303 4,303 881
National Statistics Office 74
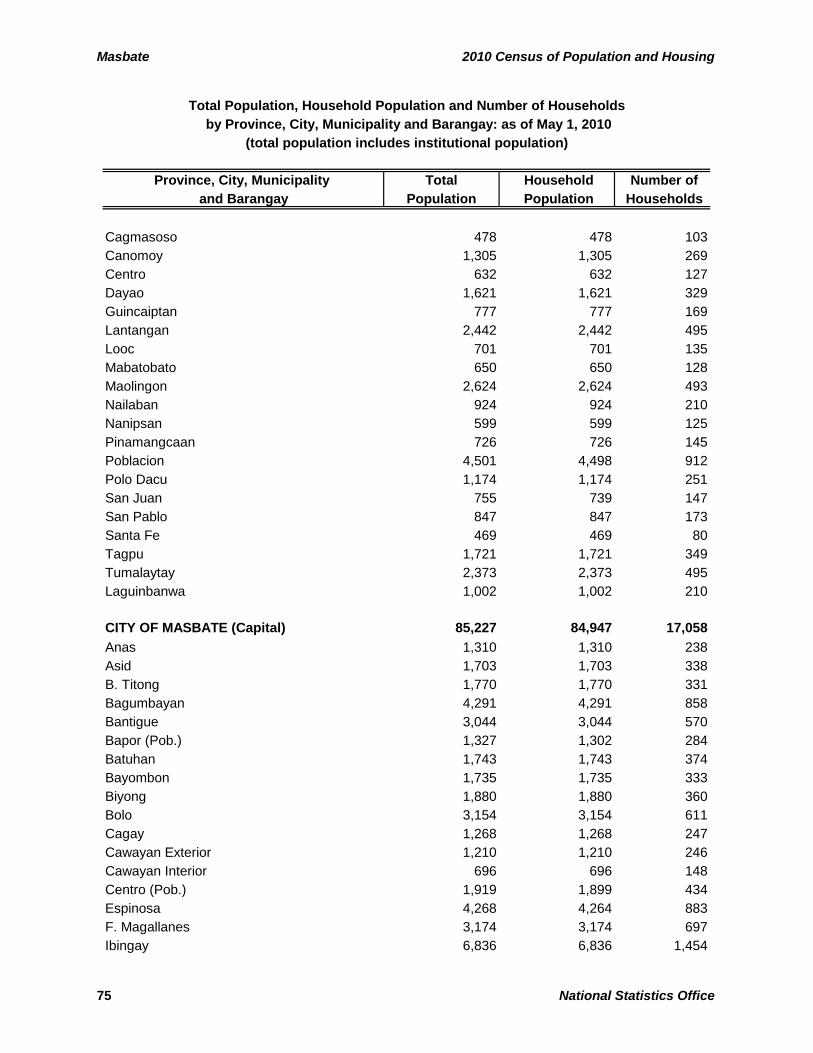
Masbate 2010 Census of Population and Housing
Province, City, Municipality Total Household Number of and Barangay Population Population Households
Total Population, Household Population and Number of Households
(total population includes institutional population) by Province, City, Municipality and Barangay: as of May 1, 2010
Cagmasoso 478 478 103Canomoy 1,305 1,305 269Centro 632 632 127Dayao 1,621 1,621 329Guincaiptan 777 777 169Lantangan 2,442 2,442 495Looc 701 701 135Mabatobato 650 650 128Maolingon 2,624 2,624 493Nailaban 924 924 210Nanipsan 599 599 125Pinamangcaan 726 726 145Poblacion 4,501 4,498 912Polo Dacu 1,174 1,174 251San Juan 755 739 147San Pablo 847 847 173Santa Fe 469 469 80Tagpu 1,721 1,721 349Tumalaytay 2,373 2,373 495Laguinbanwa 1,002 1,002 210
CITY OF MASBATE (Capital) 85,227 84,947 17,058Anas 1,310 1,310 238Asid 1,703 1,703 338B. Titong 1,770 1,770 331Bagumbayan 4,291 4,291 858Bantigue 3,044 3,044 570Bapor (Pob.) 1,327 1,302 284Batuhan 1,743 1,743 374Bayombon 1,735 1,735 333Biyong 1,880 1,880 360Bolo 3,154 3,154 611Cagay 1,268 1,268 247Cawayan Exterior 1,210 1,210 246Cawayan Interior 696 696 148Centro (Pob.) 1,919 1,899 434Espinosa 4,268 4,264 883F. Magallanes 3,174 3,174 697Ibingay 6,836 6,836 1,454
75 National Statistics Office
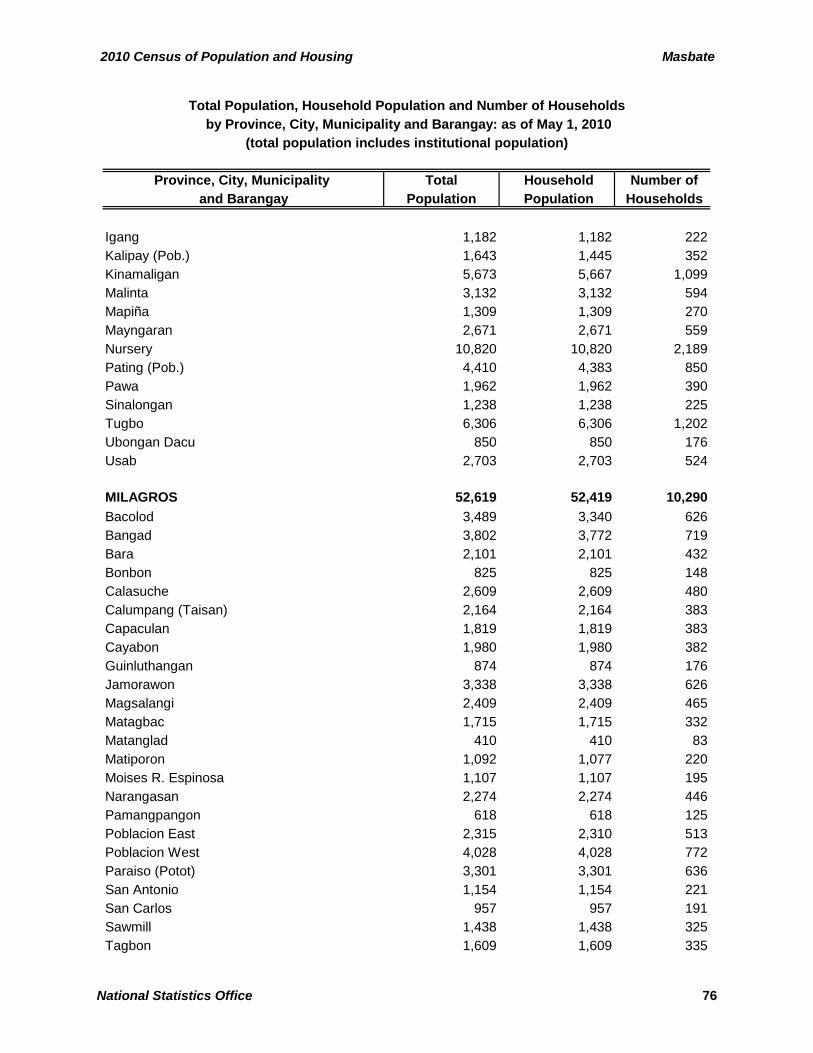
2010 Census of Population and Housing Masbate
Province, City, Municipality Total Household Number of and Barangay Population Population Households
Total Population, Household Population and Number of Households
(total population includes institutional population) by Province, City, Municipality and Barangay: as of May 1, 2010
Igang 1,182 1,182 222Kalipay (Pob.) 1,643 1,445 352Kinamaligan 5,673 5,667 1,099Malinta 3,132 3,132 594Mapiña 1,309 1,309 270Mayngaran 2,671 2,671 559Nursery 10,820 10,820 2,189Pating (Pob.) 4,410 4,383 850Pawa 1,962 1,962 390Sinalongan 1,238 1,238 225Tugbo 6,306 6,306 1,202Ubongan Dacu 850 850 176Usab 2,703 2,703 524
MILAGROS 52,619 52,419 10,290Bacolod 3,489 3,340 626Bangad 3,802 3,772 719Bara 2,101 2,101 432Bonbon 825 825 148Calasuche 2,609 2,609 480Calumpang (Taisan) 2,164 2,164 383Capaculan 1,819 1,819 383Cayabon 1,980 1,980 382Guinluthangan 874 874 176Jamorawon 3,338 3,338 626Magsalangi 2,409 2,409 465Matagbac 1,715 1,715 332Matanglad 410 410 83Matiporon 1,092 1,077 220Moises R. Espinosa 1,107 1,107 195Narangasan 2,274 2,274 446Pamangpangon 618 618 125Poblacion East 2,315 2,310 513Poblacion West 4,028 4,028 772Paraiso (Potot) 3,301 3,301 636San Antonio 1,154 1,154 221San Carlos 957 957 191Sawmill 1,438 1,438 325Tagbon 1,609 1,609 335
National Statistics Office 76
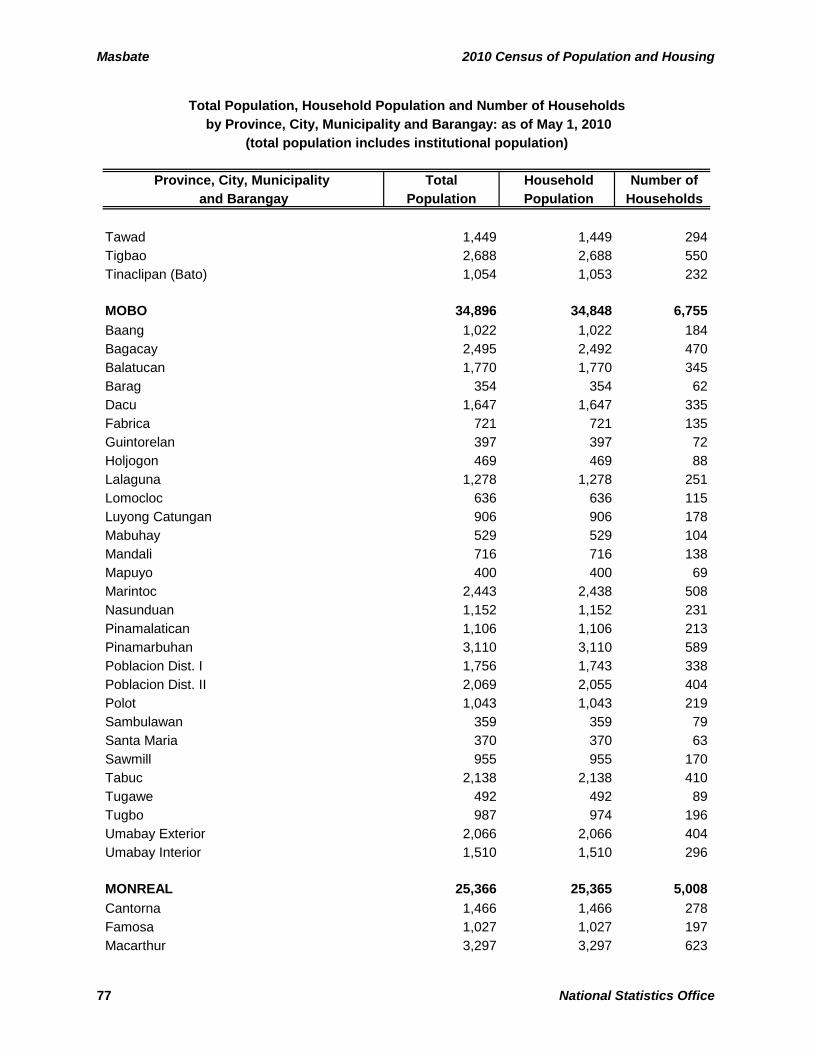
Masbate 2010 Census of Population and Housing
Province, City, Municipality Total Household Number of and Barangay Population Population Households
Total Population, Household Population and Number of Households
(total population includes institutional population) by Province, City, Municipality and Barangay: as of May 1, 2010
Tawad 1,449 1,449 294Tigbao 2,688 2,688 550Tinaclipan (Bato) 1,054 1,053 232
MOBO 34,896 34,848 6,755Baang 1,022 1,022 184Bagacay 2,495 2,492 470Balatucan 1,770 1,770 345Barag 354 354 62Dacu 1,647 1,647 335Fabrica 721 721 135Guintorelan 397 397 72Holjogon 469 469 88Lalaguna 1,278 1,278 251Lomocloc 636 636 115Luyong Catungan 906 906 178Mabuhay 529 529 104Mandali 716 716 138Mapuyo 400 400 69Marintoc 2,443 2,438 508Nasunduan 1,152 1,152 231Pinamalatican 1,106 1,106 213Pinamarbuhan 3,110 3,110 589Poblacion Dist. I 1,756 1,743 338Poblacion Dist. II 2,069 2,055 404Polot 1,043 1,043 219Sambulawan 359 359 79Santa Maria 370 370 63Sawmill 955 955 170Tabuc 2,138 2,138 410Tugawe 492 492 89Tugbo 987 974 196Umabay Exterior 2,066 2,066 404Umabay Interior 1,510 1,510 296
MONREAL 25,366 25,365 5,008Cantorna 1,466 1,466 278Famosa 1,027 1,027 197Macarthur 3,297 3,297 623
77 National Statistics Office
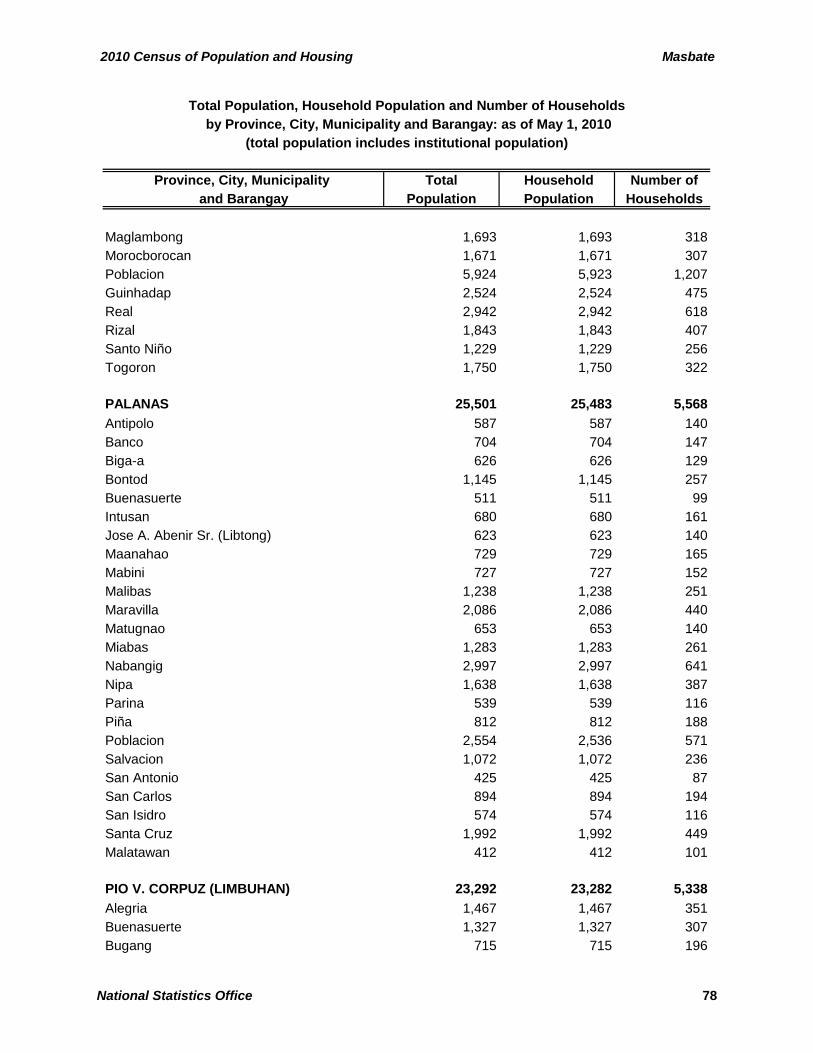
2010 Census of Population and Housing Masbate
Province, City, Municipality Total Household Number of and Barangay Population Population Households
Total Population, Household Population and Number of Households
(total population includes institutional population) by Province, City, Municipality and Barangay: as of May 1, 2010
Maglambong 1,693 1,693 318Morocborocan 1,671 1,671 307Poblacion 5,924 5,923 1,207Guinhadap 2,524 2,524 475Real 2,942 2,942 618Rizal 1,843 1,843 407Santo Niño 1,229 1,229 256Togoron 1,750 1,750 322
PALANAS 25,501 25,483 5,568Antipolo 587 587 140Banco 704 704 147Biga-a 626 626 129Bontod 1,145 1,145 257Buenasuerte 511 511 99Intusan 680 680 161Jose A. Abenir Sr. (Libtong) 623 623 140Maanahao 729 729 165Mabini 727 727 152Malibas 1,238 1,238 251Maravilla 2,086 2,086 440Matugnao 653 653 140Miabas 1,283 1,283 261Nabangig 2,997 2,997 641Nipa 1,638 1,638 387Parina 539 539 116Piña 812 812 188Poblacion 2,554 2,536 571Salvacion 1,072 1,072 236San Antonio 425 425 87San Carlos 894 894 194San Isidro 574 574 116Santa Cruz 1,992 1,992 449Malatawan 412 412 101
PIO V. CORPUZ (LIMBUHAN) 23,292 23,282 5,338Alegria 1,467 1,467 351Buenasuerte 1,327 1,327 307Bugang 715 715 196
National Statistics Office 78
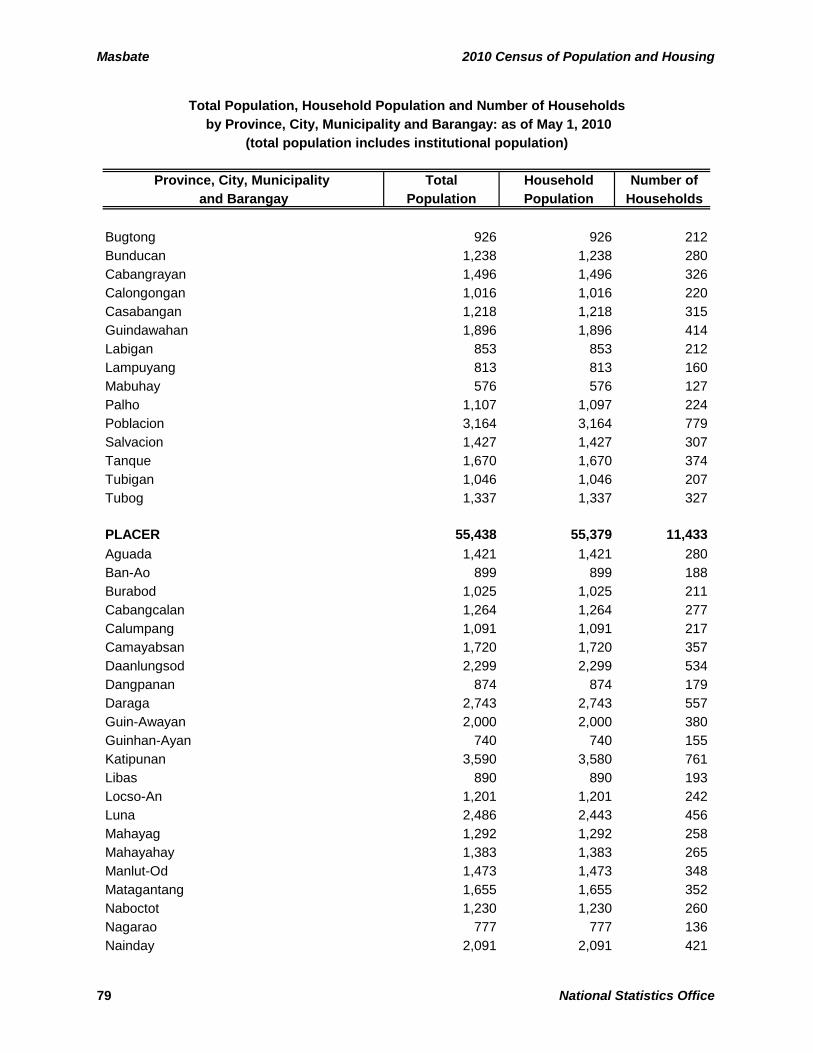
Masbate 2010 Census of Population and Housing
Province, City, Municipality Total Household Number of and Barangay Population Population Households
Total Population, Household Population and Number of Households
(total population includes institutional population) by Province, City, Municipality and Barangay: as of May 1, 2010
Bugtong 926 926 212Bunducan 1,238 1,238 280Cabangrayan 1,496 1,496 326Calongongan 1,016 1,016 220Casabangan 1,218 1,218 315Guindawahan 1,896 1,896 414Labigan 853 853 212Lampuyang 813 813 160Mabuhay 576 576 127Palho 1,107 1,097 224Poblacion 3,164 3,164 779Salvacion 1,427 1,427 307Tanque 1,670 1,670 374Tubigan 1,046 1,046 207Tubog 1,337 1,337 327
PLACER 55,438 55,379 11,433Aguada 1,421 1,421 280Ban-Ao 899 899 188Burabod 1,025 1,025 211Cabangcalan 1,264 1,264 277Calumpang 1,091 1,091 217Camayabsan 1,720 1,720 357Daanlungsod 2,299 2,299 534Dangpanan 874 874 179Daraga 2,743 2,743 557Guin-Awayan 2,000 2,000 380Guinhan-Ayan 740 740 155Katipunan 3,590 3,580 761Libas 890 890 193Locso-An 1,201 1,201 242Luna 2,486 2,443 456Mahayag 1,292 1,292 258Mahayahay 1,383 1,383 265Manlut-Od 1,473 1,473 348Matagantang 1,655 1,655 352Naboctot 1,230 1,230 260Nagarao 777 777 136Nainday 2,091 2,091 421
79 National Statistics Office
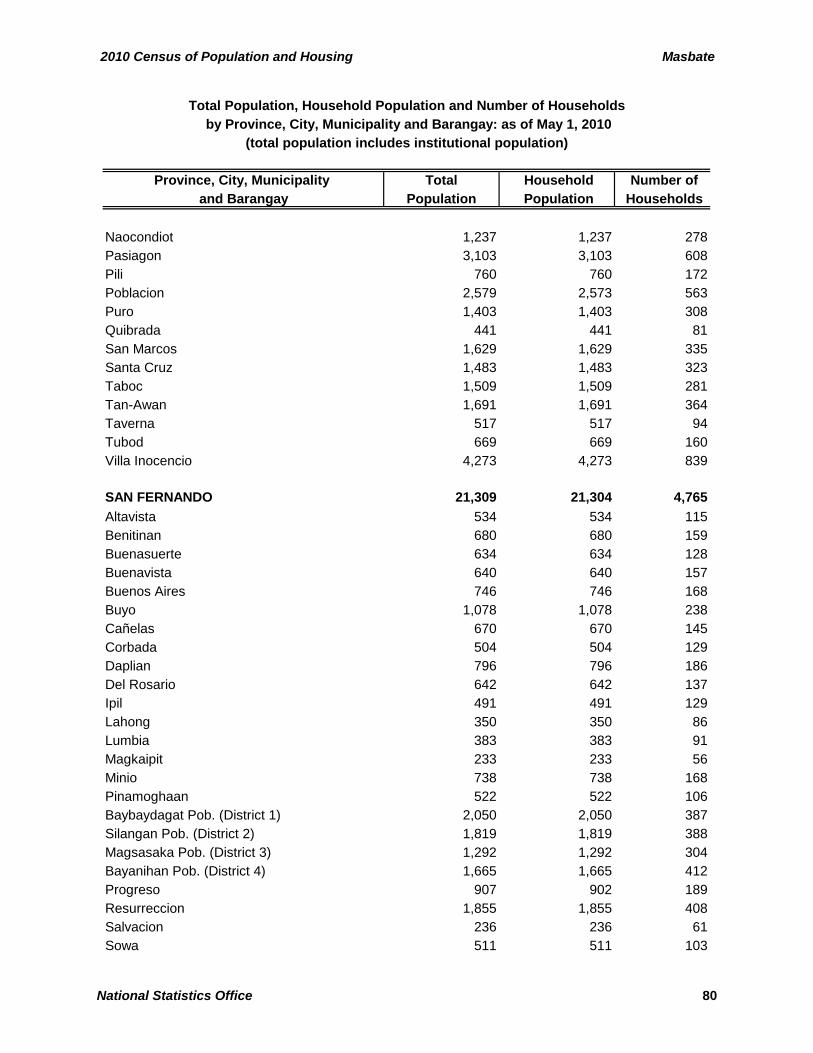
2010 Census of Population and Housing Masbate
Province, City, Municipality Total Household Number of and Barangay Population Population Households
Total Population, Household Population and Number of Households
(total population includes institutional population) by Province, City, Municipality and Barangay: as of May 1, 2010
Naocondiot 1,237 1,237 278Pasiagon 3,103 3,103 608Pili 760 760 172Poblacion 2,579 2,573 563Puro 1,403 1,403 308Quibrada 441 441 81San Marcos 1,629 1,629 335Santa Cruz 1,483 1,483 323Taboc 1,509 1,509 281Tan-Awan 1,691 1,691 364Taverna 517 517 94Tubod 669 669 160Villa Inocencio 4,273 4,273 839
SAN FERNANDO 21,309 21,304 4,765Altavista 534 534 115Benitinan 680 680 159Buenasuerte 634 634 128Buenavista 640 640 157Buenos Aires 746 746 168Buyo 1,078 1,078 238Cañelas 670 670 145Corbada 504 504 129Daplian 796 796 186Del Rosario 642 642 137Ipil 491 491 129Lahong 350 350 86Lumbia 383 383 91Magkaipit 233 233 56Minio 738 738 168Pinamoghaan 522 522 106Baybaydagat Pob. (District 1) 2,050 2,050 387Silangan Pob. (District 2) 1,819 1,819 388Magsasaka Pob. (District 3) 1,292 1,292 304Bayanihan Pob. (District 4) 1,665 1,665 412Progreso 907 902 189Resurreccion 1,855 1,855 408Salvacion 236 236 61Sowa 511 511 103
National Statistics Office 80

Masbate 2010 Census of Population and Housing
Province, City, Municipality Total Household Number of and Barangay Population Population Households
Total Population, Household Population and Number of Households
(total population includes institutional population) by Province, City, Municipality and Barangay: as of May 1, 2010
Talisay 731 731 163Valparaiso 602 602 152
SAN JACINTO 27,974 27,943 6,530Almiñe 529 529 130Bagacay 628 628 138Bagahanglad 2,933 2,933 651Bartolabac 1,220 1,220 248Burgos 1,801 1,801 441Calipat-An 1,716 1,716 419Danao 1,525 1,525 307Dorong-an Daplian 486 486 118Interior 738 738 191Jagna-an 1,215 1,215 277Luna 775 775 180Mabini 1,489 1,489 325Piña 1,028 1,028 215District I (Pob.) 1,045 1,045 261District II (Pob.) 3,354 3,331 800District III (Pob.) 1,878 1,878 480District IV (Pob.) 1,264 1,256 323Roosevelt 854 854 201San Isidro 529 529 116Santa Rosa 1,876 1,876 439Washington 1,091 1,091 270
SAN PASCUAL 44,753 44,748 9,183Boca Chica 2,342 2,342 510Bolod (Pob.) 3,229 3,225 662Busing 2,034 2,034 430Dangcalan 1,487 1,487 287Halabangbaybay 1,284 1,284 266Iniwaran 2,255 2,255 467Ki-Buaya (Rizal) 998 998 203Ki-Romero (Roxas) 1,973 1,973 420Laurente 2,439 2,439 466Mabini 2,097 2,097 441Mabuhay 1,478 1,478 309Mapanique 2,174 2,174 436
81 National Statistics Office

2010 Census of Population and Housing Masbate
Province, City, Municipality Total Household Number of and Barangay Population Population Households
Total Population, Household Population and Number of Households
(total population includes institutional population) by Province, City, Municipality and Barangay: as of May 1, 2010
Nazareno 1,244 1,244 268Pinamasingan 1,979 1,979 361Quintina 1,803 1,803 384San Jose 1,477 1,477 330San Pedro 3,267 3,266 643San Rafael 3,325 3,325 688Santa Cruz 1,911 1,911 387Terraplin (Pob.) 1,283 1,283 266Cueva 2,787 2,787 565Malaking Ilog 1,887 1,887 394
USON 53,602 53,550 10,891Arado 714 714 122Armenia 4,303 4,303 876Aurora 1,154 1,154 229Badling 843 843 172Bonifacio 1,672 1,672 350Buenasuerte 1,320 1,320 269Buenavista 3,143 3,121 643Campana 1,067 1,067 199Candelaria 1,270 1,270 265Centro 877 877 165Crossing 1,580 1,580 320Dapdap 2,546 2,523 533Del Carmen 3,539 3,534 749Del Rosario 726 726 154Libertad 1,382 1,382 269Madao 990 990 201Mabini 1,061 1,061 220Magsaysay 1,357 1,357 285Marcella 2,052 2,052 440Miaga 2,566 2,566 503Mongahay 663 663 140Morocborocan 1,548 1,548 307Mabuhay 967 967 183Paguihaman 1,674 1,674 326Panicijan 1,831 1,831 375Poblacion 1,726 1,724 378Quezon 1,582 1,582 319
National Statistics Office 82
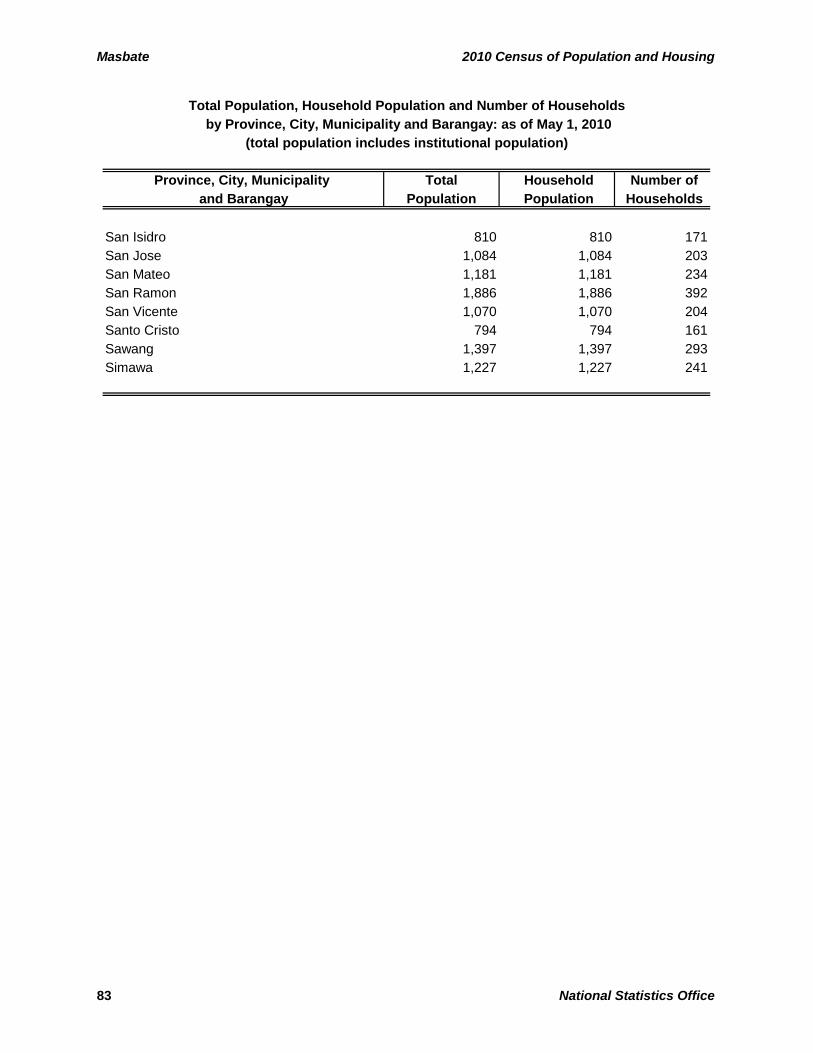
Masbate 2010 Census of Population and Housing
Province, City, Municipality Total Household Number of and Barangay Population Population Households
Total Population, Household Population and Number of Households
(total population includes institutional population) by Province, City, Municipality and Barangay: as of May 1, 2010
San Isidro 810 810 171San Jose 1,084 1,084 203San Mateo 1,181 1,181 234San Ramon 1,886 1,886 392San Vicente 1,070 1,070 204Santo Cristo 794 794 161Sawang 1,397 1,397 293Simawa 1,227 1,227 241
83 National Statistics Office
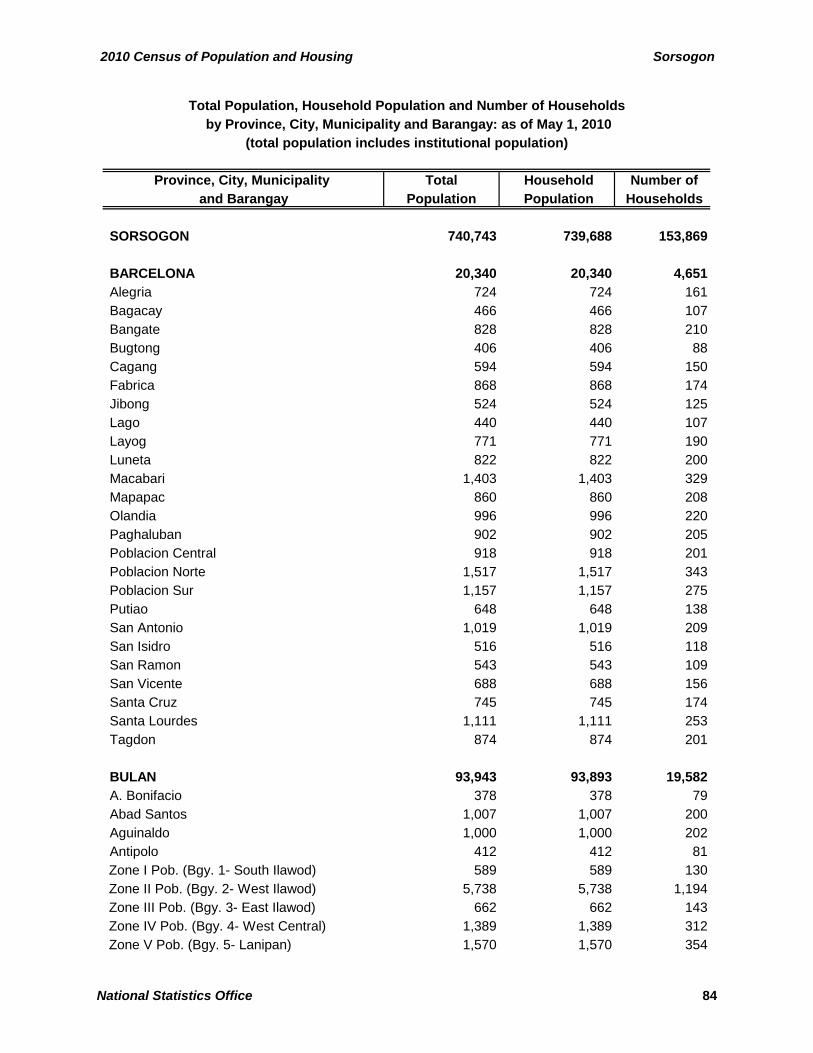
2010 Census of Population and Housing Sorsogon
Province, City, Municipality Total Household Number of and Barangay Population Population Households
SORSOGON 740,743 739,688 153,869
BARCELONA 20,340 20,340 4,651Alegria 724 724 161Bagacay 466 466 107Bangate 828 828 210Bugtong 406 406 88Cagang 594 594 150Fabrica 868 868 174Jibong 524 524 125Lago 440 440 107Layog 771 771 190Luneta 822 822 200Macabari 1,403 1,403 329Mapapac 860 860 208Olandia 996 996 220Paghaluban 902 902 205Poblacion Central 918 918 201Poblacion Norte 1,517 1,517 343Poblacion Sur 1,157 1,157 275Putiao 648 648 138San Antonio 1,019 1,019 209San Isidro 516 516 118San Ramon 543 543 109San Vicente 688 688 156Santa Cruz 745 745 174Santa Lourdes 1,111 1,111 253Tagdon 874 874 201
BULAN 93,943 93,893 19,582A. Bonifacio 378 378 79Abad Santos 1,007 1,007 200Aguinaldo 1,000 1,000 202Antipolo 412 412 81
Zone I Pob. (Bgy. 1- South Ilawod) 589 589 130 Zone II Pob. (Bgy. 2- West Ilawod) 5,738 5,738 1,194 Zone III Pob. (Bgy. 3- East Ilawod) 662 662 143 Zone IV Pob. (Bgy. 4- West Central) 1,389 1,389 312 Zone V Pob. (Bgy. 5- Lanipan) 1,570 1,570 354
Total Population, Household Population and Number of Households
(total population includes institutional population) by Province, City, Municipality and Barangay: as of May 1, 2010
National Statistics Office 84
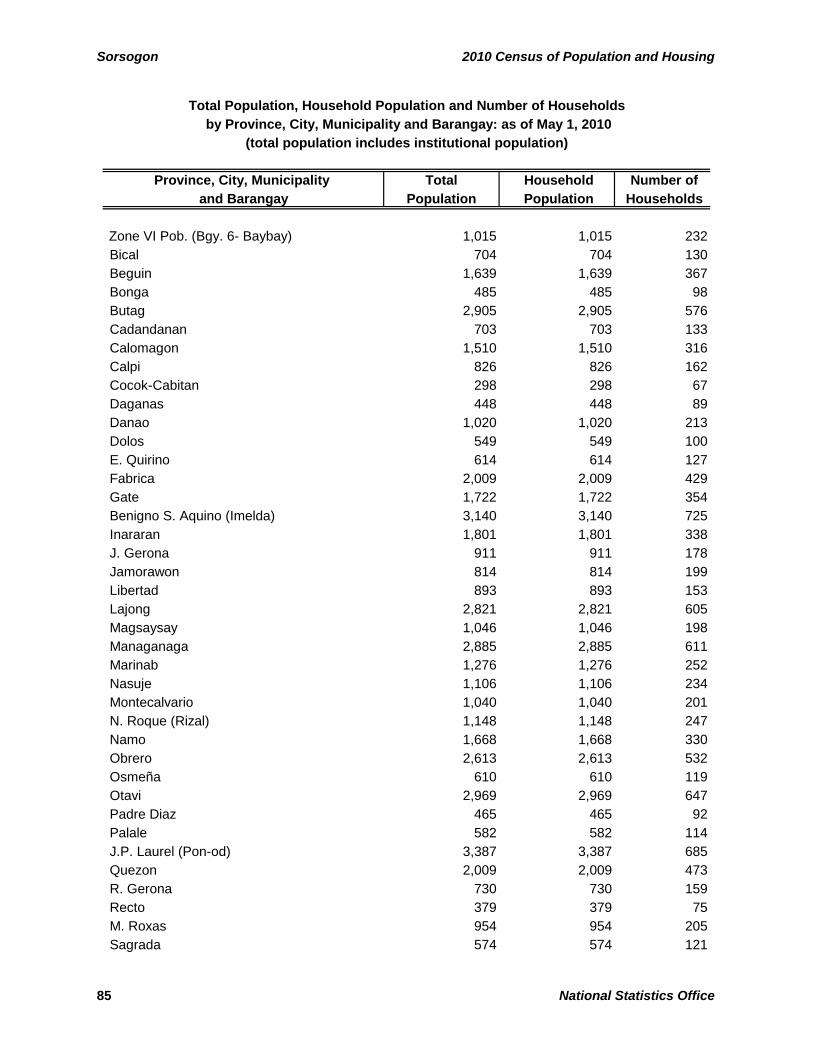
Sorsogon 2010 Census of Population and Housing
Province, City, Municipality Total Household Number of and Barangay Population Population Households
Total Population, Household Population and Number of Households
(total population includes institutional population) by Province, City, Municipality and Barangay: as of May 1, 2010
Zone VI Pob. (Bgy. 6- Baybay) 1,015 1,015 232Bical 704 704 130Beguin 1,639 1,639 367Bonga 485 485 98Butag 2,905 2,905 576Cadandanan 703 703 133Calomagon 1,510 1,510 316Calpi 826 826 162Cocok-Cabitan 298 298 67Daganas 448 448 89Danao 1,020 1,020 213Dolos 549 549 100E. Quirino 614 614 127Fabrica 2,009 2,009 429Gate 1,722 1,722 354Benigno S. Aquino (Imelda) 3,140 3,140 725Inararan 1,801 1,801 338J. Gerona 911 911 178Jamorawon 814 814 199Libertad 893 893 153Lajong 2,821 2,821 605Magsaysay 1,046 1,046 198Managanaga 2,885 2,885 611Marinab 1,276 1,276 252Nasuje 1,106 1,106 234Montecalvario 1,040 1,040 201N. Roque (Rizal) 1,148 1,148 247Namo 1,668 1,668 330Obrero 2,613 2,613 532Osmeña 610 610 119Otavi 2,969 2,969 647Padre Diaz 465 465 92Palale 582 582 114J.P. Laurel (Pon-od) 3,387 3,387 685Quezon 2,009 2,009 473R. Gerona 730 730 159Recto 379 379 75M. Roxas 954 954 205Sagrada 574 574 121
85 National Statistics Office
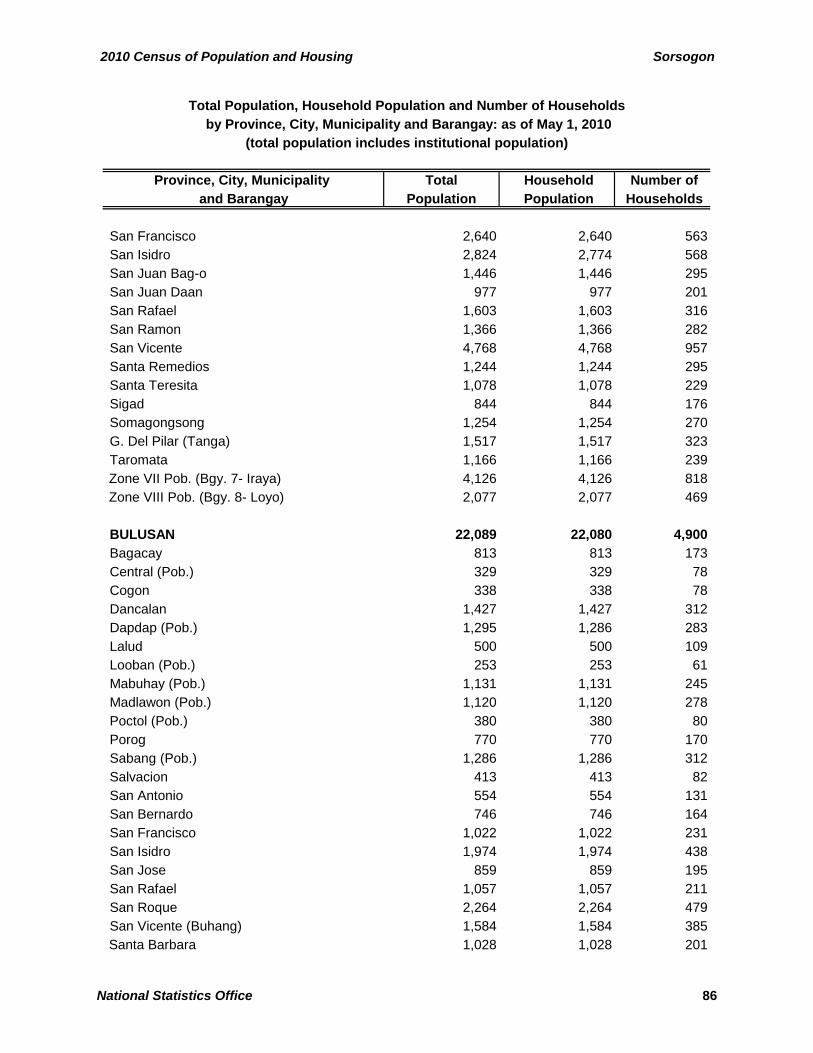
2010 Census of Population and Housing Sorsogon
Province, City, Municipality Total Household Number of and Barangay Population Population Households
Total Population, Household Population and Number of Households
(total population includes institutional population) by Province, City, Municipality and Barangay: as of May 1, 2010
San Francisco 2,640 2,640 563San Isidro 2,824 2,774 568San Juan Bag-o 1,446 1,446 295San Juan Daan 977 977 201San Rafael 1,603 1,603 316San Ramon 1,366 1,366 282San Vicente 4,768 4,768 957Santa Remedios 1,244 1,244 295Santa Teresita 1,078 1,078 229Sigad 844 844 176Somagongsong 1,254 1,254 270G. Del Pilar (Tanga) 1,517 1,517 323Taromata 1,166 1,166 239
Zone VII Pob. (Bgy. 7- Iraya) 4,126 4,126 818 Zone VIII Pob. (Bgy. 8- Loyo) 2,077 2,077 469
BULUSAN 22,089 22,080 4,900Bagacay 813 813 173Central (Pob.) 329 329 78Cogon 338 338 78Dancalan 1,427 1,427 312Dapdap (Pob.) 1,295 1,286 283Lalud 500 500 109Looban (Pob.) 253 253 61Mabuhay (Pob.) 1,131 1,131 245Madlawon (Pob.) 1,120 1,120 278Poctol (Pob.) 380 380 80Porog 770 770 170Sabang (Pob.) 1,286 1,286 312Salvacion 413 413 82San Antonio 554 554 131San Bernardo 746 746 164San Francisco 1,022 1,022 231San Isidro 1,974 1,974 438San Jose 859 859 195San Rafael 1,057 1,057 211San Roque 2,264 2,264 479San Vicente (Buhang) 1,584 1,584 385
Santa Barbara 1,028 1,028 201
National Statistics Office 86
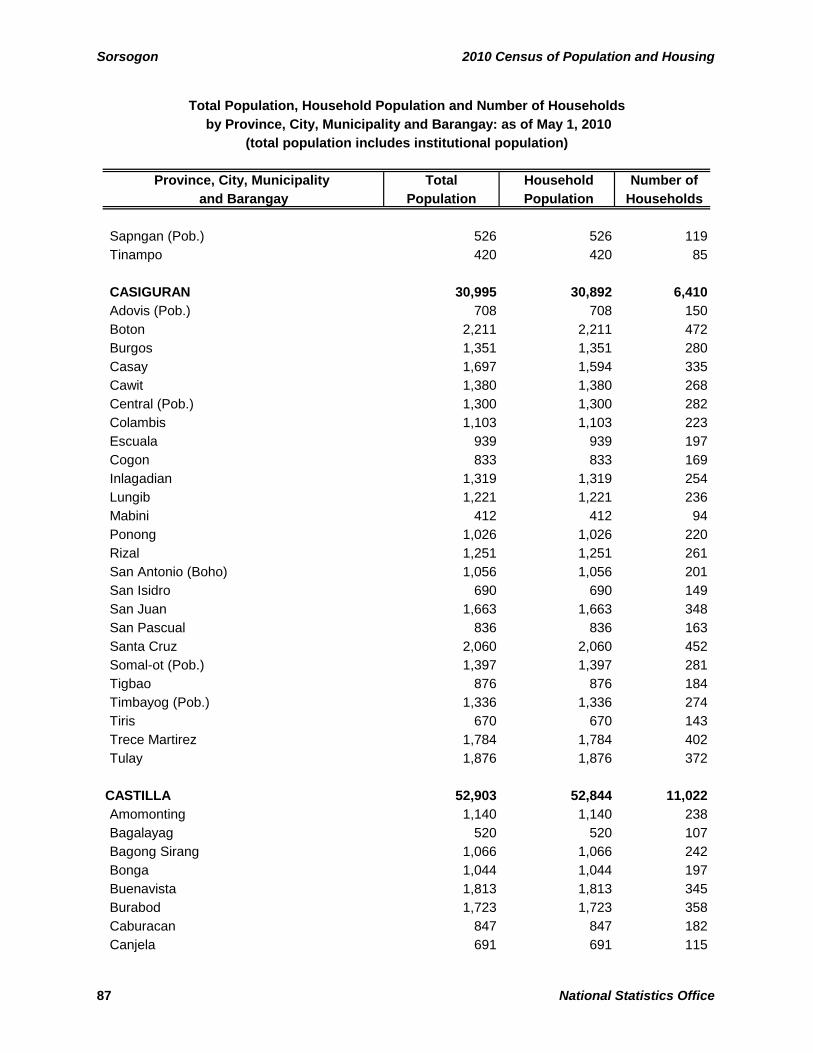
Sorsogon 2010 Census of Population and Housing
Province, City, Municipality Total Household Number of and Barangay Population Population Households
Total Population, Household Population and Number of Households
(total population includes institutional population) by Province, City, Municipality and Barangay: as of May 1, 2010
Sapngan (Pob.) 526 526 119Tinampo 420 420 85
CASIGURAN 30,995 30,892 6,410Adovis (Pob.) 708 708 150Boton 2,211 2,211 472Burgos 1,351 1,351 280Casay 1,697 1,594 335Cawit 1,380 1,380 268Central (Pob.) 1,300 1,300 282Colambis 1,103 1,103 223Escuala 939 939 197Cogon 833 833 169Inlagadian 1,319 1,319 254Lungib 1,221 1,221 236Mabini 412 412 94Ponong 1,026 1,026 220Rizal 1,251 1,251 261San Antonio (Boho) 1,056 1,056 201San Isidro 690 690 149San Juan 1,663 1,663 348San Pascual 836 836 163Santa Cruz 2,060 2,060 452Somal-ot (Pob.) 1,397 1,397 281Tigbao 876 876 184Timbayog (Pob.) 1,336 1,336 274Tiris 670 670 143Trece Martirez 1,784 1,784 402Tulay 1,876 1,876 372
CASTILLA 52,903 52,844 11,022Amomonting 1,140 1,140 238Bagalayag 520 520 107Bagong Sirang 1,066 1,066 242Bonga 1,044 1,044 197Buenavista 1,813 1,813 345Burabod 1,723 1,723 358Caburacan 847 847 182Canjela 691 691 115
87 National Statistics Office

2010 Census of Population and Housing Sorsogon
Province, City, Municipality Total Household Number of and Barangay Population Population Households
Total Population, Household Population and Number of Households
(total population includes institutional population) by Province, City, Municipality and Barangay: as of May 1, 2010
Cogon 1,042 1,042 205 Cumadcad 6,010 6,010 1,276Dangcalan 391 391 94Dinapa 2,393 2,393 530La Union 1,183 1,172 248Libtong 977 977 204Loreto 1,040 1,040 209Macalaya 3,751 3,736 766Maracabac 776 776 166Mayon 2,288 2,288 481Milagrosa 1,491 1,491 307Miluya 1,132 1,132 222Maypangi 622 622 129Monte Carmelo 912 912 188Oras 1,893 1,893 391Pandan 1,730 1,716 364Poblacion 2,815 2,796 623Quirapi 1,598 1,598 325Saclayan 561 561 110Salvacion 530 530 113San Isidro 3,829 3,829 771San Rafael 1,609 1,609 352San Roque 542 542 127
San Vicente 2,281 2,281 501Sogoy 1,590 1,590 327Tomalaytay 1,073 1,073 209
DONSOL 47,563 47,563 9,397Alin 618 618 126Awai 739 739 147Banban 809 809 170Bandi 315 315 71Banuang Gurang 1,007 1,007 211Baras 351 351 75Bayawas 526 526 116Bororan Barangay 1 (Pob.) 1,055 1,055 200Cabugao 747 747 150Central Barangay 2 (Pob.) 497 497 104Cristo 367 367 72
National Statistics Office 88
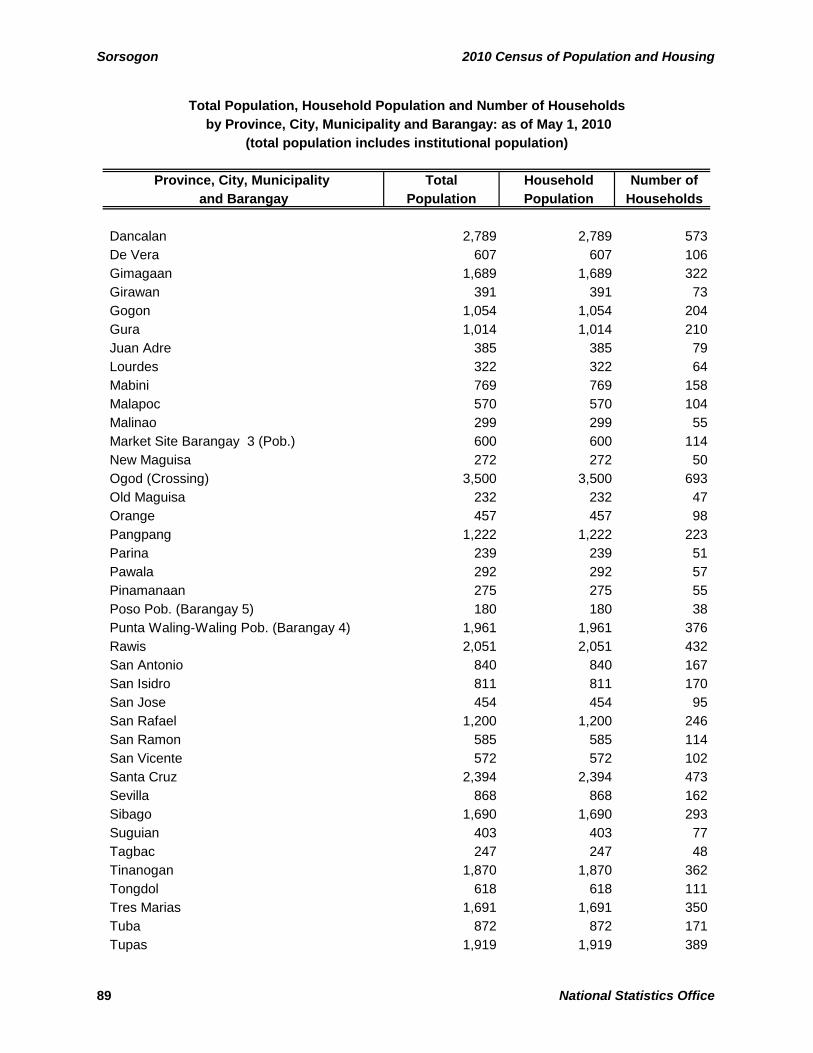
Sorsogon 2010 Census of Population and Housing
Province, City, Municipality Total Household Number of and Barangay Population Population Households
Total Population, Household Population and Number of Households
(total population includes institutional population) by Province, City, Municipality and Barangay: as of May 1, 2010
Dancalan 2,789 2,789 573De Vera 607 607 106Gimagaan 1,689 1,689 322Girawan 391 391 73Gogon 1,054 1,054 204Gura 1,014 1,014 210Juan Adre 385 385 79Lourdes 322 322 64Mabini 769 769 158Malapoc 570 570 104Malinao 299 299 55Market Site Barangay 3 (Pob.) 600 600 114New Maguisa 272 272 50Ogod (Crossing) 3,500 3,500 693Old Maguisa 232 232 47Orange 457 457 98Pangpang 1,222 1,222 223Parina 239 239 51Pawala 292 292 57Pinamanaan 275 275 55Poso Pob. (Barangay 5) 180 180 38Punta Waling-Waling Pob. (Barangay 4) 1,961 1,961 376Rawis 2,051 2,051 432San Antonio 840 840 167San Isidro 811 811 170San Jose 454 454 95San Rafael 1,200 1,200 246San Ramon 585 585 114San Vicente 572 572 102Santa Cruz 2,394 2,394 473Sevilla 868 868 162Sibago 1,690 1,690 293Suguian 403 403 77Tagbac 247 247 48Tinanogan 1,870 1,870 362Tongdol 618 618 111Tres Marias 1,691 1,691 350Tuba 872 872 171Tupas 1,919 1,919 389
89 National Statistics Office
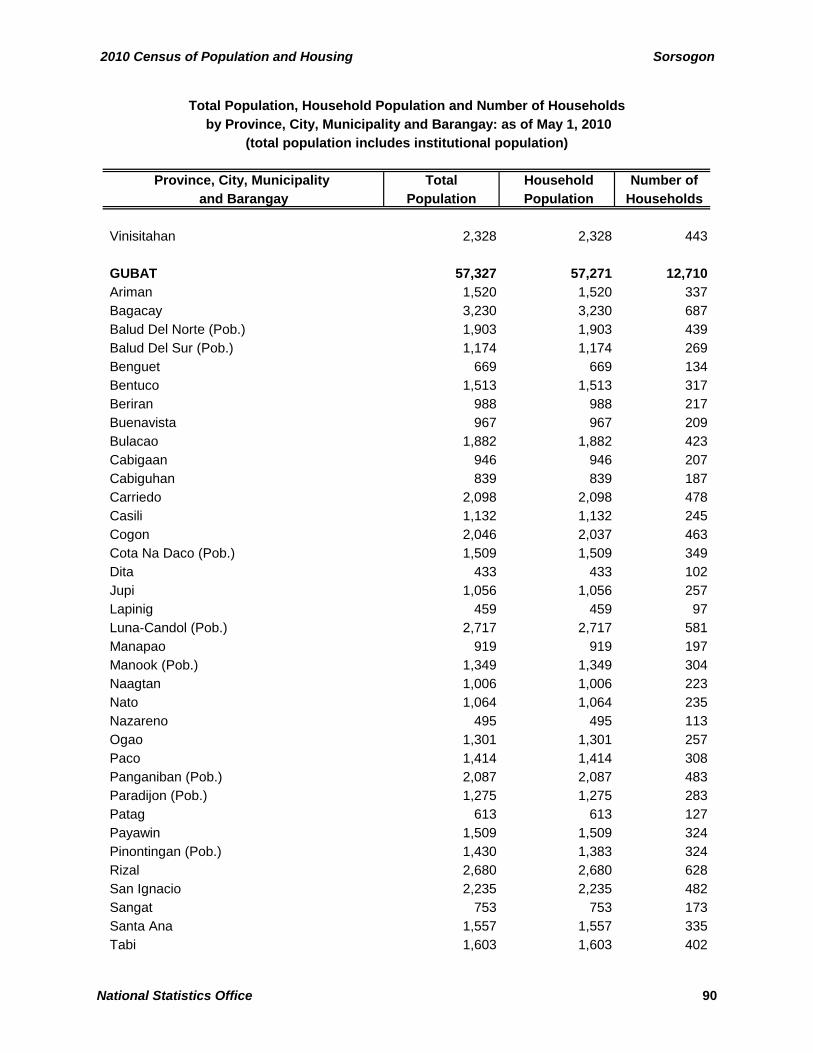
2010 Census of Population and Housing Sorsogon
Province, City, Municipality Total Household Number of and Barangay Population Population Households
Total Population, Household Population and Number of Households
(total population includes institutional population) by Province, City, Municipality and Barangay: as of May 1, 2010
Vinisitahan 2,328 2,328 443
GUBAT 57,327 57,271 12,710Ariman 1,520 1,520 337Bagacay 3,230 3,230 687Balud Del Norte (Pob.) 1,903 1,903 439Balud Del Sur (Pob.) 1,174 1,174 269Benguet 669 669 134Bentuco 1,513 1,513 317Beriran 988 988 217Buenavista 967 967 209Bulacao 1,882 1,882 423Cabigaan 946 946 207Cabiguhan 839 839 187Carriedo 2,098 2,098 478Casili 1,132 1,132 245Cogon 2,046 2,037 463Cota Na Daco (Pob.) 1,509 1,509 349Dita 433 433 102Jupi 1,056 1,056 257Lapinig 459 459 97Luna-Candol (Pob.) 2,717 2,717 581Manapao 919 919 197Manook (Pob.) 1,349 1,349 304Naagtan 1,006 1,006 223Nato 1,064 1,064 235Nazareno 495 495 113Ogao 1,301 1,301 257Paco 1,414 1,414 308Panganiban (Pob.) 2,087 2,087 483Paradijon (Pob.) 1,275 1,275 283Patag 613 613 127Payawin 1,509 1,509 324Pinontingan (Pob.) 1,430 1,383 324Rizal 2,680 2,680 628San Ignacio 2,235 2,235 482Sangat 753 753 173Santa Ana 1,557 1,557 335Tabi 1,603 1,603 402
National Statistics Office 90
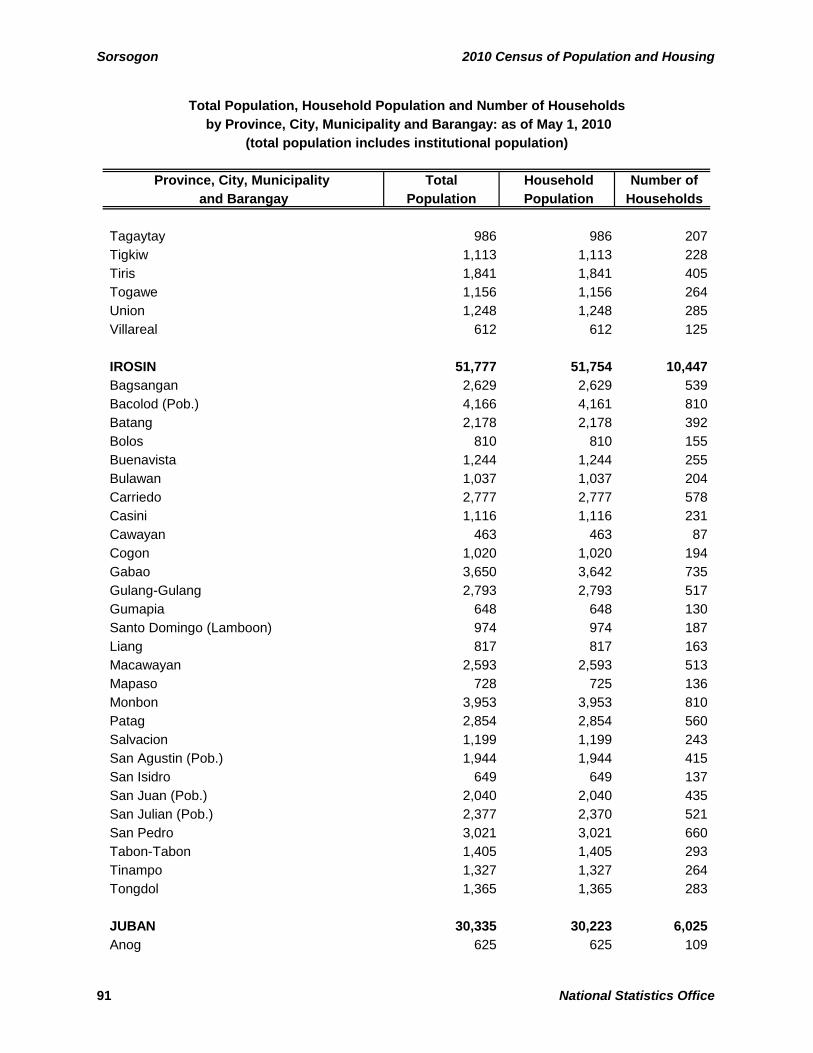
Sorsogon 2010 Census of Population and Housing
Province, City, Municipality Total Household Number of and Barangay Population Population Households
Total Population, Household Population and Number of Households
(total population includes institutional population) by Province, City, Municipality and Barangay: as of May 1, 2010
Tagaytay 986 986 207Tigkiw 1,113 1,113 228Tiris 1,841 1,841 405Togawe 1,156 1,156 264Union 1,248 1,248 285Villareal 612 612 125
IROSIN 51,777 51,754 10,447Bagsangan 2,629 2,629 539Bacolod (Pob.) 4,166 4,161 810Batang 2,178 2,178 392Bolos 810 810 155Buenavista 1,244 1,244 255Bulawan 1,037 1,037 204Carriedo 2,777 2,777 578Casini 1,116 1,116 231Cawayan 463 463 87Cogon 1,020 1,020 194Gabao 3,650 3,642 735Gulang-Gulang 2,793 2,793 517Gumapia 648 648 130Santo Domingo (Lamboon) 974 974 187Liang 817 817 163Macawayan 2,593 2,593 513Mapaso 728 725 136Monbon 3,953 3,953 810Patag 2,854 2,854 560Salvacion 1,199 1,199 243San Agustin (Pob.) 1,944 1,944 415San Isidro 649 649 137San Juan (Pob.) 2,040 2,040 435San Julian (Pob.) 2,377 2,370 521San Pedro 3,021 3,021 660Tabon-Tabon 1,405 1,405 293Tinampo 1,327 1,327 264Tongdol 1,365 1,365 283
JUBAN 30,335 30,223 6,025Anog 625 625 109
91 National Statistics Office
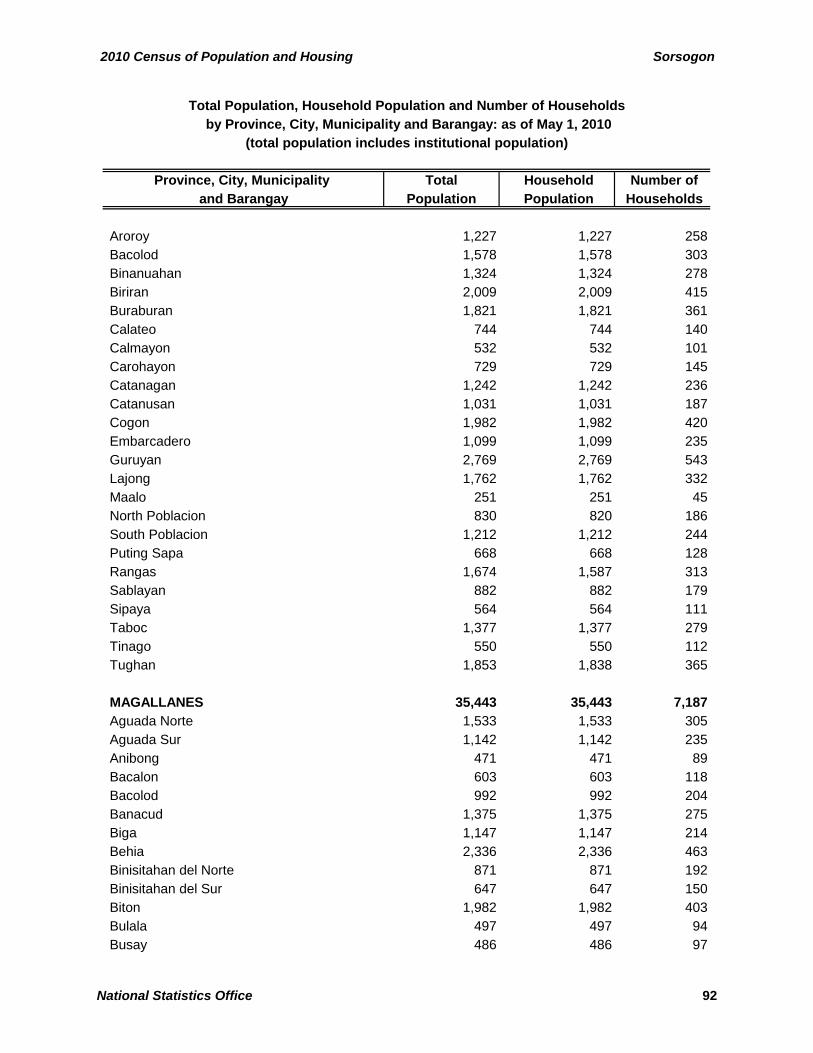
2010 Census of Population and Housing Sorsogon
Province, City, Municipality Total Household Number of and Barangay Population Population Households
Total Population, Household Population and Number of Households
(total population includes institutional population) by Province, City, Municipality and Barangay: as of May 1, 2010
Aroroy 1,227 1,227 258Bacolod 1,578 1,578 303Binanuahan 1,324 1,324 278Biriran 2,009 2,009 415Buraburan 1,821 1,821 361Calateo 744 744 140Calmayon 532 532 101Carohayon 729 729 145Catanagan 1,242 1,242 236Catanusan 1,031 1,031 187Cogon 1,982 1,982 420Embarcadero 1,099 1,099 235Guruyan 2,769 2,769 543Lajong 1,762 1,762 332Maalo 251 251 45North Poblacion 830 820 186South Poblacion 1,212 1,212 244Puting Sapa 668 668 128Rangas 1,674 1,587 313Sablayan 882 882 179Sipaya 564 564 111Taboc 1,377 1,377 279Tinago 550 550 112Tughan 1,853 1,838 365
MAGALLANES 35,443 35,443 7,187Aguada Norte 1,533 1,533 305Aguada Sur 1,142 1,142 235Anibong 471 471 89Bacalon 603 603 118Bacolod 992 992 204Banacud 1,375 1,375 275Biga 1,147 1,147 214Behia 2,336 2,336 463Binisitahan del Norte 871 871 192Binisitahan del Sur 647 647 150Biton 1,982 1,982 403Bulala 497 497 94Busay 486 486 97
National Statistics Office 92

Sorsogon 2010 Census of Population and Housing
Province, City, Municipality Total Household Number of and Barangay Population Population Households
Total Population, Household Population and Number of Households
(total population includes institutional population) by Province, City, Municipality and Barangay: as of May 1, 2010
Caditaan 3,157 3,157 652Cagbolo 1,047 1,047 224Cagtalaba 539 539 105Cawit Extension 1,591 1,591 332Cawit Proper 1,051 1,051 223Ginangra 715 715 141Hubo 802 802 152Incarizan 1,360 1,360 254Lapinig 692 692 137Magsaysay 239 239 43Malbog 382 382 75Pantalan 1,249 1,249 256Pawik 660 660 139Pili 1,302 1,302 268Poblacion 617 617 137Salvacion 1,041 1,041 228Santa Elena 1,073 1,073 195Siuton 1,828 1,828 380Tagas 511 511 111Tulatula Norte 860 860 166Tulatula Sur 645 645 130
MATNOG 37,641 37,624 7,481Balocawe 955 955 202Banogao 491 491 96Banuangdaan 537 537 116Bariis 1,096 1,096 228Bolo 1,248 1,248 249Bon-Ot Big 1,425 1,425 290Bon-Ot Small 412 412 75Cabagahan 413 413 79Calayuan 548 548 103Calintaan 1,211 1,211 237Caloocan (Pob.) 1,281 1,281 250Calpi 207 207 36Camachiles (Pob.) 1,550 1,550 310Camcaman (Pob.) 1,088 1,071 206Coron-coron 1,450 1,450 330Culasi 1,756 1,756 341
93 National Statistics Office

2010 Census of Population and Housing Sorsogon
Province, City, Municipality Total Household Number of and Barangay Population Population Households
Total Population, Household Population and Number of Households
(total population includes institutional population) by Province, City, Municipality and Barangay: as of May 1, 2010
Gadgaron 1,934 1,934 389Genablan Occidental 579 579 112Genablan Oriental 883 883 187
Hidhid 1,151 1,151 193Laboy 840 840 164Lajong 576 576 135Mambajog 627 627 139
Manjunlad 984 984 206Manurabi 770 770 161Naburacan 386 386 74Paghuliran 563 563 119Pangi 614 614 118Pawa 1,280 1,280 260Poropandan 762 762 133Santa Isabel 814 814 149Sinalmacan 473 473 87Sinang-Atan 360 360 71Sinibaran 906 906 164Sisigon 1,253 1,253 236Sua 1,451 1,451 298Sulangan 744 744 160Tablac (Pob.) 1,497 1,497 292Tabunan (Pob.) 1,703 1,703 329Tugas 823 823 157
PILAR 68,245 68,094 13,727Abas 1,045 1,045 214Abucay 2,864 2,864 552Bantayan 1,795 1,795 347Banuyo (Pob.) 3,378 3,378 666Bayasong 1,693 1,616 320Bayawas 246 246 47Binanuahan (Pob.) 1,777 1,777 344Cabiguan 2,015 2,015 429Cagdongon 947 947 189Calongay 1,968 1,968 384Calpi 631 631 138Catamlangan 1,106 1,106 262Comapo-capo 881 881 173
National Statistics Office 94

Sorsogon 2010 Census of Population and Housing
Province, City, Municipality Total Household Number of and Barangay Population Population Households
Total Population, Household Population and Number of Households
(total population includes institutional population) by Province, City, Municipality and Barangay: as of May 1, 2010
Danlog 963 963 196Dao (Pob.) 2,252 2,252 458Dapdap 1,531 1,531 301Del Rosario (Bual) 2,459 2,459 499Esmerada 410 410 84Esperanza 1,572 1,532 306Guiron 644 644 161Ginablan 1,829 1,829 353Inang 1,678 1,678 339Inapugan 2,494 2,494 433Lubiano 694 694 138Leona 374 374 67Lipason 968 968 205Lourdes 726 726 140Lungib 1,895 1,895 347Lumbang 1,357 1,357 280Mabanate 1,514 1,514 331Malbog 804 804 170Marifosque (Pob.) 1,955 1,955 421Mercedes 839 839 167Migabod 420 420 91Naspi 784 784 172Palanas 932 918 191Pangpang 1,032 1,032 214Pinagsalog 502 502 90Pineda 910 910 186Poctol 1,106 1,106 211Pudo 288 288 63Putiao 2,336 2,316 443Sacnangan 1,028 1,028 205Salvacion 2,194 2,194 457San Antonio (Millabas) 832 832 169San Antonio (Sapa) 2,574 2,574 542San Jose 1,328 1,328 247San Rafael 3,024 3,024 583Santa Fe 1,651 1,651 402
PRIETO DIAZ 20,478 20,473 4,219Brillante (Pob.) 624 624 128
95 National Statistics Office

2010 Census of Population and Housing Sorsogon
Province, City, Municipality Total Household Number of and Barangay Population Population Households
Total Population, Household Population and Number of Households
(total population includes institutional population) by Province, City, Municipality and Barangay: as of May 1, 2010
Bulawan 837 837 177Calao 1,786 1,786 368Carayat 810 810 159Diamante 1,581 1,581 319Gogon 1,585 1,585 337Lupi 726 726 157Manlabong 793 793 155Maningcay De Oro 1,234 1,234 271Perlas 405 400 80Quidolog 842 842 186Rizal 863 863 190San Antonio 481 481 97San Fernando 1,482 1,482 288San Isidro 1,212 1,212 256San Juan 687 687 136San Rafael 655 655 117San Ramon 452 452 94Santa Lourdes 959 959 186Santo Domingo 285 285 57Talisayan 781 781 148Tupaz 409 409 130Ulag 989 989 183
SANTA MAGDALENA 16,520 16,516 3,417La Esperanza 473 473 106Peñafrancia 825 825 166Barangay Poblacion I 1,095 1,095 253Barangay Poblacion II 553 553 143Barangay Poblacion III 907 907 200Barangay Poblacion IV 1,222 1,222 259Salvacion 1,413 1,413 292San Antonio 1,412 1,412 260San Bartolome (Talaongan) 2,970 2,970 618San Eugenio 931 931 191San Isidro 1,481 1,477 289San Rafael 1,253 1,253 234San Roque 1,097 1,097 242San Sebastian 888 888 164
National Statistics Office 96
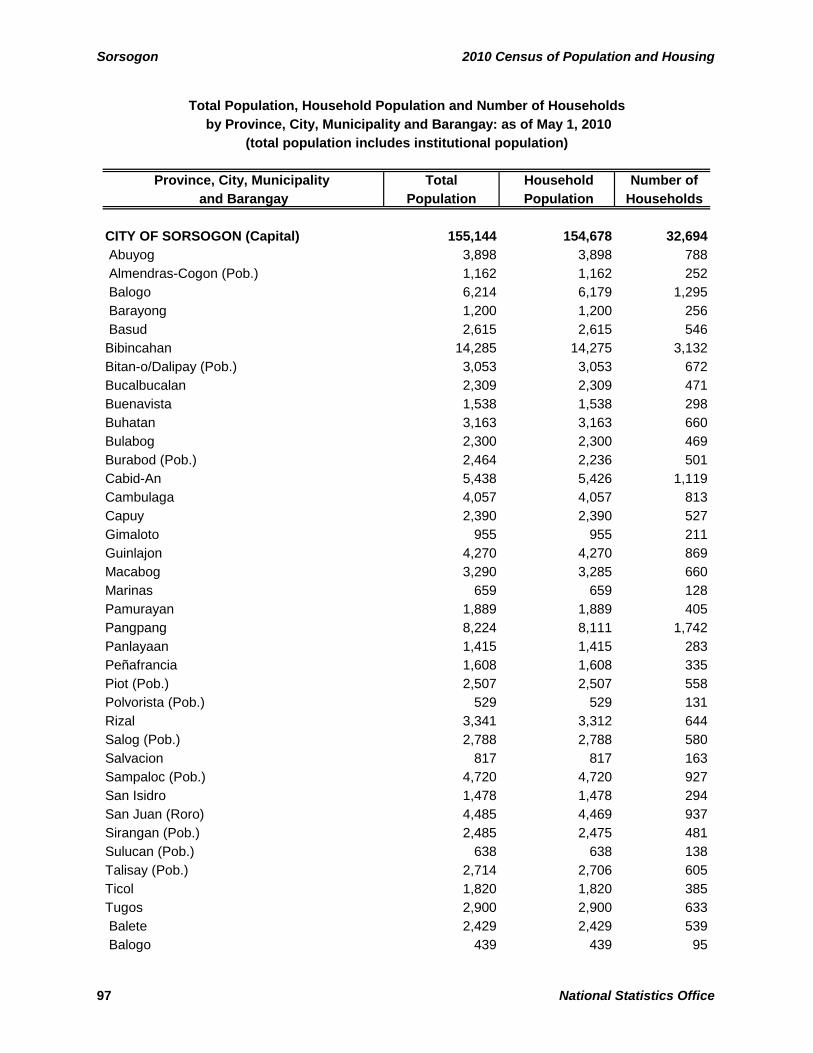
Sorsogon 2010 Census of Population and Housing
Province, City, Municipality Total Household Number of and Barangay Population Population Households
Total Population, Household Population and Number of Households
(total population includes institutional population) by Province, City, Municipality and Barangay: as of May 1, 2010
CITY OF SORSOGON (Capital) 155,144 154,678 32,694 Abuyog 3,898 3,898 788 Almendras-Cogon (Pob.) 1,162 1,162 252 Balogo 6,214 6,179 1,295 Barayong 1,200 1,200 256 Basud 2,615 2,615 546Bibincahan 14,285 14,275 3,132Bitan-o/Dalipay (Pob.) 3,053 3,053 672Bucalbucalan 2,309 2,309 471Buenavista 1,538 1,538 298Buhatan 3,163 3,163 660Bulabog 2,300 2,300 469Burabod (Pob.) 2,464 2,236 501Cabid-An 5,438 5,426 1,119Cambulaga 4,057 4,057 813Capuy 2,390 2,390 527Gimaloto 955 955 211Guinlajon 4,270 4,270 869Macabog 3,290 3,285 660Marinas 659 659 128Pamurayan 1,889 1,889 405Pangpang 8,224 8,111 1,742Panlayaan 1,415 1,415 283Peñafrancia 1,608 1,608 335Piot (Pob.) 2,507 2,507 558Polvorista (Pob.) 529 529 131Rizal 3,341 3,312 644Salog (Pob.) 2,788 2,788 580Salvacion 817 817 163Sampaloc (Pob.) 4,720 4,720 927San Isidro 1,478 1,478 294San Juan (Roro) 4,485 4,469 937Sirangan (Pob.) 2,485 2,475 481Sulucan (Pob.) 638 638 138Talisay (Pob.) 2,714 2,706 605Ticol 1,820 1,820 385Tugos 2,900 2,900 633 Balete 2,429 2,429 539 Balogo 439 439 95
97 National Statistics Office
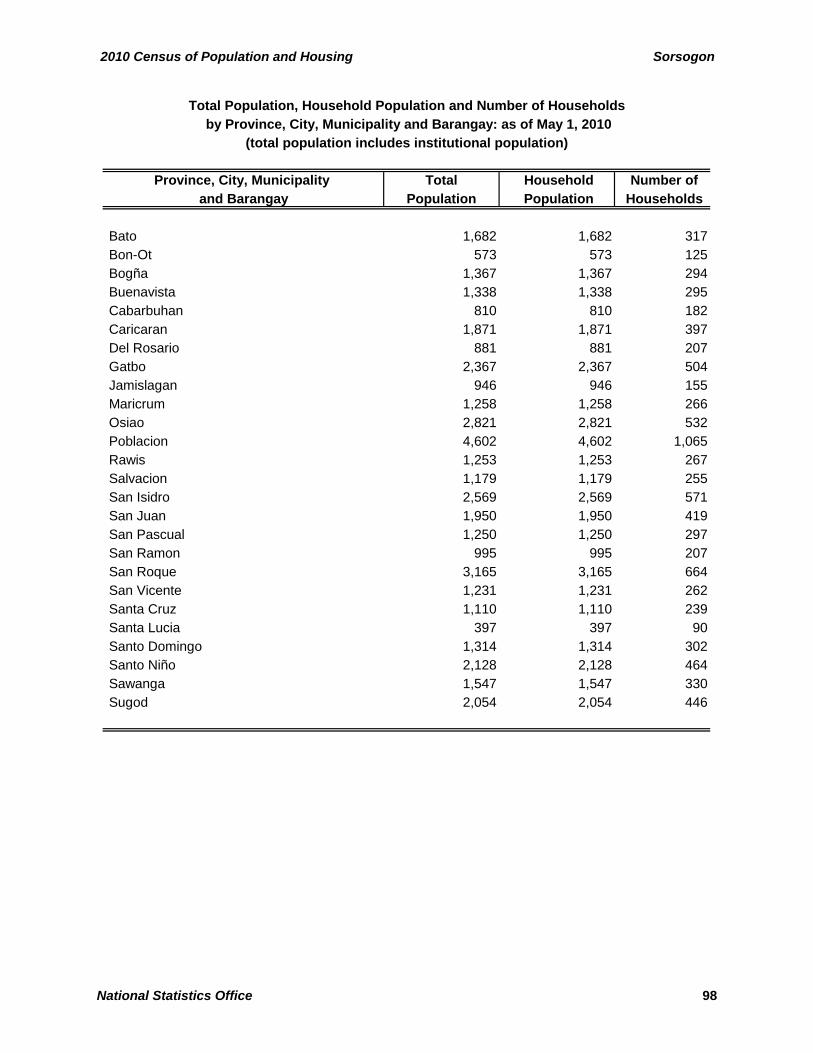
2010 Census of Population and Housing Sorsogon
Province, City, Municipality Total Household Number of and Barangay Population Population Households
Total Population, Household Population and Number of Households
(total population includes institutional population) by Province, City, Municipality and Barangay: as of May 1, 2010
Bato 1,682 1,682 317 Bon-Ot 573 573 125 Bogña 1,367 1,367 294 Buenavista 1,338 1,338 295 Cabarbuhan 810 810 182 Caricaran 1,871 1,871 397 Del Rosario 881 881 207 Gatbo 2,367 2,367 504 Jamislagan 946 946 155 Maricrum 1,258 1,258 266 Osiao 2,821 2,821 532 Poblacion 4,602 4,602 1,065 Rawis 1,253 1,253 267 Salvacion 1,179 1,179 255 San Isidro 2,569 2,569 571 San Juan 1,950 1,950 419 San Pascual 1,250 1,250 297 San Ramon 995 995 207 San Roque 3,165 3,165 664 San Vicente 1,231 1,231 262 Santa Cruz 1,110 1,110 239 Santa Lucia 397 397 90 Santo Domingo 1,314 1,314 302 Santo Niño 2,128 2,128 464 Sawanga 1,547 1,547 330 Sugod 2,054 2,054 446
National Statistics Office 98

APPENDICES
2010 Census of Population and Housing Appendix A
National Statistics Office 101
COMMONWEALTH ACT NO. 591
AN ACT CREATING A BUREAU OF THE CENSUS AND STATISTICS TO CONSOLIDATE STATISTICAL ACTIVITIES OF THE GOVERNMENT THEREIN
Be it enacted by the National Assembly of the Philippines: SECTION 1. Bureau of the Census and Statistics is created.
SECTION 2. The powers, functions, and duties of the Bureau of the Census and Statistics shall be as follows:
(a) To collect by enumeration, sampling or other methods, statistics and other
information concerning population, agricultural conditions, the area and production of crops, the number of livestock, the production of livestock products, exports, imports, commerce, industrial and commercial enterprises, prices, employment, wages, stock of commodities, agricultural and other properties, social and economic institutions, and such other statistics as the President of the Philippines by executive order may direct;
(b) To compile and classify all such statistical data and information and to publish the
same for the use of the Government and the people; (c) To prepare for and undertake all censuses of population, agriculture, industry and
commerce;
(d) To conduct, for statistical purposes, investigations and studies of social and economic problems and conditions;
(e) To compile and classify statistical and other data for other branches and
dependencies of the government, upon the approval of the President of the Philippines;
(f) To carry out and administer the provisions of Act Numbered Thirty-seven Hundred
and Fifty-three, entitled “An Act to Establish a Civil Register”;
(g) To make and publish, from time to time, estimates of population, agricultural production, income and number of livestock.
SECTION 3. The collection of data and information prescribed in section two may be
secure by the mailing or delivery of the necessary questionnaire or form and explanatory matter to the persons best qualified to furnish such data or information and in which case, the proprietor, official, government official or employee, partner, director or legal representative to whom such questionnaire or form is mailed or delivered, shall be required to accomplish such questionnire, or form personally or cause the same to be accomplished by his duly authorized agent or representative. Any person who fails or refuses to accomplish, mail or deliver such questionnaire or form received by him to the Bureau of Census and Statistics within thirty days of its receipt by him; or any person who, in accomplishing any such questionnaire or form knowingly
Appendix A 2010 Census of Population and Housing
102 National Statistics Office
gives data or information which shall prove to be materially untrue in any particular; or any person who signs such questionnaire or form after it has been accomplished in the knowledge that it is untrue in any particular shall, upon conviction, be punished by a fine of not more than six hundred pesos or by imprisonment for not more than six months, or by both.
SECTION 4. Data furnished the Bureau of the Census and Statistics by an individual,
corporation, partnership, institution or business enterprise shall not be used as evidence in any court or any public office either as evidence for or against the individual, corporation, association, partnership, institutions; or business enterprise from who such data emanate; nor shall such data or information be divulged to any person except authorized employees of the Bureau of the Census and Statistics, acting in the performance of their duties; nor shall such data be published except in the form of summaries or statistical tables in which no reference to an individual, corporation, association, partnership, institution or business enterprise shall appear. Any person violating the provisions of this section shall, upon conviction, be punished by a fine of not more than six hundred pesos or by imprisonment for not more than six months, or both.
SECTION 5. The Bureau of the Census and Statistics shall be under the executive
direction and supervision of the President of the Philippines. Such personnel as may be necessary for the proper and efficient performance of the duties prescribed by this Act shall be appointed by the President of the Philippines, upon recommendation of the Director of the Bureau of the Census and Statistics, at such rates of salaries as may be fixed in accordance with Commonwealth Act Number Four Hundred and Two, entitled “An Act to Provide for Classification of Civilian Positions and Standardization of Salaries in the Government”.
At anytime after its organization, the President of the Philippines is
authorized to place the Bureau of the Census and Statistics under the direct supervision and control of any of the executive department.
SECTION 6. The Bureau of the Census and Statistics shall have one chief and one
assistant chief, who shall be known respectively, as the Director and Assistant Director of the Bureau of the Census and Statistics. The Director of the Bureau of the Census and Statistics shall receive the same compensation as that received by the directors of bureaus mentioned in sub-paragraph (4), sub-section (a) of section five of Commonwealth Act Number Four Hundred and Two, and the Assistant Director of the Bureau of the Census and Statistics, the same compensation as that received by assistant directors of bureaus mentioned in sub-paragraph (5) of said sub-section (a) of section five of the same Act. The Director and Assistant Director of the Bureau of the Census and Statistics, shall be appointed by the President of the Philippines, with the consent of the Commission on appointments of the National Assembly.
2010 Census of Population and Housing Appendix A
National Statistics Office 103
SECTION 7. The powers, functions, and duties of the Division of Statistics of the Department of Agriculture and Commerce, those of the Director of the National Library under the provision of Act Number Thirty-seven Hundred Fifty-three, and those of the Statistics Division of the Bureau of Customs, are transferred to the Bureau of the Census and Statistics.
SECTION 8. The President of the Philippines is authorized to transfer personnel,
equipment, unexpended appropriations, if any, records, documents, supplies and other property from the Commission of the Census created by Commonwealth Act Number One Hundred and Seventy to the Bureau of Census and Statistics, upon or prior to the completion of the census taken pursuant to the provisions of Commonwealth Act Number One Hundred and Seventy.
SECTION 9. The President of the Philippines is authorized until June Thirty,
Nineteen Hundred and Forty-one, the provisions of existing laws to the contrary notwithstanding, to transfer by executive order the functions, appropriations, equipment, property, records, and personnel of any bureau, office or part thereof, engaged in the collection, compilation, and publication of statistics from the different executive departments, bureaus and offices to the Bureau of Census and Statistics, when in his judgement, greater economy, efficiency and accuracy in the collection, compilation, and publication of statistics can be accomplished thereby.
Any action taken by the President pursuant to this authority shall be
reported by him to the National Assembly at the next regular session thereof and shall be valid and subsisting until the National Assembly shall provide otherwise.
SECTION 10. This Act shall take effect upon its approval. Approved, August 19, 1940.
Appendix B 2010 Census of Population and Housing
104 National Statistics Office
BATAS PAMBANSA BLG. 72
AN ACT PROVIDING FOR THE TAKING OF AN INTEGRATED CENSUS EVERY TEN YEARS BEGINNING IN THE YEAR NINETEEN HUNDRED
AND EIGHTY AND FOR OTHER PURPOSES Be it enacted by the Batasang Pambansa in session assembled:
SECTION 1. A national census of population and other related data shall be taken every decade beginning in 1980, in accordance with plans prepared by the National Census and Statistics Office, without prejudice to the undertaking of special censuses on agriculture, industry, commerce, housing and other sectors as may be approved by the National Economic and Development Authority.
SECTION 2. There is hereby created the National Census Coordinating Board to be
composed of the Minister of Economic Planning, as Chairman, the Minister of Human Settlements, the Minister of Budget, the Minister of the Justice, the Minister of National Defense, the Minister of Labor, the Minister of Finance, the Minister of Education and Culture, the Minister of Public Works, the Minister of Transportation and Communications, the Minister of Public Highways, the Minister of Agriculture, the Minister of Natural Resources, the Minister of Public Information, and the Minister of Local Government and Community Development, as members, with the Executive Director of the National Census and Statistics Office as Executive Officer of the Board.
The censuses shall be under the supervision and coordination of the National Census Coordinating Board which shall issue such rules and regulations as may be necessary for the successful undertaking and completion of the censuses provided in this Act.
SECTION 3. There shall be established a provincial, city and municipal census board in each province, city and municipality, as the case may be, which shall provide such facilities and assistance as may be required by the National Census Coordinating Board. The boards shall be under the supervision and control of the National Census Coordinating Board.
SECTION 4. The Provincial Census Board shall be composed of the Provincial
Governor, as Chairman, and the Division Superintendent of Schools, or in case the of province with more than one school division, the Division Superintendent designated by the National Census Coordinating Board, as Vice Chairman, the District Highway Engineer, or in the case of provinces which have two or more highway engineering districts, the one that may be designated by the National Census Coordinating Board, the Provincial Commander of the Philippine Constabulary, the Provincial Development Officer, the Provincial Assessor, and the Provincial Agriculturist, as members, with the Provincial Statistics Officer as the Executive Officer.
2010 Census of Population and Housing Appendix B
National Statistics Office 105
The City Census Board shall be composed of the City Mayor, as Chairman, and the City Superintendent of Schools, as Vice Chairman, the City Engineer, the City Development Officer, and the City Assessor, as members, with the City Census Officer as the Executive Officer.
The Municipal Census Board shall be composed of the Municipal
Mayor, as Chairman, and the District Supervisor, the Municipal Agriculturist, the Station Commander, the Municipal Treasurer, and the Municipal Development Officer, as members, with the Municipal Census Officer/Census Supervisor as the Executive Officer.
SECTION 5. The National Census Coordinating Board and the local census board
may call upon any ministry, bureau, office, agency or instrumentality of the Government for any assistance in the performance of their duties.
SECTION 6. The first day of May of every regular census year is hereby designated
as the reference date for the census. The collection of data will be by enumeration and the respondent shall be the head or any responsible member of the household.
SECTION 7. Public school teachers shall be employed for enumeration work and for
such service shall be paid an honorarium as may be determined by the National Census Coordinating Board but in no case not less than two hundred-fifty pesos and shall received service credits equivalent to the number of days rendered in census work. Other government employees whose services are engaged for census work shall be entitled to such allowances as shall be prescribed by the National Census Coordinating Board payable from census funds. The census herein taken at the barangay level shall be certified to by the corresponding barangay captain.
SECTION 8. Before the end of the year 1980 and of every census year thereafter, a
count of the population by province, city, municipality and barangay shall be published by the National Census and Statistics Office. The final population count as determined from the processed census returns shall be considered official for all purposes upon proclamation by the President (Prime Minister).
SECTION 9. Data gathered pursuant to this Act shall not be used as evidence in any
court or public office or for or against any person, except in a criminal case for violation of Section 10 of this Act, nor shall such data be divulged to any person except to authorized employees of the National Census and Statistics Office, acting in the performance of their duties; nor shall such data be published except in the form of summaries or statistical tables in which no reference to an individual shall appear. Any person violating any provision of this Section shall be punished by a fine of not more than five hundred pesos or by imprisonment of not more than six months, or both.
SECTION 10. Any respondent as provided for in Section 6 who unjustifiably refuses to
furnish the information called for in the census questionnaire, or
Appendix B 2010 Census of Population and Housing
106 National Statistics Office
knowingly certifies or gives data or information which shall be prove to be materially untrue in any particular, shall be guilty of an offense under this Act and shall, upon conviction, be punished by a fine of not more than five hundred pesos or by imprisonment of not more than three months, or both.
SECTION 11. The amount necessary for the holding of censuses shall be charged to
the appropriations available for the purpose in the corresponding Appropriate Act.
SECTION 12. This Act shall take effect upon its approval. Approved, June 11, 1980.
2010 Census of Population and Housing Appendix C
National Statistics Office 107
EXECUTIVE ORDER NO. 121
REORGANIZING AND STRENGTHENING THE PHILIPPINE STATISTICAL SYSTEM (PSS)
AND FOR OTHER PURPOSES
RECALLING that the reorganization of the government is mandated expressly in Article II, Section 1 (1), and Article III of the Freedom Constitution;
HAVING IN MIND that, pursuant to Executive Order No. 5 (1986), there is a need to effect the necessary and proper changes in the organizational and functional structures of the government, its agencies and instrumentalities, in order to promote efficiency and effectiveness in the delivery of public services;
BELIEVING that the present Philippine Statistical System is too decentralized, being characterized by a single general-purpose statistical agency, a number of agencies in the production of specialized statistics and other instrumentalities involved in statistical activities either as their primary functions or as part of their administrative or regulatory functions;
REALIZING that the absence of a strong coordinating mechanism has given rise to the problems of duplication of activities, conflicting statistics, data gaps as well as unnecessary burden on respondents;
CONSIDERING that the government needs to rationalize the allocation of resources for the collection of statistics;
TAKING NOTE that the quality of statistical services is affected by the limited number of qualified statistical workers;
CONVINCED that there is a need to maintain a decentralized system characterized by independence, objectivity and integrity to make it more responsive to the requirements of national development;
CONVINCED further that there is also a need for a stronger mechanism to coordinate the decentralized government statistical service in order to promote the orderly development of a system capable of providing timely, accurate and useful data for the government and the public, especially for planning and decision-making;
AFFIRMING that there is a need to ensure the development and maintenance of high-level statistical manpower in the government;
NOW, THEREFORE, I, CORAZON C. AQUINO, President of the Philippines, by virtue of the powers vested in me by the sovereign will of the Filipino People and the Freedom Constitution, do hereby order:
SECTION 1. Title. This Executive Order shall otherwise be known as the Reorganization Act of the Philippine Statistical System.
SECTION 2. Reorganization. The Philippine Statistical System, hereinafter referred to as PSS, is hereby reorganized, structurally and functionally, in accordance with the provisions of this Executive Order.
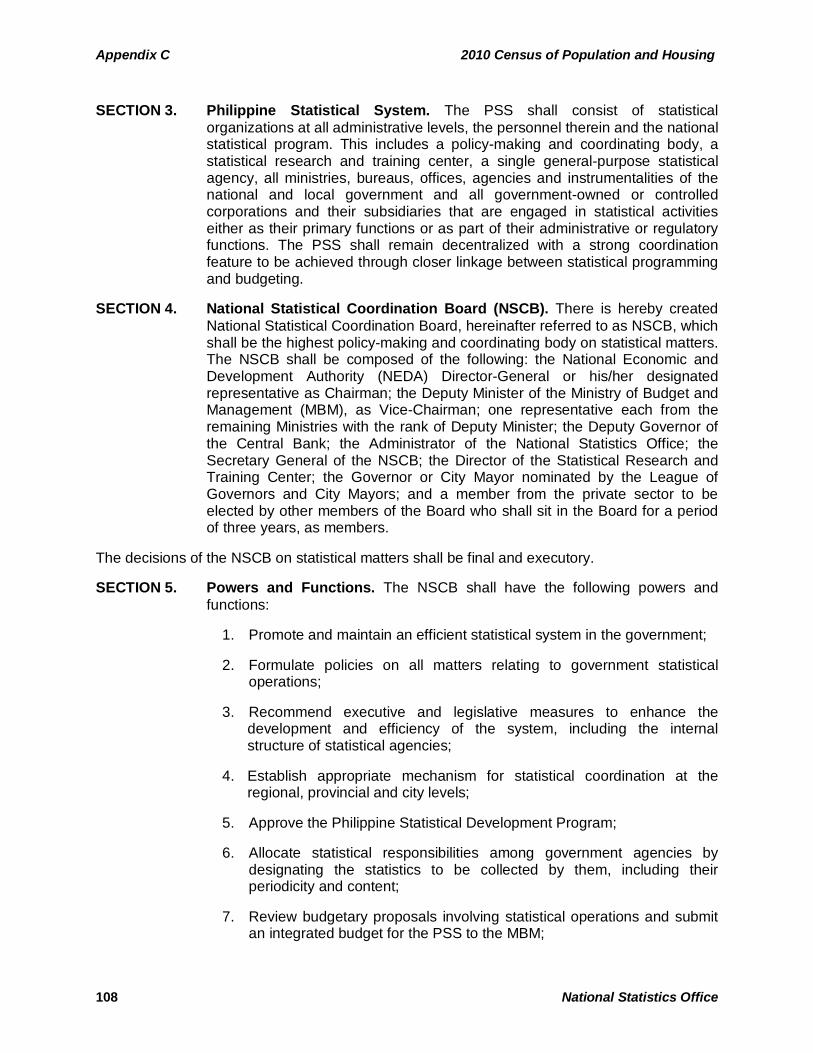
Appendix C 2010 Census of Population and Housing
108 National Statistics Office
SECTION 3. Philippine Statistical System. The PSS shall consist of statistical organizations at all administrative levels, the personnel therein and the national statistical program. This includes a policy-making and coordinating body, a statistical research and training center, a single general-purpose statistical agency, all ministries, bureaus, offices, agencies and instrumentalities of the national and local government and all government-owned or controlled corporations and their subsidiaries that are engaged in statistical activities either as their primary functions or as part of their administrative or regulatory functions. The PSS shall remain decentralized with a strong coordination feature to be achieved through closer linkage between statistical programming and budgeting.
SECTION 4. National Statistical Coordination Board (NSCB). There is hereby created National Statistical Coordination Board, hereinafter referred to as NSCB, which shall be the highest policy-making and coordinating body on statistical matters. The NSCB shall be composed of the following: the National Economic and Development Authority (NEDA) Director-General or his/her designated representative as Chairman; the Deputy Minister of the Ministry of Budget and Management (MBM), as Vice-Chairman; one representative each from the remaining Ministries with the rank of Deputy Minister; the Deputy Governor of the Central Bank; the Administrator of the National Statistics Office; the Secretary General of the NSCB; the Director of the Statistical Research and Training Center; the Governor or City Mayor nominated by the League of Governors and City Mayors; and a member from the private sector to be elected by other members of the Board who shall sit in the Board for a period of three years, as members.
The decisions of the NSCB on statistical matters shall be final and executory.
SECTION 5. Powers and Functions. The NSCB shall have the following powers and functions:
1. Promote and maintain an efficient statistical system in the government;
2. Formulate policies on all matters relating to government statistical operations;
3. Recommend executive and legislative measures to enhance the development and efficiency of the system, including the internal structure of statistical agencies;
4. Establish appropriate mechanism for statistical coordination at the regional, provincial and city levels;
5. Approve the Philippine Statistical Development Program;
6. Allocate statistical responsibilities among government agencies by designating the statistics to be collected by them, including their periodicity and content;
7. Review budgetary proposals involving statistical operations and submit an integrated budget for the PSS to the MBM;
2010 Census of Population and Housing Appendix C
National Statistics Office 109
8. Review and clear, prior to release, all funds for statistical operations;
9. Develop, prescribe, and maintain appropriate framework for the improvement of statistical coordination;
10. Prescribe uniform standards and classification systems in government statistics;
The NSCB shall not engage directly in any basic data collection activity.
SECTION 6. NSCB Technical Staff. The NSCB shall have a Technical Staff which shall perform the following functions:
1. Provide technical and secretarial support to the NSCB;
2. Serve as the statistical clearing house and liaison for international statistical matters;
3. Perform other functions as may be assigned by the NSCB and as may be necessary to carry out the purposes of this Executive Order.
SECTION 7. Secretary General. The NSCB Technical Staff shall be headed by a Secretary General with the rank of Deputy Minister, who shall be appointed by the President, and is of proven competence and recognized stature in the statistical profession.
SECTION 8. Inter-Agency Committee on Statistics. The NSCB may create inter-agency committees (IAC) to assist it in the exercise of its functions.
SECTION 9. The National Statistics Office. The National Census and Statistics Office is hereby renamed the National Statistics Office (NSO). It shall be the major statistical agency responsible for generating general purpose statistics and undertaking such censuses and surveys as may be designated by the NSCB.
The NSO shall be headed by an Administrator with the rank of Deputy Minister, who shall be appointed by the President, and is of recognized stature and proven competence in the field of statistics.
SECTION 10. The Statistical Research and Training Center. There is hereby created a Statistical Research and Training Center, hereinafter referred to as SRTC, which shall have the following functions:
1. Develop a comprehensive and integrated research and training program on the theories, concepts and methodologies for the promotion of the statistical system;
2. Undertake research on statistical concepts, definitions and methods;
3. Promote collaborative research efforts among members of the academic community, data producers and users;
4. Conduct non-degree training programs to upgrade the quality of statistical personnel and expand the statistical manpower base in
Appendix C 2010 Census of Population and Housing
110 National Statistics Office
support of the needs of the statistical system;
5. Provide financial and other forms of assistance to enhance statistical research and development.
SECTION 11. SRTC Governing Board. The SRTC shall have a Governing Board that shall formulate policies for its management and operations. The Secretary General of the NSCB shall be the Chairman of the SRTC Governing Board, with the following as members: Administrator of the National Statistics Office; Director of the Bureau of Agricultural Statistics; Dean of the University of the Philippines Statistical Center; Executive Director of the Philippine Social Science Council; a representative of the NEDA and the Director of the SRTC as ex-officio member.
SECTION 12. SRTC Executive Director. The SRTC shall have an Executive Director who shall be appointed by the SRTC Governing Board. He shall receive such salary and remuneration as may be determined by the SRTC Governing Board.
SECTION 13. SRTC Endowment Fund. There is hereby established an SRTC Endowment Fund which shall consist of contributions, donations, bequests, grants and loans from domestic and/or foreign sources, government appropriations and other incomes accruing from the operations of SRTC, which Fund is to finance the carrying out of Subsection (a) to (e) of the preceding Section 10. There is hereby appropriated out of any fund in the National Treasury or other sources not otherwise appropriated the sum of SEVEN MILLION PESOS (P7,000,000.00) as the initial contribution of the government to the Endowment Fund.
SECTION 14. SRTC Initial Operating Fund. There is hereby appropriated and programmed for immediate release out of any unappropriated balances in the National Treasury or other sources the amount of THREE MILLION PESOS (P3,000,000.00) as the initial operating fund of the SRTC.
SECTION 15. Other Statistical Agencies. Unless otherwise provided for in this Executive Order or modified by the NSCB pursuant to its herein authority, all offices, agencies and instrumentalities of the government including government-owned or controlled corporations and their subsidiaries engaged in the production of specialized statistics or otherwise involved in statistical activities either as their primary function or as part of their administrative or regulatory functions, shall continue to discharge such statistical functions in accordance with the provisions of existing laws, rules and regulations.
SECTION 16. Designated Statistics. The NSCB shall designate statistics that should be collected, compiled, processed and disseminated by agencies in accordance with the statistical calendar approved by the NSCB. It shall promulgate and implement the rules and regulations concerning designated statistics and shall periodically review the list of designated statistics as may be required appropriate.
SECTION 17. Access to Data of Government Agencies. Subject to existing laws, rules and regulations on confidentiality of information, any individual, institution or
2010 Census of Population and Housing Appendix C
National Statistics Office 111
instrumentality shall be given access to unpublished data, provided that the cost incurred is assumed by the requesting party, in accordance with existing laws, rules and regulations.
SECTION 18. Timely Release of Statistics. Agencies conducting statistical inquiries shall be responsible for ensuring the timely release of the results thereof to the general public, in compliance with the statistical calendar approved by the NSCB.
SECTION 19. Statistical Standards. All government agencies shall adopt statistical standards prescribed by the NSCB, including standard concepts and definitions, techniques, procedures and classification systems.
SECTION 20. Funds Programming. The NSCB shall be responsible for the review and prioritization of statistical activities in coordination with appropriate government agencies, given the budgetary ceiling provided by the MBM. The NSCB will also be responsible for determining how the available financial resources will be allocated among the prioritized activities. The MBM shall release the funds in accordance with the priorities set by the NSCB.
SECTION 21. Abolition of Existing Government Bodies. The committee on statistical development created under Letter of Instructions No. 601, the Statistical Advisory Board created under Part VI, Chapter II, Article II of the 1972 Integrated Reorganization Plan, and the Statistical Coordination Office of the National Economic and Development Authority are hereby abolished and their appropriations, records and properties, if any, and such personnel as may be necessary shall be transferred to the NSCB.
SECTION 22. Transitory Provisions. In accomplishing the acts of reorganization herein prescribed, the following transitory provisions shall be complied with, unless otherwise provided elsewhere in this Executive Order:
(a) The transfer of a government unit shall include the functions, appropriations, funds, records, equipment, facilities, choses in action, rights, other assets, and liabilities, if any, of the transferred unit as well as the personnel thereof, as may be necessary, who shall, in a hold-over capacity, continue to perform their respective duties and responsibilities and receive the corresponding salaries and benefits unless in the meantime they are separated from government service pursuant to Executive Order No. 17 (1986) or Article III of the Freedom Constitution. Those personnel of the transferred unit whose positions are not included in the Philippine Statistical System's new position structure and staffing pattern approved and prescribed by the NSCB Chairman or who are not reappointed shall be deemed separated from the service and shall be entitled to the benefits provided in the second paragraph of Section 23 hereof.
(b) The transfer of functions which results in the abolition of the government unit that has exercised them shall include the appropriations, funds, records, equipment, facilities, choses in action, rights, other assets and personnel as may be necessary to the proper discharge of the transferred functions. The abolished unit's remaining appropriations and
Appendix C 2010 Census of Population and Housing
112 National Statistics Office
funds, if any, shall revert to the General Fund and its remaining assets, if any, shall be allocated to such appropriate units as the Minister shall determine or shall otherwise be disposed in accordance with the Government Auditing Code and other pertinent laws, rules and regulations. Its personnel shall, in a hold-over capacity, continue to perform their duties and responsibilities and receive the corresponding salaries and benefits unless in the meantime they are separated from the service pursuant to Executive Order No. 17 (1986) or Article III of the Freedom Constitution. Its personnel, whose positions are not included in the Philippine Statistical System's new position structure and staffing pattern approved and prescribed by the NSCB Chairman under Section 23 hereof or who are not reappointed, shall be deemed separated from the service and shall be entitled to the benefits provided in the second paragraph of the same Section 23.
(c) The transfer of functions which does not result in the abolition of the government unit that has exercised them shall include the appropriations, funds, records, equipment, facilities, choses in action, rights, other assets and personnel as may be necessary to the proper discharge of the transferred functions. The liabilities, if any, that may have been incurred in connection with the discharge of the transferred functions, shall be treated in accordance with the Government Auditing Code and other pertinent laws, rules and regulations. Such personnel shall, in a hold-over capacity, continue to perform their respective duties and responsibilities and receive the corresponding salaries and benefits unless in the meantime they are separated from the service pursuant to Executive Order No. 17 (1986) or Article III of the Freedom Constitution. Any personnel, whose position, is not included in the Philippine Statistical System's new position structure and staffing pattern approved and prescribed by the NSCB Chairman under Section 23 hereof or who has not been reappointed, shall be deemed separated from the service and shall be entitled to the benefits provided in the second paragraph of the same Section 23.
(d) In case of the abolition of a government unit which does not result in the transfer of its functions to another unit, the appropriations and funds of the abolished unit shall revert to the General Fund, while the records, equipment, facilities, choses in action, rights and other assets, thereof shall be allocated to such appropriate units as the NSCB Chairman shall determine or shall otherwise be disposed in accordance with the Government Auditing Code and other pertinent laws, rules and regulations. The liabilities of the abolished unit shall be treated in accordance with the Government Auditing Code and other pertinent laws, rules and regulations, while the personnel thereof, whose positions are included in the Ministry's new position structure and staffing pattern approved and prescribed by the NSCB Chairman under Section 23 hereof or who have not been reappointed shall be deemed separated from the service and shall be entitled to the benefits provided in the second paragraph of the same Section 23.
(e) In case of merger or consolidation of government units, the new or
2010 Census of Population and Housing Appendix C
National Statistics Office 113
surviving unit shall exercise the functions (subject to the reorganization herein prescribed and the laws, rules and regulations pertinent to the exercise of such functions) and shall acquire the appropriations, funds, records, equipment, facilities, choses in action, rights, other assets, liabilities, if any, and personnel, as may be necessary, of (1) the units that compose the merger unit or (2) the absorbed unit, as the case may be. Such personnel shall, in a hold-over capacity, continue to perform their respective duties and responsibilities and receive the corresponding salaries and benefits unless in the meantime they are separated from the service pursuant to Executive Order No. 17 (1986) or Article III of the Freedom Constitution. Any such personnel, whose position is not included in the Philippine Statistical System's new position structure and staffing pattern approved and prescribed by the NSCB Chairman under Section 23 hereof or who is not reappointed, shall be deemed separated from the service and shall be entitled to the benefits provided in the second paragraph of the same Section 23.
(f) In case of termination of a function which does not result in the abolition of the government unit which has performed such function, the appropriations and funds intended to finance the discharge of such function shall revert to the General Fund, while the records, equipment, facilities, choses in action, rights, and other assets used in connection with the discharge of such function shall be allocated to appropriate units as the NSCB Chairman shall determine or shall otherwise be disposed in accordance with the Government Auditing Code and other pertinent laws, rules and regulations. The liabilities, if any, they may have been incurred in connection with the discharge of such function shall likewise be treated in accordance with the Government Auditing Code and other pertinent laws, rules and regulations. The personnel who have performed such function, whose positions are not included in the Philippine Statistical System's new position structure and staffing pattern approved and prescribed by the NSCB Chairman under Section 23 hereof or who have not been appointed, shall be deemed separated from the service and shall be entitled to the benefits provided in the second paragraph of the same Section 23.
SECTION 23. New Structure and Pattern. Upon approval of this Executive Order, the officers (the term "officer" as used in this Executive Order is intended to be within the meaning of the term "official" as used in the Freedom Constitution) and employees of the abolished entities mentioned in Section 21 hereof shall, in a hold-over capacity, continue to perform their respective duties and responsibilities and receive the corresponding salaries and benefits unless in the meantime they are separated from government service pursuant to Executive Order No. 17 (1986) or Article III of the Freedom Constitution.
The new position structure and staffing pattern of the Philippine Statistical System shall be approved and prescribed by the NSCB Chairman within one hundred twenty (120) days from the approval of this Executive Order and the authorized positions created thereunder shall be filled with regular appointments by him or by the President as they case may be. Those incumbents whose positions are not included therein or who are not
Appendix C 2010 Census of Population and Housing
114 National Statistics Office
reappointed shall be deemed separated from the service. Those separated from the service shall receive the retirement benefits to which they may be entitled under the existing laws, rules and regulations. Otherwise, they shall be paid the equivalent of one-month basic salary for every year of service, or the equivalent nearest fraction thereof favorable to them on the basis of highest salary received, but in no case shall such payment exceed the equivalent of 12-month salary.
No court or administrative body shall issue any writ or preliminary injunction or restraining order to enjoin the separation/replacement of any officer or employee effected under this Executive Order.
SECTION 24. Notice of Consent Requirement. If any reorganizational change herein authorized is of such substance or materiality as to prejudice third persons with rights recognized by law or contract such that notice to or consent of creditors are required to be made or obtained pursuant to any agreement entered into with any of such creditors, such notice or consent requirement shall be complied with prior to the implementation of such reorganizational change.
SECTION 25. Periodic Performance Evaluation. The NSCB Chairman is hereby required to formulate and enforce a periodic system of measuring objectively the performance of the NSCB, which shall be submitted semi-annually and annually to the President.
SECTION 26. Prohibition Against Change. No change in the reorganization herein prescribed shall be valid except upon prior approval of the President for the purpose of promoting efficiency and effectiveness in the delivery of public services.
SECTION 27. Funding. Funds needed to carry out the reorganization of any agency or office as a result of this Executive Order shall be taken from funds available in said agency or office.
SECTION 28. Implementing Authority of NSCB Chairman. The NSCB Chairman shall issue such rules, regulations and other issuances as may be necessary to ensure the effective implementation of the provisions of this Executive Order.
SECTION 29. Separability. Any portion or provision of this Executive Order that may be declared unconstitutional shall not have the effect of nullifying other portions or provisions hereof, as long as such remaining portions or provisions can still subsist and be given effect in their entirety.
SECTION 30. Repealing Clause. All laws, ordinances, rules, regulations, other issuances, or parts thereof which are inconsistent with this Executive Order, are hereby repealed or modified accordingly.
SECTION 31. Effectivity. This Executive Order shall take effect immediately upon its approval.
2010 Census of Population and Housing Appendix C
National Statistics Office 115
APPROVED in the City of Manila, Philippines, this 30th day of January, in the Year of Our Lord, Nineteen Hundred and Eighty Seven. (SGD.) CORAZON C. AQUINO
By the President:
(SGD.) JOKER P. ARROYO Executive Secretary
Appendix D 2010 Census of Population and Housing
116 National Statistics Office
TRAININGS AND FIELDWORK FOR THE CONDUCT OF 2010 CPH
The 2010 Census of Population and Housing (2010 CPH) is designed to take an inventory of the population and housing units in the Philippines and collect information about their characteristics. All information about the population and living quarters were collected as of 12:01 AM of May 1, 2010, the census reference date and time.
The National Statistics Office (NSO) is the agency mandated by law to conduct the 2010
CPH. Section 2 of Commonwealth Act No. 591 (CA 591), Section 9 of Executive Order No. 121 and Batas Pambansa Blg. 72 (BP 72) are the legal bases for the conduct of census. CA 591 and BP 72 explicitly provide the basis for the confidentiality of data collected during the census.
The census-taking was from May 17, 2010 to June 14, 2010, except in highly urbanized
cities such as the cities in the NCR, and large provinces in CALABARZON and Central Luzon where the enumeration period extended beyond 23 days. About 68,146 public school teachers were employed for the census as enumerators, team supervisors, and census area supervisors. Their number was augmented by 19,579 hired personnel who were assigned to enumerate in large and congested areas where enumeration was expected to go beyond 23 days and thus cannot be handled by teachers who were expected to report for the school opening on June 14. An enumerator was assigned to enumerate one enumeration area (EA), which has about 350 households. A ratio of one team supervisor to five enumerators was used during the census operations.
In order to prepare the 84,000 census personnel for enumeration work, four levels of
training were conducted. The first level training for enumeration was participated in by personnel of NSO central office and officials of NSO regional and selected provincial offices, who, in turn acted as trainers in succeeding levels. The second level training was for NSO provincial and regional office officials and staff who served as trainers for the third and fourth level training. The third level training was participated in by public school teachers who were assigned as census area supervisors. The enumerators and team supervisors were trained during the fourth level training. A standard training program covering the concepts, definitions, procedures, as well as duties and responsibilities of enumerators and supervisors was used.
Census-taking involved going around the whole enumeration area to do the required
census procedures, as follows. 1. Courtesy Call. As a matter of protocol, the census personnel made a courtesy call to
the barangay chairperson. The enumerator informed the official that the census would be undertaken in his/her barangay and the enumerators would go around the entire area to ask questions from the residents.
2. Mapping and Canvassing. The enumerator went around the entire EA to familiarize himself with the place and checked the barangay or EA boundaries and landmarks, and reflected these on the barangay/EA map.
3. Listing using CPH Form 1 or the Listing Booklet. The enumerator listed buildings
with living quarters, housing units, households and number of household members, and institutional living quarters, and number of persons staying in institutions. Structures which are occupied or used as living quarters by households, even though
2010 Census of Population and Housing Appendix D
National Statistics Office 117
these are not intended for human habitation were also listed. During the listing, the names of the household heads and their addresses, and the names and addresses of institutions were recorded.
4. Interview and Recording of Answers. For every household or institution listed, the
enumerator administered a questionnaire, that is, CPH Form 2 or Form 3 for a household and CPH Form 4 for an institution. The barangay chairperson or any official was also interviewed by the enumerator or his team supervisor using CPH Form 5 or Barangay Questionnaire.
5. Plotting. The enumerator plotted the building with its assigned serial number on the
EA map. Standard cartographic symbols were used in plotting the buildings of the households and institutions.
6. Posting of sticker. The enumerator posted a sticker on the door, gate or any
conspicuous part of the housing unit or institutional living quarter, to indicate that the household or institution has been listed and/or interviewed.
In addition to the count of the household population and institutional population,
information about selected demographic and socio-economic characteristics of the population were collected using different census questionnaires. These questionnaires were reviewed for completeness and consistency of entries at various phases of the census operations. During data collection, the census supervisors scrutinized questionnaires for completeness and consistency of entries.
Progress monitoring reports were utilized to track the progress of census and field
operations and to evaluate the completeness of census coverage in each EA while enumeration was still ongoing. The provincial, regional and central offices of NSO monitored the progress through the Progress Monitoring System (PMS). The PMS generated reports on number of households, institutions and persons enumerated based on the information sent by area supervisors through SMS (short messaging system or text messaging).
Review of accomplished questionnaires for completeness and consistency of entries
was also carried out at the census headquarters where the census teams met weekly and at the provincial offices during manual processing. Machine processing, which includes scanning and interpretation, key-from-image data entry, completeness and consistency checking, and consolidation of data, were done at the various census processing centers (CPC) in the country. Data files were transmitted from the CPCs to the Central Office for the generation of census counts. Population counts by province, city, municipality and barangay as determined from the processed census questionnaires are official for all purposes as proclaimed by the President of the Philippines.
The 2010 CPH adopted innovations to make the census operations efficient. 1. GPS technology for mapping. For this census round, the use of GPS (Global
Positioning System) was used for mapping selected barangays in five regions of Caraga, Bicol region, Cordillera, Ilocos region except Pangasinan, and in Eastern Visayas. This activity provided the enumerators with more accurate maps with exact boundary information. The use of the GPS technology will be continued by NSO as part of the rolling program for mapping activities.
Appendix D 2010 Census of Population and Housing
118 National Statistics Office
2. SMS technology for Progress Monitoring. The NSO made use of the SMS technology in monitoring the progress of enumeration nationwide. Started in the 2007 census, the enhanced version of the Progress Monitoring System or PMS was adopted for the current census round. The Philippines is the first country in the Asia and Pacific to have adopted the SMS technology for progress monitoring.
3. OMR technology for data processing. The use of Optical Mark Reader (OMR)
technology in the Philippine census started in the 2000 CPH. The Philippines is among the countries to have successfully used this technology. The use of OMR shortened the data entry phase as only those items with write-in entries were encoded. Data encoding using the key-from-image was done instead of keying from the questionnaires.
4. Satellite images for validating census coverage. The Central Office downloaded
satellite images and identified structures (buildings) in specific cities and municipalities. Counts of households were estimated based on identified structures. These estimates were used to validate the completeness of census coverage in these areas.
The NSO implemented strategies to enumerate areas which were hard to reach, remote,
upland, with Indigenous Peoples (IP) communities, under military control or with peace and order problem, Chinese communities or exclusive villages with low response rate because of security or other reasons, and areas with boundary disputes. These strategies included the recruitment of enumerators who are from the area; assignment of IP teachers in IP areas; seeking the assistance of IP guides; coordination with the AFP and PNP for transport and escorts; coordination with local officials; and coordination with homeowners associations in exclusive villages, high-rise condominiums and Filipino-Chinese communities.
2010 Census of Population and Housing Appendix E
National Statistics Office 119
EVALUATION OF POPULATION COUNTS FROM THE 2010 CPH
Progress monitoring reports were utilized to track the progress of census field operations and to evaluate the completeness of census coverage in each enumeration area while the enumeration was still ongoing. The provincial, regional, and central offices of NSO monitored the progress through the Progress Monitoring System (PMS). It used as inputs the Enumerator’s Accomplishment/PM Reports (CPH Form 10). The evaluation continued after the enumeration period using counts from processed questionnaires from the twelve Census Processing Centers 2010 (CPC 2010) across the country.
Evaluation of Counts at the NSO Field Offices The Regional Office (RO) was responsible for the evaluation of the 2010 CPH counts for
the region while the Provincial Office (PO) was responsible for the province. The computerized reporting through the PMS facilitated the evaluation at the PO and the RO. The PMS generated various reports which include the Enumeration Area (EA) Progress Enumeration Report (PMS Report 3). This report shows the counts of population of males and females and number of households by EA and the status of enumeration in each EA or barangay based on the information from CPH Form 10. Another PMS report generated at the PO is the Barangay Coverage Report (PMS Report 4). This report was used to evaluate the acceptability of the reported counts for the following indicators, computed up to the barangay level:
a. Household and population counts b. Demographic indicators
Annual population growth rate Percent change in the number of households Average household size
c. Difference between 2010 and 2007 institutional population d. Number and percent of EAs completed
The field offices investigated areas with demographically implausible growth rates and
questionable values in any of the cited indicators. Evaluation at the Central Office
Parallel monitoring and evaluation were done at the Central Office particularly at the
Household Statistics Department (HSD). The information used for the evaluation by HSD were: a. 2010 CPH counts up to the barangay level generated through PMS; b. 2010 CPH counts up to the barangay level from the Enumeration Area Reference
File (EARF) filled up with population counts by the Provincial Offices after matching and completeness checking of census questionnaires during the manual processing;
c. 2010 CPH counts up to the barangay level generated by CPCs; d. average annual population growth rates for the provinces and cities/municipalities for
the periods 1990-1995, 1995-2000, 2000-2007, 1990-2000, 1995-2007, 2000-2010
Appendix E 2010 Census of Population and Housing
120 National Statistics Office
and for all geographic levels, that is, including barangay level, for the period 2007-2010;
e. sex ratio for the provinces and cities/municipalities for the year 2007, and for all geographic levels for the year 2010;
f. average household size for all geographic levels for the years 2000, 2007, and 2010; g. percent change of population between census years 2000 and 2007, 2000 and 2010,
and 2007 and 2010 for all geographic levels; and h. difference in the total population, household population, and number of households
between census years 2000 and 2007, 2000 and 2010, and 2007 and 2010 for all geographic levels.
Below are other sources of information used as inputs for the extrapolation of population for 2010. Results of extrapolation were compared with the population counts from 2010 CPH, using the balancing equation assumption:
a. vital registration data on annual births and deaths and estimates of levels of registration based on 2000 CPH and POPCEN 2007, for the provinces and cities/municipalities;
b. number of housing units based on satellite images, for selected provinces and cities/municipalities; and
c. administrative records on membership of households in the community water or electric cooperatives, for selected provinces and cities/municipalities.
Acceptable or demographically plausible values for the abovementioned indicators, as
well as the expected direction of their changes over time are specified in the Field Operations Manual of 2010 CPH (pages 133-134). The demographic indicators for each geographic area were evaluated using the procedures also contained in the Field Operations Manual. Explanations were sought if a particular indicator fell outside the acceptable range of values, or if the observed change in the indicator deviates from the expected demographic trend. The RO submitted to the CO the explanations of the POs in his/her region for areas with census results that were considered questionable by the CO based on its independent evaluation.
A more thorough procedure of evaluation was employed for barangays suspected of
having census under-coverage or over-coverage. Careful scrutiny of questionnaires for these barangays was carried out following the procedures discussed in pages 135-136 of the Field Operations Manual. In extreme cases wherein the result of the scrutiny of questionnaires confirmed that under-enumeration or padding or fabrication of population was committed, field verification became necessary. Teams composed of Statisticians from the CO, the PSOs and Statisticians of concerned provinces conducted field verification in areas suspected of having been under-enumerated or over-enumerated.
2010 Census of Population and Housing Appendix F
National Statistics Office 121
List of Report No. 1 – Population by Province, City, Municipality, and Barangay
NATIONAL CAPITAL REGION 1 – A CORDILLERA ADMINISTRATIVE REGION 1 – B REGION I - ILOCOS REGION 1 – C REGION II - CAGAYAN VALLEY 1 – D REGION III - CENTRAL LUZON 1 – E REGION IV-A - CALABARZON 1 – F REGION IV-B - MIMAROPA 1 – G REGION V - BICOL REGION 1 – H REGION VI - WESTERN VISAYAS 1 – I REGION VII - CENTRAL VISAYAS 1 – J REGION VIII - EASTERN VISAYAS 1 – K REGION IX - ZAMBOANGA PENINSULA 1 – L REGION X - NORTHERN MINDANAO 1 – M REGION XI - DAVAO REGION 1 – N REGION XII - SOCCSKSARGEN 1 – O AUTONOMOUS REGION IN MUSLIM MINDANAO 1 – P CARAGA 1 – Q
2010 CENSUSOF POPULATION AND HOUSING
Census publications may be obtained from the Databank andInformation Services Division of the National Statistics Office atRamon Magsaysay Boulevard, Sta. Mesa, Manila with email address:[email protected] or from any NSO Provincial/Regional Office.
NSO Website: www.census.gov.ph