Queuing Models for Analyzing the Impact of Trajectory Uncertainties on the NAS Flow Efficiency
14
American Institute of Aeronautics and Astronautics 1 Queuing Models for Analyzing the Impact of Trajectory Uncertainties on the NAS Flow Efficiency Prasenjit Sengupta * , Monish D. Tandale * , Jinwhan Kim * and P. K. Menon † Optimal Synthesis Inc., Los Altos, CA 94022-2777 The application of Queuing Theory to quantify the relationships between trajectory uncertainties due to aviation operations, precision of navigation and control, and traffic flow efficiency in the National Airspace System is discussed. This work builds on a previous research effort on Markovian queuing network models of the NAS. Two approaches for incorporating the trajectory uncertainties in the queuing networks are discussed. In the first approach, an approximate queuing method that models the service distributions with the first and the second moments of the traffic flow parameters is discussed. This approach employs the Queuing Network Analyzer formulation discussed in the literature. The second approach advances a methodology for introducing the trajectory uncertainties through a set of uncertainty service nodes in a Markovian model of the NAS. The modeling approach is discussed for multiple spatial discretizations. Sample results for the U.S. National Airspace System are given. I. Introduction nderstanding the relationships between trajectory uncertainties due to aviation operations, precision of navigation and control, and the traffic flow efficiency is central to the design of Next Generation Air Transportation Systems (NextGen). In all that follows, the traffic flow efficiency is defined as the degree to which the aircraft is delayed due to congestion effects as compared to an unimpeded flight along the same route. Congestion arises when the demand exceeds capacity in a region of the airspace, which requires that the upstream aircraft entering the airspace must be delayed until the capacity becomes available. An important element of the NextGen concept being developed by NASA and the Joint Planning and Development Office (JPDO) is the Trajectory-Based Operations (TBO). Trajectory-Based Operations is a paradigm shift from the current clearance based approach and employs four-dimensional (4D) trajectories as the basis for managing the ATM system, adding time as the fourth dimension to latitude, longitude and altitude. If the predicted 4D trajectory of every aircraft is available, the flights can be scheduled to have conflict-free trajectories. However, aircraft may not be able to precisely execute the planned 4D trajectory due to the uncertainties arising from aviation operations and precision of navigation and control. Figure 1 illustrates the various uncertainty sources contributing to aircraft trajectory uncertainties. Due to the discrepancy between the planned and executed 4D trajectories, congestion may be observed resulting in flight delays and reduced flow efficiency. The objective of the present research is to employ results from Queuing Theory to quantify the relationship between trajectory uncertainties and traffic flow efficiency in the National Airspace System. A previous paper 1 introduced the concepts pursued in this research and presented preliminary results based on Markovian network analysis 2 of the NAS. That paper also presented the literature survey outlining previous work performed in this area. Markovian network analysis is prevalent in literature due to the mathematical tractability and presence of closed- form analytical solutions. However Markovian analysis assumes 1 degree-of-freedom exponential distributions to describe the arrival and service processes. In an exponential distribution the variance is equal to the square of the mean and cannot be specified independently. Thus, there is no direct approach for analyzing the effect of changing * Research Scientist, 95 First Street Suite 240, Senior Member AIAA. † Chief Scientist and President, 95 First Street Suite 240, Associate Fellow AIAA. U 9th AIAA Aviation Technology, Integration, and Operations Conference (ATIO) <br>and<br>Air 21 - 23 September 2009, Hilton Head, South Carolina AIAA 2009-6913 Copyright © 2009 by Optimal Synthesis Inc. Published by the American Institute of Aeronautics and Astronautics, Inc., with permission.
-
Upload
independent -
Category
Documents
-
view
6 -
download
0
Transcript of Queuing Models for Analyzing the Impact of Trajectory Uncertainties on the NAS Flow Efficiency
American Institute of Aeronautics and Astronautics
1
Queuing Models for Analyzing the Impact of
Trajectory Uncertainties on the NAS Flow
Efficiency
Prasenjit Sengupta*, Monish D. Tandale*, Jinwhan Kim* and P. K. Menon†
Optimal Synthesis Inc., Los Altos, CA 94022-2777
The application of Queuing Theory to quantify the relationships between trajectory
uncertainties due to aviation operations, precision of navigation and control, and traffic flow
efficiency in the National Airspace System is discussed. This work builds on a previous research effort on Markovian queuing network models of the NAS. Two approaches for
incorporating the trajectory uncertainties in the queuing networks are discussed. In the first
approach, an approximate queuing method that models the service distributions with the
first and the second moments of the traffic flow parameters is discussed. This approach
employs the Queuing Network Analyzer formulation discussed in the literature. The second
approach advances a methodology for introducing the trajectory uncertainties through a set
of uncertainty service nodes in a Markovian model of the NAS. The modeling approach is
discussed for multiple spatial discretizations. Sample results for the U.S. National Airspace
System are given.
I. Introduction
nderstanding the relationships between trajectory uncertainties due to aviation operations, precision of
navigation and control, and the traffic flow efficiency is central to the design of Next Generation Air
Transportation Systems (NextGen). In all that follows, the traffic flow efficiency is defined as the degree to which
the aircraft is delayed due to congestion effects as compared to an unimpeded flight along the same route.
Congestion arises when the demand exceeds capacity in a region of the airspace, which requires that the upstream
aircraft entering the airspace must be delayed until the capacity becomes available.
An important element of the NextGen concept being developed by NASA and the Joint Planning and
Development Office (JPDO) is the Trajectory-Based Operations (TBO). Trajectory-Based Operations is a paradigm
shift from the current clearance based approach and employs four-dimensional (4D) trajectories as the basis for
managing the ATM system, adding time as the fourth dimension to latitude, longitude and altitude. If the predicted 4D trajectory of every aircraft is available, the flights can be scheduled to have conflict-free trajectories. However,
aircraft may not be able to precisely execute the planned 4D trajectory due to the uncertainties arising from aviation
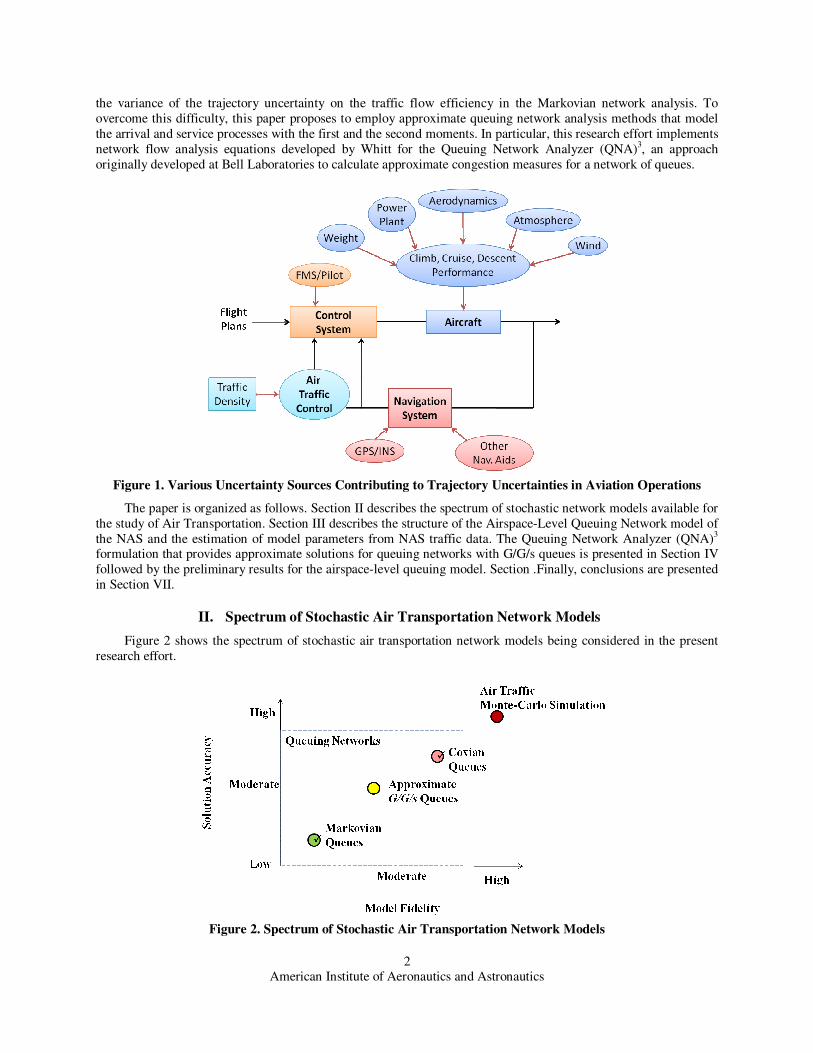
operations and precision of navigation and control. Figure 1 illustrates the various uncertainty sources contributing
to aircraft trajectory uncertainties. Due to the discrepancy between the planned and executed 4D trajectories,
congestion may be observed resulting in flight delays and reduced flow efficiency.
The objective of the present research is to employ results from Queuing Theory to quantify the relationship
between trajectory uncertainties and traffic flow efficiency in the National Airspace System. A previous paper1
introduced the concepts pursued in this research and presented preliminary results based on Markovian network
analysis2 of the NAS. That paper also presented the literature survey outlining previous work performed in this area.
Markovian network analysis is prevalent in literature due to the mathematical tractability and presence of closed-
form analytical solutions. However Markovian analysis assumes 1 degree-of-freedom exponential distributions to
describe the arrival and service processes. In an exponential distribution the variance is equal to the square of the mean and cannot be specified independently. Thus, there is no direct approach for analyzing the effect of changing
* Research Scientist, 95 First Street Suite 240, Senior Member AIAA. † Chief Scientist and President, 95 First Street Suite 240, Associate Fellow AIAA.
U
9th AIAA Aviation Technology, Integration, and Operations Conference (ATIO) <br>and <br>Air21 - 23 September 2009, Hilton Head, South Carolina
AIAA 2009-6913
Copyright © 2009 by Optimal Synthesis Inc. Published by the American Institute of Aeronautics and Astronautics, Inc., with permission.
American Institute of Aeronautics and Astronautics
2
the variance of the trajectory uncertainty on the traffic flow efficiency in the Markovian network analysis. To
overcome this difficulty, this paper proposes to employ approximate queuing network analysis methods that model
the arrival and service processes with the first and the second moments. In particular, this research effort implements
network flow analysis equations developed by Whitt for the Queuing Network Analyzer (QNA)3, an approach
originally developed at Bell Laboratories to calculate approximate congestion measures for a network of queues.
Figure 1. Various Uncertainty Sources Contributing to Trajectory Uncertainties in Aviation Operations
The paper is organized as follows. Section II describes the spectrum of stochastic network models available for
the study of Air Transportation. Section III describes the structure of the Airspace-Level Queuing Network model of
the NAS and the estimation of model parameters from NAS traffic data. The Queuing Network Analyzer (QNA)3 formulation that provides approximate solutions for queuing networks with G/G/s queues is presented in Section IV
followed by the preliminary results for the airspace-level queuing model. Section .Finally, conclusions are presented
in Section VII.
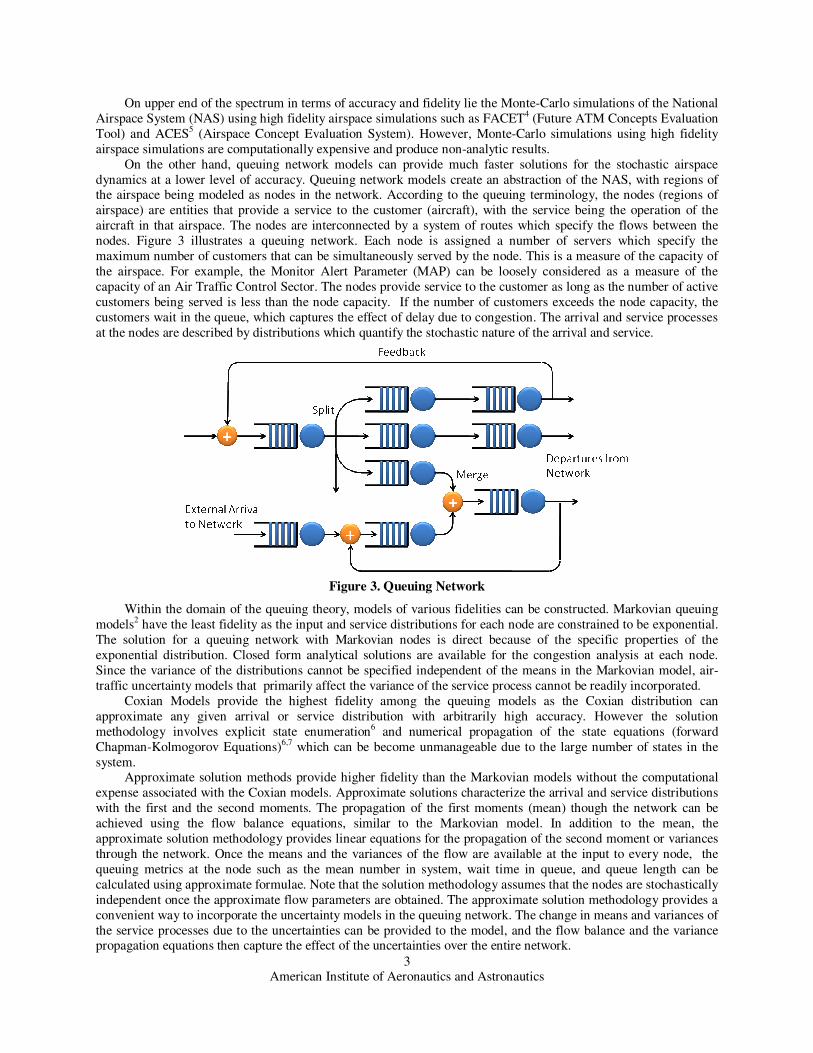
II. Spectrum of Stochastic Air Transportation Network Models
Figure 2 shows the spectrum of stochastic air transportation network models being considered in the present
research effort.
Figure 2. Spectrum of Stochastic Air Transportation Network Models
American Institute of Aeronautics and Astronautics
3
On upper end of the spectrum in terms of accuracy and fidelity lie the Monte-Carlo simulations of the National
Airspace System (NAS) using high fidelity airspace simulations such as FACET4 (Future ATM Concepts Evaluation
Tool) and ACES5 (Airspace Concept Evaluation System). However, Monte-Carlo simulations using high fidelity
airspace simulations are computationally expensive and produce non-analytic results.
On the other hand, queuing network models can provide much faster solutions for the stochastic airspace
dynamics at a lower level of accuracy. Queuing network models create an abstraction of the NAS, with regions of the airspace being modeled as nodes in the network. According to the queuing terminology, the nodes (regions of
airspace) are entities that provide a service to the customer (aircraft), with the service being the operation of the
aircraft in that airspace. The nodes are interconnected by a system of routes which specify the flows between the
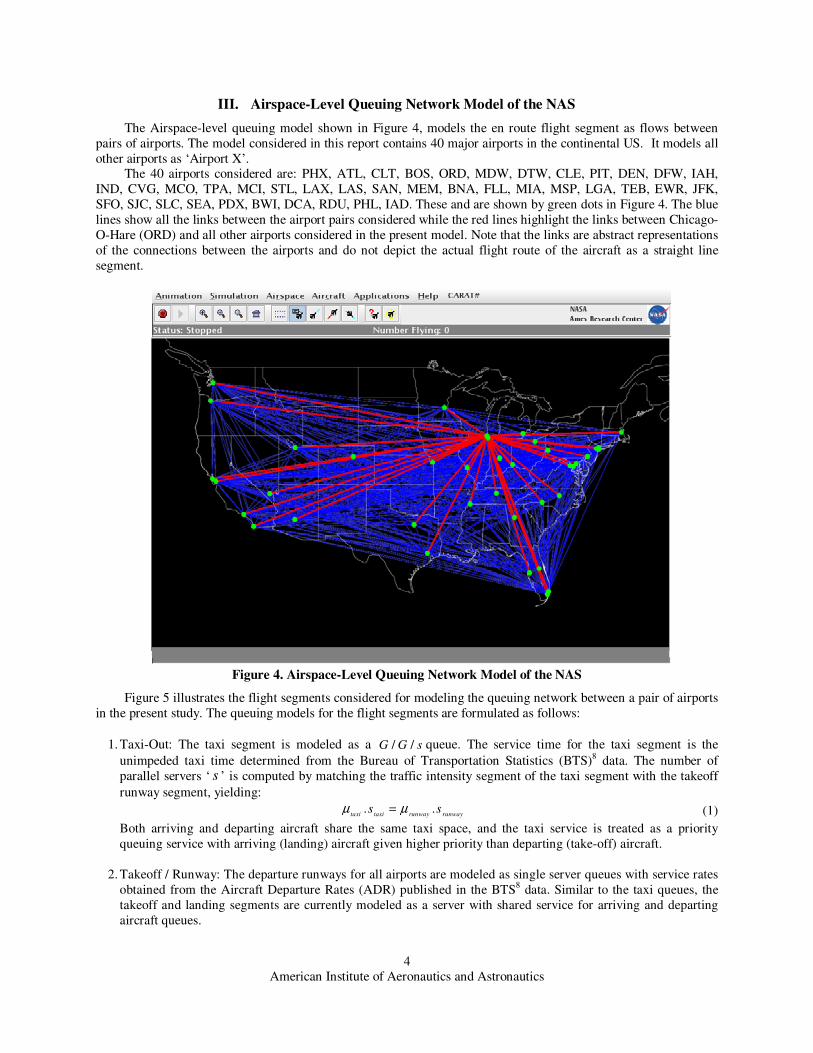
nodes. Figure 3 illustrates a queuing network. Each node is assigned a number of servers which specify the
maximum number of customers that can be simultaneously served by the node. This is a measure of the capacity of
the airspace. For example, the Monitor Alert Parameter (MAP) can be loosely considered as a measure of the
capacity of an Air Traffic Control Sector. The nodes provide service to the customer as long as the number of active
customers being served is less than the node capacity. If the number of customers exceeds the node capacity, the
customers wait in the queue, which captures the effect of delay due to congestion. The arrival and service processes
at the nodes are described by distributions which quantify the stochastic nature of the arrival and service.
Figure 3. Queuing Network
Within the domain of the queuing theory, models of various fidelities can be constructed. Markovian queuing
models2 have the least fidelity as the input and service distributions for each node are constrained to be exponential.
The solution for a queuing network with Markovian nodes is direct because of the specific properties of the
exponential distribution. Closed form analytical solutions are available for the congestion analysis at each node.
Since the variance of the distributions cannot be specified independent of the means in the Markovian model, air-
traffic uncertainty models that primarily affect the variance of the service process cannot be readily incorporated.
Coxian Models provide the highest fidelity among the queuing models as the Coxian distribution can
approximate any given arrival or service distribution with arbitrarily high accuracy. However the solution
methodology involves explicit state enumeration6 and numerical propagation of the state equations (forward
Chapman-Kolmogorov Equations)6,7 which can be become unmanageable due to the large number of states in the
system. Approximate solution methods provide higher fidelity than the Markovian models without the computational
expense associated with the Coxian models. Approximate solutions characterize the arrival and service distributions
with the first and the second moments. The propagation of the first moments (mean) though the network can be
achieved using the flow balance equations, similar to the Markovian model. In addition to the mean, the
approximate solution methodology provides linear equations for the propagation of the second moment or variances
through the network. Once the means and the variances of the flow are available at the input to every node, the
queuing metrics at the node such as the mean number in system, wait time in queue, and queue length can be
calculated using approximate formulae. Note that the solution methodology assumes that the nodes are stochastically
independent once the approximate flow parameters are obtained. The approximate solution methodology provides a
convenient way to incorporate the uncertainty models in the queuing network. The change in means and variances of
the service processes due to the uncertainties can be provided to the model, and the flow balance and the variance propagation equations then capture the effect of the uncertainties over the entire network.
American Institute of Aeronautics and Astronautics
4
III. Airspace-Level Queuing Network Model of the NAS
The Airspace-level queuing model shown in Figure 4, models the en route flight segment as flows between
pairs of airports. The model considered in this report contains 40 major airports in the continental US. It models all
other airports as ‘Airport X’. The 40 airports considered are: PHX, ATL, CLT, BOS, ORD, MDW, DTW, CLE, PIT, DEN, DFW, IAH,
IND, CVG, MCO, TPA, MCI, STL, LAX, LAS, SAN, MEM, BNA, FLL, MIA, MSP, LGA, TEB, EWR, JFK,
SFO, SJC, SLC, SEA, PDX, BWI, DCA, RDU, PHL, IAD. These and are shown by green dots in Figure 4. The blue
lines show all the links between the airport pairs considered while the red lines highlight the links between Chicago-
O-Hare (ORD) and all other airports considered in the present model. Note that the links are abstract representations
of the connections between the airports and do not depict the actual flight route of the aircraft as a straight line
segment.
Figure 4. Airspace-Level Queuing Network Model of the NAS
Figure 5 illustrates the flight segments considered for modeling the queuing network between a pair of airports
in the present study. The queuing models for the flight segments are formulated as follows:
1. Taxi-Out: The taxi segment is modeled as a sGG // queue. The service time for the taxi segment is the
unimpeded taxi time determined from the Bureau of Transportation Statistics (BTS)8 data. The number of
parallel servers ‘ s ’ is computed by matching the traffic intensity segment of the taxi segment with the takeoff
runway segment, yielding:
runwayrunwaytaxitaxiss .. µµ = (1)
Both arriving and departing aircraft share the same taxi space, and the taxi service is treated as a priority
queuing service with arriving (landing) aircraft given higher priority than departing (take-off) aircraft.
2. Takeoff / Runway: The departure runways for all airports are modeled as single server queues with service rates
obtained from the Aircraft Departure Rates (ADR) published in the BTS8 data. Similar to the taxi queues, the
takeoff and landing segments are currently modeled as a server with shared service for arriving and departing
aircraft queues.
American Institute of Aeronautics and Astronautics
5
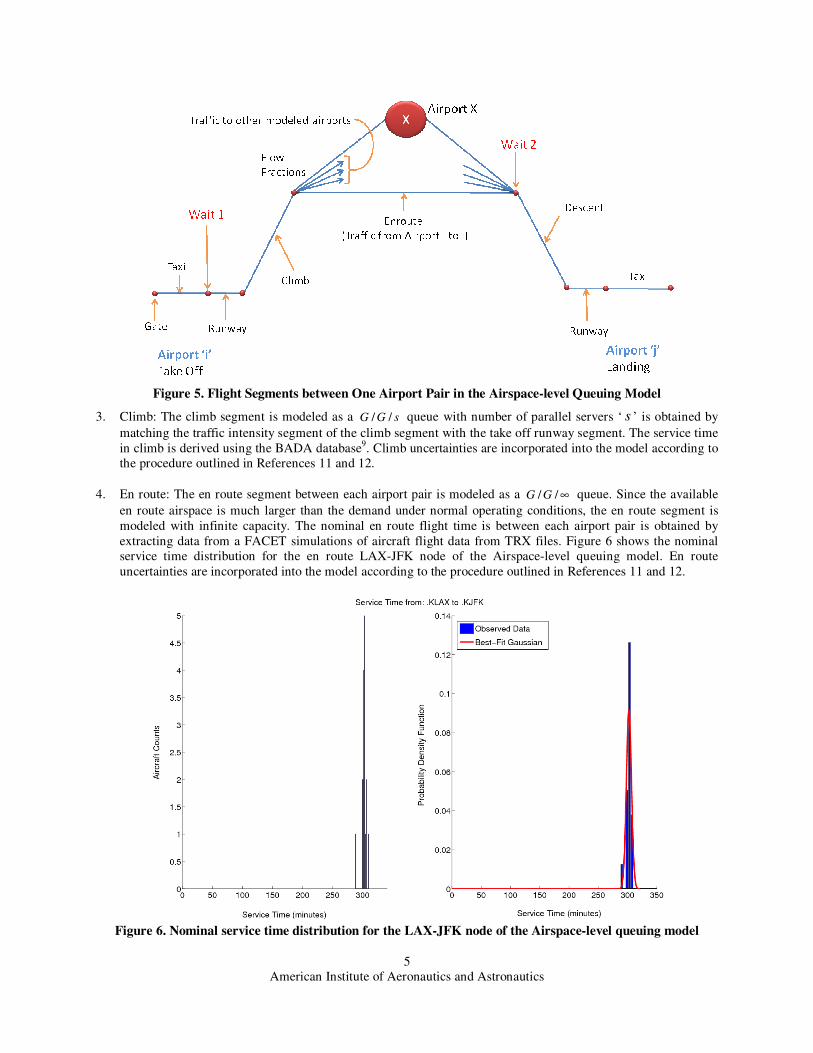
Figure 5. Flight Segments between One Airport Pair in the Airspace-level Queuing Model
3. Climb: The climb segment is modeled as a sGG // queue with number of parallel servers ‘ s ’ is obtained by
matching the traffic intensity segment of the climb segment with the take off runway segment. The service time
in climb is derived using the BADA database9. Climb uncertainties are incorporated into the model according to
the procedure outlined in References 11 and 12.
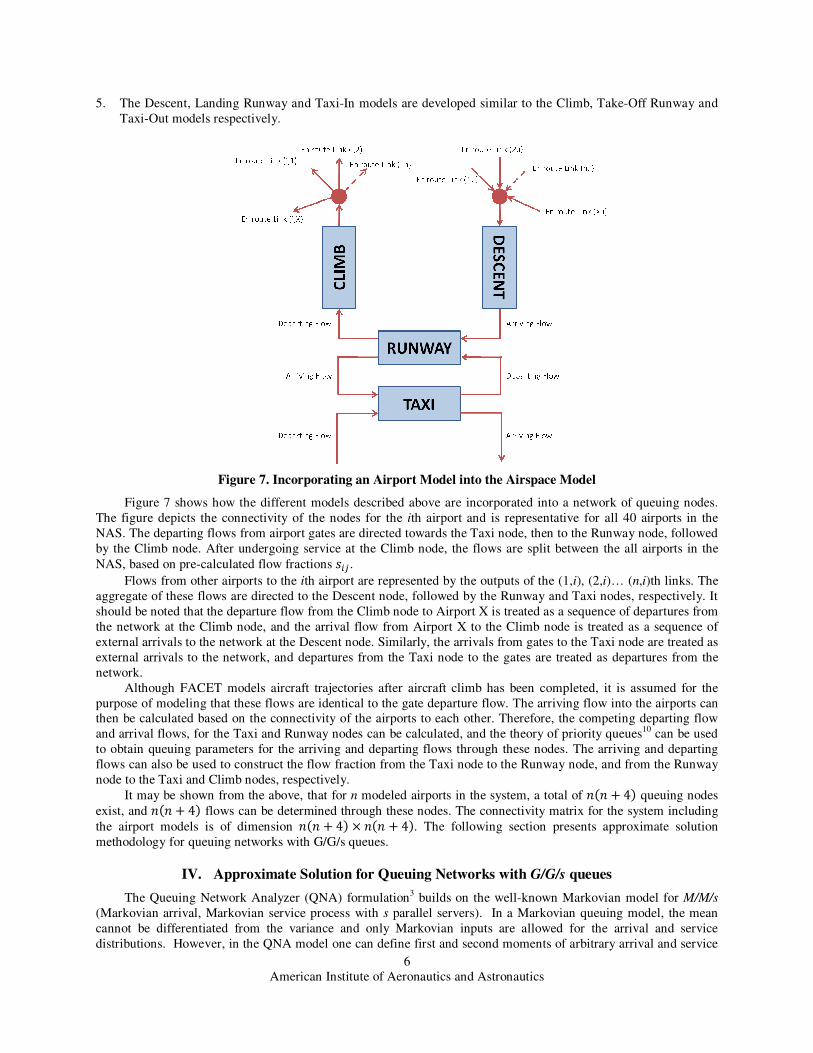
4. En route: The en route segment between each airport pair is modeled as a ∞// GG queue. Since the available
en route airspace is much larger than the demand under normal operating conditions, the en route segment is
modeled with infinite capacity. The nominal en route flight time is between each airport pair is obtained by
extracting data from a FACET simulations of aircraft flight data from TRX files. Figure 6 shows the nominal
service time distribution for the en route LAX-JFK node of the Airspace-level queuing model. En route
uncertainties are incorporated into the model according to the procedure outlined in References 11 and 12.
Figure 6. Nominal service time distribution for the LAX-JFK node of the Airspace-level queuing model
American Institute of Aeronautics and Astronautics
6
5. The Descent, Landing Runway and Taxi-In models are developed similar to the Climb, Take-Off Runway and
Taxi-Out models respectively.
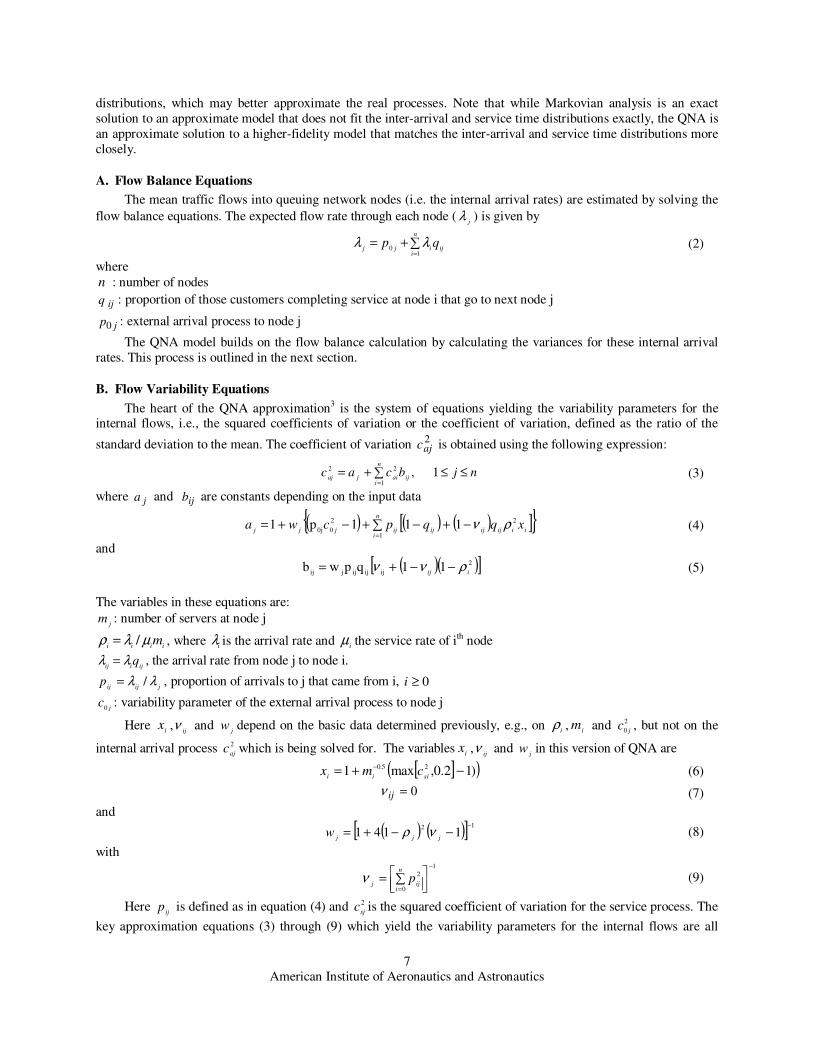
Figure 7. Incorporating an Airport Model into the Airspace Model
Figure 7 shows how the different models described above are incorporated into a network of queuing nodes.
The figure depicts the connectivity of the nodes for the ith airport and is representative for all 40 airports in the
NAS. The departing flows from airport gates are directed towards the Taxi node, then to the Runway node, followed
by the Climb node. After undergoing service at the Climb node, the flows are split between the all airports in the
NAS, based on pre-calculated flow fractions ��� .
Flows from other airports to the ith airport are represented by the outputs of the (1,i), (2,i)… (n,i)th links. The
aggregate of these flows are directed to the Descent node, followed by the Runway and Taxi nodes, respectively. It
should be noted that the departure flow from the Climb node to Airport X is treated as a sequence of departures from
the network at the Climb node, and the arrival flow from Airport X to the Climb node is treated as a sequence of
external arrivals to the network at the Descent node. Similarly, the arrivals from gates to the Taxi node are treated as
external arrivals to the network, and departures from the Taxi node to the gates are treated as departures from the
network.
Although FACET models aircraft trajectories after aircraft climb has been completed, it is assumed for the
purpose of modeling that these flows are identical to the gate departure flow. The arriving flow into the airports can
then be calculated based on the connectivity of the airports to each other. Therefore, the competing departing flow
and arrival flows, for the Taxi and Runway nodes can be calculated, and the theory of priority queues10
can be used
to obtain queuing parameters for the arriving and departing flows through these nodes. The arriving and departing
flows can also be used to construct the flow fraction from the Taxi node to the Runway node, and from the Runway
node to the Taxi and Climb nodes, respectively.
It may be shown from the above, that for n modeled airports in the system, a total of ��� � 4� queuing nodes
exist, and ��� � 4� flows can be determined through these nodes. The connectivity matrix for the system including
the airport models is of dimension ��� � 4� ��� � 4�. The following section presents approximate solution
methodology for queuing networks with G/G/s queues.
IV. Approximate Solution for Queuing Networks with G/G/s queues
The Queuing Network Analyzer (QNA) formulation3 builds on the well-known Markovian model for M/M/s
(Markovian arrival, Markovian service process with s parallel servers). In a Markovian queuing model, the mean
cannot be differentiated from the variance and only Markovian inputs are allowed for the arrival and service
distributions. However, in the QNA model one can define first and second moments of arbitrary arrival and service
American Institute of Aeronautics and Astronautics
7
distributions, which may better approximate the real processes. Note that while Markovian analysis is an exact
solution to an approximate model that does not fit the inter-arrival and service time distributions exactly, the QNA is
an approximate solution to a higher-fidelity model that matches the inter-arrival and service time distributions more
closely.
A. Flow Balance Equations
The mean traffic flows into queuing network nodes (i.e. the internal arrival rates) are estimated by solving the
flow balance equations. The expected flow rate through each node (j
λ ) is given by
∑+==
n
iijijj
qp1
0λλ (2)
where
n : number of nodes
ijq : proportion of those customers completing service at node i that go to next node j
jp0 : external arrival process to node j
The QNA model builds on the flow balance calculation by calculating the variances for these internal arrival
rates. This process is outlined in the next section.
B. Flow Variability Equations
The heart of the QNA approximation3 is the system of equations yielding the variability parameters for the internal flows, i.e., the squared coefficients of variation or the coefficient of variation, defined as the ratio of the
standard deviation to the mean. The coefficient of variation 2ajc
is obtained using the following expression:
njbcacij
n
iaijaj
≤≤∑+==
1 ,
1
22 (3)
where ja and ijb are constants depending on the input data
( ) ( ) ( )[ ]{ } 111p11
22
00j ∑ −+−+−+==
n
iiiijijijijjjj
xqqpcwa ρν (4)
and
( )( )[ ] 11qpwb 2
ijijijjij iijρνν −−+= (5)
The variables in these equations are:
jm : number of servers at node j
iiiimµλρ /= , where
iλ is the arrival rate and
iµ the service rate of ith node
ijiijqλλ = , the arrival rate from node j to node i.
jijijp λλ /= , proportion of arrivals to j that came from i, 0≥i
jc
0: variability parameter of the external arrival process to node j
Here i
x ,ij
ν and j
w depend on the basic data determined previously, e.g., on i
ρ ,i
m and 2
0 jc , but not on the
internal arrival process 2
ajc which is being solved for. The variables
ix ,
ijν and
jw in this version of QNA are
[ ]( ))12.0,max1 25.0 −+= −
siiicmx
(6)
0=ijν (7)
and
( ) ( )[ ] 121141
−
−−+=jjj
w νρ (8)
with
1
0
2
−
=
∑=
n
iijj
pν (9)
Here ij
p is defined as in equation (4) and 2
sjc is the squared coefficient of variation for the service process. The
key approximation equations (3) through (9) which yield the variability parameters for the internal flows are all
American Institute of Aeronautics and Astronautics
8
based on the basic method discussed in reference 13, asymptotic methods and the stationary interval method. Here
the equations for the basic operations: superposition (merge), splitting and departure will be given in the following.
Superposition:
2i
ik
k
ij c
∑∑
=λ
λν (10)
The summation in (10) is just the matrix element ijp and the 2ic is the external arrival process to that node.
Splitting :
iii pcpc −+= 1
22 (11)
Departure Process:
( )( ) ( )11112
2222 −+−−+= sad c
mcc
ρρ (12)
C. Queuing Analysis of Each Node
After the variance propagation throughout the network is completed, the first two moments for the arrival
process to each node are available and hence each node can be analyzed in isolation. The M/M/s queuing model2 is
applied to each node to determine the nodal queuing metrics such as the number of aircraft in the system L, the
number in the queue q
L , the total average time spent by an aircraft in the system W and the time spent in the queue
qW . The nodal queuing metrics were calculated using the following QNA approximations for the general arrival
process, general service processes and multiple-server queues (G/G/s).
( )sMMWcc
W qsa
qQNA //2
22
+= (13)
where qQNAW and qW (M/M/s) are the wait times for the QNA and Markovian models and 2ac and 2
sc are the
squared coefficients of variation for the arrival and service processes respectively.
The other QNA system parameters, QNAW (the total time in the system), qQNAL (the queue length) and QNAL
(the number in the system) follow from equation (13). The wait time in the system is given by
µ
1+= qQNAQNA WW (14)
The number in the queue qQNaL is given by Little’s formula14
qQNAqQNA WL λ= (15)
The number in the system is given by
mWL qQNAQNA ρλ += (16)
Further details on the QNA methodology can be found in Reference 3.
V. Modified Markovian Network Solution with NAS Uncertainties
As mentioned earlier, the basic Markovian formulation does not facilitate the addition of NAS uncertainties
that modify the variance of the nominal distribution. To overcome this drawback a modified solution methodology
was proposed prior to the implementation of the QNA formulation. This involves the use of an additional node in
series with the service parameter equal to the reciprocal of the square root of the uncertainty variance. This
approximate approach is described below.
An exponential distribution can be defined by a single parameter α . To fit an exponential distribution to
observed data the parameter α is identified as
=1
mean of observed data (17)
American Institute of Aeronautics and Astronautics
9
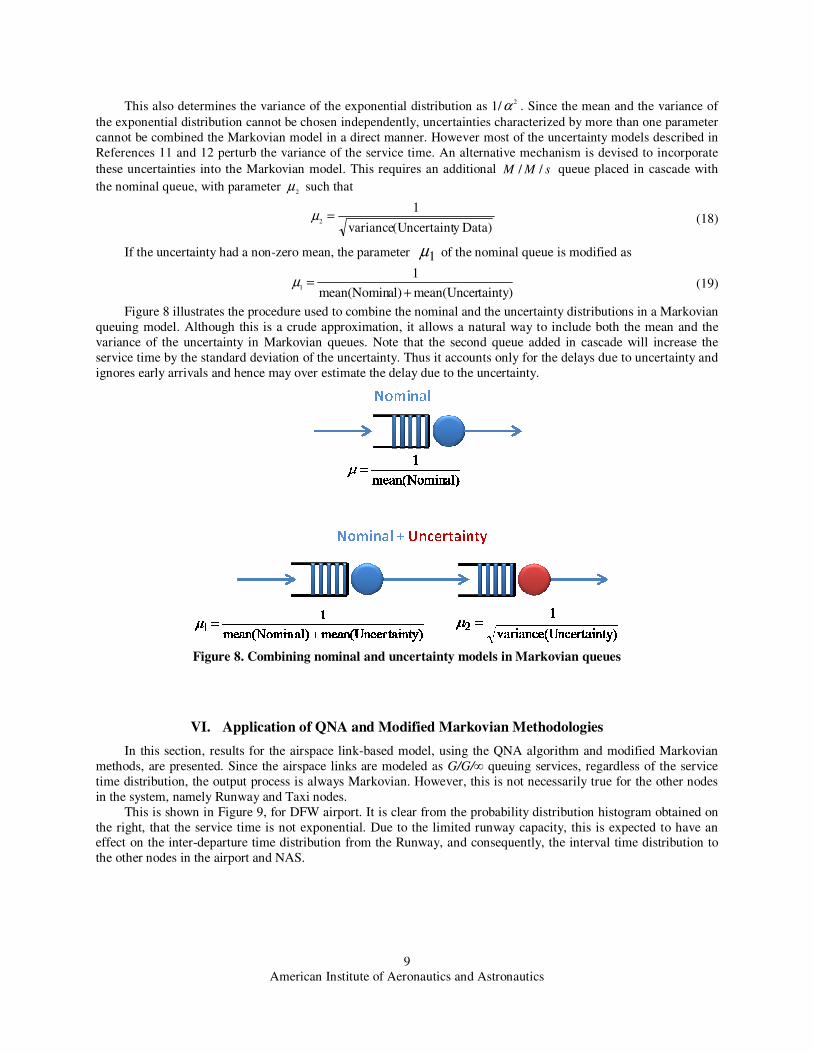
This also determines the variance of the exponential distribution as 1/2α . Since the mean and the variance of
the exponential distribution cannot be chosen independently, uncertainties characterized by more than one parameter
cannot be combined the Markovian model in a direct manner. However most of the uncertainty models described in
References 11 and 12 perturb the variance of the service time. An alternative mechanism is devised to incorporate
these uncertainties into the Markovian model. This requires an additional sMM // queue placed in cascade with
the nominal queue, with parameter 2
µ such that
)Datay Uncertaint(variance
12
=µ (18)
If the uncertainty had a non-zero mean, the parameter 1µ of the nominal queue is modified as
tainty)mean(Unceral)mean(Nomin
11
+=µ (19)
Figure 8 illustrates the procedure used to combine the nominal and the uncertainty distributions in a Markovian
queuing model. Although this is a crude approximation, it allows a natural way to include both the mean and the
variance of the uncertainty in Markovian queues. Note that the second queue added in cascade will increase the
service time by the standard deviation of the uncertainty. Thus it accounts only for the delays due to uncertainty and
ignores early arrivals and hence may over estimate the delay due to the uncertainty.
Figure 8. Combining nominal and uncertainty models in Markovian queues
VI. Application of QNA and Modified Markovian Methodologies
In this section, results for the airspace link-based model, using the QNA algorithm and modified Markovian
methods, are presented. Since the airspace links are modeled as G/G/∞ queuing services, regardless of the service
time distribution, the output process is always Markovian. However, this is not necessarily true for the other nodes
in the system, namely Runway and Taxi nodes.
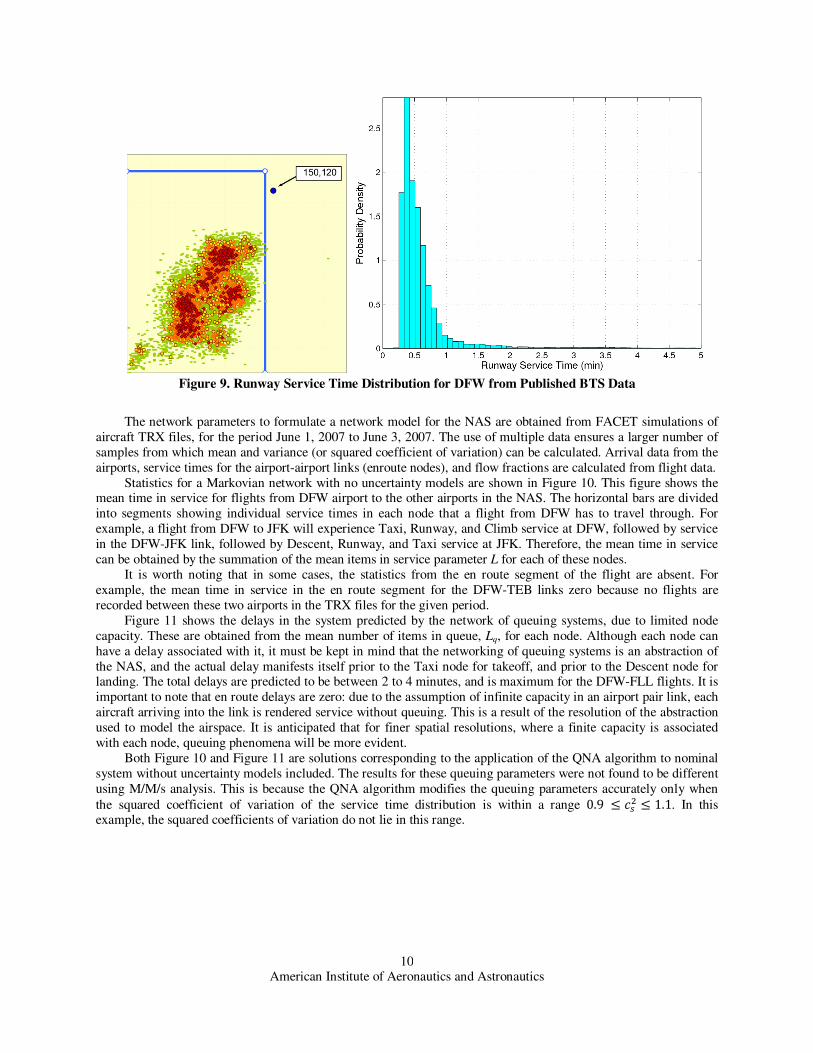
This is shown in Figure 9, for DFW airport. It is clear from the probability distribution histogram obtained on
the right, that the service time is not exponential. Due to the limited runway capacity, this is expected to have an effect on the inter-departure time distribution from the Runway, and consequently, the interval time distribution to
the other nodes in the airport and NAS.
American Institute of Aeronautics and Astronautics
10
Figure 9. Runway Service Time Distribution for DFW from Published BTS Data
The network parameters to formulate a network model for the NAS are obtained from FACET simulations of
aircraft TRX files, for the period June 1, 2007 to June 3, 2007. The use of multiple data ensures a larger number of
samples from which mean and variance (or squared coefficient of variation) can be calculated. Arrival data from the
airports, service times for the airport-airport links (enroute nodes), and flow fractions are calculated from flight data.
Statistics for a Markovian network with no uncertainty models are shown in Figure 10. This figure shows the mean time in service for flights from DFW airport to the other airports in the NAS. The horizontal bars are divided
into segments showing individual service times in each node that a flight from DFW has to travel through. For
example, a flight from DFW to JFK will experience Taxi, Runway, and Climb service at DFW, followed by service
in the DFW-JFK link, followed by Descent, Runway, and Taxi service at JFK. Therefore, the mean time in service
can be obtained by the summation of the mean items in service parameter L for each of these nodes.
It is worth noting that in some cases, the statistics from the en route segment of the flight are absent. For
example, the mean time in service in the en route segment for the DFW-TEB links zero because no flights are
recorded between these two airports in the TRX files for the given period.
Figure 11 shows the delays in the system predicted by the network of queuing systems, due to limited node
capacity. These are obtained from the mean number of items in queue, Lq, for each node. Although each node can
have a delay associated with it, it must be kept in mind that the networking of queuing systems is an abstraction of
the NAS, and the actual delay manifests itself prior to the Taxi node for takeoff, and prior to the Descent node for landing. The total delays are predicted to be between 2 to 4 minutes, and is maximum for the DFW-FLL flights. It is
important to note that en route delays are zero: due to the assumption of infinite capacity in an airport pair link, each
aircraft arriving into the link is rendered service without queuing. This is a result of the resolution of the abstraction
used to model the airspace. It is anticipated that for finer spatial resolutions, where a finite capacity is associated
with each node, queuing phenomena will be more evident.
Both Figure 10 and Figure 11 are solutions corresponding to the application of the QNA algorithm to nominal
system without uncertainty models included. The results for these queuing parameters were not found to be different
using M/M/s analysis. This is because the QNA algorithm modifies the queuing parameters accurately only when
the squared coefficient of variation of the service time distribution is within a range 0.9 ≤ �� ≤ 1.1. In this
example, the squared coefficients of variation do not lie in this range.

American Institute of Aeronautics and Astronautics
11
Figure 10. Mean Time of Aircraft in Service, Origin Airport DFW
Figure 11. Delays Predicted by Airspace Network Model
American Institute of Aeronautics and Astronautics
12
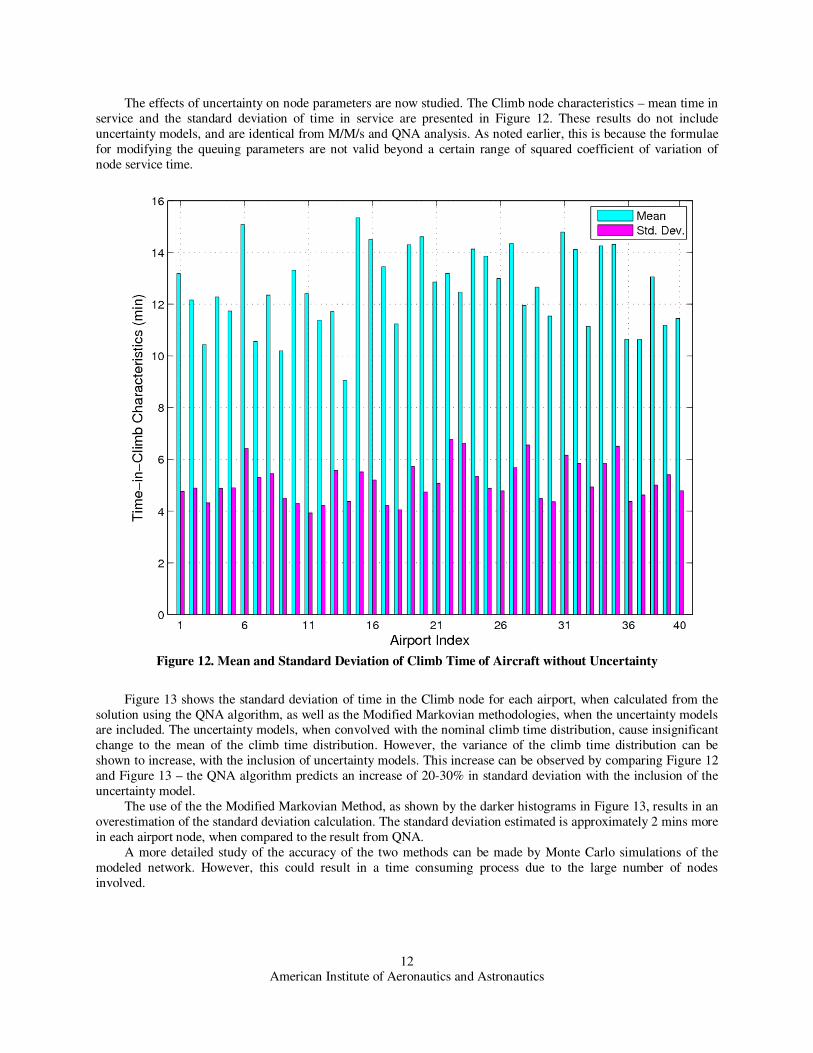
The effects of uncertainty on node parameters are now studied. The Climb node characteristics – mean time in
service and the standard deviation of time in service are presented in Figure 12. These results do not include
uncertainty models, and are identical from M/M/s and QNA analysis. As noted earlier, this is because the formulae
for modifying the queuing parameters are not valid beyond a certain range of squared coefficient of variation of
node service time.
Figure 12. Mean and Standard Deviation of Climb Time of Aircraft without Uncertainty
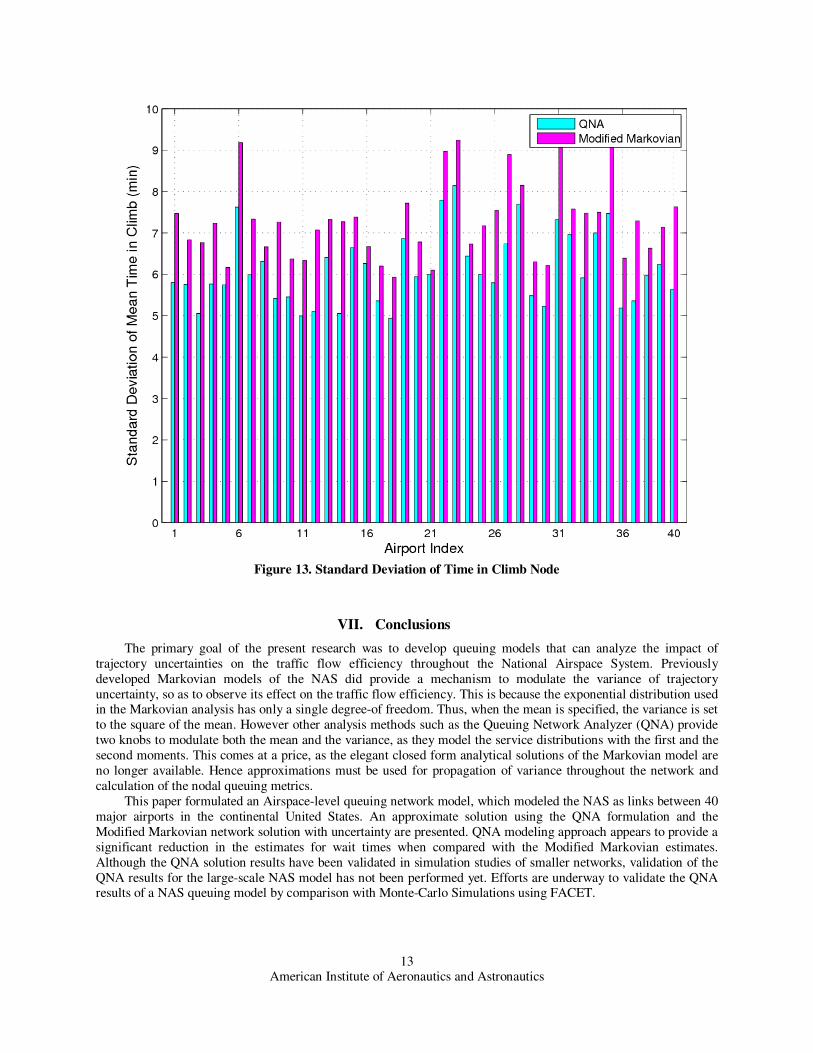
Figure 13 shows the standard deviation of time in the Climb node for each airport, when calculated from the
solution using the QNA algorithm, as well as the Modified Markovian methodologies, when the uncertainty models are included. The uncertainty models, when convolved with the nominal climb time distribution, cause insignificant
change to the mean of the climb time distribution. However, the variance of the climb time distribution can be
shown to increase, with the inclusion of uncertainty models. This increase can be observed by comparing Figure 12
and Figure 13 – the QNA algorithm predicts an increase of 20-30% in standard deviation with the inclusion of the
uncertainty model.
The use of the the Modified Markovian Method, as shown by the darker histograms in Figure 13, results in an
overestimation of the standard deviation calculation. The standard deviation estimated is approximately 2 mins more
in each airport node, when compared to the result from QNA.
A more detailed study of the accuracy of the two methods can be made by Monte Carlo simulations of the
modeled network. However, this could result in a time consuming process due to the large number of nodes
involved.
American Institute of Aeronautics and Astronautics
13
Figure 13. Standard Deviation of Time in Climb Node
VII. Conclusions
The primary goal of the present research was to develop queuing models that can analyze the impact of
trajectory uncertainties on the traffic flow efficiency throughout the National Airspace System. Previously
developed Markovian models of the NAS did provide a mechanism to modulate the variance of trajectory
uncertainty, so as to observe its effect on the traffic flow efficiency. This is because the exponential distribution used in the Markovian analysis has only a single degree-of freedom. Thus, when the mean is specified, the variance is set
to the square of the mean. However other analysis methods such as the Queuing Network Analyzer (QNA) provide
two knobs to modulate both the mean and the variance, as they model the service distributions with the first and the
second moments. This comes at a price, as the elegant closed form analytical solutions of the Markovian model are
no longer available. Hence approximations must be used for propagation of variance throughout the network and
calculation of the nodal queuing metrics.
This paper formulated an Airspace-level queuing network model, which modeled the NAS as links between 40
major airports in the continental United States. An approximate solution using the QNA formulation and the
Modified Markovian network solution with uncertainty are presented. QNA modeling approach appears to provide a
significant reduction in the estimates for wait times when compared with the Modified Markovian estimates.
Although the QNA solution results have been validated in simulation studies of smaller networks, validation of the
QNA results for the large-scale NAS model has not been performed yet. Efforts are underway to validate the QNA results of a NAS queuing model by comparison with Monte-Carlo Simulations using FACET.
American Institute of Aeronautics and Astronautics
14
Acknowledgments
This research is supported under NASA Contract No. NNA07BC55C, with Mr. Michael Bloem serving as
the Technical Point-of-Contact. Ms. Rebecca M. Grus served as the Technical Monitor.
References
1 Tandale, M. D., Menon, P. K., Cheng, V. H. L., Rosenberger, J., and Subbarao, K., “Queuing Network Models of the National Airspace System,” 8th AIAA Aviation Technology, Integration, and Operations (ATIO) Conference, Anchorage, AK, September 14 – 19, 2008.
2 Fredrick S. Hillier and Gerald J. Lieberman, “Introduction to Operations Research,” McGraw-Hill, New York, NY, 2001. 3 Whitt, W., “The Queuing Network Analyzer,” The Bell System Technical Journal, Vol. 62, Issue No. 9, November 1983. 4 Bilimoria, K. D., Sridhar, B., Chatterji, G. B., Sheth, G., and Grabbe, S., “FACET: Future ATM Concepts Evaluation
Tool,” 3rd USA/Europe Air Traffic Management R&D Seminar, Naples, Italy, June 2000. 5 Raytheon ATMSDI Team, “Airspace Concept Evaluation System Build 2 Software User Manual,” NASA Ames Research
Center, Moffett Field, CA, November 2003. 6 Harry G. Perros, “Queueing Networks with Blocking,” Oxford University Press, New York , NY, 1994, pp 15-30. 7 Medhi, J., “Stochastic Models in Queueing Theory,” 2nd Edition, Academic Press, November 12, 2002. 8 http://www.transtats.bts.gov/DL_SelectFields.asp?Table_ID=236&DB_Short_Name=On- Time 9 http://www.eurocontrol.int/eec/public/related_links/ACE_bada_documents.html: European Organization for the Safety of
Air Navigation EUROCONTROL Experimental Centre: Aircraft Performance Summary Tables for the Base of Aircraft Data (BADA) version 2.5- 3.6
10 Jaiswal, N. K., “Priority Queues,” Academic Press, New York, NY, 1968. 11 Kim, J., Palaniappan, K., Menon, P. K., Subbarao, K., and Nag, M., “Trajectory Uncertainty Modeling for Queuing
Analysis of the NAS,” AIAA Aviation Technology, Integration, and Operations Conference, Anchorage, AK, September 14 – 19, 2008.
12 Menon, P. K., Tandale, M. D., Kim, J., Sengupta, P., Kwan, J., Palaniappan K., Cheng, V. H. L., Subbarao K., Rosenberger J., Nag, M., Joshi, S. and Roongrat, C., “Multi-Resolution Queuing Models for Analyzing the Impact of Trajectory Uncertainty and Precision on NGATS Flow Efficiency ,” First Annual report prepared under NASA Contract No. NAS2-02041, Optimal
Synthesis Inc, November 18, 2008. 13 Lam, Teresa, C, “Superposition of Markov Renewal Processes and their Applications”, Technical Report No 91-92,
University of Michigan, Ann Arbor, 1990. 14 D.P. Heyman and M.J. Sobel, “Stochastic Models in Operations Research, Vol. I, New York: McGraw-Hill, 1982. 15 Marchal, W. G., “Numerical Performance of Approximate Queueing Formula with Application to Flexible Manufacturing
Systems,” Annals of Operations Research, Vol 3, 1985, (pgs141-152).