E-Textile Microinteractions: Augmenting Twist with Flick, Slide ...
Upload
khangminh22Category
view
1download
0
Quantum Coherence Effects in Biological Systems A New “Twist”
R. J. Dwayne MillerMax Planck Research Group for Structural
DynamicsDepartment of Physics, University of Hamburg,
CFEL/DESY andDepartments of Chemistry and Physics,
University of Toronto
AcknowledgementsValentyn Prokhorenko MPG,
University of Hamburg
Alexei Halpin (Physics)Philip Johnson (Chemistry)Oliver Ernst/group
(Biochem)University of Toronto
Stephen A. WaschukLeonid S. BrownDept. of PhysicsUniversity of Guelph
Ray GaoHubert Jean-RuelCheng LuNelson LuiGerman ScianiGustavo MorienaUniversity of Toronto
Shin-ya KoshiharaKen OndaTokyo Institute of TechHideki YamochiKyoto University

In the beginning….
Fundamental issue: how well is the biosystem optimized to this“light food” ??
V. Prokhorenko

Quantum Coherence and Biology
Tenet: Biological systems (at the molecular level) have evolved to control the transition state region
Barrier Crossings (transition state processes)
occur over atomic length scales ⇒ wave properties of matter become significant
Has Nature evolved to even exploit phase?
Coherence properties of waves require an interferometer to measure ⇒⇒⇒⇒ Coherent Control ≡ Molecular Frame of Reference Interferometer
Intrepid Surfer Analogy
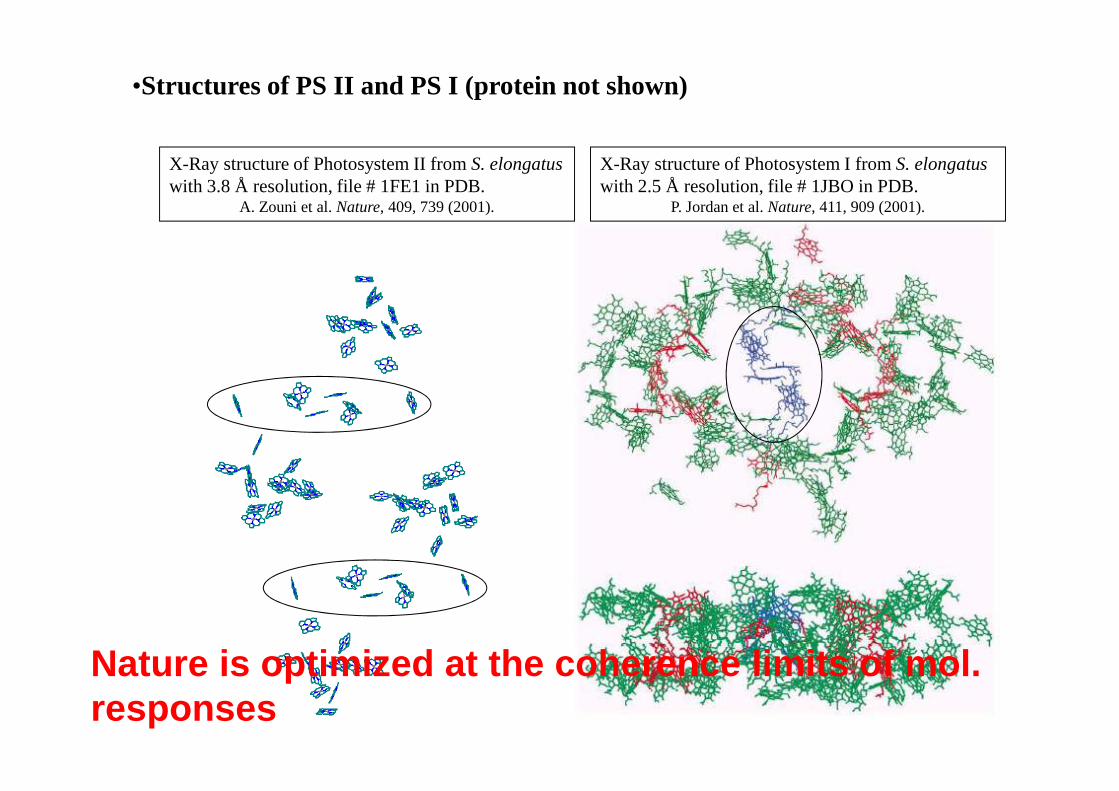
•Structures of PS II and PS I (protein not shown)
X-Ray structure of Photosystem I from S. elongatuswith 2.5 Å resolution, file # 1JBO in PDB.
P. Jordan et al.Nature, 411, 909 (2001).
X-Ray structure of Photosystem II from S. elongatuswith 3.8 Å resolution, file # 1FE1 in PDB.
A. Zouni et al.Nature, 409, 739 (2001).
Nature is optimized at the coherence limits of mol. responses

The Dream The Dream The Dream The Dream –––– Controlling Isomerization in Controlling Isomerization in Controlling Isomerization in Controlling Isomerization in
RhodopsinRhodopsinRhodopsinRhodopsin
retinalchromophore
cones
rods
Ideal System: Biologically Relevant Photoinduced Function THAT is fast enough to compete with Quantum Decoherence
http://users.rcn.com/jkimball.ma.ultranet/BiologyPages/V/Vision.html
Palczewski et al. SCIENCE 289:739
Q. Wang, R. Schonlein, L. Peteaunu, R. Mathies, C. Shank, Science 1994, 266, 422
⇒ Must Demonstrate under Weak Field Control

Bacteriorhodopsin -a Precursor to Rhodopsin
bacteriorhodopsinsare sitting in purple
membrane
cytoplasmic region
extracellular region
retinal
http://www.science.siu.edu/microbiolog/micr425/Halobacteria96

Bacteriorhodopsin photocycle
•Bacteriorhodopsin – the smallest chameleon in Nature
all-trans form: light-adapted ground state �
Efficiency of isomerization ~ 65%
http://www.science.siu.edu/microbiolog/micr425/Halobacteria96
⇒⇒⇒⇒ Reaction Dynamics can be described within a power s pectrum re: dominant mode couplings

Relevant Experimental Work
Wohlleben et al. ChemPhysChem, 6, 850, 2005 (Herek and Motkus groups)
Nuemberger et al. JCP, 125, 044512 (2006)/Vogt et al PRL 2005
Vogt et al. CPL 433, 211 (2006)
⇒⇒⇒⇒ Degree of Control Increases under Strong Field/High Intensity Conditions

CLOSED QUANTUM SYSTEMS-no coupling to bath
Single state case: 1 eigenstate ⇒ 1 pathway• no interference
� no control
Coherent Control in the Weak Field Limit
bichromic case: 2 pathways
• linear • fixed phase leads to interference
� coherent control
bichromatic control
E2E1
E
ω1ω2
OPEN QUANTUM SYSTEMS-coupling to bath, or surroundings
E1
ω1
E
• several pathways• interference at CI • phase sensitive relaxation/dissipation to bath
�coherent control
S0
S1
M. Shapiro and P. Brumer Prokhorenko et al., Chem. Phys. (2007)

350 400 450 500 550 600 650 700 7500
0.2
0.4
0.6
0.8
1
w avelength [nm]
abso
rban
ce (
norm
.)
spectrophotometermeasured in site
Laser & NOPA
Acousto-OpticPulse Shaper
Spectrometer
Sample
White Light Generator
delay line
probe signal
FROG
feedback loop
Genetic Algorithm
shaped pump
Spectrometer
• excitation energy stability (short/long-term) 0.5/1%• probe beam stability (@640 nm) 0.2%• STD of dA measurements =< 1%• simultaneous control of phases and amplitudes (the Dazzler)• available bandwidth 60 nm• normalization to actinic excitation energy
Coherent control setup

GOAL
- Control isomerization efficiency under these restrictions:a) weak field excitation (within linear responseregime)b) fixed number of absorbed photonsper laser shot
from: Kobyashi et al., Nature, v. 414 (2001)
Isomerization in terms of wave packet language: a ballistic passing of wave packet from excited state through conical intersection point (given as an “aperture”) to 13-cis ground state
from: Tretyak et al., PRL 95 2005
Coherent Control of Retinal Photoisomerization* Quantum Control of a Biological Function
*V. Prokhorenko et al. Science 2006, 313: 1257

Primary steps in bacteriorhodopsin photocycle: pump – probe kinetics of all trans ���� 13 cis isomerization
Samples:•buffer NaCl + Phosph (pH = 6.5)• OD in max. absorbance 0.8; flow cell 400 um• room temperature, MA measuring conditions, cut-off filter (probe beam)• light-adapted (before experiments and continuously during measurements• sonicated direct before measurements (for suppressing of scattering)
delay [fs]
wav
elen
gth
[nm
]
1000 2000 3000 4000 5000
500
520
540
560
580
600
620
640
660
2D-plotExcitation with 20 fs laser pulse

Decay traces at different wavelengths
0 1000 2000 3000 4000 5000 6000-10
0
10
20
30
dA [m
OD
]
0 1000 2000 3000 4000 5000 6000-80
-60
-40
-20
0
20
dA [m
OD
]
510 nm
570 nm
0 1000 2000 3000 4000 5000 6000-20
0
20
dA [m
OD
]
delay [fs]
640 nm
Growth of cis – form occurs within ττττ ~ 450 fs
Scan in delay window 50 ps: shows some decay of cis – form during ~ few ps
0 1 2 3 4 5
x 104
-5
0
5
10
15
20
delay [fs]
dA [m
OD
]
640 nm
450 500 550 600 650 700-15
-10
-5
0
5
10
w avelength [nm]dA
[mO
D]
delay 19 ps
all-trans
13-cis
↑630 nm

Optimization experiment: enhancement of cis – yield using pulse shaping
Pump: 16 nJ, delay 20 ps after excitation; observation @ 630 nm (IF 10 nm)Spectrum: controlled within 60 nm (540 – 600 nm), step 2 nm, 32 levels
Spectrum of optimal pulseOptimization process: 50 generations
Spacing between main components:~ 7.1 nm (+/- 0.9 nm)
� ~ 210 cm-1
530 540 550 560 570 580 590 600 610
λ [nm]
inte
ns
ity
0 10 20 30 40 5019
20
21
22
23
24
generat ion #
dA
[m
OD
]
the bestaveraged
Initial dA
Effect: ~ +20 %
0 100 200 300 400 500 600 7000
5
10
15
20
time of experiment [a.u.]
ac
tinic
pu
mp
en
erg
y [n
J]
V. Prokhorenko et al. Science 2006, 313: 1257

Temporal structure of the optimal pulse: FROG data and Wigner plot
delay [fs]
wav
ele
ngth
[nm
]
0 500 1000 1500 2000
520
540
560
580
600
-800 -600 -400 -200 0 200 400 600 8000
0.5
1
time [fs]
inte
nsi
ty [
a.u]
-800 -600 -400 -200 0 200 400 600 8000
10
20
phas
e [r
ad.]
-400 -200 0 200 400
550
555
560
565
570
575
580
t ime [fs]
wav
ele
ngth
[nm
]
-6
-4
-2
0
2
4Ek_6_4
-500 0 500-8
-6
-4
-2
0
2
4
6
time [fs ]
am
plit
ude
[a.
u.]
230 c m -1
390 c m -1
oscillations

Minimization experiment: suppressing cis- yield using shaped pulses
Spectrum of anti-optimal pulseAnti-optimization process: 60 generations
520 540 560 580 600 6200
0.05
0.1
wavelength [nm ]
inte
ns
ity [
a.u
.]
0 10 20 30 40 50 60
17
18
19
20
21
22
generat ion #
dA
[m
OD
]
the worstaveraged
initial dA
Effect: ~ -20%
0 10 20 30 40 50 600
5
10
15
20
time of experiment [min]
act
inic
exc
itatio
n en
erg
y [n
J]

Temporal structure of the anti-optimal pulse
delay [fs]
wav
elen
gth
[nm
]
0 500 1000 1500 2000
520
540
560
580
600
-800 -600 -400 -200 0 200 400 600 8000
0.2
0.4
0.6
0.8
1
inte
nsity
[a.
u.]
-800 -600 -400 -200 0 200 400 600 8000
10
20
30
40
50
time [fs]
phas
e [r
ad.]
-400 -200 0 200 400
550
555
560
565
570
575
580
t ime [fs]
wav
ele
ngth
[nm
]
-2
-1.5
-1
-0.5
0
0.5
1
1.5
2
2.5
# Ek_4_1
-500 0 500-3
-2
-1
0
1
2
3
4
t ime [fs]
am
plit
ude
[a.
u.]
155 cm -1
oscillations

Phase dependence: optimal pulse with - and without phase modulation
FROG of pulse with flat phaseSpectra of pulses - identical
⇒⇒⇒⇒ Coherent Control….Quantum Coherence persists along r eaction coordinate
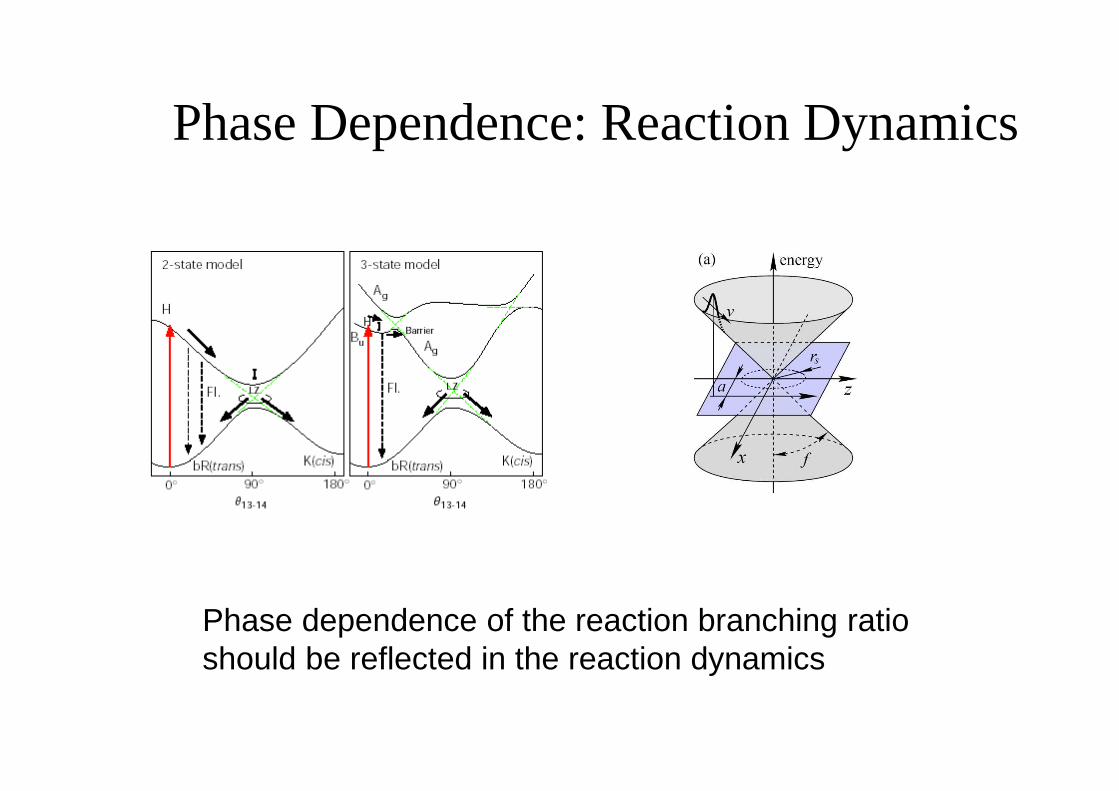
Phase Dependence: Reaction Dynamics
Phase dependence of the reaction branching ratio should be reflected in the reaction dynamics

(A1,2) – without modulation; (B1,2) – with phase modulation; (C1,2) – with flipped phase modulation
Pulse Shape Dependence of Molecular Dynamics

• Analysis of pump-probe kinetics driven by different pulses
-1 0 1 2 10 100 500
0
10
20
30
dA [
mO
D]
-1 0 1 2 10 100 500
-80
-60
-40
-20
0
-1 0 1 2 10 100 500-40
-20
0
20
delay [ps]
485 nm
558 nm
625 nm
Blue – transform-limitedRed – optimalBlack – anti-optimal
EXAMPLE:
Several traces at different wavelengths(note – actinic excitation energy all the same)

• Global Spectral Analysis
Basics:population / isomerization kinetics are sensitive to phase information contained in light
/( , ) ( ) iti
i
dA t IRF A e τλ λ −= ⊗∑

Coupling to Reaction Mode
⇒⇒⇒⇒ Driving Large Amplitude Motion along Rxn Coordinate
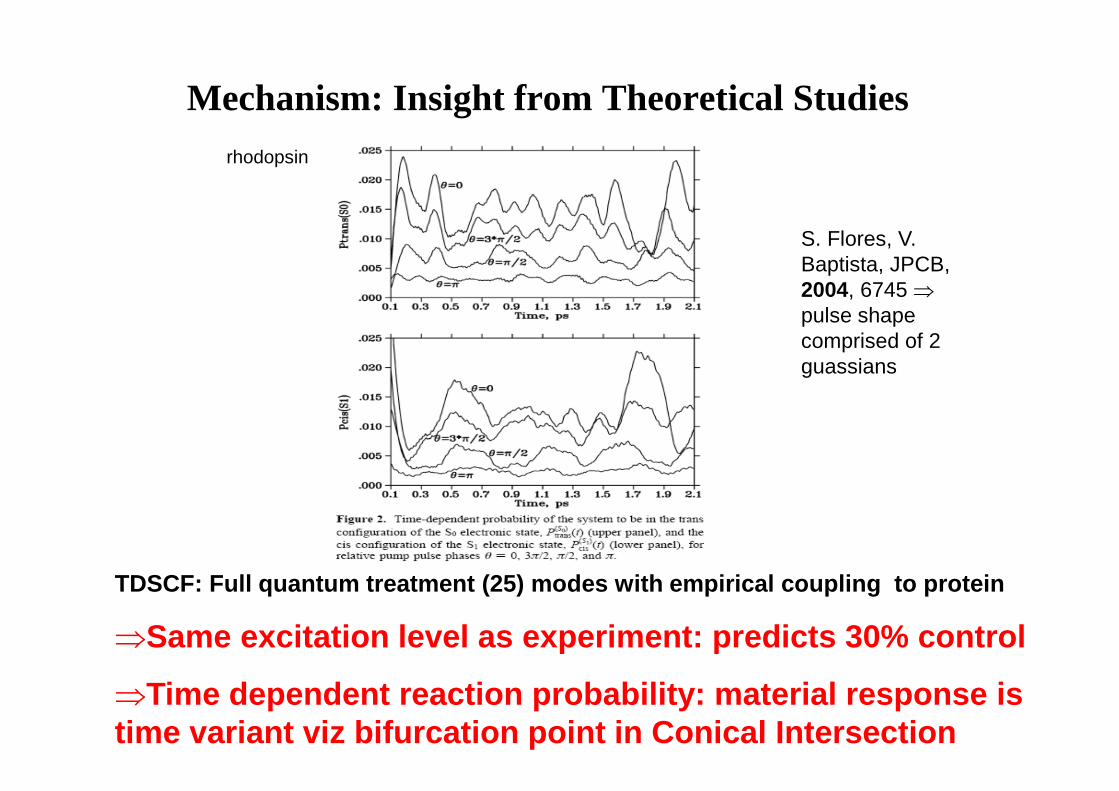
Mechanism: Insight from Theoretical Studies
TDSCF: Full quantum treatment (25) modes with empir ical coupling to protein
⇒Same excitation level as experiment: predicts 30% c ontrol
⇒Time dependent reaction probability: material respo nse is time variant viz bifurcation point in Conical Inters ection
S. Flores, V. Baptista, JPCB, 2004, 6745 ⇒pulse shape comprised of 2 guassians
rhodopsin

CONCLUSIONS (CIRCA 2009)
• Trans-cis isomerization (branching ratio) of retinal molecule in bacteriorhodopsin can be controlled in weak field limit using tailored excitation pulses (40-50%)
⇒⇒⇒⇒ control of a biological function
• Fundamental differences for weak field control in closed and open quantum systems
• Optimal pulse displays very regular temporal- and spectral structure ⇒coincides with driving torsional reaction mode modulating the conical intersection
• central spectral components are modulated with period of ~ 150, 80, 45 fs
⇒⇒⇒⇒ Coherence is conserved through barrier crossing eve nts in biological systems and can be controlled/manipulated. “Proteins know how to surf”

EXTENTION TO STRONG FIELD:THE CHALLENGE
Coherent Control Absent in High Intensity Regime in contrast to all other systems ⇒⇒⇒⇒something different about biological systems >>>> C OMPLEXITY<<<<<<<<<<<<
Isomerization is more efficient from higher lying e lectronic states.
⇒⇒⇒⇒ How can an upper level state, never accessed, be mo re efficient than evolutionary optimized state?…….contradicts weak field control res ults

No Coherence in Control
Optimal Control Pulse is observed to be Transform L imited ⇒⇒⇒⇒ No relative phase dependence, “control” only depends o n peak power
Contradicts Weak Field Control Studies and generali zed observation of increased control in strong fields
⇒⇒⇒⇒
⇒⇒⇒⇒Cis Formation Probed at 650 nm

Experiment Repeated: Chirp scans
dA vs. chirp
absorbed energy vs. chirp Rxn Yield increases withNeg. Chirp
⇒⇒⇒⇒ Phase Dependence is Observed and is Significant (16 %)
⇒⇒⇒⇒ Reproduced Results at Highest Intensity/Conditional Proof
⇒⇒⇒⇒ Florean et al/wrong monitoring wavelength/not normal ized to absorbed energy… rxn yield was not the observable

Differential absorption spectra measured at 40 ps delay after excitation (sample OD ~ 1)
Origin of observed spectral shift⇒⇒⇒⇒ionization of bR and generation of solvated electrons
⇒⇒⇒⇒ More than one photoproduct

Chirp scan of very diluted sample (OD 0.2) measured @600 nm
Absorbed energy in pure buffer vs. chirp rate
CONTROL STUDY BUFFER ONLY
Reproduces effect without protein ���� 10% of excitation absorbed due to multiphoton absorption/ionization under NONRESONANT C ONDITIONS >>>> Orders of Magnitude larger for RESONANT CONDITIONS of bR

1) Intrinsic isomerization control: wave packet acceleration
Piryatinski et al., PRL 223001 (2005)
Parameter g = v-3/2
V – speed of wave packet going though the conical intersection “aperture” (i.e., chirp of pulse)
Negatively-chirped pulses should increases isomerization efficiency
Negative chirp enhances motion to conical intersection…less time for scattering into unreactive modes

Abe et al., J.Chem.Phys. 123, 144508 (2005)
• subpulses have a period of ~ 20 fs corresponding to a carbon backbone stretch of ~1600 cm-1
Frozen two levels � does not include coupling to protein….15% for FC weighted wavepacket
General Feature ⇒⇒⇒⇒ optimum pulse is composed of subpulses timed to modes involved in reaction
20 fs 15 fs
2) Control of Isomerization: High Intensity Regime ( “Exact”)

CONCLUSIONS (CIRCA 2010)
Coherent Control demonstrated from weak field to st rong field limits
⇒Fundamental differences for weak field control in c losed and open quantum systems
⇒Key Message: Protein Structure Reduces the Reaction Coordinate to a Few Labile Coordinates
⇒⇒⇒⇒ Coherent Control must be extended to Weak Field Lim it to avoid multiphoton ionization/multiple reaction channels
⇒⇒⇒⇒ Coherence is conserved through barrier crossing eve nts in biological systems and can be controlled/manipulated. “Proteins know how to surf”
Nagging Question: How to rationalize degree of Cohe rent Control with 10 fs regime Quantum Decoherence of th e Optically Induced Polarization?


Characterizing Quantum Coherence in Biological Systems ⇒⇒⇒⇒ Coherent Multidimensional Spectroscopy
Motivation:
⇒Two-dimensional photon-echo electronic spectroscopy (2DPE) directly measures the homogeneous linewidth (pure dephasing, T2 contribution), couplings between states, and enables watching the state preparation evolve spectrally…more information on bR problem.
⇒ Anomolously long lived coherences have also been suggested to play a role in energy transport in photosynthetic systems…quantum or wave like transport…special role of the protein environment
Panitchayangkoon et al. , PNAS, 2010
Oberling, Strumpfer, Schulten, JPC, 2010

2D spectrum at T = 0
Real part
ωt
ωtω
ττ ττω
ττ ττ
∝ homogeneous width
∝ inhomogeneous width
(spectrometer)
(del
ay 1
&2)
Im. part
Increasing T � ∞
Understanding 2D-PE spectra
1) Ensemble of identical molecules
T = 0 (“correlation spectrum”)
T ���� ∞∞∞∞ (no inhomogeneous broadening)
� link between ωτ, ωt
� there is no link between variables!
correlations

2) Uncoupled molecules with different electronic transitions
Density matrix (2 molecules):
22 20 20
11 10 10
02 20 01 10 00
0 cos( )
( ) 0 cos( )
sin( ) sin( )
t
t t
t t
ρ ρ ωρ ρ ρ ω
ρ ω ρ ω ρ
=
ωt
ωττ ττ
ω01 ω02
ω01
ω02
Real part
0 0
Level diagram: 12
3) Excitonically-coupled molecules (molecular aggregate)
22 21 21 20 20
12 12 11 10 10
02 20 01 10 00
cos( ) cos( )
( ) sin( ) cos( )
sin( ) sin( )
t t
t t t
t t
ρ ρ ω ρ ωρ ρ ω ρ ρ ω
ρ ω ρ ω ρ
=
ω01 ω02ω
01ω
02
00
12 1102 10c c+22 2102 10c c+
+

Example “TLS”: Rhodamine 101
T = 0 fs
T = 40 ps

Real part of total 2D
Spectra for selected T
Model Dimer:
• Clearly resolved cross peaks – note amplitude is as expected from cross terms (e.g. µ2
Aµ2C)

AD BD
ω(cm-1) 1501 1550
τ (fs) 41.7 49.2
Quantum Beats/Homogeneous LifetimeFWHM
230 cm-1Above
Diagonal (AD)
Below Diagonal
(BD)
⇒linewidth gives an electronic dephasing time of ∼ 45 fs…also in decay of photon echo ampl.
⇒⇒⇒⇒ The antidiagonal line width and off diagonal component s are causallyrelated (FT)… long lived quantum beats are vibrational (Jonas et al –vibrational coherences enhance ET)

17600cm-1
17060cm-1
Bacteriorhodopsin

T = 0 fs
- clear vibronic structure at HOOP frequency
- negative Kerr effect
- anti-diagonal linewidth: 936 cm-1, results in a dephasing time of 11 fs (upper bound )
negative feature growing in near cis max
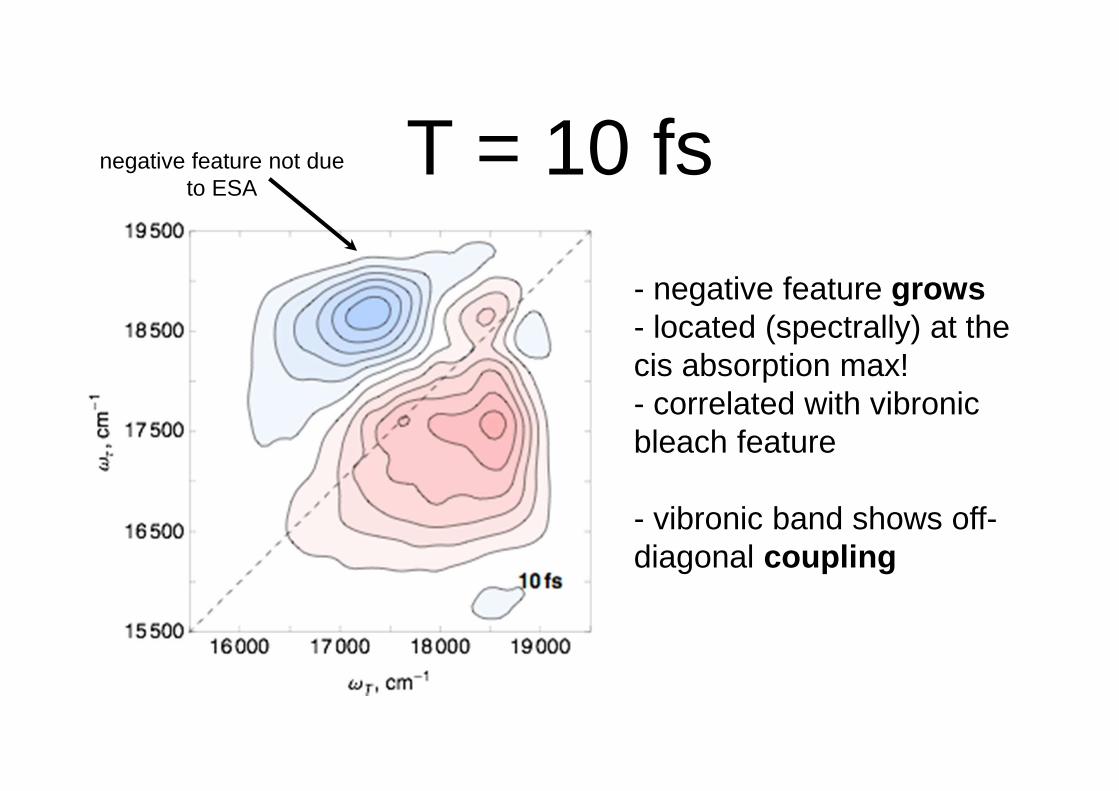
T = 10 fs
- negative feature grows- located (spectrally) at the cis absorption max!- correlated with vibronicbleach feature
- vibronic band shows off-diagonal coupling
negative feature not due to ESA

Temporal dynamicsEffect of pumping about the vibrational shoulder at 18500cm-1: clear oscillatory dynamics of the cis-like feature
Effect of pumping the linear absorption maximum at 17500cm-1: vibrational cross-peak

Fit results
Frequency, cm -1
Phase, rad
Amplitude, a.u.
Decay, fs
Mode
823 1.87 0.838 54 HOOP
210 2.73 0.731 40 Torsion
1560 1.09 0.453 53 C=C stretch
1106 2.20 0.935 42 C-C stretch
986 1.95 0.772 29 HOOP
⇒ Very strong coupling between trans and cis electronic sur faces bythe very modes directing the reaction coordinate
⇒ HIGHLY DIRECTED
CONCLUSIONS
Coherent Control demonstrated from weak field to st rong field limits
⇒Fundamental differences for weak field control in c losed and open quantum systems
⇒Key Message: Protein Structure Reduces the Reaction Coordinate to a Few Labile Coordinates
⇒⇒⇒⇒ Coherent Control must be extended to Weak Field Lim it to avoid multiphoton ionization/multiple reaction channels
⇒⇒⇒⇒ Coherence is conserved through barrier crossing eve nts in biological systems and can be controlled/manipulated. “Proteins know how to surf”
Vibrational Coupling/Coherences exploited for optim izing reaction coordinates/functions in biological system s
Copyright © 2022 FDOKUMEN