How European Are We? Explaining Georgia's Westward Aspiration

Gynecologic Oncology xxx (2013) xxx–xxx
YGYNO-975271; No. of pages: 8; 4C:
Contents lists available at ScienceDirect
Gynecologic Oncology
j ourna l homepage: www.e lsev ie r .com/ locate /ygyno
Quantitative Real Time PCR assessment of hormonal receptors and HER2status on fine-needle aspiration pre-operatory specimens from aprospectively accrued cohort of women with suspect breastmalignant lesions
Anna Garuti a,1, Ilaria Rocco a,1, Gabriella Cirmena a, Maurizio Chiaramondia b, Paola Baccini c,Massimo Calabrese d, Claudia Palermo a, Daniele Friedman e, Gabriele Zoppoli a,⁎, Alberto Ballestrero a
a Department of Internal Medicine, Istituto di Ricerca a Carattere Clinico e Scientifico (IRCCS), Azienda Ospedaliera Universitaria (AOU) San Martino Istituto Nazionale Tumori (IST), Genoa, Italyb Division of Pathology, Busto Arsizio Hospital, Busto Arsizio, Varese, Italyc Department of Surgical Sciences and Integrated Diagnostics, University of Genoa and Anatomic Pathology Service, IRCCS AOU San Martino IST, Genoa, Italyd Department of Radiology, IRCCS AOU San Martino IST, Genoa, Italye Breast Surgery Unit, Department of Surgery, University of Genoa and IRCCS AOU San Martino IST, Genoa, Italy
H I G H L I G H T S
• We assessed ER, PR, and Her-2 in FNA breast samples.• We obtain extremely accurate results using flow cytometry and PCR.• Our approach has high relevance in breast cancer neoadjuvant treatment.
Abbreviations: ER, estrogen; PR, progesterone; IHC, imneedle aspirates; QRT-PCR, quantitative real time PCR; qPrescence in situ hybridization; Ct, cycle threshold.⁎ Corresponding author at: Department of Internal
Martino IST, Viale Benedetto XV 6, 16132 Genoa, Italy.E-mail address: [email protected] (G. Zoppoli)
1 These authors contributed equally to the present stud
0090-8258/$ – see front matter © 2013 Elsevier Inc. All rihttp://dx.doi.org/10.1016/j.ygyno.2013.11.020
Please cite this article as: Garuti A, et al, Quanpre-operatory specimens from..., Gynecol On
a b s t r a c t
a r t i c l e i n f oArticle history:
Received 21 August 2013Accepted 14 November 2013Available online xxxxKeywords:Breast cancerFine needle aspirationPCRHormonal receptorsHER2
Objectives. Reliable assessment of estrogen, progesterone (ER and PR), and HER2 receptor status are essentialin breast cancer (BC) treatment. Immunohistochemical methods are limited by intra- and inter-laboratory vari-ability. Furthermore, currentmethods are not the ideal approach for reproducing the biological continuum of ER,PR, and HER2 receptor levels, due to their intrinsic, semi-quantitative nature, relying in part on subjective inter-pretation.
Methods. In the present study, we tested a molecular approach to define ER, PR, and HER2 status in fine-needle-aspirate (FNA) samples from patients with early BC. We performed flow cytometry analysis on 88 FNAspecimens from suspect BC patients to determine cellularity. We used quantitative Real Time PCR (QRT-PCR)to assess ER, PR, HER2 status, and qPCR for HER2 gene copy number (GCN).
Results. ER and PR mRNA levels showed a highly significant correlation with IHC data on surgical samples.
qPCR showedgreater accuracy than IHC in definingHER2 status. QRT-PCR defined better than IHC the continuousspectrum of the expression of the assessed receptors. Moreover, PCR analysis demonstrated a strict correlationbetweenHER2 status and higher levels of its transcript, correctly stratifyingHER2+andHER2− patients. Finally,there was a strongly significant agreement between HER2 GCN assessed on FNA specimens by qPCR and FISHdata obtained on pathological tissue specimens.Conclusions. The present results support a comprehensive approach to determine ER, PR, and HER2 status byPCR (QRT-PCR and qPCR) in FNA specimens, with high relevance for therapeutic strategies like neoadjuvanttreatment.
© 2013 Elsevier Inc. All rights reserved.
munohistochemical; FNA, fine-CR, quantitative PCR; FISH, fluo-
Medicine and IRCCS AOU San
.y.
ghts reserved.
titative Real Time PCR assessmcol (2013), http://dx.doi.org/
Introduction
Estrogen (ER), progesterone (PR) and HER2 receptors are keyfactors in determining breast cancer sensitivity to endocrine andanti-HER2 treatments. As a consequence, accurate and reliable as-sessment of ER, PR and HER2 status is of paramount relevance forclinical management.
ent of hormonal receptors and HER2 status on fine-needle aspiration10.1016/j.ygyno.2013.11.020

2 A. Garuti et al. / Gynecologic Oncology xxx (2013) xxx–xxx
Current tests to assess the status of these receptors have some limi-tations that give rise to concern in the clinical decision-making setting.Two key points are relevant.
The first problem involves correct patient classification that can alterthe predictive value of the test. In fact, there is considerable intra- andinter-laboratory variability in the diagnostic methods for both thehormone receptor by immunohistochemistry (IHC) and HER2 byfluorescence-in-situ-hybridization (FISH) determination [1,2].
For example, variability is high in low ER expressing tumors [3] andmay potentially interfere with the correct allocation of patients withinthe clinically relevant gray zone of incomplete endocrine responsive-ness [4]. Equivocal results may also be obtained through FISH HER2testing in specific cases, for examplewhen the values are in the interme-diate range, or with polysomy of chromosome 17 [2].
Secondly, current methods are not the ideal way to reproduce thebiological continuum of hormone and HER2 receptor levels due totheir intrinsic, semi-quantitative nature, which depends on the partiallysubjective interpretation of the IHC and FISH specimens by the pa-thologist. The importance of the quantitative assessment of hormonereceptors and HER2 is highlighted by several clinical trials. Indeed,the quantitative levels of these receptors correlate with patient out-come after chemo-endocrine or anti-HER2 treatment [5,6].
These results point out the possible clinical relevance of the quanti-tative levels of hormone and HER2 receptor expression rather than theuse of an absolute cut-off criterion.
On the basis of the good correlation between the amount of hor-mone receptors and HER-2 protein and their transcripts [7], nucleicacid-based molecular analysis may be a useful approach to overcomethe above mentioned limits.
Microarray gene expression profile is a reliablemethod for the quan-titative assessment of ER, PR and HER2 mRNA levels in several types oftissue samples, including whole sections, core biopsies, and fine-needleaspiration biopsies [8,9].
Quantitative polymerase chain reaction (PCR) is easy, fast, indepen-dent of specific reagents like antibodies, and it has presently reached ahigh level of sensitivity and accuracy. All these factors contribute insupporting its use as a reliable method for accurate measurement ofgene transcripts. Therefore, it is now considered the most appropriatemethod for validatingmicroarray results andwould appear to be a suit-able technique to replace microarray technology in diagnostic medicalapplications [10].
In the present study, we suggest a comprehensive approach to thedefinition of ER, PR and HER2 status by both a Real Time quantitativeReverse Transcription PCR (QRT-PCR) method to measure the mRNAlevels of the three receptors and a Real Time quantitative PCR (qPCR)method to detect the HER2 gene copy number. The tissue samplesused for the measurements were collected by fine needle aspiration(FNA), which is an easy sampling method. FNA allows the quick collec-tion of cancer cells from fresh tumor tissues and the immediate analysisof intra-cellular nucleic acids, thus avoiding any bias due to tissue pre-serving techniques.
Materials and methods
Patients and samples
This study involved 88 prospectively enrolled cases of women withsuspect breast lesions (BI-RADS category 4 or 5) referred to the BreastDiagnostic Center at IRCCS AOU San Martino IST, Genoa, Italy.
A single experienced cytopathologist performed all FNA proceduresusing a 23-gauge needle and a 13 MHz transducer under image-guidance using stereotactic ultrasound.
On the basis of the study design, we performed cytological analysisto determine cell composition, cytometric evaluation of leukocyte con-tamination, and quantitative PCR determination of ER, PR and HER2
Please cite this article as: Garuti A, et al, Quantitative Real Time PCR assessmpre-operatory specimens from..., Gynecol Oncol (2013), http://dx.doi.org/
status of all FNA samples. Sixty patients confirmed to bear a malignantlesion (cytological category C5) were included in the present study.
The first 10 patients underwent a single FNA, while the subsequent50 patients underwent two FNA procedures, the first for the conven-tional cytological diagnosis and the other for the planned study analy-ses. Samples for molecular analysis from 10 of the 50 patients whounderwent double aspiration were collected into an ATL buffer fortotal DNA extraction (QIAGEN, Valencia, CA). A small portion of each as-piration sample (1:10 of the total)was used for cytometric cellular anal-yses and the remaining cell suspension was collected into a vialcontaining 0.5 mL of RNAlater solution (Ambion, Austin, TX, USA),kept at room temperature for no more than 1 h and stored at −80 °Cuntil total RNA extraction.
Cell composition of the FNA sampleswas determined by cell counts ofthe Diff-Quik-stained slides using light microscopy at high magnification(×400). In a representative area of the slide, the first 300 cells wereclassified as tumor cells, leukocytes or stromal cells. The results wererecorded as percentages.
Leukocyte contamination was also analyzed by flow cytometry byevaluating two cell surface antigens, i.e., CD19 and CD45, which aretypically expressed in leukocytes.
Ethics committee approval was granted (no. 6/2010 director: Dr.Luigi Francesco Meloni).
Determination of hormonal-receptors and HER2 status in tumor specimens
Hormonal receptor and HER2 status for all study patients was deter-mined by IHC on formalin-fixed, paraffin-embedded tumor samplesthat were examined after surgical removal. Hormonal status was iden-tified by monoclonal antibodies 1D5 (M7047, Dako, Glostrup,Denmark) and 1A6 (M3569 Dako, DK-2600Glostrup Denmark), respec-tively for ER and PR. Samples showing nuclear staining in at least 10% ofcancer cells were defined as positive for ER or PR receptors. The Allredscore, which is a composite of the percentage of cells that stained andthe intensity of their staining, was also determined for all patients. Thepercentage of stained cells is classified from 0 to 5, while the intensityof cell staining is rated as 1, 2 or 3 [11]. The DAKOHercepTest Kit (poly-clonal antibody DA485, K5206, Dako DK-2600 Glostrup Denmark), aFood and Drug Administration (FDA) approved specific reagent, wasused to determine the amplification status of HER2. Tumors with ascore of 1+, 2+ or 3+ were confirmed by FISH (PathVision kit, VysisAutoVysion, Downers Grove, IL, USA). A positive HER2 test was definedaccording to ASCO guidelines [2].
RNA isolation, cDNA and QRT-PCR
RNA was extracted from 50 of the 60 FNA samples that were taken,using the RNAeasy Micro Kit (Qiagen, Valencia, CA) according to themanufacturer's instructions. The amount and quality of RNA wereassessed using Experion™ RNA HighSens Chips (Bio-Rad, HerculesCA). Total RNA was reverse transcribed using random hexamers in afinal volume of 50 μl as previously described [12]. The expression levelsof the target genes, ER, PR and HER2, were measured in each sample byQRT-PCR amplification performed with TaqMan Gene ExpressionAssays products in an ABI PRISM 7900 HT Fast Real Time PCR System(Applied Biosystems Monza, Italy). RPLP0 was used as the internal con-trol gene. Primers and probes were obtained from Applied Biosystems(Applied Biosystems, Monza, Italy). All measurements were performedin triplicate. The following QRT-PCR run protocol was used: activationTaq program (50 °C for 2 min and 95 °C for 10 min), amplificationand quantification program repeated 50 times (95 °C for 15 s, 60 °Cfor 1 min with a single fluorescence measurement). In the 6 cases withlow extraction yield, RNA was linearly amplified with a PreAmplifiedKit (Applied Biosystems, Monza, Italy) as previously described [13].QRT-PCR reaction was carried out in a final volume of 20 μl startingfrom 2 μl of cDNA.
ent of hormonal receptors and HER2 status on fine-needle aspiration10.1016/j.ygyno.2013.11.020

3A. Garuti et al. / Gynecologic Oncology xxx (2013) xxx–xxx
DNA isolation and qPCR
Genomic DNA was extracted from 10 of the 60 FNA samples thatwere taken, using the DNeasy Blood & Tissue Kit (Qiagen, Valencia,CA) according to themanufacturer's instructions. The amount and qual-ity of DNA were assessed with NanoDrop ND-1000 (Celbio, MI, Italy).Then, 5 ngof DNAwasused for qPCR amplificationwith TaqMan system(ABI PRISM 7900 HT Fast Real Time PCR System, Applied BiosystemsMonza, Italy) for HER2 and APP, respectively as the target and internalcontrol genes; the reaction was performed in a final volume of 20 μl.HER2 and APP primers and probes were derived from the literature[14]. All measurements were performed in triplicate. The followingqPCR run protocol was used: activation Taq program (50 °C for 2 minand 95 °C for 10 min), amplification and quantificationprogram repeat-ed 40 times (95 °C for 15 s, 60 °C for 1 min with a single fluorescencemeasurement).
In each experiment, DNA extracted from MCF7 and SKBR-3 breastcancer cell lines was included as the control for non-amplified and am-plified HER2 genes, respectively.
The DNA samples from thirty-five healthy volunteers were usedto calculate the cut-off values for amplification (range 0.91–1.48)[15]. Values below 1.5 were considered as non-amplified, thosegreater than 2.0 were considered as amplified, and those greaterthan 5.0 were scored as high-level amplification.
Data analysis
We used the comparative cycle threshold (Ct) method to determineboth the amount of mRNA encoded by each target gene and the HER2gene copy number [16]. In particular, the changes in the target gene ex-pression levels measured in tumor samples as compared to normalmammary tissue were calculated according to the 2−ΔΔCt methodusing the following formula:
ΔΔCt ¼ Ct; Targetgene−Ct; controlgeneð Þbreast tumor− Ct; Targetgene−Ct; controlgeneð Þnormalbreast:
RPLP0 was the internal control gene. HER2 gene copy number wasalso measured from qPCR data according to the previous formulawhere HER2 is the target gene and APP is the internal control gene.Human Mammary Gland RNA (Clontech Laboratories Inc.) and HumanGenomic DNA (Clontech Laboratories Inc.) were used as calibrators forgene expression assay and gene copy number determination, respec-tively. Cut-off values discriminating negative from positive ER, PR andHER2 mRNA measurements were determined by receiver operatingcharacteristic (ROC) analysis. Correlations between ER and PR mRNAexpression and IHC hormonal-receptor status and between HER2mRNA expression and IHC/FISH HER2 status were calculated bySpearman's rank correlation coefficient.
Results
Cellular composition of FNA samples
Samples of cells collected by echo-guided FNA from60 consecutivelyscreened women with suspect malignant nodules were analyzed. Thefirst ten samples were obtained from a single FNA that was split intotwo parts for diagnostic cytology and study analyses, respectively. How-ever, the number of cells that were obtained from these samples wastoo small to allow us to perform all the planned cellular and molecularanalyses, i.e., cytology, flow cytometry and PCR. Therefore, the subse-quent 50 patients underwent two FNAs, the secondofwhichwas entire-ly dedicated to the planned analyses. The percentage of tumor cells inthese 50 samples, as evaluated by cytological examination, was equalto or greater than 80% (mean 91.51%, median 97.76% range 80–99.8%),which suffices for molecular evaluation [17]. The mean value of
Please cite this article as: Garuti A, et al, Quantitative Real Time PCR assessmpre-operatory specimens from..., Gynecol Oncol (2013), http://dx.doi.org/
leukocyte contamination of the sample, as determined by flow cytome-try, was =1.98% (range 0.3–14.3).
RNA and DNA total extraction
RNAandDNAextractionswere performed on40 and10 of the 50ded-icated FNA samples, respectively. The total amount of RNA we extractedfrom 34 out of 40 samples was equal to or greater than 100 ng (mean1021 ng, range 108–4035 ng), which was enough for the direct QRT-PCR measurement of ER, PR and HER2 gene expression. Total RNA yieldin the other 6 samples was below 100 ng, mean value 28 ng (range 5–91 ng), so these samples underwent a pre-amplificationprocedure beforePCR analysis. DNA extraction performed on the 10 FNA samples dedicatedto HER2 gene copy number determination yielded enough high qualityDNA to allow qPCR analysis to be carried out. In fact, the mean value oftotal DNA extraction per sample was 510 ng (range 218–1719 ng).
RNA pre-amplification
RNApre-amplificationwas carried out on the 6 cases that had a totalRNA yield below 100 ng. It is noteworthy that this procedure can beperformed in the range from 1 to 250 ng of extracted RNA [18,19].The pre-amplification procedure was successful in all cases and allowedus to obtain an RNA yield thatwas suitable for QRT-PCR analysis. In par-ticular, we obtained more than 400 ng of amplified RNA for each case,which proved to be sufficient to perform not only the planned PCR anal-ysis of the three target genes but also multiple gene assays, such as lowdensity array. Therefore, the RNA pre-amplification technique allowedus to perform molecular analysis on all FNA samples.
Evaluation of ER and PR status by molecular analysis
ER and PRmRNA expression levels weremeasured in all 40 FNA sam-ples by QRT-PCR. The results represent the quantitative measurement ofgene expression in tumor cells relative to the normal breast tissue usedas a calibrator. In each case, QRT-PCR expression data were compared tothematched IHC data obtained from surgically removed primary tumors.
WhenmRNA expression data are listed as amonotonic series there isa ROC analysis-determined cut-off value that discriminates negative sub-groups frompositive ones (Fig. 1a and b). In fact, therewas perfect agree-ment (kappa test = 1) between IHC and QRT-PCR in classifying patientsinto negative and positive groups. Therefore, routine IHC and FNA QRT-PCR carried out on patients enrolled in this study performed just aswell in the dichotomous allocation of patients with regard to ER and PR.
According to IHC analysis, ER and PR data can be considered bothas a continuous variable, when gathered as a percentage of stainingcells, or as a discrete variable, when gathered according to Allred'score. When considered as continuous variables, IHC data show ahighly significant correlation with ER and PR mRNA levels. In fact,the Spearman correlation coefficients were 0.85 (95%CI 0.73–0.92;p b 0.0001) and 0.88 (95%CI 0.77–0.93; p b 0.0001), for ER and PR,respectively. However, by considering the distribution of the mRNAvalues within each homogeneous percentage class as defined byIHC, it is noteworthy that within each class there was a wide rangeof values which reached a maximum of 70- and 8-fold for ER andPR, respectively. This also implies some overlapping of mRNA valueswhen ranked according to the percentage of IHC positive cells(Fig. 2a and b). For instance, in the group with 50% or higher positivestaining for ER, that conventionally defines patients who are highlyresponsive to endocrine therapy, the quantity values were scatteredover a 100-fold wide range. These data suggest that in terms of clinicalbehavior, apparently IHC homogeneous patients could encompassvarious degrees of hormonal dependency.
Similar observations can be made if one considers ER and PR IHCdata as discrete variables according to Allred's score that integratesthe percentage of positive-staining tumor cells with staining intensity.
ent of hormonal receptors and HER2 status on fine-needle aspiration10.1016/j.ygyno.2013.11.020

Fig. 1.Rank orderedmRNAexpression levels of ER (a), PR (b) andHER2 (c). Each sample isidentified as negative (white column) or positive (black column) according to IHC for ERand PR status and according to IHC and FISH for HER2 status. Horizontal dotted lines indi-cate the threshold values as defined by ROC curves that discriminate patient subgroupsoptimally: ER = 0.11; PR = 0.28; HER2 = 30. *This data is out of scale, the real value is138.1.
4 A. Garuti et al. / Gynecologic Oncology xxx (2013) xxx–xxx
Despite the high correlation between the mRNA levels and Allred'sscore, correlation coefficients of 0.82 (95%CI 0.68–0.90; p b .0001) and0.90 (95%CI 0.82–0.95, p b 0.0001) for ER and PR, respectively, there isa wide distribution of the mRNA values within each homogeneousAllred's class (Fig. 3a and b).
Although derived from a small patient group, the present data sug-gest that quantitative molecular analysis may be more accurate thansemi quantitative IHC to describe the continuous spectrum of variationof ER and PR into tumor tissue.
HER2 status definition by molecular analysis
In the present series of 50patients, 44wereHER2 negative accordingto IHC (score 0 in 28, 1+ in 12 and 2+ in 4), while only 6 patients were
Please cite this article as: Garuti A, et al, Quantitative Real Time PCR assessmpre-operatory specimens from..., Gynecol Oncol (2013), http://dx.doi.org/
HER2 positive (score 3+). FISH analysis was performed on all patientswhose IHC scores were 1+ ormore and confirmed IHC results. The am-plification status of the HER2 gene can be molecularly assessed by bothmRNA levelmeasurement andDNAgene copynumber. HER2mRNAex-pression in the 40 patients evaluated by QRT-PCR shows a cut-off value,as determined by ROC analysis, that discriminates negative subgroupsfrompositive ones (Fig. 1c). In fact themolecular testwas able to clusterthese patients into two definitely distinct groups, corresponding to am-plified and non-amplified cases (Fig. 4a). The difference between thesetwo groups is highly significant (p = 0.001) and very robust. As amatter of fact, positive patients had a median value of 84.6, whichwas more than 25 times the median value of negative patients. Inthe HER2 negative patient group, no significant differences were ob-served between the three IHC score groups that define the negativestatus (Fig. 4b).
The HER2 gene was found to be amplified in two of the 10 patientsevaluated by qPCR, 2.39 and 7.99 gene copies respectively, whereas itwas not amplified in the remaining patients. These results were inagreement with the IHC/FISH and mRNA analysis (Table 1), performedon surgical samples as a control. Thus, the arranged use of the twomolecular tests, copy number and gene expression analysis, could be arobust way to correctly define the HER2 status in virtually all breastcancer patients.
Discussion
FNA is an easy sampling method that allows for the collection ofenriched cancer cells and the direct analysis of nucleic acids, therebyavoiding any bias due to tissue preserving techniques. Currentlyexisting methods allow for extraction of high-quality total RNA, whichis suitable for cDNA microarray or qPCR analysis from more than 70%of FNA samples [9,20].
In the present study, we report how FNA, performed by a trained cy-topathologist, allowed us to collect a percentage of tumor cells≥80% inall the analyzed patients, with a total RNA or DNA yield ≥100 ng in themajority of cases. Six patients in our series had an RNA yield below100 ng. However, this number of inadequate samples is likelyoverestimated because of the initial study design that foresaw the useof part of the same FNA sample for both cytometric cellular analyses,and the consequent low quantity ofmaterial suitable for RNA extractionwithout additional, time- and money-consuming pre-amplificationsteps. These six patients underwent molecular analysis after linearRNA amplification, developed in collaboration with Applied BiosystemsInc. [13].
In the present study, we tested a molecular approach for definingsimultaneously hormonal receptors and HER2 status in FNA specimensfrom patients with suspect early breast cancer. This approach is notnew, since other Authors demonstrated the feasibility and valuableresults of HER2 and/or hormone receptor status determination ondiagnostic samples, either by PCR [21,22] or IHC-based methods [23].However, our results expand such analysis to include ER and PR deter-mination by QRT-PCR. The results we obtained demonstrate that QRT-PCR performs optimally in the dichotomous allocation of patients withrespect to both ER and PR status in FNA specimens. Of interest, unlikeconventional IHC, QRT-PCR was able to discriminate between positiveand negative samples without discordant results even in spite of thesmall available material (Fig. 1a and b). Using a QRT-PCR approach,Uzan et al. [20] also reported a low discordance rate of roughly 10% inER status determination. These results were obtained in two small pa-tient groups. However, similar results were obtained [8] by usingcDNA microarray in a larger data set, confirming the validity of nucleicacid determination in pre-operatory samples.
In order to reach high performance levels, QRT-PCRmethods appliedto FNA samples have to fulfill several conditions. In particular, a trainedcytopathologist must be available to perform FNA, to carry out themicroscopic evaluation of the collected cells, and to follow material
ent of hormonal receptors and HER2 status on fine-needle aspiration10.1016/j.ygyno.2013.11.020
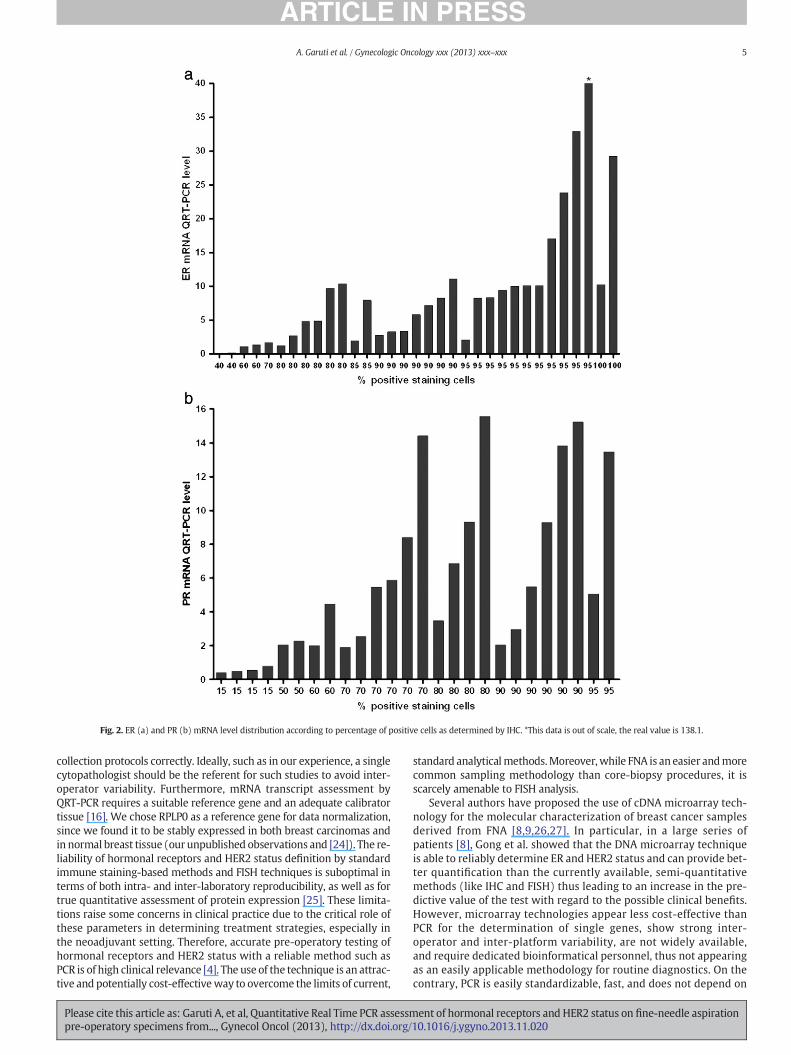
Fig. 2. ER (a) and PR (b) mRNA level distribution according to percentage of positive cells as determined by IHC. *This data is out of scale, the real value is 138.1.
5A. Garuti et al. / Gynecologic Oncology xxx (2013) xxx–xxx
collection protocols correctly. Ideally, such as in our experience, a singlecytopathologist should be the referent for such studies to avoid inter-operator variability. Furthermore, mRNA transcript assessment byQRT-PCR requires a suitable reference gene and an adequate calibratortissue [16]. We chose RPLP0 as a reference gene for data normalization,since we found it to be stably expressed in both breast carcinomas andin normal breast tissue (our unpublished observations and [24]). The re-liability of hormonal receptors and HER2 status definition by standardimmune staining-based methods and FISH techniques is suboptimal interms of both intra- and inter-laboratory reproducibility, as well as fortrue quantitative assessment of protein expression [25]. These limita-tions raise some concerns in clinical practice due to the critical role ofthese parameters in determining treatment strategies, especially inthe neoadjuvant setting. Therefore, accurate pre-operatory testing ofhormonal receptors and HER2 status with a reliable method such asPCR is of high clinical relevance [4]. The use of the technique is an attrac-tive and potentially cost-effectiveway to overcome the limits of current,
Please cite this article as: Garuti A, et al, Quantitative Real Time PCR assessmpre-operatory specimens from..., Gynecol Oncol (2013), http://dx.doi.org/
standard analyticalmethods.Moreover,while FNA is an easier andmorecommon sampling methodology than core-biopsy procedures, it isscarcely amenable to FISH analysis.
Several authors have proposed the use of cDNA microarray tech-nology for the molecular characterization of breast cancer samplesderived from FNA [8,9,26,27]. In particular, in a large series ofpatients [8], Gong et al. showed that the DNA microarray techniqueis able to reliably determine ER and HER2 status and can provide bet-ter quantification than the currently available, semi-quantitativemethods (like IHC and FISH) thus leading to an increase in the pre-dictive value of the test with regard to the possible clinical benefits.However, microarray technologies appear less cost-effective thanPCR for the determination of single genes, show strong inter-operator and inter-platform variability, are not widely available,and require dedicated bioinformatical personnel, thus not appearingas an easily applicable methodology for routine diagnostics. On thecontrary, PCR is easily standardizable, fast, and does not depend on
ent of hormonal receptors and HER2 status on fine-needle aspiration10.1016/j.ygyno.2013.11.020

Fig. 3. ER (a) and PR (b) mRNA level distribution according to Allred's classes. *This data is out of scale, the real value is 138.1.
6 A. Garuti et al. / Gynecologic Oncology xxx (2013) xxx–xxx
costly and difficult-to-handle reagents. Furthermore, it has presentlyreached high levels of sensitivity and accuracy, which strongly sup-port its use in clinical practice.
In our experience, although ER and PR mRNA levels had a highlysignificant correlation with IHC data, QRT-PCR was able to detectwider expression ranges for both genes than IHC (either expressedas a percentage of stained cells or as Allred's score, see Fig. 2a and b).These data suggest that QRT-PCR describes the continuous spectrum ofthese receptors more accurately than IHC. Also, the cost of commerciallyavailable QRT-PCR primers has been steadily declining over the lastfew years, so much so that it is often comparable with, when notsmaller than the price of IHC-grade antibodies. Hence, when the cor-relation of transcripts and their protein products is very high, anddetecting post-translational protein modifications is not the purposeof an experiment, we believe that the use of QRT-PCR as performed inour study is actually cost-effective compared to traditional immune-based cyto- or histochemistry.
Please cite this article as: Garuti A, et al, Quantitative Real Time PCR assessmpre-operatory specimens from..., Gynecol Oncol (2013), http://dx.doi.org/
Specific quantitative assessment of ER and PR expression is of poten-tially great clinical value for several reasons. It can improve the accuracyof hormonal status definition by reducing the negative effect of theintra- and inter-laboratory variability observed in IHC methods [1,28].Furthermore, theQRT-PCR approachmight allowus to define amore re-liable cut-off to predict endocrine response in the patients within the“gray zone” of incomplete endocrine responsiveness [4,29]. Finally,more precise measurement of hormone receptor quantitative levelsmay also improve their prognostic and predictive value, as suggestedby recent results from the central evaluation of randomized clinical tri-als that established a significant relationship between IHC values andpatient outcome [5,30].
ConcerningHER2 status assessment, our data support the usefulnessof the molecular test. In our patient series, QRT-PCR analysis correctlyidentified the four HER2 positive patients, whose mRNA levels wereon average 25 times higher than HER2 negative patients. Furthermore,the gene copy number measured on FNA specimens was consistent
ent of hormonal receptors and HER2 status on fine-needle aspiration10.1016/j.ygyno.2013.11.020

Fig. 4. Box and whiskers plot showing the polarization of mRNA measurements betweenHER2 negative and positive samples. Analysis was performed according to dichotomic(a) or IHC (b) groups. Rectangles = IQR (25th and 75th percentiles). Horizontal linewithin rectangle =median. Outer boundary brackets = 5th and 95th percentiles.
7A. Garuti et al. / Gynecologic Oncology xxx (2013) xxx–xxx
with the mRNA and FISH data obtained on pathological tissue samplesin the ten additional patients who underwent qPCR analysis (seeTable 1). Of course, these results require validation in larger patient co-horts. However, they represent the proof of principle for a double testapproach combining both DNA copy number and mRNA transcriptquantification. This approach may in part overcome the present limita-tions of IHC and FISH tests, in particular by resolving the issue of equiv-ocal results due to both borderline FISH results and polysomy17 (GarutiA. et al., manuscript in preparation).
In conclusion, the present results support a comprehensive PCR-based approach to define hormone receptor and HER2 status inpre-operatory FNA specimens. To our knowledge, the present workis one of the few prospectively enrolled FNA sets tested by PCR for
Table 1HER2 status in tissue samples as determined by IHC/FISH, gene expression and genecopy-number in FNA samples. In the copy number analysis, values smaller than 1.5were considered as non-amplified, whereas those greater than 2.0 were consideredas amplified. HER2 expression was performed on FFPE samples and HER2 gene wasconsidered over-expressed when the mRNA value was greater than 2.5.
Patient IHC/FISH HER2 expression (mRNA) HER2 gene (copy number)
1 neg/neg neg (0.68) Non amplified (0.91)2 neg/neg neg (0.53) Non amplified (0.88)3 neg/neg neg (0.49) Non amplified (0.82)4 pos/pos pos (31.37) Amplified (7.99)5 neg/neg neg (0.36) Non amplified (0.8)6 neg/neg neg (0.48) Non amplified (0.82)7 neg/neg neg (0.85) Non amplified (1.23)8 pos/pos pos (6.76) Amplified (2.39)9 neg/neg neg (0.44) Non amplified (0.86)10 neg/neg neg (0.23) Non amplified (0.78)
Please cite this article as: Garuti A, et al, Quantitative Real Time PCR assessmpre-operatory specimens from..., Gynecol Oncol (2013), http://dx.doi.org/
both hormone receptors and HER2 status. This approach has strongclinical implications in the neoadjuvant treatment setting. Further-more, our results point toward a high agreement with conventionalanalyses performed on surgical tissues, and may even be superiorin specific settings, by combining qPCR with QRT-PCR for HER2 statusdetermination. Nonetheless, we are aware that our results are prelimi-nary and require validation in larger patient cohorts.
Authors' contributions
AG, IL, GC, and CP participated in the study design, performed theanalyses, and carried out the experiments on RNA and DNA; PB, DFand FM supplied patients, performed FNA and evaluated the IHC andFISH analysis; MC performed ultrasound image-guidance; GZ and ECanalyzed data; and PM, GZ and AB wrote the manuscript. All authorshave read and approved the final manuscript.
Conflicts of interest
None declared.
Acknowledgments
This study was mainly supported by grants from the AssociazioneItaliana per la Lotta alle Leucemie e ai Linfomi (AIL), from Compagnia delSan Paolo and Banca CARIGE. GZ is supported by an AIRC “My First AIRCGrant” no. MFAG10570. We wish to thank Dr. P. Ciotti, Dr. P. Mandich(Department of Neuroscience, Ophthalmology and Genetics, Section ofMedical Genetics, University of Genoa, Genoa, Italy), Dr. F. Murelli (BreastSurgery Unit, Department of Surgery, University of Genoa and IRCCS AOUSanMartino IST, Genoa, Italy), andDr. E. Carminati (Department of InternalMedicine, Istituto di Ricerca a Carattere Clinico e Scientifico (IRCCS),Azienda Ospedaliera Universitaria (AOU) San Martino Istituto NazionaleTumori (IST), Genoa, Italy).
References
[1] Rudiger T, Hofler H, Kreipe HH, Nizze H, Pfeifer U, Stein H, et al. Quality assurance inimmunohistochemistry: results of an interlaboratory trial involving 172 patholo-gists. Am J Surg Pathol 2002;26:873–82.
[2] Wolff AC, HammondME, Schwartz JN, Hagerty KL, Allred DC, Cote RJ, et al. AmericanSociety of Clinical Oncology/College of American Pathologists guideline recommen-dations for human epidermal growth factor receptor 2 testing in breast cancer. ArchPathol Lab Med 2007;131:18–43.
[3] Rhodes A, Jasani B, Barnes DM, Bobrow LG, Miller KD. Reliability of immunohisto-chemical demonstration of oestrogen receptors in routine practice: interlaboratoryvariance in the sensitivity of detection and evaluation of scoring systems. J ClinPathol 2000;53:125–30.
[4] Goldhirsch A, WoodWC, Gelber RD, Coates AS, Thurlimann B, Senn HJ. Progress andpromise: highlights of the international expert consensus on the primary therapy ofearly breast cancer 2007. Ann Oncol 2007;18:1133–44.
[5] Dowsett M, Allred C, Knox J, Quinn E, Salter J, Wale C, et al. Relationship betweenquantitative estrogen and progesterone receptor expression and human epidermalgrowth factor receptor 2 (HER-2) statuswith recurrence in theArimidex, Tamoxifen,Alone or in Combination trial. J Clin Oncol 2008;26:1059–65.
[6] Krop IE, Winer EP. Ten years of HER2-directed therapy: still questions after all theseyears. Breast Cancer Res Treat 2009;113:207–9.
[7] Brown PO, Botstein D. Exploring the newworld of the genomewith DNAmicroarrays.Nat Genet 1999;21:33–7.
[8] Gong Y, Yan K, Lin F, Anderson K, Sotiriou C, Andre F, et al. Determination ofoestrogen-receptor status and ERBB2 status of breast carcinoma: a gene-expression profiling study. Lancet Oncol 2007;8:203–11.
[9] SymmansWF, Ayers M, Clark EA, Stec J, Hess KR, Sneige N, et al. Total RNA yield andmicroarray gene expression profiles from fine-needle aspiration biopsy and core-needle biopsy samples of breast carcinoma. Cancer 2003;97:2960–71.
[10] Perez-Diez A, Morgun A, Shulzhenko N. Microarrays for cancer diagnosis and classi-fication. Adv Exp Med Biol 2007;593:74–85.
[11] Harvey JM, Clark GM, Osborne CK, Allred DC. Estrogen receptor status by immuno-histochemistry is superior to the ligand-binding assay for predicting response to ad-juvant endocrine therapy in breast cancer. J Clin Oncol 1999;17:1474–81.
[12] Ballestrero A, Coviello DA, Garuti A, Nencioni A, Fama A, Rocco I, et al. Reverse-transcriptase polymerase chain reaction of the maspin gene in the detection ofbone marrow breast carcinoma cell contamination. Cancer 2001;92:2030–5.
[13] Ciotti P, Garuti A, Ballestrero A, Cirmena G, ChiaramondiaM, Baccini P, et al. Reliabilityand reproducibility of a RNA preamplification method for low-density array analysis
ent of hormonal receptors and HER2 status on fine-needle aspiration10.1016/j.ygyno.2013.11.020

8 A. Garuti et al. / Gynecologic Oncology xxx (2013) xxx–xxx
from formalin-fixed paraffin-embedded breast cancer samples. Diagn Mol Pathol2009;18:112–8.
[14] Lehmann U, Glockner S, Kleeberger W, von Wasielewski HF, Kreipe H. Detectionof gene amplification in archival breast cancer specimens by laser-assistedmicrodissection and quantitative real-time polymerase chain reaction. Am JPathol 2000;156:1855–64.
[15] KonigshoffM,Wilhelm J, Bohle RM, PingoudA,HahnM.HER-2/neu genecopy numberquantified by real-time PCR: comparison of gene amplification, heterozygosity, andimmunohistochemical status in breast cancer tissue. Clin Chem 2003;49:219–29.
[16] Livak KJ, Schmittgen TD. Analysis of relative gene expression data using real-timequantitative PCR and the 2(−Delta Delta C(T)) Method. Qual Assur 2001;25:402–8.
[17] Wang Y, Klijn JG, Zhang Y, Sieuwerts AM, Look MP, Yang F, et al. Gene-expressionprofiles to predict distant metastasis of lymph-node-negative primary breast cancer.Lancet 2005;365:671–9.
[18] Li J, Smyth P, Cahill S, Denning K, Flavin R, Aherne S, et al. Improved RNA quality andTaqMan Pre-amplification method (PreAmp) to enhance expression analysis fromformalin fixed paraffin embedded (FFPE) materials. BMC Biotechnol 2008;8:10.
[19] Mengual L, Burset M, Marin-Aguilera M, Ribal MJ, Alcaraz A. Multiplexpreamplification of specific cDNA targets prior to gene expression analysis byTaqMan Arrays. BMC Res Notes 2008;1:21.
[20] Uzan C, Andre F, Scott V, Laurent I, Azria E, Suciu V, et al. Fine-needle aspiration fornucleic acid-based molecular analyses in breast cancer. Cancer 2009;117:32–9.
[21] Susini T, Bussani C, Marini G, Nori J, Olivieri S, Molino C, et al. Preoperative assess-ment of HER-2/neu status in breast carcinoma: the role of quantitative real-timePCR on core-biopsy specimens. Gynecol Oncol 2010;116:234–9.
Please cite this article as: Garuti A, et al, Quantitative Real Time PCR assessmpre-operatory specimens from..., Gynecol Oncol (2013), http://dx.doi.org/
[22] Konofaos P, Kontzoglou K, Parakeva P, Kittas C, Margari N, Giaxnaki E, et al. The roleof ThinPrep cytology in the investigation of ki-67 index, p53 and HER-2 detection infine-needle aspirates of breast tumors. J BUON 2013;18:352–8.
[23] Tamaki K, Sasano H, Ishida T, Miyashita M, Takeda M, Amari M, et al. Comparison ofcore needle biopsy (CNB) and surgical specimens for accurate preoperative evaluationof ER, PgR and HER2 status of breast cancer patients. Cancer Sci 2010;101:2074–9.
[24] Lyng MB, Laenkholm AV, Pallisgaard N, Ditzel HJ. Identification of genes for normal-ization of real-time RT-PCR data in breast carcinomas. BMC Cancer 2008;8:20.
[25] Hayes DF. Quantitative measures of oestrogen receptor and ERBB2 expression.Lancet Oncol 2007;8:184–5.
[26] Assersohn L, Gangi L, Zhao Y, Dowsett M, Simon R, Powles TJ, et al. The feasibility ofusing fine needle aspiration from primary breast cancers for cDNA microarray anal-yses. Clin Cancer Res 2002;8:794–801.
[27] Sotiriou C, Powles TJ, Dowsett M, Jazaeri AA, Feldman AL, Assersohn L, et al. Geneexpression profiles derived from fine needle aspiration correlate with response tosystemic chemotherapy in breast cancer. Breast Cancer Res 2002;4:R3.
[28] Roche PC, Suman VJ, Jenkins RB, Davidson NE, Martino S, Kaufman PA, et al. Concor-dance between local and central laboratory HER2 testing in the breast intergrouptrial N9831. J Natl Cancer Inst 2002;94:855–7.
[29] Increasing steroid hormone receptors expression defines breast cancer subtypes nonresponsive to preoperative chemotherapy. Breast Cancer Res Treat 2009;116:359–69.
[30] Chemoendocrine compared with endocrine adjuvant therapies for node-negativebreast cancer: predictive value of centrally reviewed expression of estrogen andprogesterone receptors—International Breast Cancer Study Group. J Clin Oncol2008;26:1404–10.
ent of hormonal receptors and HER2 status on fine-needle aspiration10.1016/j.ygyno.2013.11.020
Copyright © 2022 FDOKUMEN