Remote Sensing based detection of landmine suspect areas ...
250
Remote Sensing based detection of landmine suspect areas and minefields Dissertation zur Erlangung des Doktorgrades der Naturwissenschaften im Fachbereich Geowissenschaften der Universität Hamburg vorgelegt von Ben Maathuis aus Borne (NL) Hamburg 2001
-
Upload
khangminh22 -
Category
Documents
-
view
4 -
download
0
Transcript of Remote Sensing based detection of landmine suspect areas ...

Remote Sensing based detection of
landmine suspect areas and minefields
Dissertation
zur Erlangung des Doktorgrades der Naturwissenschaften im Fachbereich
Geowissenschaften der Universität Hamburg
vorgelegt von
Ben Maathuis
aus
Borne (NL)
Hamburg
2001

Als Dissertation angenommen vom Fachbereich Geowissenschaften der Universität Hamburg auf Grund der Gutachten von Prof. Dr. J. Oßenbrügge Prof. Dr. H. Spitzer Prof. Dr. J.L. van Genderen Hamburg, den 19 Dezember 2001
Prof. Dr. U. Bismayer Dekan
des Fachbereichs Geowissenschaften

Ben Maathuis
Remote Sensing based detection of
landmine suspect areas and minefields

The research presented in this thesis was conducted at the International Institute for Aerospace Survey and Earth Sciences (ITC) P.O. Box 6, 7500 AA, Enschede, The Netherlands
Keywords: humanitarian demining, landmines, minefields, level 1-2 and 3 surveys, suspect areas, area reduction, minefield boundary, input- process- outcome and impact indicators, remote sensing, airborne surveys, multi sensor, aerial photographs, satellite images, image fusion, photo interpretation, image enhancement, multi-temporal image analysis, change detection
© 2001 Ben Maathuis
International Institute for Aerospace Survey and Earth Sciences P.O. Box 6, 7500 AA, Enschede, The Netherlands.

Contents
i
Contents Acknowledgements .............................................................................................................v List of acronyms and abbreviations .................................................................................. vii List of tables .......................................................................................................................xi List of figures .................................................................................................................. xiii
1 Introduction .................................................................................1 1.1 Introduction ...................................................................................................................1
1.1.1 Background ...........................................................................................................1 1.1.2 Landmines.............................................................................................................2 1.1.3 Countermine operation and mine action ...............................................................5 1.1.4 Mine action challenge ...........................................................................................6 1.1.5 Remote sensing .....................................................................................................7
1.2 Research questions and objectives ................................................................................8 1.3 Assumptions and hypotheses ........................................................................................9 1.4 Outline of the thesis ......................................................................................................9
2 Overhead detection of minefields, a review of sensors and techniques.........................................................................11
2.1 Introduction .................................................................................................................11 2.2 Military space imaging ...............................................................................................13 2.3 Civilian space imaging ................................................................................................15 2.3.1 Optical: film based systems ................................................................................15 2.3.2 Optical: multispectral whiskbroom scanners ......................................................19 2.3.3 Optical: multispectral and panchromatic pushbroom scanners ...........................20 2.3.4 Thermal remote sensing systems ........................................................................24 2.3.5 Microwave remote sensing systems....................................................................24 2.4 Airborne sensor developments ....................................................................................26
2.4.1 Optical techniques...............................................................................................26 2.4.1.1 Film-based photogrammetric cameras.....................................................26 2.4.1.2 Digital multispectral cameras ..................................................................30 2.4.1.3 Hyperspectral scanners ............................................................................32
2.4.2 Thermal infrared techniques ...............................................................................34 2.4.2.1 Shortwave infrared: 3-5 Microns.............................................................35 2.4.2.2 Longwave infrared: 8-12 Microns ...........................................................37 2.4.2.3 Polarimetric infrared techniques..............................................................40 2.4.2.4 Passive millimeter wave imaging ............................................................40
2.4.3 Microwave techniques ........................................................................................42 2.4.4 Concluding remarks ............................................................................................44 2.5 Image analysis for minefield detection........................................................................45
2.5.1 Visual image interpretation.................................................................................45 2.5.2 Digital image processing.....................................................................................46 2.5.3 Change detection analysis ...................................................................................49 2.5.4 Multisensor image fusion....................................................................................50

Contents
ii
2.6 Summary......................................................................................................................54
3 Indicators for minefield detection............................................57 3.1 Introduction .................................................................................................................57 3.2 Typology of indicators.................................................................................................57 3.3 Appearance of defensive minefields............................................................................60 3.4 Minefield indicators for Angola, Mozambique and Zimbabwe...................................63 3.4.1 Introduction.........................................................................................................63
3.4.2 Minefield indicators ............................................................................................65 3.5 Minefield indicators for Central Europe, an example from Croatia ............................67 3.6 Summary......................................................................................................................69
4 Methodology..............................................................................71 4.1 Introduction .................................................................................................................71 4.2 Research approach and methodology ..........................................................................71
4.2.1 Research approach ..............................................................................................71 4.2.2 Research methodology........................................................................................72
4.2.2.1 Phase 1: Blind test, Belgium....................................................................72 4.2.2.2 Phase 2: Airborne minefield detection in Mozambique...........................75 4.2.2.3 Phase 3: Satellite image analysis for minefield detection........................77
4.3 Summary......................................................................................................................79
5 The Belgium test .......................................................................81 5.1 Introduction .................................................................................................................81 5.2 Belgium pilot study .....................................................................................................81
5.2.1 Description of pilot area......................................................................................81 5.2.2 Sensors used and data acquired during the Belgium airborne campaign ............87
5.3. Data processing...........................................................................................................88 5.3.1 Aerial film...........................................................................................................88 5.3.2 Other airborne sensors ........................................................................................89
5.4 Visual interpretation of the analogue data, Belgium....................................................90 5.4.1 Introduction.........................................................................................................90 5.4.2 Test field “C” .....................................................................................................90 5.4.3 Other minefields in the Belgium pilot area .........................................................93 5.4.4 Discussion on interpretation results obtained......................................................97
5.5 Analysis of digital image data recorded of the pilot area in Belgium........................101 5.5.1 Digital camera...................................................................................................101 5.5.2 Thermal infrared ...............................................................................................103
5.5.2.1 Recon Optical CA-860 IRLS.................................................................103 5.5.2.2 Westinghouse Micro FLIR....................................................................106
5.5.3 X and P band Radar ..........................................................................................107 5.6 Satellite change detection ..........................................................................................111 5.7 Discussion on image analysis results obtained ..........................................................113 5.8 Limitations of the test conducted...............................................................................115 5.9 Summary....................................................................................................................116

Contents
iii
6 Standoff minefield detection in Africa...................................119 6.1 Introduction ...............................................................................................................119 6.2 Mozambique pilot study ............................................................................................120
6.2.1 Description of the pilot areas ............................................................................120 6.2.1.1 Introduction ...........................................................................................120 6.2.1.2 Buzi .......................................................................................................122 6.2.1.3 Bandua...................................................................................................122 6.2.1.4 Mameme ................................................................................................122 6.2.1.5 Songo.....................................................................................................123
6.3 The airborne campaign in Mozambique ....................................................................124 6.4 Image interpretation and analysis of the Mozambique test areas ..............................126
6.4.1 Introduction.......................................................................................................126 6.4.2 Buzi...................................................................................................................126 6.4.3 Bandua ..............................................................................................................128 6.4.4 Mameme ...........................................................................................................130 6.4.5 Songo ................................................................................................................131
6.5 Discussion on airborne image analysis results obtained............................................133 6.6 Satellite data collected ...............................................................................................136
6.6.1 Introduction.......................................................................................................136 6.6.2 Mozambique pilot area......................................................................................136 6.6.3 Zimbabwe border areas.....................................................................................137
6.7 Space borne data analysis ..........................................................................................138 6.7.1 Introduction.......................................................................................................138 6.7.2 Satellite based change detection analysis for the detection of
minefield indicators, Songo...............................................................................139 6.7.3 Multi-temporal space and airborne image analysis ...........................................146
6.7.3.1 Introduction ...........................................................................................146 6.7.3.2 The north-east border minefield ............................................................147 6.7.3.3 The Eastern Highlands ..........................................................................150 6.7.3.4 Satellite based detection of selected border minefield sections.............153
6.8 Discussion on the analysis results obtained ...............................................................157 6.9 Summary....................................................................................................................160
7 6 Conclusions and Recommendations .................................161 7.1 Conclusions ...............................................................................................................161 7.2 Recommendations for further research......................................................................176

Contents
iv
Summary.....................................................................................179
Zusammenfassung ....................................................................183
References..................................................................................189
About the author ........................................................................205
Appendices.................................................................................207 Appendix 1: Samples of image enlargements..................................................................207 Appendix 2: Sources and details of images and tables presented in the thesis ................221

Acknowledgements
v
Acknowledgements It would not have been possible to conduct the research, write and complete this thesis without the support and collaboration of a large number of persons and institutions that have been involved during the various stages of this research and I would like to take this opportunity to express my sincere thanks and gratitude to them. First of all, I would like to thank Prof. Dr. J.L. van Genderen for his confidence, guidance, support and supervision during the last four years. John, without the encouraging working environment you created, completing this thesis would not have been possible! I am also very appreciative of the guidance, help and support I have received from Prof. Dr. J. Oβenbrügge and Prof. Dr. H. Spitzer, in their capacity as promotor and co-promotor respectively. I am very grateful for their valuable suggestions and comments on this thesis. The initial phases of this research were carried out using data collected within the framework of a European Pilot Project entitled: “Airborne Minefield Detection Pilot Project”. This project was funded by the European Commission (EC), the Belgium Ministries of Foreign Affairs and Development Cooperation, the German Ministry of Foreign Affairs, the Department for International Development, Great Britain, the Luxembourg Ministry of Foreign Affairs and the Portuguese Development Cooperation. Special thanks go to K.J. Ehbets (EC) who was crucial in the initiation of this project. This project was furthermore supported by the project partners involved: CAE Aviation (Luxembourg), EOS and Recon Optical (both from Great Britain), Eurosense, VUB, RMA, Aerodata (all from Belgium), IGI, ZEO and Aerosensing (all from Germany), Geograf (Portugal) and Swedish Space Corporation (Sweden). It was a great pleasure for me to meet and work with a large number of people from these organizations. Although it is not possible to list everybody involved, I would especially like to mention the following persons: M. Acheroy, F. de Boeck, J. de Bono Paula, S. Bot, U. de Bruyn, P. Bullus, Y. Cardoen, J. Cornelis, D. van Damme, P. Dellisse, R. Derkum, P. Druyts, K. Ebrecht, D. Fransaer, J. Knicker, M. Hermann, F. Mack, A. Grimm, A. Katarzis, L. Lambrechts, E. Maes, J. Moreira, R. Morgado, R. Mota, A. Muls, W. Philipse, V. Pizurica, G. Rönnbäck, H. Sahli, J.P. Salmon, P. Stabile, J.P. van Tongerlo, B. Uhl, K. Wallace, R. Wane, H. van Wijk, P. Wirths, Y. Yvinec and B. Zeler, who initially came with the idea of a humanitarian airborne minefield detection platform. Also ITC provided funds for this pilot project and the support of ITC’s Directorate is gratefully acknowledged. Special thanks are due to my colleagues within ITC, from the various support departments, like the Bureau of Project Coordination, Information Technology Department, Library and Facility Management. The following persons provided excellent support: J. Beerens, J. Duim, R. Geerdink, C. Gerritsen, B. Masselink, A. Mulder, M. Noort, G. Polman, G. Reinink, J. Schipper. I should also thank the ITC for giving me the opportunity to continue with this research after the project was completed and the possibility to finalize the writing. I greatly appreciate the attitude of my colleagues from the Division of Applied Geomorphology, as they had to cope with my part-time absence. I apologize for the additional tasks you had to fulfil during the time I have spend

Acknowledgements
vi
on this research. Special thanks also go to R. Voskuil and M. Damen for their assistance during the initial image interpretation. Also H. Jellema and B. van Veen are thanked for their contributions and support, K. Sijmons for his assistance during map preparation. K. Neumann for translating the summary in German. A special word of thanks should go to Loes Colenbrander: “without your secretarial skills, excellent coordination support and the first cup of coffee in the morning, I would have been lost long before the day was over”. I wish to acknowledge the scientific and technical support, advice and contributions by A. Sieber (European Commission’s Joint Research Centre, Space Applications Institute, Ispra, Italy) and A. Craib of Baric Consultants Ltd. (Great Britain). I am also indebted to P. Blagden from the Geneva International Centre for Humanitarian Demining. Your critical comments and support towards the topic of this thesis kept me motivated to complete this work. Also the information provided on the Zimbabwe minefields was instrumental in completing the analysis on these minefields. Furthermore the support of the humanitarian demining organizations is gratefully acknowledged, especially the Norwegian People’s Aid, for their collaboration, logistical support during the airborne campaign and subsequent field validation. I would especially like to mention a number of persons of their staff in Mozambique: F. Muzima, U. Hanssen, M. Fernandes (Mila) and C. Persson, who have all been extremely supportive, kind and dedicated towards mine action. Persons from other humanitarian demining organizations in Mozambique and elsewhere to be mentioned here are: O.M. Severiano and his successor A. Verissino (IND), J. D’Almeida (UNADP), M. Wilson (HI), M. Bajić (CROMAC) and H.E. da Silva Cruz (INAROEE). F. Pabian, Los Alamos National Laboratory (University of California, USA), is gratefully acknowledged for reviewing chapter two. His critical comments and suggestions are greatly appreciated. M. Ward (Airsurv, Harare, Zimbabwe) and Mr. A. Orlovsky (Sovinformsputnik, Moscow) provided supplementary air and spaceborne data that have been used in this thesis. The assistance provided by A.A. Nielsen (Department of Mathematical Modelling, Technical University of Denmark, Lyngby), using dedicated software, allowed for the evaluation of a multivariate alteration detection algorithm. For his input I would like to express my sincere thanks. I would like to thank all those that are not mentioned above by name, but who have contributed in their way to the successful completion of this thesis. Finally I would like to thank my parents for their moral support and giving me the opportunity to obtain a higher education. The most I am indebted to are my wife Margriet and our children, Margot and Bram, and have highly appreciated their patience. Margot and Bram, once you have children, I hope that they can freely roam around, as well as all those in war affected areas, without having to fear from this lethal and long lasting form of pollution. I hope that this research can have a small contribution towards this objective.

List of acronyms and abbreviations
vii
List of acronyms and abbreviations AHI Airborne Hyperspectral Imager AMIDARS Airborne Minefield Detection and Reconnaissance System ANC African National Congress AP Anti-personnel landmine ASTAMIDS Airborne Standoff Minefield Detection System ASTER Advanced Spaceborne Thermal Emission and Reflection Radiometer AT Anti-tank landmine BMP Windows BitMap B&W IR Black and White InfraRed CASI Compact Airborne Spectrographic Imager CCD Charge-Coupled Device CCNS Computer Controlled Navigation System CCW United Nations Convention on Conventional Weapons CIR Colour InfraRed CMADS CounterMine Airborne Detection System COBRA Coastal Battlefield Reconnaissance and Analysis System DBIR Dual Band InfraRed DERA Defence Evaluation and Research Agency (D)GPS (Differential) Global Positioning System DN Digital Number DPI Dots Per Inch DOD Department of Defence (United States) DOE Department of Energy DoLP Degree of Linear Polarization DoP Degree of Polarization DOVO Dienst voor Opruiming en Vernietiging van Ontploffingstuigen
(“Belgium Interservices Bomb Disposal Unit”) EC Evolutionary Computation EROS-A1 Earth Remote Observation Satellite A1 ERS European Remote Sensing Satellite ETM Enhanced Thematic Mapper FAA Forças Armadas Angolanas FLIR Forward Looking InfraRed FOA Swedish Defence Research Agency FRELIMO Frente de Libertação de Moçambique GA Generic Algorithm GENIE Genetic Imagery Exploitation GIF Graphical Interchange Format HALO-Trust Hazardous Areas Life-support Organization HCR Croatian Mine Action Centre HMD Hyperspectral Mine Detection Program HVR High Resolution Visible ICBL International Campaign to Ban Landmines

List of acronyms and abbreviations
viii
ICRC International Committee of the Red Cross IHS Intensity Hue Saturation IMC Intensified Motion Compensated IMU Inertial Measurement Unit IR InfraRed IRLS InfraRed Line Scanner IRPC InfraRed Polarimetric Camera IRS Indian Remote Sensing Satellite ITC International Institute for Aerospace Survey and Earth Sciences IVOF Instantaneous Field Of View JERS Japanese Earth Resources Satellite KH Keyhole, Corona mission camera assignment LFC Large Format Camera Lp/mm Line pairs / millimetre L/s Lines / second LWIR Long Wave InfraRed MAD Multivariate Alteration Detection MAF Maximum Autocorrelation Factor MBPS Mega Bit Per Second MFLIR Manportable Forward Looking InfraRed MRA Multi Resolution Analysis MRP Modular or Multipurpose Reconnaissance Pod MS Multi Spectral MTI Multispectral Thermal Imager MWD Multiresolution Wavelet Decomposition MWIR Mid Wave InfraRed NATO North Atlantic Treaty Organization NDVI Normalized Difference Vegetation Index NETD Noise Equivalent Temperature Delta NGO Non Governmental Organization NPA Norwegian People’s Aid PCA Principal Component Analysis PmmW Passive millimetre Wave POS/DG Positioning and Orientation System for Direct Georeferencing RBV Return Beam Vidicon RCS Radar Cross Section REMIDS Remote Minefield Detection System RENAMO Resistência Nacional Moçambicana SAR Synthetic Aperture Radar SIR Shuttle Imaging Radar SPOT Système Pour l’Observation de la Terre STANAG NATO international standardisation agreement SWIR Short Wave InfraRed TARPS-CD Tactical Air Reconnaissance Pod System – Completely Digital TEMPS Temperature Evaluated Mine Position Survey TIFF Tagged Image File Format

List of acronyms and abbreviations
ix
TM Thematic Mapper TNT Trinitrotoluene, a constituent of many explosives UAV Unmanned Aerial Vehicle UNITA União Nacional para a Libertação Total de Angola UWB Ultra Wide Band VNIR Visible – Near InfraRed VOF Field of View WWMP World Wide Mission Planning ZANLA Zimbabwean National Liberation Army ZEO Zeiss-Eltro Optronics GmbH


List of tables
xi
List of tables Table 2.1: Operational overview, Corona reconnaissance program ..............................14 Table 2.2: System performance data, Corona reconnaissance program ........................14 Table 2.3: Main characteristics of (declassified) Russian space photography...............19 Table 2.4: Performance parameters of commercial 1 metre satellites ...........................23 Table 2.5: System characteristics of medium resolution earth orbiting radar
satellites........................................................................................................25 Table 2.6: Spectral sensitivity of available aerial film types .........................................27 Table 2.7: Performance data VOS 80 C ........................................................................30 Table 2.8: Comparison of infrared mine detection techniques ......................................40 Table 2.9: Image resolution (metres) necessary for different levels of analysis
on targets of interest .....................................................................................46 Table 3.1: Indirect minefield related objects for Mozambique and Angola ..................66 Table 3.2: Minefield indicators in the zone of separation in Croatia.............................68 Table 5.1: Mine type and number of mines deployed per minefield “Kamp
Beverloo” .....................................................................................................83 Table 5.2: Details on the landmines used at the test site ...............................................83 Table 5.3: Other relevant minefield details ...................................................................83 Table 5.4: Data acquired of the Belgium test site “Kamp Beverloo”,
9-13 May, 1998 ............................................................................................88 Table 6.1: Large scale airborne data collected of the pilot areas in
Mozambique..............................................................................................125 Table 6.2: Comparison of results with survey reports ................................................135 Table 6.3: Satellite data selected for the Songo region, NW Mozambique ................137 Table 6.4: Satellite data acquired of the border region of Zimbabwe.........................137 Table 6.5: Multi-temporal panchromatic aerial photography acquired of
the border region of Zimbabwe .................................................................138 Table 7.1: Major indicators and airborne sensors, Belgium test ................................165 Table 7.2: Impact indicators and airborne sensors, Mozambique and Zimbabwe pilot areas ................................................................................170 Table 7.3: Satellite sensors, Mozambique and Zimbabwe pilot areas ........................172


List of figures
xiii
List of figures Figure 1.1: Some common types of landmines encountered ........................................3 Figure 2.1: Colour infrared image of part of the Imperial Valley and Salton
Sea (California), taken from the Skylab by the multispectral photographic camera (S-73-1227)............................................................16
Figure 2.2: Schiphol airport, Amsterdam, The Netherlands, recorded using spectrozonal film by the KVR-1000 camera ............................................17
Figure 2.3: The Pentagon recorded by the DD-5 camera ...........................................18 Figure 2.4: Principle of the whiskbroom scanner .......................................................20 Figure 2.5: Principle of the pushbroom scanner .........................................................21 Figure 2.6: Spectral reflectance of natural and artificial green...................................28 Figure 2.7: Examples of black and white infrared, colour and colour infrared
aerial photographs taken of a minefield in Belgium ................................29 Figure 2.8: Surface mines in a grain field, crop height approx. 30 cm.......................31 Figure 2.9: Ground coverage and flying height of three thermal sensors...................37 Figure 2.10: Mines detected by airborne thermal IR remote sensing ...........................38 Figure 2.11: Mine detection on and beneath the surface ..............................................42 Figure 2.12: A weathered TMA-3 anti-tank mine, Croatia ..........................................47 Figure 2.13: Processing levels of image fusion ............................................................51 Figure 3.1: Framework for various types of minefield indicators ..............................58 Figure 3.2: Corona image of a section of the “Berlin Wall” ......................................61 Figure 3.3: The border region between former East and West Germany,
KH-4B image ...........................................................................................61 Figure 3.4: The border region between former East and West Germany,
KVR image ..............................................................................................62 Figure 3.5: Portion of the Atlantic Wall of the foreshore along the Dutch
coastal area...............................................................................................63 Figure 3.6: A portion of the zone of separation along the Drava river in
Osječko-Baranjska County, Eastern Croatia ............................................69 Figure 4.1: Research methodology developed............................................................73 Figure 5.1: Colour orthophoto map of the Belgium test site showing layout
of minefields ............................................................................................82 Figure 5.2: Kleine Brogel general climate data April and May 1998.........................84 Figure 5.3: Surface temperatures of different cover types and directly adjacent
landmines from 11-05-1998, 16.30 hr. till 19-05-1998, 12.00 hr., test field “C” ............................................................................................85
Figure 5.4: Extrapolated surface temperatures from 11-05-1998, 16.30 hr. till 19-05-1998, 12.00 hr. for bare soil and directly adjacent AT-mines .......85
Figure 5.5: Spectral reflectance curves (0.35 – 0.95µm) of mines and cover types in test field “C” ...............................................................................86
List of figures
xiv
Figure 5.6: Test field “C” layout ................................................................................90 Figure 5.7: Surface laid M6 AT, field photo ..............................................................90 Figure 5.8: M6 Anti-tank mine test field “C”.............................................................91 Figure 5.9: Colour aerial photo test field “C”.............................................................91 Figure 5.10: M6 AT alignment and indirect indicators ................................................92 Figure 5.11: Minefields identified using aerial photo analysis.....................................93 Figure 5.12: Minefield indicators using landmines and regular occurring
vegetation / soil disturbances ...................................................................94 Figure 5.13: CIR photo Minefield “B” .........................................................................99 Figure 5.14: Northern extension of minefield “V” .......................................................99 Figure 5.15: VOS-80C digital camera recording of test field “C”..............................101 Figure 5.16: VOS-80C image of a section of definite minefield 2 .............................102 Figure 5.17: Thermal sunset image ............................................................................103 Figure 5.18: Thermal morning image.........................................................................103 Figure 5.19: Thermal afternoon image .......................................................................104 Figure 5.20: Thermal profile along the M6 AT alignment, test field “C” ..................105 Figure 5.21: Thermal profile along the northern section of minefield “W”................105 Figure 5.22: Leopoldsburg test area X-band radar .....................................................107 Figure 5.23: X-band radar image details selected subsets ..........................................108 Figure 5.24: Relation track / flight lines and radar illumination.................................109 Figure 5.25: P-band radar over Leopoldsburg ............................................................110 Figure 5.26: Satellite change detection using SPOT multispectral images ................112 Figure 6.1: Location of the test areas in Mozambique..............................................121 Figure 6.2: Figure 6.2: AP mines used and section of the minefield showing density of detected mines .......................................................................124 Figure 6.3: Colour and CIR large scale aerial photo Buzi minefield showing
a number of minefield indicators ...........................................................127 Figure 6.4: ZEO FLIR recording Buzi .....................................................................128 Figure 6.5: Frelimo camp Bandua ............................................................................129 Figure 6.6: Suspect area Mameme............................................................................130 Figure 6.7: Direct minefield indicator, fencing system ............................................131 Figure 6.8: Indirect minefield indicators ..................................................................132 Figure 6.9: Landsat MSS 1973 Songo subset ...........................................................140 Figure 6.10: Landsat MSS 1989 Songo subset ...........................................................140 Figure 6.11: Change analysis Songo MSS dataset .....................................................141 Figure 6.12: KFA image western part of the minefield ..............................................142 Figure 6.13: Landsat TM image of 1984 ....................................................................142 Figure 6.14: Resolution merge Landsat TM and KFA-1000......................................143 Figure 6.15: General location map border minefields ................................................146 Figure 6.16: Cordon Sanitaire minefield ....................................................................146 Figure 6.17: Ploughshare minefield............................................................................146 Figure 6.18: Aerial photo (A) and interpretation (B) of Magula area, depicting the situation as of the start of minefield construction.............147 Figure 6.19: Mangula area in 1981, aerial photo (A) and interpretation (B) showing the situation after independence ..............................................148

List of figures
xv
Figure 6.20: Changes along the road crossing the Senga river...................................150 Figure 6.21: Border region north-east of Mutare........................................................151 Figure 6.22: Border region south-east of Mutare .......................................................151 Figure 6.23: KFA-1000 image of a section of the north-east border minefield..........153 Figure 6.24: Landsat TM image showing the border minefield .................................154 Figure 6.25: Topographical map and SPOT-XS image ..............................................155 Figure 6.26: Image enlargement area 1 ......................................................................156 Figure 6.27: Image enlargement area 2 ......................................................................156 Figure 6.28: Image enlargement area 3 ......................................................................156


“For all those still suffering from these hideous devices ”


Introduction
1
Chapter 1
Introduction
1.1 Introduction
1.1.1 Background Landmines differ from most other weapons. Once being laid, they have the potential to maim or kill long after a conflict is over, until the mine is cleared. The use of specific weapons, such as landmines, is restricted and regulated by international humanitarian law which states that weapons are prohibited which are by their nature indiscriminate and cause unnecessary suffering. Further restriction on the use of landmines was attempted through the United Nations Convention on Conventional Weapons1 (CCW), Protocol II – mines, booby traps and other devices (UN 1996, ICRC 1997). During the last decade an increased concern evolved with regard to the toll of anti-personnel landmine injuries on innocent civilians around the world in the aftermath of war. It became evident that the existing provisions were too weak and not followed during conflicts where landmines were used. In October 1992 a coalition of six non-governmental organisations (NGO’s), primarily concerned with issues such as human rights and medical assistance, sponsored the creation of the International Campaign to Ban Landmines (ICBL) (Prokosch, 1995). This campaign has been able to attract public sympathy and favourable treatment of its cause by the media through the portrayal of the suffering of mine victims and the impact of landmines. Small scale efforts like landmine export prohibition of some landmine producing countries, unilateral renouncing the use of anti-personnel mines by others, culminated through the activities of the ICBL in December 1997 in an international treaty being signed. This “Ottawa Convention” banned the use, production and stockpiling of anti-personnel mines (US Department of State, 1998). To date some of the largest military powers still have not ratified the treaty but the ban has an important role in limiting proliferation. However, the problem of the already deployed landmines still needs to be addressed (King, 1998). To end the plague of landmines posing a threat to civilians the Demining 2010 Initiative was announced in October 1997 by the Clinton Administration. The objective of the program is to accelerate the global humanitarian demining effort to eradicate landmines by
1 The CCW defines anti-personnel landmines as “a mine primarily designed to be exploded by the presence, proximity, or contact of a person that will incapacitate, injure, or kill one or more persons”

Chapter 1
2
the year 2010 through an increase in investment in humanitarian demining and effective international co-ordination in demining and assistance (US Department of State, 1999). In order to achieve the goals of the Demining 2010 Initiative a formidable task lies ahead in the detection and clearance of millions of landmines found in as many as 60 countries (Bottigliero, 2000). Over 600 different types of mines have been reported by the 1990’s (Department of Defence, 1997) but the detection and clearance techniques have hardly changed since the Second World War (Roberts and Williams, 1995). This limited progress was in part a reflection of the lack of investment, but more an indication of the intrinsic difficulty of locating buried landmines and ordnance, a problem which has defied easy solutions till the present day (Croll, 1998).
1.1.2 Landmines Brigadier-General G.J. Rains of the Confederate States Army developed a fuze2 designed to explode from the slightest pressure and used the first pressure-operated landmines (called torpedoes) during the American Civil War. On the 4th of May 1862 a Union soldier, believed to be the first landmine victim, was killed near Yorktown, close to the Confederates lines (Croll, 1998). With the advent of the assault tank on the battlefield, explosive devices (like shells) were dug into the ground and covered with boards to act as a pressure plate and intended to put tanks out of action upon pressure from the tank track. After the First World War the specifically designed anti-tank (AT) mines were developed and stayed almost identical in design until now: a container of about 30 cm. in diameter containing about 5 to 10 kg. of explosive (European Commission 1996, Stockholm International Peace Research Institute 1978). The purpose of anti-personnel (AP) mines was to hinder the work of removing or de-activation of the anti-tank mines. Since a pressure is required of more than 100 kg. to detonate AT mines they could be easily relocated by the opposite force, thus anti-tank mines were laid together with anti-personnel mines to deny access. Anti-personnel mines were widely used independently as well as to protect infantry positions from foot soldiers or delay advancing occupying forces after a retreat. These mines are activated by foot pressure on pins projecting from the mine itself or by means of a trip-wire. Mines can also be activated electronically or by remote control. Since World War II widespread use is made of landmines during armed struggle all over the world. There are several categories of anti-personnel mines (European Commission 1996): • Blast mines: strike their target with the blast of the actual explosion. With 30 to 50
grams of explosives, these mines have a lethal range of about 1 to 2 metres. It is mass-produced, most are quite small, with a variety of casing material like metal, plastic, glass, wood and e.g. bakelite casings. The mines are placed on or just underneath the ground.
2 Mechanism to activate a mine or bomb; fuse or safety fuse is a gunpowder-filled cord

Introduction
3
• Fragmentation mines: to operate these types of mines a higher level of training is required so these types are more unusual. These mines eject metal fragments and steel splinters in all directions over a wide area (lethal range up to 100 m.) • Fixed fragmentation stake mines: Generally fixed to a stake, about 30 cm. above
the ground and send their lethal splinters in all directions (often with trip-wire). • Bouncing fragmentation mines: these mines are equipped with a propelling charge
which throws the mine about two metres in the air before it detonates and spreads its lethal content of metal balls and steel fragments. The S-mine, introduced in 1935, was the first of this type.
• Directional fragmentation mines: these mines project their content in a limited arc (60-degree) and the convex side of the mine is facing the place were the enemy is expected to appear. An example is the US Claymore mine that was invented towards the end of the Korean War for use against the so-called ‘human wave’ infantry attack and can be detonated by trip-wire or remote control. The Claymore mine is a curved box-like object made of plastic and stands on four folding legs, upon detonation it ejects about 700 steel balls and has a lethal range of 50 metres (Prokosch 1995)
Figure 1.1: Some common types of landmines encountered3
PMN: Blast mine Valmare 69: Bouncing Claymore mine: PMR: Frag- fragmentation mine directional frag- mentation mentation mine stake mine Many of the recently developed mines are made of plastic or other non-metal materials and with a minimal metal content. These mines are difficult to detect using a metal detector. At present there are also mines that are designed to fire against the side of a target as it passes within the sensor range. Mines are being equipped with anti-handling or disturbance devices, others have a delayed fuzing mechanism and some can resist explosive shocks, making them resistant to neutralisation by explosion. At present a wide variety exists, e.g. anti-personnel mines having a limited size, little explosive content, metal casing, simple pressure plates up to larger sized mines, consisting of a minimum metal content, complex fuzes, trip-wires and anti-handling devices. They can be laid above the surface, having tonal blending for camouflage purposes, buried just underneath the surface, etc.
3 Further relevant details on figures and tables are presented in Appendix 2. Figures are also included on the CD-Rom included in the back.

Chapter 1
4
Most of the conventional mines are manually emplaced on or just below the ground surface, which is time consuming and requires manpower. Mechanical systems have been developed capable of distributing and burying mines, especially anti-tank mines. More recently systems have been developed for scattering and remote delivering of mines, using ground based artillery shells, rocket launchers or are being air-delivered by fixed wing aircraft or helicopter. These methods enable an even faster deployment of mainly surface laid minefields. These are more difficult to find as no precise map of the minefield is made. Deliberate hand emplaced or mechanically laid mines used by regular military forces to support major tactical operations (to delay and defend against armoured units as well as flank protection for the attacking units) are normally laid in patterns and their locations mapped, to allow removal or destruction afterwards. According to their increasing size, mined areas can be classified as follows (European Commission 1996, National Academy of Sciences, 2000): • Mined position: half a dozen mines laid at a particular position (well, bridge, etc); • Mine bottle neck: up to about 30 mines blocking an unavoidable path (road, track, etc); • Mine line: a row of mines shallow-blocking (less than 50 metres) a given direction as
such over several hundred metres; • Mined strip: up to 5 parallel mine-lines, 300 to 400 metres deep in all, constituting an
obstacle sufficient to stop an assault formation and/or hinder any further deployment; • Minefield: several strips, usually a few hundred metres apart, of a density and area
such as could, if penetrated, inflict significant casualties on the assailant. Minefields are classified into three categories apart from fake or phoney minefields (used as decoy to deceive the enemy about the exact location of the real minefields):
• Manoeuvre or tactical minefields: directly limit the enemy’s movement in a way
that gives defending forces a positional advantage. By means of mass mine-laying the enemy forces are disrupted, fixed and blocked;
• Harassment or nuisance minefields: cause enemy forces to move cautiously, thus disrupting, delaying and sometimes weakening and destroying follow-on by means of often irregular mine-laying in the enemy’s rear or in zones delivered over to the enemy;
• Protective minefields: for protection of soldiers, equipment, supplies and facilities, intended to reinforce the defence of a defended position or of an area where friendly forces are being deployed.
Within NATO simple laying and burial of mines is conducted with regard to an international standardisation agreement (STANAG 2045, signed in 1987, in: European Commission, 1996). The pre-established scheme consists of semi-circles of a few metres’ diameter in a regular formation along one or two lines, the anti-personnel mines are surrounding the central mine, mostly an anti-tank mine. The former Warsaw Pact forces followed similar rules only applying a higher density of mines. Various types of patterned mine barriers result from their mode of deployment: herringbone pattern generated by a mine launching system (e.g. Scorpion), linear mine pattern created

Introduction
5
by a mechanical mine laying system or a more random mine pattern if mines are deployed by artillery, helicopter or thrown off a driving truck (Bertsche and Hügle, 1997). Hasty mine emplacements are conducted in forward areas under time constraints and the main objective is to suddenly disrupt or block operational forces. Protective mine emplacements support a temporary halt or encampment. Defensive mine emplacements support the merging of positions prior to counter attack by providing protection from overrun. Nuisance mining supports rear security and confuses enemy forces. Of special significance is that hasty emplacements do not necessarily follow a standard pattern and the mines are often surface laid rather than buried (Hanshaw and Reidy, 1997). The hasty emplaced minefield is very effective against mechanized forces since the mines, though placed on the surface, are not visible from the vehicle due to being obscured by the surrounding vegetation (Maksymonko and Breiter, 1997). These practices for permanent area-denial and harassment are not followed by irregular military troops and are used as a terrorist tool, particularly by guerrilla forces (Cornish, 1994). Without humanitarian considerations and concern towards the laws of war the guerrilla troops, in order to undermine public morale and faith in the government, uses the mines as a terror weapon aimed specifically at the civilian population (Orlov, 1963). Agricultural and community land is mined as well as villages, water sources, along footpaths, etc. This offensive use spreads terror, destabilises the economy, destroys food sources, creates refugee flows and renders the land useless until it is cleared, a process made even more difficult as no record is taken of the position where the mines are placed. Recently also regular forces, through the use of remotely delivered and scatterable mines divert from the traditional use of landmines. The offensive use of air delivered mines in support of tactical operations or behind enemy positions will have a major impact on increasing the suffering inflicted on the civilians, like the impact of the PFM-1 ‘butterfly’ mine which was used in Afghanistan. The scattering and remote delivery makes accurate mapping of the minefield impossible and therefore self-neutralising and self-destruct remote delivered mines are being developed. An alternative to anti-personnel landmines intended for use solely against ground troops could be ready within a couple of years. Known as the nonself-destructing alternative system, or NSD-A, the system would allow an operator to view a video display through which sensors would signal when an intruder has entered the protected area. By using “the man in the loop” an option is provided either to detonate the explosive or let the person pass without injury (URL-1)4.
1.1.3 Countermine operations and mine action During a conflict, under hostile artillery and air attack, when the military encounters a minefield, a breach in the obstacle will be attempted without a decrease in the pace of the offensive. The breach will be wide enough to allow passage of armoured vehicles and 4 URL-1, etc. refers to Internet sites. Due to the transient nature of many Internet web sites, some of these references may no longer be active.

Chapter 1
6
combat troops and given the time constraint, a clearance rate of 80 percent is accepted. Mines laid outside the clearance path are disregarded. Also area clearance is done by the military, but not under hostile fire (Kerner et. al. 1999). The detection and removal rates must be higher compared to the breaching operations and time is not a critical factor. Mostly the military will mark and avoid the minefield and leave it till after the cessation of hostilities. The technology developments by the military mostly supported quick breaching techniques through minefields mostly using armoured vehicles, equipped with ploughs and flails, used to remove the anti-tank mines. During this process some of the anti-personnel mines might be left in the cleared lane. The integrated civilian approach to the landmine clearance problem is called mine action and includes mine awareness and risk reduction education, minefield survey, mapping, marking and clearance, victim assistance, including rehabilitation and reintegration and advocacy to stigmatise the use of landmines and support a total ban on anti-personnel landmines (Trevelyan 1999). Mine action covers a far wider scope of activities than mine clearance only (Blagden 2000). Civilian demining starts when the conflict has stopped and the objective is to return previously mined land to its pre-war condition. During this process it is tried to locate and destroy every single mine and dangerous explosive object, which may impact the return to normality and as such, requires a nearly 100 percent clearance rate (Orden et. al. 1997).
1.1.4 Mine action challenge To detect and neutralize landmines and unexploded ordnance contamination for the affected land will take a long time given the present low technology methods used. The target date presented by the 2010 Demining Initiative seems unrealistic given the present clearance rates and to meet this challenge better sensing and detection technology, coupled with multi-sensor data fusion is needed. There is a growing recognition that overhead remote sensing could become a particularly useful tool to provide valuable information for the mine action process and to assist in the conventional minefield detection methods (Blagden 1999, 2000, Bajić 1999, 2000). To plan a demining operation, the magnitude of the mine problem and the location of the minefields need to be known. Information gathering techniques, such as interviewing the remaining local population, former combatants and mine victims can provide significant insights. This general survey (also called a “level 1 survey”) is labour-intensive and time consuming, but also inadequate, inconsistent and incorrect information are a result from these interviews. To accelerate the mine action process, the mined areas must be quickly identified to avoid accidents and to assign priorities for demining. What is needed is a rapid, low risk and cost effective means to survey a region for minefields and to produce maps with minefield locations for use as a planning tool (Sieber 1995, Nee 1996). Equally important is to identify areas that are not affected by landmines as these permit direct productive land use. A considerable area of the total mine suspected area is not mine contaminated or only to a small extent. At present ground based technical surveys or a “level 2 survey” is aimed to determine the boundary of the minefield. Such a survey can reduce the mine suspected area by a factor of 10 and these areas can be handed over to the

Introduction
7
local population (ICRC 1999). The level 2 surveys try to achieve maximum risk reduction at lowest cost with minimum over-classification (Wolf and Barmazel 2001). The identified mined areas are cleared during a “level 3 survey” where mostly through manual demining (a mine clearance operator equipped with prodder and metal detector) the top layer of the ground surface is searched in detail to locate and remove or destroy in situ all mines and other relevant devices. Depending on the terrain configuration, mechanical clearance and specially trained explosive sniffing dogs support the manual clearance procedures. Thus the more accurate the minefield perimeter can be determined, the area to be covered by the labour intensive and time consuming level 3 survey can be minimised. The level 3 survey requires a detection and subsequent clearance rate of nearly 100 %. This is not the aim of a level 2 survey, here enough mines are to be found to reliably indicate the areas and the perimeters of the minefields, and not every mine needs to be located. For ground based level 2 survey two options are available to determine the minefield perimeter (apart from using minefield maps that are mostly not available). The total area can be cleared (actually a level 3 survey) or a sampling approach can be adopted using test trenches through the suspect areas (Wolf and Barmazel, 2001). To establish a reliable layout of a minefield more test trenches are required to increase sampling density. The more test trenches, the more a kind of level 3 survey is conducted!
1.1.5 Remote sensing In order to enhance the productivity, cost-effectiveness and safety, further demining research is being conducted focussing on the development, testing and evaluation of the best available technologies that might be applied through the full range of mine action requirements. To find alternatives to the metal detector and prodder, research has been conducted to improve detection techniques and simultaneously reduce the false alarm rates. Technologies applying (multi) sensor systems are being developed each with its strength and weaknesses. These detection sensors can be man portable, vehicle or airborne based. Other research is focussing on the olfaction, using dogs and rats, and TNT-seeking insects, genetically engineered bioreporter bacterium or explosive detection using nuclear quadrupole resonance amongst others (Kercel et al, 1997). Information obtained through space and airborne remote sensing can contribute substantially to many aspects of mine action and mine clearance planning. Earth observation satellites have been recording the earth surface in increasing resolutions from 1972 onward. Recently high-resolution images have become commercially available. Declassified high-resolution panoramic camera data from 1960 onward of many areas around the world are now also available (Day et. al. 1998). Also other space borne data recorded during manned and unmanned space programmes, as these were often equipped with cameras recording the earth surface, are available. These image archives provide a wealth of historical information. For topographical map production and updating conventional aerial photography can be used. These images also provide a high spatial resolution and multi-temporal coverage. During a conflict special intelligence and reconnaissance airborne data might be acquired of selected areas. All of this information can be utilised to support the mine action effort.

Chapter 1
8
The military have developed remote sensing technologies to detect minefields. Remote sensing information can contribute to the mapping and identification of suspect areas, identification and determination of the minefield boundaries and under favourable conditions also the identification and localization of individual mines (Herring 2000, Kerner et. al. 1999). Since the need for mine action has increased dramatically, many of these sensors and techniques are now also available to detect minefields from commercially available platforms, sensors and processing environments. Airborne systems equipped with different sensors can scan large areas, also inaccessible ones. Used for humanitarian purposes the system is not likely to be operated under combat situations but when a certain degree of political stability has been established. The survey timing, all weather and day/night capabilities, real time data processing requirements are not as rigid as for military applications. The moment to conduct an airborne survey can be based upon the most favourable sensor and environmental conditions to detect the minefields. With the current progress when using conventional area reduction techniques, it will still take a long time before the real minefields are localised and the remaining non-affected land can be returned for productive use. A reliable area reduction technique is therefore a very efficient tool to rapidly release land and remote sensing can be applied to analyse these suspect areas. At present there are not many other area reduction techniques available, apart from physical area reduction by means of a field survey.
1.2 Research questions and objectives The starting point on clearing landmines from a country or a region is to define the extent of the problem by determining the locations of mine invested areas. This study tries to evaluate the contribution of wide area detection technologies for humanitarian demining purposes. In order to be of any future use, the system should be capable to survey large areas and concentrate on location of minefields, instead of individual mines. It should equal or exceed the present method of on-the-ground interviews, locate minefields accurately surrounded by a (safety) buffer zone projected onto map media, the probability of detection should approach 100 % and the false alarm rate should be approaching zero. The total time required for analysis should be limited to weeks, multiple sensors can be applied to increase the detection probability and reduce the false alarm rate, must be capable of operating in all terrain and climates found in the countries affected and furthermore be able to determine areas that are free of landmines as this is equally important to the demining effort as finding minefields. To be able to evaluate the use of space and airborne remote sensing as a wide area detection technique for humanitarian demining purposes the following research questions have been formulated: 1. Is an airborne platform equipped with multiple sensors, able to detect minefields over
large and varied tracts of land? 2. Can suitable direct and indirect image indicators in combination with collected
ancillary information, prior knowledge/intelligence be developed to accurately identify

Introduction
9
suspect areas and minefields? Under what terrain and environmental conditions does it work?
3. Can high and medium resolution satellite image fusion techniques be used for minefield detection and for area reduction purposes?
4. Can change detection analysis on a variety of pre- and post-conflict remotely sensed images detect suspect areas and, if possible, minefields?
More specific research questions have also been defined and are presented when the research methodology is discussed in detail in chapter 4.
1.3. Assumptions and hypotheses Much of the current research effort related to better (multi-sensor) detection technologies is focussing on the detection of individual mines. Military effort under combat is focussing on detection of individual anti-tank mines so armoured AP-blast resistant vehicles can pass without problems. Detection technologies for humanitarian purposes have to be more versatile, detect also anti-personnel mines, have a probability of detection of 100 %, be operational under all terrain / vegetation conditions, etc. It is unlikely that sensors that are operated from an airborne platform are able to fulfil all specified requirements. Therefore concentrating on minefields, rather than individual mines, seems a more promising approach for standoff detection. A major problem arises as to how to define minefields, if individual mines, or their pattern, are not directly observed and how to define on the other hand areas not affected by landmines. In other words: is it possible, using other types of indicators, to identify suspect areas, minefields and accurately establish their boundaries? Equally important: are there “no minefield” indicators? Other disciplines, like archaeology, have used standoff detection techniques to identify, through indirect indicators such as crop marks, buried sites of which no traces whatever are ordinarily visible to an observer on the ground (Genderen, J.L. van, 1976). If reliable indicators or a combination of indicators exist, most suitable sensors can be selected and image resolution can be adapted, allowing identification of only those features, partially solving the analysis requirements of the huge amount of data generated with a multi-sensor wide area detection system. Depending on the physical dimensions and reflectance - emittance characteristics of those indicators, satellite images can also be used for their detection.
1.4 Outline of the thesis This introductory chapter has provided the background to the landmine problem, explained the types of landmines used and their manner of use, as well as the potential role of remote sensing techniques. It has furthermore provided the research objective, the research questions, hypotheses to be tested and the assumptions made in this work. The remainder of the thesis is structured in such a way that it treats in turn, the state of the art of sensors and techniques for minefield detection (chapter 2), the establishment of minefield indicators (chapter 3), the research approach, methodology and the detailed research questions (chapter 4), the Belgium test (chapter 5), the airborne campaign carried out in Mozambique and the use of multi-temporal image analysis, change detection and image fusion analysis (chapter 6), before the main results and conclusions are provided as

Chapter 1
10
well as the recommendations (chapter 7). The following paragraphs provide a brief preview of what is treated in each of the following chapters. Chapter 2 outlines relevant (declassified) aspects related to strategic overhead detection techniques developed by the military / intelligence community as well as those of civilian space remote sensing programs. Airborne sensing techniques are describing the state of the art of airborne sensors, such as optical (film, multi- and hyper-spectral sensors), thermal infrared as well as microwave sensors are discussed. Image analysis techniques are described, related to visual image interpretation, digital image processing techniques for mine and minefield detection, change detection analysis and image fusion. Chapter 3 discusses the relation between the occurrence of minefields and the presence of objects that can be used as (indirect) indicators. Through the use of survey reports, other relevant information and personal field research, the author has been able to establish minefield indicators for a number of different countries and different types of conflicts. Chapter 4 treats the research approach and methodology and gives the detailed research questions posed. The methodology presented consists of three phases: a test in Belgium over a specifically constructed minefield, tests in Mozambique where several pilot areas were recorded and analyzed and (multi-temporal) satellite based analysis to detect minefields in Mozambique and Zimbabwe. In chapter 5 the relevant landmine and terrain related details of the Belgium test site are described. The conditions under which the research data were acquired and the procedures and results of the subsequent image analysis are given. The indicators used to determine the minefield perimeters are discussed. The contribution of individual airborne sensors to the detection capability of landmines and minefields is assessed. Satellite images acquired prior and after minefield construction are analyzed and the results obtained described. After a discussion on the image analysis results obtained a number of limitations faced during this controlled test are presented. Chapter 6 describes the airborne campaign in Mozambique, the survey areas, the data collected, image analysis procedure, the image indicators found and the results of the airborne image analysis obtained are discussed. The second part of the chapter focuses on the use of multi-temporal satellite and medium scale aerial photography image fusion and change detection analysis. Panchromatic stereo aerial photography and earth observing satellite images are used to analyse suspect areas and to determine the likely occurrence of minefields through the incorporation of indirect indicators. Examples are presented from Mozambique and Zimbabwe. Subsequently the results obtained are discussed. Chapter 7 summarizes the main conclusions and provides answers to the specific research questions raised in the thesis and gives recommendations for further research. After these conclusions, the thesis provides a summary and detailed bibliography consulted during the research presented. In the Appendix some image enlargements are given as well as the sources of the figures and the tables presented in this thesis.

Overhead detection of minefields, a review of sensors and techniques
11
Chapter 2
Overhead detection of minefields, a review of sensors and techniques
Abstract This chapter will provide background information on relevant (declassified) aspects related to strategic overhead detection techniques developed by the military / intelligence community as well as those of civilian space and airborne remote sensing programs. The airborne sensing techniques describe the state of the art of sensors such as optical (film, multi- and hyperspectral sensors), thermal infrared as well as microwave sensors. Image analysis techniques are described related to visual image interpretation, digital image processing, change detection analysis and image fusion. Keywords: satellites, strategic overhead detection, airborne sensors, optical, thermal, microwave, visual image interpretation, digital image processing, fusion and change detection analysis.
2.1 Introduction Air and spaceborne remote sensing has been used for many applications for many decades. The first “photographs”, literally meaning, “write with light”, were taken by Daguerre and Niepce in 1839 (American Society of Photogrammetry, 1960, 1975). A Parisian photographer Gaspard Felix Tournachon (later known as “Nadar”) who ascended in a balloon to take bird’s-eye photographs near Paris took the first known aerial photograph in 1858 (Lillesand and Kiefer, 2000). Using a camera with wet collodion plates he succeeded in obtaining a photograph of the village of Petite Bicetre from a height of 80 metres above the ground. Balloons, kites and even pigeons were used as platforms to hoist cameras above the land to photograph the area below. This aerial perspective was used during the American Civil War and the second Boer War (South Africa) for artillery spotting and to gather other intelligence of enemy positions (Watkis, 1999). At the turn of the century, experiments were conducted with remote sensing from rockets and in 1906 Alfred Maul successfully boosted a payload including a camera that took 8 seconds to reach a height of 790 metres (Brookes, 1975). As the rocket started to fall the camera would make an exposure and the parachute then released would descend the equipment back to earth. It was only in 1909 when the airplane as a navigable platform for the aerial camera was first used. On the 24th of April Wilbur Wright took motion pictures over Centocelli, Italy (American Society of Photogrammetry, 1960, 1975). During the First World War aerial

Chapter 2
12
reconnaissance photography became accepted by the military as a prime and reliable source of intelligence, boosting the demand for air photographs that became an essential part of operations. During this time vigorous efforts were made to provide the military with photographic equipment and develop proper methods of photography, processing and photo interpretation. Aerial photographs were used for a number of civilian purposes after the First World War and saw the establishment of numerous private air survey companies such as The Air Survey Company, 1923 (later Fairey Surveys), KLM Aerocarto in 1922 and Hansa Luftbild in 1923. The outbreak of the Second World War provided another stimulus to developments in aerial reconnaissance. After the retreat from Dunkirk in 1940 the chief source of military intelligence information of besieged Europe was through the use of aerial photo interpretation. This situation brought about the introduction and development of more sophisticated cameras, light sensitive materials, interpretation and measuring instruments as well as the development of dedicated reconnaissance aircraft (Babington-Smith 1957, Powys-Lybbe 1983, Brugioni 1984). Military aerial reconnaissance continued to develop after the Second World War. Dedicated sensors were integrated into a reconnaissance pod, which could be mounted underneath an aircraft, like the Modular or Multipurpose Reconnaissance Pod (MRP) for the F16. Also sensors were integrated onboard of special or modified aircraft (like the U-2, or its successors the U-2R and the TR-1, the SR 71, RF-4C and the F-14) next to the use of sensors on Unmanned Air Vehicles (UAV). Most military sensor and system details are classified (URL-2). Advanced electro-optical systems (panoramic cameras, infrared line scanners, forward looking infrared sensors) are employed that provide, even from considerable distance, high resolution imagery together with multi mode radar systems (moving target identification and high resolution imaging ability). For example the MRP is equipped with electro-optical thermal step framing cameras, an IRLS and FLIR. System configuration depends on the mode of the mission, either a low or medium altitude configuration (Holler, 1999). For other types of tactical reconnaissance timeliness, accuracy and efficiency are important. This lead to the development of the Tactical Air Reconnaissance Pod System, Completely Digital (TARPS-CD), employing electro-optical step framing imagery being data linked to a receiving ground station from a tactical platform (York, 1999). With regard to the airborne detection of minefields, the US Marine Corps has developed the Coastal Battlefield Reconnaissance and Analysis (COBRA) system (Stetson et al, 2000). This system uses a multispectral video system mounted on an UAV to automatically detect minefields along its flight path. More sensor and classifier details are presented later. Another initiative currently underway is making use of a Camcopter UAV, equipped with multiple sensors (optical, infrared and hyperspectral sensors) for minefield detection (Schutte et al, 2001). Tests will be conducted over suspect areas in Croatia.

Overhead detection of minefields, a review of sensors and techniques
13
2.2 Military space imaging 18th August 1960 marked the beginning of the first successful photo reconnaissance satellite program. The age of space reconnaissance started with the mid-air capture of a satellite recovery vehicle containing the exposed reconnaissance film. The United States success obtained by the Corona program followed the U2 incident (shot down over the former USSR) that forced President Eisenhower to terminate all aerial reconnaissance. The different models of photographic intelligence satellites assisted the US with peacetime collection of intelligence information (like the number of intercontinental ballistic missiles: the so-called “missile gap”) as well as the location of targets to support combat operations during the Cold War. During early missions, emphasis was placed on acquiring coverage of the Soviet Union. Later, coverage of other areas was expanded. The camera design underwent a number of modifications during the start of the program. The initial camera, the Keyhole-1 (designated KH-1) had a resolution of 12 metres. Its successor, the KH-2, featured an improved image motion compensation system and film resolution improvement up to 8 metres. Both systems were basically 70-degree scan, vertical looking, reciprocating, panoramic cameras. In the design of the KH-3 a number of changes were incorporated like a 610 mm focal length faster lens system, permitting the use of slower, finer grained film resulting in an improved resolution up to 3.5 metres. All these cameras were used in a single camera mode. The KH-4 was the first twin camera system, using KH-3 cameras, to provide stereo coverage, one looking 15 degrees aft from the vertical and the other 15 degrees forward. The system was oriented so that the forward camera was aft looking and the aft camera was forward looking. The forward pointing camera would take the first exposure of a specific area, then about half a dozen frames later, the aft-facing camera would again photograph the same area. The resolution was slightly improved (3 - 8 metres) but the stereo capability vastly improved the photo interpreters’ ability to spot and identify new facilities. The KH 4A had a larger payload of film and used two return vehicles, which allowed for two missions from a single launch. The KH-4B provided a new generation twin panoramic camera system (610 mm focal length, f/3.5) allowing for lower orbits (approximately 130 kilometres) resulting in an improved resolution of better than 2 metres. The KH-4B could accommodate a variety of film types and operate more effectively under varying exposure conditions. Enlargement factors of the nominal photo scale on film (1:250.000) of 40 times are possible, yielding images with scales of up to 1:7.500. An individual image on average covers an area of approximately 16 by 193 kilometres. The program was declassified in 1995 and images from 1960 till 1972 are available to the general public. Using a web-browser situated at the data centre of the United States Geological Survey (http://earthexplorer.usgs.gov) quick looks are available and data can be ordered on-line. Within the 12 years of the program, with 100 missions conducted, an extensive coverage was collected consisting of about 800.000 images. On most missions, clouds obscure about 50 percent of the imagery. Further references are provide in McDonald 1995, Peebles 1997, Vukotich, Day et al, 1998, Ruffner, 1995. An overview of the program is presented in table 2.1 and table 2.2 (after McDonald, 1995).

Chapter 2
14
Table 2.1: Operational overview, Corona reconnaissance program KH-1 KH-2 KH-3 KH-4 KH-4A KH-4B Period of operation
1959-60 1960-61 1961-62 1962-63 1963-69 1967-72
Mission, life 1 day 2-3 days 1-4 days 6-7 days 4-15 days 19 days Missions, total
10 10 6 26 52 17
Missions, successful
1 4 4 21 49 16
Targets Former USSR
Emphasis on former USSR
Worldwide / emphasis on denied areas1
1 Denied areas were generally considered to be communist-controlled areas Table2.2: System performance data, Corona reconnaissance program.
KH-1 KH-2 KH-3 KH-4 KH-4A KH-4B Type mono mono mono stereo stereo stereo Ground resolution (m)
12.2 7.6 3.6-7.6 3-7.6 2.7-7.6 1.8
Film resolu-tion (l/mm)
50-100 50-100 50-100 50-100 120 160
Contact scale
u/a1 u/a u/a 1:300.000 1:305.000 1:247.500
Enlargement capability
u/a u/a u/a 20 * 40 * 40 *
Maximum scale
1:12.000 1:7.500 1:7.500
1 unavailable The Soviet Union developed their space reconnaissance satellites, called Zenit, much along the same lines as the US. The later versions of the Zenit-2 photo reconnaissance spacecraft were equipped with a number of cameras, three SA-20 cameras with a 1.000 mm. focal length lens, and one SA-10, with a 200 mm. lens. The SA-10 camera was used for low resolution pictures, to provide the ground reference for the high resolution pictures taken during the same time. The SA-20 made square frame (stereo) photography (apparently 300 *300 mm.). With an average flight altitude of 200 km. the main cameras scanned an area of 60 * 180 km., hence each camera provided a ground area of 3.600 square kilometres (60 * 60 km.) per frame. The camera’s ground resolution is stated to be in the order of 10 – 15 metres but reached the point at which individual cars could be identified (URL-3). The first reconnaissance pictures from space were obtained by the USSR from the third Zenit-2 spacecraft, which was operated between 28th of July till the 8th of August 1962. The Zenit-4 was a modified version of the Zenit-2, it apparently was equipped with one camera having a 3.000 mm. lens. No data is available on missions and success rate of the Zenit-4 or modified versions. The Zenit-4 program was probably terminated in 1970 and continued with increasingly more capable classified satellites (Day et al 1998).

Overhead detection of minefields, a review of sensors and techniques
15
The Corona program was replaced later by an entirely new system of satellites, staying in orbit, such as Keyhole-11 (first launched in 1976) and Keyhole-12 (also called advanced Kennan or improved Crystal, first launched in 1990). These new electro-optical sensors (Charge Coupled Devices) provide real time transmission to the ground stations using data relay satellite systems. The sensors reportedly operate in the visible, near infrared and thermal infrared part of the electromagnetic spectrum and probably incorporate low-light-level image intensifiers to provide night-time image capability. The resolution of these satellites is approaching 15 centimetres (Richelson, 1990). The optical satellites are flying at altitudes from 400 to 800 kilometres and record surface areas situated up to 600 to 1000 kilometres at either side of their ground track (Andronov and Shevrov 1995, Gupta 1994a). To circumvent the problem of cloud cover and to further improve round the clock recording capability high resolution (0.6 to 3 metres) radar reconnaissance satellites have been developed as well. The so-called Indigo, later named Lacrosse synthetic aperture radar satellites (first launched in 1987), is flying at about 800 kilometres and is recording an area as much as 1000 kilometres off the ground track (URL-2, Richelson 1990). In Europe, a number of countries (France, Spain and Italy) joined effort in developing their own military high resolution (approximately 1 metre (Gupta, 1994b) reconnaissance satellite offering significant decision making independence. In July 1995 the Helios 1A and in December 1999 Helios 1B was launched. The Helios II program is one of the components of a wider observation system, which also includes a military radar satellite Horus (due to lack of funds the Horus project is temporally shelved, Germany is planning a “cheap” radar satellite, the “SAR Lupe”). The program will ensure continuity of the reconnaissance program from the year 2003 onward and is nearly single-handedly financed by France. Details are classified (Eucosat, 1997, 1998). The same holds true for the Israeli Ofec reconnaissance satellite and imager.
2.3 Civilian space imaging The availability of imaging intelligence mentioned above would provide the non-governmental sector with unprecedented potential for interpretation of special events, especially in areas of conflict where terrain access for humanitarian purposes is limited, or for detailed historical and change analysis.
2.3.1. Optical: film based systems Optical remote sensing from space for the civilian community started with the first manned space programs like the Mercury, Gemini, Apollo and date back from the beginning of the 1960’s. Colour photographs were taken by handheld Hasselblad cameras having 70 mm. or 80 mm. lenses. Apollo 9 carried a multispectral photography experiment, using four 70 mm. cameras, and was a test for the Landsat program discussed later. In 1973 Skylab, the first American space workshop, was launched and astronauts took images of the earth. Images were recorded using a six-camera multispectral array (stereo images, 30 metre resolution), a long focal length 10 metre resolution “earth terrain” camera, a 13-channel multispectral scanner, a pointable spectroradiometer and two microwave

Chapter 2
16
systems. Images obtained could be enlarged to scales 1:24.000 to enable urban analysis and general interpretation (NASA 1978). During the 1973 Skylab mission large quantities of images were acquired of North, Central and South America, Europe, Western Africa, Asia and Australia. An example is provided in figure 2.1 taken over California, USA. The measured resolution capability of the multispectral photographic camera for this film reported for this image was approximately 27 metres per line pair for high contrast sites. Skylab 4 recorded mainly the same areas as those covered by Skylab 3. Figure 2.1: Colour infrared image of part of the Imperial Valley and Salton Sea (California), taken from the Skylab by the multispectral photographic camera (S-73-1227).
In the 1980’s some space camera systems have been operated, like the US’s Large Format Camera (the LFC was tested in 1984 on a space shuttle mission) and the European Space Agency’s Metric Camera, produced framing stereo images, providing imaging capabilities comparable to those of Skylab. The LFC ground resolution was restricted to 10 metres, under Presidential Directive 37 by the US Government, which was changed in March 1994 to 1 metre. In the fall of 1987 Russia started offering data products derived from sensors that were before exclusively devoted to Russian reconnaissance. One of the sensors selected was the KFA-1000, a camera that acquired images at a resolution of 5 to 10 metres. This camera was mounted on board the RESURS-F satellite systems. The RESURS-F1 is equipped with two large format KFA-1000 cameras capable of making images of 1:200.000 scale that can be enlarged up to scales of 1:25.000. The panchromatic and colour spectrozonal films (a type of film having two layers: one is sensitive in 0.57-0.68 µm range and the second is sensitive in 0.68-0.81 µm range) have been used. The “false” colour images obtained using

Overhead detection of minefields, a review of sensors and techniques
17
the colour spectrozonal film allows for a better interpretation of ground features (see figure 2.2). The image archive contains global coverage acquired since 1974. In 1997 a modified system RESURS-F1M started operation. This system carried three KFA-1000 cameras and one panchromatic camera, the KFA-200 (also designated KATE-200, resolution 20 metres). These cameras were also used onboard of the MIR space station, orbiting the earth at a height of 400 kilometres. The exposed film was taken back to earth by the shuttle Soyuz (URL-9-10). In 1992 Russia permitted the distribution of high resolution images acquired with the KVR-1000 panoramic camera, processed to a resolution of 2 metres, the commercial KVR-1000 images are spatially degraded derivatives of the original data (see figure 2.3, other designations for this camera are: KWR-1000 and DD-5, which may stand for “Digital Degradation by a factor of 5”, indicating that the original resolution would be 40 centimetres (Gupta, 1994b). The camera has a lens with a focal length of 1000 mm. and the film is sensitive to the panchromatic range. The images recorded can be enlarged up to 1:10.000 without significant loss of quality. Figure 2.2: Schiphol airport, Amsterdam, The Netherlands, recorded using spectrozonal film by the KVR-1000.
Operated simultaneously with the KVR-1000 is the TK-350 or topographic camera. This camera is equipped with a 350 mm. focal length lens and records the earth surface in a single panchromatic band at a 10 metre spatial resolution. Overlapping longitudinal image pairs provide a stereo image analysis capability. These images can be enlarged to a scale of 1:50.000 without significant loss of detail. The KVR-1000 is registered to the TK-350 images for precision overlaying of the two images. Joint use of the recorded photo material together with other parameters, registered at the moment of exposure, topographic and

Chapter 2
18
photomaps can be generated (Lavrov 1996, 1997, 2000, Chekaline and Fomtchenko 2000, URL-11-12). Cameras are mounted onboard the Cosmos satellite, orbiting the earth at an altitude of 190 to 270 kilometres, depending on the duration of the mission and the data to be recorded. Given the limited amount of film and a maximum duration per mission of 45 days, temporal gaps are evident. The satellite is recovered at the end of each mission and much of the hardware is re-used. KVR-1000 / TK-350 archives dates from 1984 (70 degrees either side of equator) (URL-13). The MK-4 camera is mounted on board the RESURS-F2 satellite providing multispectral stereoscopic images of 1:900.000 scale. The archive contains global coverage of data acquired since 1988. Like the COSMOS satellite, RESURS-F2 was designed for short missions carrying film, which was ejected in recoverable canisters. The nominal orbit height is 240 km. but the satellite could be lowered to a height of 170 km. yielding an image resolution of 6 metres. The four-channel camera can be operated in a number of modes: recording monochrome images in four spectral zones (0.46-0.51, 0.515-0.565, 0.64-0.69, 0.81-0.86 µm), spectrozonal images in pseudo colours (0.61-0.75 µm) and natural colour images (0.435-0.68 µm). Normally three channels are dedicated to the b/w zonal films and the fourth to the spectrozonal film (URL-14). Figure 2.3: The Pentagon recorded by the DD-5 camera.
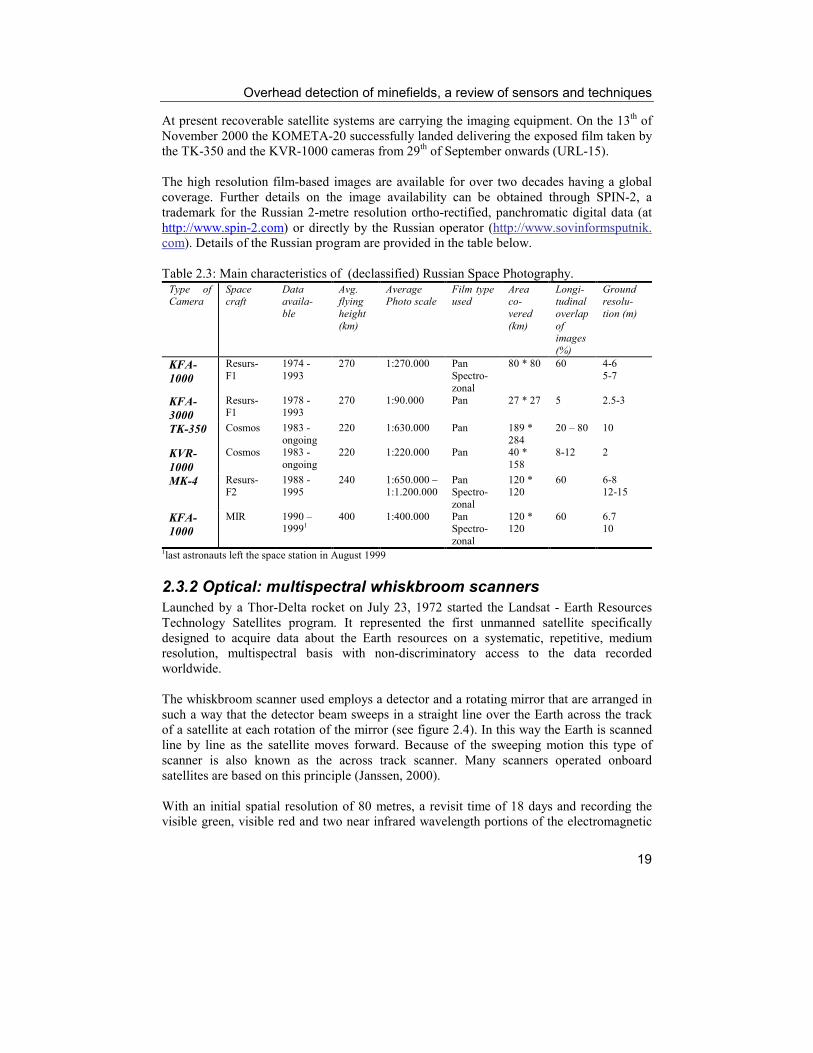
Overhead detection of minefields, a review of sensors and techniques
19
At present recoverable satellite systems are carrying the imaging equipment. On the 13th of November 2000 the KOMETA-20 successfully landed delivering the exposed film taken by the TK-350 and the KVR-1000 cameras from 29th of September onwards (URL-15). The high resolution film-based images are available for over two decades having a global coverage. Further details on the image availability can be obtained through SPIN-2, a trademark for the Russian 2-metre resolution ortho-rectified, panchromatic digital data (at http://www.spin-2.com) or directly by the Russian operator (http://www.sovinformsputnik. com). Details of the Russian program are provided in the table below. Table 2.3: Main characteristics of (declassified) Russian Space Photography.
Type of Camera
Space craft
Data availa-ble
Avg. flying height (km)
Average Photo scale
Film type used
Area co-vered (km)
Longi-tudinal overlap of images (%)
Ground resolu-tion (m)
KFA-1000
Resurs-F1
1974 -1993
270 1:270.000 Pan Spectro-zonal
80 * 80 60 4-6 5-7
KFA-3000
Resurs-F1
1978 - 1993
270 1:90.000 Pan 27 * 27 5 2.5-3
TK-350 Cosmos 1983 - ongoing
220 1:630.000 Pan 189 * 284
20 – 80 10
KVR-1000
Cosmos 1983 - ongoing
220 1:220.000 Pan 40 * 158
8-12 2
MK-4 Resurs-F2
1988 - 1995
240 1:650.000 – 1:1.200.000
Pan Spectro-zonal
120 * 120
60 6-8 12-15
KFA-1000
MIR 1990 –19991
400 1:400.000 Pan Spectro-zonal
120 * 120
60 6.7 10
1last astronauts left the space station in August 1999
2.3.2 Optical: multispectral whiskbroom scanners Launched by a Thor-Delta rocket on July 23, 1972 started the Landsat - Earth Resources Technology Satellites program. It represented the first unmanned satellite specifically designed to acquire data about the Earth resources on a systematic, repetitive, medium resolution, multispectral basis with non-discriminatory access to the data recorded worldwide. The whiskbroom scanner used employs a detector and a rotating mirror that are arranged in such a way that the detector beam sweeps in a straight line over the Earth across the track of a satellite at each rotation of the mirror (see figure 2.4). In this way the Earth is scanned line by line as the satellite moves forward. Because of the sweeping motion this type of scanner is also known as the across track scanner. Many scanners operated onboard satellites are based on this principle (Janssen, 2000). With an initial spatial resolution of 80 metres, a revisit time of 18 days and recording the visible green, visible red and two near infrared wavelength portions of the electromagnetic

Chapter 2
20
spectrum the MultiSpectral Scanner, from 1972 onward provided on a continuous basis image data of the earth surface. The other multispectral scanning system, the Return Beam Vidicon (RBV) cameras, was part of the early Landsat satellites, although hardly any data is available of the Landsat 1 and 2 missions (malfunctioning, operated primarily for engineering evaluation purposes). On Landsat 3 the RBV design was changed, it became a broad band sensor (from visible green to near infrared) and the resolution was improved to 30 metres. This satellite was launched on the 5th of March 1978. Figure 2.4: Principle of the whiskbroom scanner.
Rotating mirror
Detector
Satellite
FOV
Orbit
IFOV
Ground Cell
Scan line 1
Scan line N
Track
Swath
The successful launch of the Thematic Mapper on board of Landsat 4 (launched on 16 July 1982) and 5 (launched on 1 March 1984) is recording the earth surface in the visible, near and mid infrared portions of the electromagnetic spectrum at a spatial resolution of 30 metres. Both satellites are still operational. The Landsat 7 satellite carries the Enhanced Thematic Mapper Plus instrument (launched in April 1999) and has a new “panchromatic” channel having a resolution of 15 metres.
2.3.3 Optical: multispectral and panchromatic pushbroom scanners
Pushbroom scanners are based on the use of so called Charge-Coupled Devices (CCD’s) for measuring the electromagnetic energy. A CCD-array is a line of photosensitive detectors that records the incoming photons and converts these to electrons. The electrons are input to an electronic device that quantifies the level of energy. The pushbroom scanners record one entire line at a time. Each position along the line (pixel) has its own detector. One CCD-array corresponds to a spectral band and all the detectors in that array are sensitive to a specific range of wavelengths. For multispectral scanning a number of arrays are used, each array designed to record a different wavelength channel. The advantage of this type of scanner is the reduced noise effect and a more stable geometry (Janssen, 2000).

Overhead detection of minefields, a review of sensors and techniques
21
A French, Swedish and Belgium government owned consortium launched the SPOT-1 satellite on February 22, 1986, improving the spatial resolution to 10 metres for the panchromatic and 20 metres for the multispectral (colour infrared) mode of the high resolution visible (HVR) imaging instrument. Stereoscopic imaging is possible due to the off-nadir viewing capability of the HVR. Images recorded of different satellite tracks can be viewed in stereo and this stereo capability was much better than that of Landsat and Skylab (Genderen, J.L. van, 1974), provided more than a decade earlier. The sensor characteristics remained unchanged till the launch of SPOT 4 on 23 March 1998, which has an extended infrared capacity now called the HRV and InfraRed sensor. For SPOT-5 an improvement of the spatial resolution is envisaged, 5 metres for the panchromatic mode and 10 metres for the green, red and near infrared bands, the mid infrared resolution will remain at 20 metres. Further information on the Landsat and SPOT programs are provided by Lillesand and Kiefer (2000), Sabins (1986), Janssen (2000), Richards (1999). Figure 2.5: Principle of the pushbroom scanner.
Linear detector array
Satellite Optics
FOV
Line 1
Line N
Track
Orbit
Swath
The Indian Remote Sensing program launched the IRS 1-C in 1995 and the IRS 1-D in 1997. Both satellites are also equipped with high resolution panchromatic sensors having a spatial resolution of 5.8 metres (three CCD arrays of 4096 elements each). On the 24th of September 1999 IKONOS-2 was launched (IKONOS-1 failed) and regular data ordering started taking place from the first quarter of 2000 onward. This commercial satellite, operated by Space Imaging (USA), is the first of its kind to provide 1 metre panchromatic and 4 metre multispectral (visible blue, green and red as well as near infrared, identical to Landsat TM bands 1 to 4) data. The off-nadir viewing capability offers a better revisit rate and stereo capability, although at present but very few stereo pairs are available. Unlike other commercial satellites, IKONOS does not provide detailed orbital information, nor are details of the camera model released. The Geo product has the lowest positional

Chapter 2
22
accuracy (so-called 50m CE90, meaning that any point within the image is within 50 metres horizontally of its true position on the Earth’s surface, 90 percent of the time) and is not corrected for terrain distortions. Accuracy becomes even worse in mountainous terrain if the images are acquired with off-nadir viewing. Stereo images of the Geo-products are not distributed to the users and raw images are not available. The Precision-product is the most accurate (4m CE90) but to achieve this the user has to provide the ground control points and a digital elevation model, which should have an accuracy of one metre and five metres respectively (Toutin and Cheng, 2000). This might be a limitation for areas having only small-scale and outdated topographical information available. However, many organizations have already worked out the orbital parameters and tested radiometric and metric accuracy as well as the integrity of this sensor (Gruen, 2000). Li et al (2000) conclude that 1 metre resolution imagery will meet accuracy requirements for medium-scale topographic mapping at scale from 1:25.000 to 1:10.000, compared to SPOT satellite image products that only meet the requirements of small scale mapping at scales from 1:100.000 to 1:50.000. Fraser (2000) observes that ground point triangulation accuracies at the 1 to 2 pixel level can be achieved using alternative restitution models available to supplement the “real camera model”. Space Imaging (Gerlach 2000) states some important parameters of the mission and sensor:
• Flying height: 681 km • Focal length 10 metre • Nominal image scale: 1:68.000 • Physical pixel size: 12µm • Ground resolution: Panchromatic mode 0.82 metre
Multispectral mode 3.26 metre
Furthermore Gerlach states that IKONOS has the capability to either pushbroom or whiskbroom images allowing scanning for larger areas.
Other initiatives to orbit commercial high resolution satellites have occurred. Earthwatch launched the Earlybird (1999) and Quickbird-1 (on 20th November 2000), having a 1 metre panchromatic sensor on board next to a 4 metres multispectral sensor but both launches failed. On December 5, 2000, the EROS A1 was launched into space (URL-4-5). The EROS A+ camera carries a charge-coupled device, providing a swath of at least 12.5 km, with a resolution of 1.8 metres from an altitude of 480 km. More of these high resolution commercial satellites are expected in the near future, like the Orbview 3 and 4 (1 metre panchromatic channel and 4 metre multispectral channels). The Orbview 4 will even carry a 200-channel hyperspectral sensor able to achieve a spatial resolution of 20 metres (also 8 metres, but is only available for US government-approved customers) (URL-6-7-8). High resolution satellite details are listed in table 2.4 On the 6th of December last year Space Imaging was awarded a licence to operate a commercial remote sensing spacecraft capable of providing half-metre resolution images of the Earth. The next generation satellite imaging system will provide half-metre resolution panchromatic and two metre multispectral images (URL-16). Launch is anticipated in 2004.

Overhead detection of minefields, a review of sensors and techniques
23
Further details on the worldwide launch forecast of satellites are available at: http://www.space.com/missionlaunches/ The trend to increased spatial resolution obtained from civilian satellites will yield increasing information from space. Compared to Landsat’s 30 metre resolution, one metre images will offer 900 times more data for forming a visible image and even further improvement of the resolution is expected in the near future. A range of image types are available and some of the (declassified) images in the archives date back a long period. Table 2.4: Performance parameters of commercial 1 metre satellites (after CENSIS 2001).
Corporation Space Imaging
USA
Orbital Sciences, USA
West Indian Space Israel
Ball Aero-space USA
System IKONOS-2 OrbView-3 OrbView-4
EROS-A1, EROS-A2 EROS-B1. .EROS-B6
QuickBird-2
Mode PAN MS PAN MS PAN PAN MS Resolution (m) 1 4 1 4 A:1.8 / B: 0.82 0.5-1.25 2-5 Swath width (km) 11 8 13.5 22 Scene size (km2) 121 64 182 484 Stereo Yes Yes Yes Yes Revisit cycle 1-3 days < 3 days 3 days 1-4 days
Status Lauched 24 Sept. 1999
IKONOS-1 lost
Expected launch OV-4: 23-05-2001 OV-3: 3rd Quarter
2001 OV-1 and 2 lost
A1: launched 5-12-2000
A2: expected 3rd Quarter 2001
Expected launch Aug. 2001
QB-1 lost High resolution images are available from the 1960’s onward, first from the US Corona program, and later also by Russian space photography missions. From 2000 onwards commercially available 1 metre resolution panchromatic as well as 4 metre multispectral data became available and in the near future also high resolution radar satellites will be in orbit providing global image coverage. For minefield detection the accessibility of older high resolution images allows more detailed analysis of conflict areas during the past decades. These types of images can also provide the baseline for change studies in areas were minefields have been constructed during more recent times. Although the resolution is not good enough to detect individual landmines the images provide sufficient detail to detect a number of minefield related objects. Depending on the size of those related objects, also use can be made of the moderate resolution civilian satellite program that have been recording the earth features from the beginning of the 1970’s onward. The use of the high resolution satellites requires knowledge of the approximate location of the minefields, as the image size is limited to approximately 10 by 10 km. The initial use of the Landsat (E)TM combined later with high resolution panchromatic data might be a suitable approach for suspect area identification and minefield perimeter detection.

Chapter 2
24
2.3.4 Thermal remote sensing systems Few remote sensing systems exist that record the Earth using the thermal infrared part of the spectrum in medium spatial resolutions. The wavelengths in this range (from 8 to 14 µm) are directly related to the objects temperature. Landsat Thematic Mapper and the Enhanced Thematic Mapper record the thermal spectrum (10.4 to 12.5 µm) at spatial resolutions of 120 and 60 metres respectively having a 16 day repetitive cycle (Zhang, 1998). With the launch (December 1999) of the Advanced Spaceborne Thermal Emission and Reflection Radiometer (ASTER) another high resolution, multispectral imager is operational. ASTER provides observations in three spectral regions and the infrared subsystem has five spectral bands covering 8.125 – 11.65 µm. at 90 m. resolution (Abrams, 2000). It is doubtful if the thermal recordings at these resolutions are of any value for humanitarian demining. More recent developments feature a Multispectral Thermal Imager (MTI), sponsored by the US Department of Energy (DOE), Office of Non-proliferation and National Security. The MTI consists of a single polar orbiting satellite (approximate altitude of 580 km.) to demonstrate advanced multispectral and thermal imaging, image processing and associated technologies. The system records the Earth surface in 15 spectral bands from the visible to the longwave infrared. Spatial resolution in the visible bands is 5 metres, the other spectral channels are recorded with a resolution of 20 metres. Twice daily the MTI satellite transmits collected images to facilities in New Mexico were they are processed and distributed. The system will be used in the development of future systems designed to support treaty monitoring, military operations, environmental and climate monitoring (URL-17-18). However, data is limited to only bonafide US agencies.
2.3.5 Microwave remote sensing systems With the notable exception of synthetic aperture L-band radars such as Seasat (1978, resolution 25 metres), Shuttle imaging radar SIR-A (November 1981, resolution 40 metres) and SIR-B (October 1984, 15-50 metres ground range resolution), there was a time lag of several years before orbiting radar satellite systems at course spatial resolutions were introduced in the civilian sector (Trevett, 1986, Navalgund et al 1996). The SIR-C mission was conducted in April and October 1994, using three different radar systems, an L-band, C-band and X-band SAR, using multiple polarizations and range resolutions varied between 10 – 200 metres.
In March 1991 the Soviet Union started operating an earth orbiting S-band radar system on a commercial basis called Almaz-1. The satellite returned to earth in October 1992, after about 18 months of operation. The effective resolution varied from 10 to 30 metres, and depending on the region of interest the radar system provided repeated image coverage at intervals of 1 to 3 days.

Overhead detection of minefields, a review of sensors and techniques
25
Although many images were collected, the short duration of each of the above mentioned missions combined with the medium resolution, may limit the use for interpretation of historical developments.
ERS 1 and 2, JERS and RADARSAT are regular earth orbiting medium resolution radar satellites. System details are provided in table 2.5.
At present high resolution earth orbiting Synthetic Aperture Radar satellites are being developed like the RADARSAT-2 (operating in C-band, having a 3 metre resolution in Ultra-fine beam mode and a selection of polarization options, launch in 2001 or 2002) and the RADAR1 satellite (1 metre resolution) of RDL Space Corporation (launch in 2001). NASA expects to launch the L-band LightSAR in 2002, which can achieve a resolution of 3 metres, having multiple polarizations (HH and VV) (Lillesand and Kiefer 2000, Richards and Jia 1999).
Table 2.5: System characteristics of medium resolution earth orbiting radar satellites.
Characteristics ERS-1
(ESA)
ERS-2
(ESA)
JERS-1
(Japan)
Radarsat-1
(Canada)
Launch date July 1991 April 1995 February 1992 November 1995
Wavelength band C-band C-band L-band C-band
Polarization VV VV HH HH
Resolution (m) 30 30 18 8 – 100
Status Operational Operational Operated till Oct. 1998
Operational
The new generation high resolution radar systems may have a great potential for humanitarian demining, because of the radar’s day / night, all weather acquisition capacity. In addition soil and other micro-relief disturbances caused by the warring fractions during the conflicts are detectable on the SAR data because of the radar shadows (enhancing micro- relief), changes in surface texture / roughness and changes in soil moisture. The main satellite operators have Internet sites that can be used to obtain information of satellite data available of a specific area. Quick looks (down sampled satellite images) can be viewed on-line to see e.g. the location of eventual cloud cover. In a large number of countries a national point of contact exists that has the necessary contacts to perform a search of different sensors of an area of interest.

Chapter 2
26
2.4 Airborne sensor developments Both military and civilian organizations are struggling to develop means to remotely detect landmines. To assist in this task, at the Joint Research Centre (JRC), an international data base has been developed of anti-personnel landmine signatures acquired under different test conditions using three sensor classes: radar, thermal infrared and metal detectors (Fortung-Guasch et al, 2000). The problem is one of detecting small, camouflaged, buried or otherwise obscured objects in a highly diverse and changing environment covering large areas. A more effective capability to conduct wide area detection of landmines and minefields is of vital importance if through the use of such a system land can be released at reasonable rates and with sufficient accuracy, the system will be badly needed (Blagden, 1998). The remote sensing technologies should determine the presence or absence of mined areas and furthermore it should be able to accurately detect and delineate the boundaries of mined areas containing anti-personnel and anti-tank mines. A wide range of airborne sensors has been developed, sensitive to different portions of the electromagnetic spectrum. Each of the sensors offers specific characteristics that can be utilized for landmine detection capabilities.
2.4.1 Optical techniques The main sensors recording information in the optical range are film-based photogrammetric cameras, digital multispectral cameras, Video-CCD hyperspectral sensors and more recently digital photogrammetric cameras.
2.4.1.1 Film-based photogrammetric cameras Photogrammetric cameras provide the highest spatial resolution. Using Forward Motion Compensation (providing a wider scope for exposure, permitting the use of more sophisticated film emulsions) and a stabilized mount (angular motion compensation) used for cameras such as the Zeiss LMK and RMK-TOP or Leica RC 30 can provide images with a spatial resolution of several millimetres under favourable atmospheric conditions. The film format of 23 by 23 cm. enables photographic enlargements up to scales of 1:50 to be made, when the original contact scale of the air photos is 1:500. High resolution lenses are used having different focal lengths (152 mm.- wide angle, 305 mm.– normal angle and 610 mm. – narrow angle). The human eye is accustomed to see the resultant photographic images through their tonal contrast, sharpness and stereoscopic impressions. For landmine detection a number of film emulsion can be used such as panchromatic, orthochromatic, black and white infrared, colour film and colour infrared (camouflage detection) film. Spectral sensitivity and resolution for each of the film emulsions is different so that they can record some object more distinctly than others (see table 2.6). The black and white panchromatic film is equally sensitised to the whole visible spectrum and can be regarded as a general purpose film. The emulsion may have an extended red sensitivity (up to 0.73µm). This film emulsion is used all over the world, no special processing techniques are required and furthermore necessary “know how” is also available in most developing countries. Other film emulsions are sensitised for different spectral

Overhead detection of minefields, a review of sensors and techniques
27
ranges together with the application of specific filters, blocking or absorbing selected wavelengths, permitting differentiation of objects with a nearly identical spectral response pattern in the visible spectrum but are having different reflection characteristics in e.g. the infrared region. Table 2.6: Spectral sensitivity of available aerial film types.
Film resolution (line pairs/mm.)* Film type Spectral range (µm)
Low contrast High contrast Panchromatic 0.4 – 0.7 50-125 125-400 Orthochromatic 0.4 – 0.6 - - Black & white infrared 0.4 – 0.9 50 125 Colour 0.4 – 0.7 25-50 80-125 Colour infrared 0.5 – 0.9 32 63
*Characteristics of Kodak aerial films (Eastman Kodak Company, 1996a) The orthochromatic film, used in the past as the standard film for aerial mapping in the United States, has a strong sensitivity to green light and is particularly useful for coastal studies and vegetation mapping. The film allows maximum penetration depth of water bodies and the green vegetation shows a good tonal contrast facilitating the identification of certain vegetation details (Lo, 1976). The black and white infrared film exhibits a number of features, such as the special reflection properties of vegetation, better haze penetration properties and the high degree of absorption of infrared light by water bodies. Infrared emulsion is insensitive to diffuse or polarised light resulting in the “black shadow effect”. These properties can be usefully exploited in applications like geology were lithological differences are more clearly reflected in grey tone pattern than panchromatic photography. The emphasis of shadows by infrared can be useful to the interpreter by revealing ditches and trenches and by showing up contours, apart from the more obvious cases of revealing objects by intensifying the shadowed outlines. Photography using monochrome film fails to give a true picture of the terrestrial environment because it does not depict colour as we see it. Moreover the human eye can separate 20.000 hues and chromas, but only 200 shades of grey, more information can be obtained from colour photography than from black and white photography. Colour film maintaining a high degree of colour fidelity, good image quality combined with a high metric accuracy has been developed. Furthermore colour and colour infrared reversal film facilitates the use of positive transparencies, which are superior to prints for interpretation, because they give a higher resolution compared to prints from colour negatives (are first- order generation, prints are second-order). The colour film, designed for low to medium altitude aerial mapping and reconnaissance has also agricultural and forestry applications, such as the identification of crop and tree types through their colour association and for the detection of diseased plants as they exhibit under stress conditions unique discoloration.

Chapter 2
28
Recently a new colour negative film (Kodak Aerocolor III) was introduced. This film offers greater resolution and sharpness, combined with increased detail in shadows and light saturated areas. These improvements are important for detection of small objects. The resolving power at low contrast is 80 line pairs/mm. and at high contrast 120 line pairs/mm. (Brake and Mango 2000, Eastman Kodak Company 2001). Through the use of false colour photography a better interpretability can be achieved utilizing the greater colour contrast. The film is the colour counterpart of the black and white infrared film. The colour infrared (CIR) film emphasises differences between objects that are visually quite similar but uses the differences in infrared reflectance. The film is intended for various applications such as vegetation surveys, camouflage detection and earth resources monitoring and archaeology. The CIR film is also used in conjunction with the other film-types described (Eastman Kodak Company, 1996b). Colour infrared film (originally called “camouflage detection film”) was sometimes effective when used to photograph objects painted to imitate foliage. Figure 2.6 shows some paints (B) that may have infrared reflectance characteristics quite different than those of foliage (A). The resulting colour infrared appearance of healthy deciduous foliage will be magenta or red and the painted objects appear purple or blue. Some paints have been developed with spectral reflectance curves closely approximating those of some types of foliage (C). Camouflaged areas are most easily detected by comparing normal colour and colour infrared images made of the same object (Brock, 1967). Figure 2.6: Spectral reflectance of natural and artificial green.
CIR photography was reported to be capable of emphasising characteristics of many cultural features, such as building outlines, roof design, road materials and condition. In high residential areas the details appeared much sharper than compared to true colour film. In the search for hidden archaeological sites CIR images may provide clues such as a change in colour pattern of vegetation detected in the shape or outline of a square, rectangle or some other geometrical pattern indicating that something man-made may lie below the earth surface, like a grave site,
0.90.80.70.60.50.41.5
1.25
1.0
0.75
0.5
0.25
Ref
lect
ion
Den
sity
Wave-Length-Microns
(A) (B)(C)
Green leafGreen camouflage paints}

Overhead detection of minefields, a review of sensors and techniques
29
building, fortification or boundary wall. These differences may be easily overlooked using other film emulsions. Apart from being more expensive, other disadvantages of the use of colour and colour infrared film is the need of special colour processing equipment that is not readily available in the landmine affected countries. If film should be sent abroad for further processing security problems may arise. Additional disadvantage of the colour infrared film is the limited shelf-life and special storage requirements (freezer) which is sometimes difficult to accommodate especially if large quantities of film are used. Furthermore the interpretation of CIR photos is more difficult.
Figure 2.7: Examples of black and white infrared, colour and colour infrared aerial photographs taken of a minefield in Belgium. The images can be scanned, and processed/enhanced subsequently in any digital image processing system. The images can be studied stereoscopically to enhance micro-relief features. In addition to being used to detect minefields, aerial photography by means of such photogrammetric cameras is used to produce digital orthophoto base maps, which can serve
1: Colour aerial photo. Originalcontact scale 1:1000 2: Black and white infraredaerial photo. Contact scale1:1000 3: Colour infrared aerial photo(camouflage detection film).Contact scale 1:500.
1 2
3
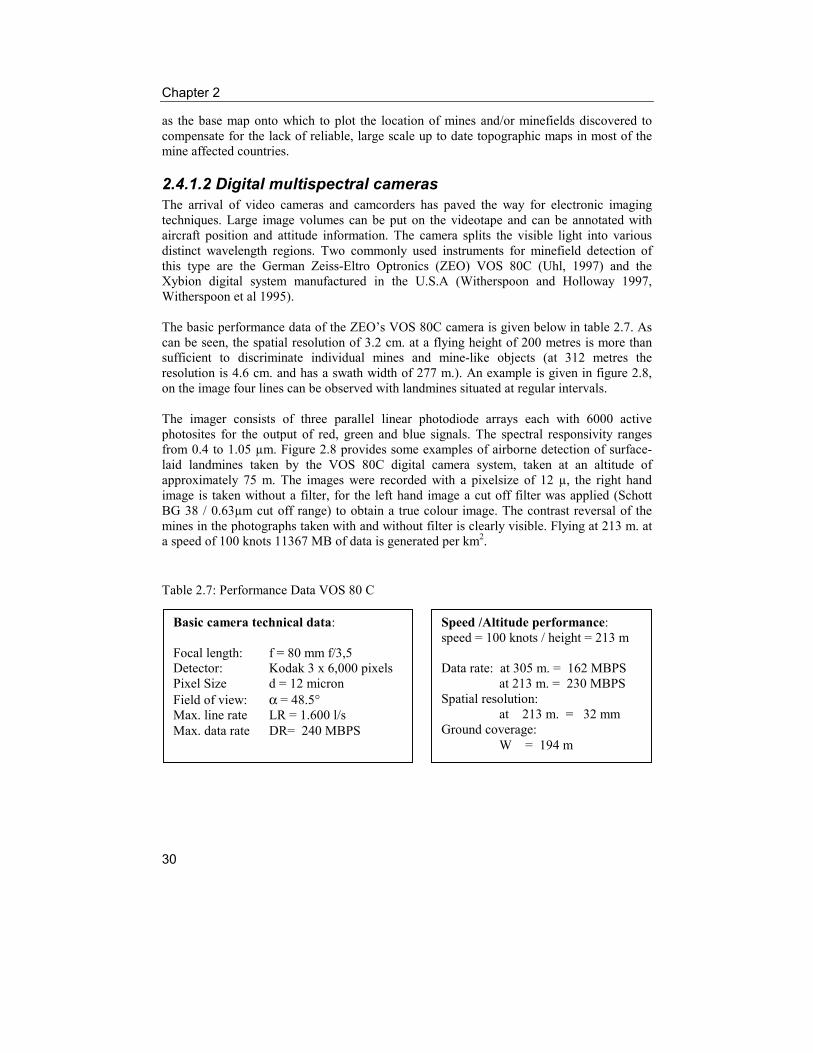
Chapter 2
30
as the base map onto which to plot the location of mines and/or minefields discovered to compensate for the lack of reliable, large scale up to date topographic maps in most of the mine affected countries.
2.4.1.2 Digital multispectral cameras The arrival of video cameras and camcorders has paved the way for electronic imaging techniques. Large image volumes can be put on the videotape and can be annotated with aircraft position and attitude information. The camera splits the visible light into various distinct wavelength regions. Two commonly used instruments for minefield detection of this type are the German Zeiss-Eltro Optronics (ZEO) VOS 80C (Uhl, 1997) and the Xybion digital system manufactured in the U.S.A (Witherspoon and Holloway 1997, Witherspoon et al 1995). The basic performance data of the ZEO’s VOS 80C camera is given below in table 2.7. As can be seen, the spatial resolution of 3.2 cm. at a flying height of 200 metres is more than sufficient to discriminate individual mines and mine-like objects (at 312 metres the resolution is 4.6 cm. and has a swath width of 277 m.). An example is given in figure 2.8, on the image four lines can be observed with landmines situated at regular intervals. The imager consists of three parallel linear photodiode arrays each with 6000 active photosites for the output of red, green and blue signals. The spectral responsivity ranges from 0.4 to 1.05 µm. Figure 2.8 provides some examples of airborne detection of surface-laid landmines taken by the VOS 80C digital camera system, taken at an altitude of approximately 75 m. The images were recorded with a pixelsize of 12 µ, the right hand image is taken without a filter, for the left hand image a cut off filter was applied (Schott BG 38 / 0.63µm cut off range) to obtain a true colour image. The contrast reversal of the mines in the photographs taken with and without filter is clearly visible. Flying at 213 m. at a speed of 100 knots 11367 MB of data is generated per km2. Table 2.7: Performance Data VOS 80 C
Basic camera technical data: Focal length: f = 80 mm f/3,5 Detector: Kodak 3 x 6,000 pixels Pixel Size d = 12 micron Field of view: α = 48.5° Max. line rate LR = 1.600 l/s Max. data rate DR= 240 MBPS
Speed /Altitude performance: speed = 100 knots / height = 213 m Data rate: at 305 m. = 162 MBPS
at 213 m. = 230 MBPS Spatial resolution:
at 213 m. = 32 mm Ground coverage:
W = 194 m
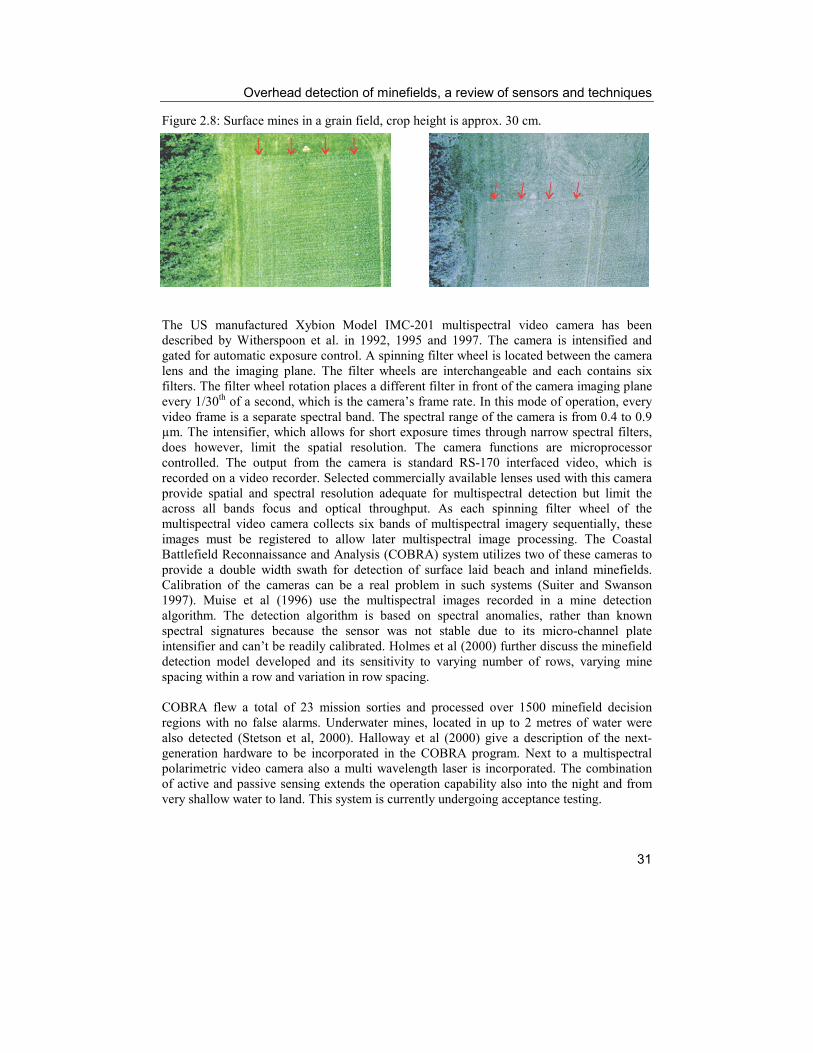
Overhead detection of minefields, a review of sensors and techniques
31
Figure 2.8: Surface mines in a grain field, crop height is approx. 30 cm.
The US manufactured Xybion Model IMC-201 multispectral video camera has been described by Witherspoon et al. in 1992, 1995 and 1997. The camera is intensified and gated for automatic exposure control. A spinning filter wheel is located between the camera lens and the imaging plane. The filter wheels are interchangeable and each contains six filters. The filter wheel rotation places a different filter in front of the camera imaging plane every 1/30th of a second, which is the camera’s frame rate. In this mode of operation, every video frame is a separate spectral band. The spectral range of the camera is from 0.4 to 0.9 µm. The intensifier, which allows for short exposure times through narrow spectral filters, does however, limit the spatial resolution. The camera functions are microprocessor controlled. The output from the camera is standard RS-170 interfaced video, which is recorded on a video recorder. Selected commercially available lenses used with this camera provide spatial and spectral resolution adequate for multispectral detection but limit the across all bands focus and optical throughput. As each spinning filter wheel of the multispectral video camera collects six bands of multispectral imagery sequentially, these images must be registered to allow later multispectral image processing. The Coastal Battlefield Reconnaissance and Analysis (COBRA) system utilizes two of these cameras to provide a double width swath for detection of surface laid beach and inland minefields. Calibration of the cameras can be a real problem in such systems (Suiter and Swanson 1997). Muise et al (1996) use the multispectral images recorded in a mine detection algorithm. The detection algorithm is based on spectral anomalies, rather than known spectral signatures because the sensor was not stable due to its micro-channel plate intensifier and can’t be readily calibrated. Holmes et al (2000) further discuss the minefield detection model developed and its sensitivity to varying number of rows, varying mine spacing within a row and variation in row spacing. COBRA flew a total of 23 mission sorties and processed over 1500 minefield decision regions with no false alarms. Underwater mines, located in up to 2 metres of water were also detected (Stetson et al, 2000). Halloway et al (2000) give a description of the next-generation hardware to be incorporated in the COBRA program. Next to a multispectral polarimetric video camera also a multi wavelength laser is incorporated. The combination of active and passive sensing extends the operation capability also into the night and from very shallow water to land. This system is currently undergoing acceptance testing.

Chapter 2
32
In Europe, the Swedish Defence Research Agency (FOA) is carrying out research to enhance and adapt the Xybion multispectral camera system further for minefield detection and several algorithms are currently being tested and analyzed to separate objects from the background. The filtering method used by the Xybion makes it easier to find and separate man-made objects from natural objects in the scene under consideration (Christiansen and Ringberg, 1996, 1997), but to date FOA has not reported to have actually located landmines using the system beyond a test set-up. Scheerer (1997) reported on the use of video cameras which have an extended sensitivity beyond the visible spectrum in the red channel up to 1.1 µm. Used together with a near infrared laser illuminator mines with camouflage colours in a background of natural vegetation can be better detected.
2.4.1.3 Hyperspectral scanners Much experimental work using hyperspectral scanners has been done in Canada, by research groups such as McFee. et al (1997) and Achal. et al (1995, 1999). One such system is the CASI (Compact Airborne Spectrographic Imager), which is a pushbroom imaging spectrograph intended for acquisition of visible and near-infrared multispectral imagery from light aircraft. The instrument operates over a 0.545µm spectral range that can be placed between 0.4 and 1 µm. and has a 37.8° field of view (FOV) across-track. The CASI may be programmed to operate in three modes, which provide different types of CCD readout. In Spatial Mode the sensor acts as a multispectral scanner, the full across-track resolution of 512 pixels is obtained for up to 19 nonoverlapping spectral bands with programmable centre wavelengths and bandwidths. The spatial resolution is inversely related with the number of bands selected. In Spectral Mode contiguous spectral radiance values from 0.43 to 0.87 µm. in 1.9 µm. increments are recorded. Up to 101 imaging points along the swath can be obtained. A programmable monochromatic image at the full spatial resolution (Scene Recovery Channel) is also acquired to provide a reference. In Full Frame Mode the complete spatial and spectral resolutions are maintained, the full spectral resolution of 288 samples recorded for each of the 512 spatial pixels. This mode is used for acquisition of calibration data or where a data set using full resolution is desired. In all modes data are digitized to a precision of 12 bits (Wulder et al, 1996). The pushbroom scanner utilizes the forward motion of the aircraft to obtain a two dimensional image of the areas below. The speed of the aircraft and the sensor integration time determine the along track pixels size and the aircraft altitude is determining the across-track pixel size. To obtain a spatial resolution of 15 cm for the detection of AT-mines, the airborne platform must have an airspeed of 35 knots (18 m/s), a flying height above terrain of 110 m. (Achal et al, 1999) and therefore a helicopter has to be used. The instrument has an image swath of 512 pixels, so a spatial resolution of 15 cm. will produce an image swath of 76.8 m. To detect AP-mines an even higher spatial resolution is required and higher spectral resolutions will be needed for dense green vegetation and both should be obtained at the same time. Kenton et al (1999) conclude that the spatial resolution should allow two pixels on target for good spectral discrimination performance and that it may be possible to achieve a sufficient detection performance with an optimally selected set of 5 or 6 bands.

Overhead detection of minefields, a review of sensors and techniques
33
Helicopter based systems can fly very low and slow, but as can be seen from above figures, only a very narrow swath is covered. Hence helicopter based platforms are only practical if one already knows where the minefield is or where there is one suspected to be. It is impractical for humanitarian purposes to search for landmines and minefields in countries of over one million square kilometres such as Angola by means of helicopter. Then aeroplanes must be used in order to cover large areas. Other problems associated with VNIR mine detection are that algorithms must be used one after the other for each expected mine type and the detection of buried mines suffers from a high false alarm rate (Achal et al, 1999). Experiments were conducted to see if buried surrogate mines could be detected by measuring the change in reflectance spectra of vegetation above the mine sites. The mines were not detectable directly after burial, but could be differentiated 1.5 months later. This was attributed by a difference in the reflectance spectra of the vegetative cover by stress due to the burial process. A number of mines were not detected and the number was apparently increasing with thickness of foliage (McFee et al, 1996). In the United States, Lucey et al (1997) and Fields et al (1997) are also active with an airborne hyperspectral imager (AHI) for landmine detection. The hyperspectral mine detection (HMD) program has made measurements over the full optical spectral region from the visible through long wave infrared. The principal phenomena identified for hyperspectral mine detection is based upon localized spectral differences in the image created by the emplacement of the mines. This localized difference, due to soil – mineral compositional and particle size differences will result in a difference in spectral signature of the soil that can be observed using a hyperspectral sensor. A good indicator of disturbed versus undisturbed soil is the magnitude (difference of more than 10 %) of quartz “reststrahlen” recorded at 9.2 µm. While the strength of the signature is strongest immediately after the mine is buried, it will be detectable for a period of weeks up to months depending on the degree of weathering and rainfall. This feature is confirmed by more recent measuring campaigns (Kenton et al, 1999) but showed also the dependency on quartz. This feature was nearly absent in typical bare soil regions encountered in Bosnia and Jordan. The program found other minerals having this “reststrahlen” effect. Using other spectral regions also the localized temperature differences can be used. For the detection in the reflected infrared, the region around 2.2 µm. is a useful region since here the signature of the mineral differences and the signature of the soil moisture content are especially strong (De Persia, 1995). Haskett et al (2000), using an analytical spectral devices field spectrometer, collected hyperspectral buried mine reflectance signatures (1553 bands extending from 0.35 to 2.5µm, spatial resolution 9 cm.) in various soils (road, gravel and vegetation covered) and burial conditions (1 to 2 days, two weeks, four weeks). They conclude that the more disturbed the soil (over the mines) the more different the signatures are between the disturbed soil and the background and the longer the buried time, the less different the signatures are between the disturbed soil and the background.
Chapter 2
34
Coath and Richardson, using a spectrophotometer, measured diffuse and specular reflections of four representative scatterable anti-personnel landmines (dispersed by e.g. artillery, rockets, etc.) and were compared to those of grass and soil backgrounds. They conclude that maximum contrast is in the near ultra-violet and near infrared portion of the electromagnetic spectrum.
2.4.2 Thermal infrared techniques Infrared mine detection can be based upon the detection of a texture difference in the soil, the detection of a local spectral difference and the detection of a local temperature anomaly. The wavelength regions being used to detect mine-like objects and minefields are the 1-2.5 µm. short –wave infrared (SWIR), the 3-5 µm. thermally dominated mid-wave (MWIR) and the 8-12 µm. long-wave infrared (LWIR) portions of the electromagnetic spectrum. Recently buried mines can be seen in the thermal infrared because the disturbed soil has an apparent temperature difference from the surrounding undisturbed soil. The lower soil density reduces the thermal conductivity. The detection of a buried mine by this method will be affected by weather conditions, since rain will cause the soil to compact and the anomaly to disappear (Winter et al, 1997). Thermal techniques can be used to detect mines that have been buried in the ground for a long time. The heat transfer through the soil will be affected by the presence of a buried object such as a plastic landmine, which is made up of a low-conductivity material. During the day, when the sun is shining, the soil above the mine is effectively warmed more than the soil to the sides (since the mine blocks the heat transfer to some extent) while at night the opposite occurs. The soil above the mine appears hot during the day and cools more during the night, compared to its surrounding environment (thermal inertia). High conductivity materials have the opposite effect, cool by day and warm at night. Detection of buried mines using temperature anomalies does not rely on the properties of the surface, so long after the disturbed soil properties have disappeared the temperature anomaly will still be present. Mine detection based on temperature anomalies is prone to high false alarm rates since rocks and vegetation also cause temperature differences. To predict the diurnal contrast variations under different conditions Uppsäll et al (2000) have collected outdoor time series of landmines in a sand box and in a gravel road. The maximum contrast between the buried mine (depth 29 cm, buried 2½ year prior to measurements) and the gravel road background occurred during the early afternoon (up to 18.00 hrs.) using shortwave and longwave infrared measurements. For the other times during the diurnal cycle the contrast in apparent temperature was only up to 0.5 ºC. compared to the surrounding environment. For the sandbox measurements generally higher thermal contrasts are recorded and a maximum thermal contrast exists at 9.00 hrs. and during the early afternoon for the longwave infrared. Maximum contrast for the shortwave infrared is also found at 9.00 hrs. and during noon. Based on diurnal measurements using a standoff (distance of 15 metres) high resolution LWIR scanner Janssen et al (1996) over a testbed of humid and dry white sand were able to

Overhead detection of minefields, a review of sensors and techniques
35
detect surface laid plastic and metal AT and AP-mines during the whole day, several of the buried mines could be detected during two periods of the day: around sunrise and sunset. Carter et al (1998) report on the use of a thermal sensor after microwave irradiation of the soil containing a shallow buried mine-like object. Difference in soil moisture (mine – dry versus soil – moist) result in differential heating that is recorded from a short standoff distance by the thermal sensor. The method is reported to be slow, is dependent on a critical amount of soil moisture and requires a large amount of power for microwave irradiation. Soelberg et al (2000) tried to verify if a certain mine would cause unnatural variations given a specific background (gravel and meadow) from varying heights (6, 8 and 10 metres). To test this, thermal models with varying sizes and temperature contrasts are used, to provide some guidelines on the minimum temperature contrast and a minimum size / resolution (in pixels) for the mine model to detect the object. Their initial research suggests, taking into consideration the classifier used, that for a good detection rate with minimum false alarms, a mine radius is needed of four pixels and a temperature contrast of 0.5 ºC. A lower thermal contrast leads to lower detection rates and higher false alarm rates.
2.4.2.1 Shortwave infrared: 3-5 Microns Rockwell Corporation Tactical Systems Division and Zeiss-Eltro Optronic GmbH have decided to co-operate in the production of various configurations of a Manportable Forward-Looking Infrared unit, the MFLIR system. The MFLIR is packaged as a self-contained unit, with one I/O connector to operate the FLIR, including e.g. power input and a 12 bit digital video output. The FLIR works in the spectral band of 3-5µm using a detector array of 320 by 240 pixels. The two-dimensional focal plane array is mounted inside an all-metal vacuum dewar with proper cold spectral filtering and cold shielding to maximize the signal-to-noise ratio. A variety of lenses are available for different applications. In the case of landmine detection, a zoom lens can be attached to the camera giving more flexibility to adapt camera performance and resolution requirements to the aircraft mission profile. With an instantaneous field of view of 0.5 mrad, it is ideal for rapid reconnaissance of minefields along roads and roadside verges, bridges, tracks, etc. It has a spatial resolution of 20 to 30 mm. depending on flying height (21 mm. at 213 m. and 31 mm. at 305 m.) using a focal length of 300 mm. and has a swath width of 7 and 10 metres respectively. Another off-the-shelf thermal IR system in this wavelength region, which is presently being adapted, is the AGEMA thermal imager. This instrument can obtain spatial resolutions of 10 and 15 cm at 100 m. and 300 m. respectively (aircraft ground speed of 100 knots). Fritzsche and Löhlein, using a 3-5 µm thermal IR camera, conclude that no satisfactory solution for automatic object detection in the images acquired could be established because objects and background in general had similar statistical texture and therefore common texture extraction techniques could not be successfully applied. They further concluded that polarimetric IR sensing could be a more promising solution, as manmade targets with smooth surfaces and edges tend to show up clearer.

Chapter 2
36
More recently also high resolution mid-wave infrared framing cameras providing a wide field of view coverage are being developed. These cameras can acquire continuous stereo coverage (Lareau 1998, Kauffman 1998) and are used for tactical reconnaissance (Holler, 1999).

Overhead detection of minefields, a review of sensors and techniques
37
2.4.2.2. Longwave infrared: 8-12 Microns The standard commercial airborne thermal infrared linescanner (IRLS) used for many remote sensing applications is the DAEDALUS, used by many air survey companies around the world. However, the spatial resolution, even at low flying heights is not high enough to detect mine-sized objects.
Three military systems have been developed in the USA, called AMIDARS (Airborne Minefield Detection and Reconnaissance System), REMIDS (Remote Mine Detection System) and CMADS (Countermine Airborne Detection System). The AMIDARS system consists of a RECON Optical Company CA-860 thermal infrared linescanner in the 8-12 µm. range, specifically designed for the purpose of detecting surface mines from an airborne platform. This is commercially available. Martin-Marietta Corp developed the CMADS system. Figure 2.9 shows the ground coverage of the three sensors. Hence, in practice, for humanitarian demining, only the RECON CA-860 is suitable, in order to cover large areas as in Angola, Mozambique, Afghanistan, etc. A one-kilometre wide swath is covered at a flying height of some 300 metres. Figure 2.9: Ground coverage and flying height of three thermal sensors (after Maksymonko and Breiter)
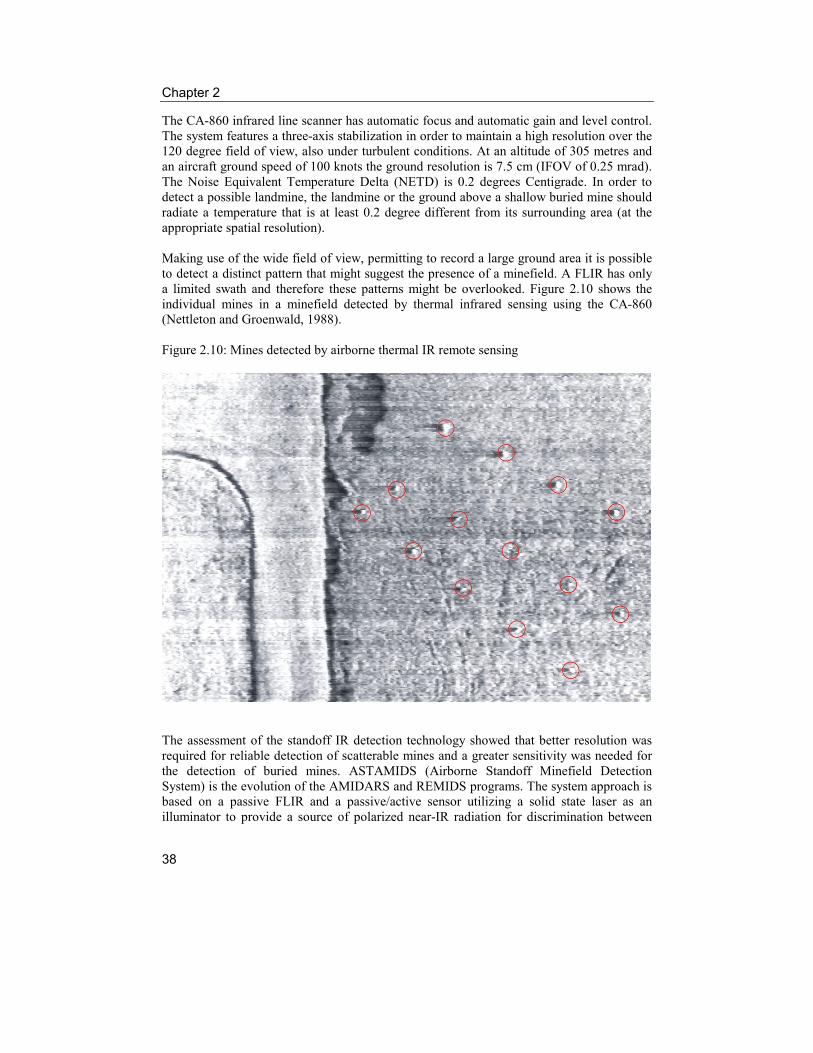
Chapter 2
38
The CA-860 infrared line scanner has automatic focus and automatic gain and level control. The system features a three-axis stabilization in order to maintain a high resolution over the 120 degree field of view, also under turbulent conditions. At an altitude of 305 metres and an aircraft ground speed of 100 knots the ground resolution is 7.5 cm (IFOV of 0.25 mrad). The Noise Equivalent Temperature Delta (NETD) is 0.2 degrees Centigrade. In order to detect a possible landmine, the landmine or the ground above a shallow buried mine should radiate a temperature that is at least 0.2 degree different from its surrounding area (at the appropriate spatial resolution). Making use of the wide field of view, permitting to record a large ground area it is possible to detect a distinct pattern that might suggest the presence of a minefield. A FLIR has only a limited swath and therefore these patterns might be overlooked. Figure 2.10 shows the individual mines in a minefield detected by thermal infrared sensing using the CA-860 (Nettleton and Groenwald, 1988). Figure 2.10: Mines detected by airborne thermal IR remote sensing
The assessment of the standoff IR detection technology showed that better resolution was required for reliable detection of scatterable mines and a greater sensitivity was needed for the detection of buried mines. ASTAMIDS (Airborne Standoff Minefield Detection System) is the evolution of the AMIDARS and REMIDS programs. The system approach is based on a passive FLIR and a passive/active sensor utilizing a solid state laser as an illuminator to provide a source of polarized near-IR radiation for discrimination between

Overhead detection of minefields, a review of sensors and techniques
39
man-made and natural objects. The spatial resolution is 2.5 cm (Bowman et al, 1999). Two active channels measure the polarized return energy and a 3rd passive channel are used for the detection of buried mines. Using the temperature anomaly associated with the buried mine and a spatially based detection technique, utilizing the high spatial resolution, the buried mines can be differentiated from the background. The result generated based on a test of these sensing systems conducted in 1997 is not conclusive given the sensor problems encountered, which does not allow for an adequate assessment (Maksymonko and Ngoc Le, 1999). Generally high probabilities of detection and low false alarm rates were found only in artificial clutter-free environments. Minefield test results were disappointing due to the high level of vegetation clutter (Bowman et al, 1999). Of the various optical, thermal and microwave sensors, the 8-12 µm. wavelength passive infrared sensor is the most dependent on environmental conditions. As Simard has shown (1996), the performance of thermal infrared sensors can degrade during the inversion period of the diurnal cycle, unfavourable air temperature, cloud cover, soil moisture and other factors. Using two or more thermal infrared images of the same area taken at different times of the diurnal cycle, time-domain analysis techniques help to reduce the effect of the many environmental parameters and thereby enhance the probability of detection. To date, most of the work on landmine detection by means of thermal infrared has been ground, or vehicle based. Some papers referring to airborne methods can be found in Maksymonko and Breitner (1997), Del Grande et al (1993), Scheerer (1997) and Winter et al (1997). Often 3-5 and 8-12 µm. systems are used simultaneously as a dual-band infrared (DBIR) imaging technique (Del Grande et al 1993). The Temperature Evaluated Mine Position Survey (TEMPS) uses a dual-band Thermovision 880 infrared scanner from Agema Infrared Systems. The shortwave band (SWB) image and the longwave band (LWB) image are ratioed to produce a temperature map that enhances the surface temperature difference for different surface materials. Another ratio (LWB/SWB) produces an emissivity-ratio map which enhances the emissivity-ratio differences between surface materials and surface object clutter, independent of their temperature. Decoupling the heat patterns (associated with the buried mines) from the surface-emissivity patterns (associated with clutter) allows for a better discrimination between natural background and man-made objects and helps to reduce the false alarm rate. The results obtained from a FLIR (Agema 570, 7.5 to 13 µm) mounted on top of the Mine Hunter-Killer system (Bishop et al 2000, Watts et al 2000) show that because of the wide variations in performance, the incorporation of the infrared sensor can improve detection performances of surface laid or shallow buried landmines only under a very narrow range of conditions. Table 2.8 gives a comparison of the current infrared mine detection techniques (after Winter et al, 1997) and problems encountered.

Chapter 2
40
Table 2.8: Comparison of infrared mine detection techniques. Mine detection
technique Spectral Region
Physical observable
Application time scale
Problems
Texture detection (night IR)
MWIR / LWIR
Recently disturbed soil
Up to several days
False alarm rate due to vegetation
Spectral detection (SWIR)
2-2.5µm Disturbed soil Unknown Unreliable mine signature
Spectral detection (MWIR)
4.5-5 µm Disturbed soil Unknown Unreliable mine signature
Spectral detection (LWIR)
8-12 µm Disturbed soil Days to months
Sensor and processing complex
Temperature detection
8-12 µm Thermal inertia of
buried mine
Indefinite False alarm rate due to vegetation,
rocks, etc.
2.4.2.3 Polarimetric infrared techniques Standard infrared cameras detect the amplitude of the thermal emission and apart from using multiple infrared regions also use can be made of the polarimetric infrared features of the scattered and emitted electromagnetic radiation from the mines and the ground clutter. Polarimetry is the measurement of the state of polarization of optical radiation, or the measurements of change of state of polarization by propagation though an optical material (Barbour et al, 1996). The landmines are exhibiting a regular geometry in contrast to the random oriented surrounding and this may result in a high probability of detection and low false alarm rates. At the Defence Evaluation and Research Agency (UK) pioneer work was done on the characterisation of polarisation effects in the 3-5 and 8-12 µm thermal bands. The disadvantage of the technology is that thermal radiation cannot penetrate vegetation and therefore mines may go undetected (Bishop et al 1998, 1999). At DERA an Infrared Polarimetric Camera (IRPC) to detect surface laid and buried anti-tank mines is currently under development (Barbour et al, 1998) Using the polarization metrics Larive et al (1999) were able to enhance the contrast between man-made objects and natural clutter. According to Barnes et al (1999) the degree to which the light is polarized (DoP) and the degree to which the light is linearly polarized (DoLP) tends to highlight man-made objects. Also de Jong et al (2000) conclude that detection performance is improved using classifiers that are also based on polarization features, compared to those based on the intensity cue only. The combination or the fusion of the intensity and the linear polarization gave the best detection performance.
2.4.2.4 Passive millimetre wave imaging This technique can be seen as a thermal imaging technique using very long wavelengths. A passive millimetre wave radiometer receives both thermally emitted radiance (in proportion to the object’s emissivity and temperature) and reflected / scattered atmospheric radiance

Overhead detection of minefields, a review of sensors and techniques
41
(in proportion to the object’s reflectivity and the radiometric temperature of its surrounding). The predominant source of reflected radiation is the sky. At millimetre wave and microwave frequencies the sky is very cold and objects with a high reflectivity, like metal objects, appear cooler than their surrounding. Plastic and wood mines will appear warmer than their surrounding. The term used to describe the radiometric levels of an object in the scene in the millimetre wave regime is radiometric temperature (Frost et al 1996, Yujiri et al 1997). The main advantage of passive millimetre wave (PmmW) is that it provides day/night capability and all weather imaging possibilities. Millimetre wave, due to their longer wavelengths are able to penetrate the vegetative cover and into the soil at shallow depth (up to 5 cm.) but is very susceptible to soil moisture and furthermore, the radar cross section (RCS) of AT-mines strongly depends on the type of soil on which it is deployed (Schimpf et al, 1997). The major limitations are the poor resolution of the images and the immature state of the receivers (using integrated circuits technology). Large antennas are required to obtain adequate resolution, i.e. in order to acquire a spatial resolution of 2.5 cm. at 10 metres standoff distance an antenna of 1.5 m. diameter is required (Nivelle and Lhomme, 1997). Using specific signal processing techniques shorter antennas can be used to obtain the same resolution but it is still doubtful if required resolutions can be obtained at greater standoff distances. Further research is required for the use of PmmW imaging focussing on operating frequency, resolution and signal to clutter ratio (Blume et al, 1997). Schimpf et al (1997) concluded, using a 94 GHz radiometer with a range resolution of 1.5 metre (obtained from an airborne platform flying at 200 metres altitude) that this resolution was not sufficient or just at the limit of detectability to detect surface laid AT-mines. Also using a radiometer operating at 35 GHz, the mines could not be detected. Groot et al (1996) operated a 94 GHz radiometer, from August 23 till August 24 12.00 hr, 1995 at selected intervals over a 24 hour period, from a standoff distance of nearly 20 metres having a resolution of 20 by 50 cm. per pixel, cross and slant range respectively. They conclude that the buried mines were invisible at all times as well as (surface laid) AP-mines. Surface laid AT-mines, both metal and plastic, could be detected.

Chapter 2
42
2.4.3 Microwave techniques To date, there are but very few papers existing on airborne detection of landmines using SAR systems. Most work is concentrating on ground based or vehicle based systems in this wavelength region. Australian (Carevic, D.D. et al. 1997, Chant and Rye, 1996), Danish (Jakobsen et al, 1997), Russian (Pelyushenko and Racut, 1997), Swedish (Ericsson and Gustafsson, 1997), German (Schimpf et al, 1997), American (Yujiri et al 1997), French (Dourthe and Pichot 1996), British (Benjamin, 1996), as well as researchers from other countries have all shown how the detection of buried anti-tank landmines, both metallic and low-metal content mines (often referred to as dielectric mines) is possible, subject to certain constraints. Figure 2.11 shows the principle of detection of AT mines by radar techniques (Lee et al, 1997). Figure 2 11: Mine detection on and beneath the surface.
Radar sensors detect targets by means of their radio frequency reflectivity. The radar illuminates the area of interest and a receiver is used to detect the reflected radio signals. For the Angolan project (Zeler, 1997)5, two SAR bands were used, the X-band for high spatial resolution (50 cm.) and the P-band for penetrating vegetation cover (the level of signal attenuation caused by foliage increases with frequency) and soil (up to a maximum of half the wavelength of about 72 cm.). The system AeS-1, designed and manufactured at and by AeroSensing GmbH in Germany,
was first flown in August 1996. The HH polarized P-band front end was completed in 1997. First P-band flights have been tested over a specially prepared minefield in Belgium in 1998. The final obtained range resolution is 2.5 metres and the azimuth resolution is 0.5 metres. The results are described in chapter 5. Other airborne SAR experiments for minefield detection have been described by Grosch et al. (1995) and by Lee et al. (1997) in the USA, and by Scheerer (1997) and Bertsche and Hügle (1997) in Germany. AIRSAR images (5 m. resolution) acquired over a military bombing range located in the Yuma desert in Arizona in the C-, L- and P-band showed a considerable variation to detect metallic ordnance debris. Cross-polarized (HV) images acquired in all three wavelengths 5 The project airborne campaign, initially planned for Angola was diverted to Mozambique
Soil
Direct path
Multipaths
Surface mines RADAR
RADAR
Divergency loss
TransmissionLoss
Transmission Loss
Soil
Propagation Loss
Buried mines

Overhead detection of minefields, a review of sensors and techniques
43
showed a higher degree of contrast between the ordnance debris and the surrounding desert surface than co-polarized (HH) images. The P-band, cross-polarized images were superior to other wavelength / polarization combinations at enhancing this contrast. This was attributed to the inherent reduction in returned signal for the cross-polarized images, which reduced the overall background clutter, the greater penetration depth and the apparent radar smoothness of the desert floor at P-band (Schaber, 1999). Another airborne SAR, the FOLPEN system, is also used to detect mines and (unexploded) ordnance. Metallic anti-tank mines were buried to 15 cm. in moderately conductive desert soil. Having a resolution of 1 by 1 metre and using HH and VV polarizations, most clutter can be rejected and the mines can be detected. Plastic AT-mines and AP-mines could not be detected (Grosch et al, 1995). Perry et al (1998) used Centimetric Synthetic Aperture Radar (X-band) having a resolution of 7 by 20 cm. This frequency was chosen, being a compromise between obtaining a high spatial resolution while at the same time retaining the possibility of penetrating grass and other foliage. Only 15 percent of the (partly metal) mines situated in the long grass could be detected. It was considered unlikely that obscured plastic mines could be detected. Due to these results, the Defence Evaluation and Research Agency (DERA), rejected the Centimetric SAR technique and continued developing an Ultra Wide Band (UWB) SAR. The RCS of dielectric properties varies rapidly with frequency, making it unlikely that narrow band systems could be used for reliable detection (Cloude et al, 1996). UWB pulses illuminate the scene (and the dielectric targets) over a very wide frequency range. The back scattered energy can provide information about the shape and the material structure of the target and this can be used for detection and possibly classification. Trials conducted at DERA proved that both metal and plastic mines could be detected and that the back scattered signal was unique to the target. Advantages of the UWB SAR technology are the ground and foliage penetration, high resolution and unique target signatures (Bishop et al, 1999). The prototype radar used (range resolution of 5 cm.) showed both metal and plastic mines could be detected. The signatures of the targets in the images are spread in range direction due to complex target scattering mechanisms which result in multiple reflections separated in time and this effect produces a signature that is unique to the target and can aid in target detection in cluttered backgrounds (URL-20). Airborne trails with the radar integrated onto an airship have been conducted (URL-19). Mine-like targets of 10 cm. diameter, surface laid in grass approximately 30 cm. high could be detected. In Kosovo radar tests against a fully ground truthed live mine test site was conducted. An UWB fully polarimetric Boom-SAR (range resolution 15 cm.) mounted on a 45 m. telescopic boom lift also demonstrated the ability to exploit the frequency diversity for the detection of targets (Marinelli et al, 1998). Lee et al (1997), using the data obtained from the FOLPEN and the ultra-wideband Boom-SAR campaigns, concluded using RCS models for metallic mines on and beneath the surface, that the optimum frequency for detecting anti-tank mines is the UHF band (300 to 3000 MHz). Detection of buried metallic mines should be viable in dry soil, detection of mines in high vegetated or clutter environments was not considered in the study. Nguyen et al (1999) using data collected during four BoomSar campaigns shows that an increase in

Chapter 2
44
soil moisture significantly degrades the detection performance as a result from a lower signal to noise ratio on metal mines. Plastic mine stimulants (January 1996 experiment) were not visible in the SAR imagery because the dielectric of the mine was essentially equal to the soil. During later tests (1998), due to increased soil moisture, a dielectric mismatch between the mine and the surrounding soil was recorded. This increase in soil moisture also caused an increase in signal attenuation (difficulty of signal penetrating the soil) (Kappra et al, 1999)
2.4.4 Concluding remarks. The airborne sensors described all have a potential to detect landmines under specific conditions. The advantages of the film based optical systems are the high spatial resolution that can be achieved, combined with the stereoscopic interpretation possibilities. Using different emulsions the visible as well as the near infrared portion of the spectrum can be covered. Surface laid mines can be detected and also recent disturbances in the soil and vegetation stress due to placement of mines can be observed. The film based systems are not able to penetrate the vegetation or the soil and if the indirect indicators have disappeared over time, the mines will not be detected. Possible other minefield related features could be identified using visual interpretation techniques. Digital analysis is still cumbersome, as the data needs to be digitized using scanners. The detection limitations for film based systems also hold true for the digital optical cameras and the visible and near infrared hyperspectral scanners. Thermal systems have obtained resolutions that enable detection of individual mines. Table 2.7 discusses the detection limitations of the infrared mine detection techniques. Apart from the long wave infrared, indirect indicators are used for detection, which disappear with time. The long wave infrared uses the permanent thermal inertia feature of a buried mine. Apart from the high false alarm rates due to environmental clutter this spectral region is very susceptible to adverse environmental conditions. Also dense vegetation is not penetrated and if the mine is buried deep enough a surface temperature anomaly is not detected. Microwave systems are plagued with the inverse relation between wavelength / penetration capability and spatial resolution. In order to detect mines a high spatial resolution is required that can be obtained using shorter wavelengths but limits the penetration capability, even through the vegetation. Also, soil moisture effects can seriously degrade detection capabilities. Plastic mines have been detected using UWB-radar systems. It is clear that there is no single sensor that can be used under all circumstances. A multiple sensor system should be able to detect mines or using indirect evidence, secondary manifestations or ancillary features indicative of the actual deployment of landmines. If under optimum condition each of the sensors can detect a certain number of mines and mine related features, a reliable boundary of the minefield can still be established.
Overhead detection of minefields, a review of sensors and techniques
45
2.5 Image analysis for minefield detection
2.5.1 Visual Image interpretation Image interpretation is defined as the act of examining photograph images for the purpose of identifying objects and judging their significance (American Society of Photogrammetry, 1960). The origins of photo interpretation are linked to military intelligence collection. In Britain the first manual on the use of photo interpretation on the trench war along the Western Front: “Notes on the Interpretation of Aeroplane Photographs” was published in 1916 (Watkis, 1999). During the process of visual image interpretation the relation between e.g. colours and patterns in an image with known real world features is used to extract information. This is either through spontaneous recognition, through recollection of known features, or using a process of logical inference. Professional knowledge and experience is applied for the identification of certain objects or features. Use is made of a number of interpretation elements, to express characteristics present in the images, such as size, shape, shadow, tone and colour, texture and pattern. Site, the relationship with regard to topographical and geographical location, and association, the indirect inference of the meaning or function of e.g. an object through a combination of related features, are other important image interpretation elements. The simultaneous and often implicit use of all these elements is the strength of visual image interpretation in comparison to standard automated methods that depend mostly on one element, namely the colour (Janssen, 2000). The impression of the third dimension, through the use of stereoscopic images, is another tool applied during visual image interpretation. Photo interpretation keys, reference material designed to facilitate rapid and accurate identification and determination of the significance of objects, can be consulted when an object is not known. If the object is not described and remains unknown a process of convergence of evidence may be applied. There may be many clues to the identity of an unknown object. None of the clues provides a full explanation by itself but if all, or most of them point to the same conclusion, the conclusion is probably correct (American Society of Photogrammetry, 1960). Identification of objects in aerial photographs by direct recognition is a fairly simple process. The military has defined minimum scales for interpretation and identification of various objects for a number of purposes (Departments of the Army, Navy and the Air Force, 1953, 1968). The photographic scales given in these sources have been transformed into ground resolution distances in metres for comparison with other sources and are given in table 2.9 (Richardson and Merz, 1996). For the direct identification of a number of objects rather detailed and high resolution images are required. Next to direct recognition, through the use of logical inference, deduction and applying prior knowledge, the occurrence of different types of minefields may be related to other objects that are more clearly recognised on images.

Chapter 2
46
Table 2.9: Image resolution (metres) necessary for different levels of analysis on targets of interest, after Richardson and Metz, 1996.
TARGET Detection (1)
General ID (2)
Precise ID (3)
Description (4)
Bridges 6 4.5 1.5 1 Radar and radio sites 3 1-1.5 0.3 0.15 Supply depots 1.5-3 0.6 0.3 0.03 Airfield facilities 6 4.5 3 0.3 Rockets and artillery 1 0.6 0.15 0.05 Aircraft 4.5 1.5 1 0.15 Missile sites 3 1.5 0.6 0.3 Ships – submarines 10-30 4.5-6 0.6-1.5 0.3-1 Nuclear weapons components 2.5 1.5 0.3 0.03 Vehicles 1.5 0.6 0.3 0.06 Minefields 3-9 6 1 0.03 Ports and harbours 30 15 6 3 Railroad yards – shops 15-30 15 6 1.5 Roads 10-20 5 1 0.6 Urban areas 60 30 3-5 1 Terrain 90+ 30-90 4.5 1.5
(1) Location of class units, objects, or activity of military interest (2) Determination of general target type (3) Discrimination within general target type (4) Size / dimension, configuration / layout, components construction, equipment count, etc
2.5.2 Digital image processing The fundamental goal of mine detection is to achieve a high detection rate with a low false alarm rate. While many mine detectors achieve the first of these goals it is often at the cost of a high false alarm rate. Sources of false alarm are called clutter and the density and type of clutter strongly affects the performance of the detection system. The digital image processing chain for minefield detection starts with removal of sensor distortion, aircraft motion effects and atmospheric noise but also with methods for clutter removal. The second step involves the identification of the location and assessment of mine candidates (mine cues). Blume et al (1997) state that to do a reliable mine detection at least nine pixels on target are required. Considering e.g. spectral anomalies instead of the mine spectral signature (the spectral signatures vary considerably due to target weathering, ambient illumination and many other factors) or the use of contrast appearances as well as shape and size of target objects can guide the detection and labelling process. For detected mine-like objects, characteristics such as location, shape, size and contrast are also recorded. These features can give an estimate of the target confidence. When incorporating spectral information the target and background signatures must be sufficiently well separated in the multidimensional colour space defined by the chosen (multi) sensor wavebands. If this is not the case more complex segmentation algorithms have to be applied.

Overhead detection of minefields, a review of sensors and techniques
47
An example of target weathering is provided in figure 2.12. The TMA-3 mine displayed, having an original olive drab green case colour, is situated in a live minefield along the coastal area in Croatia. The mine has been deployed for a number of years and the impact of the climate is visible resulting in a strong weathering of the paint and at several places the protective layer of fibreglass is visible. These climatic impacts result in a strongly deviating spectral response of the mine. Figure 2.12: A weathered TMA-3 anti-tank mine, Croatia.
The Hyperspectral Mine Detection (HMD) program developed a spectral clustering based detection algorithm for recently buried mines based on the fact that mines are spectrally distinct from the major background constituents in a scene, secondly mines tend to be more spectrally homogeneous than the mixed background areas and lastly, mines are spatially-localized phenomena, while mixed background pixels with similar spectral content are often distributed throughout the scene. The algorithm fully adapts to the measured background in the scene and does not require a radiometric spectral signature for the mine targets (Bowman et al, 1999). Apart from using these mine detection algorithms also “a priory” knowledge of minefield pattern can be incorporated into the process of identifying minefields. Minefields can have point patterns that tend to exhibit a kind of regularity like equal spacing, collinearity or other forms of regularity that provide valuable discriminants against natural (random) occurring clutter due to features such as rocks and vegetation. Collinearity and regularity detection methods can be considered in a stepwise approach as first identifying points that are approximately collinear and secondly analyzing within each set its regularity (Katarzis et al 1999, Lake et al 1997).

Chapter 2
48
Utilising this spatial regularity has received extensive study. The Hough Transform is an image processing technique to detect lines in images that can be modified slightly to detect collinearity in point patterns. Another approach is making use of the concept of homogeneity, were homogeneity may correspond to “no minefield” while non-homogenous areas need closer inspection. Nevis (1996) reports target recognition rules that are based on target density and minimum distance allowed between two suspected targets. Fritzsche and Löhlein (1999) confirm the challenges encountered during the image segmentation stage. When homogenous regions are found that resemble the shapes of the objects to be found a Connected Component Analysis can be conducted to determine the boundary of the object to be classified during a later stage. They also used the Markov Random Fields for image segmentation and the Hidden Markov Models for object shape interpretation but concluded that none of the techniques used produced satisfactory results. Using the spectral-spatial contrast measures it is possible to determine the minefield boundaries and Perry and Bishop (1999) reported that with a mine detection rate of 20 percent the minefield boundary could be established with acceptable accuracy. Muise et al (1996) state that the utility of detecting minefields rather than mines as aggregation of detection results allow for good minefield detection even when over half of the mines in the minefield are not detected at all. To be able to detect individual landmines the sensor(s) used should exhibit a high target to clutter ratio and a number of pixels over the target should be recorded. In order to detect AP-mines the image resolution should therefore be in the order of 5 cm. or less. In this case model based parameters like size and shape can be used as well as image statistics computed from mine or mine-like objects and can be compared with the statistics of the surrounding area (local background). The assumption of independent Guassian noise is frequently made when developing statistical signal processing algorithms (more simple and less computationally complex). If these assumptions are correct the classifier can perform optimal, but if other noise distributions occur (e.g. Laplacian or Cauchy) these might adversely affect the performance (Tantun and Collins, 2000). The successful digital exploitation of all this information (spatial, spectral and possibly hybrid spatio-spectral signatures) rests more than ever on the availability of suitable analysis tools. Using evolutionary computation (EC) concepts, a generic algorithm (GA) generates (automatic) feature extraction algorithms for remote sensing applications (Brumby et al, 1999, 2000). Genetic Imagery Exploitation (GENIE) is making use of a generic algorithm software to assemble image processing tools from a collection of low level image operators (e.g. edge detectors, texture measures, spectral operations, various morphological filters). Each candidate tool generates a number of feature planes, which are combined using a supervised classifier to generate the final feature mask (URL-21).

Overhead detection of minefields, a review of sensors and techniques
49
2.5.3 Change detection analysis Differences reflected by the environment can be related to the occurrence of minefields, e.g. arable land taken out of production due to the presence of landmines during the conflict period. Images taken prior, during and after a conflict shows changes that can thus be attributed to the presence of minefields. Change detection provides the image analyst with a valuable research and monitoring tool. Change detection is the process of identifying differences in the state of an object or phenomenon by observing it at different times (Singh, 1989). Change detection techniques require two or more data sets to be recorded in the same spectral bands with similar radiometric measurements so that they are comparable and compatible in use. The changes in land cover result in changes in radiance values recorded by the satellites. Evaluation of the cause of these changes is not an easy task (Mouat et al, 1993). For digital change detection the original images are transformed into a new single or multi band image in which the areas of change are highlighted and classified. Different kinds of change detection techniques can be applied. These methods include comparison of land cover classifications, multidate classification, image differencing / ratioing, vegetation index differencing, principal component analysis, change vector analysis, image regression, spectral mixture analysis and the canonical correlation analysis. Jensen (1996) furthermore reports on the use of a binary mask or incorporation of ancillary data as one of the multi-date layers. Apart from these methods Ridd and Liu (1998) propose also the Tasseled-Cap transform differencing and the chi-square transformation. Nielsen et al (1998), incorporating the concept of canonical correlation analysis, have developed the Multivariate Alteration Detection (MAD) and the Maximum Autocorrelation Factor (MAF) transformation. The MAD is invariant to linear and affine transforms such as changes in sensor gain and offset. Wiemker et al (1997) uses an iterative process during principal component transform, incorporating a probability density function, to determine the “No Change Axis” which is invariant against additive offsets and scaling factors that can vary between the recording times. The amount of change is quantified by the magnitude of the second principal component. Change can be detected through the comparative analysis of independently produced classifications of different dates or through a simultaneous analysis of a multi-temporal data set. As the spectral change detection methods are based on pixel wise operations or scene-wise plus pixel-wise operations the analysis requires that the images are accurately spatially registered towards each other and that the images have a common radiometric response. To discriminate between change and no-change pixels from the continuous spread of data depends on the selection of a threshold value. Selection of the best threshold value can depend on prior knowledge on the scene or visual image interpretation. Also image statistics can be used, like standard deviation from the mean thresholding. When conducting change detection analysis care should further be taken to avoid and eliminate / minimize during the pre-processing (if possible at all) problems related to differences in spatial resolution of the sensors and their spectral bandpass differences, effect of cloud cover, phenological variation due to seasonal changes and sun angle variations (Lunetta and Elvidge 1999).

Chapter 2
50
Furthermore if the image digital counts have to be converted to ground reflectance for “absolute” change detection purposes (to establish a relation to the physical ground unit) a radiometric calibration and correction procedure should be applied to correct for the sensor (gain and offset), atmospheric effects (scattering, absorption and refraction of light) as well as solar irradiance and zenith angles. Chavez (1996) describes two fully image based radiometric correction models that do not require in-situ field measurements (that are mostly unavailable for e.g. remote areas or for certain historic dates), are relatively simple and straight forward to apply and provide results as accurate as those generated by models (using in-situ measurements). For the type of multi-temporal change analysis conducted in relation to minefield detection these accurate radiometric correction methods are not required. Using “qualitative” image digital counts is mostly sufficient for analysis purposes. Visual change detection involves the careful comparison of multi-temporal image coverage preferably using stereo vision. Through the use of satellite image historical records from the 1960’s onward, potential minefield indicators can be analyzed such as agricultural areas in and out of production, identification of key elements likely to be mined (industry, infrastructure) or changes along the perimeter of villages in combination with land taken out of production, etc.
2.5.4 Multisensor image fusion The objective of remote sensing is to detect landmines over large areas, at the highest level of accuracy possible. Thus the number of “false negatives” must be minimized (i.e. that no minefields are missed) as well as “false positives” (i.e. the sensor says there is a landmine present when there is none). Especially the false positives are a major problem with ground based systems, where deminers in the field report over 100 false alarms for one real mine! The sensors discussed (photographic, electro-optical, thermal infrared and radar) all have a potential to detect the presence of some types of mines under some specific environmental circumstances. However, no single sensor yet exists that can find all of the mines all of the time. To improve this process, image fusion techniques can be applied. The aim of image fusion is to integrate different data in order to obtain more information than can be derived from each of the single sensor data alone (Pohl, 1996, Pohl and van Genderen, 1998, Waltz and Llinas, 1990). Three different types of data fusion architecture, to combine the digital data obtained from single sensors, can be applied: pixel, feature or decision-based fusion algorithms (figure 2.13, after Pohl and van Genderen, 1998). Pixel level fusion combines multiple co-registered images to a single image and each location in the combined image has an associated vector of measurements from each of the sensors. The new image is processed using an algorithm that simultaneously operates on the vector values. Pixel-based fusion can be used for optical and thermal infrared imagery to confirm targets or reject/reduce false alarms. Problems associated with this fusion level are differences in data format (1D time series, 2D image, scalar values), resolution, sensor

Overhead detection of minefields, a review of sensors and techniques
51
geometry and orientation (line scanning, central projection, nadir, forward or sideward looking) and field of view, etc. Accurate (sub-pixel) image registration (matching two images so that corresponding coordinate points in the two scenes correspond to the same physical region of the scene) is necessary before pixel based image fusion can be applied as well as for the change detection techniques that have been described previously. The most difficult step in image registration is to obtain correspondence between the two sets of pixels / features. Fonseca and Manjunath (1996) provide the following observations:
• Images are from different sensors and usually have different spatial resolutions;
• Images have different spectral characteristics, so that contrast information is different for the same imaged object;
• Images taken at different times or under different conditions present changes that can affect the matching process.
Figure 2.13: Processing levels of image fusion
Feature Extraction Feature extraction
Feature Identification
Fusion
Fusion
Fusion
Result Result Result
Evaluation Evaluation Evaluation
Image 1 Image 2 Image N Image 1 Image 2 Image N Image 1 Image 2 Image N
featurelevel
decisionlevel
pixel
level
proc
essi
ng
proc
essi
ng
proc
essi
ng
Accurate image co-registration plays a vital role as misregistration causes artificial vectors that affect the interpretation during a later stage. Herman (2000) demonstrated that image co-registration is a very cumbersome process and sometimes yield unsatisfactory results. Feature-based fusion can be used for any number of sensors, where the features (mines, indicators of minefields, etc.) are first interpreted / extracted from each individual sensor, then these extracted features are co-registered and fused to confirm or reject a target as being a minefield. The co-registration of features from individual sensors is often easier to achieve than pixel level fusion.

Chapter 2
52
The highest level of data fusion is the decision- or interpretation level fusion approach. Here, all ancillary data are also incorporated into the detection process. For example, if the terrain is non-tank trafficable, then unlikely that anti-tank mines are placed in such areas, so false alarms here could be rejected. Spatial regularity, abandoned agricultural land, destroyed buildings, key targets (bridges, roads, intersections, water wells, electricity posts, pipelines, etc.) are all elements that can be incorporated into the decision-making process. When conducting visual image interpretation the three levels of fusion are used simultaneously and on a continuous basis: the use of images from multiple sensors (or different film emulsions) to identify different types of features / objects and based on additional information, knowledge and experience of the image analyst these are either accepted or rejected as related to the occurrence of mine-like objects or minefields. To maximize information content for visual interpretation also use is made of image fusion to merge images of different spatial and spectral resolutions to create a high resolution multispectral combination, e.g. using the panchromatic sharpening band and a few multispectral lower resolution bands. Good results for image sharpening and improved feature extraction have been reported making use of fusion techniques like Intensity-Hue-Satuaration (IHS), Principal Components (PCA) and Multi Resolution Analysis (MRA)(Gross and Schott 1998, Pohl 1996, Welch and Ehlers 1987, Ehlers, 1991). For the IHS-transform the lower spatial resolution three band combination is transformed into the IHS space, the intensity channel is replaced by the enhanced higher spatial resolution channel and the data are converted back to the Red-Green-Blue colour space. The distinct spectral patterns, which are provided by the multispectral data, are displayed in various hues while the high resolution data reveal the surface textural patterns (Sunar and Musaoğlu, 1998). The procedure can successfully be applied to true colour images using a conventional panchromatic sharpening band but less successful when the colour composite includes near or mid infrared bands. Another limitation is that in the IHS transform only three multispectral bands can be used (Vrabel, 1996). The most straightforward method of fusion of images is through direct band substitution, e.g. using two bands of a multispectral image in combination with a panchromatic band when preparing a colour composite. Simple mathematical techniques for fusion of images are through arithmetic operators such as addition and multiplication, with or without weighting functions (to weight them equally or one image more heavily than the other). Another method uses high-pass filters on the high spatial resolution image, thus enhancing the high frequency component (mostly related to the spatial information) and removes most of the spectral information. The filtered (co-registered) image is added to the higher spectral resolution multispectral data set. This procedure merges the spatial information of the higher resolution image to (each of) the spectral bands of the higher spectral resolution image (Chavez et al, 1991)
Overhead detection of minefields, a review of sensors and techniques
53
Multispectral data can also be fused with higher spatial resolution data using the principal component analysis procedure. The first component (containing the largest variance) typically resembles an intensity image and can be substituted by the higher spatial resolution panchromatic image (which is stretched to have approximately the same variance and average as the first principal component). An inverse principal component transform can be applied to merge the data. Although the spectral information unique to any of the multispectral bands is mapped to higher order components also these components can be substituted (each time representing a smaller amount of variance) (Chavez et al, 1991). The IHS and PCA methods are susceptible to a certain degree of distortion of the spectral characteristics of the data, especially if the image used for substitution is not highly correlated either to the PC band or the intensity image. Park et al (2000) propose a multi-resolution data fusion scheme based on a wavelet transformation that allows multi-resolution image decomposition, analysis and reconstruction of remotely sensed images. They conclude based on a fusion of Landsat TM and IRC-1C images that the Daubechies Wavelet Basis (decomposition level 3) enables both image enhancements (image sharpening) as well as preserving the spectral information. The application of wavelet transformation for merging spatial and spectral characteristics of multi-resolution data is described by Garguet-Duport et al (1996) and they concluded that the wavelet method least distorted the spectral characteristics of the data and therefore only the higher resolution spatial information is imported into the spectral bands. Yocky (1996) compared the Multiresolution Wavelet Decomposition (MWD) image fusion technique with the IHS transform. He concluded that the spectral characteristics are better preserved as well as enhancing spatial characteristics when combining the low spatial resolution multispectral and high spatial resolution panchromatic images into the merged high spatial resolution multispectral image using the MWD technique. Also some Daubechies wavelets gave better results than others did in the merged image. The Mine Hunter – Killer close in detection vehicle uses fuzzy logic and neural network technology to detect mine signatures obtained from ground penetrating radar, forward looking infrared and metal detector. Each sensor has a preprocessing set of algorithms that corrects for sensor anomalies, before the feature vectors are extracted using neural network classifiers as well as binary decision tree classifiers. These in turn are statistically combined in the global fusion centre for optimal decision fusion (Bhatia et al, 2000). In the framework of the DREAM Program (Data Fusion as Remedy Against Mines) Fritzsche et al (1999) report on the fusion of data obtained from a metal detector, ground penetrating radar and thermal infrared sensor. Detection results of the sensors are fused on a decision level and the combined detection clearly exceeded single sensor performance, a 20 percent higher probability of detection depending of the fusion rule and a reduction of the false alarm rate by over 30 percent. Another system using ground penetrating radar, thermal infrared and metal detector is developed under the ESPRIT project LOTUS (Cremer et al, 2000). To improve detection

Chapter 2
54
performance also here fusion methods are applied. Apart from the selection of the best single sensor, four fusion functions are available: naïve Bayes, linear discriminant, Dempster-Shafer and Voting. From the tests conducted it was concluded that the difference in performance between the four techniques used was minimal. The four fusion techniques performed better than the best single sensor selection. Results obtained further showed poor performance given the overall low detection rate in relation to the false alarm rate.
2.6 Summary Present day operational methods for detection still rely on ground / field based methods such as probing, metal detectors, use of dogs, etc. The military have developed many airborne sensors and processing techniques to detect minefields. These are now available to the scientific community to develop peacetime, humanitarian approaches to landmine detection. Airborne remote sensing techniques, which have previously been applied to other problems, can now be adapted and customized to the problem of minefield detection. A multitude of images can be obtained from medium to high resolution satellites orbiting the earth from the 1960’s onward. Using visual image interpretation, combined with change detection and image fusion techniques, these historical records can be analysed. If still higher resolution data is required multi-sensor airborne surveys can be conducted. Research using images recorded by standoff sensors has very much concentrated on the detection of individual landmines. For a reliable detection and classification of individual landmines and mine-like targets high spatial resolutions are required to have a number of pixels over target in order to obtain significant differences between the target pixels and the surrounding (environmental) clutter. Research has shown that each of these sensors have their own set of limitations with regard to this clutter, allowing detection under certain conditions. Many of these target detection and classification studies have been conducted using images acquired under controlled conditions, these test-beds are not found under real world conditions. Given real world complexities it is reasonable to assume that the detection performance will even be further degraded. Another factor that will negatively influence the detection performance is the time since the minefield was constructed. Most of the current tests use only a limited timeframe (less than 2 years) before the images are acquired. In landmine affected countries minefields are present which are constructed more than 25 years ago. The system performance is described by parameters such as the probability of detection and false alarm rate and evaluates the image and the detection - classification routines. Much attention is given to (real-time) automatic detection of mines and mine-like features. By incorporating experienced image analysts / photo interpreters into the processing chain (time is not a constraint), a significant improvement to present methods could be obtained. The main challenge therefore is more in the area of target feature extraction and processing rather than in acquiring a useable signature, as at present multiple sensors are able to obtain high spatial resolutions over a wide range of the electromagnetic spectrum using a (large)

Overhead detection of minefields, a review of sensors and techniques
55
number of discrete spectral channels. Also incorporating minefield and mine related features into the detection and classification process will enhance the system performance. The next chapter will treat the minefield indicators that are depicted on various types of remotely sensed imagery that can positively contribute to the identification of minefield boundaries.

Chapter 2
56
Indicators for minefield detection
57
Chapter 3
Indicators for minefield detection
Abstract This chapter outlines the features often found in association with the presence of minefields that can be detected by remote sensing techniques. After presenting a framework to obtain minefield related indicators, some examples from Western Europe of relevant features related to the occurrence of minefields are given. Direct and indirect indicators of minefields are presented for Angola, Zimbabwe, Mozambique and Croatia obtained from the level-1 surveys (some confirmed by subsequent level 2 surveys) conducted in these countries and from personal on-site fieldwork by the author in each of these countries. Keywords: defensive and border minefields, survey records, (in)direct minefield indicators, Atlantic Wall, Iron Curtain, Berlin, Mozambique, Angola, Zimbabwe, Croatia
3.1 Introduction According to accident reports of landmine victims collected by the Red Cross, most accidents occur at bush paths, roads, tracks and agricultural fields. Primary, secondary and tertiary roads, paths and tracks are common locations, with those most likely to be mined being close to population infrastructure (wells, schools, hospitals, etc). Main access roads are mined to prevent large scale troop and equipment movements, the verges of the roads with the intention of obstructing access to advancing infantry. Some roads have been given tarmac paving, in order to see immediately if any modification to the surface has occurred. Detours along the road and new road sections adjacent to the old unused road in combination with wreckage are linked to the occurrence of landmines. Bridges and bridgeheads are often mined to prevent access or if already damaged, to prevent repair. Ring shaped minefields have been constructed surrounding villages in the front zone and provincial capitals for their protection. Defensive minefields also protect military and police headquarters as well as temporary camps. Also along international borders minefields are reported. Often trenches, parapets or embankments and fencing systems, which can be detected by remote sensing, accompany these defensive minefields. Identification of possible mine affected areas starts with the localization of these suspect areas. The presence of other, more detailed indicators might at a later stage lead to the conclusion that landmines are present.
3.2 Typology of indicators Minefields may be identified using methods that directly detect and confirm the location of landmines. From the collected remote sensing data possible landmine signatures – candidates are to be extracted to establish the layout of the minefield. Next to this approach indirect indicators can be used, other variables that are assumed (based on experience or landmine deployment methods, etc.) to be closely related to the occurrence of the

Chapter 3
58
minefields themselves. Figure 3.1 presents a framework that can be adopted to derive various types of indirect minefield related indicators that might appear during the whole process of the armed conflict. For development of this concept use was made of research and development of social indicators (Rossi and Gilmartin, 1980) and environmental indicators for agriculture (Organization for Economic Co-operation and Development, 1999). The type of indicators that have a clear relation with the occurrence of minefields dictate the type of remote sensing data to be collected or acquired as well as subsequent image analysis. Figure 3.1: Framework for various types of minefield indicators
Dev
elop
men
t of c
once
ptua
l an
d an
alyt
ical
und
erst
andi
ng
Input Indicators Process Indicators Outcome indicators Impact Indicators
controlled
by
produce
using
(repeated)
measure-
ments
lead
to
•type of conflict
•objective of land-mine deployment:
•economy of force
•security
•offensive
•manoeuvre
•socio-economiclandscape (villages-infrastructure, agri-culture and industry)
•physical landscape(terrain, topography,natural vegetation, etc)
•periodic changes
•long term trends
•fluctuation in therate of change
•indicators justifyingmilitary action
•indicators justifyingminefield boundaries
•direct minefieldspecific indicators
Iden
tific
atio
nof
suita
ble
indi
cato
rs
Explore possibilities for (detailed) identification of indirect indicators usingall possible input, process, outcome and impact indicators with a likelyminefield occurence. For identification a possitive and negative reasoningapproach can be adopted (e.g. the likelyhood that an AT- minefield will befound on non tank- trafficable terrain is minimal). The time that elapsed sincelandmine deployment may cause decay of these indicators.
Col
lect
ion
of R
Sba
sed
data
to id
en-
tify
indi
cato
rs
Collection of (multi-temporal) air- and space borne images and utilizing:
•image characterisitics (like spatial, spectral, temporal resolution) for
•feature extraction (using visual - stereoscopic interpretation and changedetection analysis techniques combined with digital image processing andimage enhancement techniques)
Inte
grat
ion
of
indi
cato
rs
Assist in mine action, e.g. during level 1 and 2 surveys with likely minefieldtype occurrence; accomplish risk reduction at low cost with minimum over-classification of suspect areas eventually including possible indicators forlandmine displacements (e.g. due to soil erosion).
The input indicators are determined by the type of conflict (e.g. a small scale versus large scale conflict or a conflict involving regular army versus guerrilla warfare). The role of landmines in warfare are governed by several principles of war (National Academy of Sciences 2000), such as:
1. The use of all combat power available as effectively as possible; allocating minimum essential combat power to secondary forces (economy of force);
2. Never permitting the enemy to acquire an unexpected advantage (security); 3. Seizing, retaining and exploiting the initiative (offensive); 4. Placing the enemy in a position of disadvantage through the flexible
application of combat power (manoeuvre).

Indicators for minefield detection
59
Landmines are a component used in an overall strategy for the construction of barriers and complex obstacles that impede the mobility of a force. Obstacles like mountains, rivers, railway and road embankments, that exist before military operations are used - modified. Military forces also create other obstacles to support their scheme of manoeuvre. Preparation or modification of the obstacle or barrier results in changes over time. Controlled by these socio-economic and physical environment minefields are constructed to:
1. Produce a vulnerability on enemy manoeuvre that can be exploited by friendly forces;
2. Cause the enemy to break up his forces; 3. Interfere in enemy command and control; 4. Inflict damage on enemy personnel and equipment; 5. Exploit the capabilities of other weapon systems by delaying enemy forces in
an engagement area; 6. Protect friendly forces from enemy manoeuvre and infiltration.
Apart from using these aspects of warfare the process indicators may provide additional clues as where to look for suspect areas. Minefields are e.g. constructed to prevent access to and protect villages, important industry and infrastructure or agricultural areas. For a minefield, to become an obstacle, also the natural terrain configuration has to be considered (e.g. a minefield that is frequently interrupted by rivers will not act as a barrier). So topography, type and density of natural vegetation, etc., have to be considered when trying to identify suspect areas. If reliable process indicators are available this suspect area may be reduced to represent those areas that have undergone changes over time that contrasts with areas that are known not to be affected. Through time series analysis outcome indicators may be identified such as changes in the infrastructure, agricultural land, etc. These changes may reflect e.g. areas taken out of agricultural production and regeneration of natural vegetation or the changes along the roads such as bypasses. Through multi-temporal analysis, taking images before, during and after the conflict a further reduction of the suspect areas may be obtained. The armed struggle results in all kinds of impact indicators that can be used to justify a certain military strategy for minefield deployment up to a level that yields even direct minefield related indicators. Indirect indicators are used that justify military action and minefield boundaries. More detailed images might even reveal direct indicators from which the minefield perimeter may be derived. A wide range of possible indicators combined with a multitude of relevant ancillary conflict information is at one’s disposal during the image analysis phase to derive suitable image objects - elements. As these elements can be composed of different shapes, sizes, spectral characteristics, etc., during the image analysis stage, basically visual interpretation techniques are applied. Digital image processing is mainly used for image co-registration, image enhancement and image fusion techniques for later visual interpretation.

Chapter 3
60
Apart from the identification of suspect areas (level 1 survey) further image analysis to establish the minefield perimeter, can be used directly during the level 2 surveys. The conventional sampling system used during these surveys consists of the construction of a number of test trenches until the minefield is encountered. If the surveyor is lucky the minefield is found when ‘cutting’ the first test trench, if the trench is poorly located the minefield may be missed. To prevent this, more test trenches have to be constructed. As test trenches multiply, a type of level 3 survey is being conducted. Having established the layout of the minefield through remote sensing analysis, the test trenches can be more efficiently located, and the results of the interpretation can be validated at a number of places until the derived boundary of the minefield is regarded as reliable. Further research presented below is directed to the selection of suitable indicators revealing the presence of minefields. Examples are presented from Europe and Southern Africa and indicators are presented that are closely related to the occurrence of different types of minefields.
3.3 Appearance of defensive minefields Construction of defensive minefields to detect, delay and neutralize invasions require a lot of resources to be effective and especially minefields parallel to international borders can be seen as “contemporary versions” of the Chinese Wall and the 120 km. long Wall of Hadrianus in Northern England. Construction, repair and maintenance all have their requirements like accessibility, earth moving for preparation of the ground, clearing and deforesting, construction of camps, etc. In addition to this, changes in the land use and pattern start to occur as a linear narrow uninterrupted feature starts to take further shape. More recent examples of these types of minefields are the Atlantic and Berlin Walls and the border area between former East and West Germany. During the Cold War era defensive minefields were constructed in Germany. In Berlin, the constructions of the “Berlin Wall” started in August 1961 and over time a defensive barrier (166 km. long) circumvented the French, British and American sectors of the town. Apart from a wall, also a strip of land was cleared, to increase the depth, which was mined at a number of locations or was equipped with vehicle traps, watchtowers, electric fences, floodlights, etc. Access routes for patrol and maintenance were also situated along this partly barren strip. Figure 3.2 shows a portion of the “Berlin Wall” situated in the Southeast of former West Berlin (Neuköln). The image was acquired on the 25th of November 1970, by the KH4B, stereo high, aft looking Corona panoramic camera (Corona mission nr. 1112-2). The image resolution is in the order of two metres. The strip of “no-mans land” can be easily observed, separating the urban area from the agricultural land. Even within the urban area this strip can be detected, although sometimes it is difficult to differentiate between the “Wall” and the road system. The enlarged panchromatic inset of the image clearly depicts the “Wall”, the sunlit part and even its shadow is recognizable, and the regular spaced brighter spots could be related to the fencing system or floodlights. Also a trench or road can be seen. Along the border between former East and West Germany, on the East German side, also a more than 1300 km. long defensive barrier was constructed. This “iron curtain” consisted of

Indicators for minefield detection
61
minefields, roads for patrol and maintenance, fences, moats, watchtowers and bunkers. After the Second World War socialist East Germany started to reform the agricultural sector and large collective farms were introduced. The former small agricultural fields were merged into larger arable lands. In West Germany the land ownership did not change and the small parcels still exist. Figure 3.2: Corona image of a section of the “Berlin Wall”. Figure 3.3 shows, from the same Corona image as described above, an enlargement of a section of the border region between former East and West Germany. The northern section of the image shows the small sized parcels and in the south-eastern part the larger agricultural fields are observed The “iron curtain” separates the two areas with its sharp straight boundaries and sudden changes in direction / heading. This area belongs to the border minefield separating the two countries. Another good indicator for these types of boundaries is the disruption of formerly existing infrastructure. These indirect minefield related indicators could also be observed on smaller scale images, especially those indicators related to land use pattern. Figure 3.3: The border region between former East and West Germany, KH-4B image.

Chapter 3
62
Another portion of the Iron Curtain is given by the KVR image (figure 3.4) obtained from D-SAT 2 (Copyright Scout Systems, 1997), a multi-resolution digital satellite image atlas of Germany. The analogue KVR-1000 images, obtained from Germany (date is not provided) are scanned at different resolutions. The original false colour film was scanned so that a spatial resolution of 30 metres was obtained. Given this image detail the parcel size differences can clearly observed demarcating the border region. Other details on the KVR system are provided in the previous chapter. Figure 3.4: The border region between former East and West Germany, KVR image.
The “Atlantic Wall” was constructed during the Second World War to reinforce a natural border, along the western coast of Europe, to prevent an Allied invasion. The defensive barrier consisted of several obstacles placed in the foreshore and the backshore zone. Directly along the low tidal level steel framed structures (3 metre high) were placed parallel to the shoreline, with anti tank mines attached to the top. Then further beachward a row of poles was placed, angled seaward, also with anti tank mines on top. This was followed by ramps, which had their mine-tipped logs driven into the sand. Further landward the hedgehogs were situated. These were mine tipped 1.5 - 2 metre high obstacles constructed of steel rails welded together. All these structures were situated below high tidal level (Nesbit, 1996). On the backshore, “walls” of barbed wire and minefields were situated which criss-crossed the beach and paths leading off the beaches. In the dunes, bunkers had been constructed. Figure 3.5 shows a portion of the Atlantic Wall situated in The Netherlands. The aerial photo (scale 1: 7800) was taken by the Royal Air Force on 6 Oct 1944 and shows the foreshore at low tidal level (Staal and Voskuil, 1980). The sequence of the different components, constructed to damage and destroy any landing craft, can be clearly observed. Knowing the way the obstacle has been constructed helps the interpreter to identify its

Indicators for minefield detection
63
elements and in this way, even the individual mines can be located. Thus these large scale images allow for an even better localization of direct mine related objects and structures. Figure 3.5: Portion of the Atlantic Wall of the foreshore along the Dutch coastal area
The examples given are not representative of the whole range of mine laying occurrences, but demonstrate that other indicators, if properly interpreted, can reveal information to locate and delineate the boundaries of minefields. For other conflict zones and different types of conflicts, other minefield related indicators should be developed, based on an understanding of how the “obstacle(s)” was constructed.
3.4 Minefield indicators for Angola, Mozambique and Zimbabwe
3.4.1 Introduction The Southern African region has witnessed a long period of armed struggles (Calvocoressi, 1982) and the warring factions have been making extensively use of landmines. In Angola, during the 16 years of civil war, the government (FAA) assisted by Cuban forces, laid planned defensive minefields around key installations, while UNITA and other guerrilla groups, supported by e.g. the apartheid regime in South Africa, mined roads and approaches to rebel bases. After the collapse of the government in the 1992 elections, indiscriminate mine laying took place during the fighting for the provincial capitals, till the signing of the Lusaka Protocol in 1994 (United States Department of State, 1998). Even afterwards both parties have forwarded claims that new mines have been laid. In October 1992 a ceasefire was signed, ending 17 years of civil war between Frelimo and Renamo in Mozambique. Even before the national independence in 1975, Frelimo launched as early as 1964 a national liberation struggle against the then colonial regime of Portuguese East Africa. This struggle gradually culminated into a guerrilla war and by the end of the 1960’s Frelimo moved their strongholds from near the Tanzanian border into the

Chapter 3
64
north-western province of Tete. Also Mozambique’s neighbours, Rhodesia and especially South Africa were directly involved in the civil war by organizing and supporting Renamo. After Mozambique became independent, it enforced the United Nations sanctions and closed its borders with the white Rhodesian minority regime in 1976 and supported the Zimbabwean National Liberation Army (ZANLA). The Rhodesian Central Intelligence Organization responded by founding the Renamo in 1976 (Hall, 1990), consisting of soldiers who had fought with the Portuguese during the colonial war as well as Frelimo dissidents. Its initial aim was to destabilize the Mozambican government and to provide intelligence on ZANLA guerrillas. After independence of Zimbabwe, control of Renamo was handed over to the South African military. They revitalized Renamo to counteract Mozambique’s support for the ANC military operations from its territory and to block landlocked Zimbabwe’s access to the sea, through Mozambique, increasing South African dominance of the regional economy (Human Rights Watch 1994, Oxfam 1996). With a reduced support from South Africa following the signature of the 1984 Nkomati non-aggression pact, Renamo changed its strategy and adopted new insurgency tactics. Not being able to rely on rear bases in South Africa, Renamo would have to provision itself from the local population and needed to increase its efforts to conserve arms and to replenish its supplies from captured weaponry. Furthermore Renamo also started to assault civilian targets demonstrating the rebels’ strength, to weaken symbolically the authority of the government and to undermine the rural production systems on which the country depended. The main aim was to destroy transport links, health clinics, schools, and all other infrastructure that represented social security and government provision. The captured “Vaz” diaries at their headquarters in 1985 document Renamo tactics. The general tactics given amongst others are the destruction of the Mozambican economy in the rural zones as well as the communication routes to prevent exports and imports to and from abroad, and the movement of domestic produce. Specially mentioned targets were the railways and the Cahora Bassa dam (Hall, 1990). The Mozambique Armed Forces stood little chance of maintaining control across vast areas of the territory when faced with surprise, mobile, sharp attack and quick withdrawals and the conflict continued until the resources dried up and a peace agreement was finally reached upon (Morgan 1990, Pearce 2000, Minter 1989a and 1989b). In Zimbabwe, between 1965 and 1980 mines were used by the nationalist groups against the Rhodesian regime to try to topple the white settler government. During the war of liberation the nationalist groups had their rear bases in Tanzania, Zambia and Mozambique. In the beginning they used mines, laid haphazardly all over the country, to try to restrict the Rhodesian Security Forces movements and to facilitate the setting up of liberated zones in remote regions of the country. The response was the construction of elaborate border minefields between 1974 and 1980 to restrict access by the guerrilla forces and forced relocation of the local communities in concentrated and protected villages (Rupiya 1998, ICRC 1997).

Indicators for minefield detection
65
3.4.2 Minefield indicators To see which (in)direct minefield indicators can be applied in a Southern African context possessing a whole range of completely different types of environmental conditions, a large number of mine danger area reports and level 1 mine survey reports were used, obtained from the HALO Trust and the Norwegian People’s Aid (NPA) from Angola as well as Mozambique. This information was collected in 1996 in Angola in the process of a nationwide general mine survey program designed to record general details of mine sites. Some of these reports were confirmed using a level 2 survey. For some even level 3 survey report forms were available. For Mozambique the results of the nationwide level 1 survey, stored as mine assessment and survey reports in the Shaman database (current to July 1994, survey mostly by the HALO Trust) were studied as well as reconnaissance reports and minefield reconnaissance and survey forms of the NPA. Information on Zimbabwe was taken from the minefield map book, showing details on the location of the border minefields of Zimbabwe. From a detailed analysis of these reports supplemented by personal field visits and research a large number of minefield indicators have been developed (table 3.1), all of which can be identified on one or more different types of remotely sensed images. All parties involved deployed landmines in Mozambique. Renamo strategy was aimed at the devastation of the economy and the isolation of government and supporting forces. Mines were laid to deny access by the civilian community to e.g. fields or water sources, also infrastructure was mined. Frelimo used defensive mining to protect key economic installations and strategic locations, defensive positions, military encampments but also around the perimeter of villages, surrounding hospitals and government offices in these villages. All of these indirect indicators can be observed directly or inferred by overhead detection using e.g. large scale images. A limitation may be the time elapsed since the mines have been placed and therefore the related indicators don’t exist anymore (e.g. fencing removed by farmers) or the secondary indicators have decayed (e.g. soil disturbances are not visible any longer due to the regeneration of vegetation). Spatial, spectral, radiometric and temporal resolution of the sensors collecting the remote sensed data are important parameters in relation to the type of indicators to be detected that have a good relation with the occurrence of minefields. Fine spatial resolution images can be used to identify the smaller sized impact objects and course spatial resolution will only be suitable to identify main process indicators and sub process categories. Specific choices of spectral bands can enhance the detectability of e.g. certain impact indicators, fine radiometric resolution differentiates small changes in spectral reflectance / emittance between various objects and the temporal resolution allows for the observation of variations of the state of these objects over time. The requirements of these resolutions strongly depend on the type of e.g. impact indicators linked to the occurrence of minefields. Technical details on sensors used for overhead detection have been specified in the previous chapter.

Chapter 3
66
Table 3.1: Indirect minefield related indicators for Mozambique and Angola. Main
process indicators
Sub-process categories
Impact indicators
Urban – Civilian areas
entrances to villages, trench / ring around village, relocated improvised village , social infrastructure providing services at community level, such as administrative buildings (government), schools, churches, shops, health posts, hospitals, isolated provincial or government towns, deny return of displaced persons to their home
Urban Areas –Villages
Police – Military controlled areas
head quarters, exercise terrain, trenches and double trench systems, foxholes, fences, (tank) parapets and embankments, evidence of aerial bombing, bunkers, approaches to head quarters and guerrilla bases, ammunition dumps, former fighting areas, remnants of equipment, isolation of garrisons
Roads main access roads, closing off other main access roads, unused road, road verges, bypass and no further road continuation , footpaths, bridge heads and bypass, supply route of warring fraction, crossing of railroad-road, road destruction along steep mountain sections, road blocks, check points and gates, car and truck wreckage, resting places along tracks with shadow trees, use of tarmac roads to see any surface modifications
Airstrip edges of airfield, overgrown landing strip (in outlying regions)
Railroad station, railway, bridges, damaged trains
Water facilities
pump station, dams, pipelines
Infra-structure
Power line pylons / electricity poles, power transformer (sub) stations
Industry Industry buildings, quarry sites, small scale industry and production units at community level
Agri-culture
Land use no use of potential arable land, footpaths through fields, fire wood collection places, field boundaries, irregular pattern of e.g. coconut plantations, regeneration of fruit tree plantations, prevent troops living off the land, changes in pattern / use like a small connected strip of unused potential arable land, corpses of cattle, goats and other wild-life being blown up, springs, water and livestock sipping tanks, boreholes and small scale irrigation facilities
Borders following international borders
Communi-cation
radio and television stations, other telecom facilities
Soci
o-ec
onom
ic L
ands
cape
Political Infra-structure
Known mine locations
indicators placed by local population if mines have been identified, poles, (white pained) stones, only few (marked) tracks / paths through minefield
Terrain & Topo-graphy
Strategic position
observation post, vantage point (with trench system), strategic area to be used during retreat of enemy forces (killing grounds), prevent access to certain areas (soldiers and equipment), areas used as troop assembly points before main attack, inferred position of military equipment, natural boundaries, “favourable” ambush sites
Nat
ural
Lan
dsca
pe
Natural Water Resources
Rivers & lakes
river crossings and fording points, destroyed bridges (next to each other), access routes along rivers, along lagoons, ponds, fishing places / points, minefields aligned adjacent rivers, main streams

Indicators for minefield detection
67
3.5 Minefield indicators for Central Europe, an example from Croatia A different type of conflict evolved in Croatia. Following the disintegration of the Federal Republic of Yugoslavia, Croatia declared its independence from Yugoslavia in 1991. Serbia and Croatian Serbs started an armed conflict that would last till 1995 when Croatian Forces regained control over most occupied areas. Eastern Slovenia was re-integrated later as part of the Dayton Peace Accords. The minefields originating from this conflict were laid primarily as defensive measures to prevent the Yugoslav Army from advancing (United States Department of State, 1998). After initial advances of the Serbs the fighting forces came to a partial standstill along a zone of separation, which curled like a venomous snake through the country (Bajić, 1999). Within this zone, different mining activities took place. The actual separation line often followed a natural barrier, like a river or a break in the terrain. In the area situated directly adjacent to this line, scattered use of individual AP and AT mines, clustered use of AT mines surrounded by AP mines and, within the minefields, alignments of AT and AP mines can be found. During the conflict when a new offensive was launched and the separation line would move, new minefields would be constructed. In general only AT mines were used along infrastructure and areas accessible to military vehicles. AT mines in the vicinity of communication lines were often protected by AP mines and booby-traps. Many of the AP mines were surface laid. The AP mines were also used in forested areas and in urban settlements (personal communication D. Goršeta, Head Croatian Mine Action Centre). Both sides in the conflict made use of landmines, and the mines were predominantly laid to protect defensive positions along the confrontation line. The width of this zone of separation, at each side of the separation line was about 6 km. depending on the type of weapons that were used during the conflict. Identification of the zone of separation is possible by observing the state of the houses in the major villages, as many of them were bombed and shelled, causing major damage to most of the houses. Based on a personal site visit to Croatia in February 2000, as well as in meetings and discussions with members of CROMAC, as well as on published reports and papers such as those by Bajić (1999, 2000) objects likely to be mined and other minefield indicators are given in table 3.2. Some of the indicators listed might be misleading (such as “abandoned” land) as many former landowners moved out of the region during the conflict as they belonged to another ethnic group and have not returned to their belongings until now.

Chapter 3
68
Table 3.2: Minefield indicators in the zone of separation in Croatia. Main
process indicators
Sub - process categories
Impact indicators
Urban areas & villages
Villages houses and farms not occupied / not repaired as people have left the area during the conflict, backyards not used, deny return of displaced people
Infra-structure
Roads, railroads, other
general road mining: main access roads and cross roads, secondary and tertiary roads / tracks, expected direction for tank use, railroads, access roads to strategic objects, electricity pylons, phone lines, bridges, water supply systems and wells not used, airport located inside / outside fenced installations, along national border
Industry Industry factories, power plants and transformer stations
Soci
o-ec
onom
ic
Agricul-tural areas
Landuse Vineyards and orchards not maintained / out of production, potential agricultural land out of production
Terrain & Topo-graphy
Strategic objects
observation posts and military objects at strategic positions, (temporary) tank and artillery positions, temporary bases and fortified positions (preparing bunkers, pillboxes, parapets and trenches)
Nat
ural
Natural terrain
Nature reserves, forests and grazing lands
no collection of firewood along the forest edge / in the forest, blown up livestock, oil drums placed in the field by shepherds where animals were killed, meadows not used for grazing, former tourist areas
Figure 3.6 is a portion of a map showing the approximate location of the mine contamination. The symbols are not to scale and do not reflect the exact boundary of each location. Information presented on the map is up to date as of January 2000, and two major alignments of minefields can be seen with a kind of ”no mans land” in between (HCR, 2000). The map clearly shows the challenge of locating by airborne methods the extent of the minefields as the borders of the existing minefields are unknown and are laid without proper plan and records, mostly at the start of the armed conflict (1991). Along the Drava river a dense vegetation cover is present and soil surface changes have taken place as a response to the fluvial processes taking place in this floodplain, like accretion and erosion of the river and the lateral spread of the flood water and its sediments. All these factors, overtime obscure the man made features that are necessary to find the minefield perimeters.

Indicators for minefield detection
69
Figure 3.6: A portion of the zone of separation along the Drava river in Osječko-Baranjska County, Eastern Croatia.
3.6 Summary The presence of landmines and minefields can very often be linked to the occurrence of related secondary or indirect features. Instead of looking only for the presence of small and concealed individual mines, the configuration of these related features may provide a good additional indication towards the presence or absence, and the layout of a minefield. Depending on the type of indicators, direct and indirect evidence can be obtained about the presence of minefields as shown by the examples on the “Atlantic Wall” and “Berlin Wall” and the border minefield between former East and West Germany, as well as by the remote sensing data acquired of the various pilot areas described in subsequent chapters. An extensive survey revealed that this approach is also valid for other areas and other types of conflicts. Study of relevant documents, site visits and discussion with a number of demining organizations showed that, although haphazard mining has occurred, often mines have been placed with a certain objective. By understanding these objectives and then linking them to remotely sensed image features, minefields can be localized and mapped.

Chapter 3
70

Methodology
71
Chapter 4
Methodology
Abstract In this chapter the research approach and the general research methodology is presented. For each of the research phases specific objectives are defined, followed by a description of the activities conducted to be able to answer the specific research questions formulated. Keywords: approach, methodology, airborne platform, airborne sensors, pilot study in Belgium, Mozambique and Zimbabwe, satellite images.
4.1 Introduction The research described here was conducted over a number of years, starting from 1998. After an initial period of literature research to find the state of art of airborne remote sensing and standoff mine detection a multi sensor platform was developed. Simultaneously a test area was prepared for an airborne test. This chapter gives the details on the methodology adopted and specific research questions to be answered. The tests conducted over the pilot areas are described in subsequent chapters.
4.2 Research approach and methodology
4.2.1 Research approach The approach adopted for this research focused on the identification of mines and mine-like objects, finding the relationship between minefield indicators and the actual presence of minefields as detectable on a variety of remotely sensed data types. The thesis tests the assumption that many minefield related features have spatial dimensions that can be identified on remote sensed images. If these features are not directly visible any longer due to the elapsed time since the termination of the conflict, other secondary features may be of use. As these indicators can consist of many different types and combinations of features mainly visual image interpretation techniques are applied. Image segmentation for (automatic) detection was not used, as research by others have shown the features of interest have diverse reflection and emittance characteristics resulting in low reliability of detection, high false alarm rates and inconsistent results. However digital image processing was extensively used to enhance minefield related indicators of sensor data or satellite images, using various image enhancement techniques. For example, digital image processing was used for multisensor data fusion, followed by visual image interpretation. Pixel based digital multisensor fusion was applied to airborne data collected by the optical, thermal and microwave sensors. The hypothesis was that combined analysis of those images might reveal additional information compared to single sensor data interpretation. Higher level fusion techniques were applied using analogue image analysis procedures.

Chapter 4
72
Other multisensor fusion approaches were applied to merge high resolution panchromatic image data with lower resolution multispectral data on the assumption that in the merged data, the minefield indicators might be enhanced, allowing better detection possibilities for visual image interpretation. Digital change detection techniques were applied to study changes that occurred over time. On the multi-temporal satellite image data those minefield related objects that can be identified given the limitations of the spatial resolution, were enhanced for visual interpretation, such as changes to the road system or changed usage of agricultural areas.
4.2.2 Research methodology The followed methodology can be divided into a number of phases, each having their specific activities. The research started with an extensive literature study concentrating on airborne sensors, mine deployment practices, conflict analysis, combined with some initial fieldwork to derive minefield indicators. The results of these activities are described in previous chapters. To evaluate standoff minefield detection a system and sensor test was conducted. A specially laid minefield in Belgium was surveyed and images acquired were analyzed. Based on these results sensors were selected to be included in a minefield survey in Mozambique to enable a test of the system under real world conditions. Several test areas were selected representing different environments found in the country. Subsequently these areas were recorded, the data was analyzed and maps displaying the boundaries of the minefields identified were prepared and subsequently checked for accuracy and reliability. To evaluate the use of satellite images for minefield detection for one of the test areas in Mozambique also a multi-temporal and multi-sensor satellite image analysis was conducted. To be able to determine more accurately if this type of defensive minefield could also be identified under different sets of conditions, the border areas between Mozambique and Zimbabwe were studied as well. For this specific study use was made of available aerospace data only, no large scale airborne survey was conducted. Further details on these phases are given below and a flowchart of the followed methodology is presented in figure 4.1
4.2.2.1 Phase 1: Blind test, Belgium Specific research questions. For this test the following specific research questions have been defined using standoff detection:
• Can individual AP and AT mines be detected using remote sensing and what are optimum detection conditions?
• Can individual mines placed at the surface as well as those buried be detected and under which conditions?
• Can minefields be detected having different mine laying patterns? • Can minefields be detected under different vegetation conditions? • Can minefield related indicators be identified? • Can minefields be detected using multi-temporal satellite images taken before
and after construction of the minefields?

Methodology
73
• What is the optimum (multi) sensor system configuration for airborne minefield detection and what are pre-conditions for successful detection?
Figure 4.1: Research methodology developed.
Remote sensing based detection of landmine suspect areas and minefields
“Blind Test”Belgium
IAirborne test Mozambique
Satellite data analysis
IIIII
Test area preparation
Selection of the pilot areas
Data analysis
Mine location &minefield perimeter
Multi sensor dataacquisition:• by airborne survey• by satellite•by ground survey
Validation / test results Airborne campaign
Data analysis
determine minefield perimeter
Final sensorselection
Validation
Data analysis
determine minefield perimeter
Validation
Data analysis
determine minefield perimeter
Validation
Conclusions, recommendations and suggestions for further research
SongoMozambique
Border minefield Zimbabwe
literature study and fieldwork
Fieldwork in Belgium, Angola, Mozambiqueand Croatia on landmine and minefield indicators
Literature study on:• sensor & detection
techniques• conflict analysis• landmines and laying
techniques
Data processing
Data processing Data processing Data processing
Available multi temporal aerial
photography
Test area preparation. A specially laid minefield, constructed by demining specialists from the Belgium army during week 20 (May) in 1997, is situated at a military exercise terrain near Leopoldsburg. The area dimensions are about 500 by 1000 metres and the four corner coordinates were provided by the military. This test minefield consists of a structured test site and of tactical test sites. The structured site consists of an area of 50 by

Chapter 4
74
50 metres filled with different types of AT and AP mines, surface laid or buried at different depths, having different inclinations. Also mine-like objects were included. The details of this minefield (test field “C”) were provided for initial image analysis. The other tactical minefields simulated the conditions, as could be encountered in landmine affected countries like Angola. As the area was part of a military shooting range, all kind of projectile fragments or mine-like objects were to be expected. No further details on these minefields were provided to the interpreters. Data acquisition. To be able to evaluate sensor performance the equipment was tested over this minefield in Belgium. A partial airborne remote sensing survey was conducted over the test area on 29 July 1997 and 18 September 1997 (colour, colour infrared, black and white infrared at various scales). A full multi sensor airborne survey was made from 9th to 13th of May 1998, consisting of (colour, colour infrared, panchromatic) aerial photography at various scales, radar (both X and P band, from various directions), digital multispectral camera and a high resolution thermal infrared line scanner (various altitudes and at different times of day and night). Later, also two low level helicopter based 8-12 µm. FLIR recordings were acquired. It was planned to conduct the main airborne survey over the area during the early spring of 1998, as the trees would still have no leaves, but due to prolonged bad weather conditions during this period these flights were delayed till May. By this time the spring season was in progress and fresh leaves had developed on the deciduous trees. Further details are presented in chapter 5.2.2. To facilitate later image analysis during the May 1998 airborne campaign also other environmental data were recorded, such as general climate data, spectral data from surface laid mines in test field “C” and different ground cover types, soil grainsize, moisture and temperature at different depths and between different ground cover types by the author. To evaluate if satellite data could contribute positively to this analysis, also a multi-temporal SPOT multispectral dataset was acquired, taken just before and after the minefield was constructed. Data processing. The sensor provider conducted the initial processing of the data acquired of the test site. The different types of exposed film were developed and contact prints were prepared for visual stereoscopic analysis. Of some areas also enlargements were prepared. The data acquired and stored on onboard tape recorders of the digital sensors used was subsequently provided in general image formats that could be incorporated into image processing software packages. Metadata files describing the data were provided as well. The FLIR data recorded were stored on videotape and using a digital video recorder a frame wise image display and image grabbing is facilitated. For the IRLS automatic gain and offset was used to provide maximum image contrast due to the different environmental conditions during the morning, afternoon and evening flights. The operator, using dedicated image fusion and thresholding techniques, was also involved in further processing of the microwave data. A large scale orthophoto map of the test area was prepared as well. Data analysis. To see if mines could be identified using the data recorded, first priority was given to a detailed analysis of sensor data recorded of test field “C”. The interpretations

Methodology
75
started using the aerial photography and for selected sites where minefields were expected also other sensor data was consulted. If mine indicators could also be found on these images the confidence levels were increased. The minefields detected were therefore classified as possible, probable and definite minefields. Incorporating stereovision during the interpretation process looking for indicators to locate potential minefields use was made of patterns, tone, texture, colour, shape, size, vegetation or soil disturbances and the presence of other mine associated features (wooden sticks, wire fencing, etc). In addition to studying the original airborne images, hard copy enlargements of the data acquired by the multi-sensor system were made and visually analyzed. The results were plotted on a digital colour orthophoto map. Validation of the results. After about 6 weeks of image analysis the obtained results were presented at the Royal Military Academy, Academic Teaching Branch, Belgium and validated with the mine locations that had been recorded in the field. After these presentations, the ground truth tables were provided showing the exact locations of the individual mines, the type and mine specification as well as the depth the mine was buried. Using this information the images acquired were analyzed again to see if the undetected minefield locations could still be found afterwards and to find the reasons why they were not detected in the first place. Also mine laying details of the detected minefields were examined to establish sensor performance requirements. Sensor selection. Based on the results obtained, each sensor could be assessed and the detection performance could be established. Only those sensors having a good detection performance and an added benefit were selected for future airborne minefield detection campaigns.
4.2.2.2 Phase 2: Airborne minefield detection in Mozambique Specific research questions. Using the data acquired over suspect areas and minefields in Mozambique, answers were expected to the following specific research questions:
• Can airborne remote sensing detect minefields that have been constructed over two decades ago?
• Can minefields be detected where mainly anti-personnel mines have been used?
• Under which environmental conditions are minefields detectable? • Can large scale and high resolution remote sensing also detect individual
landmines placed more than a decade ago? • Which indicators can be used to detect suspect areas and to determine the
boundary of minefields? Selection of pilot areas. In Mozambique the areas selected represented different climatic and geographic zones. Some conflict information should be available to make a rough estimate of the area to be covered and to facilitate further flight planning. Due to the internal relief of one of the test areas, limitations were encountered towards the spatial resolution of the data to be acquired, as the aircraft could not fly at low altitudes. Other

Chapter 4
76
areas posed no problem to data acquisition, as these were flat and large scale, high resolution data could be obtained. Airborne campaign. After sensor integration in South Africa, during the end of the dry season (1998) a remote sensing survey was conducted recording the defined pilot areas with the selected sensor suite. The flights served a dual purpose. The data used for image analysis and interpretation for minefield detection were acquired on the largest possible scale considering terrain limitations. The acquisition of colour aerial photography for orthophoto map production was conducted at 1:20.000 scale using a metric camera with an Inertial Measurement Unit attached to its side. In order to be able to directly and accurately geo-reference the aerial photos the position and attitude information for each exposure was recorded during the survey flight using the positioning system (GPS) and the attitude system (IMU) respectively. With the availability of the integrated GPS/IMU systems the direct measurement of the full exterior orientation of the camera during data recording is possible (Cramer et al 2000, Shukla and Smith 2000). Being able to model the image acquisition process using the sensor geometry and the external geometry, no further ground reference control points are required for map production, which in suspect areas, is a “difficult” task. In fixing the IMU to the sensor there is a miss-alignment between their respective co-ordinate system axes. This miss-alignment can be determined using a calibration process using markers positioned such that for each of the photos obtained for calibration purposes four markers can be identified (Muls en Van Damme, 1999). These markers were placed within safe areas and their position was accurately determined, obtaining precisely known ground control co-ordinates. These markers were recorded during the beginning and at the end of the mission. A requirement for this approach is the use of a (D)GPS ground station within a radius of 30 km. from the survey area. Before an airborne survey started the differential GPS ground station was mobilized and data were recorded and stored for later post-processing. This approach was tested over the Belgium pilot area and compared to conventional aerotriangulation. A high degree of positional accuracy was obtained of approximately 20 cm. in X and Y direction (Fransaer and De Boeck, 1999) incorporating correction factors for the camera - GPS offset and the miss-alignment offset between the sensor and IMU. The flight plans, prepared using World Wide Mission Planning (WWMP) software, were stored on data cards, which were inserted into the Computer Controlled Navigation System (CCNS) onboard of the aircraft. Accurate flight navigation was obtained using the Omnistar receiver and using the GPS correction factors, sub-metre positional accuracy was obtained. The flying track and actual position during the flight was shown on a small display situated in front of the pilot during data acquisition. Before a new run was recorded the access flying route was of sufficient duration to allow integration of the correction factors obtained from the Omnistar system to make sure the predetermined flight path was flown. All

Methodology
77
relevant flight and sensor attitude information was stored and noted, necessary for further processing. The evening prior to the flight the film was taken out of the freezer as the quality, especially of the unexposed colour infrared film deteriorates quickly under normal temperature conditions. After exposure the film was frozen again. The use of multiple metric cameras allowed for the simultaneous acquisition of colour and colour infrared photographs. During some low altitude flights also the MFLIR was used, especially over the Buzi pilot area. Considering the extensive dimensions of the other test areas and the minimum altitude requirements, continuous deployment of the MFLIR was not possible given the narrow swath width recorded or feasible, given the minimum flying altitude above ground level and the corresponding image resolution obtained. As the airport was closed during the night, early morning flights or late evening flights were not possible. Data processing, analysis and validation. Batches of frozen film (packed in dry ice) were delivered to a federal express service agent and shipped to Europe for development of some samples of the aerial photographs to assure a good quality of the images taken. Subsequently a new area was recorded. During a later stage all photography was developed and the transparencies were used for stereo (multi emulsion) photo interpretation. For suspect areas contact prints and enlargements for more detailed analysis were prepared as well. Photographs were also digitized for pixel based image fusion. Using the same (mainly) visual image analysis methods, as those applied during the Belgium test described before, minefield related indicators could be identified at a large number of locations. Through extrapolation of the location of these features at a number of places minefield boundaries could be established having a different degree of confidence. The obtained minefield boundaries were plotted onto the prepared base maps for later field validation.
4.2.2.3 Phase 3: Satellite image analysis for minefield detection Specific research questions. Using multi sensor and multi-temporal satellite images, applying change detection and image fusion techniques for the detection of minefields, the following specific research questions were defined:
• Which minefield indicators can be detected from satellite data and under which conditions?
• Are data needed from before, during and after the conflict to detect minefields?
• What are the limiting factors to be considered during change detection analysis?
• Can recent minefields be detected? • Are there limitations towards the spatial extent of a minefield for satellite
based detection?

Chapter 4
78
• Can these spatial limitations be overcome using image fusion techniques incorporating higher spatial resolution satellite data?
Songo. For the Songo minefield identified from the data acquired by the airborne survey conducted, a multi-temporal and multi resolution satellite image data set was obtained (see table 6.2). The images selected from the various image archives were mainly taken during the end of the dry season. The satellite images were imported, pre-processed, referenced and enhanced to facilitate the detection of those minefield indicators used during the analysis of the airborne images to identify the location of the minefield. A number of change detection and image fusion techniques were applied to detect the location of the minefield as each of the techniques applied could be validated using the minefield boundary obtained from the airborne survey. Analysis was conducted using images acquired by the same satellite sensor as well as resampling procedures to other spatial resolutions to facilitate integration with other types of satellite images. As the minefield is running through large and varied tracks of land, several environmental conditions could be evaluated. NE Zimbabwe border region and Mutare border region. To evaluate in more detail the use of satellite images, sections of the Zimbabwe border minefields were studied. Two sample areas were selected. From these areas only medium resolution Landsat Thematic Mapper and Multispectral SPOT post conflict images were available (see table 6.3). To overcome the requirements of having prior and post minefield construction satellite imagery use could be made instead of panchromatic aerial photography available at the Survey Department in Harare (see table 6.4). Multi-temporal aerial photographs at regular temporal interval from 1960 onward were available. Acquisition dates were selected to represent the construction phase, direct post conflict phase and a number of years after the conflict had terminated. Contact prints were obtained for stereoscopic interpretation. All aerial photography was taken at a scale of 1:25.000 for completely different purposes and applications than minefield detection. Visual change detection was possible due to the similar scale of the images and the aerial photographs taken during different dates could be used during the stereo analysis, using two multiple dates simultaneously. From the north-eastern border minefield also KFA-1000 images, having a 5 metres spatial resolution, could be obtained from the dry season of 1979 just before Zimbabwe became independent. Integration of all information allowed for the determination of the minefield boundary and analysis of the minefield indicators present during different stages of the minefield history. The validation could be conducted using a minefield map book indicating all the border minefields of Zimbabwe, obtained from the Geneva International Centre for Humanitarian Demining. The maps, prepared at 1:50.000 scale were reduced. Original 1:50.000 scale topographical maps were also available for image rectification. Visually the minefield was plotted - transferred onto the topomap and digitized for later image overlay.

Methodology
79
4.3 Summary In this chapter the methodology has been explained and for the phases differentiated within this research, specific research questions were raised. A short description is provided for the activities conducted within the framework of this research to find the answers to the general research objectives specified in the first chapter and the more specific research questions given here. The following chapters describe the research activities conducted for the three phases differentiated and the final chapter gives the findings with regards to the research questions raised.

Chapter 4
80

The Belgium test
81
Chapter 5
The Belgium test
Abstract This chapter describes the details of the test conducted in Belgium and the results obtained. First the pilot area is described; the layout of the test area near Leopoldsburg in Belgium is presented, type of mines used, their characteristics and locations of the inert mines as well as other relevant test area features. Subsequently the data collected for this pilot area are presented and the pre-processing conducted. This is followed by the data analysis, minefield indicators used, validation and results obtained are presented. The sensor performance is described and the final multi sensor system for minefield detection is defined. Keywords: airborne platform and sensors, pilot study in Belgium, satellite images, remote sensing data collected, ancillary field data, data processing, landmine detection.
5.1 Introduction The collection and initial data analysis was conducted in the framework of a project called the “Airborne Minefield Detection Pilot Project” (Genderen 1997, Zeler 1997) in which the author was involved. Sensor testing for minefield detection is often performed using an experimental set-up like the use of a sandbox in which the mines are placed and a sensor is moved overhead. The images acquired are analyzed and conclusions are drawn towards the performance. Other tests are conducted placing (surrogate) mines on different surfaces and detection is tested using images obtained by sensor from a larger standoff distance. This chapter describes a test conducted over a minefield constructed which had to be as realistic as possible to evaluate the system and sensor performance, followed by a test in a landmine affected country under real conditions, which is described in the next chapter.
5.2 Belgium pilot study
5.2.1 Description of the pilot area The pilot area is located on a military shooting range “Kamp Beverloo” near Leopoldsburg, Belgium. The dimensions of the area are approximately 500 by 750 metres. A colour orthophoto map of the area is given in figure 5.1. A few roads traverse the area, one tarmac road and the others are dirt roads. There are a few places where due to levelling, construction of small artificial hills and earth moving activities the vegetation has been removed. Also a dumpsite can be found. In the remaining area different types of vegetation coverage can be found such as grass and heather. Both types of vegetation are about 30 to 50 cm. high. Different types of trees are growing in the area such as birch, oak and pine trees. Also small bare isolated patches between the heather can be found in the area. In the NE part of the study area a house is situated. The (undisturbed) soil can be classified as a

Chapter 5
82
podzol soil, having a dark coloured, humus rich, top layer situated over a light coloured sandy substratum, starting at a depth of 30 to 40 cm. Within the whole profile small stones are present. At the disturbed places the light coloured fine to medium sized sandy soil is appearing. In order to quantify and validate the detection system performance, the test minefield had to be as realistic as possible. It had to reflect a real mix of AP and AT mines, the technique of laying the mines and the corresponding depths of the mines had to agree with reality and the geographic dispersion and geometry of the minefield in the test area should correspond with military strategies used by regular armed forces. The specific configuration of the minefields resulted out of experiences of the deminers of the Belgium military (DOVO). The landmines placed in the test area are also plotted on the orthophoto map. The image background used is of 1 June 1997, scale 1:4.000. The Department of Geodesy of the Royal Military Academy, Belgium, determined the exact geographic position of each of the objects placed in the pilot area (Muls et al, 1998). One AT mine in minefield “V” could not be located and its position is therefore not established. Figure 5.1: Colour orthophoto map of the Belgium test site showing layout of minefields.

The Belgium test
83
Table 5.1: Mine type and number of mines deployed per minefield, “Kamp Beverloo” Mine-field ID
M35 Bg
PRB M409
M6 PMR-1
PMN HPD F1
UXO Mine-like
Total
A 24 4 4 32 B 8 4 12 C 10 10 10 10 40 D 10 10 E 12 27 1 40 F 21 5 26 V 102 102
W1 44 (37)
44
Z 15 10 63 88 Total 57 36 144 4 21 113 10 10 394
1 at a number of locations multiple mines are laid, 44 mines at 37 locations Table 5.2: Details on the landmines used at the test site.
Name Mine-type
Case-colour1
Shape Dimensions (mm)
Width2 Height Case material
M35Bg AP Khaki Cylindrical 63.5 39 Plastic PRB M409 AP Sand Cylindrical 82 28 Plastic M6 AT Blue Cylindrical 333.4 82.5 Metal PMR-1 AP OD green Cylindrical 80 1203 Metal PMN AP Brown &
black Cylindrical 112 56 Plastic, rub-
ber, metal HPD F1 AT Blue Flat-irregular 280 * 190 103 Aluminium
1 actual colour of the inert mine used during the test 2 for cylindrical shaped mines the diameter (in mm.) is given, else length * width 3 body only, not including the wooden stick Table 5.3: Other relevant minefield details.
Minefield ID
No. of mine lines
General remarks
A 1 Mines buried less than 5 cm. UXO and PMR outside central line B 1 Mines buried less than 5 cm. During field validation soil erosion
features observed, mines exposed and washed down the slope C 4 Three mines of each type surface laid D 2 Mines buried less than 5 cm. E 3 Mines situated across access roads to the house, all mines buried F 2 Half of PMN mines buried, UXO situated outside central mine lines V 1 All buried at 14 cm., mechanical mine layer used to place the mines W 1 Half is surface laid, others buried up to 40 cm deep, some in
clusters (5* 2 and 1 * 3 mines each) Z 2 All mines buried less than 5 cm.

Chapter 5
84
Table 5.1 shows the details of the 374 mines and the 20 unexploded ordnance and mine-like objects for each of the minefields constructed and table 5.2 gives relevant landmine details. The mines used in the pilot area are inert mines and according to NATO regulations the colours of these training mines should differ from the actual mostly olive drab (OD) green coloured mines. The mine-like objects consist of concrete blocks (length * width * height: 28 * 17 * 9 cm). Table 5.3 gives other relevant minefield details. General climatological data collected at the “Kleine Brogel” military airport for the months April and May 1998 are presented in figure 5.2. This station is situated approximately 10 kilometres away from the test area. The different climatological setting during the airborne campaign can clearly be observed. The airborne campaign was conducted in a short period (from 9 till 13 May) having no rainfall, a clear sky and above average temperature and hours of sunshine duration. The maximum windspeed during the campaign was between 7 to 9 m./sec. Before the airborne campaign a resolution panel was installed. For the microwave data acquisition corner reflectors were placed in and around the test area and their position was recorded using DGPS measurements for later data processing and referencing. Within the test area different reference panels were placed, this to facilitate later image referencing for fusion purposes. Prior to the data acquisition of the microwave P and X band data (11-05-1998, from 12.00 hr. onward) soil moisture was recorded at several locations in the test area. The volumetric water content of the soil ranged between 10 and 20 percent depending on the type of vegetation cover, heather covered areas had a higher soil moisture content in test field “C”. On 19th of May at a number of identical sites, moisture measurements were conducted again showing in general 5 % less volumetric moisture content. Figure 5.2: Kleine Brogel general climate data April and May 1998
-4
0
4
8
12
16
20
24
28
32
36
1/4
4/4
7/4
10/4
13/4
16/4
19/4
22/4
25/4
28/4 1/5
4/5
7/5
10/5
13/5
16/5
19/5
22/5
25/5
28/5
31/5
April-May 1998
Temp_min Temp_max Rain (mm) Sun (hr) campaign

The Belgium test
85
The surface temperature was also recorded. Temperature loggers were installed at various locations; at the surface within the heather and grass and situated at the bare soil and next to a buried and surface laid AT mine (using temperature probes inserted about half a cm. into the topsoil). Each 15 minutes the temperature was recorded during a number of days. The sensitivity of the instruments is within 0.5º C with a maximum range of just over 40º C. The data recorded of surface temperatures of several cover types is presented in figure 5.3. Figure 5.3: Surface temperatures of different cover types and directly adjacent landmines from 11-05-1998, 16.30 hr till 19-05-1998, 12.00 hr., test field “C”.
Figure 5.4: Extrapolated surface temperatures from 11-05 1998,16.30 hr till 19-05-1998, 12.00 hr. for bare soil and directly adjacent AT mines.
0
5
10
15
20
25
30
35
40
45
7:00
11:3
016
:00
20:3
01:
005:
3010
:00
14:3
019
:00
23:3
04:
008:
3013
:00
17:3
022
:00
2:30
7:00
11:3
016
:00
20:3
01:
005:
3010
:00
14:3
019
:00
23:3
04:
008:
3013
:00
17:3
022
:00
2:30
7:00
11:3
016
:00
20:3
01:
005:
3010
:00
14:3
019
:00
23:3
04:
008:
3013
:00
Time (min)
Tem
pera
ture
(Deg
rees
C)
Bare Grass Heather Next to ATM metal
0
5
10
15
20
25
30
35
40
45
50
16:3
0
21:1
5
2:00
6:45
11:3
0
16:1
5
21:0
0
1:45
6:30
11:1
5
16:0
0
20:4
5
1:15
6:00
10:4
5
15:3
0
20:1
5
0:45
5:30
10:1
5
15:0
0
19:4
5
0:15
5:00
9:45
14:3
0
19:1
5
0:00
4:30
9:15
14:0
0
18:4
5
23:3
0
4:00
8:45
13:3
0
18:1
5
23:0
0
3:30
8:15
Time (min)
Tem
pera
ture
(Deg
rees
C)
Surface laid M6 ATM Buried HPD ATM Bare

Chapter 5
86
Because the sensitivity of the equipment was limited to just over 40º C. the loggers used could not properly record the extreme surface temperatures existing during part of the day. The temperatures recorded between the heather and grass are generally lower than those of bare soil and just adjacent to the landmines. To evaluate these temperature events a higher order polynomial curve fitting technique was applied. The results are given in figure 5.4. In general in the early afternoon the greatest temperature difference exists between the bare soil and the temperature just adjacent the landmines, the surface laid mine having the highest temperature. Also the buried HPD mine produced a temperature anomaly. For later image analysis spectral reflectance characteristics of major cover types and mines were taken in test field “C” using a hand held field spectrometer having a one-degree field of view. Spectral reflectance in the visible and near infrared spectrum of some of the samples recorded is given in figure 5.5. The M6 mine at the shorter wavelength is clearly different from the other cover types and at the longer wavelengths both types of mines have a lower reflectance compared to the other recorded samples. Figure 5.5: Spectral reflectance curves (0.35 – 0.95 µm) of mines and cover types in test field “C”.
0
0.1
0.2
0.3
0.4
0.5
0.6
0.7
0.8
0.9
1
350
369
388
407
426
445
464
483
502
521
540
559
578
597
616
635
654
673
692
711
730
749
768
787
806
825
844
863
882
901
920
939
958
977
wavelength (nm)
refle
ctan
ce v
alue
bare_soil m35bg m6 concr_block grass heather

The Belgium test
87
5.2.2 Sensors used and data acquired during the Belgium airborne campaign In order to ensure maximum likelihood of detecting anti-personnel and anti-tank minefields under diverse terrain / vegetation conditions, for the Belgium test six core sensors were employed covering several regions of the electromagnetic spectrum. The optical sensors were used to acquire images using different scales (from large to smaller scale) or resolutions, different film emulsion types, the thermal sensor recorded the areas during mid-day time as well as during the morning and evening at different altitudes and the microwave sensor recorded the pilot area from different directions and altitudes. The sensors used and data recorded are given below. For the airborne campaign over the Belgium pilot area the following sensors were used: Two optical sensors in the visible/near infrared region:
• Metric Cameras (Zeiss LMK2000, focal length 305 mm. and (two alternating) Leica RC 30, focal length 305 mm.) with panchromatic, B&W IR (AGFA Aviphot Pan 200 and Aviphot Chrome 200), colour and colour IR film (KODAK Aerochrome MS Film 2448 and FCIR Film 2443) with Forward Motion Compensation and Angular Motion Compensation
• ZEO VOS 80C digital camera (0.45 – 0.95 µm). Two thermal sensors in the thermal infrared region:
• Recon Optical Inc. CA-860 IRLS (8-12 µm) • Westinghouse MicroFLIR (8-12 µm)
Two sensors in the microwave region:
• AeS-1 X-band radar (centre wavelength 3 cm.) • AeS-1 P-band radar (centre wavelength 65 cm.)
Most of the sensors used have been described previously. During the Belgium test all sensors, the airborne platform (Short SC7-3M Skyvan LX-GHI) and other related equipment (such as DGPS and CCNS4, ApplAnix POS/DG) and their integration were tested (Fransaer and De Boeck, 1999). During a partial campaign stereo colour and colour infrared photography at scales of 1:500 and 1:1.000 was obtained on 29th of July and 18th of September, 1997. Smaller scale colour aerial photography was taken on the 1st of July 1997, scale 1:4.000 as well as 1:1.000 black and white infrared photography during the morning of the 12th of July, 1997. An overview of the data recorded is given in table 5.4. To evaluate the use of change detection techniques for the test area satellite data was acquired. For the Belgium test area the week in which the minefields were constructed was used in the image search. The most recent data just prior (02 May) and after (30 May) the test area preparation could be obtained from SPOT XS sensor.

Chapter 5
88
Table 5.4: Data acquired of the Belgium test site “Kamp Beverloo”, 9-13 May, 1998. EM range Sensor Date Description of data recorded
Zeiss LMK2000 f=305 mm.
09-05 Avichrome and Pan200, stereo aerial photographs at scales: 1:500, 1:1.000 and 1:6.000, afternoon flight
Leica RC 30 f=305 mm.
10-05 & 13-06
Kodak Aerochrome II MS Film 2448 and Infrared Film 2443, stereo aerial photographs at scales: 1:575, 1:800, 1:1.800, 1:5.000 and 1:10.000, around noon.
Optical (LMK is operated by Aerodata, Leica is operated by Eurosense, VOS is operated by Zeiss-Eltro Optronix)
ZEO VOS-80 C (On board recording on Ampex tape)
12- 05 Afternoon flight, at 180 m., 365 m., 580 m. and 730 m.
13-05 Morning flight (07.45-09.15 hr) at 75 m., 150 m., 365 m. and 730 m.
13-05 Afternoon flight (15.00-17.00 hr) at 180 m., 365 m., 580 m. and 730 m.
Recon CA 860 IRLS (On board recording on Ampex tape)
12-05 Evening flight (19.30–20.00 hr) 150 m. test flight Evening flight (21.00-22.15 hr) 365 m. and 730 m.
Thermal (IRLS is operated by Recon Optical Inc., MFLIR re-cording by Eurosense) Westinghouse
Microflir (Video output)
19-05 & 24-06
Morning flight at 45 m. and 60 m. (using helicopter and a stabilised camera system, WESCAM)
AeS-1 X band (On board recording on Ampex tape)
11-05 Heading 180 and 270 degree at 3000 metres. Microwave (Radar is operated by Aero-sensing) AeS-1 P band
(On board recording on Ampex tape)
11-05 Heading interval 45 degree, 8 tracks starting from 0 degree, at 600 m. 1.200 m and 3.000 metres.
5.3 Data processing
5.3.1 Aerial film For the Belgium test, contact prints were made of all the aerial photography. All photography acquired was of excellent quality and used for extensive visual stereo photo interpretation, especially the larger scale imagery. Photographic enlargements were made of suspect areas up to a scale of 1 : 50. The multiple film types available were used simultaneously and suspect areas and minefield related indicators were checked on all different film types. The data acquired during the partial airborne campaign in July and September 1997 was compared with the data recorded in May 1998, and changes were analyzed on other available imagery. For some areas the large scale images were scanned, using a photogrammetric scanner (at 7 µm, resulting in a resolution of less than 0.5 cm.)

The Belgium test
89
and referenced to each other to allow for pixel based image fusion, thus creating a high resolution multispectral data set of some of the suspect areas.
5.3.2 Other airborne sensors Optical: ZEO VOS 80C. Using a dedicated program developed by ZEO the VOS 80C raw data can be converted to BMP files having a width of 2000 pixels, the number of lines depends on the PC memory. As the VOS camera generates an image with a width of 6000 pixels, three adjacent BMP files are generated. For the analysis the 180 and 365 metre altitude recordings were used, having a swath width of 165 and 330 metres respectively. This resulted in images having a spatial resolution of 2.75 cm and 5.5 cm. for both altitudes. Subsets of the image data were created and imported into an image processing package. These subsets coincided with suspect areas determined by visual interpretation for the aerial photographs. These subsets were subsequently rectified using scanned aerial photographs Thermal: RECON Optical IRLS. Data recorded by this sensor were stored on an onboard tape recorder. The operator transferred subsets of the data into TIFF image file format, which could be imported into an image processing software package. Also here image referencing was applied. This proved to be much more difficult as due to the flying speed (120 knots) the minimum elevation to operate the sensor was 365 metre and therefore the spatial resolution obtained was about 9 cm. Good referencing with higher resolution images was therefore very difficult. Westinghouse Micro FLIR. The low level flight (at 45 m.) provided a very narrow swath and as no geo-coding information was available it is very difficult to position and further analyse the images. Due to this it is also not possible to further evaluate the spatial resolution obtained (difficult to recognize objects of known size in the natural terrain). Microwave: AeS-1 X- and P-band. The data transfer and conversion was performed by the operator Aerosensing, who provided the data in GIF format to be integrated into the image processing software. The resolution obtained for the X-band data was 0.5 by 0.5 metre and was validated by the response of the corner reflectors. The swath width obtained was 2 km. For the P-band data a resolution is obtained of 2.5 by 1 metre, also having a swath of 2 km. Due to the small size of the mines and the relatively low resolution of the P-band images, the backscatter coefficient variation between a radar pixel with and without a mine is low. The detection can be improved if images taken from different directions can be fused. During the campaign 8 main headings were flown and Aerosensing developed an algorithm, based on thresholding combined with a boolean “or” operator to combine the 8 headings obtained at a flying height of 600 metre into one image. Further processing was conducted to improve the resolution so that a P-band resolution of 2.5 by 0.5 metre spatial resolution (range by azimuth) was obtained as well as an improved fusion algorithm.

Chapter 5
90
45
4.5
4.5
4.5
4.5
M6 AT False Alarm
300o
N
15 15 15
45
MPD M35 B0
5.4 Visual interpretation of the analogue data, Belgium
5.4.1 Introduction The interpretation process started using the panchromatic, black and white infrared, colour and colour infrared airborne imagery acquired at different scales with a careful inspection of the infrastructure in the test area. Potential locations where minefields are to be expected (e.g. at road junctions) were checked. The identified locations were also plotted on the other airborne data acquired during the May campaign to verify if these image sources also revealed anomalies related to the occurrence of minefields. Incorporating stereovision, the test area was analysed looking for landmines as well as secondary evidences, features or other indicators to locate potential minefields. Use was made of patterns, shadows, tone, texture, colour, shape, size, vegetation or soil disturbances and the presence of other mine associated features (wooden sticks, wire fencing, etc). During stereo visual interpretation (with magnification up to 10 times) colour and colour infrared film emulsions were used simultaneously. In addition hard copy enlargements of the data acquired by the radar, digital camera, thermal sensor and colour and colour infrared images were used during the interpretation phase. A large number of potential sites could be identified. Hence a threshold was used with regard to the length/size of the individual minefields, isolated locations and irregular patterns were removed, etc. unless the presence of an indicator was so convincing, to determine in a second phase the real potential sites. The indicators found on the multi sensor data set was used to classify the identified features in three categories: definitely a minefield, probably a minefield and possibly a minefield.
5.4.2 Test field “C” For this 50 by 50 metres area ground truth information was provided during the preparation phase of the airborne campaign. Detailed characteristics were received with information about the type, depth, angle and location of the individual mines. The layout of this mine- Figure 5.6: Test field “C” layout. Figure 5.7: Surface laid M6 AT, field photo.
M6 HPD M35BG False Alarm

The Belgium test
91
field is given in figure 5.6. A surface laid M6 AT mine within this test field, partly obscured by the heather vegetation, in shown in figure 5.7. Figure 5.8: M6 Antitank mine test field “C”.
(A) DOD mine photo (B) Colour AP enlargement (C) CIR AP enlargement Figure 5.8 (A) shows a M6 AT mine in the original colour (United States Department of Defence). Figures 5.8 (B) and (C) show the AT mine given in figure 5.7 recorded using large scale colour and colour infrared aerial photography. Figure 5.9 gives an overview of test field “C” (colour aerial photo test field “C”, original scale 1:575, note the white four reference panels in the corners of this minefield, see also enlargement 1, appendix 1). Figure 5.9: Colour aerial photo test field “C”.

Chapter 5
92
The reasons for identification of this area as definite minefield 1 (see also figure 5.10) are:
Direct indicators: • Clear visibility of surface laid AT mine within the minefield. Making
use of the scale of the image the approximate diameter of the circular feature could be determined (in the order of 30 cm.) providing additional information for object determination.
Indirect indicators: • The four corner markers indicate some special activity (anomaly in
the photos). • More detailed search revealed the wire around the minefield (fenced
off). • Several manmade wooden sticks were lying on the ground within the
fenced area, coinciding with the occurrence of the mine alignments. • Wooden manmade sticks standing vertical, at the border of the
fenced area, detected by their shadow, coincided exactly with the alignment of the landmines, marking the beginning and end. Along the M6 AT mine line even a wire remained between the sticks, showing the exact mine alignment (see figure 5.10).
• Alignment of (regular) vegetation disturbance parallel to the wooden sticks.
Combination of direct and indirect indicators: • Knowing that most minefields are laid in a pattern, at regular
intervals, the presence of other potential individual mine locations could be inferred using a regular spacing pattern between the mines and alignment of the mine lines, coinciding with subtle changes in vegetation cover.
Incorporating all the information, four alignments could be identified and within these alignments also the positions of most of the anti tank mines and some of the concrete blocks (false alarms) as well as some AP mines could be determined (extrapolating the pattern found along the other mine alignment. Although the dimensions of the concrete block and the HPD F1 AT mine are similar, the difference in colour (white to light grey) is a major indicator to differentiate the surface laid concrete block from the AT mine. Figure 5.10: M6 AT alignment and indirect indicators.
The red circles indicate the inferred positions of the 10 M6 AT mines and their locations could be verified in the field. Enlargement 1 in appendix 1 shows more image details.

The Belgium test
93
5.4.3 Other minefields in the Belgium pilot area The other minefields identified using visual interpretation techniques during the blind test are given in figure 5.11. The different coloured hatching patterns are indicating the level of confidence assigned to each of the identified minefields. The individual mines that have not been detected are represented by their original symbol.
Figure 5.11: Minefields identified using aerial photo analysis Definite minefield 2: This minefield could be identified based on the positive identification of a number of likely surface laid M6 AT mines. The colour anomaly was clearly visible on the colour and colour infrared images (see figure 5.12 and enlargement 2 in Appendix 1). Using a regular spacing interval along an alignment based on directly visible surface laid mines, also mine locations obscured by the natural vegetation (heather) could be inferred. An alignment with this pattern could be followed until regular soil / vegetation disturbances started appearing, most likely representing buried mine locations. These regular anomalies in the natural vegetation occurred at roughly the same spacing interval as those between the surface laid landmines, also situated along an alignment. These features could be observed
%%
%
%
%
%%
%
% %
%
%%
##
##
#
##
##########
$
$$ $
$$$$$$$$$$$$
$$$$$$$$$$$$$$$$$$$$$
%%%%
%%%
#######################
##### #######
###
####
##########
######
######
###########
##
###
#
####
#####
###
##
#####
$$$$$$
$ $$$$$$
$
$$$$$
$$$$$$$$$$$$
$$$$$$$$$$$$$$$$$$$$$$$$$$$$$$$$$$$$$$$$$$$$$$$$$$$$$$$$$$$$$$$$$$$$$$$$$$$$$$$$$$$$$$$$$$$$$$$$$$$$$$
$$$$$$$$$$$$$$$$$
$$$$
$$
$$
$$
$$
$$$$
$$
$$
$$$
$$ $$$$$$$$$
$$
$$$$$$$$$$$$$$$$$$$$$$$$$$
50 0 50 100 150 Meters
% Surface UXO and minelike object# Surface AP mines$ Surface AT mines% Buried minelike object# Buried AP mines$ Buried AT mines
Possible minefieldProbable minefieldDefinite minefield
213400
213400
213600
213600
213800
213800
2022
00202200
2024
00202400
2026
00202600
Z
D
A
E
C
BW
V
F
4
31 2
1
2
3 5
4
2
1.2
1.1
3.1 3.2
Probable mine line extension

Chapter 5
94
Figure 5.12: Minefield indicators usinglandmines and regular occurring vegetation /soil disturbances.
on the colour, colour infrared and panchromatic photographs. Using the regular spacing interval even the number of mines used to construct the minefield can be approximated.
Definite minefield 3: Again based on the positive identification of a number of individual surface laid anti-tank mines this area was marked as a minefield and the minefield alignment could be established. No clear regular spacing of the individual mines could be observed or inferred. This might be due to a mixture of AT mines with AP mines or due to the fact that the vegetation disturbances are no longer visible. In the southern portion of the alignment at a number of places, circular disturbances could be observed, making it difficult to determine the exact extent of this minefield, which could therefore probably be longer. These disturbances do not have a regular pattern. Definite minefield 4: This minefield is most clearly visible on the aerial photos acquired in May 1998. Direct identification of AT mines on the colour and colour infrared images provided a good indication of the alignment of this minefield. Along this alignment soil disturbances occurred at regular intervals (approximately 5 metres apart). Two AT mines are not visible on the 1997 images and it may be assumed that the soil was washed away, exposing the (blue coloured) top of the AT mine on the May 1998 photos. The same distances between the (soil–vegetation) disturbances were also used for a number of other minefields observed in the area. Because the area is sparsely vegetated, mainly the soil disturbances provide secondary indicators
of the mine deployment on the 1997 images. In the southern portion of this alignment also vegetation disturbances can be identified, especially on the 1998 colour infrared photos. From these indicators it can be assumed that in this area shallow buried landmines are present in this minefield.

The Belgium test
95
Probable minefield 1: This likely minefield was inferred based on the occurrence of an aligned sequence of poles placed in a kind of topographic depression. The type of poles used looks identical to those observed in test field “C”. If this would be the case then most probably two alignments of mines can be expected, the poles marking the boundary of the minefield. Within the depression, no further indications appear of probable deployment of landmines and therefore if this would be a minefield, AP mines are to be expected. Furthermore, under real conditions, within such a depression (looking like a kind of small anti-tank ditch) no AT mines are to be expected, as a tank would not pass through this ditch (see also Appendix 1, enlargement 3). Probable minefield 2: In this area a minelike object can be identified on the surface on the 1998 colour photos. This object is not visible on the 1997 photos. This object aligns with regular soil and vegetation disturbances found north of it. Further detailed interpretation of the 1997 photos not only confirmed these regular aligned disturbances but also a continuation of vague disturbances is visible towards the south, especially in the central part of this sparsely vegetated area which was not so much disturbed by military activities (e.g. fresh truck tracks, etc.) after probable landmine deployment. Probable minefield 3: Clear aligned circular vegetation and soil disturbances can be observed. These disturbances are very similar to those observed along the section of definite minefield 2 where the landmines were buried. The spacing intervals between the disturbances are not as regular as those observed in definite minefields 1 and 2. Given the size of the disturbances AT mines are to be expected but this could not visually be verified as no surface exposed mines could be detected. Possible minefield 1: Section 1.1. Within this section several circular “aligned” anomalies could be traced with a regular spacing. There is no evidence of surface mines. If this is a minefield, the mines are all buried. Due to the size of the disturbances AT mines are most likely. This area is situated at the junction of a number of roads and a topographic depression is situated just along the alignment (foxhole). The fact that this area is situated at the verge of the road also justifies the deployment of AT mines. On the road leading to the northeast also a circular disturbance can be seen. Section 1.2: Within this section on the aerial photographs of 29-07-1997 (colour, 1:1.000) a series of circular disturbances along a straight alignment are observed crossing the roads in the area. These two possible minefields together prevent access to the whole northern and eastern part of the test area. Given these strategic considerations this area is very important under real conditions. However on all the data sets acquired in May 1998 extensive earthworks by bulldozer or grader have removed traces of this potential minefield. If this test would be conducted under real conditions then section 2 would not be considered and marked as a possible minefield, because in that case one should see signs of craters where a bulldozer went over the AT mines (or remnants of wreckage). This reasoning applies also for probable minefield 2 and possible minefield 3.1 and 3.2 as many changes have occurred in these areas as well and fresh truck tracks can be identified.

Chapter 5
96
Possible minefield 2: Two parallel lines (nearly 2 metres apart) of disturbances could be observed with a regular spacing (about 2 metres). The size of the circular disturbances is relatively small which could indicate the presence of AP mines. One of these disturbances has a slightly deviating colour (red-brown), maybe indicating a surface exposed mine. The pattern could not be extended onto or across the road. Near to this possible minefield another alignment of circular disturbances can be traced, but this one is much shorter and therefore it has not been selected. Possible minefield 3: In the immediate surrounding of the house on the older aerial photographs a number of potential locations were identified crossing the access roads. A few rows across the loose surface road at short spacing can be observed and these disturbances occur together with colour differences of the sandy material of the road, like bands of darker toned subsoil have been brought to the surface, indicating that the road surface has been modified. The entrance of the other access road shows a number of larger circular disturbances coinciding with the track of the car or truck-tires. Due to the presence of the trees and associated shadows, the other path could not be checked properly using the aerial photographs. Possible minefield 4: Series of approx. 15 circular features more or less in line observed by soil and vegetation disturbances. The distance between the possible mine locations is not identical. The disturbances are white coloured (bare soil) and relatively small, possibly indicating buried AP mines. Within e.g. test field “C” the places where the AP mines are situated, the heather vegetation has regenerated, minimizing the disturbances created and therefore hardly visible. The main reasons for selection is the observed pattern and extent of this possible minefield Possible minefield 5: Row of 3 aligned circular patterns, indicative of possible (near) surface laid mines. Possible extension to five or more related features but still relatively short to be classified as a minefield. Again here the disturbances have a white tone. No direct evidence of mines is present. In general the following criteria provided a good guideline during the interpretation process for the detection and classification of the minefield identified:
• Definite: direct landmine evidence coupled with occurrence of regular minefield pattern through indirect indicators, observed on the optical data or detected on one or more of the other sensors used;
• Probable: strong indirect / secondary indicators and associated mine deployment pattern, mainly observed on the optical data using stereoscopic interpretation techniques;
• Possible: weak indirect / secondary indicators only, minefield pattern is not pronounced, can be inferred only through detailed stereoscopic photo interpretation and use of photographic enlargements (up to 1 : 50).

The Belgium test
97
5.4.4 Discussion on interpretation results obtained After a period of approximately six weeks the initial blind interpretation results obtained were plotted on an orthophoto map and taken to the Royal Military Academy in Belgium to be validated. The minefields indicated on the orthophoto map were compared to the ground truth tables prepared by the “Belgian Interservices Bomb Disposal Unit”. A first comparison of the interpretation with the ground truth information showed that:
• Seven out of the nine minefields constructed in the test area were correctly or partially correctly identified, six of these minefields were unknown beforehand, the 7th minefield was used as a training field (test field “C”);
• Two of the nine minefields were not identified, these consisted of purely anti personnel landmines;
• Three false alarms, areas actually free of minefields, were identified. None of these had been classified as “definite” minefield.
In the following paragraphs the interpretation results obtained are further described. The layout of the minefield used for training purposes (test field “C”) was known and indicators for the positive identification of this minefield have been described. During subsequent fieldwork only 20 out of the 40 deployed devices and false alarms could be visually detected in the field. Definite minefield 2: This minefield is called minefield “W” by the military. This minefield was identified correctly. Not only with regard to the extent of the minefield but also the individual positions of the AT mines was mapped accurately. The surface laid mines as well as the buried mines (up to 40 cm deep) were observed and inferred correctly. The position of those surface laid mines still obscured by the vegetation could be inferred because the spacing between the individual mines was established at a number of places. Definite minefield 3: This minefield is called minefield “Z” by the Belgian military. Within this line a number of surface laid AT mines were found. The minefield has a probable continuation to the south-east which also proved to be mine laid. Therefore the southern part is also definitely a continuation of the minefield. Definite minefield 4: This minefield is the continuation of minefield “Z” and consists of two rows of 2 to 3 cm deep buried AT and AP mines. The area mapped is partially correct, the northern boundary is correct but in the southern part this minefield continues into the heather up to definite minefield 3. In the sparsely vegetated areas the alignments of mines could be detected, but in the heather covered areas no indicators were found. Probable minefield 1: This minefield is called minefield “D” and is definitely a minefield. This minefield was inferred correctly and consists of 2 rows of AP mines. The wooden sticks proved to be a good indicator for the presence of the mine alignments, which was validated during subsequent fieldwork. The AP mines were buried deeper than indicated by the ground truth tables.

Chapter 5
98
Probable minefield 2: This minefield is called minefield “V” and consists of buried AT mines at 15 cm. depth. There is a southern extension that was not detected due to the changes that occurred in this area (traffic). Probable minefield 2 continues to the north to possible minefields 1.1 and 1.2. This minefield was constructed using a mechanical minelayer (Matenin). Probable minefield 3: This area was a false alarm according to the ground truth tables. No mines were laid there. Possible minefield 1: This minefield which was differentiated in section 1.1 and 1.2 is actually the continuation of minefield “V”. Section 1.1 continues further to the north and was not detected. Possible minefield 2: This minefield is called “F” and consists of mainly 2 rows of AP mines. The alignment of the 2 rows was mapped correctly. Some random scattered mines and UXO’s were not mapped but the minefield alignment was correct. Possible minefield 3: This is called minefield “E”. The AP and AT mines were buried towards the entrance roads to the house. Actually three roads have been mined, two roads were correctly identified as being mined. Possible minefield 4 and possible minefield 5: No mines were laid here, both were false alarms. Not detected were the following minefields:
• Minefield “A”: consisting of a row of 32 AP mines, buried at a depth of 1 cm. mainly underneath dense tree cover;
• Minefield “B”: consisting of two short rows of (in total 12) AP mines buried at 2 cm depth on the south facing slope of a man made hill, just adjacent to trees situated on the top;
• Some portions of Minefields “E”, “V” and “Z” were not detected. To further evaluate these results, a detailed field investigation was conducted to study the reasons for the differences of the interpretations with the ground truth tables and the reasons for the false alarms mapped as well. To be able to determine the miss-matches the field survey was conducted together with the military responsible for construction of the minefields (“Belgian Interservices Bomb Disposal Unit”). Detailed inspections in the vegetated areas showed disturbances providing evidence of mine deployment. In the areas consisting of bare soil, along roads or when sparse vegetation was present, a spade was used to expose the landmines. Due to the changes that have occurred at a number of places (e.g. minefields “E” and “V”) the minefield was difficult to find. Minefield “A”: This minefield was constructed under a dense tree cover. Due to the fact that the birch trees had already established fresh leaves and because of the shadows of the vegetation in general, no clear impression could be obtained of the mines deployed at or

The Belgium test
99
Figure 5.13: CIR photo Minefield “B”.
Figure 5.14: Northern extension of minefield “V”.
near the surface. After careful inspection the AP mine alignment could not be observed but wooden poles, similar as those used in minefield “C” and “D” were found.
Minefield “B”: In order to find the reasons why this minefield was not detected the approximate mine alignment was plotted (see blue arrows on figure 5.13). On the colour infrared image the sheet and rill erosion phenomena are clearly depicted (by the bright white tones) on the slope of the artificial hill. Due to this high reflectance, small detailed features inside the eroded areas could not be observed. Furthermore given the possibilities of soil erosion and terrain configuration in general one would not expect this site to be a potential minefield site. Field observations confirmed the potential of soil erosion as one of the AP mines was washed down the slope. The
other AP mines were shallow buried and were hard to detect visually. Two landmines were situated underneath the tree standing in the middle of the mine alignment. A wooden pole still remained at the left side of the mine alignment but could also not be detected on the airborne data available. Minefield “E”: Even after subsequent image analysis this minefield extension could not be identified. The secondary features associated with the burial of the AP and AT mines were not visible any longer across the track leading into the forested area.
Minefield “V”: This minefield was constructed using a minelayer. Re-interpretation showed that along some sections of this minefield the tracks of the machine being used could still be clearly observed. In the northern portion of minefield “V” even in the middle of the track clear vegetation disturbances are visible at a regular distance interval representing the AT mine locations (see figure 5.14). The clear vegetation disturbances can only be inferred in those areas where the heather has a homogeneous cover. Using this mine laying pattern given in figure 5.14 and extrapolating it
Chapter 5
100
over the total length of the minefield inferred using the direct evidence of the tracks of the minelayer about 95 mines, out of the total of 102 mines being actually deployed, can be accounted for. The reason for this deviation is that the southern portion of this minefield cannot be clearly identified. Also the three false alarms generated were studied. Probable minefield 3 consists of a series of rabbit holes aligned with a narrow and shallow elongated depression. The soil excavated by the rabbits show the soil disturbances. At other places the rabbit holes could be identified and these disturbances could be accounted for. Many of the holes were dug into the side of the shallow depression obscuring it from direct detection. This feature also resulted in another false alarm, namely possible minefield 4. These soil disturbances can also be attributed to animal activity. The features related to the classification of possible minefield 5 are related to the disposal of pieces of paper littering the area. Also at other places rubbish was found but neither in such a pattern nor shape.
The Belgium test
101
5.5 Analysis of digital image data recorded of the pilot area in Belgium
5.5.1 Digital camera The data recorded by the digital camera has a spectral overlap compared to the aerial photography taken of the test area. The main advantage is that the data is already in a digital format and can be used, after a data conversion routine, directly in an image processing software package for further analysis. Subsets were created of the definite minefields identified to evaluate the suitability of the sensor for minefield detection. Appropriate pre-processing techniques were conducted for image enhancement. Figure 5.15 depicts test field “C” recorded on the 12th of May (1998) at an altitude of 180 metres, oriented identical as in figure 5.9. Figure 5.15: VOS-80C digital camera recording of test field “C”.

Chapter 5
102
The images were acquired with a high spatial resolution. Because of this detail the surface exposed M6 AT mine could be determined visually on the image as well as the surface laid concrete block. At some places the wire fencing used surrounding the minefield could also be observed, especially at places where the white coloured wire is strongly contrasting with the nearly homogenous dark brown coloured heather vegetation. Other indirect indicators used to determine e.g. the position of the individual M6 AT mines in test field “C” could also be observed on the image, such as the wooden sticks laying on the ground and the vegetation disturbances, although these are not that clearly depicted compared to the aerial photographs. The smaller sized indicators such as the standing wooden poles and the thin wire between them could not be detected. Figure 5.16 shows the northern section of the test area identified as definite minefield 2. The surface laid AT mines that are not obscured by the heather vegetation can be clearly identified (see arrows). Based on the pattern, distance between the mines and alignment of this minefield, a partially obstructed AT mine could also be identified (in the circle). See also enlargement 2 of appendix 1 providing a colour aerial photo of this section. Figure 5.16: VOS 80C image of a section of definite minefield 2
For definite minefields 3 and 4 the partially surface exposed mines could not be clearly identified. Also the secondary features and other indirect indicators used to establish the alignment could not be detected through visual interpretation. Although the images show many detailed features, a major limitation for visual analysis is that stereoscopic interpretation is not possible. The 3D impression, coupled with the high spatial resolution reveals much more information than looking at the high resolution digital image monoscopically. Another drawback is that the data recorded is made available at a radiometric resolution of 8 bits. Image details in low contract areas are difficult to interpret and require local image stretching routines that, on the other hand, adversely affected other recorded areas on the image (and therefore patterns extending into these areas are more difficult to establish).
Minefield Alignment

The Belgium test
103
Figure 5.18: Thermal morning image testfield “C”
5.5.2 Thermal Infrared
5.5.2.1. Recon Optical CA-860 IRLS For landmines that are obscured in the optical and near infrared part of the electromagnetic spectrum, recordings using other spectral regions may show their presence. The deviating temperature characteristics of the landmines (or disturbances caused) compared to the surrounding terrain are the key to their detection. To detect these differences the test area was recorded after sunrise, during the early afternoon and at sunset (fig. 5.17, 5.18, 5.19).
Figure 5.17: Thermal sunset image test field “C”
The imagery over test field “C”, was recorded on 12 May at 21.24 hr. from an altitude of 365 m. resulting in a spatial resolution of 9 cm. Figure 5.17 (A) shows the original data recorded, (B) gives the evening image after applying a Fourier transformation to minimize the effect of image striping. The relative temperature recorded is showing the warmer image elements in a white tone, the cooler pixels are dark toned. At night, trees stick out as white areas, since they cool off slower than the heather vegetation and grass. During image acquisition use was made of a gain and offset to maximize the contrast, using the full radiometric range of the sensor. Different settings were used for the other recordings.
A B

Chapter 5
104
Figure 5.18 shows the image acquired after sunrise on the 13th of May at 8.10 hrs, from the same altitude. Figure 5.19 shows the afternoon image of test field “C”, recorded on the 13th of May at 15.54 hours, also from 365 m. Here the trees appear dark (cool) because of evapotranspiration and shadowing. Given the results from the temperature measurements conducted in the field (the maximum temperature anomaly between the bare soil and the AT mines occurred during the afternoon, see figure 5.4), this image was used to see if the AT mines could be detected. Figure 5.19: Thermal afternoon image test field “C”
During pre-processing, the thermal image acquired was co-registered using a high resolution orthophoto map of the test area. A properly distributed set of unambiguous control points was used for image rectification having a RMS error less than one pixel. The positions of the landmines obtained from the military were plotted on the thermal image. Visual inspection shows that differences can be observed on the image between some buried or otherwise obscured mine positions and the surrounding non-disturbed areas, especially disturbances in the heather vegetation as these result in larger temperature differences. Because the patches of bare soil or scarcely vegetated areas are warmer than the denser vegetation cover (the trees and associated shadowed areas have the lowest temperature) visual interpretation, using the tone of the image to detect the mines is
ÚÚ
ÚÚ
ÚÚ
ÚÚ
ÚÚ
ÚÚ
ÚÚ
ÚÚ
ÚÚÚÚ
ÚÚ
ÚÚ
ÚÚ
ÚÚ
ÚÚ
ÚÚ
ÚÚ
ÚÚ
ÚÚÚ
Ú
5 0 5 10 15 20 25 Meters
Ú mine position213350
213350
213375
213375
213400
213400
213425
213425
2024
50202450
2024
75202475

The Belgium test
105
difficult. Also use was made of profiles to determine if regular temperature anomalies could be detected revealing the positions of the landmines. Figure 5.20 shows such a thermal profile, plotted along the Y-axis the relative temperature that occurred along the M6 AT mine alignment (given by the blue line in fig. 5.19). Figure 5.20: Thermal profile along the M6 AT mine alignment, test field “C” From the profile at a regular interval (4.5 m.) the mine locations can be observed with DN values just over 150. Only two mines (7 and 9) show different temperature characteristics, having higher relative temperatures. The value range between 150 and 165 is mainly related to the occurrence of landmines, the other land cover along the profile having lower values, with irregular occurrences of higher relative temperatures. To enhance the visibility of this value range, image stretching techniques could be applied. Applying a slicing at the DN value of 150 and using a priori minefield knowledge acquired by the image interpreter, further image processing using algorithms incorporating direction and pattern have a potential to assist during the image analysis stage. This can also be observed on figure 5.21. Although the relative temperatures are lower (profile taken along
Figure 5.21: Thermal profile along the northern section of minefield “W”.
Chapter 5
106
a dense heather covered section as shown in figure 5.16, see also Appendix 1, enlargement 2) again most of the mine locations have deviating intermediate values (between 110 and 150) that are higher than the general surrounding along the profile which has values below 100. Only three of the 13 mines plot with values above 150. Another approach using the thermal inertia characteristics of the mine in relation to its surrounding environment would be the use of the three acquired data sets simultaneously. This requires an accurate co-registration of the data. Given the poor thermal contrast, especially of the evening image, no clear control points could be obtained, resulting in poor image registration results having a mismatch of a number of pixels. Other efforts to co-register the data were also not successful (Hermann, 2000). Even if the registration would have been successful the thermal contrast is very limited, resulting in most of the features having the same relative temperature. This is supported by the temperature measurements conducted (fig. 5.3 and 5.4) that show that during the evening and morning, temperatures of the different cover types and the mines are identical and without a thermal difference, detection is not possible. With the data recorded it is impossible to determine the diurnal temperature cycles because the sensor gain and offset settings have been adjusted by the sensor operator during each of the flights in a non-reproducible way. The use of the thermal images to detect secondary features and indirect indicators for landmine presence is limited by the fact that the spatial resolution does not allow for their discrimination, and that the spectral characteristics of the features used are identical to the surrounding (e.g. the use of wooden sticks lying between the vegetation).
5.5.2.2 Westinghouse Micro FLIR Using a helicopter, at low speed and altitude, a high resolution forward looking infrared sensor, was flown over the test site. The data recorded was stored on videotape. The resulting oblique swath is very narrow and as the data is not geo-referenced integrating the images with the field observations was not possible. The wind generated by the rotor of the helicopter greatly affected the vegetation, especially the trees. The gimbal rotation and the movement of the helicopter resulted in a fast scanning process of the terrain, which, coupled with an adjustment time needed for autofocussing, results in a blurred image appearance. The images allow for general distinction of the main vegetation cover types as well as some small sized objects that have a strong thermal anomaly with their surrounding. It is not possible to recognize these objects. The main limitation of this platform / sensor combination is the narrow swath, as this does not allow for detection of a possible minefield pattern. If the data would be geo-coded, then selected video frames of suspect areas could be captured and compared with the other high resolution data acquired to visually determine if the objects are related to the occurrence of landmines. Image fusion at the pixel level needs advanced processing, as the forward look angle of the images is continuously changing based on the manipulations of the sensor operator.

The Belgium test
107
5.5.3 X and P band Radar The X-band data presented in figure 5.22 was acquired on 13-05-1998 at 3000 metres above ground level, at a heading of 180 degree (N-S). The radar is illuminating towards the right. The data has a 50 by 50 cm. spatial resolution. It can be seen that the embankment, trees and especially the corner reflector produce a strong return signal when facing the radar. The other side of the trees and embankment show radar shadow resulting in dark tones. The heather (rough surface) shows a mixture of higher and lower backscatter returns and the grass and the roads / bare areas act like a specular reflector, resulting a low signal return. Figure 5.22: Leopoldsburg test area X band radar
#######################
##
##
##
#
#
###############
####
###
######
####
####
######
######
####
##########
#######
###
###########
####### #####
######
#
# #
#
##
#######
##############
#############################################################################################
#########
########
#
#########
######
#############
#
####
#
######
#
####
#
##
#####
#
###
####
####
##
####
##
# #
# #
##
# #
#
#
####
# #
# #
# #
# #
##
##
#### #
####
# #
# #
# ## #Z-1
C-1W-1
W-2
V-1
V-2
The pre-processing of the X-band data was done by the sensor provider. For geocoding the data, use was made of corner reflectors and their positions in the field were determined using a GPS receiver. The digital file with the X-band radar data was provided in a generic binary format (4 bytes / real), the heather information provided details on the geocoding of the image. The positions of the landmines obtained from the military were plotted on the geocoded X-band radar data. The windows indicate the subsets selected for further visual analysis and these are given in figure 5.23. Given the spatial resolution of the radar data obtained, subsets have been selected of AT minefields, that have been surface laid or buried at different depths.

Chapter 5
108
Using the X-band (centre wavelength about 3 cm.) the signal return is strongly influenced by the top of the vegetation and not by the ground surface. That is why some subsets selected have a dense vegetation coverage and the other areas are nearly bare. Figure 5.23: X-band radar image details selected subsets.
Test field-C (C-1) Field-V Top (V-1) Field-V Bottom (V-2)
Field-Z, Top (Z-1) Field-W, Top (W-1) Field-W, Bottom (W-2) The data obtained of test field “C” allows for a general differentiation between the vegetation types in this area, reflecting the roughness of the ground cover. No landmines or mine alignments can be visually detected. Detailed inspection showed that for the top of minefield “V”, consisting of buried HPD AT mines underneath dense heather vegetation, that the mine alignment cannot be detected. Within the more homogeneous and general darker toned southern extension of minefield “V”, consisting of bare soil and some scarce vegetation, the buried mine alignment could also not be detected. As most of these mines were deployed under conditions that are unfavourable for detection by the X-band, two of

The Belgium test
109
Test area
T6
T9
T7
T4
T2
T5
T3
T8
the other three subsets selected have more favourable characteristics. Similar conditions to those existing in minefield “V” also occur in the bottom section of minefield “W” but the disturbances created when the mines were buried have resulted in a different surface roughness (see fig. 5.12) and some should be large enough to be depicted by the radar sensor. The pattern of disturbances so clearly seen on the optical data could not be detected on the radar image. The top of minefield “Z” and minefield “W” have shallow buried, partly exposed and surface laid AT mines. Although conditions are favourable for detection, no mine alignment could be detected. The P-band radar data was also pre-processed and geo-coded by the radar system operator (Aerosensing) and was provided in a generic binary format (4 bytes / real) to be incorporated into an image processing package for visualization and subsequent image analysis. The images were geo-coded using the information from the header files provided to evaluate the relation between the signal backscatter and the landmine location. The P-band data obtained was resampled to a pixelsize of 25 by 25 cm. from the original resolution of 0.5 by 2.5 m. recorded at 600 m. above ground level. Closer inspection of the data reveals the elongated original pixels structure. Figure 5.24 shows the track / flight line configuration used to obtained the P-band data. The radar is illuminating towards the right. Figure 2.25 shows an enlargement of track two used to plot the location of some of the minefields as well as the images acquired from the different flying directions.
The validation of the positional accuracy of the data acquired from different flying directions is not possible as no unambiguous reference points could be identified. Also co-registration between the images could not be verified and therefore possible small shifts of the individual images could not be determined. Visual analysis reveals that the backscattered signal is strongly affected by the forest / tree cover in the test area. The trees are causing direct and multipath backscatter, which in turn is translated into brighter image pixels. The actual shape of the trees, e.g. those north of test field “C”, strongly depends on the heading of the flight line. Detection of the two embankments also strongly depends on the flight direction. The embankment in the NW corner can be identified on most of the images,
except when the embankment is parallel to the range direction. A house, situated within minefield “E”, can be observed on the images of tracks 2, 6 and 7 as a bright white spot within the lighter toned forested area.
Figure 5.24: Relation tracks / flightlines and radar illumination (not toscale).

Chapter 5
110
Figure 2.25: P-band radar over Leopoldsburg
##### ############
##### ###
######
###
######
## ######
####
##########
##########
###########
###################
##############################################################################
###########################
#######
#####
##
###
##
######
##
######
######
##############
##
##### ############### #############
P-band Image, track 2- heading 180 degree
Track 2 / heading 180 degree Track 3 / heading 270 degree
Track 4 / heading 135 degree Track 5 / heading 225 degree
Track 6 / heading 0 degree Track 7 / heading 90 degree

The Belgium test
111
Track 8 / heading 315 degree Track 9 / heading 45 degree There is no distinct difference in backscatter between the heather, grass, bare soil and roads. Due to the wavelength used the signal is able to penetrate the topsoil (about 35 cm.) within these areas and a small portion of the energy is received by the antenna given the divergency, propagation and transmission losses encountered (see figure 2.11). Because of these losses the overall signal return is substantially lower for these cover types and results in a grey to black pixel appearance. Further visual interpretation of the images shows that no positive identification can be made about the possible location of minefields or of individual mines. To determine in more detail the suitability of this sensor, mine field “W” (surface laid and buried M6 AT- mines) was studied at the pixel level. At this level the rectangular pixel appearance (depending on the track selected) does not allow for good visual interpretation, through the random pepper and salt appearance no clear idea can be obtained if the brighter pixels represent landmines. Also no clear patterns could be observed, so this surface laid AT minefield could not be visually identified. Further research being carried out at Aerosensing makes use of a specially developed neural network classifier applied to each of the eight P-band images acquired over test field “C”. Using a consensus decision for mine detection if more than six out of eight networks provide evidences for a mine, a final classified image is produced. This image showed a high false alarm rate (64) and a possible detection of 5 mines (Huber, 2000). If the threshold for the false alarm rate would be reduced, the mines would probably not be detected. Apart from the direct detection of landmines, the other indicators that have been used e.g. during the visual detection process using the optical data were not recognizable on either the X or the P-band images.
5.6 Satellite change detection For the test site, SPOT multispectral satellite data was acquired to see if the construction of the minefields could be detected based upon the changes that could have resulted from the placement of the landmines. As it was known that the area was prepared during week 20, 1997, remote sensing data was collected shortly prior to and after the mine deployment, on 2 May and 30 May, 1997, respectively. The satellite data search showed that the SPOT satellite made the most favourable image acquisition for this multi-temporal analysis. A limitation was that the image acquired of the 2nd of May was in off-nadir mode so that the

Chapter 5
112
area of interest was situated at the edge of the image (a small SE portion of the test site was not covered). The 30 May image was acquired nadir downlooking. Figure 5.26 shows the colour composites of the area before (A) and after (B) minefield construction. Also shown is the normalized difference vegetation index (NDVI) of the image acquired before (C) and after (D) as well as the difference (E) between the two NDVI’s (NDVIafter – NDVIbefore). After the images were accurately co-registered, a visual interpretation revealed that hardly any changes could be observed in the test area. To minimize differences in radiometric properties of the images and enhancing the spectral differences between vegetation and bare soil (possibly related to landmine deployment), normalized difference vegetation indexes were calculated. Also the visual comparison of these images did not show a clear indication that the area showed signs of the newly minefields constructed. The NDVI differencing confirms this, the grey tones indicate no change where as the black and white tones show differences between the two data sets. Some changes can be observed along the infrastructure in the area of interest, but these might be attributed to differences in image acquisition geometry that could not be corrected for during image rectification. Figure 5.26: Satellite change detection using SPOT multispectral images.
(A) (B) (C) (D) (E) Rönnbäck (2000) used an image subtraction approach, incorporating a radiometric normalization procedure to make sure that changes occurring in the image are related to ground based changes and not due to e.g. different atmospheric conditions during the time of recording. An iterative histogram matching technique is adopted to radiometrically normalize one image to the other. After a matching iteration the new and old pixel value are compared and if the difference is larger than a specified threshold the pixel is not included for the matching process as this pixel might have been influenced due to changes. After a number of iterations the transformation function does not change and can be adopted to conduct the radiometric correction. The difference between the subtracted images reveals the changes. Also this approach did not reveal indicators showing the presence of the construction of minefields in the Leopoldsburg area, as the resolution is insufficient to depict the small changes on the ground.
Test site

The Belgium test
113
5.7 Discussion on image analysis results obtained The airborne data collected of the test area and subsequent analysis showed that minefields could be detected from large standoff distances. Through detailed analysis of the optical data, locations of landmines could be determined within the minefield, minefield patterns and alignments could be established as well. Indirect indicators, such as soil and vegetation disturbances combined with manmade indicators (e.g. wooden sticks and wire fencing) have been used extensively to detect minefields if no direct presence of landmines could be established. Not all minefields were detected, those not detected consisted solely of buried AP mines. Only a few false alarms were generated (details have been presented before). Stereoscopic image interpretation of the optical data using multiple emulsions simultaneously revealed even small anomalies in the images that could be related to the presence of landmines. The images obtained from the digital camera showed many of these features as well but data analysis could only be performed monoscopically. A number of surface laid AT mines could be detected, but analyzing the presence of indirect indicators proved to be much more difficult. Direct detection of AP mines was not possible, all were situated within the vegetation or were buried, obscuring them for visual detection. The other sensors used did not have the necessary resolution to have a number of pixels on target, necessary for detection. After geo-coding the thermal and the radar data were used to search for minefields. The images were used for the direct detection of landmines within the minefields. Given the spatial resolution of the thermal infrared line scanner special attention was given to the detection of AT mines as buried AP mines would not cause a thermal anomaly that would appear on the image. The combination of visual interpretation linked with the construction of thermal profiles along the identified alignments showed the occurrence of regular thermal anomalies of concealed and buried AT mines for a mine line in test field “C”. This information provided additional confidence during the interpretation process. More attention needs to be given to the geo-coding of the thermal data as this severely limits their use. Due to the low thermal contrast, especially in the sunset images, no image co-registration could be performed and therefore possible thermal inertia characteristics of mines could not be utilized. The field measurements showed that the largest difference between the soil directly adjacent the landmines and a bare soil reference area was largest during the afternoon and minimal during sunset and sunrise further limiting the use of the data recorded during these hours. The high resolution images recorded by the forward looking infrared sensor could not be analyzed successfully partly due to the fact that the data was not geo-coded. Given the narrow swath width orientation of the image frames is extremely difficult. Furthermore, the narrow swath does not allow the interpretation of a minefield pattern or alignment over larger distances. Interpreting the radar data recorded over the test field did not prove to be very successful. The X-band mainly interfered with the top of the vegetation cover and not with the mines

Chapter 5
114
concealed in between or underneath e.g. the heather vegetation. The P-band radar does not have sufficient spatial resolution to detect the metal AT mines, even when data acquired from multiple flight directions were fused. This was also due to the geo-coding of these images resulting in pixels not being accurately co-registered and therefore image fusion algorithms and neural network classifiers produced only limited results. Another limiting factor may have been the relatively high soil moisture content resulting from a prolonged period of poor weather before the data was acquired. The high moisture content adversely affects the ground penetration capability of the P-band radar. The results obtained are mainly based on visual stereoscopic image analysis limiting the use of the thermal and radar data as these could not visually be fused with the large scale aerial photographs. Furthermore, other indirect indicators could not be visually detected on the thermal or radar data. Based on these results the most suitable images for minefield detection, not only using the landmines but also making extensive use of associated indicators revealing the presence of minefields, were the colour and colour infrared aerial photographs obtained at the largest scales possible. The images collected at the end of 1997 still showed signs of soil disturbances that could not be clearly detected on images taken during May 1998. On the other hand, the 1998 large scale aerial photographs showed the presence of formerly buried AT mines that became exposed. The multi-temporal analysis showed changes that proved to be helpful during photo interpretation using both dates simultaneously underneath the stereoscope. The digital camera images spectrally overlapped the aerial photography emulsions used. As the spatial resolution is less, the aerial photography is preferred for visual analysis. The thermal infrared line scanner provided additional information raising the confidence level for minefield classification. The major drawback is the lack of positional information and the sensor resolution does not allow the discrimination of AP mines. The radar sensor did not contribute to the detection of minefields. Yvinec et al (1999) and Katartzis et al (1999) made extensive use of digital image processing techniques to detect the minefields using the images acquired by the airborne campaign, not only using the spectral information for detection of individual mines but also utilizing spatial characteristics of minefields, such as the possible occurrence of a regular pattern along an alignment. Semi-automatic image processing tools were developed to detect possible minefield indicators used during the visual interpretation process, such as the detection of periodic indicators like the regular occurrence of poles, image segmentation to identify homogeneous connected areas, automatic processing routines to detect the presence of trenches and foxholes. These processing tools can assist the image interpreter to enhance certain indicators. How these are used if detected by the processing tools to infer the minefield is left to the photo interpreter. Using these techniques Yvinec and Katartzis could identify the AT mines situated in minefields “C” and “W”. From the multispectral satellite images (at 20 m. resolution), acquired directly prior and after minefield construction, it is not possible to detect direct indications of landmine deployment. The mine laying practices of the military did not affect the vegetation cover in

The Belgium test
115
such a way that it can be observed by the satellite (due to its spatial resolution) and therefore no relevant changes could be detected. It is expected that under real conditions the deployment of minefields will produce indicators that in some cases can be detected even on (multi-temporal) satellite images, e.g. arable land left out of production. The test site used is not a suitable location to validate this approach. In chapter 7 the detailed research questions formulated for this phase are further discussed and answered.
5.8 Limitations of the test conducted The preparations of the sensor and platform test started in 1997. A requirement was that the sensor should be commercially available so that if the “blind test” was successful, the equipment would be available to perform wide area detection elsewhere. This omitted sensors to be used that were still under development. The sensing equipment used represents the development status as of 1997. In the mean time technological improvement have taken place and therefore other sensing equipment is currently available which could be integrated into a multi-sensor system as have been reported in chapter 2, such as the high resolution thermal (stereo) framing camera. Due to NATO regulations some of the mines used in the test were painted with a deviating colour of their casing to distinguish between the inert mines used for training purposes and real landmines. Therefore colour used for some of the inert mines is not the same as to those deployed under real conditions. The construction of the minefields in the test area was done with great care and not under constraints normally faced during times of conflict, as is reflected by the number of mines that have been carefully buried and otherwise concealed in the minefields. As stated in chapter 3, the use of mines by military forces is governed by several principles of war controlled by process indicators and leading to impact indicators. The test area as such is situated in a natural setting not being used by the local population. Under real conditions one would not expect mine laying to occur at such a site. A large number of additional indicators often found in association with the presence of minefields, such as those reported in table 3.1 and 3.2 are not valid here. As the test area is relatively small and the physical landscape is rather homogeneous, also no indicators could be obtained using the terrain configuration. Being able to incorporate the whole range of indicators, and not only the landmine specific indicators, would provide a more realistic test of the methodological concept developed. Further complicating the analysis were a number of changes that have occurred in the test area after minefield construction, such as earth moving and levelling activities, which took place completely modifying the local environment. Also a new road was constructed. Fresh car and truck tracks and other related modifications could also be observed which under real conditions lead to the conclusion that no landmines are situated in these areas.

Chapter 5
116
All airborne data was collected within one year after minefield construction. In mine infected countries minefields are present for over a decade or more. The natural regeneration of these areas, as the local population does not use them, becomes more evident as the time proceeds compared to those areas being used. These conditions were not reflected in the test area. The test clearly demonstrated that to be able to detect minefields, ancillary information with regard to the mine deployment methods is necessary. Once knowing that e.g. minefield “V” was laid by a mechanical mine layer, the minefield could be easily detected. Due to prolonged poor climatological circumstances the main airborne campaign was delayed until the fresh leaves appeared on the trees. This prevented detailed analysis of the ground features directly under the crown of the trees and in the shadowed areas on the optical and thermal data. As was observed by Voles (1998), to assess sensor systems, large trials are required to obtain performance measures with confidence. With a confidence coefficient of 98.1 % to determine a probability of detection of 99.6% only one mine can be missed out of 1000 mines being used in the test. The total number of mines used here is roughly a third of this required total. Furthermore, to evaluate if the perimeter of minefields was assessed accurately new procedures should be developed.
5.9 Summary Apart from the remote sensed data collected for the pilot area other relevant details have been given, like a description of the environment of the pilot area, mines deployed, etc. To be able to evaluate the sensor performance over the controlled test in Belgium soil data were collected such as soil moisture, grainsize and a soil profile description. Spectral reflectance curves were recorded of the visible and near infrared spectrum of major cover types and some landmines situated within test field “C”. General climate records representative for the test area were provided as well as detailed surface temperature recordings of some cover types and adjacent to landmines taken during the airborne campaign. The next section of the chapter was devoted to the initial processing of the data acquired over the Belgium test area. The sensor operators did most of the pre-processing and the obtained images were used during visual image interpretation. The digital data obtained was imported into image processing software for further analysis. Image subsets were selected, based on preliminary interpretation results, conducted using large scale stereo aerial photography. The initial blind interpretation results using the images acquired of the test were compared to the ground truth tables showing all the landmine locations. The minefields identified were classified as definite, probable and possible using indicators obtained from the high resolution optical data, thermal infrared and radar images. After the ground truth, further visual interpretation and other image analysis techniques were performed to determine the reasons why certain minefields were detected and others remained unnoticed on the

The Belgium test
117
airborne data. The known mine locations were plotted on the geocoded thermal and radar images to see if the minefields could be detected once the exact positions of the landmines were known. The contribution of the different images was studied in detail to determine their suitability for detection of minefields. The results obtained using mainly visual interpretation of the optical data recorded were compared to other efforts using digital image processing techniques to extract landmines and minefields. The SPOT satellite data was imported and pre-processed. Image co-registration procedures were performed to allow for further pixel based change analysis techniques. Finally a number of limitations were given with regard to the test conducted.

Chapter 5
118
Standoff minefield detection in Africa
119
Chapter 6
Standoff minefield detection in Africa
Abstract In this chapter the results are presented of the airborne and satellite based detection of minefields in Mozambique and Zimbabwe. First an overview is presented of the pilot areas selected, representing different climatological/environmental zones, followed by a description of a number of minefield deployment methods found in Mozambique and the high resolution airborne data collected over these areas during the airborne campaign. The results of the image analysis are presented and discussed subsequently. The second part of this chapter is focussing on the use of satellite remote sensing for minefield detection. A test area was selected based on the airborne data collected in Mozambique (surrounding Songo) and multi-temporal satellite images acquired using multiple sensors were analyzed to evaluate their suitability for detection of minefield indicators. Using satellite data archives images could be acquired dating from 1973 till present, allowing for an extensive analysis of temporal developments. To evaluate if the results obtained are representative, other areas, marking the border zone between Mozambique and Zimbabwe was analyzed using different types of satellite images combined with medium resolution multi-temporal aerial photography. Also use was made of outdated topographical maps providing ancillary information used during image interpretation.
Keywords: landmines, demining, minefields, survey, airborne survey, satellite images, aerial photographs, minefield indicators, multi-temporal analysis, change detection, resolution.
6.1 Introduction Mozambique and Zimbabwe both experienced a long period of civil conflict in their recent history, and during this period extensive use was made of landmines still hampering regional economic development and causing casualties to the local population. Mainly use was made of anti-personnel landmines and a large number of suspect areas and minefields still have not been cleared, and are not even accurately surveyed to determine the extent of the landmine affected areas or minefield perimeter. Given the size of the suspect areas believed to be contaminated with landmines, an approach such as used in Belgium, where all possible sensors were flown acquiring data at different scales and resolutions, data recorded from different flight directions, etc. is not feasible given the shear amount of data that would be generated in a South African context. As the large scale aerial photography provided the major information towards identification of minefields in Belgium, combined with thermal imagery to improve the confidence level for some types of minefields, these were the prime sensors selected to be used during the airborne campaign in Mozambique. As the infrared line scanner did not have the required spatial resolution to detect AP mines, a forward looking infrared sensor, integrated in a
Chapter 6
120
fixed wing aircraft, was incorporated into the campaign to test its suitability for recording of selected suspect sites, like roads and road verges or along electricity pylons. In general, due to terrain configuration and the large amount of data generated, the details to be seen on the smaller scale images acquired in Mozambique (1:2000 – 1:3000) would not allow for the identification of direct landmine presence (which was observed to be extremely difficult in the Belgium test using large scale data) but was expected to reveal a large number of indirect indicators allowing to define the perimeter of the minefield accurately. In order to evaluate the suitability of remote sensing for minefield detection over the selected areas, a number of different types of airborne and spaceborne data were acquired to see if and which indirect indicators could be detected. Because of the fact that some of the minefields were constructed already a long time ago, older satellite data and aerial photography was incorporated into the analysis, to determine the temporal developments that have taken place in the suspect areas. Through the combination of all this remote sensed data, together with ancillary information, during subsequent analysis, a large number of input, process, outcome and impact indicators could be determined. Their presence should lead to the accurate identification of the minefields located within the suspect areas.
6.2 Mozambique pilot study
6.2.1 Description of the pilot areas
6.2.1.1 Introduction For the selection of the test areas the priority listing was used prepared by the provincial government in collaboration with the Mozambique government agency responsible for humanitarian demining (IND). Areas were selected which have a high priority for demining so limited field validation could take place during a later stage. The areas selected represent different climatic, geographic zones, etc. Two test areas were selected in the tropical coastal zone (Buzi and Bandua), one area in the flat, low elevated plains (Mameme) and another area marking the transition between the plains and the mountains with very diverse terrain characteristics (Songo). Climatologically the areas are also different, reflected by various types and densities of vegetation. The areas selected have different conflict characteristics and therefore differ with regard to metal contamination, presence or absence of UXO’s. All areas consist mainly or completely of minefields with anti-personnel mines. In general few anti-tank mines have been used during the conflict in Mozambique.

Standoff minefield detection in Africa
121
Areas selected were relatively close to an airport for the necessary aviation facilities. Also road access for field validation during the airborne campaign / marking and (D)GPS set-up close to the suspect areas surveyed were very good. Norwegian People’s Aid (NPA) is active in the central part of the country (3 provinces). In order to limit logistical problems during field validation the test areas were selected within the NPA assigned provinces. Facilities during the airborne and field campaign were available, either provided by NPA or in the villages/towns near the test areas. Figure 6.1 shows the locations of the test areas selected in Mozambique. A short description of each of the selected areas is provided below. Figure 6.1: Location map of the test areas in Mozambique.

Chapter 6
122
6.2.1.2 Buzi The minefield is situated in an area of tropical agriculture within the lowland area, adjacent to the Buzi River, about 30 kilometres south west of Beira, one of the main coastal towns. The identified minefield can be classified as a defensive minefield ring, surrounding a then important sugar cane processing factory and a landing strip. Both limbs of the minefield extent towards the Buzi River, which marks the end of the minefield. The minefield, constructed in 1982 by Frelimo, consists of anti-personnel mines such as POMZ-2 (with trip wires and fragmentation sleeve), PMN and PMD-6 and is believed to be a high-density minefield. The PMN and PMD are typically shallow buried and the POMZ appears above the surface. Due to the fact that the whole minefield is flooded annually the local population is afraid that the mines will be washed away by the floods passing through the minefield. Two accidents have been reported. Markers on both sides demarcate the minefield. These bars (railway tracks) are placed upright into the soil at a regular interval of about 5 metres. The rail track is nearly 2 metres high and its maximum dimensions are 6.5 cm. by 7 cm. The width of the minefield is about 5 metres. The area is intensively used for agriculture but in the suspect area the vegetation consists mainly of grass, which after the rainy season can be over two metres high.
6.2.1.3 Bandua Close to Buzi, the town of Bandua is situated (about 25 km in SW direction), and the mined area can be found on the western side of this village. The minefield is limited on the northeastern side by the local primary school, just 6 metres off the school playground. The mined area surrounds an old military base camp (Frelimo). The edge of the camp is still visible by the trenches and embankments constructed, which surround the camp. The minefield is probably situated on the outside of this embankment. The camp was used until 1992. There is a high level of metal contamination. The area is also very flat. The military camp deviates from the surrounding area. Along both sides of the entrance road to Bandua a plantation with rows of cashew nuts mixed with coconut trees is found. Also rice is grown between the trees. This pattern stops near the former base camp at the edge of the village. It could have been possible that this plantation continued up to the village prior to the construction of the military camp. The suspected minefield transformed into a dense bush – shrub – grass vegetation cover strongly contrasting in use with the surrounding area.
6.2.1.4 Mameme This area was used as an old Frelimo camp near Mameme, about 55 km. from Tete airport. The site is high on the priority list for mine clearance as an accident was reported, killing 2 children and wounding another one when playing with an AP mine (PMD-6) found in the area. The site was mined to prevent access to the military camp. No detailed level 2 survey has been executed to determine the precise boundary of the minefield. The minefield is believed to form a half circle surrounding the camp. The

Standoff minefield detection in Africa
123
present area cleared is two metres off the road. Frelimo mostly used Russian types of mines such as the PMD-6 (box mine), PMN and POMZ-2. Also UXO’s are believed to be present in this area. The place is full with old equipment, metal contamination, etc. The remainders of the camp buildings can be identified at a distance of about 150 metres from the road. The area is affected by burning, it is half-open terrain and spacing between the trees is generally more than 10 metres. Patches with very dense grass (dry) up to 50 cm. high occur. There are many stones, up to very big core boulders of more than 1 metre in diameter. The terrain is flat, internal relief is less than a few metres. This vegetation and terrain type is typical for large areas of central Mozambique.
6.2.1.5 Songo The Songo minefield can be regarded as a defensive minefield. The purpose was to protect the village, the dam and the hydro-electricity power plant constructed. The Portuguese constructed the minefield from 1968 till 1970 and from 1975 onward Frelimo continued to lay mines in the minefield till the end of the war. The minefield was patrolled daily and if access paths were seen, new mines were laid. Some general sketch maps are available based on local information (see also Appendix 1, enlargement 5). It was also stated that a number of accidents have happened (NPA, 1995). A cleared section visited in the field showed several alignments of AP mines with a density of a mine per square metre. The width of the minefield differs from approximately ten to twenty metres to about 80 metres. A level 2 survey has not yet determined the remaining layout of the non-cleared minefield. In the recently cleared area, the positions of the individual mines have been indicated by markers, which show the high density (see white pained sticks on figure 6.2). Most of the minefield fencing has been removed over time. At the edge of the minefield some short metal posts are still visible, extending about 20 cm. above the ground. Only detailed field observations show these indicators of the minefield perimeter. All of the mines found so far are AP mines such as the AUPS, with and without metal fragmentation sleeves. The PRB 35 BG mines are placed with the detonator down (figure 6.2). All PRB’s found have a metal ring below them, with a diameter of 8 cm. The mines are surface laid up to a maximum depth of 3 to 4 cm. In the area many boulders are present on the surface and on some of them mines were cemented. There are few UXO’s present, the area is furthermore contaminated with metal fragments. Prior to the airborne campaign about 10.000 AP mines have been detected and cleared. Some of the valleys and riverbeds were re-surveyed after clearance, but due to the displacement of mines during the rainy season of mined areas within the catchment area, mines were still found. Dog detection was used for the survey of the riverbeds as these are important places were people go to collect water during the dry season (intermitted drainage, people make hand dug shallow wells). Important additional information for mine surveys is the estimated degree of erosion, which could indicate displacement or accumulation of sediments (that could indicate depth to mines) as well as some idea about the catchment areas where the minefield is situated to

Chapter 6
124
determine the possible spread of displaced mines. This morpho-dynamic mapping can be accomplished as well using the remote sensing survey data collected during this study, but is not the focus of current research. Figure 6.2: AP mines used and section of the minefield showing density of detected mines.
The area marks the mountain front. As the minefield is reported to be very long, all types of terrain configuration can be found, moderate undulating terrain along the main valleys to very steep sloping areas up in the mountains.
6.3 The airborne campaign in Mozambique During the preparation stage amongst other activities, the export licences for the equipment were requested. For the CA 860 no licence could be obtained in time from the US State Department, and therefore this sensor could not be mobilized. The other sensors selected (two Leica RC 30 cameras, equipped with forward motion compensation, stabilized mount and different types of high resolution lenses and film emulsions and at later stage also the ZEO FLIR) were shipped to South Africa (Rand Airport, Johannesburg) as well as the other equipment (CCNS, OMNISTAR, flight planning software, portable computers, kinematic GPS systems, ApplAnix POS/DG, etc.). The aircraft was mobilized from Luxembourg and all equipment was integrated into the platform in Johannesburg. A ground team collected the necessary data needed for final flight planning as well as placing a number of ground markers in a safe area for instrument calibration (in order to determine the difference in alignment angles between the sensor and the Inertial Measurement Unit). The accurate positions computed of the aircraft during the moment of exposure together with the attitude information at a later stage were needed for high precision digital colour orthophoto map production without further ground verification / additional measurements of ground control points. The geodetic team operated one test area ahead of the airborne campaign. Some of the measurements were also used for last minute changes in the flight planning. The adapted flight plans were stored on data cards, which could be inserted into the CCNS onboard of the aircraft, which was linked to the Omnistar for accurate sub-metre real time positional accuracy for flight navigation by the pilots. During the airborne campaign small scale colour aerial photographs (1:20.000) were taken to facilitate the orthophoto map production. Furthermore large scale (1:500, 1:2.000 and 1:3.000) colour and colour infrared stereo aerial photography was taken for (visual)
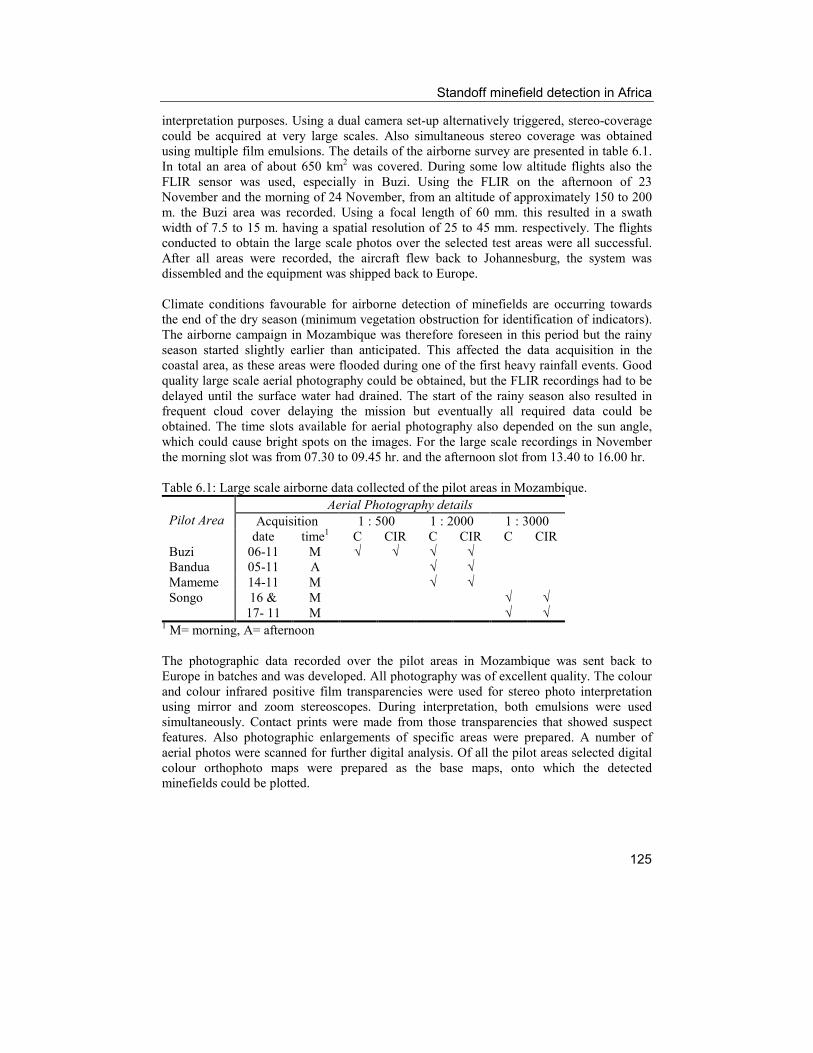
Standoff minefield detection in Africa
125
interpretation purposes. Using a dual camera set-up alternatively triggered, stereo-coverage could be acquired at very large scales. Also simultaneous stereo coverage was obtained using multiple film emulsions. The details of the airborne survey are presented in table 6.1. In total an area of about 650 km2 was covered. During some low altitude flights also the FLIR sensor was used, especially in Buzi. Using the FLIR on the afternoon of 23 November and the morning of 24 November, from an altitude of approximately 150 to 200 m. the Buzi area was recorded. Using a focal length of 60 mm. this resulted in a swath width of 7.5 to 15 m. having a spatial resolution of 25 to 45 mm. respectively. The flights conducted to obtain the large scale photos over the selected test areas were all successful. After all areas were recorded, the aircraft flew back to Johannesburg, the system was dissembled and the equipment was shipped back to Europe. Climate conditions favourable for airborne detection of minefields are occurring towards the end of the dry season (minimum vegetation obstruction for identification of indicators). The airborne campaign in Mozambique was therefore foreseen in this period but the rainy season started slightly earlier than anticipated. This affected the data acquisition in the coastal area, as these areas were flooded during one of the first heavy rainfall events. Good quality large scale aerial photography could be obtained, but the FLIR recordings had to be delayed until the surface water had drained. The start of the rainy season also resulted in frequent cloud cover delaying the mission but eventually all required data could be obtained. The time slots available for aerial photography also depended on the sun angle, which could cause bright spots on the images. For the large scale recordings in November the morning slot was from 07.30 to 09.45 hr. and the afternoon slot from 13.40 to 16.00 hr. Table 6.1: Large scale airborne data collected of the pilot areas in Mozambique.
Aerial Photography details Acquisition 1 : 500 1 : 2000 1 : 3000
Pilot Area
date time1 C CIR C CIR C CIR Buzi 06-11 M √ √ √ √ Bandua 05-11 A √ √ Mameme 14-11 M √ √ Songo 16 &
17- 11 M M
√ √
√ √
1 M= morning, A= afternoon The photographic data recorded over the pilot areas in Mozambique was sent back to Europe in batches and was developed. All photography was of excellent quality. The colour and colour infrared positive film transparencies were used for stereo photo interpretation using mirror and zoom stereoscopes. During interpretation, both emulsions were used simultaneously. Contact prints were made from those transparencies that showed suspect features. Also photographic enlargements of specific areas were prepared. A number of aerial photos were scanned for further digital analysis. Of all the pilot areas selected digital colour orthophoto maps were prepared as the base maps, onto which the detected minefields could be plotted.

Chapter 6
126
6.4 Image interpretation and analysis of the Mozambique test areas
6.4.1 Introduction Given the scale of the images acquired, detection of minefields through direct identification of landmines, especially AP mines, is impossible. The identification of minefields and its boundary is linked to the occurrence of minefield related indicators. Through fieldwork and discussions with relevant demining organizations, a study of level 1 and 2 survey reports, an extensive list of indicators (see also table 3.1) was obtained relevant to the occurrence of minefields. During the analysis phase of the airborne data special attention was given to the identification of these indicators.
6.4.2 Buzi For this minefield a level 1 survey form was available providing a general sketch map with the layout of this minefield for reference purposes. The whole area was systematically covered with 1:2000 scale aerial photography using colour and colour infrared emulsions acquired with a suitable overlap. For some selected runs data was recorded at extreme large scale (1:500) using a different emulsion for each of the two cameras resulting in gaps of the coverage. For stereo recording multiple runs had to be flown but this was not attempted. For the FLIR data acquired these runs were recorded once more. From the analysis of the large scale aerial photographs, both the colour as well as the CIR, the layout of the minefield could be established quickly due to the presence of the upright positioned railway tracks marking the perimeter of the minefield. Other indicators used for identification of the minefield are (see also figure 6.3 and enlargement 4 in Appendix 1):
• Differences in land use, the minefield is not used as arable land, although it has an agricultural potential;
• Detection of straight elongated stretches of unused land with angular bends; • Access to the area restricted by gates, position of the gates coinciding with
minefield alignment, gates along main access routes but also along foot paths; • Strange change of direction / bends of footpaths, tracks, dirt roads and
bypasses; • Overall layout of the minefield, acting a defensive barrier protecting
important industry, a small harbour, airstrip and the living quarters of the employed estate workers.
More detailed analysis using the aerial photographs shows other indicators such as:
• Where safe footpaths through the minefield occur these are marked by the top of railway tracks being painted white, and with aligned white painted stones;
• At a number of places between the railway tracks steel wires are still present, further reinforcing the fencing system.

Standoff minefield detection in Africa
127
Figure 6.3: Colour and CIR large scale aerial photo Buzi minefield showing a number of minefield indicators.
Using the extremely large scale photography it was tried to identify the location of individual mines in this minefield, also because of the possible use of non-directional fragmentation mines appearing above the surface combined with the possibility to detect trip wires. The detailed analysis of the images did not reveal the presence of the POMZ, nor could tripwires be identified. Due to the age of the minefield, the stakes of these mines may have deteriorated and therefore the mine is not placed in its upright position anymore. Also tripwires could not be identified. In some sections of the minefield, especially where the vegetation was recently burned, a pattern of soil modifications could be established, that might indicate the location of buried AP blast mines. At some locations also colour differences are related to these disturbances. During subsequent fieldwork these areas were surveyed in detail but landmine presence was not related to these soil disturbances, which in fact were small depressions. Making use of indirect indicators (elongated stretches of land and regular occurrence of poles marking the edge of the minefield) image segmentation routines developed could be applied successfully and through automatic extraction of these indicators the minefield perimeter could also be determined (Yvinec et al, 1999 and Katarzis et al, 1999). For visual interpretation, the 1:2000 scale images provided sufficient detail to map the minefield. Thermal morning data (3-5 µm) acquired on videotape was copied onto digital tape / recorder. A number of frames were selected for further analysis. Figure 6.4 shows a mosaic of two frames taken on 24-11-’98 at 07.41 hrs. The difference in land use is clearly reflected in the thermal recording. The short vegetation adjacent the minefield is warmer

Chapter 6
128
Figure 6.4: ZEO FLIR recording Buzi compared to the longer grasses inside the minefield (morning dew). Some bare (relatively warm) patches appear whited toned as well as a footpath adjacent the eastern stretch of the minefield. The darker toned spots reflect the wet conditions during which the recordings were taken and therefore optimum results could not be expected from the thermal sensor. The railway tracks can only vaguely be detected due to the relatively coarse resolution (4 to 5 cm) during data recording. Given this resolution and the fact that the AP mines have been buried for a long time also no direct presence of individual landmines could be established using the MFLIR data.
Due to airport regulations no flights could be conducted late in the evening and early in the morning and therefore possible thermal inertia properties of mine locations could not be studied in detail. Fusion of the thermal data and the large scale colour and CIR aerial photo’s did not provide additional information for visual interpretation due to the resolution differences of the thermal images compared to the optical data. The total length of the minefield identified on the southern side of the Buzi river is 3.5 km. The minefield perimeter could be mapped over its total extent using the indirect indicators discussed above. Further details are given in Appendix 1, enlargement 4.
6.4.3 Bandua According to the level 1 and 2 survey reports, surrounding military or police camps, by the deployment of landmines for protection against enemy forces is a regular phenomenon. In this respect it is important that through the analysis of the images, the camp area can be identified, as well as its perimeter (as outside of this area landmines are to be expected). In the case of Bandua the campsite could be established through the detection of a number of indicators, such as the occurrence of watchtowers and trenches in a zigzag pattern (figure 6.5). More detailed analysis also revealed the position of the embankment surrounding the camp. Usually these types of camps have a controlled access at the entrance, made up of a typical embankment pattern. Within the camp, an area can be identified mainly free of trees and shrubs probably representing the former exercise and drilling grounds given the presence of the trenches. Due to these activities the area may be contaminated with UXO’s. Further

Standoff minefield detection in Africa
129
towards the north, partly protected by a V-shaped embankment, some smaller areas can be seen free of taller trees. These might be the areas where the accommodation was situated. Figure 6.5: Frelimo camp Bandua
Outside of the embankment a dense vegetation cover can be observed strongly contrasting with the surrounding area. No tracks or footpaths can be observed leading into this area. On the eastern perimeter, the village starts and at the southern edge, agricultural activities can be observed. Given the normal mine laying practices at these sites, the suspect area coincides with the area covered by the dense vegetation. The whole eastern portion of the area given in figure 6.5 shows signs of continuous use apart from the area adjacent to the camp embankment. Because of its dense cover, no further analysis is possible using the optical data collected.
Camp entrance
Trenches

Chapter 6
130
6.4.4 Mameme This area was first detected by the typical pattern of the entrance to the camp, depicted by the embankment. This embankment can be followed for a few hundred metres in both directions leading towards the road. Within this embankment a large number of foxholes are present as well as remnants of (military) vehicles, equipment and also the remnants of the base camp are visible (figure 6.6). Figure 6.6: Suspect area Mameme
At the southwestern egde, outside of the embankment, a large slit trench is visible. The appearance of this camp is different from the one in Bandua. The main similarity is the use of the embankment. It is therefore logical that the mine deployment method is identical as described before, namely outside of the embankment. Detailed analysis of this area did not reveal major soil disturbances and a clear identification of the minefield was not possible.
Trench
Entrance
Base camp

Standoff minefield detection in Africa
131
6.4.5 Songo To determine the perimeter of the minefield, use was made of a number of direct and indirect minefield related indicators. In order to construct such a defensive minefield many modifications to the natural terrain had to be made. One of these modifications which is clearly depicted on the airborne data recorded is the construction of a road, necessary for access to the minefield during the preparation phase as well as for later maintenance and patrolling. The road can be detected on the airborne images along most of the suspect area except for a small section in the eastern part of the minefield leading towards the Zambezi river. Here only a track – footpath is still visible. Figure 6.7: Direct minefield indicator, fencing system
Figure 6.7 shows a section of the road. Along the road an alignment of upright standing poles at regular interval is still visible marking the perimeter of the minefield. This clear demarcation of the minefield perimeter has been removed along other sections of this minefield. Therefore other indirect indicators had to be used to identify the full extent of the minefield. Figure 6.8 depicts a number of these indirect indicators that have shown to be related to the occurrence of this minefield. These indicators are related to the construction, patrolling and maintenance phases of the minefield as well as to changes to the local environment over time because of its presence. Because at some places the minefield crosses suitable arable lands and the local population is using the areas adjacent the minefield, the suspect area can be identified clearly by its change in land use (figure 6.8-A, see also enlargement 5 in Appendix 1). The minefield runs in between two villages and although trees are available for the collection of firewood at close proximity, the local population refrains from its use. The dried grass (image acquired at the end of the dry season) strongly contrasts with the arable land next to it as well. Figure 6.8-B shows a section of a tarmac road running parallel to the minefield. Where the road crosses the intermitted stream, the bridge is gone, making the road useless for transportation. Furthermore no bifurcation can be found near the stream indicating that cars

Chapter 6
132
would pass through this area. A small footpath can be seen leading through the riverbed where one enters the suspect area. Furthermore, the land use provides another indication. North of the road, the area is agriculturally used as well as further south of the road. The section running parallel to the road is left idle. Figure 6.8: Indirect minefield indicators
C: Soil disturbances perpendicular to road D: Regular occurrence of non-used housing The soil disturbances made during minefield construction are another important indirect indicator, as these are still visible even after 30 years. Before the landmines could be deployed the ground was prepared at a large number of places using a bulldozer or grader. Their impact can be seen as linear features running perpendicular to the road (Fig. 6.8-C). Also in a number of places, the bulldozer tracks can be seen running parallel to the road. Especially on the steeper terrain sections, stones have been piled up adjacent to the disturbed area, probably to prevent erosion after preparation of the terrain. In a number of places, due to these extensive ground works, the tree density is less compared to the surrounding area. All in all, these terrain modifications result in a different pattern, adjacent to the road, that can be clearly distinguished in numerous places and can be seen on the other images given in figure 6.7 and figure 6.8 as well. Another indicator that can be used to confirm the occurrence of the minefield is related to the regular patrolling and maintenance activities. To accommodate the people responsible, camps have been constructed at regular intervals along the minefield. The building material
A: Land use changes B: Tarmac road not used any longer

Standoff minefield detection in Africa
133
used and the layout of these quarters differs considerably from the standard type of houses found in the area (figure 6.8-D). In front of these buildings a kind of drill and exercise yard can be observed as well, revealing its military character. Not all these indicators are visible throughout the minefield. It is through the use of the natural terrain configuration, in combination with the road that the places where these indicators appear can be connected to determine the total extent of the minefield. In this way the minefield running east, south and the western extension could be identified. At some places the minefield perimeter was difficult to determine and therefore more possible alignments were mapped. The total length of the minefield extension identified, not previously surveyed or cleared, using the acquired remote sensing data is approximately 20 km. For about 1.5 km. the minefield perimeter situated east of Songo could not be accurately established resulting in two alternative locations of the minefield being mapped. Approaching the Zambezi river the indicators were less prominent. Therefore in this area about 2 km. was classified as a possible minefield extension. Along the Zambezi river, the end of this extension coincides with a foxhole and the suspect area identified runs parallel to a bush path leading there. For the remainder of the minefield, the use of multiple indirect indicators allowed for the detection of the minefield perimeter. The maps prepared have been provided to the National Demining Commission, NPA and the United Nations Accelerated Demining Program in Mozambique. Due to the dimensions of these maps it is not possible to provide them here, further reference on the layout of this minefield is provided in Appendix 1, enlargement 5.
6.5 Discussion on the airborne image analysis results obtained The interpretation of the airborne imagery was subject to selected field validation. The four selected pilot areas were all visited and where possible, the on-site interpretations were used to check the accuracy of the minefield boundary as mapped from the remote sensing data. For the Buzi minefield, the boundary was validated at a number of places and proved to be very accurate. The identification of individual mines was not successful. The indirect indicators like those used during the Belgium test (e.g. soil and vegetation disturbances) have deteriorated over time and could not be identified any longer. Soil disturbances could be detected but selected mine clearance activities by NPA showed that these were not related to the presence of landmines. Approaching the Buzi river, within the recent Buzi floodplain, the minefield markers were not any longer visible. A continuation of the minefield has been mapped using the remote sensing data but was classified as a possible extension of the minefield for approximately 50 metres as no field verification has been made. In the Bandua minefield, demining activities have taken place. These are visible on the map of the campsite, shown by its rectangular pattern. In the northern part landmines were found mainly outside of the embankment. The southern portion outside the embankment was not cleared during the time when the field survey was conducted, but is almost certainly mine affected, given the fact that during clearing for agricultural purposes, landmines were found in a few places south of the densely vegetated area.

Chapter 6
134
Using the optical data collected, no further evidence could be established for landmine presence apart from the fact that the local population does not use it and no footpaths are passing through the area, although a village is at close proximity. Identification of the campsite perimeter could be accomplished through stereoscopic interpretation. The trenches indicate the military use of the central terrain within the camp. The remnants of the watchtower near the main entrance further confirm its military nature. For Mameme the indicators for the presence of the minefield are again from ancillary information related to normal operational procedures by Frelimo. The embankment marking the edge of the camp could be accurately identified, as well as the entrance. The presence of remnants of all types of machinery and other equipment are clearly contrasting with the surrounding areas and the combination of these indicators, together with the presence of foxholes reveals the military character of the site. During the selected field validation mission, a level 3 survey was under way by NPA. The boundary of the minefield expected by their staff, given by the markers placed in the field, coincided with the interpretation made from the remote sensing data. For the Songo area, further demining activities were conducted. In a newly cleared section of the minefield (after the airborne data was collected) the minefield perimeter was accurately mapped at a few selected locations. The remainder of the minefield could not be validated but given the strong evidence of all direct and indirect minefield related evidences found, especially the western extension of the minefield is believed to be identified correctly. Given the large extent of this minefield, further demining activities will confirm over time if the indicators used relate to the correct perimeter of the remaining minefield as mapped from the remote sensing data. The large scale aerial photographs collected during the airborne campaign allowed for the identification of minefield related input, process and impact indicators. Outcome indicators, revealing changes over time could not be incorporated in this analysis but the heavy ground works conducted for minefield construction still left many traces that could still be identified after 30 years. The use of colour and colour infrared emulsions together during visual interpretation enhanced the man-made modifications in the natural terrain. The scale used showed sufficient details to detect a large number of indicators. The minefield continuation could not exactly be determined in a number of places because the indirect indicators could not be identified. For these sections, the perimeter of the minefield was inferred from the natural terrain conditions and the alignment of the minefield parallel to the access road. Knowing that the road proved to be a good indicator, even smaller scale images can be used to detect the minefield (obtained by satellite). Because of the long period of civil war in Mozambique airborne remote sensing data is not available for large parts of the country, not even at smaller scales (commonly flown for map making – updating purposes). Due to this, a special airborne campaign mission had to be organized. If medium to large scale images would have been available these could have been used as well.

Standoff minefield detection in Africa
135
The image interpretation could be completed relatively quickly. During a first general inspection possible input indicators were used to look for places that needed a more detailed image analysis to reveal general impact indicators. Once these indicators were established, the main effort was directed towards the identification of the direct minefield related indicators, in order to establish the minefield perimeter. In summary, for two of the four pilot areas, namely Buzi and Songo, the presence of direct and indirect indicators allowed for the precise identification of the minefield perimeter over a total length of about 25 km, mainly in inaccessible terrain. For the two other areas, Bandua and Mameme, the exact minefield perimeter could not be established, but the use of airborne images allowed for the identification of the military character and therefore determine these areas as “suspect areas”. Orthophoto maps prepared within the Airborne Minefield Detection Pilot Project show the full extent of the minefields identified. Table 6.2 shows a comparison with the data locally available prior to this survey for the pilot areas selected. Appendix 1 (enlargements 4 and 5) provides further details for the Buzi and Songo minefields identified. Table 6.2: Comparison of results with survey reports.
Area Type of survey conducted
Sketch map available
Comparison with results Airborne Minefield Detection Pilot Project
Buzi Level 1 yes Minefield identified deviates with map of Level 1 survey report (see Appendix 1)
Bandua Level 1 – 3* no Only GPS coordinate Mameme Level 1 – 3* no Only GPS coordinate Songo Level 1 – 3* yes Minefield identified deviates with map of
Level 1 survey report (see Appendix 1) * Level 3 survey was or had been conducted for sections of the minefields during execution of the Airborne Minefield Detection Pilot Project. The comparison of the results show that standoff minefield detection can provide additional information to be used in a level-2 survey, especially in areas that are difficult to access such as the Songo minefield.

Chapter 6
136
6.6 Satellite data collected
6.6.1 Introduction For Mozambique multi-temporal satellite data was collected for the Songo area. As the minefield in this area is very long and crosses many different environments it is regarded to be a good test site for analysis using different types of satellite sensors. A disadvantage is that the minefield was constructed from the end of the 1960’s onward and that none of the tested satellites were operational during the initial construction period but images could be acquired when the minefield was patrolled and maintained. Another problem, related to the older satellite images is, that these are stored on computer compatible tapes, some of which have deteriorated in quality and could not be read anymore. Some portions of the border region of Zimbabwe were also analyzed by satellite data. Several types of minefields have been constructed along the border region providing different types of indicators. Combined use is made of different types of satellites, multi-temporal aerial photography and even ancillary information provided by topographical maps. Here the minefield construction started from the middle of the 1970’s and was part of the defence strategy until Zimbabwe obtained its independence in 1980. For this analysis use could be made of multi-temporal panchromatic aerial photography, which was available countrywide for at least the last half a century, flown on regular intervals for mapping purposes. Different satellite systems were selected so that most spatial and spectral combinations available on the current fleet of satellites were included. Older declassified Corona and KFA archives were also searched but unfortunately none of the test sites selected were covered by Corona images. For the analysis of the Songo minefield use was made of the results obtained by the airborne survey conducted and the high resolution aerial photos provided some sort of ground reference as only limited ancillary and ground truth information was available. For the border minefields of Zimbabwe more details were known, from minefield type descriptions, level 1 surveys up to mine clearance information. All the available background information was used during the interpretation and analysis process of the remotely sensed images obtained.
6.6.2. Mozambique pilot area For multi-temporal analysis, satellite data were selected from approximately the same season, even if a limited cloud cover existed. Images taken during the end of the dry season were preferred. The use of different satellite data allowed for image fusion to enhance specific minefield indicators. Not all satellite operators have images available in their archives during the dry season period for all of the years. To study the suitability of Radarsat a special image acquisition was requested. For validation purposes use could be made of the results from the airborne large scale image analysis. Table 6.3 provides details of the images selected after an extensive satellite image archive search. Of the KFA-1000

Standoff minefield detection in Africa
137
sensor geo-coded black and white photographic prints were obtained at a scale of 1:25.000 covering most of the Songo area. Table 6.3: Satellite data selected for the Songo region, NW Mozambique
Satellite Instrument Index1 Date (d-m-y) Cloud cover Quality Landsat 1 MSS 181-071 04-09-1973 Outside AOI Good Landsat 2 MSS 181-071 31-08-1977 no Good Landsat 5 MSS 169-071 19-10-1989 no Good Landsat 5 TM 169-071 03-09-1984 no Good Landsat 5 TM 169-071 09-09-1986 no Good Landsat 5 TM 169-071 04-09-1990 no Good Landsat 5 TM 169-071 09-09-1992 no Good Landsat 5 TM 169-071 02-09-1995 no Good SPOT 1 HRV 1X 137-381 17-08-1986 no Good SPOT 4 HRVIR 1 137-381 02-09-1999 < 5 % Good SPOT 1 HRV 1P 137-381 26-08-1992 no Good SPOT 2 HRV 1P 137-381 09-07-1995 no Good Radarsat 1 Path Image
SAR fine 4 near beam, ascending
M0193279 20-08-1999 N/A Good
KFA
1000 1401- 21075
21-08-1979 no Good
1 For the KFA-1000 film and frame number are specified respectively
6.6.3 Zimbabwe border areas To evaluate if the findings of the Songo area were representative, other defensive minefields were selected. For two selected areas along the border region of Zimbabwe satellite data and multi-temporal aerial photography could be obtained prior, during and after construction of the minefields. Validation of the results was possible using a minefield map indicating the location of these border minefields. Table 6.4 and 6.5 provide the details on the satellite images acquired as well as the multi-temporal panchromatic aerial photography. Table 6.4: Satellite data acquired of the border region of Zimbabwe.
Satellite Instrument Index1 Area Date (d-m-y) Cloud cover
Quality
Landsat TM 170-071 NE 16-09-1992 0 Good Landsat TM 168-073 Mutare 10-10-1994 0 Good SPOT HVR 139-388 Mutare 09-05-1992 0 Good KFA (film-frame)
1000 1399-21693 1401-20933
NE 20 & 21-08-1979
0 Good
1 For the KFA-1000 film and frame number are specified respectively The multi-temporal panchromatic aerial photography obtained of the selected Zimbabwe border areas were acquired in Harare. As the photography was flown for other purposes, the

Chapter 6
138
scale was pre-determined (1: 25.000). Also the season in which some of the data was recorded is not the most suitable time for minefield indicator detection. However, one advantage was that the data was recorded with a forward overlap of 60 percent, allowing stereoscopic interpretation. The contact prints obtained have an acceptable image quality. Table 6.5: Multi-temporal panchromatic aerial photography acquired of the border region of Zimbabwe.
Scale Emulsion Area Dates (d-m-y) 1:25.000 Pan NE 20-04-‘74, 21-04-‘74, 20-05-’74, 21-11-’74 1:25.000 Pan NE 11-06-’81, 21-07-‘81 1:25.000 Pan NE 06-07-’90, 16-08-’89, 18-10-‘89 1:25.000 Pan Mutare 1968 1 1:25.000 Pan Mutare 1974 and Sept. 1975 1 1:25.000 Pan Mutare 23-07- ‘81
1 Month and / or day not known
6.7 Space borne data analysis
6.7.1 Introduction During the data analysis process care should be taken to confirm that the developments over time are related to the presence of minefields and not due to other “normal” circumstances, e.g. local burning of the vegetation during the end of the dry season to improve the soil fertility for the next cropping cycle (which is customary practice in the region). It is therefore important to have a general background on the normal agricultural practices, cropping patterns, type(s) of natural vegetation, hydrological and climatological conditions, etc. of the area of interest (AIO) at the time the satellite image is acquired. Although the images can date back to the 1970’s these general agricultural practices and climatological circumstances have not changed much over this time period. On the other hand, changes over time expected as a result of the conflict can be identified as well. Ancillary information in this respect is very important. For the northwestern part of Mozambique hardly any additional spatial information is available apart from some small scale topographic, geological and soil maps. Only through the use of remote sensing images an unbiased idea could be obtained of the existing situation during that time. Some reports were obtained describing the developments of the construction of the Cahora Bassa dam in the Zambezi river and its impact on the environment as well as some scarce reporting on the guerrilla warfare in the region. Some important general developments in this respect are given below. The expansion of Frelimo in the late 1960’s from its strongholds in Tanzania to the province of Tete represented a major drawback for the Portuguese colonialists and they launched a counteroffensive “Operation Gordian Knot” in 1970, making use of napalm and “scorched earth” counterinsurgency tactics. The rural people were forcibly relocated to tightly controlled strategic settlements (Human Rights Watch, 1994).

Standoff minefield detection in Africa
139
After independence, Frelimo promoted large state farms and estates (abandoned by the Portuguese) through massive investments and neglected the small farming practices producing for the local food market. Furthermore, they started a compulsory “communal village” program. A major consequence of these activities was the sharp decline in agricultural output resulting in a food crisis of near famine proportions. These policies gradually changed in the 1980’s (Morgan, 1990). In a reaction to the increased presence of the guerrilla’s opening a new front in Tete province and to secure the Cahora Bassa dam construction site as well as to protect Songo village from Frelimo attacks, the Portuguese laid a minefield surrounding the entire area between 1968 and 1970. From independence onwards Frelimo maintained the minefield (NPA, 1995). Further details have been presented before. On the 4th of December 1974 the Cahora Bassa dam closed the gorge through which the Zambezi is flowing and a massive reservoir began to fill, barely six months before Mozambique’s independence. Frelimo saw this Portuguese financed project as a symbol and instrument of domination of the people of Mozambique and at independence the investment was “safeguarded” by an administrative arrangement placing the dam under the control of a Portuguese company. Due to this impact people had to be relocated. People in the lower Zambezi basin were forcibly evicted as part of a larger displacement of people to protected or strategic villages. In a period of about two years, up to the end of 1973 about 200.000 people were moved (Bolton, 1986). Apart from the tremendous changes originating from the Cahora Bassa dam operation more gradual changes are likely to have occurred due to the relocation of the rural population. It can be assumed that most people were evicted nearer to the dam site. This will have resulted in e.g. a regeneration of their arable lands. Furthermore due to its storage capacity, the water table of the reservoir is fluctuating remarkably during the year, resulting in changes along the shoreline. The process of change detection needs to incorporate these aspects, otherwise no meaningful change is observed. For Zimbabwe more detailed ancillary information is available and will be presented later.
6.7.2 Satellite based change detection analysis for the detection of minefield indicators, Songo The problem faced using the satellite data collected was to determine the changes related to the construction of the minefield and not those due to e.g. satellite sensor differences or atmospheric conditions. Furthermore, indicators that can be used to determine the layout of the minefield should be visible spatially and spectrally. Another problem to be solved is related to differences between the satellite systems used, due to e.g. their spatial resolution inaccuracies, results from image co-registration, and resampling to other pixelsize dimensions. This results in other DN values in the new co-registered images. Because of this multi-date images were collected from each of the satellites used so that no pixels had to be resampled in size, only image co-registration was required using a nearest neighbourhood procedure. From the change analysis conducted on each of the sensor
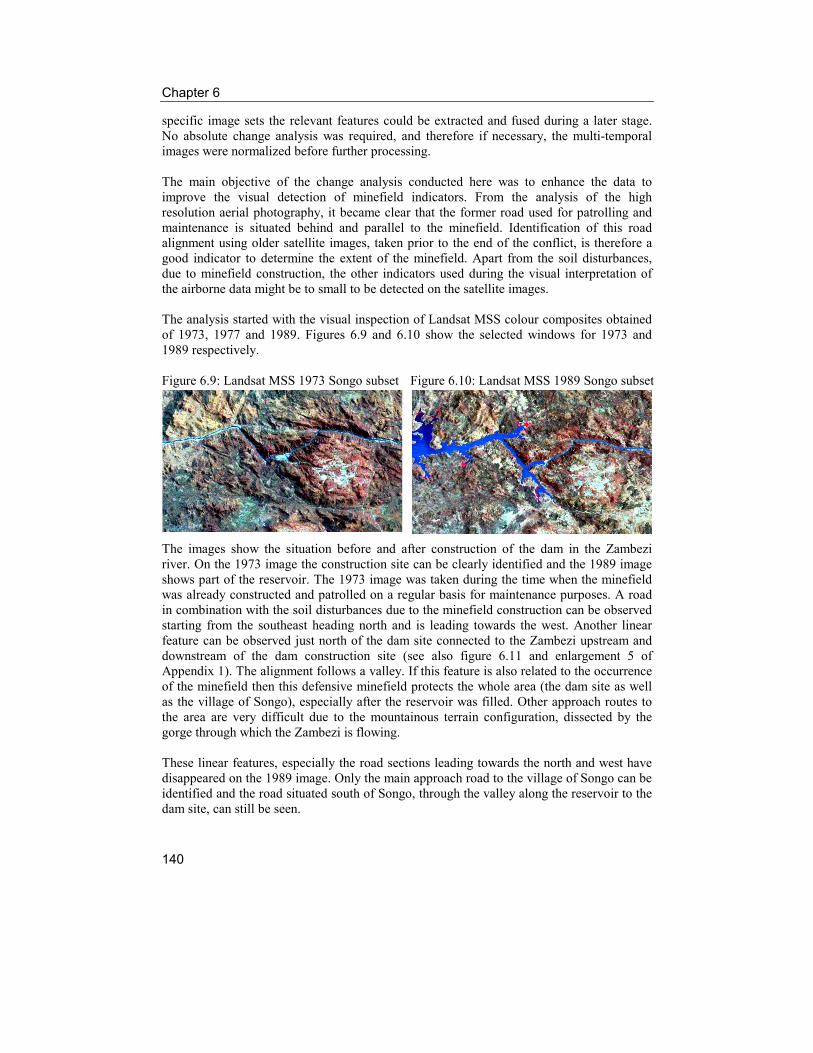
Chapter 6
140
specific image sets the relevant features could be extracted and fused during a later stage. No absolute change analysis was required, and therefore if necessary, the multi-temporal images were normalized before further processing. The main objective of the change analysis conducted here was to enhance the data to improve the visual detection of minefield indicators. From the analysis of the high resolution aerial photography, it became clear that the former road used for patrolling and maintenance is situated behind and parallel to the minefield. Identification of this road alignment using older satellite images, taken prior to the end of the conflict, is therefore a good indicator to determine the extent of the minefield. Apart from the soil disturbances, due to minefield construction, the other indicators used during the visual interpretation of the airborne data might be to small to be detected on the satellite images. The analysis started with the visual inspection of Landsat MSS colour composites obtained of 1973, 1977 and 1989. Figures 6.9 and 6.10 show the selected windows for 1973 and 1989 respectively. Figure 6.9: Landsat MSS 1973 Songo subset Figure 6.10: Landsat MSS 1989 Songo subset
The images show the situation before and after construction of the dam in the Zambezi river. On the 1973 image the construction site can be clearly identified and the 1989 image shows part of the reservoir. The 1973 image was taken during the time when the minefield was already constructed and patrolled on a regular basis for maintenance purposes. A road in combination with the soil disturbances due to the minefield construction can be observed starting from the southeast heading north and is leading towards the west. Another linear feature can be observed just north of the dam site connected to the Zambezi upstream and downstream of the dam construction site (see also figure 6.11 and enlargement 5 of Appendix 1). The alignment follows a valley. If this feature is also related to the occurrence of the minefield then this defensive minefield protects the whole area (the dam site as well as the village of Songo), especially after the reservoir was filled. Other approach routes to the area are very difficult due to the mountainous terrain configuration, dissected by the gorge through which the Zambezi is flowing. These linear features, especially the road sections leading towards the north and west have disappeared on the 1989 image. Only the main approach road to the village of Songo can be identified and the road situated south of Songo, through the valley along the reservoir to the dam site, can still be seen.
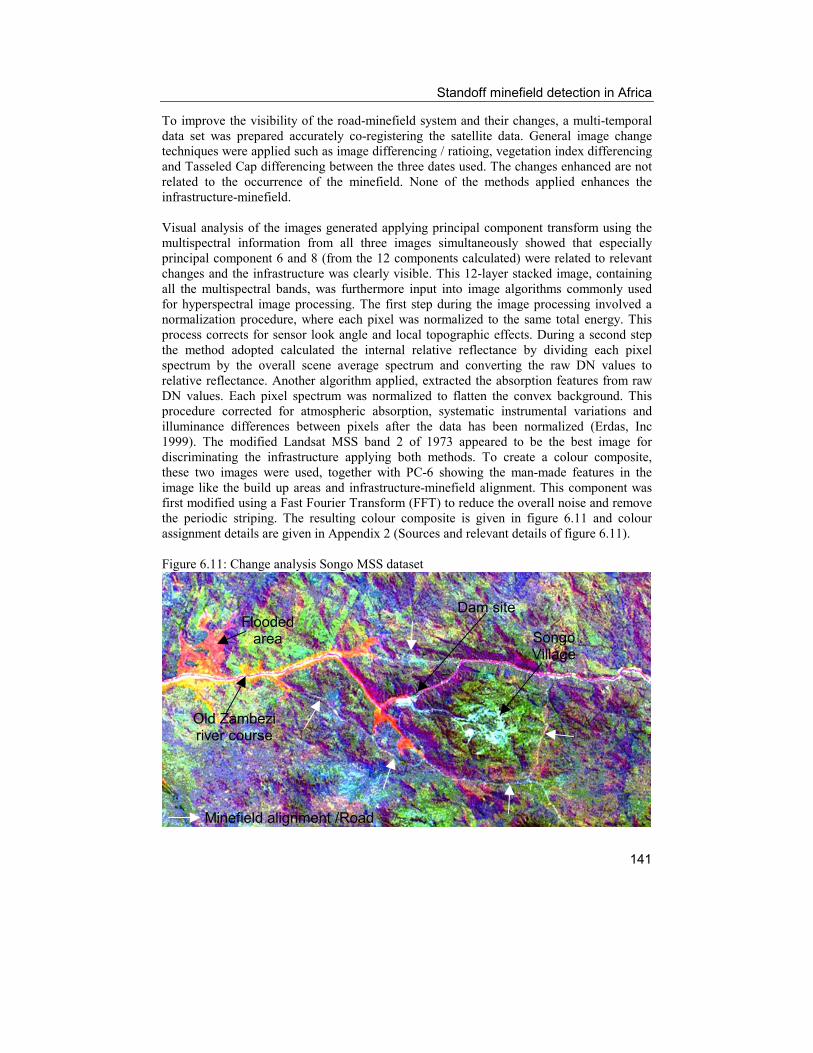
Standoff minefield detection in Africa
141
To improve the visibility of the road-minefield system and their changes, a multi-temporal data set was prepared accurately co-registering the satellite data. General image change techniques were applied such as image differencing / ratioing, vegetation index differencing and Tasseled Cap differencing between the three dates used. The changes enhanced are not related to the occurrence of the minefield. None of the methods applied enhances the infrastructure-minefield. Visual analysis of the images generated applying principal component transform using the multispectral information from all three images simultaneously showed that especially principal component 6 and 8 (from the 12 components calculated) were related to relevant changes and the infrastructure was clearly visible. This 12-layer stacked image, containing all the multispectral bands, was furthermore input into image algorithms commonly used for hyperspectral image processing. The first step during the image processing involved a normalization procedure, where each pixel was normalized to the same total energy. This process corrects for sensor look angle and local topographic effects. During a second step the method adopted calculated the internal relative reflectance by dividing each pixel spectrum by the overall scene average spectrum and converting the raw DN values to relative reflectance. Another algorithm applied, extracted the absorption features from raw DN values. Each pixel spectrum was normalized to flatten the convex background. This procedure corrected for atmospheric absorption, systematic instrumental variations and illuminance differences between pixels after the data has been normalized (Erdas, Inc 1999). The modified Landsat MSS band 2 of 1973 appeared to be the best image for discriminating the infrastructure applying both methods. To create a colour composite, these two images were used, together with PC-6 showing the man-made features in the image like the build up areas and infrastructure-minefield alignment. This component was first modified using a Fast Fourier Transform (FFT) to reduce the overall noise and remove the periodic striping. The resulting colour composite is given in figure 6.11 and colour assignment details are given in Appendix 2 (Sources and relevant details of figure 6.11). Figure 6.11: Change analysis Songo MSS dataset
Minefield alignment /Road
Songo Village
Old Zambezi river course
Flooded area
Dam site

Chapter 6
142
This image clearly incorporates the changes that have occurred in the area over time as can be seen in the Cahora Bassa reservoir still displaying the old Zambezi river course. Furthermore the infrastructure-minefield alignment, the dam site and Songo village are clearly displayed. Also the linear feature north of the dam is clearly visible as well. Using the photographic enlargements of the KFA-1000 the road can be seen clearly. Also parallel to the road an elongated stretch of modified terrain is visible representing the soil modifications necessary for minefield construction. This linear stretch can be observed for nearly the entire length of the minefield. Figure 6.12 shows a section of the western portion of the minefield. Other linear features are also seen. Some represented electricity pylons, as they are narrow and straight and are not following natural terrain topography. Figure 6.12: KFA image western part of the minefield.
The Landsat TM image of 1984 was fused with the higher spatial resolution KFA image to use the improved spectral resolution of TM in combination with the higher spatial resolution of the KFA image. The area selected is north of the dam site where, on the TM image of 1984, the alignment running east west, connecting the reservoir to the Zambezi river downstream of the dam is hardly visible. For this resolution merge, the Brovey transform showed the best results. Other image fusion routines, such as the IHS transform, PCA based high resolution image substitution did not show as many image details. Figure 6.13 depicts a colour composite of Landsat TM, bands 432 (RGB).
On the left side a vague linear feature can still be identified but the full alignment leading from the reservoir to the Zambezi cannot be seen. Also, no other indications of roads or other access routes are visible. Figure 6.14 shows the result of the image fusion using bands 2, 3 and 4.
Figure 6.13: Landsat TM image of 1984

Standoff minefield detection in Africa
143
Figure 6.14: Resolution merge using Landsat TM and KFA-1000
From this resulting image, the possible minefield alignment can be clearly identified as well as roads or tracks running parallel to the suspect area. Another remarkable feature is that gullies originating from small valleys along the mountain front, stop just north of the alignment. Under normal conditions these gullies should extent but this would result in gaps in the minefield barrier. It is therefore likely that drainage control measures were applied and these are not done without a reason in such an area. Two co-registered data sets (Landsat MSS 1973 and 1989, Landsat TM 1984 and 1992) were processed using multivariate alteration detection (MAD) and maximum autocorrelation factor (MAF) analysis techniques for change detection. Nielsen (Nielsen and Conradsen, 1997) conducted the processing using dedicated software developed at their Department. Of the images generated, only the MAF combined with the MAD procedure using the two Landsat scenes provided some improved indication of the location of the infrastructure. The other images did not assist towards an improved interpretation capability of minefield related indicators. Further image interpretation and digital analysis was conducted using the multi-temporal images acquired by Landsat Thematic Mapper (TM), SPOT panchromatic and multispectral sensor as well as the microwave data recorded by Radarsat. The Landsat Thematic Mapper images acquired were used for visual interpretation of the minefield related indicators observed on the airborne images. It appeared that when visually comparing the images, the 1992 TM image shows most clearly the alignment along the infrastructure. The alignment marking the western extension of the minefield is clearly visible as well as the one north of the dam site. The older images do not show the minefield related feature so well. On the 1995 image, the alignment can also be observed, but not as clear as on the 1992 image. Although the images were all acquired during the beginning of September, fluctuations in year-to-year climatological circumstances could be a reason for the clear (brighter) appearance of the alignment in the 1992 image. However, further data to support this hypothesis is not available.

Chapter 6
144
To further enhance the minefield related indicators, the same processing as applied to the multi-temporal analysis of the MSS images described before was conducted using the 5 Landsat TM co-registered subsets of the Songo area, excluding the thermal channel. The only really suitable image found after visual inspection of the new images computed was principal component 6, which is clearly related to the infrastructure and other manmade (urban) features. The minefield alignment situated in the eastern part could not be differentiated. The multispectral SPOT image of 1986 shows the existing / used infrastructure clearly. The alignment along the infrastructure and the non-used infrastructure towards the east, west and north of the dam site is not visible. The same holds true for the 1999 image. Here, another alignment running from Songo to the southwest can be observed. This alignment is very straight and represents new electricity pylons constructed to distribute electricity generated at the hydro-power plant. Both the SPOT panchromatic images show the alignment clearly at most places and also short sections of the non-used road can be detected. In the eastern part of the minefield the alignment is not very pronounced. Existing infrastructure can be observed clearly as well. The high resolution SPOT panchromatic image of 1992 was fused with the Landsat TM image also taken in 1992, about two weeks later. Again applying the Brovey transform, using bands 2, 3 and 4 for the TM multispectral bands selected, proved to yield the best image. Incorporating the higher spatial details recorded by the panchromatic sensor improves the appearance of the minefield alignment. The spatial detail of the image obtained is comparable to figure 6.12 but co-registering in areas of major relief differences proved to be very difficult over larger areas, without incorporating a terrain model during rectification and resulted in unacceptable miss-matches, therefore small subsets were used for image fusion. A fine beam mode Radarsat image (nominal resolution 10 m.) was recorded on request to study the suitability of the microwave domain to detect minefield indicators. The image, apart from the foreshortening and layover effects due to the terrain relief, did not contribute much towards the visual identification of indicators. The land surface of the image showed a high amount of speckle, roads and other manmade features are difficult to detect apart from the dam, which acted as a corner reflector. The reservoir acted as a specular reflector resulting in a dark image tone. The high incidence angle (Fine 4 beam), combined with the wavelength used (C-band, 5.6 cm and the horizontal transmitted / horizontal received) make distinction of relevant indicators impossible. In conclusion, it can be said that the 1973 Landsat MSS image showed the minefield alignment very clearly, as the roads for minefield patrolling and maintenance in combination with the (then fresh) soil disturbances resulting from the construction of the minefield, could be detected, even given the sensor relatively poor spatial resolution. The combined use of the three MSS images clearly showed the main layout of the suspect area. The KFA-1000 image also shows the road running parallel to the minefield and the modified areas along the road could also be identified. Due to unknown reasons, only the

Standoff minefield detection in Africa
145
later Landsat TM images provide a clear indication of the minefield alignment. The SPOT panchromatic images acquired during these years also showed the alignment. Fusion of both sensors showed an improved contribution for visual interpretation. The SPOT XS and Radarsat images did not provide a major contribution towards the identification of the relevant minefield related indicators. The SPOT XS images clearly show the infrastructure and comparing these images with the older MSS or KFA images, the roads that are not longer in use can be identified and therefore, their combined use still provides an important indirect indicator. Through the use of especially the older Landsat MSS images and the KFA image the minefield alignment could be identified and corresponds to the interpretation results of the high resolution images acquired during the airborne campaign in November 1998. Even a potential extension of this minefield could be identified using the satellite images. Knowing the relevant type of indicators also lower resolution data can be used for minefield detection. The results obtained and their implications are further discussed in chapter 7. No images could be acquired prior to the construction of this minefield, therefore the historical developments especially in relation to the road and minefield construction cannot be fully analyzed. For the pilot areas in Zimbabwe, discussed next, data could be obtained prior, during and after the conflict, allowing for a more extensive analysis.

Chapter 6
146
6.7.3 Multi-temporal space and airborne image analysis
6.7.3.1 Introduction To prevent infiltration of the Zimbabwe African National Liberation Army (ZANLA) operating from e.g. Tete, Manica and Gaza provinces in Mozambique, an extensive system of border minefields was constructed (figure 5.15, minefields are in red, Blagden 1997). Figure 6.15: General location map border minefields Figure 6.16: Corsan minefield
Figure 6.17: Ploughshare minefield
In the north-east of Zimbabwe the minefields were established in areas emptied of local inhabitants following the creation of no-go areas. From the 18th of May 1973, emergency powers were announced to move the people along this border region to concentrated or protected villages, situated at least 200 km. from the border. Construction of this minefield started from May 1974 (Rupiya, 1998). To evaluate the use of multi-temporal aerospace image analysis a section of this north-east border minefield was selected and an attempt was made to detect the so-called Corsan (Cordon Sanitaire) and the Ploughshare minefields. Their lay-out is given in figures 6.16 and 6.17. By 1997, virtually all the fencing had been removed by local people or had disintegrated (Thompson, 2001). Another border area was selected, situated in the Eastern Highlands, to evaluate the use of space and airborne images under completely different environmental and climatological conditions. Upon Mozambican closure of all border crossings with Rhodesia (in adherence to the UN sanctions) in 1975, the Rhodesian Security Forces started construction of a minefield to protect the town of Mutare.

Standoff minefield detection in Africa
147
6.7.3.2 The north-east border minefield The selected area where the minefield is situated is located in the Zambezi Valley (the “low veldt”) along the international border between Zimbabwe and Mozambique in the NE part of the country. The area studied consists of communal lands, stretching from the Musengezi river until the village of Mukumbura and was tsetse infected during the time period considered (Brunt et al, 1986). The area has a semi-arid climate (rainfall less than 650 mm.). The area is relatively flat, consisting of the active floodplain of the Mukumbura river and the slightly higher situated fluvial terrace. The agro-ecological classification for this area shows that the region is characterized as a ‘semi-extensive farming’ region. The rainfall is too low and uncertain for cash cropping except in very favourable localities, especially along the main river courses. The farming system is therefore based on life stock production and can be intensified by growing drought-resistant fodder crops (Hall and Blench, 1998). The cattle are mainly used to plough the fields. They are kept in wood-fenced kraals every night and taken out to pasture or fields every morning, year round. Large differences can be observed between the aerial photographs obtained on 20-05-1974 and 11-06-1981. Both images are approximately from the same season, in the transition time between the wet and the dry season. During the wet season the area is densely covered with vegetation, but in the dry season from July onwards the surface grasses and undergrowth are thinned and dried up by the sun and the trees shed their leaves. Figure 6.18: Aerial photo (A) and interpretation (B) of Magula area, depicting the situation as of the start of minefield construction.
A: Aerial photo, original scale 1:25.000 B: Interpretation

Chapter 6
148
Already in 1974 a track can be observed. Probably the track was facilitating tsetse control. Also a fencing system was erected. No difference in vegetation density can be observed on both sides of the fencing system. It can therefore not be confirmed if the fencing system is being used for cattle or more likely to prevent movement into the area by other animals. North of the image, along the edge of the river terrace, the constructed Cordon Sanitaire can be observed. The width is approximately 50 metres, including roads along both sides. In the middle, a 25 metre wide darker toned area is situated which is probably the minefield and the roads are service roads used for construction of the minefield and fencing system as well as for regular patrolling and maintenance. The roads can be clearly identified and are therefore used regularly. This image shows the construction and early implementation phase of the minefield. Due to construction of the “Corsan” people were deprived of access to water on the Zimbabwean side of the minefield. There is no connection between the track and fence situated in the lower part of the aerial photo and the Cordon Sanitaire. The 1981 aerial photographs reveal the situation just after Zimbabwe’s independence. The stretch defoliated on the Zimbabwean side is generally larger than on the Mozambican side. The area defoliated along both sides of the “Corsan” is more than 100 metres. The maintenance roads are poorly visible, especially the one on the Mozambican side of the minefield. Figure 6.19: Mangula area in 1981, aerial photo (A) and interpretation (B) showing the situation after independence.
A: Aerial Photo, original scale 1:25.000 B: Interpretation Major changes have occurred south of the Cordon Sanitaire. A new North-South road has been constructed, partly overlapping the former access route. Newly dug gravel pits can

Standoff minefield detection in Africa
149
also be observed, material excavated was probably used for road construction. The old east-west road / track can still be seen on the 1981 image but parallel to it a new road has been made. Just north of this road, between the road and the gravel pits a narrow stretch, about 30 metres wide, is visible. This stretch does not appear on the north-south directed road sections. Part of this stretch overlaps with the former game or cattle fencing system (in the western part of the photo) but from the road junction towards the east it has been newly developed. Furthermore, the road drainage is directed towards the southern part along the road. At regular intervals, elongated stretches have been cleared using a bulldozer or grader and excess material is deposited along the side of the road. In the area, no new tracks have been developed and no other remarkable vegetation changes can be observed. Blagden (1997) states that the ploughshare minefield also has a road system in its neighbourhood, within 30 metres distance (for construction and patrolling services) and that the three mine rows are not usually more than 10 metres apart. More recent level 2 survey results do not support this completely. Commonly the ploughshare mine lanes would be placed close to the rear maintenance track but can also be found forwards of this track towards the Cordon Sanitaire minefield. The minefields were not just laid and maintained, but were adapted in the face of a changing tactical scenario. During the emplacement of the ploughshare strips, there was very little damage that is possibly unobservable after the grass had been recovered from footfalls. With regards to the tripwire, as long as the stakes at both appeared above the vegetation, it was not necessary to cut it. Therefore the direct perimeter of the individual mine lanes are difficult to determine. Other linear disturbances between the road and the Cordon Sanitaire could not be observed. According to Thompson (2001), discussing the humanitarian demining effort of this minefield, the rows were unevenly spaced and the vegetation was not cleared, so the minefield contained numerous trees and dense thorn bush. The field was subject to a great deal of in filling and randomly spaced anti-personnel mines. The minefield had a service track running behind and parallel to it to allow patrolling and maintenance. From the multi-temporal aerial photo analysis covering a larger section along the border area this road system is the only system that can be identified within the area running adjacent to the Cordon Sanitaire for over a length of approximately 60 kilometres. Also new north-south running “service roads” to the Cordon Sanitaire can be identified. No alignments along the roads were found. The road system is also visible on the 1979 KFA-1000 image and therefore the road was constructed during the period of conflict. This situation continues until the Musingwa river is approached, a tributary of the Mukumbura river. The multi-temporal analysis showed that villages situated in the area around the Musingwa river have all disappeared during the conflict. The agricultural areas have regenerated and are covered with grass, bush and shrubs. Here the former game or cattle fences are again coinciding with the new road constructed. Further towards the east, from this floodplain onwards, a new alignment can be found along the road again (see figure 6.20). This alignment continues until another constructed fencing system is encountered, starting from the Cordon Sanitaire, circumventing the village of Mukumbura and Masoso communal land.

Chapter 6
150
The images given show the development over time. In 1974 the area along the road is agriculturally used apart from the floodplain of the Senga river. In 1981 the area has regenerated to grass, shrubs and bush and furthermore an alignment can be observed situated just north of the road. In 1989 the area just north of the road has remained out of production despite the fact that it has agricultural potential as given by the land use during 1974 (see arrow). The area south of the road is taken in production again. For a more detailed assessment of this alignment larger scale imagery is required. Figure 6.20: Changes along the road crossing the Senga river
A: 1974 B: 1981 C: 1989
6.7.3.3 The Eastern Highlands The rainy and temperate climate of the Eastern Highlands allows for a wide range of profitable farming systems such as mixed agriculture, cattle breeding, tea estates, forestry plantations and fruit orchards. During colonization the area was allocated for commercial farming and white settlement. To protect this region, a modified “Corsan” was established alongside a newly constructed all weather road running parallel to the game fences (fitted with an alarm system) which marks the limit of the minefield. The width of the minefield was approximately 300 metres and consists of three rows of mines. Figure 6.21 shows the situation along the border north-east of Mutare in 1969 (left) and 1981 (right). A linear feature can be seen running from north to south, marking the international border. The difference is further enhanced by changes in land use practices in the two countries apart from the forest plantation and Umtali subtropical experimental station that can be seen in the north-eastern part of the image (this section is also given by a topographical map in figure 6.25). In Zimbabwe large commercial farms can be found, and in Mozambique small holders are responsible for the widespread intensive agricultural use in the south-eastern part of the images. Major changes, apart from the urban development in Mutare, can be observed along the border on the Zimbabwean side. A new road runs parallel to the border and in between the road and border a fencing system has been constructed. Roads and tracks formerly providing access to Mozambique have been closed and are abandoned as soon as the fencing system is encountered. Note also that the experimental station situated in Mozambique and the road system in the plantation area has not been maintained. The wide strip in between the fenced area further highlights the border region on the 1981 system.

Standoff minefield detection in Africa
151
Figure 6.21: Border region north-east of Mutare A: Mutare border region in 1969 B: Mutare border region in 1981
Figure 6.22: Border region south-east of Mutare A: Mutare border region in 1974 B: Mutare border region in 1981

Chapter 6
152
Figure 6.22 shows the temporal developments south-east of Mutare town. The border crossing (former Forbes border post) along the Muneni river and Machipanda / railway station are situated in the northern part of the image. The changes can be clearly detected by comparing the images taken in 1974 and 1981. The newly constructed road runs north-south and turns to the east in the southern portion of the image. Two alignments running parallel to this road system can be observed showing the location of the fencing systems marking the boundaries of the minefield. In the southern part of the image former agriculturally used land is now abandoned and tracks into Mozambique have been disrupted and subsequently abandoned. Agriculture is practiced up to the edge of the minefield in the southern part of the image further enhancing this sharp boundary. Detection of the ploughshare mine lanes within the minefield perimeter was not possible given the image scales used. Detailed interpretation of the aerial photographs shows some linear features within the fenced area, running parallel to the fencing system, possibly former tracks or footpaths. These can only be detected at a few localized places. As stated earlier the emplacement of the mine lanes have only slightly affected / damaged the vegetation within the minefield area.

Standoff minefield detection in Africa
153
6.7.3.4 Satellite based detection of selected border minefield sections
Of the selected areas, satellite images were also analyzed. The north-eastern border minefield can be clearly depicted on KFA-1000 images acquired during the conflict (1979). Although the resolution is not as good as compared to the aerial photos, still the main (in)direct minefield related features can be identified, such as the roads, tracks, fencing system, land use pattern, etc. Figure 6.23 shows approximately the same area as depicted in figure 6.18 and 6.19. Figure 6.23: KFA-1000 image of a section of the north-east border minefield.
The defoliated area, appearing in brighter tones, along the Cordon Sanitaire can be observed very clearly and the service road along the minefield on the Zimbabwean side can also be seen. Vegetation changes are depicted by different grey levels, the brighter toned areas having a less dense vegetation cover compared to the darker toned areas. The sediments of the Mukumbura river appear white and some recent meanders of the river can be clearly identified. Also smaller drainage lines can be identified based on the tonal differences due to changes in vegetation density along the small intermitting streams.

Chapter 6
154
The detection of the Cordon Sanitaire, given the remarkable change in vegetation compared to the surrounding area due to the use of defoliants, is even possible using lower resolution satellite data. Below an example is provided of a Landsat Thematic Mapper colour composite image from 1992 (bands 4, 3, 2 in red-green-blue). Figure 6.24: Landsat TM image showing the border minefield
The blue-cyan coloured remarkably shaped Cordon Sanitaire can be observed but no further detail inside the Corsan is visible. Where the “Corsan” is crossing the floodplain of the Muzengezi river, the extent of the minefield is more difficult to identify due to the same reflectance characteristics of the floodplain area. Part of the minefield here may have been affected by (flash) floods and new sediments have been deposited within the minefield. The major roads are also clearly visible and even the gravel pits along the road can be seen. The dark toned regions are affected by (recent) burning, red toned areas show higher vegetation concentration and even the fossil fluvial system can be assessed using the red tonal differences. Some old river meanders can be observed just south of the major access road. For satellite based minefield detection in the Eastern Highlands, post-conflict SPOT XS and Landsat Thematic Mapper images were used. For image rectification and referencing use was made of old topographical maps prepared using aerial photographs from before the conflict period. The portion along the border near Mutare was selected and is also given in figure 6.25. When comparing the map with the post conflict SPOT multispectral image, the differences in infrastructure are clear, especially the new road constructed parallel to the border can clearly be depicted. This road, derived from the satellite image, was used to update the topographical map displayed, as the map was produced before the road was constructed. Also on the Landsat TM image these changes mentioned are clearly visible even though the spatial resolution of this image is less. The topographical map (1:50.000) was compiled from aerial photography of 1968 and 1969, and is updated with the road taken from SPOT XS of 09-05-1992. Incorporation of this ancillary information facilitates also a multi-temporal comparison and additional information, such as the border, can be directly related to detect suspect areas on the

Standoff minefield detection in Africa
155
satellite image. For this purpose the topographical map was scanned and co-registered with the satellite image. Figure 6.25: Topographical map and SPOT XS image
The enlarged areas displayed (figures 6.26, 6.27 and 6.28) show the original map and SPOT image details. Area 1 shows the new road constructed. Here the new road partly overlaps a stretch of the former access road to the forest plantation. The former road junction and the road section leading into Mozambique are no longer visible. A linear pattern following the border line (dashed line on topographical map) can be seen as well. Between the road and the border there is a small strip of trees and bushes, further towards the border, the area is clear(ed) of any tree-like vegetation, resulting in a blue toned alignment following the border.
Enlargement 1
Enlargement 2
Enlargement 3
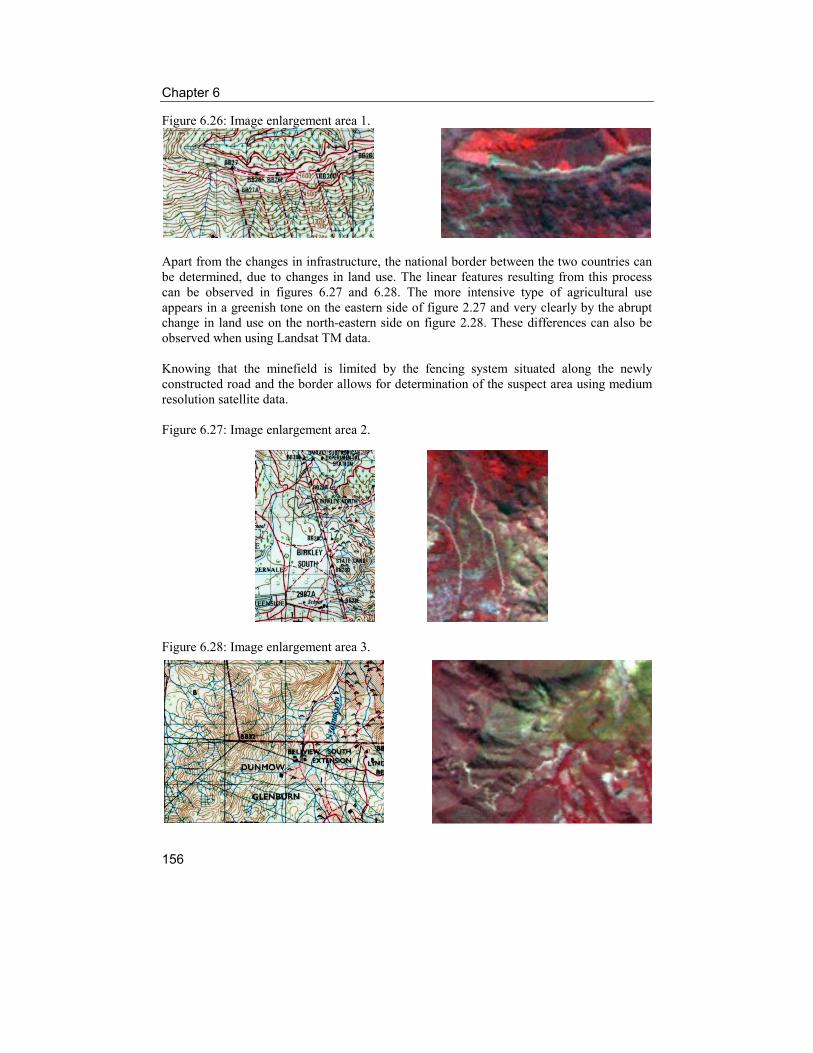
Chapter 6
156
Figure 6.26: Image enlargement area 1.
Apart from the changes in infrastructure, the national border between the two countries can be determined, due to changes in land use. The linear features resulting from this process can be observed in figures 6.27 and 6.28. The more intensive type of agricultural use appears in a greenish tone on the eastern side of figure 2.27 and very clearly by the abrupt change in land use on the north-eastern side on figure 2.28. These differences can also be observed when using Landsat TM data. Knowing that the minefield is limited by the fencing system situated along the newly constructed road and the border allows for determination of the suspect area using medium resolution satellite data. Figure 6.27: Image enlargement area 2.
Figure 6.28: Image enlargement area 3.

Standoff minefield detection in Africa
157
6.8 Discussion on the analysis results obtained In this chapter remote sensing data, using all possible spatial and temporal scales available, were used to analyse if suspect areas and real minefields could be detected which were constructed already a long time ago. The images collected did not allow for the detection of individual landmines, as the spatial resolution was not sufficient for the discrimination of anti-personnel landmines that were mainly deployed in the countries surveyed. The approach adopted strongly depends on the use of (in)direct indicators related to the occurrence of minefields. It was demonstrated that, once (a set of) indicators could be determined, even minefields could be identified. Using the data acquired during the airborne campaign, mainly collected by optical sensors (metric camera, using colour and colour infrared film), stereoscopic analysis revealed the occurrence of a large number of indirect indicators that were related to the occurrence of minefields. Data of different scales were used during image analysis from 1: 500 up to 1:3000. Using the large scale data (1:500) in the Buzi minefield no individual landmines could be detected, the time that elapsed since the mines were laid left no indicators revealing their exact positions. On the large scale as well as on the smaller scale images the minefield perimeter could be identified accurately. The indicators used can also be identified from even smaller scale images. The thermal data also revealed the location of the minefield, mainly due to the temperature differences related to the differences between the land cover of the minefield compared to the surrounding agriculturally used areas. Other indirect indicators, like the railway tracks, were very difficult to detect, or not at all. For the military camps at Bandua and Mameme no accurate minefield perimeter could be established. The remote sensing data allowed for the identification of indicators to determine the suspect areas but to establish the location of the minefield perimeter further ancillary information is required, related to the way mines were laid in these places. By incorporating this knowledge possible mine affected areas could be identified. In the case of military camps landmines were deployed mainly outside the camp area and through the identification of the embankments these potential mine affected areas could be determined. In the case of Bandua the presence of dense bushes and shrubs, left idle by the local population further strengthened this assumption. For Songo smaller scale images were used (1:3000) as due to the terrain relief a minimum flying height had to be observed, not allowing data to be recorded at larger scale. Also at this scale minefield related indicators could be determined revealing the perimeter of the minefield over a long distance having very diverse terrain conditions. Soil disturbances that are related to the construction of the minefield could still be observed, even 30 years later. Once knowing which (set of) indicators are related to the occurrence of minefields even smaller scale remote sensing data can be applied. This was demonstrated using the Songo

Chapter 6
158
minefield as an example. Images collected from different satellites were used to detect the minefield. The advantage of using satellite data is that historical recordings can be analyzed as well. The Songo minefield could be clearly detected, e.g. using Landsat MSS data, having a comparatively low spatial resolution. The indicators, like the construction of the road and the soil modifications for minefield construction purposes, appeared clearly on the Landsat MSS image from 1973. The use of these historical image archives allows for a multi-temporal analysis, studying changes over time. A number of change detection routines and algorithms have been applied. A large number of these clearly depict changes but these are not related to the presence of the minefield, but e.g. burning of natural vegetation. Once indicators are established, change detection and image processing techniques have to be used to enhance only these indicators. To assist during interpretation also a background is required in developments that have taken place over time in the area of interest. For this purpose a historical background of the conflict is required combined with other ancillary data related to the input, process, outcome and impact indicators. For Zimbabwe use was made of multi-temporal analysis using medium scale panchromatic aerial photographs, satellite images and the combined use of satellite data together with ancillary information in the form of topographical maps. For the north-eastern border minefield multi-temporal aerial photography revealed the location of the Cordon Sanitaire. The location of the ploughshare minefield, harder to detect as limited vegetation disturbances were made during minefield construction, can be inferred using the location of the service roads. Multi-temporal image analysis showed that still potential agricultural areas have not been taken into production along such a (service) road. Through the identification of these selected suspect areas, during a level 2 survey, the minefield perimeter can be established and further image analysis may reveal other indicators that can be used for a better identification of this minefield. The modifications that resulted from the construction of the minefield and the changes that have occurred over time due to the presence of the minefield in Zimbabwe allowed for the detection of the minefield on satellite images. The Cordon Sanitaire could be detected on the Landsat TM image, mainly because the vegetation was removed from the minefield and along its perimeter. These changes were still visible in 1992, when the image was recorded. For the Mutare area new roads were constructed along the minefield. Also due to minefield construction other roads crossing the border were closed subsequently. These changes, as well as changes in the vegetation cover could be detected using a multi-temporal set of aerial photographs. The suspect areas identified could also be observed using a SPOT image together with the topographical map prepared from aerial photographs prior to the conflict. The SPOT image clearly showed the location of the new road and the topographical map was giving the political boundary, both were demarcating the suspect area. Also due to the land use differences between both countries the border between Zimbabwe and Mozambique could be identified from the satellite image.

Standoff minefield detection in Africa
159
When confronted with the real world situation, it has proved difficult to validate the results, especially for a large minefield such as the one found in the neighbourhood of Songo. For this minefield, the results were validated at a few “safe” places. Due to the limited terrain accessibility, no additional level 2 information was available to provide further ground truth. Also for the other pilot areas in Mozambique only a selected field validation was feasible. The interpretations made using the remote sensed imagery collected for the Zimbabwe border could not be supported by fieldwork, for validation use was made of the minefield maps that were available. The preparation of the airborne campaign revealed the difficulty to obtain export licences for some of the equipment needed to acquire the airborne images. In the case of Mozambique no export licence could be obtained for the Recon Optical IRLS and therefore this sensor could not be operated in Mozambique, fortunately an export licence for the ZEO FLIR was granted and the sensor could be mobilized. The satellite remote sensing data used came from a search using numerous image archives. A lot of images are available but these are scattered over quite a number of data suppliers. This chapter has demonstrated that under diverse conditions, through remote sensing, suspect areas can be identified and that for some areas the perimeters of minefields that have been constructed already a long time ago can be established. The examples presented here do not provide the full range of possible mine deployment methods (e.g. scattered mine laying activities such as those used by guerrilla forces). Also not all terrain conditions that are found all over the world are represented. Further research has to be conducted to show the potential of standoff detection under other circumstances. Chapter 7 states some of the research topics that have to be considered in this respect.

Chapter 6
160
6.9 Summary In this chapter the use of standoff detection to locate minefields over a number of selected areas in Southern Africa was discussed, representing different types of landmine deployment, climatic zones, natural environment, etc. A description of the four selected pilot areas in Mozambique was provided and subsequently the airborne campaign executed to obtain the imagery was discussed. This was followed by the image analysis and interpretation of the large scale data recorded over these pilot areas. The interpretations derived from the remote sensing data were used for a selected field validation and the results obtained were discussed subsequently. A large number of (in)direct indicators could be detected revealing the location of suspect areas as well as the perimeter of minefields for the pilot areas. The second part of the chapter was focussing on the suitability of satellite images for the detection of minefields. A description was provided on the data acquired as well as the (historical) developments that have taken place in the selected areas. Use was made of multi-temporal analysis using satellite images, medium scale aerial photography and the combined use of satellite images with ancillary information provided by outdated topographical maps derived from aerial photography taken before the start of the conflict. Analysis of the data acquired showed that, even at lower spatial resolutions, but through the use of multi-temporal data, important minefield related indicators could be identified. For validation of the interpretations use was made of the interpretations derived from the analysis of the large scale airborne data recorded over Songo (Mozambique) and using a minefield map book that was available for the Zimbabwe border minefields. The chapter finalizes with a discussion on the results that were obtained using multiple data sets derived from remote sensing sensors, covering a wide range of spatial as well as temporal resolutions.

Conclusions and recommendations
161
Chapter 7
Conclusions and recommendations
7.1 Conclusions Airborne minefield detection has been mainly subject of research by the military. Most effort was therefore directed to (real time) standoff detection of AT-mines. In this thesis the use of space and airborne remote sensing as a wide area detection technique for humanitarian demining was evaluated for a number of pilot areas. Using images taken from an airborne platform, equipped with multiple sensors, minefields over large and varied tracts of land were detected. The approach adopted focussed on the use of indicators revealing the presence of minefields rather than the use of mine cues only. No previous research has been reported making use of such an approach for minefield detection. The identification of suitable direct and indirect image indicators, in combination with collected ancillary information, prior knowledge/intelligence, etc., provided major keys towards the identification and detection of suspect areas and minefields. These indicators were applied to detect minefields under different terrain and environmental conditions. Subsequently for some of the test areas a variety of pre- and post-conflict high and medium resolution multi- temporal airborne and satellite images were used, change detection and data fusion techniques have been applied to enhance the presence of indicators facilitating suspect area identification and minefield detection. To obtain an answer to the specific research questions formulated in this thesis, first a blind test was conducted over a variety of specially constructed minefields and direct landmine identification in combination with other indicators allowed for the airborne detection of a number of these minefields using large scale images, acquired up to one year after actual landmine deployment. Subsequently, this test was followed by an airborne campaign in a landmine affected country where minefields, mainly consisting of AP mines, were constructed over twenty years ago. For detection of these minefields only indicators could be applied, and for at least two of the four areas the minefield perimeter could be mapped. For the other two test areas only the suspect regions could be identified and the likely location of the minefield based on regular mine laying methods adopted during the conflict. Finally smaller scale air and spaceborne images were analyzed and the indicators obtained could be used for the identification and delineation of the suspect areas and minefield perimeter. The specific research questions formulated for each of the research phases differentiated are discussed in more detail below. An answer is formulated for each of the specific research questions raised and where applicable, relevant tables are presented summarizing a number of research findings.

Chapter 7
162
The Belgium “blind” test.
• Can individual AP and AT mines be detected using remote sensing? What are optimum detection conditions and can individual mines placed at the surface as well as those buried be detected and under which conditions?
The high spatial resolution airborne images collected of the Leopoldsburg test area allowed for the detection of individual anti-tank mines, both surface laid as well as buried mines. The resolution obtained, especially by the optical data, allowed for the differentiation of objects of even a few millimetres in size, provided that those objects contrasted with the immediate surroundings, such as the wire fencing surrounding test field “C” and the wire marking the anti-tank alignment within this minefield. This high spatial resolution resulted in a large number of pixels over target for e.g. surface laid anti-tank mines. Due to this, surface laid mines that were not or only partly obscured by the vegetation, could be visually detected. Due to the blue coloured paint used for the anti-tank mine casing the surface laid mines had strongly deviating spectral characteristics compared to their immediate surroundings. If more exposed mines could be identified also the possible mine alignment could be inferred. Due to the fact that anti-tank mines were (partially) exposed at a number of places, three minefields (mine alignments) could be identified (minefields “C”, “W” and “Z”). Given the large number of pixels over target, the mine cue signature allows for the implementation of automatic image extraction routines for the detection of these surface laid AT-mines. During the “blind” interpretation phase and even after the ground truth tables were provided by the Belgium military no individual surface laid anti-personnel mines could be identified on the images collected. The colour of the casing used did not contrast sufficiently with the surrounding environment, making their visual detection impossible. Even during subsequent fieldwork these AP mines were very difficult to identify, because the surface laid mines (located in minefields ”A”, “C” and “F”) were obscured by the heather or intermitting patches of tall grass (up to 50 cm. high). In minefield ”A” the mine alignment was placed under birch trees further limiting direct identification from the airborne data collected. All other AP mines deployed were shallow buried in the test area. The majority of the mines located in the test area were buried. For the detection of mines secondary features, like alignments of soil and vegetation marks occurring at regular intervals, were used to identify landmine locations. As the airborne data was collected up to one year after the minefield construction, a number of these secondary indicators were still visible on the images. The combination of exposed landmines, together with these regular occurring disturbances, revealed the direction of the minefield alignments (e.g. minefields “W” and “Z”). Especially the disturbances resulting from the AT mine deployment could be detected, e.g. the locations of the deeper buried AT mines were clearly visible due to the larger soil disturbances created. The heather situated on top of a number of AT mines showed clear signs of stress, deviating from the surrounding healthy vegetation. Minefield “V” was constructed using a minelayer. After ground truth tables were provided at a number of locations, especially in the heather, the individual AT mine positions could be

Conclusions and recommendations
163
identified by the regular pattern of small patches of stressed / disturbed vegetation. The identification of the mines in the bare soil situated on the southern part of this mine line was more difficult, due to the disturbances created by the military trucks after mine deployment. Due to the fact that the secondary impact of AP deployments is far less, pure AP-mine alignments were very difficult to detect, resulting in a higher degree of uncertainty during the final minefield classification process (probable and possible minefields), like minefield “F”. Two pure AP minefields (“A” and “B”) remained unnoticed. Also after fieldwork, knowing the exact location of some exposed AP mines (due to erosion) in minefield “B” they could not be detected. This can be attributed to the dark colour of the casing of the landmines used in combination with the shadows of the vegetation (situated directly above the alignment) and the shadow of the rills (due to the erosion processes occurring on this artificial embankment). From the images acquired of the Belgium test and subsequent analysis it can be concluded that individual AT-mines can be detected using airborne remote sensing under “optimum” conditions. Surface laid (non obscured) AT-mines can be scanned with sufficient pixels over target to allow direct identification. Buried AT-mines can be detected as well if secondary features such as soil and vegetation marks are still prominent. The airborne identification of surface laid individual AP-mines was not feasible, only vague indirect evidences were detected allowing for their deployment, but at low levels of certainty.
• Can minefields be detected having different mine laying patterns? The minefields constructed in the test area can be classified as mine lines, mined positions or mine bottle neck and a mined strip, consisting of a number of parallel mine lines. These minefields were constructed using AT or AP mines or a combination of both. During the image analysis the expected regular patterns and alignments that are the result from their mode of deployment were intensively used for the identification of the mine affected areas. Another approach followed was to look for objects likely to be mined, e.g. roads, road verges and strategic positions such as road junctions and the house situated in the NE part of the test area. These areas were studied in detail to see if mine laying activities had occurred. Through the use of this type of ancillary information on regular mine laying methods, minefield “E” was partially detected. Once evidences were found that in a certain area mines could be situated, secondary indicators (e.g. soil and vegetation disturbances) to identify the type and resulting pattern of the mined area was searched for intensively. By adopting these approaches, during image analysis, different types of minefields, having different mine laying patterns could be detected.
• Can minefields be detected under different vegetation conditions? In the Belgium test area different types of land cover occurred, such as heather, grass, different types of deciduous trees, bare soil. Also man made features like roads (tarmac and dirt roads), artificial hills and embankments as well as a dump site appeared in the area. Furthermore disturbances due to the military character of the site (foxholes and trench like depressions, remnants of bullets, small shells and other litter) are visible as well as

Chapter 7
164
disturbances created by the animals living in the area (e.g. rabbit-holes). In this heterogeneous “cluttered” environment mines and minefields could be identified. It was possible to identify surface laid or otherwise partly exposed AT-mines within different types of land cover such as heather, grass and on bare soil. Buried mines could be identified given their secondary indications for deployment, like soil and vegetation marks. This was especially the case for AT-mines, for AP-mines their direct and indirect detection remained very difficult or was not possible at all. The false alarms generated were mainly due to the disturbances created by the rabbits and litter disposed of in the area. Apart from this, from the time of minefield construction, till the major acquisition campaign of the airborne data (May 1998), some terrain modifications occurred resulting in a change of land cover. Under real circumstances these areas would not be considered as mined areas. Within the test area no agriculturally used areas were situated so the impact of landmine deployment under these conditions could not be evaluated.
• Can minefields be detected using multi-temporal satellite images taken before and after construction of the minefields?
Using multi-temporal SPOT XS satellite images, acquired directly prior and after minefield construction, it was tried to identify the location of minefields constructed in the test area. The impact in the terrain during minefield construction, using secondary indicators, like changes in land cover (e.g. expressed as the difference of the NDVI taken before and after minefield construction), did not allow for the identification of the minefields in this test area. Also no other image features could be linked towards the occurrence of minefields. Higher spatial resolutions provided by the new generation of earth orbiting satellites could partly overcome this problem. The results presented over here used multispectral images with a spatial resolution of 20 metres. Now high resolution multispectral images are available at 4 metres resolution and panchromatic images at 1 metre spatial resolution. Even with this improved resolution it is still doubtful if the AT-mines and (small sized) indicators, such as used in this Belgium test, can be detected on these type of images.
• Can minefield related indicators be identified? A lot of research has been conducted to detect landmines using all sorts of sensors. Most of these technologies developed use some sort of mine inherent features or “cues” for their localization. During the image analysis stage of this work not only direct identification of landmines was attempted, but relevant indirect features were identified related to the occurrence of minefields. Through the use of these features suspect areas and minefields could be identified. The approach is rooted in the fact that during minefield construction modifications in the terrain are also taking place, directly as a result of minefield construction but also over a period of time as a secondary impact of the mine deployment, like changes in land use or land cover because people are hesitant to infringe on these suspect areas. If these modifications can be detected the possible location(s) of the minefield(s) might be identified as well. These indicators can be established if more background information about the type and objective(s) of mine deployment is obtained. Knowing that wooden poles were indicating the location of the mine lines in minefield

Conclusions and recommendations
165
“C”, this indicator could be used to identify minefield “D”. A number of indicators may have larger dimensions so they are readily depicted on the large scale images acquired, but may even be visible on smaller scale images. It has been demonstrated that through the use of indirect indicators identified, even though the test conducted faced some limitation towards proper justification of the approach, minefields could be detected. To further test and develop this approach other mine suspect areas were studied in detail under real conditions. Table 7.1: Major indicators and airborne sensors, Belgium test
Large scale stereo optical aerial photo VOS IRLS Microwave Type of
Indicators found PAN PAN-
IR Colour CIR Digital
camera Thermal 8-12 µµµµ
X-band
P- Band
Direct identification AT-mine
+ + ++ ++ + +- - -
Direct identification AP-mine
- - - - - - - -
Circular soil disturbances + + ++ ++ +- +- - - Circular Vegetation disturbances
+ + +++ +++ + +- - -
Alignment of disturbances + + +++ +++ ++ +- - - Regular spacing disturbances
+ + +++ +++ + +- - -
Corner markers ++ ++ +++ +++ ++ - - - Wire fencing +- +- +++ +++ ++ - - - Poles, laying and standing + ++ +++ +++ + - - - Tracks of mine layer and regular disturbances inside track
++ ++ +++ +++ ++ + - -
Likely mined object – position*
+++ +++ +++ +++ +++ ++ ++ +
Thermal anomalies NA NA NA NA NA ++ NA NA
+++ readily and consistently detected ++ detected + vaguely detected +- occasionally detected - not detected NA Not Applicable *Impact indicators as mentioned in table 3.1 and 3.2, in the Belgium test represented by objects like roads, road junctions and the house, situated in the NE part of the test area, can be considered likely mined positions and objects.

Chapter 7
166
The images acquired of the Belgium test site did not only allow to detect at some places surface situated AT-mines, but also a number of relevant indirect indicators that were used to determine the layout of the minefields. Intensive use has been made of circular soil and vegetation disturbances, but also of objects related to the manmade impact during minefield construction. Table 7.1 is providing an overview of the type of indicators used and the images acquired by the different sensors used during the test on which these indicators could be detected under the image acquisition conditions (scales, resolution, timing, etc.) as described in detail in chapter 5. In the table a differentiation is made indicating the suitability of the different sensors for the detection of a number of indicators used during image analysis.
• What is the optimum (multi) sensor system configuration for airborne minefield detection and what are pre-conditions for successful detection?
As indicated, during image analysis indirect vegetation and soil marks, together with e.g. alignment and spacing of disturbances, and the use of other (manmade) indicators proved to be essential for minefield identification. Also other ancillary information, like the use of a mine layer and its impact on the terrain was important ancillary information used during image interpretation. Because of this combination of mine and landmine related features used, only visual image interpretation techniques could be applied. With the current state of art on image feature extraction routines only through “man in the loop” visual (stereoscopic) image interpretation all the aspects to be considered during minefield identification can be incorporated in the image analysis phase. This method of image analysis favours the incorporation of stereoscopic aerial photography and therefore affects the selection of the most suitable sensors to be used. As can be seen from table 7.1 most of the indicators were detected using optical stereoscopic large scale colour and colour infrared aerial photography. The digital camera did not provide an added value, especially not when taken into consideration that the majority of the data is analyzed in an analogue way. Spectrally the VOS and the optical aerial photography also overlap. The thermal sensor provided some added information using the thermal anomalies recorded. Already prior information is required with regard to the approximate location and alignment of the landmines for the detection of relevant anomalies. For identification of a number of other indicators the thermal sensor is not so suitable. Hardly any minefield indicator and no individual landmines could be identified using the microwave images. Following the approach developed here the optimum sensor suite for airborne minefield detection should consist of metric cameras using colour and colour infrared film emulsions. Incorporating a high resolution thermal sensor that under favourable conditions might provide thermal anomalies to be used to increase certainty levels during final minefield classification can further expand this sensor suite. To be able to integrate the thermal data with the optical data, accurate image registration is required so that also under circumstances when minimal thermal contrast are prevailing, the data can be integrated with thermal data recorded at other times during the diurnal cycle as well as with the optical data.

Conclusions and recommendations
167
Looking at the overall results of the “blind” test more than half of the individual mines could be accounted for in the minefields identified. Even though these results might seem promising, they are far less than the required detection and subsequent clearance rate set by the United Nations (99.6 %). The airborne detection attempted here does not meet this requirement for individual landmine detection but the results obtained show that remote sensing can be successfully used for the detection of minefields as seven out of the nine minefields were partly or correctly identified and the number of false alarms generated is low. To evaluate if the results obtained in this blind test are also valid for minefields which had existed over a longer period of time and under different environmental – mine deployment conditions, further research was conducted in landmine affected areas situated in Southern Africa.
Standoff airborne minefield detection. To evaluate the performance of airborne minefield detection in conjunction with the data analysis approach developed (chapter 3), data was collected over a number of pilot areas selected in Mozambique and Zimbabwe. The areas selected are representing different mine deployment methods as well as different climatologic and environmental conditions. The specific research questions raised are discussed below.
• Can airborne remote sensing detect minefields that have been constructed over two decades ago?
The period during which the conflict occurred and in which landmines were used in Mozambique is roughly from the end of the 1960’s to the beginning of the 1990’s when the peace agreement was signed. In Zimbabwe the conflict started slightly later and lasted until 1980 when the country became independent. For the pilot areas most of the landmines were deployed over two to three decades ago. Two types of data sets were used, large scale multispectral images (colour, colour infrared stereo aerial photography and high resolution MFILR recordings) obtained by an airborne campaign conducted during the end of the dry season of 1998 for Mozambique and medium scale panchromatic stereoscopic images acquired at the start, during and after the conflict had ceased in Zimbabwe. Within the selected pilot areas, making use of outcome and impact indicators found, minefields could be detected using the airborne data acquired. Within the selected pilot areas in Mozambique for two of the areas the minefield perimeter could be established, for the other two areas surveyed the suspect areas were identified. Within these suspect areas, the location of the potential minefield can be approximated using mine laying strategies normally encountered during the conflict; no direct evidence could be established for the exact minefield perimeter. Using the large scale data minefield related impact indicators were detected allowing the identification of the layout of minefields that were constructed over two decades ago. For example in the Songo minefield, believed to be the oldest mine affected area as construction started already in 1968, terrain modifications were still visible after all these years and were used to identify the minefield location. Other related minefield indicators could also be identified like remnants of the fencing system and changes in land use and land cover pattern.

Chapter 7
168
For the Zimbabwe pilot areas, developments occurring over time were analyzed in detail but also on the most recent images taken, the location of larger sections of the “Cordon Sanitaire” border minefield system (taken roughly two decades after minefield construction) are clearly revealed. For the detection of the possible location of the “Ploughshare” minefield the multi-temporal image coverage is used to monitor the development of the service roads required for access, construction and maintenance of this minefield as the impact on the natural terrain during construction of this type of minefield is minimal. These service roads can be identified on the recent images but it is difficult to differentiate those with other roads constructed after termination of the conflict. As the area was a “no go” zone during the conflict, images acquired prior and during the conflict give the highest probability for correct identification of the purpose of the road.
• Can minefields be detected where mainly anti-personnel mines have been used? For all of the areas studied the minefields were reported to consist primarily of blast anti-personnel landmines (with and without fragmentation sleeves), like the PMD-6, PMN, AUPS, PRB 35 BG and fragmentation stake mines like the POMZ-2 and the Ploughshare mines (both with trip wires). Also UXO’s are reported to be present. As the approach adopted is using secondary indicators for landmine deployment, mainly other indicators were used for the identification of the minefields detected. The type of landmines used for construction of the minefields is therefore not critical for their detection and minefields were detected consisting exclusively of AP-mines.
• Under which environmental conditions are minefields detectable? The pilot areas selected in Mozambique are representative for larger regions in the country with regard to climate, landscape, terrain cover, etc. Buzi represented a floodplain area with tropical agricultural activities, Bandua is situated on the flat coastal plain, Mameme is located in the central plains and Songo marks the transition to the mountains and mountainous areas along the border. The same holds true for the border regions in Zimbabwe, the NE border minefield is representative for the low Zambezi valley and the Eastern border area for the Eastern Highlands. Together these areas represent a multitude of environments encountered in Southern Africa. Most of the airborne data collected was taken during or towards the end of the dry season. During these months the effects of the vegetation coverage, possibly obstructing ground features, is at its minimum. Furthermore, many areas are affected by regular burning practices further reducing the obscuring character of the vegetation, especially of the grasses. Also during this period the deciduous trees have dropped their leaves. Due to the fact that images from this period were selected, many indicators, otherwise (partly) concealed, can still be detected using the optical airborne sensors. For the Bandua pilot area selected the dense vegetation posed a major problem and therefore in a portion of the test area ground features were obscured by the vegetation. Apart from Mameme, which is also a relatively small area, most of the minefields in the other test areas were sufficiently long so that at a large number of places minefield related

Conclusions and recommendations
169
features could be observed, despite the fact that in some areas trees or dense ground cover was obscuring relevant ground features. Through extrapolation of the detected minefield perimeter the approximate boundary for these areas could be established. In summary, the season with minimum vegetation coverage is favourable for minefield detection. This study did not cover extreme environmental conditions like swamps or deserts (sand dunes).
• Can large scale and high resolution remote sensing also detect individual landmines placed more than a decade ago?
The majority of the large scale airborne data collected did not allow for the direct detection of individual anti-personnel landmines, as the image resolutions obtained did not have sufficient spatial detail. Under the mountainous conditions encountered in e.g. NW Mozambique, the minimum flying height to be observed does not facilitate the recording of the terrain at extremely large scales using fixed wing aircraft. In the Buzi area extremely large scale optical images were acquired (1:500) having a spatial resolution sufficient for individual AP-mine detection. During image analysis a zigzag mine laying pattern was inferred, derived from secondary indicators like soil disturbances as no surface laid AP-mines could be identified. However, during a subsequent field check this pattern could not be confirmed. The time elapsed since the landmine deployment did not allow the use of these types of indicators that were successfully applied in the more recently constructed minefields in the Belgium test area. Also the thermal data recorded did not show thermal anomalies that could be used to identify individual landmines.
• Which indicators can be used to detect suspect areas and to determine the boundary of minefields?
In order to detect suspect areas and subsequently the boundary of minefields constructed already over two decades ago, use was made of a multitude of impact indicators justifying the minefield perimeter. Table 7.2. summarizes the main indicators found in the Mozambique and Zimbabwe pilot areas, using the large and medium scale airborne data collected. When a suspect area is detected, based on one or a few indicators, further detailed image analysis conducted mostly revealed the presence of more indicators. At a number of places these indicators are so convincing that based on their pattern and alignment, the boundary of the minefield could be established. The medium scale aerial photography furthermore facilitated the study of changes that took place in a suspect area over time providing further information. In order to obtain an idea of relevant minefield related indicators, good background knowledge is required with regard to the input, process, outcome and impact indicators occurring in the region as described in chapter 3. For the pilot areas also use was made of the information provided by the level 1 survey collected for a number of regions, as well as from the results of the fieldwork carried out. To apply the approach followed in this work and adopt it for other regions, military personnel involved in the conflict from both sides can provide valuable indicator related information, which can be used during the image analysis process afterward. The image analysis showed that indicators could be detected on

Chapter 7
170
large as well as small scale images. Depending on the type of relevant indicators the suitable flight parameters for the airborne survey and (type of) images to be recorded has to be determined. Further details on the indicators observed and the possibility for detection on different types of airborne data (e.g. different scales, spectral resolutions) is provided in table 7.2 under those conditions as described in detail in chapter 6. Table 7.2: Impact indicators and airborne sensors, Mozambique and Zimbabwe pilot areas
Large scale stereo optical aerial photo (< 1:3.000)
FLIR
Medium scale stereo optical aerial photo (1:25.000)
Type of Indicators found in pilot areas
Colour CIR Thermal 3-5 µµµµ Pan & Colour
Trenches +++ +++ NA +- Foxholes +++ +++ NA - Embankments surrounding camps +++ +++ NA - Leftover “military” equipment +++ +++ NA - NA Remnants (foundation) base camp +++ +++ NA +- Watchtower +++ ++ NA NA
+++ +++ +- -
Minefield marking: Poles White painted stones +++ +++ - -
+++ +++ ++ +++ +++ +++ ++ +++ ++ ++ - +-
+++ +++ +++ +++ +++ +++ +++ ++
Linear alignments with: Areas out of agricultural use Soil disturbances Erosion control works Roads parallel aligned
Controlled access, check points Base camps at regular interval +++ +++ NA NA
Clearing of vegetation +++ +++ +++ +++
+++ +++ NA NA +++ +++ NA +- +++ +++ +++ +++
Roads and footpaths / tracks: Roads out of use Unexpected tarmac road paving Restricted access through
alignment New access and service roads +++ +++ NA +++
Regeneration of natural vegetation on arable lands +++ +++ NA +++
Destruction of villages NA NA NA +++ Bridges out of use +++ +++ NA ++
+++ readily and consistently detected ++ detected + vaguely detected +- occasionally detected - not detected NA Not Applicable The ancillary information collected was used as a conceptual framework during the visual stereoscopic (multi-temporal and multispectral) image analysis process and a large number of relevant minefield related indicators could be detected (outcome indicators). The

Conclusions and recommendations
171
stereoscopic capability (using magnifying lenses) during image analysis proved to be very important revealing subtle and detailed features that did not readily appear monoscopically. Not all indicators were found in each of the pilot areas and therefore the appearance of some of the indicators could not be evaluated for some of the airborne data collected. From the table it can be concluded that through the use of stereoscopic large and medium scale optical aerial photography, a large number of minefield related features could be identified. The thermal sensor that was used in the Buzi area provided some indicators but these also appear on the optical data. To evaluate the medium scale images, also the colour aerial photographs taken over the pilot areas in Mozambique, used for the production of orthophoto maps have been included.
Standoff spaceborne minefield detection. Of three of the selected pilot areas, multispectral satellite data was collected taken during and after minefield construction. Especially the images collected from Songo are believed to be representative with regard to the different types of spatial, spectral and temporal resolutions that can be obtained from the satellite image archives nowadays. Most satellite image acquisitions were during the end of the dry season. Using the satellite data special attention was given towards their detection capability of process and outcome indicators (see chapter 3) to obtain a first impression towards the identification of suspect areas and minefields.
• Which minefield indicators can be detected from satellite data and under which conditions?
The level of spatial detail that can be obtained from medium resolution satellite images (SPOT, LANDSAT) is less compared to large scale aerial photography. High resolution satellite systems, like the declassified space photography (Corona and KFA) provide spatial details comparable to those recorded by medium resolution aerial photography. The new generation high resolution satellites, such as IKONOS II, also record the terrain (in stereo mode) obtaining spatial details comparable to medium scale aerial photography. An advantage of satellite images is that larger areas are recorded and a synoptic view is obtained revealing many process and, if a multi-temporal image coverage is available, also outcome indicators. Depending on the dimensions of the minefield deployment activities also impact indicators can be obtained even justifying minefield boundaries. Another advantage of incorporation of space borne data, of major importance to humanitarian demining, is that historical image records are available providing the only possibility for retrospective study. For NW Mozambique no airborne images were taken during the period of conflict. This situation also occurs in many other conflict affected regions. Table 7.3 provides an overview of the main indicators found, mostly through the use of multi-temporal image analysis, apart from the KFA and the Radarsat images. For the NE border area of Zimbabwe only one Landsat TM image was available and for the Eastern border minefield the multi-temporal coverage was obtained using a TM image in conjunction with a SPOT XS image. Under the conditions as described in chapter 6 a

Chapter 7
172
number of process, outcome and impact indicators could be extracted from the satellite images used. One of the reasons why the Landsat MSS images proved to be very useful is because the disturbances related to the Songo minefield construction are well visible on especially the oldest MSS image. The impact of minefield construction became gradually less over time and therefore were not so clearly detected by the other sensors used as they became operational from the mid of the 1980’s onward. For the Zimbabwe minefields, which are more recent, the other multispectral satellite images more profoundly showed minefield related indicators. Table 7.3: Satellite sensors, Mozambique and Zimbabwe pilot areas
Visible Vis+(N)IR Vis+(N)IR Visible Microwave Type of Indicators found KFA MSS TM SPOT-XS SPOT-
PAN Radarsat
+++ ++ +++ +++ +++ NA +++ +++ +++ +++ +++ ++
Alignments with: Land cover changes Vegetation clearances Soil disturbances +++ +++ ++ ++ ++ -
+++ +++ ++ ++ ++ +- +++ ++ ++ ++ ++ -
Roads and tracks: Parallel along alignment Restricted access Roads out of use NA +++ ++ ++ ++ NA Strategic objects +++ +++ +++ +++ +++ ++ Strategic positions +++ +++ +++ +++ +++ +
+++ readily and consistently detected ++ detected + vaguely detected +- occasionally detected - not detected NA Not Applicable The Radarsat image was recorded a long time after construction of the Songo minefield and therefore certain indicators that could be observed on the older multispectral images did not appear.
• Are data needed from before, during and after the conflict to detect minefields? For the pilot areas studied no images were obtained prior to the conflict, only images taken during and after the conflict were analyzed. Because of this, the research question can only be partially answered. The Songo example showed that minefield related indicators were most prominent after minefield construction and gradually degraded with time when the minefield was not maintained any longer and the mine affected area regenerated towards its natural setting. These temporal changes were important with regard to the identification of this minefield. The Zimbabwe examples showed that the minefield construction impact, e.g. the use of defoliants, construction of service roads, etc. remained well detectable even after the minefields were not maintained. Due to this only post conflict images are required. The need for prior, during and post conflict images therefore depends very much on the particular setting during which the minefields were constructed.

Conclusions and recommendations
173
• What are the limiting factors to be considered during change detection analysis? When conducting change detection analysis, the selection of appropriate imagery is very important and should take account of the historical setting of the conflict of the areas of interest. The timing of the images selected should have the highest probability for detection of process, outcome and impact indicators. A second consideration to be incorporated in selecting the images is that seasonal influences should be minimized and the season selected should have the highest probability to reveal the indicators. Finally the type of images selected should be based on the minefield related indicators expected, e.g. for smaller sized features higher resolution images are required. The multi-temporal study of the pilot areas revealed that many changes had occurred over time. A number of these changes are related to secondary impacts of the conflict, like the relocation of the population and subsequent regeneration of their arable lands. Also agricultural practices, like burning activities prior to the new planting season show remarkable changes. The major difficulty faced when conducting this type of analysis is to differentiate between these changes and modifications related to the impact of the minefields. To be able to detect the relevant changes a good background knowledge of the conflict and minefield related indicators is necessary as well as an understanding of the agricultural patterns and practices.
• Can recent minefields be detected? To be able to evaluate this specific research question use was made of images acquired from the period directly after minefield construction. Using the high resolution KFA images, acquired in 1979, it was possible to detect larger sections of the minefield alignment around Songo as well as the border minefield of Zimbabwe. Soil disturbances and vegetation clearances can be clearly detected, service roads used for minefield access, construction and maintenance are also visible. Even the potential location of the “Ploughshare” minefield can be inferred using the minor service roads constructed adjacent and parallel to the “Cordon Sanitaire”. The Landsat MSS image of 1973 also showed larger sections of the Songo minefield. The resolution did not allow for the differentiation between the service road and the other terrain modifications implemented for minefield construction. From the Songo example it can be concluded that the images acquired directly after minefield construction showed most prominently the indicators used for detection, although the spatial resolution of this image was the lowest.
• Are there limitations towards the spatial extent of a minefield for satellite based detection and can these spatial limitations be overcome using image fusion techniques incorporating higher spatial resolution satellite data?
A short alignment, vaguely detected on the Landsat TM image from 1984, representing the possible continuation of the Songo minefield situated north of the Cahora Bassa dam site, was fused with a KFA image. The improved spectral resolution of TM in combination with the higher spatial resolution of the KFA image was used to enhance the alignment. In addition to this, using the higher spatial resolution of the KFA image, also other minefield

Chapter 7
174
relevant indicators could be detected, such as a road or track running parallel to the suspect area and certain erosion phenomena, stopping just north of the alignment. Through image fusing it was possible to detect the continuation of the alignment towards both sides of the Zambezi river, blocking possible access from this direction, increasing the probability level that this alignment is actually a minefield. Through image fusion, not only images having different spatial and spectral resolutions can be combined but also temporal variations, extremely important for minefield indicator determination, can be incorporated as well. The physical dimensions of the other sections of the minefields found did not allow for a further evaluation of this specific research question.
Research findings relevant for humanitarian demining. Apart from answering the specific research questions raised, mainly related to the technical feasibility of remote sensing to identify suspect areas and minefields, other relevant aspects for humanitarian demining need to be considered as well, to be able to evaluate in more detail the capability and limitations of standoff detection. A number of these considerations are discussed below. The indicators to be expected depend on the type of conflict, purpose of mine laying, time elapsed since the conflict, etc. In general the type of process, outcome and impact indicators govern all resolution aspects of the remote sensing data. Tables 7.1, 7.2 and 7.3 present a listing of the main minefield indicators found in the test areas studied using the images considered. This table can be modified and further adjusted to provide an initial idea of the type of indicators that can be expected under other circumstances. This can form a basis for other air- or spaceborne suspect area or minefield detection activities to be conducted in other regions for humanitarian demining purposes. The research conducted shows that airborne remote sensing is not suitable for individual AT or AP landmine detection nor for pinpointing their location, as needed during level 3 surveys, but has a potential when performing a level 1 and 2 survey. The objectives of these surveys is to determine the landmine affected areas and minefield perimeters. The outcome of this research shows that remote sensing based minefield detection can contribute to this difficult task. The use of remote sensing is often the only way to obtain a good idea of the developments that have taken place in an area of interest, as sometimes no other means to obtain this information are available, especially if people have been relocated or have abandoned the area due to the fighting that took place. Apart from showing the changes that have occurred over time, it is also possible to analyze the present state of the areas of interest, as mostly no accurate and updated maps exist to be used during a level 1 survey after the conflict has ended. Furthermore (digital) orthophoto or (high resolution) satellite image maps can be prepared, substituting the outdated and (often) small scale topographical maps. These documents can be used in a geographic information system. Use can be made of global positioning systems linking the images and maps with field observations. These documents

Conclusions and recommendations
175
are also very useful for all other aspects included in mine action (baseline survey, rehabilitation, priority setting for areas to be demined, etc.). Demining organizations can directly use photographic prints and enlargements in the field. The data obtained by means of remote sensing provide a wealth of information having the potential to increase the efficiency of the regular field based level 1 and 2 surveys. Persons working in humanitarian demining programs are already actively involved in these surveys and therefore already have a good knowledge of all types of input, process, outcome and impact indicators. What is required in order to apply this approach is to translate their field based experiences into image analysis routines. Expertise building, necessary for image interpretation and analysis, requires time. To assist and accelerate this process image keys can be developed of all kinds of different indicators, eventually for different types countries and mine deployment methods. These keys could be stored in a central database, identical to the JRC’s mine signatures database, and image analysts from relevant organizations could utilize it. The amount of data generated from large scale (multi sensor) airborne remote sensing is so overwhelming, that image analysis alone would already require enormous resources. It is therefore not feasible to survey a whole country. Therefore the recommended approach is that when suspect areas are identified on smaller scale images (e.g. obtained by satellite) only the suspect areas need to be recorded by an airborne platform at higher spatial resolutions to eventually obtain the minefield boundaries. The costs involved for implementation of remote sensing based detection of suspect areas and minefields strongly depend on the types of air and spaceborne data available and the indicators of importance. For Mozambique no existing, suitable airborne data was available and a special campaign was conducted to acquire the necessary images, adding substantially to the overall costs involved (e.g. mission preparation, aircraft mobilization, etc). For Zimbabwe use could be made of available aerial photography. Mostly no high resolution scale (colour) aerial photography is available, but depending on the type of indicators, also medium resolution images can be used. The cost for reproduction of these images is minimal. A set of older satellite images of the same area of interest can also often be acquired at reduced prices. The main effort involved is the capacity needed for image analysis. If through incorporation of these techniques the efficiency of detecting minefields can be increased, remote sensing based detection is a well spent investment. Acquisition of large and medium scale aerial photography can be conducted using airborne platforms available in numerous countries. The procedures for airborne survey are well established all over the world. To conduct this type of survey there may be a need for specific sensors, other related equipment (INS & POS-DG) and film only, as a suitable platform is usually available within the country. Limiting circumstances, like export licences for equipment, companies able to develop the exposed films, preprocessing of other sensor data and a security officer during the survey or for release of images, might apply.

Chapter 7
176
The information derived from air- or spaceborne images can serve as basic information to show the government, donors, etc., the progress that has been made on mine action in order to show impact of their investments, donations. It can also be used for “Ottawa Treaty” compliance to show the progress achieved of removal of landmines. The information collected is not only relevant for humanitarian demining programs, but is useful for general rehabilitation purposes after a conflict has ended and costs involved might be shared amongst different stakeholders using the images needed for different purposes. Some of the necessary information can be made available from elsewhere, such as high resolution satellite image information used by peace keeping forces who are in need as well of up to date information in order to fulfil their mission. They have mostly finalized their task prior to the start of a humanitarian demining program.
7.2 Recommendations for further research More research has to be conducted on how the results obtained from remote sensing based detection of suspect areas and minefields can be integrated into a humanitarian demining program. According to a recent study on the technology needs for humanitarian demining in the Balkans, modeling predicts that each 10% improvement in level 2 capability (i.e. a 10 % reduction in the area to be cleared following a technical survey) would result in an 8% increase in the overall efficiency of the clearance operation (McAslan and Bryden, 2000). An aspect of main importance to be considered is how to efficiently determine the accuracy of the minefield perimeters identified on the images, in conjunction with field based sampling methods, without performing a complete level 2 survey. During this research use was made of a ground truth table provided by the military for the Belgium test site, of minefield maps of Zimbabwe, and controlled field validation in Mozambique. Due to the extent of e.g. the Songo minefield and the difficulty with regard to terrain access no complete level 2 survey could be performed. Given the information provided by air and spaceborne data analysis a new approach should be developed for validation purposes. To demonstrate the use of remote sensing for identification of suspect areas and minefield detection other pilot areas need to be incorporated where other conditions exists such as in SE Asia (border region between Thailand and Cambodia) or in Central Africa (e.g the arid areas in Northern Chad adjacent the Libyan border), representing older battle grounds. More recent conflicts need to be investigated as well (e.g. Afghanistan, border region Ethiopia and Eritrea, Central Europe), especially if airborne delivery of mines has been used (e.g. using the location of the canisters as an indirect indicator in relation to the possible spread of sub-munitions or the impact of shells in forested areas disrupting the tree coverage pattern). Testing the approach under other conditions will more clearly define the possibilities and limitations of the images that are used and the approach that has been adopted in this thesis. The research approach followed here could be slightly adapted. Especially for the older conflicts more attention should be given to image archives available and to search for suitable images in these archives. This should be done in conjunction with an inventory of suitable minefield indicators so that during this process the smallest possible image scales can be selected for identification of minefield related indicators. Such an investigation also

Conclusions and recommendations
177
provides the other requirements (e.g. image resolution) that need to be known when an airborne campaign has to be conducted to acquire images for more detailed analysis. For the research conducted in this thesis use has been made of commercially available airborne sensors which represent the development status from the mid of the 1990’s. New airborne sensors developments have to be incorporated. If the need exists for high resolution stereoscopic data during future airborne campaigns use could be made of digital photogrammetric cameras, such as the Digital Modular Camera (Z/I Imaging) or the HRCS-A (German Aerospace Research Center). By direct digital high resolution (visible to near infrared) multispectral image acquisition some of the disadvantages of the film based metric cameras could be minimized or overcome (apart from film development and processing), such as problems with film storage (especially colour infrared film) and image acquisition quality control during an airborne campaign. Also these cameras, amongst other features, offer a wider range of illumination conditions, extending operations also under less favourable image acquisition conditions. Attention should be given how these images can be quickly (digitally) interpreted, especially if larger areas have to be recorded. Also other new developments, such as the use of a high resolution and wide field of view CA-265 Millennium Infra Red (3-5 µ) Stereo Framing Camera (Recon Optical Inc.) can be integrated in a new sensor configuration. Further research should be focussed on the combined use of this sensor suite, especially the added benefits of image fusion algorithms for identification, extraction and classification of minefield related indicators. Furthermore high resolution spaceborne satellites (such as IKONOS II and EROS) have to be incorporated to study their suitability, e.g. taken of areas having a more recent conflict history. A central research question should be in how far these high resolution satellite based images can substitute airborne remote sensing. A further improvement of access to the satellite image (historical) archives is needed. To date, the archives are quite dispersed and organized by sensor type and distributor rather than by region. What is needed is a co-operation between satellite data providers such that geo-referenced searches can be performed on a multitude of sensors for an area of interest. Other useful archives also exists that can be used for humanitarian demining, like the 3.5 million aerial photographs taken by the German Luftwaffe during the Second World War, also of regions of Northern Africa, along the Mediterranean Sea, just prior to the main battle around El Alamein which is still heavily polluted by mainly anti-tank mines and shells. The larger scales used (e.g. 1 : 15.000) potentially allow for the detection of many indicators. Also the RAF has been active in acquiring airborne reconnaissance of these areas during the war. These were processed at the Cairo situated RAF interpretation unit and are probably still available in some archives in Egypt. These images are a basis for a first analysis of the possible locations of anti-tank minefields. Incorporation of other high resolution data, like those obtained from CORONA during a later period, show the dynamics with regard to dune movements, responsible for obscuring these minefields from detection today. Recently taken medium resolution images from Belgium and Northern France still show a number of soil indicators (in strongly agriculturally modified terrain) revealing the location of the battle ground during the First World War, even after a period

Chapter 7
178
of 80 years has elapsed. Only through the use of these datasets a good idea can be obtained depicting the conditions during which the minefields were constructed. Related to the previous recommendation is the need for incorporation of higher resolution data recorded by (still) classified reconnaissance programs during the past decades. The release of higher resolution images, acquired after the CORONA program is still restricted. Acquisition of images taken by these sensors is often related to conflict zones. These images, or at least the release of the meta data (such as humanitarian demining related interpretations) would overcome some of the spatial resolution shortcoming of civilian space programs from the 1970’s onward. Such a step in further declassifying reconnaissance images for humanitarian demining purposes would e.g. be in support of the “2010 Initiative”. Images made available should be the topic of immediate research. Attempts were made here to use indicators to deduct the presence of suspect areas and minefields. For their identification use was made mainly of visual interpretation skills (either directly on the images obtained or after digital image enhancement / fusion). The extraction of a number of these indicators could also be achieved using digital image processing techniques. Depending on the resolution of the images, a large number of these indicators (such as those listen in table 3.1 and 3.2) have a potential to be extracted by automated image processing routines. Further research should therefore be focussed on how these automated feature extraction and classification routines can assist in this visual interpretation process. This could reduce or prevent possible omission errors during the visual interpretation process. Ultimately this could speed up the whole analysis process as during an automated pre-analysis stage the suspect features are identified that need further investigation during a next stage, therefore limiting the need for “man in the loop” analysis of the complete area under investigation.

Summary
179
Summary In this thesis, standoff detection from air and spaceborne platforms was attempted, under test and real conditions. The results obtained show that standoff detection can assist in the (difficult and dangerous) field-based humanitarian demining efforts. Landmines, once laid, have a potential to maim and kill long after the conflict is over, until the mine is cleared. The warring parties do not keep reliable records or maps where they have placed the mines or laid the minefields. Since the 2nd World War millions of mines have been laid worldwide in wars, civil conflicts and in campaigns of blind terrorism against civilians. In spite of great willingness for assistance in the affected countries, serious accidents continue to occur. Landmines and minefields not only affect people, they also have a tremendous impact on national economies. In the war affected areas billions of dollars, which could be used for rehabilitation, have to be used to clean the debris of war. The integrated civilian approach in response to the landmine problem is called mine action and covers a far wider scope of activities than mine clearance only and differs in a number of aspects from military related demining activities. Present day operational methods for detection of landmines still rely on ground / field based methods mainly using metal detectors and dogs. For detailed localization probing techniques are applied. To detect and remove landmines and unexploded ordnance contamination will take a long time using the current methods. To speed up this process the present clearance rates should be improved using better sensing and detection technology. There is a growing recognition that remote sensing could become a particular useful tool to provide valuable information for the mine action process and to assist in the process of conventional minefield detection. The military have developed airborne sensors and processing techniques to detect minefields. Some of these are now available to the scientific community to develop peacetime, humanitarian approaches to landmine detection. Air and spaceborne systems, equipped with different sensors, can quickly and safely scan large (inaccessible) areas and the information obtained can contribute to the mapping and identification of suspect areas, identification and determination of the minefield boundaries and under favorable conditions even the identification and localization of individual mines. In general, within the suspect regions identified, only small areas are actually mine affected and therefore a reliable area reduction technique is an extremely efficient and cost-effective tool to release suspect land. At present there are not many area reduction techniques apart from physical area reduction by means of a so-called “level-2” field survey. Air and spaceborne remote sensing techniques, which have previously been applied to other problems, can now be adapted and customized to the problem of identification of suspect areas and minefield detection. The main objective of this research was to evaluate the use of space and airborne remote sensing as a wide area standoff detection technique for humanitarian demining purposes, especially the potential to assist in conventional level 1 and level 2 surveys. Chapter 2 presents background information, obtained from literature, on the relevant (declassified) aspects related to strategic overhead detection techniques developed by the

Summary
180
military / intelligence community as well as those of civilian space and airborne remote sensing programs. The airborne sensing techniques describe the state of the art of sensors, such as optical (film, multi- and hyperspectral sensors), thermal infrared as well as microwave sensors. Image analyses techniques are described related to visual image interpretation, digital image processing, change detection analysis and image fusion. A multitude of images can be obtained from medium to high resolution satellites, orbiting the earth from the 1960’s onward and application of these image processing techniques allows for the incorporation of this information into the overall analysis process. If still higher resolution (up to date) images are required, multi-sensor airborne surveys can be conducted. Research using images recorded by standoff sensors has very much concentrated on the detection of individual landmines. For a reliable detection and classification of individual landmines and mine-like targets high spatial resolutions are required to have a number of pixels over target in order to obtain significant differences between the target pixels and the surrounding (environmental) clutter. Research has shown that each of these sensors have specific limitations with regard to this clutter, therefore allowing detection only under certain conditions. Many of these target detection and classification studies have been conducted using images acquired under controlled conditions. These test-beds are not found in reality and given real world complexities, in combination with larger time frames when landmines were deployed, it is reasonable to assume that the detection performance will even be further degraded. Therefore concentrating on minefields, rather than individual mines, seems a more promising approach for standoff detection. In general, the (standoff) system performance is described by parameters such as the probability of detection and false alarm rate and evaluates the image and the detection - classification routines. Much attention is given to (real-time) automatic detection of mines and mine-like features, especially by the military. By incorporating experienced image analysts / photo interpreters (“man in the loop”) into the processing chain (as real-time is not a major constraint for humanitarian demining), a significant improvement to present methods could be obtained. The main challenge therefore is more in the area of target feature extraction and processing rather than in acquiring a useable signature, as at present multiple sensors are able to obtain high spatial resolutions over a wide range of the electromagnetic spectrum using a (large) number of discrete spectral channels. Therefore incorporating minefield and mine related features into the detection and classification process will enhance the system performance. Chapter 3 outlines the features often found in association with the presence of minefields that can be detected by remote sensing techniques. After presenting a framework to obtain minefield related indicators, examples from Western Europe of relevant features, related to the occurrence and the layout of minefields, are given. An extensive survey revealed that this approach is also valid for other areas and other types of conflicts. Study of relevant documents, site visits and discussion with a number of demining organizations showed that, although haphazard mining has occurred, often mines have been placed with a certain objective. By understanding these objectives and then linking them to remotely sensed image features, minefields can be localized and mapped. Direct and indirect indicators of minefields are presented for Angola, Zimbabwe, Mozambique and Croatia.

Summary
181
In chapter 4 the overall methodology is presented and for the three phases differentiated within this research, specific research questions are defined. For evaluation of these questions, pilot studies have been designed using a multitude of remote sensing images of different areas, in conjunction with different types of analysis methods, to enable the determination of their suitability towards identification of suspect areas and minefields. A short description is provided for each of the activities conducted within the framework of this research. Chapter 5 describes the details of the test using a multi-sensor airborne platform, conducted in Belgium and provides the results obtained. First the pilot area is described. The layout of the test area near Leopoldsburg in Belgium is presented, type of mines used, their characteristics and locations of the inert mines as well as other relevant test area features. Subsequently, acquisition and the initial processing of the data are discussed. For the analogue data collected, image analysis was conducted using visual (stereoscopic) image interpretation. The digital sensor data obtained was imported into image processing software for further enhancement and analysis. Subsets were selected, based on preliminary visual interpretation results using large scale stereo aerial photography and their signatures were studied. The initial blind interpretation results using the images acquired of the test were, in a later stage, compared to the ground truth tables showing all the landmine locations and seven out of the nine minefields constructed were partly or completely detected. Two minefields, consisting completely of anti-personnel mines were not detected. Direct landmine identification, in combination with other indicators, allowed for the airborne detection of these minefields using large scale images, acquired up to one year after actual landmine deployment. The minefields identified were classified as definite, probable and possible using image signatures and related indicators obtained from the high resolution optical data, thermal infrared and radar images. After the ground truth, further image analysis was conducted to determine the reasons why certain minefields were detected and others remained unnoticed on the airborne data collected. The known mine locations were plotted on the geo-coded thermal and radar images to see if the minefields could be detected once the exact positions of the landmines were known. The contribution of the different images was studied in detail to determine their suitability for detection of minefields. Based on these results the optimum airborne sensor configuration was defined. In chapter 6 the results are presented of the airborne and satellite based detection of minefields in Mozambique and Zimbabwe. First an overview is presented of the pilot areas selected, representing different climatological and environmental zones, followed by a description of a number of minefield deployment methods found in Mozambique and the high resolution airborne data collected over these areas during the airborne campaign. The results of the image analysis are presented and discussed subsequently. The minefields, mainly consisting of AP mines, were constructed over twenty years ago. For detection of these minefields only indicators could be applied, justifying for at least two of the four areas the minefield perimeter. For the other two test areas only the suspect regions could be identified and the likely location of the minefield, based on mine laying practices adopted during the conflict at such places. The second part of this chapter focusses on the use of

Summary
182
satellite remote sensing for minefield detection. A test area was selected based on the airborne data collected in Mozambique (surrounding Songo) and multi-temporal satellite images acquired using multiple sensors were analyzed to evaluate their suitability for detection of minefield indicators. Using satellite data archives images could be acquired dating from 1973 to the present, allowing for an extensive analysis of temporal developments and the contribution of each of the satellite sensors used towards the detection of minefields. To evaluate if the results obtained are representative, other test areas, marking the border zone between Mozambique and Zimbabwe, were analyzed using different types of satellite images, combined with medium resolution multi- temporal aerial photography. The smaller scale air and spaceborne images were analyzed and the indicators obtained could be used for the identification and delineation of the suspect areas and minefield perimeter in the test areas selected in Mozambique and Zimbabwe. Also use was made of outdated topographical maps providing ancillary information used during image interpretation. The final chapter discusses the results obtained from this research. In this thesis the use of space and airborne remote sensing as a wide area detection technique to contribute to the humanitarian demining process was evaluated for a number of pilot areas. The identification of suitable direct and indirect image indicators, in combination with collected ancillary information, prior knowledge/intelligence, etc., provided major keys towards the successful identification and detection of suspect areas and minefields using standoff detection techniques. Finally the thesis presents some other findings relevant for humanitarian demining purposes and mine action in general as well as providing a number of recommendations for further research.

Zusammenfassung
183
Zusammenfassung Die Arbeit setzt sich mit Verfahren der Fernerkundung zur Identifizierung von Landminenfeldern in methodenkritischer und anwendungsorientierter Weise auseinander. Damit wird das Ziel verfolgt, die schwierige, langwierige und häufig gefährliche zivile Minenräumung wirksam zu unterstützen. Einmal gelegt, haben Landminen noch lange nach Konfliktbeendigung das Potential zum Verstümmeln und Töten. Die Kriegsparteien führen in der Regel keine zuverlässigen Aufzeichnungen oder Karten darüber, wo sie die Minen plaziert haben oder wo sich Minenfelder befinden. Die quantitativen Dimensionen sind erschreckend hoch: seit dem Ende des Zweiten Weltkrieges wurden weltweit Millionen von Minen in Kriegen, Bürgerkriegen und militanten Konflikten gelegt. Ungeachtet der grossen Bereitschaft der betroffenen Länder, Räumungen nach Beilegung der Auseinandersetzungen herbeizuführen, treten weiterhin ernsthafte Unfälle auf, bei denen Zivilisten die hauptsächlichen Opfer sind. Landminen und Minenfelder betreffen aber nicht nur die Menschen, sie haben auch einen enormen Einfluss auf die nationale Wirtschaft. So müssen in den vom Krieg betroffenen Gebieten enorm hohe Geldsummen für die Räumung der Kriegsschäden aufgebracht werden und stehen somit nicht für den Wiederaufbau zur Verfügung. Der integrierte zivile Ansatz als Reaktion auf das Landminenproblem (“Mine action”) deckt ein wesentlich breiteres Handlungsfeld als nur die Minenräumung ab und unterscheidet sich dadurch von militärischen Minenräumungen. Gegenwärtig verlassen sich operationalisierte Methoden der Identifizierung von Landminen noch auf bodengestützte Methoden, hauptsächlich unter Einsatz von Metalldetektoren und Hunden. Für eine detaillierte Lokalisierung werden Suchtechniken (“Probing techniques”) angewandt. Jedoch ist davon auszugehen, daß bei Verwendung dieser Methoden das Entdecken und Entfernen von Landminen und unexplodierter Munition eine lange Zeit in Anspruch nehmen wird. Zur Beschleunigung dieses Prozesses sollte die aktuelle Räumungsrate durch den Einsatz besserer Technologien der Erkennung erreicht werden. Insbesondere die Fernerkundung kann ein sinnvolles Werkzeug zur Bereitstellung wertvoller Informationen bezüglich des “Mine action process” und zur Unterstützung der konventionellen Minenfeldentdeckung werden. Beispielsweise hat das Militär verschiedener Länder Flugzeugsensoren und Bearbeitungstechniken zur Erkennung von Minenfeldern entwickelt. Einige von ihnen sind bereits für die “Scientific community” verfügbar, um humanitäre Ansätze zur Landminenentdeckung zu entwickeln. Weiterhin tasten Luft- und Weltraumsysteme, ausgestattet mit verschiedenen Sensoren, schnell und sicher grosse und unzugängliche Gebiete ab. Die gewonnenen Informationen können zur Kartierung und Identifikation der verdächtigen Gebiete, der Identifikation und Bestimmung der Minenfeldergrenzen sowie unter besonders guten Bedingungen sogar zur Identifikation und Lokalisierung einzelner Minen beitragen. Gewöhnlich sind innerhalb der identifizierten Region nur kleine Gebiete von Minen betroffen. Somit ist eine zuverlässige Gebietseingrenzung eine sehr effiziente und kosteneffektive Methode zur Bestimmung von Verdachtsflächen bzw. Ausweisung von minenfreien Gebieten. Derzeit existieren nur wenige Techniken der Gebietseingrenzung, abgesehen von Verfahren am Boden (sogenannte “Level-2” Gebietserhebung).

Zusammenfassung
184
Luft- und weltraumgestützte Fernerkundungstechniken, welche zunächst für andere Problemfelder angewandt wurden, können auf die Aufgabenstellung der Identifikation verdächtiger Gebiete und der Entdeckung von Minenfeldern übertragen und individuell angepasst werden. Der Hauptgegenstand dieser Arbeit ist die Bewertung des Einsatzes weltraum- und flugzeuggestützter Fernerkundung als ein Anwendungsgebiet der “Standoff detection”-Technik für humanitäre Vorhaben der Minenräumung v.a. dem Potential zur Unterstützung konventioneller “Level-1” und “Level-2” Erhebungen. Kapitel 2 präsentiert den Forschungsstand und die aus der Literatur gewonnenen Hintergrundinformationen über relevante (unklassifizierte) Aspekte strategisch übergeordneter Entdeckungstechniken die durch Militär- bzw. Spionage-Organisationen entwickelt wurden. Weiterhin wird ein Überblick über die zivilen weltraum- und flugzeuggestützten Fernerkundungsprogramme gegeben. Die flugzeuggestützten Sensoren, die dem neuesten Stand der Technik entsprechen, wie zum Beispiel optische Sensoren (Film, multi- und hyperspektrale Sensoren), thermales Infrarot sowie Mikrowellensensoren werden in Hinblick auf ihre Eignung diskutiert. Weiterhin werden Bildanalysetechniken bezüglich visueller Interpretation, digitaler Bildverarbeitung, Änderungsdetections-Analyse und Bildfusion beschrieben. Eine Vielzahl an Bildern kann von Satelliten mit mittlerer bis hoher Auflösung, welche die Erde seit den 60er Jahren umkreisen, gewonnen werden. Anwendungen dieser Bildverarbeitungstechniken ermöglichen die Eingliederung der Informationen in den übergeordneten Analyseprozess. Noch höher auflösende (aktuelle) Bilder stellen multisensorale Flugzeugerkundungen bereit. Die Forschungsansätze, die durch “standoff” Sensoren aufgezeichnete Bilder nutzt, sind zur Zeit stark auf das Entdecken einzelner Landminen konzentriert. Für eine zuverlässige Entdeckung und Klassifikation einzelner Landminen und minenähnlicher Ziele wird eine hohe räumliche Auflösung benötigt. Voraussetzung sind eine genügende Zahl an Pixeln des Zieles (der Landminen), um signifikante Unterschiede zwischen Zielpixeln und Pixeln der Umgebung aufzuzeigen. Die Forschung hat ergeben, dass die herangezogenen Sensoren spezifische Beschränkungen aufweisen und somit eine Entdeckung nur unter bestimmten Bedingungen möglich ist. Viele der bisherigen Studien zur Minenentdeckung wurden von zuvor erstellten künstlichen Testminenfeldern durchgeführt. In der existierenden Komplexität realer Auseinandersetzungen liegen solche Testgebiete allerdings nicht vor. In der praktischen Arbeit bestehen daher viele erschwerende Einflußgrößen und es muss mit Veränderungen über grössere Zeiträume (Jahre bis Jahrzehnte) gerechnet werden. Dadurch scheint die Konzentration auf Minenfelder und nicht auf einzelne Minen, der weiterführende Ansatz der “Standoff detection” zu sein. Gewöhnlich wird die Ausführung des (“standoff”) Systems von Parametern beschrieben, wie der Entdeckungswahrscheinlichkeit und von Falschalarmraten und das Bild wird im Zusammenhang mit der Entdeckung – Klassifikationsroutine bewertet. Der automatischen (Echtzeit) Entdeckung von Minen und minenähnlichen Merkmalen vor allem beim Militär wird v.a. mehr Beachtung gegeben. Durch die Aufnahme erfahrener Bildanalysten (“man in the loop”) in die Prozesskette (da Echtzeit nicht zwingend für humanitäre Entminung ist), könnte eine wesentliche Verbesserung der Ergebnisse erreicht werden. Die grösste Herausforderung liegt somit eher in der Zielmerkmalsextraktion und –bearbeitung als im

Zusammenfassung
185
Erwerb nutzbarer Signaturen, soweit multiple Sensoren derzeitig in der Lage sind, räumlich hoch auflösende Daten für ein breites elektromagnetisches Spektrum unter Nutzung einer (grossen) Zahl diskreter spektraler Kanäle aufzunehmen. Somit wird die Berücksichtigung von Minenfeldern und minen-typischen Merkmalen in den Entdeckungs- und Klassifikationsprozess die Leistungsfähigkeit des Erkennungssystems steigern. Kapitel 3 beschreibt die Merkmale, welche beim Vorhandensein von Minenfeldern oft mittels Fernerkundungstechniken aufgedeckt werden können. Nach der Darstellung eines Arbeitsrahmens für den Erwerb von Indikatoren, die sich auf Minenfelder beziehen lassen, werden Beispiele für relevante Merkmale aus Westeuropa im Zusammenhang mit dem Auftreten und der Anordnung von Minenfeldern geliefert. Eine umfassende Prüfung zeigt, dass dieser Ansatz auch für andere Gebiete sowie andere Konfliktarten gültig ist. Das Studium relevanter Dokumente, Geländearbeit vor Ort und Diskussionen mit einer Vielzahl von Entminungsorganisationen zeigt, dass trotz vermeintlich willkürlicher Verlegung von Minen bestimmte Vorsätze erkennbar werden. Durch das Verständnis dieser Absichten und ihre Verbindung mit fernerkundlichen Bildmerkmalen können Minenfelder lokalisiert und kartiert werden. In der Arbeit werden direkte und indirekte Indikatoren für Minenfelder für Angola, Simbabwe, Mozambique und Kroatien präsentiert. In Kapitel 4 wird die übergeordnete Methodologie präsentiert und für die drei Phasen innerhalb dieser Arbeit differenziert. Spezifische Forschungsfragen werden definiert. Zur Bewertung dieser Fragen wurden Pilotstudien, welche eine Vielzahl an Fernerkundungsbildern aus verschiedenen Gebieten in Verbindung mit verschiedenen Arten von Analysemethoden nutzen, entwickelt, um bestimmen zu können, inwiefern sie zur Identifikation verdächtiger Gebiete und Minenfelder geeignet sind. Eine kurze Beschreibung jeder dieser Aktivitäten wird geliefert. Kapitel 5 beschreibt die Details des Testes zur Nutzung flugzeuggestützter multi-sensoraler Plattformen, der in Belgien durchgeführt wurde, und stellt die gewonnenen Ergebnisse dar. Die Gestaltung des Testgebietes in der Nähe von Leopoldsburg in Belgien wird beschrieben. Weiterhin werden die Arten der genutzten Minen, deren Charakteristik sowie die Lage der inaktiven Minen und andere für das Testgebiet relevanter Merkmale aufgezeigt. Anschliessend werden die Datennahme und vorbereitende Datenbearbeitung diskutiert. Für die analog gesammelten Daten wurde die Bildanalyse durch den Einsatz visueller (stereoskopischer) Bildinterpretation durchgeführt. Die erhobenen digitalen Sensordaten wurden in eine Bildinterpretationssoftware für weitere Verbesserungen und Analysen eingespeist. Teilausschnitte wurden, basierend auf vorbereitenden visuellen Interpretationsergebnissen, unter Verwendung grossmassstäbiger Stereoluftbilder ausgewählt und ihre Signaturen wurden untersucht. Die ersten blinden Interpretationsergebnisse, die die aus dem Test erworbenen Bilder nutzen, wurden in einem späteren Schritt mit den “Ground truth tables”, welche alle Positionen der Landminen zeigen, verglichen. Sieben der neun errichteten Minenfelder wurden teilweise oder vollständig entdeckt, zwei Minenfelder, die vollständig aus Antipersonenminen bestehen, wurden nicht entdeckt. Die “Standoff detection” erlaubt – in Kombination mit anderen Indikatoren – die direkte Identifikation einzelner Landminen. Für

Zusammenfassung
186
eine Anzahl dieser Minenfelder sind grossmassstäbige Bilder bis zu einem Jahr nach der eigentlichen Legung der Landminen herangezogen und untersucht worden. Die identifizierten Minenfelder wurden in “eindeutig”, “wahrscheinlich” und “möglich” unter Verwendung von Bildsignaturen und von Indikatoren klassifiziert, die von hochauflösenden optischen Daten, thermalen Infrarotbildern und Radarbildern gewonnen wurden. Nach der “Ground truth” wurde eine weiterführende Bildanalyse zur Ermittlung der Gründe durchgeführt, warum bestimmte Minenfelder von den flugzeuggestützten Daten entdeckt werden konnten und andere unentdeckt geblieben sind. Die bekannten Minenplätze wurden auf die geocodierten thermalen und Radarbilder aufgezeichnet, um im Nachhinein feststellen zu können, ob die Minenfelder sowie die genaue Lage der bekannten Landminen herausgearbeitet werden können. Der Beitrag der verschiedenen Bilder wurde im Detail untersucht, um ihre generelle Eignung für die Entdeckung von Minenfeldern zu bestimmen. Auf diesen Ergebnissen basierend wurde die optimale Konfiguration der Flugzeugsensoren für den Einsatz über reale Minenfelder in Afrika festgelegt. In Kapitel 6 werden die Ergebnisse einer Kampagne zur flugzeug- und satellitenbasierten Minenfeldentdeckung in Mozambique und Simbabwe präsentiert. Zunächst wird ein Überblick der ausgewählten Pilotgebieten mit ihren verschiedenen Klima- und Umweltzonen gegeben. Es folgt die Beschreibung einer Anzahl von in Mozambique vorgefundenen Anwendungsmethoden der Minenfeldverteilung (grösstenteils aus Antipersonenminen bestehend, die vor mehr als 20 Jahren errichtet worden sind) sowie der hochauflösenden Flugzeugdaten, welche während einer Befliegungskampagne für diese Gebiete gesammelt wurden. Anschliessend werden die Ergebnisse der Bildanalyse präsentiert und diskutiert. Zur Entdeckung dieser Minenfelder konnten nur Indikatoren angewandt werden, die mindestens für zwei der vier Gebiete die Minenfeldparameter rechtfertigen. Für die beiden anderen Testgebiete konnten nur die verdächtigen Gebiete identifiziert werden sowie die wahrscheinliche Lage des Minenfeldes. Für dieses Vorgehen ist eine Minenlegepraxis angenommen worden, die für Konflikte in dieser Region typisch sind. Der zweite Teil dieses Kapitels ist auf den Einsatz der Satellitenfernerkundung für Minenfeldentdeckung fokussiert. Basierend auf in Mozambique (in der Umgebung von Songo) gesammelten Flugzeugdaten wurde ein Testgebiet ausgewählt. Anschließend wurden multitemporale Satellitenbilder, die unter Einsatz verschiedener Sensoren entstanden sind, zur Bewertung der Eignung für das Entdecken von Minenfeldindikatoren analysiert. Durch die Verwendung von Satellitendaten-Archiven ließen sich Bilder von 1973 bis zur Gegenwart untersuchen. Anhand dieser Bilder konnten zeitliche Entwicklungen sowie der Beitrag der jeweiligen Satellitensensoren festgestellt werden, die zur Entdeckung von Minenfeldern führen. Um bewerten zu können, ob die gewonnenen Ergebnisse repräsentativ sind, wurden andere Testgebiete, die die Grenzzone zwischen Mozambique und Simbabwe markieren, analysiert. Hier kamen verschiedene Satellitenbildarten in Kombination mit mittelauflösenden multitemporalen Luftbildern zum Einsatz. Ebenfalls genutzt wurden alte topographische Karten, die Zusatzinformationen für die Bildanalyse liefern.

Zusammenfassung
187
Das abschließende Kapitel diskutiert die Ergebnisse, die in dieser Untersuchung gewonnen wurden. In dieser Dissertation wurde der Einsatz von Weltraum- und Flugzeugfernerkundung als ein Beitrag des humanitären Räumungsprozesses von Landminen für eine Anzahl an Pilotgebieten bewertet. Die Identifikation geeigneter direkter und indirekter Bildindikatoren, in Kombination mit gesammelten Zusatzinformationen, früherem Wissen etc., stellt Lösungsansätze für eine erfolgreiche Identifikation und Abgrenzung verdächtiger Gebiete und Minenfelder unter Einsatz der “Standoff detection” dar. Weiterhin gibt die Dissertation Handlungsvorschläge, die für humanitäre Vorhaben der Minenräumung und generelle Minenaktionen relevant sind und eine Anzahl an Empfehlungen für weitergehende Forschung.

Zusammenfassung
188

References
189
References Abrams, M. (2000): “The Advanced Spaceborne Thermal Emission and Reflection
Radiometer (ASTER): data products for high spatial resolution imager on NASA’s Terra platform”. (Int. Journal of Remote Sensing, 2000, Vol. 21, No. 5, pp. 847-859).
Achal, S.B., McFee, J.E. and Anger, C.D. (1995): “Identification of surface laid mines by classification of CASI reflectance spectra” (Proc. SPIE, Vol. 2496, pp. 324-335).
Achal, S.B., Anger, C.D., McFee, J.E., Herring, R.W. (1999): “Detection of surface-laid mine fields in VNIR hyperspectral high spatial resolution data. (Proc. SPIE, Vol. 3710, pp. 808-818).
American Society of Photogrammetry. (1960): Manual of Photographic Interpretation. Washington D.C. George Banta Company Inc., Menhasha, Wisconsin
American Society of Photogrammetry. (1975): Manual of Remote Sensing. 1st Edition. Falls Church Va. 22046. Keuffel & Esser Company. LCCCN: 75-7552.
Andronov A., Shevrov A. (1995): “American Overhead Visual Reconnaissance Systems”. (Zarubezhnoye Voyennoye Obozreniye. No. 3, pp. 37-42). Available at: http://www.fas.org/spp/military/program/imint/andornov.htm
Babington-Smith, C. (1957): Air Spy. 1st Edition. Harper and Brothers, New York. LCCCN: 57-8194
Bajić, M. (1999): “Variability of the landmine fields in Croatia, a challenge for the airborne multisensor mine detection”. (Proceedings 2nd International Symposium on Operationalization of Remote Sensing, ITC, Enschede, The Netherlands, 16-20 August 1999).
Bajić, M. (2000): “Redefinition the objectives of the airborne remote sensing for humanitarian demining: exponential growth of the remediated area.”. (Workshop on the needs of airborne and spaceborne data for minefield survey, 09-10 March 2000. ARIS, Joint Research Centre, European Commission, Ispra (Va), Italy).
Barbour, B.A., Kordella, S., Dorsett, M.J., Kerstiens, B.L. (1996): “Mine detection using a polarimetric IR sensor”. (Proc. EUREL Int’l Conf., Edinburgh, U.K., 7-9 October 1996, Conf. Publication No. 431. I.E.E on The Detection of Abandoned Landmines, pp. 78-82).
Barbour, B., Barnes, H., Jones, M., Lewis, P. Perry, K., Bishop, P. (1998): “Infrared polarimetric camera development”. (Proc EUREL Int’l Conf., Edinburgh, Conf. Publication No. 458. I.E.E Int’l Conf. on The Detection of Abandoned Landmines, 12-14 Oct 1998, Edinburgh, pp. 134-137)
Barnes, H., Jones, M., Bishop, P. (1999): “Infrared polarimetric camera system development”. (Proc. SPIE, Vol. 3710, pp. 189-196).
Benjamin, R. (1996): “Near field sport-focused microwave sensing for the detection of buried land mines” (Proc. EUREL Int’l Conf., Edinburgh, U.K., 7-9 October 1996, Conf. Publication No. 431 IEE, on The Detection of Abandoned Landmines, pp. 128-132).
Bertsche, K.A. and Hügle, H. (1997): “Material requirements for airborne minefield detection system” (Proc. SPIE, Vol. 3079, pages 487-497).

References
190
Bhatia, I., Diehl, V., Moore, T., Marble, J., Tran, K., Bishop, S. (2000): Sensor data fusion for mine detection from a vehicle-mounted system”. (Proc. SPIE, Vol. 4038, pp. 824-834).
Bishop, P.K., Perry, K.M., Poulter, M.A. (1998): “ Airborne minefield detection”. (Proc. EUREL Int’l Conf., Edinburgh, U.K., 7-9 October 1996, Conf. Publication No. 431. I.E.E on the Detection of Abandoned Landmines, pp. 213-217).
Bishop, P.K., Crisp, G.N. Smith, M.J. (1999): “Remote minefield detection system” (Proc. SPIE Vol. 3710, pp. 1130-1138).
Bishop, S., Campana, S.B., Lang, D.A., Wiggins, C. (2000): “Close-in detection system for the Mine Hunter/Killer program”. (Proc. SPIE, Vol. 4038, pp. 1204-1213).
Blagden, P.M. (1997): “Minefield clearance in North East Zimbabwe”. (Works Contract Tender No 4254, Volumes I to IV. Prepared for the Ministry of Defence, Republic of Zimbabwe, September 1997).
Blagden, P.M. (1998): “The changing scene of mine clearance”. (Proc EUREL Int’l Conf., Edinburgh, Conf. Publication No. 458. I.E.E Int’l Conf. on the Detection of Abandoned Landmines, 12-14 Oct 1998, Edinburgh, pp. 19-22)
Blagden, P.M. (1999): “Synopsis of presentation – The need for remote sensing and GIS in Humanitarian Mine action”. (Consultation meeting of 22/09/99 Intelligent Sensors and Data Fusion for Humanitarian De-Mining. Information Society Technologies. European Commission DG-XIII – B4).
Blagden, P.M. (2000): “The need for improving minefield survey”. (Workshop on the needs of airborne and spaceborne data for minefield survey, 09-10 March 2000. ARIS, Joint Research Centre, European Commission, Ispra (Va), Italy).
Blume, B., Taylor, S., Albers, J., Witherspoon, N.H. (1997): “Technology assessment of passive millimeter wave imaging sensor for standoff airborne mine detection”. (Proc. SPIE, Vol. 3079, pp. 600-613).
Bolton, P. (1986): “Mozambique’s Cabora Bassa project: an environmental assessment”. (In: Goldsmith, E. (ed) (1986): The social and environmental effects of large dams. Volume 2. Case Studies, pp. 156-167. Wadebridge Ecological Centre, Camelford, UK).
Bottigliero, I. (2000): 120 Million Landmines Deployed Worldwide: Fact or Fiction? Foundation Pro Victimis, Geneva. ISBN: 0-85052-731-7.
Bowman, A.P., Winter, E.M., Stocker, A.D., Lucey, P.G. (1999): “Hyperspectral infrared techniques for buried landmine detection. (Fourth International Airborne Remote Sensing Conference and Exhibition / 21st Canadian Symposium on Remote Sensing, Ottawa, Ontario, Canada, 2-24 June 1999, Vol. 1, pp. 19-26)
Brake, D., Mango, S. (2000): “Colour aerial photographs with B&W resolution”. (GIM International, Vol.14, No. 11, pp. 70-73).
Brock, G.C. (1967): Physical Aspects of Aerial Photography. Dover Publication, Inc. New York. LCCCN: 67-18855
Brookes, A.J. (1975): Photo Reconnaissance. Ian Allan Ltd. London. ISBN: 0-7110-0570-2 Brugioni, D.A. (1984): Photo Interpretation and Photogrammetry in World War II.
(Photogrammetric Engineering and Remote Sensing. Vol. 50, No. 9, September 1984, pp. 1313-1318).

References
191
Brumby, S.P., Theiler, J., Perkins, A.J., Harvey, N., Szymanski, J.J., Bloch, J.J., Mitchell, M. (1999): “Investigation of image feature extraction by a generic algorithm”. (Proc SPIE, Vol. 3812, pp. 24-31).
Brumby, S.P., Harvey, N., Perkins, A.J., Porter, R.B., Szymanski, J.J., Theiler, J., Bloch, J.J. (2000): “A genetic algorithm for combining new and existing image processing tools for multispectral imagery”. (Proc SPIE, Vol. 4049, pp. 480-490).
Brunt, M.A. Clarke, V.J., Greling, C. de (1986): “Tsetse area development and land use planning in the Zambezi Valley”. (FAO, consultant report).
Calvocoressi, P. (1982): World politics since 1945. 4th Edition, Longman. ISBN: 0-582-29586-6
Carter, L.J., O’Sullivan, M.J., Hung, Y.J., Teng, J.C-C. (1998): “Thermal imaging for landmine detection”. (Proc EUREL Int’l Conf., Edinburgh, Conf. Publication No. 458. I.E.E Int’l Conf. on the Detection of Abandoned Landmines, 12-14 Oct 1998, Edinburgh, pp. 110-114)
Carevic, D.D., Craig, M. and Chant, I. (1997): “Modelling GPR echos from landmines using linear combinations of exponentially damped sinusoids” (Proc. SPIE, Vol. 3079, pp. 568-580).
Center for Science and International Security (CENSIS) (2001): “Potential of commercial satellite imagery for arms control verification and support of OSCE and UN missions. A case study”. (CENSIS, University of Hamburg, Hamburg, 6 March 2001).
Chant, I.J. and Rye, A.R. (1996): “Overview of current radar landmine detection research by the Defence Science and Technology Organization, Salisbury, S. Australia” (Proc. I.E.E. EUREL Int’l Conf. on The Detection of Abandoned Landmines: a humanitarian imperative, seeking a technical solution, pp. 138-142).
Chavez, P.S., Sides, S.C., Anderson, J.A. (1991): “Comparison of three different methods to merge multiresolution and multispectral data: Landsat TM and Spot Panchromatic”. (Photogrammetric Engineering and Remote Sensing, Vol. 57, No.3, March 1991, pp. 295-303).
Chekaline, V.F., Fomtchenko, M.M. (2000): “Russian concept of the space images digital processing”. (Proceedings XXIII International ISPRS Congress in Amsterdam, July 2000).
Christiansen, A.L. and Ringberg, S. (1996): “Optical mine reconnaissance at the National Defence Research Establishment. Multispectral imaging and classification: Thermodynamic soil modelling”. (Proc. EUREL Int’l Conf., Edinburgh, U.K., 7-9 October 1996, Conf. Publication No. 431. I.E.E on The Detection of Abandoned Landmines, pp. 97-102).
Christiansen, A.L. and Ringberg, S. (1997): “Multispectral mine reconnaissance”. (Third Int’l Airborne Remote Sensing conf. and Exhibition, 7-10 July, Copenhagen, Denmark, Vol. II, pp. 36-43).
Cloude, S.R., Milne, A., Thornhill, Crisp, G. (1996): “UWB SAR detection of dielectric targets”. (Proc. EUREL Int’l Conf., Edinburgh, U.K., 7-9 October 1996, Conf. Publication No. 431. I.E.E on The Detection of Abandoned Landmines, pp. 114-118).
Coath, J.A. and Richardson, M.A. (2000): “Regions of high-contrast for the detection of scatterable landmines”. (Proc. SPIE, Vol. 4038, pp. 232-240).

References
192
Cornish, P. (1994): Anti-personnel mines. Controlling the plague of ‘Butterflies’. The Royal Institute of International Affairs. London. ISBN: 0-90503-187-3.
Cramer, M., Stallmann, D., Haala, N. (2000): “Direct georeferencing using GPS / inertial exterior orientations for photogrammetric applications”. (Proceedings XXIII International ISPRS Congress in Amsterdam, July 2000, International Archives of Photogrammetry and Remote Sensing, Vol. 33, Part B3, pp. 198-205).
Cremer, F., Schutte, K., Schavemaker, J.G.M., Breejen, den E. (2000): “Towards an operational sensor-fusion system for anti-personnel landmine detection”. (Proc. SPIE, Vol. 4038, pp. 792-803).
Croll, M. (1998): The History of Landmines. Leo Cooper. ISBN: 0-85052-628-0 Day D.A., Logsdon, J.M., Latell, B. (1998): Eye in the sky: the story of the Corona spy
satellites. Smithsonian Institution Press, Washington. ISBN: 1-56098-80-4 Del Grande, N.K. Durbin, P.F., Perkins, D.E. (1993): “Dual-band infrared imaging
applications: locating buried minefields, mapping sea ice, and inspecting ageing aircraft”. ( Review of Progress in Quantitative, Non-destructive Evaluation, edited by Thompson, D.O. and Chimenti, D. Plenum Press, New York, Vol. 12A. pp. 465-472).
Del Grande, N.K. et al (1993): “Dual-band infrared capabilities for imaging buried object sites”. (Proc. SPIE, Vol. 1942, pp. 166-177).
Department of Defence. (1997): Mine Facts. (CD-Rom, most commonly encountered landmines). Developed by the Office of Humanitarian and Refugee Affairs, U.S. Department of Defence, Washington DC.
Departments of the Army, Navy and the Air Force. (1953): Photographic Interpretation Handbook. TM30-245/NAVAER 10-35-610/AFM 200-50. 1954. Washington.
Departments of the Army, Navy and the Air Force. (1968): Image Interpretation Handbook. Volume 1. TM30-245/NAVAER 10-35-610/AFM 200-50. Prepared by: Naval Reconnaissance and Technical Support Center. US government printing office.
DePersia, A.T., Bowman, A, Lucey, P. Winter, E.M. (1995): “Phenomenology considerations for hyperspectral mine detection”. (Proc. SPIE, Vol. 2469, pp. 159-167).
Dourthe, C. and Pichot, Ch. (1996): “Microwave Imaging algorithms for arbitrary space and time incident waveforms using ultrawide bandwidth GPR techniques” (Proc. EUREL Int’l Conf., Edinburgh, U.K., 7-9 October 1996, Conf. Publication No. 431. I.E.E on The Detection of Abandoned Landmines, pp. 124-127).
Eastman Kodak Company (1996a): Specifications and characteristics of Kodak aerial films. Eastman Kodak Company Publication no.AS-57. Rochester, New York.
Eastman Kodak Company (1996b): Aerial Data. Eastman Kodak Company Publication no.AS-69. Rochester, New York.
Eastman Kodak Company (2001): Aerial Data. Kodak Aerocolor III negative film 2444 Eastman Kodak Company Publication no. AS-116. Rochester, New York
Ehlers, M. (1991): “Multisensor image fusion techniques in remote sensing”. (ISPRS Journal of Photogrammetry and Remote Sensing. Vol. 46. 1991, pp.19-30).
Erdas Inc. (1999): Erdas Field Guide. 5th Edition Revised and Expanded. Erdas Inc. Atlanta, Georgia, USA.

References
193
Ericsson, A. and Gustafsson, A. (1997): “Detection and classification results for an impulse radar mine detection system"”(Proc. SPIE, Vol. 3079, pp. 636-642).
Eucosat. (1997): Implementation of satellite systems for security. Report of Eucosat Working Group. June 1997. EUropean COntrol by SATellite, 6, rue Galilée, Paris, France.
Eucosat. (1998): Helios II, Horus: the French-German projects in cooperation run out of steam. The Letter. A special edition, issue 18, January 1998, EUropean COntrol by SATellite, 6, rue Galilée, Paris, France.
European Commission. (1996): The fight against antipersonnel mines. Under the direction of Dr. M. Joli, Head of the Department of International Solidarity, Conseil International et Développement (CIDEV, France)
Fields, D.J., Bowman, A.P., Winter E.M., Badik, F.J., Schlanger, M.J., Lucey, P.G., Williams, T.J., Johnson, J.R., Horton, K.A., Allen, G., Stocker, A.D., Oshagen, A., Schaff, W., Kendall, W., Carter, M.R., Bennett, C.L., and Aimonetti, W.D. (1997): “Hyperspectral Mine Detection Program” (Third Int’l Airborne Remote Sensing Conf. and Exhibition, 7-10 July, Copenhagen, Denmark).
Fonseca, L.M.G., Manjunath, B.S. (1996): “Registration techniques for multisensor remotely sensed imagery”. (Photogrammetric Engineering and Remote Sensing, Vol. 62, No.9, September 1996, pp. 1049-1056).
Fortuny-Guasch, J. Dietrich, B., Hosgood, B., Nesti, G. Dean, J.T., Sieber, A.J. (2000): “Multi sensor mine signature measurements at the JRC”. (Proc. SPIE, Vol. 4038, pp. 877-883).
Fransaer, D., Boeck, F. De (1999): “Aerial data acquisition in the frame of airborne minefield detection” (In: Proceedings 2nd Int’l Symposium on operationalization of remote sensing, 16-20 August 1999, ITC, Enschede, The Netherlands).
Fraser, C.S. (2000): “High-resolution satellite imagery: A review of metric aspects”. (Proceedings XXIII International ISPRS Congress in Amsterdam, July 2000, International Archives of Photogrammetry and Remote Sensing, Vol33, Part B7, pp. 452-459).
Fritzsche, M., Löhlein, O. (1999): “Sensor fusion for the detection of landmines”. (Proc. SPIE, Vol. 3752, pp. 414-424)
Frost, R., Appleby, R., Price, S., Nivelle, F., Allin, M., Hawkins, G.D.H. (1996): “The detection of mines using RF / millimetric radiometry. (Proc. EUREL Int’l Conf., Edinburgh, U.K., 7-9 October 1996, Conf. Publication No. 431. I.E.E on The Detection of Abandoned Landmines, pp. 138-142).
Garguet-Duport, B., Girel, J., Chassery, J., Pautou, G. (1996): “The use of multiresolution analysis and wavelet transform for merging Spot Panchromatic and multispectral image data”. (Photogrammetric Engineering and Remote Sensing, Vol. 62, No.9, September 1996, pp. 1057-1066).
Gerlach, F. (2000): “Characteristics of Space Imaging’s one-meter resolution satellite imagery products”. (Proceedings XXIII International ISPRS Congress in Amsterdam, July 2000, International Archives of Photogrammetry and Remote Sensing, Vol33, Part B1, pp. 128-135).
Genderen, J.L van (1974): “An evaluation of stereoscopic viewing of ERTS and SKYLAB images”. (Ed. Battrick, B.T and Duc, N.T: Proceedings of European Earth-

References
194
Resources Satellite Experiments, Frascati, Italy, 1974, ESTEC, Noordwijk, Netherlands, pp.47-55).
Genderen, J.L. van (1976): “Remote Sensing in Archaeology”. Journal of the Royal Archaeological Society. Volume 133, pages 1-8)
Genderen, J.L. van. (1997): Proposal for a pilot project for airborne minefield detection in Angola. Final version, May 1997. Submitted to European Commission, DG VIII/G/4D. ITC, internal publication.
Grosch, T.O., Lee, C.F. et al. (1995): “Detection of surface and buried mines with VHF airborne SAR” (Proc. SPIE, Vol. 2496, Orlando, April 1995, pp. 110-120).
Groot, J., Dekker, R. Ewijk, L.van. (1996): “Landmine detection with an imaging 94 GHz radiometer”. (Proc. SPIE, Vol. 2765, pp. 337-347).
Gross, H.N., Schott, J.R. (1998): “Application of spectral mixture analysis and image fusion techniques for image sharpening”. (Remote Sensing of Environment, Vol. 63, 1998, pp. 85-94).
Gruen, A. (2000): “Potential and limitations of high resolution satellite imagery”. (Keynote address. 21st Asian Conference on Remote Sensing, December 4-8, 2000, Taipei, Taiwan)
Gupta, V. (1994a). “Remote Sensing and Photogrammetry in Treaty Verification: Present Challenges and Prospects for the Future”. (Photogrammetric Record, 14(83): pp. 729-745 (April 1994).
Gupta, V. (1994b): “New satellite Images for Sale. The opportunities and Risks Ahead”. (Center for Security and Technology Studies, Lawrence Livermore National Laboratory, UCRL-JC-118140, CSTS-47-94, 28 September 1994. International Secu-rity, Vol. 20, No.1, 1995, pp. 94-125). Available at: http://www.llnl.gov/csts/publications/gupta/contents.htm
Hall, M. (1990): “The Mozambican National resistance Movement (Renamo): A study in the destruction of an African country”. (Africa, 60(1), pp. 39-98, ISSN 0001-9720)
Hall, S., Blench, R. (1998): “Conflicts in protected areas in Africa: Livestock and the conservation of the Rwenya Wildlife Management Area, North East Zimbabwe”. (Overseas Development Institute, network paper agricultural research and extension network, 82 (1998) pp. 7-15).
HALO TRUST (1995-1996): Mine danger area report. Field survey forms describing suspect areas in Huambo province, Angola. (HALO Trust internal reports).
HALO TRUST (1994): Mozambique National Mine Survey. Survey conducted for the United Nations Office for Humantitarian Assistance Coordination by HALO Trust, during four months in 1994. Data entered into the SHAMAN database, available at United Nations Accelerated Demining Program and the National Demining Institute, Maputo, Mozambique.
Hanshaw, T. and Reidy, D.M. (1997): “Operational Standoff Mine Detection: Its Technology and Application” (Proc. SPIE 3079, pp. 432-442).
Haskett, H.T., Rupp, R., Moore, T. (2000): “Quantitative performance of buried mine hyperspectral reflectance signatures (.35-2.5 µm) in various soils”. (Proc. SPIE, Vol. 4038, pp. 886-899).
Herman, M. (2000): Landminen-Erkennung aus der Luft. (Unpublished MSc Thesis. February 2000, Center for Science and International Security (CENSIS), University of Hamburg, Germany)
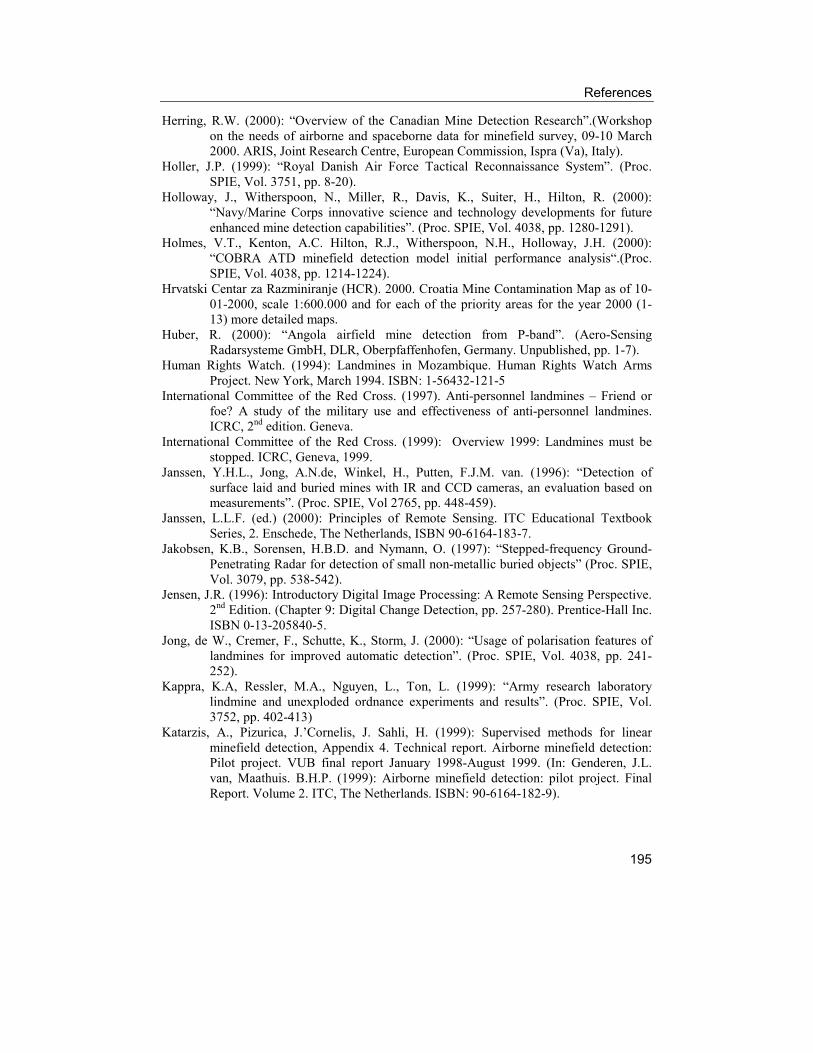
References
195
Herring, R.W. (2000): “Overview of the Canadian Mine Detection Research”.(Workshop on the needs of airborne and spaceborne data for minefield survey, 09-10 March 2000. ARIS, Joint Research Centre, European Commission, Ispra (Va), Italy).
Holler, J.P. (1999): “Royal Danish Air Force Tactical Reconnaissance System”. (Proc. SPIE, Vol. 3751, pp. 8-20).
Holloway, J., Witherspoon, N., Miller, R., Davis, K., Suiter, H., Hilton, R. (2000): “Navy/Marine Corps innovative science and technology developments for future enhanced mine detection capabilities”. (Proc. SPIE, Vol. 4038, pp. 1280-1291).
Holmes, V.T., Kenton, A.C. Hilton, R.J., Witherspoon, N.H., Holloway, J.H. (2000): “COBRA ATD minefield detection model initial performance analysis“.(Proc. SPIE, Vol. 4038, pp. 1214-1224).
Hrvatski Centar za Razminiranje (HCR). 2000. Croatia Mine Contamination Map as of 10-01-2000, scale 1:600.000 and for each of the priority areas for the year 2000 (1-13) more detailed maps.
Huber, R. (2000): “Angola airfield mine detection from P-band”. (Aero-Sensing Radarsysteme GmbH, DLR, Oberpfaffenhofen, Germany. Unpublished, pp. 1-7).
Human Rights Watch. (1994): Landmines in Mozambique. Human Rights Watch Arms Project. New York, March 1994. ISBN: 1-56432-121-5
International Committee of the Red Cross. (1997). Anti-personnel landmines – Friend or foe? A study of the military use and effectiveness of anti-personnel landmines. ICRC, 2nd edition. Geneva.
International Committee of the Red Cross. (1999): Overview 1999: Landmines must be stopped. ICRC, Geneva, 1999.
Janssen, Y.H.L., Jong, A.N.de, Winkel, H., Putten, F.J.M. van. (1996): “Detection of surface laid and buried mines with IR and CCD cameras, an evaluation based on measurements”. (Proc. SPIE, Vol 2765, pp. 448-459).
Janssen, L.L.F. (ed.) (2000): Principles of Remote Sensing. ITC Educational Textbook Series, 2. Enschede, The Netherlands, ISBN 90-6164-183-7.
Jakobsen, K.B., Sorensen, H.B.D. and Nymann, O. (1997): “Stepped-frequency Ground-Penetrating Radar for detection of small non-metallic buried objects” (Proc. SPIE, Vol. 3079, pp. 538-542).
Jensen, J.R. (1996): Introductory Digital Image Processing: A Remote Sensing Perspective. 2nd Edition. (Chapter 9: Digital Change Detection, pp. 257-280). Prentice-Hall Inc. ISBN 0-13-205840-5.
Jong, de W., Cremer, F., Schutte, K., Storm, J. (2000): “Usage of polarisation features of landmines for improved automatic detection”. (Proc. SPIE, Vol. 4038, pp. 241-252).
Kappra, K.A, Ressler, M.A., Nguyen, L., Ton, L. (1999): “Army research laboratory lindmine and unexploded ordnance experiments and results”. (Proc. SPIE, Vol. 3752, pp. 402-413)
Katarzis, A., Pizurica, J.’Cornelis, J. Sahli, H. (1999): Supervised methods for linear minefield detection, Appendix 4. Technical report. Airborne minefield detection: Pilot project. VUB final report January 1998-August 1999. (In: Genderen, J.L. van, Maathuis. B.H.P. (1999): Airborne minefield detection: pilot project. Final Report. Volume 2. ITC, The Netherlands. ISBN: 90-6164-182-9).

References
196
Kauffman, C. (1998): “Emergence of tactical, framing infrared reconnaissance”. (Proc SPIE, Vol. 3431, pp. 130-143)
Kenton, A.C., Schwart, C.R., Horvath, R., Cederquist, J.N., Nooden, L.S., Twede, D.R., Nunez, J.A., Wright, J.A., Salisbury, J.W., Montavon, K. (1999): “Detection of land mines with hyperspectral data”. (Proc SPIE, Vol. 3710, pp. 917-928).
Kercel, S.W., Burlage, R.S., Patek, D.R., Smith, C.M. (1997):”Novel methods for detecting buried explosive devices”. (Proc. SPIE, Vol. 3079, pp. 467-477).
Kerner, D., Deni, J., Grubb, J., Hutton, C., Johnson, R., Kincaid, T. (1999): Anti-personnel landmine (APL) detection technologies and assessment – wide area detection in support of arms control. Technical report. DNA 001-96-G-0061. Prepared by DynMeridian for the Defence Threat Reduction Agency.
King, C. (1998): “Demining, Enhancing the Process”. (The Journal of Humanitarian Demining. Issue 2.2. June 1998). Available at: http://www.hdic.jmu.edu/hdic/ journal/2.2/features/king.htm
Lake, D.E., Sadler, B., Casey, C. (1997): “Detecting regularity in minefields using collinearity and a modified Euclidean algorithm. (Proc. SPIE Vol. 3079, pp. 500-507).
Lareau, A.G. (1998): “Advancements in E-O framing”. (Proc SPIE, Vol. 3431, pp. 96-107) Larive, M., Spoliansky, D., Trézières, O. (1999): “Pre-processing of 8-12µm polarimetric
features for laid and flush-buried mines detection”. (Proc. SPIE, Vol. 3710, pp. 197-202).
Lavrov, V.N. (1996): “Space Survey Photocameras for Cartographic Applications”. (Proceedings XVIII International ISPRS Congress in Vienna, June 1996).
Lavrov, V.N. (1997): “Spin-2 Space Survey Photo Cameras for Cartographic Purposes”. (Proceedings of Fourth International Conference on Remote Sensing for Marine and Coastal Environments, Orlando, Florida, 17-19 March 1997). Available at: http://www.spin-2.com/paper3.htm
Lavrov, V.N. (2000): “Mapping with the use of Russian space high resolution images”. (Proceedings XXIII International ISPRS Congress in Amsterdam, July 2000 International Archives of Photogrammetry and Remote Sensing, Vol. 33).
Lee, C.F., Ayasli, S., Carlin, L. and Merchant, B.L. (1997): “RCS models and analysis of metallic mines” (Proc. SPIE Vol. 3079, pp. 581-597).
Li, R, Zhou, G, Yang, S, Tuell, G, Schmidt, N.J., Fowler, C. (2000): “A study of the potential attainable geometric accuracy of IKONOS satellite imagery” (Proceedings XXIII International ISPRS Congress in Amsterdam, July 2000, International Archives of Photogrammetry and Remote Sensing, Vol33, Part 4B, pp. 587-595).
Lillesand T. M., Kiefer, R.W. (2000): Remote Sensing and Image Interpretation. 4th Edition. John Wiley & Sons, Inc. ISBN: 0-471-25515-7.
Lucey, P.G., Williams, T., Horton, K., Allen, G., Kokubun, D., Julien, J., Stocker, A., Kendall, W., Schaff, W., Winter, E., Schlangen, M. and Batik, F. (1997): “AHI: Airborne Hyperspectral Imager for detection of buried landmines.” (Abstract, Third Int’l Airborne Remote Sensing Conf. and Exhibition, 7-10 July 1997, Copenhagen, Denmark, Vol. II, pp.1).

References
197
Lunetta, R.S., Elvidge, C.D (1999): Remote Sensing Change Detection: Environmental Monitoring Methods and Applications. London, Taylor and Francis, 1999. ISBN 0-7484-0861-4.
Lo, C.P. (1976): Geographical applications of aerial photographs. Crane, Russak & Company, Inc. New York. ISBN: 0-8448-0872-5.
Maksymonko, G. and Breiter, K. (1997): “ASTAMIDS minefield detection performance at Aberdeen proving ground test site.” (Proc. SPIE, Vol. 3079, pp. 726-737).
Maksymonko, G. and Le, N. (1999): “A performance comparison of standoff minefield detection algorithms using thermal IR image data”. (Proc. SPIE, Vol. 3710, pp. 852-863).
Marinelli, V. DeLuca, C, Ressler, M. (1998): “UXO detection using ultra-wideband synthetic aperture radar”. (Proc. SPIE 3392, pp. 668-677)
McAslan, A.R.R., Bryden A.C. (2000): “Humanitarian Demining in South Eastern Europe. An analysis of capability shortfalls and other user needs” (Geneva International Centre for Humanitarian Demining, Geneva, 2000).
McDonald, R.A. (1995): “CORONA: Success for Space Reconnaissance, A Look into the Cold War, and a Revolution for Intelligence”. (Photogrammetric Engineering and Remote Sensing. Volume 61, 6 June 1995).
McFee, J.E., Ripley, H.E., Buxton, R, Thriscutt, A.M. (1996): “Preliminary study of detection of buried landmines using a programmable hyperspectral imager”. (Proc. SPIE, Vol. 2765, pp. 476-488).
McFee, J.E. and Ripley, H.T. (1997): “Detection of buried landmines using a casi hyperspectral imager.” (Proc. SPIE., Vol. 3079, pp. 738-749).
Minter, W. (1989a): “An army of abductors”. (Africa Report. 1989. 34(3), pp. 17-20). Minter, W. (1989b): “The Mozambican National Resistance (Renamo) as described by ex-
participants”. (Development Dialogue. 1989(1), pp. 89-132). Morgan. G. (1990): “Violence in Mozambique: towards an understanding of Renamo”.
(Journal of Modern African Studies. 1990, 28 (4), pp. 603-619). Mouat, D.A., Mahin, G.G., Lancaster, J. (1993): “Remote sensing techniques in the
analysis of change detection”. (Geocarto International (2), 1993, pp.39-49). Muise, R.R., Wright, J.A., Holmes, Q.A. (1996): “Coastal mine detection using COBRA
multispectral sensor” (Proc. SPIE., Vol. 2765, pp. 15-24). Muls A., Meets, W., Meutter, B. de, Abe, B., Damme, D. van, Opstal, M. van. (1998):
“Geodetic and Topographic measurements for the Angola airborne minefield campaign”. (Paper in: Genderen, J.L. van and Maathuis, B.H.P.: Angola airborne minefield detection: pilot project, monthly report, no. 8., July, 1998, Internal publication, ITC, Enschede, the Netherlands).
Muls, A., Damme, D. Van. (1999): “Geodetic Survey of ground markers in Mozambique”. (In: Genderen, J.L. van and Maathuis, B.H.P.: Airborne Minefield Detection Pilot Project, Monthly Report No. 21. August 1999. Internal publication, ITC, Enschede, The Netherlands).
NASA Lyndon B. Johnson Space Center. (1978): Skylab EREP Investigations Summary. NASA SP-399. Washington D.C.
National Academy of Sciences (2000): Alternative technologies to Replace Antipersonnel landmines. Committee on Alternative Technologies to Replace Antipersonnel Landmines. Commission on Engineering and Technical Systems Office of

References
198
International Affairs. National Research Council. Available at: http://books.nap.edu/books/0309073499/html/R1.html
Navalgund, R.R., Jayaraman, V., Kiran Kumar, A.S., Sharma, T., Mathews, K. and Mohanty, K.K. (1996): “Remote Sensing Data Acquisition, Platforms and Sensor Requirements”. (Journal of the Indian Society of Remote Sensing, Vol.24, No. 4, 1996).
Nee, L.J. (1996): “Technology for mine clearance operations. Application of sensor systems to mine survey”. (Proceedings of the International Conference on Mine Clearance Technology, 2-4 July 1996, Copenhagen, Denmark)
Nesbit, R.C. (1996): Eyes of the RAF. A History of Photo-Reconnaissance. Alan Sutton Publishing Ltd. ISBN: 0-7509-1130-1.
Nettleton, D., Groenwald, R. (1988): “AMIDARS flight performance”. (Proc. SPIE, Vol. 979, pp. 8-15).
Nevis, A. (1996): “Image characterization and target recognition in the surf zone environment”. (Proc. SPIE, Vol. 2765, pp. 46-57).
Nguyen, N., Kappra, K., Wong, D., Ressler, M., Sichina, J. (1999): “Mine detection performance in different soil conditions using data from ultra-wideband wide-area surveillance radar”. (Proc. SPIE, Vol. 3710, pp. 930-941).
Nielsen, A.A., Conradsen, K. (1997): Multivariate alteration detection (MAD) in multispectral bi-temporal image data: a new approach to change detection studies. (Technical report IMM-REP-1997-11, IMM Department of Mathematical Modelling, Technical University of Denmark, Lyngby, Denmark).
Nielsen, A.A., Conradsen, K., Simpson, J.J. (1998): “Multivariate alteration detection (MAD) and MAF postprocessing in multispectral, bitemporal image data: new approaches to change detection studies”. (Remote Sensing of Environment, Vol. 64, No. 1, April 1998. pp. 1-19).
Nivelle, F.C., Lhomme, P. (1997): “Detection of landmines with passive IR and mmW imaging sensors”. (Proc. SPIE., Vol. 3079, pp. 614-624).
Norwegian People’s Aid (1995): “Recce on minefield surrounding the town of Songo, Cahora Bassa District, Tete Province”. (Reconnaissance report 4/95, NPA Demining Team, 22-06-1995, internal document).
Norwegian People’s Aid (1995-1996): Minefield Reconnaissance and survey forms. Norwegian People’s Aid Demining Team. (Internal Reports NPA, Tete, Mozambique).
Norwegian People’s Aid (1997): Landmine provincial summaries: 1996-97. (Internal publication NPA, Luanda, Angola).
Orden, van G., Pyl, van der T, Simms, G. Sieber A.J. (1997): “Developments in demining”. (UNIDIR Newsletter, special issue, number SI 3/97. No. ISSN: 1012-4934. pp. 21-26).
Organisation for Economic Co-operation and Development (1999): Environmental Indicators for Agriculture, Volume 2. Issues and Design. OECD Proceedings, ISBN 92-64-17041-3
Orlov, A. (1963): Handbook of Intelligence and Guerrilla Warfare. Ann Arbor, The University of Michigan Press. LCCCN 63-9900.
Oxfam. (1996): Mozambique. Rising from the ashes. An Oxfam country profile. Oxfam (UK and Ireland), Oxford, UK. 1996. ISBN 0-85598-341-8

References
199
Park, J., Tateishi, R., Wikantika, K. (2000): “Multisensor data fusion using multiresolution analysis (MRA)”. (Proceedings XXIII International ISPRS Congress in Amsterdam, July 2000, International Archives of Photogrammetry and Remote Sensing, Vol33, Part B2, pp. 430-436).
Pearce, C. (2000): “Landmines a threat to the recovery of agricultural production”. (Agricultural and Rural Development. 2000 7:1, pp. 21-23).
Peebles, C. (1997): The Corona project: America’s first spy satellites. Airlife Publishing Ltd. ISBN 1-55750-688-4
Pelyushenko, S.A. and Racut, I.V. (1997): “The microwave sensor for detection of anti-infantry mines in subsurface” (Proc. SPIE, Vol. 3079, pp. 643-651).
Perry, K.M., Bishop, P.K. (1998): “Remote Minefield Detection System Technology Demonstation Programme (REMIDS TDP)”, BSI98.
Pohl, C. (1996): Geometric Aspects of Multisensor Image Fusion for Topographic Map Updating in the Humid Tropics. ITC Publication no. 39. ITC, Enschede, The Netherlands. ISBN: 90-6164-121-7.
Pohl, C. and Genderen, J.L. van (1998): “Multisensor image fusion in remote sensing: concepts, methods and applications”. (International Journal of Remote Sensing, Vol. 19, No. 5, pp.823-854).
Powys-Lybbe, U. (1983): The eye of intelligence. William Kimber, London. ISBN: 0-7183-0468-3.
Prokosch, E. (1995): The technology of killing. A military and political history of antipersonnel weapons. Zed Books, London. ISBN: 1-85649-357-1
Richards, J.A. and Jia, X. (1999): Remote Sensing and Digital Image Analysis: an Introduction. Third, Revised and Enlarged Edition. Springer Verlag, Berlin. ISBN: 3-540-64860-7
Richardson, G.T., Merz, R.N. (1996): “High-resolution commercial imagery and open-source information: Implications for arms control”. (Bureau of Intelligence, Verification and Information Management. Intelligence, technology and Analysis Division. United States Arms Control and Disarmament Agency. Intelligence note 13 May 1996). Available at: http://www.fas.org/irp/offdocs/acda.htm
Richelson, J.T. (1990): Americas Secret Eyes in Space: The US Keyhole Spy Satellite Program. Harper and Row, ISBN 0-88730-285-8.
Ridd, M.K., Liu, J. (1998): “A comparison of four algorithms for change detection in an urban environment”. (Remote Sensing of Environment. Vol. 63, 1998, pp. 95-100. Elsevier Science Inc. 1998).
Roberts, S. and Williams, J. (1995): After the guns fall silent: the enduring legacy of landmines. 1st edition, Vietnam Veterans of America Foundation, Washington DC. ISBN: 0-85598-337-X
Rönnbäck, G. (2000):”Airborne Minefield Detection. Change Detection Maps”. (In: Genderen, J.L. van, Maathuis, B.H.P.: Airborne Minefield Detection: Pilot Project. Final Report. Volume 2. ITC, Enschede, The Netherlands. ISBN 90-6164-182-9. pp. 1-14).
Rossi, R.J., Gilmartin, K.J. (1980): Handbook of Social Indicators: Sources, Characteristics and Analysis. Garland STPM Press, New York. ISBN 0-8240-7135-2

References
200
Ruffner, K.C. (1995): Corona: America’s First Satellite Program, CIA Cold War Records. CIA, Washington, DC. National Technical Information Service, Springfield, Virginia, USA. Available at: http://www.cia.gov/sci/books/corona/corona.pdf
Rupiya, M.R. (1998): Landmines in Zimbabwe. A deadly legacy. Sapes Books, Harare, Zimbabwe. ISBN: 1-77905-065-8
Sabins F.F. (1986): Remote Sensing. Principles and Interpretation. 2nd Edition. Freeman Company, New York. ISBN: 0-7167-1793-X
Schaber, G.G. (1999): “SAR studies in the Yuma desert, Arizona: sand penetration, geology and the detection of military ordnance debris”. (Remote Sensing of Environment, 67, pp. 320-347. Elsevier Science Inc. 1999).
Scheerer, K. (1997): “Airborne multisensor system for the autonomous detection of landmines” (Proc. SPIE, Vol. 3079, pp. 478-486).
Schimpf, H., Rühl, M. and Biegel, G. (1997): “SAR measurements of mines and minefields at 35 GHz and 94 GHz” (Proc. SPIE, Vol. 3079, pp. 625-635).
Schutte, K., Sahli, H., Schrottmayer, D., Eisl, M., Javier Varas, J., Bajic, M., Uppsäll, M., Breejen den E. (2001): “ARC: A Camcopter based mine field detection system”. Preprint for Fifth International Arirborne Remote Sensing Conference, San Francisco, California, 17-20 September, 2001.
Shavez, P.S. (1996): “Image-based atmospheric corrections – revisited and improved”. (Photogrammetric Engineering and Remote Sensing, Vol. 62, No.9, September 1996, pp. 1025-1036).
Shukla, R.K., Smith, M.J. (2000): “Geo-referencing CASI imagery using direct measurement of position and attitude”. (Proceedings XXIII International ISPRS Congress in Amsterdam, July 2000, International Archives of Photogrammetry and Remote Sensing, Vol. 33, Part B2, pp. 502-509).
Sieber, A.J. (1995): International workshop and study on the state of knowledge for the localisation and identification of anti-personnel mines. ISP 9501, Joint Research Centre, European Commission, EUR 16329 EN.
Simard, J.R. (1996): “Improved landmine detection capability: systematic approach to the detection of buried mines using passive IR imaging”. (Proc. SPIE, Vol. 2765, pp. 489-500).
Singh, A. (1989): “Digital change detection techniques using remotely-sensed data”. (International Journal of Remote Sensing, Vol. 10, 1989. pp. 989-1003).
Soelberg, P., Storm, J., Stage, B., Sorensen, H.B.D. (2000): “Resolution requirements for thermal detection of buried landmines”. (Proc. SPIE, Vol. 4038, pp. 138-145).
Staal, G. and Voskuil, R.P.G.A. (1980): Een blik op bezet Nederland. Luchtfoto’s van de Geallieerden. Studium General Landbouwhogeschool Wageningen,. Wageningen, The Netherlands.
Stetson, S.P., Witherspoon, N.H., Holloway, J.H., Suiter, H.R., Crosby, F.J., Hilton, R., McCarley, K.A. (2000): “COBRA ATD minefield detection results for the Joint Countermine ACTD Demonstrations”. (Proc. SPIE, Vol. 4038, pp. 1268-1279).
Stockholm International Peace Research Institute. (1978): Anti-personnel Weapons. London, Taylor and Francis.
Suiter, H.R. and Swanson, N.L. (1997): “Sensitivity and noise comparison of intensified multispectral cameras.” (Proc. SPIE Vol. 3079, pp. 770-781).

References
201
Sunar, F. Musaoğlu, N. (1998): “Merging multiresolution SPOT P and Landsat TM data: the effects and advantages”. (International Journal of Remote Sensing, Vol. 19, 1998, No. 2, pp. 219-224).
Tantum, S. and Collins, L. (2000): “Detection and classification of landmine-like targets in a non-Gaussian noise environment”. (Proc. SPIE, Vol. 4038, pp. 900-909)
Thompson, H. (2001): “Koch Mine Safe and the Cordon Sanitaire Clearance Program”. (In: Journal of Mine Action, issue 5.1. Spring 2001, Mine Action Information Centre, James Madison University, ISSN: 1533-9440, pp. 114-119).
Toutin T.T., Cheng, P. (2000): “Demystification of IKONOS”. (Earth Observation Magazine, July 2000). Available at: http://www.eomonline.com/Common/ currentissues/July00/ toutin.htm
Trevelyan, J. (1999): “Improving mine action and mine clearance”. (Proceedings 2nd International Symposium on Operationalization of Remote Sensing, ITC, Enschede, The Netherlands, 16-20 August 1999).
Trevett, J.W. (1986): Imaging radar for resources surveys. University Press, Cambridge. ISBN: 0-412-25520-0
Uhl, B. (1997): “High resolution digital color EO camera system VOS” (Third Int’l. Airborne Remote Sensing Conf. and Exhibition, 7-10 July 1997, Copenhagen, Denmark, Vol. II, pp. 21-28).
United Nations. (1996): Protocol on the prohibitions or restrictions on the use of mines, booby-traps and other devices as amended on 3 May 1996 (Protocol 2 as amended on 3 May 1996). Available at: http://www.unog.ch/frames/disarm/distreat/ mines.htm
United States Department of State (1998): Hidden Killers 1998. The Global landmine Crisis. Bureau of Political-Military Affairs. Prepared by Office of Humanitarian Demining Programs. Department of State Publication 10575, Bureau of Political-Military Affairs, September 1998.
United States Department of State. (1999): To walk the earth in safety. The United States commitment to Humanitarian Demining. Bureau of Political-Military Affairs. Office of Humanitarian Demining Programs. April 1999.
Uppsäll, M. Pettersson, L.M., Georgson, M., Sjökvist, S. (2000): “Temporal IR contrast variations of buried land mines”. (Proc. SPIE, Vol. 4038, pp. 146-155).
Voles, R. (1998): “Confidence in the assessment and use of mine detection systems”. (Proc. EUREL Int’l Conf., Edinburgh, Conf. Publication No. 458. I.E.E. Int’l Conf. On the Detection of Abandoned Landmines, 12-14 Oct. 1998, Edinburgh, pp. 28-30).
Vrabel, J. (1996): “Multispectral imagery band sharpening study”. (Photogrammetric Engineering and Remote Sensing, Vol. 62, No.9, September 1996, pp. 1075-1083).
Vukotich, C.J. (Not dated): “Discoverer / Corona Program Article”. (Published in Astrophile, a publication of the Space Topic Study Unit). Available at: http://www.spacecovers.com/articles/ article_corona.htm
Waltz, E and Llinas, J. (1990): Multisensor data fusion. Artech House, London. ISBN 0-89006-277-3
Watkis, N. C. (1999): The western front from the air. Sutton Publishing Limited. ISBN: 0-7509-1338-X

References
202
Watts, T.M., Cornell, D., Harris, D. (2000): “Mine Hunter/Killer advanced technology demonstrator”. (Proc. SPIE, Vol. 4038, pp. 1194-1203).
Welch, R., Ehlers, M. (1987): “Merging multiresolution SPOT HVR and Landsat TM data”. (Photogrammetric Engineering and Remote Sensing. Vol. 53, No. 3, March 1987, pp. 301-303).
Wiemker, R., Speck, A., Kulbach, D., Spitzer, H., Bienlein, J. (1997): “Unsupervised robust change detection on multispectral imagery using spectral and spatial features”. (Third International Airborne Remote Sensing Conference and Exhibition. 7-10 July, 1997, Copenhagen, Denmark, Vol. I, pp. 640-647)
Winter, E.M. Fields, D.J., Carter, M.R., Bennett, C.L., Lucey, P.G., Johnson, J.R., Horton, K.A., and Bowman, A.P. (1997): “Assessment techniques for airborne infrared land mine detection”. (Third Int’l Airborne Remote Sensing Conf. and Exhibition, 7-10 July, Copenhagen, Denmark, Vol. II, pp. 44-51).
Witherspoon, N.H. and Holloway, J.H. (1992): “Video based multispectral detection of landmines, a technology applicable for use in law enforcement”. (Proc. SPIE, Vol. 1693, pp. 185-194).
Witherspoon, N.H., Holloway, J.H., Davis, K.S., Miller, R.W. and Dubey, A.C. (1995): “The coastal battlefield reconnaissance and analysis (COBRA) program for minefield detection” (Proc. SPIE, Vol. 2496, pp. 500-508).
Witherspoon, N.H. and Holloway, J.R. (1997): “The evolution of multispectral mine detection: the beginning of a solution” (Third Int’l Airborne Remote Sensing Conf. and Exhibition, 7-10 July 1997, Copenhagen, Denmark).
Wolf, D.H., Barmazel, D. (2001): ”The use of limited detonation for level 2 minefield surveying: Technical, reliability and economic issues”. (Paper presented to the UXO / Countermine Forum, New Orleans, Louisiana, April 9-12, 2001)
Wulder, M., Mah, S, Trudeau, D. (1996): “Mission planning for operational data acquisition campaigns with the casi”. (Second Int’l Airborne Remote Sensing Conf. And Exhibition, 24-27 June 1996, San Francisco, California, Vol. III, pp. 53-62).
Yocky, D.A. (1996): “Multiresolution wavelet decomposition image merger of Landsat Thematic Mapper and Spot Panchromatic data”. (Photogrammetric Engineering and Remote Sensing, Vol. 62, No.9, September 1996, pp. 1067-1074)
York, A. M. (1999): “Tac Recce CONOPS: Today and Tomorrow”. (Proc. SPIE, Vol. 3751, pp. 21-29)
Yujiri, L., Hauss, B. and Shoucri, M. (1997): “Microwave/millimeter wave radiometric detection of metal and plastic mines”. (Proc. SPIE, Vol. 3079, pp. 652-658)
Yvinec, Y., Druyts, P., Lacroix, V., Ouaghli, Y., Mahamadou, I. (1999): ”Airborne minefield detection: Pilot project. RMA / SIC Final report”. (In Genderen, J.L. van, Maathuis, B.H.P.: Airborne Minefield Detection: Pilot Project. Final Report. Volume 2. ITC,. Enschede, The Netherlands. ISBN 90-6164-182-9. pp. 1-99).
Zhang, X. (1998): Coal fires in Northwest China. Detection, Monitoring and Prediction using Remote Sensing Data. PhD. Thesis University Delft, The Netherlands. ITC Publication 58, ITC, Enschede, The Netherlands. ISBN 90-6164-144-6.
Zeler, B. (1997): “The concept of a humanitarian airborne minefield detection project” (Third Int’l Airborne Remote Sensing Conf. and Exhibition, 7-10 July 1997, Copenhagen, Denmark, Vol II, pp. 13-19).

References
203
Internet references URL-1 Defence Systems Daily (26-03-2001): New technologies hold promise for
eliminating antipersonnel landmines. Available at: http://defence-data.com/ current /page10341.htm
URL-2 Space Project Policy. (not dated): Desert Storm- Military Space Imagery Intelligence. Available at: http://www.fas.org/spp/militar/docops/operate/ds/ images.htm
URL-3 Burrows.W.E. (not dated): Imaging Space Reconnaissance Operations during the Cold War: Cause, Effect and Legacy. The Cold War Experience. Part of the Cold War Forum website. Available at: http://webster.hibo.no/asf/Cold_War/report1/ williame.htm
URL-4 West Indian Space (05-12-2000): EROS A1 Satellite launched into space. World’s lightest weight commercial satellite to provide high-resolution imagery of earth. Available at: http://coresw.com/news/isi20001205.htm
URL-5 West Indian Space (not dated): EROS satellites conceptual mode of operation. Available at: http://coresw.com/ WIS/Operational_Concept.html
URL-6 Earthwatch. 21-11-2000: Earthwatch announces Quickbird1 satellite a loss. Available at:http://www.digitalglobe.com/news/news_11_21_00.shtm
URL-7 Earthwatch. (not dated): Quickbird1 specifications Available at: http://www. digitalglobe.com/products/quickbird1.shtm
URL-8 Orbimage. (2000): Orbimage system. Available at: http://www.orbimage.com/ corp/orbimage_system/system.htm
URL-9 Sovinformsputnik (not dated) MK-4 and KFA-1000 Cameras. Available at: http://www-com.iasis.svetcorp.net/ mk_kfa.htm
URL-10 Eurimage (last updated 27-04-2000): KFA-1000 (MIR). Available at: http://www.eurimage.com/Products/ KFA_1000.htm
URL-11 Sovinformsputnik. (not dated): Spin-2. Camera Systems. http://www.spin2.com/ camera.htm
URL-12 Neo. (not dated): KVR-1000 en KFA-1000 (MIR). Remote Sensing in Nederland; de Neo website. http://www.neo.nl/kvr.htm
URL-13 Eurimage. (last updated 27-04-2000): KVR-1000 & TK-350 (Cosmos). Available at: http://www.eurimage.com/Products/KVR_1000.htm
URL-14 Eurimage (last updated 27-04-2000): MK-4. Available at: http://www.eurimage. com/Products/MK_4.htm
URL-15 Sovinformsputnik (not dated): Kometa-20 has landed. Available at: http://www-com.iasis.svetcorp.net/ kometa_land_news.htm
URL-16 Space Imagine (19-01-2001): Space Imaging awarded license to provide half meter resolution commercial satellite imagery. Available at: http://www.spaceimaging.com/ newsroom/releases/2001/halfmeter_license.htm
URL-17 US Department of Energy (03-06-2001): Multi Spectral Imager (MTI). Available at: http://nis-www.lanl.gov/nis-projects/mti/
URL-18 Los Alamos National Laboratory (14 June 2000): MTI satellite begins scientific work, maps Cerro Grande Fire damage. Available at: http://www.lanl.gov/worldview/news/releases/archive/00-082.shtml
URL-19 Mineseeker Foundation (2001): Summary. Report1, Volume1, January 2001. Available at: http://www.mineseeker.org/download/pdf/summary.pdf

References
204
URL-20 Mineseeker Foundation (2001): UWB SAR Sensor. Available at: http://www.mineseeker.org/download/pdf/sensor.pdf
URL-21 Szymaski, J., Bloch, J. (2000): “Rapid Feature Identification Project. Generic algorithms used for feature identification in remotely-sensed imagery”. Available at: http://www.daps.lanl.gov/genie/briefings/RFIP_Talk_6_2000.pdf
205
About the author Bernardus Henricus Pancratius Maathuis was borne in Borne (The Netherlands) on April 25, 1962. After completion of primary and secondary education in Borne and Hengelo respectively, he went to study at the Teacher Training College (“leraren-opleiding”) Ubbo Emmius in Leeuwarden and Groningen, specializing in Geography and History. After obtaining his degree in 1985 he continued his studies at the International Institute for Aerospace Survey and Earth Sciences (ITC) in the Division of Applied Geomorphology and Engineering Geology. He did his MSc research on fluvial dynamics and flood hazard of the Komering floodplain in South Sumatra and obtained an MSc degree in 1988. Subsequently, for a three year period, he was employed by the Department of Physical Geography, University of Frankfurt (Germany) and was stationed in Chiang Mai (Northern Thailand) to conduct a natural resource inventory and mapping project in collaboration with the Department of Geography, at Chiang Mai University. From 1991 till present, he is working in the Division of Applied Geomorphology (ITC), mainly in the field of natural hazard studies and the application of geographic information systems and remote sensing. During this period he was actively involved in training and education at the Institute, but was also involved in many projects and consulting activities. In this period he travelled abroad on numerous occasions, mainly to countries in SE Asia, the Middle East and Africa. In 1998 and 1999 he was project manager and responsible for the execution and progress of an airborne minefield detection pilot project. Since 1998 he changed his research interest also to humanitarian hazards, especially towards the detection of minefields, applying his experiences in aerial photo interpretation and (digital) image processing, and has carried out fieldwork in several mine affected countries in Africa and Central Europe.

Appendix
206

Appendix
207
Appendix 1: Samples of Image Enlargements

Appendix
208
Enlargement 1: M6- antitank mine line Test field “C” This figure shows the M6-antitank alignment of test field “C” on a colour aerial photo, acquired on the 18th of September 1997, at a scale of 1:500 (image source: Airborne Minefield Detection Pilot Project, recorded by Eurosense). The image was scanned, using a photogrammetric scanner, with a resolution of 5 micron, directly from the film. The image on the left side shows the alignment from the east to the west, top to bottom respectively. The individual mine locations are numbered from 1 to 10 and the red circles indicate their positions, these have been validated in the field. The image chips given on the right hand side provide enlargements of the ten mine locations. Some general indicators can be observed on the left hand side image, like the reference panels, wire fencing and poles / pickets left after minefield construction. Also a surface laid M6 AT mine can be seen, partly obscured by the heather vegetation. The shadow of the pole marking the western perimeter of this alignment can also be seen. On some of the enlargements the impact of mine deployment can be deducted using disturbances in the vegetation. Enlargements 1, 2, 4, 5, 6, 7 and 8 show signs of vegetation disturbances on those locations where mines have been buried. Enlargements 3 and 10 hardly show any signs of mine deployment but their positions can be inferred using the regular pattern of vegetation disturbances taking into consideration the other locations along this alignment. The other indicators like the poles left in the area, probably used for surveying the exact mine location, can be observed on enlargements 3, 6 and 8. A very thin wire that was probably used for the layout of the alignment can vaguely be identified on enlargements 1, 2, 3 and 7. Further information is presented in chapter 5.4.2.

Appendix
209
Enlargement 1: M6-AT mine line Test field “C”
1
2
3
4
5
6
7
8
9
10
1
2
3
4
5
6
7
8
9
10
East
West

Appendix
210
Enlargement 2: Location of individual AT-mines, northern portion of Minefield “W”
Minefield alignment Directly observed Inferred by pattern

Appendix
211
Enlargement 2: Location of individual AT-mines, northern portion of Minefield “W” This alignment of the northern portion of minefield “W” was taken from a colour aerial photo, acquired on the 10th of May 1998, original photo scale 1 : 575 (image source: Airborne Minefield Detection Pilot Project, recorded by Eurosense). The image was scanned using an ordinary flatbed scanner at a resolution of 450 DPI, directly from the contact print. According to the ground truth tables provided by the Belgium military this part of the AT-minefield was surface laid. A number of antitank mines appear at the surface and can be directly detected. Based on their occurrence the direction of the alignment can be established. Given the fact that two non-obscured mines appear relatively close together, in relation to the one visible at the top of this minefield, an idea can be obtained about the spacing of the individual mines deployed. Using the pattern that can be derived from this spacing interval also the mines that have been deployed, but are obscured by the heather vegetation (approximately 30 to 50 cm. high), can be inferred. Due to the fact that these mines are surface laid minimal signs of vegetation disturbances are to be expected at these locations. Without an idea of the spacing (pattern) and direction of this alignment it would not have been possible to identify these mine locations. The VOS-80C digital camera image of this area is presented in figure 5.16 and the southern extension of this alignment is described in chapter 5.4.3.

Appendix
212
Enlargement 3: The use of poles as indirect indicator.
Location of pole Mine alignment

Appendix
213
Enlargement 3: The use of poles as indirect indicator. This colour photo of minefield “D” was taken on the 10th of May, 1998, original photo scale is 1 : 575. The image is scanned from a photographic enlargement having an approximate scale of 1: 50 using an ordinary flatbed scanner at 450 DPI (image source: Airborne Minefield Detection Pilot Project, recorded by Eurosense). Through the use of stereoscopic image interpretation in combination with photographic enlargements two alignments could be identified on the aerial photos, using identical poles as have been detected in test field “C”. Vegetation or soil marks indicating possible mine locations could not be determined. The photograph given below, taken during subsequent fieldwork, shows the area. The red arrows indicate the poles, and the AP-mines found are marked by the sticks (within the red circles) that have been inserted on those places where the position of the landmines could be validated in the field. Not all AP-mines could be found. It is obvious looking at the aerial photo and the field photo below, that if it would not be through the use of such indicators, this minefield would probably not have been detected. More details are presented in chapter 5.4.3 and 5.4.4.

Appendix
214
Enlargement 4: Indicators for minefield perimeter delineation, Buzi.
White painted stones marking path through
minefield
Special marking on railway tracks
Remnant of wire fencing
Controlled access: gate post
Railway tracks used
for minefield marking

Appendix
215
Enlargement 4: Indicators for minefield perimeter delineation, Buzi. The enlargement shows a portion of a colour infrared aerial photo, original image scale 1 : 500, acquired of the Buzi minefield during the airborne campaign in Mozambique on the 6th of November 1998 (image source: Airborne Minefield Detection Pilot Project, recorded by Eurosense). The image was scanned, using an ordinary flatbed scanner at 450 DPI from a photographic enlargement at a scale of 1 : 50. In order to determine this area as a potential minefield use is made of indicators showing that the area has controlled access (remnants of the gate along the road) in combination with the occurrence of a regular pattern of two rows of upright standing railway tracks, situated approximately 5 metres apart. Other details, clearly linked to the occurrence of a minefield also appear, like the special marking of the top of the railway track (painted white) and the occurrence of an alignment of white painted stones, marking the location and the perimeter of a footpath through the minefield respectively. In this section of the minefield no clear impression can be obtained of the minefield perimeter if only land use differences are being considered. Therefore the use of other indicators, such as the upright standing railway tracks with remnants of wire fencing in between, allows for the determination of the minefield boundary. Detailed interpretation inside the minefield does not reveal the locations of individual AP-mines. Given the fact that this minefield was constructed a long time ago, vegetation anomalies no longer exist. Apart from mine placement disturbances affecting the vegetation, regular burning practices prior to the start of the agricultural season have a strong impact on the vegetation inside the minefield, limiting the use of this indicator for individual landmine detection. The next page shows an uncontrolled photo mosaic (image source: Airborne Minefield Detection Pilot Project, recorded by Eurosense, on the 6th of November 1998, colour photo, original image scale 1 : 2000) prepared for the whole minefield, circumventing the sugar processing factory and airstrip. Also a survey map is given for comparison. This map was attached to the level 1 survey report and was used as reference for the airborne campaign.

Appendix
216
Health post
Market
Houses
Sugar factory
Airstrip
Buzi river
N
Area given in figures 6.3 and 6.4
Buzi river
Airstrip
Road to factory
Area given in Enlargement 4
Buzi river
Uncontrolled photo mosaic of Buzi minefield.
The dashed line on the uncontrolled photo mosaic marks the minefield. When the survey map and the mosaic are compared large differences can be observed with respect to the general layout of the minefield (note also the landing strip). Apart from being able to quickly establish the boundary of this minefield, the images also facilitate immediate map production that can be used directly for further field validation. When geometric precision is important orthophoto maps have to be prepared as base maps. More details are presented in chapter 6.2.1.2 and 6.4.2.
Survey report sketch map of Buzi minefield
Minefield

Appendix
217
Enlargement 5: Land use changes as minefield indicator, Songo.
Minefield perimeter

Appendix
218
Enlargement 5: Land use changes as minefield indicator, Songo. This enlargement was obtained from colour images acquired during the Mozambique airborne campaign on the 16th of November 1998 (image source: Airborne Minefield Detection Pilot Project, recorded by Eurosense). The data was scanned directly from the contact print (original photo scale 1 : 3.000) using a flatbed scanner at 600 DPI. Apart from the proximity to the occurrence of a dirt road (presently out of use), which proved to be a good indicator for the general identification of this minefield alignment, the perimeter of this minefield can be more accurately determined using differences in land use pattern. This enlargement, situated on the eastern side of the village Songo, shows a number of small settlements as well as their arable lands. In the middle a continuous strip of idle land is situated, clearly contrasting with the surrounding area. No agriculture is practiced in this strip nor is firewood being collected from here, although the area has similar agricultural potential compared to the surrounding environment. More steeper sloping land is being used / preferred instead of the suitable land use areas situated within this alignment.
Signs of erosion can be observed, not only on / along the dirt road, but also gullies appear in the agriculturally used areas, even extending into the minefield at a number of places. Identification of these sites provides additional information with regard to a possible re-location of landmines due to erosion phenomena. Therefore apart from clearance activities within the minefield, also the gullies extending from the minefields need to be surveyed. Given the general terrain configuration it was not possible to collect higher resolution images, but these types of indicators can still be clearly identified on the images acquired, allowing for the determination of the minefield perimeter. The sketch map given here was attached to the level 1 survey report of the Songo minefield. The

Appendix
219
minefield as it was identified from aerial photographs and satellite images in this area is given below. Although demining has already started, the complete extent of the minefield is still not surveyed. The image given below shows the layout of the minefield (image source: Airborne Minefield Detection Pilot Project, Landsat Thematic Mapper, 03-09-1984, minefield layout by author). Songo minefield as identified from standoff detection.
The blue line represents the area that has been demined. The red line is the continuation thatcould be mapped using the large scale airborne data that was collected during the airbornecampaign. The yellow line represents the possible continuation of this minefield at the otherside of the Zambezi river, identified using multi-temporal satellite change detectiontechniques. This total layout completely circumvents Songo and the dam site. More details on this minefield are presented in chapter 6.2.1.5 and 6.4.5.

Appendix
220

Appendix
221
Appendix 2: Sources and details of images and tables presented in the thesis

Appendix
222
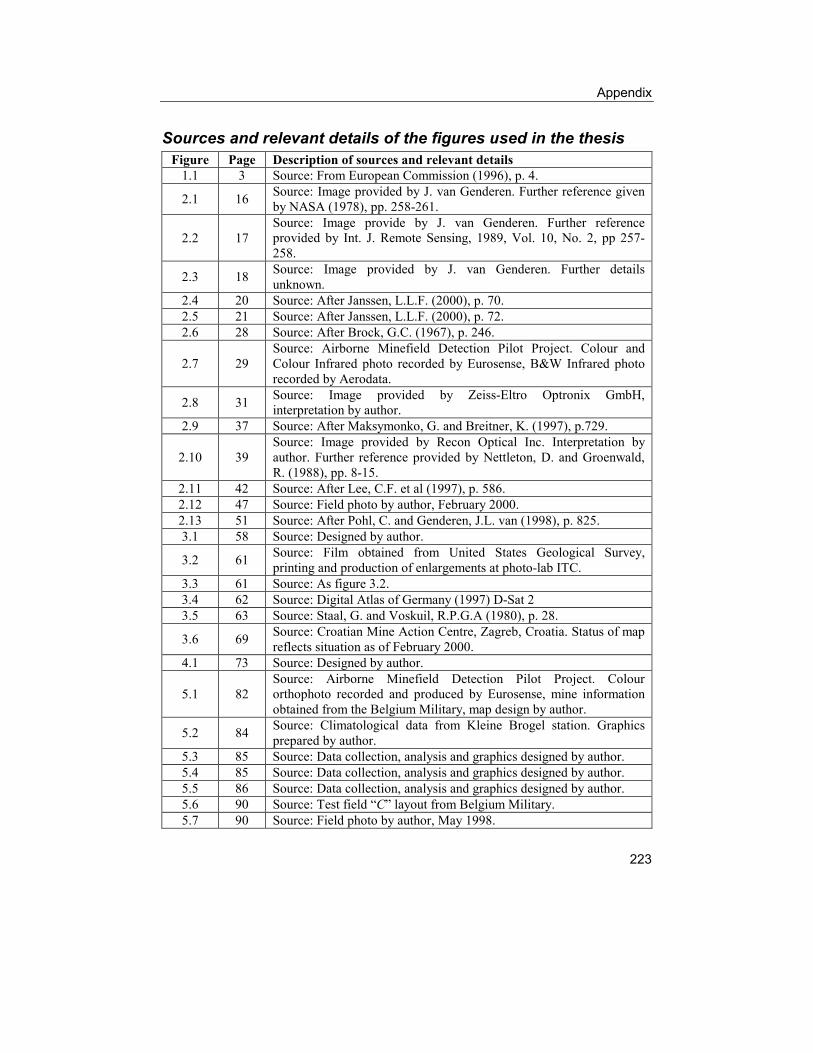
Appendix
223
Sources and relevant details of the figures used in the thesis Figure Page Description of sources and relevant details
1.1 3 Source: From European Commission (1996), p. 4.
2.1 16 Source: Image provided by J. van Genderen. Further reference given by NASA (1978), pp. 258-261.
2.2 17 Source: Image provide by J. van Genderen. Further reference provided by Int. J. Remote Sensing, 1989, Vol. 10, No. 2, pp 257-258.
2.3 18 Source: Image provided by J. van Genderen. Further details unknown.
2.4 20 Source: After Janssen, L.L.F. (2000), p. 70. 2.5 21 Source: After Janssen, L.L.F. (2000), p. 72. 2.6 28 Source: After Brock, G.C. (1967), p. 246.
2.7 29 Source: Airborne Minefield Detection Pilot Project. Colour and Colour Infrared photo recorded by Eurosense, B&W Infrared photo recorded by Aerodata.
2.8 31 Source: Image provided by Zeiss-Eltro Optronix GmbH, interpretation by author.
2.9 37 Source: After Maksymonko, G. and Breitner, K. (1997), p.729.
2.10 39 Source: Image provided by Recon Optical Inc. Interpretation by author. Further reference provided by Nettleton, D. and Groenwald, R. (1988), pp. 8-15.
2.11 42 Source: After Lee, C.F. et al (1997), p. 586. 2.12 47 Source: Field photo by author, February 2000. 2.13 51 Source: After Pohl, C. and Genderen, J.L. van (1998), p. 825. 3.1 58 Source: Designed by author.
3.2 61 Source: Film obtained from United States Geological Survey, printing and production of enlargements at photo-lab ITC.
3.3 61 Source: As figure 3.2. 3.4 62 Source: Digital Atlas of Germany (1997) D-Sat 2 3.5 63 Source: Staal, G. and Voskuil, R.P.G.A (1980), p. 28.
3.6 69 Source: Croatian Mine Action Centre, Zagreb, Croatia. Status of map reflects situation as of February 2000.
4.1 73 Source: Designed by author.
5.1 82 Source: Airborne Minefield Detection Pilot Project. Colour orthophoto recorded and produced by Eurosense, mine information obtained from the Belgium Military, map design by author.
5.2 84 Source: Climatological data from Kleine Brogel station. Graphics prepared by author.
5.3 85 Source: Data collection, analysis and graphics designed by author. 5.4 85 Source: Data collection, analysis and graphics designed by author. 5.5 86 Source: Data collection, analysis and graphics designed by author. 5.6 90 Source: Test field “C” layout from Belgium Military. 5.7 90 Source: Field photo by author, May 1998.

Appendix
224
5.8 91 Source: (A) image taken from “Mine facts” prepared by Department of Defence (1997); (B & C) Airborne Minefield Detection Pilot Project. Colour and Colour Infrared photo recorded by Eurosense.
5.9 91 Source: Airborne Minefield Detection Pilot Project. Colour photo recorded by Eurosense, interpretation by author.
5.10 92 Source: Airborne Minefield Detection Pilot Project. Colour photo recorded by Eurosense, interpretation by author.
5.11 93
Source: Airborne Minefield Detection Pilot Project. Colour orthophoto recorded and produced by Eurosense, mine information obtained from the Belgium Military, interpretation and map design by author.
5.12 94 Source: Airborne Minefield Detection Pilot Project. Colour photo recorded by Eurosense, interpretation by author.
5.13 99 Source: Airborne Minefield Detection Pilot Project. Colour Infrared photo recorded by Eurosense, interpretation by author.
5.14 99 Source: Airborne Minefield Detection Pilot Project. Colour photo recorded by Eurosense, interpretation by author.
5.15 101 Source: Airborne Minefield Detection Pilot Project. Digital camera image data recorded by ZEO.
5.16 102 Source: Airborne Minefield Detection Pilot Project. Digital camera image data recorded by ZEO, interpretation by author.
5.17 103 Source: Airborne Minefield Detection Pilot Project. IRLS image data recorded by Recon Optical Inc., Fourier transform by author.
5.18 103 Source: Airborne Minefield Detection Pilot Project. IRLS image data recorded by Recon Optical Inc. Image enhancement by author.
5.19 104 Source: Airborne Minefield Detection Pilot Project. IRLS image data recorded by Recon Optical Inc. Mine positions by Belgium Military. Image rectification, enhancement and map design by author.
5.20 105 Source: Designed by author. 5.21 105 Source: Designed by author.
5.22 107 Source: Airborne Minefield Detection Pilot Project. X-band radar image data recorded by Aerosensing. Mine positions by Belgium Military. Image enhancement and map design by author.
5.23 108 Source: Airborne Minefield Detection Pilot Project. X-band radar image data recorded by Aerosensing. Image enhancement by author.
5.24 109 Source: Designed by author.
5.25 110 Source: Airborne Minefield Detection Pilot Project. X-band radar image data recorded by Aerosensing. Mine positions by Belgium Military. Image enhancement and map design by author.
5.26 112 Source: Airborne Minefield Detection Pilot Project. Satellite images obtained by Swedish Space Corporation. Image processing by author.
6.1 121 Source: CIA, The World Factbook, further reference at http//www.odci.gov/cia/publications/factbook/index.htm
6.2 124 Source: Field photos by author, August 1998. 6.3 127 Source: Airborne Minefield Detection Pilot Project. Colour and

Appendix
225
Colour Infrared photo recorded by Eurosense, interpretation by author.
6.4 128 Source: Airborne Minefield Detection Pilot Project. Thermal Infrared image recorded by Zeiss Eltro-Optronix GmbH. Image mosaic and enhancement by author.
6.5 129 Source: Airborne Minefield Detection Pilot Project. Colour orthophoto recorded and produced by Eurosense, interpretation and map design by author.
6.6 130 Source: Airborne Minefield Detection Pilot Project. Colour orthophoto recorded and produced by Eurosense, interpretation and map design by author.
6.7 131 Source: Airborne Minefield Detection Pilot Project. Colour photo recorded by Eurosense, interpretation by author.
6.8 132 Source: Airborne Minefield Detection Pilot Project. Colour photo recorded by Eurosense, interpretation by author.
6.9 140 Source: Airborne Minefield Detection Pilot Project. Satellite images obtained from Swedish Space Corporation. Image processing by author.
6.10 140 Source: Airborne Minefield Detection Pilot Project. Satellite images obtained from Swedish Space Corporation. Image processing by author.
6.11 141
Source: Airborne Minefield Detection Pilot Project. Satellite images obtained from Swedish Space Corporation. Image processing by author, using co-registered MSS images from 1973, 1977 and 1989. Bands selected for the Red, Green and Blue colour assignment are: Red: Log residuals of MSS band 2 of 1973; Green: Internal average relative reflectance of Landsat MSS band 2 of 1973; Blue: Fast Fourier Transformed Principal Component - 6.
6.12 142 Source: Airborne Minefield Detection Pilot Project. Satellite images obtained from Sovinformsputnik, Russia. Image enhancement and interpretation by author.
6.13 142 Source: Airborne Minefield Detection Pilot Project. Satellite image obtained from Swedish Space Corporation. Image processing and interpretation by author.
6.14 143 Source: Airborne Minefield Detection Pilot Project. Image processing and interpretation by author.
6.15 146 Source: CIA, The World Factbook, further reference at http//www.odci.gov/cia/publications/factbook/index.htm, minefields from Blagden, P.M. (1997).
6.16 146 Source: After Rupiya, M.R. (1998), p. 25 and Elliot, G. (2000) “De-mining Debate, Issue 4”. South African Institute of International Affairs, p. 5.
6.17 146 Source: After Rupiya, M.R. (1998), p. 52 and Elliot, G. (2000) “De-mining Debate, Issue 4”. South African Institute of International Affairs, p. 5.
6.18 147 Source: Aerial photographs obtained from Airsurv, Harare,

Appendix
226
Zimbabwe. Interpretation and map design by author.
6.19 148 Source: Aerial photographs obtained from Airsurv, Harare, Zimbabwe. Interpretation and map design by author.
6.20 150 Source: Aerial photographs obtained from Airsurv, Harare, Zimbabwe. Image rectification, enhancement and interpretation by author.
6.21 151 Source: Aerial photographs obtained from Airsurv, Harare, Zimbabwe. Image rectification, enhancement and interpretation by author.
6.22 151 Source: Aerial photographs obtained from Airsurv, Harare, Zimbabwe. Image rectification, enhancement and interpretation by author.
6.23 153 Source: Satellite images obtained from Sovinformsputnik, Russia. Image enhancement and interpretation by author.
6.24 154 Source: Satellite image from ITC image archive. Image processing and interpretation by author.
6.25 155 Source: Satellite image from ITC image archive, Topographical map from the Survey of Zimbabwe, Harare, Zimbabwe. Image processing, interpretation and map updating by author.
6.26 156 Source: Satellite image from ITC image archive, Topographical map from the Survey of Zimbabwe, Harare, Zimbabwe. Image processing and interpretation by author.
6.27 156 Source: Satellite image from ITC image archive, Topographical map from the Survey of Zimbabwe, Harare, Zimbabwe. Image processing and interpretation by author.
6.28 156 Source: Satellite image from ITC image archive, Topographical map from the Survey of Zimbabwe, Harare, Zimbabwe. Image processing and interpretation by author.

Appendix
227
Sources and relevant details of the tables used in the thesis Table Page Description of sources and relevant details
2.1 14 Source: Adapted from McDonald, R.A. (1995), p. 718. 2.2 14 Source: Adapted from McDonald, R.A. (1995), p. 718. 2.3 19 Source: Compiled by author.
2.4 23 Source: Center for Science and International Security (SENSIS), (2001), Appendix A, p. 5.
2.5 25 Source: Compiled by author.
2.6 27 Source: Adapted from Eastman Kodak Company (1996), “Characteristics of Kodak aerial films”, Company brochure.
2.7 30 Source: Performance data provided by Zeiss Eltro-Optronix GmbH. 2.8 40 Source: After Winter, E.M. (1997), p. II-51. 2.9 46 Source: After Richardson, G.T and Merz, R.N. (1996), p. 3.
3.1 66 Source: Compiled from “level 1 and 2 survey reports of HALO Trust and NPA, table design by author.
3.2 68 Source: Compiled from “level 1 and 2 survey” reports of HALO Trust and NPA, table design by author.
5.1 83 Source: Airborne Minefield Detection Pilot Project. After Royal Military Academy, Belgium Military.
5.2 83 Source: Airborne Minefield Detection Pilot Project. After Royal Military Academy, Belgium Military. Table design by author.
5.3 83 Source: Airborne Minefield Detection Pilot Project. After Royal Military Academy, Belgium Military. Table design by author.
5.4 88 Source: Airborne Minefield Detection Pilot Project. Table design by author.
6.1 125 Source: Airborne Minefield Detection Pilot Project. Table design by author.
6.2 137 Source: Airborne Minefield Detection Pilot Project. Table design by author.
6.3 137 Source: Satellite image archive ITC. Table design by author.
6.4 138 Source: Aerial photographs obtained from Airsurv, Harare, Zimbabwe. Table design by author.
7.1 165 Source: Compiled and table design by author. 7.2 170 Source: Compiled and table design by author. 7.3 172 Source: Compiled and table design by author.

Appendix
228