Expression and Functional Profiling of Neprilysin, Insulin Degrading Enzyme and Endothelin...
22
Expression and functional profiling of neprilysin, insulin degrading enzyme and endothelin converting enzyme in prospectively studied elderly and Alzheimer’s brain Suqing Wang 1,4,* , Rui Wang 1,5,* , Lang Chen 1 , David A. Bennett 2 , Dennis W. Dickson 3 , and Deng-Shun Wang 1,6 1 Department of Pathology and Laboratory Medicine, School of Medicine and Public Health, University of Wisconsin, Madison, WI 53705, USA 2 Rush Alzheimer’s Disease Center, Rush University Medical Center, Chicago, IL, USA 3 Department of Pathology (Neuropathology) and Neuroscience, Mayo Clinic College of Medicine, Jacksonville, FL 32224, USA 4 Department of Nutrition and Food Health, School of Public Health, Wuhan University 5 Department of Pharmaceutical Sciences, School of Pharmacy, East China University of Science & Technology Abstract The brain steady state level of Aβ is determined by the balance between its production and removal, the latter through egress across blood and CSF barriers as well as Aβ degradation. The major Aβ degrading enzymes are neprilysin (NEP), insulin degrading enzyme (IDE) and endothelin converting enzyme (ECE-1). Although evidence suggests that NEP is down-regulated in AD, the role of IDE and ECE in the Aβ accumulation in aging and dementia remains less certain. In this study, we examined mRNA and protein expression, as well as biological activity of NEP, IDE and ECE-1 in human frontal cortex by real-time RT-PCR for mRNA, immunoblotting for protein and highly sensitive and specific fluorescence assays for activity. The relationships between Aβ degrading enzymes and pathologic measures and clinical features were also assessed. The results showed that NEP mRNA, protein level and activity were decreased in AD compared with normal controls with no cognitive impairment (NCI). In contrast IDE activity was unchanged, but there was higher expression of IDE mRNA, indicating a possible compensatory reaction due to deficits in activity. ECE-1 expression in AD brain showed no significant difference compared to age-matched controls. Correlation analyses suggested that NEP expression was correlated with Aβ accumulation and clinical diagnosis, being lower in AD than in NCI. In contrast, neither IDE nor ECE-1 correlated with Aβ or clinical diagnosis. These findings provide additional support for NEP as the major protease involved in Aβ degradation and suggest its possible therapeutic targeting in AD. Keywords Amyloid degrading enzymes; neprilysin (NEP); endothelin converting enzyme (ECE); insulin degrading enzyme (IDE); β-amyloid (Aβ); degradation; Alzheimer’s disease (AD); AD brain 6 Corresponding Author: Deng-Shun Wang, MD, PhD, Department of Pathology and Laboratory Medicine, University of Wisconsin School of Medicine and Public Health, Madison, WI 53705, USA, Tel: 608-262 9825, Fax: 608-265-3301, [email protected]. * These authors contributed equally NIH Public Access Author Manuscript J Neurochem. Author manuscript; available in PMC 2011 October 1. Published in final edited form as: J Neurochem. 2010 October ; 115(1): 47–57. doi:10.1111/j.1471-4159.2010.06899.x. NIH-PA Author Manuscript NIH-PA Author Manuscript NIH-PA Author Manuscript
Transcript of Expression and Functional Profiling of Neprilysin, Insulin Degrading Enzyme and Endothelin...
Expression and functional profiling of neprilysin, insulindegrading enzyme and endothelin converting enzyme inprospectively studied elderly and Alzheimer’s brain
Suqing Wang1,4,*, Rui Wang1,5,*, Lang Chen1, David A. Bennett2, Dennis W. Dickson3, andDeng-Shun Wang1,6
1 Department of Pathology and Laboratory Medicine, School of Medicine and Public Health,University of Wisconsin, Madison, WI 53705, USA2 Rush Alzheimer’s Disease Center, Rush University Medical Center, Chicago, IL, USA3 Department of Pathology (Neuropathology) and Neuroscience, Mayo Clinic College of Medicine,Jacksonville, FL 32224, USA4 Department of Nutrition and Food Health, School of Public Health, Wuhan University5 Department of Pharmaceutical Sciences, School of Pharmacy, East China University of Science& Technology
AbstractThe brain steady state level of Aβ is determined by the balance between its production andremoval, the latter through egress across blood and CSF barriers as well as Aβ degradation. Themajor Aβ degrading enzymes are neprilysin (NEP), insulin degrading enzyme (IDE) andendothelin converting enzyme (ECE-1). Although evidence suggests that NEP is down-regulatedin AD, the role of IDE and ECE in the Aβ accumulation in aging and dementia remains lesscertain. In this study, we examined mRNA and protein expression, as well as biological activity ofNEP, IDE and ECE-1 in human frontal cortex by real-time RT-PCR for mRNA, immunoblottingfor protein and highly sensitive and specific fluorescence assays for activity. The relationshipsbetween Aβ degrading enzymes and pathologic measures and clinical features were also assessed.The results showed that NEP mRNA, protein level and activity were decreased in AD comparedwith normal controls with no cognitive impairment (NCI). In contrast IDE activity wasunchanged, but there was higher expression of IDE mRNA, indicating a possible compensatoryreaction due to deficits in activity. ECE-1 expression in AD brain showed no significant differencecompared to age-matched controls. Correlation analyses suggested that NEP expression wascorrelated with Aβ accumulation and clinical diagnosis, being lower in AD than in NCI. Incontrast, neither IDE nor ECE-1 correlated with Aβ or clinical diagnosis. These findings provideadditional support for NEP as the major protease involved in Aβ degradation and suggest itspossible therapeutic targeting in AD.
KeywordsAmyloid degrading enzymes; neprilysin (NEP); endothelin converting enzyme (ECE); insulindegrading enzyme (IDE); β-amyloid (Aβ); degradation; Alzheimer’s disease (AD); AD brain
6Corresponding Author: Deng-Shun Wang, MD, PhD, Department of Pathology and Laboratory Medicine, University of WisconsinSchool of Medicine and Public Health, Madison, WI 53705, USA, Tel: 608-262 9825, Fax: 608-265-3301, [email protected].*These authors contributed equally
NIH Public AccessAuthor ManuscriptJ Neurochem. Author manuscript; available in PMC 2011 October 1.
Published in final edited form as:J Neurochem. 2010 October ; 115(1): 47–57. doi:10.1111/j.1471-4159.2010.06899.x.
NIH
-PA Author Manuscript
NIH
-PA Author Manuscript
NIH
-PA Author Manuscript
IntroductionAlzheimer disease is a progressive neurodegenerative disease of the elderly characterized bydeposition of Aβ in the brain as amyloid plaques and amyloid angiopathy. Aβ isphysiologically produced by proteolytic cleavage of amyloid precursor protein (APP) by theconcerted action of β- and γ-secretases, and its pathologic accumulation in AD indicates animbalance between Aβ biosynthesis and clearance (Eckman and Eckman 2005; Higuchi etal. 2005; Wang et al. 2006). Under normal conditions, as revealed in pulse-chase studies inmice, Aβ is rapidly removed from the brain after its synthesis (Cirrito et al. 2003).Deficiencies in Aβ clearance or enzyme-mediated Aβ degradation are thought to lead toaccumulation and aggregation of Aβ, which in turn, triggers a complex multistep cascadeleading to dementia. Therefore, strategies that lower Aβ levels in the brain may stop or delayonset of AD (Eckman and Eckman 2005; Higuchi et al. 2005; Wang et al. 2006; Miners etal. 2008c; Bates et al. 2009).
In the past decade multiple proteases have been shown to be capable of cleaving Aβ,including neprilysin (NEP), insulin-degrading enzyme (IDE) and endothelin-convertingenzyme-1 (ECE-1), and a number of experimental and epidemiological studies implicatethese enzymes in normal homeostasis of Aβ in the brain (Eckman and Eckman 2005;Higuchi et al. 2005; Wang et al. 2006; Miners et al. 2008c; Bates et al. 2009).
While NEP appears to be the dominant Aβ protease (Vardy et al. 2005; El-Amouri et al.2008; Hersh and Rodgers 2008; Miners et al. 2008c), other catabolic enzymes such as ECEand IDE likely participate in regulating the steady-state levels of Aβ (Eckman et al. 2006;Qiu and Folstein 2006; Llovera et al. 2008). NEP is a type II integral membrane protein,known as zinc metallopeptidase, composed of 750 residues with an active site at itsextracellular carboxyl-domain. NEP is capable of degrading monomeric and oligomericforms of Aβ (El-Amouri et al. 2008). Neprilysin deficient mice have significantly elevatedbrain Aβ levels, and treatment with NEP inhibitors can cause a rapid increase of Aβ levels inthe brain, associated with memory impairment (Apelt et al. 2003; Farris et al. 2007). Bycontrast, deposition of Aβ in NEP deleted mice can be reversed by injection of exogenousNEP (Iwata et al. 2001; Hemming et al. 2007). Over expression of NEP in brains of APPtransgenic mice (Leissring et al. 2003; Marr et al. 2003; Miners et al. 2008c; Meilandt et al.2009) or over-expression of NEP in the periphery (Guan et al. 2009) is associated withlower brain Aβ levels and amyloid plaque load. In addition to these investigations carriedout in animal models, observations in human postmortem tissue suggest that NEP expressionis inversely related to the extent of AD pathology (Akiyama et al. 2001; Eckman et al. 2006;Hellstrom-Lindahl et al. 2008).
IDE is also a zinc metalloendopeptidase that is predominantly cytosolic (Duckworth et al.1994), with less in the plasma membrane (Goldfine et al. 1984); it has a molecular weight of110 kDa. As demonstrated by in vitro studies, IDE is not only a major soluble proteaseinvolved in the degradation of extracellular Aβ in the brain, but it also has the ability toremove the cytoplasmic products of APP (Bernstein et al. 1999; Edbauer et al. 2002). APPtransgenic mouse that develop AD-like neuropathology with aging have elevated IDEmRNA and protein, and IDE protein expression is positively correlated with expression offull-length APP in cerebral cortex, indicating that IDE expression responds to Aβaccumulation (Vepsalainen et al. 2008). Mice with a homozygous deletion of IDE haveelevated endogenous brain Aβ (Miller et al. 2003; Leal et al. 2006). Conversely,overexpression of IDE attenuates brain plaque formation, secondary pathology and preventspremature death in a transgenic AD mouse model (Leissring et al. 2003). In AD, in situhybridization and western blot analyses demonstrate reduced neuronal IDE mRNA andprotein levels in hippocampus (Cook et al. 2003), and immunohistochemistry studies show
Wang et al. Page 2
J Neurochem. Author manuscript; available in PMC 2011 October 1.
NIH
-PA Author Manuscript
NIH
-PA Author Manuscript
NIH
-PA Author Manuscript
that neuronal IDE expression in hippocampus is also significantly reduced compared withcontrols (Miners et al. 2008c). Reduced levels of cytosolic IDE have also been reported inAD (Perez et al. 2000). In contrast, Zhao and co-workers found reduced hippocampal IDEprotein and activity in membrane fraction, but not the cytosol (Zhao et al. 2007). Studies thatfocused on IDE in the cortex rather than hippocampus, showed different results; Caccamoand co-workers reported that IDE protein levels diminish with of age, while cortical IDEexpression is elevated in AD (Caccamo et al. 2005). Kim and co-workers reported reducedIDE catalytic activity in AD lymphoblast lines without significant changes in IDEexpression and suggested that this might involve genetic factors (Kim et al. 2007). Theinconsistent results for IDE in AD remains to be explained, but may be due tomethodological issues. Clearly, additional studies are needed to better understand thesignificance of changes in IDE in aging and AD.
As another set of type II integrated membrane zinc metalloendopeptidases, ECEs areprimarily localized in endothelial cells, but have also been detected in neurons and glia(Davenport et al. 1998). Two ECE isoforms, ECE-1 and ECE-2, share 59% sequencehomology and have similar catalytic activity; in the brain the predominant isoform is ECE-1(Davenport et al. 1998; Miners et al. 2008c). In both animal models and postmortem humanbrain tissue, the role of ECE-1 in AD is far from established. Eckman and co-workers werethe first to identify ECE-1 as a novel Aβ-degrading enzyme in cell models (Eckman et al.2001). Later, they found that the level of brain Aβ was increased in ECE-1 deficient mice(Eckman et al. 2003), providing the first direct evidence that ECE-1 might play a role in Aβmetabolism in the brain. Over-expression of ECE-1 in APP presenilin 1 (PS1) bigenictransgenic mice with gene delivery mechanisms decreased Aβ accumulation in the cortexand hippocampus (Carty et al. 2008). While there is evidence for a role of ECE-1 in Aβmetabolism in experimental models, there is limited information on its role in AD. Only onestudy has investigated ECE-1 levels in AD brains, which showed increased neuronalexpression in cerebral cortex and hippocampus in controls compared to AD (Funalot et al.2004). The results need to be interpreted with caution because there is 59% identity betweenECE-1 and ECE-2 (Barnes and Turner 1997), the possibility of cross-reactivity of antibodieswith ECE-2 was not completely excluded.
We previously reported that NEP was selectively decreased in AD brain, and that there wasan inverse correlation between NEP activity and vulnerability to AD pathology (Wang et al.2005); however, there is still little comparative data exploring Aβ degrading enzymessimultaneously in AD and controls. To address this issue, in the current study we measuredexpression and activity levels of three Aβ degrading enzymes (NEP, IDE and ECE-1) inbrain tissue of prospectively studied controls with no cognitive impairment (NCI), as well asthose with mild cognitive impairment (MCI) and clinical AD. The findings provide furtherevidence connecting enzyme activity, Aβ accumulation and clinical features duringpathogenesis of AD.
Materials and MethodsCase and clinical features data
Frozen brain tissue from frontal cortex was obtained from participants in the ReligiousOrders Study of the Rush Alzheimer Disease Center (P30AG10161) as described previously(Wang et al. 2007). Included in this study were 10 NCI, 10 MCI and 10 AD. All cases hadundergone a uniform structured clinical evaluation that included a medical history,neurologic examination, neuropsychological performance testing, and review of a brain scanwhen available. The evaluation included the mini-mental status examination (MMSE) as anoverall test of cognition and 20 other cognitive performance tests, 19 of which were used to
Wang et al. Page 3
J Neurochem. Author manuscript; available in PMC 2011 October 1.
NIH
-PA Author Manuscript
NIH
-PA Author Manuscript
NIH
-PA Author Manuscript
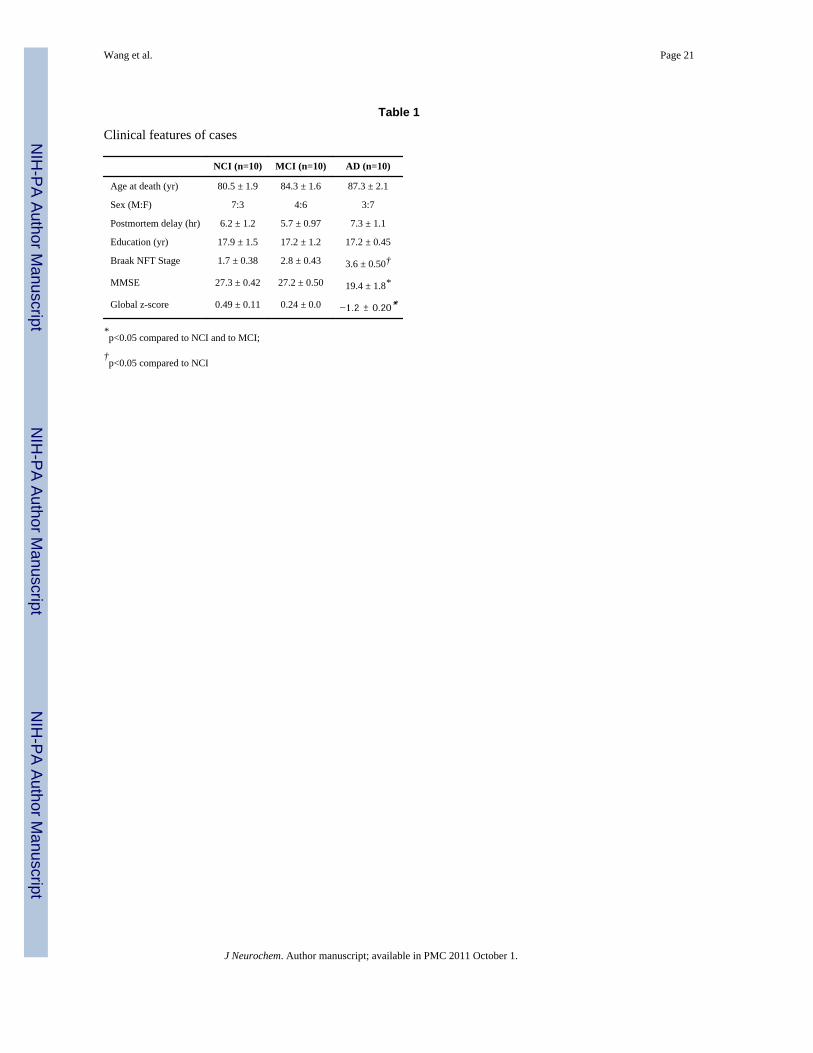
create a global measure of cognition, as described previously (Bennett et al. 2002; Wilson etal. 2002). Characteristics of the three groups are summarized in Table 1.
Chemicals and reagentsOligonucleotides were synthesized by Gibco BRL Life Technologies (Gaithersburg, MD).TRIreagent, Omniscript Reverse Transcriptase was acquired from Invitrogen (Cincinnati,OH, USA) and Qiagen (Valencia, CA, USA), respectively. SYBR green PCR master mixwas from AB applied biosystem. NEP, IDE and ECE-1 antibody were purchased fromChemicon, Abcam, and R&D Systems, respectively. Synaptophysin monoclonal antibodywas a generous gift from Dr. William Honer, University of British Columbia, Vancouver,Canada. β-actin and α-actin antibodies were from Amershan and Sigma-Aldrich. Anti-rabbitand anti-mouse HRP-conjugated secondary antibody and anti-goat HRP-conjugatedsecondary antibody were from Cell Signaling and Santa Cruz. Mac-R-P-P-G-F-S-A-F-K(Dnp)-OH Fluorogenic peptide substrate came from R&D. An enhancedchemiluminescence (ECL) kit was obtained from Pierce. Other general chemicals andreagents were from Sigma-Aldrich.
RNA extraction and reverse transcription (RT)-PCRFrontal cortical gray matter was carefully dissected from frozen tissue and analyzed blindedto clinical information. Total RNA was isolated from approximately 50 mg of tissueaccording to the TRI-Reagent protocol. RNA was quantified and assessed for purity by UVspectrophotometer. 1.5 μg of total RNA was subjected to reverse transcription with theOmniscript RT in a 20 μl reaction. The RT reaction was diluted five folds and 5 μl wasamplified by Real-time PCR (qPCR) in 25 μl reaction mixture containing Master SybrGreen (ABI).
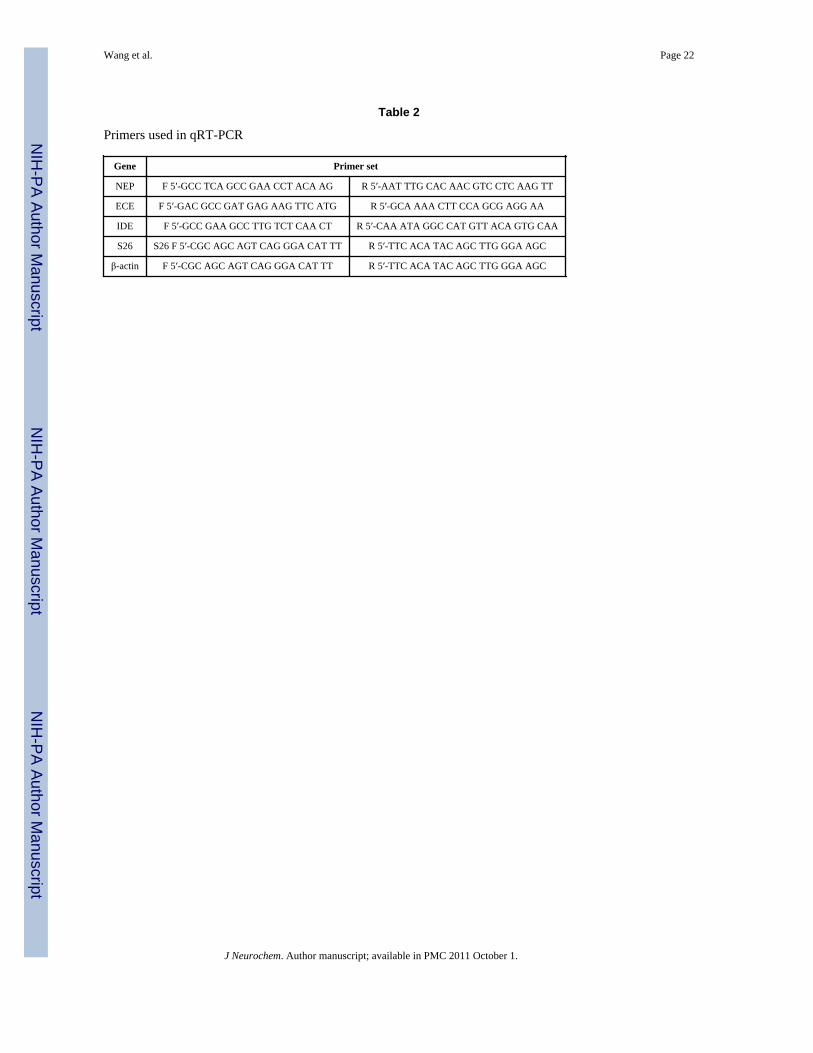
The primer sets were designed to span the intron-exon borders to distinguish amplifiedcDNA from genomic DNA by Primer Express software (Applied Biosystems, Foster City,CA). The sequences of primers used in current study were listed in Table 2. qPCR wasperformed on an ABI Prism 7500 real-time PCR system. The thermal cycling conditionscomprised an initial denaturation step at 95°C for 2 min, then 40 cycles of two steps PCRincluding 95°C for 15s and 60°C for 1 min. Data were collected during the 60°C annealingstep. Optimization of primers concentration was performed at Serial dilutions of thetemplate cDNA made from PCRs within the linear range. The authenticity of the PCRproducts was confirmed with melting curve analysis using the Applied Biosystems softwareand electrophoreses in 2.0% agarose gel.
Relative quantification of genes expression was carried out by comparative Ct methodaccording to manufacture protocol (User Bulletin #2: ABI Prism 7500 Sequence DetectionSystem). Briefly, the genes mRNA level was expressed in cycle threshold (Ct) value; the Ctvalues for each sample were averaged from duplicate. Base on the amplification efficiency,human β-actin for NEP, S26 for ECE and IDE were used as reference genes. Differencesbetween the mean Ct values of NEP and reference genes were calculated as ΔCtsample=CtNEP-Ctβ-actin for AD and MCI groups, and that of the delta Ct for the NCI group was setfor calibrator (ΔCtcalibrator). Final results, the sample-calibrator ratio, expressed as N-folddifferences of NEP expression in the AD or MCI groups compared with NCI group, weredetermined as 2 −(ΔCtsample - ΔCtcalibrator). Similar method was used in ECE and IDEcalculation of relative quantification of genes expression.
SDS-PAGE, Western blot and protein quantificationBrain tissue homogenates were prepared from dissected samples of unfixed frozen frontalcortex. Protease inhibitor cocktail (Sigma-Aldrich) and 1 mM PMSF (Sigma-Aldrich) were
Wang et al. Page 4
J Neurochem. Author manuscript; available in PMC 2011 October 1.
NIH
-PA Author Manuscript
NIH
-PA Author Manuscript
NIH
-PA Author Manuscript
added to the lysis buffer (Pierce), 50 μl whole tissue lysates was added to 150 μl 1% SDSthat contain protease inhibitor and 1 mM PMSF. After vortexing, the samples wereincubated on ice for 30 min. From 1000 μg whole tissue lysates, 4x sample buffer was addedand boiled at 95°C for 5min, cooled on ice and subsequently loaded to a 12% SDS-PAGEgel. Proteins were transferred to nitrocellulose membrane at 100V for 70 min. Afterblocking with 5% nonfat milk-TBST for 1hr at room temperature, membranes wereincubated in 5% nonfat milk-TBST with mouse anti-Aβ (1:1000; Clone Ab9, a gift from DrT. Golde, Mayo Clinic, Jacksonville, FL), rabbit anti-NEP antibody (1:2000; Chemicon,Temecula, CA, USA), mouse anti-IDE (1:2000; Abcam, Cambridge, MA, USA.), goat anti-ECE-1 (1:2000; R&D Systems, Minneapolis, MN), mouse anti-synaptophysin (EP10;1:500), mouse monoclonal antibody BAN50 (recognizing the amino terminus of Aβ)(1:1000), mouse anti-β-actin (1:2000; Amersham, Piscataway, NJ, USA) or rabbit anti-α-actin antibodies (1:4000; Sigma-Aldrich, St. Louis, MO, USA), respectively, at 4°Covernight. After washing with TBS-T, membranes were incubated with HRP-conjugatedanti-rabbit (1:8000; Cell Signaling, Danvers, MA, USA), or anti-mouse (1:8000; CellSignaling,) or anti-goat (1:5000; Santa Cruz, CA, USA) secondary antibodies for 1 hour atroom temperature, detected by the ECL plus Western blotting detection system andautoradiography film (Amersham, Piscataway, NJ, USA). The densities of target bands weremeasured with Image Quant 5.2 and expressed as relative level with respect to the normalcontrol.
Measurement of Enzymatic ActivityNEP activity was determined by fluorescence resonance energy transfer (Johnson and Ahn2000; Takaki et al. 2000; Wang et al. 2005). Human frontal cortex gray matter washomogenized in PBS (pH 7.4) containing protease inhibitor cocktail (Sigma, 200mg/mL), 1mM PMSF and solubilized by sonication. Samples were then added to 0.1% TritonX-100 inPBS to final concentration 2.0 mg/mL, incubated on ice for 30 min to extract membraneproteins. 50 μl of fluorogenic peptide substrate (Mca-RPPGFSAFK-[Dnp]-OH; R&DSystems, Minneapolis, MN) [45] dissolved in HEPES buffer (pH 7.4) was added to 50 μl ofhomogenate from a normal case and then diluted to 2000, 1000, 500, 250, 125, 62.5, and31.25 mg/ml to produce a standard curve. To determine the specificity of the assay, a set ofsamples were initially preincubated with 100 nM thiorphan (Sigma-Aldrich), a NEP specificinhibitor (Wang et al. 2003; Miners et al. 2008b), for 10 minutes. Specific NEP activity isoptimal at pH 7.4 (Wang et al. 2005). Sample homogenates (1000 μg/mL) were pre-incubated with or without inhibitor prior to adding fluorogenic peptide substrate.Fluorescence was read after 30 minutes incubation at room temperature with excitation at320nm and emission at 405nm on a fluorescent 96-well plate reader (Spectra Max Gemini;Molecular Devices, Sunnyvale, CA).
ECE activity was also analyzed by fluorogenic peptide substrate Mca-RPPGFSAFK(Dnp)-OH at RT in the presence or absence of the ECE inhibitor, phosphoramidon (1μM, Sigma)(Wang et al. 2003; Miners et al. 2008b). Phosphoramidon inhibition of ECE-1 is highly pHdependent (Ahn et al. 1998). The IC50 value of phosphoramidon is about 50-fold lower atpH 5.8 than at pH 7.2. In addition, NEP activity is also pH-dependent. There is almost noNEP activity at pH5.8 (Fahnoe et al. 2000). Thus, the inhibition by phosphoramidon at pH5.8 can be considered the inhibition of ECE.
IDE specific activity was measured by using immunocapture based fluorometric assay(Miners et al. 2008a; Wang et al. 2009a). Frontal cortex brain tissues homogenates weremixed with 9 times volumes of sample buffer (0.5% Triton-X-100, 20 mM Tris pH 7.4, 10%sucrose (w/v) containing protease inhibitor cocktail (Sigma-Aldrich) for 30 min, ultrasonichomogenized and then centrifuged at 1300 rpm for 15 min at 4°C. Greiner 96-well highbinding ELISA plate were coated with capture IDE antibody (Santa Cruz, sc27266, 50 mg/
Wang et al. Page 5
J Neurochem. Author manuscript; available in PMC 2011 October 1.
NIH
-PA Author Manuscript
NIH
-PA Author Manuscript
NIH
-PA Author Manuscript
ml) diluted in carbonate buffer (pH 8.6) and left for 18 h at 4°C. The plates were washedwith PBS containing 0.5% tween-20 for 3–5 times. After 30 min blocking with PBS-Tcontaining 2% bovine serum albumin, 50 μl of brain homogenate was added and incubatedat 4°C overnight. After 3–5 washes, 10 μM fluorogenic peptide diluted in 50 mM HEPES(pH 7.5) was added and incubated at 30°C in dark. Fluorescent readings were taken after 60min. Control wells included in each plate contained PBS and fluorogenic peptide.
All the assays were triplicates, and the mean values were calculated for each sample.
Statistical analysesAll data were expressed as mean ± standard error of the mean. Statistical analyses wereperformed using the GraphPad Prism 4.0 software (GraphPad Software, Inc., San Diego,CA). One-way ANOVA analysis was used to evaluate differences in mean values amongthree groups, followed by post hoc tests of multiple comparisons when ANOVA weresignificant. Pearson correlation analysis was used to study relations between variables.Statistical significance level was set a p<0.05.
ResultsReal-time RT-PCR
In an effort to understand the gene transcription of Aβ degrading enzymes participate in theregulation of Aβ accumulation in AD development, we examined NEP, IDE and ECE-1level in frontal cortex from NCI, MCI and AD patients using qRT-PCR. NEP mRNA levelswere decreased in MCI and AD groups with significance in AD compared with NCI (Figure1A). In contrast to NEP, both ECE-1 and IDE mRNA increased in MCI and AD brains, andfor IDE this reached significance in AD compared with NCI.
Western BlotsMany studies suggest that post-transcriptional regulation of Aβ-degrading enzymes mayplay a role in Aβ degradation and clearance (Wang et al. 2006; Miners et al. 2008c). Tostudy the protein expression of these enzymes, immunoblotting was performed inpostmortem brain samples. As shown in Figure 1B, NEP had a double band at 80- and 100-kDa molecular mass. Densitometric analyses of blots revealed a significant decrease in NEPin AD compared with NCI (p<0.05), in agreement with previous reports (Higuchi et al.2005). Despite increases in mRNA observed for IDE and ECE-1, their protein levels did notshow significant change.
Activity AssaysNEP enzymatic activity was measured in frontal cortex with a fluorometric assay. As shownin Figure 1C, NEP catalytic activity was significantly decreased in AD compared with NCIand MCI. On the other hand, IDE and ECE activity tended to increase in AD compared toMCI and NCI, but this did not reach statistical significance. It is reasonable to speculate thatdeficits in NEP expression and activity in AD may lead to compensatory increases in IDEand ECE-1 expression and possibly to activity.
Synaptophysin, a pre-synaptic marker, is not altered with AD developmentNEP and ECE-1 is integral transmembrane protease that is primarily expressed inpresynaptic terminals of neurons (Fukami et al. 2002), while IDE is expressed in neuronsand other cell types. Neuron loss should potentially affect expression of these enzymes. Inorder to clarify that decreased NEP level in AD is not merely due to neuronal or synapticloss, western blots of a presynaptic marker, synaptophysin, were performed in the same
Wang et al. Page 6
J Neurochem. Author manuscript; available in PMC 2011 October 1.
NIH
-PA Author Manuscript
NIH
-PA Author Manuscript
NIH
-PA Author Manuscript
frontal cortex homogenates used for western blots of Aβ degrading enzymes. As shown inFigure 2, synaptophysin level was less in MCI and AD, but the difference did not reachsignificance compared to NCI, probably due to the location of the tissue (frontal cortex,which is has neuronal loss later than medial temporal lobe in AD pathogenesis), the fact thatAD and MCI had relatively mild cognitive deficits, and the relatively small sample size.After adjusted by synaptophysin, NEP protein in AD cases remained significantly lower inAD compares to NCI, indicating that NEP reduction is not merely due to neuronal andsynaptic loss.
NEP protein level, but not ECE-1 or IDE, is closely correlated with Aβ accumulationTo understand the relationship between Aβ degrading enzymes and Aβ accumulation, weconducted western blot to measure the content of Aβ by full length Aβ antibody in humanpostmortem brain tissue. As expected we observed a marked increase in Aβ in AD comparedwith NCI (Figure 3). Further exploration of the functional association between the Aβdegrading enzyme and Aβ accumulation indicated that NEP immunoreactivity was inverselycorrelated with Aβ in all cases (Figure 4. R2= −0.37, p=0.0004). Similar analyses performedin subsets showed negative correlation in NCI (R2= −0.32, p=0.08) and MCI (R2= −0.49,p=0.02) group. However, there was no association in the AD group (R2= 0.26, p=0.13)(Figure 4). No significant correlations between IDE or ECE immunoreactivity and Aβcontent were observed (data not shown).
NEP, not ECE-1, or IDE, activity is directly related with clinical manifestationsTwo clinical neuropsychological parameters, MMSE and global neuropsychological z-scores were examined with respect to Aβ degrading enzymes (Figure 5). The MMSE iswidely used to assess the severity of cognitive impairment, and there was a significantcorrelation between MMSE and NEP activity (p=0.016), and a even more significantcorrelation between NEP activity and z-score (p=0.006). In contrast, there was nocorrelation between IDE and ECE-1 in either mental state scores or the neuropsychologicsummary measure of cognitive function.
DiscussionAlthough the physiological functions of Aβ remain to be elucidated, imbalance in itsproduction and clearance contributes to its accumulation in brain, which is one of the mostcharacteristic features of AD. Considerable evidence has emerged indicating that proteolyticdegradation of Aβ is a major process involved in Aβ clearance. To date, most attention hasbeen focused on NEP and its homologues IDE and ECE-1. A range of different studies hasproduced conflicting results for NEP and IDE in AD (El-Amouri et al. 2008; Miners et al.2008c; Bates et al. 2009). Except for experimental models, little is known about ECE-1especially in human tissue (Weeraratna et al. 2007; Miners et al. 2008c). In the currentstudy, we measured mRNA, protein and enzyme activity for these Aβ degrading enzymes infrontal cortex of a series of well characterized patients and correlated these findings to Aβlevels and clinical and clinical features.
While some previous studies have shown increases in NEP and IDE levels in AD thatcorrelated with disease severity (Dorfman et al. 2008; Miners et al. 2009), in the presentstudy we found mRNA, protein and activity of NEP were decreased in AD, which is inagreement with our previous studies (Wang et al. 2003; Wang et al. 2005) as well findingsof independent investigators using comparable methods (Akiyama et al. 2001; Miners et al.2006). Previous experiments in cultured neuronal cells indicated that NEP mRNA, proteinand activity are upregulated by treatment with Aβ (Wang et al. 2009b). In the context of thepresent findings, it suggests that any increase in NEP in the human brain in response to Aβ
Wang et al. Page 7
J Neurochem. Author manuscript; available in PMC 2011 October 1.
NIH
-PA Author Manuscript
NIH
-PA Author Manuscript
NIH
-PA Author Manuscript
may be relatively early in the disease process. With the advent of amyloid imaging, it isbecoming clear that Aβ deposition in the frontal cortex is an early pathologic process (Jacket al. 2009). Compensatory increases in NEP would be expected in clinically normalindividuals with cortical amyloid deposits, a process referred to as pathological aging, andthis is what was found in our previous study (Wang et al. 2005).
NEP is known as an integral membrane protein and to be expressed predominantly in axonaland synaptic membranes (Fukami et al. 2002). Given this localization, it is important thatany decreases in NEP mRNA, protein or catalytic activity, be assessed in light of neuron orsynaptic loss in order to exclude the possibility that decreases are merely secondary tosynaptic loss. In previous studies, neuron specific enolase has been used (Miners et al.2009), while we used the presynaptic marker synaptophysin in this and previous studies(Wang et al. 2005). We found a trend for decreasing synaptophysin immunoreactivity in ADand MCI compared to NCI, but this did not reach statistical significance. Synaptophysin lossin AD shows regional anatomical differences (Masliah et al. 1994), with frontal cortexinvolved later than medial temporal lobe, which may explain the subtle changes weobserved. NEP protein level, after adjusting for synaptophysin level, still showed significantdecreases in AD compared to NCI. The results suggest that neuron or synaptic loss cannotexplain the decreases we observed in NEP in AD.
Experimental studies have shown that ECE-1 can degrade Aβ (Eckman et al. 2001; Eckmanet al. 2003; Eckman et al. 2006), but the relative contribution of ECE-1 to Aβ degradation inthe human brain is unknown. The current study is the first systematic investigation of ECE-1levels and catalytic activity in AD. A previous study reported on ECE-1 protein expressionin cortex and hippocampus, but did not measure enzyme activity (Funalot et al. 2004). Wefound a trend for increases in ECE-1 mRNA, protein and activity in AD compared withNCI, although none of these reached statistical significance. Our findings support thehypothesis that increased ECE-1 in AD is compensatory to increases in Aβ and fit with ourin vitro findings that SH-SY5Y treated with Aβ had significantly increased ECE-1expression and activity (Wang et al. 2009a).
Previous studies of IDE regulation in AD brain have yielded inconsistent results; somestudies have shown reduction of IDE in AD (Perez et al. 2000; Cook et al. 2003; Caccamo etal. 2005; Zhao et al. 2007), while others have shown significant increases (Caccamo et al.2005; Dorfman et al. 2008). The studies were not directly comparable, given that differentcellular components (cytosolic versus membrane) and different brain regions (hippocampus,neocortex, or cerebellum) were studied. In the current studies we found higher IDE mRNAin AD compared to NCI, with IDE protein and catalytic activity also tending to be higher inAD frontal cortex, but not reaching statistical significance, consistent with findings from theoriginal report (Bernstein et al. 1999). Our in vitro data also support our observation in ADcases (Wang et al. 2009a) and provide support for the hypothesis that IDE is up-regulated inresponse to increasing levels of brain Aβ, similar to ECE-1.
From the above, we speculate that IDE and ECE-1 might be second line defense toincreasing Aβ related to decreases in NEP. On the other hand, decreased catalytic capacityof NEP is not adequately compensated by the ECE-1 and IDE, as Aβ progressivelyaccumulates in the brain. Moreover, these enzymes most likely act independently withrespect to Aβ removal from the brain, in agreement with experimental data from mice (Qiuand Folstein 2006).
In the brain, NEP, IDE and ECE show a distinct pattern of expression. NEP is mainlyexpressed in presynaptic terminals of neurons (Fukami et al. 2002), IDE is predominately acytosolic protein (Yfanti et al. 2008) and ECE exhibits a dual localization in the cell (Barnes
Wang et al. Page 8
J Neurochem. Author manuscript; available in PMC 2011 October 1.
NIH
-PA Author Manuscript
NIH
-PA Author Manuscript
NIH
-PA Author Manuscript
and Turner 1997). The region and subcellular expression of these enzymes may explain theirfunctions during AD development.
There has been strong evidence that Aβ accumulation is central to the pathogenesis of AD.There is, however, little evidence for increased Aβ production in the majority of late onsetAD. Deficiencies in Aβ clearance or enzyme-mediated Aβ degradation are increasinglythought to be responsible for Aβ accumulation, particularly in late onset AD (Wang et al.2006; Miners et al. 2008c). Post-mortem AD brain showed NEP mRNA and protein reducedin high plaque areas (Yasojima et al. 2001b; Yasojima et al. 2001a; Wang et al. 2003;Caccamo et al. 2005; Wang et al. 2005). Reductions were most prominent in regions mostvulnerable to AD pathology, such as hippocampus, but not in other brain areas such ascerebellum or in peripheral organs (Yasojima et al. 2001b; Caccamo et al. 2005). Similar tofindings in AD, NEP expression is reduced in the hippocampus and cortex of aged micecompared to young mice (Iwata et al. 2002; Apelt et al. 2003). Conversely, over-expressionof NEP reduces Aβ levels in a dose-dependent manner (Iwata et al. 2002; Marr et al. 2004),and protects neuronal cells from Aβ toxicity in vitro (El-Amouri et al. 2007). Consistentwith the previous studies by our lab (Wang et al. 2005) and above mentioned reports byothers, present data showed that a decrease in the overall level of NEP mRNA, protein andactivity in AD brains, was observed. Importantly, NEP protein expression was inverselycorrelated with Aβ levels. A strong correlation was also found between NEP enzymaticactivity and clinical cognitive scores, MMSE and Global82 (Figure 5), regardless of whetheror not there were cortical amyloid deposits, which is in agreement with previous findings(Funato et al. 1998; Morishima-Kawashima et al. 2000; Fukumoto et al. 2004; Wang et al.2005). These data support the hypothesis that decreased NEP contributes to Aβ deposition inAD.
Interestingly, negative correlation between NEP protein and Aβ level was found in MCI(R2=0.49, p=0.02) and NCI (R2=0.32, p=0.08) in this study, which is reasonable and inagreement with previous findings. In contrast to NCI and MCI, however, we observed nosignificant correlation between NEP levels and Aβ in AD brains. The levels of NEP wereuniformly low and the Aβ levels were high providing a narrow dynamic range forcorrelations. In addition, pathological induction and modification of NEP may occur in AD.In AD transgenic mice (TgCRND8), over-expressing human APP, relative NEP levels aregreater in the transgenic than in control mice, and NEP immunoreactivity is localized to asubpopulation of plaques. Aβ deposition correlated with total NEP immunoreactivity. Thissuggests that NEP may have been pathologically induced because of Aβ deposition (Sato etal. 1991). Our previous study indicated, acutely administrated Aβ decreased NEP catalyticactivity, which consequently up-regulated NEP mRNA and protein levels. Oxidativemodification of NEP plays a crucial role in enzyme inactivation [57]. It indicates that NEPmay also be up-regulated under the induction of increased Aβ during AD development. Dueto oxidative modification of NEP, increased NEP is insufficient to clear the excessive Aβthat eventually results in the brain Aβ deposition and plaque formation.
Unlike Zhao and coworkers who found correlation between IDE immunoreactivity and thelevels of Aβ in hippocampus and occipital cortex (Zhao et al. 2007), we found no significantcorrelations between IDE or ECE-1 and Aβ. These results suggested NEP is a key Aβdegrading enzyme in the aging and AD. The decrease in NEP expression in AD may beinduced by accumulation of Aβ with pro-oxidant state favoring oxidative modification andinactivity of NEP. Thus, low NEP may promote Aβ formation and be part of a negativefeedforward process whereby increased Aβ leads to greater deficiencies in NEP activity(Farris et al. 2007).
Wang et al. Page 9
J Neurochem. Author manuscript; available in PMC 2011 October 1.
NIH
-PA Author Manuscript
NIH
-PA Author Manuscript
NIH
-PA Author Manuscript
In summary, our finding suggests that NEP is a key protease in Aβ degradation, though ECEand IDE may act as a second line defense. The strategies aimed at promoting NEPexpression or enzymatic activities in the brain may help prevent progression of AD throughmechanisms involving the clearance of the Aβ peptides from the brain.
AcknowledgmentsThis work is supported by NIH grants AG025722 and AG029972 (to DSW), and an Alzheimer Association GrantIIRG-08-90524 (to DSW), and the start fund from the Department of Pathology and Laboratory Medicine,University of Wisconsin and Public Health, Madison, Wisconsin (to DSW), and NIH grants to DWD andP30AG10161 and R01AG15819 (to DAB).
ReferencesAhn K, Herman SB, Fahnoe DC. Soluble human endothelin-converting enzyme-1: expression,
purification, and demonstration of pronounced pH sensitivity. Arch Biochem Biophys. 1998;359:258–268. [PubMed: 9808768]
Akiyama H, Kondo H, Ikeda K, Kato M, McGeer PL. Immunohistochemical localization of neprilysinin the human cerebral cortex: inverse association with vulnerability to amyloid beta-protein (Abeta)deposition. Brain Res. 2001; 902:277–281. [PubMed: 11384622]
Apelt J, Ach K, Schliebs R. Aging-related down-regulation of neprilysin, a putative beta-amyloid-degrading enzyme, in transgenic Tg2576 Alzheimer-like mouse brain is accompanied by anastroglial upregulation in the vicinity of beta-amyloid plaques. Neurosci Lett. 2003; 339:183–186.[PubMed: 12633883]
Barnes K, Turner AJ. The endothelin system and endothelin-converting enzyme in the brain:molecular and cellular studies. Neurochem Res. 1997; 22:1033–1040. [PubMed: 9239759]
Bates KA, Verdile G, Li QX, Ames D, Hudson P, Masters CL, Martins RN. Clearance mechanisms ofAlzheimer’s amyloid-beta peptide: implications for therapeutic design and diagnostic tests. MolPsychiatry. 2009; 14:469–486. [PubMed: 18794889]
Bennett DA, Wilson RS, Schneider JA, Evans DA, Beckett LA, Aggarwal NT, Barnes LL, Fox JH,Bach J. Natural history of mild cognitive impairment in older persons. Neurology. 2002; 59:198–205. [PubMed: 12136057]
Bernstein HG, Ansorge S, Riederer P, Reiser M, Frolich L, Bogerts B. Insulin-degrading enzyme inthe Alzheimer’s disease brain: prominent localization in neurons and senile plaques. Neurosci Lett.1999; 263:161–164. [PubMed: 10213160]
Caccamo A, Oddo S, Sugarman MC, Akbari Y, LaFerla FM. Age- and region-dependent alterations inAbeta-degrading enzymes: implications for Abeta-induced disorders. Neurobiol Aging. 2005;26:645–654. [PubMed: 15708439]
Carty NC, Nash K, Lee D, Mercer M, Gottschall PE, Meyers C, Muzyczka N, Gordon MN, Morgan D.Adeno-associated viral (AAV) serotype 5 vector mediated gene delivery of endothelin-convertingenzyme reduces Abeta deposits in APP + PS1 transgenic mice. Mol Ther. 2008; 16:1580–1586.[PubMed: 18665160]
Cirrito JR, May PC, O’Dell MA, Taylor JW, Parsadanian M, Cramer JW, Audia JE, Nissen JS, BalesKR, Paul SM, DeMattos RB, Holtzman DM. In vivo assessment of brain interstitial fluid withmicrodialysis reveals plaque-associated changes in amyloid-beta metabolism and half-life. JNeurosci. 2003; 23:8844–8853. [PubMed: 14523085]
Cook DG, Leverenz JB, McMillan PJ, Kulstad JJ, Ericksen S, Roth RA, Schellenberg GD, Jin LW,Kovacina KS, Craft S. Reduced hippocampal insulin-degrading enzyme in late-onset Alzheimer’sdisease is associated with the apolipoprotein E-epsilon4 allele. Am J Pathol. 2003; 162:313–319.[PubMed: 12507914]
Davenport A, Kuc R, Plumpton C, Mockridge J, Barker P, Huskisson N. Endothelin-convertingenzyme in human tissues. Histochemical J. 1998; 30:359–374.
Dorfman VB, Pasquini L, Riudavets M, Lopez-Costa JJ, Villegas A, Troncoso JC, Lopera F, CastanoEM, Morelli L. Differential cerebral deposition of IDE and NEP in sporadic and familialAlzheimer’s disease. Neurobiol Aging. 2008
Wang et al. Page 10
J Neurochem. Author manuscript; available in PMC 2011 October 1.
NIH
-PA Author Manuscript
NIH
-PA Author Manuscript
NIH
-PA Author Manuscript
Duckworth WC, Bennett RG, Hamel FG. A direct inhibitory effect of insulin on a cytosolic proteolyticcomplex containing insulin-degrading enzyme and multicatalytic proteinase. J Biol Chem. 1994;269:24575–24580. [PubMed: 7929129]
Eckman EA, Eckman CB. Abeta-degrading enzymes: modulators of Alzheimer’s disease pathogenesisand targets for therapeutic intervention. Biochem Soc Trans. 2005; 33:1101–1105. [PubMed:16246055]
Eckman EA, Reed DK, Eckman CB. Degradation of the Alzheimer’s amyloid beta peptide byendothelin-converting enzyme. J Biol Chem. 2001; 276:24540–24548. [PubMed: 11337485]
Eckman EA, Watson M, Marlow L, Sambamurti K, Eckman CB. Alzheimer’s disease beta-amyloidpeptide is increased in mice deficient in endothelin-converting enzyme. J Biol Chem. 2003;278:2081–2084. [PubMed: 12464614]
Eckman EA, Adams SK, Troendle FJ, Stodola BA, Kahn MA, Fauq AH, Xiao HD, Bernstein KE,Eckman CB. Regulation of steady-state beta-amyloid levels in the brain by neprilysin andendothelin-converting enzyme but not angiotensin-converting enzyme. J Biol Chem. 2006;281:30471–30478. [PubMed: 16912050]
Edbauer D, Willem M, Lammich S, Steiner H, Haass C. Insulin-degrading enzyme rapidly removesthe beta-amyloid precursor protein intracellular domain (AICD). J Biol Chem. 2002; 277:13389–13393. [PubMed: 11809755]
El-Amouri SS, Zhu H, Yu J, Gage FH, Verma IM, Kindy MS. Neprilysin protects neurons againstAbeta peptide toxicity. Brain Res. 2007; 1152:191–200. [PubMed: 17459354]
El-Amouri SS, Zhu H, Yu J, Marr R, Verma IM, Kindy MS. Neprilysin: an enzyme candidate to slowthe progression of Alzheimer’s disease. Am J Pathol. 2008; 172:1342–1354. [PubMed: 18403590]
Fahnoe DC, Knapp J, Johnson GD, Ahn K. Inhibitor potencies and substrate preference for endothelin-converting enzyme-1 are dramatically affected by pH. J Cardiovasc Pharmacol. 2000; 36:S22–25.[PubMed: 11078325]
Farris W, Schutz SG, Cirrito JR, Shankar GM, Sun X, George A, Leissring MA, Walsh DM, Qiu WQ,Holtzman DM, Selkoe DJ. Loss of neprilysin function promotes amyloid plaque formation andcauses cerebral amyloid angiopathy. Am J Pathol. 2007; 171:241–251. [PubMed: 17591969]
Fukami S, Watanabe K, Iwata N, Haraoka J, Lu B, Gerard NP, Gerard C, Fraser P, Westaway D, StGeorge-Hyslop P, Saido TC. Abeta-degrading endopeptidase, neprilysin, in mouse brain: synapticand axonal localization inversely correlating with Abeta pathology. Neurosci Res. 2002; 43:39–56.[PubMed: 12074840]
Fukumoto H, Rosene DL, Moss MB, Raju S, Hyman BT, Irizarry MC. Beta-secretase activityincreases with aging in human, monkey, and mouse brain. Am J Pathol. 2004; 164:719–725.[PubMed: 14742275]
Funalot B, Ouimet T, Claperon A, Fallet C, Delacourte A, Epelbaum J, Subkowski T, Leonard N,Codron V, David JP, Amouyel P, Schwartz JC, Helbecque N. Endothelin-converting enzyme-1 isexpressed in human cerebral cortex and protects against Alzheimer’s disease. Mol Psychiatry.2004; 9:1122–1128. 1059. [PubMed: 15340356]
Funato H, Yoshimura M, Kusui K, Tamaoka A, Ishikawa K, Ohkoshi N, Namekata K, Okeda R, IharaY. Quantitation of amyloid beta-protein (A beta) in the cortex during aging and in Alzheimer’sdisease. Am J Pathol. 1998; 152:1633–1640. [PubMed: 9626067]
Goldfine ID, Williams JA, Bailey AC, Wong KY, Iwamoto Y, Yokono K, Baba S, Roth RA.Degradation of insulin by isolated mouse pancreatic acini. Evidence for cell surface proteaseactivity. Diabetes. 1984; 33:64–72. [PubMed: 6360769]
Guan H, Liu Y, Daily A, Police S, Kim MH, Oddo S, LaFerla FM, Pauly JR, Murphy MP, Hersh LB.Peripherally expressed neprilysin reduces brain amyloid burden: a novel approach for treatingAlzheimer’s disease. J Neurosci Res. 2009; 87:1462–1473. [PubMed: 19021293]
Hellstrom-Lindahl E, Ravid R, Nordberg A. Age-dependent decline of neprilysin in Alzheimer’sdisease and normal brain: inverse correlation with A beta levels. Neurobiol Aging. 2008; 29:210–221. [PubMed: 17098332]
Hemming ML, Patterson M, Reske-Nielsen C, Lin L, Isacson O, Selkoe DJ. Reducing amyloid plaqueburden via ex vivo gene delivery of an Abeta-degrading protease: a novel therapeutic approach toAlzheimer disease. PLoS Med. 2007; 4:e262. [PubMed: 17760499]
Wang et al. Page 11
J Neurochem. Author manuscript; available in PMC 2011 October 1.
NIH
-PA Author Manuscript
NIH
-PA Author Manuscript
NIH
-PA Author Manuscript
Hersh LB, Rodgers DW. Neprilysin and amyloid beta peptide degradation. Curr Alzheimer Res. 2008;5:225–231. [PubMed: 18393807]
Higuchi M, Iwata N, Saido TC. Understanding molecular mechanisms of proteolysis in Alzheimer’sdisease: progress toward therapeutic interventions. Biochim Biophys Acta. 2005; 1751:60–67.[PubMed: 16054018]
Iwata N, Takaki Y, Fukami S, Tsubuki S, Saido TC. Region-specific reduction of A beta-degradingendopeptidase, neprilysin, in mouse hippocampus upon aging. J Neurosci Res. 2002; 70:493–500.[PubMed: 12391610]
Iwata N, Tsubuki S, Takaki Y, Shirotani K, Lu B, Gerard NP, Gerard C, Hama E, Lee HJ, Saido TC.Metabolic regulation of brain Abeta by neprilysin. Science. 2001; 292:1550–1552. [PubMed:11375493]
Jack CR Jr, Lowe VJ, Weigand SD, Wiste HJ, Senjem ML, Knopman DS, Shiung MM, Gunter JL,Boeve BF, Kemp BJ, Weiner M, Petersen RC. Serial PIB and MRI in normal, mild cognitiveimpairment and Alzheimer’s disease: implications for sequence of pathological events inAlzheimer’s disease. Brain. 2009; 132:1355–1365. [PubMed: 19339253]
Johnson GD, Ahn K. Development of an internally quenched fluorescent substrate selective forendothelin-converting enzyme-1. Anal Biochem. 2000; 286:112–118. [PubMed: 11038281]
Kim M, Hersh LB, Leissring MA, Ingelsson M, Matsui T, Farris W, Lu A, Hyman BT, Selkoe DJ,Bertram L, Tanzi RE. Decreased catalytic activity of the insulin-degrading enzyme in chromosome10-linked Alzheimer disease families. J Biol Chem. 2007; 282:7825–7832. [PubMed: 17244626]
Leal MC, Dorfman VB, Gamba AF, Frangione B, Wisniewski T, Castano EM, Sigurdsson EM,Morelli L. Plaque-associated overexpression of insulin-degrading enzyme in the cerebral cortex ofaged transgenic tg2576 mice with Alzheimer pathology. J Neuropathol Exp Neurol. 2006; 65:976–987. [PubMed: 17021402]
Leissring MA, Farris W, Chang AY, Walsh DM, Wu X, Sun X, Frosch MP, Selkoe DJ. Enhancedproteolysis of beta-amyloid in APP transgenic mice prevents plaque formation, secondarypathology, and premature death. Neuron. 2003; 40:1087–1093. [PubMed: 14687544]
Llovera RE, de Tullio M, Alonso LG, Leissring MA, Kaufman SB, Roher AE, de Prat Gay G, MorelliL, Castano EM. The catalytic domain of insulin-degrading enzyme forms a denaturant-resistantcomplex with amyloid beta peptide: implications for Alzheimer disease pathogenesis. J BiolChem. 2008; 283:17039–17048. [PubMed: 18411275]
Marr RA, Rockenstein E, Mukherjee A, Kindy MS, Hersh LB, Gage FH, Verma IM, Masliah E.Neprilysin gene transfer reduces human amyloid pathology in transgenic mice. J Neurosci. 2003;23:1992–1996. [PubMed: 12657655]
Marr RA, Guan H, Rockenstein E, Kindy M, Gage FH, Verma I, Masliah E, Hersh LB. Neprilysinregulates amyloid Beta peptide levels. J Mol Neurosci. 2004; 22:5–11. [PubMed: 14742905]
Masliah E, Mallory M, Hansen L, DeTeresa R, Alford M, Terry R. Synaptic and neuritic alterationsduring the progression of Alzheimer’s disease. Neurosci Lett. 1994; 174:67–72. [PubMed:7970158]
Meilandt WJ, Cisse M, Ho K, Wu T, Esposito LA, Scearce-Levie K, Cheng IH, Yu GQ, Mucke L.Neprilysin overexpression inhibits plaque formation but fails to reduce pathogenic Abetaoligomers and associated cognitive deficits in human amyloid precursor protein transgenic mice. JNeurosci. 2009; 29:1977–1986. [PubMed: 19228952]
Miller BC, Eckman EA, Sambamurti K, Dobbs N, Chow KM, Eckman CB, Hersh LB, Thiele DL.Amyloid-beta peptide levels in brain are inversely correlated with insulysin activity levels in vivo.Proc Natl Acad Sci U S A. 2003; 100:6221–6226. [PubMed: 12732730]
Miners JS, Kehoe PG, Love S. Immunocapture-based fluorometric assay for the measurement ofinsulin-degrading enzyme activity in brain tissue homogenates. J Neurosci Methods. 2008a;169:177–181. [PubMed: 18221786]
Miners JS, Verbeek MM, Rikkert MO, Kehoe PG, Love S. Immunocapture-based fluorometric assayfor the measurement of neprilysin-specific enzyme activity in brain tissue homogenates andcerebrospinal fluid. J Neurosci Methods. 2008b; 167:229–236. [PubMed: 17904641]
Wang et al. Page 12
J Neurochem. Author manuscript; available in PMC 2011 October 1.
NIH
-PA Author Manuscript
NIH
-PA Author Manuscript
NIH
-PA Author Manuscript
Miners JS, Baig S, Tayler H, Kehoe PG, Love S. Neprilysin and insulin-degrading enzyme levels areincreased in Alzheimer disease in relation to disease severity. J Neuropathol Exp Neurol. 2009;68:902–914. [PubMed: 19606063]
Miners JS, Van Helmond Z, Chalmers K, Wilcock G, Love S, Kehoe PG. Decreased expression andactivity of neprilysin in Alzheimer disease are associated with cerebral amyloid angiopathy. JNeuropathol Exp Neurol. 2006; 65:1012–1021. [PubMed: 17021406]
Miners JS, Baig S, Palmer J, Palmer LE, Kehoe PG, Love S. Abeta-degrading enzymes in Alzheimer’sdisease. Brain Pathol. 2008c; 18:240–252. [PubMed: 18363935]
Morishima-Kawashima M, Oshima N, Ogata H, Yamaguchi H, Yoshimura M, Sugihara S, Ihara Y.Effect of apolipoprotein E allele epsilon4 on the initial phase of amyloid beta-proteinaccumulation in the human brain. Am J Pathol. 2000; 157:2093–2099. [PubMed: 11106581]
Perez A, Morelli L, Cresto JC, Castano EM. Degradation of soluble amyloid beta-peptides 1–40, 1–42,and the Dutch variant 1–40Q by insulin degrading enzyme from Alzheimer disease and controlbrains. Neurochem Res. 2000; 25:247–255. [PubMed: 10786709]
Qiu WQ, Folstein MF. Insulin, insulin-degrading enzyme and amyloid-beta peptide in Alzheimer’sdisease: review and hypothesis. Neurobiol Aging. 2006; 27:190–198. [PubMed: 16399206]
Sato M, Ikeda K, Haga S, Allsop D, Ishii T. A monoclonal antibody to common acute lymphoblasticleukemia antigen (neutral endopeptidase) immunostains senile plaques in the brains of patientswith Alzheimer’s disease. Neurosci Lett. 1991; 121:271–273. [PubMed: 1708483]
Takaki Y, Iwata N, Tsubuki S, Taniguchi S, Toyoshima S, Lu B, Gerard NP, Gerard C, Lee HJ,Shirotani K, Saido TC. Biochemical identification of the neutral endopeptidase family memberresponsible for the catabolism of amyloid beta peptide in the brain. J Biochem. 2000; 128:897–902. [PubMed: 11098130]
Vardy ER, Catto AJ, Hooper NM. Proteolytic mechanisms in amyloid-beta metabolism: therapeuticimplications for Alzheimer’s disease. Trends Mol Med. 2005; 11:464–472. [PubMed: 16153892]
Vepsalainen S, Hiltunen M, Helisalmi S, Wang J, van Groen T, Tanila H, Soininen H. Increasedexpression of Abeta degrading enzyme IDE in the cortex of transgenic mice with Alzheimer’sdisease-like neuropathology. Neurosci Lett. 2008; 438:216–220. [PubMed: 18455870]
Wang DS, Dickson DW, Malter JS. beta-Amyloid Degradation and Alzheimer’s Disease. J BiomedBiotechnol. 2006; 2006:58406. [PubMed: 17047308]
Wang DS, Iwata N, Hama E, Saido TC, Dickson DW. Oxidized neprilysin in aging and Alzheimer’sdisease brains. Biochem Biophys Res Commun. 2003; 310:236–241. [PubMed: 14511676]
Wang DS, Lipton RB, Katz MJ, Davies P, Buschke H, Kuslansky G, Verghese J, Younkin SG,Eckman C, Dickson DW. Decreased neprilysin immunoreactivity in Alzheimer disease, but not inpathological aging. J Neuropathol Exp Neurol. 2005; 64:378–385. [PubMed: 15892294]
Wang R, Wang S, Malter JS, Wang DS. Effects of 4-hydroxy-nonenal and Amyloid-beta onexpression and activity of endothelin converting enzyme and insulin degrading enzyme in SH-SY5Y cells. J Alzheimers Dis. 2009a; 17:489–501. [PubMed: 19363254]
Wang R, Wang S, Malter JS, Wang DS. Effects of HNE-modification induced by Abeta on neprilysinexpression and activity in SH-SY5Y cells. J Neurochem. 2009b; 108:1072–1082. [PubMed:19196432]
Wang S, Simon BP, Bennett DA, Schneider JA, Malter JS, Wang DS. The significance of Pin1 in thedevelopment of Alzheimer’s disease. J Alzheimers Dis. 2007; 11:13–23. [PubMed: 17361031]
Weeraratna AT, Kalehua A, Deleon I, Bertak D, Maher G, Wade MS, Lustig A, Becker KG, Wood W3rd, Walker DG, Beach TG, Taub DD. Alterations in immunological and neurological geneexpression patterns in Alzheimer’s disease tissues. Exp Cell Res. 2007; 313:450–461. [PubMed:17188679]
Wilson RS, Beckett LA, Barnes LL, Schneider JA, Bach J, Evans DA, Bennett DA. Individualdifferences in rates of change in cognitive abilities of older persons. Psychol Aging. 2002; 17:179–193. [PubMed: 12061405]
Yasojima K, McGeer EG, McGeer PL. Relationship between beta amyloid peptide generatingmolecules and neprilysin in Alzheimer disease and normal brain. Brain Res. 2001a; 919:115–121.[PubMed: 11689168]
Wang et al. Page 13
J Neurochem. Author manuscript; available in PMC 2011 October 1.
NIH
-PA Author Manuscript
NIH
-PA Author Manuscript
NIH
-PA Author Manuscript

Yasojima K, Akiyama H, McGeer EG, McGeer PL. Reduced neprilysin in high plaque areas ofAlzheimer brain: a possible relationship to deficient degradation of beta-amyloid peptide. NeurosciLett. 2001b; 297:97–100. [PubMed: 11121879]
Yfanti C, Mengele K, Gkazepis A, Weirich G, Giersig C, Kuo WL, Tang WJ, Rosner M, Schmitt M.Expression of metalloprotease insulin-degrading enzyme insulysin in normal and malignant humantissues. Int J Mol Med. 2008; 22:421–431. [PubMed: 18813847]
Zhao Z, Xiang Z, Haroutunian V, Buxbaum JD, Stetka B, Pasinetti GM. Insulin degrading enzymeactivity selectively decreases in the hippocampal formation of cases at high risk to developAlzheimer’s disease. Neurobiol Aging. 2007; 28:824–830. [PubMed: 16769157]
Wang et al. Page 14
J Neurochem. Author manuscript; available in PMC 2011 October 1.
NIH
-PA Author Manuscript
NIH
-PA Author Manuscript
NIH
-PA Author Manuscript
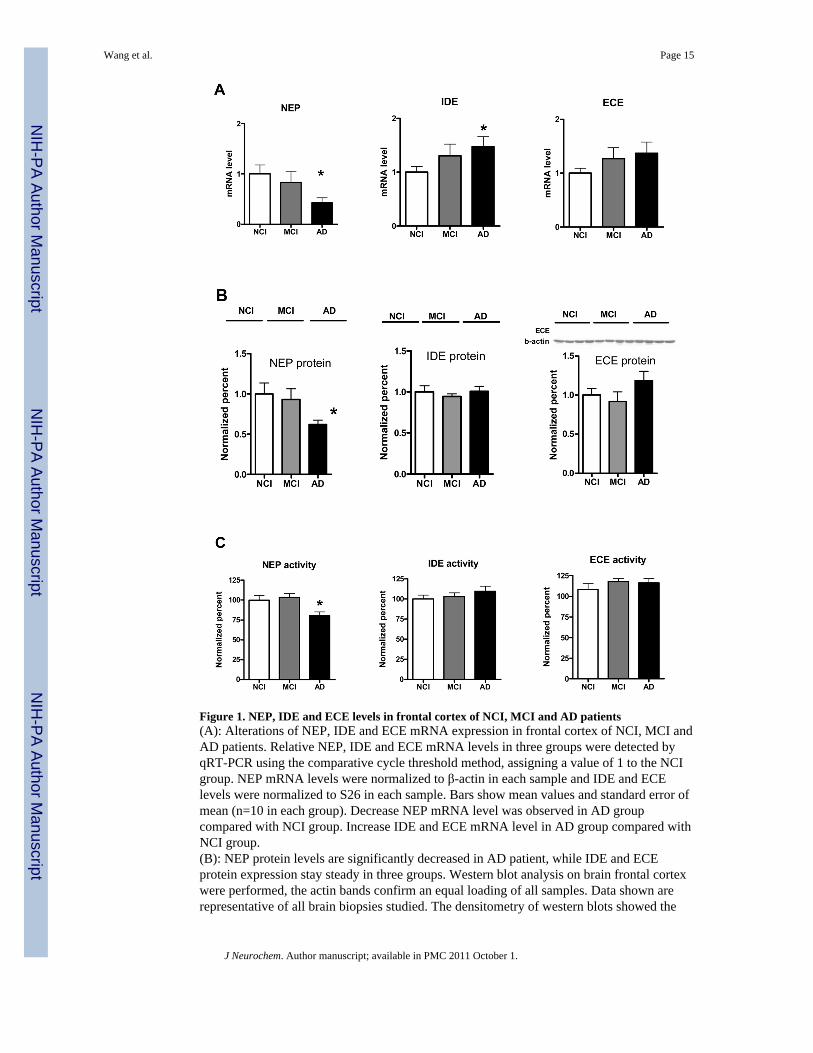
Figure 1. NEP, IDE and ECE levels in frontal cortex of NCI, MCI and AD patients(A): Alterations of NEP, IDE and ECE mRNA expression in frontal cortex of NCI, MCI andAD patients. Relative NEP, IDE and ECE mRNA levels in three groups were detected byqRT-PCR using the comparative cycle threshold method, assigning a value of 1 to the NCIgroup. NEP mRNA levels were normalized to β-actin in each sample and IDE and ECElevels were normalized to S26 in each sample. Bars show mean values and standard error ofmean (n=10 in each group). Decrease NEP mRNA level was observed in AD groupcompared with NCI group. Increase IDE and ECE mRNA level in AD group compared withNCI group.(B): NEP protein levels are significantly decreased in AD patient, while IDE and ECEprotein expression stay steady in three groups. Western blot analysis on brain frontal cortexwere performed, the actin bands confirm an equal loading of all samples. Data shown arerepresentative of all brain biopsies studied. The densitometry of western blots showed the
Wang et al. Page 15
J Neurochem. Author manuscript; available in PMC 2011 October 1.
NIH
-PA Author Manuscript
NIH
-PA Author Manuscript
NIH
-PA Author Manuscript
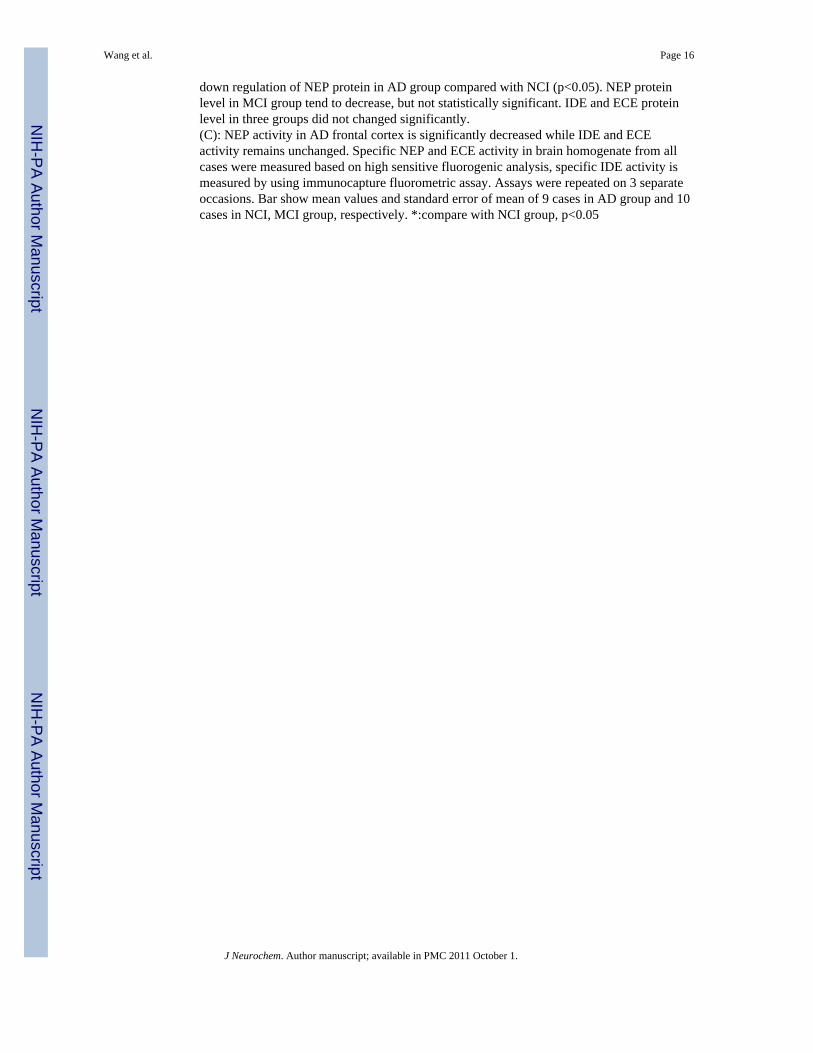
down regulation of NEP protein in AD group compared with NCI (p<0.05). NEP proteinlevel in MCI group tend to decrease, but not statistically significant. IDE and ECE proteinlevel in three groups did not changed significantly.(C): NEP activity in AD frontal cortex is significantly decreased while IDE and ECEactivity remains unchanged. Specific NEP and ECE activity in brain homogenate from allcases were measured based on high sensitive fluorogenic analysis, specific IDE activity ismeasured by using immunocapture fluorometric assay. Assays were repeated on 3 separateoccasions. Bar show mean values and standard error of mean of 9 cases in AD group and 10cases in NCI, MCI group, respectively. *:compare with NCI group, p<0.05
Wang et al. Page 16
J Neurochem. Author manuscript; available in PMC 2011 October 1.
NIH
-PA Author Manuscript
NIH
-PA Author Manuscript
NIH
-PA Author Manuscript
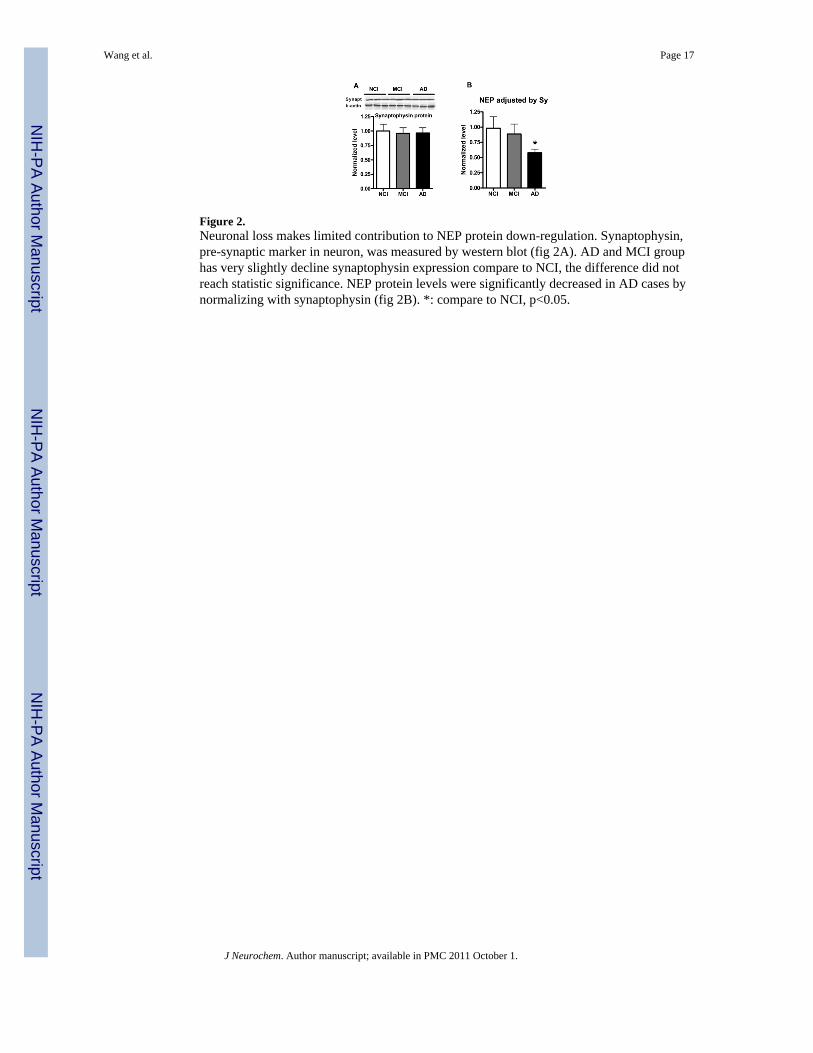
Figure 2.Neuronal loss makes limited contribution to NEP protein down-regulation. Synaptophysin,pre-synaptic marker in neuron, was measured by western blot (fig 2A). AD and MCI grouphas very slightly decline synaptophysin expression compare to NCI, the difference did notreach statistic significance. NEP protein levels were significantly decreased in AD cases bynormalizing with synaptophysin (fig 2B). *: compare to NCI, p<0.05.
Wang et al. Page 17
J Neurochem. Author manuscript; available in PMC 2011 October 1.
NIH
-PA Author Manuscript
NIH
-PA Author Manuscript
NIH
-PA Author Manuscript
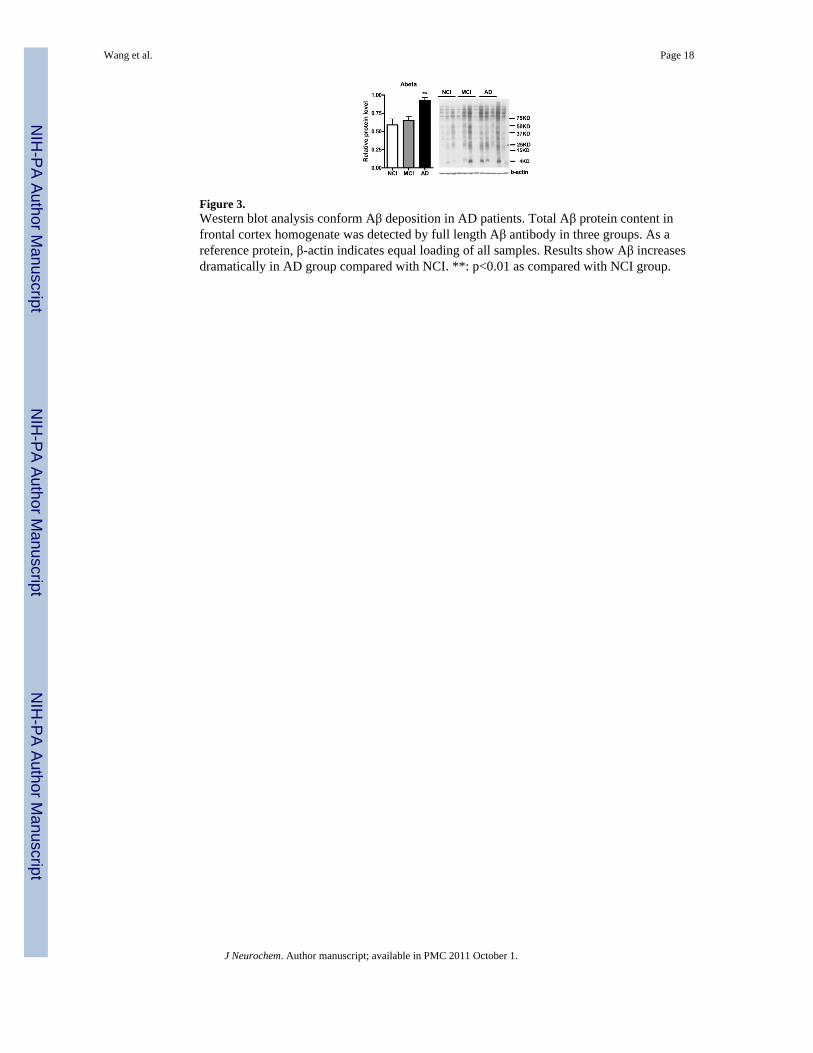
Figure 3.Western blot analysis conform Aβ deposition in AD patients. Total Aβ protein content infrontal cortex homogenate was detected by full length Aβ antibody in three groups. As areference protein, β-actin indicates equal loading of all samples. Results show Aβ increasesdramatically in AD group compared with NCI. **: p<0.01 as compared with NCI group.
Wang et al. Page 18
J Neurochem. Author manuscript; available in PMC 2011 October 1.
NIH
-PA Author Manuscript
NIH
-PA Author Manuscript
NIH
-PA Author Manuscript
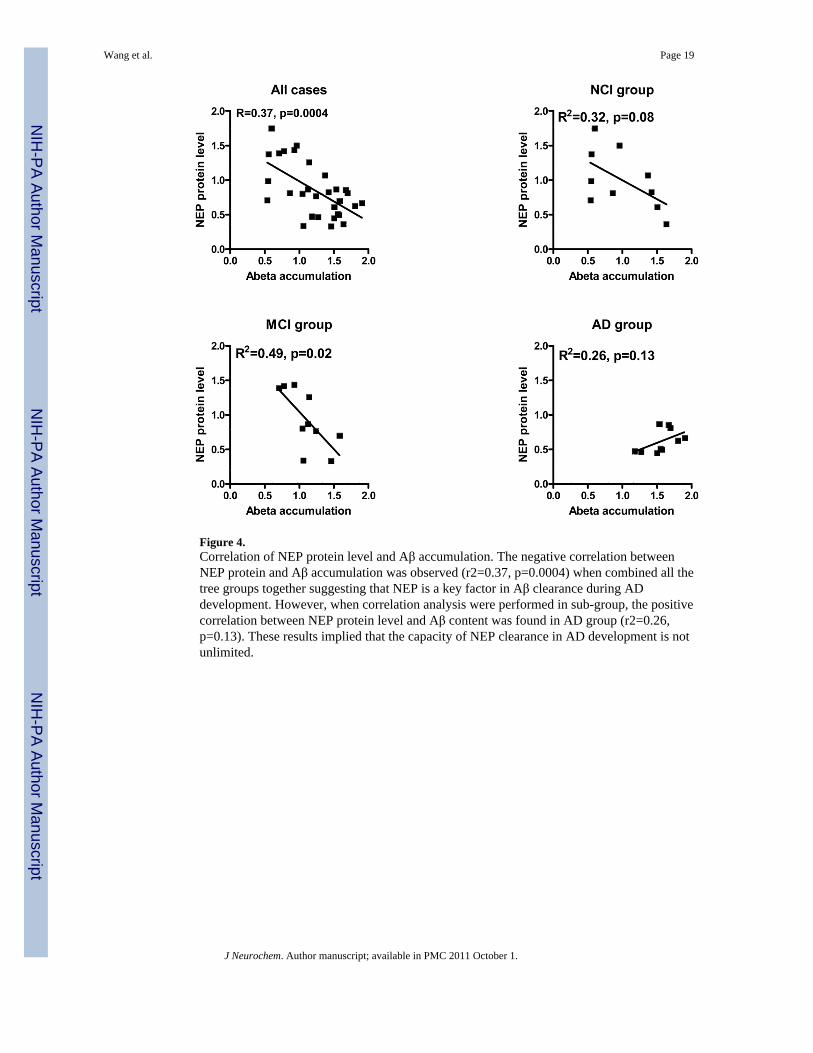
Figure 4.Correlation of NEP protein level and Aβ accumulation. The negative correlation betweenNEP protein and Aβ accumulation was observed (r2=0.37, p=0.0004) when combined all thetree groups together suggesting that NEP is a key factor in Aβ clearance during ADdevelopment. However, when correlation analysis were performed in sub-group, the positivecorrelation between NEP protein level and Aβ content was found in AD group (r2=0.26,p=0.13). These results implied that the capacity of NEP clearance in AD development is notunlimited.
Wang et al. Page 19
J Neurochem. Author manuscript; available in PMC 2011 October 1.
NIH
-PA Author Manuscript
NIH
-PA Author Manuscript
NIH
-PA Author Manuscript
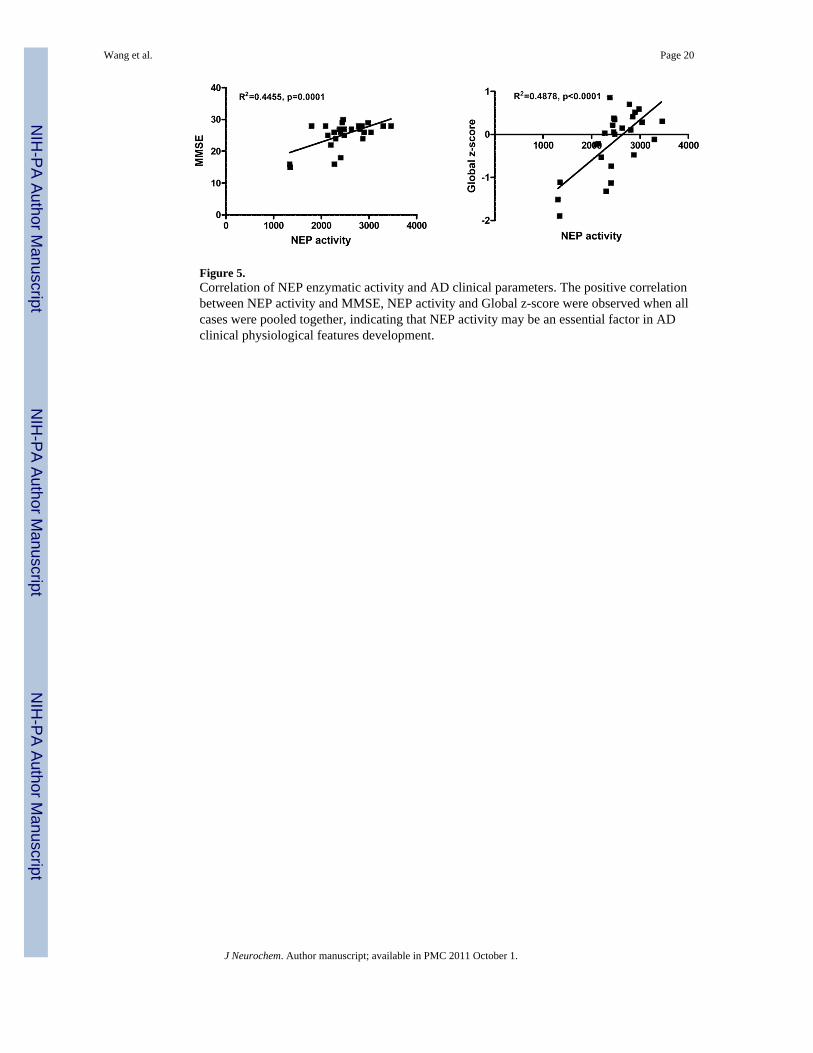
Figure 5.Correlation of NEP enzymatic activity and AD clinical parameters. The positive correlationbetween NEP activity and MMSE, NEP activity and Global z-score were observed when allcases were pooled together, indicating that NEP activity may be an essential factor in ADclinical physiological features development.
Wang et al. Page 20
J Neurochem. Author manuscript; available in PMC 2011 October 1.
NIH
-PA Author Manuscript
NIH
-PA Author Manuscript
NIH
-PA Author Manuscript
NIH
-PA Author Manuscript
NIH
-PA Author Manuscript
NIH
-PA Author Manuscript
Wang et al. Page 21
Table 1
Clinical features of cases
NCI (n=10) MCI (n=10) AD (n=10)
Age at death (yr) 80.5 ± 1.9 84.3 ± 1.6 87.3 ± 2.1
Sex (M:F) 7:3 4:6 3:7
Postmortem delay (hr) 6.2 ± 1.2 5.7 ± 0.97 7.3 ± 1.1
Education (yr) 17.9 ± 1.5 17.2 ± 1.2 17.2 ± 0.45
Braak NFT Stage 1.7 ± 0.38 2.8 ± 0.43 3.6 ± 0.50†
MMSE 27.3 ± 0.42 27.2 ± 0.50 19.4 ± 1.8*
Global z-score 0.49 ± 0.11 0.24 ± 0.0 −1.2 ± 0.20*
*p<0.05 compared to NCI and to MCI;
†p<0.05 compared to NCI
J Neurochem. Author manuscript; available in PMC 2011 October 1.
NIH
-PA Author Manuscript
NIH
-PA Author Manuscript
NIH
-PA Author Manuscript
Wang et al. Page 22
Table 2
Primers used in qRT-PCR
Gene Primer set
NEP F 5′-GCC TCA GCC GAA CCT ACA AG R 5′-AAT TTG CAC AAC GTC CTC AAG TT
ECE F 5′-GAC GCC GAT GAG AAG TTC ATG R 5′-GCA AAA CTT CCA GCG AGG AA
IDE F 5′-GCC GAA GCC TTG TCT CAA CT R 5′-CAA ATA GGC CAT GTT ACA GTG CAA
S26 S26 F 5′-CGC AGC AGT CAG GGA CAT TT R 5′-TTC ACA TAC AGC TTG GGA AGC
β-actin F 5′-CGC AGC AGT CAG GGA CAT TT R 5′-TTC ACA TAC AGC TTG GGA AGC
J Neurochem. Author manuscript; available in PMC 2011 October 1.