Quantitative Preparation in Doctoral Education Programs
20
Volume 12, 2017 Accepted by Editor Rosemary Van Der Meer│ Received: April 13, 2017│ Revised: July 4, 2017 │ Accepted: July 19, 2017. Cite as: Ferguson, S. L., Hovey, K. A., & Henson, R. K. (2017). Quantitative preparation in doctoral education programs: A mixed-methods study of doctoral student perspectives on their quantitative training. International Journal of Doctoral Studies, 12, 137-156. Retrieved from http://www.informingscience.org/Publications/3789 (CC BY-NC 4.0) This article is licensed to you under a Creative Commons Attribution-NonCommercial 4.0 International License. When you copy and redistribute this paper in full or in part, you need to provide proper attribution to it to ensure that others can later locate this work (and to ensure that others do not accuse you of plagiarism). You may (and we encour- age you to) adapt, remix, transform, and build upon the material for any non-commercial purposes. This license does not permit you to use this material for commercial purposes. QUANTITATIVE PREPARATION IN DOCTORAL EDUCATION PROGRAMS: A MIXED-METHODS STUDY OF DOCTORAL STUDENT PERSPECTIVES ON THEIR QUANTITATIVE TRAINING Sarah L. Ferguson* Rowan University, Glassboro, NJ, USA [email protected] Katrina A. Hovey Western Oregon University, Monmouth, OR, USA [email protected] Robin K. Henson University of North Texas, Denton, TX, USA [email protected] * Corresponding author ABSTRACT Aim/Purpose The purpose of the current study is to explore student perceptions of their own doctoral-level education and quantitative proficiency. Background The challenges of preparing doctoral students in education have been discussed in the literature, but largely from the perspective of university faculty and program administrators. The current study directly explores the student voice on this issue. Methodology Utilizing a sequential explanatory mixed-methods research design, the present study seeks to better understand doctoral-level education students’ perceptions of their quantitative methods training at a large public university in the southwestern United States. Findings Results from both phases present the need for more application and consistency in doctoral-level quantitative courses. Additionally, there was a consistent theme of internal motivation in the responses, suggesting students perceive their quanti- tative training to be valuable beyond their personal interest in the topic. Recommendations for Practitioners Quantitative methods instructors should emphasize practice in their quantitative courses and consider providing additional support for students through the inclu- sion of lab sections, tutoring, and/or differentiation. Pre-testing statistical ability at the start of a course is also suggested to better meet student needs. Future Research Using the student perspectives presented in the present study, future researchers should continue to explore effective instructional strategies and curriculum design within education doctoral programs. The inclusion of student voice can strengthen and guide future work in this area. Keywords quantitative proficiency, doctoral education, exploratory mixed-methods
-
Upload
khangminh22 -
Category
Documents
-
view
0 -
download
0
Transcript of Quantitative Preparation in Doctoral Education Programs
Volume 12, 2017
Accepted by Editor Rosemary Van Der Meer│ Received: April 13, 2017│ Revised: July 4, 2017 │ Accepted: July 19, 2017. Cite as: Ferguson, S. L., Hovey, K. A., & Henson, R. K. (2017). Quantitative preparation in doctoral education programs: A mixed-methods study of doctoral student perspectives on their quantitative training. International Journal of Doctoral Studies, 12, 137-156. Retrieved from http://www.informingscience.org/Publications/3789
(CC BY-NC 4.0) This article is licensed to you under a Creative Commons Attribution-NonCommercial 4.0 International
License. When you copy and redistribute this paper in full or in part, you need to provide proper attribution to it to ensure that others can later locate this work (and to ensure that others do not accuse you of plagiarism). You may (and we encour-age you to) adapt, remix, transform, and build upon the material for any non-commercial purposes. This license does not
permit you to use this material for commercial purposes.
QUANTITATIVE PREPARATION IN DOCTORAL
EDUCATION PROGRAMS: A MIXED-METHODS STUDY OF
DOCTORAL STUDENT PERSPECTIVES ON THEIR
QUANTITATIVE TRAINING
Sarah L. Ferguson* Rowan University, Glassboro, NJ, USA [email protected]
Katrina A. Hovey Western Oregon University, Monmouth, OR, USA [email protected]
Robin K. Henson University of North Texas, Denton, TX, USA [email protected]
* Corresponding author
ABSTRACT
Aim/Purpose The purpose of the current study is to explore student perceptions of their own doctoral-level education and quantitative proficiency.
Background The challenges of preparing doctoral students in education have been discussed in the literature, but largely from the perspective of university faculty and program administrators. The current study directly explores the student voice on this issue.
Methodology Utilizing a sequential explanatory mixed-methods research design, the present study seeks to better understand doctoral-level education students’ perceptions of their quantitative methods training at a large public university in the southwestern United States.
Findings Results from both phases present the need for more application and consistency in doctoral-level quantitative courses. Additionally, there was a consistent theme of internal motivation in the responses, suggesting students perceive their quanti-tative training to be valuable beyond their personal interest in the topic.
Recommendations for Practitioners
Quantitative methods instructors should emphasize practice in their quantitative courses and consider providing additional support for students through the inclu-sion of lab sections, tutoring, and/or differentiation. Pre-testing statistical ability at the start of a course is also suggested to better meet student needs.
Future Research Using the student perspectives presented in the present study, future researchers should continue to explore effective instructional strategies and curriculum design within education doctoral programs. The inclusion of student voice can strengthen and guide future work in this area.
Keywords quantitative proficiency, doctoral education, exploratory mixed-methods
Ferguson, Hovey, & Henson
138
INTRODUCTION
Students entering doctoral programs in education often bring with them years of experience; some as classroom teachers, some as administrators in schools and school districts, some as counselors or school psychologists. What many students lack is a solid grounding in skills related to research, a nec-essary component of a doctoral degree (Eisenhart & DeHaan, 2005; Henson, Hull, & Williams, 2010; Labaree, 2003). The transition from education practitioner into educational researcher is not a simple one and requires training targeted to both the skills and theory of research as well as their specific area of education. Additionally, the analytical process required for research is markedly different from what classroom teachers and education practitioners might use in their roles (Eisenhart & DeHaan, 2005; Labaree, 2003).
Previous literature has discussed the challenges faculty and program administrators face in preparing doctoral students in education (Eisenhart & DeHaan, 2005; Henson et al, 2010; Labaree 2003; Page, 2001). However, less focus in this area has been given to the perspectives of the students’ themselves and their thoughts regarding their doctoral training. Previous studies have been conducted on EdD students and their interests in conducting research (see Kerrigan & Hayes, 2016), professional devel-opment for doctoral students at a research university (Heflinger & Doykos, 2016), and the perspec-tives of doctoral students in Mathematics Education on their quantitative training (Shih, Reys, & Engledowl, 2016). The current study continues this line of work by focusing on education doctoral students’ perspectives of their doctoral training specifically in the area of quantitative methods, a topic that may arguably be the most unfamiliar to doctoral students with experience in the field of education (Eisenhart & DeHaan, 2005; Henson et al., 2010).
LITERATURE REVIEW
DEVELOPING DOCTORAL RESEARCHERS
Research in education is complex due to the nature of the topic, the high stakes associated with edu-cation and achievement, the difficulties of funding and access, as well as the dynamic nature of hu-mans and behaviors commonly studied (Labaree, 2003; Leech, 2012). Doctoral students in education often come to their doctoral program without a strong grounding in scientific methods, and the shift in worldview from the practical application of practitioners in education to the theoretical and analyt-ical work of education research requires time and training (Eisenhart & DeHaan, 2005; Labaree, 2003; Paul & Marfo, 2001). This experiential gap requires graduate programs to introduce students to scientific research, provide ample training, and allow multiple opportunities for students to apply their newly gained knowledge, all within the confines of a doctoral degree plan (Eisenhart & DeHaan, 2005; Henson et al., 2010). There is a need to educate doctoral students in the processes and logic underpinning scientific thought and methods while allowing them time to apply these les-sons in meaningful research projects (Henson et al., 2010; Paul & Marfo, 2001). However, this expe-dited exposure to educational research can create anxiety for many doctoral students and is a chal-lenging endeavor for university faculty and administrators (Eisenhart & DeHaan, 2005; Henson et al., 2010). Students who do report positive outcomes from their doctoral research training specifically identify research opportunities, internships, and publications as contributing to their perceived suc-cess as a graduate student (Heflinger & Doykos, 2016; Shih et al., 2016).
TEACHING QUANTITATIVE METHODS
Because a gap in research experience is evident for incoming students, it is important for doctoral students to receive appropriate training through methods courses. Capraro and Thompson (2008) surveyed 251 doctoral programs, and discovered that 25.9% of the programs did not require any quantitative or qualitative methods courses. Of those programs requiring students to complete spe-cific methods coursework, on average, students completed only three quantitative courses and one qualitative course. Similarly, Leech and Goodwin (2008) found varying requirements among graduate
Quantitative Preparation in Doctoral Programs
139
programs. After surveying 100 participating schools, they found that only 23% required a measure-ment course, and 27% of schools offered measurement courses as electives. Of the schools requiring measurement courses, students completed three courses on average, but took anywhere between one and nine. In a more recent study, Leech and Haug (2015) surveyed faculty in schools of education at 28 institutions regarding their quantitative methods courses. For programs resulting in an EdD, they found 53% of schools had statistics courses available, but only 42% required students to complete a basic statistics course. For these same programs, 32% required intermediate statistics courses. Com-paratively, PhD programs reported 21% requiring a basic statistics course, and 21% requiring an in-termediate statistics course for their students.
Approaching the issue of quantitative preparation from a holistic perspective, Henson et al. (2010) examined the collective quantitative proficiency (CQP) of doctoral students. At that time, they dis-covered that doctoral students were not only poorly trained but also utilizing quantitative statistics incorrectly. They argued for a reform of curriculum, allowing students more exposure to quantitative statistics and additional opportunities to practice skills. A common theme across the literature is the determination that doctoral students are not receiving enough instruction and practice in either quan-titative or qualitative methods to be qualified researchers. Henson et al. (2010) argued that the only way to better prepare doctoral students is through both exposure to the content and practice oppor-tunities. Supplying students with meaningful practice can support confidence in their research abili-ties.
What is lacking from the previous research on doctoral education in quantitative methods is the per-spective of the students themselves. While the literature presents a foundational perspective on the current practices in quantitative training in doctoral programs and faculty suggestions of changes and discussion of the unique challenges they face, the student voice has thus far been largely missing ex-cept for a few studies in 2016 (Shih et al.; Heflinger & Doykos). The current study is intended to pro-vide insight into the student perspective on quantitative methods training in education doctoral pro-grams, providing an additional perspective on the issue.
QUANTITATIVE PROFICIENCY
Quantitative proficiency in the current study is defined as a deep understanding and support for quantitative methodology including measurement, research design, and statistics (Chance, 2002; Gar-field, 2002; Henson, Hull, & Williams, 2010). Beyond the ability to calculate central tendency or run analyses in computer programs, quantitative proficiency looks at the reasoning ability of an individual in planning, executing, and analyzing quantitative research. The concept of quantitative proficiency is a key force behind high-quality research applications utilizing quantitative methods (Chance, 2002; Garfield, 2002; Henson et al., 2010). At a foundational level, the ability of researchers to accurately use and evaluate studies based on quantitative methods is inherently tied to their doctoral preparation in quantitative methods. Whether a student is planning to focus on educational research or pursue a career as a practitioner-scholar, there is a need for quantitative proficiency for all education doctoral students.
Research on the topic of quantitative proficiency is not new to the field of educational research. In 2001, the No Child Left Behind (NCLB) Act required schools to use only evidence-based strategies to teach students (NCLB, 2002; Simpson, 2005). This law emphasized not only the importance of educational research, but also qualifications of researchers themselves (Chance & Garfield, 2002; Feuer, Towne, & Shavelson, 2002). Educational researchers began to focus more on the culture of their community and recognized a need for research into the teaching of quantitative methods at the highest level (Chance & Garfield, 2002). Consideration must be given to the way in which we prepare doctoral level students as they prepare to take on leadership roles in their fields.
Ferguson, Hovey, & Henson
140
PURPOSE AND RESEARCH QUESTIONS
The purpose of the current study is to evaluate the perceptions of education doctoral students re-garding their current quantitative proficiency. While previous literature has addressed this issue from the faculty and program perspectives, no work has been done on quantitative proficiency from the perspective of doctoral students themselves. Therefore, this study specifically targets doctoral-level students as they prepare for future work in educational research and practitioner-scholar roles in edu-cation. There are three primary research questions in this study. The first two research questions di-rectly address the suggestion in Henson et al. (2010) and the literature overall that both quantitative courses and practical application are needed in doctoral programs. First, what are current doctoral students’ perceptions of their training in quantitative methods? Second, in what ways have doctoral students applied their quantitative training beyond required coursework? Finally, what are the per-ceived challenges of doctoral students regarding their quantitative training?
The current study will investigate these research questions in two phases using a sequential explana-tory mixed-methods research design (Creswell & Plano Clark, 2011). First, we will discuss the Phase 1 survey in detail, presenting both quantitative and qualitative data as captured using survey method-ology to explore student perspectives on their quantitative preparation. Then, we will present Phase 2 in detail, discussing the in-depth focus groups conducted with a subset of participants from phase 1 to further explain the patterns noted in the survey analysis. Finally, mixed-inferences are presented to combine the findings from both phases into a cohesive discussion.
PHASE 1
METHODS
Research design
The present study utilizes a sequential explanatory mixed-methods research design to better under-stand and evaluate students’ perception of CQP and their implementation of quantitative methods (Creswell & Plano Clark, 2011). In phase 1, a web-based survey was constructed for the collection of quantitative and qualitative data among all participants (see Appendix A for key items from the ques-tionnaire which were highlighted in analysis). Approval from the Institutional Review Board (IRB) was obtained prior to conducting the research study.
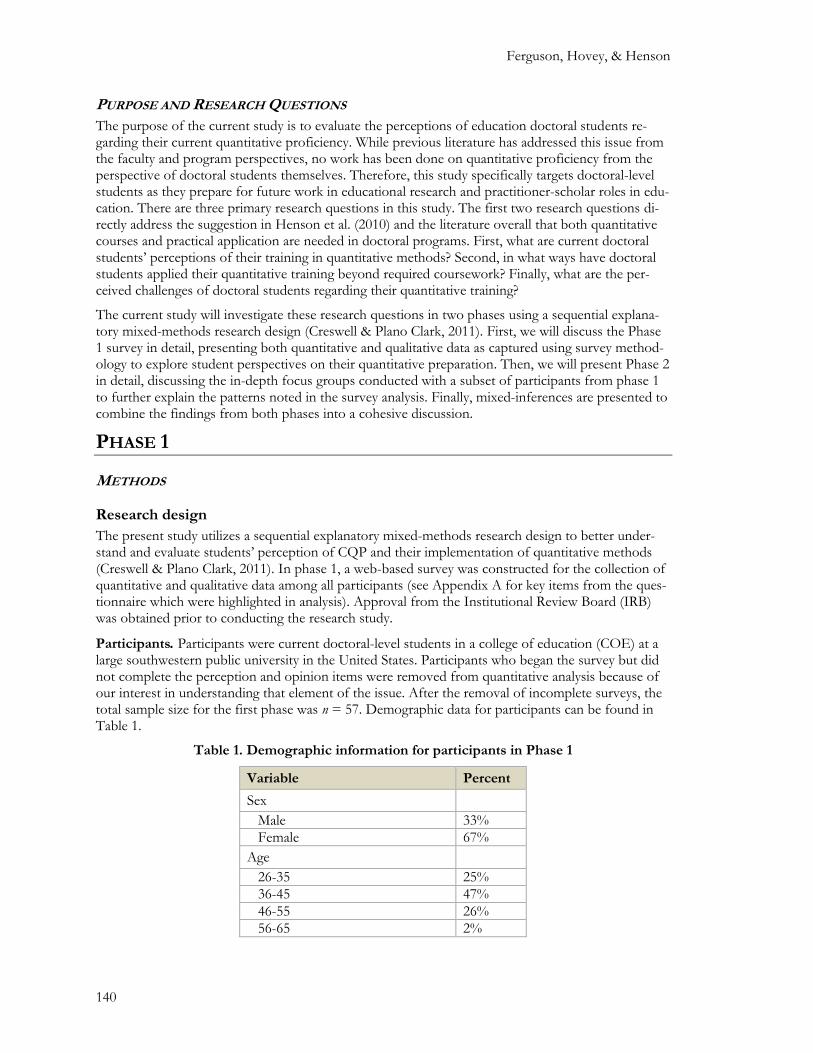
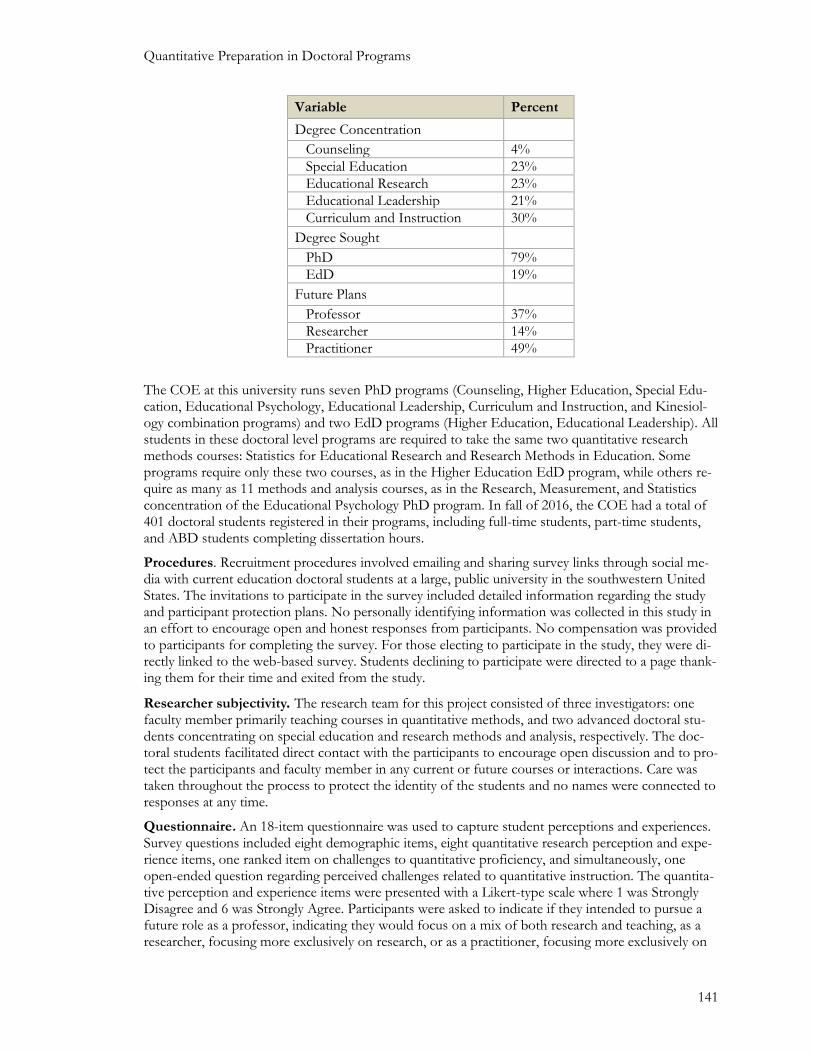
Participants. Participants were current doctoral-level students in a college of education (COE) at a large southwestern public university in the United States. Participants who began the survey but did not complete the perception and opinion items were removed from quantitative analysis because of our interest in understanding that element of the issue. After the removal of incomplete surveys, the total sample size for the first phase was n = 57. Demographic data for participants can be found in Table 1.
Table 1. Demographic information for participants in Phase 1
Variable Percent
Sex
Male 33%
Female 67%
Age
26-35 25%
36-45 47%
46-55 26%
56-65 2%
Quantitative Preparation in Doctoral Programs
141
Variable Percent
Degree Concentration
Counseling 4%
Special Education 23%
Educational Research 23%
Educational Leadership 21%
Curriculum and Instruction 30%
Degree Sought
PhD 79%
EdD 19%
Future Plans
Professor 37%
Researcher 14%
Practitioner 49%
The COE at this university runs seven PhD programs (Counseling, Higher Education, Special Edu-cation, Educational Psychology, Educational Leadership, Curriculum and Instruction, and Kinesiol-ogy combination programs) and two EdD programs (Higher Education, Educational Leadership). All students in these doctoral level programs are required to take the same two quantitative research methods courses: Statistics for Educational Research and Research Methods in Education. Some programs require only these two courses, as in the Higher Education EdD program, while others re-quire as many as 11 methods and analysis courses, as in the Research, Measurement, and Statistics concentration of the Educational Psychology PhD program. In fall of 2016, the COE had a total of 401 doctoral students registered in their programs, including full-time students, part-time students, and ABD students completing dissertation hours.
Procedures. Recruitment procedures involved emailing and sharing survey links through social me-dia with current education doctoral students at a large, public university in the southwestern United States. The invitations to participate in the survey included detailed information regarding the study and participant protection plans. No personally identifying information was collected in this study in an effort to encourage open and honest responses from participants. No compensation was provided to participants for completing the survey. For those electing to participate in the study, they were di-rectly linked to the web-based survey. Students declining to participate were directed to a page thank-ing them for their time and exited from the study.
Researcher subjectivity. The research team for this project consisted of three investigators: one faculty member primarily teaching courses in quantitative methods, and two advanced doctoral stu-dents concentrating on special education and research methods and analysis, respectively. The doc-toral students facilitated direct contact with the participants to encourage open discussion and to pro-tect the participants and faculty member in any current or future courses or interactions. Care was taken throughout the process to protect the identity of the students and no names were connected to responses at any time.
Questionnaire. An 18-item questionnaire was used to capture student perceptions and experiences. Survey questions included eight demographic items, eight quantitative research perception and expe-rience items, one ranked item on challenges to quantitative proficiency, and simultaneously, one open-ended question regarding perceived challenges related to quantitative instruction. The quantita-tive perception and experience items were presented with a Likert-type scale where 1 was Strongly Disagree and 6 was Strongly Agree. Participants were asked to indicate if they intended to pursue a future role as a professor, indicating they would focus on a mix of both research and teaching, as a researcher, focusing more exclusively on research, or as a practitioner, focusing more exclusively on
Ferguson, Hovey, & Henson
142
teaching or leadership as a practitioner. These items were developed based on a review of the litera-ture on quantitative proficiency by the primary researchers. Then the items were reviewed in collabo-ration with the rest of the research team and other peers to clarify wording and refine the question-naire before data collection.
The mixed-method design in phase 1 includes both quantitative and qualitative data, which was col-lected concurrently and analyzed separately. Results are combined in the discussion to deepen the un-derstanding of each methodology on its own and strengthen the overall study outcomes (Creswell & Plano Clark, 2011; Teddlie & Tashakkori, 2009).
RESULTS
To address the first research question on student perceptions of their own training in quantitative methods, both descriptive analysis and group comparisons were conducted. Group comparison for doctoral degree concentration and future career goals (see Table 1) were conducted based on pat-terns observed in the descriptive results.
Descriptive analysis
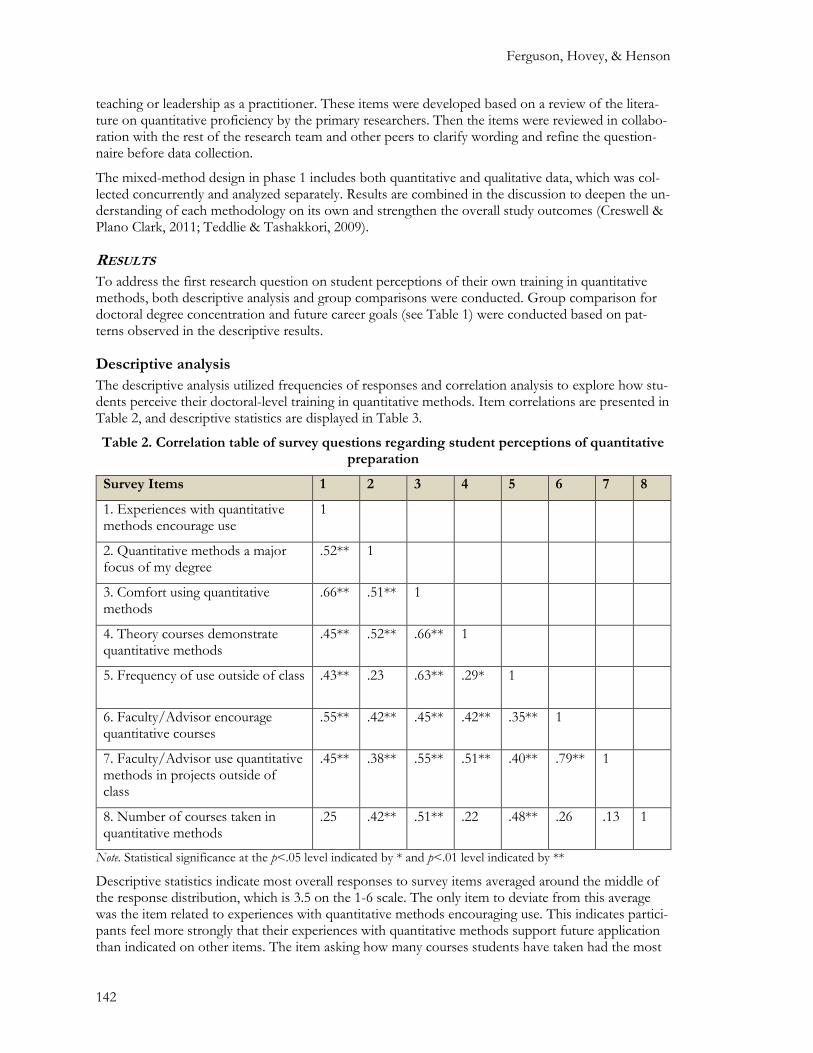
The descriptive analysis utilized frequencies of responses and correlation analysis to explore how stu-dents perceive their doctoral-level training in quantitative methods. Item correlations are presented in Table 2, and descriptive statistics are displayed in Table 3.
Table 2. Correlation table of survey questions regarding student perceptions of quantitative preparation
Survey Items 1 2 3 4 5 6 7 8
1. Experiences with quantitative methods encourage use
1
2. Quantitative methods a major focus of my degree
.52** 1
3. Comfort using quantitative methods
.66** .51** 1
4. Theory courses demonstrate quantitative methods
.45** .52** .66** 1
5. Frequency of use outside of class .43** .23 .63** .29* 1
6. Faculty/Advisor encourage quantitative courses
.55** .42** .45** .42** .35** 1
7. Faculty/Advisor use quantitative methods in projects outside of class
.45** .38** .55** .51** .40** .79** 1
8. Number of courses taken in quantitative methods
.25 .42** .51** .22 .48** .26 .13 1
Note. Statistical significance at the p<.05 level indicated by * and p<.01 level indicated by **
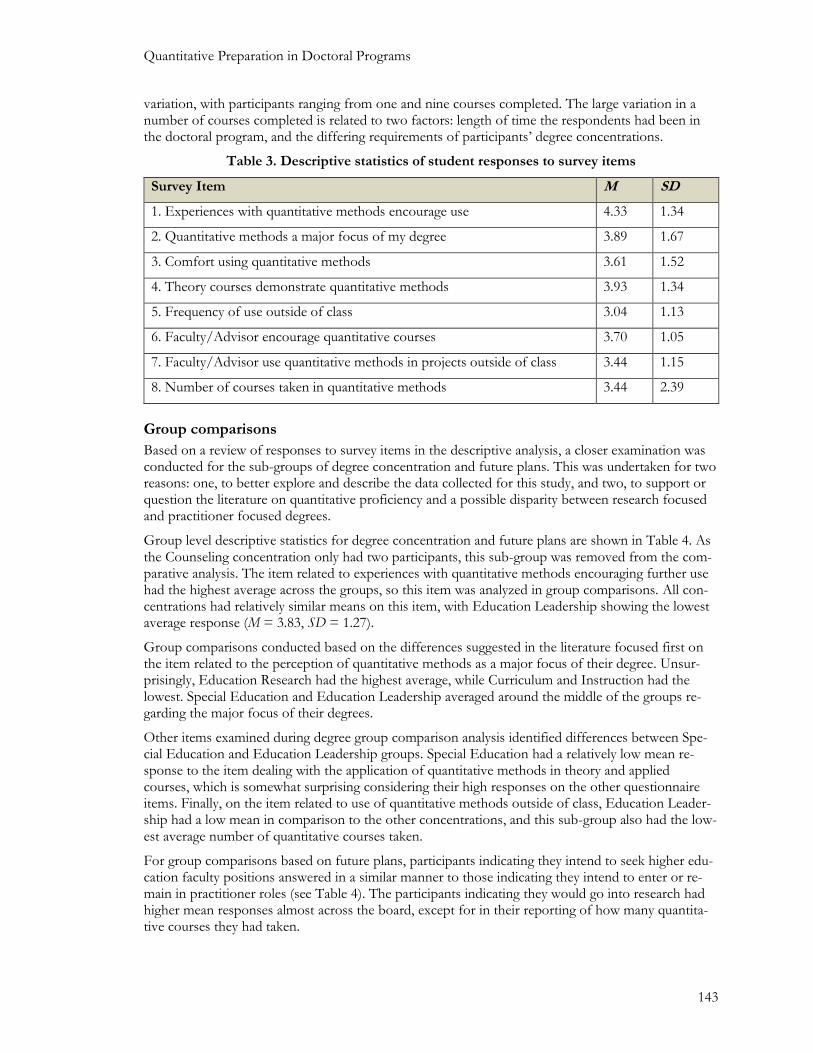
Descriptive statistics indicate most overall responses to survey items averaged around the middle of the response distribution, which is 3.5 on the 1-6 scale. The only item to deviate from this average was the item related to experiences with quantitative methods encouraging use. This indicates partici-pants feel more strongly that their experiences with quantitative methods support future application than indicated on other items. The item asking how many courses students have taken had the most
Quantitative Preparation in Doctoral Programs
143
variation, with participants ranging from one and nine courses completed. The large variation in a number of courses completed is related to two factors: length of time the respondents had been in the doctoral program, and the differing requirements of participants’ degree concentrations.
Table 3. Descriptive statistics of student responses to survey items
Survey Item M SD
1. Experiences with quantitative methods encourage use 4.33 1.34
2. Quantitative methods a major focus of my degree 3.89 1.67
3. Comfort using quantitative methods 3.61 1.52
4. Theory courses demonstrate quantitative methods 3.93 1.34
5. Frequency of use outside of class 3.04 1.13
6. Faculty/Advisor encourage quantitative courses 3.70 1.05
7. Faculty/Advisor use quantitative methods in projects outside of class 3.44 1.15
8. Number of courses taken in quantitative methods 3.44 2.39
Group comparisons
Based on a review of responses to survey items in the descriptive analysis, a closer examination was conducted for the sub-groups of degree concentration and future plans. This was undertaken for two reasons: one, to better explore and describe the data collected for this study, and two, to support or question the literature on quantitative proficiency and a possible disparity between research focused and practitioner focused degrees.
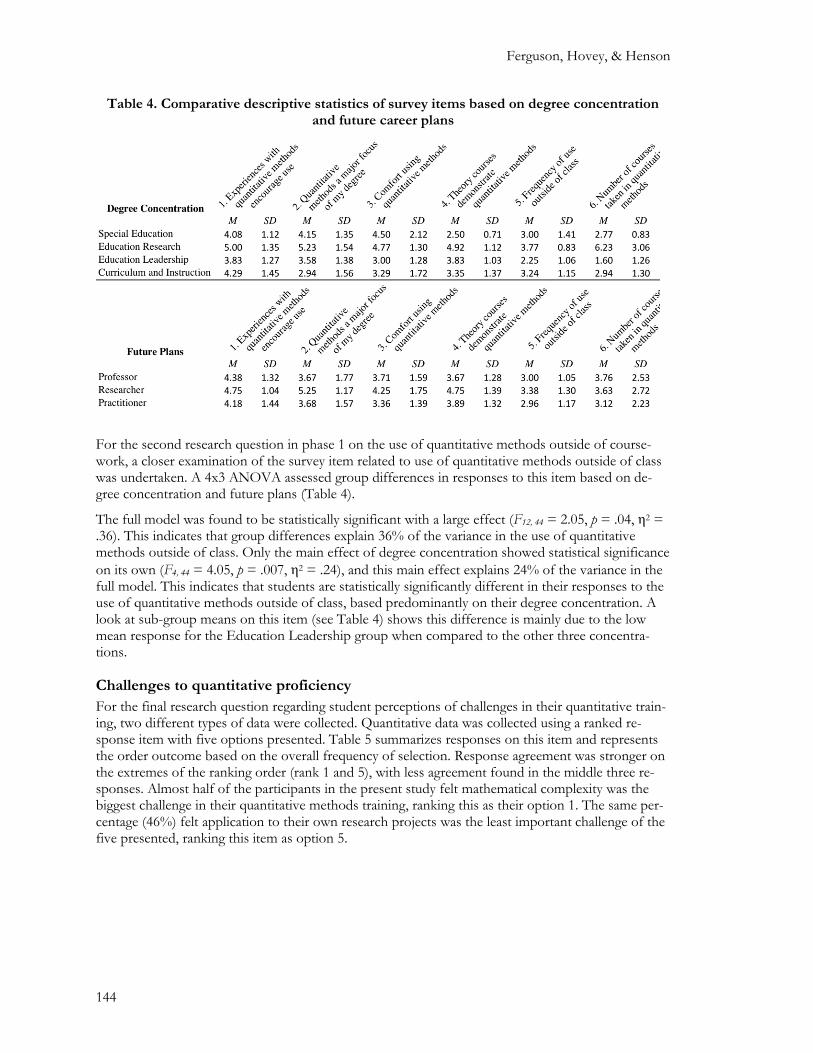
Group level descriptive statistics for degree concentration and future plans are shown in Table 4. As the Counseling concentration only had two participants, this sub-group was removed from the com-parative analysis. The item related to experiences with quantitative methods encouraging further use had the highest average across the groups, so this item was analyzed in group comparisons. All con-centrations had relatively similar means on this item, with Education Leadership showing the lowest average response (M = 3.83, SD = 1.27).
Group comparisons conducted based on the differences suggested in the literature focused first on the item related to the perception of quantitative methods as a major focus of their degree. Unsur-prisingly, Education Research had the highest average, while Curriculum and Instruction had the lowest. Special Education and Education Leadership averaged around the middle of the groups re-garding the major focus of their degrees.
Other items examined during degree group comparison analysis identified differences between Spe-cial Education and Education Leadership groups. Special Education had a relatively low mean re-sponse to the item dealing with the application of quantitative methods in theory and applied courses, which is somewhat surprising considering their high responses on the other questionnaire items. Finally, on the item related to use of quantitative methods outside of class, Education Leader-ship had a low mean in comparison to the other concentrations, and this sub-group also had the low-est average number of quantitative courses taken.
For group comparisons based on future plans, participants indicating they intend to seek higher edu-cation faculty positions answered in a similar manner to those indicating they intend to enter or re-main in practitioner roles (see Table 4). The participants indicating they would go into research had higher mean responses almost across the board, except for in their reporting of how many quantita-tive courses they had taken.
Ferguson, Hovey, & Henson
144
Table 4. Comparative descriptive statistics of survey items based on degree concentration and future career plans
For the second research question in phase 1 on the use of quantitative methods outside of course-work, a closer examination of the survey item related to use of quantitative methods outside of class was undertaken. A 4x3 ANOVA assessed group differences in responses to this item based on de-gree concentration and future plans (Table 4).
The full model was found to be statistically significant with a large effect (F12, 44 = 2.05, p = .04, η2 = .36). This indicates that group differences explain 36% of the variance in the use of quantitative methods outside of class. Only the main effect of degree concentration showed statistical significance
on its own (F4, 44 = 4.05, p = .007, η2 = .24), and this main effect explains 24% of the variance in the full model. This indicates that students are statistically significantly different in their responses to the use of quantitative methods outside of class, based predominantly on their degree concentration. A look at sub-group means on this item (see Table 4) shows this difference is mainly due to the low mean response for the Education Leadership group when compared to the other three concentra-tions.
Challenges to quantitative proficiency
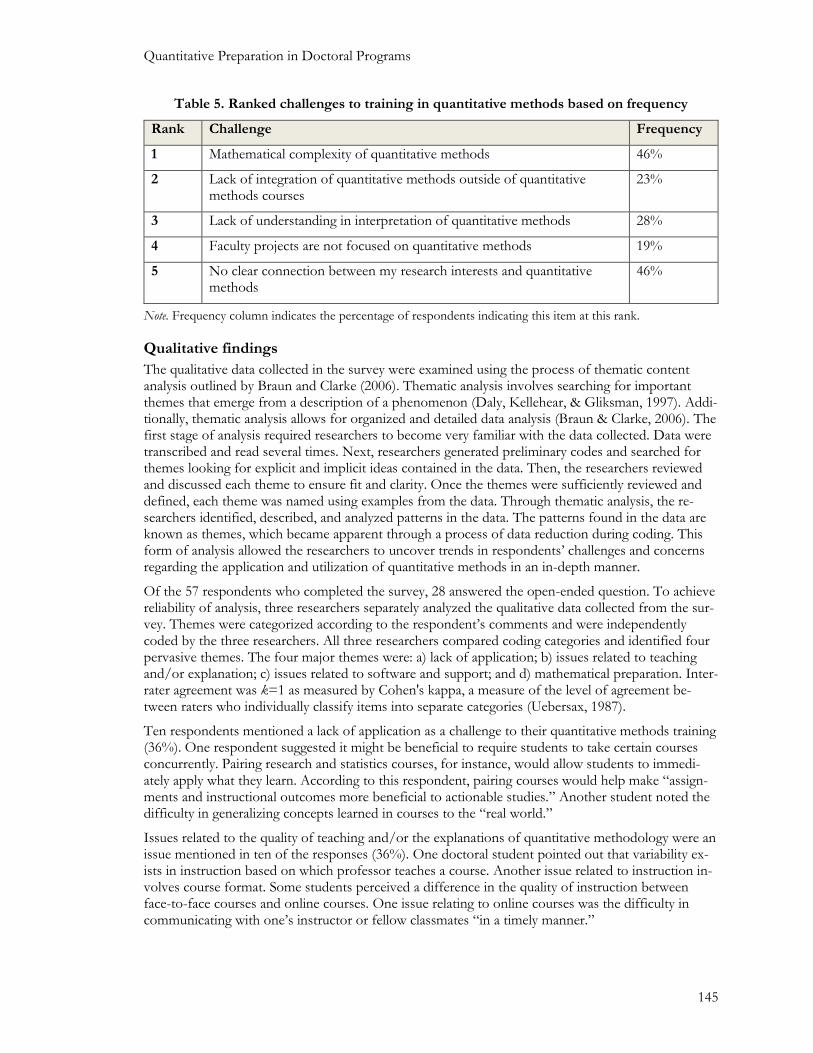
For the final research question regarding student perceptions of challenges in their quantitative train-ing, two different types of data were collected. Quantitative data was collected using a ranked re-sponse item with five options presented. Table 5 summarizes responses on this item and represents the order outcome based on the overall frequency of selection. Response agreement was stronger on the extremes of the ranking order (rank 1 and 5), with less agreement found in the middle three re-sponses. Almost half of the participants in the present study felt mathematical complexity was the biggest challenge in their quantitative methods training, ranking this as their option 1. The same per-centage (46%) felt application to their own research projects was the least important challenge of the five presented, ranking this item as option 5.
Quantitative Preparation in Doctoral Programs
145
Table 5. Ranked challenges to training in quantitative methods based on frequency
Rank Challenge Frequency
1 Mathematical complexity of quantitative methods 46%
2 Lack of integration of quantitative methods outside of quantitative methods courses
23%
3 Lack of understanding in interpretation of quantitative methods 28%
4 Faculty projects are not focused on quantitative methods 19%
5 No clear connection between my research interests and quantitative methods
46%
Note. Frequency column indicates the percentage of respondents indicating this item at this rank.
Qualitative findings
The qualitative data collected in the survey were examined using the process of thematic content analysis outlined by Braun and Clarke (2006). Thematic analysis involves searching for important themes that emerge from a description of a phenomenon (Daly, Kellehear, & Gliksman, 1997). Addi-tionally, thematic analysis allows for organized and detailed data analysis (Braun & Clarke, 2006). The first stage of analysis required researchers to become very familiar with the data collected. Data were transcribed and read several times. Next, researchers generated preliminary codes and searched for themes looking for explicit and implicit ideas contained in the data. Then, the researchers reviewed and discussed each theme to ensure fit and clarity. Once the themes were sufficiently reviewed and defined, each theme was named using examples from the data. Through thematic analysis, the re-searchers identified, described, and analyzed patterns in the data. The patterns found in the data are known as themes, which became apparent through a process of data reduction during coding. This form of analysis allowed the researchers to uncover trends in respondents’ challenges and concerns regarding the application and utilization of quantitative methods in an in-depth manner.
Of the 57 respondents who completed the survey, 28 answered the open-ended question. To achieve reliability of analysis, three researchers separately analyzed the qualitative data collected from the sur-vey. Themes were categorized according to the respondent’s comments and were independently coded by the three researchers. All three researchers compared coding categories and identified four pervasive themes. The four major themes were: a) lack of application; b) issues related to teaching and/or explanation; c) issues related to software and support; and d) mathematical preparation. Inter-rater agreement was k=1 as measured by Cohen's kappa, a measure of the level of agreement be-tween raters who individually classify items into separate categories (Uebersax, 1987).
Ten respondents mentioned a lack of application as a challenge to their quantitative methods training (36%). One respondent suggested it might be beneficial to require students to take certain courses concurrently. Pairing research and statistics courses, for instance, would allow students to immedi-ately apply what they learn. According to this respondent, pairing courses would help make “assign-ments and instructional outcomes more beneficial to actionable studies.” Another student noted the difficulty in generalizing concepts learned in courses to the “real world.”
Issues related to the quality of teaching and/or the explanations of quantitative methodology were an issue mentioned in ten of the responses (36%). One doctoral student pointed out that variability ex-ists in instruction based on which professor teaches a course. Another issue related to instruction in-volves course format. Some students perceived a difference in the quality of instruction between face-to-face courses and online courses. One issue relating to online courses was the difficulty in communicating with one’s instructor or fellow classmates “in a timely manner.”
Ferguson, Hovey, & Henson
146
Concerns having to do with software and support were included in five comments (18%). One stu-dent mentioned the university using the Statistical Package for the Social Sciences (SPSS) software even though “industry practice does not use SPSS.” One suggestion was for support services such as labs and tutoring hours to be expanded to accommodate non-traditional students. “More support services should be available in the evening hours or on Saturdays. Many people are still at work when the sessions for support are offered.”
Mathematical background and preparation concerns were mentioned four times (14%). Some stu-dents in doctoral programs indicated they do not have a strong math background and their doctoral program is practitioner based, not research focused. Even so, students are required to take quantita-tive research coursework. “Non-research majors are taking courses with research majors.” Another perceived issue is that instructors tend to assume students have background knowledge they do not. One respondent wrote, “My master’s program DID NOT include any statistics coursework. I feel it has been assumed that we have this background knowledge.” Another doctoral student felt students are not encouraged to “understand the mathematics behind the statistics.”
DISCUSSION
In relation to the first research question, we found that participants in phase 1 tended to feel positive about the value of quantitative courses in encouraging future use of quantitative methods. On the item corresponding to whether quantitative methods are a major focus of their degree, participants in Educational Research unsurprisingly endorsed this item the highest, while Curriculum and Instruc-tion had the lowest average. This finding corresponds to the statements made in previous work, which suggested differences in researcher proficiency could be connected to area of degree focus (Henson et al., 2010). Students pursuing a degree in research specifically would be expected to have additional required courses in methods than would be seen for other degree specializations, and this was supported in the current study.
In the comparison of responses based on future plans, participants who indicated professor and practitioner as their career path tended to respond to items similarly. By contrast, the participants who indicated they were interested in research had overall higher responses on items, except for the number of quantitative courses currently completed. This finding suggests that a division in EdD and PhD programs may not be necessary from the student perspective to support career goals, at least for those pursuing a professor or practitioner career. Previous research has debated the need for dif-ferent quantitative methods courses, particularly for those students who need methods courses for future work as a practitioner, as might be expected with an EdD student, versus those who would focus more on research productivity in their future work, as would be more common for a PhD (Ei-senhart & DeHaan, 2005; Henson et al., 2010).
The second research question looked at how often quantitative methods are used outside of class. The only noteworthy effect was found in the main effect of degree concentration. Specifically, the difference appears to be between participant responses on this item in Education Research on the high end and Education Leadership on the low end. The high mean for Education Research is not surprising as this is a quantitative research concentration. However, the lower mean for Education Leadership is somewhat surprising as, since the advent of NCLB (2002), many education decisions are driven by quantitative data. However, this finding aligns with the literature on the perceived appli-cation differences between education leadership and education research careers (Eisenhart & DeHaan, 2005; Henson et al., 2010).
Results related to the third research question involve a combination of quantitative and qualitative responses. As a result of the qualitative analysis, the issue of teaching quality in quantitative courses is a concern for participants. This perspective is partially supported in current work on teaching in higher education, but only with the inclusion of student practice (McKeachie, 2002). When compar-ing quantitative and qualitative responses, two discrepancies were identified. First, while quantitative responses indicated that mathematical complexity was the biggest challenge to application, this was

Quantitative Preparation in Doctoral Programs
147
the least prevalent of the four themes identified in the qualitative analysis. Second, a lack of applica-tion was identified as one of the major themes in qualitative analysis. However, the quantitative re-sults indicated this was the least challenging aspect of quantitative methods training. Further investi-gation is needed to better understand doctoral student perceptions of challenges to quantitative pro-ficiency. Specifically, a more detailed investigation of the challenges doctoral students face is needed to better understand the results of this survey phase.
PHASE 2
METHODS
Research design
Phase 2 of the study utilized focus group methodology to better understand and evaluate doctoral students’ perceptions of their quantitative preparation and their perceptions of their ability to imple-ment quantitative methods. The focus group questions were designed based on the results of the phase 1 survey to further assess doctoral student perspectives of their quantitative training. Specifi-cally, the question on challenges in quantitative training was included to clarify the results from phase 1. Three focus groups were conducted. The focus groups began with an initial quantitative reasoning task and then moved on to four discussion questions (see Appendix B). The quantitative reasoning task was included to focus the conversation in the focus groups on quantitative proficiency. Addi-tionally, the inclusion of this task allowed for additional analysis of the participants’ level of profi-ciency in discussing some simple statistical analyses. The remaining questions were semi-structured, open-ended and meant to spur discussion among the participants. Approval from the Institutional Review Board (IRB) was obtained prior to conducting the research study.
Procedures. Participants for phase 2 were recruited from volunteers who self-selected to participate in the focus groups at the end of the phase 1 survey. The invitations to participate in phase 2 re-quired survey respondents to enter their email address at the end of the phase 1 surveys. In an effort to encourage open and honest responses from participants, email addresses were not connected with the survey responses from phase 1.
The focus groups lasted 51, 56, and 36 minutes, respectively, and all group sessions were conducted in conference rooms within the university. Consent for participation was obtained prior to the start of each group. The same researcher acted as moderator for all three groups: stating the purpose of the study, the questions for the participants to answer, and moderated all responses. All information was recorded utilizing two digital recorders, and a light meal was provided for the participants.
Participants. A total of 10 doctoral students participated in the focus groups. The sample was 30% Male and 70% Female. Representation of degree concentration was Counseling: 10%; Special Educa-tion: 10%; Educational Research: 50%; Educational Leadership: 10%; and Curriculum and Instruc-tion: 20%.
Data analysis
Recordings were transcribed verbatim following the completion of the focus groups. Transcriptions were verified by the research team to ensure the accuracy of the original focus groups (Bailey, 2008). Qualitative data in phase 2 was analyzed using content analysis within a constant comparative frame-work (Glaser, 1965; Rutledge, Jones, Bailey, & Stewart, 2014). Constant comparative analysis for this project included a process of first open coding the focus group transcripts. Then, the researchers compared notes on the open coding process to reach consensus on the preliminary major themes to include in the coding frame (see Figure 1). Next, axial coding was used to compare codes and themes found in the data (Chenail, 2012). Then, the data was again compared to the themes to re-analyze data and allow for identification of new themes. Finally, the coding process was ended when satura-tion was achieved and all meaningful data was coded, resulting in four main themes: quantitative

Ferguson, Hovey, & Henson
148
training for independent research, challenges to utilizing quantitative methods, critiques of quantita-tive preparation, and internal motivation for students. This constant comparative process allowed the researchers to better evaluate doctoral-level students’ perceptions of their quantitative methods train-ing in an in-depth manner.
Figure 1. Preliminary coding frame developed in Phase 2 qualitative analysis
FINDINGS
Quantitative reasoning task
Three themes were identified in the discussions regarding the quantitative reasoning task. One theme that was mentioned in all three focus groups was a general statistics discussion related to the task. Participants ranged in the depth of their discussion regarding this task with seven out of 18 com-ments occurring at a basic level. These comments generally focused on assumptions and whether the values were statistically significant. Eight comments out of 18 were at a deeper level of discussion, including talk about the meaning of p-values in statistics and the need for clarification of scaling be-fore interpretation. Only three comments were related to advanced statistical concepts such as valida-tion and the role of sample size in deciphering statistical and practical significance.
The second theme focused on confusion participants faced in interpreting the task. Some partici-pants showed a lower level of learning or remembrance of basic statistical concepts, commenting that “I would have to go back, and I could not give any interpretation to this at all, cause I look at it and go ‘it looks familiar’ but, ah, to be honest I would have to go and review and go ‘what does it mean?’” (Focus Group 1, Participant 1). Nervous laughter was observed multiple times during the first two focus groups, typically right before or after comments regarding lack of understanding or depth in a participant’s own discussion.
The final theme identified in this first section was a discussion of real world significance and applica-bility. Participants in two different focus groups mentioned their first thought was related to practical significance and meaning as opposed to statistical significance. Participants recognized the common misconceptions regarding statistical values and meaning in a practical sense, noting that “People typi-cally don’t know what statistical significance is and they automatically assume statistical significance is the same thing as practical significance and it’s not.” (Focus Group 2, Participant 4).
Quantitative training for independent research
When asked about their preparedness for independent research using quantitative methods, partici-pants were mixed in their responses. Three out of the ten participants commented that they feel con-
I. Interpretation Confusion
a. Outside Support
II. Critiques of Courses
a. Comments on Course Activities/Materials
b. Comments on Instructors
III. Real-World Significance
IV. Application
a. Personal Experience
V. Internalizing Knowledge
Quantitative Preparation in Doctoral Programs
149
fident in their knowledge and know where to go for more information and assistance. Other partici-pants felt exposed to content but did not own their learning “I feel like I have been exposed to it and I can conduct research and run the tests, but…to really dig deep into it I don’t feel like I’m there yet” (Focus Group 1, Participant 2). Those that lacked confidence feared making an error in work on their own, felt they would rather hire someone to complete their analysis, and even commented they “still feel really dumb” regarding quantitative methods (Focus Group 1, Participant 2).
The other major theme in this section of the focus groups relates to the lack of application of course-work to independent research. Participants commented that "we don’t get enough opportunities to work through the whole process” in quantitative courses, leading to a lack of preparation for the real-ity of independent research (Focus Group 3, Participant 2). One participant also raised a concern re-garding the applicability of quantitative methods for students in more qualitative-focused content ar-eas.
Challenges to utilizing quantitative methods
Another major theme was related to challenges students face in utilizing quantitative methods. Some of the challenges were specifically related to course work, such as the issue of diversity of back-grounds for students within each course. This was cited as a concern for their professors who then struggle to meet the needs of students from novice to intermediate levels. Participants in two differ-ent focus groups addressed this issue, with one saying “being in class where they (other students) don’t understand the divisional line, they are like ‘what’s that?’ so that brings down the whole class” (Focus Group 3, Participant 1). A need for scaffolding content in statistics courses was also mentioned, with participants desiring a more gradual progression through the topics.
Another element of challenges discussed by the participants related to confusion regarding statistics and interpretations. One participant said that “statistics is like a foreign language” (Focus Group 1, Participant 2) and others noted that they often sought help from outside resources to complete the course requirements. In contrast to the comments on a lack of challenge due to students at differing instructional levels as mentioned in the previous element, these participants noted that courses move too quickly and lack a strong foundation. Once again, a common thread of scaffolding and a need for clear understanding of the basics concepts connects these two sides of the issue.
The last theme of the challenges question is related to the application of quantitative methods to practical research problems. Participants noted a need for more examples and case studies built into quantitative courses. A number of comments from participants harkened back to the issue of a need to connect applied substantive theory to statistical practice, and connect statistical theory to applied research topics. One participant addressed this issue by saying “I feel like our exposure was very the-oretical, and it should have more real-world examples” (Focus Group 3, Participant 1).
Critiques of quantitative preparation
Throughout the discussion, participants often had direct critiques and comments on their quantita-tive preparation. Two overall themes were identified related to these comments. The first focused on the classes themselves. One participant noted the disconnection between grades in a course and re-taining the content, saying “I don’t remember anything from my classes and I hated all of them, even though I did really well” (Focus Group 1, Participant 1). Discussions on this issue noted a lack of ap-plication to real problems, not enough emphasis on application and meaning in addition to processes, and a lack of context around the statistical knowledge gained. One participant commented, “it makes no sense if you don't understand how to best use it or in what framework you are going to use it” (Focus Group 2, Participant 4). Participants in one focus group felt the work completed in quantita-tive methods courses was not always meaningful to their research and would never be useful to them again. It should be noted participants not in a research-focused concentration introduced this com-ment.
Ferguson, Hovey, & Henson
150
The second theme identified in analysis is related to the first theme but focuses more on the role of faculty. Multiple participants discussed a need for more support in quantitative methods courses, whether through a lab section for courses or through additional mentoring and scaffolding in the lec-tures. Participants commented on the lack of consistency in teaching style and pedagogy, noting that faculty are “professors but not teachers” (Focus Group 1, Participant 4). In another focus group, the comment was made on differences in content depending on the course section and professor. One participant was concerned that the quality of each course was not the same, saying, “it can be dis-heartening to hear that two people are taking the same course by different people and still the infor-mation seems completely different” (Focus Group 2, Participant 4). Additionally, participants cited a lack of feedback on assignments as a critique of their quantitative preparation saying “I can’t tell you how many times I’ve turned in a paper or turned in a test and I know my score, but no editing was provided; no feedback was provided…” (Focus Group 2, Participant 3).
Internal motivation for students
Throughout the process of coding and discussing the results between the researchers, an additional theme was identified from the data. Participants did not appear to be venting frustrations with spe-cific professors or complaining about their courses. Rather, their motivation in participating in this study and discussing these issues appeared to be internal. The larger issue for participants was one of a desire to internalize the knowledge gained in quantitative methods courses to help their own career goals. One participant stated “I want to know ‘so what, what does it mean?’ the interpretation and real-world application” (Focus Group 1, Participant 1), emphasizing a personal motivation to learn the content. Another said, in reference to research, “We want to learn more about what we can do so we can think of questions to ask…we want to ask more questions” (Focus Group 1, Participant 3).
Participants commented on the role of doctoral-level courses to prepare students for the professional field, saying, “we’re trying to produce individuals that are going to be productive” (Focus Group 2, Participant 3). Comments related to challenges in courses, need for more feedback, and real world applications appear to be rooted in this want for internalized learning. Participants in the study often critiqued or stated suggestions for courses to increase rigor and make stronger connections to practi-cal problems as “it needs to be applicable, nobody wants to have wasted their time” (Focus Group 2, Participant 4).
DISCUSSION
Results from the quantitative reasoning task indicated that students in the current study, regardless of degree concentration, have a foundational understanding of quantitative methods. Those participants from the Educational Research concentration did tend to show more advanced quantitative reason-ing ability than others in the focus groups. These results agree with the phase 1 survey results and should not be surprising. Additionally, the results from this task show students have an awareness of challenges in interpreting statistical analyses beyond reporting numbers. Discussions on the issue of statistical significance and meaning behind high or low values indicate a higher level of quantitative reasoning, as expected with doctoral-level students. As suggested in Eisenhart and DehHann (2005), the Educational Research concentration participants did show a stronger quantitative proficiency in the present study as compared to the other participants. However, all participants exhibited a profi-ciency level appropriate to their program’s needs, which is in line with suggestions from Henson et al. (2010) that methods courses should be consistent regardless of PhD or EdD degree focus. As proposed by multiple participants in the current study, one resolution to this issue could be to split quantitative courses between Educational Research students and students in other concentrations. Alternatively, an additional focus on application specific to each student’s needs or program concen-tration within the existing course structure could help alleviate this student concern.
From the open-ended focus group questions, participants were frank in their discussion of the posi-tives and negatives they perceive in their quantitative training. Participants had several suggestions
Quantitative Preparation in Doctoral Programs
151
and critiques of current quantitative coursework in their programs beyond their own personal likes or dislikes of the topic. Discussion often focused on the need to improve preparation to include more application and real-world problems. Consistently throughout all three focus groups, the drive for participants appeared to be a desire to improve the programs and better support personal research goals. This result agrees with suggestions in Henson et al. (2010) to increase quantitative proficiency through application of statistical concepts.
The overall Internal Motivation theme identified in the study speaks to this concept, emphasizing the unique perspective of doctoral students in coursework. Rather than complaining about instructors or courses, focus throughout the study appeared to be on how courses worked or did not work for each individual and what students felt they needed in order to feel confident in applying quantitative meth-ods. This theme appears to be directly connected to the concept of quantitative proficiency as de-fined for this project (Chance, 2002; Garfield, 2002; Henson et al., 2010). Students in doctoral pro-grams in education, as supported in the present study, want to master the content of their quantita-tive methods courses and by quantitatively proficient. The concerns noted in the present study are related to how faculty and course work can best support this goal, and are not focused on a lack of interest or ability in these courses on the part of the students.
MIXED-METHODS INTEGRATION
LIMITATIONS
The sample in both phases of the current study is taken from one college within a single university. Although this is a large public university, generalizability is limited. In phase 1, no option was pre-sented to students on the topic of teaching quality as a challenge to quantitative training. This is a limitation of the current questionnaire and future iterations can benefit from this inclusion. Addition-ally, the sample size for the survey is small for a quantitative study, limiting the generalizability of the results. Unequal sample sizes between the sub-groups should also be noted. Future studies could ex-pand the current work with a larger sample, possibly using stratified sampling strategies to allow for equal sub-group comparisons. When students are presented with a set of options to order as op-posed to an open item to share their concerns, their responses may be more impacted by expecta-tions and perceptions instead of personal opinion. In the focus groups, limitations of time and sched-uling may have prevented some participants from contributing. For phase 2, data analysis was con-ducted by the two primary researchers to avoid potential bias in the professor to student relationship for the third researcher. However, the limitation of only two coders should be noted. Future studies could take the coding frame utilized in this study and attempt a replication of these results with an-other sample and a different research team.
INTEGRATED CONCLUSIONS
Inferences from results of the quantitative and qualitative studies were integrated to form meta-infer-ences (Creswell & Plano Clark, 2011; Teddlie & Tashakkori, 2009; Venkatesh, Brown, & Bala, 2013). Overall, the results of the survey study extend the literature on quantitative proficiency by addressing student perspectives on quantitative training instead of focusing on the instructor or program per-spective. Based on these responses, students acknowledged the need for quantitative courses and overall felt their experiences supported their future use of quantitative methods. Challenges related to quantitative proficiency appear to be predominantly focused on mathematical preparation and the ability to apply content outside of class. This is largely in line with previous understandings in the lit-erature on this topic (Eisenhart & DeHaan, 2005; Henson et al, 2010; Labaree 2003; Shih et al., 2016), but indicates these issues are still salient in current doctoral training.
From phase 2, the focus group results support the findings of the phase 1 survey. As with the first phase, participants in the focus groups cited a need for more application of quantitative methods. Additionally, challenges mentioned in the survey on differences in student preparation and varying
Ferguson, Hovey, & Henson
152
instructor teaching styles were discussed in more detail. This emphasizes the need for attention in these areas to better support quantitative proficiency for students in doctoral programs, and agrees with prior research on doctoral students (Shih et al., 2016). Overall, the focus for students in both phases of the current study appears to be internally motivated by a need to understand and utilize quantitative methods appropriately. Faculty and course/program administrators should note the stu-dent concerns related to adequate support or tutoring in courses, lack of equal preparation for doc-toral-level quantitative courses, and a stated interest for students in applied work within courses to put their learning into action.
Additionally, the main differences seen between Education Leadership and Educational Research concentration students appear to be related to the number of courses taken and the perceived future use of quantitative methods. Little in the present study supports the need for separating quantitative methods courses for these two student groups. Prior literature has called for differentiation in the type of research training provided for different areas of education, separating students in educational research areas from those with a more applied focus in educational leadership (Eisenhart & DehHann, 2005). Rather, student perspectives in the present study on their quantitative preparation suggest the need for better support for all students. Results from both phases indicate doctoral stu-dents value their quantitative coursework, but there are specific challenges to their success in these courses that can be addressed. However, it should be noted that the challenges identified differ be-tween the Education Leadership and Educational Research student groups. An alternate argument to different courses for different education programs has been presented, arguing that all students re-ceiving a PhD are receiving a research generating degree, and therefore should be prepared equally to conduct research (Henson et al, 2010). If a combined course approach is maintained, differentiation within the course is be needed to meet the unique needs of these student groups and address their different levels of preparation. The present study supports an argument for increased student support in quantitative methods courses, regardless of program or concentration.
Faculty and program administrators in doctoral education degree programs should consider how best to address the concerns and suggestions found within this study in their own programs. In terms of course design and content, suggestions would be for instructors to increase practical applications in their quantitative courses through applied homework or project assignments. Additionally, the issue of support through tutoring or lab sections has consistently been discussed and should be seriously considered in course planning. Other suggestions would be to pre-test students’ statistical abilities in doctoral level courses as opposed to assuming they are adequately prepared. Students could then be offered additional course work or targeted remediation support to better prepare them for success in quantitative methods courses, pulling recommendations from the differentiation literature common in K-12 education (see extensive work by Carol Ann Tomlinson; Lawrence-Brown, 2004). If the ulti-mate goal of quantitative methods courses is to prepare high-quality educational researchers who are quantitatively proficient, faculty and administrators in quantitative methods courses can benefit from the student voice represented in these recommendations to adjust their course offerings and better meet the needs of their students.
REFERENCES
Bailey, J. (2008). First steps in qualitative data analysis: Transcribing. Family Practice, 25, 127-131. doi:10.1093/fampra/cmn003
Braun, V., & Clarke, V. (2006). Using thematic analysis in psychology. Qualitative Research in Psychology, 3(2), 77-101.
Capraro, R. M., & Thompson, B. (2008). The educational researcher defined: What will future researchers be trained to do? Journal of Educational Research, 101, 247-253. doi: 10.3200/JOER.101.4.247-253
Chance, B. L. (2002). Components of statistical thinking and implication for instruction and assessment. Journal of Statistics Education, 10(3). Retrieved from http://www.amstat.org/publications/jse/v10n3/chance.html
Quantitative Preparation in Doctoral Programs
153
Chance, B. L. & Garfield, J. B. (2002). New approaches to gathering data on student learning for research in statistics education. Statistics Education Research Journal, 1(2), 38-44. Retrieved from https://www.stat.auck-land.ac.nz/~iase/serj/SERJ1(2).pdf
Chenail, R. J. (2012). Conducting qualitative data analysis: Reading line-by-line, but analyzing by meaningful qualitative units. The Qualitative Report, 17, 266-269. Retrieved from http://www.nova.edu/ssss/QR/QR17-1/chenail-line.pdf
Creswell, J. W., & Plano Clark, V. L. (2011). Designing and conducting mixed methods research. Thousand Oaks, CA: Sage Publications.
Daly, J., Kellehear, A. & Gliksman, M. (1997). The public health researcher: A methodological approach. Melbourne, Australia: Oxford University Press.
Eisenhart, M., & DeHaan, R. L. (2005). Doctoral preparation of scientifically based education researchers. Edu-cational Researcher, 34(4), 3-13. doi:10.3102/0013189X034004003
Feuer, M. J., Towne, L., & Shavelson, R. J. (2002). Scientific culture and educational research. Educational Re-searcher, 31(8), 4-14. doi:10.3102/0013189X031008004
Garfield, J. B. (2002). The challenge of developing statistical reasoning. Journal of Statistics Education, 10(3). Re-trieved from http://www.amstat.org/publications/jse/v10n3/garfield.html
Glaser, B. G. (1965). The constant comparative method of qualitative analysis. Social Problems, 12, 436-445. doi:10.2307/798843
Heflinger, C. A., & Doykos, B. (2016). Paving the pathway: Exploring student perceptions of professional de-velopment preparation in doctoral education. Innovative Higher Education 41, 343–358. doi:10.1007/s10755-016-9356-9
Henson, R. K., Hull, D. M., & Williams C. S. (2010). Methodology in our education research culture: Toward a stronger collective quantitative proficiency. Educational Researcher, 39, 229-240. doi:10.3102/0013189X10365102
Kerrigan, M. R., & Hayes, K. W. (2016). EdD students’ self-efficacy and interest in conducting research. Inter-national Journal of Doctoral Studies, 11. 147-162. Retrieved from http://ijds.org/Volume11/IJDSv11p147-162Kerrigan1975.pdf
Labaree, D. F. (2003). The peculiar problems of preparing educational researchers. Educational Researcher, 32, 13-22. doi:10.3102/0013189X032004013
Lawrence-Brown, D. (2004). Differentiated instruction: Inclusive strategies for standards-based learning that benefit the whole class. American Secondary Education, 32, 34-62.
Leech, N. L. (2012). Educating knowledgeable and skilled researchers in doctoral programs in schools of edu-cation: A new model. International Journal of Doctoral Studies, 7, 19-37. Retrieved from http://ijds.org/Vol-ume7/IJDSv7p019-037Leech325.pdf
Leech, N. L., & Goodwin, L. D. (2008). Building a methodological foundation: Doctoral-level methods courses in colleges of education. Research in the Schools, 15, 1-8.
Leech, N. L., & Haug, C. A. (2015). Investigating graduate level research and statistics courses in schools of education. International Journal of Doctoral Studies, 10, 93-110. Retrieved from http://ijds.org/Vol-ume10/IJDSv10p093-110Leech0658.pdf
McKeachie, W. J. (2002). Teaching tips. New York, NY: Houghton Mifflin Company.
No Child Left Behind Act of 2001, 20 U.S.C. 70 § 6301 et seq. (2002). Retrieved from http://www2.ed.gov/policy/elsec/leg/esea02/107-110.pdf
Page, R. N. (2001). Reshaping graduate preparation in educational research methods: One school’s experi-ence. Educational Researcher, 30(5), 19-25. doi:10.3102/0013189X030005019
Paul, J. L., & Marfo, K. (2001). Preparation of educational researchers in philosophical foundations of in-quiry. Review of Educational Research, 71(4), 525-547. doi:10.3102/00346543071004525
Ferguson, Hovey, & Henson
154
Rutledge, B. L., Jones, E. S., Bailey, J. H., & Stewart, J. H. (2014). Evolution of medical students' understanding of systems-based practice: A qualitative account. The Qualitative Report, 19(27), 1-9. Retrieved from http://nsuworks.nova.edu/tqr/vol19/iss27/1
Shih, J. C., Reys, R. E., & Engledowl, C. (2016). Profile of research preparation of doctorates in mathematics education in the United States. Far East Journal of Mathematical Education, 16, 135-148. doi:10.17654/ME016020135
Simpson, R. (2005). Evidence-based practices and students with autism spectrum disorders. Focus on Autism and Other Developmental Disabilities, 20, 140-149. doi:10.1177/10883576050200030201
Teddlie, C., & Tashakkori, A. (2009). Foundation of mixed methods research. Thousand Oakes, CA: Sage Publica-tions.
Uebersax, J. S. (1987). Diversity of decision-making models and the measurement of interrater agreement. Psy-chological Bulletin, 101, 140–146. doi:10.1037/0033-2909.101.1.140
Venkatesh, V. H., Brown, S. A., & Bala, H. (2013). Bridging the qualitative-quantitative divide: Guidelines for conducting mixed methods research in information systems. MIS Quarterly, 37, 21-54. Retrieved from http://aisel.aisnet.org/cgi/viewcontent.cgi?article=3083&context=misq
APPENDIX A – QUANTITATIVE PROFICIENCY ITEMS FROM
PHASE 1 QUESTIONNAIRE
PLEASE RATE THE FOLLOWING ITEMS ON YOUR LEVEL OF AGREEMENT WITH THE
STATEMENTS:
My experience with quantitative methods in doctoral-level courses has encouraged me to use quanti-tative methods more
Quantitative methods have been a major focus of my doctoral course work
I feel comfortable using quantitative methods on my own
My theory and applied courses (not including quantitative methods) demonstrate how quantitative methods are used in my concentration
PLEASE RATE THE FOLLOWING ITEMS ON YOUR PERSPECTIVE OF HOW FREQUENTLY
THEY OCCUR:
How often have you used quantitative methods for research outside of class?
How often do others in your concentration use quantitative methods in their research?
Does your advisor and/or faculty member encourage you to take quantitative methods courses?
Does your advisor and/or faculty member encourage the use of quantitative methods in projects out-side of class?
Please drag the following items into a ranked order with the one you feel is most challenging in your use and understanding of quantitative methods in the first position:
______ Mathematical complexity of quantitative methods
______ Faculty projects are not focused on quantitative methods
______ Lack of integration of quantitative methods outside of quantitative methods courses
______ Lack of understanding in interpretation of quantitative methods
______ No clear connection between my research interests and quantitative methods
What other challenges or barriers have you faced in the application and utilization of quantitative methods?
Quantitative Preparation in Doctoral Programs
155
APPENDIX B – PHASE 2 DATA COLLECTION
QUANTITATIVE REASONING TASK
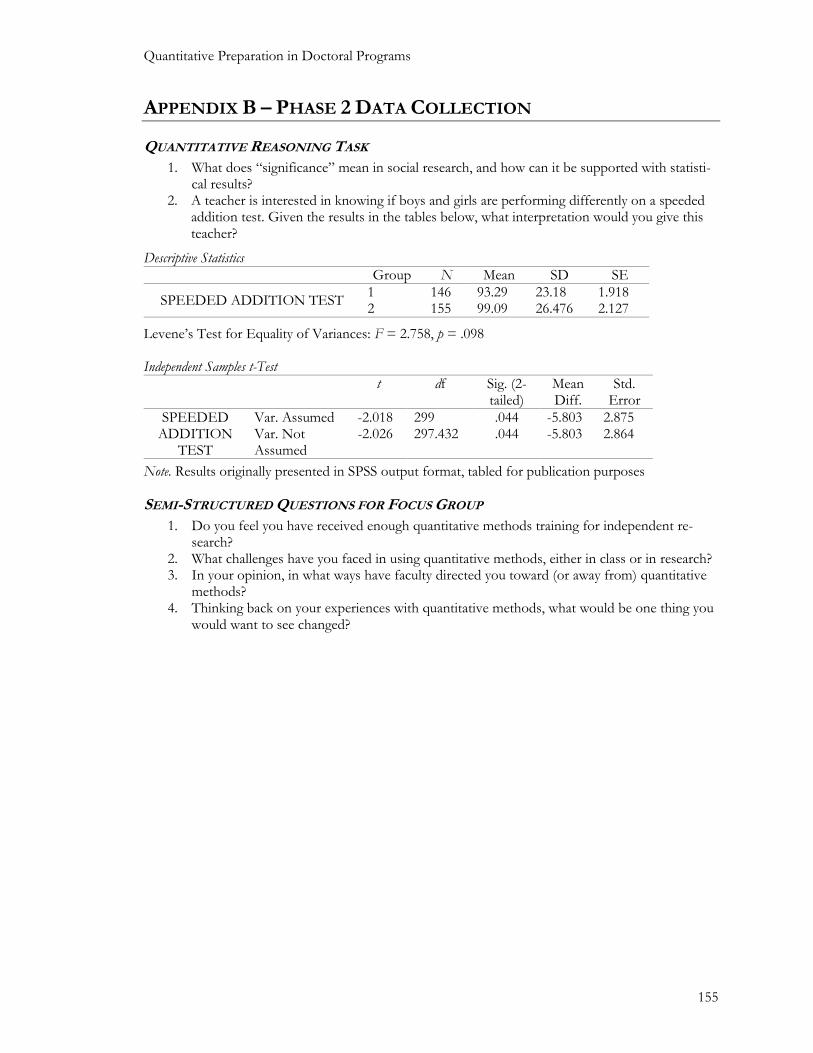
1. What does “significance” mean in social research, and how can it be supported with statisti-cal results?
2. A teacher is interested in knowing if boys and girls are performing differently on a speeded addition test. Given the results in the tables below, what interpretation would you give this teacher?
Descriptive Statistics
Group N Mean SD SE
SPEEDED ADDITION TEST 1 146 93.29 23.18 1.918 2 155 99.09 26.476 2.127
Levene’s Test for Equality of Variances: F = 2.758, p = .098 Independent Samples t-Test
t df Sig. (2-tailed)
Mean Diff.
Std. Error
SPEEDED ADDITION
TEST
Var. Assumed -2.018 299 .044 -5.803 2.875 Var. Not Assumed
-2.026 297.432 .044 -5.803 2.864
Note. Results originally presented in SPSS output format, tabled for publication purposes
SEMI-STRUCTURED QUESTIONS FOR FOCUS GROUP
1. Do you feel you have received enough quantitative methods training for independent re-search?
2. What challenges have you faced in using quantitative methods, either in class or in research? 3. In your opinion, in what ways have faculty directed you toward (or away from) quantitative
methods? 4. Thinking back on your experiences with quantitative methods, what would be one thing you
would want to see changed?
Ferguson, Hovey, & Henson
156
BIOGRAPHIES
Sarah L. Ferguson is an assistant professor of Quantitative Methods in education research at Rowan University, focusing on the application of advanced research methods and statistics approaches to issues in educa-tion. Her current research focuses on two areas: the education and utiliza-tion of quality research methods and analyses, and supporting the career development pathway for individuals from high school to career in STEM fields.
Katrina A. Hovey is an assistant professor of Special Education at West-ern Oregon University. She has extensive experiences assessing and teaching culturally and linguistically diverse and exceptional learners. Her research focuses on pre-service teacher preparation and in-service per-sonnel coaching to improve outcomes for students with special academic and behavioral needs through the use of high level practices.
Robin K. Henson is a professor of Educational Psychology and Univer-sity Distinguished Teaching Professor at the University of North Texas. He teaches statistical methodology courses from beginning to advanced levels. His research interests focus on applied statistics, measurement is-sues, self-efficacy theory, and doctoral preparation in methodology.