Quantitative Phosphoproteomic Analysis Reveals a Role for Serine and Threonine Kinases in the...
16
Quantitative Phosphoproteomic Analysis Reveals a Role for Serine and Threonine Kinases in the Cytoskeletal Reorganization in Early T Cell Receptor Activation in Human Primary T Cells* □ S Patricia Ruperez‡§, Ana Gago-Martinez§, A. L. Burlingame‡, and Juan A. Oses-Prieto‡¶ Protein phosphorylation-dephosphorylation events play a primary role in regulation of almost all aspects of cell function including signal transduction, cell cycle, or apo- ptosis. Thus far, T cell phosphoproteomics have focused on analysis of phosphotyrosine residues, and little is known about the role of serine/threonine phosphorylation in early activation of the T cell receptor (TCR). Therefore, we per- formed a quantitative mass spectrometry-based analysis of the global phosphoproteome of human primary T cells in response to 5 min of TCR activation with anti-CD3 antibody. Combining immunoprecipitation with an antiphosphoty- rosine antibody, titanium dioxide phosphopeptide enrich- ment, isobaric tag for the relative and absolute quantitation methodology, and strong cation exchange separation, we were able to identify 2814 phosphopeptides. These unique sites were employed to investigate the site-specific phos- phorylation dynamics. Five hundred and seventeen phos- phorylation sites showed TCR-responsive changes. We found that upon 5 min of stimulation of the TCR, specific serine and threonine kinase motifs are overrepresented in the set of responsive phosphorylation sites. These phos- phorylation events targeted proteins with many different activities and are present in different subcellular locations. Many of these proteins are involved in intracellular signaling cascades related mainly to cytoskeletal reorganization and regulation of small GTPase-mediated signal transduction, probably involved in the formation of the immune synapse. Molecular & Cellular Proteomics 11: 10.1074/ mcp.M112.017863, 171–186, 2012. T lymphocytes are able to recognize specific antigenic pep- tides presented by molecules of the major histocompatibility complex on the surface of other cell types. This interaction is mediated by a dimeric specialized molecule called T cell receptor (TCR), 1 which is part of a larger membrane complex in association with CD3 , , , and chains. The binding between TCR and the major histocompatibility complex-anti- gen is of relatively low affinity, and it is stabilized by the association with co-receptors (CD4 or CD8). All of these mol- ecules in turn recruit, via their intracellular domains, different polypeptides to carry out signal transduction. In addition to antigen recognition, coactivation by CD28 is required to trig- ger full activation of the T cell, which expresses then different cell surface molecules and releases soluble mediators (cyto- kines) that promote changes in the activity of different target cell types (1). During the TCR-major histocompatibility complex-antigen recognition, T cells undergo considerable membrane and cy- toskeletal rearrangements that lead to the formation of the immunological synapse (IS). During this maturation, precise molecular reorganizations occur at the interface between T cells and an antigen presenting cell. Cell motility, polarization, and receptor relocalization events are dependent on the lym- phocyte cytoskeleton and are necessary for the maturation of the IS. TCR, co-receptors, intracellular signaling molecules, and adhesion receptors polarize to the IS and form small aggregates known as microclusters (2, 3), processes all de- pendent on functional microtubule and actin cytoskeleton. This results in the stabilization and functional maturation of the signaling complexes. Protein phosphorylation is a major regulatory process in most intracellular signaling pathways (4). Signal transduction from the TCR is known to be dependent on the initial steps of several cytosolic tyrosine kinases (Lck, Fyn, and ZAP-70) and membrane proteins with tyrosine phosphatase activity (CD45). The intracellular signaling events follow engagement From the ‡Department of Pharmaceutical Chemistry, Mass Spec- trometry Facility, School of Pharmacy, University of California San Francisco, San Francisco, California 94158 and the §Department of Analytical and Food Chemistry, Faculty of Chemistry, University of Vigo, Campus Universitario 36310, Vigo, Spain Received February 10, 2012, and in revised form, April 5, 2012 Published, MCP Papers in Press, April 12, 2012, DOI 10.1074/ mcp.M112.017863 1 The abbreviations used are: TCR, T cell receptor; IS, immunolog- ical synapse; iTRAQ, isobaric tag for the relative and absolute quan- titation; LC-MS/MS, liquid chromatography tandem mass spectrom- etry; PBL, peripheral blood lymphocytes. Research © 2012 by The American Society for Biochemistry and Molecular Biology, Inc. This paper is available on line at http://www.mcponline.org Molecular & Cellular Proteomics 11.5 171
-
Upload
independent -
Category
Documents
-
view
1 -
download
0
Transcript of Quantitative Phosphoproteomic Analysis Reveals a Role for Serine and Threonine Kinases in the...

Quantitative Phosphoproteomic AnalysisReveals a Role for Serine and ThreonineKinases in the Cytoskeletal Reorganization inEarly T Cell Receptor Activation in HumanPrimary T Cells*□S
Patricia Ruperez‡§, Ana Gago-Martinez§, A. L. Burlingame‡, and Juan A. Oses-Prieto‡¶
Protein phosphorylation-dephosphorylation events play aprimary role in regulation of almost all aspects of cellfunction including signal transduction, cell cycle, or apo-ptosis. Thus far, T cell phosphoproteomics have focused onanalysis of phosphotyrosine residues, and little is knownabout the role of serine/threonine phosphorylation in earlyactivation of the T cell receptor (TCR). Therefore, we per-formed a quantitative mass spectrometry-based analysis ofthe global phosphoproteome of human primary T cells inresponse to 5 min of TCR activation with anti-CD3 antibody.Combining immunoprecipitation with an antiphosphoty-rosine antibody, titanium dioxide phosphopeptide enrich-ment, isobaric tag for the relative and absolute quantitationmethodology, and strong cation exchange separation, wewere able to identify 2814 phosphopeptides. These uniquesites were employed to investigate the site-specific phos-phorylation dynamics. Five hundred and seventeen phos-phorylation sites showed TCR-responsive changes. Wefound that upon 5 min of stimulation of the TCR, specificserine and threonine kinase motifs are overrepresented inthe set of responsive phosphorylation sites. These phos-phorylation events targeted proteins with many differentactivities and are present in different subcellular locations.Many of these proteins are involved in intracellular signalingcascades related mainly to cytoskeletal reorganization andregulation of small GTPase-mediated signal transduction,probably involved in the formation of the immunesynapse. Molecular & Cellular Proteomics 11: 10.1074/mcp.M112.017863, 171–186, 2012.
T lymphocytes are able to recognize specific antigenic pep-tides presented by molecules of the major histocompatibility
complex on the surface of other cell types. This interaction ismediated by a dimeric specialized molecule called T cellreceptor (TCR),1 which is part of a larger membrane complexin association with CD3 �, �, �, and � chains. The bindingbetween TCR and the major histocompatibility complex-anti-gen is of relatively low affinity, and it is stabilized by theassociation with co-receptors (CD4 or CD8). All of these mol-ecules in turn recruit, via their intracellular domains, differentpolypeptides to carry out signal transduction. In addition toantigen recognition, coactivation by CD28 is required to trig-ger full activation of the T cell, which expresses then differentcell surface molecules and releases soluble mediators (cyto-kines) that promote changes in the activity of different targetcell types (1).
During the TCR-major histocompatibility complex-antigenrecognition, T cells undergo considerable membrane and cy-toskeletal rearrangements that lead to the formation of theimmunological synapse (IS). During this maturation, precisemolecular reorganizations occur at the interface between Tcells and an antigen presenting cell. Cell motility, polarization,and receptor relocalization events are dependent on the lym-phocyte cytoskeleton and are necessary for the maturation ofthe IS. TCR, co-receptors, intracellular signaling molecules,and adhesion receptors polarize to the IS and form smallaggregates known as microclusters (2, 3), processes all de-pendent on functional microtubule and actin cytoskeleton.This results in the stabilization and functional maturation ofthe signaling complexes.
Protein phosphorylation is a major regulatory process inmost intracellular signaling pathways (4). Signal transductionfrom the TCR is known to be dependent on the initial steps ofseveral cytosolic tyrosine kinases (Lck, Fyn, and ZAP-70) andmembrane proteins with tyrosine phosphatase activity(CD45). The intracellular signaling events follow engagement
From the ‡Department of Pharmaceutical Chemistry, Mass Spec-trometry Facility, School of Pharmacy, University of California SanFrancisco, San Francisco, California 94158 and the §Department ofAnalytical and Food Chemistry, Faculty of Chemistry, University ofVigo, Campus Universitario 36310, Vigo, Spain
Received February 10, 2012, and in revised form, April 5, 2012Published, MCP Papers in Press, April 12, 2012, DOI 10.1074/
mcp.M112.017863
1 The abbreviations used are: TCR, T cell receptor; IS, immunolog-ical synapse; iTRAQ, isobaric tag for the relative and absolute quan-titation; LC-MS/MS, liquid chromatography tandem mass spectrom-etry; PBL, peripheral blood lymphocytes.
Research© 2012 by The American Society for Biochemistry and Molecular Biology, Inc.This paper is available on line at http://www.mcponline.org
Molecular & Cellular Proteomics 11.5 171

of the TCR including activation of different kinase cascades(PKC, MAPK, phosphoinositide 3-kinase, and PAK) (5–7). Im-portant progress focused on elucidation of the roles andkinetics of early TCR-responsive tyrosine phosphorylationevents during T cell activation has occurred. These studieshave relied on the availability of highly specific antibodies thatrecognize phosphorylated tyrosine residues, making the de-tection of these phosphorylation events by flow cytometry orimmunoblot easy (8–10). Recently, the use of MS coupled tophosphopeptide enrichment techniques has expanded thescope of these analysis by permitting the simultaneous de-tection and quantitation of hundreds or even thousands ofphosphorylation sites in a sample, thus providing a broader,system wide view of the biological processes involved. Massspectrometric mapping of tyrosine phosphorylation sites dur-ing TCR stimulation (11, 12) has provided important insightsinto the mechanism and connectivity of different pathwaysduring early T cell activation, but fewer serine and threoninephosphorylation events have been characterized in the con-text of TCR signaling, despite their large number comparedwith tyrosine phosphorylation events. However, the complex-ity of the T cell serine and threonine phosphoproteome isstarting to be recognized, and it seems now obvious thatmeasuring the dynamics among the population of Ser and Thrphosphorylated residues will be critical for gaining a full un-derstanding of T cell activation. Some recent studies haveused a proteomic approach to address this issue using dif-ferent lines of T lymphocytes (13, 14). Using P14 cytotoxic Tlymphocytes, Navarro et al. (13) identified 2081 Ser and Thrphosphopeptides and found that 450 of them changed theirabundance after 1 h of TCR stimulation. Proteins identified inthis subset were involved in RNA post-translational modifica-tion, protein synthesis, cell death, gene transcription, and po-lymerization of actin. Another large scale quantitative phospho-proteomics experiment in Jurkat cells (14) reported theidentification of thousands of phosphorylated sites, from which�600 tyrosine, serine, and threonine sites were up- or down-regulated in response to TCR activation for different times (5and 15 min for Tyr; 15 or 60 min for Ser/Thr), and concluded thatthe scope of phosphorylation in response to TCR stimulation iswidespread, and the proteins targeted were involved in all of thesignificant phenomena associated with T cell activation.
As observed by traditional biochemistry techniques, proteinphosphorylation events following TCR activation maximize ina few minutes (as early as 1–2 min) for tyrosine phosphory-lation, and some time later, at around 20 min, for most serineand threonine phosphorylated polypeptides. However, theprecise timing and dynamics differ for particular proteins. Wedecided to study the phosphorylation changes occurring at astill early stage of the activation of the signaling cascades (5min), between the very quick initial steps, and the well char-acterized events after 20 min of activation, because there isstill a need to understand very early (5 min) Ser/Thr phosphor-ylation events in human primary T cells.
Although Jurkat cells are a very commonly accepted modelto study TCR signaling (10, 11, 14), we have chosen hereprimary cells, because Jurkat cells lack specific signalingproteins as phosphatase and tensin homolog (8, 15), whichcould result in important differences in the phosphorylationprofiles after TCR stimulation. Because of the usage of pri-mary cells, isobaric mass tags (iTRAQ) (16, 17) were employedto measure differences in the phosphorylation profile afterTCR stimulation.
To expand our study of protein phosphorylation changes inT cells at these early activation times, we focused our effortsnot only on the analysis of tyrosine phosphorylation eventsemploying immunoaffinity purification using P-Tyr-100 anti-bodies but also on serine and threonine phosphorylation us-ing affinity chromatography based on TiO2. Overall, we iden-tified and used for quantitation 2814 unique phosphorylatedpeptides (48 phosphorylated in Tyr and 2767 in Ser/Thr). Fivehundred and seventeen of these phosphorylated sites (from477 phosphopeptides) showed TCR-responsive changes. In-depth analysis of all the TCR-responsive phosphorylationsites resulted in the identification of 91 previously unreportedphosphorylation sites. We show that TCR-responsive phos-phorylation changes at these early times occur in proteinswith many different activities and in different subcellular loca-tions, with a large group of proteins involved in cytoskeletalreorganization, giving important clues about how the cyto-skeleton interacts with plasma membrane in early TCR acti-vation. To our knowledge, this data set is the broadest fromhuman primary lymphocytes where changes in the intracellu-lar levels of serine and threonine phosphorylation events aremeasured after 5 min of TCR stimulation.
EXPERIMENTAL PROCEDURES
Peripheral Blood Lymphocyte Isolation and Stimulation with anti-CD3—Peripheral blood lymphocytes were enriched by dilution ofbuffy coats (Blood Centers of the Pacific, San Francisco, CA) in PBSand centrifugation over a Ficoll-Paque (GE Healthcare) density gradientfollowing standard procedures. The cells in the interface were collectedand washed in PBS. After centrifugation at 1700 rpm for 10 min, super-natants were discarded, and each pellet was resuspended in RPMI1640 culture medium with 10% FCS. The cells were left in culture for 2 hat 37 °C in the presence of CO2 to remove the adherent monocytes.Lymphocytes were recovered in the supernatant and resuspended at aconcentration of 5 � 106 cells/ml in RPMI 1640 with 10% FCS.
Stimulation with anti-CD3 (clone HIT3a; BD Pharmingen, San Jose,CA) was performed as followed. For 5 min, 1 � 109 cells were treatedwith HIT3a primary antibody at a concentration of 1 �g/ml at 37 °C inpresence of CO2 (incubator). Unstimulated cells were subjected to thesame process as stimulated ones, but instead of antibody, PBS wasadded. Stimulated and unstimulated cells were centrifuged at 1200rpm for 10 min and 2 ml of TRIzol reagent (Invitrogen) was added toeach pellet and stored at �80 °C.
Cell Lysis, Reduction/Alkylation, and In-solution Digestion—1 �109 cell pellets were thawed and resuspended in 22 ml of TRIzolreagent. Briefly, 0.2 ml of chloroform was added per 1 ml of TRIzol.The aqueous phase containing the RNA was removed, whereas theinterface and the phenol phase containing DNA and proteins werekept. The removal of the DNA was done by precipitation with 100%
Phosphoproteomics of Early TCR Activation
172 Molecular & Cellular Proteomics 11.5

ethanol (0.3 ml per ml of TRIzol). The supernatant was collected, andthe proteins were isolated by precipitation with isopropyl alcohol, 1.5ml of isopropanol/ml of TRIzol. Protein pellets were resuspended in25 mM ammonium bicarbonate buffer containing 6 M guanidine HCland 1 mM of NaF as phosphatase inhibitors. The amount of proteinwas checked by BCA protein assay kit (Pierce), and �30 mg ofprotein was recovered per sample. Next, 2 mM tris(2-carboxyethyl)-phosphine was added to each sample, and they were incubated for1 h at 56 °C to reduce cysteine side chains. Iodoacetamide was thenadded to the samples to a 4.2 mM concentration, and they wereincubated 45 min in the dark at 21 °C to alkylate those cysteine sidechains. The samples were then diluted 6-fold with 25 mM ammoniumbicarbonate to reduce guanidine HCl concentration to 1 M, and 2%(w/w) modified trypsin (Promega, Madison, WI) was added. The pHwas adjusted to 8.0 with 250 mM ammonium bicarbonate, and thesamples were incubated 12 h at 37 °C. Digestion efficiency waschecked by analyzing by LC-MS/MS aliquots of the digests contain-ing 0.5 �g of the initial protein amount, desalted by using u-C18-ZipTips (Waters) according to the manufacturer’s instructions.
Desalting of Digested Proteins—The digests were desalted using aMAX-RP Sep Pak� classic C18 cartridge (Waters) following the man-ufacturer’s protocol. Briefly, the cartridges were conditioned with70% acetonitrile (MeCN) and 0.1% TFA and then washed twice with10 ml of 0.4% TFA in water. Next, the samples previously acidifiedwere loaded onto the column, and the adsorbed material was washed10–20 times the volume of the resin with 0.4% TFA in water. Thepeptides were eluted in three times with 0.5 ml of 70% MeCN, 0.1%TFA. The solvent was evaporated to dryness under vacuum, and thepeptides were resuspended in the corresponding buffer to performthe phosphopeptide enrichment.
Enrichment of Phosphorylated Peptides Using Titanium Dioxide—Titanium dioxide enrichment was performed using an AKTA Purifier(GE Healthcare) using 5-�m TiO2 beads (GL Sciences, Tokyo, Japan)(18, 19) in-house packed into a 2.0-mm � 2-cm analytical guardcolumn (Upchurch Scientific, Oak Harbor, WA). Tryptic digests (30mg) were resuspended in 1.75 ml of 35% MeCN, 200 mM sodiumchloride, and 0.4% TFA and divided into seven aliquots of 250 �l,each containing 4.2 mg of material. Phosphopeptide enrichment wasperformed separately in each of these aliquots. Aliquots were loadedonto the TiO2 column at a flow rate of 2 ml/min. The column was thenwashed for 2 min with 35% MeCN, 200 mM NaCl, and 0.4% TFA toremove nonphosphorylated peptides. Phosphopeptides were elutedfrom the column using 1 M KH2PO4, pH 3.0, at a flow rate of 0.5ml/min for 30 min directly onto an on-line coupled C18 macrotrappeptide column (Michrom Bioresources, Auburn, CA). This columnwas washed with 5% MeCN, 0.1% TFA for 14 min, and the ad-sorbed material was eluted in 400 �l of 50% MeCN, 0.1% TFA at aflow rate of 0.25 ml/min. Small fractions (1/200) of the eluates wereanalyzed by LC-MS/MS. The data were searched, allowing phos-phorylation in serine, threonine, and tyrosine as variable modifica-tions, to assess the enrichment in phosphopeptides on the eluates.80% of all peptides identified were phosphorylated. Eluates of thenonstimulated samples were pulled together, and the same wasdone for the stimulated fractions; peptide amounts in the eluateswere estimated based on absorbance at 280 nm, using a nanodropsystem (Thermo Scientific). Both samples where then solvent evap-orated in a speed vac system and stored at �20 °C until iTRAQlabeling.
iTRAQ Labeling—iTRAQ® labeling (AB Sciex) was performed asfollows: 200 �g of each sample (stimulated and nonstimulated) wereresuspended in 80 �l of iTRAQ dissolution buffer. The samples werethen split in two equal parts to label 100 �g of peptide/iTRAQ chan-nel. iTRAQ labeling reagents were reconstituted in 70 �l of ethanol,and two different isobaric reagents were used per condition, leaving
the labeling as follows: unstimulated cells were labeled with iTRAQtags 114 and 116, and stimulated cells were labeled with iTRAQ tags115 and 117. The labeling reaction was performed for 1 h at 21 °C. Analiquot of each labeling reaction was then examined by LC-MS/MSand searched, allowing iTRAQ as a variable modification to confirmthat at least 99% of all peptides identified showed iTRAQ labeling(20). Another aliquot containing a combination 1:1:1:1 of the fourlabeled samples was analyzed by LC-MS/MS to confirm that totalpeptide levels were similar in the four labeling reactions. The fourlabeling reactions were then combined, desalted using a Sep Pak asdescribed earlier, solvent-evaporated in a speed vac system, andstored at �20 °C until immunoaffinity purification was performed.
Immunoaffinity Purification of Tyrosine-phosphorylated Peptides—Phosphotyrosine containing peptides were enriched from the iTRAQ-labeled TiO2 eluates using phosphotyrosine mouse monoclonal anti-body (P-Tyr-100) coupled to protein G-agarose beads (PhosphoscanKit, Cell Signaling Technology, Danvers, MA) (21). Peptides weredissolved in 1.4 ml of immunoaffinity purification buffer (50 mM
MOPS, pH 7.2, 10 mM sodium phosphate, 50 mM NaCl). After verify-ing that the pH was neutral, the sample was incubated with phos-photyrosine antibody beads, adding 80 �l of slurry containing 40 �l ofbead volume. The sample was incubated for 30 min at 4 °C withgentle rotation. The mixture was centrifuged at 1500 � g for 1 min,and the supernatant was collected and kept for analysis of serine andthreonine phosphorylation. The beads were washed three times with1 ml of immunoaffinity purification buffer and two times with 1 ml ofwater. Retained peptides were eluted twice with 0.15% TFA, vacuumdried, and desalted using C18 ZipTip at basic pH (22). The peptideswere then analyzed by Nano-Lc-ESI-Qq-TOF tandem MS on aQSTAR Elite mass spectrometer (Applied Biosystems/MDS Sciex,Foster City, CA).
Strong Cation Exchange Chromatography—The supernatant col-lected from the immunoaffinity purification, consisting mainly of serineand threonine phosphopeptides, was desalted using a SepPak, sol-vent-evaporated, and resuspended in 300 �l of 5 mM KH2PO4, 30%MeCN, pH 2.7 (Buffer A). Strong cation exchange chromatographywas performed on an AKTA purifier (GE Healthcare). Sample in bufferA was loaded in the column, a Tricorn 5/200 (GE Healthcare) packedin house with a 5-�m 300 Å pore polysulfoethyl A resin (WesternAnalytical, Lake Elsinore, CA). Buffer B consisted of 5 mM KH2PO4,350 mM KCl, 30% MeCN at pH 2.7 (23). The chromatographic sepa-ration was performed at 0.35 ml/min with a gradient that went from2% to 72% B during 52 min and from 72% to 100% B in 10 min. Atotal of 58 fractions were collected, desalted using �C18 ZipTips(Millipore), and analyzed by Nano-Lc-ESI-Qq-TOF tandem MS on aQSTAR Elite (Applied Biosystems/MDS Sciex).
Western Blotting for Phosphoproteins—Anti-CD3 lymphocyte ly-sates, stimulated for 5 min and unstimulated, were prepared byresuspension in TRIzol reagent, as mentioned above, and precipi-tated proteins were resuspended in gel loading buffer containing 200mM Tris-HCl, pH 6.8, 8% SDS, 20% v/v glycerol, 5% 2-mercaptoeth-anol, and 0.01% bromphenol blue. Equal amounts of protein (20–50�g) were separated by 4–20% gradient Tris-HCl gel (Bio-Rad) bySDS-PAGE (Bio-Rad), and then transferred onto a PVDF (ThermoScientific, Rockford, IL). The membrane was blocked overnight at4 °C in blocking buffer (25 mM Tris, pH 7.5, 150 mM NaCl, 0.1%Tween 20, 1% BSA) and then incubated with the indicated primaryantibody in the same blocking buffer at 22 °C for 1 h. Mouse anti-human phosphotyrosine (P-Tyr-100), rabbit anti-human phospho-Akt(Ser-473), rabbit anti-human phospho-p44/42 MAPK (ERK1/2) (Thr-202/Tyr-204), rabbit anti-human phospho-stathmin (Ser-16), rabbitanti-human phospho-PAK1 (Ser-199/204)/PAK2 (Ser-192/197), rabbitanti-human phospho-p90RSK (Ser-380), rabbit anti-human phospho-GSK3�/� (Ser-21/9), and rabbit anti-human GAPDH antibodies (Cell
Phosphoproteomics of Early TCR Activation
Molecular & Cellular Proteomics 11.5 173

Signaling Technology, Danvers, MA) were used as primary antibodies(1/1000 dilution). The membrane was washed three times for 10 minat 22 °C with TBS (25 mM Tris, pH 7.5, 150 mM NaCl, 0.1% Tween 20).Next, the membrane was incubated with secondary anti-rabbit IgG oranti-mouse IgG antibody directly conjugated to horseradish peroxi-dase (1/5000 dilution; Bio-Rad, GE Healthcare) for 1 h in blockingbuffer and washed six times for 5 min with TBS and once for 5 minwith PBS (25 mM Tris, pH 7.5, 150 mM NaCl). The blots were devel-oped with chemiluminiscence ECL Kit (GE Healthcare).
Nano-LC-ESI-Qq-TOF Tandem Mass Spectrometry Analysis—Peptides were loaded onto a 75-�m � 150-mm reverse phase C18PepMap column (Dionex, LC Packings, San Francisco, CA) to beseparated using an Agilent 1100 series HPLC system equipped withan auto sampler (Agilent Technologies, Palo Alto, CA). A flow rate of300 nl/min was used with a 2-h MeCN gradient (3–32%) in 0.1%formic acid. The LC eluate was coupled to a nano-ion spray sourceattached to a QSTAR Elite mass spectrometer (Applied Biosystems/MDS Sciex). Peptides were analyzed in positive ion mode. MS spec-tra were acquired between 350 and 1500 m/z for 0.4 s. For each MSspectrum, the two most intense multiple charged peaks were se-lected for collision-induced dissociation. Per precursor ion selected,two MS/MS were taken; the first one was acquired between 180 and1500 m/z for 2.5 s with resolution set to low and an automaticallycollision-induced dissociation energy based upon peptide charge andm/z ratio. The second MS/MS was acquired between 112 and 119m/z for 2.5 s with a resolution set to unit and a constant voltage of65 v, to maximize generation of iTRAQ reporter ions. A dynamicexclusion window was applied which prevented the same m/z frombeing selected for 1 min after its acquisition. Typical performancecharacteristics were 10,000 resolution with 30 ppm mass measure-ment accuracy in both MS and MS/MS spectra.
Peptide and Protein Identification—QSTAR Elite data was analyzedwith Analyst QS software (Applied Biosystems/MDS Sciex, FosterCity, CA) and MS/MS centroid peak lists were generated using theMascot.dll script. Peak lists were searched against the UniProtKBHomo sapiens database as of August 10th 2010 (containing 192.290entries), using Protein Prospector version 5.8 (http://prospector.ucsf.edu) with the following parameters. Trypsin was the enzymeselected, and up to three missed cleavages were allowed. Carbam-idomethylation of cysteine residues and iTRAQ labeling of lysineresidues and N terminus of the protein were allowed as fixed modi-fications. N-Acetylation of the N terminus of the protein, loss ofprotein N-terminal methionine, pyroglutamate formation from peptideN-terminal glutamines, oxidation of methionine, and phosphorylationof serine, threonine, and tyrosine were allowed as variable modifica-tions. A first search was done using a peptide tolerance for QSTARdata in MS and MS/MS mode of 150 ppm and 0.2 Da, respectively.Taking into account the systematic error from the first search, asecond search was done with a MS mass tolerance of 60 ppm.Proteins were considered positively identified when at least one pep-tide with a Protein Prospector peptide expectation value lower than0.1 was identified. The false positive rate was estimated by searchingthe data using a concatenated database that contains the originalUniProtKB database, as well as a version of each original entry wherethe sequence has been randomized. Unique peptides were only con-sidered; peptides common to several proteins were not used forquantitative analysis. Sequence ID and phosphorylation sites weremanually confirmed for all peptides that showed significantchanges in levels after stimulation. Sites described here were com-pared with lists of currently reported phosphorylation sites onPhosphositePlus (http://www.phosphosite.org) and Uniprot DB(http://www.uniprot.org).
Quantitation—Relative quantitation of peptide abundance was per-formed via calculation of the raw area of peaks corresponding to the
four different iTRAQ labels, 114.1, 115.1, 116.1, and 117.1 m/z pres-ent in all MS/MS spectra. Areas were determined by Protein Prospec-tor by using isotope correction values supplied by the vendor forthese batches of the reagent. If a peptide with the same charge statehad several MS/MS spectra, just the best scoring one was used forquantitation. Only MS/MS spectra with iTRAQ peak areas greaterthan 30 were selected. Areas of the iTRAQ reporter ions representingtechnical replicates of the same sample were used to calculate sig-nificance thresholds for the analysis, as described under “Results”.
To measure the relative abundance of a given phosphopeptide, theaverage of iTRAQ areas in the unstimulated sample was divided bythe average of iTRAQ areas in the stimulated sample from that sameMS/MS spectrum. The lower the ratio, the more abundant that phos-phopeptide was in the stimulated sample.
Phosphorylation Motif Analysis—To analyze the predicted consen-sus phosphorylation site motifs present in our set of TCR-responsivepeptides, Motif-X algorithm (24) was run. Parameters used were: se-quence window of � 6 amino acids around the identified phosphor-ylated site, significance of 0.000001, and an occurrence of 35. Thequeried kinase motifs were from those reported in the Human ProteinReference Database phosphorylation database (25) and those de-scribed by Kinexus (www.kinexus.ca) as protein Ser/Thr kinase con-sensus phosphorylation site specificity.
We also performed a manual analysis of the enrichment we ob-served in the sequences of TCR-responsive peptides for some se-lected motifs for particular kinases compared with their presence in allprotein sequences in the Human Uniprot database. Enrichment fac-tors were calculated as reported previously (26).
RESULTS
Quantitative Analysis of Changes in Protein PhosphorylationFollowing Activation of Primary Human T Cells—To analyzethe changes in protein phosphorylation in T lymphocytes fol-lowing TCR activation, we used human primary lymphocytesisolated from leukocyte-rich buffy coats. Cells in culture wereactivated with 1 �g/ml anti-CD3 for 5 min. Fig. 1 shows thetypical changes in the tyrosine phosphorylation profile weobserve under these conditions by Western blot using P-Tyr-100 antiphosphotyrosine antibodies. To compare the relativeoccupancy of phosphorylated residues (tyrosine and serine/threonine) in proteins extracted from resting and cells thatwere stimulated for 5 min, we used a mass spectrometry-based iTRAQ approach. The work flow of the experiment isdepicted in Fig. 2. Briefly, the cells were lysed, and proteinswere TRIzol-extracted and digested with trypsin (see “Exper-imental Procedures”). Digests were enriched in phosphopep-tides by affinity chromatography using TiO2 columns. Equalamounts (as estimated by absorbance at 280 nm) of theeluates of the TiO2 column from unstimulated or stimulated Tcells were labeled with iTRAQ reagents. To be able to deter-mine significance thresholds for the changes in abundancelevels from the iTRAQ ratio distributions of the peptides, twoiTRAQ channels were used per sample: Two separate aliquotsof peptides from control (unstimulated) cells were labeled witheither 114 or 116 iTRAQ tags, and two other separate aliquotsof peptides from stimulated cells were labeled with either 115or 117 iTRAQ tags. Subsequently the four differentially labeledsamples were combined. To further enrich phosphotyrosine-
Phosphoproteomics of Early TCR Activation
174 Molecular & Cellular Proteomics 11.5

containing peptides, immunoprecipitation using P-Tyr-100was carried out. This fraction was analyzed separately by MS.The supernatant of the immunoprecipitation, mainly phospho-serine- and phosphothreonine-containing peptides, was sub-jected to additional separation by strong cation exchangechromatography to reduce complexity of the fractions to beanalyzed by mass spectrometry. A total of 2883 phosphopep-tides from 1372 proteins were identified; of these peptides,2836 were phosphorylated on serine or threonine, and 48were phosphorylated on tyrosine. The false discovery rate ofpeptide identification was below 0.8%, as estimated fromsearches against a randomized database.
Quantitative data for the phosphorylated peptides weregenerated using the peak areas of the iTRAQ reporter ions.First we analyzed the experimental dispersion of the systemusing the technical replicates we included by labeling thecontrol and stimulated samples with two iTRAQ channelseach. As we can see from the plots representing the peak areain one iTRAQ channel versus the second channel correspond-ing to the same sample (control or stimulated cells) for eachgiven peptide, peak areas of the two technical replicates persample were very consistent (see supplemental Fig. 1). Weexcluded from downstream analysis peptides for which the
FIG. 2. Experimental workflow. Thedifferent steps of sample preparationand analysis (cell isolation, proteinextraction, phosphoenrichment, iTRAQlabeling, and LC-MS/MS analysis) aresummarized in this diagram.
FIG. 1. Global tyrosine phosphorylation changes in T lympho-cytes upon stimulation with anti-CD3 antibody. The cells wereincubated in control medium (lanes 1) or in the presence of 1 �g/mlanti-CD3 antibody for 5 min (lanes 2) and then lysed. Aliquots ofprotein extracted from total cells lysates were subjected to SDS-PAGE and stained with colloidal Coomassie (A). Identical amounts ofsample were loaded in a second gel and immunoblotted with P-Tyr-100 antibody (B).
Phosphoproteomics of Early TCR Activation
Molecular & Cellular Proteomics 11.5 175
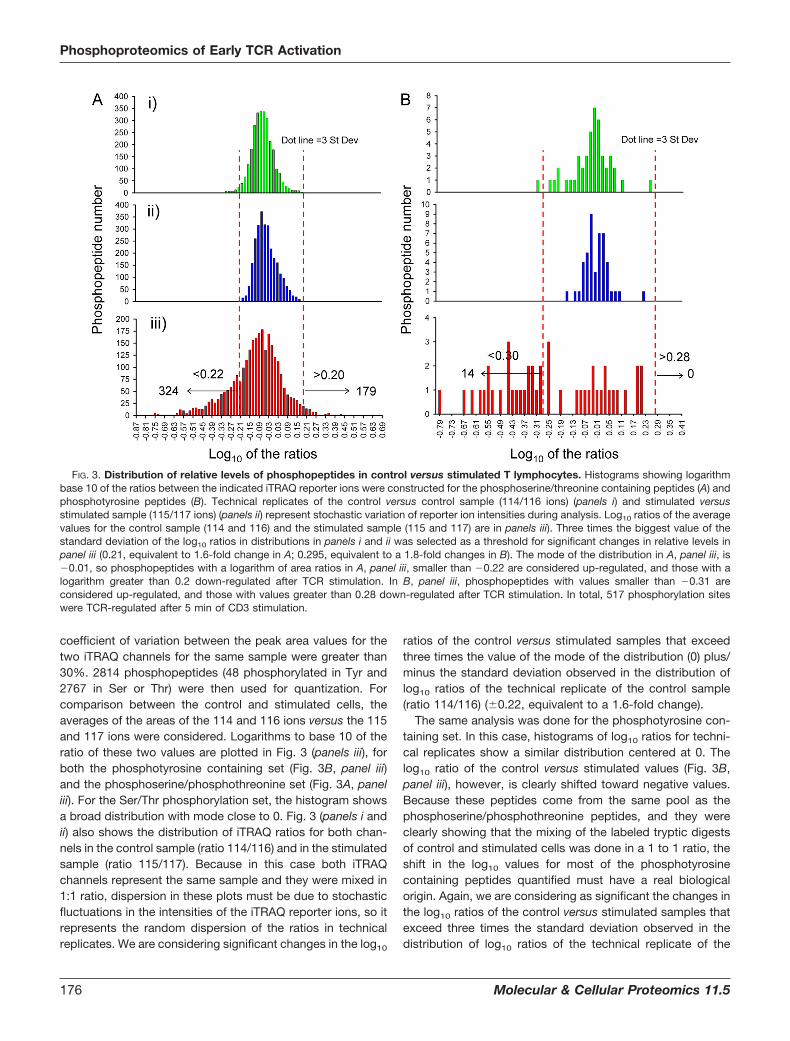
coefficient of variation between the peak area values for thetwo iTRAQ channels for the same sample were greater than30%. 2814 phosphopeptides (48 phosphorylated in Tyr and2767 in Ser or Thr) were then used for quantization. Forcomparison between the control and stimulated cells, theaverages of the areas of the 114 and 116 ions versus the 115and 117 ions were considered. Logarithms to base 10 of theratio of these two values are plotted in Fig. 3 (panels iii), forboth the phosphotyrosine containing set (Fig. 3B, panel iii)and the phosphoserine/phosphothreonine set (Fig. 3A, paneliii). For the Ser/Thr phosphorylation set, the histogram showsa broad distribution with mode close to 0. Fig. 3 (panels i andii) also shows the distribution of iTRAQ ratios for both chan-nels in the control sample (ratio 114/116) and in the stimulatedsample (ratio 115/117). Because in this case both iTRAQchannels represent the same sample and they were mixed in1:1 ratio, dispersion in these plots must be due to stochasticfluctuations in the intensities of the iTRAQ reporter ions, so itrepresents the random dispersion of the ratios in technicalreplicates. We are considering significant changes in the log10
ratios of the control versus stimulated samples that exceedthree times the value of the mode of the distribution (0) plus/minus the standard deviation observed in the distribution oflog10 ratios of the technical replicate of the control sample(ratio 114/116) (�0.22, equivalent to a 1.6-fold change).
The same analysis was done for the phosphotyrosine con-taining set. In this case, histograms of log10 ratios for techni-cal replicates show a similar distribution centered at 0. Thelog10 ratio of the control versus stimulated values (Fig. 3B,panel iii), however, is clearly shifted toward negative values.Because these peptides come from the same pool as thephosphoserine/phosphothreonine peptides, and they wereclearly showing that the mixing of the labeled tryptic digestsof control and stimulated cells was done in a 1 to 1 ratio, theshift in the log10 values for most of the phosphotyrosinecontaining peptides quantified must have a real biologicalorigin. Again, we are considering as significant the changes inthe log10 ratios of the control versus stimulated samples thatexceed three times the standard deviation observed in thedistribution of log10 ratios of the technical replicate of the
FIG. 3. Distribution of relative levels of phosphopeptides in control versus stimulated T lymphocytes. Histograms showing logarithmbase 10 of the ratios between the indicated iTRAQ reporter ions were constructed for the phosphoserine/threonine containing peptides (A) andphosphotyrosine peptides (B). Technical replicates of the control versus control sample (114/116 ions) (panels i) and stimulated versusstimulated sample (115/117 ions) (panels ii) represent stochastic variation of reporter ion intensities during analysis. Log10 ratios of the averagevalues for the control sample (114 and 116) and the stimulated sample (115 and 117) are in panels iii). Three times the biggest value of thestandard deviation of the log10 ratios in distributions in panels i and ii was selected as a threshold for significant changes in relative levels inpanel iii (0.21, equivalent to 1.6-fold change in A; 0.295, equivalent to a 1.8-fold changes in B). The mode of the distribution in A, panel iii, is�0.01, so phosphopeptides with a logarithm of area ratios in A, panel iii, smaller than �0.22 are considered up-regulated, and those with alogarithm greater than 0.2 down-regulated after TCR stimulation. In B, panel iii, phosphopeptides with values smaller than �0.31 areconsidered up-regulated, and those with values greater than 0.28 down-regulated after TCR stimulation. In total, 517 phosphorylation siteswere TCR-regulated after 5 min of CD3 stimulation.
Phosphoproteomics of Early TCR Activation
176 Molecular & Cellular Proteomics 11.5

control sample (ratio 114/116) (�0.295, equivalent to a 1.8-fold change).
Phosphopeptides showing more than a 1.6-fold level changein the phosphoserine/phosphothreonine set, or 1.8-foldchanges in abundance in the phosphotyrosine set contain thusTCR-responsive phosphorylation sites. In total, 517 of the phos-phosites (from 477 phosphopeptides, see supplemental Table1) showed TCR-responsive changes; 338 were up-regulated (14phosphotyrosine and 324 phosphoserine/phosphothreonine-containing peptides), and 179 were down-regulated, all in thephosphoserine/threonine set (see supplemental Table 1).
Analysis of all the TCR-responsive phosphorylation sitesresulted in the identification of 91 new sites or 18% of theresponsive ones (supplemental Table 2). Sequence identifica-tion and assignment of the phosphorylation site for all theTCR-responsive phosphopeptides were confirmed by manualinspection of the MS/MS spectra (see spectra in supplemen-tal MS/MS data).
We have confirmed changes in relative levels between con-trol and 5-min stimulated samples for some of the identifiedTCR-responsive phosphorylation sites by Western blot, tofurther validate the analysis of the iTRAQ data (Fig. 4B). Notmany antibodies are commercially available against the phos-phorylated forms of the proteins found in this study. We haveperformed immunoblots against (i) phospho-ERK 2 (doublyphosphorylated on Thr-185 and Tyr-187), (ii) phospho-stath-min on Ser-16, (iii) phospho-GSK-3� on Ser-21, and (iv) phos-pho-PAK 2 on Ser-197. Fig. 4A shows the ion intensities of thereporter ions of MS/MS spectra of phosphopeptides thatcontain the above mentioned phosphorylation sites in thesame set of proteins (i to iv). We conclude that, at least for thissmall subset of proteins that we have tested, the relativechanges inferred from the immunoblots and form the MS/MSdata are in good agreement.
Bioinformatic Analysis of the TCR-responsive Proteins—All517 identified TCR-responsive phosphorylation sites belongto a set of 334 proteins. We have analyzed this set of phos-phoproteins involved in the TCR signaling pathways usingDAVID Bioinformatics Resources 6.7 (http://david.abcc.ncifcrf.gov/) to obtain their cellular localization and molecularfunction (Fig. 5). Most of these proteins are located in thecytoskeleton, cytosol, plasma membrane, and nucleoplasm/chromosomes. We have performed a parallel analysis for thewhole set of proteins identified by MS. The results indicatedthat in proteins containing TCR-responsive phosphorylationsites, some categories seem overrepresented, particularlyplasma membrane proteins. Most of these plasma membraneproteins are also associated to cytoskeleton according totheir Gene Ontology annotations. In the same way, molecularfunctions (Fig. 5B) are very diverse, but a striking number haveGTPase regulatory activity, cytoskeletal protein binding, ki-nase activity, and lipid-binding domains. We have also ob-served how phosphorylation on proteins associated with tran-scription processes highly decreased after TCR stimulation.
Next, we organized TCR-regulated phosphoproteins intoprotein-protein interaction networks. We have used STRING(Search Tool for the Retrieval of Interacting Genes/Protein,http://string-db.org/) to find interactions between them basedon previously described experimental evidences. We ob-tained by plotting a high confidence evidence network(score � 0.7) seven different clusters (Fig. 6). The largestcluster contains proteins interacting directly with the TCRcomplex or the main reported pathways like CD3�, CD3�,NFAT (nuclear factor of activated T cells), ERK1/2, STMN1(stathmin), and EVL (enabled/vasodilator-stimulated phos-phoprotein-like protein) and also in cytoskeleton regulation astalin, zixin, and actin (Fig. 6A). Several Rho-GTPase proteinsformed another defined cluster where they are all involved incytoskeleton regulation and cytoskeletal polarity between Tcell and APC (antigen-presenting cell) (27, 28) (string83.embl.de) (Fig. 6B). Cortactin, cofilin-1, and p21-activated pro-tein kinase 1/2 (PAK1/2) interact among them and formedanother cluster also involved in cytoskeleton organization (Fig.6C) (8, 29). Other clusters can also be seen involved in regu-lation of transcription (either initiation or repression) (Fig. 6D),pre-mRNA processing (Fig. 6E), trafficking through nucleus(Fig. 6F), and microtubule and centrosome assembly (Fig. 6G)(30, 31).
Analysis of the Kinase-specific Motives in TCR-responsivePhosphopeptides—Kinase specificity is defined by the aminoacid sequences surrounding the phosphorylation sites. Wehave performed an analysis of the predicted consensus phos-phorylation site motifs present in our set of TCR-responsivepeptides. We employed the Motif-X algorithm (24) by using asequence window of � 6 amino acids around the identifiedphosphorylated site. Three motifs were identified in the setof phosphopeptides up-regulated after TCR stimulation:RXX(pS/pT), (pS/pT)P, and RX(pS/pT); and just one, (pS/pT)P,was identified in the set of down-regulated phosphopeptides(Fig. 7). According to the Human Protein Reference Database,the consensus phosphorylation site motif RXX(pS/pT) is spe-cific for kinases such as CaMK1, 2, and 4; PKC; and Akt. MotifRX(pS/pT) is specific for PKC, PKA, and Aurora-A kinase, andthe proline-directed kinase motif (pS/pT)P is specific forERK1/2, GSK3, and cyclin-dependent kinase.
We have also performed a manual analysis of the enrich-ment we observed in the sequences of TCR-responsive pep-tides for some selected motifs for particular kinases (26),compared with their presence in all protein sequences in theHuman Uniprot database (Fig. 8 and supplemental Table 4).Consensus motifs for CaMK, p90RSK, PKD, and ERK1/2 areenriched in the subset of phosphopeptides up-regulated afterTCR stimulation, whereas motifs for PKA, cell division controlprotein 2 homolog, casein kinase 2 are enriched in the pool ofdown-regulated phosphopeptides.
From the 517 TCR-responsive phosphosites, we found 33belonging to protein kinases; 11 of these phosphosites aredown-regulated and 22 up-regulated upon TCR stimulation.
Phosphoproteomics of Early TCR Activation
Molecular & Cellular Proteomics 11.5 177

We have searched for kinase-specific motifs in this subset ofpeptides (Table II). Most of these protein kinases (exceptpeptides from � subunit of phosphorylase b kinase, ERK2,serine threonine protein kinase D2, and serine threonine pro-tein kinase MST4) had at least one phosphopeptide contain-ing one of the kinase-specific phosphorylation motivesanalyzed here, as shown in Table II. The majority of theTCR-responsive phosphopeptides found in protein kinases
could be a product of the activity of several different kinases(see sequences in supplemental Table 1). For example, ribo-somal protein s6 kinase �1 (p90RSK) could be phosphoryl-ated on Ser-380 (in the sequence QLFRGFsFVATGL) byCaMK2, 1, and 4; Chk1; PKD; or PKC. In contrast, TCR-responsive phosphorylation sites identified in other kinasesare much more specific, like Ser-58 in PAK2 (in the sequencePRHKIIsIFSGTE), between all the motifs considered here, only
FIG. 4. Correlation between the changes in relative levels of phosphorylation after TCR stimulation observed by immunoblot and byMS. In A, MS/MS spectra showing iTRAQ reporter ions generated from precursors with m/z 612.774� (panel i), 616.963� (panel ii), 700.834�
(panel iii), and 767.053� (panel iv), which correspond to peptides spanning residues Val-173–Arg-191, Ala-15–Arg-27, Thr-7–Lys-27, Ser-197–Lys-216 on ERK1/2, stathmin, GSK3, and PAK, respectively, and phosphorylated in Thr-185/Tyr-187, Ser-16, Ser-21, and Ser-197. In B, 5 minanti-CD3 stimulated and unstimulated lymphocytes were lysed, protein was extracted, and the aliquots were subjected to SDS-PAGE andimmunoblotted using antibodies against the specific phosphorylated sequences in ERK1/2 (panel i), stathmin (panel ii), GSK3 (panel iii), andPAK 2 (panel iv) or against GAPDH (panel v).
Phosphoproteomics of Early TCR Activation
178 Molecular & Cellular Proteomics 11.5

fits with PKC-directed motifs. In some cases different sites inthe same kinase show opposite changes upon TCR activa-tion: mitogen-activated protein/microtubule affinity regulatingkinase 2 is identified with one up-regulated phosphopeptide(Ser-376) with a p90RSK-specific motif and one down-regu-lated phosphopeptide with a GSK3 specific motif (Ser-456).
DISCUSSION
Different methods for the activation of T cells in cultureusing anti-CD3 antibodies have been developed and used bydifferent groups. In most cases, they used antibodies at-tached to the plastic surface of the culture dishes (32, 33).Some other studies add the soluble antibody to the mediumthat contains the cells (3, 34, 35). We tested both protocols forefficiency of the activation of the signaling cascades (as as-sessed by Western blot using an anti-phosphotyrosine anti-body), using either culture plates precoated with anti-CD3
(using antibody solutions 5 or 10 �g/ml) or soluble antibodyadded to the cells (at concentrations of 1 and 2 �g/ml). In ourhands, activation was more efficient, as suggested by theintensity and pattern of immunoreactive bands, using theantibody in solution, (data do not shown). The results weresimilar using 1 or 2 �g/ml, so we decided to carry out ourexperiments adding anti-CD3 antibody to the culture mediumat 1 �g/ml.
The large scale, unbiased analysis of the changes in T cellphosphorylation levels performed here establishes that at 5min after TCR stimulation, widespread serine and threoninephosphorylation and dephosphorylation is taking place. Fiveminutes following TCR activation the main wave of tyrosinephosphorylation, which includes the very initial steps ofthe signaling cascades, is already fading, and serine/threo-nine phosphorylation signaling events are becoming predom-inant. We see how these events affect proteins with manydifferent activities and in different subcellular locations. At thistime point we still can observe in our data set increasedtyrosine phosphorylation in some of the proteins that repre-sent the first steps of the signaling pathway, like CD3 � chain.We do not detect tyrosine phosphorylation of some of themajor tyrosine kinase substrates immediately downstream ofthe TCR that are observed shortly after TRC stimulation, likeLAT (linker of activated T cells), SLP-76, PLC�, Vav, or ZAP-70, perhaps because of the kinetics of the experimental sys-tem; as we mention above, tyrosine phosphorylation eventspeak at an earlier time, within 1–2 min after TCR activation,and the resulting phosphorylated forms of these proteins canbe only transiently detected. During TCR activation, tyrosinephosphorylation of CD3 � chain is followed by recruitment ofthe tyrosine kinases Lck, Fyn, and ZAP-70 that phosphorylatethe transmembrane adaptor protein LAT, which relocates tomicroclusters during TCR activation. Unexpectedly, we ob-serve here how LAT gets dephosphorylated in Ser-135 uponTCR stimulation. How phosphorylation in this residue affectsLAT activity is unknown, but it possibly adds a new controlmechanism over its activity complementary to its phosphory-lation by ZAP-70.
Indeed, a number of the proteins we have identified asTCR-responsive have been previously described to partici-pate in TCR-modulated signaling pathways. From all of the517 TCR-responsive phosphorylation sites identified in thisstudy, 29 were previously characterized as TCR-responsivesites in the literature (Table I) (13, 14). For example, TCRstimulation generated dephosphorylation of the actin-bindingproteins cofilin-1 on Ser-3 and LIM and SH3 domain protein 1on Thr-104 and induced phosphorylation of others, as dock-ing protein 1, which modulates integrin activation by compet-ing with talin-1. We also observe an increase in phosphory-lation on talin-1 Ser-1021 (Table I) (14, 36, 37). We have foundthat many other sites, previously unknown to be TCR-respon-sive, do change phosphorylation levels on proteins previouslyknown to play defined roles in TCR signaling (supplemental
FIG. 5. Distribution of functional categories of the identifiedproteins. Cellular localization and molecular function of the 334 TCR-responsive proteins and all identified proteins are represented in Aand B, respectively. The categories were distributed using DAVIDbioinformatics resources (http://david.abcc.ncifcrf.gov/).
Phosphoproteomics of Early TCR Activation
Molecular & Cellular Proteomics 11.5 179

FIG. 6. Interaction networks for some groups of TCR-responsive proteins. Different clusters of interacting proteins were identified usingSTRING to obtain a high confidence evidence network. Connecting lines show reported interaction based on experimental evidence (blue lines)or databases (pink lines). A, proteins interacting directly with the TCR complex or the main reported pathways; B, Rho-GTPases, C, cytoskeletalregulators; D, regulation of transcription; E, pre-mRNA processing; F, trafficking through nucleus; G, microtubule and centrosome assembly.
Phosphoproteomics of Early TCR Activation
180 Molecular & Cellular Proteomics 11.5

Table 3). An example is the above mentioned Ser-135 in LAT.We have found 101 of these additional sites. From these sites,seven have never been described as a phosphorylation siteon the corresponding protein; examples of this are Ser-886 inneuroblast differentiation-associated protein, Ser-394 andThr-2209 on filamin-A, and Ser-135 on drebrin-like protein,which is a key component of the immunological synapse thatregulates T cell activation by bridging TCRs and the actincytoskeleton to gene activation and endocytic processes (38).
The time frame we have chosen in this experiment to ana-lyze the changes in the phosphoproteome of T cells (5 min)overlap in time with extensive cytoskeletal reorganization inthe immune synapse. Dynamic rearrangement of the actin andmicrotubule cytoskeletons is essential for TCR signaling (2).Following the interaction between T cell and APC, a number ofproteins (TCR complexes and signaling molecules such asZAP-70 (� chain-associated protein kinase of 70 kDa), LAT,
GRB2 (growth factor receptor-bound protein-2), GRAP2(GRB2-related adaptor protein-2), and SLP-76 (SRC homolo-gy-2 domain-containing leukocyte protein of 76 kDa)) (3, 39)aggregate into microclusters at the periphery of the immunesynapse, and then they move centripetally toward centralareas in which signal extinction occurs (40). This movement ofsignaling microclusters is controlled by actin cytoskeletonreorganizations; between 5 and 15 min after TCR-APC inter-action, accumulation of F-actin in these areas is elevated, andthere is active actin polymerization (41).
We observe in this study how the most abundant group ofTCR-regulated phosphoproteins after 5 min of activation isassociated to cytoskeleton; this set of proteins should there-fore be informative of the molecular mechanisms regulatingthe cytoskeletal reorganization dynamics in the IS, to controlTCR signaling. Formation of membrane structures resemblingIS has been observed when anti-CD3 bound to glass surfaceshas been used to stimulate T cells, in an antibody-specificfashion (39). Anti-CD3 stimulation thus seems to be able totrigger cytoskeletal rearrangements associated to IS forma-tion. In a time frame (5 min) coincident with the time observedfor the cytoskeletal rearrangements observed when T cells arepresented anti-CD3 bound to glass surfaces (39) or during ISformation in APC-T cell systems, we see extensive modifica-tions in cytoskeletal proteins, which suggests that theseevents could also participate in the formation of the IS. At themolecular level, we see an increase of phosphorylation onactin itself (Ser-239 on �-actin), and several regulatory pro-teins. Actin cytoskeleton controls B cell receptor dynamics atthe plasma membrane through membrane-cytoskeleton link-ers (42); it is unknown how this happens in the TCR. We seein our data how talin-1, which acts as a membrane-cytoskel-eton linker, increases its phosphorylation levels in residuesSer-1021, Ser-1201, and Ser-446 as a result of TCR activa-tion. This protein has been shown to interact with adhesionmolecules of the integrin family and cytoskeletal componentsin a Rap1-dependent manner (43), and it is localized on theperipheral zone of the immunological synapse (44). Based onthe sequences that we observe that surround the phosphory-lated residues, talin-1 could be a substrate of protein kinaseslike PKC and CAMK2 and 4, which we observe to be respon-sive to TCR stimulation in our experiment (supplemental Table1). Several other actin-binding proteins, which could be in-volved in the movement of those microclusters, showchanges in phosphorylation; as an example, CapZ-interactingprotein (dephosphorylated at Ser-1164) regulates the ability ofF-actin capping protein to remodel actin filament assembly.We observe dephosphorylation of particular residues in aconsiderable number of proteins related to the actin cytoskel-eton: phosphatase and actin regulator 2, myosin 18A, paxillin,myosin 9 (phosphorylated on Ser-1713 and dephosphory-lated on Ser-1942), dematin (increased in phosphorylation in 5sites: Ser-92, Ser-96, Ser-105, Ser-113, and Ser-333 anddephosphorylated in either Ser-16 or Ser-18), LIM, SH3 pro-
FIG. 7. Frequency plots of residues surrounding serine, threo-nine, or tyrosine phosphorylation sites. The height of the residuesrepresents the frequency with which they occur at the respectivepositions. The color of the residues represents their physicochemicalproperties. The frequency plots were generated with motif X algo-rithm. A shows motifs found in up-regulated TCR-responsive phos-phopeptides, and B shows those found in down-regulatedphosphopeptides.
Phosphoproteomics of Early TCR Activation
Molecular & Cellular Proteomics 11.5 181

tein, CAP-Gly domain-containing linker protein, and cofilin-1(supplemental Table 1). So both protein kinase and phosphateactivities triggered after 5 min of TCR engagement act overthe TCR-responsive set of phosphoproteins in the actin cyto-skeleton. Inhibitory phosphorylation sites, as occurring inthe case of myosin IIA (45) impair signaling microclustersmovement and TCR signaling, but once the TCR is trig-gered, some specific phosphatase(s) act(s) over thesephosphorylation sites, releasing their inhibitory effect, as anecessary step for the microclusters relocation to the syn-apse. We observe changes in the phosphorylation status ofparticular residues in several different regulatory phospha-tase subunits (protein phosphatase 1 regulatory (inhibitor)subunit 11, protein phosphatase 1 regulatory (inhibitor) sub-unit 12A (PPP1R12A), protein phosphatase inhibitor 2,putative uncharacterized protein PSTPIP1, proline-serine-threonine phosphatase-interacting protein 1, RNA polymer-ase II subunit A C-terminal domain phosphatase, tyrosine-protein phosphatase nonreceptor type 11 (PTPN11), andprotein tyrosine phosphatase, nonreceptor type 12 (PTPN12).Which of them, if any, are related to the dephosphorylationevents observed at this time during TCR activation remains achallenging task for future works.
The processes occurring in the immune synapse also in-volve reorganization of the microtubules. The microtubuleorganizing center needs to reorient and contact the plasmamembrane at the TCR-APC contact site, and it requires theeffect of protein kinases located in the microclusters, liketyrosine kinases Lck and Fyn and other kinases as PKC �, �,
and � (46, 47). We observe how several PKC isoforms altertheir phosphorylation levels at 5 min. PKC � gets tyrosine- andserine-phosphorylated in several sites (Tyr-313, Thr-141, Ser-306, Ser-685, and Ser-695) in our data. PKC� is dephosphory-lated in Ser-674. Other proteins are also required for micro-tubule organizing center polarization, and we can see themhere changing phosphorylation levels: PDLIM1 (PDZ and LIMdomain protein 1), which increases its phosphorylation inSer-206 (newly identified, see supplemental Table 2) andwhich gets dephosphorylated in Ser-129; LAT interaction pro-teins, like the adapter protein GRB2-associated binding pro-tein 3, which is seen to be increased in phosphorylation atSer-345; and its interacting protein SHC1 (phosphorylated onTyr-427). Some important regulatory proteins as the earliermentioned tyrosine protein phosphatase nonreceptor type 11(PTN11) are able to bind GRB2-associated binding protein 3.Microtubule organizing center recruitment is regulated by in-teractions between tubulin and molecular motors like dynein,responsible for transporting cellular cargo along the microtu-bules (48), which shows increased phosphorylation levels inour data set.
Rac/Rho GTPases are inactive in quiescent cells but be-come activated with TCR stimulation in response to increasedintracellular diacylglicerol levels. GTPases are important reg-ulators of the cytoskeleton. Some of them are localized inthe microclusters, like CDC42 or Rap1. They are likely tobe the key for actin and microtubules cytoskeleton interplay inthe immunological synapse conditioning its shape and stabil-ity. We can see in the list of TCR-responsive phosphoproteins
FIG. 8. Selected kinase motifs present in TCR-responsive phosphopeptides. We represent the enrichment factors for different motivesin the sets of up- and down-regulated phosphopeptides (letters inside brackets indicate possible alternative amino acids in that position).Enrichment factors (supplemental Table 4) were calculated by taking into account the number of times the consensus phosphorylation sitemotifs appeared randomly in the database and the number of TCR-responsive phosphopeptides containing that motif (see “ExperimentalProcedures” for details). Motifs in the x axis correspond to the following kinases: CaMK1, (F/I/L/M/V)XRXX(pS/pT)(F/I/L/M/V); CaMK2,RXX(pS/pT); (M/V/L/I/F)X(R/K)XX(pS/pT) or (F/I/L/V/Y)X(K/R)XX(pS/pT)(F/I/L/M/V/Y)(D/E); CaMK4, RXX(pS/pT) or (F/I/L/V/Y)XRXX(pS/pT); PKA,RXX(pS/pT), RX(pS/pT), KRXX(pS/pT), or R(R/K)X(pS/pT); PKC, RXX(pS/pT), RX(pS/pT), or (R/K)XX(pS/pT); ERK1/2, (pS/pT)P, PX(pS/pT)P, orVX(pS/pT)P; GSK3, (pS/pT)P, PX(pS/pT)P, or (pS/pT)XXXsP; aurora A, RX(pS/pT); Chk1, (M/I/L/V)X(R/K)XX(pS/pT); Akt, RXX(pS/pT),RXRXX(pS/pT), or R(R/S/T/)X(pS/pT)X(S/T); p90RSK, RXRXX(pS/pT) or (R/K)XRXX(pS/pT); PKD, (L/V/I)X(R/K)XX(pS/pT); Zip kinase, RRXX(pS/pT); cyclin-dependent kinase 5, (pS/pT)P or PX(pS/pT)P; cell division control protein 2 homolog, KRXX(pS/pT); and casein kinase 2,(pS/pT)(D/E)(D/E)(D/E), (pS/pT)X(D/E)(D/E/pS)(D/E), or (pS/pT)(D/E)X(D/E).
Phosphoproteomics of Early TCR Activation
182 Molecular & Cellular Proteomics 11.5

several regulators of its activity: residues on CDC42 RhoGTPase effector protein, Ras GTPase-activating-like proteinIQGAP2, and Rap1 GTPase-activating protein 2 when presentincreased phosphorylation levels. As for the kinases respon-sible for these modifications, there could be several candi-dates according to the motives that surround the phosphor-ylated residues. PKC might be responsible for Ser-564phosphorylation of Rap1 GTPase-activating protein 2, andGSK3 or ERK might be responsible for Ser-45 and Ser-612/613. A possible kinase responsible for IQGAP2 phosphoryla-tion is p90RSK. We observe increased phosphorylation onPKD2; PKD has been described to control the activity andplasma membrane localization of the GTPase Rap1 (49).
A set of GAP and GEF also shows changes in their phos-phorylation levels (Rho GTPase-activating proteins 4, 6, 25,and 30, Rho guanine nucleotide exchange factors 2 and 12,and CDC42 effector protein 3). Several of these are able tointeract with A kinase (PRKA) anchor protein 13 (nononco-genic Rho GTPase-specific GTP exchange factor, AKAP13).AKAP13 has been described to function as scaffolding pro-teins to coordinate a Rho signaling pathway and, in addition,function as a protein kinase A-anchoring protein (50, 51). Wecan observe increased phosphorylation in AKAP13 and its
interacting protein cAMP-dependent protein kinase, regula-tory, type II� (PRKAR2A). This could provide a link for theregulation of cytoskeleton by cAMP levels via Rac/Rho GT-Pases during TCR responses. PKA is anchored to the TCR bythe ezrin-myosin family (52) and works as a potent negativeregulator of T cell immune function. It phosphorylates the Srckinase Csk, which upon activation inhibits Lck and Fyn main-taining the T cell homeostasis, but cAMP could also regulatethe cytoskeleton rearrangements on the IS by this actionthrough the Rac/Rho GTPases.
Changes in phosphorylation levels at 5 min after TCR stim-ulation affect even proteins involved in nuclear processesrelated to gene expression, transcription factors (we see keyregulators of cytokine gene expression in T cells like NFAT Iand �-catenin (53, 54) decreasing its phosphorylation in in-hibitory residues upon TCR triggering), transcriptional regula-tors like histone deacetylases (Ser-393 in histone deacetylase1) and methyl-CpG binding proteins. Proteins involved inmRNA processing and splicing present changes in their phos-phorylation state at this early time, which is in agreement withwhat has been observed for later times (13), but our resultsshow that changes in the regulatory post-translational modi-fications in this set of proteins are in fact much earlier, and the
TABLE ITCR responsive phosphorylation sites identified in this study and previously known to be involved in TCR signaling
Phosphorylation sites are labeled in the sequence of the peptides.
Phosphoproteomics of Early TCR Activation
Molecular & Cellular Proteomics 11.5 183

nuclear reprogramming of the T cell starts a few minutes afterTCR stimulation.
Many additional experiments will be necessary to exploreall the possible consequences of the changes in the T cellphosphoproteome shown here to happen after TCR stimula-
tion. Changes in protein phosphorylation collected in largescale experiments like this one represent global views of thecellular state and so can be invaluable to design targetedexperiments to elucidate the patterns of the transfer of infor-mation inside the cell. The exact role of the changes in phos-
TABLE IIKinase-specific motifs found in the TCR responsive phosphopeptides in protein kinases
In blue and with an asterisk we represent the kinase-specific motifs found in downregulated phosphopeptides present in the sequences ofprotein kinases. Upregulated ones are represented in black. See legend of Figure 8 for kinase specificity for these motives.
Phosphoproteomics of Early TCR Activation
184 Molecular & Cellular Proteomics 11.5

phorylation on the sites that are responsive to TCR stimulationin T cells remains a task for future research.
Acknowledgments—We thank Jonathan Trinidad for guidance withphosphopeptide enrichment and strong cation exchange chromatog-raphy, Kati Medzihradszky for advice regarding confirmation of somephosphorylated sites, and David Maltby for assistance in the runningof the mass spectrometer.
* This work was supported by National Center of Research Re-sources Grants P41RR001614 and RR012961. The costs of publica-tion of this article were defrayed in part by the payment of pagecharges. This article must therefore be hereby marked “advertise-ment” in accordance with 18 U.S.C. Section 1734 solely to indicatethis fact.
□S This article contains supplemental material.¶ To whom correspondence should be addressed. Tel.: 415-476-
5249; Fax: 415-502-1655; E-mail: [email protected].
REFERENCES
1. Bridgeman, J. S., Sewell, A. K., Miles, J. J., Price, D. A., and Cole, D. K.(2012) Structural and biophysical determinants of �� T-cell antigen rec-ognition. Immunology 135, 9–18
2. Lasserre, R., and Alcover, A. (2010) Cytoskeletal cross-talk in the control ofT cell antigen receptor signaling. FEBS Lett. 584, 4845–4850
3. Yokosuka, T., Sakata-Sogawa, K., Kobayashi, W., Hiroshima, M.,Hashimoto-Tane, A., Tokunaga, M., Dustin, M. L., and Saito, T. (2005)Newly generated T cell receptor microclusters initiate and sustain T cellactivation by recruitment of Zap70 and SLP-76. Nat. Immunol. 6,1253–1262
4. Pawson, T., and Scott, J. D. (2005) Protein phosphorylation in signaling: 50years and counting. Trends Biochem. Sci. 30, 286–290
5. van der Merwe, P. A., and Dushek, O. (2011) Mechanisms for T cell receptortriggering. Nat. Rev. Immunol. 11, 47–55
6. Pearce, L. R., Komander, D., and Alessi, D. R.(2010) The nuts and bolts ofAGC protein kinases. Nat. Rev. Mol. Cell Biol. 11, 9–22
7. Finlay, D., and Cantrell, D. (2011) The coordination of T-cell function byserine/threonine kinases. Cold Spring Harb. Perspect. Biol. 3, a002261
8. Houtman, J. C., Houghtling, R. A., Barda-Saad, M., Toda, Y., and Samel-son, L. E. (2005) Early phosphorylation kinetics of proteins involved inproximal TCR-mediated signaling pathways. J. Immunol. 175,2449–2458
9. Zhu, M., Janssen, E., and Zhang, W. (2003) Minimal requirement of tyrosineresidues on linker for activation of T cells in T cell activation and thymo-cyte development. J. Immunol. 170, 325–333
10. Abraham, R. T., and Weiss, A. (2004) Jurkat T cells and development of theT-cell receptor signaling paradigm. Nat. Rev. Immunol. 4, 301–308
11. Salomon, A. R., Ficarro, S. B., Brill, L. M., Brinker, A., Phung, Q. T., Ericson,C., Sauer, K., Brock, A., Horn, D. M., Schultz, P. G., and Peters, E. C.(2003) Profiling of tyrosine phosphorylation pathways in human cellsusing mass spectrometry. Proc. Natl. Acad. Sci. U.S.A. 100, 443–448
12. Nguyen, V., Cao, L., Lin, J. T., Hung, N., Ritz, A., Yu, K., Jianu, R., Ulin,S. P., Raphael, B. J., Laidlaw, D. H., Brossay, L., and Salomon, A. R.(2009) A new approach for quantitative phosphoproteomic dissection ofsignaling pathways applied to T cell receptor activation. Mol. Cell. Pro-teomics 8, 2418–2431
13. Navarro, M. N., Goebel, J., Feijoo-Carnero, C., Morrice, N., and Cantrell,D. A. (2011) Phosphoproteomic analysis reveals an intrinsic pathway forthe regulation of histone deacetylase 7 that controls the function ofcytotoxic T lymphocytes. Nat. Immunol. 12, 352–361
14. Mayya, V., Lundgren. D. H., Hwang, S. I., Rezaul, K., Wu, L., Eng, J. K.,Rodionov, V., and Han, D. K. (2009) Quantitative phosphoproteomicanalysis of T cell receptor signaling reveals system-wide modulation ofprotein-protein interactions. Sci. Signal. 2, ra46
15. Carrascal, M., Ovelleiro, D., Casas, V., Gay, M., and Abian, J. (2008)Phosphorylation analysis of primary human T lymphocytes using se-quential IMAC and titanium oxide enrichment. J. Proteome Res. 7,5167–5176
16. Iwai, L. K., Benoist, C., Mathis, D., and White, F. M. (2010) Quantitative
phosphoproteomic analysis of T cell receptor signaling in diabetes proneand resistant mice. J. Proteome Res. 9, 3135–3145
17. Moulder, R., Lonnberg, T., Elo, L. L., Filen, J. J., Rainio, E., Corthals, G.,Oresic, M., Nyman, T. A., Aittokallio, T., and Lahesmaa, R. (2010) Quan-titative proteomics analysis of the nuclear fraction of human CD4� cellsin the early phases of IL-4-induced Th2 differentiation. Mol. Cell. Pro-teomics 9, 1937–1953
18. Pinkse, M. W., Uitto, P. M., Hilhorst, M. J., Ooms, B., and Heck, A. J. (2004)Selective isolation at the femtomole level of phosphopeptides from pro-teolytic digests using 2D-NanoLC-ESI-MS/MS and titanium oxide pre-columns. Anal. Chem. 76, 3935–3943
19. Larsen, M. R., Thingholm, T. E., Jensen, O. N., Roepstorff, P., and Jør-gensen, T. J. (2005) Highly selective enrichment of phosphorylated pep-tides from peptide mixtures using titanium dioxide microcolumns. Mol.Cell. Proteomics 4, 873–886
20. Trinidad, J. C., Specht, C. G., Thalhammer, A., Schoepfer, R., and Burlin-game, A. L. (2006) Comprehensive identification of phosphorylation sitesin postsynaptic density preparations. Mol. Cell. Proteomics 5, 914–922
21. Rush, J., Moritz, A., Lee, K. A., Guo, A., Goss, V. L., Spek, E. J., Zhang, H.,Zha, X. M., Polakiewicz, R. D., and Comb, M. J. (2005) Immunoaffinityprofiling of tyrosine phosphorylation in cancer cells. Nat. Biotechnol. 23,94–101
22. Gilar, M., Olivova, P., Daly, A. E., and Gebler, J. C. (2005) Two-dimensionalseparation of peptides using RP-RP-HPLC system with different pH infirst and second separation dimensions. J. Sep. Sci. 28, 1694–1703
23. Villen, J., and Gygi, S. P. (2008) The SCX/IMAC enrichment approach forglobal phosphorylation analysis by mass spectrometry. Nat. Protoc. 3,1630–1638
24. Schwartz, D., and Gygi, S. P. (2005) An iterative statistical approach to theidentification of protein phosphorylation motifs from large-scale datasets. Nat. Biotechnol. 23, 1391–1398
25. Amanchy, R., Periaswamy, B., Mathivanan, S., Reddy, R., Tattikota, S. G.,and Pandey, A. (2007) A curated compendium of phosphorylation motifs.Nat. Biotechnol. 25, 285–286
26. Biarc, J., Chalkley, R. J., Burlingame, A. L., and Bradshaw, R. A. (2011) Theinduction of serine/threonine protein phosphorylations by a PDGFR/TrkAchimera in stably transfected PC12 cells. Mol. Cell. Proteomics10.1074/mcp.M111.013375
27. Birkenfeld, J., Nalbant, P., Yoon, S. H., and Bokoch, G. M. (2008) Cellularfunctions of GEF-H1, a microtubule-regulated Rho-GEF: Is alteredGEF-H1 activity a crucial determinant of disease pathogenesis? TrendsCell Biol. 18, 210–219
28. van Duijn, T. J., Anthony, E. C., Hensbergen, P. J., Deelder, A. M., andHordijk, P. L. (2010) Rac1 recruits the adapter protein CMS/CD2AP tocell-cell contacts. J. Biol. Chem. 285, 20137–20146
29. Ammer, A. G., and Weed, S. A. (2008) Cortactin branches out: Roles inregulating protrusive actin dynamics. Cell Motil. Cytoskeleton 65,687–707
30. Ambrose, J. C., and Wasteneys, G. O. (2008) CLASP modulates microtu-bule-cortex interaction during self-organization of acentrosomal micro-tubules. Mol. Biol. Cell 19, 4730–4737
31. Didier, C., Merdes, A., Gairin, J. E., and Jabrane-Ferrat, N. (2008) Inhibitionof proteasome activity impairs centrosome-dependent microtubule nu-cleation and organization. Mol. Biol. Cell 19, 1220–1229
32. Tse, H. M., Thayer, T. C., Steele, C., Cuda, C. M., Morel, L., Piganelli, J. D.,and Mathews, C. E. (2010) NADPH oxidase deficiency regulates Thlineage commitment and modulates autoimmunity. J. Immunol. 185,5247–5258
33. Goldberg, M. R., Luknar-Gabor, N., Zadik-Mnuhin, G., Koch, P., Tovbin, J.,and Katz, Y. (2007) Synergy between LPS and immobilized anti-humanCD3� mAb for activation of cord blood CD3� T cells. Int. Immunol. 19,99–103
34. Shan, X., Balakir, R., Criado, G., Wood, J. S., Seminario, M. C., Madrenas,J., and Wange, R. L. (2001) Zap-70-independent Ca2� mobilization andErk activation in Jurkat T cells in response to T-cell antigen receptorligation. Mol. Cell. Biol. 21, 7137–7149
35. Rebeaud, F., Hailfinger, S., Posevitz-Fejfar, A., Tapernoux, M., Moser, R.,Rueda, D., Gaide, O., Guzzardi, M., Iancu, E. M., Rufer, N., Fasel, N., andThome, M. (2008) The proteolytic activity of the paracaspase MALT1 iskey in T cell activation. Nat. Immunol. 9, 272–281
36. Oxley, C. L., Anthis, N. J., Lowe, E. D.., Vakonakis, I., Campbell, I. D., and
Phosphoproteomics of Early TCR Activation
Molecular & Cellular Proteomics 11.5 185

Wegener, K. L. (2008) An integrin phosphorylation switch: The effect of�3 integrin tail phosphorylation on Dok1 and talin binding. J. Biol. Chem.283, 5420–5426
37. Das, V., Nal, B., Roumier, A., Meas-Yedid, V., Zimmer, C., Olivo-Marin,J. C., Roux, P., Ferrier, P., Dautry-Varsat, A., and Alcover, A. (2002)Membrane-cytoskeleton interactions during the formation of the immu-nological synapse and subsequent T-cell activation. Immunol. Rev. 189,123–135
38. Le Bras, S., Foucault, I., Foussat, A., Brignone, C., Acuto, O., and Deckert,M. (2004) Recruitment of the actin-binding protein HIP-55 to the immu-nological synapse regulates T cell receptor signaling and endocytosis.J. Biol. Chem. 279, 15550–15560
39. Bunnell, S. C., Kapoor, V., Trible, R. P., Zhang, W., and Samelson, L. E.(2001) Dynamic actin polymerization drives T cell receptor-inducedspreading: A role for the signal transduction adaptor LAT. Immunity 14,315–329
40. Varma, R., Campi, G., Yokosuka, T., Saito, T., and Dustin, M. L. (2006) T cellreceptor-proximal signals are sustained in peripheral microclusters andterminated in the central supramolecular activation cluster. Immunity 25,117–127
41. Alarcon, B., Mestre, D., and Martínez-Martín, N. (2011) The immunologicalsynapse: A cause or consequence of T-cell receptor triggering? Immu-nology 133, 420–425
42. Treanor, B., Depoil, D., Gonzalez-Granja, A., Barral, P., Weber, M., Dushek,O., Bruckbauer, A., and Batista, F. D. (2010) The membrane skeletoncontrols diffusion dynamics and signaling through the B cell receptor.Immunity 32, 187–199
43. Reicher, B., and Barda-Saad, M. (2010) Multiple pathways leading from theT-cell antigen receptor to the actin cytoskeleton network. FEBS Lett.584, 4858–4864
44. Critchley, D. R. (2000) Focal adhesions: The cytoskeletal connection. Curr.Opin. Cell Biol. 12, 133–139
45. Ilani, T., Vasiliver-Shamis, G., Vardhana, S., Bretscher, A., and Dustin, M. L.
(2009) T cell antigen receptor signaling and immunological synapsestability require myosin IIA. Nat. Immunol. 10, 531–539
46. Cunningham, N. R., Hinchcliff, E. M., Kutyavin, V. I., Beck, T., Reid, W. A.,and Punt, J. A. (2011) GSK3-mediated instability of tubulin polymers isresponsible for the failure of immature CD4�CD8� thymocytes to po-larize their MTOC in response to TCR stimulation. Int. Immunol. 23,693–700
47. Kuhne, M. R., Lin, J., Yablonski, D., Mollenauer, M. N., Ehrlich, L. I., Huppa,J., Davis, M. M., and Weiss, A. (2003) Linker for activation of T cells,zeta-associated protein-70, and Src homology 2 domain-containing leu-kocyte protein-76 are required for TCR-induced microtubule-organizingcenter polarization. J. Immunol. 171, 860–866
48. Dustin, M. L., Chakraborty, A. K., and Shaw, A. S. (2010) Understanding thestructure and function of the immunological synapse. Cold Spring Harb.Perspect Biol. 2, a002311
49. Medeiros, R. B., Dickey, D. M., Chung, H., Quale, A. C., Nagarajan, L. R.,Billadeau, D. D., and Shimizu, Y. (2005) Protein kinase D1 and the �1integrin cytoplasmic domain control �1 integrin function via regulation ofRap1 activation. Immunity 23, 213–226
50. Smith, F. D., Langeberg, L. K., Cellurale, C., Pawson, T., Morrison, D. K.,Davis, R. J., and Scott, J. D. (2010) AKAP-Lbc enhances cyclic AMPcontrol of the ERK1/2 cascade. Nat. Cell Biol. 12, 1242–1249
51. Michel, J. J., and Scott, J. D. (2002) AKAP mediated signal transduction.Annu. Rev. Pharmacol. Toxicol. 42, 235–257
52. Mosenden, R., and Tasken, K. (2011) Cyclic AMP-mediated immuneregulation–overview of mechanisms of action in T cells. Cell Signal. 23,1009–1016
53. Lovatt, M., and Bijlmakers, M. J. (2010) Stabilisation of �-catenin down-stream of T cell receptor signalling. PLoS One 5, e12794
54. Chung, E. J., Hwang, S. G., Nguyen, P., Lee, S., Kim, J. S., Kim, J. W.,Henkart, P. A., Bottaro, D. P., Soon, L., Bonvini, P., Lee, S. J., Karp, J. E.,Oh, H. J., Rubin, J. S., and Trepel, J. B. (2002) Regulation of leukemic celladhesion, proliferation, and survival by �-catenin. Blood 100, 982–990
Phosphoproteomics of Early TCR Activation
186 Molecular & Cellular Proteomics 11.5