Deformation of erythrocytes under shear: A small-angle light scattering study
Upload
independentCategory
view
0download
0
Quantitative Measurement of Plasmodium-InfectedErythrocytes in Murine Models of Malaria by Flow
Cytometry Using Bidimensional Assessment of
SYTO-16 Fluorescence
Marıa Belen Jimenez-Dıaz, Teresa Mulet, Vanesa Gomez, Sara Viera, Angela Alvarez,Helena Garuti, Yolanda Vazquez, Alejandra Fernandez, Javier Ibanez, Magdalena Jimenez,Domingo Gargallo-Viola, Inigo Angulo-Barturen*
� AbstractFlow cytometry is a powerful tool for measuring parasitemias in murine malaria mod-els used to test new antimalarials. Measurement of the emission of the nonpermeablenucleic acid dye YOYO-1 (at 530 and 585 nm after excitation at 488 nm) allowed theunambiguous detection of low parasitemias (�0.01%) but required prolonged fixationand permeabilization of the sample. Thus, we tested whether this issue could be over-come by use of the cell-permeant dye SYTO-16 with this same bidimensional method.Blood samples from CD1 mice infected with Plasmodium yoelii, Plasmodium vinckei, orPlasmodium chabaudi or from NODscidb2m-/- engrafted with human erythrocytes andinfected with P. falciparum were stained with SYTO-16 in the presence or absence ofTER-119 mAb (for engrafted mice) in 96-well plate format and acquired in TrucountTM
tubes. Bidimensional analysis with SYTO-16 was quantitatively equivalent to YOYO-1.Moreover, by combining SYTO-16 with the use of TER-119-PE antimouse erythrocytemAb and Trucount tubes, the measurement of the concentration of P. falciparum-infected erythrocytes over a range of five orders of magnitude was achieved. Bidimen-sional analysis using SYTO-16 can be used to accurately measure the concentration ofPlasmodium spp.-infected erythrocytes in mice without complex sample preparation.' 2008 International Society for Advancement of Cytometry
� Key termsmalaria; flow cytometry; SYTO-16; bivariate analysis; TrucountTM; P. falciparum; mice
MALARIA is caused by the erythrocytic stages of protozoa of the genus Plasmodium,
which colonize and destroy host’s erythrocytes (1). To counter this disease, murine
models of malaria are essential tools for research (2), particularly for drug discovery
(3). In addition to the standard rodent experimental systems, different murine mod-
els of P. falciparum malaria are currently available (4–6). These are of special interest
for drug discovery because, with the exception of human subjects, these are the only
experimental systems available that allow the evaluation in vivo of the real human
pathogen growing inside human erythrocytes (hE) previously engrafted into immu-
nodeficient mice. Not surprisingly, the peripheral blood of these chimeric mice
[humanized mice (HM)] is a complex mixture of murine erythrocytes (mE) and hE,
in which the hematological effects of massive transfusions of hE and their elimination
from peripheral blood may have important effects. Hence, the specific and quantita-
tive measurement of different erythrocytic subpopulations is crucial in HM models,
particularly when these models are used to establish the relationship between the
amount of an antimalarial drug in blood and the effect on parasitemia through ex-
perimental pharmacokinetic and pharmacodynamic studies (PK/PD). In this kind of
GlaxoSmithKline R & D, ID CEDDDiseases of the Developing World,Tres Cantos, Spain
Received 12 March 2008; RevisionReceived 6 July 2008; Accepted 13August 2008
Grant sponsor: Medicines for MalariaVenture (Geneva, Switzerland); Grantsponsor: Fundaci�on Universidad-Empresa, CITIUS Program (Madrid,Spain).
*Correspondence to: I~nigo AnguloBarturen, GlaxoSmithKline Investigaci�ony Desarrollo, SL, Diseases of theDeveloping World, Drug DiscoveryBiology, Therapeutic Efficacy, c/ SeveroOchoa, 2 Tres Cantos, 28760 Madrid,Spain
Email: [email protected]
Published online 10 September 2008 inWiley InterScience (www.interscience.wiley.com)
DOI: 10.1002/cyto.a.20647
© 2008 International Society forAdvancement of Cytometry
Original Article
Cytometry Part A � 75A: 225�235, 2009
studies, an accurate and precise measurement of the concen-
tration of parasites in blood is essential (7,8).
Flow cytometry provides higher throughput, statistical
power, and precision than microscopic assessment of blood
smears from Plasmodium spp.-infected mice. In spite of this,
microscopy has remained as the gold standard to measure par-
asitemia in murine malarias because of the relatively low spec-
ificity of detection of flow cytometry in these models. To date,
most cytometric techniques available employ nucleic acid dyes
to detect parasite’s DNA/RNA in erythrocytes otherwise lack-
ing nuclei (9–14). However, the content of nucleic acids (re-
sidual RNA or DNA) in noninfected mE is highly variable and
may be similar to the amount of nucleic acids present in
infected erythrocytes. For example, since micronuclei-contain-
ing mE have quantities of DNA comparable to uninucleated
parasites, P. berghei has been used as a standard to define the
region of murine micronuclei in studies of genotoxicity in
mice assessed by flow cytometry (15). This problem of speci-
ficity is particularly marked in the presence of reticulocytosis
during recovery from anemia after treatment of an experimen-
tal infection (16) or in infections by P. vinckei or P. chabaudi,
which do not have preference for reticulocytes (2). In order to
overcome this hurdle, we developed a bidimensional method
of measuring the appropriately compensated emission of the
nucleic acid dye YOYO-1 at 530 � 30 (FL1530) and 585 � 42
(FL2585) nm after excitation at 488 nm (YOYO-1530/YOYO-
1585) (16). The YOYO-1530/YOYO-1585 bidimensional patterns
of staining allowed the distinction between infected and unin-
fected reticulocytes or normocytes and we could unequivocally
determine whether a mouse was infected or not at parasite-
mias as low as 0.01%. Unfortunately, biological membranes
are not permeable to YOYO-1, and a relatively complex sample
preparation is required, which makes this dye unsuitable for
quick and quantitative measurement of the concentration of
infected erythrocytes in blood.
A number of cell-permeant nucleic acid dyes that have
been used to detect Plasmodium spp. in mice are currently
available. These include DNA-selective dyes such as Hoechst
33258 and Hoechst 33342 (9,17–19). However, excitation of
these dyes is achieved through the use of ultraviolet lasers
which are not widely available. Among the non-DNA selective
dyes, hydroethidine (13,20) requires prior oxidation to ethi-
dium to render it capable of binding to nucleic acids (21). Ac-
ridine orange, which is another non-DNA selective dye (22),
has recently been described as a permeable dye for staining
nucleic acids that does not require complex sample processing
(23) despite having long been considered a nonpermeable dye
that is highly susceptible to staining conditions (21). In any
case, the emission spectra of Hoechst, hydroethidine or acri-
dine orange, are different from that of YOYO-1, making them
unsuitable for use in a bidimensional FL1530/FL2585 method.
In contrast, SYTO-16 (i) is a cell-permeant non-DNA selective
cyanine dimer, (ii) has excitation and emission spectra similar
to those of YOYO-1, (iii) is essentially nonfluorescent in the
absence of nucleic acids, and (iv) shows a quantum yield
higher than YOYO-1 (0.65 vs. 0.52 relative to fluorescein,
respectively) (24). Interestingly, SYTO-16 has already been
used to detect erythrocytes parasitized with P. falciparum
in vitro (25,26) and P. berghei in vivo (26,27), although, to the
best of our knowledge, it has only been formally validated to
measure parasitemias in murine models of the hemoparasite
Theileria (28). Moreover, none of the authors cited used a
bidimensional FL1530/FL2585 method to detect parasitized ery-
throcytes in mice. In consequence, we tested whether SYTO-
16 could be used in murine models of malaria in a fluores-
cence bidimensional FL1530/FL2585 method (SYTO-16530/
SYTO-16585) aimed specifically at providing a fast, specific,
and quantitative measurement of the concentration of infected
erythrocytes in HM.
In this article, we describe a flow cytometry dual parame-
ter procedure using SYTO-16530/SYTO-16585 to measure Plas-
modium spp. parasitemias in murine models of malaria that
does not require sample processing and is as sensitive and
accurate as YOYO-1530/YOYO-1585. This method allows the si-
multaneous staining of samples with SYTO-16 and mAbs to
identify specific erythrocytic subpopulations and/or avoid
interfering background signals. Moreover, the method is com-
patible with the use of acquisition tubes containing known
numbers of calibrated beads (TrucountTM), which allow the
measurement of the actual concentrations of infected erythro-
cytes in blood.
MATERIALS AND METHODS
Mice
Pathogen-free 8- to 12-week-old female CD1 (Hsd:ICR)
mice were obtained from Harlan (Gannat, France). A colony
of NOD.Cg-Prkdcscid B2mtm1Unc/J (NODscid/b2m-/-) immunode-
ficient mice was raised and maintained by Charles River Labo-
ratories (L’Arbresle, France). Female mice (8-week old) were
used. The mice were provided with autoclaved tap water and
c-irradiated pelleted diet ad libitum and maintained in the
GlaxoSmithKline Laboratory Animal Science animal facilities
at Tres Cantos (Spain). The animal research complied with
national and European Union legislation and GlaxoSmith-
Kline policy on the Care and Use of Animals and related codes
of practice.
Reagents and Antibodies
Saline solution and Dulbecco’s PBS from Gibco (Paisley,
UK); Giemsa solution from Merck & Co. (Whitehouse Sta-
tion, NJ); SYTO-16 and YOYO-1 from Molecular Probes
(Leiden, The Netherlands); biotinylated rat IgG1 isotype con-
trol, CD71 (biotinylated rat IgG1, clone C2), PE-streptavidin,
PE-conjugated rat IgG2b isotype control, and TER-119 (PE-
conjugated rat IgG2b antimouse erythrocyte) from Pharmin-
gen (San Diego, CA).
Parasites and Infection of Mice
P. yoelii 17X, P. berghei ANKA (both kindly donated by
Dr. E. Dei-Cas and Dr. L. Delhaes from Institut Pasteur, Lille,
France), P. vinckei and P. chabaudi (Malaria Research and Ref-
erence Reagent Resource Center, ATCC, Manassas, VA) were
ORIGINAL ARTICLE
226 Bidimensional SYTO-16 in Murine Malaria
used. P. falciparum Pf3D70087/N9 was generated from P. falcipa-
rum 3D7 as a standardized isolate capable of growing reprodu-
cibly in mice engrafted with hE in GlaxoSmithKline-Diseases
of the Developing World (Tres Cantos, Spain) (6). Experi-
ments in standard murine models (P. yoelii, P. chabaudi, or P.
vinckei) were performed as described previously (16). Experi-
ments with NODscid/b2m-/- mice engrafted with hE and infected
with P. falciparum Pf3D70087/N9 were conducted as described
(6). Briefly, in order to assay P. falciparum in mice, cohorts of
age-matched female NODscid/b2m-/- were injected i.p. daily
with hE throughout the experiment. When �40% chimerism
in peripheral blood was reached (7–10 days after initiation of
injections), the mice were infected with 20 3 106 parasites
obtained from infected donors (i.v. in 0.2 ml of saline or hE
suspension). In this animal model, P. falciparum Pf3D70087/N9
is not cleared from peripheral blood of mice.
Human Blood
Incomplete donations or erythrocyte concentrates of
malaria-negative donors were used, generously provided by
the Spanish Red Cross blood bank in Madrid, Spain. Prior to
injection, blood stored at 48C was washed twice with RPMI
1640, 25 mM HEPES (Sigma) containing 7 3 1023 mM hypo-
xanthine (Sigma) at room temperature. The buffy coat was
removed by aspiration (if required), and erythrocytes were
resuspended at 50% hematocrit in RPMI 1640, 25% decom-
plemented human serum (Sigma) 3.1 mM hypoxanthine.
Finally, the blood suspension was warmed at 378C for 20 min
prior to intraperitoneal injection with 1 ml of hE suspension
(administered daily throughout the experiments).
Measurement of Parasitemia
Flow cytometry. In brief, 2 ll of blood from the lateral tail
vein of mice were rapidly transferred into 0.1 ml/well of saline
containing 2.5 or 5 lM SYTO-16 (for rodent plasmodia and P.
falciparum in HM, respectively, since HM may have a signifi-
cantly higher erythrocyte concentration in blood) and, if
required, 10 lg/ml TER119-PE, in clean V-bottomed 96-well
plates. The samples were incubated for 20 min at room tem-
perature in the dark, after which 10 ll of saline 0.25% glutar-
aldehyde was added to each well. After 5 min of incubation to
allow complete inactivation of plasmodia, 30 ll was trans-
ferred from each well to either normal tubes or TrucountTM
tubes (Becton Dickinson, San Jose, CA) containing 270 ll ofsaline and acquired. Each Trucount tube contains a defined
number of fluorescent beads. The samples were acquired in
FACScalibur or LSRII flow cytometers (Becton Dickinson)
equipped with at least a 15 mW 488 nm air-cooled Argon-ion
laser, exactly as described for YOYO-1 (16). All the experi-
ments described in this article were performed using a FACS-
calibur flow cytometer unless otherwise stated. Erythrocytes
and leukocytes were gated in logarithmic forward/side scatter
dot plots, and green and red fluorescence were collected in
photomultipliers through 530 � 30 (FL1530) or 585 � 42
(FL2585) band-pass filters, respectively. The mean fluorescence
channels in FL1530 and FL2585 were adjusted to equal values in
the first decade of intensity in bivariate logarithmic scale dot-
plots with noninfected control samples. Leukocytes were
excluded during analysis in SSC/FL1530 dot plots because they
show much higher amounts of nucleic acids than parasites.
Compensation of SYTO-16 emission was performed exactly as
described for YOYO-1 (16). This was a critical step to accu-
rately define the region of infected events and must be deter-
mined empirically by comparison of the effect of increasing
compensation of the emission of SYTO-16 in FL2585 in sam-
ples from uninfected and Plasmodium-infected mice. Blood
samples taken 48 h after infection with P. yoelii or P. berghei
were optimal for compensation, since they show normocytes
containing rings and trophozoites, and reticulocytes harboring
all stages of the parasite. General procedures and target pat-
terns of staining are detailed in the Results section referring to
Figures 2A and 2B. The samples were analyzed using either
CellQuest-Pro or BD FACSDiva 5.0 (Becton Dickinson) soft-
ware. In samples with parasitemias[0.1%, the number of ery-
throcytes acquired was that which allowed the gathering of at
least 1,000 events (typically 2,000–5,000, depending on para-
sitemia) in the region established for infected erythrocytes.
For parasitemias below 0.1%, 1.5 3 106 total erythrocytes
were acquired. In order to determine the specifications of the
technique, the minimum number of events in the region of
infected events considered statistically significant was 100,
because it was the minimum number of events which could
provide reliably a recognizable bidimensional pattern of
infected events when compared with uninfected controls.
According to this criterion, the maximum sensitivity achieva-
ble by acquiring 1.5 3 106 total erythrocytes was 0.007%.
The concentration of cells in the acquisition tube was cal-
culated according to the following formula: Erythrocytes/
mlacquisition tube 5 (NE/NB) 3 (Beads/mlacquisition tube); where
NE is the number of erythrocytes acquired and NB is the
number of beads acquired. The actual concentration of ery-
throcytes in blood was calculated by multiplying the concen-
tration of cells in the acquisition tube by the dilution factors
employed.
Microscopy. Microscopic analysis of samples of peripheral
blood from infected mice were performed in blood smears
stained with 10% (vol/vol) Giemsa in saline buffer (0.015 M
NaCl, 0.001 M phosphate buffer, pH 7.0) as described in
Ref. 29.
Statistical Analysis
Experimental differences between the means or medians
of different groups were analyzed by the Student’s t test, Wil-
coxon-signed rank test or one-factor ANOVA, followed by
Dunnett’s posttest. Homogeneity of variances was assessed
using the Levene’s test. Normality of variables was assessed by
Kolmogorov–Smirnov test. All statistical analyses were per-
formed using GraphPad Prism 4.0 (GraphPad Software, San
Diego, CA) or SPSS 13.0 for Windows (SPSS, Chicago, IL).
Probability values P [ 0.05 were considered nonsignificant.
All the experiments described were performed at least twice in
order to ensure the reproducibility of results.
ORIGINAL ARTICLE
Cytometry Part A � 75A: 225�235, 2009 227
RESULTS
Optimization of Staining with SYTO-16
To assess the value of SYTO-16 in murine models of
malaria, the concentration of SYTO-16 that lacked hemolytic
activity was first determined, and the resolution in FL1530between noninfected and infected erythrocytes in our assay
conditions was maximized. These conditions were standar-
dized in order to avoid sample processing before acquisition.
The concentration of SYTO-16 was optimized using P. yoelii
since it has a marked preference to infect reticulocytes (2), and
the background due to noninfected reticulocytes is negligible
48–72 h after infection in the conditions used (16,23).Thus,
2 ll of whole blood obtained from CD1 mice infected with
P. yoelii were added to 100 ll saline (�1.63 106 erythrocytes/ll,23.7% of parasitemia at 72 h after i.v. infection with 6.4 3 106
parasitized erythrocytes) containing increasing concentrations
of SYTO-16 in a 96-well plate format. After 20 min of incuba-
tion at room temperature in the dark, the samples were neu-
tralized with glutaraldehyde for 5 min and acquired 30 ll ofeach sample in Trucount tubes containing a defined number
of fluorescent beads. Although not necessary for the flow cyto-
metry technique, neutralization with glutaraldehyde was
included to guarantee safe manipulation of samples poten-
tially infectious to humans. The fluorescent beads in Trucount
tubes acted as internal controls to test whether the addition of
SYTO-16 significantly reduced the number of erythrocytes per
well in comparison to control wells without SYTO-16, as a
means of assessing the potential hemolytic effect of SYTO-16
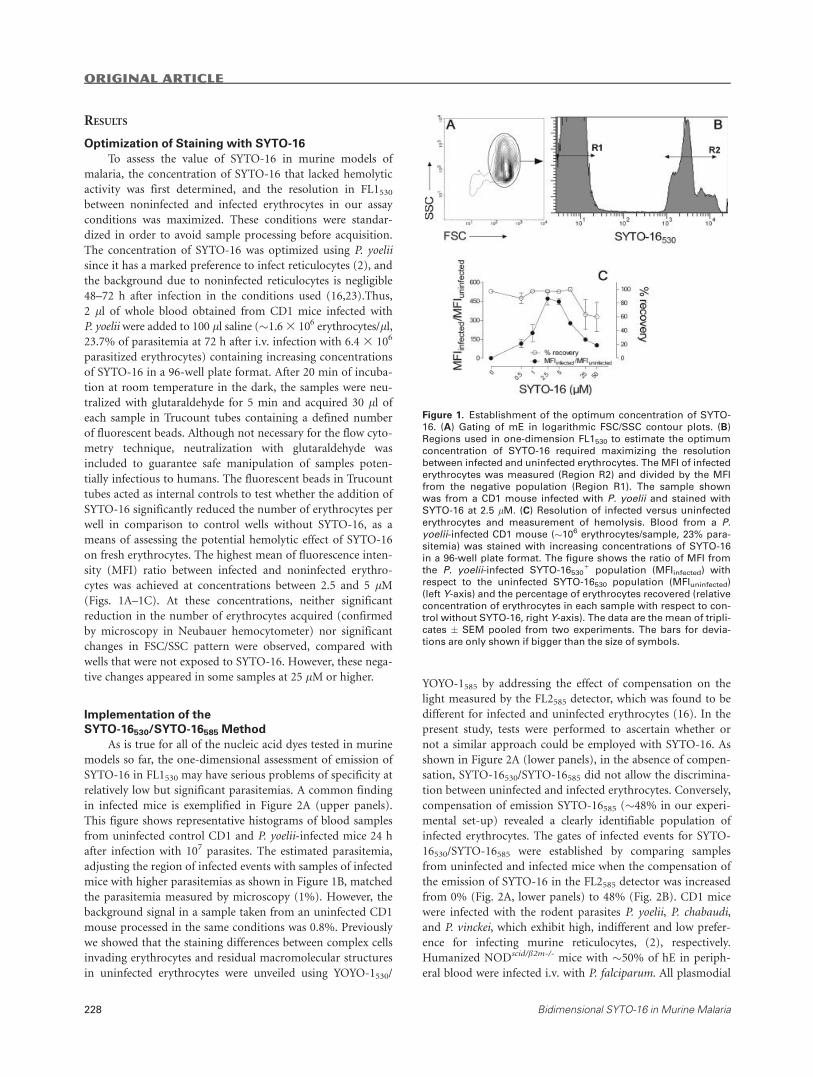
on fresh erythrocytes. The highest mean of fluorescence inten-
sity (MFI) ratio between infected and noninfected erythro-
cytes was achieved at concentrations between 2.5 and 5 lM(Figs. 1A–1C). At these concentrations, neither significant
reduction in the number of erythrocytes acquired (confirmed
by microscopy in Neubauer hemocytometer) nor significant
changes in FSC/SSC pattern were observed, compared with
wells that were not exposed to SYTO-16. However, these nega-
tive changes appeared in some samples at 25 lM or higher.
Implementation of the
SYTO-16530/SYTO-16585 Method
As is true for all of the nucleic acid dyes tested in murine
models so far, the one-dimensional assessment of emission of
SYTO-16 in FL1530 may have serious problems of specificity at
relatively low but significant parasitemias. A common finding
in infected mice is exemplified in Figure 2A (upper panels).
This figure shows representative histograms of blood samples
from uninfected control CD1 and P. yoelii-infected mice 24 h
after infection with 107 parasites. The estimated parasitemia,
adjusting the region of infected events with samples of infected
mice with higher parasitemias as shown in Figure 1B, matched
the parasitemia measured by microscopy (1%). However, the
background signal in a sample taken from an uninfected CD1
mouse processed in the same conditions was 0.8%. Previously
we showed that the staining differences between complex cells
invading erythrocytes and residual macromolecular structures
in uninfected erythrocytes were unveiled using YOYO-1530/
YOYO-1585 by addressing the effect of compensation on the
light measured by the FL2585 detector, which was found to be
different for infected and uninfected erythrocytes (16). In the
present study, tests were performed to ascertain whether or
not a similar approach could be employed with SYTO-16. As
shown in Figure 2A (lower panels), in the absence of compen-
sation, SYTO-16530/SYTO-16585 did not allow the discrimina-
tion between uninfected and infected erythrocytes. Conversely,
compensation of emission SYTO-16585 (�48% in our experi-
mental set-up) revealed a clearly identifiable population of
infected erythrocytes. The gates of infected events for SYTO-
16530/SYTO-16585 were established by comparing samples
from uninfected and infected mice when the compensation of
the emission of SYTO-16 in the FL2585 detector was increased
from 0% (Fig. 2A, lower panels) to 48% (Fig. 2B). CD1 mice
were infected with the rodent parasites P. yoelii, P. chabaudi,
and P. vinckei, which exhibit high, indifferent and low prefer-
ence for infecting murine reticulocytes, (2), respectively.
Humanized NODscid/b2m-/- mice with �50% of hE in periph-
eral blood were infected i.v. with P. falciparum. All plasmodial
Figure 1. Establishment of the optimum concentration of SYTO-
16. (A) Gating of mE in logarithmic FSC/SSC contour plots. (B)
Regions used in one-dimension FL1530 to estimate the optimum
concentration of SYTO-16 required maximizing the resolution
between infected and uninfected erythrocytes. The MFI of infected
erythrocytes was measured (Region R2) and divided by the MFI
from the negative population (Region R1). The sample shown
was from a CD1 mouse infected with P. yoelii and stained withSYTO-16 at 2.5 lM. (C) Resolution of infected versus uninfectederythrocytes and measurement of hemolysis. Blood from a P.yoelii-infected CD1 mouse (�106 erythrocytes/sample, 23% para-
sitemia) was stained with increasing concentrations of SYTO-16
in a 96-well plate format. The figure shows the ratio of MFI from
the P. yoelii-infected SYTO-165301 population (MFIinfected) with
respect to the uninfected SYTO-16530 population (MFIuninfected)
(left Y-axis) and the percentage of erythrocytes recovered (relativeconcentration of erythrocytes in each sample with respect to con-
trol without SYTO-16, right Y-axis). The data are the mean of tripli-cates � SEM pooled from two experiments. The bars for devia-
tions are only shown if bigger than the size of symbols.
ORIGINAL ARTICLE
228 Bidimensional SYTO-16 in Murine Malaria
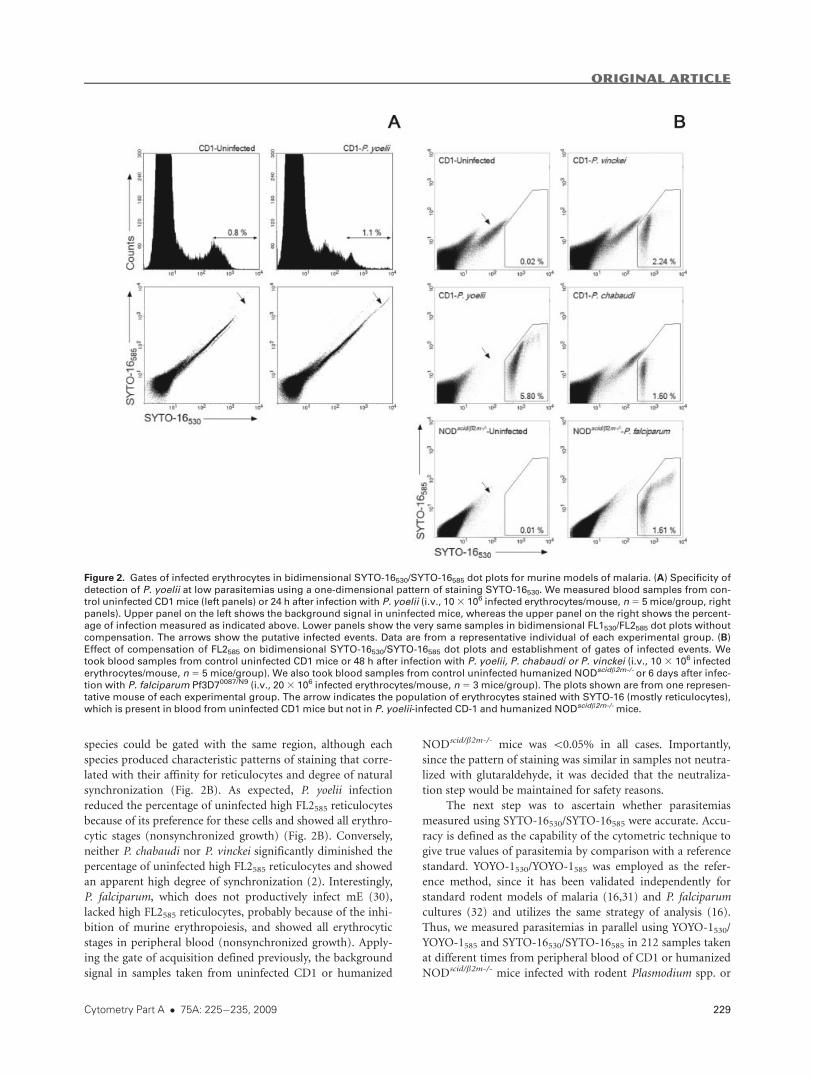
species could be gated with the same region, although each
species produced characteristic patterns of staining that corre-
lated with their affinity for reticulocytes and degree of natural
synchronization (Fig. 2B). As expected, P. yoelii infection
reduced the percentage of uninfected high FL2585 reticulocytes
because of its preference for these cells and showed all erythro-
cytic stages (nonsynchronized growth) (Fig. 2B). Conversely,
neither P. chabaudi nor P. vinckei significantly diminished the
percentage of uninfected high FL2585 reticulocytes and showed
an apparent high degree of synchronization (2). Interestingly,
P. falciparum, which does not productively infect mE (30),
lacked high FL2585 reticulocytes, probably because of the inhi-
bition of murine erythropoiesis, and showed all erythrocytic
stages in peripheral blood (nonsynchronized growth). Apply-
ing the gate of acquisition defined previously, the background
signal in samples taken from uninfected CD1 or humanized
NODscid/b2m-/- mice was \0.05% in all cases. Importantly,
since the pattern of staining was similar in samples not neutra-
lized with glutaraldehyde, it was decided that the neutraliza-
tion step would be maintained for safety reasons.
The next step was to ascertain whether parasitemias
measured using SYTO-16530/SYTO-16585 were accurate. Accu-
racy is defined as the capability of the cytometric technique to
give true values of parasitemia by comparison with a reference
standard. YOYO-1530/YOYO-1585 was employed as the refer-
ence method, since it has been validated independently for
standard rodent models of malaria (16,31) and P. falciparum
cultures (32) and utilizes the same strategy of analysis (16).
Thus, we measured parasitemias in parallel using YOYO-1530/
YOYO-1585 and SYTO-16530/SYTO-16585 in 212 samples taken
at different times from peripheral blood of CD1 or humanized
NODscid/b2m-/- mice infected with rodent Plasmodium spp. or
Figure 2. Gates of infected erythrocytes in bidimensional SYTO-16530/SYTO-16585 dot plots for murine models of malaria. (A) Specificity of
detection of P. yoelii at low parasitemias using a one-dimensional pattern of staining SYTO-16530. We measured blood samples from con-
trol uninfected CD1 mice (left panels) or 24 h after infection with P. yoelii (i.v., 103 106 infected erythrocytes/mouse, n5 5 mice/group, rightpanels). Upper panel on the left shows the background signal in uninfected mice, whereas the upper panel on the right shows the percent-
age of infection measured as indicated above. Lower panels show the very same samples in bidimensional FL1530/FL2585 dot plots without
compensation. The arrows show the putative infected events. Data are from a representative individual of each experimental group. (B)
Effect of compensation of FL2585 on bidimensional SYTO-16530/SYTO-16585 dot plots and establishment of gates of infected events. We
took blood samples from control uninfected CD1 mice or 48 h after infection with P. yoelii, P. chabaudi or P. vinckei (i.v., 10 3 106 infected
erythrocytes/mouse, n 5 5 mice/group). We also took blood samples from control uninfected humanized NODscidb2m-/- or 6 days after infec-
tion with P. falciparum Pf3D70087/N9 (i.v., 203 106 infected erythrocytes/mouse, n 5 3 mice/group). The plots shown are from one represen-
tative mouse of each experimental group. The arrow indicates the population of erythrocytes stained with SYTO-16 (mostly reticulocytes),
which is present in blood from uninfected CD1 mice but not in P. yoelii-infected CD-1 and humanized NODscidb2m-/-mice.
ORIGINAL ARTICLE
Cytometry Part A � 75A: 225�235, 2009 229
P. falciparum, respectively. The rodent malaria samples were
taken between days 0 and 6 after infection and showed a range
of parasitemia between 0.02 and 92%.The samples from the
murine P. falciparum model were taken between days 0 and 10
after infection and showed a range of parasitemia between
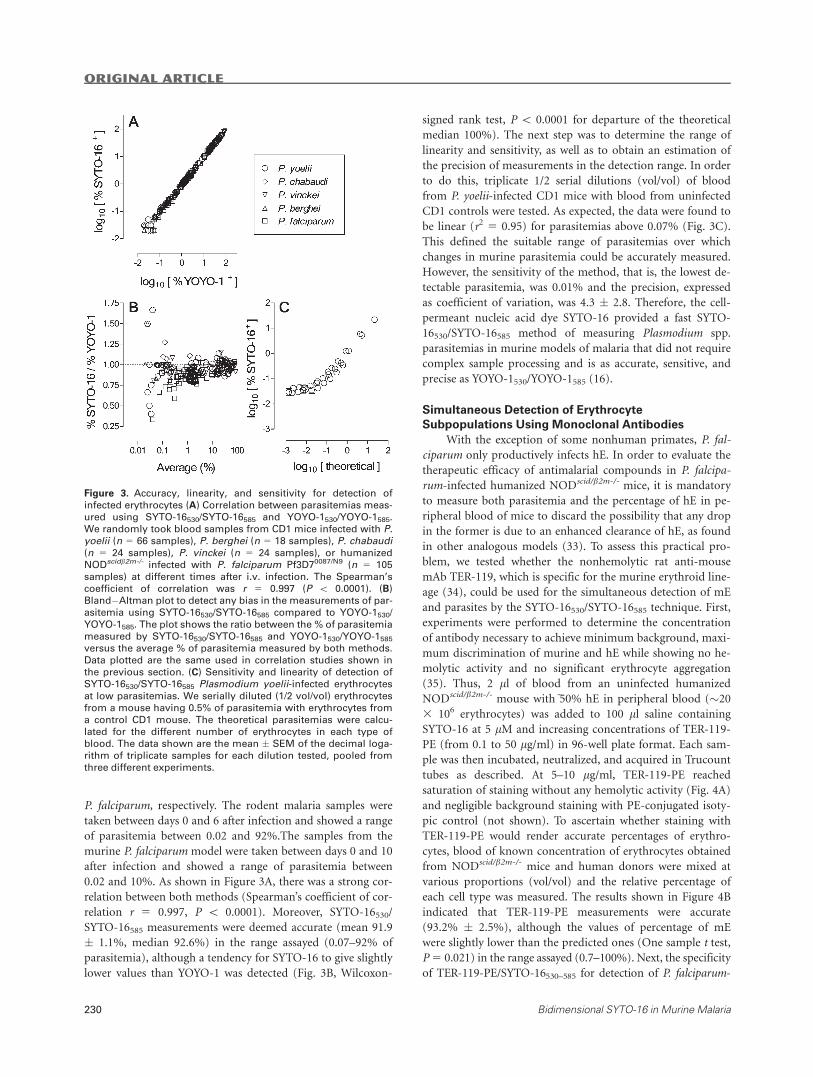
0.02 and 10%. As shown in Figure 3A, there was a strong cor-
relation between both methods (Spearman’s coefficient of cor-
relation r 5 0.997, P \ 0.0001). Moreover, SYTO-16530/
SYTO-16585 measurements were deemed accurate (mean 91.9
� 1.1%, median 92.6%) in the range assayed (0.07–92% of
parasitemia), although a tendency for SYTO-16 to give slightly
lower values than YOYO-1 was detected (Fig. 3B, Wilcoxon-
signed rank test, P \ 0.0001 for departure of the theoretical
median 100%). The next step was to determine the range of
linearity and sensitivity, as well as to obtain an estimation of
the precision of measurements in the detection range. In order
to do this, triplicate 1/2 serial dilutions (vol/vol) of blood
from P. yoelii-infected CD1 mice with blood from uninfected
CD1 controls were tested. As expected, the data were found to
be linear (r2 5 0.95) for parasitemias above 0.07% (Fig. 3C).
This defined the suitable range of parasitemias over which
changes in murine parasitemia could be accurately measured.
However, the sensitivity of the method, that is, the lowest de-
tectable parasitemia, was 0.01% and the precision, expressed
as coefficient of variation, was 4.3 � 2.8. Therefore, the cell-
permeant nucleic acid dye SYTO-16 provided a fast SYTO-
16530/SYTO-16585 method of measuring Plasmodium spp.
parasitemias in murine models of malaria that did not require
complex sample processing and is as accurate, sensitive, and
precise as YOYO-1530/YOYO-1585 (16).
Simultaneous Detection of Erythrocyte
Subpopulations Using Monoclonal Antibodies
With the exception of some nonhuman primates, P. fal-
ciparum only productively infects hE. In order to evaluate the
therapeutic efficacy of antimalarial compounds in P. falcipa-
rum-infected humanized NODscid/b2m-/- mice, it is mandatory
to measure both parasitemia and the percentage of hE in pe-
ripheral blood of mice to discard the possibility that any drop
in the former is due to an enhanced clearance of hE, as found
in other analogous models (33). To assess this practical pro-
blem, we tested whether the nonhemolytic rat anti-mouse
mAb TER-119, which is specific for the murine erythroid line-
age (34), could be used for the simultaneous detection of mE
and parasites by the SYTO-16530/SYTO-16585 technique. First,
experiments were performed to determine the concentration
of antibody necessary to achieve minimum background, maxi-
mum discrimination of murine and hE while showing no he-
molytic activity and no significant erythrocyte aggregation
(35). Thus, 2 ll of blood from an uninfected humanized
NODscid/b2m-/- mouse with~50% hE in peripheral blood (�20
3 106 erythrocytes) was added to 100 ll saline containing
SYTO-16 at 5 lM and increasing concentrations of TER-119-
PE (from 0.1 to 50 lg/ml) in 96-well plate format. Each sam-
ple was then incubated, neutralized, and acquired in Trucount
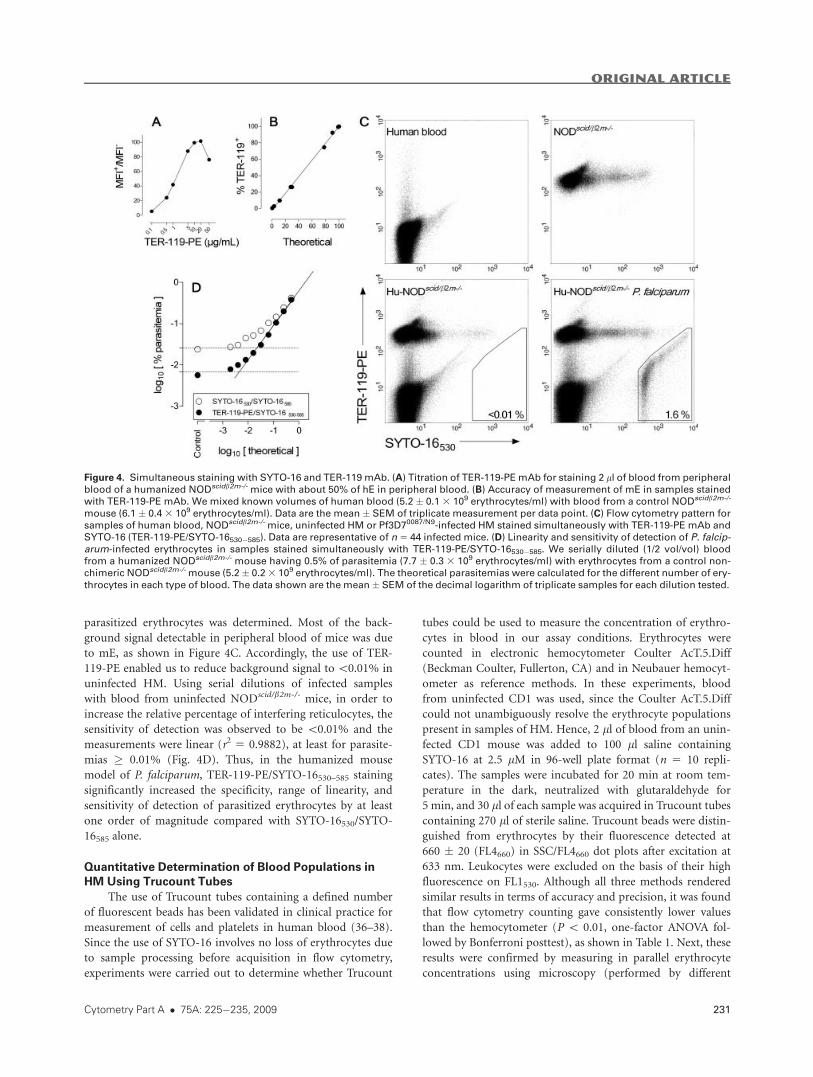
tubes as described. At 5–10 lg/ml, TER-119-PE reached
saturation of staining without any hemolytic activity (Fig. 4A)
and negligible background staining with PE-conjugated isoty-
pic control (not shown). To ascertain whether staining with
TER-119-PE would render accurate percentages of erythro-
cytes, blood of known concentration of erythrocytes obtained
from NODscid/b2m-/- mice and human donors were mixed at
various proportions (vol/vol) and the relative percentage of
each cell type was measured. The results shown in Figure 4B
indicated that TER-119-PE measurements were accurate
(93.2% � 2.5%), although the values of percentage of mE
were slightly lower than the predicted ones (One sample t test,
P5 0.021) in the range assayed (0.7–100%). Next, the specificity
of TER-119-PE/SYTO-16530–585 for detection of P. falciparum-
Figure 3. Accuracy, linearity, and sensitivity for detection of
infected erythrocytes (A) Correlation between parasitemias meas-
ured using SYTO-16530/SYTO-16585 and YOYO-1530/YOYO-1585.
We randomly took blood samples from CD1 mice infected with P.yoelii (n 5 66 samples), P. berghei (n 5 18 samples), P. chabaudi(n 5 24 samples), P. vinckei (n 5 24 samples), or humanized
NODscidb2m-/- infected with P. falciparum Pf3D70087/N9 (n 5 105
samples) at different times after i.v. infection. The Spearman’s
coefficient of correlation was r 5 0.997 (P \ 0.0001). (B)
Bland�Altman plot to detect any bias in the measurements of par-asitemia using SYTO-16530/SYTO-16585 compared to YOYO-1530/
YOYO-1585. The plot shows the ratio between the % of parasitemia
measured by SYTO-16530/SYTO-16585 and YOYO-1530/YOYO-1585versus the average % of parasitemia measured by both methods.
Data plotted are the same used in correlation studies shown in
the previous section. (C) Sensitivity and linearity of detection of
SYTO-16530/SYTO-16585 Plasmodium yoelii-infected erythrocytesat low parasitemias. We serially diluted (1/2 vol/vol) erythrocytes
from a mouse having 0.5% of parasitemia with erythrocytes from
a control CD1 mouse. The theoretical parasitemias were calcu-
lated for the different number of erythrocytes in each type of
blood. The data shown are the mean � SEM of the decimal loga-
rithm of triplicate samples for each dilution tested, pooled from
three different experiments.
ORIGINAL ARTICLE
230 Bidimensional SYTO-16 in Murine Malaria
parasitized erythrocytes was determined. Most of the back-
ground signal detectable in peripheral blood of mice was due
to mE, as shown in Figure 4C. Accordingly, the use of TER-
119-PE enabled us to reduce background signal to\0.01% in
uninfected HM. Using serial dilutions of infected samples
with blood from uninfected NODscid/b2m-/- mice, in order to
increase the relative percentage of interfering reticulocytes, the
sensitivity of detection was observed to be \0.01% and the
measurements were linear (r2 5 0.9882), at least for parasite-
mias � 0.01% (Fig. 4D). Thus, in the humanized mouse
model of P. falciparum, TER-119-PE/SYTO-16530–585 staining
significantly increased the specificity, range of linearity, and
sensitivity of detection of parasitized erythrocytes by at least
one order of magnitude compared with SYTO-16530/SYTO-
16585 alone.
Quantitative Determination of Blood Populations in
HM Using Trucount Tubes
The use of Trucount tubes containing a defined number
of fluorescent beads has been validated in clinical practice for
measurement of cells and platelets in human blood (36–38).
Since the use of SYTO-16 involves no loss of erythrocytes due
to sample processing before acquisition in flow cytometry,
experiments were carried out to determine whether Trucount
tubes could be used to measure the concentration of erythro-
cytes in blood in our assay conditions. Erythrocytes were
counted in electronic hemocytometer Coulter AcT.5.Diff
(Beckman Coulter, Fullerton, CA) and in Neubauer hemocyt-
ometer as reference methods. In these experiments, blood
from uninfected CD1 was used, since the Coulter AcT.5.Diff
could not unambiguously resolve the erythrocyte populations
present in samples of HM. Hence, 2 ll of blood from an unin-
fected CD1 mouse was added to 100 ll saline containing
SYTO-16 at 2.5 lM in 96-well plate format (n 5 10 repli-
cates). The samples were incubated for 20 min at room tem-
perature in the dark, neutralized with glutaraldehyde for
5 min, and 30 ll of each sample was acquired in Trucount tubes
containing 270 ll of sterile saline. Trucount beads were distin-guished from erythrocytes by their fluorescence detected at
660 � 20 (FL4660) in SSC/FL4660 dot plots after excitation at
633 nm. Leukocytes were excluded on the basis of their high
fluorescence on FL1530. Although all three methods rendered
similar results in terms of accuracy and precision, it was found
that flow cytometry counting gave consistently lower values
than the hemocytometer (P \ 0.01, one-factor ANOVA fol-
lowed by Bonferroni posttest), as shown in Table 1. Next, these
results were confirmed by measuring in parallel erythrocyte
concentrations using microscopy (performed by different
Figure 4. Simultaneous staining with SYTO-16 and TER-119 mAb. (A) Titration of TER-119-PEmAb for staining 2 ll of blood from peripheral
blood of a humanized NODscidb2m-/-mice with about 50% of hE in peripheral blood. (B) Accuracy of measurement of mE in samples stained
with TER-119-PE mAb. We mixed known volumes of human blood (5.2 � 0.1 3 109 erythrocytes/ml) with blood from a control NODscidb2m-/-
mouse (6.1 � 0.43 109 erythrocytes/ml). Data are the mean � SEM of triplicate measurement per data point. (C) Flow cytometry pattern for
samples of human blood, NODscidb2m-/-mice, uninfected HM or Pf3D70087/N9-infected HM stained simultaneously with TER-119-PE mAb and
SYTO-16 (TER-119-PE/SYTO-16530�585). Data are representative of n5 44 infected mice. (D) Linearity and sensitivity of detection of P. falcip-arum-infected erythrocytes in samples stained simultaneously with TER-119-PE/SYTO-16530�585. We serially diluted (1/2 vol/vol) bloodfrom a humanized NODscidb2m-/-mouse having 0.5% of parasitemia (7.7 � 0.3 3 109 erythrocytes/ml) with erythrocytes from a control non-
chimeric NODscidb2m-/-mouse (5.2 � 0.23 109 erythrocytes/ml). The theoretical parasitemias were calculated for the different number of ery-throcytes in each type of blood. The data shown are the mean � SEM of the decimal logarithm of triplicate samples for each dilution tested.
ORIGINAL ARTICLE
Cytometry Part A � 75A: 225�235, 2009 231
technicians with different degrees of training), and TER-119-
PE/SYTO-16530–585 plus Trucount beads (TSC) in 26 samples
taken from peripheral blood of humanized NODscid/b2m-/-
mice having between 2.2 3 109 and 11.9 3 109 erythrocytes/
ml. As expected from previous results, both sets of data corre-
lated significantly (Spearman’s coefficient of correlation r 50.76, P\ 0.0001) and TSC measurements showed an accuracy
of 117% � 28% (median 114.7), indicating a tendency to give
slightly higher values than microscopy under routine labora-
tory conditions (Wilcoxon-signed rank test, P \ 0.0028 for
departure of the theoretical median 100%). Finally, the linear-
ity and sensitivity of counting by TSC was determined using a
LSRII digital flow cytometer in order to maximize the sensitiv-
ity of counting infected erythrocytes using 2 ll blood samples.
First, the concentration of erythrocytes was measured in sam-
ples obtained by 1/2 (vol/vol) triplicate serial dilutions of
blood from a P. falciparum-infected humanized NODscid/b2m-/-
mouse with human serum. The data were linear over the entire
range tested (2.6 3 109 down to 4.1 3 107 erythrocytes/ml,
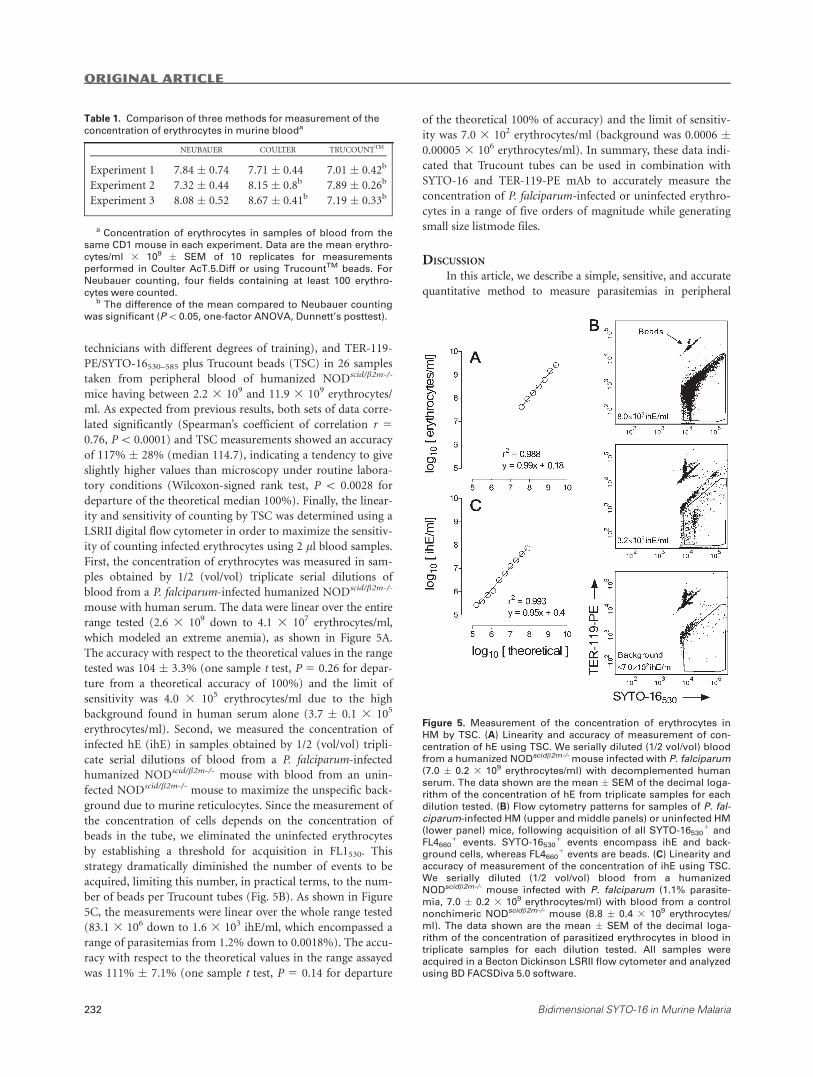
which modeled an extreme anemia), as shown in Figure 5A.
The accuracy with respect to the theoretical values in the range
tested was 104 � 3.3% (one sample t test, P 5 0.26 for depar-
ture from a theoretical accuracy of 100%) and the limit of
sensitivity was 4.0 3 105 erythrocytes/ml due to the high
background found in human serum alone (3.7 � 0.1 3 105
erythrocytes/ml). Second, we measured the concentration of
infected hE (ihE) in samples obtained by 1/2 (vol/vol) tripli-
cate serial dilutions of blood from a P. falciparum-infected
humanized NODscid/b2m-/- mouse with blood from an unin-
fected NODscid/b2m-/- mouse to maximize the unspecific back-
ground due to murine reticulocytes. Since the measurement of
the concentration of cells depends on the concentration of
beads in the tube, we eliminated the uninfected erythrocytes
by establishing a threshold for acquisition in FL1530. This
strategy dramatically diminished the number of events to be
acquired, limiting this number, in practical terms, to the num-
ber of beads per Trucount tubes (Fig. 5B). As shown in Figure
5C, the measurements were linear over the whole range tested
(83.1 3 106 down to 1.6 3 103 ihE/ml, which encompassed a
range of parasitemias from 1.2% down to 0.0018%). The accu-
racy with respect to the theoretical values in the range assayed
was 111% � 7.1% (one sample t test, P 5 0.14 for departure
of the theoretical 100% of accuracy) and the limit of sensitiv-
ity was 7.0 3 102 erythrocytes/ml (background was 0.0006 �0.00005 3 106 erythrocytes/ml). In summary, these data indi-
cated that Trucount tubes can be used in combination with
SYTO-16 and TER-119-PE mAb to accurately measure the
concentration of P. falciparum-infected or uninfected erythro-
cytes in a range of five orders of magnitude while generating
small size listmode files.
DISCUSSION
In this article, we describe a simple, sensitive, and accurate
quantitative method to measure parasitemias in peripheral
Figure 5. Measurement of the concentration of erythrocytes in
HM by TSC. (A) Linearity and accuracy of measurement of con-
centration of hE using TSC. We serially diluted (1/2 vol/vol) blood
from a humanized NODscidb2m-/-mouse infected with P. falciparum(7.0 � 0.2 3 109 erythrocytes/ml) with decomplemented human
serum. The data shown are the mean � SEM of the decimal loga-
rithm of the concentration of hE from triplicate samples for each
dilution tested. (B) Flow cytometry patterns for samples of P. fal-ciparum-infected HM (upper and middle panels) or uninfected HM
(lower panel) mice, following acquisition of all SYTO-165301 and
FL46601 events. SYTO-16530
1 events encompass ihE and back-
ground cells, whereas FL46601 events are beads. (C) Linearity and
accuracy of measurement of the concentration of ihE using TSC.
We serially diluted (1/2 vol/vol) blood from a humanized
NODscidb2m-/- mouse infected with P. falciparum (1.1% parasite-
mia, 7.0 � 0.2 3 109 erythrocytes/ml) with blood from a control
nonchimeric NODscidb2m-/- mouse (8.8 � 0.4 3 109 erythrocytes/
ml). The data shown are the mean � SEM of the decimal loga-
rithm of the concentration of parasitized erythrocytes in blood in
triplicate samples for each dilution tested. All samples were
acquired in a Becton Dickinson LSRII flow cytometer and analyzed
using BD FACSDiva 5.0 software.
Table 1. Comparison of three methods for measurement of the
concentration of erythrocytes in murine blooda
NEUBAUER COULTER TRUCOUNTTM
Experiment 1 7.84 � 0.74 7.71 � 0.44 7.01 � 0.42b
Experiment 2 7.32 � 0.44 8.15 � 0.8b 7.89 � 0.26b
Experiment 3 8.08 � 0.52 8.67 � 0.41b 7.19 � 0.33b
a Concentration of erythrocytes in samples of blood from the
same CD1 mouse in each experiment. Data are the mean erythro-
cytes/ml 3 109 � SEM of 10 replicates for measurements
performed in Coulter AcT.5.Diff or using TrucountTM beads. For
Neubauer counting, four fields containing at least 100 erythro-
cytes were counted.b The difference of the mean compared to Neubauer counting
was significant (P\0.05, one-factor ANOVA, Dunnett’s posttest).
ORIGINAL ARTICLE
232 Bidimensional SYTO-16 in Murine Malaria
blood of mice infected with Plasmodium spp. using SYTO-
16530/SYTO-16585.
Any flow cytometry technique for murine models of
malaria should have adequate specificity, that is, the ability to
discriminate between infected and background erythrocytes in
the range of its intended use. In this respect, the enhanced
specificity of the YOYO-1530/YOYO-1585 method for detection
of parasitemias in mice allowed the unequivocal identification
of parasites in many circumstances in which the previously
described methods had failed (16). Despite the quality of this
technique, it had two major shortcomings. First, it did not
allow a quick determination of parasitemia since a minimum
of 2 h of fixation in glutaraldehyde was required before sample
processing. Second, measuring the concentration of infected
erythrocytes in blood samples was not possible, because of the
extensive manipulation of the blood samples. Therefore,
SYTO-16, a membrane-permeant nucleic acid dye with spec-
tral properties similar to YOYO-1, was tested because of its
potential to maintain the level of specificity achieved with
YOYO-1530/YOYO-1585 while allowing a fast and quantitative
measurement of infected erythrocytes in mice infected with
Plasmodium spp.
Before implementing the SYTO-16530/SYTO-16585 bidi-
mensional method, in which compensation is of critical im-
portance, we determined the concentration of SYTO-16 that
maximized the MFIinfected/MFIuninfected ratio at 530 nm in
samples showing a negligible percentage of uninfected reticu-
locytes (e.g., P. yoelii 48–72 h after i.v. infection with 107 para-
sites). SYTO-16 has been previously used to detect P. falcipa-
rum in vitro (25,26), and P. berghei (26,27) and Theileria
sergenti (28) in mice by measuring its emission around 530 nm
after excitation at 488 nm. The concentrations of dye used by
these authors ranged from 20 nM (26) to 3 lM (27). Unfortu-
nately, no information has been published on the criteria and
the titration curve results in the different conditions of stain-
ing with SYTO-16. Most of the studies used PBS as staining
buffer (26–28) although there seems to be evidence indicating
that phosphate salts may affect the binding of SYTO-16 to
DNA (24). Moreover, there is experimental evidence indicat-
ing that changing the staining buffer and/or the interactions
with other reagents may markedly reduce the MFI after stain-
ing with SYTO-16 (26). Therefore, it is very difficult to com-
pare the concentrations deployed in the aforementioned stu-
dies with the relatively high concentrations that were shown to
be required to maximize the MFIinfected/MFIuninfected ratio. In
summary, it is likely that the wide differences in the concen-
trations of SYTO-16 employed reflect not only different condi-
tions of staining but also different criteria of optimization.
Since SYTO-16 has a quantum yield that is higher than most
nucleic acids dyes, it is not surprising that sufficient resolution
for some uses was also obtained at lower concentrations of
SYTO-16. In fact, in our experimental conditions, the MFIin-
fected/MFIuninfected ratio for SYTO-16 at 0.5 lM (MFIinfected/
MFIuninfected ratio � 100) was actually higher than the highest
ratio obtained for YOYO-1 at 0.25 lM (optimal MFIinfected/
MFIuninfected ratio � 60) (16) and appeared to be very similar
to the resolution described by Huber et al. (27) using 3 lM in
PBS. Regardless of the differences between findings reported
in the present study and those reported by other authors,
SYTO-16 showed a MFIinfected/MFIuninfected that was five times
higher than YOYO-1 (at optimum concentration), hydroethi-
dine or thiazole orange and even higher when compared to
Hoechst, propidium iodide, or acridine orange, according to
data presented by other authors (20,23,28,39–41). This trait of
SYTO-16 was crucial to reproducibly measure very low con-
centrations of parasites (below\0.01%) since the background
signal was minimized.
The detection specificity of the SYTO-16530/SYTO-16585method is dependent on the differential distribution of values
of the bidimensional vector (SYTO-16530, SYTO-16585) for the
populations of uninfected erythrocytes containing residual
nucleic acids and infected erythrocytes containing Plasmodium
spp. Although SYTO-16 is not a DNA-selective dye, its peaks
of absorption (488 or 494 nm bound to DNA or RNA, respec-
tively) and emission (518 and 525 nm, bound to DNA or
RNA, respectively) were slightly shifted to longer wavelengths,
and its quantum yield was significantly lower (0.65 vs. 0.24,
bound to DNA or RNA, respectively) when bound to RNA
(24). Thus, the first component of the vector (SYTO530),
which is close to the emission maximum of SYTO-16, prob-
ably reflects the amount and type of predominant nucleic acid
inside erythrocytes, that is, DNA in infected erythrocytes and
RNA in uninfected reticulocytes. Consequently, as occurred in
one-dimensional methods, SYTO-16530 alone (the first com-
ponent of the bidimensional vector), this component may not
discriminate between infected and uninfected erythrocytes
containing similar amounts of nucleic acids. This discrimina-
tion was achieved by measuring the compensated SYTO-16585component. The relative contribution of SYTO-16 bound to
DNA, RNA, other undefined sources of fluorescence, and
autofluorescence to the emission in FL2585 is not currently
known, but it may differ significantly from YOYO-1. The
SYTO-16530/SYTO-16585 and YOYO-1530/YOYO-1585 methods
were equivalent in terms of measurement of the percentage of
parasitemia in blood from infected mice, but some experimen-
tal evidences indicate that the patterns of staining might be
qualitatively different. First, in contrast with the YOYO-1530/
YOYO-1585 method, the SYTO-16530/SYTO-16585 procedure
does not involve digestion of RNA. It is likely that SYTO-16
bound to RNA may be more relevant in the SYTO-16585 com-
ponent. This would explain why the SYTO-16530/SYTO-16585method did not permit a clear differentiation between infected
reticulocytes and infected normocytes, in contrast with the
pattern of infected erythrocytes observed with YOYO-1530/
YOYO-1585 (16). Consequently, the presence of significant
amounts of RNA in infected erythrocytes may mask detectable
differences in fluorescence between infected reticulocytes and
infected normocytes that are unveiled in YOYO-1530/YOYO-
1585 upon fixation with glutaraldehyde and RNA digestion.
Second, the SYTO-16530/SYTO-16585 procedure does not
require fixation with glutaraldehyde. Even though a short
5-min period of fixation with 0.25% glutaraldehyde may
induce significant autofluorescence in erythrocytes, our results
suggest that autofluorescence does not interfere in the pattern
ORIGINAL ARTICLE
Cytometry Part A � 75A: 225�235, 2009 233
of staining. Therefore, it is likely that the autofluorescence of
uninfected background events may be more important for dis-
crimination between infected and uninfected events in YOYO-
1530/YOYO-1585 than in the SYTO-16530/SYTO-16585 proce-
dure. This might explain why the RNA present in noninfected
erythrocytes could be compensated in FL2585 as the specific
signal in infected erythrocytes in SYTO-16530/SYTO-16585(Fig. 2), whereas the effect of compensation (up to 70%) on
background erythrocytes compared to infected erythrocytes
was negligible in YOYO-1530/YOYO-1585 (16). Third, since the
staining with SYTO-16 was performed using fresh erythro-
cytes, SYTO-16 may accumulate in mitochondria, the parasi-
tophore vacuole, or cytoplasmic structures of parasites, as
found in many eukaryotic cells (24,42). As a whole, the afore-
mentioned characteristics make the interpretation of SYTO-
16530/SYTO-16585 patterns of staining difficult in terms of
unequivocally identifying the different stages of the parasite in
vivo, as has been addressed recently for monitoring P. falcipa-
rum in vitro using Hoechst and thiazole orange (41). A poten-
tial way to overcome staining pattern interpretation problems
might be to test permeable DNA-selective dyes that can be
excited at 488 or at 532 nm (e.g., Vybrant Dye-CycleTM Green
or Orange stains), as has been suggested recently (43). These
reagents emit fluorescence when bound to double-stranded
DNA, and the intensity of emission is proportional to the
amount of DNA in the cell (24). Although a systematic com-
parison using a bidimensional method FL1530/FL2585 is still in
progress, our preliminary results indicate that SYTO-16530/
SYTO-16585 and Vybrant Dye-CycleTM Green530/Vybrant Dye-
CycleTM Green585 produce similar patterns of staining, SYTO-
16 being brighter than Vybrant Dye-Cycle Green while the lat-
ter dye renders lower levels of background.
A number of techniques aimed at simultaneously staining
membrane antigens and intraerythrocytic parasite’s nucleic
acids have been described. All of them were intended to char-
acterize specific subpopulations of infected erythrocytes (44–
46) or detect antibodies against membrane antigens found on
the surface of infected erythrocytes (47,48). In addition to this
approach, the present study demonstrates that mAb targeted
against erythrocytic populations responsible for background
signals can be used to significantly enhance the specificity and
sensitivity of cytometric measurements. This strategy seemed
more reliable than trying to select the target population (e.g.
P. falciparum-infected erythrocytes) using antibodies against
human glycophorin A, since this is a high-density antigen that
might cause artefacts due to agglutination of erythrocytes
(35), thereby reducing the quality of measurements of ihE in
HM at very low parasitemias. The sensitivity achieved using
TSC in HM was remarkable (�0.001%). Previously, the most
sensitive procedures for detection of parasites in peripheral
blood had required the lysis of erythrocytes and detection of
released parasites (22,49). With these procedures, the sensitiv-
ity in human samples was 0.005% and significantly lower (49),
or even unacceptably unspecific (22), in rodent malaria mod-
els. Compared with these methods, TSC does not require sam-
ple lysis, employs smaller quantities of blood [2 ll vs. 50 ll(49) or 25 ll (22), respectively] and gives accurate values of
concentration of ihE over the entire range tested. The main
disadvantage is the relatively long time of acquisition per sam-
ple required to achieve maximum sensitivity. Indeed, our
results suggest that there is still room for improvement in TSC
procedure, since platelets are a major source of background in
mice at very low parasitemias. Thus, mAbs against murine pla-
telets could be employed to enhance the sensitivity and speci-
ficity of measurements in expensive PK/PD studies in P. falcip-
arum HM models.
The technique described in the present article does not
require complex sample processing. As there are no changes in
sample volume, the measurement of the actual concentrations
of erythrocytes in blood was possible. The use of Trucount
tubes was strongly advocated because of its demonstrated
reliability in clinical practice to measure the concentration of
leukocytes (36), red cell vesicles in thalassemic patients (37),
and particularly, platelets or residual cells in plasma products
(38). However, given the relatively high cost of these tubes,
other approaches could be validated for each particular analyt-
ical purpose. Therefore, methods based on the stability of the
flow rate of bench cytometers (50) or, preferably, with stand-
ards prepared with biotin-labeled erythrocytes (51), might
provide cheaper alternatives.
Murine models of malaria may become key tools to
understand the in vivo PK/PD relationships that govern the
therapeutic efficacy of antimalarials (52). These studies
demand accurate quantitative measurements of parasite con-
centration over wide ranges of parasitemia (7,52) and, as in
the case of P. falciparum HM models, the capacity to resolve
complex cellular dynamics. The TER-119-PE/SYTO-16530–585technique described here was developed to measure ihE with
high specificity and sensitivity in HM used in PK/PD studies
of antimalarial therapeutic efficacy. This procedure provided in-
formation on the hematological status of HM (e.g. erythrocyte
concentration and degree of engraftment with hE), significantly
improved the specificity of detection of P. falciparum-ihE over
SYTO-16530/SYTO-16585 alone and enabled us to accurately
measure the concentration of ihE in blood over the entire
range of detection (five orders of magnitude). Moreover, this
technique can be modified to measure the reticulocytosis and
the degree of anemia induced by different strains of rodent
Plasmodium spp. in immunocompetent mice using anti-
mouse CD71 mAb instead of TER-119 (data not shown).
Hence, it may become a useful tool in any experimental design
in murine models of malaria requiring quantitative assessment
of erythrocytic subpopulations.
ACKNOWLEDGMENTS
This work was supported in part by Medicines for
Malaria Venture (Geneva, Switzerland) through GSK-Diseases
of the Developing World/MMV agreement. We acknowledge
the support of Antonio Martınez and all the staff at Labora-
tory Animal Science Department in GlaxoSmithKline-Diseases
of the Developing World in Tres Cantos (Spain) for providing
and maintaining the mice used in this study. The authors are
also indebted to Elena Jimenez and the staff from Experimen-
tal Pharmacophysiology at GSK DDW-Biology for their con-
ORIGINAL ARTICLE
234 Bidimensional SYTO-16 in Murine Malaria
tribution counting blood samples with the electronic hemo-
cytometer Coulter AcT.5.Diff. The authors are indebted to Jo-
seph J. Campo (CRESIB, Barcelona, Spain) for critical review
of the manuscript. The authors are also grateful to Nick
Guthrie for the thorough review of the English grammar and
syntax of the manuscript.
LITERATURE CITED
1. Ridley RG. Medical need, scientific opportunity and the drive for antimalarial drugs.Nature 2002;415:686–693.
2. Landau I, Gautret P. Animal models: Rodents. In: Sherman IW, editor. Malaria: Para-site Biology, Pathogenesis and Protection. Washington, DC: ASM Press; 1998. pp401–417.
3. Fidock DA, Rosenthal PJ, Croft SL, Brun R, Nwaka S. Antimalarial drug discovery:Efficacy models for compound screening. Nat Rev Drug Discov 2004;3:509–520.
4. Moreno A, Badell E, Van Rooijen N, Druilhe P. Human malaria in immunocompro-mised mice: New in vivo model for chemotherapy studies. Antimicrob Agents Che-mother 2001;45:1847–1853.
5. Moreno A, Ferrer E, Arahuetes S, Eguiluz C, Rooijen NV, Benito A. The course ofinfections and pathology in immunomodulated NOD/LtSz-SCID mice inoculatedwith Plasmodium falciparum laboratory lines and clinical isolates. Int J Parasitol2006;36:361–369.
6. Angulo-Barturen I, Jimenez-Dıaz MB, Mulet T, Rullas J, Herreros E, Ferrer S, JimenezE, Mendoza A, Regadera J, Rosenthal PJ, Bathurst I, Pompliano DL, Gomez de lasHeras F, Gargallo-Viola D. A murine model of falciparum-malaria by in vivo selectionof competent strains in non-myelodepleted mice engrafted with human erythrocytes.PLoS ONE 2008;3:e2252.
7. White NJ. Assessment of the pharmacodynamic properties of antimalarial drugsin vivo. Antimicrob Agents Chemother 1997;41:1413–1422.
8. Edwards G, Krishna S. Pharmacokinetic and pharmacodynamic issues in the treat-ment of parasitic infections. Eur J Clin Microbiol Infect Dis 2004;23:233–242.
9. Bianco AE, Battye FL, Brown GV. Plasmodium falciparum: Rapid quantification ofparasitemia in fixed malaria cultures by flow cytometry. Exp Parasitol 1986;62:275–282.
10. Makler MT, Lee LG, Recktenwald D. Thiazole orange: A new dye for Plasmodium spe-cies analysis. Cytometry 1987;8:568–570.
11. Whaun JM, Rittershaus C, Ip SH. Rapid identification and detection of parasitizedhuman red cells by automated flow cytometry. Cytometry 1983;4:117–122.
12. Kadjoian V, Gasquet M, Delmas F, Guiraud H, De Meo M, Laget M, Timon-David P.Flow cytometry to evaluate the parasitemia of Plasmodium falciparum. J Pharm Belg1992;47:499–503.
13. van der Heyde HC, Elloso MM, vande Waa J, Schell K, Weidanz WP. Use of hydro-ethidine and flow cytometry to assess the effects of leukocytes on the malarial parasitePlasmodium falciparum. Clin Diagn Lab Immunol 1995;2:417–425.
14. Barkan D, Ginsburg H, Golenser J. Optimisation of flow cytometric measurement ofparasitaemia in Plasmodium-infected mice. Int J Parasitol 2000;30:649–653.
15. Torous D, Asano N, Tometsko C, Sugunan S, Dertinger S, Morita T, Hayashi M. Per-formance of flow cytometric analysis for the micronucleus assay-a reconstructionmodel using serial dilutions of malaria-infected cells with normal mouse peripheralblood. Mutagenesis 2006;21:11–13.
16. Jimenez-Dıaz MB, Rullas J, Mulet T, Fernandez L, Bravo C, Gargallo-Viola D,Angulo-Barturen I. Improvement of detection specificity of Plasmodium-infectedmurine erythrocytes by flow cytometry using autofluorescence and YOYO-1. Cyto-metry Part A 2005;67A:27–36.
17. Janse CJ, van Vianen PH, Tanke HJ, Mons B, Ponnudurai T, Overdulve JP. Plasmo-dium species: Flow cytometry and microfluorometry assessments of DNA contentand synthesis. Exp Parasitol 1987;64:88–94.
18. Franklin RM, Brun R, Grieder A. Microscopic and flow cytophotometric analysis ofparasitemia in cultures of Plasmodium falciparum vitally stained with Hoechst 33342-application to studies of antimalarial agents. Z Parasitenkd 1986;72:201–212.
19. Jacobberger JW, Horan PK, Hare JD. Cell cycle analysis of asexual stages of erythrocy-tic malaria parasites. Cell Prolif 1992;25:431–445.
20. Jouin H, Daher W, Khalife J, Ricard I, Puijalon OM, Capron M, Dive D. Double stain-ing of Plasmodium falciparum nucleic acids with hydroethidine and thiazole orangefor cell cycle stage analysis by flow cytometry. Cytometry Part A 2004;57A:34–38.
21. Shapiro HM. Practical Flow Cytometry. Hoboken: Wiley; 2003. 681 pp.
22. Saito-Ito A, Akai Y, He S, Kimura M, Kawabata M. A rapid, simple and sensitive flowcytometric system for detection of Plasmodium falciparum. Parasitol Int2001;50:249–257.
23. Bhakdi SC, Sratongno P, Chimma P, Rungruang T, Chuncharunee A, Neumann HP,Malasit P, Pattanapanyasat K. Re-evaluating acridine orange for rapid flow cytometricenumeration of parasitemia in malaria-infected rodents. Cytometry Part A2007;71A:662–667.
24. Haughland RP. The Handbook. A Guide to Fluorescent Probes and Labeling Technol-ogies, 10th ed. Eugene: Molecular Probes; 2005. 1126 pp. Available at: http://probes.invitrogen.com/handbook/.
25. Dahl EL, Rosenthal PJ. Multiple antibiotics exert delayed effects against the Plasmo-dium falciparum apicoplast. Antimicrob Agents Chemother 2007;51:3485–3490.
26. Koka S, Foller M, Lamprecht G, Boini KM, Lang C, Huber SM, Lang F. Iron defi-ciency influences the course of malaria in Plasmodium berghei infected mice. BiochemBiophys Res Commun 2007;357:608–614.
27. Huber SM, Duranton C, Henke G, Van De Sand C, Heussler V, Shumilina E, SanduCD, Tanneur V, Brand V, Kasinathan RS et al. Plasmodium induces swelling-activatedClC-2 anion channels in the host erythrocyte. J Biol Chem 2004;279:41444–41452.
28. Yagi Y, Shiono H, Kurabayashi N, Yoshihara K, Chikayama Y. Flow cytometry to eval-uate Theileria sergenti parasitemia using the fluorescent nucleic acid stain, SYTO16.Cytometry 2000;41:223–225.
29. Sanni LA, Fonseca LF, Langhorne J. Mouse models for erythrocytic-stage malaria. In:Doolan DL, editor.Malaria Methods and Protocols, Vol.72: Methods in MolecularMedicine. Totowa: Humana Press; 2002. pp 57–76.
30. Klotz FW, Chulay JD, Daniel W, Miller LH. Invasion of mouse erythrocytes by thehuman malaria parasite, Plasmodium falciparum. J Exp Med 1987;165:1713–1718.
31. Li Q, Gerena L, Xie L, Zhang J, Kyle D, Milhous W. Development and validation offlow cytometric measurement for parasitemia in cultures of P. falciparum vitallystained with YOYO-1. Cytometry Par A 2007;71A:297–307.
32. Xie L, Li Q, Johnson J, Zhang J, Milhous W, Kyle D. Development and validation offlow cytometric measurement for parasitaemia using autofluorescence and YOYO-1in rodent malaria. Parasitology 2007;134:1151–1162.
33. Vigario AM, Belnoue E, Cumano A, Marussig M, Miltgen F, Landau I, Mazier D,Gresser I, Renia L. Inhibition of Plasmodium yoelii blood-stage malaria by interferonthrough the inhibition of the production of its target cell, the reticulocyte. Blood2001;97:3966–3971.
34. Kina T, Ikuta K, Takayama E, Wada K, Majumdar AS, Weissman IL, Katsura Y. Themonoclonal antibody TER-119 recognizes a molecule associated with glycophorin Aand specifically marks the late stages of murine erythroid lineage. Br J Haematol2000;109:280–287.
35. Riquelme BD, de Isla NG, Valverde JR, Stoltz JF. A simple method for quantifyinghigh density antigens in erythrocyte membrane by flow cytometry. J Biochem Bio-phys Methods 2006;68:31–42.
36. Nicholson JK, Stein D, Mui T, Mack R, Hubbard M, Denny T. Evaluation of a methodfor counting absolute numbers of cells with a flow cytometer. Clin Diagn Lab Immu-nol 1997;4:309–313.
37. Pattanapanyasat K, Noulsri E, Fucharoen S, Lerdwana S, Lamchiagdhase P, Siritanar-atkul N, Webster HK. Flow cytometric quantitation of red blood cell vesicles in tha-lassemia. Cytometry Part B 2004;57B:23–31.
38. Pichler J, Printz D, Scharner D, Trbojevic D, Siekmann J, Fritsch G. Improved flowcytometric method to enumerate residual cells: Minimal linear detection limits forplatelets, erythrocytes, and leukocytes. Cytometry 2002;50:231–237.
39. Janse CJ, Haghparast A, Speranca MA, Ramesar J, Kroeze H, del Portillo HA, WatersAP. Malaria parasites lacking eef1a have a normal S/M phase yet grow more slowlydue to a longer G1 phase. Mol Microbiol 2003;50:1539–1551.
40. Pattanapanyasat K, Thaithong S, Kyle DE, Udomsangpetch R, Yongvanitchit K, HiderRC, Webster HK. Flow cytometric assessment of hydroxypyridinone iron chelatorson in vitro growth of drug-resistant malaria. Cytometry 1997;27:84–91.
41. Grimberg BT, Erickson JJ, Sramkoski RM, Jacobberger JW, Zimmerman PA. Moni-toring Plasmodium falciparum growth and development by UV flow cytometry usingan optimized Hoechst-thiazole orange staining strategy. Cytometry Part A2008;73A:546–554.
42. Wlodkowic D, Skommer J, Pelkonen J. Towards an understanding of apoptosis detec-tion by SYTO dyes. Cytometry Part A 2007;71A:61–72.
43. Shapiro HM, Mandy F. Cytometry in malaria: Moving beyond giemsa. CytometryPart A 2007;71A:643–645.
44. Jouin H, Goguet de la Salmoniere YO, Behr C, Huyin Qan Dat M, Michel JC, SarthouJL, Pereira da Silva L, Dubois P. Flow cytometry detection of surface antigens onfresh, unfixed red blood cells infected by Plasmodium falciparum. J Immunol Meth-ods 1995;179:1–12.
45. Pattanapanyasat K, Walsh DS, Yongvanitchit K, Piyawatthanasakul N, Wanachiwana-win W, Webster HK. Robust in vitro replication of Plasmodium falciparum in glyco-syl-phosphatidylinositol-anchored membrane glycoprotein-deficient red blood cells.Am J Trop Med Hyg 2003;69:360–365.
46. Pattanapanyasat K, Webster HK, Udomsangpetch R, Wanachiwanawin W, Yongva-nitchit K. Flow cytometric two-color staining technique for simultaneous determina-tion of human erythrocyte membrane antigen and intracellular malarial DNA. Cyto-metry 1992;13:182–187.
47. Drame I, Diouf B, Spiegel A, Garraud O, Perraut R. Flow cytometric analysis of IgGreactive to parasitized red blood cell membrane antigens in Plasmodium falciparum-immune individuals. Acta Trop 1999;73:175–181.
48. Staalsoe T, Giha HA, Dodoo D, Theander TG, Hviid L. Detection of antibodies tovariant antigens on Plasmodium falciparum-infected erythrocytes by flow cytometry.Cytometry 1999;35:329–336.
49. van Vianen PH, van Engen A, Thaithong S, van der Keur M, Tanke HJ, van der KaayHJ, Mons B, Janse CJ. Flow cytometric screening of blood samples for malaria para-sites. Cytometry 1993;14:276–280.
50. Storie I, Sawle A, Goodfellow K, Whitby L, Granger V, Reilly JT, Barnett D. Flow ratecalibration. I. A novel approach for performing absolute cell counts. Cytometry PartB 2003;55B:1–7.
51. Mock DM, Lankford GL, Widness JA, Burmeister LF, Kahn D, Strauss RG. Measure-ment of circulating red cell volume using biotin-labeled red cells: Validation against51Cr-labeled red cells. Transfusion 1999;39:149–155.
52. Gibbons PL, Batty KT, Barrett PH, Davis TM, Ilett KF. Development of a pharmaco-dynamic model of murine malaria and antimalarial treatment with dihydroartemisi-nin. Int J Parasitol 2007;37:1569–1576.
ORIGINAL ARTICLE
Cytometry Part A � 75A: 225�235, 2009 235
Copyright © 2022 FDOKUMEN