Controlling the dynamics of a bidimensional gel above and below its percolation transition
Upload
independentCategory
view
0download
0
Characterization and Electrochemical Properties of Li2Cu0.5Ni0.4M0.1O2 Lithium-ion Battery Cathodes
C.T. Love, M.D. Johannes, A.M. Stux, and K.E. Swider-Lyons
U.S. Naval Research Laboratory, Washington, D.C. 20375, USA
Doped lithium copper-nickel mixed-metal oxides are prepared and studied as cathode materials for secondary Li-ion batteries. The compounds, Li2Cu0.5Ni0.4M0.1O2 (where M = Al, Ga), are made using solid state and micro-emulsion synthesis techniques. All compounds have a body-centered orthorhombic (Immm) crystal structure. The undoped compound has an initial discharge capacity of 270 mAh/g but exhibits poor capacity retention with cycling. The Al- and Ga-doped compounds made by solid-state synthesis have a higher discharge capacity than those made by micro-emulsion. Micro-emulsion processed compounds exhibit better cycleability and capacity retention upon charge/discharge suggesting a more stable crystal structure. Gallium doping improved the structural stability resulting in lowered irreversible capacity loss. Two reversible reaction mechanisms, lithium intercalation/de-intercalation and a displacement reaction are suggested to occur in the Li2Cu0.5Ni0.4M0.1O2 system.
Introduction
Increasing the specific energy density of a cathode can improve the ability of the Li-ion cell to provide power over sustained time intervals between recharges. The specific energy of Li-intercalation materials may be improved by: (a) increasing the molar equivalent of lithium delivered per unit formula of cathode material, (b) retaining the structural integrity throughout charge/discharge cycling, and (c) increasing the voltage of operation (1). One example of a high capacity Li-ion material was obtained by the over-lithiation of a layered structure of LiNiO2 (1 Li-ion per unit cell) to form body-centered orthorhombic (Immm) Li2NiO2 (2 Li-ion per unit cell) was first obtained by Dahn et. al. (2). The discharge capacity and stability of Li2NiO2 cathode materials was studied by Kang et. al. (3). Their work showed an initial capacity of nearly 240 mAh/g upon the first discharge cycle, which is a two-fold improvement over that of the layered structure. However, they suggested upon extraction of Li ions, the Immm structure was probably not retained (3). A solid solution approach to prepare isostructural Li2CuO2, was performed by Imanishi et. al. (4). The substitution of copper atoms for nickel was shown to improve the reversibility of charge/discharge cycles and increase the 1st discharge specific capacity to approximately 320 mAh/g where the molar ratio of copper to nickel was near 1:1 (4). Li2CuO2 is an air-stable intercalation compound (5) and was also shown to enhance specific capacity as an additive to other Li-intercalation materials by Vitins et. al. (6). This paper presents experimental results on the Li2Cu0.5Ni0.4M0.1O2 system where M is a transition metal dopant, Al or Ga. X-ray diffraction was used to observe the effect of the doping element and molar composition on the initial crystal structure before charge/discharge cycling. Physical and electrochemical characterization techniques were performed to verify theoretical calculations.
ECS Transactions, 16 (29) 27-35 (2009)10.1149/1.3115305 © The Electrochemical Society
27 ) unless CC License in place (see abstract). ecsdl.org/site/terms_use address. Redistribution subject to ECS terms of use (see 132.250.22.6Downloaded on 2014-12-05 to IP
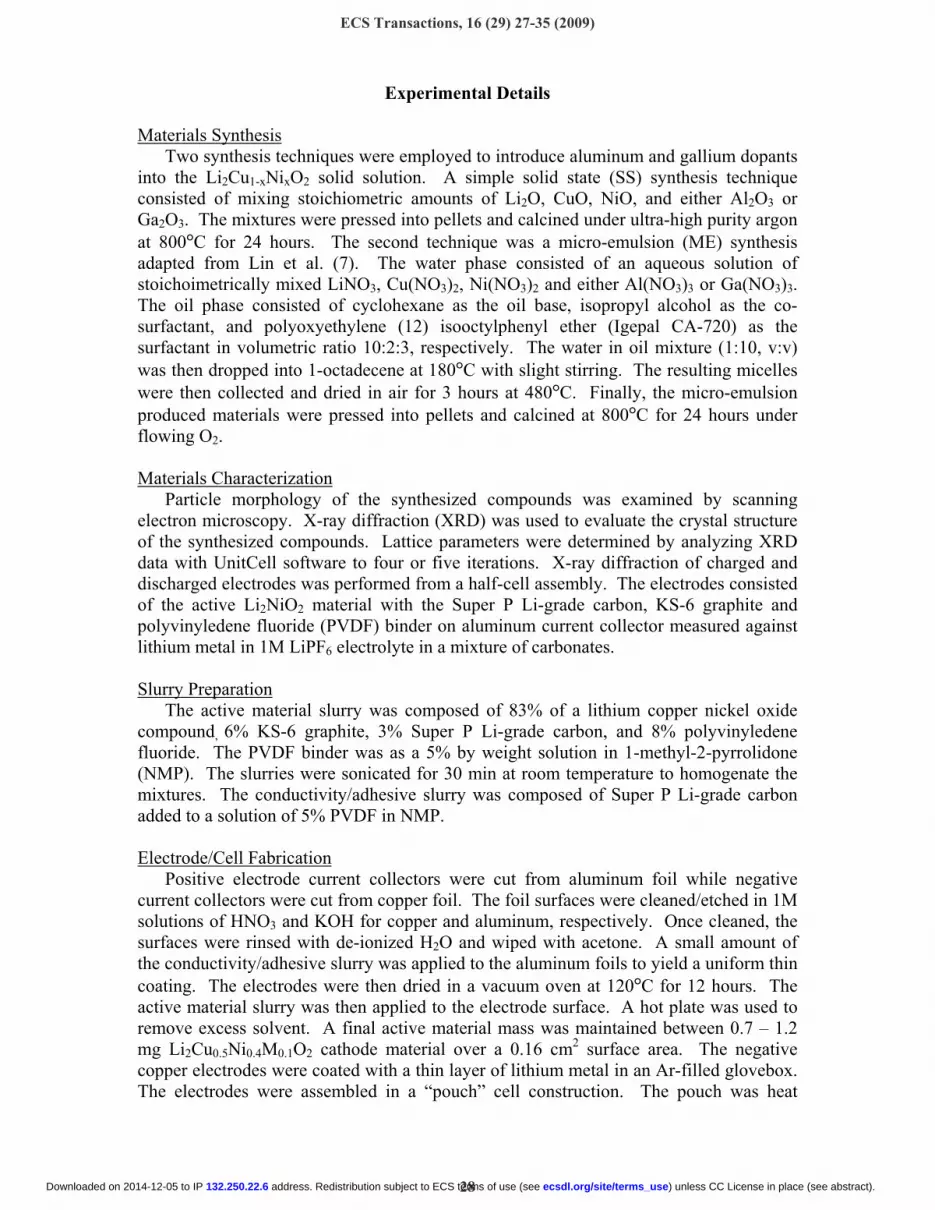
Experimental Details Materials Synthesis
Two synthesis techniques were employed to introduce aluminum and gallium dopants into the Li2Cu1-xNixO2 solid solution. A simple solid state (SS) synthesis technique consisted of mixing stoichiometric amounts of Li2O, CuO, NiO, and either Al2O3 or Ga2O3. The mixtures were pressed into pellets and calcined under ultra-high purity argon at 800°C for 24 hours. The second technique was a micro-emulsion (ME) synthesis adapted from Lin et al. (7). The water phase consisted of an aqueous solution of stoichoimetrically mixed LiNO3, Cu(NO3)2, Ni(NO3)2 and either Al(NO3)3 or Ga(NO3)3. The oil phase consisted of cyclohexane as the oil base, isopropyl alcohol as the co-surfactant, and polyoxyethylene (12) isooctylphenyl ether (Igepal CA-720) as the surfactant in volumetric ratio 10:2:3, respectively. The water in oil mixture (1:10, v:v) was then dropped into 1-octadecene at 180°C with slight stirring. The resulting micelles were then collected and dried in air for 3 hours at 480°C. Finally, the micro-emulsion produced materials were pressed into pellets and calcined at 800°C for 24 hours under flowing O2. Materials Characterization
Particle morphology of the synthesized compounds was examined by scanning electron microscopy. X-ray diffraction (XRD) was used to evaluate the crystal structure of the synthesized compounds. Lattice parameters were determined by analyzing XRD data with UnitCell software to four or five iterations. X-ray diffraction of charged and discharged electrodes was performed from a half-cell assembly. The electrodes consisted of the active Li2NiO2 material with the Super P Li-grade carbon, KS-6 graphite and polyvinyledene fluoride (PVDF) binder on aluminum current collector measured against lithium metal in 1M LiPF6 electrolyte in a mixture of carbonates. Slurry Preparation
The active material slurry was composed of 83% of a lithium copper nickel oxide compound, 6% KS-6 graphite, 3% Super P Li-grade carbon, and 8% polyvinyledene fluoride. The PVDF binder was as a 5% by weight solution in 1-methyl-2-pyrrolidone (NMP). The slurries were sonicated for 30 min at room temperature to homogenate the mixtures. The conductivity/adhesive slurry was composed of Super P Li-grade carbon added to a solution of 5% PVDF in NMP. Electrode/Cell Fabrication
Positive electrode current collectors were cut from aluminum foil while negative current collectors were cut from copper foil. The foil surfaces were cleaned/etched in 1M solutions of HNO3 and KOH for copper and aluminum, respectively. Once cleaned, the surfaces were rinsed with de-ionized H2O and wiped with acetone. A small amount of the conductivity/adhesive slurry was applied to the aluminum foils to yield a uniform thin coating. The electrodes were then dried in a vacuum oven at 120°C for 12 hours. The active material slurry was then applied to the electrode surface. A hot plate was used to remove excess solvent. A final active material mass was maintained between 0.7 – 1.2 mg Li2Cu0.5Ni0.4M0.1O2 cathode material over a 0.16 cm2 surface area. The negative copper electrodes were coated with a thin layer of lithium metal in an Ar-filled glovebox. The electrodes were assembled in a “pouch” cell construction. The pouch was heat
ECS Transactions, 16 (29) 27-35 (2009)
28 ) unless CC License in place (see abstract). ecsdl.org/site/terms_use address. Redistribution subject to ECS terms of use (see 132.250.22.6Downloaded on 2014-12-05 to IP

sealed with a Celgard porous polymer membrane pre-wet with 1M LiPF6 electrolyte (in a mixture of carbonates) and used to separate the positive and negative electrodes. Electrochemical Characterization
Electrochemical testing was conducted using a battery tester (Maccor 2300) over a voltage range of 2.0 to 4.2 V vs. lithium metal anode. Cells were discharged at 26 mA/g constant current, approximately 0.17 – 0.22 mA/cm2. The capacity in unit mAh/g was recorded against voltage vs. Li/Li+ for 10 charge/discharge cycles.
Results and Discussion
The morphology of the synthesized particles is shown in the SEM micrographs in Figure 1. The solid state synthesis of the Al- and Ga-doped compounds yielded rounded 5 to 10 µm crystalline particles in larger agglomerates. These agglomerates were covered with a small amount of “debris” most likely unreacted NiO. The micro-emulsion technique yielded smaller jagged crystalline particles 2-5 µm in diameter; however, there exists one significantly large particle in each of the Al- and Ga-doped samples.
Figure 1. Scanning electron micrographs of: (a) Li2Cu0.5Ni0.4Al0.1O2 prepared via solid state synthesis, (b) Li2Cu0.5Ni0.4Ga0.1O2 prepared via solid state synthesis, (c) Li2Cu0.5Ni0.4Al0.1O2 prepared via micro-emulsion, and (d) Li2Cu0.5Ni0.4Ga0.1O2 prepared via micro-emulsion.
The XRD patterns (Figure 2) are indexed according to a body-centered orthorhombic Immm structure. In this structure, copper and nickel atoms are the centers of planar oxygen squares while lithium atoms occupy tetrahedral sites within the cell. The strongest reflections occur at the (002) and (101) planes for all compounds. Sharper more well-defined peaks are observed in samples prepared via micro-emulsion. NiO
(a) (b)
(d)(c)
2µm
2µm 2µm
2µm
ECS Transactions, 16 (29) 27-35 (2009)
29 ) unless CC License in place (see abstract). ecsdl.org/site/terms_use address. Redistribution subject to ECS terms of use (see 132.250.22.6Downloaded on 2014-12-05 to IP

diffraction peaks also exist in the solid state prepared compounds due to unreacted NiO as observed in the electron micrographs. The lattice spacings of all compounds are listed in Table I. No significant changes were observed in the a-direction with the introduction of aluminum and gallium dopants in either solid state or micro-emulsion synthesized materials. Subtle positive strain is observed in the b-direction, especially in the case of the micro-emulsion prepared samples. The unit cells undergo significant positive strain in the c-direction with the introduction of aluminum and gallium dopants. This direction is the distance between the ab-type planes which are occupied by the copper and nickel oxygen squares. The total unit cell volume for the undoped and doped compounds is also given in Table I. There is a clear increase in cell volume with the introduction of dopants as described earlier with strain in the b- and c-directions. Additionally, the synthesis technique used to prepare the compound also caused an increase in unit cell volume. Micro-emulsion prepared compounds have greater unit cell volume which could indicate a larger percentage of the dopant being inserted within the unit cell.
Figure 2. XRD spectra for doped and undoped compounds. SS indicates prepared via solid state processing while ME indicates micro-emulsion.
TABLE I. Lattice Parameters ( ± 0.001 Å) and Unit Cell Volume Compound Synthesis Technique a (Å) b (Å) c (Å) Volume (Å3) Li2Cu0.6Ni0.4O2 SS 3.68 2.83 9.29 96.7 ± 0.018 Li2Cu0.5Ni0.4Al0.1O2 SS 3.67 2.85 9.33 97.6 ± 0.018 Li2Cu0.5Ni0.4Ga0.1O2 SS 3.68 2.84 9.31 97.3 ± 0.023 Li2Cu0.5Ni0.4Al0.1O2 ME 3.66 2.86 9.40 98.4 ± 0.014 Li2Cu0.5Ni0.4Ga0.1O2 ME 3.66 2.86 9.38 98.2 ± 0.013
The charge/discharge behavior of aluminum doped compounds is given in Figure 3.
An initial flat charge plateau is present in both the SS and ME prepared compounds, although it is more pronounced in the SS compound. The voltage of this initial charge
Li2Cu0.5Ni0.4Ga0.1O2 ME
Li2Cu0.5Ni0.4Ga0.1O2 SS
Li2Cu0.5Ni0.4Al0.1O2 ME
Li2Cu0.5Ni0.4Al0.1O2 SS
Li2Cu0.6Ni0.4O2
ECS Transactions, 16 (29) 27-35 (2009)
30 ) unless CC License in place (see abstract). ecsdl.org/site/terms_use address. Redistribution subject to ECS terms of use (see 132.250.22.6Downloaded on 2014-12-05 to IP

plateau is approximately 3.38 V and 3.50 V for SS and ME, respectively. A flat initial discharge plateau is observed in the SS aluminum doped sample near 2.85 V giving a final capacity of 161 mAh/g (Figure 3(a)). After cycling these initial plateaus are no longer observed in either compound and the capacity decreases significantly to 125-100 mAh/g. The subsequent charge plateaus occur near 3.15 V for cycles 2-10, while the discharge plateau becomes less evident and decreases in voltage to approximately 2.70 V. For the ME prepared aluminum doped compound, several charge plateaus exist indicating multiple reactions in the structure as lithium is removed from the electrode material at 3.05 V and 3.25 V (Figure 3(b)). These features in the discharge profile exist in all cycles 2-10 suggesting some stability is achieved through retention of crystal structure. On initial discharge, the capacity of this compound is approximately 31% lower, 111 mAh/g. However, the coulombic efficiency is higher for this compound, again suggesting a more stable structure during cycling. A review of the capacity and efficiency data for all compounds is given in Table II.
(a)
(b)
Figure 3. Charge/discharge behavior for Li2Cu0.5Ni0.4Al0.1O2 prepared by: (a) solid state synthesis and (b) micro-emulsion synthesis.
ECS Transactions, 16 (29) 27-35 (2009)
31 ) unless CC License in place (see abstract). ecsdl.org/site/terms_use address. Redistribution subject to ECS terms of use (see 132.250.22.6Downloaded on 2014-12-05 to IP
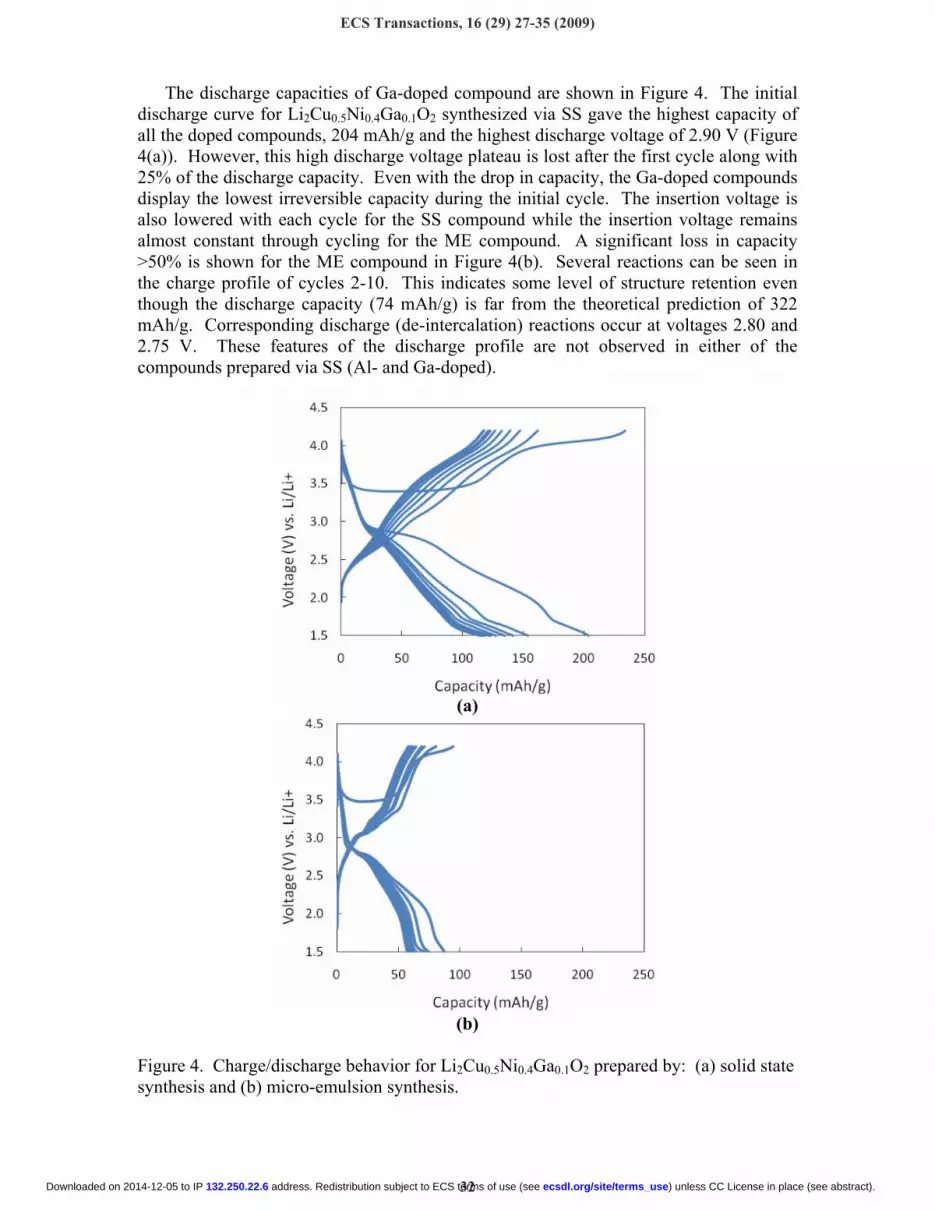
The discharge capacities of Ga-doped compound are shown in Figure 4. The initial discharge curve for Li2Cu0.5Ni0.4Ga0.1O2 synthesized via SS gave the highest capacity of all the doped compounds, 204 mAh/g and the highest discharge voltage of 2.90 V (Figure 4(a)). However, this high discharge voltage plateau is lost after the first cycle along with 25% of the discharge capacity. Even with the drop in capacity, the Ga-doped compounds display the lowest irreversible capacity during the initial cycle. The insertion voltage is also lowered with each cycle for the SS compound while the insertion voltage remains almost constant through cycling for the ME compound. A significant loss in capacity >50% is shown for the ME compound in Figure 4(b). Several reactions can be seen in the charge profile of cycles 2-10. This indicates some level of structure retention even though the discharge capacity (74 mAh/g) is far from the theoretical prediction of 322 mAh/g. Corresponding discharge (de-intercalation) reactions occur at voltages 2.80 and 2.75 V. These features of the discharge profile are not observed in either of the compounds prepared via SS (Al- and Ga-doped).
(a)
(b)
Figure 4. Charge/discharge behavior for Li2Cu0.5Ni0.4Ga0.1O2 prepared by: (a) solid state synthesis and (b) micro-emulsion synthesis.
ECS Transactions, 16 (29) 27-35 (2009)
32 ) unless CC License in place (see abstract). ecsdl.org/site/terms_use address. Redistribution subject to ECS terms of use (see 132.250.22.6Downloaded on 2014-12-05 to IP

TABLE II. Capacity and Colombic Efficiency of Li2Cu0.5Ni0.4M0.1O2 Compounds Li2Cu0.5Ni0.4M0.1O2 Properties Host Al (SS) Al (ME) Ga (SS) Ga (ME)
1st Charge Capacity (mAh/g) 320 188 138 234 94
1st Discharge Capacity (mAh/g) 270 161 111 204 87 Irreversible Capacity (%) 15.6 14.7 19.6 12.8 7.4 Discharge Capacity @ 10th cycle (mAh/g) 74 100 75 114 57 Capacity Loss @ 10th cycle 90 38 32 44 34 Columbic Efficiency @ 10th cycle (%) 97.1 98.2 99.3 97.4 99.2 Li content (1st charge) 1.28 0.73 0.53 0.94 0.38 Li content (1st discharge) 1.08 0.62 0.43 0.82 0.35
The discharge profiles for Al-doped ME and Ga-doped SS and ME compounds
showed a quick increase in cell voltage from the open circuit potential around 3.0V to nearly 4.0 V. This behavior has been observed elsewhere for Li2CuO2 and is attributed to the nucleation of a secondary LiCuO2 phase (6). After further analysis of the discharge profiles in Figures 3 and 4 it appears that intercalation/de-intercalation of Li-ions (topotactic reaction) within the unit cell may not be the primary reaction mechanism. On the contrary, a reversible displacement or conversion reaction may take place in which the lithiated metal oxide is consume by Li and reduced to metal (8). Several nontopotactic transitions were observed in isostructural Li2CuO2 when cycled (6). Similarly, biphasic behavior was observed along the electrochemical charge/discharge plateaus for Li2CuO2 vs. Li metal (5). This reaction has been described elsewhere (9, 10) for metal oxide nanoparticles and can be described for the compounds studied in this work as follows:
MO + 2Li ↔ Li2O + M [1] where M = Cu or Ni. A displacement reaction may contribute to the large percentage of discharge capacity observed at lower voltages in compounds containing a significant amount of unreacted NiO, such that NiO could become electrochemically lithiated during the initial discharge cycle.
To determine the contribution of displacement reactions to the measured capacity, XRD is taken for Li2NiO2 compound before and after the 1st charge/discharge (Figure 5). There is a large amount of unreacted NiO in the initial “as prepared” compound. This unreacted NiO remains after the 1st charge (de-intercalation) while most of the lithiated species, Li2NiO2, is removed as indicated by the loss or at least significant reduction in peak intensity. Once the compound is discharged, lithium ions return to the structure as evident by the Li2NiO2 peaks, thus giving evidence for intercalation/de-intercalation. This is not to say that intercalation/de-intercalation is the only mechanism at work in the Li2Cu0.5Ni0.4M0.1O2 system. It is simply an indication that some degree of capacity is due to the storage and expulsion of Li within the orthorhombic unit cell. Displacement reactions are often difficult to measure because the products are amorphous. They cannot be ruled out as contributors to the capacity of these materials.
ECS Transactions, 16 (29) 27-35 (2009)
33 ) unless CC License in place (see abstract). ecsdl.org/site/terms_use address. Redistribution subject to ECS terms of use (see 132.250.22.6Downloaded on 2014-12-05 to IP

25 35 45 55 65 75 85
Inte
nsity
/ a.
u.
2θ / degree
after 1st discharge
after 1st charge
as prepared
Figure 5. XRD of Li2NiO2 compound as prepared, after 1st initial charge cycle, and after 1st discharge cycle. All spectra contain the active cathode material, Li2NiO2, with Super P Li-grade carbon, KS-6 graphite and PVDF binder. Key: * denotes NiO; ∆ denotes Li2NiO2.
Conclusion
Single phase body centered orthorhombic (Immm) Li2Cu0.5Ni0.5M0.1O2 compounds
were synthesized with aluminum and gallium doping using solid state and micro-emulsion synthesis techniques. Significant increases in unit cell volume and the lack of unreacted material in electron micrographs and XRD spectra suggest the micro-emulsion technique was more successful for the introduction of aluminum and gallium into the orthorhombic structure. The solid state processed materials gave higher discharge capacity than the micro-emulsion for Al- and Ga-doped compounds. Micro-emulsion processed compound exhibited better cycleability and capacity retention upon charge and discharging suggesting a more stable crystal structure. The gallium doped compounds improved the structural stability by lowering irreversible capacity loss. The decreased capacity of ME Li2Cu0.5Ni0.4Ga0.1O2 was most likely the result of large particle agglomerations causing a significant efficiency loss since most of the active electrode material is not accessed during the intercalation (discharge) and de-intercalation (charge) processes. Further studies are necessary to indentify whether topotactic or displacement reactions are the dominant mechanism for Li-ion capacity in the Li2Cu0.5Ni0.4M0.1O2 system.
Acknowledgments
C.T. Love is supported under a Naval Research Laboratory Post-Doctoral Fellowship administered by the American Society for Engineering Education. The authors thank the Office of Naval Research for financial support.
*
*
*
***
* * * *
∆∆
∆
∆ ∆
∆
ECS Transactions, 16 (29) 27-35 (2009)
34 ) unless CC License in place (see abstract). ecsdl.org/site/terms_use address. Redistribution subject to ECS terms of use (see 132.250.22.6Downloaded on 2014-12-05 to IP

References
1. M. D. Johannes, A. M. Stux and K. E. Swider-Lyons, Phys. Rev. B, 77 075124 (2008).
2. J. R. Dahn, U. Vonsacken and C. A. Michal, Solid State Ion., 44, 87 (1990). 3. K. Kang, C. H. Chen, B. J. Hwang and G. Ceder, Chem. Mat., 16, 2685 (2004). 4. N. Imanishi, K. Shizuka, T. Ikenishi, T. Matsumura, A. Hirano and Y. Takeda,
Solid State Ion., 177, 1341 (2006). 5. D. L. A. S. Prakash, M. Morcrette, M. S. Hegde, J.-B. Leriche, C. Masquelier,
ChemInform, 36, 45 (2005). 6. G. Vitins, E. A. Raekelboom, M. T. Weller and J. R. Owen, J. Power Sources,
119, 938 (2003). 7. Y.-K. Lin, C.-H. Lu, H.-C. Wu and M.-H. Yang, J. Power Sources, 146, 594
(2005). 8. R. Malini, U. Uma, T. Sheela, M. Ganesan and N. Renganathan, Ionics (2008)
online first. 9. P. Poizot, S. Laruelle, S. Grugeon, L. Dupont and J.-M. Tarascon, Nature, 407,
496 (2000). 10. J. Li, H. M. Dahn, L. J. Krause, D.-B. Le and J. R. Dahn, J. Electrochem. Soc.,
155, A812 (2008).
ECS Transactions, 16 (29) 27-35 (2009)
35 ) unless CC License in place (see abstract). ecsdl.org/site/terms_use address. Redistribution subject to ECS terms of use (see 132.250.22.6Downloaded on 2014-12-05 to IP
Copyright © 2022 FDOKUMEN


![Mononuclear Lanthanide Single Molecule Magnets Based on the Polyoxometalates [Ln(W 5 O 18 ) 2 ] 9− and [Ln(β 2 SiW 11 O 39 ) 2 ] 13− (Ln III = Tb, Dy, Ho, Er, Tm, and Yb](https://static.fdokumen.com/doc/165x107/63221a7e050768990e0fb2ea/mononuclear-lanthanide-single-molecule-magnets-based-on-the-polyoxometalates-lnw.jpg)
![Synthesis, characterization, and electrochemical and electrical properties of a novel ball-type hexanuclear metallophthalo-cyanine, bridged by calix[4]arenes substituted with four](https://static.fdokumen.com/doc/165x107/6315bc8e85333559270d4452/synthesis-characterization-and-electrochemical-and-electrical-properties-of-a.jpg)


![Polyoxometalates with Internal Cavities: Redox Activity, Basicity, and Cation Encapsulation in [X n + P 5 W 30 O 110 ] (15 - n ) - Preyssler Complexes, with X = Na + , Ca 2+ , Y](https://static.fdokumen.com/doc/165x107/633563c6cd4bf2402c0b0fc5/polyoxometalates-with-internal-cavities-redox-activity-basicity-and-cation.jpg)