
Viscoelastic Deformation Models for Subduction Earthquake ...
Upload
sciences-poCategory
view
3download
0
Pergamon FIbrheology, Vol. 34, No. 2, pp. 99410,199i
Copyright 0 1997 Elsetier Science Ltd Printed in the USA. All rights reserved
ooo6355x/97 $17.00 t .oo
PII s000s-355x(97)00007-3
DEFORMATION OF ERYTHROCYTES UNDER SHEAR: A SMALL-ANGLE LIGHT SCATTERING STUDY
P. MAZERON, S. MULLER, AND H. EL AZOUZI
Groupe Physico-Chimie des Colloides, Laboratoire d’Etude des Systtmes Organiques et Colloi’daux (LESOC), U.A. C.N.R.S. no 406, Universite Henri Poincare - Nancy 1, Faculte des Sciences, Vandoeuvre 11% Nancy Cedex, FRANCE
Reprint requests to: Dr. P. Mazeron, Universite Henri Poincare - Nancy 1, Faculte des Sciences, BP 239, 54506 Vandoeuvre les Nancy Cedex, FRANCE; Fax: 33 (0)3 83 91 25 32; e-mail: [email protected]
ABSTRACT In this study, sharp small-angle light scattering (SALS) images of erythrocytes under increasing shear stresses in a Couette flow were obtained, and accurate measurements of the angular positions of the two first minima and maxima have been carried out. The deformed cells were assumed to be three-axis ellipsoids of constant volume for all shear stresses. Application of the Physical Optics Approximation (POA) then permitted the determination of the cell dimensions as a function of the applied shear stress. Our results agree with determinations obtained by other methods. 0 1997 Elsevier Science Ltd
Introduction Extensive literature, experimental as well as theoretical, has been devoted to red blood cell (RBC) deformation and motion under shear. In this study, we will refer mainly to articles .directly related to the steady stationary orientation motion in which the cells deform into triaxial ellipsoids (Schmid-Schonbein and Wells, 1969; Goldsmith and Marlow, 1972; Fischer and Schmid-Schonbein, 1977).
A variety of techniques have been employed to study RBC rheology and deformability (Bareford et al., 1985; I.C.S.H., 1986; Staubli et al., 1986). We have used classical ektacytometry (Bessis et al., 1980) and light scattering to characterize shear-induced deformations of RBC. Light scattered by particles is, in effect, very sensitive to shape and orientation effects. However, this method has not been widely used with RBC because no exact analytical solution exists for large three-axis ellipsoidal scatterers. To obtain quantitative deductions, numerical or approximate methods must be used. Due to the large values of RBC size parameters, numerical methods such as the discrete dipole approximation (Draine and Flatau, 1993) or the T-matrix method (Barber and Hill, 1990) are for the time being intractable. The simplest theory to
KEYWORDS: Erythrocytes; deformability; light scattering; ellipsoids; small- angle light-scattering patterns
99

100 RBC d.+rmatian under shear Vol. 34, No. 2
approximate forward light scattering is the Fraunhofer diffraction (Zahalak and Sutera, 1981). This theory states that the intensity distribution of the scattered light depends only on the shape and size of the cross-sectional area of the scatterer. The particle being considered therefore exhibits the same optical signature as an opaque screen or an aperture with the geometry of the cross- section. Isointensity curves for ellipsoids are then ellipses of the same aspect ratio as that of the cross-section of the particle. This approximation is easy to use but is not really satisfactory since it fails to take into account two fundamental parameters of three-dimensional scatterers: refractive index and volume, and therefore should not be applied. For example, it cannot explain why some rings on experimental patterns are open and it can lead to wrong size determinations (Streekstra et aZ., 1993; Ravey and Mazeron, 1983).
A far more plausible approximation is the anomalous diffraction (van de Hulst, 1957). In this approach, it is considered that the spatial intensity distribution results from the interference between two wave fronts: the first one corresponding to the light that travels along the scatterer and the other one to the light that traverses the scatterer. If only the first one was considered, the Fraunhofer diffraction would be obtained. The size and refractive index of the particle are taken into account in the phase shift between the two waves. For ellipsoidal scatterers, isointensity curves are still ellipses. The anomalous diffraction should be used instead of the Fraunhofer diffraction as it is found to be a better approximation (Streekstra et aZ., 1993). For example, it can explain the disappearance of rings for particular values of refractive index and size (Kerker, 1969). It has been recently applied to suspensions of ellipsoidal RBC oriented arbitrarily in a Couette flow (Streekstra et aZ., 1994).
A third and more elaborate approximation is the Physical Optics Approximation (POA) recently developed for large ellipsoids (Mazeron and Muller, 1996). It is based on the vectorial Kirchhoff integral (Jackson, 1975) in which the field scattered by a particle is expressed as a function of the electromagnetic field on the particle surface. The relation is rigorous and the approximation consists of attributing a physically suitable value to the unknown surface field. The Fresnel laws and Poynting theorem have been chosen for this purpose. The POA contains both the anomalous diffraction and the Fraunhofer diffraction (Ravey and Mazeron, 1982) and can be reduced, at will, to either. It is then more general. Contrary to the anomalous diffraction and the Fraunhofer diffraction, it can handle depolarization effects and can explain the dissymetly that appears in small-angle light-scattering (SALS) patterns (Fig. 5a). It can also account for some special scattering cases in which the small- angle scattered intensity is not maximum for a zero scattering angle (Barber and Yeh, 1975; Ravey and Mazeron, 1983, Fig. 17). It often happens that for axial orientation, for small scattering angles (9 < 20”) and for a relative refractive index of the particle not very far from unity, POA and anomalous diffraction lead to almost the same results. This is by no means a general rule. For these reasons, despite the relative complexity of the method, we used the POA to interpret the SALS patterns from erythrocytes. In this approximation, isointensity curves are not necessarily ellipses.
This paper explains how it is possible to study by SALS the changes undergone by the RBC as a function of the applied shear stress. The ellipsoid axes lengths are deduced from the known volume and the refractive index of the cells, and from the angular positions of the intensity maxima and minima measured on the experimental light scattering patterns. They are essential parameters in RBC rheology and are necessary in obtaining information on the properties of the membrane.
Vol. 34, No. 2 RBC deformation under shear 101
Materials and Methods
Using classical ektacytometry (Bessis et al., 1980) the cells were sheared in a concentric-cylinder Couette device. The magnitude of the shear stress, 7, applied to the cells was calculated from z = rl Ro/E, in which q is the viscosity of the suspending medium of the cells (32 cp at 22”C), R the radius of the inner cylinder (3.45 cm), E the gap width between the inner and outer cylinders (0.5 mm), and w the angular frequency of the outer cylinder (0 to 120 rpm).
The dilute RBC suspensions were obtained from Dextran T500 and phosphate buffered solution (300 mOsm/l, pH = 7.4). They were submitted to the red light of a low-power He-Ne laser. The laser beam was perpendicular to the streamlines. For the wavelength used (h = 632,8 nm), the refractive index of the suspensions was 1.347.
There was no electronic device to register or analyze the scattering patterns, therefore a photographic plate was used. Although it is possible to observe up to four rings (closed or open) of decreasing intensities on this plate, we have limited the study to the central spot of the pattern and to the two first intensity minima and maxima. Their angular positions in the north-south (NS) and west-east (WE) directions were measured directly on the plate with a simple optical density scanning system. Since the outer cylinder was a cylindrical lens surrounded by two media of different refraction indices (the RBC suspension and the surrounding air), these measured angular values, 9’, must be corrected for refraction effects in order to obtain the real 8 values. A reasonable estimate of 0 was obtained by 8’ = n9, in which n = 1.347 is the refractive index of the RBC suspensions (see Appendix). Owing to the accuracy of experimental angular measurements (a few percent), this estimate was generally enough.
The good working order of the measuring system had been checked with calibrated spheres of polystyrene latex with a diameter of 3.18 pm and a refractive index of 1.593 in the red. When suspended in water their relative refractive index was 1.193. The SALS patterns obtained were circular and agreed, within a few percent, with the Lorenz-Mie exact predictions (Mie, 1908). When suspended in aqueous solutions of trifluoroethanol with a refractive index of 1.310, the Lorenz-Mie theory predicted the disappearance of the first ring (Kerker, 1969). Indeed, this phenomenon has been observed on our corresponding SALS patterns and it also occurs with shapes other than spheres (Ravey, 1985).
Results SALS patterns
Several SALS patterns obtained for shear stresses varying from approximately zero to 19.0 Pa are presented in Fig. 1. They contain much information because in addition to the central spot several more or less pronounced rings can be seen. As they are well contrasted, we can infer that RBC suspensions are rather monodisperse in orientation and deformation. This is due to the linear profile of velocity distribution that causes a uniform shear stress field. The following are general comments on the patterns.
- All of the patterns seem to be symmetric with respect to their center. - The pattern for RBC under conditions of no stress (not shown) is poorly
contrasted and corresponds to randomly oriented RBC in a resting shape. - For a weak stress, less than 0.2 (in fact, as soon as the outer cylinder is
rotating), the pattern becomes clear and circular. In this case, the cells probably still have their rather oblate resting shape (a 4.1 pm particle diameter is deduced from this pattern: this is the diameter of a relaxed erythrocyte), but they are oriented by the flow with their revolution axis parallel, or almost

102 RBC dejiwmation under shear Vol. 34, No. 2
Fig. 1. Experimental SAL.8 patterns of erythrocytes deformed under
increasing shear stresses (-0. 1.1. 3.8, 7.6, 19.0 Pa, left to right, respectively).
parallel, to the incident light and perpendicular to the streamlines. The pattern would be either blurred or not circular otherwise.
-When the shear stress is increased, the red cells resemble elongated but flat ellipsoids so that the patterns are elongated also.
Using an optical density scanning system, we measured the angular positions of the two first minima and maxima in the WE (y= 0’) and NS (y = 90”) pattern directions (y is the angle between the horizontal plane and the scattering plane). The results in degrees, corrected for refraction effects (see above section) are presented in Table 1. For small 0 angles f3(r = 90)/9(y = 0) = p is the axis ratio of the pattern. As we can see in Table 1, p is strongly dependent on the shear stress Z, but practically independent of the extremum chosen.
Ellipsoid dinwnsions
The RBC suspensions used were diluted so that single and independent scattering predominated. We calculated that approximately 7000 cells were present in the scattering volume and contributed to the SALS pattern formation by adding their intensities. The incident laser beam had a Gaussian intensity profile. Since the waist of the beam is large (approximately 0.8 mm) compared to the particle size, we can consider that the cells were submitted to a plane incident wave.
An important parameter in light scattering studies is the relative refractive index value of the scatterer. It is considered to be real (Reynolds et al., 1976) for the red light of the He-Ne laser. A value of 1.05 has been measured with a refractometer (Streekstra et al., 1994) from hemoglobin concentration considerations. It is also possible to estimate it from RBC composition (hemoglobin 32%, water 65%, membrane components 3%) and from the corresponding refractive indices (1.615 for Hb, 1.333 for water, 1.6 for the membrane). By the Lorentz-Lorenz (Clausius-Mossotti) equation, a value of 1.05 is then found again. For our part, by comparing the reflectance under normal incidence of packed RBC to those of liquids of known refractive indices, we have measured a value of 1.065. This last value was used in our scattering calculations.
The measured (Coulter) RBC volume is 85 l.rm3.

Vol. 34, No. 2 RBC defrmation under shear 103
Table 1
Experimental angular positions (degrees) of the two first intensity minima and extrema and image axis ratio p for various shear stress values (Pa)
‘5 mini maxi min2 max2
r 0
1.1
3.8
7.6
19.0
e(Y = 0)
e(y = 90)
P
e(Y = 0)
e(y = 90)
P
etr = 0)
e(y = 90)
P
w = 0)
e(y = 90)
P
e(Y = 0)
e(y = 90)
P
4.7 5.8 8.0 9.4
4.7 5.8 8.0 9.3
1 1 1 1
4.0 5.2 7.3 8.5
5.2 6.8 9.4 11.1
1.30 I.31 1.29 1.31
3.3 4.0 5.8 6.7
6.7 8.3 11.9 13.1
2.03 2.08 2.05 1.96
3.0 3.8 5.6 6.2
6.9 8.5 12.3 14.1
2.30 2.24 2.20 2.27
2.7 3.5 5.0 5.8
8.4 10.8 14.5 17.5
3.10 3.09 2.90 3.02
The constrained RBC shape is assumed to be ellipsoidal with the ellipsoid oriented in the following way (Fig. 2): the major semi-axis, b, is in the horizontal plane made by the incident light direction and the undisturbed flow direction, tilted of a to the streamline; the medium semi-axis, a, is perpendicular to this plane, that is, parallel to the vorticity vector; the minor semi-axis, c, characterizes the cell half-width when ct = 0.
All the patterns exhibiting no apparent dissymmetry, it seems that the long ellipsoid axis is oriented almost along the streamlines (see discussion). In other words, the angle a is certainly small enough so that it cannot markedly influence the shape of the SALS patterns.
We then computed (from POA) various charts for three-axis ellipsoids with the aforementioned volume, refractive index and orientation (a = 0). They give the angular positions of the two first minima and maxima of intensity when the scattering plane is horizontal (y = 0) as a function of the semi-axis length a, for a series of b/a ratios. One of them is presented in Fig. 3.
These charts practically independent of c, that is, of the ellipsoid volume, are used to determine a. The four extrema lead within experimental errors to the same a value. Accordingly, the ellipsoidal shape hypothesis for constrained PBC is compatible with these experimental measurements. A hypothetical spheroidal shape would have failed.

104 RBC defbrmation under shear Vol. 34, No. 2
incident light direction
Fig. 2. Ellipsoid orientation with respect to incident light direction, z, and undisturbed flow direction, y, Semi-axis, a, is perpendicular to (y,z) plane.
9 (degrees] First Intensity Minimum 71 I I I I , I 1 I I
6-
s- p=l
4- 3 / ~~ p-3 2
1 1 I I I I 1 I 2 3 4 5 6
a (microns)
Fig. 3. Theoretical chart obtained according to POA giving the angular position of the first intensity minimum in the WE pattern direction (y= 0) versus the semi-axis length, a, for ellipsoids (volume 85pm3, refractive index 1.065, axial orientation a = 0) of different p = b/a ratios ranging from 1 to 3 by steps of .l.

Vol. 34, No. 2 RBC ckjbnnatim under shear 105
The b value is determined by the axis ratio p of the pattern, measured with the two first extrema. Although scattering is not diffraction, p has a value very close to the axis ratio of the ellipsoid cross section (b/a), for a relative range of indices of refraction characteristic of biological cells (from 1.0 to 1.1) and for various values of the minor semi-axis (Mazeron and Muller, 1996).
The third dimension, c, of the scatterer is simply determined from the known volume V = 4rcabc/3 = 85 pm 3. The results are displayed in Table 2. Also included is the ellipsoid surface, S, calculated from a, b, c.
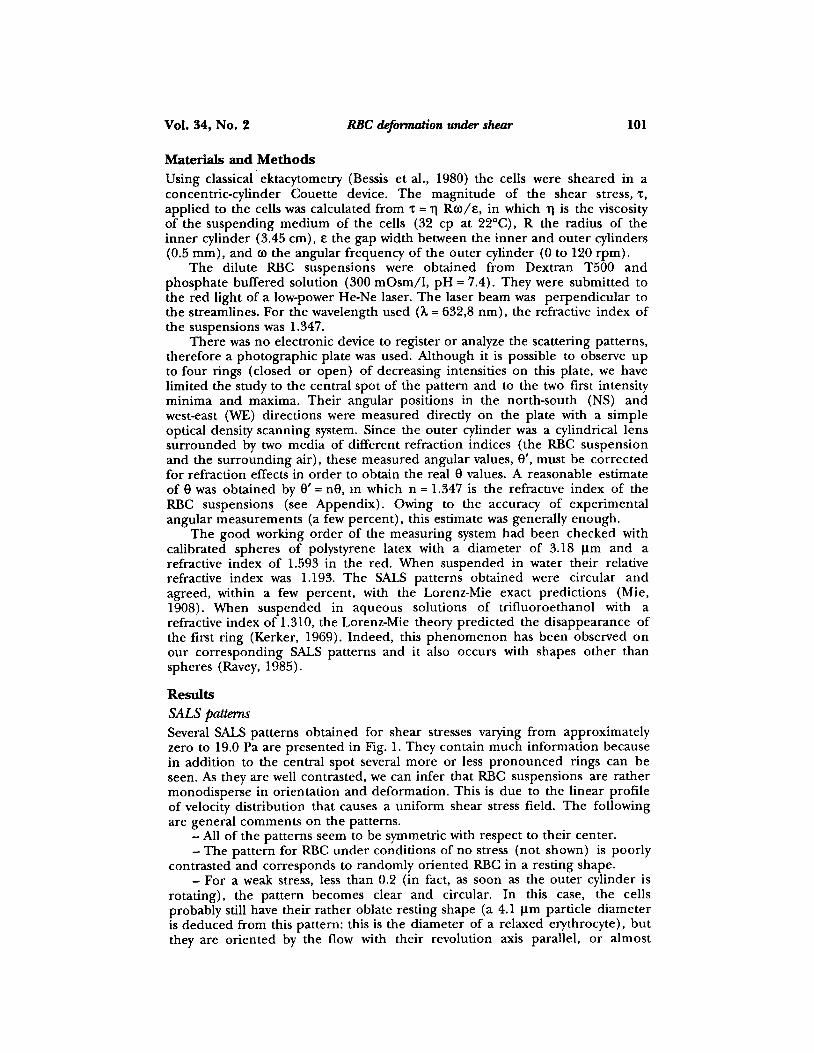
Open circles in Fig. 4 display the changes in a, b, c as a function of the applied shear stress. The filled circles correspond to Sutera’s determinations (see discussion).
Discussion
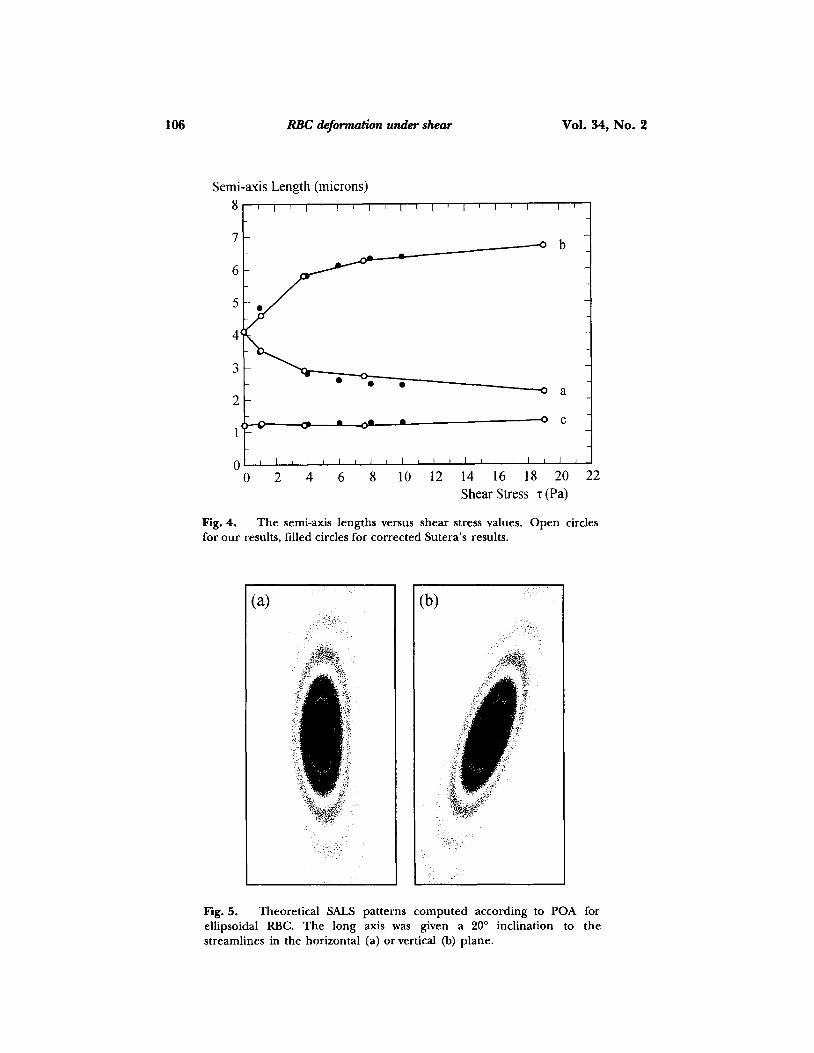
For these RBC suspensions, anomalous diffraction and POA lead to almost the same results as far as small scattering angles are concerned. This is certainly due to the geometrical (dimensions and orientation) and optical parameter values implied in the current problem. However, POA and anomalous diffraction are not always equivalent. For example, when the ellipsoid orientation is not axial (a # 0) a dissymmetry appears in the angular intensity curves, as it must, (Asano, 1979; Barber and Hill, 1990) and hence, in the SALS patterns. This effect is accounted for by the POA only. Figure 5a shows the theoretical pattern we would obtain for O! = 20” and Fig. 5b for the ellipsoid long axis still inclined at 20” to the streamlines but in a vertical plane. In the first case, a slight but visible dissymmetry appears in the pattern and could theoretically be used to determine a, and in the second, the NS direction of the pattern is rotated and could be easily measured. Neither could be experimentally observed.
Another aspect must be stressed: we were not interested in the whole SALS pattern but only in some geometrical characteristics. This is only one aspect of the problem, which cannot lead to a full characterization of the scatterer. We noticed, for example, that the rings appearing in the patterns, although resembling ellipses, are not isointensity curves. Intensity reinforcements do not appear in the polar or the equatorial directions of the pattern and they do depend on scatterer parameters that were not taken into account in this study.
It is interesting to compare our results to the computed geometrical parameters obtained by others (Sutera et al., 1989; Tran-Son-Tay et al., 1984, 1987) using direct microscopic measurements with a cone-plate rheoscope and video recordings of red cells tank-treading. Their determinations (Sutera et al.,
Table 2
Calculated dimensions (in microns), surface and axis ratio p = b/a of ellipsoidal RBCs as a function of the shear stress 7 (in Pa)
Z=JO z = 1.1 z = 3.8 T = 7.6 T= 19
a 4.10 3.52 2.90 2.72 2.24
b 4.10 4.58 5.80 6.26 6.72
C 1.21 1.26 1.21 1.19 1.35
P 1.0 1.3 2.0 2.3 3.0
S 124 121 127 129 124
RBC deformation under sh43-w Vol. 34, No. 2
Semi-axis Length (microns) 8 1,1,1,1,1,1l1l~l~l’I~~
7- ob _
2-
l’fl . Am . 43 c
0 1’1”“““““““” 0 2 4 6 8 10 12 14 16 18 20 22
Shear Stress t (Pa)
Fig. 4. The semi-axis lengths versus shear stress values. Open circles for our results, filled circles for corrected Sutera’s results.
Fig. 5. Theoretical SALS patterns computed according to POA for ellipsoidal RBC. The long axis was given a 20” inclination to the streamlines in the horizontal (a) or vertical (b) plane.

Vol. 34, No. 2 RBC deformation under shear 107
1989, Table 1, bottom fraction) are shown in Fig. 4 (filled circles). They correspond closely to the same surface to volume ratio (approximate1 1.50) as ours and have been corrected by a kind of normalizing factor (85/78) Y i3 taking into account the volume value they considered (78 um3) and ours (85 um3). After Sutera’s results, the angle a between the streamlines and the long axis is independent of the shear stress. Its magnitude (= 11’) is compatible with the lack of dissymmetry of our patterns. Although the method used here is totally different from Sutera’s, the agreement is surprisingly good. The small differences observed could certainly be explained by factors such as age of the cells or the different viscosities (Bessis and Mohandas, 1975) used for the suspending medium (Sutera used 35 cp, we used 32 cp). For the top fraction (Sutera et aZ., 1989, Table l), the agreement is not so good (b is too large), but the curves still exhibit the same trends.
The study confirms (this is an experimental conclusion and not a hypothesis) that in this Couette flow, the RBC deformation takes place at constant surface. The mechanical properties of the membrane are such that it deforms easily at constant area but strongly resists any change in area (Keller and Skalak, 1982).
Conclusion
The steady motion of RBC in a shear flow has been studied by light scattering measurements only, using the Physical Optics Approximation recently developed for large ellipsoids. The experimental measurements concerning the angular position of various extrema are compatible with a description in terms of an ellipsoidal shape for RBC submitted to a shear stress.
We have demonstrated the feasibility of deducing the dimensions a, b, c of erythrocytes under shear from accurate measurements on SALS patterns. The cells were assumed to be three-axis ellipsoids of constant volume (85 um3) for all shear stresses used and to have a real relative refractive index (1.065). The experimental results confirm that the cells deform at constant surface (125 urn*). Our a, b, c values agree fairly well with those obtained by Sutera. The apparent symmetry of the SALS pattern indicates that the angle between the long axis of the ellipsoid and the streamlines is small whatever the shear stress.
The present method while limited to small scattering angles can be extended to large particles other than ellipsoids if their scattering properties can be computed. They may be homogeneous or not, absorbing or dielectric, arbitrarily oriented, with a large radius of cmvature compared to the wavelength. No exact theory exists for such general scatterers, but for a refractive index close to one, an anomalous diffraction much simpler than BOA will certainly do.
Appendix Figure 6 represents a cross-sectional view of part of the external cylinder of the ektacytometer in a horizontal plane. The incident light propagates from the center, 0, of the concentric cylinders towards point A of the scattering volume, located at a distance, d, from the outer cylinder. A ray of light scattered in the direction defined by 8 follows path AI I’B. Seeming to come from point A’, its apparent scattering angle is 8’. How are angles 8’ and 8 related?
Because 8 = i + a and 8’ = i’ + cx’ we obtain 8’- 8 = i’ - i + r - r’, in which the four unknown angles can be expressed as a function of 8 by means of classical relations in triangles OAI and OA’I’ and refraction laws:
sin0 sin i sin r sinr’ -=-. R
-=-; nsini= n’sinr; sini’= n’sinr’. R-d’ R+e R

10s RBC dejbnnation under shear Vol. 34, No. 2
air
I i
n’ n
Fig. 6. Geometry of the refraction correction.
R = 35 mm is the interior radius of the outer cylinder, e = 5 mm is the thickness of the outer cylinder, n = 1.347 is the refractive index of RBC suspensions, and n’ = 1.543 is the refractive index of the outer cylinder (made of quartz). The scattering volume has the shape of a small cylinder whose length is the gap width between the two cylinders (0.5 mm) and whose radius is that of the laser beam (0.4 mm). The maximum value of d is then approximately 0.5 mm so that we can neglect d compared with R.
We can then replace sin x by x because the angles considered are small (< 20”). We then obtain, without significant loss of accuracy
_ = n@+e/h’) = 095& 0’
8 l+e/R * ’
Without the sine approximation, the computed ratio 0’/0 would vary from 0.953n to 0.961n for 8 ranging from 0 to 20”. For angles corresponding to the WE line of the SALS patterns, the above expression solves the problem in a horizontal plane. Within less than 5%, it may be approximated by 0’ = n9 which is the refraction correction in a vertical plane (see below).
For the vertical NS line of the patterns, the path AI I’B lies in the vertical plane containing the incident light direction so that the outer cylinder behaves like a plane-parallel slab. We then get exactly sin 8’ = n sin 9, that is, 8’ = ne for small angles.
References
ASANO, S. (1979). Light scattering properties of spheroidal particles. Appl. Opt. 18, 712-722.
BARBER, P., and YEH, C. (1975). Scattering of electromagnetic waves by arbitrarily shaped dielectric bodies. Appl. Opt. 14, 2864-2872.

Vol. 34, No. 2 BBC deformation under shear 109
BARBER, P.W., and HILL, S.C. (1990). Light Scaltering &y Particles: Computational Methods. World Scientific Publishing Co. Pte. Ltd., Singapore, New Jersey, London, and Hong Kong.
BAREFORD, D., STONE, P.C.W., CALDWELL, N.M., MEISELMAN, H.J., and STUART, J. (1985). Comparison of instruments for measurements of erythrocyte deformability. Clin. Hemorheol. 5, 31 l-322.
BESSIS, M., and MOHANDAS, N. (1975). Deformability of normal, shape-altered and pathological red cells. Blood Cells 1, 315-321.
BESSIS, M., MOHANDAS, N., and FEO, C. (1980). Automated ektacytometry: a new method of measuring red cell deformabilty and red cell indices. Blood Cells 6, 315-327.
DRAINE, B.T., and FLATAU, PJ. (1993). Discrete-dipole approximation for scattering calculations. J. Opt. Sot. Am. A 11, 1491-1499.
EXPERT PANEL ON BLOOD RHEOLOGY OF THE INTERNATIONAL COMMITTEE FOR STANDARDIZATION IN HEMATOLOGY. (1986). Guidelines for measurements of blood viscosity and erythrocyte deformability. Clin. Hemorh.eol. 6, 439-453.
FISCHER, T., and SCHMID-SCHGNBEIN, H. (1977). Tank-tread motion of red cell membranes in viscometric flow: behavior of intracellular and extracellular markers. Blood Cells 3, 351-365.
GOLDSMITH, H.L., and MARLOW, J. (1972). Flow behavior of erythrocytes. I. Rotation and deformation in dilute suspensions. Proc. R SOC. Eond. B182, 351-384.
JACKSON, J.D. (1975). Simple radiating systems, scattering, and diffraction. In: Classical Electrodynamics. Wiley, New York, pp. 432-435.
KELLER, S.R., and SKALAK, R. (1982). Motion of a tank-treading ellipsoidal particle in a shear flow. J Ruid Mech. 220, 27-47.
KERKER, M. (1969). The scattering of light and other electromagnetic radiations. Academic Press, New York, and London.
MAZERON, P., and MULLER, S. (1996). Light scattering by ellipsoids in a Physical Optics Approximation. Appl. Opt. 35, 3726-3735.
MIE, G. (1908). Beitrage zur Optik triiber Medien, speziell Kolloidaler Metallosungen. Ann. Phys. 25, 377-452.
RAVEY, J.C., and MAZERON, P. (1982). Light scattering in the physical optics approximation; application to large spheroids. J Opt. (Paris) 13, 273-282.
RAVEY, J.C., and MAZERON, P. (1983). Light scattering by large spheroids in the physical optics approximation: numerical comparison with other approximate and exact results. j. Opt. (Paris) 14, 29-41.
RAVEY, J.C. (1985). The first extrema in the radiation pattern of the light scattered by micrometer-sized spheres and spheroids. J. Colloid Interface Sci. 105, 435-446.

110 RBC dejbmution under shear Vol. 34, No. 2
REYNOLDS, L., JOHNSON, C., and ISHIMARU, A. (1976). Diffuse reflectance from a finite blood medium: applications to the modeling of fiber optic catheters. Appl. Opt. 15, 2059-2067.
SCHMID-SCHONBEIN, H., and WELLS, R. (1969). Fluid drop-like transition of erythrocytes under shear. Science 165, 288-291.
STAUBLI, M., STONE, P.C.W., STRAUB, P.W., and STUART, J. (1986). Evaluation of methods for measuring erythrocyte deformability. Clin. Hemorheol. 6, 589-602.
STREEKSTRA, GJ., HOERSTRA, A.G., NIJHOF, EJ., and HEETHAAR, R.M. (1993). Light scattering by red blood cells in ektacytometry: Fraunhofer versus anomalous diffraction. A$$. Opt. ?2, 2266-2272.
STREERSTRA, GJ., HOERSTRA, A.G., and HEETHAAR, R.M. (1994). Anomalous diffraction by arbitrarily oriented ellipsoids: applications in ektacytometry. A#. Opt. 33, 7288-7296.
SUTERA, S.P., PIERRE, P.R., and ZAHALAR, G.I. (1989). Deduction of intrinsic mechanical properties of the erythrocyte membrane from observations of tank-treading in the rheoscope. Biorheology 26, 177-197.
TRAN-SON-TAY, S., SUTERA, S.P., and RAO, P.R. (1984). Determination of red blood cell membrane viscosity from rheoscopic observations of tank-treading motion. Biophys. J 46, 65-72.
TRAN-SON-TAY, S., SUTERA, S.P., ZAHALAK, G.I., and RAO, P.R. (1987). Membrane stress and internal pressure in a red blood cell freely suspended in a shear flow. Biophys. J. 51, 915-924.
van de HULST, H.C. (1957). Light Scattering by Small Particles. Wiley, New York.
ZAHALAR, G.I., and SUTERA, S.P. (1981). Fraunhofer diffraction of an oriented monodisperse system of prolate ellipsoids. J Colloid Interface Sci. 82, 423-429.
Received 6 August 1996; accepted in revised form 20 March 1997.
Copyright © 2022 FDOKUMEN


![[IN FIRST-ANGLE PROJECTION METHOD]](https://static.fdokumen.com/doc/165x107/6312eb38b1e0e0053b0e36b0/in-first-angle-projection-method.jpg)


