Slide 1 Integrating The Cardiopulmonary System Into Physical ...

Quantitative blood flow measurements in the small animal cardiopulmonarysystem using digital subtraction angiography
MingDe LinDepartment of Radiology, Center for In Vivo Microscopy and Department of Biomedical Engineering,Duke University Medical Center, Box 3302, Durham, North Carolina 27710
Craig T. MarshallDivision of Pulmonary and Critical Care Medicine and Center for Hyperbaric Medicineand Environmental Physiology, Duke University Medical Center, Box 3823, Durham, North Carolina 27710
Yi QiDepartment of Radiology, Center for In Vivo Microscopy, Duke University Medical Center, Box 3302,Durham, North Carolina 27710
Samuel M. JohnstonDepartment of Radiology, Center for In Vivo Microscopy and Department of Biomedical Engineering,Duke University Medical Center, Box 3302, Durham, North Carolina 27710
Cristian T. BadeaDepartment of Radiology, Center for In Vivo Microscopy, Duke University Medical Center, Box 3302,Durham, North Carolina 27710
Claude A. PiantadosiDivision of Pulmonary and Critical Care Medicine and Center for Hyperbaric Medicineand Environmental Physiology, Duke University Medical Center, Box 3823, Durham, North Carolina 27710
G. Allan Johnsona�
Department of Radiology, Center for In Vivo Microscopy and Department of Biomedical Engineering,Duke University Medical Center, Box 3302, Durham, North Carolina 27710
�Received 31 March 2009; revised 24 August 2009; accepted for publication 24 August 2009;published 27 October 2009�
Purpose: The use of preclinical rodent models of disease continues to grow because these modelshelp elucidate pathogenic mechanisms and provide robust test beds for drug development. Amongthe major anatomic and physiologic indicators of disease progression and genetic or drug modifi-cation of responses are measurements of blood vessel caliber and flow. Moreover, cardiopulmonaryblood flow is a critical indicator of gas exchange. Current methods of measuring cardiopulmonaryblood flow suffer from some or all of the following limitations—they produce relative values, arelimited to global measurements, do not provide vasculature visualization, are not able to measureacute changes, are invasive, or require euthanasia.Methods: In this study, high-spatial and high-temporal resolution x-ray digital subtraction angiog-raphy �DSA� was used to obtain vasculature visualization, quantitative blood flow in absolutemetrics �ml/min instead of arbitrary units or velocity�, and relative blood volume dynamics fromdiscrete regions of interest on a pixel-by-pixel basis �100�100 �m2�.Results: A series of calibrations linked the DSA flow measurements to standard physiologicalmeasurement using thermodilution and Fick’s method for cardiac output �CO�, which in eightanesthetized Fischer-344 rats was found to be 37.0�5.1 ml /min. Phantom experiments were con-ducted to calibrate the radiographic density to vessel thickness, allowing a link of DSA cardiacoutput measurements to cardiopulmonary blood flow measurements in discrete regions of interest.The scaling factor linking relative DSA cardiac output measurements to the Fick’s absolute mea-surements was found to be 18.90�CODSA=COFick.Conclusions: This calibrated DSA approach allows repeated simultaneous visualization of vascu-lature and measurement of blood flow dynamics on a regional level in the living rat. © 2009American Association of Physicists in Medicine. �DOI: 10.1118/1.3231823�
Key words: small animal, digital subtraction angiography, cardiovascular, pulmonary, cardiac
output, blood flow5347 5347Med. Phys. 36 „11…, November 2009 0094-2405/2009/36„11…/5347/12/$25.00 © 2009 Am. Assoc. Phys. Med.

5348 Lin et al.: Animal cardiopulmonary blood flow measurements using x-ray DSA 5348
I. INTRODUCTION
The use of small animals in research has increased in recentyears because of the growing importance of rodent models inthe elucidation of disease mechanisms.1 One of the mostcritical indicators of the physiologic responses to circulatorydisease and drug stimuli is the rate and distribution of car-diopulmonary blood flow. A number of well-established tech-niques are used for measuring cardiopulmonary blood flowincluding the Fick method, thermodilution, magnetic flowm-etry, microspheres, Doppler ultrasound, magnetic resonanceimaging �MRI�, computed tomography �CT�, and positronemission tomography �PET�.2–15 Fick’s method is the goldstandard for measuring cardiac output �CO� in absolute units�ml/min�; however, it is a global measurement of the entirebody �nonregional�. Regional measurements can be made us-ing thermodilution, an advantage over Fick’s method, but thereported values are relative measurements. Magnetic flowm-etry can produce absolute units �when properly calibrated�,but is very invasive �a thoracotomy is commonly performedto gain access to the aorta for CO measurements�. In addi-tion, the internal vessels of the lung are out of reach forprobe placement because most of the pulmonary vesselbranches are within the lung parenchyma. Regional bloodflow information can be obtained by the use of microspheres,an advantage over previous methods, but the results are rela-tive values �commonly in units of concentration�. Also, onlya few acquisitions can be performed in the same animal, andmicrosphere techniques require euthanasia.
Noninvasive solutions that allow multiple measurementsand vascular visualization in the same animal include Dop-pler ultrasound, MRI, CT, and PET. Ultrasound offers high-temporal sampling but is limited in measuring parenchymalblood flow because of the gas in the lungs. Additionally, theresults are in terms of velocity �cm/min� rather than flow�ml/min�. CT perfusion is an active area of research,16–18 butscaling CT to the spatial resolution necessary for small ani-mals currently requires much longer scan times �several sec-onds to minutes�, which is too long to capture rapid, acutechanges in blood flow. Several different methods have beendeveloped for perfusion MRI based on the flow or the use ofinjectable contrast agents.10,19,20 These methods are alsochallenging when translating them to the spatial and tempo-ral resolutions required for small animals, and calibration canbe particularly problematic.
We describe here a method that employs x-ray digital sub-traction angiography �DSA� as a solution to these shortcom-ings. DSA is particularly appealing because it is easy to useand it can capture rapid physiological changes on a heartbeat-to-beat basis.21 In DSA, a sequence of x-ray images isacquired pre- and post-injection of vascular contrast.22 Theprecontrast injection images are averaged to create a maskfrom which the post-contrast injection images are subtracted,resulting in the enhancement of the blood vessels while sup-pressing the background anatomy. Small animal DSA imag-ing has been described in previous work, which providesrepeatable high-spatial and high-temporal resolution imaging
10,23–26
in the living rodent. The anatomical imaging fromMedical Physics, Vol. 36, No. 11, November 2009
DSA can be used to derive blood flow metrics using a non-parametric deconvolution technique.27 This blood flow cal-culation is a relative measurement specific to each animal.The focus of this work is mapping the relative flow metricsin DSA to an absolute metric through physiologic-basedmeasurements—the Fick and thermodilution techniques.Fick’s method, the gold standard for measuring cardiacoutput,28–30 is the ratio of the total blood oxygen uptake bythe peripheral tissues to the arterial-venous blood oxygenconcentration difference.30–33 The thermodilution techniqueis an indicator-dilution method where the regional blood flowis measured by noting temperatures changes induced at spe-cific points through the injection of a cold liquid.30,31,33,34
In this study, we used a novel modification to the thermaldilution method to link DSA to the Fick’s technique by usingprewarmed contrast agent as the indicator for both the ther-mal dilution and DSA measurement. The resulting calibratedDSA solution provides �1� high-spatial and high-temporalresolution �100�100 �m2 at 10 frames/s�, �2� blood flow inabsolute units �m/min� and relative blood volume informa-tion at discrete regions of interest �ROIs� of the enhancedblood vessels, �3� transit time dynamics �s� on a pixel-by-pixel basis �100�100 �m2�, and �4� multiple measurementsin the same animal in rapid succession �every 30 s�.
II. MATERIALS AND METHODS
II.A. Radiographic system
The radiographic system used for this work has been con-structed for functional small animal imaging with both high-spatial resolution �100�100 �m2 pixels� and high-temporalresolution �10 ms exposures at 10 frames/s�.2,23–26,35–37 Thesystem employs a unique LABVIEW �National Instruments,Austin, TX� sequencer that allows synchronization of breath-ing, contrast injection, radiographic exposure, and digitalframe acquisition with cardiac cycle. Images were acquiredwith x-ray techniques �80 kVp, 160 mA, and 10 ms� opti-mized for small animal DSA and thus limited beam harden-ing effects.26
Thermodilution measurements were acquired simulta-neously with DSA images by capturing the output from thethermocouples with the LABVIEW sequence, which providedtime sequences where the radiographic density of the DSAimage was indexed to a thermodilution measurement at thesame time. Each run was composed of 30 x-ray images fol-lowing one contrast injection. The images were taken at thesame point in the cardiac cycle �systole� during a brief periodof apnea. This typically yielded one image every 160 ms�i.e., 6 frames/s�. The microinjector delivered a single100�11 �l bolus of heated contrast agent for each run �8 intotal� into the right atrium via the right jugular vein. Thethermodilution sampling was started �6 s before the simul-taneous acquisition with x-ray DSA to acquire baseline tem-perature values, and thermodilution sampling concluded�8 s after conclusion of x-ray DSA sampling to fully cap-
ture the temperature return to the initial values.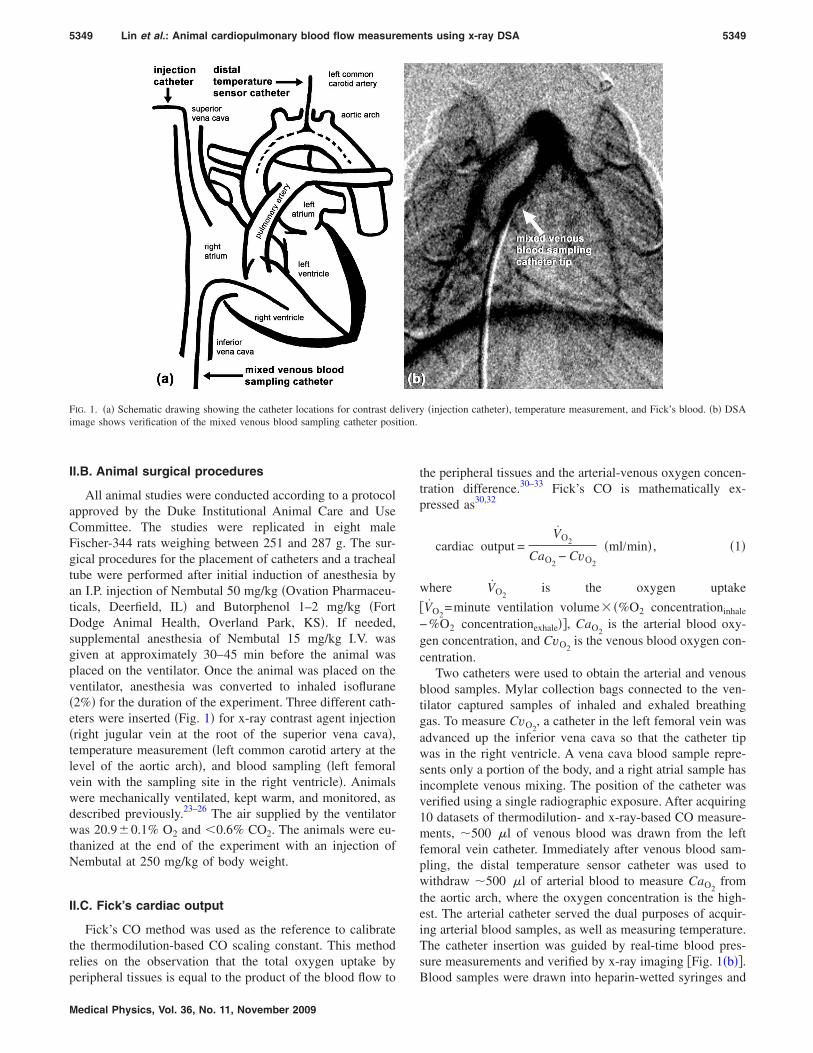
tion.
5349 Lin et al.: Animal cardiopulmonary blood flow measurements using x-ray DSA 5349
II.B. Animal surgical procedures
All animal studies were conducted according to a protocolapproved by the Duke Institutional Animal Care and UseCommittee. The studies were replicated in eight maleFischer-344 rats weighing between 251 and 287 g. The sur-gical procedures for the placement of catheters and a trachealtube were performed after initial induction of anesthesia byan I.P. injection of Nembutal 50 mg/kg �Ovation Pharmaceu-ticals, Deerfield, IL� and Butorphenol 1–2 mg/kg �FortDodge Animal Health, Overland Park, KS�. If needed,supplemental anesthesia of Nembutal 15 mg/kg I.V. wasgiven at approximately 30–45 min before the animal wasplaced on the ventilator. Once the animal was placed on theventilator, anesthesia was converted to inhaled isoflurane�2%� for the duration of the experiment. Three different cath-eters were inserted �Fig. 1� for x-ray contrast agent injection�right jugular vein at the root of the superior vena cava�,temperature measurement �left common carotid artery at thelevel of the aortic arch�, and blood sampling �left femoralvein with the sampling site in the right ventricle�. Animalswere mechanically ventilated, kept warm, and monitored, asdescribed previously.23–26 The air supplied by the ventilatorwas 20.9�0.1% O2 and �0.6% CO2. The animals were eu-thanized at the end of the experiment with an injection ofNembutal at 250 mg/kg of body weight.
II.C. Fick’s cardiac output
Fick’s CO method was used as the reference to calibratethe thermodilution-based CO scaling constant. This methodrelies on the observation that the total oxygen uptake by
FIG. 1. �a� Schematic drawing showing the catheter locations for contrast deimage shows verification of the mixed venous blood sampling catheter posi
peripheral tissues is equal to the product of the blood flow to
Medical Physics, Vol. 36, No. 11, November 2009
the peripheral tissues and the arterial-venous oxygen concen-tration difference.30–33 Fick’s CO is mathematically ex-pressed as30,32
cardiac output =V̇O2
CaO2− CvO2
�ml/min� , �1�
where V̇O2is the oxygen uptake
�V̇O2=minute ventilation volume� �%O2 concentrationinhale
−%O2 concentrationexhale��, CaO2is the arterial blood oxy-
gen concentration, and CvO2is the venous blood oxygen con-
centration.Two catheters were used to obtain the arterial and venous
blood samples. Mylar collection bags connected to the ven-tilator captured samples of inhaled and exhaled breathinggas. To measure CvO2
, a catheter in the left femoral vein wasadvanced up the inferior vena cava so that the catheter tipwas in the right ventricle. A vena cava blood sample repre-sents only a portion of the body, and a right atrial sample hasincomplete venous mixing. The position of the catheter wasverified using a single radiographic exposure. After acquiring10 datasets of thermodilution- and x-ray-based CO measure-ments, �500 �l of venous blood was drawn from the leftfemoral vein catheter. Immediately after venous blood sam-pling, the distal temperature sensor catheter was used towithdraw �500 �l of arterial blood to measure CaO2
fromthe aortic arch, where the oxygen concentration is the high-est. The arterial catheter served the dual purposes of acquir-ing arterial blood samples, as well as measuring temperature.The catheter insertion was guided by real-time blood pres-sure measurements and verified by x-ray imaging �Fig. 1�b��.
y �injection catheter�, temperature measurement, and Fick’s blood. �b� DSA
liverBlood samples were drawn into heparin-wetted syringes and

5350 Lin et al.: Animal cardiopulmonary blood flow measurements using x-ray DSA 5350
placed on ice taking care to exclude air from the syringe. Theblood gas was analyzed �682 CO-Oximeter, InstrumentationLaboratory, Lexington, MA� within 30 min of when thesamples were drawn. During the blood sampling, the inhaledand exhaled breathing air was captured in gas sample bags
for calculating O2 uptake �V̇O2�. The blood and air samples
took �3 min to be acquired. The oxygen concentration inthe breathing and exhaled air was measured using a gas chro-matograph �3800 Gas Chromatographer, Varian, Inc., PaloAlto, CA�. The measurements were corrected to standardtemperature and pressure, dry. Minute ventilation was mea-sured using a spirometer.
II.D. Thermodilution-based cardiac output
The thermodilution technique is an indicator-dilutionmethod where an injectate-induced temperature differencebetween two points in a region of flow is a function of thetemperature change, the volume of injectate, and the heatcharacteristics of the injectate and blood. This is expressedby the Stewart–Hamilton equation �2�,30,31,33
cardiac output =KthermoVi�Ti − Tb��ici
�bcb��T�t�dt�ml/min� , �2�
where Kthermo is the scaling constant, �xcx is the density�g /cm3� and specific heat �J / �g °C�� of injectatex=i orbloodx=b, Vi is the injectate volume �ml�, Tx is the initialtemperature of injectatex=i or bloodx=b �°C�, and �T is thetemperature change between injectate and distal temperaturesensors �°C�.
In the clinical setting,34 room temperature or chilled salineis injected in the right atrium and the temperature is mea-sured at the tip of the catheter in the pulmonary artery usinga multiport Swan–Ganz catheter. We used warmed x-ray con-trast agent �Isovue-370, 370 mg iodine/ml, Bracco Diagnos-tics, Princeton, NJ� to acquire x-ray DSA images and ther-modilution curves at the same time. Another importantdesign feature was that the distal temperature sensor was aseparate catheter that was placed in the aortic arch via theleft common carotid artery to allow adequate time forinjectate-blood mixing because of the rapid heart rate of therat ��375 beats /min�. The injection catheter �Fig. 2�a�� wasconstructed from a series of cascading diameter PE tubessegments �3.75 cm, PE-50 at the tip to 1.25 cm, PE-190 to6.5 cm, PE-240 at the end� to ensure that the catheter couldfit in the jugular vein, while maintaining a large enough lu-men to deliver the contrast agent.25 In addition, the injectioncatheter had a heating tube coaxially wrapped around thecontrast catheter and ports for temperature measurement andcontrast injection. The tubing segments �PE-190 and PE-240�heated by the coaxial heat tube held the majority ��90%� ofthe injectate volume. The remaining catheter length was inthe rat and thus, at body temperature. A temperature-controlled water bath and a peristaltic pump were used tocirculate warm water around the injection catheter via thecoaxial heating tube. The coaxial heating tube was con-structed from a pair of hemostasis valves with side ports
�Part No. 80390, Qosina, Edgewood, NY�. The heating as-Medical Physics, Vol. 36, No. 11, November 2009
sembly ensured the injectate temperature was maintained at50�0.1 °C. A small �0.23 mm� thermocouple �T-type with0.005 s time constant, IT-23, Physitemp, Clifton, NJ� insertedthrough the sensor port �2 Fr Touhy Borst adapter, Part No.:S19244, Qosina, Edgewood, NY� provided the temperaturereadings for the injectate. The injectate temperature wasmeasured and recorded for the entire thermodilution tech-nique. This was an improvement over current clinical andsmall animal thermodilution systems, where only one tem-perature sample is made in an external beaker.30,31,33,34 In ourapproach, continuous temperature sampling and a closertemperature sensor placement to the injection site eliminatedassumptions that no heat loss occurred between filling, con-necting, and dispensing the injectate, as occurs in other sys-tems. The microinjector used in this study delivered repeat-able volumes �100�11 �l� of injectate10,23–25 and wasshown in previous work to have little effect on the bloodflow physiology.25
The distal temperature sensor catheter �Fig. 2�b�� was in-serted through the left common carotid artery and placed justsuperior to where the carotid artery branches from the aorta.This was the same catheter used to obtain the arterial bloodsample for the Fick CO measurement. A 2 Fr Touhy Borstadapter, like the one used in the injection catheter, allowedfor the thermocouple wire �IT-23� to pass out of the fluid-filled catheter for connection to the LABVIEW module. Thisfluid-tight connection allowed the thermocouple to be ad-vanced or retracted under x-ray guidance when the TouhyBorst adapter was unlocked. This design allows one to guidethe delicate sensor ��0.15 mm diameter lead wires� througha length of winding vasculature ��15–20 mm� under highsystolic pressure ��100–120 mm Hg at systole�. Further-more, sending only the thermocouple into the aorta allowedfor repeatable positioning of the thermocouple and directmeasurement of temperature changes with minimal distur-bance of blood flow. Depending on the variation in the aorticarch for each rat, the sensor probe tip �represented by the
FIG. 2. Thermodilution and x-ray DSA catheters. The injection catheter �a�delivered warmed contrast agent, and the distal temperature sensor catheter�b� measured the change in temperature downstream from the injection site.
dotted lines in Fig. 1�a�� was either just superior to the aortic

5351 Lin et al.: Animal cardiopulmonary blood flow measurements using x-ray DSA 5351
valve in the ascending aorta �AA� or immediately after thearch in the descending aorta �DA�. Given the different mea-surement locations, the thermodilution cardiac output mea-surement results were grouped into two categories—one forthe sensor tip located in the DA �four rats� and the other forthe sensor tip located in the AA �four rats�. The DSA resultswere also grouped in this fashion because of the chain ofcalibrations linking DSA to thermodilution.
Thermocouples were sampled 12 times/s in the USB-9211A module of our monitoring system �National Instru-ments, Austin, TX� using LABVIEW software developed in-house. Of note is the calculation of the denominator term ofthe Stewart–Hamilton equation, ��T�t�dt in Eq. �2�. Thearea under the temperature change curve �Fig. 3� was com-posed of two parts. The first part was the area under thetemperature change curve that ranged from immediately afterthe contrast injection to 40% of the maximum temperaturechange in the descending limb of the graph. The second partwas the area under an exponential curve that was fitted�circle-dotted curve� on the down slope, starting from 40%of the maximum temperature change.30,31 This fit was basedon the descending temperature range of 80%–40% of themaximum temperature change value and was done to miti-gate effects of indicator recirculation that resulted in a long,gradually decreasing temperature change tail �curve from 10to 18 s�.
Ten thermodilution measurements, each separated by 2min,30 were made for each rat. Statistics �average, standarddeviation, and coefficient of variation� showing the CO mea-surements were found for each rat. The thermodilution scal-ing constant �Kthermo� was then calculated Eq. �3� for each ratby
Kthermo =Fick ’ s cardiac output
Thermodilution cardiac output�3�
so that the relative thermodilution CO measurement matchedthat rat’s specific absolute Fick’s CO measurement.
Singular value decomposition �SVD�, based on the workof Ostergaard et al.,27 was used to find the relative flow rates.The method allows for measurements independent of the
38
FIG. 3. A plot of the time density curve �right, y axis� and the thermaldilution �left, y axis� measure shows the coincidence of the two. The letters�a, g, h, and i� refer to the DSA x-ray series seen in Fig. 4 at specific timepoints during the run.
measurement region. Briefly, the flow rate in a vessel can
Medical Physics, Vol. 36, No. 11, November 2009
be estimated by deconvolving the effects of the vasculaturefrom contrast concentration curves. In this case, the curvesare pixel value changes in x-ray intensity over time �timedensity curve �TDC��. Typically, an input �arterial inputfunction �AIF�� in the shape of a square impulse function ata proximal vessel location will become a delayed, dispersedcurve at a distal vessel location. While there are other waysof deconvolving, SVD has proven superior in several previ-ous studies.38–40 The relative blood volume can be estimatedfrom the area under the time-concentration curve normalizedto the area under the AIF curve.27 Mean transit time �MTT�can be calculated following the central volume theorem bythe blood volume divided by the flow rate.27 In essence, theMTT is related to the center of mass under the time densitycurves, not amplitude of the time density curve, and so wascalculated separately from the vessel thickness correction de-scribed in Sec. II E. For each run, regions of interest �ROIs�were taken of the ascending aorta and the pulmonary arteryroot �AIF�.25 The aortic and AIF concentration time curveswere realigned to a common signal maximum41–43 to correctfor bolus delay errors. The ROIs were drawn so that no over-lying enhanced blood vessels were included �see ROIs inFig. 4�.
The DSA scaling constant �KDSA� was calculated �Eq. �4��for each rat by
KDSA =calibrated thermodilution cardiac output
x-ray DSA cardiac output�4�
so that the relative x-ray DSA CO measurement matched thatrat’s specific calibrated thermodilution CO measurement.
In a contrast-filled vessel, the signal intensity change afterlogarithmic subtraction is linearly related to the contrastagent concentration in the vessel.44,45 This was experimen-tally verified in the live rat by plotting the peak DSA signalfor several major vessels for injection volumes of 50, 100,and 150 �l. Two DSA runs in the same rat were made foreach injection volume for a total of 6 runs. Because the DSACO was calibrated to the location-dependent �DA or AA�thermodilution results, there was a need to measure how in-dependent the DSA calibration factors were between the DAand AA cases. This was done by comparing the percent dif-ference between the product of calibration factors Kthermo
�KDSA within the DA and AA cases by combining Eqs. �3�and �4�: COFick=Kthermo�COthermo and substituting COthermo
=KDSA�CODSA into the former resulted in
COFick = KDSA � CODSA, �5�
where COx is the cardiac output measured by Fick, precali-brated thermodilution, or precalibrated DSA, Kthermo�KDSA
is the product of calibration factors.
The percent difference was calculated by
5352 Lin et al.: Animal cardiopulmonary blood flow measurements using x-ray DSA 5352
% difference =�KDA − KAA�
�KDA + KAA
2 � 100, �6�
where KDA is the average Kthermo�KDSA for the descendingaorta and KAA=average is the average Kthermo�KDSA for the
FIG. 4. Selected DSA images show �a� initial arrival of contrast in the rightof the parenchyma, �e� complete parenchymal filling, �f� pulmonary veins ancomplete aorta filling, and �i� contrast has passed through cardiopulmonary scan be temporally isolated. The ROIs �circles� in �b� show the AIF and in �
ascending aorta.
Medical Physics, Vol. 36, No. 11, November 2009
II.E. SVD flow metric vessel thickness correction andexperimental verification
The SVD calculation deconvolves an arterial input TDCfrom a distal vessel TDC.27 The maximum height of the resi-due function from the deconvolved TDC is the relative flowrate.46,47 Given the same AIF and only amplitude scaling
ricle, �b� filling of the pulmonary arterial system, �c� early to �d� midfillingly left heart filling, �g� left ventricle filling and early aorta enhancement, �h�. Note that the bolus is sufficiently compact that the different stages of flow
ow the aorta, which are used for the blood metric calculations.
ventd earystemh� sh
differences in the distal vessel TDCs, the same scaling ap-

5353 Lin et al.: Animal cardiopulmonary blood flow measurements using x-ray DSA 5353
plies to the deconvolved result. Logarithmically subtractedx-ray angiography images produce signal intensity valuesthat are linearly related to the cross-sectional contrast thick-ness of the vessel.44,45 At the same flow rate, a contrast-filledvessel that is twice as thick will yield a TDC with a peak thatis twice as high. We corrected for this vessel thickness modu-lation using the width of the projected vessel to determinethe thickness. The vessel thicknesses were estimated using athreshold-based method48 and an approach similar to Cloughet al.45 Briefly, a minimum intensity projection of the DSAimages was filtered and thresholded to extract the contrast-filled vessels. A distance transform was performed to find thedistance of each pixel in the vessel from the nearest vesselboundary, and skeletonization was performed to locate thepixels on the central axes of the vessels.49,50 A line segmentwas constructed over each skeleton pixel at an angle perpen-dicular to the central axis, and the distance value at the skel-eton pixel was then used to assign thickness values to allpixels along the line segment from one end of the tube to theother. Assuming that a cylindrical vessel was parallel to theimaging plane and there was constant attenuation inside thevessel, a radius-to-thickness transform was applied,2R2−x2, where R is the vessel radius and x is the distanceof the pixel along the line segment from the skeleton pixel.45
Using the same ROIs for the SVD calculations, the averageinner diameter of a common vessel �aorta in the live animal�was measured and served to scale the pulmonary blood flow�PBF� in the other vessels. We performed phantom experi-ments to verify the impact of vessel thickness on PBF calcu-lations. The phantom �Fig. 5� was constructed from fourlengths of Tygon tubing. Tube A contained 500 �l of x-raycontrast agent �Isovue-370� and represented the AIF in theSVD calculations. Tubes B, C, and D represented the distalvessels. A syringe pump connected to tube A ran at 50 ml/min and ten x-ray images were acquired every second for 30s. Four sets of DSA images were acquired for each of thethree distal vessels �12 datasets in total�. The images wereprocessed as in the live animal study, the SVD-based flowcalculation was performed, and the vessel thickness correc-tion was applied. The p values �one-way ANOVA� of thepulmonary blood flow results with and without thickness cor-rection were determined between tubes B and C and tubes Dand C �tube C was what tubes B and D were scaled to usingthe thickness correction�. The vessel thickness correction
FIG. 5. A flow phantom was used to verify the SVD-based flow calculationsbetween three vessels of differing diameters �B=1.14 mm, C=2.06 mm,and D=2.79 mm�. Tube A was the AIF.
was then applied to the live animal data. In the live animal,
Medical Physics, Vol. 36, No. 11, November 2009
the correction and calibration was only done for vessels thatcould be resolved. The lung parenchyma was an area wherethe microvessels are smaller than what the x-ray detectorcould resolve. In those areas, the SVD vessel thickness cor-rection was not applied.
III. RESULTS
Figure 4 shows representative images of the raw DSAdata used for the calibrations, which show �a� the initial in-flow of contrast into the right atrium and right ventricle, ��b�and �c�� flow from the right ventricle out the pulmonary ar-tery, ��d�–�f�� flow back into the left atria, and ��g� and �h��flow out of the left ventricle into the arterial system. Notethat in Fig. 4, DSA has the ability to separate the venous andarterial phases of pulmonary blood flow. While there are pe-riods where arterial and venous structures are superimposed,the high-temporal resolution and tight boluses allow us toclearly separate these structures in both time and space. Fig-ure 6 shows the time density curve in the aortic arch, pulmo-nary arteries, and lung parenchyma. The temporal resolution�160 ms� is sufficient to capture 10 points defining the mostrapidly changing points of the time density curve. At peakopacification, the spatial resolution �100 �m� is more thansufficient to provide an accurate measure of the diameter ofthe aortic arch �Fig. 4�h�� and many of the branching vesselsin the pulmonary system.
Linearity between concentration and peak signal in thetime density curve is critical for the SVD calculations. Thefirst measurement in Fig. 7 demonstrates the peak signal in-tensity vs the volume of the injected bolus for a number ofcritical structures. Two DSA runs were executed in the samerat for each injection volume. As expected, a larger injectionvolume resulted in higher contrast agent concentrations and ahigher peak signal �more negative in the subtracted images�.Linear fits were applied and the R2 values were all �0.97,indicating the linearity between signal intensity and contrast
FIG. 6. Time density curves of the same rat in Fig. 4 showing signal changesat specific regions over time. The same types of time density curves aremeasured on a pixel-by-pixel basis and are used to calculate the SVD-basedflow metrics. AIF: Arterial input function; R.PA: Right pulmonary artery;L.PA: Left pulmonary artery; R.Lung: Right lung parenchyma; and L.Lung:Left lung parenchyma.
concentration.

5354 Lin et al.: Animal cardiopulmonary blood flow measurements using x-ray DSA 5354
Blood flow derived from the SVD is dependent on thepeak of the TDC, which, in turn, is dependent on the diam-eter of the vessel. Linearity with respect to volume of thebolus is not sufficient. Figure 8 shows the peak signal fromthe pulmonary vessels and the heart as a function of vesselthickness �assuming the heart as a large vessel�, where thethickness is estimated from the vessel width. Data are plottedagain for three different volumes of injections. The fit to alinear model shows R2�0.94.
Finally, the results from the flow phantom were used tovalidate the SVD calculations for vessels of differing sizewith constant flow. The phantom is shown in Fig. 5 and therepresentative time density curves are shown in Fig. 9. Asummary from four TDCs for each tube is included in TableI. The uncorrected pulmonary blood flow is derived fromeach TDC. As expected, when correction for the vessel thick-ness is included, the SVD-derived flow is the same for allthree vessels.
III.A. Fick’s cardiac output
Table II shows the summary of the calibrations. UsingFick’s method, the average CO between eight rats was37.0�5.1 ml /min and cardiac index was137.8�19.0 ml /min kg �13.9% Cv�.
FIG. 7. Peak DSA signal intensity in the right pulmonary artery, left ven-tricle, parenchyma, and aorta plotted versus injection volume. Linear fitsyielded R2�0.97 for all plots �R2=0.98, 0.97, 0.99, and 0.99 for aorta,parenchyma, left ventricle, and right pulmonary artery, respectively�.
FIG. 8. Peak DSA signal versus thickness of the pulmonary vessels and theheart �assumed as a large vessel� for 50, 100, and 150 �l injections ofcontrast agent. Note the linearity of the fits, R2�0.93 �R2=0.95, 0.94, and
0.94 for 50, 100, and 150 �l injection volume, respectively�.Medical Physics, Vol. 36, No. 11, November 2009
III.B. Thermodilution-based cardiac output
Ten thermodilution and simultaneous x-ray-based COmeasurements were made for each of the eight rats. Theaverage of those values was used to obtain Kthermo, the scal-ing factor linking thermodilution to Fick’s method results.The impact on cardiac output because of changes in the totalblood volume is sensitive to the rate of transfusion/hemorrhage. In our study, 1 ml of contrast agent �readilycleared by the kidneys� was added in 10 injections of 100 �lvolume over 20 min. Because the injected volume of thewarmed contrast agent was small �100 �l�, the net tempera-ture increase in the animal was �0.4 °C �Fig. 3� and therewas minimal impact on the rat’s vascular physiology��16 ml of the total blood volume�. Given the differentmeasurement locations �ascending or descending aorta�, thetemperature change readings were significantly different, upto 48%. The temperature difference between the two mea-surement locations �descending or ascending aorta� resultedin different calibration constants for Kthermo. The precali-brated thermodilution-based CO measurements averaged75.4�8.0 a.u. with the probe in the descending aorta and46.3�5.7 a.u. with the probe in the ascending aorta. Be-
FIG. 9. Representative time density curves of the flow phantom at the AIF�tube A in Fig. 5� and the distal vessels �tubes B, C, and D�. An externalpump was used to deliver the same flow rate through the three tubing sizes.
TABLE I. Flow metric results for the phantom experiment before and aftervessel thickness correction. There was statistically significant precorrectiondifference between tubes B and C �p value �0.0001� and tubes D and C �pvalue �0.035�. The prethickness corrected pulmonary blood flow valuesincreased with an increase in tube diameter even though the same pump ratewas used. No statistically significant difference was noted after the thicknesscorrection between tubes B and C �p value �0.839� and tubes D and C �pvalue �0.471�, an indication that matches the reality of the pump beingoperated at the same rate for all three tubes. In addition, there was nostatistically significant difference �p value �0.828� before and after thethickness correction for tube C because the scaling was to itself. Four DSAruns were made for each tube size.
TubeThickness
�mm�SVD flow
�a.u.—volume/time�Corrected flow
�a.u.—volume/time�
B 1.14 0.044�0.006 0.079�0.007C 2.06 0.078�0.003 0.078�0.006D 2.79 0.093�0.011 0.074�0.008

5355 Lin et al.: Animal cardiopulmonary blood flow measurements using x-ray DSA 5355
cause the thermodilution measurement was sensitive to thetemperature probe placement and the DSA was calibrated tothermodilution, the DSA calibration factors were groupedwith thermodilution to the DA and AA cases: KDSA �DA� was40.5�2.6 and KDSA �AA� was 22.3�1.9 with an 8.7% Cvfor the AA measurements. A measure of independence wasperformed between the DA and the AA calibration factors toassure that DSA calibration factor was not affected by thelocation specific thermodilution calibration. The aggregatecalibration of DSA to Fick’s via thermodilution was obtainedby multiplying Kthermo and KDSA �Eq. �5��. The result is18.9��1.8��CODSA=COFick. The standard deviation in the
TABLE II. Measured and calculated values of CO using Fick’s method, thermin the DA and AA. Ten thermodilution samples and ten x-ray DSA sequenc
Rat
1 2 3 4
Weight �g� 268 273 287 261Heart rate �BPM� 359 382 349 364
Fick’s method CO �ml/min�
37.15 35.03 30.37 30.85
Thermodilution CO �a.u.�, precalibratedDistal temp. sensor: In descending aorta �DA�Avg. 76.4 82.5 64.1 78.7Stdev. 2.8 3.6 3.5 2.5Cv �%� 3.65 4.35 5.51 3.20
Avg. Stdev.
Kthermo 0.49 0.42 0.47 0.39 0.44 0.04
X-ray DSA CO �a.u.�, precalibratedDistal temp. sensor: In descending aorta �DA�Avg. 1.79 1.95 1.61 2.12Stdev. 0.40 0.31 0.36 0.30Cv �%� 22.47 16.04 22.38 13.93
Avg. Stdev.
KDSA 42.76 42.34 39.79 37.06 40.48 2.63
FIG. 10. �a� SVD-derived PBF, �b� pulmonary blood volume, and �c� MTT
vessels �arrow shows pulmonary artery� and longer transit time in the more distaMedical Physics, Vol. 36, No. 11, November 2009
conversion �9.5%� is less than the 14% variation we saw inthe gold standard �Fick’s�, suggesting that the measurementsat AA and DA are consistent.
III.C. X-ray DSA-based cardiopulmonary blood flow
Finally, Fig. 10 shows the SVD-derived flow metrics ofthe same rat in Fig. 4. The lung parenchyma contains manysmall vessels and capillary sizes that are smaller than whatthe x-ray detector could resolve. This produces a blush in theregion rather than clearly defined vasculature. Thus, thethickness correction was not applied to these areas, and pul-
tion, and x-ray DSA arranged in two groups—the distal temperature sensorre acquired for each rat.
Total Avg. Total Stdev. Total Cv5 6 7 8
262 273 251 273 268.5 10.7 4.0370 382 376 414 374.5 19.6 5.2
Avg. Std. Cv
45.24 41.99 36.23 39.37 37.0 5.1 13.9
In ascending aorta �AA�39.1 46.9 46.2 53.15.0 4.2 2.1 5.4
12.89 9.03 4.55 10.15Avg. Stdev. Cv
1.16 0.90 0.78 0.74 0.89 0.19 20.8
In ascending aorta �AA�1.93 2.02 1.88 2.510.28 0.20 0.19 0.49
14.51 9.71 10.19 19.67Avg. Stdev. Cv
20.30 23.25 24.57 21.18 22.33 1.94 8.7
e same rat on a pixel-by-pixel basis. There was rapid transit in the major
odilues we
Cv
9.8
Cv
6.5
of th
l locations �circles indicate lung parenchyma�.
5356 Lin et al.: Animal cardiopulmonary blood flow measurements using x-ray DSA 5356
monary blood flow values are presented only for specificvessels where the correction for attenuation derived from thevessel thickness could be applied. The blood transit time wascalculated on a pixel-by-pixel basis and allowed for measure-ment of transit time dynamics on a regional basis—rangingfrom major vessels �i.e., aorta� to tissue �i.e., lung paren-chyma�. In the MTT map, there was fast transit time in themajor vessels �pulmonary artery—arrow, 0.47 s� and highertransit time in the more distal locations where the main ves-sels became capillaries. The lung parenchyma right lowerlobe showed a 1.22 s MTT �large circle� and a 1.32 s MTT inthe right upper lobe �small circle�. Table III shows the aver-age mean transit time at specific regions �aorta, pulmonaryarteries, and lung parenchyma� for all eight rats in this study.As expected, the transit time is greater in the parenchyma��0.93 s� than in the major vessels ��0.45 s�.
IV. DISCUSSION
Fick’s method for cardiac output determinations is basedon the ratio of an animal’s rate of oxygen extraction acrossthe heart to the total body consumption of oxygen �metabo-lism�. A major limitation to the Fick method is that onlycardiac output and not regional blood flow measurementscan be made. In addition, the blood withdrawal process isslow and requires near steady-state respiratory gas exchange,so acute, rapid changes may not be captured. These limita-tions are not present for thermodilution and DSA-based mea-surements, allowing multiple blood flow measurements toprovide a statistical foundation as part of the calibration pro-cess, rather than calibrating DSA to a single Fick’s CO mea-surement.
For the live animal study, the rat strain, sex, body weight,physiologic state, and anesthetic type �or conscious state� cansignificantly impact the cardiac output.5,6,8,12,51,52 The cardiacoutput in the rat can range from 25 ml/min in a deeply anes-thetized rat29 to 50 ml/min in a conscious rat.4 In previouswork using the Fick’s method, CO measurements in the sameanimal yielded �5% variation between measurements.53,54
The variation can be related to the increased complexity ofthis study over previous work by the inclusion of thermodi-lution and DSA. An absolute comparison of CO between thisstudy and previous work is difficult to make because theanesthesia type, surgical complexity, and rat size and strain�if given� were different than in this study. Papovic et al.53
reported �strain not given� CO=65.0�1.8 ml /min �2.8%
TABLE III. Average mean transit times at specific regions of interest for allrats �n=8� in this study.
Region of interest Mean transit time �s�
Aorta 0.22�0.01Right pulmonary artery 0.42�0.04Left pulmonary artery 0.44�0.05Right lung parenchyma 1.15�0.09Left lung parenchyma 0.93�0.07
Cv� and cardiac index=204.0�5.6 ml /min kg for rats with
Medical Physics, Vol. 36, No. 11, November 2009
average body weight=318.6�9.0 g, while Walsh et al.54 re-ported CO=41.1�2.0 ml /min �4.9% Cv� in Sprague Daw-ley rats and CO=39.9�3.0 ml /min �7.5% Cv� in Wistarrats. The body weights ranged from 175 to 250 g. Using theFick’s method in this study produced similar CO values asanother study �43�10 ml /min� that used microspheres inanesthetized male Fischer-344 rats of similar bodyweight.4,14 The variations in Fick’s method between the DArats were �10% and �14% in the AA rats. Grouping alleight rats in this study showed a �10% variation. The result-ing data for this rat strain and weight, anesthesia type, andimaging system parameters provide us a quantitative, nonin-vasive, image-based measure of blood flow traceable to anabsolute physiologic measurement with reproducibility in thecalibration within the variability of Fick’s method itself.
The DSA method also has some limitations. The SVDcalculation assumes no dispersion of contrast agent. The ef-fect of contrast dispersion can be corrected for by using afinite element vasculature model approach.43 However, thisapproach, to date, is a vessel-specific solution rather than ageneral solution. Contrast bolus delay effects must be cor-rected by realigning the TDCs and the AIF to a commonsignal maximum.41–43 Rats of grossly different anterior-posterior dimensions will result in x-ray intensity changesinversely proportional to the object thickness. Signal inten-sity shifts because of specimen anatomy are suppressedwhile the contrast-filled vasculature is highlighted in DSAbecause of the logarithmic subtraction,26 which mitigates theTDC amplitude dependency on the specimen thickness.However, variations in contrast-filled vessel thickness canmodulate PBF. Therefore, the PBF must be corrected by scal-ing the vasculature to a common vessel. This is not possiblein the lung parenchyma where many vessels are smaller thanthe x-ray detector can resolve. The vessel thickness correc-tion assumes a cylindrical vessel that is parallel to the imag-ing plane. DSA is a planar imaging method and thus thesuperposition of enhanced structures can result in an overes-timation of relative blood volume.
A projection of the parenchyma could be treated as thesuperposition of many overlapping capillaries. It is possibleto use a volumetric imaging modality like micro-CT to findthe thickness of the parenchyma at each pixel. A volumetriccoronal dataset of the segmented lung would be flattened toproduce a 2D projection image. This projection image wouldrepresent the thickness of the parenchyma at each pixel.Lastly, the projection image would be registered to and ap-plied as a thickness correction for the DSA image sets. Somework has already been done in combining DSA �a projection-based imaging method�, with CT �a tomographic method�.24
Even with these limitations, the method provides a valu-able new tool for functional preclinical imaging. This smallanimal DSA system has these advantages because it can per-form the following: Minimally invasive in vivo blood flowmeasurements in the same animal in a rapid succession �ev-ery 30 s�, at very high resolution �up to 100 �m�, with quan-titative blood flow in absolute metrics �ml/min� from discrete
ROIs, and with mean transit time dynamics on a pixel-by-
5357 Lin et al.: Animal cardiopulmonary blood flow measurements using x-ray DSA 5357
pixel basis �100�100 �m2�. This new method can provideexacting solutions to real-time anatomical and quantitativefunctional data acquisition in the living rat to evaluate drug-or disease-modulated cardiac output and pulmonary bloodflow dynamics.
ACKNOWLEDGMENTS
The authors wish to thank David S. Enterline, M.D., andJames Waples for the information about the contrast agent,Robert Behringer, Ph.D., for insightful discussion about fluiddynamics, Eric Alford and Aaron Walker for running bloodgas and air sample analyses, Owen Doar for scheduling andcoordinating the aforementioned analyses, Jim Pollaro, M.S.,for the ventilator software control interface and monitoringsystem, and Laurence Hedlund, Ph.D., for animal supportand surgery. All work was performed at the Duke Center forIn Vivo Microscopy, an NCRR National Biomedical Technol-ogy Research Center �Grant No. P41 RR005959� and NCISmall Animal Imaging Resource Program �Grant No. U24CA092656�, and the Duke Center for Hyperbaric Medicineand Environmental Physiology.
a�Author to whom correspondence should be addressed. Electronic mail:[email protected]; Also at Department of Radiology, Department ofBiomedical Engineering, and Department of Physics, Center for In VivoMicroscopy, Duke University Medical Center, Durham, NC 27710; Tele-phone: 919-684-7754; Fax: 919-684-7158.
1K. Paigen, “A miracle enough: The power of mice,” Nat. Med. 1, 215–220 �1995�.
2C. Badea, B. Fubara, L. Hedlund, and G. Johnson, “4D micro-CT of themouse heart,” Mol. Imaging 4, 110–116 �2005�.
3B. Corman, M. Duriez, P. Poitevin, D. Heudes, P. Bruneval, A. Tedgui,and B. I. Levy, “Aminoguanidine prevents age-related arterial stiffeningand cardiac hypertrophy,” Proc. Natl. Acad. Sci. U.S.A. 95, 1301–1306�1998�.
4M. D. Delp, M. V. Evans, and C. Duan, “Effects of aging on cardiacoutput, regional blood flow, and body composition in Fischer-344 rats,” J.Appl. Physiol. 85, 1813–1822 �1998�.
5R. Hachamovitch, P. Wicker, J. M. Capasso, and P. Anversa, “Alterationsof coronary blood flow and reserve with aging in Fischer 344 rats,” Am.J. Physiol. Heart Circ. Physiol. 256, 66–73 �1989�.
6J. G. Hauptman, G. K. DeJong, K. A. Blasko, and I. H. Chaudry, “Mea-surement of hepatocellular function, cardiac output, effective blood vol-ume, and oxygen saturation in rats,” Am. J. Physiol. Regulatory Integra-tive Comp. Physiol. 257, 439–444 �1989�.
7S. Ishise, B. L. Pegram, J. Yamamoto, Y. Kitamura, and E. D. Frohlich,“Reference sample microsphere method: Cardiac output and blood flowsin conscious rat,” Am. J. Physiol. Heart Circ. Physiol. 239, 443–449�1980�.
8I. Kuwahira, N. C. Gonzalez, N. Heisler, and J. Piiper, “Changes in re-gional blood flow distribution and oxygen supply during hypoxia in con-scious rats,” J. Appl. Physiol. 74, 211–214 �1993�.
9A. B. Malik, J. E. Kaplan, and T. M. Saba, “Reference sample method forcardiac output and regional blood flow determinations in the rat,” J. Appl.Physiol. 40, 472–475 �1976�.
10N. Mistry, J. Pollaro, J. Song, M. Lin, and G. A. Johnson, “Pulmonaryperfusion imaging in the rodent lung using dynamic contrast enhancedMRI,” Magn. Reson. Med. 59, 289–297 �2008�.
11J. Oosting, H. A. J. Struijker-Boudier, and B. J. A. Janssen, “Circadianand ultradian control of cardiac output in spontaneous hypertension inrats,” Am. J. Physiol. Heart Circ. Physiol. 273, 66–75 �1997�.
12Y. Sasaki and H. N. Wagner, Jr., “Measurement of the distribution ofcardiac output in unanesthetized rats,” J. Appl. Physiol. 30, 879–884�1971�.
13S. Steenstrup, J. D. Hove, K. Kofoed, and H. Kelbæk, “A maximum
entropy method to compute the 13NH3 pulmonary transit time from rightMedical Physics, Vol. 36, No. 11, November 2009
to left ventricle in cardiac PET studies,” Physiol. Meas. 23, 23–32 �2002�.14R. F. Tuma, G. L. Irion, U. S. Vasthare, and L. A. Heinel, “Age-related
changes in regional blood flow in the rat,” Am. J. Physiol. Heart Circ.Physiol. 249, H485–H491 �1985�.
15R. Veelken, L. Danckwart, P. Rohmeiss, and T. Unger, “Effects of intra-venous AVP on cardiac output, mesenteric hemodynamics, and splanchnicnerve activity,” Am. J. Physiol. Heart Circ. Physiol. 257, 658–664�1989�.
16J. D. Eastwood, M. H. Lev, T. Azhari, T.-Y. Lee, D. P. Barboriak, D. M.Delong, C. Fitzek, M. Herzau, M. Wintermark, R. Meuli, D. Brazier, andJ. M. Provenzale, “CT perfusion scanning with deconvolution analysis:Pilot study in patients with acute middle cerebral artery stroke,” Radiol-ogy 222, 227–236 �2002�.
17A. Cenic, D. G. Nabavi, R. A. Craen, A. W. Gelb, and T.-Y. Lee, “Dy-namic CT measurement of cerebral blood flow: A validation study,”AJNR Am. J. Neuroradiol. 20, 63–73 �1999�.
18D. G. Nabavi, A. Cenic, S. Henderson, A. W. Gelb, T.-Y. Lee, and G. A.Rosenberg, “Perfusion mapping using computed tomography allows ac-curate prediction of cerebral infarction in experimental brain ischemia,”Stroke 32, 175–183 �2001�.
19Y. Cremillieux, Y. Berthezene, H. Humblot, M. Viallon, E. Canet, M.Bourgeois, T. Albert, W. Heil, and A. Briguet, “A combined 1Hperfusion/3He ventilation NMR study in rat lungs,” Magn. Reson. Med.41, 645–648 �1999�.
20Y. Berthezene, V. Vexler, O. Clement, A. Muhler, M. E. Moseley, and R.C. Brasch, “Contrast-enhanced MR imaging of the lung: assessments ofventilation and perfusion,” Radiology 183, 667–672 �1992�.
21S. D. Shpilfoygel, R. A. Close, D. J. Valentino, and G. R. Duckwiler,“X-ray videodensitometric methods for blood flow and velocity measure-ment: A critical review of literature,” Med. Phys. 27, 2008–2023 �2000�.
22C. Mistretta, M. Ort, J. Cameron, A. Crummy, and P. Moran, “Multipleimage subtraction technique for enhancing low contrast periodic objects,”Invest. Radiol. 8, 43–49 �1973�.
23C. T. Badea, L. W. Hedlund, M. Lin, J. F. Boslego Mackel, and G. A.Johnson, “Tumor imaging in small animals with a combined micro-CT/micro-DSA system using iodinated conventional and blood pool contrastagents,” Contrast Media Mol. Imaging 1, 153–164 �2006�.
24C. T. Badea, L. W. Hedlund, M. Lin, J. S. Boslego Mackel, E. Samei, andG. A. Johnson, “Tomographic digital subtraction angiography for lungperfusion estimation in rodents,” Med. Phys. 34, 1546–1555 �2007�.
25M. Lin, L. Ning, C. T. Badea, N. N. Mistry, Y. Qi, and G. A. Johnson, “Ahigh precision contrast injector for small animal x-ray digital subtractionangiography,” IEEE Trans. Biomed. Eng. 55, 1082–1091 �2008�.
26M. Lin, E. Samei, C. T. Badea, T. T. Yoshizumi, and G. A. Johnson,“Optimized radiographic spectra for small animal digital subtraction an-giography,” Med. Phys. 33, 4249–4257 �2006�.
27L. Ostergaard, R. M. Weisskoff, D. A. Chesler, C. Gyldensted, and B. R.Rosen, “High resolution measurement of cerebral blood flow using intra-vascular tracer bolus passages. Part I: Mathematical approach and statis-tical analysis,” Magn. Reson. Med. 36, 715–725 �1996�.
28M. Hoeper, R. Maier, J. Tongers, J. Niedermeyer, J. M. Hohlfeld, M.Hamm, and H. Fabel, “Determination of cardiac output by the Fickmethod, thermodilution, and acetylene rebreathing in pulmonary hyper-tension,” Am. J. Respir. Crit. Care Med. 160, 535–541 �1999�.
29G. Kissling, C. Ross, and M. Brandle, “Validity of thermal dilution tech-nique for measurement of cardiac output in rats,” Am. J. Physiol. HeartCirc. Physiol. 265, 1007–1013 �1993�.
30T. A. Bowdle, P. R. Freund, and G. A. Rooke, Cardiac Output�SpaceLabs Inc., Redmund, WA, 1991�.
31B. H. Brown, R. H. Smallwood, D. C. Barber, P. V. Lawford, and D. R.Hose, Medical Physics and Biomedical Engineering, Medical ScienceSeries �Institute of Physics, Philadelphia, 1999�.
32N. L. Jones, Clinical Exercise Testing, 4th ed. �Saunders, Philadelphia,PA, 1997�.
33J. G. Webster, Medical Instrumentation Application and Design, 3rd ed.�Wiley, New York, 1998�.
34G. O. Darovic, Hemodynamic Monitoring, Invasive and NoninvasiveClinical Application, 3rd ed. �Saunders, Philadelphia, 1995�.
35C. T. Badea, L. W. Hedlund, and G. A. Johnson, “Micro-CT with respi-ratory and cardiac gating,” Med. Phys. 31, 3324–3329 �2004�.
36W. Mai, C. T. Badea, C. T. Wheeler, L. W. Hedlund, and G. A. Johnson,“Effects of breathing and cardiac motion on the spatial resolution in mi-
croscopic imaging of rodents,” Magn. Reson. Med. 53, 858–865 �2005�.
5358 Lin et al.: Animal cardiopulmonary blood flow measurements using x-ray DSA 5358
37S. J. Mukundan, K. B. Ghaghada, C. T. Badea, C.-Y. Kao, L. W. Hedlund,J. M. Provenzale, G. A. Johnson, E. Chen, R. V. Bellamkonda, and A.Annapragada, “A liposomal nanoscale contrast agent for preclinical CT inmice,” AJR, Am. J. Roentgenol. 186, 300–307 �2006�.
38T. A. Bronikowski, C. A. Dawson, and J. H. Linehan, “Model-free de-convolution techniques for estimating vascular transport functions,” Int. J.Bio-Med. Comput. 14, 411–429 �1983�.
39S. Sourbron, R. Luypaert, D. Morhard, K. Seelos, M. Reiser, and M.Peller, “Deconvolution of bolus-tracking data: A comparison of discreti-zation methods,” Phys. Med. Biol. 52, 6761–6778 �2007�.
40J. Gamel, W. F. Rousseau, C. R. Katholi, and E. Messel, “Pitfalls indigital computation of the impulse response of vascular beds from indi-cator dilution curves,” Circ. Res. 32, 516–523 �1973�.
41F. Calamante, D. G. Gadian, and A. Connelly, “Delay and dispersioneffects in dynamic susceptibility contrast MRI: Simulations using singularvalue decomposition,” Magn. Reson. Med. 44, 466–473 �2000�.
42F. Calamante, L. Willats, D. G. Gadian, and A. Connelly, “Bolus delayand dispersion in perfusion MRI: Implications for tissue predictor modelsin stroke,” Magn. Reson. Med. 55, 1180–1185 �2006�.
43F. Calamante, P. J. Yim, and J. R. Cebral, “Estimation of bolus dispersioneffects in perfusion MRI using image-based computational fluid dynam-ics,” Neuroimage 19, 341–353 �2003�.
44S. Balter, D. Ergun, E. Tscholl, F. Buchmann, and L. Verhoeven, “Digitalsubtraction angiography: Fundamental noise characteristics,” Radiology152, 195–198 �1984�.
45A. V. Clough, G. S. Krenz, M. Owens, A. Al-Tinawi, C. A. Dawson, andJ. H. Linehan, “An algorithm for angiographic estimation of blood vesseldiameter,” J. Appl. Physiol. 71, 2050–2058 �1991�.
Medical Physics, Vol. 36, No. 11, November 2009
46K. L. Zierler, “Equations for measuring blood flow by external monitor-ing of radioisotopes,” Circ. Res. 16, 309–321 �1965�.
47R. Wirestam, E. Ryding, A. Lindgren, B. Geijer, S. Holtås, and F. Ståhl-berg, “Absolute cerebral blood flow measured by dynamic susceptibilitycontrast MRI: A direct comparison with Xe-133 SPECT,” Magn. Reson.Mater. Phys., Biol., Med. 11, 96–103 �2000�.
48K. R. Hoffmann, D. P. Nazareth, L. Miskolczi, A. Gopal, Z. Wang, S.Rudin, and D. R. Bednarek, “Vessel size measurements in angiograms: Acomparison of techniques,” Med. Phys. 29, 1622–1633 �2002�.
49H. Breu, J. Gil, D. Kirkpatrick, and M. Werman, “Linear time Euclideandistance algorithms,” IEEE Trans. Pattern Anal. Mach. Intell. 17, 529–533 �1995�.
50L. Lam, S. W. Lee, and C. Y. Suen, “Thinning methodologies—A com-prehensive survey,” IEEE Trans. Pattern Anal. Mach. Intell. 14, 869–885�1992�.
51D. K. Bowles, R. P. Farrar, and J. W. Starnes, “Exercise training improvescardiac function after ischemia in the isolated, working rat heart,” Am. J.Physiol. Heart Circ. Physiol. 263, 804–809 �1992�.
52N. Veal, F. Moal, J. Wang, E. Vuillemin, F. Oberti, E. Roy, M. Kaassis, R.Trouve, J.-L. Saumet, and P. Cales, “New method of cardiac output mea-surement using ultrasound velocity dilution in rats,” J. Appl. Physiol. 91,1274–1282 �2001�.
53V. P. Popovic and K. M. Kent, “120-day study of cardiac output inunanesthetized rats,” Am. J. Physiol. 207, 767–770 �1964�.
54G. M. Walsh, M. Tsuchiya, and E. D. Frohlich, “Direct Fick applicationfor measurement of cardiac output in rat,” J. Appl. Physiol. 40, 849–853�1976�.
Copyright © 2022 FDOKUMEN