
TOPICAL REVIEWS: In vivo small-animal imaging using micro-CT and digital subtraction angiography
Upload
independentCategory
view
1download
0
Matching of projection imaging and tomographic imaging. Application to the Digital Subtracted Angiography (DSA) and the
Magnetic Resonance Angiography (MRA).
Maximilien Vermandela*, Carine Kulika*, Xavier Lerclerca*, Jean Rousseaua*, Christian Vasseurb**
a Centre Hospitalier Universitaire de Lille; b Laboratoire Interaction, Image et Ingénierie de la Décision, Université des Sciences et Technologie de Lille
ABSTRACT
This study proposes a new method for matching vascular imaging modalities without the use of external frame or external landmarks. We first perform a 3D reconstruction of a piece of the cerebral vascular tree using Magnetic Resonance Angiography (MRA). Then, this structure is projected on the Digital Subtracted Angiography (DSA) images until its best position and orientation are found. As the 3D structure is known in the MRA referential, this method enables us to match information from DSA and MRA. The complete matching of all the DSA images in many incidences and the MRA set have been obtained. For the DSA images, the epipolar constraint has been verified between all the incidences. This new approach in medical imaging brings a very original method, making easier and more efficient visualization and quantification of vascular information.
Keywords: registration, matching, MRI, X-ray imaging, angiography.
1. INTRODUCTION
During the last years, a large number of new analysis methods and images processing have been developed to match images coming from different medical imaging modalities. Those developments enable a more qualitative and quantitative analysis of multi-modality examination. This study presents a new approach for registration and matching of projection and tomographic imaging. For illustrating the applied method, this paper deals with X-Rays and Magnetic Resonance vascular cerebral images. Several authors1, 2 describe methods about 2D and 3D registration. Those methods can be classified as two different approaches which are intensity-based registration1 and feature-based registration2.
The intensity-based registration iteratively optimizes the six rigid-body parameters describing the position and the orientation of the 3D dataset in the DSA space, by generating digitally reconstructed radiographs (DDRs).
The feature-based registration algorithm generates a 'skeleton' of the vascular tree present in the DSA images, reducing the thickness of each to an elementary pixel. Blood vessels in the 3D model, generated using the MRA set, are 'skeletonized', by extracting the medial axis of each vessel. Then, the algorithm selects a sub-sample of points on the 3D skeleton model. Finally, for each 3D point, the closest corresponding point in the 'skeletonized' DSA is found.
The method described in this paper is based on a 3D modeling of the volume of interest and re-projection algorithm using conic projection properties.
The developments presented have been applied on both phantom and patient images. Pre-operative MRA scans have been used to generate a 3D model of the vascular tree. DSA images were acquired in standard pre-operative conditions.
* m-vermandel | c-kulik | xleclerc | [email protected]; phone 33 320 44 67 21; Institut de Technologie Médicale, 2, Avenue Oscar Lambret, 59037 Lille Cedex, France; ** [email protected]; phone 33 320 43 48 76; Bâtiment P2, 59655 Villeneuve d'Ascq
Medical Imaging 2002: Visualization, Image-Guided Procedures, and Display,Seong K. Mun, Editor, Proceedings of SPIE Vol. 4681 (2002) © 2002 SPIE · 1605-7422/02/$15.00 55

This paper contains three parts. Firstly, the method is explained, describing each step. Then, the third part gives results in registering images from phantom. The last section presents our conclusions on the methodology applied, giving some clinical application perspectives.
2. METHOD
2.1 Principle Matching images needs several preliminary steps as registration or researching landmarks changing relations. The main difficulty is due to the managed imaging modalities. There is no physical or mathematical relation linking DSA and MRA. To exceed this complexity, we propose a method illustrated by Fig. 1.
MRA
DSA + -
Real Volume
3D model reconstruction Conic projection
Minimization
Fig. 1: Block diagram illustrating the methodology applied.
First, we acquire MRA and DSA images of the considered volume. Then, we exploit tomographic imaging properties (MRA) to reconstruct a 3D model of the initial volume. The reconstructed model is the anatomic reference and is digitally projected applying conic model properties. In order to make a more effective and faster projection, the best discretization step of the volume is computed and only the volume surface is projected. The resulting image is compared to a segmented DSA image through a similarity measure. Finally, the optimal position and orientation of the model in the DSA space is iteratively found. At the end of this process and considering that the structure is known in the MRA referential (thanks to the reconstruction step) the complete matching between the two modalities is immediately obtained.
It must be noted here that the configuration of the volume in the DSA space must be unique for a given projection. This condition is verified by objects without owning symmetry axis or symmetry center, thanks to the properties of the conic projection which are linear and radiographic deformation, respectively illustrated by Fig. 2 and Fig. 3. The anatomic references satisfy this condition by nature.
A
C
B M N
m n
I (Image)
O
Object plane
Source
Source
Image
Object
Fig. 2: Radiographic deformation Fig. 3: Linear deformation.
Proc. SPIE Vol. 468156

2.2 Volume reconstruction The model is reconstructed from the MRA dataset. First, we generate a Maximum of Intensity Projection (MIP) as described below (Fig. 4).
OMod1
x
z
y
MIP
MRA Dataset
…
Pixels projection
Fig. 4: Maximum of Intensity Projection algorithm. Fig. 5: Resulting image.
The MIP resulting image is used for detecting the vascular structure through the entire MRA dataset, applying fuzzy set theory and data fusion. Fig. 6 shows an example of automatic detection performed by the algorithm. Then, the detected surfaces are stacked to reconstruct the model3 (Fig. 7).
Fig. 6: detected structure on a MRA image Fig. 7: model reconstruction from the detected structure
2.3 Parameters definition First of all, the definition of the different referential and parameters employed in the next parts is required. The DSA referential is detailed Fig. 8.
Proc. SPIE Vol. 4681 57

.
O DSA
DSA X
DSA Y
DSA Z
O ima ima X
ima Y
X 0
Y 0
SID
Source
Image
Fig. 8: Localization conventions for DSA. (SID: Source to Image Distance)
The referential origin is located to the X-rays source, the Z-axis is worn by the orthogonal line passing through the X-rays source and oriented to the image plane. The X- and Y-axis are immediately given, as X-axis is parallel to the image X-axis. The calibration parameters needed are the Source to Image Distance (SID) and the coordinates of the source projection, given by X0 and Y0.
The six degree rigid parameters are the volume position in the DSA space, given by Ovol, and the volume orientation, given by ϕ, θ, ψ, as shown on Fig 9.
O vol
vol y
vol z
vol x
θ
ϕ
ψ
Fig. 9: Six degree rigid parameters describing the model configuration.
When degree parameters are found, the homogenous matrix MVOL, is computed and applied for matching the modalities. The relation detailed in (1) gives an example of computing 3D coordinates of a point in DSA space from its 3D coordinates in MRA space, given MMRA, the homogenous matrix of the MRA referential.
MRAMRAVOLDSA PMMP ⋅⋅= (1)
Proc. SPIE Vol. 468158
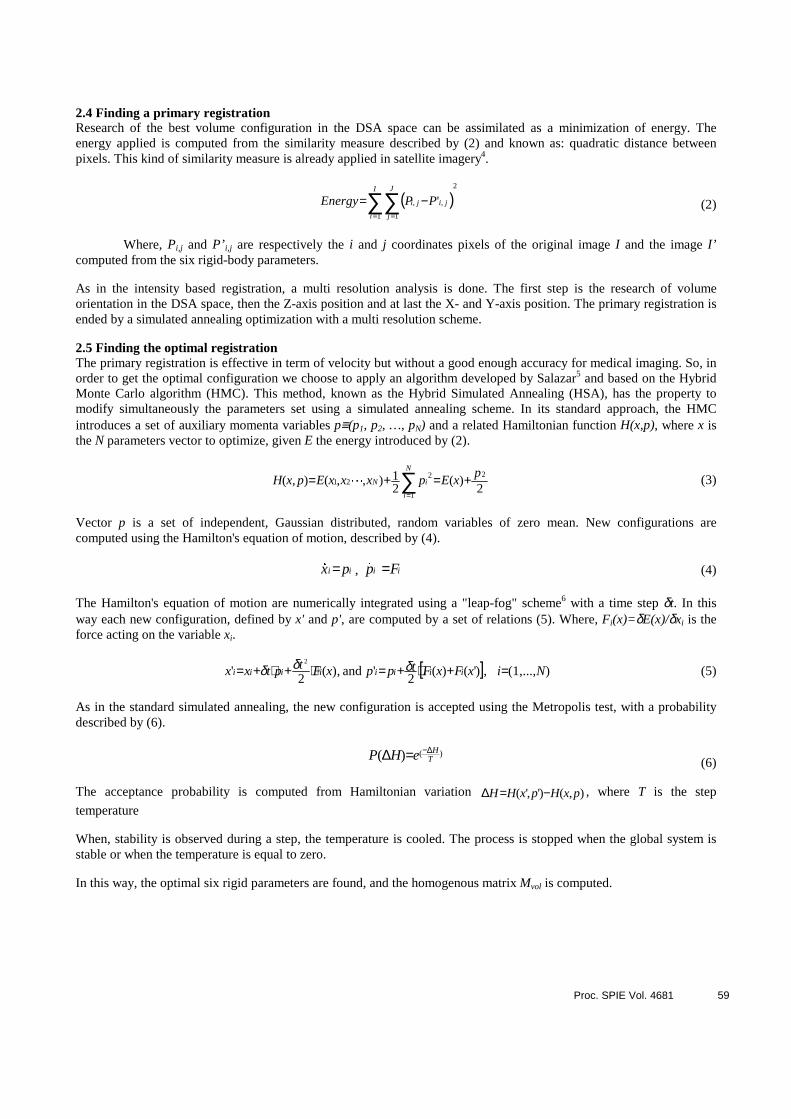
2.4 Finding a primary registration Research of the best volume configuration in the DSA space can be assimilated as a minimization of energy. The energy applied is computed from the similarity measure described by (2) and known as: quadratic distance between pixels. This kind of similarity measure is already applied in satellite imagery4.
( )2
1 1
,, '∑∑= =
−=I
i
J
j
jiji PPEnergy (2)
Where, Pi,j and P’i,j are respectively the i and j coordinates pixels of the original image I and the image I’ computed from the six rigid-body parameters.
As in the intensity based registration, a multi resolution analysis is done. The first step is the research of volume orientation in the DSA space, then the Z-axis position and at last the X- and Y-axis position. The primary registration is ended by a simulated annealing optimization with a multi resolution scheme.
2.5 Finding the optimal registration The primary registration is effective in term of velocity but without a good enough accuracy for medical imaging. So, in order to get the optimal configuration we choose to apply an algorithm developed by Salazar5 and based on the Hybrid Monte Carlo algorithm (HMC). This method, known as the Hybrid Simulated Annealing (HSA), has the property to modify simultaneously the parameters set using a simulated annealing scheme. In its standard approach, the HMC introduces a set of auxiliary momenta variables p≡(p1, p2, …, pN) and a related Hamiltonian function H(x,p), where x is the N parameters vector to optimize, given E the energy introduced by (2).
2)(
21),,(),(
2
1
221
pxEpxxxEpxH
N
i
iN +=+= ∑=
" (3)
Vector p is a set of independent, Gaussian distributed, random variables of zero mean. New configurations are computed using the Hamilton's equation of motion, described by (4).
ii px =� , ii Fp =� (4)
The Hamilton's equation of motion are numerically integrated using a "leap-fog" scheme6 with a time step δt. In this way each new configuration, defined by x' and p', are computed by a set of relations (5). Where, Fi(x)=δE(x)/δxi is the force acting on the variable xi.
[ ] ),...,1(,)'()(2
' and ,)(2
'2
NixFxFtppxFtptxx iiiiiiii =+⋅+=⋅+⋅+= δδδ (5)
As in the standard simulated annealing, the new configuration is accepted using the Metropolis test, with a probability described by (6).
)()( THeHP ∆−=∆ (6)
The acceptance probability is computed from Hamiltonian variation ),()','( pxHpxHH −=∆ , where T is the step
temperature
When, stability is observed during a step, the temperature is cooled. The process is stopped when the global system is stable or when the temperature is equal to zero.
In this way, the optimal six rigid parameters are found, and the homogenous matrix Mvol is computed.
Proc. SPIE Vol. 4681 59

3.RESULTS
Evaluation criterion are needed for validation of registration algorithm. As in standard evaluation procedures, we choose two criterion which are robustness and accuracy. The robustness defines the capability of the method to converge to an unique and optimal solution. In order to compare with the methods presented in introduction, we have performed experiments as proposed by McLaughlin and al7 for the robustness. The accuracy is evaluated on the basis of data information obtained from a vascular phantom (Fig. 10 and Fig. 11).
Fig. 10: Picture of the phantom used for the test and the validation.
Fig. 11: Model of the phantom generated from MRA dataset.
3.1 Robustness First of all, an optimal registration is computed. Then, starting positions for the registrations were chosen by perturbing the gold standard value. Four experiments were performed with the amount of perturbation increased each time, as shown in table 1. Note that in experiment proposed by McLaughlin, there is no in-plane translation (δX or δY).
Experiment # δZ δθ δϕ δψ 1 +/- 25 mm +/- 4° +/- 4° +/- 4° 2 +/- 50 mm +/- 8° +/- 8° +/- 8° 3 +/- 75 mm +/- 12° +/- 12° +/- 12° 4 +/- 100 mm +/- 16° +/- 16° +/- 16°
Table 1: Perturbation of the starting positions from the gold standard
The gold standard registration and an example of the perturbing position are respectively shown by Fig. 12 and 13.
Fig. 12: Gold standard registration Fig. 13: Perturbing position
Proc. SPIE Vol. 468160

The results of the experiments are illustrated below (Fig. 14), showing simultaneously comparison with the two others introduced methods: intensity-based registration1 and feature-based registration2.
Robustness experiments
0
10
20
30
40
50
60
70
80
90
100
1 2 3 4
Experiment Number
% S
ucc
ess Applied method
Feature based method
Intensity based method
Fig. 14: Results of the robustness experiments
We can observe a good robustness for the method. The different perturbing configurations give almost 100% of success in each case. The feature-based and intensity-based method seem to be very more sensitive to the perturbing configurations.
3.2 Accuracy In order to measure accuracy of registration, we use distance measurements. A number of particular points were chosen on the vascular phantom as described on Fig. 15.
Fig. 15: Particular point identified on the vascular phantom
Distance measurement were performed applying epipolar geometry principle using two incidences for DSA images. A such distance measurement gives accuracy for localization between several DSA projections, and the registration accuracy is thus quantified.
Fig. 16 and 17 illustrate the accuracy evaluation through the error computed from expected and measured distances for seven experiments.
Proc. SPIE Vol. 4681 61

0,00
10,00
20,00
30,00
40,00
50,00
60,00
70,00
80,00
90,00
100,00
Distance (mm)
Evaluation of the registration accuracy
Expected distance 27,10 94,01 77,70 73,50 47,00 85,18 52,00
Measured distance 27,17 94,95 78,02 74,47 46,14 85,78 52,30
1 2 3 4 5 6 7
Fig. 16: Real and measured distance in millimeter
Measurement Error
0
0,2
0,4
0,6
0,8
1
1,2
Error 0,070756338 0,93524738 0,317498037 0,972075303 0,858478569 0,600359057 0,29885276
1 2 3 4 5 6 7
Fig. 17: Error evolution in millimeter through experiments
Fig. 16 and Fig. 17 enable to observe the accuracy of the method applied. Actually, for the different distance measurements, we have obtained less than 1mm error.
4. CONCLUSION
Considering the robustness and the accuracy results, the exposed method seems to be efficient for 2D-3D registration. The feature-based method is very sensitive to the quality of both 2D and 3D skeletonisation algorithm, but offers real good result in term of computation time. The intensity-based method is very computationally intensive. Our approach offers a good accuracy, similar to the intensity-based method which is known to be more accurate than the feature-based, and is far less computationally intensive. Own registration method is based on several algorithms: a pixel-based approach (as Intensity-based registration), a fast projection algorithm and an effective optimization scheme (HSA5)
In our case, two different applications have been developed from the DSA and MRA registration. ‘Virtual DSAs’ created from the MRA dataset using conic projection and MIP properties are superimposed with real DSA examination images. Fig. 18 and 19 show an example of virtual DSA image.
Proc. SPIE Vol. 468162

Fig. 18: Virtual DSA image Fig. 19: Original DSA image
Fig. 18 and Fig.19 show that virtual DSA and original DSA are very similar. We have observed a good matching between original and virtual DSA using transparency8 superimposition.
We have also developed a 3D navigator application for exploring in real time and simultaneously DSA and MRA images. The navigation is modeled by a three dimensional cursor which gives a position in each plan of an MRA exam and on the different incidences of the DSA exam as illustrated Fig. 20.
3D Target : 46.7 18.4 96.9 MRA Target : 24.8 18.1 72.72
DSA 1 Target : 105.2 46.4 DSA 2 Target : 192.0 81.26
Fig. 20: Example of interactive navigation
Many other applications could be developed from the exposed method. First, the developments of the MRA techniques could be validated using matching and comparison with the DSA as a gold standard. In surgical context, the approach may be used for preoperative planning. The data fusion brought from the multi-modality imaging is an important source of information in Computed Assisted Surgery.
Proc. SPIE Vol. 4681 63

ACKNOWLEDGMENTS
We wish to thank the CREATIS Lab, Lyon France, which courtesy lets us managed their vascular phantom CORONIX for our validation experiments.
REFERENCES 1. G. P. Penney, “Registration of tomographic images to X-ray Projections for use in image guided interventions”,
Phd thesis, University College London. 2. Y. Kita, D. L. Wilson & J. A. Noble, “Real-time registration of 3D cerebral vessels to X-ray angiograms”,
MICCAI’98, pp. 1125-1133, 1998. 3. S. Vial, D. Gibon, C. Vasseur, J. Rousseau,” Volume delineation by fusion of fuzzy sets obtained from multiplanar
tomographic images”, Medical Imaging, IEEE Transactions on 20, pp 1362-1372,2001. 4. M. Svedlow, C. D. McGillem and P. E. Anuta, “Image registration: similarity measure and preprocessing method
comparison”, IEEE Trans. on Aerospace and Electronics Systems 14, pp 141-149,1978. 5. R. Salazar and R. Toral, “Simulated Annealing using Hybrid Monte Carlo”, Journal of Statistical Physics 89, p.
1047, 1997. 6. P. Hut, J. Making and S. McMillan, “Building a better leapfrog”, The Astrophysical Journal 443, pp L93-L96,
1995 7. R. A. McLaughlin, J. Hipwell, G. P. Penney, K. Rhode and A. Chung, “Intensity-based registration versus feature-
based registration for neurointerventions”, Medical Image Understanding and Analysis 2001. 8. A. Mammen., “Transparency and antialiasing algorithms with the virtual pixel maps technique", IEEE Computer
Craphics and applications, 9, pp. 43-55, 1989.
Proc. SPIE Vol. 468164
Copyright © 2022 FDOKUMEN