Quantitative approach in iron oxides and oxyhydroxides by vibrational analysis
7
ÓPTICA PURA Y APLICADA. www.sedoptica.es Opt. Pura Apl. 45 (3) 269‐275 (2012) ‐ 269 ‐ © Sociedad Española de Óptica Sección Especial / Special Section: XII Encuentro Nacional de Óptica (ENO) ‐ III Conferencia Andina y del Caribe en Óptica y sus Aplicaciones (CANCOA) Quantitative approach in iron oxides and oxihydroxides by vibrational analysis Aproximación cuantitativa en óxidos y oxihidróxidos de hierro mediante análisis vibracional A. F. Betancur (1,*) , F. R. Pérez (1) , M. del M. Correa (1) , C. A. Barrero (2) 1. Grupo de Óptica y Espectroscopía (GOE), Universidad Pontificia Bolivariana, A.A. 56006, Medellín, Colombia. 2. Grupo de Estado Sólido (GES), Universidad de Antioquia, A.A. 1226, Medellín, Colombia. (*) Email: [email protected] Recibido / Received: 15/05/2012. Revisado / Revised: 18/07/2012. Aceptado / Accepted: 19/07/2012. DOI: http://dx.doi.org/10.7149/OPA.45.3.269 ABSTRACT: Four different mixtures of goethite, hematite and magnetite in different mass fraction percentage, were prepared. Raman and infrared spectroscopic measurements were carried out. For both sets of spectrum, mathematical relationships between the Raman and Infrared fraction, as obtained from the characteristic bands of each phase, and the respective mass fraction, were established. In most cases, linear relationships were obtained. A problem sample was used in order to estimate their respective relative phase abundances obtaining better results from the Raman spectroscopy measurements. Key words: Infrared Spectroscopy, Raman Spectroscopy, Iron Oxides, Quantitative Analysis. RESUMEN: Se prepararon cuatro mezclas distintas de goethita, hematita y magnetita en diferentes porcentajes de fracción másica. Se realizaron medidas de espectroscopía Raman e infrarrojo. Para ambos conjuntos de espectros se obtuvieron relaciones matemáticas entre la fracción Raman y fracción Infrarroja, obtenidas estas a partir de las bandas características para cada fase, con su respectiva fracción másica. En la mayoría de los casos se obtuvieron relaciones lineales. Se usó una muestra problema para la estimación de las abundancias relativas obteniendo mejores resultados a partir de las medidas de espectroscopía Raman. Palabras clave: Espectroscopía Infrarroja, Espectroscopía Raman, Óxidos de Hierro, Análisis Cuantitativo. REFERENCIAS Y ENLACES / REFERENCES AND LINKS [1]. R. M. Cornell, U. Schwertmann, The Iron Oxides , Willey‐VCH Verlag GmbH & Co., Weinheim (2003). [2]. T. Nishimura, H. Katayama, K. Noda, T. Kodama, “Effect of Co and Ni on the corrosion behavior of low alloy steels in wet/dry environments”, Corros. Sci. 42, 1611‐1621 (2000). [3]. F. R. Pérez, C. A. Barrero, O. Arnache, L. C. Sánchez, K. E. García, A. R. H. Walker, “Structural properties of iron phases formed on low alloy steels immersed in sodium chloride‐richsolutions”, Physica B 404, 1347‐1353 (2009). [4]. D. L. A. de Faria, S. V. Silva, M. T. Olivera, “Raman microspectroscopy of some iron oxides and oxyhydroxides”, J. Raman Spectrosc. 28, 873‐878 (1997). [5]. H. Tamura, “The role of rusts in corrosion and corrosion protection of iron and steel”, Corros. Sci. 50, 1872‐1883 (2008).
-
Upload
independent -
Category
Documents
-
view
4 -
download
0
Transcript of Quantitative approach in iron oxides and oxyhydroxides by vibrational analysis

ÓPTICA PURA Y APLICADA. www.sedoptica.es
Opt. Pura Apl. 45 (3) 269‐275 (2012) ‐ 269 ‐ © Sociedad Española de Óptica
Sección Especial / Special Section: XII Encuentro Nacional de Óptica (ENO) ‐ III Conferencia Andina y del Caribe en Óptica y sus Aplicaciones (CANCOA)
Quantitative approach in iron oxides and oxihydroxides by vibrational analysis
Aproximación cuantitativa en óxidos y oxihidróxidos de hierro mediante
análisis vibracional
A. F. Betancur(1,*), F. R. Pérez(1), M. del M. Correa(1), C. A. Barrero(2) 1. Grupo de Óptica y Espectroscopía (GOE), Universidad Pontificia Bolivariana, A.A. 56006, Medellín, Colombia.
2. Grupo de Estado Sólido (GES), Universidad de Antioquia, A.A. 1226, Medellín, Colombia. (*) Email: [email protected]
Recibido / Received: 15/05/2012. Revisado / Revised: 18/07/2012. Aceptado / Accepted: 19/07/2012.
DOI: http://dx.doi.org/10.7149/OPA.45.3.269
ABSTRACT:
Four different mixtures of goethite, hematite and magnetite in different mass fraction percentage, were prepared. Raman and infrared spectroscopic measurements were carried out. For both sets of spectrum, mathematical relationships between the Raman and Infrared fraction, as obtained from the characteristic bands of each phase, and the respective mass fraction, were established. In most cases, linear relationships were obtained. A problem sample was used in order to estimate their respective relative phase abundances obtaining better results from the Raman spectroscopy measurements.
Key words: Infrared Spectroscopy, Raman Spectroscopy, Iron Oxides, Quantitative Analysis.
RESUMEN:
Se prepararon cuatro mezclas distintas de goethita, hematita y magnetita en diferentes porcentajes de fracción másica. Se realizaron medidas de espectroscopía Raman e infrarrojo. Para ambos conjuntos de espectros se obtuvieron relaciones matemáticas entre la fracción Raman y fracción Infrarroja, obtenidas estas a partir de las bandas características para cada fase, con su respectiva fracción másica. En la mayoría de los casos se obtuvieron relaciones lineales. Se usó una muestra problema para la estimación de las abundancias relativas obteniendo mejores resultados a partir de las medidas de espectroscopía Raman.
Palabras clave: Espectroscopía Infrarroja, Espectroscopía Raman, Óxidos de Hierro, Análisis Cuantitativo.
REFERENCIAS Y ENLACES / REFERENCES AND LINKS
[1]. R. M. Cornell, U. Schwertmann, The Iron Oxides, Willey‐VCH Verlag GmbH & Co., Weinheim (2003).
[2]. T. Nishimura, H. Katayama, K. Noda, T. Kodama, “Effect of Co and Ni on the corrosion behavior of low alloy steels in wet/dry environments”, Corros. Sci. 42, 1611‐1621 (2000).
[3]. F. R. Pérez, C. A. Barrero, O. Arnache, L. C. Sánchez, K. E. García, A. R. H. Walker, “Structural properties of iron phases formed on low alloy steels immersed in sodium chloride‐richsolutions”, Physica B 404, 1347‐1353 (2009).
[4]. D. L. A. de Faria, S. V. Silva, M. T. Olivera, “Raman microspectroscopy of some iron oxides and oxyhydroxides”, J. Raman Spectrosc. 28, 873‐878 (1997).
[5]. H. Tamura, “The role of rusts in corrosion and corrosion protection of iron and steel”, Corros. Sci. 50, 1872‐1883 (2008).
ÓPTICA PURA Y APLICADA. www.sedoptica.es.
Opt. Pura Apl. 45 (3) 269‐275 (2012) ‐ 270 ‐ © Sociedad Española de Óptica
[6]. F. R. Pérez, C. A. Barrero, A. R. H. Walker, K. E. García, K. Nomura, “Effects of chloride concentration, immersion time and steel composition on the spinel phase formation”, Mater. Chem. Phys. 117, 214‐223 (2009).
[7]. F. R. Pérez, C. A. Barrero, K. E. García, “Factors affecting the amount of corroded iron converted into adherent rust in steels submitted to immersion tests”, Corros. Sci. 52, 2582‐2591 (2010).
[8]. M. Yamashita, T. Shimizu, H. Konishi, J. Mizuki, H. Uchida, “Structure and protective performance of atmospheric corrosion product of Fe–Cr alloy film analyzed by Mössbauer spectroscopy and with synchrotron radiation X‐rays”, Corros. Sci. 45, 381‐394 (2003).
[9]. H. Namduriand, S. Nasrazadani, “Quantitative analysis of iron oxides using Fourier transform infrared spectrophotometry”, Corros. Sci. 50, 2493–2497 (2008).
[10]. S. J. Oh, D. C. Cook, T. E. Townsend, “Characterization of iron oxides commonly formed as corrosion products on steel”, Hyperfine Interact. 112, 59‐65 (1998).
[11]. L. Legrand, G. Sagon, S. Lecomte, A. Chausse, R. Messina, “A Raman and infrared study of a new carbonate green rust obtained by electrochemical way”, Corros. Sci. 43, 1739–1749 (2001).
[12]. H. D. Ruan, R. L. Frost, J. T. Kloprogge, L. Duong, “Infrared spectroscopy of goethite dehydroxylation. II. Effect of aluminium substitution on the behaviour of hydroxyl units”, Spectrochim. Acta A 58, 479–491 (2002).
[13]. F. Dubois, C. Mendibide, T. Pagnier, F. Perrard, C. Duret, “Raman mapping of corrosion products formed onto spring steels during salt spray experiments. A correlation between the scale composition and the corrosion resistance”, Corros. Sci. 50, 3401–3409 (2008).
[14]. F. R. Pérez, C. A. Barrero, K. E. García, A. R. H. Walker, “Raman microscopy as a tool for the rust composition distribution analysis”, Rev. Col. Fis. 42, 2, 187‐190 (2010).
[15]. X. Su, C. Yu, C. Qiang, “Synthesis of ‐Fe2O3 nanobelts and nanoflakes by thermal oxidation and study to their magnetic properties”, Appl. Surf. Sci. 257, 9014–9018 (2011).
[16]. J. P. Labbé, J. Lédion, F. Hui, “Infrared spectrometry for solid phase analysis: Corrosion rustsm”, Corros. Sci. 50, 1228–1234 (2008).
[17]. M. Gotic, S. Music, “Mössbauer, FT‐IR and FE SEM investigation of iron oxides precipitated from FeSO4 solutions”, J. Mol. Struct. 834–836, 445–453 (2007).
[18]. S. A. Fysh, P. M. Fredericks, “Fourier transform infrared studies of aluminous goethites and hematites”, Clay Miner. 31, 377‐382 (1983).
[19]. J. Desai, H. M. Pathan, S. Min, K. Jung, O. Joo, “FT‐IR, XPS and PEC characterization of spray deposited hematite thin films”, Appl. Surf. Sci. 252, 1870–1875 (2005).
1. Introduction
The fields of application of iron oxides are
tremendously wide. In a great number of
processes including steels making, power
generation, nuclear wastes disposal,
pharmaceutical, cosmetic, petrochemical,
corrosion steels among other, the
comprehension of the formation and
transformation of iron oxides is necessary [1]. In
the case of corrosion, its methodological study
contributed to understand the physical and
chemical properties of their products, which is
important to detect the evolution of rust layers
in order to have a comprehension about its
protective properties [2‐3]. According to several
authors, the understanding of the chemical and
physical mechanisms involved in the oxidation
reaction and the evolution and structure of the
rust layer, is important to control the effects of
corrosion [4‐5].
The characteristics of the adherent rust layer
formed on steels, such as composition,
morphology and relative amounts, determine
the resistance to corrosion. The precise
determination of these relative amounts of each
phase presented in rust is one important task for
researchers from the corrosion workers [6, 7].
Standard methods for the identification and
characterization of iron oxides have traditionally
been X‐ray diffraction (XRD) and/or Mössbauer
spectroscopy (MS) [8]. MS technique has an
operational disadvantage related to the
manipulation of a radioactive source. In addition,
measurements performed on several very low
temperatures are necessary in order to properly
ÓPTICA PURA Y APLICADA. www.sedoptica.es.
Opt. Pura Apl. 45 (3) 269‐275 (2012) ‐ 271 ‐ © Sociedad Española de Óptica
differentiate magnetic and super‐paramagnetic
goethite and other phases. On the other hand,
XRD is unable to differentiate between hematite
and maghemite [9].
Due to the complexity of steel corrosion
products, normally a combination of analytical
techniques including Raman and infrared
spectroscopies is commonly used [10,11].
However, a few of works address quantitative
analysis. Infrared [9,12] and Raman
spectroscopies [13,14] have individually applied
to estimate the relative amounts of iron phases
on corrosion products. In this work, different
combinations of goethite, magnetite and
hematite were prepared varying their relative
abundances. Measurements of Fourier
Transform Infrared Spectroscopy (FT‐IR) and
Confocal Raman Microscopy (CRM) were
performed. The correlations between the Raman
or Infrared fraction of the most representative
bands of all phases and their respective mass
fraction were obtained. The results obtained by
the two techniques are compared and discussed.
2. Materials and methods
2.a. Experimental
Analytical grade goethite, hematite and
magnetite from Alpha Aeser were used. The
samples were prepared by mixing of those three
different iron oxide phases at different mass
fractions. First, four different amounts of each
phase were weighed with an analytical balance.
They were mixed and ground in an agate mortar
up to have a uniform color and finer powder.
Finally, the samples were store in sealed bags up
to be measured. The different samples have been
labeled as S1, S2, S3 and S4 (See Table I).
FTIR spectra were carried out on a Nicolet
6700 FTIR in attenuated total reflection (ATR)
mode by using a diamond crystal probe. With
this crystal the optimal measurement range is
between 650 cm‐1 and 4200 cm‐1. The collection
was done for a 256 scans with a 4 cm‐1
resolution. The Raman spectra were obtained by
using a Horiba Jobin‐Yvon Model LabRAM HR
High Resolution, with the laser line of 632.81 nm
and a 100X microscope objective. The spectra
were collected at 120 s integration time and the
nominal power into the sample was about 0.35
mW.
Table I
Mass fraction percentage of four different combinations of goethite, hematite and magnetite.
Sample Goethite Hematite Magnetite
S1 33.66 33.42 32.92
S2 74.94 15.42 9.63
S3 7.29 89.53 3.18
S4 17.92 11.34 70.74
2.b. Raman and infrared fraction
Raman and infrared spectra from all mixing of
iron oxides samples and from the pure phases
were taken. Characteristic bands of each phase
were selected by using not only the information
presented in the literature [1,4,6‐9] but also our
measurements. As it was expected, all the bands
in the spectra coming from the different mixing
showed different relative intensities at different
concentrations. In order to establish a
relationship between the band intensities of
each phase and their respective concentration,
we proceeded as it is explained. First, the total
intensity for a phase was defined as:
, 1
where is the intensity of the characteristic
band corresponding to a specific phase. The
label k is the number of those characteristics
bands. In other words, is the sum of all
( = 1, … , ) intensities of the selected bands for
the phase . Here, the label i stands for goethite,
magnetite or hematite ( = 1, … , ). Then, the
infrared or Raman fractions, , was defined
dividing by the summation of taken on all
the phases. In this work, = 3, i.e. goethite,
hematite and magnetite, respectively. In this
way, the Raman (or infrared) fraction of the
phase was calculated as it follows:
∑. 2
It is good to say that the intensities used in
this procedure are normalized as it will be
explained in Section 3.c.
ÓPTICA PURA Y APLICADA. www.sedoptica.es.
Opt. Pura Apl. 45 (3) 269‐275 (2012) ‐ 272 ‐ © Sociedad Española de Óptica
Different factors like crystallinity, particle
size, temperature, instrumental noise and
nanometric structure, among other, could affect
the vibrational characteristics of a material.
Hence, the procedure to estimate the relative
abundances of each phase, are not a simple task.
In this work we propose that in Eq. (2) could
be a function of therelative abundances under
the supposition that is the concentration the
property that more hardly affects the spectral
intensity.
3. Results and discussion
A brief description of the major infrared and
Raman bands of the iron phases used in this
paper is presented. Hence, based on results
reported for different authors, the experimental
bands were chosen.
3.a. Raman spectroscopy (CRM)
The most representative bands of hematite are
around 228.6 cm‐1and 295.02 cm‐1. According to
Faria et al. [4], these bands of hematite are two
of the seven Raman active phonons. These two
bands were taken for quantitative analysis. The
remaining five phonon bands at about 247.9,
300.9, 413.8, 500.2 and 614.5 cm‐1 [4], all of
them were found in our spectrum. From the
literature, the band at about 1317.8 cm‐1 is a
vibration which has some unclear origin. Faria et
al. [4] says that this band is caused by the
scattering of two magnons in the structure, but
according to Su et al. [15], this phonon consists
in a second harmonic vibration. It is important to
say that the band of hematite at 1317.8 cm‐1 is
close to the magnetite at approximately 1304.9
cm‐1. This causes an overlapping in vibrations
when these two phases are mixed, making
difficult their identification by using those bands.
Therefore, these bands were not selected as
analytical bands of hematite and magnetite. The
band of goethite that stands out over other
active modes in Raman spectra is 388.8 cm‐1.
The band at about 552.3 cm‐1 does not appear in
the other analysed phases, therefore, it was used
for the development mathematical fitting. In the
case of magnetite, the most representative band
is found at about 667.2 cm‐1, hence we selected it
as the analytical band. The other bands cannot
be selected, because they interfere with bands
from the other phases [4,15].
3.b. Infrared spectroscopy (FT‐IR)
The quantification of iron oxides by infrared
spectroscopy is not common, although a good
number of qualitative studies are found in
literature [4,6,7]. Recently, proposals to use
infrared [9] and Raman spectroscopy [13] in
quantitative studies on iron oxides have been
reported. According to Gotic and Music [17], the
IR band at 3144 cm‐1 can be assigned to the OH
stretching mode in the goethite structure (‐FeOOH). Therefore, this vibration cannot be
selected as a characteristic band of goethite.
Most of authors agree the major bands of
goethite are at about 793cm‐1 and 898 cm‐1
[1,17]. In this way, the analytical bands selected
were those found at 792.6 cm‐1 and 896.7 cm‐1.
In magnetite and hematite mixing, the
differentiation of their bands is difficult by
infrared measurements. This is due to their
characteristics vibrations are close. Namduri et
al. [9] assigned the bands at 540 cm‐1 and 570
cm‐1 as analytical bands of hematite and
magnetite, respectively. Fysh and Fredericks
[18] working with hematite at high temperature,
reported bands at 470 and 550 cm‐1. Desai et al.
[19] showed bands of hematite at 476 and 616
cm‐1. Gotic and Music [17] reported bands at 360
cm‐1 and 565 cm‐1 for magnetite. Labbé et al. [16]
reported a band at 570 cm‐1 as the major band of
magnetite. In this work, the bands used were
those at 416 cm‐1 and 430 cm‐1 for hematite, and
570 cm‐1 for magnetite.
3.c. Combined phases: Raman (CRM) and
Infrared (FT‐IR) measurements
Figures 1 to 4 show the CRM and FT‐IR spectra
from the iron phase mixtures, respectively. No
fitting were performed on the spectra. However,
in order to minimize the effect of the baseline on
the data, all spectra were normalized by using
the following equation:
, 3
where , , and stands for the
normalised, the absolute, the maximum absolute
and minimum absolute intensity, respectively of
all spectrum.
ÓPTICA PURA Y APLICADA. www.sedoptica.es.
Opt. Pura Apl. 45 (3) 269‐275 (2012) ‐ 273 ‐ © Sociedad Española de Óptica
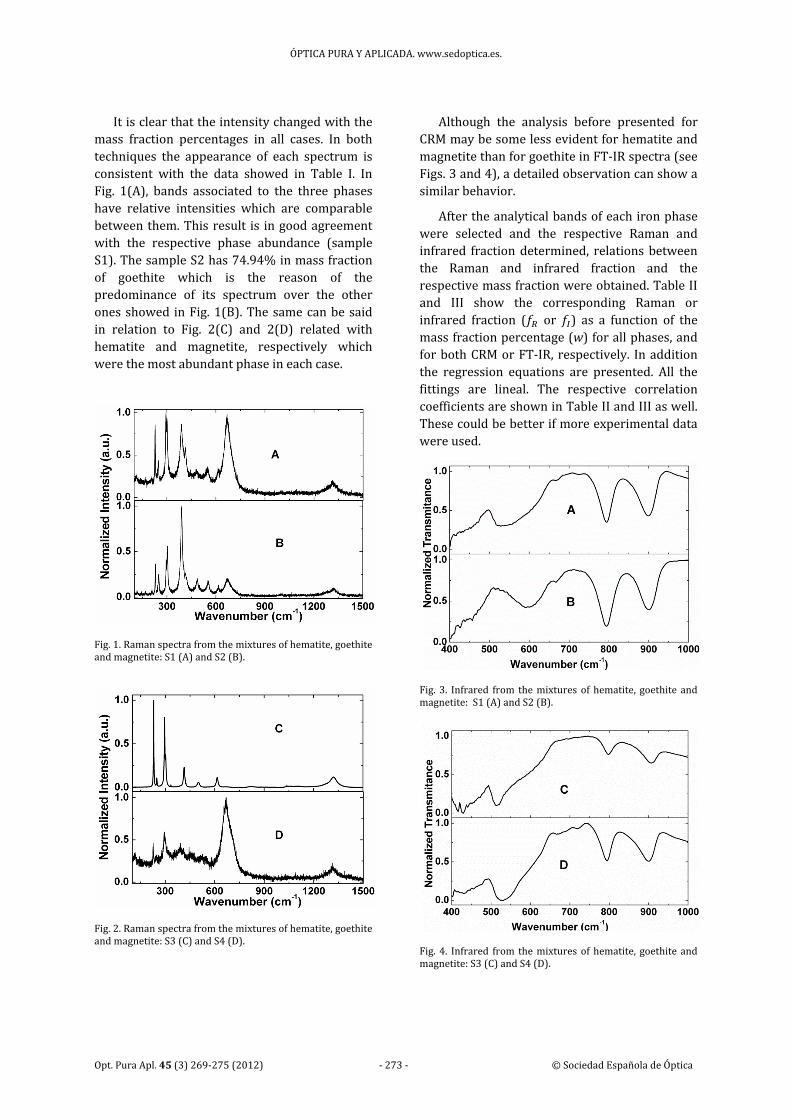
It is clear that the intensity changed with the
mass fraction percentages in all cases. In both
techniques the appearance of each spectrum is
consistent with the data showed in Table I. In
Fig. 1(A), bands associated to the three phases
have relative intensities which are comparable
between them. This result is in good agreement
with the respective phase abundance (sample
S1). The sample S2 has 74.94% in mass fraction
of goethite which is the reason of the
predominance of its spectrum over the other
ones showed in Fig. 1(B). The same can be said
in relation to Fig. 2(C) and 2(D) related with
hematite and magnetite, respectively which
were the most abundant phase in each case.
Fig. 1. Raman spectra from the mixtures of hematite, goethite and magnetite: S1 (A) and S2 (B).
Fig. 2. Raman spectra from the mixtures of hematite, goethite and magnetite: S3 (C) and S4 (D).
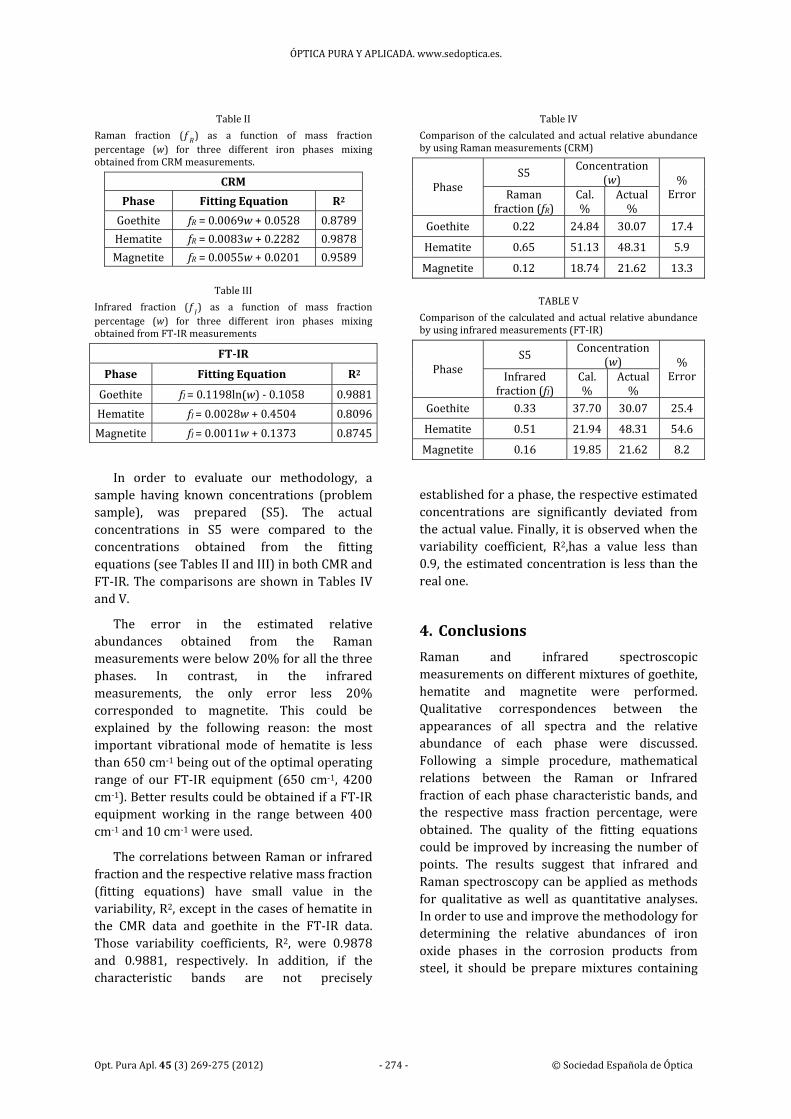
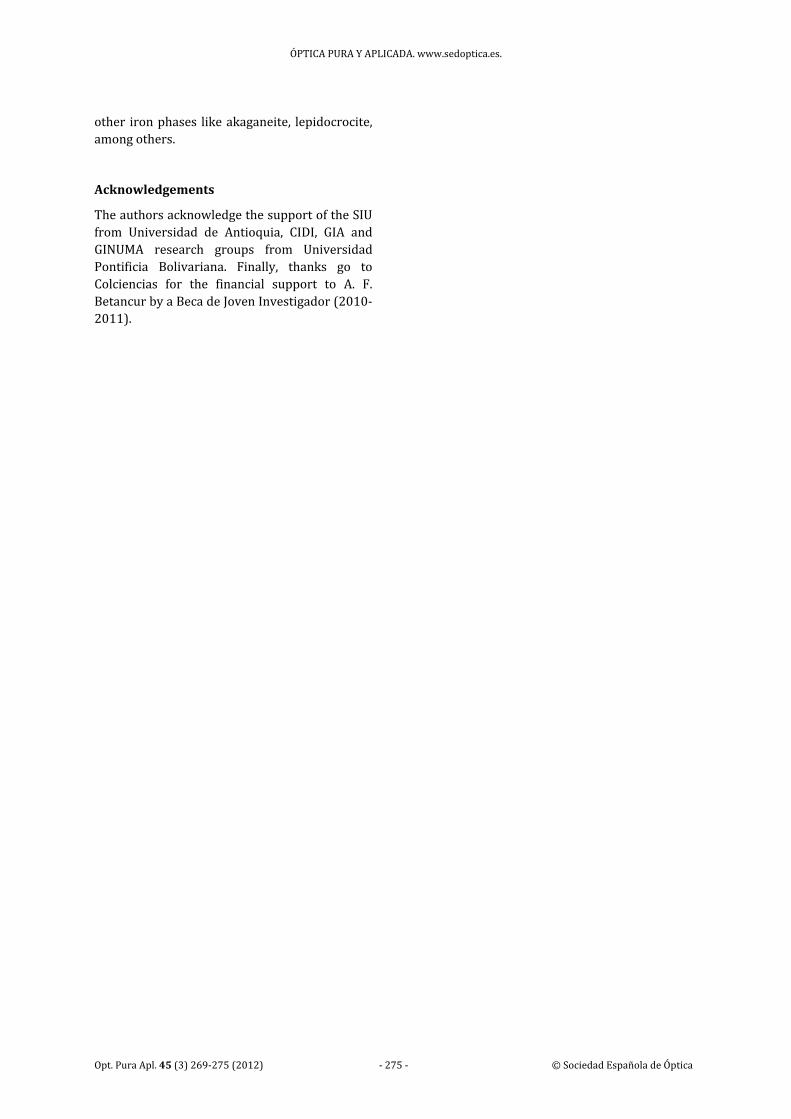
Although the analysis before presented for
CRM may be some less evident for hematite and
magnetite than for goethite in FT‐IR spectra (see
Figs. 3 and 4), a detailed observation can show a
similar behavior.
After the analytical bands of each iron phase
were selected and the respective Raman and
infrared fraction determined, relations between
the Raman and infrared fraction and the
respective mass fraction were obtained. Table II
and III show the corresponding Raman or
infrared fraction ( or ) as a function of the
mass fraction percentage (w) for all phases, and
for both CRM or FT‐IR, respectively. In addition
the regression equations are presented. All the
fittings are lineal. The respective correlation
coefficients are shown in Table II and III as well.
These could be better if more experimental data
were used.
Fig. 3. Infrared from the mixtures of hematite, goethite and magnetite: S1 (A) and S2 (B).
Fig. 4. Infrared from the mixtures of hematite, goethite and magnetite: S3 (C) and S4 (D).
ÓPTICA PURA Y APLICADA. www.sedoptica.es.
Opt. Pura Apl. 45 (3) 269‐275 (2012) ‐ 274 ‐ © Sociedad Española de Óptica
Table II
Raman fraction ( ) as a function of mass fraction
percentage ( ) for three different iron phases mixing obtained from CRM measurements.
CRM
Phase Fitting Equation R2
Goethite fR = 0.0069w + 0.0528 0.8789
Hematite fR = 0.0083w + 0.2282 0.9878
Magnetite fR = 0.0055w + 0.0201 0.9589
Table III
Infrared fraction ( ) as a function of mass fraction
percentage ( ) for three different iron phases mixing obtained from FT‐IR measurements
FT‐IR
Phase Fitting Equation R2
Goethite fI = 0.1198ln(w) ‐ 0.1058 0.9881
Hematite fI = 0.0028w + 0.4504 0.8096
Magnetite fI = 0.0011w + 0.1373 0.8745
In order to evaluate our methodology, a
sample having known concentrations (problem
sample), was prepared (S5). The actual
concentrations in S5 were compared to the
concentrations obtained from the fitting
equations (see Tables II and III) in both CMR and
FT‐IR. The comparisons are shown in Tables IV
and V.
The error in the estimated relative
abundances obtained from the Raman
measurements were below 20% for all the three
phases. In contrast, in the infrared
measurements, the only error less 20%
corresponded to magnetite. This could be
explained by the following reason: the most
important vibrational mode of hematite is less
than 650 cm‐1 being out of the optimal operating
range of our FT‐IR equipment (650 cm‐1, 4200
cm‐1). Better results could be obtained if a FT‐IR
equipment working in the range between 400
cm‐1 and 10 cm‐1 were used.
The correlations between Raman or infrared
fraction and the respective relative mass fraction
(fitting equations) have small value in the
variability, R2, except in the cases of hematite in
the CMR data and goethite in the FT‐IR data.
Those variability coefficients, R2, were 0.9878
and 0.9881, respectively. In addition, if the
characteristic bands are not precisely
Table IV
Comparison of the calculated and actual relative abundance by using Raman measurements (CRM)
Phase S5
Concentration (w) %
Error Raman fraction (fR)
Cal. %
Actual %
Goethite 0.22 24.84 30.07 17.4
Hematite 0.65 51.13 48.31 5.9
Magnetite 0.12 18.74 21.62 13.3
TABLE V
Comparison of the calculated and actual relative abundance by using infrared measurements (FT‐IR)
Phase S5
Concentration (w) %
Error Infrared fraction (fI)
Cal. %
Actual %
Goethite 0.33 37.70 30.07 25.4
Hematite 0.51 21.94 48.31 54.6
Magnetite 0.16 19.85 21.62 8.2
established for a phase, the respective estimated
concentrations are significantly deviated from
the actual value. Finally, it is observed when the
variability coefficient, R2,has a value less than
0.9, the estimated concentration is less than the
real one.
4. Conclusions
Raman and infrared spectroscopic
measurements on different mixtures of goethite,
hematite and magnetite were performed.
Qualitative correspondences between the
appearances of all spectra and the relative
abundance of each phase were discussed.
Following a simple procedure, mathematical
relations between the Raman or Infrared
fraction of each phase characteristic bands, and
the respective mass fraction percentage, were
obtained. The quality of the fitting equations
could be improved by increasing the number of
points. The results suggest that infrared and
Raman spectroscopy can be applied as methods
for qualitative as well as quantitative analyses.
In order to use and improve the methodology for
determining the relative abundances of iron
oxide phases in the corrosion products from
steel, it should be prepare mixtures containing
ÓPTICA PURA Y APLICADA. www.sedoptica.es.
Opt. Pura Apl. 45 (3) 269‐275 (2012) ‐ 275 ‐ © Sociedad Española de Óptica
other iron phases like akaganeite, lepidocrocite,
among others.
Acknowledgements
The authors acknowledge the support of the SIU
from Universidad de Antioquia, CIDI, GIA and
GINUMA research groups from Universidad
Pontificia Bolivariana. Finally, thanks go to
Colciencias for the financial support to A. F.
Betancur by a Beca de Joven Investigador (2010‐
2011).