Quantifying nickel in soils and plants in an ultramafic area in Philippines
10
Environ Monit Assess DOI 10.1007/s10661-009-1067-6 Quantifying nickel in soils and plants in an ultramafic area in Philippines Janice P. Susaya · Ki-Hyun Kim · Victor B. Asio · Zueng-Sang Chen · Ian Navarrete Received: 3 March 2009 / Accepted: 30 June 2009 © Springer Science + Business Media B.V. 2009 Abstract In this study, concentrations of nickel (Ni) were quantified in the soils and plants in the agricultural areas of Salcedo watershed in Eastern Samar Island, Philippines. The quantity of total Ni in soils (TS-Ni) was significantly high with a mean of 1,409 mg kg −1 , while the soil available Ni (SA-Ni) was low with a mean of 8.66 mg kg −1 . As the levels of TS-Ni in the Salcedo watershed greatly exceeded the maximum allowable concen- trations for agricultural soils, the site is not suit- able for agricultural purposes. Despite significant TS-Ni levels, SA-Ni levels were very low due to tight binding between Ni and soil components. Consequently, all plants investigated did not meet the criterion for a Ni hyperaccumulator plant with low Ni contents (mean TP-Ni of 14.7 mg kg −1 ). J. P. Susaya · K.-H. Kim (B ) Department of Earth and Environmental Sciences, Sejong University, Seoul, Korea e-mail: [email protected] V. B. Asio Department of Agronomy and Soil Science, Visayas State University, Baybay, Leyte, Philippines Z.-S. Chen Department of Agricultural Chemistry, National Taiwan University, Taipei, Taiwan I. Navarrete United Graduate School of Agricultural Sciences, Iwate University, Ueda, Morioka, Iwate, Japan Comparison of Ni levels between food plants and its recommended daily intake (RDI) suggests that consumption of food-plants grown in the study area is unlikely to pose health risks. However, caution must be taken against combined consump- tion of food plants with high Ni levels or their prolonged consumption, as it can induce accumu- lation of Ni above RDI. Keywords Nickel · Ultramafic · Soil · Bioaccumulation · Plant Introduction Nickel (Ni) is considered an essential micronutri- ent for plants, humans, and animals. It can exist in trace amounts in air, food, drinking water, and soils (Al-Khlaifat and Al-Khashman 2007; Lemos et al. 2007a, b; Kabata-Pendias 2004). Bioavailable forms of Ni can be released to the ecosystem via transport across the soil, groundwater, and other water systems (Huang 1997). They can then be subject to trophic chains and residue in tissues of plants, animals, and humans (Vassilieva et al. 1997). For instance, Marzec (2004) found a daily intake of Ni to be 124–166 μg in adults in the Lublin region of Poland. Although Ni plays an important role in the metabolism of humans and animals, its intake in excessive amounts or over a prolonged period
Transcript of Quantifying nickel in soils and plants in an ultramafic area in Philippines
Environ Monit AssessDOI 10.1007/s10661-009-1067-6
Quantifying nickel in soils and plants in an ultramaficarea in Philippines
Janice P. Susaya · Ki-Hyun Kim · Victor B. Asio ·Zueng-Sang Chen · Ian Navarrete
Received: 3 March 2009 / Accepted: 30 June 2009© Springer Science + Business Media B.V. 2009
Abstract In this study, concentrations of nickel(Ni) were quantified in the soils and plants in theagricultural areas of Salcedo watershed in EasternSamar Island, Philippines. The quantity of totalNi in soils (TS-Ni) was significantly high with amean of 1,409 mg kg−1, while the soil available Ni(SA-Ni) was low with a mean of 8.66 mg kg−1.As the levels of TS-Ni in the Salcedo watershedgreatly exceeded the maximum allowable concen-trations for agricultural soils, the site is not suit-able for agricultural purposes. Despite significantTS-Ni levels, SA-Ni levels were very low due totight binding between Ni and soil components.Consequently, all plants investigated did not meetthe criterion for a Ni hyperaccumulator plant withlow Ni contents (mean TP-Ni of 14.7 mg kg−1).
J. P. Susaya · K.-H. Kim (B)Department of Earth and Environmental Sciences,Sejong University, Seoul, Koreae-mail: [email protected]
V. B. AsioDepartment of Agronomy and Soil Science,Visayas State University, Baybay, Leyte, Philippines
Z.-S. ChenDepartment of Agricultural Chemistry,National Taiwan University, Taipei, Taiwan
I. NavarreteUnited Graduate School of Agricultural Sciences,Iwate University, Ueda, Morioka, Iwate, Japan
Comparison of Ni levels between food plants andits recommended daily intake (RDI) suggests thatconsumption of food-plants grown in the studyarea is unlikely to pose health risks. However,caution must be taken against combined consump-tion of food plants with high Ni levels or theirprolonged consumption, as it can induce accumu-lation of Ni above RDI.
Keywords Nickel · Ultramafic · Soil ·Bioaccumulation · Plant
Introduction
Nickel (Ni) is considered an essential micronutri-ent for plants, humans, and animals. It can existin trace amounts in air, food, drinking water, andsoils (Al-Khlaifat and Al-Khashman 2007; Lemoset al. 2007a, b; Kabata-Pendias 2004). Bioavailableforms of Ni can be released to the ecosystem viatransport across the soil, groundwater, and otherwater systems (Huang 1997). They can then besubject to trophic chains and residue in tissuesof plants, animals, and humans (Vassilieva et al.1997). For instance, Marzec (2004) found a dailyintake of Ni to be 124–166 μg in adults in theLublin region of Poland.
Although Ni plays an important role in themetabolism of humans and animals, its intake inexcessive amounts or over a prolonged period
Environ Monit Assess
could pose serious health risks. If Ni contaminantsmove into an organism, physiological resistance tomicrobes is reduced to weaken the organism’s ac-tivity considerably (Vassilieva et al. 1997). Theseauthors found that children living in pollutedareas have hypertrophy of tonsils, enlarged lym-phatic nodes, and enlarged livers. There is evi-dence that soluble Ni particulate, especially nickelsulfate (NiSO4) is linked to acute lung injury(Prows 2003). Davis et al. (2001) also observedplants grown in high-Ni soil are more susceptibleto TuMV (Turnip Mosaic Virus) infection thanthose in low Ni soils.
The Philippines have many ultramafic (ultra-basic or serpentine) rock outcrops. The termultramafic is used to describe igneous or meta-morphic rocks which comprise less than 45% sil-ica (SiO2) with high concentrations of Ni, Mg,Fe, Cr, and Co (Rashed 1995). Madulid andAgoo (1997) reported that ultramafic rocks in thePhilippines have an aggregate area of 11,500 km2
along trenches and faults such as the Philippinefault zone. Samar is one of the islands with themajor outcrops of ultramafic rocks (Baker et al.1992) as indicated by the presence of a complexophiolite sequence (Dimalanta et al. 2006). Rel-atively enhanced levels of Ni were observed inthe ultramafic soils in the southern part of Samarisland (Navarete et al. 2007). Most farmers in theisland are growing crops by manual tillage. Conse-quently, elevated Ni levels in the area could pos-sibly pose health hazard to the farmers through(dust) inhalation or (soil) ingestion (Hough et al.2004; Nakashima et al. 2008). As such, high Nilevels in agricultural soils are a major concernto crop quality (Lee et al. 2004). However, fewstudies have evaluated relationships between theamount of Ni in the soil and those taken up bynative plants and agricultural crops.
The objective of this study was to evaluatethe amount of total soil Ni (TS-Ni), soil avail-able Ni (SA-Ni), and the total plant Ni contents(TP-Ni) in native plants and agricultural cropsgrowing in the Salcedo watershed in Samar Island.Investigation of heavy metal levels on agricul-tural soils and food plants is the basic elementto assess the suitability of land use and theirpotential impacts on farmers’ health or on cropquality. This information is also valuable for both
the central/local administrative units and non-government agencies to establish land use man-agement plans and to provide guidelines for theconsumption of vegetables grown on soils withelevated metal levels. The analysis of Ni in plantsis also useful to identify different native plantspecies with respect to Ni hyperaccumulation. Ac-quisition of such information is an essential factorin developing phytoremediation technologies forthe treatment of metal-polluted soils, sediments,and water resources (Wenzel et al. 2003; Everhartet al. 2006).
Materials and methods
Study site
The study was conducted in the villages ofMalbog, Naparaan, and Palanas in the Salcedowatershed in Eastern Samar, Philippines (Fig. 1).The watershed is dominated by Luisiana clay, anold and highly weathered soil developed fromthe weathering of the ultramafic rock. Navareteet al. (2007) found that the soils in the watershedcontain high levels of Ni, Cu, and Cr inheritedfrom the parent rocks.
The soils are deep, clayey, strongly granulated,and well drained. The sampling areas have flat torolling topography with an average annual rainfallof 1,500–2,500 mm. Land use for all three studyareas are fallow and agricultural. In an earlierassessment on the watershed, many farmers werereported to complain of unexplainable healthproblems which may be related to the high levelsof heavy metals in the area (ELAC-EV 2005).
Collection of samples
Composite soil samples were collected from thesurface soil (0–20 cm depth) near or aroundeach plant sampled for leaf analysis. Soil sampleswere air-dried, ground to pass through a 2 mm(10 mesh) stainless steel sieve, and stored in la-beled plastic containers for laboratory analysis.Composite sample of healthy, mature, and youngleaves of native plants and agricultural crops (foodplants) were collected and placed in labeled plas-tic bags (Table 1). Unknown plants were identified

Environ Monit Assess
Fig. 1 Map showing the sampling locations in Eastern Samar in Philippines
at the Herbarium in the Department of BiologicalSciences, Visayas State University, Philippines.Leaf samples were washed with deionized distilledwater and oven-dried at 70◦C for 2 days. Theywere then ground using a Willey mill and placedin labeled plastic containers.
Sample preparation and chemical analysis
To characterize the soil properties of the studysite, the following soil parameters were analyzed:soil pH, soil organic matter (SOM), soil texture,and cation exchange capacity (CEC). Labora-tory analyses were conducted at the Pedologyand Geo-ecology Laboratory in the Departmentof Agronomy and Soil Science and at the
Central Analytical Services Laboratory, VisayasState University, Baybay, Leyte, Philippines.
The pH of the soil samples were measuredusing glass electrodes in a soil to water ratio of1:2.5 (ISRIC 1995). The content of soil organicmatter (%OM) was analyzed by following theWalkley-Black wet combustion method proce-dures (Nelson and Sommers 1982). Cation ex-change capacity was measured using ammoniumacetate at pH 7.0 (Black 1965). Soil particlesize distribution was measured using the pipettemethod (ISRIC 1995).
The total Ni concentration in soils (TS-Ni) wasanalyzed following the tri-acid method as adaptedby Salas et al. (1998). Five grams of air-dried soilsamples (<2 mm) were placed in a digestion tube.
Environ Monit Assess
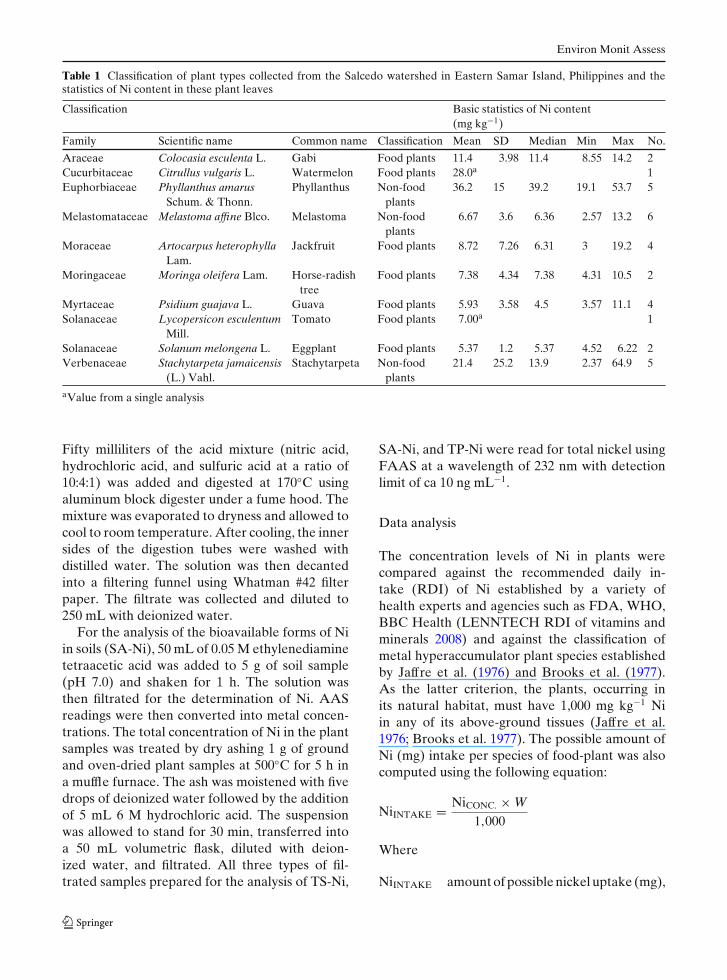
Table 1 Classification of plant types collected from the Salcedo watershed in Eastern Samar Island, Philippines and thestatistics of Ni content in these plant leaves
Classification Basic statistics of Ni content(mg kg−1)
Family Scientific name Common name Classification Mean SD Median Min Max No.
Araceae Colocasia esculenta L. Gabi Food plants 11.4 3.98 11.4 8.55 14.2 2Cucurbitaceae Citrullus vulgaris L. Watermelon Food plants 28.0a 1Euphorbiaceae Phyllanthus amarus Phyllanthus Non-food 36.2 15 39.2 19.1 53.7 5
Schum. & Thonn. plantsMelastomataceae Melastoma affine Blco. Melastoma Non-food 6.67 3.6 6.36 2.57 13.2 6
plantsMoraceae Artocarpus heterophylla Jackfruit Food plants 8.72 7.26 6.31 3 19.2 4
Lam.Moringaceae Moringa oleifera Lam. Horse-radish Food plants 7.38 4.34 7.38 4.31 10.5 2
treeMyrtaceae Psidium guajava L. Guava Food plants 5.93 3.58 4.5 3.57 11.1 4Solanaceae Lycopersicon esculentum Tomato Food plants 7.00a 1
Mill.Solanaceae Solanum melongena L. Eggplant Food plants 5.37 1.2 5.37 4.52 6.22 2Verbenaceae Stachytarpeta jamaicensis Stachytarpeta Non-food 21.4 25.2 13.9 2.37 64.9 5
(L.) Vahl. plantsaValue from a single analysis
Fifty milliliters of the acid mixture (nitric acid,hydrochloric acid, and sulfuric acid at a ratio of10:4:1) was added and digested at 170◦C usingaluminum block digester under a fume hood. Themixture was evaporated to dryness and allowed tocool to room temperature. After cooling, the innersides of the digestion tubes were washed withdistilled water. The solution was then decantedinto a filtering funnel using Whatman #42 filterpaper. The filtrate was collected and diluted to250 mL with deionized water.
For the analysis of the bioavailable forms of Niin soils (SA-Ni), 50 mL of 0.05 M ethylenediaminetetraacetic acid was added to 5 g of soil sample(pH 7.0) and shaken for 1 h. The solution wasthen filtrated for the determination of Ni. AASreadings were then converted into metal concen-trations. The total concentration of Ni in the plantsamples was treated by dry ashing 1 g of groundand oven-dried plant samples at 500◦C for 5 h ina muffle furnace. The ash was moistened with fivedrops of deionized water followed by the additionof 5 mL 6 M hydrochloric acid. The suspensionwas allowed to stand for 30 min, transferred intoa 50 mL volumetric flask, diluted with deion-ized water, and filtrated. All three types of fil-trated samples prepared for the analysis of TS-Ni,
SA-Ni, and TP-Ni were read for total nickel usingFAAS at a wavelength of 232 nm with detectionlimit of ca 10 ng mL−1.
Data analysis
The concentration levels of Ni in plants werecompared against the recommended daily in-take (RDI) of Ni established by a variety ofhealth experts and agencies such as FDA, WHO,BBC Health (LENNTECH RDI of vitamins andminerals 2008) and against the classification ofmetal hyperaccumulator plant species establishedby Jaffre et al. (1976) and Brooks et al. (1977).As the latter criterion, the plants, occurring inits natural habitat, must have 1,000 mg kg−1 Niin any of its above-ground tissues (Jaffre et al.1976; Brooks et al. 1977). The possible amount ofNi (mg) intake per species of food-plant was alsocomputed using the following equation:
NiINTAKE = NiCONC. × W1,000
Where
NiINTAKE amount of possible nickel uptake (mg),
Environ Monit Assess
NiCONC. mean concentration of the element(Ni) per plant species (mg kg−1),
W weight of food-plant ingested (g), and1,000 conversion constant (g kg−1)
A Pearson correlation analysis was done betweenall soil parameters (pH, %OM, CEC, and soil tex-ture) and Ni data sets (TS-Ni, SA-Ni, and TP-Ni)to assess the soil factors controlling the behaviorof Ni between soils and plants. A path analysismodel was also developed using the results ofPearson correlation analysis (SPSS 12.0, 2003).
Results and discussion
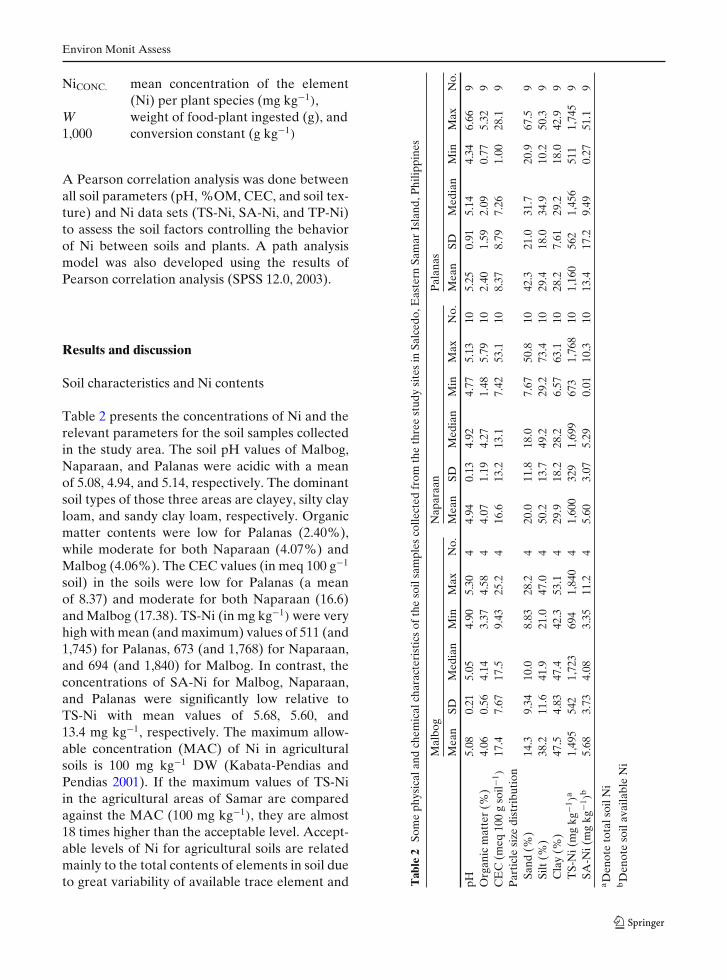
Soil characteristics and Ni contents
Table 2 presents the concentrations of Ni and therelevant parameters for the soil samples collectedin the study area. The soil pH values of Malbog,Naparaan, and Palanas were acidic with a meanof 5.08, 4.94, and 5.14, respectively. The dominantsoil types of those three areas are clayey, silty clayloam, and sandy clay loam, respectively. Organicmatter contents were low for Palanas (2.40%),while moderate for both Naparaan (4.07%) andMalbog (4.06%). The CEC values (in meq 100 g−1
soil) in the soils were low for Palanas (a meanof 8.37) and moderate for both Naparaan (16.6)and Malbog (17.38). TS-Ni (in mg kg−1) were veryhigh with mean (and maximum) values of 511 (and1,745) for Palanas, 673 (and 1,768) for Naparaan,and 694 (and 1,840) for Malbog. In contrast, theconcentrations of SA-Ni for Malbog, Naparaan,and Palanas were significantly low relative toTS-Ni with mean values of 5.68, 5.60, and13.4 mg kg−1, respectively. The maximum allow-able concentration (MAC) of Ni in agriculturalsoils is 100 mg kg−1 DW (Kabata-Pendias andPendias 2001). If the maximum values of TS-Niin the agricultural areas of Samar are comparedagainst the MAC (100 mg kg−1), they are almost18 times higher than the acceptable level. Accept-able levels of Ni for agricultural soils are relatedmainly to the total contents of elements in soil dueto great variability of available trace element and T
able
2So
me
phys
ical
and
chem
ical
char
acte
rist
ics
ofth
eso
ilsa
mpl
esco
llect
edfr
omth
eth
ree
stud
ysi
tes
inSa
lced
o,E
aste
rnSa
mar
Isla
nd,P
hilip
pine
s
Mal
bog
Nap
araa
nP
alan
as
Mea
nSD
Med
ian
Min
Max
No.
Mea
nSD
Med
ian
Min
Max
No.
Mea
nSD
Med
ian
Min
Max
No.
pH5.
080.
215.
054.
905.
304
4.94
0.13
4.92
4.77
5.13
105.
250.
915.
144.
346.
669
Org
anic
mat
ter
(%)
4.06
0.56
4.14
3.37
4.58
44.
071.
194.
271.
485.
7910
2.40
1.59
2.09
0.77
5.32
9C
EC
(meq
100
gso
il−1)
17.4
7.67
17.5
9.43
25.2
416
.613
.213
.17.
4253
.110
8.37
8.79
7.26
1.00
28.1
9P
arti
cle
size
dist
ribu
tion
Sand
(%)
14.3
9.34
10.0
8.83
28.2
420
.011
.818
.07.
6750
.810
42.3
21.0
31.7
20.9
67.5
9Si
lt(%
)38
.211
.641
.921
.047
.04
50.2
13.7
49.2
29.2
73.4
1029
.418
.034
.910
.250
.39
Cla
y(%
)47
.54.
8347
.442
.353
.14
29.9
18.2
28.2
6.57
63.1
1028
.27.
6129
.218
.042
.99
TS-
Ni(
mg
kg−1
)a1,
495
542
1,72
369
41,
840
41,
600
329
1,69
967
31,
768
101,
160
562
1,45
651
11,
745
9SA
-Ni(
mg
kg−1
)b5.
683.
734.
083.
3511
.24
5.60
3.07
5.29
0.01
10.3
1013
.417
.29.
490.
2751
.19
a Den
ote
tota
lsoi
lNi
bD
enot
eso
ilav
aila
ble
Ni
Environ Monit Assess
variable properties of soil (Kabata-Pendias andSadurski 2004).
Ni accumulation in plants
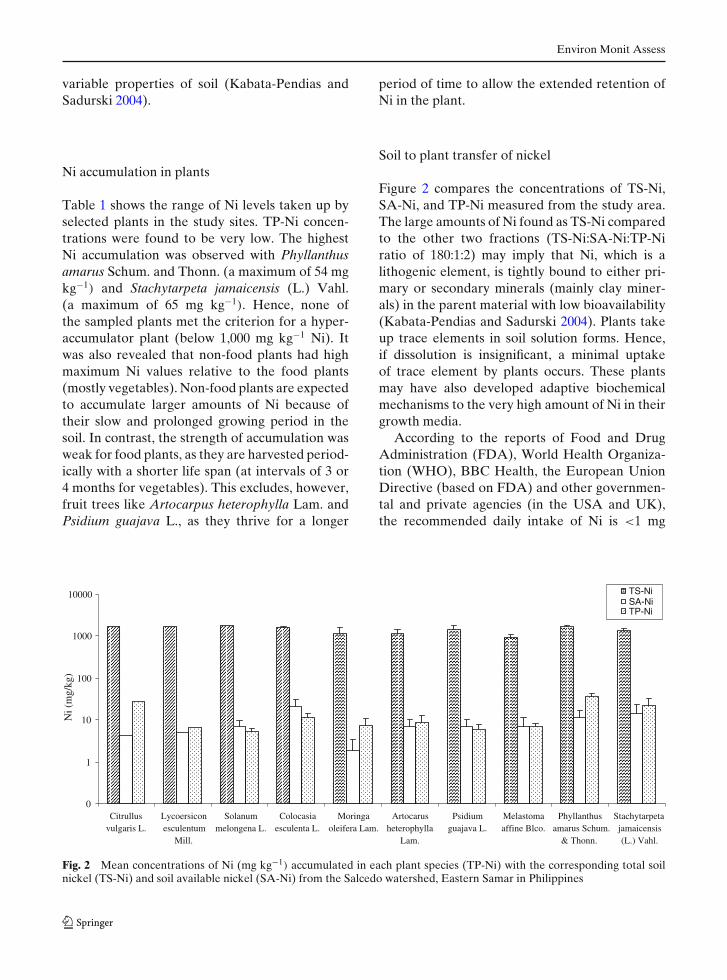
Table 1 shows the range of Ni levels taken up byselected plants in the study sites. TP-Ni concen-trations were found to be very low. The highestNi accumulation was observed with Phyllanthusamarus Schum. and Thonn. (a maximum of 54 mgkg−1) and Stachytarpeta jamaicensis (L.) Vahl.(a maximum of 65 mg kg−1). Hence, none ofthe sampled plants met the criterion for a hyper-accumulator plant (below 1,000 mg kg−1 Ni). Itwas also revealed that non-food plants had highmaximum Ni values relative to the food plants(mostly vegetables). Non-food plants are expectedto accumulate larger amounts of Ni because oftheir slow and prolonged growing period in thesoil. In contrast, the strength of accumulation wasweak for food plants, as they are harvested period-ically with a shorter life span (at intervals of 3 or4 months for vegetables). This excludes, however,fruit trees like Artocarpus heterophylla Lam. andPsidium guajava L., as they thrive for a longer
period of time to allow the extended retention ofNi in the plant.
Soil to plant transfer of nickel
Figure 2 compares the concentrations of TS-Ni,SA-Ni, and TP-Ni measured from the study area.The large amounts of Ni found as TS-Ni comparedto the other two fractions (TS-Ni:SA-Ni:TP-Niratio of 180:1:2) may imply that Ni, which is alithogenic element, is tightly bound to either pri-mary or secondary minerals (mainly clay miner-als) in the parent material with low bioavailability(Kabata-Pendias and Sadurski 2004). Plants takeup trace elements in soil solution forms. Hence,if dissolution is insignificant, a minimal uptakeof trace element by plants occurs. These plantsmay have also developed adaptive biochemicalmechanisms to the very high amount of Ni in theirgrowth media.
According to the reports of Food and DrugAdministration (FDA), World Health Organiza-tion (WHO), BBC Health, the European UnionDirective (based on FDA) and other governmen-tal and private agencies (in the USA and UK),the recommended daily intake of Ni is <1 mg
0
1
10
100
1000
10000
Citrullusvulgaris L.
Lycoersiconesculentum
Mill.
Solanummelongena L.
Colocasiaesculenta L.
Moringaoleifera Lam.
Artocarusheterophylla
Lam.
Psidiumguajava L.
Melastomaaffine Blco.
Phyllanthusamarus Schum.
& Thonn.
Stachytarpetajamaicensis(L.) Vahl.
Ni (
mg/
kg)
TS-NiSA-NiTP-Ni
Fig. 2 Mean concentrations of Ni (mg kg−1) accumulated in each plant species (TP-Ni) with the corresponding total soilnickel (TS-Ni) and soil available nickel (SA-Ni) from the Salcedo watershed, Eastern Samar in Philippines

Environ Monit Assess
Fig. 3 Possible amount ofNi (mg) transferable fromeach food plant speciesgrown on the study sites.Results are comparedagainst the recommendeddaily intake (RDI) of1 mg day−1 establishedby LENNTECH (2008).The RDI is shown as acontinuous horizontal line
02
468
10
12141618
20222426
2830
Psidiumguajava L.
Artocarusheterophylla
Lam.
Moringaoleifera Lam.
Solanummelongena L.
Colocasiaesculenta L.
Citrullusvulgaris L.
Lypcoersiconesculentum
Mill.
Food plants
Ni (
mg)
1000 g/day
250 g/day
125 g/day
(LENNTECH RDI of vitamins and minerals2008). However, people are less likely to sufferfrom Ni deficiency, because a sufficient quantityof Ni can be supplied from food and water.
Figure 3 shows the possible amount of Ni in-take per species of food plants, when taken at1,000, 250, and 125 g. It indicates that for mostfood plants consumed in great quantities (1,000 gday−1), the Ni intake level would be high com-pared to the RDI. A sufficient amount of Ni canbe supplied by P. guajava L., A. heterophyllaLam., Moringa oleifera Lam., Solanum melongenaL., and Lycopersicon esculentum Mill., whentaken at 125 g day−1. However, Citrullus vulgarisL. and Colocasia esculenta L. should be taken inlow quantities (lower than 125 g day−1), as theycontain high amounts of nickel among all the foodplants analyzed. It should be noted that the com-bined intake of these plants would give an evenhigher quantity of Ni, as Ni values may differ aftercooking or treatment for food.
According to the description of acute toxicitygiven by Florida Department of EnvironmentalProtection, soil cleanup target levels of nickelis 105 mg kg−1 per single ingestion (HazardousSubstances and Waste Management Research(HSWMR) 1999). The Toxicological Profile ofATSDR (1997) also reports that nickel in solids(e.g., food) is forty times (40×) less bioavailablethan nickel in solution (e.g., water). A comparisonbetween these toxicity levels and the amounts of
Ni in the food-plants grown on the study soilssuggests that the consumption of these food-plantsat reasonable quantities is unlikely to pose animminent threat to human health.
Factors affecting soil-to-plant transfer of nickel
Figure 4 shows a path analysis model showingrelationships between the soil factors affectingNi transfer from soil to plant based on Pearsoncorrelation analysis at 95% confidence interval
pH
% OM
% Sand
% Clay
CEC
TS-Ni
SA-Ni TP-Ni
% Silt
+
+
+
+ _
_
Fig. 4 Path analysis model showing relationships amongthe factors affecting nickel transfer between soils andplants based on Pearson correlation analysis (at 95% sig-nificance level). Positive (+) sign denotes that an increasein one parameter yields an increase in the other, whilenegative (−) sign denotes an inverse relationship

Environ Monit Assess
Table 3 Pearson correlation analysis between the commonsoil parameters (pH, %OM, CEC [eq 100 g soil−1] % silt,% clay, and % sand) and the Ni concentration data (TS-Ni,
SA-Ni, and TP-Ni [mg kg−1]) collected from three sites ofthe Salcedo watershed in Eastern Samar Island, Philippines
%OM CEC % Silt % Clay % Sand Ni concentration (mg kg−1)(meq per 100 g soil) TS-Ni SA-Ni TP-Ni
pH Correl 0.200 0.331 0.188 0.230 −0.342 0.312 0.882a 0.260Sig. 0.359 0.123 0.392 0.291 0.110 0.148 0.000 0.151
%OM Correl 0.048 0.601a 0.071 −0.595a 0.727a 0.114 0.348Sig. 0.827 0.002 0.747 0.003 0.000 0.603 0.051
CEC Correl 0.251 0.553a −0.642a 0.162 0.242 −0.133(meq 100 g soil−1) Sig. 0.248 0.006 0.001 0.459 0.266 0.469
% Silt Correl −0.278 −0.691a 0.866a 0.229 0.212Sig. 0.198 0.000 0.000 0.294 0.244
% Clay Correl −0.502b −0.166 0.060 −0.080Sig. 0.015 0.599 0.784 0.664
% Sand Correl −0.693a −0.251 0.125Sig. 0.000 0.247 0.496
TS-Ni Correl 0.337 0.304(mg kg−1) Sig. 0.116 0.091
SA-Ni Correl 0.277(mg kg−1) Sig. 0.124
aCorrelation is significant at the 0.01 levelbCorrelation is significant at the 0.05 level
(Table 3). A positive relationship means that anincrease of one variable yields an increase in theother. However, a negative signal yields an oppo-site pattern so that an increase of one factor yieldsa decrease in the other.
In Fig. 4, CEC, the ability of the soil to adsorband exchange cations including Ni2+, is stronglycorrelated with the amount of clay (r = 0.55;P = 6.03 × 10⁻³) but inversely with the sand frac-tions of the soil (r = −0.64; P = 6.3 × 10⁻⁴). Thisimplies that CEC tends to increase with an in-crease in the amount of clay fraction but de-creases if sand fractions increase. This conformsto the report of Kabata-Pendias and Sadurski(2004) who pointed that the main feature of clayis high CEC with a very high affinity to bind traceelement ions. TS-Ni exhibited strong positivecorrelations with OM (r = 0.73; P = 7.5 × 10⁻⁵)
and silt fractions (r = 0.87; P = 3.5 × 10⁻⁸) butshowed an inverse correlation with sand frac-tions (r = −0.69; P = 3.9 × 10⁻²). This contra-dicts the findings of Kabata-Pendias and Sadurski(2004) who stated that the association of metals
with organic matter was generally insignificantfor Ni.
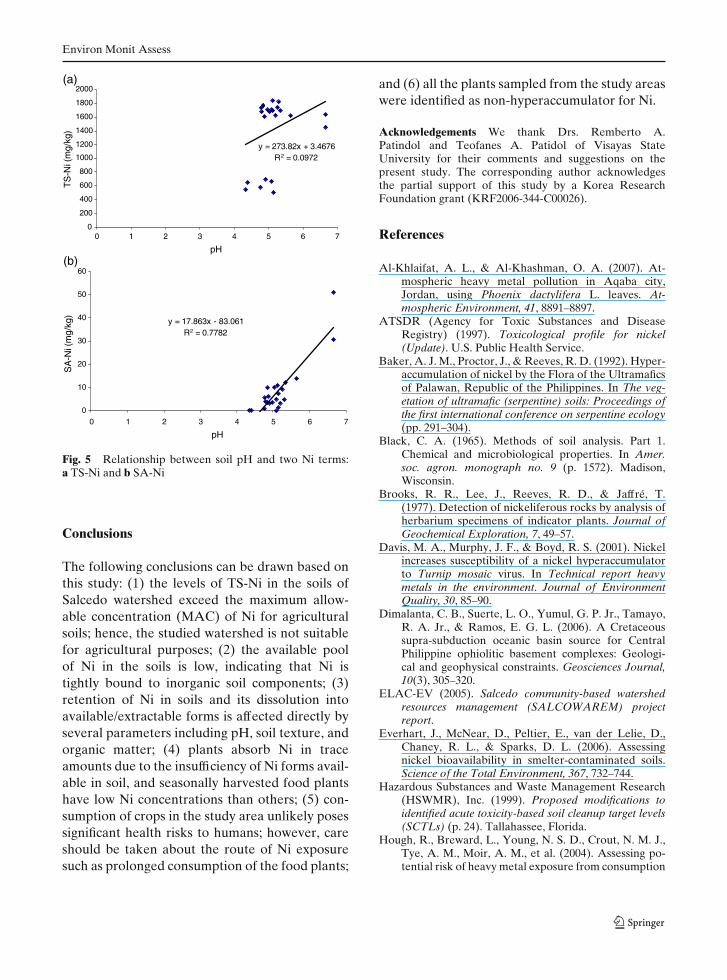
The results of correlation analysis also indi-cate that soil pH influences the amount of SA-Ni(r = 0.88; P = 1.8 × 10⁻⁸), while it is not withTS-Ni (r = 0.31; P = 1.5 × 10⁻¹) (Fig. 5). It thussuggests that an increase in the pH value can in-duce increases in the amount of SA-Ni. Nonethe-less, none of the soil parameters investigatedin this study appeared to be strongly associatedwith Ni uptake patterns for plants. Accordingto Kabata-Pendias and Sadurski (2004), metalsin forest soils are usually more easily mobile,bioavailable, and leachable than trace elements inagricultural soils. This finding is somewhat consis-tent with the observation in this study in that theamount of soil available Ni was fairly low in allthe study sites with the low quantity of Ni in plantspecies. It should also be considered that the landuse types of all the sampling sites were identifiedas cultivated or at fallow period (cultivated landthat is left unplowed and unseeded during a grow-ing season).
Environ Monit Assess
(a)
y = 273.82x + 3.4676R2 = 0.0972
0
200
400
600
800
1000
1200
1400
1600
1800
2000
0 4
pH
TS
-Ni (
mg/
kg)
(b)
y = 17.863x - 83.061R2 = 0.7782
0
10
20
30
40
50
60
SA
-Ni (
mg/
kg)
321 5 6 7
0 4
pH
321 5 6 7
Fig. 5 Relationship between soil pH and two Ni terms:a TS-Ni and b SA-Ni
Conclusions
The following conclusions can be drawn based onthis study: (1) the levels of TS-Ni in the soils ofSalcedo watershed exceed the maximum allow-able concentration (MAC) of Ni for agriculturalsoils; hence, the studied watershed is not suitablefor agricultural purposes; (2) the available poolof Ni in the soils is low, indicating that Ni istightly bound to inorganic soil components; (3)retention of Ni in soils and its dissolution intoavailable/extractable forms is affected directly byseveral parameters including pH, soil texture, andorganic matter; (4) plants absorb Ni in traceamounts due to the insufficiency of Ni forms avail-able in soil, and seasonally harvested food plantshave low Ni concentrations than others; (5) con-sumption of crops in the study area unlikely posessignificant health risks to humans; however, careshould be taken about the route of Ni exposuresuch as prolonged consumption of the food plants;
and (6) all the plants sampled from the study areaswere identified as non-hyperaccumulator for Ni.
Acknowledgements We thank Drs. Remberto A.Patindol and Teofanes A. Patidol of Visayas StateUniversity for their comments and suggestions on thepresent study. The corresponding author acknowledgesthe partial support of this study by a Korea ResearchFoundation grant (KRF2006-344-C00026).
References
Al-Khlaifat, A. L., & Al-Khashman, O. A. (2007). At-mospheric heavy metal pollution in Aqaba city,Jordan, using Phoenix dactylifera L. leaves. At-mospheric Environment, 41, 8891–8897.
ATSDR (Agency for Toxic Substances and DiseaseRegistry) (1997). Toxicological profile for nickel(Update). U.S. Public Health Service.
Baker, A. J. M., Proctor, J., & Reeves, R. D. (1992). Hyper-accumulation of nickel by the Flora of the Ultramaficsof Palawan, Republic of the Philippines. In The veg-etation of ultramafic (serpentine) soils: Proceedings ofthe first international conference on serpentine ecology(pp. 291–304).
Black, C. A. (1965). Methods of soil analysis. Part 1.Chemical and microbiological properties. In Amer.soc. agron. monograph no. 9 (p. 1572). Madison,Wisconsin.
Brooks, R. R., Lee, J., Reeves, R. D., & Jaffré, T.(1977). Detection of nickeliferous rocks by analysis ofherbarium specimens of indicator plants. Journal ofGeochemical Exploration, 7, 49–57.
Davis, M. A., Murphy, J. F., & Boyd, R. S. (2001). Nickelincreases susceptibility of a nickel hyperaccumulatorto Turnip mosaic virus. In Technical report heavymetals in the environment. Journal of EnvironmentQuality, 30, 85–90.
Dimalanta, C. B., Suerte, L. O., Yumul, G. P. Jr., Tamayo,R. A. Jr., & Ramos, E. G. L. (2006). A Cretaceoussupra-subduction oceanic basin source for CentralPhilippine ophiolitic basement complexes: Geologi-cal and geophysical constraints. Geosciences Journal,10(3), 305–320.
ELAC-EV (2005). Salcedo community-based watershedresources management (SALCOWAREM) projectreport.
Everhart, J., McNear, D., Peltier, E., van der Lelie, D.,Chaney, R. L., & Sparks, D. L. (2006). Assessingnickel bioavailability in smelter-contaminated soils.Science of the Total Environment, 367, 732–744.
Hazardous Substances and Waste Management Research(HSWMR), Inc. (1999). Proposed modifications toidentified acute toxicity-based soil cleanup target levels(SCTLs) (p. 24). Tallahassee, Florida.
Hough, R., Breward, L., Young, N. S. D., Crout, N. M. J.,Tye, A. M., Moir, A. M., et al. (2004). Assessing po-tential risk of heavy metal exposure from consumption
Environ Monit Assess
of home-produced vegetables by urban populations.Environmental Health Perspectives, 112(2), 215–221.
Huang, P. M. (1997). Environmental impact of metal-organic interactions. In D. Adriano, Z. S. Chen,S.S. Yang, & I. K. Iskandar (Eds.), Biogeochemistryof trace metals (pp. 403–432). Environmental HealthPerspectives, 112(2), 215–221.
ISRIC (1995). Procedures for soil analysis (5th ed., p. 3–6).In L. P. Van Reeuwijk (Ed.).
Jaffre, T., Brooks, R. R., Lee, J., & Reeves, R. D. (1976).Sebertia acuminate: A hyperaccumulator of nickelfrom New Caledonia. Science, 193, 579–580.
Kabata-Pendias, A. (2004). Soil–plant transfer of traceelements—an environmental issue. Geoderma, 122,143–149.
Kabata-Pendias, A., & Pendias, H. (2001). Trace elementsin soils and plants (3rd ed.). Boca Raton: CRC.
Kabata-Pendias, A., & Sadurski, W. (2004). Trace elementsand compounds in soil. In E. Merian, M. Anke, M.Ihnat, & M. Stoeppler (Eds.), Elements and their com-pounds in the environment. Occurrence, analysis andbiological relevance (2nd ed.). New York: Wiley-VCH.
Lee, T. M., Lai, H. Y., & Chen, Z. S. (2004). Effectof chemical amendments on the concentration ofcadmium and lead in long-term contaminated soils.Chemosphere, 57, 1459–1471.
Lemos, V. A., dos Passos, A. S., dos Santos, N. G.,de Andrade, S. D., de Carvalho, A. L., &da Silva, D. G. (2007a). Determination of cobalt, cop-per and nickel in food samples after pre-concentrationon a new pyrocatechol-functionalized polyurethanefoam sorbent. Reactive & Functional Polymers, 67,573–581.
Lemos, V. A., da Franc, R. S., & Moreira, B. O. (2007b).Cloud point extraction for Co and Ni determinationin water samples by flame atomic absorption spec-trometry. Separation and Purification Technology, 54,349–354.
LENNTECH (2008). Recommended daily intake of vita-mins and minerals. Available at http://www.lenntech.com/. Accessed 21 September 2008.
Madulid, D. A., & Agoo, E. M. G. (1997). Assessmentof the vegetation of Philippines mountains on ultra-mafic rocks. In T. Jaffré, R. D. Reeves, & T. Becquer(Eds.), The ecology of ultramafic and metalliferous
areas. Documents Scientifiques et Techniques, III/2,Orstom, Nouméa, New Caledonia.
Marzec, Z. (2004). Alimentary chromium, nickel, and sele-nium intake of adults in Poland estimated by analysisand calculations using the duplicate portion technique.Nahrung, 48(1), 47–52.
Navarete, I. A., Asio, V. B., Jahn, R., & Tsutsuki, K. (2007).Characteristics and genesis of two strongly weatheredsoils in Samar, Philippines. Australian Journal of SoilResearch, 45(3).
Nakashima, T., Okada, T., Asahi, J., Yamashita, A., Kawai,K., Kasai, H., et al. (2008). 8-Hydroxydeoxyguanosinegenerated in the earthworm Eisenia fetida grownin metal-containing soil. Mutation Research, 654,138–144.
Nelson, D. W., & Sommers, L. E. (1982). Total carbon,organic carbon, and organic matter. In A. L. Page,et al. (Eds.), Methods of soil analysis. Part 2. Chemi-cal and microbiological properties (2nd ed.). Madosin,WI, USA. Agronomy Monograph, 9, 539–580.
Prows, D. R. (2003). Genetic susceptibility to nickel-induced acute lung injury. Chemosphere, 51, 1139–1148.
Rashed, M. N. (1995). Trace element determinationin warm-climate plants by atomic absorption spec-troscopy and ion selective electrodes. Journal of AridEnvironments, 30, 463–478.
Salas, F. M., Chino, M., Goto, S., Igayashi, T., Masujima,H., & Kumazawa, K. (1998). Forms and distribu-tion of heavy metals in soils long-term applied withsewage sludge. Journal of the International Society forSoutheast Asian Agricultural Sciences, 4, 81–98.
Vassilieva, T. L., Duka, Y. D., Orogodny, V. V., &Kharitonov, M. (1997). Relation between trace el-ement concentration in soils and the health of hu-mans in Ukraine. In I. K. Iskandar, S. E. Hardy,A. C. Chang, & G. M. Pierzynski (Eds.), Proceed-ings Of extended abstracts for the fourth internationalconference on the biogeochemistry of trace elements(pp. 51–52). California, USA.
Wenzel, W. W., Bunkowski, M., Puschenreiter, M., &Horak, O. (2003). Rhizosphere characteristics ofindigenously growing nickel hyperaccumulator andexcluder plants on serpentine soil. EnvironmentalPollution, 123, 31–138.