Geotextile Sand Filter - Arizona Design & Installation Manual
ARTICLE IN PRESS
Geotextiles and Geomembranes 23 (2005) 77–105
0266-1144/$ -
doi:10.1016/j
�Correspo
E-mail ad
(J.D. Frost),
www.elsevier.com/locate/geotexmem
Quantifying hook and loop interaction intextured geomembrane–geotextile systems
G.L. Hebelera, J.D. Frosta,�, A.T. Myersb
aSchool of Civil and Environmental Engineering, Georgia Institute of Technology, 790 Atlantic Drive,
Atlanta, GA, USAbGeorgia Institute of Technology, Atlanta, GA, USA
Received 24 February 2004; received in revised form 16 June 2004
Abstract
This paper examines the role of geomembrane texture on geomembrane–geotextile interface
performance, focusing in particular on hook and loop interaction. The study specifically
involves textured HDPE geomembranes and needle punched nonwoven fabrics; however, the
concepts presented may be relevant to other geosynthetic systems. The effects of hook and
loop interaction on geosynthetic interface performance were quantified through laboratory
interface shear testing, ASTM hook and loop interaction tests, and optical microscopy.
Testing was conducted over a large range of normal stresses (0.4–312 kPa) to capture
variations in behavior as a function of normal stress. Results show that the magnitude of hook
and loop interaction depends on the characteristics of the geomembrane texture and can
contribute a significant portion of the peak interface strength. The results aid in quantifying
behavioral differences observed between geomembranes textured using different manufactur-
ing processes, and provide microscale insight into textured geomembrane–geotextile
interaction mechanisms over a range of stress levels.
r 2004 Elsevier Ltd. All rights reserved.
Keywords: Hook and loop interaction; Surface texture; Interface strength
see front matter r 2004 Elsevier Ltd. All rights reserved.
.geotexmem.2004.06.002
nding author. Tel: +1-404-894-2280; fax: +1-404-894-2281.
dresses: [email protected] (G.L. Hebeler), [email protected]
[email protected] (A.T. Myers).

ARTICLE IN PRESS
G.L. Hebeler et al. / Geotextiles and Geomembranes 23 (2005) 77–10578
1. Introduction
It is often advantageous in geotechnical design to combine several materials to createhybrid geosystems. The combination of two or more geosynthetics has been used inpractice for decades over a wide range of applications. These applications are welldocumented in Ingold (1994), Koerner (1998), amongst others, and specific geomem-brane–geotextile uses include: drainage, resistance to puncture, and controlling tearpropagation. Geomembranes used in combination with geotextiles are often textured toallow for better compliance and interaction between the synthetic materials. Practicalapplications of geotextile–geomembrane systems include landfill liners, highway subgrades,leachate and gas collection systems, and retaining structures (Williams and Houlihan,1986).
Hook and loop interaction, which is commonly but incorrectly referred to by thetrade name Velcros, has become a recent topic of discussion in the geosyntheticcommunity. However, no quantitative studies have been conducted to measure the effectof hook and loop interaction on geosynthetic system performance. Hook and loopinteraction within the geosynthetic field is mainly relevant to systems with texturedgeomembranes in contact with open structured geotextiles, such as the needle-punched-nonwoven (NPNW) type. As a result, this study is focused on investigating the hookand loop interaction between textured geomembranes and NPNW geotextiles. Theprimary texturing processes currently used in North American geosynthetic practice arecoextrusion and structuring, with impingement widely used as a third texturing processoutside of North America. The coextrusion process generates random textures over abroad size range of features. Structuring typically produces a more uniform textureconsisting of smoother macroscopic patterns, with micro and mesotexture existing onthe base substrate only. Practical experiences with these textured geomembranes haveshown differences in low normal stress behavior, most notably during installation. Somepractitioners note the benefit of additional interaction between a geotextile and texturedgeomembrane during installation, as the system requires minimal or no supplementalrestraints or temporary connections during placement and joining of the seams. Otherpractitioners note the disadvantage of large interaction between the components of ageosynthetic composite system during installation as it greatly restricts realignment andminor adjustments of the geosynthetics after their initial placement. Anecdotal evidencehas linked many of the behavioral differences observed during installation to varyinglevels of hook and loop interaction between the geomembrane texture and NPNWfabric. This study uses a number of laboratory techniques across a range of normalstress conditions in order to provide quantitative insight into the mechanics andmagnitudes of hook and loop interaction in textured geomembrane–geotextile systems.
2. Geomembrane manufacturing and texturing techniques
To provide a framework for the results presented herein, a brief review ofgeomembrane manufacturing and texturing techniques is presented, and follows thatof Frost et al. (2002).

ARTICLE IN PRESS
G.L. Hebeler et al. / Geotextiles and Geomembranes 23 (2005) 77–105 79
2.1. Manufacturing techniques
Geomembranes are manufactured from a variety of polymer resins, with the mostcommon types being polyvinyl chloride (PVC), cholorsulfonated polyethylene(CSPE), and polyethylene (PE). The most common variety used in combination withgeotextiles, are PE membranes, and these are the focus of the current study. PEmembranes are manufactured as either smooth or textured sheets using a screwextrusion process and classified by resin density as high density polyethylene(HDPE), linear low density polyethylene (LLDPE), or very low density polyethylene(VLDPE) (Koerner, 1998). The most common density used in geosynthetic systemsis currently HDPE, and is the focus of the current study. The manufacturing processconsists of solid resin pellets, and other additives such as antioxidants and processstabilizers being blended in a hopper attached to a barrel system. An Archimedeanscrew-type feeder system carries the pellets to the die section, while a series of heaterscontained along the screw length melt the resin pellets. The melted formulation isforced through one of two common die types: flat dies (cast sheeting) which force thepolymer mixture through two horizontal die lips, or circular dies (blown film) whichforce the polymer mixture between two vertically oriented concentric die lips(Koerner, 1998).
2.2. Texturing techniques
While the constituents used in the production of HDPE geomembranes arerelatively similar for all manufacturers; the texturing techniques, processes, andfinished textures can vary widely. Manufacturing methods used to texturegeomembranes include: coextrusion, impingement, lamination, and structuring.The lamination texturing process has lost favor in recent years due to a combinationof performance issues and the recent merger of several large geosyntheticmanufacturers. Impingement is extensively used as a texturing process outside ofNorth America, but is no longer widely used in North America. A brief summary ofthe two most commonly used texturing methods (coextrusion and structuring) inNorth America is presented below after Donaldson (1995).
The coextrusion method uses one or two secondary extruders on the preferred orboth sides of a main extruder to deliver a molten resin with an added blowing agent,typically nitrogen. As the mix nears the end of the extrusion system, the reducedpressure and cooler air expands the blowing agent. The texture is formed by theshearing action of the extruder breaking the bubbles formed by the cooling of theblowing agent. The bond strength between the extruded layers (base, top texturedsurface, and bottom textured surface) is controlled by the rate of extrusion. Problemswith improper rates include: debonding or limited layer cohesion at fast extrusionrates, and imbedded bubbles of blowing agent in the core of the geomembrane atslow extrusion rates. Properly executed, coextrusion texturing produces high bondstrengths between the geomembrane core and the textured surfaces consisting ofvariably sized macrotexture with significant microtexturing due to the rapidexpansion of the blowing agent. Plan and cross-sectional views of the tested

ARTICLE IN PRESS
(a) (b) (c)
Fig. 1. Images of coextruded geomembrane used in the test program: (a) plan view—115mm� 150mm,
(b) magnified plan view—9mm� 13mm, and (c) machine direction cross-sectional view—
10mm� 7.5mm.
G.L. Hebeler et al. / Geotextiles and Geomembranes 23 (2005) 77–10580
coextruded geomembrane are shown in Fig. 1. Hooked features of different sizes canbe readily seen in the cross-section.
The structuring process forces a hot flat die extruded geomembrane through twocounter-rotating rollers with patterned surfaces. The texture of the embossing rollersis sometimes a box and point pattern, but can be of almost any geometry. Anadvantage of structuring is the ability to create vastly different textures on the upperand lower geomembrane surfaces. Improper cooling can result in residual stressesunder the macrotextural features making the membrane more susceptible to stresscracking in the presence of active surface agents. Structured texture is highlyrepeatable and consists of uniform macrotexture, with micro- and mesotexturepresent on the base material between macro features. Plan and cross-sectional viewsof the tested structured geomembrane are shown in Fig. 2. No distinct macrolevelhooked features can be seen.
In this paper, three distinct size ranges will be used to aid in the discussion oftextural features. Macrotexture will refer to base structure, asperities, and orattached features 40.125mm in out-of-plane dimension. Microtexture will refer toroughness present on the base sheet or macrotextural features of o0.05mm. Textureor roughness intermediate to those ranges will be described as mesotexture.Texturing technique has been shown to directly influence the strength and durabilityof both the microtexture, and to a greater extent, the macrotexture created duringthe texturing process (Frost et al., 2002). This study focuses on investigatingproperties of various textured geomembranes in which all texture in the currentstudy consists of the same material as the base HDPE geomembrane.
3. Experimental program
3.1. Introduction
The experimental program consisted of a series of laboratory investigationsdesigned to quantify the hook and loop interaction of geomembrane–geotextile

ARTICLE IN PRESS
(a) (b) (c)
Fig. 2. Images of structured geomembrane used in the test program: (a) plan view—115mm� 150mm, (b)
magnified plan view—9mm� 13mm, and (c) machine direction cross-sectional view—10mm� 7.5mm.
G.L. Hebeler et al. / Geotextiles and Geomembranes 23 (2005) 77–105 81
systems. Testing included: direct interface shear tests, and ASTM standard tests forshear strength (ASTM D5169, 1998) of hook and loop fasteners. The direct interfaceshear testing was conducted according to ASTM D5321, 2002 at normal stressesranging from 0.4 to 312 kPa, over a horizontal displacement of 80mm, at adisplacement rate of 5mm/min, and deviated from the standard procedure in thattests were only conducted parallel to the machine (roll) direction of thegeosynthetics. The ASTM hook and loop interaction tests were conducted on theinvestigated geosynthetic materials, commercial hook and loop specimens, andhybrid combinations of all materials. Tests with commercial hook and loop materialswere conducted to provide a reference for the magnitude of strength of theseengineered systems. Optical microscopy provided qualitative insight into themechanisms present during interface shearing.
3.2. Materials tested
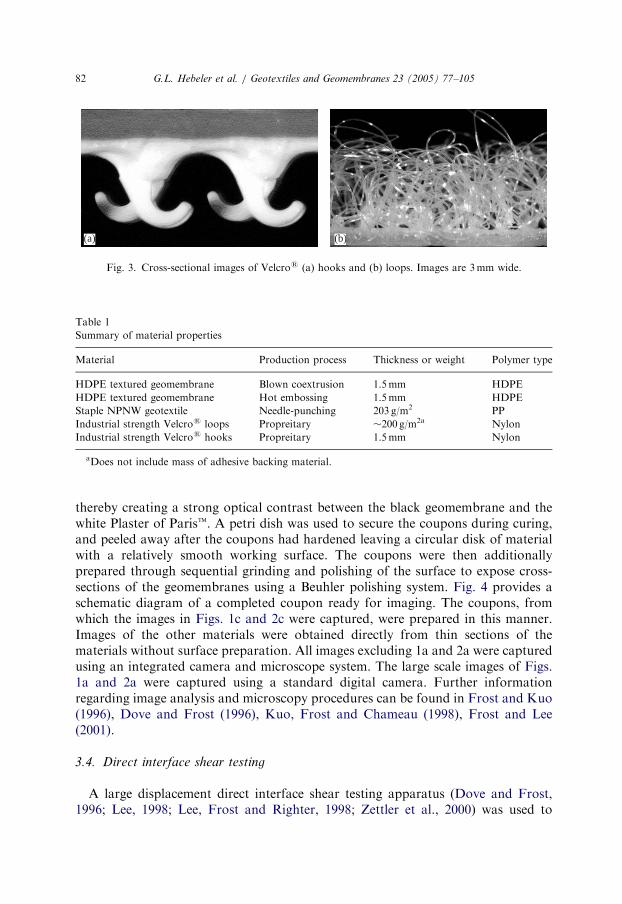
This study focused on the most common geosynthetic materials used in currentNorth American practice when placing geotextiles in combination with geomem-branes. As such, two textured HDPE geomembranes (Figs. 1 and 2), one texturedusing a coextruded process and one textured using a structuring process were testedin combination with a single staple type NPNW geotextile. Additionally, acommercial hook and loop fastener (Fig. 3), was used to provide a meaningfulbackdrop for the discussion of hook and loop interaction. Relevant informationregarding the tested materials is listed in Table 1.
3.3. Optical microscopy
Surface characteristics were evaluated using an integrated digital camera-opticalmicroscope system. Procedures similar to those described by Dove and Frost (1996)were used to prepare the geomembrane coupons for analysis. The procedure involvescasting coupons of the geomembranes vertically in a solution of Plaster of Parist
ARTICLE IN PRESS
(a) (b)
Fig. 3. Cross-sectional images of Velcros (a) hooks and (b) loops. Images are 3mm wide.
Table 1
Summary of material properties
Material Production process Thickness or weight Polymer type
HDPE textured geomembrane Blown coextrusion 1.5mm HDPE
HDPE textured geomembrane Hot embossing 1.5mm HDPE
Staple NPNW geotextile Needle-punching 203 g/m2 PP
Industrial strength Velcros loops Propreitary �200 g/m2a Nylon
Industrial strength Velcros hooks Propreitary 1.5mm Nylon
aDoes not include mass of adhesive backing material.
G.L. Hebeler et al. / Geotextiles and Geomembranes 23 (2005) 77–10582
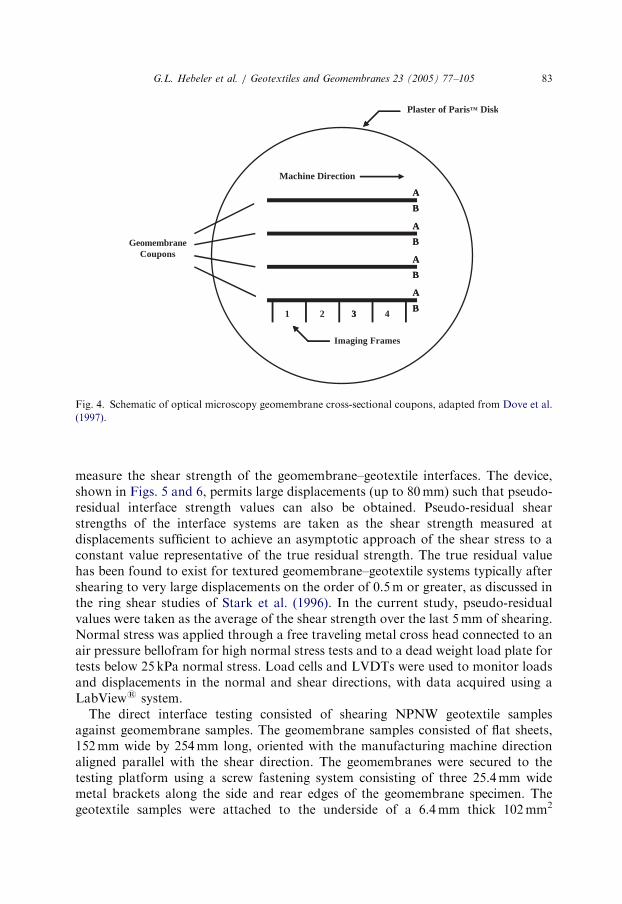
thereby creating a strong optical contrast between the black geomembrane and thewhite Plaster of Parist. A petri dish was used to secure the coupons during curing,and peeled away after the coupons had hardened leaving a circular disk of materialwith a relatively smooth working surface. The coupons were then additionallyprepared through sequential grinding and polishing of the surface to expose cross-sections of the geomembranes using a Beuhler polishing system. Fig. 4 provides aschematic diagram of a completed coupon ready for imaging. The coupons, fromwhich the images in Figs. 1c and 2c were captured, were prepared in this manner.Images of the other materials were obtained directly from thin sections of thematerials without surface preparation. All images excluding 1a and 2a were capturedusing an integrated camera and microscope system. The large scale images of Figs.1a and 2a were captured using a standard digital camera. Further informationregarding image analysis and microscopy procedures can be found in Frost and Kuo(1996), Dove and Frost (1996), Kuo, Frost and Chameau (1998), Frost and Lee(2001).
3.4. Direct interface shear testing
A large displacement direct interface shear testing apparatus (Dove and Frost,1996; Lee, 1998; Lee, Frost and Righter, 1998; Zettler et al., 2000) was used to
ARTICLE IN PRESS
A
B1 2 3 4
A
B
A
B
A
B
Machine Direction
Imaging Frames
GeomembraneCoupons
Plaster of Paris™ Disk
A
B3
A
B
A
B
A
B
Fig. 4. Schematic of optical microscopy geomembrane cross-sectional coupons, adapted from Dove et al.
(1997).
G.L. Hebeler et al. / Geotextiles and Geomembranes 23 (2005) 77–105 83
measure the shear strength of the geomembrane–geotextile interfaces. The device,shown in Figs. 5 and 6, permits large displacements (up to 80mm) such that pseudo-residual interface strength values can also be obtained. Pseudo-residual shearstrengths of the interface systems are taken as the shear strength measured atdisplacements sufficient to achieve an asymptotic approach of the shear stress to aconstant value representative of the true residual strength. The true residual valuehas been found to exist for textured geomembrane–geotextile systems typically aftershearing to very large displacements on the order of 0.5m or greater, as discussed inthe ring shear studies of Stark et al. (1996). In the current study, pseudo-residualvalues were taken as the average of the shear strength over the last 5mm of shearing.Normal stress was applied through a free traveling metal cross head connected to anair pressure bellofram for high normal stress tests and to a dead weight load plate fortests below 25 kPa normal stress. Load cells and LVDTs were used to monitor loadsand displacements in the normal and shear directions, with data acquired using aLabViews system.
The direct interface testing consisted of shearing NPNW geotextile samplesagainst geomembrane samples. The geomembrane samples consisted of flat sheets,152mm wide by 254mm long, oriented with the manufacturing machine directionaligned parallel with the shear direction. The geomembranes were secured to thetesting platform using a screw fastening system consisting of three 25.4mm widemetal brackets along the side and rear edges of the geomembrane specimen. Thegeotextile samples were attached to the underside of a 6.4mm thick 102mm2

ARTICLE IN PRESS
Fig. 5. Plan view of interface shear device (vertical LVDTs not shown for clarity), after Zettler (1999).
Fig. 6. Side view of interface shear device, after Zettler (1999).
G.L. Hebeler et al. / Geotextiles and Geomembranes 23 (2005) 77–10584

ARTICLE IN PRESS
G.L. Hebeler et al. / Geotextiles and Geomembranes 23 (2005) 77–105 85
aluminum plate using spray adhesive and allowed to cure for 1 h under 10 kPanormal stress. The geotextile samples were trimmed to the dimensions of thealuminum plate leaving an extended flap along the leading edge. The extended flapwas then wrapped completely around the beveled leading edge of the plate and gluedto the upper surface. This configuration provided a smooth leading edge, whichbetter approximates large-scale in situ shearing conditions by allowing the geotextileto be sheared against the geomembrane without peeling. An upper aluminum section102mm2 was used to secure the extended flap between the aluminum sections. Theupper aluminum block also served to transfer the load from the metal crosshead tothe geosynthetics being tested.
The direct interface shear tests were conducted according to ASTM D5321, 2002,except as noted earlier, under a large range of normal stresses from (0.4–312 kPa) toa displacement of 80mm per test at a displacement rate of 5mm/min. As averification of the test setup, multiple tests were conducted for both geosyntheticcombinations at 100 kPa normal stress, and showed excellent repeatability. Virgingeomembrane and geotextile specimens were used in each test of the primary testingsequence. An additional wear test sequence was conducted on both geomembranetypes at a normal stress of about 100 kPa to allow for the quantification of largedisplacement geomembrane wear and interface strength behavior. The wear testsequence consisted of a virgin and three repeat tests resulting in a cumulative sheardisplacement of 320mm. Virgin geotextile specimens were used in each of the repeattests to isolate the effects of geomembrane wear without having to consider large-scale geotextile wear factors such as filament pullout and breakage (Gilbert et al.,1995; Li and Gilbert, 1999).
3.5. ASTM hook and loop testing
Standard ASTM hook and loop shear strength tests (ASTM D5169-98) wereconducted using the materials from the direct interface shear tests. Additionally,strips of an industrial strength hook and loop system were tested autonomously andin combination with the geotextile and geomembrane specimens. Tests wereconducted using a uniaxial tension/compression testing frame. The test configurationprovided load resolution of 0.4N, a large displacement range in excess of 0.5m, andvertical displacement resolution of 0.1mm. A total of 6 material combinations weretests as follows:
�
Coextruded HDPE geomembrane—NPNW geotextile. � Coextruded HDPE geomembrane—commercial loops. � Structured HDPE geomembrane—NPNW geotextile. � Structured HDPE geomembrane—commercial loops. � Commercial hooks—NPNW geotextile. � Commercial hooks—commercial loops.ASTM test method D5169-98 requires material specimens to be 25.4mm �
101.6mm in plan area, with the central 50.8mm of material overlapped as shown in

ARTICLE IN PRESS
G.L. Hebeler et al. / Geotextiles and Geomembranes 23 (2005) 77–10586
Fig. 7. The materials were oriented with the machine direction of the geosyntheticsaligned along the tension direction. The commercial hook and loop materials aremanufactured to be bi-directional. As specified by ASTM D5169, the mating of thevarious ‘‘hook’’ and ‘‘loop’’ materials was achieved by applying a dead weight for 2 sand then pushing a weighted roller over the length of the joined strips for 5successive cycles. The ASTM specified mating process corresponds well with typicalconstruction loads encountered by geosynthetics during installation, and thusadequately models the in-place interaction of the tested materials under zero normalstress conditions. The upper and lower extended portions of each material were thenplaced into tensile testing grips, and the specimen was pulled at a constant rate of305mm/min.
Fig. 7. Test configuration for ASTM D5169-98, shear strength of hook and loop fasteners.
ARTICLE IN PRESS
G.L. Hebeler et al. / Geotextiles and Geomembranes 23 (2005) 77–105 87
4. Test results
4.1. Optical microscopy results
As previously noted, cross-sections of the two tested geomembranes, taken alongthe machine direction, where encased in coupons of Plaster of Parist and polished tocreate a strong optical contrast between the geomembranes and the housing materialas depicted in Fig. 4. Digital images of the coupons were captured with a charge-coupled device (CCD) camera integrated into an optical microscopy system. Thecaptured images were then digitally analyzed to quantify the surface roughnesscharacteristics of the tested geomembranes. A quantitative measure ofsurface roughness used in the geomaterials community is the profile roughnessparameter RL.
RL ¼Actual profile length
Projected profile length; ð1Þ
while the texturing processes of the two tested materials differs greatly, the profileroughness values of the tested materials obtained from the optical microscopyanalysis are comparable with RL values of 1.2870.21 and 1.2370.05 for thecoextruded and structured geomembranes, respectively. Accordingly, it is consideredreasonable to directly compare the response of interfaces involving geotextiles andthese two geomembranes. The optical microscopy images were further used toprovide qualitative insight into the mechanisms controlling geotextile–geomembraneand hook and loop response.
4.2. Direct interface shear results
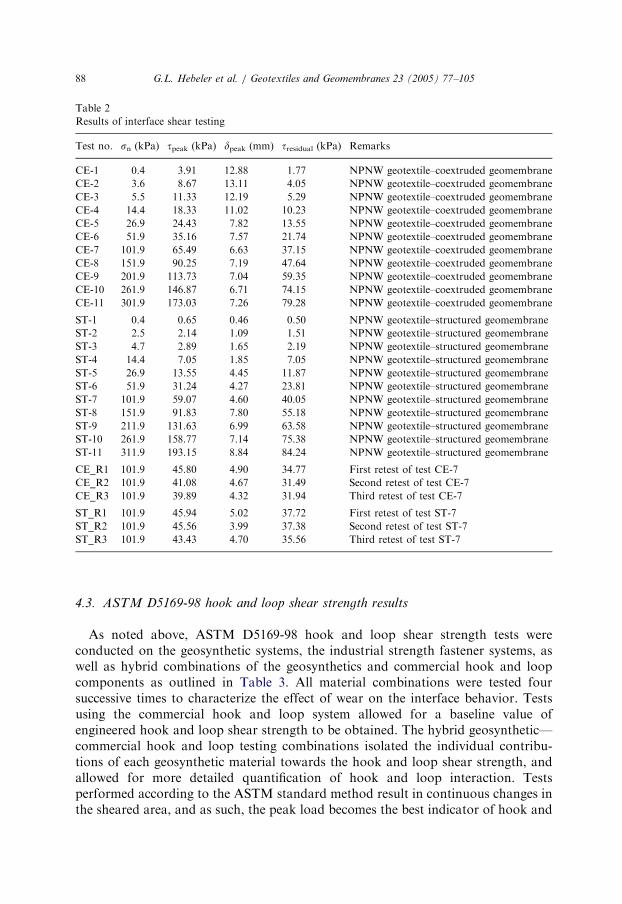
As previously noted, all interface shear tests consisted of an upper NPNWgeotextile of 203 g/m2 sheared against a lower textured geomembrane over adisplacement range of 80mm per test. Direct interface shear tests were conducted onvirgin material samples at eleven normal stress levels ranging from 0.4 to 312 kPa).Peak and pseudo-residual (@ 80mm displacement) interface shear stresses weredetermined for both material combinations at all normal stress levels. Additionally, aseries of four interface shear tests (virgin, 1st retest, 2nd retest, and 3rd retest) wereconducted on specimens of both texturing types at a normal stress level of 102 kPa,with a new geotextile specimen used in each retest. A summary of the interface sheartesting results is presented in Table 2. Shear stress versus displacement plots for allvirgin tests on the coextruded and structured geomembranes are summarized inFigs. 8 and 9, respectively. The differences in the scale of parts a and b of thesefigures is noted. The results for the coextruded geomembrane system shows a postpeak softening trend throughout the tested normal stress range. In comparison, theresults of the structured geomembrane system exhibit higher stiffness, lower strength,and limited strain softening at low (o50 kPa) normal stresses, with post peaksoftening and mobilized strengths becoming comparable to the coextruded system asnormal stress increases.
ARTICLE IN PRESS
Table 2
Results of interface shear testing
Test no. sn (kPa) tpeak (kPa) dpeak (mm) tresidual (kPa) Remarks
CE-1 0.4 3.91 12.88 1.77 NPNW geotextile–coextruded geomembrane
CE-2 3.6 8.67 13.11 4.05 NPNW geotextile–coextruded geomembrane
CE-3 5.5 11.33 12.19 5.29 NPNW geotextile–coextruded geomembrane
CE-4 14.4 18.33 11.02 10.23 NPNW geotextile–coextruded geomembrane
CE-5 26.9 24.43 7.82 13.55 NPNW geotextile–coextruded geomembrane
CE-6 51.9 35.16 7.57 21.74 NPNW geotextile–coextruded geomembrane
CE-7 101.9 65.49 6.63 37.15 NPNW geotextile–coextruded geomembrane
CE-8 151.9 90.25 7.19 47.64 NPNW geotextile–coextruded geomembrane
CE-9 201.9 113.73 7.04 59.35 NPNW geotextile–coextruded geomembrane
CE-10 261.9 146.87 6.71 74.15 NPNW geotextile–coextruded geomembrane
CE-11 301.9 173.03 7.26 79.28 NPNW geotextile–coextruded geomembrane
ST-1 0.4 0.65 0.46 0.50 NPNW geotextile–structured geomembrane
ST-2 2.5 2.14 1.09 1.51 NPNW geotextile–structured geomembrane
ST-3 4.7 2.89 1.65 2.19 NPNW geotextile–structured geomembrane
ST-4 14.4 7.05 1.85 7.05 NPNW geotextile–structured geomembrane
ST-5 26.9 13.55 4.45 11.87 NPNW geotextile–structured geomembrane
ST-6 51.9 31.24 4.27 23.81 NPNW geotextile–structured geomembrane
ST-7 101.9 59.07 4.60 40.05 NPNW geotextile–structured geomembrane
ST-8 151.9 91.83 7.80 55.18 NPNW geotextile–structured geomembrane
ST-9 211.9 131.63 6.99 63.58 NPNW geotextile–structured geomembrane
ST-10 261.9 158.77 7.14 75.38 NPNW geotextile–structured geomembrane
ST-11 311.9 193.15 8.84 84.24 NPNW geotextile–structured geomembrane
CE_R1 101.9 45.80 4.90 34.77 First retest of test CE-7
CE_R2 101.9 41.08 4.67 31.49 Second retest of test CE-7
CE_R3 101.9 39.89 4.32 31.94 Third retest of test CE-7
ST_R1 101.9 45.94 5.02 37.72 First retest of test ST-7
ST_R2 101.9 45.56 3.99 37.38 Second retest of test ST-7
ST_R3 101.9 43.43 4.70 35.56 Third retest of test ST-7
G.L. Hebeler et al. / Geotextiles and Geomembranes 23 (2005) 77–10588
4.3. ASTM D5169-98 hook and loop shear strength results
As noted above, ASTM D5169-98 hook and loop shear strength tests wereconducted on the geosynthetic systems, the industrial strength fastener systems, aswell as hybrid combinations of the geosynthetics and commercial hook and loopcomponents as outlined in Table 3. All material combinations were tested foursuccessive times to characterize the effect of wear on the interface behavior. Testsusing the commercial hook and loop system allowed for a baseline value ofengineered hook and loop shear strength to be obtained. The hybrid geosynthetic—commercial hook and loop testing combinations isolated the individual contribu-tions of each geosynthetic material towards the hook and loop shear strength, andallowed for more detailed quantification of hook and loop interaction. Testsperformed according to the ASTM standard method result in continuous changes inthe sheared area, and as such, the peak load becomes the best indicator of hook and

ARTICLE IN PRESS
Fig. 8. Direct interface shear results of a coextruded HDPE geomembrane with a thickness of 1.5mm
sheared against needle-punched nonwoven geotextile specimens having a mass per unit area of 203 g/m2:
(a) all tests (normal stresses from 0.4 to 302kPa), (b) exploded view of low normal stress tests
(0.4–26.9 kPa).
G.L. Hebeler et al. / Geotextiles and Geomembranes 23 (2005) 77–105 89
loop shear strength. The results of all tested material combinations are summarizedin Table 3. The general trend in the results follows an initial portion of increasingstrength attributed to the engagement of the ‘‘loop’’ structure by the ‘‘hook’’material. Following the seating response upon initial displacement, the typicalbehavior consists of a linear strength increase culminating at a peak resistance,

ARTICLE IN PRESS
Fig. 9. Direct interface shear results of a structured HDPE geomembrane with a thickness of 1.5mm
sheared against needle-punched nonwoven geotextile specimens having a mass per unit area of 203 g/m2:
(a) all tests (normal stresses from 0.4 to 312kPa), (b) exploded view of low normal stress tests
(0.4–26.9 kPa).
G.L. Hebeler et al. / Geotextiles and Geomembranes 23 (2005) 77–10590
followed by rapid decrease in strength as the contact area decreases to zero. Typicalresults from the ASTM standard hook and loop strength test for the tested materialsexhibiting large hook and loop interaction and those exhibiting minimal butmeasurable hook and loop interaction are shown in Figs. 10a and b, respectively.The significant difference in scale between these two figures is noted.

ARTICLE IN PRESS
Table 3
Summary of ASTM hook and loop shear testing
Hook material Loop material Virgin peak
load (N)
Disp at
virgin peak
(mm)
Residual
peak load
(N)a
Disp at
residual
peak (mm)
Velcro hooks Velcro loops 294.0 11.6 216.6 7.2
Velcro hooks NPNW geotextile 53.6 20.5 4.0 8.3
Coextruded
geomembrane
NPNW geotextile 0.6 7.5 2.1 11.2
Coextruded
geomembrane
Velcro loops 3.1 1.3 1.7 2.7
Structured
geomembrane
NPNW geotextile 0.0 N/A 0.0 N/A
Structured
geomembrane
Velcro loops 0.0 N/A 0.0 N/A
aResidual values taken from the 3rd retest.
G.L. Hebeler et al. / Geotextiles and Geomembranes 23 (2005) 77–105 91
5. Discussion
5.1. Summary of results
To facilitate discussions herein, two normal stress regions are defined as typicallyencountered in municipal solid waste landfill practice: construction and final capclosure stresses (o50 kPa), and operational stresses (50 to 41000 kPa). The focus ofthis study is on construction and low to intermediate operational normal stressinteraction mechanisms. The direct interface shear results are summarized in Figs. 11and 12 showing the peak and psuedo-residual interface strength values, respectively,plotted versus applied normal stress. The structured geomembrane system clearlyshows a linear peak strength behavior over the entire range of normal stresses tested,as shown in Fig. 11. In contrast, the coextruded geomembrane system exhibitsnonlinear peak response at low normal stresses, transitioning to a linearly increasingpeak strength response over the remainder of the tested normal stresses range(15–302 kPa). The trends of the peak interface shear stress results show that thestructured system provides slightly higher interface friction than the coextrudedsystem within the operational normal stress range tested, as represented in theconventional Mohr–Coulomb form shown in Eq. (2):
tsðpeakÞ ¼ ca þ tanðd0peakÞ; ð2Þ
coextruded : tsðpeakÞ ¼ 9:5 kPaþ tanð30:4Þ; ð3Þ
structured : tsðpeakÞ ¼ 0 kPaþ tanð35:1Þ; ð4Þ
where ca=apparent cohesion and d0peak=the peak interface friction angle (Vaid andRinne, 1995; Richardson and Theil, 2001). The pseudo-residual interface behavior

ARTICLE IN PRESS
Fig. 10. Typical virgin ASTM standard hook and loop shear strength test results: (a) combinations
exhibiting large hook and loop interaction, (b) combinations exhibiting minimal but measurable hook and
loop interaction.
G.L. Hebeler et al. / Geotextiles and Geomembranes 23 (2005) 77–10592
presented in Fig. 12, is based on shear stress values @ 80mm displacement. Thefigure shows similar results for tests on specimens of both textures, with thecoextruded system again showing slightly stronger response in the low constructionstress range (o25 kPa), and the structured system showing marginally strongerresidual response at operational stresses.

ARTICLE IN PRESS
Fig. 11. Values of peak interface stress as a function of normal stress for the tested coextruded and
structured geomembranes with a thickness of 1.5mm in contact with a needle-punched nonwoven
geotextile having a mass per unit area of 203 g/m2.
Fig. 12. Values of psuedo-residual interface stress, taken at 80mm of displacement, as a function of
normal stress for the tested coextruded and structured geomembranes with a thickness of 1.5mm in
contact with a needle-punched nonwoven geotextile having a mass per unit area of 203 g/m2.
G.L. Hebeler et al. / Geotextiles and Geomembranes 23 (2005) 77–105 93
5.2. Behavior at construction level normal stresses
Differences in direct interface shear behavior over the low normal stress range forthe coextruded and structured geomembranes are illustrated in Figs. 8b and 9b,respectively. The initial stiffness of the low (o50 kPa) normal stress tests

ARTICLE IN PRESS
G.L. Hebeler et al. / Geotextiles and Geomembranes 23 (2005) 77–10594
onstructured specimens (Fig. 9b) show predominantly frictional behavior with littleto no degradation in small strain stiffness with increasing normal load. In contrast,the tests on coextruded specimens (Fig. 8b) show much higher peak and residualstrengths at low normal stresses, all exhibiting a bilinear pre-peak stiffness behaviorconsisting of an initial frictional response, followed by a secondary strength increaseat lower stiffness representative of supplemental hook and loop interaction. The peakstress being followed by significant post-peak softening for the coextruded samples.The reduction in displacement to peak stress with increasing normal stress seen inFig. 8b (13mm at 0.4 kPa to 8mm at 26.9 kPa) represents a transition in dominantmechanism, from surficial hook and loop interactions to a more frictional response athigher normal stresses. While the structured system exhibits linear peak behaviorwithin the low normal stress range as seen in Fig. 11, a detailed examination of thefull shear stress–displacement behavior of the individual low normal stress tests(Fig. 9b) shows an increase in displacement to peak stress with increasing normalstress (0.1mm at 0.4 kPa to 4.3mm at 26.9 kPa) indicative of greater geotextilefilament engagement as normal stress increases. In summary, frictional interactionsoccur at much higher stiffness than hook and loop interactions, and the relativecontributions of frictional and hook and loop resistance leads to the observed trendsand differences in displacement to peak strength.
To better understand the hook and loop interactions at low normal stresses, theresults of the ASTM standard hook and loop shear strength tests presented in Table3 and Fig. 10 were examined. As discussed earlier, the ASTM hook and loop testoccurs at essentially zero applied normal stress, thereby isolating the contributions ofhook and loop interaction from frictional mechanisms. The peak strength of thecommercial hook and loop system was determined to be 294N for virgin samplessheared at 305mm/min over a 1290mm2 area. The tests including one or more of thegeosynthetic materials showed much lower strengths than the engineered hook andloop system. The structured geomembrane showed no apparent hook and loopstrength when paired with either the NPNW geotextile or the commercial loops,further illustrating the absence of hook and loop interaction at low normal stressesfor this texturing technique. The coextruded geomembrane showed some limitedhook and loop strength, with the peak load of the virgin samples equaling 0.6 and3.1N when paired with the NPNW geotextile and the commercial loops,respectively. The combination of the NPNW geotextile and the commercial hooksprovided a significant hook and loop interaction, on the order of 54N of peakstrength. This hybrid test clearly shows that the fabric structure of NPNWgeotextiles can provide considerable hook and loop strength when paired with anideal hooking material. A comparative review of the images in Figs. 1c, 2c, and 3support these interpretations.
The current low normal stress results provide quantitative insight into mechanismsaffecting nonfrictional interaction in geotextile–geomembrane systems and comple-ment the findings of Giroud (2004). Giroud investigated the effects of adhesion onthe performance of geosynthetic systems at construction level normal stresses andprovides guidance in the design of geosynthetic systems under constructionconditions accounting for adhesion in any form.

ARTICLE IN PRESS
G.L. Hebeler et al. / Geotextiles and Geomembranes 23 (2005) 77–105 95
5.3. Texture–filament interactions
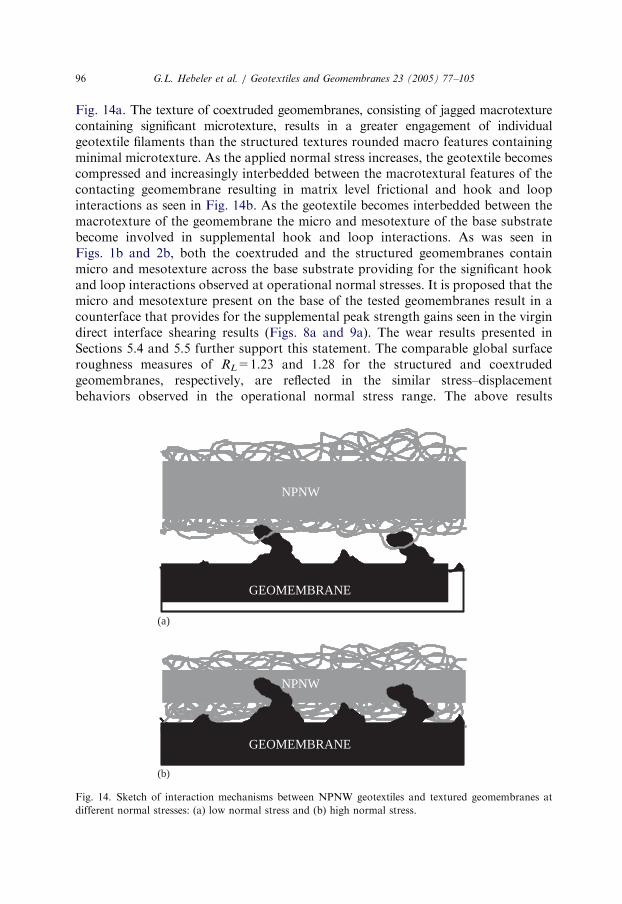
Plots of the responses from three selected normal stresses (14.4, 102, and 262 kPa)are shown in Fig. 13 for both texture types. These results demonstrate the typicalevolution of stiffness and strength behavior over the tested normal stress range forgeotextile–geomembrane systems of comparable global geomembrane surfaceroughness values but formed using different texturing methods. The geomembranesshow distinctly different behavior in the low (14.4 kPa) normal stress region wherethe sharp overlapping texture of the coextruded geomembrane results in a significanthook and loop contribution to the overall interface response. The stiff roundedmacrotexture of the structured geomembrane provides a more frictional response oflower strength and higher stiffness. The behavior of the two materials transitionstowards a convergent response in the operational stress range where macro and basegeomembrane texture begin to control the system behavior. A transition in themechanism controlling hook and loop interaction within the geosynthetic occurswith increased normal stress as the surficial hook and loop interaction dominant atlower normal stresses is exceeded by the effect of the geotextile matrix compressionbetween the macrotextural features of the geomembranes, resulting in matrix levelinteractions controlling the shear behavior at higher normal stresses. A schematicshowing the transition of textured geomembrane–NPNW geotextile systeminteractions from the low normal stress range to the operational stress range isshown in Fig. 14. At low normal stresses, the interaction between the NPNWgeotextile and the textured geomembranes consists mostly of individual filamentsbeing engaged by the outward region of the geomembrane texture, as seen in
Fig. 13. Progression of interface shear behavior with increasing normal stress for the tested coextruded
and structured geomembranes with a thickness of 1.5mm in contact with a needle-punched nonwoven
geotextile having a mass per unit area of 203 g/m2.
ARTICLE IN PRESS
G.L. Hebeler et al. / Geotextiles and Geomembranes 23 (2005) 77–10596
Fig. 14a. The texture of coextruded geomembranes, consisting of jagged macrotexturecontaining significant microtexture, results in a greater engagement of individualgeotextile filaments than the structured textures rounded macro features containingminimal microtexture. As the applied normal stress increases, the geotextile becomescompressed and increasingly interbedded between the macrotextural features of thecontacting geomembrane resulting in matrix level frictional and hook and loopinteractions as seen in Fig. 14b. As the geotextile becomes interbedded between themacrotexture of the geomembrane the micro and mesotexture of the base substratebecome involved in supplemental hook and loop interactions. As was seen inFigs. 1b and 2b, both the coextruded and the structured geomembranes containmicro and mesotexture across the base substrate providing for the significant hookand loop interactions observed at operational normal stresses. It is proposed that themicro and mesotexture present on the base of the tested geomembranes result in acounterface that provides for the supplemental peak strength gains seen in the virgindirect interface shearing results (Figs. 8a and 9a). The wear results presented inSections 5.4 and 5.5 further support this statement. The comparable global surfaceroughness measures of RL=1.23 and 1.28 for the structured and coextrudedgeomembranes, respectively, are reflected in the similar stress–displacementbehaviors observed in the operational normal stress range. The above results
GEOMEMBRANE
NPNW
(a)
(b)
GEOM
NPNW
GEOMEMBRANE
GEOMEMBRANE
NPNW
NPNW
Fig. 14. Sketch of interaction mechanisms between NPNW geotextiles and textured geomembranes at
different normal stresses: (a) low normal stress and (b) high normal stress.

ARTICLE IN PRESS
G.L. Hebeler et al. / Geotextiles and Geomembranes 23 (2005) 77–105 97
support the hypothesis that as normal stress increases from the construction to theoperational stress range; the controlling behavioral mechanisms transfer fromsurficial to interbedded interactions.
5.4. Geomembrane wear mechanisms
The effect of wear on the textured geomembranes was investigated throughrepeated direct interface shear tests conducted at 102 kPa normal stress. Thegeomembrane specimens were tested against four virgin geotextile specimens insuccession, for a total cumulative displacement of 320mm (80mm per test). The useof virgin geotextile specimens in each retest, isolated the role of geomembranetexture degradation on the residual strength of the interfaces. Fig. 15 presents theresults of this test series for the coextruded (Fig. 15a) and structured (Fig. 15b)systems, respectively. Both systems show significant loss of peak strength uponretesting, indicating that wear of the geomembrane texture can occur in theoperational stress range. The loss of peak strength and the lack of significantdegradation to macrotexture upon reshearing at this normal stress level (102 kPa)supports the conclusion that micro and mesotexture found on both the basesubstrate and also on the macrotextural features not only provide supplementalstrength by way of hook and loop interactions but also become damaged uponshearing past the virgin peak. Fig. 15b additionally supports the above hypothesisthat at higher normal stresses the mesotexture present on the base of the structuredgeomembrane provides contact points for filament engagement and strength gainsprovided by the subsequent matrix level hook and loop interactions. While bothgeomembrane types show the loss of the hook and loop contribution after the virginshearing, it can be seen that the coextruded geomembrane shows a much larger peakto residual strength decrease, consistent with the higher level of initial microtexture.This is clearly illustrated in the plot of sensitivity versus cumulative displacement forthese test series as seen in Fig. 16. After significant cumulative shearing bothgeosynthetic systems converge to a sensitivity of tpeak=tresidual of about 1.2. Therelative stability of the measured residual strengths upon reshearing supports thesupposition that post-peak interface behavior in these types of systems ispredominantly controlled by the normal stress; the mechanical properties andbehavior of the geotextile filaments and matrix; and the size, not the shape orassociated microtexture of the geomembrane macrotexture.
The same properties that make the coextruded texture conducive to higher hookand loop interaction at lower normal stresses, namely: significant microtexture,overlapping pockets, and sharp extensions results in a macrotexture that was foundto be more compressible and fragile through pre and post-shear visual inspection,accounting for the slightly lower peak interface strengths seen at operational normalstress levels. While the difference in the strengths of the two textured interfaces issignificant within the low normal stress range, it is only moderately significant withinthe tested range of operational normal stresses, however, increased degradation andcompression of the texture on coextruded geomembranes may become significant athigher applied normal stresses.

ARTICLE IN PRESS
Fig. 15. Direct interface shear repeat test results of an HDPE geomembranes, (a) coextruded and (b)
structured, with a thickness of 1.5mm sheared against virgin needle-punched nonwoven geotextile
specimens having a mass per unit area of 203 g/m2 at a normal stress level of 102 kPa.
G.L. Hebeler et al. / Geotextiles and Geomembranes 23 (2005) 77–10598
5.5. Geotextile wear mechanisms
The pseudo-residual interface behavior of the tested materials was presented inFig. 12. The plots show similar results for tests on specimens of both textures, withthe large displacement strength of the interfaces primarily governed by the propertiesof the geotextile and the macrotexture of the geomembranes. The average filamentlength of the staple NPNW geotextile tested is approximately 75–100mm (3–4 in). Ata maximum, only half of the filament length can be engaged before phenomena such

ARTICLE IN PRESS
Fig. 16. Sensitivity ðtpeak=tresidualÞ versus cumulative displacement at 102 kPa normal stress for the tested
coextruded and structured geomembranes with a thickness of 1.5mm in contact with a needle-punched
nonwoven geotextile having a mass per unit are of 203 g/m2.
G.L. Hebeler et al. / Geotextiles and Geomembranes 23 (2005) 77–105 99
as filament pullout and other geotextile wear mechanisms degrade individualfilament strength. The loose filaments pulled and/or torn from the matrix throughvirgin shearing subsequently detract from the post-peak system strength as they limitcontinued interactions at the contact surface. As such, geotextile wear mechanismsappear to control the large displacement strength of this type of geosyntheticinterface provided the combination of surface texture and normal stress are sufficientto create interactions similar to Fig. 14b. The combination of sufficient roughness toengage the geotextile fabric globally instead of at individual filaments, and sufficientnormal stress to allow the geotextile fabric to fully penetrate into the geomembranetexture allows the full global strength of the NPNW geotextile to be realized for aparticular normal stress level (Frost et al., 2002). Fig. 16, showing sensitivity as afunction of cumulative shear displacement against virgin geotextiles at intervals of80mm, shows a convergence to a value of tpeak=tresidual ¼ 1:2 for both texture types.The convergence of the sensitivity value for both geomembrane types after repeatedshearing against virgin geotextile samples represents an isolation of the geotextilewear as the majority of the geomembrane wear occurs within the initial tests of thewear sequence. This residual sensitivity value represents the geotextile strength lossesthat result from large displacement matrix level interface shearing regardless of thepresence of significant hook and loop interaction.
Geotextile wear was also investigated through residual ASTM hook and loopshear strength testing. Residual values were obtained by conducting 3 repeat tests onthe same materials and taking the peak load of the 4th test (3rd retest) as the residualvalue, as listed in Table 3. The coextruded geomembrane–NPNW geotextilecombination demonstrated an increased residual hook and loop response as

ARTICLE IN PRESS
G.L. Hebeler et al. / Geotextiles and Geomembranes 23 (2005) 77–105100
compared to the virgin tests due to the loosening of the geotextile fabric upon repeattesting. The loosening of the fabric allowed the coextruded texture to more easilyengage the surficial filaments of the NPNW geotextile, providing a 350% increase inpeak strength. The higher observed hook and loop interaction at zero normal stressresulted from more filaments being able to engage the texture between themacrotextural features due to the loosening of the geotextile matrix. This mechanismparallels the increased hook and loop interactions seen in the direct interface sheartests as a result of increasing the applied normal stress. The NPNW geotextileshowed a dramatic (92.5%) decrease in strength for the 3rd retest when paired withthe commercial hooks, indicating that repeated shearing causes the surficial filamentsto be dislodged from their anchorage in the main fabric matrix. The shearing of thefilaments from the matrix was not seen after three retests with the coextruded texturebecause of the reduced level of engagement; however, similar strength reduction wasobserved after significant retesting (410 retests).
5.6. Sensitivity ðtpeak=tresidualÞ
A useful measure to highlight differences in the peak and psuedo-residualresponses of the tested geotextile–geomembrane systems is the sensitivityðtpeak=tresidualÞ of the direct interface shear results, as shown in Fig. 17 as a functionof normal stress. It can be seen that both systems exhibit an initial decrease insensitivity with increasing normal stresses resulting from the transition inengagement mechanisms depicted in Fig. 14. After the initial decrease in sensitivityat low normal stresses the structured geomembrane–geotextile system shows anapproximately linear increase in sensitivity from a minimum value of 1.0 at a normal
Fig. 17. Sensitivity ðtpeak=tresidualÞ versus normal stress for the tested coextruded and structured
geomembranes with a thickness of 1.5mm in contact with a needle-punched nonwoven geotextile having
a mass per unit area of 203 g/m2.
ARTICLE IN PRESS
G.L. Hebeler et al. / Geotextiles and Geomembranes 23 (2005) 77–105 101
stress of 14.4 kPa to a maximum observed sensitivity of 2.3 at the maximum normalstress level tested (312 kPa). The coextruded geomembrane–geotextile systemexhibits higher sensitivity values at low normal stresses exhibiting a measuredmaximum at the lowest normal stress tested (tP=tR ¼ 2:2 @ 0.4 kPa). The largesensitivities at low normal stresses stem from the higher peak strengths observed atthose normal stresses due to the significant hook and loop contribution. Thecoextruded system sensitivity shows a decreasing trend with increased normal stressup to 50 kPa at which time the sensitivity increases linearly, but at a slower rate thanthe structured system. The global interaction mechanisms of the two systems showsimilar behaviors as a result of the similarities in macrogeomembrane surfacetexture, and the increasing contributions of matrix level geotextile–geomembranetexture interactions. The divergence of the sensitivity trends stems from thedifferences seen in the peak behavior (Fig. 11), as the residual behaviors are similardue to their dependence on the consistent geotextile and macroroughness properties.It follows logically that the increase in sensitivity seen at operational normal stressesfor the coextruded system would lag that of the structured system as highlightedpreviously by the peak strength behaviors.
5.7. Stiffness considerations
Examination of the interface stress displacement behavior for the various normalstress ranges also reveals some important stiffness considerations. In the low(14.4 kPa) normal stress plots of Fig. 13, the displacement to peak of the two systemsshows significant divergence, 1.5 and 9.0mm for the structured and coextrudedgeomembranes, respectively. As such, depending on the allowable constructiondisplacement specifications, the added benefits of hook and loop interactions seenfor the coextruded texture at low (o50 kPa) normal stresses may not be achievedthroughout the system. The initial interface stiffnesses of the two geomembranesystems are comparable, but are divergent after the structured geomembrane systemreaches peak strength, indicating that both textures provide comparable initialfrictional stiffness. It follows that the added strength gained through hook and loopinteraction is achieved at a much lower stiffness, due to the lower stiffness ofindividual NPNW filaments that are discretely involved in low normal stress hookand loop response mechanisms. As normal stress increases and similar interactionmechanisms control the behavior of both geomembrane types, the stiffnesscharacteristics of the two geotextile–geomembrane systems are essentially equivalent.The large displacements needed to mobilize the peak strength of both geotextile-geomembrane systems at operational normal stress levels should be noted whenspecifying the in-place strengths of these types of geosynthetic systems.
6. Conclusions
Through a combination of multiple laboratory tests and optical observations, theinterface behavior of two textured geomembrane types (coextruded and structured)

ARTICLE IN PRESS
G.L. Hebeler et al. / Geotextiles and Geomembranes 23 (2005) 77–105102
in contact with NPNW geotextiles was investigated. The direct interface shear andASTM hook and loop results show distinctive differences in the behavior of thetested interfaces. All geomembrane material properties and dimensions, excludingthe texturing processes, were similar. As such, it can be concluded that the observedbehavioral differences can be attributed to the differences in the surface texture ofthe tested geomembranes. A summary of the conclusions from the current study arepresented below:
(1) The texture of the coextruded geomembranes was characterized throughoptical microscopy as consisting of jagged macrotexture with high levels ofmicro and mesotexture present along the base substrate and bonded to themacrotextural features.
(2) The texture of the structured geomembranes was characterized throughoptical microscopy as consisting of ‘‘smooth’’ rounded macrotexture withno bonded micro or mesotexture but significant micro and mesotexturepresent along the base substrate.
(3) Hook and loop interactions in textured geomembrane–geotextile systemswere found to be strongly dependent on the level of micro and mesotexturebonded to the surface of the macrotextural features at low normal stressesand on the level bonded to the macrotexture and along the base substrate athigher normal stresses.
(4) The frictional contributions to the shear response of the two systems werefound to be controlled by discrete surficial interactions between surfacefilaments and textural features at low normal stresses, and dominated by thecompression and interbedding of the geotextile between the macrotexture,resulting in more global continuum interactions at higher normal stresses.
(5) The geomembranes tested contained macrotexture of similar out of planedimension and spacing, as well as comparable levels of base texture resultingin similar frictional and hook and loop contributions to the peak responsewithin the range of operational stresses tested (50–312 kPa). The directinterface shear results within this normal stress range correspond toconventional Mohr–Coulomb relationships of tsðpeakÞ ¼ 9:5 kPaþ tanð30:4Þand tsðpeakÞ ¼ tanð35:1Þ for the coextruded and structured systems,respectively.
(6) The peak response of the coextruded system was consistently strongerthan the structured system within the low normal stress range (o50 kPa).The structured texture exhibited an almost purely frictional peakresponse supplemented by insignificant hook and loop interactionsat low stresses due to the absence of microtexture away fromthe base substrate. In contrast, the jagged nature and significantmicrotexture present on the macrotexture of the coextruded geo-membrane provided a counterface conducive to large strength contributionsfrom hook and loop interaction in addition to the comparable frictionalresponse resulting in a highly nonlinear peak shear response at low normalstresses.

ARTICLE IN PRESS
G.L. Hebeler et al. / Geotextiles and Geomembranes 23 (2005) 77–105 103
(7) ASTM standard hook and loop shear strength tests were used to isolate thelow normal stress hook and loop interaction mechanisms. The hook andloop tests confirmed the low normal stress behavior seen in the directinterface shear testing and allowed the individual contributions to the hookand loop interaction to be quantified. The fabric of NPNW geotextiles wasfound to be well suited to hook and loop interaction when paired with theengineered hook structure of a commercial hook and loop product. Thecoextruded geomembrane showed limited response during ASTM hook andloop testing when paired with both the NPNW geotextile and commercialloops, while the structured geomembranes provided no measurable responsein combination with all tested loop materials.
(8) The pseudo-residual shear behaviors of the tested geomembranes weresimilar, and primarily dependent on frictional interactions between theNPNW geotextile and the macrotextural features of both geomembranes.Additionally, the pseudo-residual shear strengths were found to be stronglydependant on the properties and wear mechanisms of the NPNW geotextile.
(9) Microtexture, and to a lesser extent mesotexture, on both geomembranetypes was found to be susceptible to wear of varying degrees as a result ofinterface shear at all tested normal stress levels and was therefore not asignificant factor in post-peak interaction mechanisms.
(10) Through visual inspection of the geomembranes pre- and post-shear, themacrotextural features of the coextruded geomembrane were found to bemore susceptible to wear and degradation processes from interface shear, ascompared to the macrotexture of the structured geomembrane, resulting inslightly lower peak and residual strengths at the operational normal stressestested.
The current results suggest that hook and loop interaction plays a significant rolein the interface shear behavior of NPNW geotextile-textured geomembrane systemsacross a wide range of normal stress levels. The results and discussions presentedherein regarding hook and loop interaction within textured geomembrane–geotextilesystems as a result of different geomembrane texturing techniques should allowcontractors and design engineers to make more informed decisions regarding theselection and specification of textured geomembranes in practice.
Acknowledgements
The authors are grateful to the anonymous reviewers for their insightful commentson the manuscript. The first author was supported under a National Defense Scienceand Engineering Graduate (NDSEG) fellowship. The third author was supported byan undergraduate fellowship through the NSF/SURF program at Georgia Tech.Both sponsors are gratefully acknowledged. The assistance of Gretchen Davidsonwith some of the laboratory testing is gratefully acknowledged. The geosynthetic
ARTICLE IN PRESS
G.L. Hebeler et al. / Geotextiles and Geomembranes 23 (2005) 77–105104
manufacturers (Agru America; Amoco Fabrics and Fibers Co.; and Poly-Flex, Inc.)are acknowledged for providing the samples of their products used in the currentstudy.
References
ASTM D5169, 1998. Standard test method for shear strength (dynamic method) of hook and loop touch
fasteners. West Conshohocken, PA.
ASTM D5321, 2002. Standard test method for determining the coefficient of soil and geosynthetic or
geosynthetic and geosynthetic friction by the direct shear method. West Conshohocken, PA.
Donaldson, J.J., 1995. Texturing techniques. Proceedings of the Eighth Conference on
Geosynthetic Resins, Formulations, and Manufacturing, Philadelphia, Pennsylvania, USA,
pp. 116–125.
Dove, J.E., Frost, J.D., 1996. A method for measuring geomembrane surface roughness. Geosynthetics
International 3 (3), 369–392.
Dove, J.E., Frost, J.D., Bachus, R.C., Han, J., 1997. The influence of geomembrane surface roughness on
interface strength. Proceedings of Geosynthetics’97 Conference, IFAI, Long Beach, CA, USA, vol. 2,
pp. 863–876.
Frost, J.D., Kuo, C.Y., 1996. Automated determination of the distribution of local void ratio from digital
image analysis. Geotechnical Testing Journal 19 (2), 107–117.
Frost, J.D., Lee, S.W., 2001. Microscale study of geomembrane–geotextile interactions. Geosynthetics
International 8 (6), 577–597.
Frost, J.D., Evans, T.M., Hebeler, G.L., Giroud, J.P., 2002. Influence of wear mechanisms on
geosynthetic interface strengths. Proceedings of the Seventh International Conference on Geosyn-
thetics, Nice, France, vol. 4, pp. 1325–1328, September.
Gilbert, R.B., Liu, C.N., Wright, S.G., Trautwein, S.J., 1995. A double shear test method for
measuring interface strength. Proceedings of Geosynthetics’95, IFAI, Nashville, Tennessee, vol. 3,
pp. 1017–1029.
Giroud, J.P., 2004. Quantitative analysis of the impact of adhesion between geomembranes and geotextiles
on the stability of soil-geosynthetic systems on slopes. JP Giroud, Inc., Ocean Ridge, FL, USA,
pp. 14.
Ingold, T.S., 1994. The Geotextiles and Geomembranes Manual. Elsevier Advanced Technology, Oxford,
UK 610pp.
Koerner, R.M., 1998. Designing with Geosynthetics, fourth ed. Prentice-Hall, New Jersey, USA 783pp.
Kuo, C.Y., Frost, J.D., Chameau, J.-L.A., 1998. Image analysis determination of stereology based fabric
tensors. Geotechnique 48 (4), 515–525.
Lee, S.W., 1998. Influence of surface topography on interface strength and counterface soil structure,
Ph.D. Dissertation, School of Civil and Environmental Engineering, Georgia Institute of Technology,
Atlanta, GA, USA, 336pp.
Lee, S.W., Frost, J.D., Righter, G.K., 1998. The influence of geomembrane surface roughness on
geomembrane–geotextile interface strength. Proceedings of the Sixth International Conference on
Geosynthetics, Atlanta, GA, USA, vol. 1, pp. 433–438.
Li, M., Gilbert, R.B., 1999. Shear strength of textured geomembranes and nonwoven geotextile interfaces.
Proceedings of Geosynthetics’99, IFAI, Boston, MA, USA, vol. 1, pp. 505–516.
Richardson, G.N., Thiel, R.S., 2001. Interface shear strength: part I—geomembrane considerations.
Geosynthetic Fabric Review 14–19.
Stark, T.D., Williamson, T.A., Eid, H.T., 1996. HDPE geomembrane/geotextile interface shear strength.
ASCE Journal of Geotechnical Engineering 122 (3), 197–203.
Vaid, Y.P., Rinne, N., 1995. Geomembrane coefficients of interface friction. Geosynthetics International 2
(1), 309–325.

ARTICLE IN PRESS
G.L. Hebeler et al. / Geotextiles and Geomembranes 23 (2005) 77–105 105
Williams, N.D., Houlihan, M., 1986. Evaluation of friction coefficients between geomembranes,
geotextiles, and related products. Proceedings of the Third International Conference on Geotextiles,
Vienna, Austria, pp. 891–896.
Zettler, T.E., 1999. Operational induced changes in geomembrane surface topography, M.S. Thesis,
School of Civil and Environmental Engineering, Georgia Institute of Technology, Atlanta, GA, USA,
264pp.
Zettler, T.E., Frost, J.D., DeJong, J.T., 2000. Shear-induced changes in smooth HDPE geomembrane
surface topography. Geosynthetics International 7 (3), 243–267.
Copyright © 2022 FDOKUMEN