Quantification of Liver Fat in the Presence of Iron and Iodine
8
ORIGINAL ARTICLE Quantification of Liver Fat in the Presence of Iron and Iodine An Ex-Vivo Dual-Energy CT Study Michael A. Fischer, MD,* Ralph Gnannt, MD,* Dimitri Raptis, MD,† Caecilia S. Reiner, MD,* Pierre-Alain Clavien, MD,† Bernhard Schmidt, PhD,‡ Sebastian Leschka, MD,§ Hatem Alkadhi, MD, MPH,* and Robert Goetti, MD* Purpose: Iodinated contrast media (CM) and iron in the liver are known to hinder an accurate quantification of liver fat content (LFC) with single- energy computed tomography (SECT). The purpose of this study was to evaluate the feasibility and accuracy of dual-energy CT (DECT) for ex vivo quantification of LFC, in the presence of iron and CM, compared with SECT. Materials and Methods: Sixteen phantoms with a defined LFC of 0%, 10%, 30%, and 50% fat and with varying iron content (0, 1.5, 3, and 6 mg/mL wet weight liver) were scanned with a second-generation dual-source 128-slice CT system. Phantoms were scanned unenhanced and contrast-enhanced after adding 1.0 mg/mL iodine to each phantom. Both SECT (120 kV) and DECT (tube A: 140 kV, using a tin filter 228 mAs; tube B: 80 kV, 421 mAs) data were acquired. An iron-specific dual-energy 3-material decomposition algorithm pro- viding virtual noniron images (VNI) was used to subtract iron and CM from the data. CT numbers (Hounsfield units) were measured in all data sets, including 120 kV from SECT, as well as 140 kV, 80 kV, 50%:50% weighted 80 kV/140 kV, and VNI derived from DECT. The dual-energy index was calculated from 80 kV and 140 kV data. SECT and DECT measurements (Hounsfield units) including the dual-energy index of unenhanced and contrast-enhanced phantoms were compared with the known titrated LFC, using Pearson correlation analysis and Student t test for related samples. Results: Inter-reader agreement was excellent for all measurements of CT numbers in both SECT and DECT data (Pearson r, 0.965–1.0). For fat quantification in the absence of iron and CM, CT numbers were similar in SECT and DECT (all, P 0.05), showing a linear correlation with titrated LFC (r ranging from 0.981 to 0.999; P 0.01). For fat quantification in the presence of iron but without CM, significant underestimation of LFC was observed for all measurements in SECT and DECT (P 0.05), except for VNI. Measurements in VNI images allowed for an accurate LFC estimation, with no significant differences compared with measurements in iron-free phan- toms (all, P 0.25). For fat quantification in the presence of iron and CM, further underestimation of LFC was seen for measurements in SECT and DECT (P 0.015), except for VNI. Measurements in VNI images showed a high accuracy for estimating the LFC, with no significant difference compared with measurements in iron- and CM-free phantoms (P 0.2). Conclusions: Our ex vivo phantom study indicates that DECT with the use of a dedicated, iron-specific 3-material decomposition algorithm allows for the accurate quantification of LFC, even in the presence of iron and iodinated CM. VNI images reconstructed from DECT data equal nonenhanced SECT data of liver without CM by eliminating iron and iodine from the images. No added value was seen for DECT as compared with SECT for quantification of LFC in the absence of iron and iodine. Key Words: liver fat content, iron, contrast media, computed tomography, dual-energy (Invest Radiol 2011;xx: 000 – 000) H epatic steatosis, defined as elevated triglyceride content of the liver, has many underlying causes, including alcohol, metabolic diseases, and nutritional disorders. 1 As a consequence of the meta- bolic syndrome, the prevalence of hepatic steatosis has markedly increased in the past years and has been estimated to affect 13% to 23% of the Western population. 2,3 Early diagnosis and treatment of both alcoholic and nonalcoholic hepatic steatosis are important due to their potential to progress to end-stage liver disease. In addition, fatty liver has a lower regeneration potential, affecting the outcomes of both conservative therapy and liver surgery. 4,5 Therefore, accu- rate quantification of liver fat content (LFC) is of major clinical interest for the primary evaluation of diffuse liver disease as well as for monitoring treatment response. 6 To date, liver biopsy with sampling of histopathology repre- sents the reference standard method for the quantification of LFC. However, the method is invasive, is subject to sampling errors, and histopathology is known to suffer from a considerable inter-reader variability. 7,8 Among the noninvasive methods of LFC quantifica- tion, magnetic resonance (MR) imaging and especially MR spec- troscopy has gained an important role in providing accurate mea- sures of LFC. 9,10 However, limited availability of MR spectroscopy and the dependence of fat measurements with MR imaging on protocol parameters as well as local field inhomogeneity preclude a widespread use of MR for the evaluation of hepatic steatosis. 10,11 In clinical practice, computed tomography (CT) is commonly used for the imaging evaluation of chronic hepatic disease. The degree of fat deposition can be estimated based on the hepatic attenuation reflected by a decrease in Hounsfield units (HU) with increasing LFC. In the presence of iron and contrast media (CM), however, quantification of LFC is no longer possible with single- energy CT (SECT). 12 Both iron and CM confound measurements by increasing attenuation with higher iron and/or iodine concentrations, an inverse effect to fat. 13,14 This issue is of major clinical concern because iron often coexists with fat depositions in chronic, diffuse liver disease. For example, alcoholic liver disease, which is characterized by fatty liver, fibrosis, hepatitis, and cirrhosis, usually is associated with mild- to-severe iron overload. 15 Moreover, quantification of LFC would be desirable also in CM-enhanced CT studies of the liver. Dual-source CT, being equipped with 2 x-ray tubes and 2 corresponding detector units, enables the simultaneous acquisition of data with 2 different tube voltages. The resulting dual-energy CT (DECT) data allows distinguishing materials with comparable atomic numbers due to differences in the photo and Compton effect on CT attenuation at different photon energies. 16 Accordingly, Received September 21, 2010; accepted for publication (after revision) December 31, 2010. From the *Institute of Diagnostic and Interventional Radiology, University Hospital Zurich, Zurich, Switzerland; †Clinic of Visceral and Transplant Surgery, University Hospital Zurich, Zurich, Switzerland; ‡Imaging and IT Division, Siemens Healthcare, Forchheim, Germany; and §Institute of Radi- ology, General Hospital Saint Gall, Saint Gall, Switzerland. Reprints: Hatem Alkadhi, MD, MPH, Institute of Diagnostic and Interventional Radiology, University Hospital Zurich, Raemistr 100, 8091 Saint Gall, Swit- zerland. E-mail: [email protected]. Copyright © 2011 by Lippincott Williams & Wilkins ISSN: 0020-9996/11/0000-0001 Investigative Radiology • Volume xx, Number x, xxx 2011 www.investigativeradiology.com | 1
-
Upload
independent -
Category
Documents
-
view
0 -
download
0
Transcript of Quantification of Liver Fat in the Presence of Iron and Iodine

ORIGINAL ARTICLE
Quantification of Liver Fat in the Presence of Iron and IodineAn Ex-Vivo Dual-Energy CT Study
Michael A. Fischer, MD,* Ralph Gnannt, MD,* Dimitri Raptis, MD,† Caecilia S. Reiner, MD,*Pierre-Alain Clavien, MD,† Bernhard Schmidt, PhD,‡ Sebastian Leschka, MD,§ Hatem Alkadhi, MD, MPH,*
and Robert Goetti, MD*
Purpose: Iodinated contrast media (CM) and iron in the liver are known tohinder an accurate quantification of liver fat content (LFC) with single-energy computed tomography (SECT). The purpose of this study was toevaluate the feasibility and accuracy of dual-energy CT (DECT) for ex vivoquantification of LFC, in the presence of iron and CM, compared with SECT.Materials and Methods: Sixteen phantoms with a defined LFC of 0%, 10%,30%, and 50% fat and with varying iron content (0, 1.5, 3, and 6 mg/mL wetweight liver) were scanned with a second-generation dual-source 128-sliceCT system. Phantoms were scanned unenhanced and contrast-enhanced afteradding 1.0 mg/mL iodine to each phantom. Both SECT (120 kV) and DECT(tube A: 140 kV, using a tin filter 228 mAs; tube B: 80 kV, 421 mAs) data wereacquired. An iron-specific dual-energy 3-material decomposition algorithm pro-viding virtual noniron images (VNI) was used to subtract iron and CM from thedata. CT numbers (Hounsfield units) were measured in all data sets, including120 kV from SECT, as well as 140 kV, 80 kV, 50%:50% weighted 80 kV/140kV, and VNI derived from DECT. The dual-energy index was calculated from80 kV and 140 kV data. SECT and DECT measurements (Hounsfield units)including the dual-energy index of unenhanced and contrast-enhanced phantomswere compared with the known titrated LFC, using Pearson correlation analysisand Student t test for related samples.Results: Inter-reader agreement was excellent for all measurements of CTnumbers in both SECT and DECT data (Pearson r, 0.965–1.0). For fatquantification in the absence of iron and CM, CT numbers were similar inSECT and DECT (all, P ! 0.05), showing a linear correlation with titratedLFC (r ranging from 0.981 to 0.999; P " 0.01). For fat quantification in thepresence of iron but without CM, significant underestimation of LFC wasobserved for all measurements in SECT and DECT (P " 0.05), except forVNI. Measurements in VNI images allowed for an accurate LFC estimation,with no significant differences compared with measurements in iron-free phan-toms (all, P ! 0.25). For fat quantification in the presence of iron and CM,further underestimation of LFC was seen for measurements in SECT and DECT(P " 0.015), except for VNI. Measurements in VNI images showed a highaccuracy for estimating the LFC, with no significant difference compared withmeasurements in iron- and CM-free phantoms (P ! 0.2).Conclusions: Our ex vivo phantom study indicates that DECT with the useof a dedicated, iron-specific 3-material decomposition algorithm allows forthe accurate quantification of LFC, even in the presence of iron and iodinatedCM. VNI images reconstructed from DECT data equal nonenhanced SECTdata of liver without CM by eliminating iron and iodine from the images. No
added value was seen for DECT as compared with SECT for quantificationof LFC in the absence of iron and iodine.
Key Words: liver fat content, iron, contrast media, computedtomography, dual-energy
(Invest Radiol 2011;xx: 000–000)
Hepatic steatosis, defined as elevated triglyceride content of theliver, has many underlying causes, including alcohol, metabolic
diseases, and nutritional disorders.1 As a consequence of the meta-bolic syndrome, the prevalence of hepatic steatosis has markedlyincreased in the past years and has been estimated to affect 13% to23% of the Western population.2,3 Early diagnosis and treatment ofboth alcoholic and nonalcoholic hepatic steatosis are important dueto their potential to progress to end-stage liver disease. In addition,fatty liver has a lower regeneration potential, affecting the outcomesof both conservative therapy and liver surgery.4,5 Therefore, accu-rate quantification of liver fat content (LFC) is of major clinicalinterest for the primary evaluation of diffuse liver disease as well asfor monitoring treatment response.6
To date, liver biopsy with sampling of histopathology repre-sents the reference standard method for the quantification of LFC.However, the method is invasive, is subject to sampling errors, andhistopathology is known to suffer from a considerable inter-readervariability.7,8 Among the noninvasive methods of LFC quantifica-tion, magnetic resonance (MR) imaging and especially MR spec-troscopy has gained an important role in providing accurate mea-sures of LFC.9,10 However, limited availability of MR spectroscopyand the dependence of fat measurements with MR imaging onprotocol parameters as well as local field inhomogeneity preclude awidespread use of MR for the evaluation of hepatic steatosis.10,11
In clinical practice, computed tomography (CT) is commonlyused for the imaging evaluation of chronic hepatic disease. Thedegree of fat deposition can be estimated based on the hepaticattenuation reflected by a decrease in Hounsfield units (HU) withincreasing LFC. In the presence of iron and contrast media (CM),however, quantification of LFC is no longer possible with single-energy CT (SECT).12 Both iron and CM confound measurements byincreasing attenuation with higher iron and/or iodine concentrations, aninverse effect to fat.13,14 This issue is of major clinical concern becauseiron often coexists with fat depositions in chronic, diffuse liver disease.For example, alcoholic liver disease, which is characterized by fattyliver, fibrosis, hepatitis, and cirrhosis, usually is associated with mild-to-severe iron overload.15 Moreover, quantification of LFC would bedesirable also in CM-enhanced CT studies of the liver.
Dual-source CT, being equipped with 2 x-ray tubes and 2corresponding detector units, enables the simultaneous acquisitionof data with 2 different tube voltages. The resulting dual-energy CT(DECT) data allows distinguishing materials with comparableatomic numbers due to differences in the photo and Compton effecton CT attenuation at different photon energies.16 Accordingly,
Received September 21, 2010; accepted for publication (after revision) December31, 2010.
From the *Institute of Diagnostic and Interventional Radiology, UniversityHospital Zurich, Zurich, Switzerland; †Clinic of Visceral and TransplantSurgery, University Hospital Zurich, Zurich, Switzerland; ‡Imaging and ITDivision, Siemens Healthcare, Forchheim, Germany; and §Institute of Radi-ology, General Hospital Saint Gall, Saint Gall, Switzerland.
Reprints: Hatem Alkadhi, MD, MPH, Institute of Diagnostic and InterventionalRadiology, University Hospital Zurich, Raemistr 100, 8091 Saint Gall, Swit-zerland. E-mail: [email protected].
Copyright © 2011 by Lippincott Williams & WilkinsISSN: 0020-9996/11/0000-0001
Investigative Radiology • Volume xx, Number x, xxx 2011 www.investigativeradiology.com | 1

DECT was shown able to accurately predict the liver iron content(LIC) in an animal study.17 DECT has been recently further im-proved by introducing a tin filter, which improves the separation ofthe 2 energy spectra and thus, the ability to differentiate andcharacterize different body materials.18,19
The purpose of this study was to evaluate the feasibility andaccuracy of DECT for the ex vivo quantification of LFC in thepresence of iron and CM, compared with SECT.
MATERIALS AND METHODS
PhantomsSixteen 15 mL polypropylene test tubes (FALCON, Becton
Dickinson and Co., NJ) containing 10 mL of homogenized mixturesof liver tissue (veal liver), titrated fat (goose fat), and iron (iron-chloride) were placed in a grid and were submerged in a 22 # 30 #40 cm3 tank filled with distilled water, simulating body attenuation.
Liver/fat mixtures, using fat concentrations of 0%, 10%, 30%,and 50% were prepared 4 times to allow for adding iron (Fe3$) in4 different concentrations.
The following iron concentrations were used: 0 mg/mL wet-liversimulating healthy liver, 1.5 mg/mL wet-liver simulating slightly ele-vated LIC, and 3 and 6 mg/mL wet-liver simulating mild and severehemosiderosis, respectively.20 For conversion of LIC of dry-liver re-ported in the literature to LIC of wet-liver used for phantom prepara-tion, a conversion factor of 1/3.33 was applied, as previously shown.21
The phantom position in the grid was noted by one radiologistnot involved in further CT data analysis, and phantoms werescanned according to the imaging protocol described below.
After scanning of the “nonenhanced” phantoms, iodine con-taining CM (iopromide, Ultravist 300, 300 mg/mL, Bayer ScheringPharma, Berlin, Germany) at a concentration of 1 mg/mL was addedto all 16 test tubes, which were homogenized and scanned againusing the same grid position and scan protocol.
DECT Data AcquisitionAll CT scans were performed using a dual-source 128-slice CT
system (SOMATOM Definition Flash, Siemens Healthcare, Forch-heim, Germany) equipped with a tin filter for improved separation ofthe 2 energy spectra.18 First, single-energy images were acquired usinga tube voltage of 120 kV and a tube current-time product of 210 mAsper rotation (effective tube current-time product, 410 mAs; CT doseindex [CTDIvol], 2.01 mGy). Further scanning parameters were: de-tector collimation of 64 # 0.6 mm2, slice acquisition of 128 # 0.6 mm2
using a flying focus along the z-axis with 2 different focal spots, gantryrotation time of 500 milliseconds, and pitch 0.6. Then, dual-energyimages were acquired using a tube voltage pair of 140 kV and 80 kVand a tube current-time product pair of 192 mAs per rotation (effective,384 mAs) and 497 mAs per rotation (effective, 994 mAs), respectively,while keeping all other parameters unchanged as for the SECT dataacquisition. CTDIvol for this setting was 2.88 mGy.
All DECT images were reconstructed with a slice thickness of1.5 mm and an increment of 1 mm, using a dedicated dual-energykernel (D30f). SECT images were reconstructed with the same slicethickness and increment, using a standard medium-smooth soft-tissue kernel (B30f).
DECT Image ReconstructionAll images were reconstructed by 1 radiologist who was not
involved in the CT data analysis.For each phantom, the following 5 sets of images were
reconstructed:
1. Single-energy images acquired at 120 kV (SE120),2. 80 kV images acquired during DECT (DE80),
3. 140 kV images acquired during DECT (DE140),4. Linearly blended images using a 50%:50% weighted ratio of the
80 kV and 140 kV dual-energy data (DE80/140), and5. Virtual noniron (VNI) images derived from dual-energy 3-mate-
rial decomposition, using DECT data acquired at 80 kV and 140kV (Fig. 1).
Dual-energy 3-material decomposition was used in this studyto differentiate fat, liver tissue, and iron, by using commerciallyavailable postprocessing software (“Liver virtual non-contrast[VNC],” syngo Dual Energy, Siemens AG, Forchheim, Germany).Briefly, the sum of masses of the 3 constituent materials is equiva-lent to the mass of the mixture. With this assumption it is possibleto solve an equation for 3 unknown variables with only 2 spectralmeasurements, using a mass-conservation based, 3-material decom-position DECT algorithm.22 Presettings of this algorithm are opti-mized for the decomposition of iodine but can be adjusted for anyhigh atomic number material (such as iron). To subtract iron fromthe CT data, an iron-specific algorithm was generated as follows:
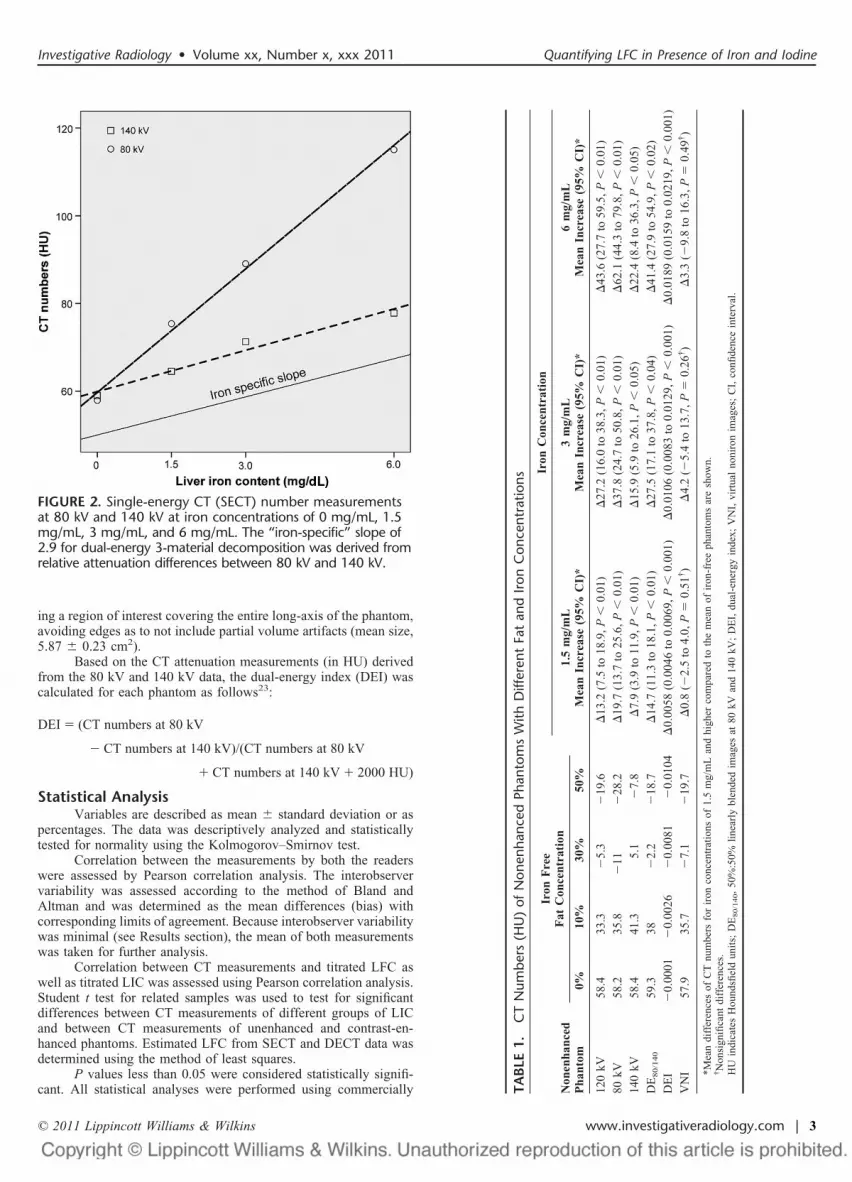
First, both the liver component as well as the fat componentused for the phantom preparation were calibrated for 80 kV and 140kV, using samples of 100% liver tissue and 100% fat; whereas, the“iron-specific” slope was derived from relative attenuation differ-ences between 80 kV and 140 kV. Accordingly, the “iron-specific”slope of 2.9 is the ratio of the slopes at 80 kV (9.4) and 140 kV (3.2)determined using samples containing liver tissue and iron at con-centrations of 1.5, 3, and 6 mg/mL (Fig. 2).
CT Data AnalysisTwo independent and blinded radiologists (with 3 and 4 years
of experience in abdominal radiology, respectively) measured CTnumbers on 3-mm thick reformations of all image sets from allphantoms. Measurements were performed in random order by plac-
FIGURE 1. Dual-energy 3-material decomposition of fat, livertissue, and high atomic number material: red overlay images(C, D) reflect content of high atomic number material (iron%C& and iodine plus iron %D&), which was subtracted from thecomputed tomography (CT) images to produce virtual noni-ron images (VNI) (A, B).
Fischer et al Investigative Radiology • Volume xx, Number x, xxx 2011
2 | www.investigativeradiology.com © 2011 Lippincott Williams & Wilkins
ing a region of interest covering the entire long-axis of the phantom,avoiding edges as to not include partial volume artifacts (mean size,5.87 ' 0.23 cm2).
Based on the CT attenuation measurements (in HU) derivedfrom the 80 kV and 140 kV data, the dual-energy index (DEI) wascalculated for each phantom as follows23:
DEI ! (CT numbers at 80 kV
" CT numbers at 140 kV)/(CT numbers at 80 kV
# CT numbers at 140 kV # 2000 HU)
Statistical AnalysisVariables are described as mean ' standard deviation or as
percentages. The data was descriptively analyzed and statisticallytested for normality using the Kolmogorov–Smirnov test.
Correlation between the measurements by both the readerswere assessed by Pearson correlation analysis. The interobservervariability was assessed according to the method of Bland andAltman and was determined as the mean differences (bias) withcorresponding limits of agreement. Because interobserver variabilitywas minimal (see Results section), the mean of both measurementswas taken for further analysis.
Correlation between CT measurements and titrated LFC aswell as titrated LIC was assessed using Pearson correlation analysis.Student t test for related samples was used to test for significantdifferences between CT measurements of different groups of LICand between CT measurements of unenhanced and contrast-en-hanced phantoms. Estimated LFC from SECT and DECT data wasdetermined using the method of least squares.
P values less than 0.05 were considered statistically signifi-cant. All statistical analyses were performed using commercially TA
BLE
1.C
TN
umbe
rs(H
U)
ofN
onen
hanc
edPh
anto
ms
With
Diff
eren
tFa
tan
dIro
nC
once
ntra
tions
Non
enha
nced
Pha
ntom
Iron
Fre
eF
atC
once
ntra
tion
Iron
Con
cent
rati
on
1.5
mg/
mL
Mea
nIn
crea
se(9
5%C
I)*
3m
g/m
LM
ean
Incr
ease
(95%
CI)
*6
mg/
mL
Mea
nIn
crea
se(9
5%C
I)*
0%10
%30
%50
%
120
kV58
.433
.3(
5.3
(19
.6)
13.2
(7.5
to18
.9,P
"0.
01)
)27
.2(1
6.0
to38
.3,P
"0.
01)
)43
.6(2
7.7
to59
.5,P
"0.
01)
80kV
58.2
35.8
(11
(28
.2)
19.7
(13.
7to
25.6
,P"
0.01
))
37.8
(24.
7to
50.8
,P"
0.01
))
62.1
(44.
3to
79.8
,P"
0.01
)14
0kV
58.4
41.3
5.1
(7.
8)
7.9
(3.9
to11
.9,P
"0.
01)
)15
.9(5
.9to
26.1
,P"
0.05
))
22.4
(8.4
to36
.3,P
"0.
05)
DE
80/1
40
59.3
38(
2.2
(18
.7)
14.7
(11.
3to
18.1
,P"
0.01
))
27.5
(17.
1to
37.8
,P"
0.04
))
41.4
(27.
9to
54.9
,P"
0.02
)D
EI
(0.
0001
(0.
0026
(0.
0081
(0.
0104
)0.
0058
(0.0
046
to0.
0069
,P"
0.00
1))
0.01
06(0
.008
3to
0.01
29,P
"0.
001)
)0.
0189
(0.0
159
to0.
0219
,P"
0.00
1)V
NI
57.9
35.7
(7.
1(
19.7
)0.
8((
2.5
to4.
0,P
*0.
51†)
)4.
2((
5.4
to13
.7,P
*0.
26†)
)3.
3((
9.8
to16
.3,P
*0.
49†)
*Mea
ndi
ffer
ence
sof
CT
num
bers
for
iron
conc
entr
atio
nsof
1.5
mg/
mL
and
high
erco
mpa
red
toth
em
ean
ofir
on-f
ree
phan
tom
sar
esh
own.
†N
onsi
gnifi
cant
diff
eren
ces.
HU
indi
cate
sH
ound
sfiel
dun
its;
DE
80/1
40,
50%
:50%
linea
rly
blen
ded
imag
esat
80kV
and
140
kV;
DE
I,du
al-e
nerg
yin
dex;
VN
I,vi
rtua
lno
niro
nim
ages
;C
I,co
nfide
nce
inte
rval
.
FIGURE 2. Single-energy CT (SECT) number measurementsat 80 kV and 140 kV at iron concentrations of 0 mg/mL, 1.5mg/mL, 3 mg/mL, and 6 mg/mL. The “iron-specific” slope of2.9 for dual-energy 3-material decomposition was derived fromrelative attenuation differences between 80 kV and 140 kV.
Investigative Radiology • Volume xx, Number x, xxx 2011 Quantifying LFC in Presence of Iron and Iodine
© 2011 Lippincott Williams & Wilkins www.investigativeradiology.com | 3

available software (Statistical Package for Social Sciences, release17.0, Chicago, IL).
RESULTS
Inter-reader AgreementInter-reader agreement was excellent for all DECT and SECT
measurements of nonenhanced phantoms without and with ironsupplementation (Pearson r, 0.973–1.0 and 0.982 –1.0, respec-tively). Similar results were obtained for the contrast-enhancedphantoms (Pearson r, 0.979–0.999 and 0.965–1.0, respectively).
Mean measurement biases were low, ranging from (0.32 to0.65 HU (limits of agreement, (2.86 to 3.43 HU) for nonenhancedCT without iron, from (0.50 to 0.76 HU (limits of agreement,(2.89 to 3.84 HU) for nonenhanced CT with iron, and from (0.92
to 0.51 HU (limits of agreement, (4.68 to 3.16 HU) for contrast-enhanced CT.
Because interobserver variability and biases were minimal,the mean of both measurements was taken for further analysis.
Fat Quantification in the Absence of Iron andIodine
For iron-free, nonenhanced phantoms, with a defined LFC of0%, 10%, 30%, and 50% fat, no significant differences were ob-served between SE120, DE80, DE140, DE80/140, and VNI (all, P !0.05), with CT attenuation numbers ranging between (28.2 and59.3 HU (Table 1).
Significant linear correlation between CT attenuation andtitrated LFC was observed for all 5 image sets (Fig. 3A), withPearson correlation coefficients ranging from 0.981 to 0.999 (all, P
FIGURE 3. Comparison of CT measurements at 120 kV, 80 kV, 140 kV, and 80/140 kV with VNI measurements derived fromdual-energy CT (DECT) for unenhanced (iodine free) phantoms. For unenhanced phantoms at 0 mg/mL iron (A) SECT andDECT including VNI numbers were similar showing no significant difference in fat quantification (P ! 0.05). With increasingiron content (B–D) there was a significant underestimation of titrated liver fat content (LFC) for all measurements (all, P "0.05) except for VNI, which correctly estimated the LFC for low (B), medium (C), and high (D) iron concentration (all, P !0.25).
Fischer et al Investigative Radiology • Volume xx, Number x, xxx 2011
4 | www.investigativeradiology.com © 2011 Lippincott Williams & Wilkins

" 0.01). DEI measurements ranged from (0.0001 to (0.0104(Table 1), also showing a significant linear correlation to titratedLFC (r * 0.987, P " 0.001).
Fat Quantification in the Presence of Iron WithoutIodine
For iron-containing, nonenhanced phantoms with defined LFCof 0%, 10%, 30%, and 50% fat, significant underestimation of LFC wasseen for SE120, DE80, DE140, DE80/140, and DEI, with increasing LIC,even at a low LIC of 1.5 mg/mL (all, P " 0.015). In contrast, nosignificant differences in CT numbers (HU) were seen for VNI imagesof phantoms with low (P * 0.51), medium (P * 0.26), and high (P *0.491) LIC, as compared with iron-free phantoms (Table 1). Thisindicated that CT number measurements in VNI images from DECTallow for the quantification of titrated LFC, regardless of the LIC, byeliminating iron from the data (Figs. 3B–D).
Correlation of CT number measurements after iron supple-mentation remained linear for all 4 LIC reflected by a parallel shiftof CT values within the coordinate system (Fig. 3). Pearson corre-lation coefficients for SE120, DE80, DE140, DE80/140, DEI, and VNIwere similarly high, ranging from 0.954 to 1.0 (all, P " 0.05).
Fat Quantification in the Presence of Iron andIodine
When adding 1.0 mg/mL iodine to iron-free phantoms with adefined LFC of 0%, 10%, 30%, and 50% fat, a significant underes-timation of LFC was seen for SE120, DE80; DE140, DE80/140, andDEI (all, P " 0.05). In contrast, CT measurements in VNI imagesaccurately estimated titrated LFC, with CT numbers being similar tounenhanced VNI measurements (P * 0.071) (Table 2).
Pearson correlation coefficients ranged from 0.992 to 0.999(P " 0.01) for all CT measurements when comparing unenhancedwith contrast-enhanced phantoms (Fig. 4A).
Comparable to unenhanced phantoms, there was a significantunderestimation of LFC when adding iron to the contrast-enhancedphantoms even at a low LIC of 1.5 mg/mL (all, P " 0.015). Again,no significant differences were seen for measurements in VNIimages in contrast-enhanced phantoms with low (P * 0.27), me-dium (P * 0.33), and high (P * 0.20) LIC, as compared withiron-free phantoms (Table 2). This indicates that attenuation mea-surements in VNI images from DECT allow for the accurate quan-tification of titrated LFC by eliminating iron and iodine from thedata (Figs. 4B–D).
Correlation between SE120, DE80, DE140, DE80/140, and DEImeasurements with defined LFC was linear and significant for all 4LIC (Pearson r, 0.971–0.992 and 0.972–0.991, respectively; all,P " 0.03). Linear correlation was also shown for VNI measure-ments at zero to medium LIC (Pearson r, 0.978–0.991; P " 0.02).No significant correlation was seen for a high LIC of 6 mg/mL(Pearson r * 0.959, P * 0.182).
Figure 5 summarizes the main results of this study. In anunenhanced phantom and in the absence of iron, SECT and DECTare equally suitable for the estimation of LFC. However, both ironand CM confound LFC quantification in SECT by increasing theattenuation of the liver phantoms in contrast to the attenuationlowering effect of fat. VNI derived from DECT, on the other hand,is able to accurately quantify the titrated LFC by virtually eliminat-ing iron and iodine from the DECT data set. Since linear correlationwas shown for all SECT and almost all DECT measurements,conversion of CT numbers to estimated LFC was performed asfollows:
SECT: LFC * (155.923%%/HU& # SE120 %HU& $ 51.685DECT: LFC * (162.644%%/HU& # VNI %HU& $ 52.785 TA
BLE
2.C
TN
umbe
rs(H
U)
ofC
ontr
ast-
Enha
nced
Phan
tom
sW
ithD
iffer
ent
Fat
and
Iron
Con
cent
ratio
ns
Con
tras
t-E
nhan
ced
Pha
ntom
Iron
Fre
eF
atC
once
ntra
tion
Iron
Con
cent
rati
on
1.5
mg/
mL
Mea
nIn
crea
se(9
5%C
I)*
3m
g/m
LM
ean
Incr
ease
(95%
CI)
*6
mg/
mL
Mea
nIn
crea
se(9
5%C
I)*
0%10
%30
%50
%
120
kV90
.157
.930
.916
.1)
14.3
(7.8
to20
.6,P
"0.
01)
)25
.7(1
5.4
to35
.9,P
"0.
01))
)44
.4(2
9.2
to59
.6,P
"0.
01)
80kV
99.0
76.5
40.9
18.6
)20
.2(1
4.7
to25
.7,P
"0.
001)
)35
.1(2
5.7
to44
.6,P
"0.
001)
)59
.9(5
0.5
to69
.2,P
"0.
001)
140
kV74
.857
.327
.08.
0)
6.7
(2.4
to11
.0,P
"0.
05)
)12
.0(4
.4to
19.5
,P"
0.05
))
20.2
((13
.5to
26.9
,P"
0.01
)D
E80/1
40
88.0
62.9
34.2
13.1
)13
.7(5
.7to
21.8
,P"
0.01
))
23.2
(13.
6to
32.8
,P"
0.01
))
42.3
(34.
3to
50.2
,P"
0.00
1)D
EI
(0.
0052
(0.
0090
(0.
0067
(0.
0111
)0.
0062
(0.0
052
to0.
0073
,P"
0.00
1))
0.01
06(0
.009
9to
0.01
13,P
"0.
001)
)0.
0179
(0.0
155
to0.
0203
,P"
0.00
1)V
NI
59.9
37.2
(1.
7(
18.9
)2.
1((
3.0
to7.
1,P
*0.
27†)
)2.
4((
4.1
to8.
9,P
*0.
33†)
)2.
7((
2.6
to8.
0,P
*0.
20†)
*Mea
ndi
ffer
ence
sof
CT
num
bers
for
iron
conc
entr
atio
nsof
1.5
mg/
mL
and
high
erco
mpa
red
toth
em
ean
ofir
on-f
ree
phan
tom
sar
esh
own.
†N
on-s
igni
fican
tdi
ffer
ence
s.H
Uin
dica
tes
Hou
ndsfi
eld
units
;D
E80/1
40,
50%
:50%
linea
rly
blen
ded
imag
esat
80kV
and
140
kV;
DE
I,du
al-e
nerg
yin
dex;
VN
I,vi
rtua
lno
niro
nim
ages
;C
I,co
nfide
nce
inte
rval
.
Investigative Radiology • Volume xx, Number x, xxx 2011 Quantifying LFC in Presence of Iron and Iodine
© 2011 Lippincott Williams & Wilkins www.investigativeradiology.com | 5

DISCUSSIONOwing to the increasing prevalence of hepatic steatosis and its
potential to progress to end-stage liver disease, accurate quantifica-tion of fat content is of major clinical interest for the primaryevaluation of diffuse liver disease as well as for the monitoring oftreatment response.2–6
SECT is known to be a useful noninvasive method fordetecting and following patients with advanced stages of fatty liverdiseases.24 In clinical routine, SECT can be used for estimating theLFC, with a mean attenuation of healthy liver parenchyma rangingfrom 55 to 65 HU at unenhanced studies.12 The ability of SECT fordiscrimination of liver tissue and fat is well reflected in our phantomstudy showing an excellent correlation of SECT attenuation andLFC, with a significant decline of CT numbers from 58 HU to (19.6HU with increasing LFC from 0% to 50%, respectively.
Our results demonstrate that discrimination of liver tissue andfat is also feasible with DECT, showing an excellent correlationbetween CT numbers and LFC in a clinically relevant range from0% to 50%. This is consistent with the results of a recent studyshowing that DECT is comparable—however not superior—toSECT for decomposition of materials with similarly low atomicnumbers.23 Thus, DECT similarly allows, but does not appear toimprove, the accuracy for discriminating fat from soft tissue whencompared with SECT in the nonenhanced, iron-free liver.
Storage diseases with iron, glycogen, or copper lead to anincreased attenuation of the hepatic parenchyma,12 which mayconfound the quantification of LFC from SECT measurements. Ourresults show that for elevated LIC, SECT fails to estimate the LFCdue to a significant increase in CT numbers. These confoundingeffects of iron were present already at a low LIC of 1.5 mg/mL.
FIGURE 4. Comparison of CT numbers at 120 kV, 80 kV, 140 kV, and 80/140 kV with VNI measurements derived from DECTfor contrast enhanced (iodine) phantoms with varying liver iron content (LIC). For phantoms at 0 mg/mL iron (A) both SECTand DECT measurements significantly underestimated (all, P " 0.05) titrated LFC, whereas VNI measurements allowed for cor-rect LFC estimation (P * 0.071) being similar to “iron- and iodine- free” VNI and SECT measurements at 120 kV (Fig. 3). Withincreasing LIC (B–D), there was an increasing underestimation of LFC for all measurements (all, P " 0.05) except for VNI,which correctly estimated the LFC for low (B), medium (C) and high (D) LIC (all, P ! 0.2).
Fischer et al Investigative Radiology • Volume xx, Number x, xxx 2011
6 | www.investigativeradiology.com © 2011 Lippincott Williams & Wilkins

Accordingly, the coexistence of iron and fat neutralize each other’seffects on attenuation. For example, in our study, measurements fromSECT resembled physiological liver parenchyma (59 HU) at a LIC of3 mg/mL and a LFC of 10%. This underlines that absolute quantifica-tion of LFC is not feasible with SECT when iron is present.
DECT using low-energy data (DE80) and linearly-blendedlow- and high-energy data (DE80/140), as well as calculation of theDEI have previously shown promise for the identification of varioussoft-tissue types, calcified structures, and iodine-containingCM.23,25 Our study indicates that DE80, DE80/140 data as well as theDEI shows no benefit over SECT for quantifying the LFC both withand without coexisting iron. This is consistent with early DECTstudies showing that dual-energy images generated using differentratios of the 80 kV and 140 kV data are not helpful for detectingfatty liver infiltration in the presence of hemochromatosis or hemo-siderosis.14,26,27
The effect of increasing LIC on CT numbers is well reflectedby a parallel increase of HU values for all CT numbers, with DE140
representing the lower and DE80 the upper limit of measurements.
DEI being an equation including CT numbers at both tube voltagesshows the same limitations as DE80/140, with no added value forLFC quantification.
DECT using an iron-specific 3-material decomposition algo-rithm, however, is able to eliminate the confounding iron from thedata, allowing for the quantification of titrated LFC, regardless ofthe LIC. The feasibility of dual-energy 3-material decompositionwas also shown for other high atomic number materials (such asiodine and bone) and thus was used to create virtual noncontrastimages.28 Iron, being a high atomic number material, shows anenergy-dependent change in CT attenuation, which is inversely andlinearly related to the LIC.14 An iron-specific dual-energy 3-tissuedecomposition algorithm, allowing for the subtraction of iron has, tothe best of our knowledge, not been proposed before. For the recon-struction of VNI images, we performed an x-ray spectral analysis at 80kV and 140 kV with increasing amounts of iron for optimizing thealgorithm to the characteristic absorption profiles of liver tissue, fat, andiron. Using this algorithm, our results show a high accuracy for ex vivoestimation of LFC even in the presence of iron.
FIGURE 5. LFC quantification in the presence of 0, 1.5, 3, and 6 mg/mL iron using SECT at 120 kV and VNI from DECT atunenhanced (A, B) and contrast-enhanced scans (C, D).
Investigative Radiology • Volume xx, Number x, xxx 2011 Quantifying LFC in Presence of Iron and Iodine
© 2011 Lippincott Williams & Wilkins www.investigativeradiology.com | 7

Our results also show that in the presence of iron and iodine,VNI images from DECT allow for the accurate quantification oftitrated LFC by eliminating both iron and iodine from the data. Thisis most probably due to similar absorption profiles and k-edges ofiron and iodine,29 allowing the “iron-specific” algorithm to alsoremove iodine sufficiently. It must be noted, however, that forachieving a complete iodine subtraction from the data, the dual-energy algorithm would be needed to be adjusted to an iodine-specific slope, which would lower the accuracy of iron subtraction.
LimitationsFirst, we must acknowledge the inherent limitations of an ex
vivo study. Thus, our results might not be transferred with the sameaccuracy to an in vivo setting or to other scanners.30 Nevertheless,we used veal liver, organic fat, and an iron (Fe3$)-compound tomimic the in vivo components as close as possible.
Second, the calibration of the iron-specific dual-energy algo-rithm proposed in this study was performed with only 3 differentiron concentrations and on the same phantoms used for the valida-tion of the model, which might limit the power of our results.
Furthermore, we found strong and highly significant linearcorrelation between estimated LFC by CT numbers and actual LFC.Nevertheless, there are some discrepancies regarding estimation oflow LFC at the presence of high iron and iodine content (6 mg/mLiron: estimated, 5.5%; actual, 10%). This may be caused by thequantification model for LFC (LFC * (162.644%%/HU& # VNI%HU& $ 52.785) being based on the measurements of only 4phantoms (containing 0%, 10%, 30%, and 50% LFC) and whichmight be further optimized by measurements of phantoms withlower LFC intervals.
Moreover, it is possible to measure the LIC from DECToverlay-images, which are generated next to the VNI images by thepostprocessing software (Fig. 1). However, this must be the subjectof further prospective studies including more than only 3 ironconcentrations and evaluating the feasibility of DECT for quantifi-cation of LIC.
Finally, we did not analyze the use of a tube voltage pair of100/140 kV, which is known to provide a better image quality forabdominal scans as compared with 80/140 kV, especially in obesepatients who frequently suffer from steatosis hepatis.
CONCLUSIONSOur ex vivo study indicates that DECT with 3-material
decomposition allows for the accurate quantification of LFC even inthe presence of iron and iodine. VNI images reconstructed fromDECT data simulate nonenhanced SECT by eliminating iron andiodine from the images. No added value was seen for DECT ascompared with SECT for LFC quantification in the absence of ironand iodine. Future studies should address the ability of DECT for fatquantification in other causes of elevated density of the liver paren-chyma, such as copper in Wilson disease, gold, thallium, arsenic,glycogen, and cirrhosis.
REFERENCES1. Farrell GC, Larter CZ. Nonalcoholic fatty liver disease: from steatosis to
cirrhosis. Hepatology. 2006;43:S99–S112.2. Browning JD, Szczepaniak LS, Dobbins R, et al. Prevalence of hepatic
steatosis in an urban population in the United States: impact of ethnicity.Hepatology. 2004;40:1387–1395.
3. Clark JM, Brancati FL, Diehl AM. Nonalcoholic fatty liver disease. Gastro-enterology. 2002;122:1649–1657.
4. Angulo P. Nonalcoholic fatty liver disease. N Engl J Med. 2002;346:1221–1231.
5. McCormack L, Petrowsky H, Jochum W, et al. Hepatic steatosis is a risk
factor for postoperative complications after major hepatectomy—a matchedcase-control study. Ann Surg. 2007;245:923–930.
6. Nomura F, Ohnishi K, Ochiai T, et al. Obesity-related nonalcoholic fattyliver—CT features and follow-up-studies after low-calorie diet. Radiology.1987;162:845–847.
7. El-Badry AM, Breitenstein S, Jochum W, et al. Assessment of hepaticsteatosis by expert pathologists: the end of a gold standard. Ann Surg.2009;250:691–697.
8. McGill DB, Rakela J, Zinsmeister AR, et al. A 21-year experience with majorhemorrhage after percutaneous liver biopsy. Gastroenterology. 1990;99:1396–1400.
9. Fischer MA, Nanz D, Reiner CS, et al. Diagnostic performance and accuracyof 3-D spoiled gradient-dual-echo MRI with water- and fat-signal separationin liver-fat quantification: comparison to liver biopsy. Invest Radiol. 2010;45:465–470.
10. Hussain HK, Chenevert TL, Londy FJ, et al. Hepatic fat fraction: MR imagingfor quantitative measurement and display—early experience. Radiology.2005;237:1048–1055.
11. Sharma P, Martin DR, Pineda N, et al. Quantitative analysis of T2-correctionin single-voxel magnetic resonance spectroscopy of hepatic lipid fraction. JMagn Reson Imaging. 2009;29:629–635.
12. Boll DT, Merkle EM. Diffuse liver disease: strategies for hepatic CT and MRimaging. Radiographics. 2009;29:1591–1614.
13. Hamer OW, Aguirre DA, Casola G, et al. Fatty liver: imaging patterns andpitfalls. Radiographics. 2006;26:1637–1653.
14. Raptopoulos V, Karellas A, Bernstein J, et al. Value of dual-energy CT indifferentiating focal fatty infiltration of the liver from low-density masses.Am J Roentgenol. 1991;157:721–725.
15. Kohgo Y, Ohtake T, Ikuta K, et al. Dysregulation of systemic ironmetabolism in alcoholic liver diseases. J Gastroenterol Hepatol. 2008;23(suppl 1):S78 –S81.
16. Graser A, Becker CR, Staehler M, et al. Single-phase dual-energy CT allowsfor characterization of renal masses as benign or malignant. Invest Radiol.2010;45:399–405.
17. Goldberg HI, Cann CE, Moss AA, et al. Noninvasive quantitation of liver ironin dogs with hemochromatosis using dual-energy CT scanning. Invest Radiol.1982;17:375–380.
18. Stolzmann P, Leschka S, Scheffel H, et al. Characterization of urinary stoneswith dual-energy CT: improved differentiation using a tin filter. Invest Radiol.2010;45:1–6.
19. Thomas C, Krauss B, Ketelsen D, et al. Differentiation of urinary calculi withdual energy CT: effect of spectral shaping by high energy tin filtration. InvestRadiol. 2010;45:393–398.
20. Tavill AS. Diagnosis and management of hemochromatosis. Hepatology.2001;33:1321–1328.
21. Olivieri NF, Saxon BR, Nisbet-Brown E, et al. Quantitative assessment of tissueiron in patients (pts) with sickle cell disease. Blood. 1997;90(Suppl. 1):1976.
22. Liu X, Yu L, Primak AN, et al. Quantitative imaging of element compositionand mass fraction using dual-energy CT: three-material decomposition. MedPhys. 2009;36:1602–1609.
23. Zachrisson H, Engstrom E, Engvall J, et al. Soft tissue discrimination ex vivoby dual energy computed tomography. Eur J Radiol. 2010;75:e124–e128.
24. Bydder GM, Chapman RW, Harry D, et al. Computed-tomography attenua-tion values in fatty liver. J Comput Tomogr. 1981;5:33–35.
25. Robinson E, Babb J, Chandarana H, et al. Dual source dual energy MDCT:comparison of 80 kVp and weighted average 120 kVp data for conspicuity ofhypo-vascular liver metastases. Invest Radiol. 2010;45:413–418.
26. Mendler MH, Bouillet P, Le Sidaner A, et al. Dual-energy CT in the diagnosisand quantification of fatty liver: limited clinical value in comparison toultrasound scan and single-energy CT, with special reference to iron overload.J Hepatol. 1998;28:785–794.
27. Oelckers S, Graeff W. In situ measurement of iron overload in liver tissue bydual-energy methods. Phys Med Biol. 1996;41:1149–1165.
28. Scheffel H, Stolzmann P, Frauenfelder T, et al. Dual-energy contrast-en-hanced computed tomography for the detection of urinary stone disease.Invest Radiol. 2007;42:823–829.
29. Johnson TR, Krauss B, Sedlmair M, et al. Material differentiation by dualenergy CT: initial experience. Eur Radiol. 2007;17:1510–1517.
30. Levi C, Gray JE, Mccullough EC, et al. The unreliability of CT-numbers asabsolute values. Am J Roentgenol. 1982;139:443–447.
Fischer et al Investigative Radiology • Volume xx, Number x, xxx 2011
8 | www.investigativeradiology.com © 2011 Lippincott Williams & Wilkins