Rapid Method for Determination of Iodine Numbers of ...
59
Western Michigan University Western Michigan University ScholarWorks at WMU ScholarWorks at WMU Master's Theses Graduate College 12-1996 Rapid Method for Determination of Iodine Numbers of Vegetable Rapid Method for Determination of Iodine Numbers of Vegetable Oils Oils Ondrej Hendl Follow this and additional works at: https://scholarworks.wmich.edu/masters_theses Part of the Chemistry Commons Recommended Citation Recommended Citation Hendl, Ondrej, "Rapid Method for Determination of Iodine Numbers of Vegetable Oils" (1996). Master's Theses. 4354. https://scholarworks.wmich.edu/masters_theses/4354 This Masters Thesis-Open Access is brought to you for free and open access by the Graduate College at ScholarWorks at WMU. It has been accepted for inclusion in Master's Theses by an authorized administrator of ScholarWorks at WMU. For more information, please contact [email protected].
-
Upload
khangminh22 -
Category
Documents
-
view
5 -
download
0
Transcript of Rapid Method for Determination of Iodine Numbers of ...
Western Michigan University Western Michigan University
ScholarWorks at WMU ScholarWorks at WMU
Master's Theses Graduate College
12-1996
Rapid Method for Determination of Iodine Numbers of Vegetable Rapid Method for Determination of Iodine Numbers of Vegetable
Oils Oils
Ondrej Hendl
Follow this and additional works at: https://scholarworks.wmich.edu/masters_theses
Part of the Chemistry Commons
Recommended Citation Recommended Citation Hendl, Ondrej, "Rapid Method for Determination of Iodine Numbers of Vegetable Oils" (1996). Master's Theses. 4354. https://scholarworks.wmich.edu/masters_theses/4354
This Masters Thesis-Open Access is brought to you for free and open access by the Graduate College at ScholarWorks at WMU. It has been accepted for inclusion in Master's Theses by an authorized administrator of ScholarWorks at WMU. For more information, please contact [email protected].

RAPID MEfHOD FOR DEfERMINATION OF IODINE NUMBERS OF VEGEf ABLE OILS
by
Ondrej Hendl
A Thesis Submitted to the
Faculty of The Graduate College in partial fulfillment of t1
requirements for the Degree of Master of Arts Department of Chemistry
Western Michigan University Kalamazoo, Michigan
December 1996

Copyright by Ondrej Hendl
1996
ACKNOWLEDGMENTS
The author wishes to express his gratitude to the Chemistry Department of
Western Michigan University for pro\·iding the instrumentation, chemical supplies and
financial assistance to accomplish this research. The assistance and moral support given
by Dr. Michael E. McCarville is gratefully acknowledged. The author would also like
to thank all the faculty, graduate students and other staff members of the Chemistry
Department for their assistance and encouragement. Thanks are given to Dr. James A.
Howell for his support, patience and time throughout the years of my research.
I thank my mother and finally my wife, Simona, for her continuing supply of
encouragement and love.
Ondrej Hendl
11
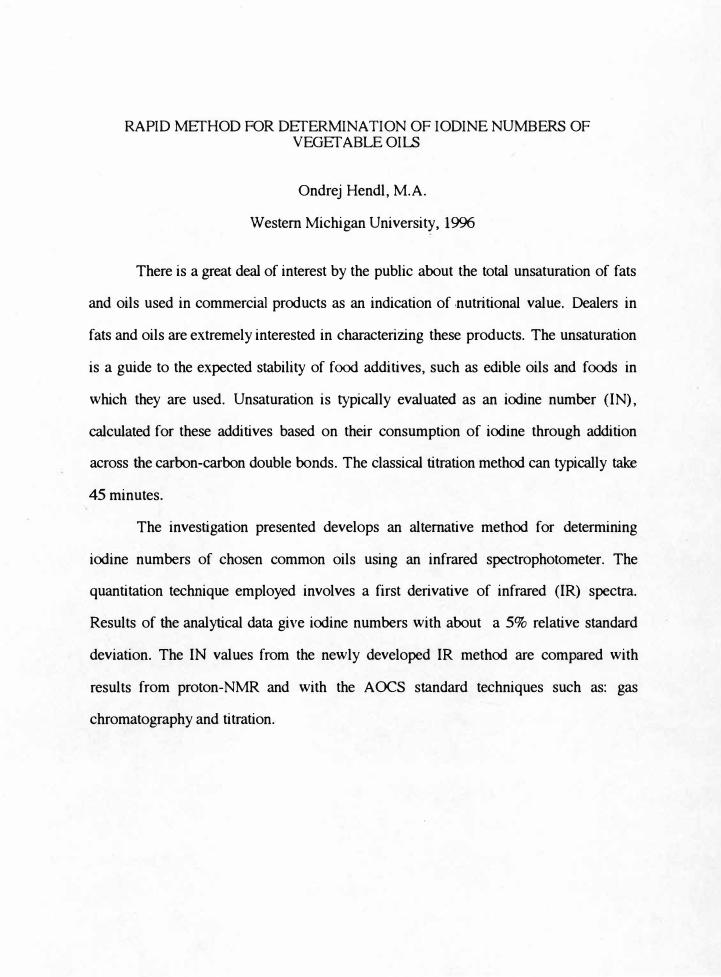
RAPID METHOD FOR DETERMINATION OF IODINE NUMBERS OF VEGETABLE OILS
Ondrej Hendl, M.A.
Western Michigan University, 1996
There is a great deal of interest by the public about the total unsaturation of fats
and oils used in commercial products as an indication of nutritional value. Dealers in
fats and oils are extremely interested in characterizing these products. The unsaturation
is a guide to the expected stability of food additives, such as edible oils and foods in
which they are used. Unsaturation is typically evaluated as an iodine number (IN),
calculated for these additives based on their consumption of iodine through addition
across the carbon-carbon double bonds. The classical titration method can typically take
45 minutes.
The investigation presented develops an alternative method for determining
iodine numbers of chosen common oils using an infrared spectrophotometer. The
quantitation technique employed involves a first derivative of infrared (IR) spectra.
Results of the analytical data give iodine numbers with about a 5% relative standard
deviation. The IN values from the newly developed IR method are compared with
results from proton-NMR and with the AOCS standard techniques such as: gas
chromatography and titration.

TABLE OF CONTENTS
ACKNOWLEDGMENTS ...................................................................... ii
LIST OFT ABLES ............................................................................... V
LIST OF FIGURES ........................................ -.................................... vi
INTRODUCTION ............................................................................... 1
Characterization of Edible Oils ........................................................ 1
The Technology of Edible Fats and Oils ............................................. 4
Adulteration .............................................................................. 4
Nutrition and Health Aspects .......................................................... 5
Chemical Properties .................................................................... 7
Proposed Methodology .............................................. _. ................. 7
MATERIALS AND MEfHODS .............................................................. 10
Materials ........................................................ : ....................... 10
Classical Titration Method ............................................................ 11
Reagents ....................................................................... 12
Procedure ...................................................................... 13
Saponification .......................................................................... 13
Reagents ....................................................................... 15
Procedure ...................................................................... 15
Gas Liquid Chromatography (GC) .................................................. 16
Apparatus and Parameters ................................................... 17
Reagents ....................................................................... 17
Procedure ...................................................................... 17
Proton Nuclear Magnetic Resonance (1 H-NMR) .................................. 18
lll

Table of Contents-continued
Procedure ...................................................................... 20
Infrared Spectroscopy and Its Derivative Spectra .................................. 20
Derivative Spectroscopy ..................................................... 22
Instrument and Parameters ................................................... 25
Reagents ....................................................................... 25
Procedure ...................................................................... 25
Calculation of Iodine Numbers From Collected Data ..................... 26
Chromophore Study .......................................................... 28
Derived Equation for Iodine Number Calculation ......................... 29
RESULTS AND DISCUSSION ............................................................. .34
CONCLUSION ................................................................................. 39
APPENDIX
A. Gas Chromatography, Proton - NMR and Infrared Spectra of SelectedVegetable Oils .......................................................................... 40
REFERENCES ................................ : ................................................ 49
IV

LIST OF T ABLES
1. The Nomenclature of Common Fatty Acids in Vegetable Oils ......................... 3
2. Vegetable Oils Used ........................................................................ 10
3. Standard Fatty Acids ................................... · .................................... 11
4. Iodine Numbers From Classical Titration ............................................... 14
5. Saponification Numbers of Vegetable Oils .............................................. 16
6. Determination of Iodine Number Values by Gas Chromatography ................... 18
7. Determination of Iodine Number Values From Proton - NMR. ....................... 21
8. Calculated Absorptivities for Model Compounds From DerivativeSpectra ....................................................................................... 27
9. The Iodine Values Calculated From IR Technique ..................................... .33
10. Comparison of Iodine Number Results From Different Methods ................... .35
11. Comparison of Calculated Iodine Numbers INea1e
and IN\a1
ObtainedFrom IR Method Base in Incorporated Value of Both SN
!i, and SN
exp ............. .37
12. Determined Iodine and Saponification Numbers by Classicaland Newly Developed Method ........................................................... .38
V
LIST OF FIGURES
1. Cis and Trans Isomers of Oleic Acid .................................................... 6
2. Idealized Representation of 1st/ 4th Derivative on Single Peak ....................... 23
3. Unresolved Absorption Bands in Fundamental Spectra ................................ 24
4. First Derivative of Absorption Bands ..................................................... 25
5. Spectrophotometer Cell ..................................................................... 29
6. l.ecithin Molecule ............................................................................. 36
Vl

INTRODUCTION
Characterization of Edible Oils
Lipids are one of the large groups of organic comJX>unds which are of great
imJX>rtance in the food we eat because they are readily digested and utilized by the
body. They are widely distributed and almost every natural food has considerable
quantities of them.
Fats are a subset of the lipid family. They are imJX)rtant in food and health
science. Fats are the main comJX>nent of fat cells in animals and plants, and act as an
imJX>rtant storage medium of food reserves in the organism. These fats can be
extracted from their native organisms to form the basis of many products which are
used for food preparation. Fats and oils provide a concentrated source of food energy.
Chemically, fats and oils are esters of fatty acids derived from a single,
trif unctional alcohol, glycerol. Biological lipids are a chemically diverse group of
c .. ,mnds, the common and defining feature of which is their insolubility in water.
The biological functions of the lipids are equally diverse. Fats and oils are the principal
stored forms of energy in many organisms. Other lipids, although present in relatively
small quantities, play crucial roles as enzyme cofactors, electron carriers, light
absorbing pigments and etc.
The simplest lipids constructed from fatty acids are the triglycerides or
commonly called fats or neutral fats. These comJX>unds are comJX>sed of three fatty
acids each in an ester linkage with a single glycerol.
1

Fatty acids are carboxylic acids with hydrocarbon chains of 4 to 36 carbons. In
some fatty acids, this chain is fully saturated (contains no double bonds) and
unbranched. Others may contain one or more double bonds. As shown in Table 1, the
nomenclature of common fatty acids in vegetable oils specifies the chain length and
number of double bonds. The 16-carbon saturated palmitic acid is abbreviated 16:0,
and the 18-carbon oleic acid, with one double bond, is 18: 1. The positions of any
double bonds are specified by superscript numbers following fl (delta). For example, a
20-carbon fatty acid with one double bond between C-9 and C-10, and another between
C-12 and C-13, is designated 20:2 (fl9·12 ). The fl sign is used by chemists and
describes the position of the double bond counted from carboxyl carbon. For example
fl9
,
On the other hand, we may also see a number following omega to designate the
position of a double bond in an unsaturated acid. This designation of double bonds in
triglyceride molecules was established by nutritionists (1). For example oo-3,
2

Table 1
The Nomenclature of Common Fatty Acids
Carbon Skeleton Saturated
4:0
6:0
8:0
10:0
12:0
14:0
16:0
18:0
20:0
22:0
24:0
· Unsaturated
16: l(A9)
18: l(A9)
18: l(A9)
18:2(A9·12
)
18:3(A 9,12,15
)
20:4(A 5 ,s ,11.14)
Structure
C3H
7COOH
C5H
11COOH
C7H
15COOH
C9H
19COOH
C11
H23
COOH
C13
H27
COOH
C15
H31
COOH
C17
H35
COOH
C19
H39
COOH
C21
H43
COOH
C23
H45
COOH
1)
2)
2)
3)
4)
5)
in Vegetable Oils (2)
Systematic Name
n-Butanoic
n-Hexanoic
n-Octanoic
n-Decanoic
n-Dodecanoic
n-Tetradecanoic
n-Hexadecanoic
n-Octadecanoic
n-Eicosenoic
n-Docosanoic
n-Tetracosanoic
cis-9-hexadecenoic
cis-9-octadecenoic
trans-9-octadecenoic cis-cis-9-12-octadecandienoic cis-cis-cis-9-12-15-octadecatrienoic cis-cis-cis-cis-5-8-11-14-eicosatetraenoic
l) CH
3 (CH
2 )5
CH=CH(CH2
)7
COOH
Common Name
Butyric
Caproic
Caprylic
Capric
Laurie
Myristic
Palmitic
Stearic
Arachidic
Behenic
Lignoceric
Palmitoleic
Oleic
Elaidic
Linoleic
Linolenic
Arachidonic
2> CH3
(CH2
)7
CH=CH(CH2
)7
COOH3> CH
3 (CH
2 )4 CH=CHCH
2 CH=CH(CH
2 )7
COOH4> CH
3 CH
2 CH=CHCH
2 CH=CHCH
2 CH=CH(CH
2 )7 COOH
5> CH3
(CH2
) CH=(CHCH2
CH)3
=CH(CH2
)3
COOH
3
MeltinijPoint ( C)
-7.9 88
-3.4 116
16.7 144
31.6 172
44.2 200
54.4 228
62.9 256
69.6 284
75.3 312
79.9 340
84.1 368
0.5 254
16.3 282
43.7 282
-5.0 280 �
-11.0 278
-49.5 304

The most commonly occurring fatty acids have even numbers of carbon atoms in an
unbranched chain of 12 to 24 carbons. The double bonds of polyunsaturated fatty
acids are almost never conjugated, but separated by a methylene group.
The position of double bonds is also regular and in most monounsaturated fatty
acids the double bonds are between C-9 and C-10 (�9), and the other double bonds of
polyunsaturated fatty acids are generally �12 and � 15, · see Table 1.
The Technology of Edible Fats and Oils ( 1)
Three principal methods are used for the extraction of edible fats and oils from
the animal or vegetable tissues in which they occur. These are rendering, pressing, and
solvent extraction. Rendering is a process by which fat is removed from a tissue by
heat. The process can be carried out either in the presence of water - "wet rendering" -
or in its absence - "dry rendering". Pressing is the application of high pressures to the
tissue to squeeze out the fat. In same cases, such as the pressing of olives, virgin oil is
the first pressing of the fruit and is particularly bland in flavor. The fruit is then
subjected to subsequent pressings to give other grades of oil. Solvent extraction uses
solvents to extract oils from tissues. This method is practical in the removal of oil from
tissues which have a relatively low percentage of oil. Processed and purified oils
contain small amounts of compounds other than simple fats. The other compounds
present are complex lipid-lecithins, cephalius, other phosphatides and hydrocarbons.
Adulteration
A great body of research has been built up around these foods because of
efforts to differentiate one from the other so that an inexpensive oil is not sold as a more
costly one. Each year there are incidents of olive oil that is labeled and sold as 100%
4

pure oil, but in fact, contains less-expensive vegetable oils. However, because of
increased scrutiny by regulatory agencies both in the United States and in Europe, the
number of incidents seem to be declining. This surveillance has increased both
overseas and in the United States in part due to the Spanish Toxic Oil Syndrome
incident where contaminated oil sickened and killed a number of people in Spain during
1981 (3).
Olive oil, due to its unique character, stability, and health benefits, has always
been the subject of fraud or mixing. However, some of the analytical tests introduced
during the past three to four years have minimized what can be done to adulterate extra
virgin oil. Grades of olive oil from highest prized to the lowest are as follows: extra
virgin olive oil, olive oil and olive pomace oil. One test determines the presence of
trans fatty acid content (3). A second test measures steroidal hydrocarbons which may
be degraded when olive oil is processed or other oils are refined (3).
In 1995 as a result of these analytical tests the U.S. Food and Drug
Administration (FDA) was able to test 73 olive oils produced or distributed by
companies based in the United States. Only one was found to be adulterated (3).
Nutrition and Health Aspects
In recent times, fat consumption has been carefully studied as a parameter
relating to health issues. The dietary consumption of various fats and oils has been
related to a variety of health statistics. Specifically, several studies have correlated
various forms of fat consumption to heart related diseases. From a health standpoint,
unsaturation has been identified as a desirable quality in fats. In recent years
margarines, for example, have been produced with higher levels of dienoic and trienoic
acids, and correspondingly lower levels of monoenoic and saturated acids. These oils,
higher in polyunsaturates are manufactured to the desired semi-solid consistency by use
5

of oil solidifying agents as opposed to hydrogenation. Medical opinion is divided on
the desirability of types of unsaturation. For example, it has been suggested that
polyunsaturated fats are prone to production of a greater number of free radicals during
metabolic processes. These free radicals are thought to then produce subsequent
deleterious effects in the body ( 4 ) .
A high intake of fat shows a positive correlation with blood cholesterol level. It
has long been recognized that a high blood cholesterol level directly affects
arteriosclerosis. Also there are conflicting reports that have indicated an increased
consumption of trans fatty acids may lead to the development of coronary heart disease.
General structure of cis and trans fatty acids is seen in Figure 1.
cis trans
CH/CH2
)7 H '\._ /
C=C H/ '\. (Clli)
7COOH
Figure 1. Cis and Trans Isomers of Oleic Acid.
Since trans- unsaturation in common fatty acid chains is typically a product of
hydrogenation catalyst and not of natural synthesis, it has been argued that the human
body is not accustomed to metabolizing these materials. Consequently, medical
opinion also recommends reduction of consumption of trans - unsaturated materials.
Interestingly, both saturated fats and trans - unsaturated fats have higher melting points
than the equal chain length cis - unsaturated materials, due to packing inefficiencies in
the cis - chain structures. While this higher melting point is at times a desirable
commercial feature, its contribution to health is debatable.
6

Due to the above considerations it is desirable to qualify oils and fats on the
basis of two parameters: the ratio of unsaturation to saturation in the acid chains and the
ratio of trans I cis isomers in unsaturated materials. Fats also act as solvents for the fat
- soluble vitamins that are naturally intrcxiuced into the diet in the fatty portion of the
food. The fats and other lipids are, therefore, important in the diet for a number of
reasons.
Chemical Properties
A number of chemical tests have evolved during years of studying of oils which
are based on the partial determination of the chemical composition of the oil. These
tests serve both to identify the oil and to detect the presence of adulteration as well as
providing a measure of rancidity. All oils show a range of values and therefore
sometimes more than one test is necessary. A few of the most commonly used tests are
as follows: the Iodine Number is a measure of the true amount of unsaturation. The
Saponification Number is related to the amount of potassium hydroxide required to
saponify the fat and is inversely related to the average molecular weight of the fat or oil.
The Reichert Meissl Number is a measure of the amount of water-soluble volatile fatty
acids and the Polenske Number (5) measures the amount of volatile insoluble fatty
acids. These tests can differentiate fats and oils on the basis of the chemical
composition of the various triglycerides present in the mixture.
Proposed Methcxiology
There is a great deal of interest by the public and prcxiucers of oils to disclosure
of total unsaturation in focxi additives, such as edible oils. The total unsaturation of an
oil is an indication of the nutritional value, as well as a partial guide to its expected
stability. Food technologists use the icxiine number as an expression of the level of
7

unsaturation in a sample. The carbon-carbon double bonds of the fatty acids are the
active reaction sites of the oil utilized for the determination of the iodine number. The
iodine number is traditionally obtained from a titration technique called the Wijs or
Hanus method. In these titrations excess iodine is added to a sample of an oil in
chloroform where it may add across the carbon-carbon double bonds. The absorbed
iodine is determined by back titration of the unreacted iodine with sodium thiosulfate.
The iodine solutions for each method are somewhat different. The Wijs titration adds
chlorine to increase the reactivity of the iodine solution, whereas the Hanus titration
adds bromine. The typical reaction time of the oil and the iodine solution is 1 hour.
Mercuric acetate can be added to the iodine solutions to speed the reaction time to 5-10
minutes. Total analysis time for an oil using these titration methods is at least 30
minutes. Other methods for determining iodine number of an oil are nuclear magnetic
resonance (6, 7), and Raman spectroscopy (4). The classical titration method (8, 9,
10) and gas-liquid chromatography (11, 12) remain the standard methods used by the
Association of Official Analytical Chemists (AOAC) and the American Oil Chemist's
Society (AOCS).
More recently infrared spectroscopy has been used to obtain iodine numbers
comparable to the titration methods. Lowry (13) applied the 1st and higher order (lst-
4th) derivatives in infrared spectroscopy to resolve the weak carbon-carbon double
bond band at 1651 cm·1 (shoulder or peak) from the carbonyl band at 1740 cm·1• He·
developed a method for determination of iodine number based on the comparison of a
ratio of derivative peak heights at 1740 cm·1 and 1651 cm·1 with standard oils. The
major disadvantage of this technique was the stray light contribution to the carbonyl
band. In order to minimize avoid this problem he had to prepare standards with low,
middle and high iodine numbers and also use different dilutions for measuring each
bond.
8
In our study we propose using the 1st derivative to resolve the overlapped
peaks at 1740 cm-• (carbonyl) and 1651 cm-1 (carbon - carbon double bond). However
it is proposed that the carbonyl derivative absorption be measured at the overtone of the
1740 cm-1 band at 3460 cm-•. In this case no significant contribution of stray light error
is likely. Also it is proposed that this should produce an improvement in quantitation of
the iodine number of an oil by infrared spectroscopy. The average molecular weight of
oils, needed to calculate iodine numbers from inf rared data, can be calculated from
saponification numbers.
9

MATERIALS AND MEfHODS
Materials
Fourteen common oils were purchased from Spectrum and Sigma companies
and subsequently studied. These vegetable oils with their literature iodine numbers are
shown as following in Table 2. A range of iodine numbers for some of the oils in table
are listed because oil types will vary in content of fatty acids from different locations
and seasons. All samples are edible oils, except for linseed. Linseed oil is a highly
unsaturated drying oil used in oil based paints. In Table 3 are listed fatty acids used as
standards for determination of retention times with gas chromatography.
Name Manufacture
Almond Sigma
Castor Spectrum (Ricinus)
Coconut Sigma
Com Sigma
Cottonseed Sigma
Linseed Spectrum
Olive Sigma
Table 2
Vegetable Oils Used
INlit
Name
95-102 Palm
83-88 Peanut
Manufacture
Spectrum
Sigma
9 Safflower Seed Sigma
123 Sesame Sigma
106 Soybean Sigma
190 Sunflower Sigma
81 Wheat Germ Spectrum
10
INH,
51
145
107
130
120
115-132

Name
Caproic
Caprylic
Table3
St�dard Fatty Acids
Purity [ % ] Manufacture
NIA NBC 1
�99 Ruka Chemika
Name
Arachidic
Behenic
Purity [ % ] Manufacture
� 99 Sigma
� 99 Sigma
Capric � 98 Ruka Chemika Lignoceric � 98 Sigma
Laurie 98 J. T. Baker Oleic NIA MC&B2
Myristic �99 Sigma Linoleic 99 Sigma
Prumitic 99 Sigma Linolenic 99 Sigma
Stearic 99 Lancaster
1 National Biochemical Corporation 2 Matheson - Coleman & Bell NIA= Not Available
Classical Titration Method
The iodine number is defined as the number of grams of iodine absorbed by
100 gams of fat. The double bonds present in the unsaturated fatty acids react readily
with iodine. The iodine number (IN) is therefore a measure of the extent of
unsaturation of the fatty acids present. While oleic acid contains one double bond in its
18 carbon chain, linolenic acid contains three double bonds in its 18 carbon chain.
Thus a molecule of fat containing one oleic acid can react with only one third as much
iodine as a molecule of fat containing one linolenic acid residue. The fatty acids present
in natural fats are fairly characteristic of the fat. While there will be variation in each
vegetable oil due to climate and soil factors, evaluating their iodine numbers are of great
11
value in identifying the oils. Standard methods have been developed for these
analyses.
The classical standard method for the determination of IN involves a time
intensive titration method. The method involves dissolving a weighed sample of fat
(0.1 - 0.5g) in chloroform and adding an excess of halogen such as 12
and/or Br2
•
After standing in the dark for a controlled period of time, the excess unreacted iodine is
measured by thiosulfate titration. The most recent revision of the standard method for
the determination iodine number involves using a cyclohexane/acetic acid sol vent.
Further information on latest revisions of AOCS standard methods can be found on the
world wide web ( 14).
Reagents
Potassium Triiodide Standard Solution, 0.1000 molar: K.13
(HARLECO,
concentrate).
Starch Solution, 1 % w/v: dissolve 1.0 g of soluble starch (J.T. Baker Chemical
Co., ACS grade) in 100 ml distilled water. Boil for 5 minutes and keep the clear
supernatant liquid after it is cooled to room temperature.
Scx.lium Thiosulfate Standard Solution, 0.1 molar: dissolve about 25 g of
N�S20
3 · 5 H
20 (J.T. Baker Chemical Co., ACS grade) with 1 g of NaOH (Columbus
Chemical Industries, Inc.) in 1.0 L of freshly boiled distilled water.
Standardization of Sodium Thiosulfate: dilute 25 ml mixture of 0.1000 molar
standard solution of Iodine (Kl3
) with approximately 25 ml distilled water and 5 ml of
glacial acetic acid (Fisher Scientific Company). Titrate with N�S20
3 until the solution
became light yellow. Several drops of starch solution may be added near the end point.
Titrate until the solution became colorless.
12

Potassium Iodide, 15% w/v: dissolve 45 g KI (Mallinckrodt Inc., U.S.P.,
granular) into 300 ml of boiled distilled water.
Kaufmann's Solution: 150 g NaBr anhydrous (Fisher Scientific, ACS grade)
are added to 1.0 L methanol (Fisher Scientific, ACS grade). Filter the methanol
solution into a 1.0 L amber bottle with a glass stopcock. Add 8.0 g liquid bromine
(Columbus Chemical Industries) and mix.
Procedure
Each oil was titrated in triplicate as neat samples by the Hanus method. This
method has been approved as a standard technique (8) by the AOCS. Experimentally
determined iodine numbers (INexp
) of the selected oils are listed as average values with
their relative standard deviation (RSD) and compared with iodine numbers from
literature in Table 4.
Saponification
The Saponification Number is defined as the number of milligrams of
potassium hydroxide required to saponify 1 g of oil. This method is also a time
consuming titration procedure. Potassium hydroxide reacts with a triglyceride
consuming three moles of potassium hydroxide for each mole of oil. A measured
excess of potassium hydroxide is added to a given weight of triglyceride. The mixture
is allowed to react at elevated temperature for a prescribed time. Then the unreacted
potassium hydroxide is titrated with a standard solution of hydrochloric acid. If the
13
RI COOCH
2
Ri COOCH + 3 Off -+ R 1 COO- + R2 COC} + R3 COO- +
HOCH2
I HO-CH
I R
3 COOCH
2
I HOCH2
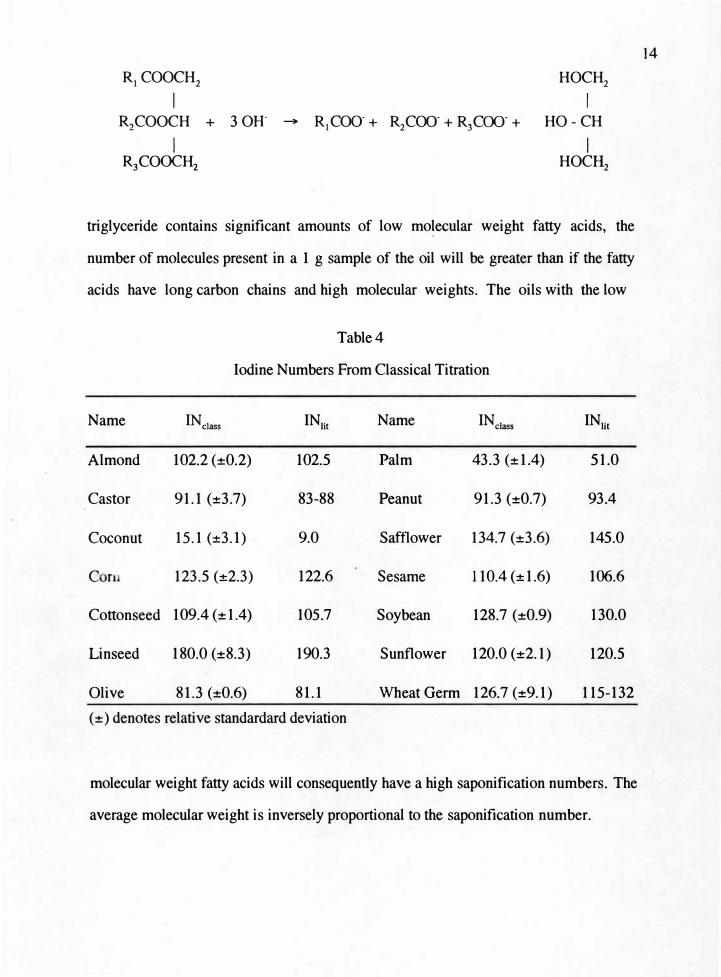
triglyceride contains significant amounts of low molecular weight fatty acids, the
number of molecules present in a 1 g sample of the oil will be greater than if the fatty
acids have long carbon chains and high molecular weights. The oils with the low
Table4
Iodine Numbers From Classical Titration
Name INclass INH, Name INclass INlit
Almond 102.2 (±0.2) 102.5 Palm 43.3 (±1.4) 51.0
Castor 91.1 (±3.7) 83-88 Peanut 91.3 (±0.7) 93.4
Coconut 15.1 (±3.1) 9.0 Safflower 134.7 (±3.6) 145.0
Cn 123.5 (±2.3) 122.6 Sesame 110.4 (±1.6) 106.6
Cottonseed 109.4 (±1.4) 105.7 Soybean 128.7 (±0.9) 130.0
Linseed 180.0 (±8.3) 190.3 Sunflower 120.0 (±2.1) 120.5
Olive 81.3 (±0.6) 81.1 Wheat Germ 126.7 (±9.1) 115-132
(±) denotes relative standardard deviation
molecular weight fatty acids will consequently have a high saponification numbers. The
average molecular weight is inversely proportional to the saponification number.
14
SN= mg KOH I g sample= 10·3 g KOH / g sample x mole / 56.1 g KOH
x 1 mole x sample / 3 mole KOH = 1.68 x 10⁵ / Mw
SN = 1.68 x 10⁵ / Mw
[l]
[2]
Average molecular weights were also determined for each vegetable oil by
proton nuclear magnetic resonance measurements and compared with the values
obtained from saponification data in Appendix A.
Reagents
Sodium Hydroxide Standard Solution, 0.5000 molar: NaOH (HARLECO,
concentrate CO2
free).
Hydrochloric Acid, 0.5 molar: HCl accurately standardized against standard
0.5000 M NaOH.
Phenolphthalein Indicator Solution, 1 % w/v in 95% ethanol.
Alcoholic Potassium Hydroxide: Prepared according the reference from AOCS (15).
Procedure
Each oil was saponified with ethanolic sodium hydroxide and titrated with
hydrochloric acid in triplicate. This method has been approved as a standard technique
by both the AOCS (15) and AOAC (16). Experimentally determined saponification
numbers of the selected oils are listed as average values with their RSD in Table 5 and
compared with literature available values.
15

Gas Liquid Chromatography (GC)
This methcxl for determining IN values is applicable to methyl esters of fatty
acids having 8 - 24 carbon atoms and to vegetable oils after their conversion to their
methyl esters. The methcxl permits quantitative separation of mixtures containing
saturated and unsaturated methyl esters. The methcxl involves two steps: (1) preparation
of the methyl esters, and (2) GC analysis. Although gas chromatography gives very
good results, it still requires a significant amount of wet chemistry since oil samples are
Table 5
Saponification Numbers of Vegetable Oils
Name SN•"P SN1i1 Name SNcxp
SNli,
Almond 189.6(±0.1) NIA Palm 199.1(±0.4) 200.0
Castor 178.8(±0.7) NIA Peanut 189.6(±0.6) 192.1
Coconut 265.6(±0.4) 268 Safflower 192.0(±0.6) 192.0
Corn 190.1(±0.3) 192.0 Sesame 187.9(±0.5_ 187.9
Cottonseed 193.0(±0.5) 194.3 Soybean 191.2(±0.8) 190.6
Linseed 191.2(±0.2) 190.3 Sunflower 186.7(±0.3) 188.7
Olive 187.5(±0.3) 189.7 Wheat Germ 189.6(±0.2) 189.7
(±) denotes relative standard deviations
not sufficiently volatile for the GC technique. The measurements are made on the
assorted reaction prcxlucts from the esterification reaction. It is necessary to determine
retention times from a collection of methyl ester standards. While this methcxl provides
useful information about the oil it is time intensive.
16

Apparatus and Parameters
All chromatographic measurements were done with a Varian 3600 Star gas
chromatograph, with flame ionization detector (FID) and a SP - 2380 (Supelco; 30 m,
0.25 mm ID, 0.20 µm film thickness) fused silica capillary column with a 90%
(biscyanopropyl) and 10% (cyano-phenyl) siloxane bonded phase. The peak areas
were measured by a Shimadzu CR601 Chromatopac electronic integrator with 0
attenuation. A 50 µL syringe (Hamilton), graduated to 0.05 µL was used.
Reagents
Boron Trifluoride reagent, w/v = 14 %: BF/methanol (Alltech).
Saturated Sodium Chloride Solution: NaCl (Fisher Scientific, A.C.S. grade).
Methanolic Sodium Hydroxide, 0.5 molar: 2 grams NaOH are dissolved in 100
ml methanol (Fisher Scientific) containing� 0.5 % H20.
Standard fatty acids: see Table 3, necessary to determine retention times.
Heptane: C6H
14 (Baxter Corporation, High Purity Grade).
Procedure
Fatty acid methyl ester preparation followed the AOCS and AOAC standard
method (11, 12). Both vegetable oils and standard acids were analyzed according same
procedure.
An example of a chromatogram of esterified coconut oil is shown in Appendix
A-1. Iodine Numbers were calculated with an equation given in the AOCS Book of
Methods as shown in Ce 1-62 (12). The equation is as follows:
17

IN=(% 16: 1 X 0.95) + (%18: 1 x 0.860) +(%18:2 xl.732) + (%18:3 X 2.616) +
+ (%20: 1 a x 0.785) + (%22: 1 x 0.723) [3]
Experimental results are reported in Table 6.
Table 6
Determination of Icxiine Number Values by Gas Chromatography
Name INGC
INu, Name INGC
INu,
Almond 96.77(±5.79) 95-102 Palm 47.87(±1.42) 51.0
Castor 93.99(± 10.91) 83-88 Peanut 98.88(±4.98) 93.4
Coconut 33.70(±9.66) 9.0 Safflower 138.70(±7.10) 145.0
Com 133.8(±5.95) 122.6 Sesame 123.46(±6.44) 106.6
Cottonseed 131.58(±11.66) 105.7 Soybean 133.48(±7.30) 130.0
Linseed 185.40(±2.93) 190.3 Sunflower 110.82(±5.92) 120.5
Olive 81.29(±3.63) 81.1 Wheat Germ 142.53(±5.75) 115-132
(±) denotes relative standard deviation
Since a splitter was not available, it was necessary to vent the injector manually
in order to approach the conditions of the standard methcxi, e.g. 3 µL injection with a
100 to 1 split ratio. This limited day to day reproducibility. A typical chromatogram
obtained under these conditions may be seen in Appendix A-2.
Proton Nuclear Magnetic Resonance (1H-NMR)
Nuclear magnetic resonance spectroscopy makes it possible to determine the
various kinds of hydrogen atoms in the triglyceride molecule. This is due to the fact
18

that hydrogen atoms in a strong magnetic field absorb radio frequency energy. The
frequency of absorption depends on where the hydrogen atoms are located in the
molecule. The 'H-NMR technique has now become a standard method for
determination of IN values of oil in oilseed in the AOCS Book of Methods (7).
The 'H-NMR has multivariate application for oil chemist. First, the 1H-NMR
can be used to determine the average molecular weight of triglyceride molecule.
Second, the iodine number for different natural oils can be determined from the number
of hydrogen atoms directly attached to double bond carbon atoms (6). The relationship
between the average number of double bonds per molecule and the iodine value is
described for a general triglyceride molecule as is shown in Appendix A-3. The four
hydrogen atoms marked I::,. in the glycerol molecule give a multiplet at 4.2 ppm, and its
integrated signal is proportional to the number of these hydrogen atoms in the sample.
The two hydrogen atoms bonded to the olefinic carbons are marked with x and the
methine proton of the glycerine moiety give a multiplet at 5.3 ppm. The integral for
these resonances is proportional to the number of protons. Thus the ratio between the
· integral at 4.2 ppm and the integral at 5.3 ppm ( corrected for the methine proton)
depends on the number of double bonds present in the triglyceride. The last integrated
area from 3.0 to 0.3 ppm represents remaining protons, designated as Hr'
on
triglyceride molecule. From the following sets of equations the final formulas for both,
the average molecular weight of triglyceride molecule and the Iodine Number is
obtained.
integration @ 4.2 ppm is: H4
_2 =4 k [4]
where k = proportionality constant for a single proton response (integration)
:. k = H4)4 [5]
integration @ 5.3 ppm is: HS.3 = k( l + 2X) [6]
19

where X = average number of >C=C< per triglyceride molecule
:. H5
_3 = (H4_/4)(1 + 2X) [7]
rearranging 2X = 4(H5)H4.2) - 1 [8]
or X = 2(H5jH4.2) - 0.5 [9]
the number of olefinic protons per triglyceride molecule is given by
V = 2X = 4(H5
_3/H4_2) - 1 [1 O]
and the average molecular weight is as follows:
MW = 173.1 + 45.1 + 13.02V + 14.03{[H, - 9(H4_/4)]/[2(H4.2/4)]} [11]
IN = (126.91)(100)V/MW [12]
.Procedure
Measurements were made on an AC - 200 (Bruker) NMR spectrometer. Each
sample was analyzed in triplicate as follows: 2-4 mg of sample was dissolved in about
1 ml CDCl3
, the tube was shaken, transfered to an NMR tube, and then placed in the
spectrometer. Integration values for the resonances at about 5.3 ppm [H5
_3], 4.2 ppm
[H4.2], and from 3.0 to 0.4 ppm [H,] were obtained. Computation of values was
carried out using equations [4] through [12]. Experimental results from Proton-NMR
method are reported in Table 7 with RSD values.
Infrared Spectroscopy and Its Derivative Spectra
Vibrational spectroscopies, including infrared and Raman, are extremely
valuable tools for elucidating the structure and reactivity of many different types of
samples. Infrared spectroscopy provides a powerful tool to investigate the molecular
structure characterized by "polar'' bonds and vibrations that change the molecular
dipole. In other words, the chemical bonds between atoms of different
20

•
electronegativity, change the net charge during atomic movement. The determination of
IN by infrared spectroscopy has been studied from several different perspectives.
Mainly, the focus of this study was aimed at two overlapped peaks e.g.
carbonyl band (1740 cm·1) and carbon - carbon double bond band at (1651 cm·'). The
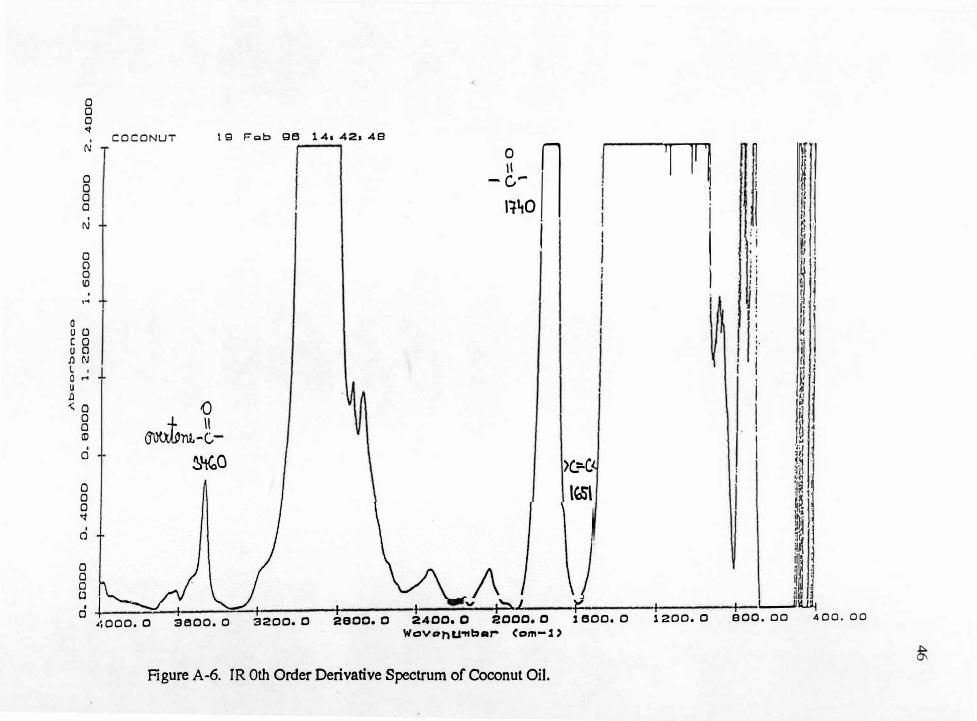
principle reason that infrared methods have had only limited success for determining
iodine numbers is due to the extreme difference in the strength of the carbonyl (>C=O)
and the carbon-carbon double bond (>C=C<) bands. In order to satisfactorily measure
the >C=C< band the concentration must be so high that the >C=O band is so large that
only stray light is measured. Conversely, adjusting the concentration for measurable
values of the >C=O band, causes the >C=C< band to be so weak as to negate its
validity (see Appendix A). These problems are further complicated by strong degree of
overlap of these two bands.
Table 7
Determination of Iodine Number Values From Proton - NMR
Name INPNMR
IN1i1
Name lNPNMR
INli,
Almond 102.4(±5.6) 95-102 Palm 45.1(±2.5) 51.0
Castor 84.4(±3.7) 83-88 Peanut 90.5(± 1.5) 93.4
Coconut 15.2(±6.2) 9.0 Safflower 139.8(±9.9) 145.0
Corn 126.1(± 7.9) 122.6 Sesame 124.0(± 14.9) 106.6
Cottonseed 105.8(±2.6) 105.7 Soybean 121.0(±9.8) 130.0
Linseed 180.1(±8.2) 190.3 Sunflower 140.3(±4.6) 120.5
Olive 86.2(±4.7) 81.1 Wheat Germ 132.1(±2.9) 115-132
(±) denotes relative standard deviation
21

Derivative Spectroscopy
Derivative spectroscopy is a relatively new analytical technique. Even though it
was intrcxluced more than twenty-five years ago, it has only gained limited acceptance.
This has been due to the lack of reliable analog circuits and computational features of
instrumentation. Today reliable derivatives can be taken computationally. The 1st
derivative of a spectrum is a graphic representation of the mathematical differentiation
of an absorbance spectrum, e.g. dA/dv vs. v, where A = absorbance and v =
wavenumber.
Derivative spectroscopy has been applied in UV-visible (17), flame emission
(18), flame absorption (19), luminescence (18), fluorescence (20, 21), and also
infrared (22) spectroscopic instruments. Most experimentation has been performed in
the UV-visible region. The principal advantage of derivative measurements is the
improvement in the detectability of minor spectral features. This spectral enhancement
reduces the potential for measurement errors caused by overlapping and unresolved
bands. Minor differences in the spectra can be so enhanced such that quantitation can
become possible. The derivative is a measure of the rate of change in the slope of
spectrum.
The type of presentation obtained from the application of 1st to 4th derivative on
a spectrum peak, may be seen in Figure 2. This illustrates idealized representations of
derivatives applied to a single gaussian peak. In the first order derivative, the
absorption maximum of the zero order curve appears as a zero crossing (Y) and the
points of inflection appear as maxima and minima (X, and X2). This representation
shows the gradient increasing to point (X,) and decreasing until gradient or rate of
change of slope is zero, (Y), or zero crossing. The gradient increases again in the
opposite direction until reaching (X2) and finally decreases gradually again to zero. The
22

second order derivative can be thought of as the rate of change of gradient. In this
mode, the absorption maximum appears as a minimum (Y) and the points of inflection,
or positions on the zero order curve where the rate of change of gradient is greatest,
appear as maxima (X/X2). This presentation is perhaps more immediately familiar
than the first derivative as a peak has now been resolved at the absorption maximum.
Fi<st
Third
Second
:x' x,
Figure 2. Idealized Representation of 1st/4th Derivative on Single Peak.
Also, it can be seen that the original peak has been significantly sharpened by
the application of the second derivative. The representation of the third derivative
shows an inverted sense of the first derivative when the peak of the zero order curve
still being at the zero crossing. However, the fourth derivative is potentially much
more interesting. The use of the fourth derivative produces a peak at the maximum
absorbance and is extremely convenient for interpretation, because it is in the same
sense as the original. It also exhibits a further sharpening of the peak band, thereby
allowing a further improvement in apparent resolution. The use of even higher
23

derivative orders is possible, but would really be applicable only to extremely
specialized applications and are generally limited by signal-to-noise considerations.
In Figure 3. we consider the case of two compounds A and B (maxima: A = 2 and B =
6) with overlapping peaks, a very common occurrence in IR spectra. Thus, the
derivative can emphasize the slope change with respect to wavelength and can provide
selectivity of B relative to A. The application of quantitative derivative spectroscopy is
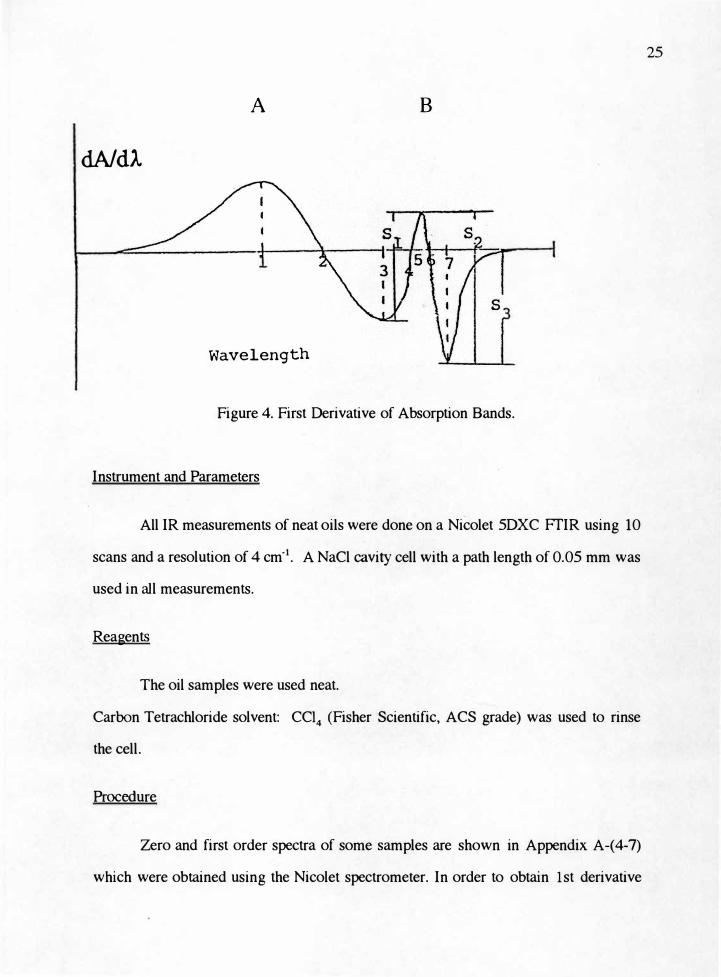
based on the measurement of the maxima and minima of the derivative spectra. Figure
4. depicts the corresponding 1st derivative spectra and their maxima. Occasionally a
lesser maximum may be used in order to improve selectivity, e.g. selectivity for B, S3
> S2
> S 1• The limiting factor in derivative inf rared spectroscopy is the inherent noise
accompanying the signal. As the signal-to-noise ratio decreases within the spectrum,
the error in the derivative measurements becomes more significant. Based on the
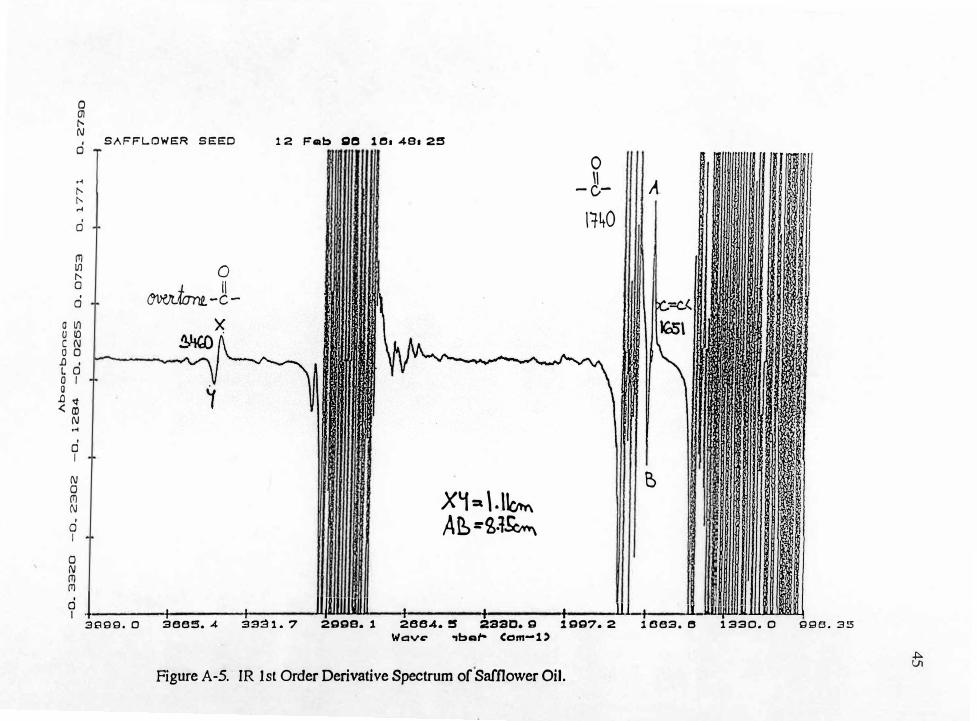
previous discussion, the 1st derivative of each fundamental oil spectrum was
processed as follows: measure the height in cm of the 1st derivative peak caused by
>C=C< bond at 1651 cm -i and the height in cm of 1st derivative of the harmonic band
caused by >C=O at 3460 cm-1.
A B
wavele.ngth
Figure 3. Unresolved Absorption Bands in Fundamental Spectra.
24
A B
dA/dl
Wavelength
Figure 4. First Derivative of Absorption Bands.
Instrument and Parameters
All IR measurements of neat oils were done on a Nicolet 5DXC FfIR using 10
scans and a resolution of 4 cm·1• A NaCl cavity cell with a path length of 0.05 mm was
used in all measurements.
Reagents
The oil samples were used neat.
Carbon Tetrachloride solvent: CC14
(Fisher Scientific, ACS grade) was used to rinse
the cell.
Procedure
Zero and first order spectra of some samples are shown in Appendix A-(4-7)
which were obtained using the Nicolet spectrometer. In order to obtain 1st derivative
25

spectra the 0th order spectrum had to be obtained first. The wavenumber range of
interest for the 0th order spectra was entered as 4,000 to 400 cm-1 and for the 1st
derivative spectra 4,000 to 1,000 cm-1• The ordinate (d.A/dv) for 1st derivative spectra
was entered as -0.333 to 0.277 units. The cell was polished before each day of
analysis.
Each sample was scanned three times and coadded. Between sample analyses,
a cell cleaning procedure was followed. First, the cell was rinsed three times with
chloroform. It was then dried with a stream of air and rinsed several times with the next
sample solution. Finally, the cell was filled with the sample and tightly capped. The
outside of the cell was rinsed with chloroform and dried with soft paper tissue to
remove all residual sample. Chloroform was used as a cleaning agent because it
exhibits no absorbance bands in the wavenumber range of interest
No sample preparation was needed. A small amount of each sample was simply
placed in the clean cavity cell with Pasteur pipette. The cell was mounted in the
instrument using the standard cell holder. The time required for each infrared spectrum
was approximately two minutes to place the sample in a cavity cell and to position the
cell in the holder. Approximately three minutes was required for data acquisition,
processing and calculation.
Calculation of Iodine Numbers From Collected Data
In order to calculate iodine numbers from collected derivative peak heights of individual
oils an attempt was made to derive an equation for this purpose. The derived equation
for IN calculation is presented by equations [13]-[29]. The ratio of absorptivities was
calculated from model compounds as shown in Table 8 and found to be (a' c = 0 / a' c = c)
= 0.28 (±0.07). Peaks of interest were at 1651 cm- 1 and 3460 cm-1.
26

Table 8
Calculated Absorptivities for Model Compounds From Derivative Spectra
Name % (w/w)
cis3Hexlol 13.40
cis50ctlol 13.40
cis4Declol 10.80 mean a'c=c
capMeEst 6.13
capMeEst 48.27
capMeEst 48.92 mean (a'
e=o )
1
capEtEst
capEtEst
6.10
31.42
capEtEst 48. 92mean (a'c=0)
2
olMeEst
olMeEst
2.99
13.62
olMeEst 48.92 mean (a' c=o )3
triolein
trilinolein
mean a'c:e
mean a'c=0
neat
neat
A\6s1 [cm]
>C = C<5.61
3.70
2.50
7.21
11.38
A346o [cm]
>C = O
0.34
1.78
1.81
0.35
1.30
1.40
0.10
0.42
1.20
1.62
1.70
a\%51 10-
>C=C<0.60 (±0.02)
0.53 (±0.04)
0.49 (±0.01) 0.56 (±0.06)
2.32
1.80
2.06*
a'Jg6o 10->C=O
0.14
0.12
0.09 0.12 (±0 .025)
0.15
0.13
0.10 0.14(±0.012)
0.13
0.13
0.13 0.13 (±0.000)
0.52
0.54
0.53*
* Standard deviations could not be reported due to the fact of limited amount of sample.
27

From the data in Table 8 the ratio of absorptivities using isolated functional groups is
seen to be:
a'c=c = 0.56(±0.06)
average a' c =o = {(a')i + (a')2
+ (a')3 } / 3 =
= [0.12(±0.025) + 0.14(±0.012) + 0.13(±0.000)] I 3 =0.13(±0.012)
( a'C =O/ a'c=C)exp
= 0.28(±0.07)
using triolein and trilinolein
(a' c=0) / (a' c=c) = 0.53/2.06 = 0.26
Chromophore Study
The purpose of this study was to determine the theoretical absorptivity ratio, for
carbonyl and >C=C< bond, that would be applicable to a derived equation for IN in
equations[13]-[32]. This study utilized standard solutions containing the two
chromophores of interest for the determination of absorptivites of both carbonyl
(>C=O) and carbon - carbon double (>C=C<)bond as they are present in the
triglyceride molecule. In order to calculate a theoretical absorptivity ratio the other
variables, including IN and SN, have to be substituted into the derived equation.
Reagents
cis- 3-hexen-1-ol (Lancaster, 98% purity)
cis- 5-octene-1-ol (Lancaster, 98+% purity)
cis -4-decene-1-ol (Lancaster, 96% purity)
Caproic methyl ester (Sigma, 98% purity)
Caproic ethyl ester (Sigma, 99%)
Oleic methyl ester (Sigma, 98%)
Carbon Tetrachloride: CCl4
(Fisher Scientific, ACS grade)
28
Triolein: (Sigma, 99%)
Trilinolein (Sigma, 99%)
Derived Equation for Iodine Number Calculation
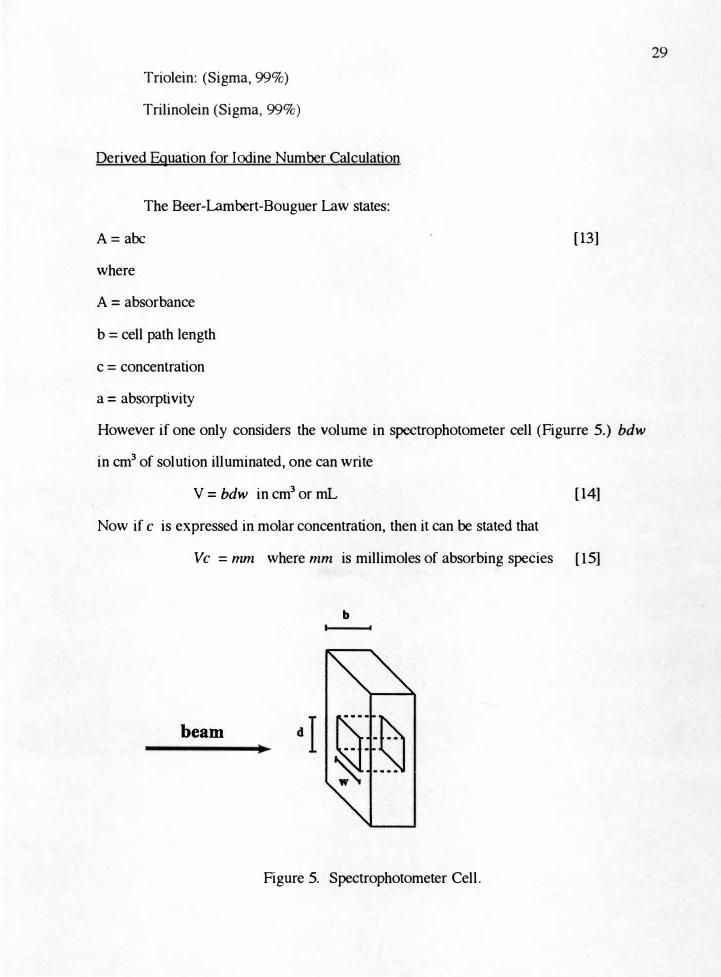
The Beer-Lambert-Bouguer Law states:
A=aoc
where
A = absorbance
b = cell path length
c = concentration
a = absorptivity
[13]
However if one only considers the volume in spectrophotometer cell (Figurre 5.) bdw
in cm3 of solution illuminated, one can write
V = bdw in cm3 or mL [14]
Now if c is expressed in molar concentration, then it can be stated that
Ve = mm where mm is millimoles of absorbing species [15]
b
beam
Figure 5. Spectrophotometer Cell.
29

under these conditions the absorptivity, a, for the absorbing species takes the form
a = A.Imm [16]
While the Beer-Lambert-Bouguer law does not strictly apply to derivative spectra,
practice has clearly shown that the derivative of absorbance, A', is proportional to
concentration, c, over a limited concentration range. Thus equation [16] can be written
in terms of derivative values, e.g.
a' =A'/mm [17]
Logically the IN must be proportional to the ratio of the number of moles of >C=C< to
the number of moles >C=O. This ratio can be expressed as follows:
Cc=dcc=0 = {A'c=Ja'c=c}/{A'c=0/a'c=0} [18]
It can be seen that the volume term cancels out. Rearranging one can write
Cc=dcc=-0
= {A'c=JA'c=0}. {a'cda'c=c} = {A'c=JA'c=0}R
= moles >C=C<lmoles >C=O
where R = {a'c:0/a'c=c} = ratio of absorptivities
The saponification number, SN, is fined by
SN = mg KOH/g sample
[19].
[20]
[21]
It is well known that the average molecular weight of a fat or oil is inversely
proportional to the saponification number. Experimentally it has been observed that the
IN is proportional to the SN. Therefore applying equation [18] we can write
IN= k {A'c=c/a'c=c}/{A'cda'c=0}. SN [22]
Now applying equation [19] the IN is given by the following relationship:
IN= k {A'c=JA'c=0}. {a'cda'c=c} . SN [23]
From equation [19] we see that
IN= k {moles >C=C<lmoles>C=O} . SN [24]
30

Therefore since IN is defined as the number of g 12 per 100 g sample, it follows that
__ g--=I2--- =100 g sample
31
= { 100 • 254 g 12 •(100*) 1 mole 1
2
1 mole 12 _ • l mole C=O • 1 mole KOH • 10·3 g KOH }
l mole C=C l mole KOH 56.1 g KOH 1 mg KOH
• {mole >C=C:9,_ • { mg KOH} mole >C=O f g sample . (25]
where (100*) is not a factor but a label. Thus the quantity in the first set of brackets is
a proportionality constant k and the last term in brackets is the SN.
The proportionality constant is given by k = 0.453 (26]
Now applying equations (20] and (23] the expression for the IN can be written as
IN= 0.453 {A'c=dA'c=0} - R . SN
Rearranging one can write
IN= K. {A'c=dA'c=0}. SN
where K = k . R= 0.453 . 0.27 = 0.122
(27]
[28]
[29]
Where R was determined using triolein and trilinolein as model componds. This value
is consistent with the ratio found with studied model componds. This value could also
be determined experimentally using a wide variety of oils. The value for K used to
determine IN's in this study was 0.133 using equation [28] and calculated· as the
average of 14 different oils.
Instrument and Parameters
All IR measurements of neat oils were carried out on a FrIR - Nicolet 5DXC
with 10 scans and resolution 4 cm·1• The NaCl cavity cell, path length 0.05 mm was
used throughout all measurements. A Mettler balance was used to determine the
concentration [w/w %] of diluted standard samples with carbon tetrachloride prepared
in 10 mL volumetric flasks.
Procedure
The first set of standard compounds: cis- 3-hexen-1-ol, cis- 5-octene-1-ol, cis -
4-decene-1-ol, were used as model compounds to simulate the >C=C< double band
present in many fatty acids which absorb at 1651 cm-1• The second group of
compounds: caproic methyl ester, caproic ethyl ester and oleic methyl ester were used
to simulate the first harmonic of the carbonyl band of fatty acids present at 3460 cm·1•
The concentration range for the first set of standards was adjusted so that the
intensities of the standard bands simulated the >C=C< double band as in oil samples.
This concentration was in the range between 10 and 13% w/w of standard in carbon
tetrachloride. The concentration range for the second set of standards was adjusted so
that the intensities of the bands produced simulated the carbonyl band intensities of oil
samples. This ranged between 3.0 and 50.0% w/w of standard in carbon tetrachloride.
The absorptivity values were then calculated using the modified form of Beer's Law,
equation [17].
Each standard in the first set was measured three times and the average
absorptivity value for the >C=C< double bond was calculated. The same procedure
was done for the second set of carbonyl standards. The final absorptivity value for
carbonyl bond was obtained as an average of the three standards. The results of the
absorptivities for these standards are presented in Table 8. The experimental
absorptivity ratio as determinated from model compounds was equal to 0.28 (±0.07).
Triolein and trilinolein (Sigma 99%) were also chosen as model compounds and
their absorptivities were determined from sample weight, molecular weights, and
32
absorbance measurements. The average ratio of the absorptivities for these two
compounds was found to be 0.26, compared to 0.28 for the model compounds in Table
8. Also using equation [27], theoretically calculated values for IN and SN of triolein
and trilinolein, measured values for absorbances at 1651 and 3460 cm·1, and the
average value of their absorptivity ratios was found to be 0.27. This ratio too is in very
good agreement with the previously determined ratios for the model compounds.
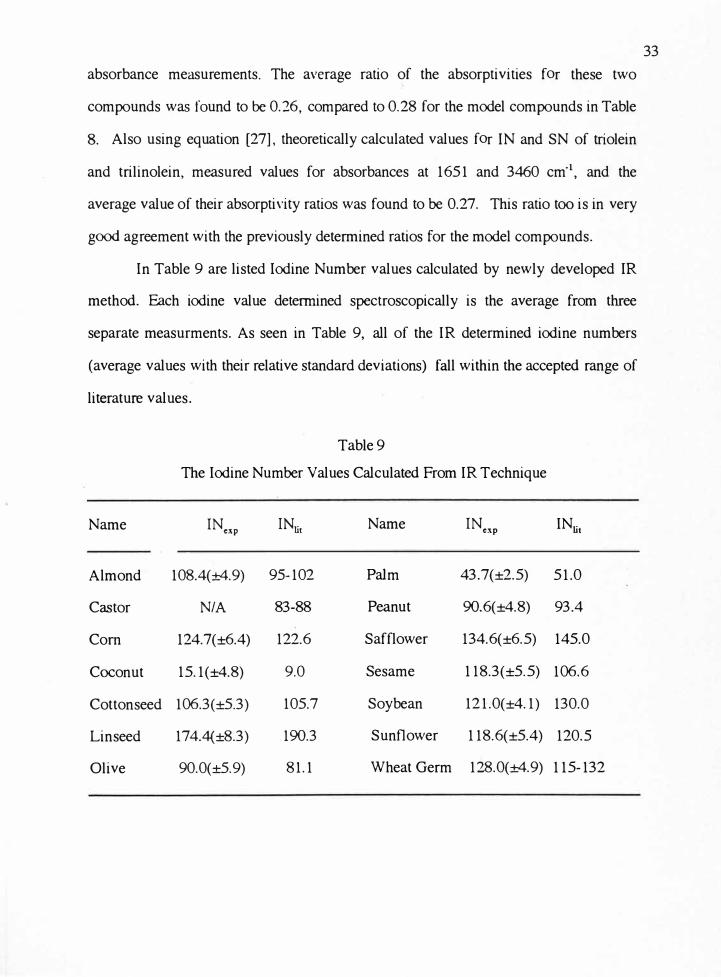
In Table 9 are listed Iodine Number values calculated by newly developed IR
method. E.ach iodine value determined spectroscopically is the average from three
separate measurments. As seen in Table 9, all of the IR determined iodine numbers
(average values with their relative standard deviations) fall within the accepted range of
literature values.
Table 9
The Iodine Number Values Calculated From IR Technique
Name INcxp INli1 Name INcxp IN
lit
Almond 108.4(±4.9) 95-102 Palm 43.7(±2.5) 51.0
Castor NIA 83-88 Peanut 90.6(±4.8) 93.4
Com 124.7(±6.4) 122.6 Safflower 134.6(±6.5) 145.0
Coconut 15.1(±4.8) 9.0 Sesame 118.3(±5.5) 106.6
Cottonseed 106.3(±5.3) 105.7 Soybean 121.0(±4.1) 130.0
Linseed 174.4(±8.3) 190.3 Sunflower 118.6(±5.4) 120.5
Olive 90.0(±5.9) 81.1 Wheat Germ 128.0(±4.9) 115-132
33

RESULTS AND DISCUSSION
The goal of this study was to detennine Iodine Numbers of various selected
vegetable oils by standard techniques and compare them with results from a newly
developed IR technique. We can evaluate our results based on two different levels
from the data as shown in Table 10. First, comparison of IN values from each
individual technique vs. IN values cited in literature. Secondly, and perhaps more
realistically, they can be compared to those obtained by the classical titration method.
The classical method provides highly accurate and precise results for each
sample. For this reason the classical method was used in this research as the reference
technique. Proton-NMR is also a known and established technique, but the results
appears. less accurate and precise relative to the classical titration method. This was
caused primarily by difficulties in defining the areas for peak integration. Fair
evaluation of the gas chromatographic method suffered from the lack of a split/splitless
injector. This accounts, in large part, for the large value in standard deviations. The IR
method is quite accurate and precise with respect to literature IN values and also the
classical method. However, this method was not able to detennine iodine number of
castor oil and lecithin. The castor oil contains approximately 87 % ricinoleic acid. A
strong band appearing around 3500 cm-1 is caused by OH stretch of hydroxyl group
present in ricinoleic acid and overlaps with the harmonic band of carbonyl at 3460 cm-1
(23). Lecithin exhibits a similar problem.
CH3(Ctlz)
5CH(OH)CH
2CH=CH(CH
2)1COOH
Ricinoleic acid ( d-12-Hydroxy-cis-9-octadecenoic acid)
34

Table 10
Comparison of Iodine Number Results From Different Methods
Name IN classical
Almond 102.2(±0.3) 102.4(±5.6) 108.4(±4.5) 96.77(±5.79) 95-102
Castor 91.1(±2.9) 84.4(±3.7) NA 93.99(±10.91) 83-88
Coconut 15.1(±18.6) 15.2(±6.1) 15.1(±6.6) 33.70(±9.66) 9.0
Com 123.5(± 1.8) 126.1(± 7.9) 124.7(±6.4) 133.80(±5.95) 122.6
Cottonseed lQCJ.4(± 1.2) 105.8(±2.6) 106.3(±5.0) 131.58(± 11.66) 105.7
Linseed 180.0(±4.6) 180.1(±4.6) 174.4(±4.5) 185.40(±2.93) 190.3
Olive 81.3(±0.8) 86.2(±4.7) 90.0(±6.6) 81.29(±3.63) 81.1
Palm 43.3(±3.1) 45.1(±2.5) 43.7(±5.7) 47 .87( ± 1.42) 51.0
Peanut 91.3(±0.7) 90.5(±1.5) 90.6(±5.3) 98.88(±4.98) 93.4
Safflower 134.7(±2.7) 139.8(± 14.9) 134.6(±4.8) 138. 70( ± 7 .10) 45.0
Sesame 110.4(± 1.4) 124.0(± 14.9) 118.3(±4.6) 123.46(±6.44) 106.6
Soybean 128.7(±0.7) 126.4(±9.8) 121.0(±3.4) 133.48(±7.30) 130.0
Sunflower 120.0(±1.8) 140.3(±4.6) 118.6(±4.6) 110.82(±5.92) 120.5
Wheat Germ 126.7(±7.2) 132.1(±2.9) 128.0(±3.8) 142.53(±5.75) 115-132
(±) denotes relative standard deviation
The hydroxyl group of phospholipids (Figure 6) tends to overlap the harmonic band of
the carbonyl group (18). There were two types of saponification numbers applied in the
35

iodine number calculation which were obtained both experimentally and from the
Ii terature.
CH20COR
CHOCOR
I
Figure 6. Lecithin Molecule.
From Table 11 it can be seen that calculated iodine numbers, INu1
(calculated from
literature SN values), and IN•xp (calculated from experimentally determined SN values)
are almost identical. This is due to the fact saponification numbers from the literature
and those experimentally determined are very similar. This implies that iodine numbers
can be calculated from the derived equation [28] using literature values of the
saponif acation numbers and thus avoiding the tedious titration necessary to obtain this
variable.
In order to confirm the validity and reproducibility of the new IR technique
three edible oils, avocado (Anglia Oils Ltd., Hull, Product of U.K.), canola (Spartan,
Grand Rapids), and macadamia (Loriva Supreme Foods, Hauppauge) were purchased
and analyzed. The data in Table 12. illustrates the agreement of iodine numbers
obtained by titration and by infrared measurements. With the exception of macadamia
oil, the values are in good agreement with the literature (24). The variation in measured
iodine numbers from the literature might be interpreted as possibly being caused by
additives introduced during the manufacturing process to enhance the quality of the
cooking oil.
36

37
Table 11
Comparison of Calculated Iodine Numbers INti, and IN•xp Obtained From IR Method
Base on Incorporated Values, SN1i1 and SNexp
NAME SNljt
SNCIP
IN,;1 INrn1
ALMOND 188-197 189.6 (±0.2) 102.2 (±7.9) 108.4 (±4.9)
CASTOR 176-187 178.8 (±1.3) NIA NIA
COCONUT 268.0 265.6 (± 1.2) 15.2 (±1.0) 15.1 (±1.0)
CORN 192.0 190.1 (±0.5) 126.0 (±6.4) 124.7 (±6.4)
CCJITONSEED 194.3 193.0 (±0.9) 107.0 (±5.3) 106.3 (±5.3)
OUYE 189.7 187.5 (±0.5) 91.0 (±6.0) 90.0 (±5.9)
PALM 199.1 200.0 (±0.8) 43.5 (±2.4) 43.7 (±2.5)
PEANUT 192.1 189.6 (±1. 1) 91.8 (±4.8) 90.6 (±4.8)
SAFFLOWER 192.0 192.0 (± 1.2) 137.9 (±6.4) 134.6 (±6.5)
SESAME 187.9 187.9 (±0.9) 118.3 (±5.5) 118.3 (±5.5)
SOYBEAN 190.6 191.2 (±1.5) 120.6 (±4.9) 121.0 (±4.1)
SUNFLOWER 188.7 186.7 (±0.6) 119.9 (±5.4) 118.6 (±5.4)
WHEATGERM 179-189 189.6 (±0.4) 124.0 (±4.8) 128.0 (±4.9)
(±) denotes relative standard deviation

Table 12
Determined Iodine and Saponification Numbers by Classical and Newly Developed Method
Name
Avocado
Canola
IN class
83.9(±4.8)
105.0(±1.5)
Macadamial00.2(±2.9)
INlit
71-95
97-107
74-76
(±) denotes relative standard deviation
INIR SNexp SN
li,
83.1(±2.2) 180.2(±1.3) 177-198
101.9(± 1.7) 176.0(± 1.6) 168-179
99.7(±1.8) 199.6(± 1.8) 193-197
38

CONCLUSION
The derivative infrared spectroscopic technique provides a quantitative method
that is very comparable to the standard methods. This method provides data with a
relative standard deviation of about 5 percent. This technique permits quantitation in the
inf rared region at the same level of precision and accuracy as some of the more
elaborate standard techniques. The method does not require any standards or sample
preparation since spectra are measured on single neat samples. It does not require
expensive instrumentation for analysis and takes only about 5 minutes to obtain an
iodine number.
39

Appendix A
Gas Chromatograms, Proton - NMR and Infrared Spectra of Selected Vegetable Oils
40

Certificate of 52Lna[ysis DESCRIPTION: COCONUT OIL
CATALOG NO.: 4-69<9 LOT NO.: lA-S3898 CAS NUMBER: 8001-31-e
PHYSICAL PROPERTIES
APPEARANCE SAPONIRCATION VALUE SOLUBILIIY
ASSAY
while semisolid with faint yellow cast 257
dcac colodcss solution at 200 mg plus 4.0 ml of chlorofonn
CHROMATOGRAPHIC ASSAY OF COCONUT OIL AS METHYL ESTERS4
AOt "- c( t<Jll8Gllll28CWID
- SOLVD<T 2 3 4 s 6
=
�
1S<JX)
-
·em 1
·-I
,I ... is COLUMN: SP2J80, 30m. X G.lSmmlD0 0.2f.cm df CAT,}{().: 1-4110 OVEN::-. 804Cco2.SO°C@'4-c/mia CARRIER: bdium, lO cm/w:@SO-C
....
EUJTION ORDER L 'Clprok.C6:0
RETENTIONTJME {min.l -3.J�
1. Capcylk.C8:0 a. Capdc, ClO:O 4. �CU.-0 S; �CU:O 6; �alQll(io; Cl 6:0 -7. �C18:0 8. Ol�Cl8:1 9. Unold<; Cl8:2
9.7.
13.3 17.'4 2U 24.6 lS.S 26..9 28.S
8 9
7 10
I
is 9a DE'f.: FJD.260"C INJ.: 3Jd. SPLIT: 100:l
AREA PER<E::IT C¾l ..24 3.4 2.9.
24.3 10.S 9.S
3.S 13.7. 19.6 2.6
I •
41
..a
r#9ii::J:: . <oonethJ.HeMehe
• Mdhyl Estas wccc pccparoc1 following proo:d=s ouilinod in AOAC Mdhod 969.33 oc AOC:, Mdhod C.Cl-66 •
...,.<l<Jafcty Cootrof SupeMSO<
� wattants u.at b pcoducts OOfflOffll lo fie Wom\alioil.b)(\tairied 11\ Chis pubrtealion. �mustdel.entinefle�o(fle�forltspa1ic1Aa,'use. AeaseseeChelalesf. c:ajzog o<ocde<WIYO«leand pad<,ng �Coe addiGo<mler.-and�o( sale.
Figure A-1. Chromatogram of Coconut Oil Obtained from Supelco Company.
Reprinted by permission of Supelco Company.

00 C:
t g,
-·
Zv
i3 -"hf"cA "i:C'i'S""'
f..:> ';: 5.S9S
\;:> 9.517
.:s: -==========--::+..863
('1 18.698
'"' 23.242
+J
cl:>
.s>
TOP
CHROl1ATOPAC C-R3A
SAl1PLE NO 8 REPORT NO 43
PKNO TINE AREA
l 3.758 149 2 4.888 36 3 4.248 34 4 5.895 1569 5 9.517 936 6 14.863 6811 7 18.698 2295 8 23.242 1779 9 27.55 3413
10 28.312 1972 I I 29.413 158
---------TOTAL t·:it52
11K IDNO
y
y
FILE
.$) 00 ..;.s '"' . "1 .r I? ,._ -
f· f- � n�� .&' -rf � � . () g. <'1- 6"
� (') -� �<> � <"" A ("\iji � IA �;'z p O � ft
� ;; .:: 00 o 6 o o
8 METHOD 41
COHC HANE
8.7763 8.1865 8.1791 8.193 4.8873
35.566 11. 9822
9.289517.8218.2946
8.8255 ··------------
1E)0
JC: �
� -..;.:_

,:
Mw = 173.l +45.l + 13.02V+ 114.03µ IN=(l26.91) x(l00)V iMw
6- Y. Y.
H H H
n H-C-O-CO-(CHl)1-C = C-(CHi)1-Cffi
I x H-C-0-CO-(Cffi)to-Cffi
n H-C-0-CO-(Cffi)t<-Cffi H n
X
ethy{ene & glycerol >CH�
7.8 6.0
long chain -CHi-& -CH�
Figure A-3. Proton-NMR Spectrum of Peanut Oil.
8.8
43
illlre.·2•-u SF 2cl8. sr aa.Ha Ol $3U. SI 8192 ro 8l92 St 4.81a. fll/Pf
.. , 3. lsil 3. qi) 1. tCi 18 l<S 8 fl:: 5UI
F� 5913 02 l8. 0� 65t. f'O
LI! a.:
c;e 1.: a 21.: CT 8.1 fl ,., F2 .-.• KUO( 84.! f'l'l(/CI( •• � 133S •.

0 0 C "t N SAFFLOWER SEEO 12 Fob QB 18148129
T \N�\�½,+ 1 I ll ��� Ji1/J o I I .. }I! ;;U i I 1. 0 ' I� ,t i '
� I II I :I ;1 l\i � ! !1
tC- '1• II I! � •. ,··
I -
I� . ,. "I N Iii ' rt � ;l . Q
Rltl :'I i :� Id g :a r 1· : � I t Ii mt
CJ.. � 1 1� l i ..; \fS\ \' ! rl! 'i• l
l i� a 11 i · \J tJ . �i l' C q : .i ,., ll O r II !; . . n N ! li' :!: j \. • I 1I � l •;1 l) r◄ LI � 1 ,. l Ii :i .a . I i f � < Q I C ! ,,
0
I l :
0 I 1 1 'I
� I I j) l o+ .. h j I l
, 111· (JW(lf/illt - I a j j!! ·
s 1 ��o ! '1 � ; A ) I ,� !1 lj0 II
I 1\ J,l 1
g�u ., 111., Cj 1./ ,· 1: i o � 1
� I d--··, 1 1 � V 1 1 u,lli 4000. o aooo. o 2200. o 2000. o 2.400. c aooc. c 1 eco. o 1200. a acc. co Aoo. oD
W QY ar,·Umbor- (om ... 1)
Figure A-4. IR 0th Order Derivative Spectrum of Safflower Oil. t
0 (]'/ " N
0
...." I'-....
I 0
('11 Ill "
a d
O Ill U ID C N o a
.D I L 0 0 I a
.D st< (I)
N.... d I
N a (T) N
d I
a N ('11 ('11
SAFFLOWER SEED
0 + II
at>Vt.W'nl -c -
12 Fab ge 10149125
X�= \.\\cm Ae:,=2,.l�
0 \\ -c-
\140
A
�
9 I I I 11111111111111 I I I 111 I II UJJll�IUI u 1111111 3ggg, o aees. 4 3331.7 2gge.1 2ee4.� 2aac.g 1gg7.2 1eea. e 1aao. o gge. 3s
Wav� ,bD� (om-1)
Figure A-5. IR 1st Order Derivative Spectrum of Safflower Oil. �
0
0 Q a st '
N
0 Q aa'N
a C} 0 (0 '
, ...
0 0 C 0 0 Q fl N
COCONUT 19 FQb 98 14142148
0 � II
-��oI
Tl1 i
I l
-�
I : i ; I I• Ii
: ! I j I
I; . ! ' ,.
I
I l.ti
I ll ,, � I !· 11!l
Ill I· '
� I li ,, i
L , l0 .... u
I I l
l·ti j
� �Ji� l�
�.0 -< Q
0 Q (I)
I a
Q 0 0 '!f
d
,Q + II
��-C,-��o >C.=-0
\�\
I i ;Y. 1� 1·, �� i··� t
/,� 1: �Ii j· �!� J l� i�� lII: � jl ,: l1
i
• � I,
Q Q a (.)
cl I � , -- , , , .... , ..... 1 r , 1 1...----111W4 4000. 0 seoo. o a200. o 2eoo. o 2400.0 2000.0 1eoo. o 1200. 0 eoo. oo 400. 00
WoV�hU�b•� (cm-1>
Figure A-6. JR 0th Order Derivative Spectrum of Coconut Oil. �

\ Q
:::=<)
G}
(II -OJ
"t
-a
(\J
G}
Ol
n.
a
(/)
l!J
a
1-:J
z
a
u
a
u
l
I 0
:::::-0
X
I
1
K 0�
� o-
•"
dJ:r-
<><
47
0
0
01
01
01
l!J
(\I
(IJ
(I)
...
a .
to
co
co
...
� . Ol
OI
OI
...
...
.-.
I •
EA
o
(II
V
(II
NL
CJ
.D
IJ
E
. :,
IJ
C
I)0
IJ
>
NO
�
N .
a
0
0
(II .
(II
(II
(II
(1)
(\I .
I'-CD
co
(I) .
0
a
a
�-
--
-4-
__
__
__
__
_,,_ _
__
__
__
__
__
__
__
_ ___...
'st
OL
L2
"0
8
1"L
l ·o
L
ZL
O ·o
S
62
0 ·o
-L
l E: l
·o-
6€
€2
·o-
1: ge:
e: ·o
c,
:::,u
oq
..10
:,sq
y
-0
0
8
'o
e
s
0
8.
�
·.:3
�·i::cu
cu
�
...
Cll
.....
0::
....
�
<
·e
u::

48
Name MWSN MWP-NMR
Almond 886.1(±0.9) 872.3(±47.7)
Castor 939.6(±6.8) 948.6(±41.6)
Coconut 632.5(±2.8) 658.1(±268.4)
Com 883.7(±2.3) 878.9(±55.1)
Cottonseed 870.5(±4.0) 862.0(±21.2)
Linseed 878.7(±1.4) 879.4(±40.0)
Olive 896.0(±2.4) 908.3(±49.2)
Palm 843.8(±3.4) 852.7(±47.3)
Peanut 886.1(±5.1) 862.8(±47.3)
Safflower 875.0(±5.5) 877.5(±62.1)
Sesame 894.1(± 7.1) 912.9(±109.7)
Soybean 878.7(±6.9) 856.3(±69.4)
Sunflower 899.8(±2.9) 872.3(±28.6)
Wheat Germ 886.1(± 1.9) 873.5(± 19.2)
(±) denotes relative standard deviation
Figure A-8. Average Molecular Values from P-NMR and SN Measurements.
REFERENCES
1. Meyer, L.H. (1%1). Food Chemistry. Reinhold Publishing Corporation, NewYork, p. 42-44.
2. ibid., pp. 22.
3. Haumann, F.B. (1996). Mediterranean Product Consumed Worldwide, Inform,7: pp. 890-901.
4. Petty, Ch., Walser, F. (1992). An Introduction to Fr - Raman ( Near - Infrared)Spectroscopy. Nicolet Fr -IR Spectral Lines, Introducing the Raman 91Spectrometer, pp. 2- 3.
5. Melvin, J.A., Skelton, J.R. ( 1953). Organic Chemistry. Harper & BrothersPublishers, New York, p. 223.
6. Vinter, N.L. (1976). Studies on the Relationship Between Unsaturation andIodine Value of Butterfat by High Resolution Nuclear Magnetic Resonance (NMR) Milchwissenshaft, 3 ( 10), pp. 598-602.
7. The American Oil Chemists' Society (1996, September 28 ). Oil in Oilseeds byProton - NMR, Offic_ial Method, Internet, www.aocs.org.
8. Association of Official Analytical Chemistry (1980). 13th Ed., Iodine Value.Hanus Method, 28.018, Official Methods of Analysis.
9. Association of Official Analytical Chemistry (1980). 13th Ed., Iodine Value. WijsMethod, 28.020, Official Methods of Analysis.
10. The American Oil Chemists' Society (1983). 13th Ed., Iodine Value. WijsMethod. Vol. 1, Cd 1-25, Official Method.
11. Association of Official Analytical Chemistry (1980). 13th Ed., Preparation ofMethyl Esters and Gas Chromatography. 28.052-28.65, Official Methods ofAnalysis.
12. The American Oil Chemists' Society (1983). 13th, Fatty Acid Composition by Gas
Chromatography:. Vol. 1, Ce 1-62, Official Method.
13. Lowry, J.C. (September 26, 1984). The application of Multiderivative InfraredSpectroscopy to Iodine Number Determination, M.S. Thesis, WMU.
14. The American Oil Chemists' Society (September 28, 1996). IN UsingCyclohexane/Acetic Acid, Official Method, Internet, www. aocs.org.
49

15. The American Oil Chemists' Society (1983). 13th Ed., Saponification Number ,Vol. 2, Tl la-64, Official Method.
16. Association of Official Analytical Chemistry (1980). 13th Ed., SaponificationNumber, 28.018, Official Methods of Analysis.
17. Kapoulas, M.V., Andrikopoulos, K.N. (1987). Detection of VirginOliveOilAdulteration with Refined Oils by Second-Derivative Spectrophotometry, FoodChemistry, 23: pp. 183-192.
18. Snellman, W. (1970)., Flame Emission Spectrometry with Repetitive OpticalScanning in the Derivative Mode, Anal. Chem. 42, p. 394.
19. Fowler, W.K. (1974). Double Modulation Atomic Fluorescence FlameSpectrometry, Anal.Chem., 46, p. 601.
20. Kolb, D.A. & Shearin, K.K. (1977). Fingerprinting Petroleum Oils with LowTemperature Derivative Ruorometry. Pittsburgh Conference on AnalyticalChemistry and Applied Spectroscopy, Cleveland, Ohio.
21. O'Haver, T.C., Green, G.L. (1974). Derivative Luminescences Spectrometry.Anal. Chem., 46, p. 2191.
22. Overland, J,. Gilby, A.C., Russell, J.W., Brown, C.W., Beutes, J., Bjork,C.W., Paulet, H.G. (1967). A Littrow-McCubbin High Resolution InfraredSpectrometer, Appl. Opt., 6, p. 457.
23. Stadler Laboratories Inc. (1963). Ricinoleic Acid, Vol. 21, No. 21992, StadlerStandard Spectra, Grating Spectrum, Philadelphia, PA.
24. Eckey, E.W. (1954). Vegetable Fats and Oils, Reinhold Publishing Corporation,New York.
50