Quantification of host and pathogen DNA and RNA transcripts in the interaction of Norway spruce with...
11
Physiological and Molecular Plant Pathology 70 (2007) 99–109 Quantification of host and pathogen DNA and RNA transcripts in the interaction of Norway spruce with Heterobasidion parviporum M. Karlsson a, , A.M. Hietala b , H. Kvaalen b , H. Solheim b , A ˚ . Olson a , J. Stenlid a , C.G. Fossdal b a Department of Forest Mycology and Pathology, Swedish University of Agricultural Sciences, Box 7026, SE-750 07 Uppsala, Sweden b Norwegian Forest and Landscape Institute, P.O. Box 115, N-1431 A ˚ s, Norway Accepted 23 July 2007 Abstract Colonization levels of the pathogenic fungus Heterobasidion parviporum in tissue cultures and bark lesions of 33-year-old Norway spruce trees was monitored using quantitative PCR. Expression of selected host and fungal transcripts was also measured in the same material using quantitative reverse transcriptase (RT)-PCR. The host genes phenylalanine ammonia lyase, peroxidase, glutathione- S-transferase, germin-like protein and class IV chitinase were all induced in tissue cultures in response to infection. Higher transcript levels of phenylalanine ammonia lyase and peroxidase were detected in the more resistant clone 589 than in the less resistant clone 409. Expression of a class IV chitinase was higher in clone 409 than in 589. Several of the fungal genes assayed were differentially expressed during colonization, including putative glutathione-S-transferases, laccase, cellulase, cytochrome P450 and superoxide dismutase genes. The transcriptional responses suggest an important role for the antioxidant systems of both organisms. The changes in the levels of all the examined host and pathogen transcripts were similar between tissue cultures and bark over their overlapping colonization range. This suggests that tissue cultures can be used to select candidate host defense and fungal pathogenicity genes operative in tissues composed of primarily living cells, such as phloem, in the Norway spruce/H. parviporum pathosystem. r 2007 Elsevier Ltd. All rights reserved. Keywords: Tissue culture; Conifer root rot; Picea abies; Transcript profile; Quantitative PCR 1. Introduction Norway spruce [Picea abies (L.) Karst.] has a natural distribution in Northern Europe and Asia and is the most economically important tree species of the Nordic coun- tries. A common threat to Norway spruce is the pathogenic fungus Heterobasidion annosum (Fr.) Bref. sensu lato (s.l.). In Europe, H. annosum s.l. consists of three species with overlapping geographic distribution and host range, H. annosum sensu stricto (s.s.), H. abietinum Niemela¨ and Korhonen and H. parviporum Niemela¨ and Korhonen [1]. Heterobasidion parviporum mainly attacks Norway spruce, although Siberian fir (Abies sibirica Ledeb.) and Scots pine (Pinus sylvestris L.) occasionally show infection [2]. Heterobasidion annosum (s.s.) mainly attacks Pinus species, although it has been shown to attack Picea, Larix, Juniperus and deciduous trees like Betula sp. and Alnus sp. [3]. Heterobasidion abietinum only infects Abies spp. [4]. Epidemiological studies have shown that wounds and cut stump surfaces act as the primary infection routes for the establishment of H. annosum s.l., while secondary infections of healthy trees occur through vegetative growth between root-root contacts of trees [5–7]. Fruiting bodies of the fungus are frequently found on both trees and stumps, which indicate that the fungus can complete its lifecycle as both a parasite and a saprophyte [3]. Previous inoculation investigations have shown that the variation in sapwood growth among H. parviporum isolates is relatively low [2,8–10]. Norway spruce has been screened with stem inocula- tions to identify clones that differ in resistance towards H. annosum s.l. [11]. Based on lesion length and fungal isolations, considerable clonal variation in genetic resistance ARTICLE IN PRESS www.elsevier.com/locate/pmpp 0885-5765/$ - see front matter r 2007 Elsevier Ltd. All rights reserved. doi:10.1016/j.pmpp.2007.07.006 Corresponding author. Tel.: +46 18 671875; fax: +46 18 673599. E-mail address: [email protected] (M. Karlsson).
-
Upload
independent -
Category
Documents
-
view
0 -
download
0
Transcript of Quantification of host and pathogen DNA and RNA transcripts in the interaction of Norway spruce with...
ARTICLE IN PRESS
0885-5765/$ - se
doi:10.1016/j.pm
�CorrespondE-mail addr
Physiological and Molecular Plant Pathology 70 (2007) 99–109
www.elsevier.com/locate/pmpp
Quantification of host and pathogen DNA and RNA transcripts in theinteraction of Norway spruce with Heterobasidion parviporum
M. Karlssona,�, A.M. Hietalab, H. Kvaalenb, H. Solheimb,A. Olsona, J. Stenlida, C.G. Fossdalb
aDepartment of Forest Mycology and Pathology, Swedish University of Agricultural Sciences, Box 7026, SE-750 07 Uppsala, SwedenbNorwegian Forest and Landscape Institute, P.O. Box 115, N-1431 As, Norway
Accepted 23 July 2007
Abstract
Colonization levels of the pathogenic fungus Heterobasidion parviporum in tissue cultures and bark lesions of 33-year-old Norway
spruce trees was monitored using quantitative PCR. Expression of selected host and fungal transcripts was also measured in the same
material using quantitative reverse transcriptase (RT)-PCR. The host genes phenylalanine ammonia lyase, peroxidase, glutathione-
S-transferase, germin-like protein and class IV chitinase were all induced in tissue cultures in response to infection. Higher transcript
levels of phenylalanine ammonia lyase and peroxidase were detected in the more resistant clone 589 than in the less resistant clone 409.
Expression of a class IV chitinase was higher in clone 409 than in 589. Several of the fungal genes assayed were differentially expressed
during colonization, including putative glutathione-S-transferases, laccase, cellulase, cytochrome P450 and superoxide dismutase genes.
The transcriptional responses suggest an important role for the antioxidant systems of both organisms. The changes in the levels of all the
examined host and pathogen transcripts were similar between tissue cultures and bark over their overlapping colonization range. This
suggests that tissue cultures can be used to select candidate host defense and fungal pathogenicity genes operative in tissues composed of
primarily living cells, such as phloem, in the Norway spruce/H. parviporum pathosystem.
r 2007 Elsevier Ltd. All rights reserved.
Keywords: Tissue culture; Conifer root rot; Picea abies; Transcript profile; Quantitative PCR
1. Introduction
Norway spruce [Picea abies (L.) Karst.] has a naturaldistribution in Northern Europe and Asia and is the mosteconomically important tree species of the Nordic coun-tries. A common threat to Norway spruce is the pathogenicfungus Heterobasidion annosum (Fr.) Bref. sensu lato (s.l.).In Europe, H. annosum s.l. consists of three specieswith overlapping geographic distribution and host range,H. annosum sensu stricto (s.s.), H. abietinum Niemela andKorhonen and H. parviporum Niemela and Korhonen [1].Heterobasidion parviporum mainly attacks Norway spruce,although Siberian fir (Abies sibirica Ledeb.) and Scots pine(Pinus sylvestris L.) occasionally show infection [2].Heterobasidion annosum (s.s.) mainly attacks Pinus species,
e front matter r 2007 Elsevier Ltd. All rights reserved.
pp.2007.07.006
ing author. Tel.: +4618 671875; fax: +46 18 673599.
ess: [email protected] (M. Karlsson).
although it has been shown to attack Picea, Larix,Juniperus and deciduous trees like Betula sp. and Alnus
sp. [3]. Heterobasidion abietinum only infects Abies spp. [4].Epidemiological studies have shown that wounds and
cut stump surfaces act as the primary infection routesfor the establishment of H. annosum s.l., while secondaryinfections of healthy trees occur through vegetative growthbetween root-root contacts of trees [5–7]. Fruiting bodiesof the fungus are frequently found on both trees andstumps, which indicate that the fungus can complete itslifecycle as both a parasite and a saprophyte [3]. Previousinoculation investigations have shown that the variation insapwood growth among H. parviporum isolates is relativelylow [2,8–10].Norway spruce has been screened with stem inocula-
tions to identify clones that differ in resistance towardsH. annosum s.l. [11]. Based on lesion length and fungalisolations, considerable clonal variation in genetic resistance
ARTICLE IN PRESSM. Karlsson et al. / Physiological and Molecular Plant Pathology 70 (2007) 99–109100
has been recorded for Norway spruce [12]. However,relatively little is known about the defense reactions ofconifers and the mechanisms contributing to their resistanceagainst H. annosum s.l. In response to heartwood infection,Norway spruce forms a reaction zone in the border areabetween the healthy sapwood and the infected heartwood[13]. This phenol-containing zone slows down the lateralspread of the pathogen towards the vitally important livingsapwood. Consistently, extracts from the reaction zone havebeen shown to inhibit fungal growth and activity of fungalextracellular enzymes [14–16]. Therefore, Norway sprucetrees may live for decades after infection and only a veryadvanced stage of the disease results in death of the tree [3].It has been estimated that more than 50% of the diametergrowth losses found in heavily infected Norway spruce treescan be attributed to increased production of antifungalcompounds by the tree in the reaction zone [17]. Despite thiseffort, the pathogen is eventually able to detoxify thereaction zone components and grow through the barrier.
One obstacle to studying host/pathogen interaction inconifers has been the limited availability of mature clonesfor controlled inoculations, as genetic variation within thehost material and the lack of replicates complicateinterpretation of the results. Somatic embryogenesis,rooted cuttings, and tissue cultures may provide solutionsto this problem. Tissue cultures from mature Norwayspruce trees have been proposed as a possible model systemfor assessing resistance toward fungal pathogens [18,19].Plant tissue cultures have been used successfully to studyphysiologically important cell processes including cellbiology, biochemistry and molecular biology of thedefense response in parsley [Petroselinum crispum (Mill.)A. W. Hill] [20]. Clonal variation was also observed inNorway spruce chitinase isoforms both in bark inocula-tions, by H. parviporum, as well as in tissue cultures [21].
Here we present data on the use of tissue cultures tostudy molecular aspects of the interactions between Nor-way spruce and H. parviporum. First, tissue culturesoriginating from spruce clones that display variation indisease resistance were inoculated with H. parviporum andthe colonization rates were monitored. Secondly, transcriptlevels of candidate fungal pathogenicity and host defense-related genes were monitored during the infection process.Finally, colonization levels and transcript levels of selectedhost and pathogen genes were compared between tissuecultures and bark of mature trees.
2. Materials and methods
2.1. Biological material
Needles from two Norway spruce clones, clone 409 withlimited bark resistance to H. parviporum and clone 589 withhigh bark resistance [19,22], were collected in May 2000,surface sterilized in sodium hypochlorite (2% v/v) for15min, and washed in sterile deionized water. The needleswere then plated on spruce tissue culture medium
(S-medium) [19] and incubated in dark at 24 1C. After2–3 weeks, calli appeared from the basal meristemof the needles and was sub-cultured to fresh medium.The heterokaryotic strain 87-257/1 of H. parviporum
(Norwegian Forest Research Institute fungal culturecollection) was used for inoculation. Prior to inoculation,the fungus was cultured on S-medium for 11 days inthe dark at 21 1C. For inoculation, eight host tissuepieces, 200–300mg in fresh weight, were placed withforceps on the margin of actively growing fungalcolonies in each Petri dish. Uninoculated tissue culturestransferred onto fresh growth medium served as non-treated samples. Incubation was continued at 21 1C for144 h, and randomly chosen samples, three replicates perclone each time, were taken at the initial time ofinoculation and at 6, 12, 24, 72 and 144 h post-inoculation(hpi). For reference purposes, surface mycelium of thepathogen from the S-medium cultures was also harvestedat the time of inoculation. After sampling, tissue culturesand the mycelial reference samples were stored at �150 1Cuntil processing.
2.2. RNA isolation, quality analysis and cDNA synthesis
Tissue cultures and H. parviporum mycelium wereground to powder with a pestle in liquid nitrogen-chilledmortars. RNA was isolated from 50 or 5mg of groundtissue or mycelium, respectively, by using an RNAqueoussmall-scale phenol-free total RNA isolation kit and RNAIsolation Aid (Ambion, Austin, Tex.) according to themanufacturer’s instructions. Contaminating DNA wasremoved by using the DNA-Free DNase treatmentand removal kit (Ambion, Austin, Tex.). RNA qualitywas analyzed using a Series II RNA 6000 Nano assay(Agilent Technologies, Santa Clara, CA) in an Agilent 2100bioanalyzer (Agilent Technologies, Santa Clara, CA)according to the manufacturer’s instructions.Total RNA was quantified with a VersaFluor fluorom-
eter (Bio-Rad, Hercules, CA) and a RiboGreen RNAquantification kit (Molecular Probes, Eugene, Oreg.)according to the manufacturer’s instructions. Reversetranscription of 500 ng of total RNA was done in a100 ml reaction volume using TaqMan reverse transcriptionreagents according to the manufacturer’s instructions(Applied Biosystems, Foster City, CA). The referenceRNA from pure mycelium was similarly processed andaliquots containing 1, 10 and 100 ng of total RNA wereused for cDNA synthesis. Extraction and reverse transcrip-tion of RNA from inoculated bark of clones 409 and 589was made as described elsewhere [22].
2.3. Oligonucleotide primers used for transcript
quantification
Oligonucleotides were designed against H. annosum
transcripts [23] displaying sequence similarities to a-tubulin(TUB1), cellulase (CEL1), laccase (LAC1), superoxide
ARTICLE IN PRESS
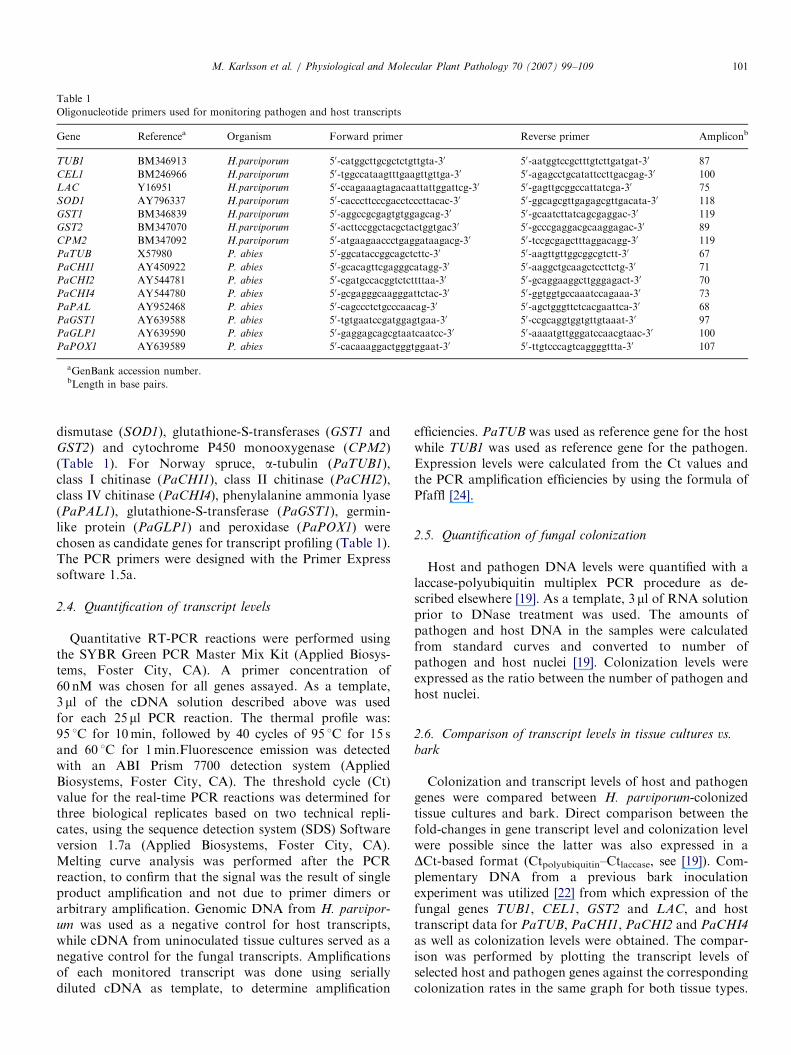
Table 1
Oligonucleotide primers used for monitoring pathogen and host transcripts
Gene Referencea Organism Forward primer Reverse primer Ampliconb
TUB1 BM346913 H.parviporum 50-catggcttgcgctctgttgta-30 50-aatggtccgctttgtcttgatgat-30 87
CEL1 BM246966 H.parviporum 50-tggccataagtttgaagttgttga-30 50-agagcctgcatattccttgacgag-30 100
LAC Y16951 H.parviporum 50-ccagaaagtagacaattattggattcg-30 50-gagttgcggccattatcga-30 75
SOD1 AY796337 H.parviporum 50-cacccttcccgacctcccttacac-30 50-ggcagcgttgagagcgttgacata-30 118
GST1 BM346839 H.parviporum 50-aggccgcgagtgtggagcag-30 50-gcaatcttatcagcgaggac-30 119
GST2 BM347070 H.parviporum 50-acttccggctacgctactggtgac30 50-gcccgaggacgcaaggagac-30 89
CPM2 BM347092 H.parviporum 50-atgaagaaccctgaggataagacg-30 50-tccgcgagctttaggacagg-30 119
PaTUB X57980 P. abies 50-ggcataccggcagctcttc-30 50-aagttgttggcggcgtctt-30 67
PaCHI1 AY450922 P. abies 50-gcacagttcgagggcatagg-30 50-aaggctgcaagctccttctg-30 71
PaCHI2 AY544781 P. abies 50-cgatgccacggtctcttttaa-30 50-gcaggaaggcttgggagact-30 70
PaCHI4 AY544780 P. abies 50-gcgagggcaagggattctac-30 50-ggtggtgccaaatccagaaa-30 73
PaPAL AY952468 P. abies 50-cagccctctgcccaacag-30 50-agctgggttctcacgaattca-30 68
PaGST1 AY639588 P. abies 50-tgtgaatccgatggagtgaa-30 50-ccgcaggtggtgttgtaaat-30 97
PaGLP1 AY639590 P. abies 50-gaggagcagcgtaatcaatcc-30 50-aaaatgttgggatccaacgtaac-30 100
PaPOX1 AY639589 P. abies 50-cacaaaggactgggtggaat-30 50-ttgtcccagtcaggggttta-30 107
aGenBank accession number.bLength in base pairs.
M. Karlsson et al. / Physiological and Molecular Plant Pathology 70 (2007) 99–109 101
dismutase (SOD1), glutathione-S-transferases (GST1 andGST2) and cytochrome P450 monooxygenase (CPM2)(Table 1). For Norway spruce, a-tubulin (PaTUB1),class I chitinase (PaCHI1), class II chitinase (PaCHI2),class IV chitinase (PaCHI4), phenylalanine ammonia lyase(PaPAL1), glutathione-S-transferase (PaGST1), germin-like protein (PaGLP1) and peroxidase (PaPOX1) werechosen as candidate genes for transcript profiling (Table 1).The PCR primers were designed with the Primer Expresssoftware 1.5a.
2.4. Quantification of transcript levels
Quantitative RT-PCR reactions were performed usingthe SYBR Green PCR Master Mix Kit (Applied Biosys-tems, Foster City, CA). A primer concentration of60 nM was chosen for all genes assayed. As a template,3 ml of the cDNA solution described above was usedfor each 25 ml PCR reaction. The thermal profile was:95 1C for 10min, followed by 40 cycles of 95 1C for 15 sand 60 1C for 1min.Fluorescence emission was detectedwith an ABI Prism 7700 detection system (AppliedBiosystems, Foster City, CA). The threshold cycle (Ct)value for the real-time PCR reactions was determined forthree biological replicates based on two technical repli-cates, using the sequence detection system (SDS) Softwareversion 1.7a (Applied Biosystems, Foster City, CA).Melting curve analysis was performed after the PCRreaction, to confirm that the signal was the result of singleproduct amplification and not due to primer dimers orarbitrary amplification. Genomic DNA from H. parvipor-
um was used as a negative control for host transcripts,while cDNA from uninoculated tissue cultures served as anegative control for the fungal transcripts. Amplificationsof each monitored transcript was done using seriallydiluted cDNA as template, to determine amplification
efficiencies. PaTUB was used as reference gene for the hostwhile TUB1 was used as reference gene for the pathogen.Expression levels were calculated from the Ct values andthe PCR amplification efficiencies by using the formula ofPfaffl [24].
2.5. Quantification of fungal colonization
Host and pathogen DNA levels were quantified with alaccase-polyubiquitin multiplex PCR procedure as de-scribed elsewhere [19]. As a template, 3 ml of RNA solutionprior to DNase treatment was used. The amounts ofpathogen and host DNA in the samples were calculatedfrom standard curves and converted to number ofpathogen and host nuclei [19]. Colonization levels wereexpressed as the ratio between the number of pathogen andhost nuclei.
2.6. Comparison of transcript levels in tissue cultures vs.
bark
Colonization and transcript levels of host and pathogengenes were compared between H. parviporum-colonizedtissue cultures and bark. Direct comparison between thefold-changes in gene transcript level and colonization levelwere possible since the latter was also expressed in aDCt-based format (Ctpolyubiquitin–Ctlaccase, see [19]). Com-plementary DNA from a previous bark inoculationexperiment was utilized [22] from which expression of thefungal genes TUB1, CEL1, GST2 and LAC, and hosttranscript data for PaTUB, PaCHI1, PaCHI2 and PaCHI4
as well as colonization levels were obtained. The compar-ison was performed by plotting the transcript levels ofselected host and pathogen genes against the correspondingcolonization rates in the same graph for both tissue types.
ARTICLE IN PRESSM. Karlsson et al. / Physiological and Molecular Plant Pathology 70 (2007) 99–109102
2.7. Statistical analyses
The experiment was designed as factorial with three fixedfactors, treatments (non-infected and infected tissue) clones(409 and 589) and sampling time (0, 6, 12, 24, 72 and 144 h)after inoculation. Clone was considered a fixed factor in theanalysis of variance. This three-factor model was used toanalyze whether transfer and inoculation of tissue culturesinduced host genes and whether there were any differencesin transcript levels between the inoculated clones. Theexperimental design was reduced to a two-factor modelwith clone and time as fixed factors when analyzing fungaltranscript levels. Each host and fungal transcript wassubjected to analysis of variance separately with the Mixedprocedure in SASTM [25]. Preplanned comparisons ofdifferences between least square means between clones ateach time point within treatments, and between time pointswithin each clone and treatment, were performed with the‘‘pdiff’’ option in the Mixed procedure [25]. Productmoment correlations between the various relative tran-script levels were computed with the Corr procedure inSASTM.
3. Results
3.1. Analysis of total RNA
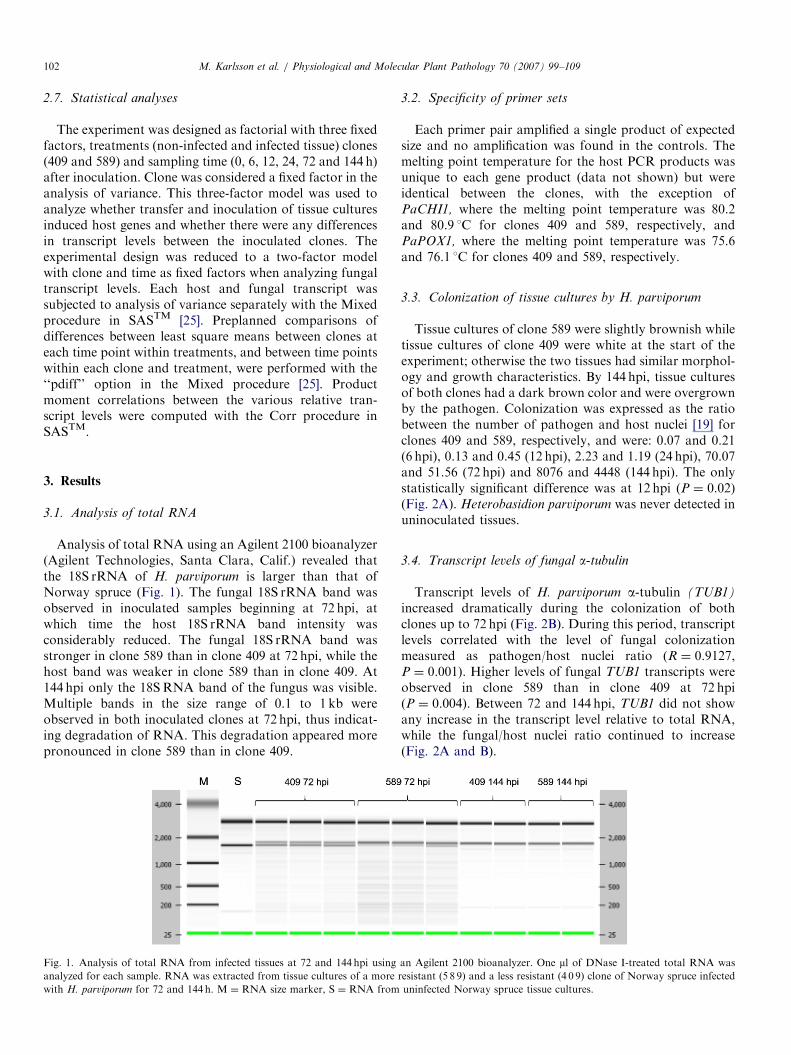
Analysis of total RNA using an Agilent 2100 bioanalyzer(Agilent Technologies, Santa Clara, Calif.) revealed thatthe 18S rRNA of H. parviporum is larger than that ofNorway spruce (Fig. 1). The fungal 18S rRNA band wasobserved in inoculated samples beginning at 72 hpi, atwhich time the host 18S rRNA band intensity wasconsiderably reduced. The fungal 18S rRNA band wasstronger in clone 589 than in clone 409 at 72 hpi, while thehost band was weaker in clone 589 than in clone 409. At144 hpi only the 18SRNA band of the fungus was visible.Multiple bands in the size range of 0.1 to 1 kb wereobserved in both inoculated clones at 72 hpi, thus indicat-ing degradation of RNA. This degradation appeared morepronounced in clone 589 than in clone 409.
Fig. 1. Analysis of total RNA from infected tissues at 72 and 144hpi using
analyzed for each sample. RNA was extracted from tissue cultures of a more
with H. parviporum for 72 and 144 h. M ¼ RNA size marker, S ¼ RNA from
3.2. Specificity of primer sets
Each primer pair amplified a single product of expectedsize and no amplification was found in the controls. Themelting point temperature for the host PCR products wasunique to each gene product (data not shown) but wereidentical between the clones, with the exception ofPaCHI1, where the melting point temperature was 80.2and 80.9 1C for clones 409 and 589, respectively, andPaPOX1, where the melting point temperature was 75.6and 76.1 1C for clones 409 and 589, respectively.
3.3. Colonization of tissue cultures by H. parviporum
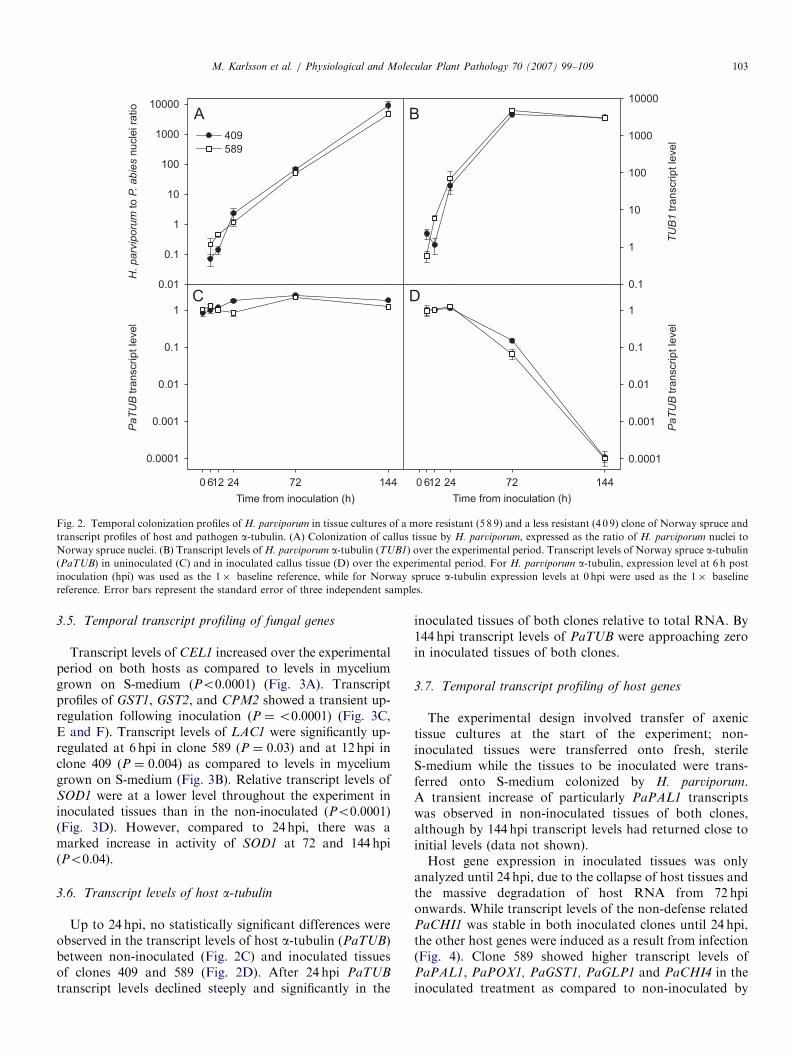
Tissue cultures of clone 589 were slightly brownish whiletissue cultures of clone 409 were white at the start of theexperiment; otherwise the two tissues had similar morphol-ogy and growth characteristics. By 144 hpi, tissue culturesof both clones had a dark brown color and were overgrownby the pathogen. Colonization was expressed as the ratiobetween the number of pathogen and host nuclei [19] forclones 409 and 589, respectively, and were: 0.07 and 0.21(6 hpi), 0.13 and 0.45 (12 hpi), 2.23 and 1.19 (24 hpi), 70.07and 51.56 (72 hpi) and 8076 and 4448 (144 hpi). The onlystatistically significant difference was at 12 hpi (P ¼ 0.02)(Fig. 2A). Heterobasidion parviporum was never detected inuninoculated tissues.
3.4. Transcript levels of fungal a-tubulin
Transcript levels of H. parviporum a-tubulin (TUB1)
increased dramatically during the colonization of bothclones up to 72 hpi (Fig. 2B). During this period, transcriptlevels correlated with the level of fungal colonizationmeasured as pathogen/host nuclei ratio (R ¼ 0.9127,P ¼ 0.001). Higher levels of fungal TUB1 transcripts wereobserved in clone 589 than in clone 409 at 72 hpi(P ¼ 0.004). Between 72 and 144 hpi, TUB1 did not showany increase in the transcript level relative to total RNA,while the fungal/host nuclei ratio continued to increase(Fig. 2A and B).
an Agilent 2100 bioanalyzer. One ml of DNase I-treated total RNA was
resistant (5 8 9) and a less resistant (4 0 9) clone of Norway spruce infected
uninfected Norway spruce tissue cultures.
ARTICLE IN PRESS
Time from inoculation (h)
0 612 24 72 144
PaT
UB
tra
nscript le
vel
0.0001
0.001
0.01
0.1
1
H. parv
iporu
m t
o P
. abie
s n
ucle
i ra
tio
0.01
0.1
1
10
100
1000
10000
TU
B1 tra
nscript le
vel
0.1
1
10
100
1000
10000
Time from inoculation (h)
0 612 24 72 144
PaT
UB
tra
nscript le
vel
0.0001
0.001
0.01
0.1
1
409
589
A B
C D
Fig. 2. Temporal colonization profiles of H. parviporum in tissue cultures of a more resistant (5 8 9) and a less resistant (4 0 9) clone of Norway spruce and
transcript profiles of host and pathogen a-tubulin. (A) Colonization of callus tissue by H. parviporum, expressed as the ratio of H. parviporum nuclei to
Norway spruce nuclei. (B) Transcript levels of H. parviporum a-tubulin (TUB1) over the experimental period. Transcript levels of Norway spruce a-tubulin(PaTUB) in uninoculated (C) and in inoculated callus tissue (D) over the experimental period. For H. parviporum a-tubulin, expression level at 6 h post
inoculation (hpi) was used as the 1� baseline reference, while for Norway spruce a-tubulin expression levels at 0 hpi were used as the 1� baseline
reference. Error bars represent the standard error of three independent samples.
M. Karlsson et al. / Physiological and Molecular Plant Pathology 70 (2007) 99–109 103
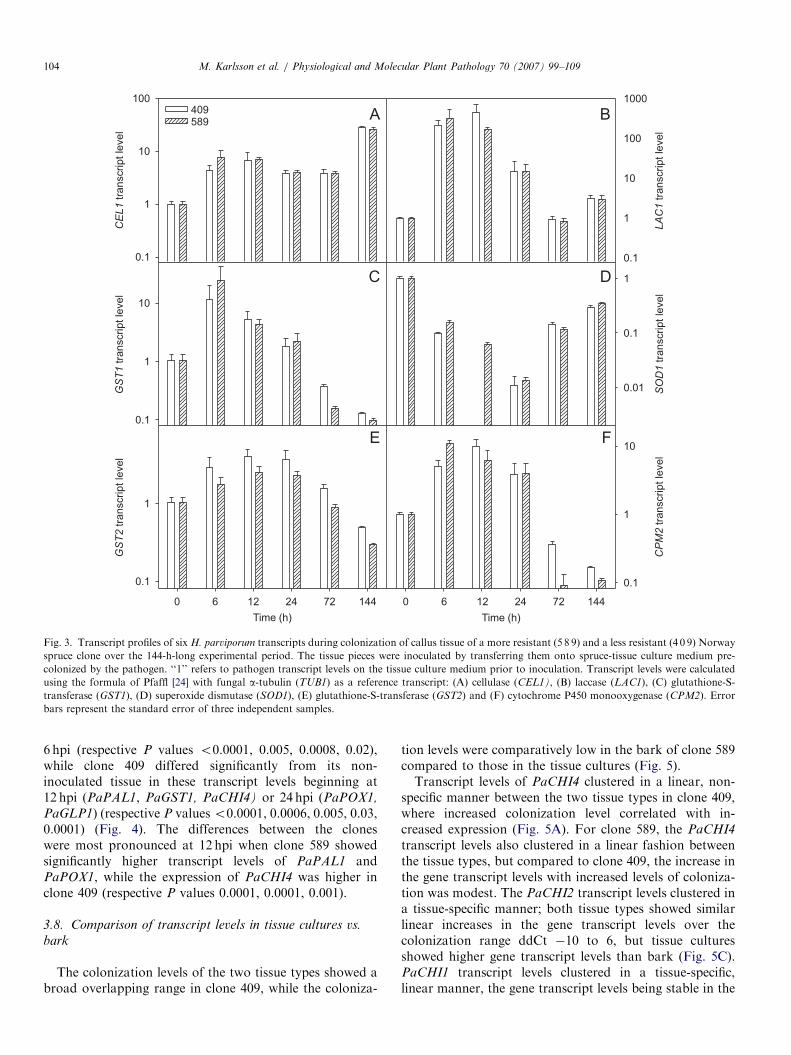
3.5. Temporal transcript profiling of fungal genes
Transcript levels of CEL1 increased over the experimentalperiod on both hosts as compared to levels in myceliumgrown on S-medium (Po0.0001) (Fig. 3A). Transcriptprofiles of GST1, GST2, and CPM2 showed a transient up-regulation following inoculation (P ¼o0.0001) (Fig. 3C,E and F). Transcript levels of LAC1 were significantly up-regulated at 6 hpi in clone 589 (P ¼ 0.03) and at 12hpi inclone 409 (P ¼ 0.004) as compared to levels in myceliumgrown on S-medium (Fig. 3B). Relative transcript levels ofSOD1 were at a lower level throughout the experiment ininoculated tissues than in the non-inoculated (Po0.0001)(Fig. 3D). However, compared to 24hpi, there was amarked increase in activity of SOD1 at 72 and 144 hpi(Po0.04).
3.6. Transcript levels of host a-tubulin
Up to 24 hpi, no statistically significant differences wereobserved in the transcript levels of host a-tubulin (PaTUB)between non-inoculated (Fig. 2C) and inoculated tissuesof clones 409 and 589 (Fig. 2D). After 24 hpi PaTUB
transcript levels declined steeply and significantly in the
inoculated tissues of both clones relative to total RNA. By144 hpi transcript levels of PaTUB were approaching zeroin inoculated tissues of both clones.
3.7. Temporal transcript profiling of host genes
The experimental design involved transfer of axenictissue cultures at the start of the experiment; non-inoculated tissues were transferred onto fresh, sterileS-medium while the tissues to be inoculated were trans-ferred onto S-medium colonized by H. parviporum.A transient increase of particularly PaPAL1 transcriptswas observed in non-inoculated tissues of both clones,although by 144 hpi transcript levels had returned close toinitial levels (data not shown).Host gene expression in inoculated tissues was only
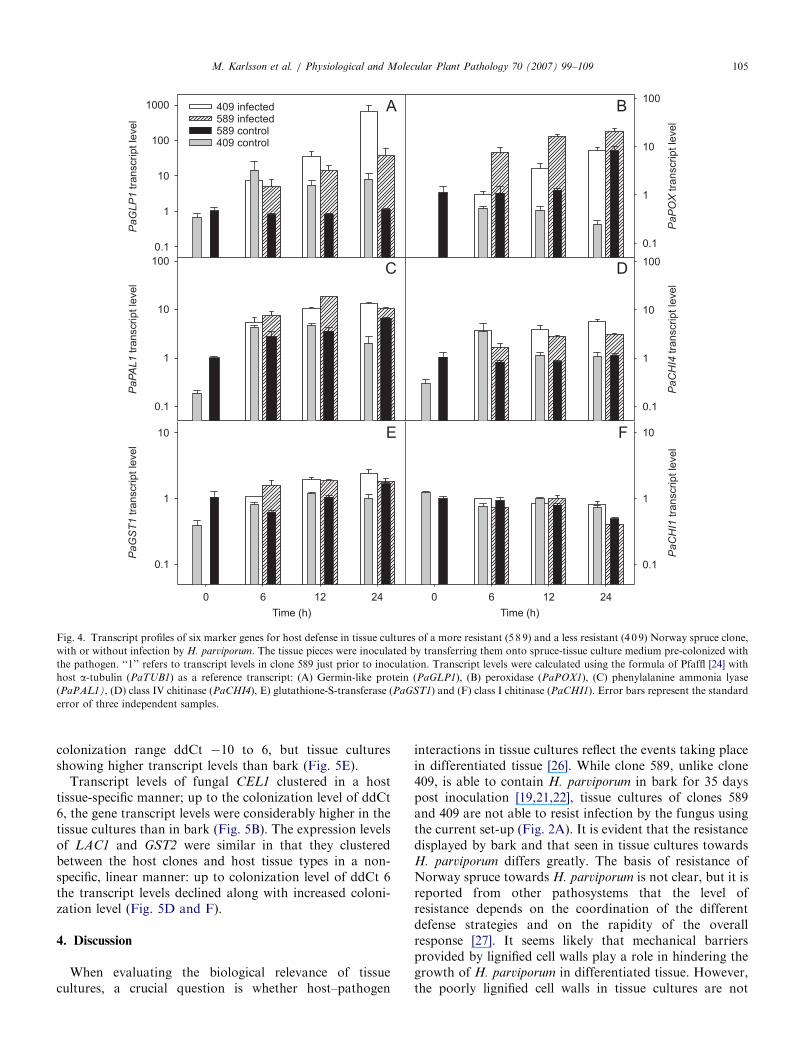
analyzed until 24 hpi, due to the collapse of host tissues andthe massive degradation of host RNA from 72 hpionwards. While transcript levels of the non-defense relatedPaCHI1 was stable in both inoculated clones until 24 hpi,the other host genes were induced as a result from infection(Fig. 4). Clone 589 showed higher transcript levels ofPaPAL1, PaPOX1, PaGST1, PaGLP1 and PaCHI4 in theinoculated treatment as compared to non-inoculated by
ARTICLE IN PRESS
CE
L1
tra
nscrip
t le
ve
l
0.1
1
10
100409589
LA
C1
tra
nscrip
t le
ve
l
0.1
1
10
100
1000
GS
T1 t
ran
scrip
t le
ve
l
0.1
1
10
Time (h)
0 6 12 24 72 144
GS
T2 t
ran
scrip
t le
ve
l
0.1
1
SO
D1
tra
nscrip
t le
ve
l
0.01
0.1
1
Time (h)
0 6 12 24 72 144
CP
M2
tra
nscrip
t le
ve
l
0.1
1
10
A B
C
E
D
F
Fig. 3. Transcript profiles of six H. parviporum transcripts during colonization of callus tissue of a more resistant (5 8 9) and a less resistant (4 0 9) Norway
spruce clone over the 144-h-long experimental period. The tissue pieces were inoculated by transferring them onto spruce-tissue culture medium pre-
colonized by the pathogen. ‘‘1’’ refers to pathogen transcript levels on the tissue culture medium prior to inoculation. Transcript levels were calculated
using the formula of Pfaffl [24] with fungal a-tubulin (TUB1) as a reference transcript: (A) cellulase (CEL1), (B) laccase (LAC1), (C) glutathione-S-
transferase (GST1), (D) superoxide dismutase (SOD1), (E) glutathione-S-transferase (GST2) and (F) cytochrome P450 monooxygenase (CPM2). Error
bars represent the standard error of three independent samples.
M. Karlsson et al. / Physiological and Molecular Plant Pathology 70 (2007) 99–109104
6 hpi (respective P values o0.0001, 0.005, 0.0008, 0.02),while clone 409 differed significantly from its non-inoculated tissue in these transcript levels beginning at12 hpi (PaPAL1, PaGST1, PaCHI4) or 24 hpi (PaPOX1,
PaGLP1) (respective P valueso0.0001, 0.0006, 0.005, 0.03,0.0001) (Fig. 4). The differences between the cloneswere most pronounced at 12 hpi when clone 589 showedsignificantly higher transcript levels of PaPAL1 andPaPOX1, while the expression of PaCHI4 was higher inclone 409 (respective P values 0.0001, 0.0001, 0.001).
3.8. Comparison of transcript levels in tissue cultures vs.
bark
The colonization levels of the two tissue types showed abroad overlapping range in clone 409, while the coloniza-
tion levels were comparatively low in the bark of clone 589compared to those in the tissue cultures (Fig. 5).Transcript levels of PaCHI4 clustered in a linear, non-
specific manner between the two tissue types in clone 409,where increased colonization level correlated with in-creased expression (Fig. 5A). For clone 589, the PaCHI4
transcript levels also clustered in a linear fashion betweenthe tissue types, but compared to clone 409, the increase inthe gene transcript levels with increased levels of coloniza-tion was modest. The PaCHI2 transcript levels clustered ina tissue-specific manner; both tissue types showed similarlinear increases in the gene transcript levels over thecolonization range ddCt �10 to 6, but tissue culturesshowed higher gene transcript levels than bark (Fig. 5C).PaCHI1 transcript levels clustered in a tissue-specific,linear manner, the gene transcript levels being stable in the
ARTICLE IN PRESS
Pa
PA
L1
tra
nscrip
t le
ve
l
0.1
1
10
100
Pa
PO
X tra
nscript le
vel
0.1
1
10
100
Time (h)
0 6 12 24
Pa
GS
T1
tra
nscrip
t le
ve
l
0.1
1
10
Pa
CH
I4 t
ran
scrip
t le
ve
l
0.1
1
10
100
Time (h)
0 6 12 24
Pa
CH
I1 t
ran
scrip
t le
ve
l
0.1
1
10
Pa
GL
P1
tra
nscrip
t le
ve
l
0.1
1
10
100
1000 409 infected589 infected589 control409 control
A B
C
E
D
F
Fig. 4. Transcript profiles of six marker genes for host defense in tissue cultures of a more resistant (5 8 9) and a less resistant (4 0 9) Norway spruce clone,
with or without infection by H. parviporum. The tissue pieces were inoculated by transferring them onto spruce-tissue culture medium pre-colonized with
the pathogen. ‘‘1’’ refers to transcript levels in clone 589 just prior to inoculation. Transcript levels were calculated using the formula of Pfaffl [24] with
host a-tubulin (PaTUB1) as a reference transcript: (A) Germin-like protein (PaGLP1), (B) peroxidase (PaPOX1), (C) phenylalanine ammonia lyase
(PaPAL1), (D) class IV chitinase (PaCHI4), E) glutathione-S-transferase (PaGST1) and (F) class I chitinase (PaCHI1). Error bars represent the standard
error of three independent samples.
M. Karlsson et al. / Physiological and Molecular Plant Pathology 70 (2007) 99–109 105
colonization range ddCt �10 to 6, but tissue culturesshowing higher transcript levels than bark (Fig. 5E).
Transcript levels of fungal CEL1 clustered in a hosttissue-specific manner; up to the colonization level of ddCt6, the gene transcript levels were considerably higher in thetissue cultures than in bark (Fig. 5B). The expression levelsof LAC1 and GST2 were similar in that they clusteredbetween the host clones and host tissue types in a non-specific, linear manner: up to colonization level of ddCt 6the transcript levels declined along with increased coloni-zation level (Fig. 5D and F).
4. Discussion
When evaluating the biological relevance of tissuecultures, a crucial question is whether host–pathogen
interactions in tissue cultures reflect the events taking placein differentiated tissue [26]. While clone 589, unlike clone409, is able to contain H. parviporum in bark for 35 dayspost inoculation [19,21,22], tissue cultures of clones 589and 409 are not able to resist infection by the fungus usingthe current set-up (Fig. 2A). It is evident that the resistancedisplayed by bark and that seen in tissue cultures towardsH. parviporum differs greatly. The basis of resistance ofNorway spruce towards H. parviporum is not clear, but it isreported from other pathosystems that the level ofresistance depends on the coordination of the differentdefense strategies and on the rapidity of the overallresponse [27]. It seems likely that mechanical barriersprovided by lignified cell walls play a role in hindering thegrowth of H. parviporum in differentiated tissue. However,the poorly lignified cell walls in tissue cultures are not

ARTICLE IN PRESS
Rela
tive P
aC
HI4
tra
nscript le
vel
4
6
8
10
Relative H. parviporum DNA level
-8 -6 -4 -2 0 2 4 6 8 10 12 14 -8 -6 -4 -2 0 2 4 6 8 10 12 14
Rela
tive P
aC
HI1
tra
nscript le
vel
-2
0
2
4
6
Rela
tive C
ellu
lase
tra
nscript le
vel
-6
-4
-2
0
2
Rela
tive L
accase
tra
nscript le
vel
-5
0
5
10
15
Relative H. parviporum DNA levelR
ela
tive G
ST
335
tra
nscript le
vel
-3
-2
-1
0
1
Rela
tive P
aC
HI2
tra
nscript le
vel
2
4
6
8
10
A B
C
E
D
F
Fig. 5. The relationship between the relative levels of H. parviporum DNA (calculated as dCt value of Norway spruce polyubiquitine gene – dCt value of
H. parviporum laccase gene) used as a measure of colonization and the relative levels of three Norway spruce transcripts (calculated as dCt value of
Norway spruce transcript assayed – dCt value of Norway spruce a-tubulin) and three H. parviporum transcripts (calculated as dCt value of H. parviporum
transcript assayed – dCt value of H. parviporum a-tubulin). Open circles represent data from inoculated callus of clone 409, closed circles represent bark
lesions of clone 409. Open triangles represent data from inoculated callus of clone 589, closed triangles represent bark lesions of clone 589. Panels A, C and
E show Norway spruce transcripts, while B, D and F show H. parviporum transcripts.
M. Karlsson et al. / Physiological and Molecular Plant Pathology 70 (2007) 99–109106
capable of hindering the pathogen colonization to theextent that allows the accumulation of defense-relatedproteins in the cells neighboring the initial infection point.
Another important issue when evaluating the biologicalrelevance of tissue cultures in host-pathogen interactionstudies is, whether inoculated tissue cultures show cellulardefense responses that reflect those of differentiated tissueupon pathogen challenge and, whether the active virulencefactors of the pathogen differ between host tissue types.Comparisons of colonization levels and transcript levels intissue cultures and bark of clones 409 and 589 revealed thatsome host and pathogen gene transcripts could showtissue-specific expression. For example, transcript levels of
the host chitinase PaCHI2 and the fungal cellulase CEL1
were lower in the bark than in tissue cultures at similarcolonization levels. However, the fold-changes in the levelsof all the examined host and pathogen transcripts weresimilar between tissue cultures and bark over their over-lapping colonization range. This suggests that tissuecultures can be used for studying candidate host defenseand fungal pathogenicity genes operating in tissuescomposed primarily of living cells, such as phloem, in theNorway spruce/H. parviporum pathosystem. However, itremains to be examined at which level the events takingplace in inoculated tissue cultures reflect those active inother important sites of defence reactions in trees, such as
ARTICLE IN PRESSM. Karlsson et al. / Physiological and Molecular Plant Pathology 70 (2007) 99–109 107
the interface between heartwood and sapwood. Thesetissues are composed primarily of dead xylem, but are alsothe location where formation of a phenol-rich, antifungalreaction zone takes place in response to colonization by thepathogen.
Invasion of plant tissues by the necrotrophic fungusBotrytis cinerea triggers processes indicative of pro-grammed cell death (PCD) at a distance from the hyphae[34], implying that diffusible factors have a direct orindirect phytotoxic activity. Necrotrophic behavior ofH. parviporum has been demonstrated e.g. by Lindbergand Johansson [35], who showed that in bark, necrosisexpands one to two cell layers ahead of the colonizinghyphae. The dramatic change in pathogen/host nuclearratios and rapid decline in host a-tubulin transcript levelsafter 24 hpi in tissue cultures, suggests massive host celldeath in both clones. This is consistent with the findings ofNagy et al. [28], who in a microscopy-based study showedthat colonization of tissue cultures of Norway spruce byH. parviporum results in extensive cell death at later stagesof infection.
The marker genes for host defense monitored in thepresent study, phenylalanine ammonia lyase, peroxidase,germin-like protein, glutathione-S-transferase and class IIand IV chitinases, have been implicated in plant defensesfollowing pathogen infection and wounding in numerousstudies [27,30]. One early feature of plant defense is anoxidative burst involving transient accumulation of hydro-gen peroxide at the surface of the affected plant cells. Thisis evident also for cell wall elicitors from H. parviporum,which elicit a transient release of hydrogen peroxide fromcultured Norway spruce cells in a dose-dependent manner[31]. Tenhaken et al. [32] showed that hydrogen peroxideacts as a diffusible signal for the induction of genesencoding cellular protectants, such as glutathione-S-trans-ferases [33], in neighboring cells. Induction of defense geneswas more rapid in the more resistant clone 589 than in theless resistant clone 409. Transcript levels of PaPAL,PaPOX1, PaGST1 and PaCHI4 were higher in inoculatedtissues compared to non-treated tissues as early as 6 hpi inclone 589, while clone 409 differed significantly from non-treated tissues beginning at 12–24 hpi. This finding isconsistent with our previous study which investigatedH. parviporum–inoculated bark of the two clones, wheretranscript levels of the class II and IV chitinases werehigher in areas immediately adjacent to the inoculation sitein clone 589 than in similar sites in clone 409, 3 days afterinoculation [22]. In that study, the difference between theclones was even more pronounced 2–6mm away from theinoculation point, where no infection was yet established,and we hypothesized that the clones differ in defense-related signal perception or transduction [21,22]. Alterna-tively, the difference between spruce clones could becorrelated to differences in the production of endogenousor exogenous elicitors.
Degradation of RNA was more severe in inoculatedtissue cultures of clone 589 than in clone 409 at 72 hpi. This
indicates that pathogen-related host cell death progressfaster in clone 589 than in clone 409, which is similar to thearea of necrosis formed adjacent to the site of inoculationin mature trees. The lower intensity of the 18S rRNA bandin clone 589 at 72 hpi is consistent with gene expressiondata; at this time the unnormalized transcript levels wereon average 2–4 times higher in clone 409 than in clone 589(data not shown). However, it is noteworthy that PaCHI4,a gene that has been proposed as a marker for programmedcell death in Norway spruce [36], showed higher transcriptlevels in clone 409 than in clone 589 at 24 hpi.Transcript levels of H. parviporum TUB1, the reference
gene used for normalization of transcript levels of fungalgenes, correlated with the accumulation of fungal biomassup to 72 hpi. Loss of correlation was observed between 72and 144 hpi, which can be a consequence of the massivehost cell death towards the end of the experiment.Alternatively, loss of correlation can also be explained byan accumulation of metabolically inactive fungal cells at144 hpi, as the expression of a-tubulin has previously beenshown to correlate with the amount of actively growingmycelium in the basidiomycete Amanita muscaria [29].The tolerance of necrotrophic pathogens to oxidative
stress has been hypothesized to involve the activity of ROS-scavenging enzymes such as superoxide dismutase (SOD),catalase and peroxidase [37]. The expression of SOD1 inthis study showed the highest activity in the 0 hpi control,followed by a rapid decrease in activity up to 24 hpi afterwhich a marked increase was detected in the gene transcriptlevel. A plausible explanation is that the SOD1-encodedprotein functions in protecting the fungal cell against O2
�
produced as a byproduct of oxidative metabolism. Thusthe activity should correlate with the nutritional status ofthe fungus, which is expected to be high during growth onS-medium and during growth on dead host cells in the laterstages of host colonization. This is consistent with results inwhich expression of SOD1 during fungal growth wasshown to be lower in spruce bark than during in vitrogrowth in carbon-rich medium [38].The fungal laccase and glutathione-S-transferase genes
showed a rapid induction in the early stages of hostcolonization, possibly indicating fungal detoxification ofhost produced secondary metabolites [15,39,40]. As mosthost cells are either dead or dying by 72 hpi, the subsequentdown-regulation of these genes during later stages ofcolonization could then be an indication of successfulfungal detoxification of the particular host-derived com-pounds that constitute the substrates of the enzymes.The transcript profile of CPM2, encoding a cytochrome
P450 enzyme, showed a peak in expression during the earlystages of the interaction, at 6, 12 and 24 hpi. CytochromeP450 enzymes have been shown to play important roles infungal pathogenesis, either in biosynthesis of toxins [41,42],or in the detoxification of phytoalexins [43]. WhetherCPM2 is involved in detoxification or in biosynthesis oftoxic compounds like the H. annosum s.l. toxin fomannoxin[44], or in other functions, needs further investigation.
ARTICLE IN PRESSM. Karlsson et al. / Physiological and Molecular Plant Pathology 70 (2007) 99–109108
Transcript levels of fungal CEL1 increased continuouslythroughout the experimental period as compared to growthon S-medium. This suggests that levels of easily availablenutrients such as glucose, which is known to repress thetranscription of cellulases in fungi [45], are relatively lowduring colonization and that the pathogenic fungus likelydegrades structural polysaccharides of plant cell walls toretrieve carbon.
Due to the great economic losses caused by H. parviporum,development of efficient control measures against thispathogen are warranted. Understanding the virulence factorsof the pathogen and defense reactions of the host wouldallow rational evaluation of the variation in diseaseresistance in the host population. This could lead to theestablishment of breeding programs targeted towards diseaseresistance. Our data suggest that the pathogen antioxidantsystems play an important role in the outcome of theinteraction. Our data also suggests that the rapidity ofhost responses may play a role in resistance. Our conclusionis that tissue cultures can function as a model systemfor sorting out candidate defense and virulence factorsoperating during the interaction between Norway spruce andH. parviporum.
Acknowledgments
The work carried out at the Norwegian Forest andLandscape Institute was supported by grants from theResearch Council of Norway (No.152867/I10). Additionalfinancial support by grants from FORMAS (23.0/2002-1658), Carl Tryggers Foundation (CTS 01:312) and EU(RESROBS, QLK5-CT-2000-00241) are acknowledged.We thank Leslie Paul for linguistic revision and twoanonymous reviewers for constructive criticism on themanuscript.
References
[1] Niemela T, Korhonen K. Taxonomy of the Genus Heterobasidion. In:
Woodward S, Stenlid J, Karjalainen R, Huttermann A, editors.
Heterobasidion annosum biology, ecology, impact and control. CAB
International; 1998. p. 27–33.
[2] Stenlid J, Swedjemark G. Differential growth of S-isolates and P-
isolates of Heterobasidion annosum in Picea abies and Pinus sylvestris.
Trans Brit Mycol Soc 1988;90:209–13.
[3] Korhonen K, Stenlid J. Biology of Heterobasidion annosum. In:
Woodward S, Stenlid J, Karjalainen R, Huttermann A, editors.
Heterobasidion annosum biology, ecology, impact and control. CAB
International; 1998. p. 43–70.
[4] Capretti P, Korhonen K, Mugnai L, Romagnoli C. An intersterility
group of Heterobasidion annosum specialized to Abies alba. Eur J For
Path 1990;20:231–40.
[5] Chase TE, Ullrich RC. Sexuality, distribution, and dispersal of
Heterobasidion annosum in pine plantations of Vermont. Mycologia
1983;75:825–31.
[6] Stenlid J. Population structure of Heterobasidion annosum as
determined by somatic incompatibility, sexual incompatibility, and
isoenzyme patterns. Can J Bot 1985;63:2268–73.
[7] Stenlid J. Controlling and predicting the spread of Heterobasidion
annosum from infected stumps and trees of Picea abies. Scan J For
Res 1987;2:187–98.
[8] Kuhlman EG. Inoculation of Loblolly pine seedlings with Fomes
annosus in the greenhouse. Can J Bot 1969;47:2079–82.
[9] Swedjemark G, Stenlid J. Susceptibility of conifer and broadleaf
seedlings to Swedish S-strain and P-strain of Heterobasidion annosum.
Plant Pathol 1995;44:73–9.
[10] Swedjemark G, Stenlid J. Between-tree and between-isolate variation
for growth of S-group Heterobasidion annosum in sapwood of Picea
abies cuttings. Can J For Res 1997;27:711–5.
[11] Delatour G, von Weissenberg K, Dimitri L. Host resistance. In:
Woodward S, Stenlid J, Karjalainen R, Huttermann A, editors.
Heterobasidion annosum biology, ecology, impact and control. CAB
International; 1998. p. 143–66.
[12] Swedjemark G, Stenlid J, Karlsson B. Genetic variation among
clones of Picea abies in resistance to growth of Heterobasidion
annosum. Silv Genet 1998;46:369–74.
[13] Shain L. The response of sapwood of Norway spruce to infection by
Fomes annosus. Phytopathology 1971;61:301–7.
[14] Cerny G. Hemmung einiger ektoenzyme von Fomes annosus (Fr.)
Cke. durch holz- und bastextrakte aus Picea abies (Karst). Eur J For
Path 1973;3:214–20.
[15] Popoff T, Theander O, Johansson M. Changes in sapwood of roots
of Norway spruce, attacked by Fomes annosus Part II. Organic
chemical constituents and their biological effects. Physiol Plant
1975;34:347–56.
[16] Johansson M, Popoff T, Theander O. Effect of spruce root
constituents on extracellular enzymes of Fomes annosus. Physiol
Plant 1976;37:275–82.
[17] Bendz-Hellgren M, Stenlid J. Long-term reduction in the diameter
growth of butt rot affected Norway spruce, Picea abies. For Ecol
Manage 1995;74:239–43.
[18] Kvaalen H, Solheim H. Co-inoculation of Ceratocystis polonica and
Heterobasidion annosum with callus of two Norway spruce clones
with different in vivo susceptibility. Plant Cell Tissue Org Cult
2000;60:221–8.
[19] Hietala AM, Eikenes M, Kvaalen H, Solheim H, Fossdal CG.
Multiplex real-time PCR for monitoring Heterobasidion annosum
colonization in Norway spruce clones that differ in disease resistance.
Appl Environ Microbiol 2003;69:4413–20.
[20] Hahlbrock K, Bednarek P, Ciolkowski I, Hamberger B, Heise A,
Liedgens H, et al. Non-self recognition, transcriptional reprogram-
ming, and secondary metabolite accumulation during plant/pathogen
interactions. Proc Natl Acad Sci USA 2003;100:14569–76.
[21] Fossdal CG, Hietala AM, Kvaalen H, Solheim H. Changes in host
chitinase isoforms in relation to wounding and colonization by
Heterobasidion annosum: early and strong defense response in 33-
year-old resistant Norway spruce clone. Tree Physiol 2006;26:169–77.
[22] Hietala AM, Kvaalen H, Schmidt A, Johnk N, Solheim H, Fossdal
CG. Temporal and spatial profiles of chitinase expression by Norway
spruce in response to bark colonization by Heterobasidion annosum.
Appl Environ Microbiol 2004;70:3948–53.
[23] Karlsson M, Olson A, Stenlid J. Expressed sequences from the
basidiomycetous tree pathogen Heterobasidion annosum during early
infection of Scots pine. Fungal Genet Biol 2003;39:51–9.
[24] Pfaffl M. A new mathematical model for relative quantification in
real-time RT-PCR. Nucleic Acids Res 2001;29:2002–7.
[25] SAS. 1996. SAS Institute Inc. SAS/STATr Software: changes and
enhancements thorough release 6.11. Cary, NC.
[26] Daub ME. Tissue culture and selection of resistance to pathogens.
Ann Rev Phytopathol 1986;24:159–86.
[27] Kombrink E, Somssich IE. Defense responses of plants to pathogens.
Adv Bot Res 1995;21:1–34.
[28] Nagy NE, Franschechi VR, Kvaalen H, Solheim H. Callus cultures
and bark from Norway spruce clones show similar cellular features
and relative resistance to fungal pathogens. Trees Struct Func
2005;19:695–703.
ARTICLE IN PRESSM. Karlsson et al. / Physiological and Molecular Plant Pathology 70 (2007) 99–109 109
[29] Tarkka M, Schrey S, Nehls U. The a-tubulin gene AmTuba1: a
marker for rapid mycelial growth in the ectomycorrhizal basidiomy-
cete Amanita muscaria. Curr Genet 2006;49:294–301.
[30] Collinge DB, Kragh KM, Mikkelsen JD, Nielsen KK, Rasmussen U,
Vad K. Plant Chitinases. Plant J 1993;3:31–40.
[31] Schwacke R, Hager A. Fungal elicitors induce a transient
release of active oxygen species from cultured spruce cells that is
dependent on Ca2+ and protein kinase activity. Planta 1992;187:
136–41.
[32] Tenhaken R, Levine A, Brisson LF, Dixon RA, Lamb C. Function of
the oxidative burst in hypersensitive disease resistance. Proc Natl
Acad Sci USA 1995;92:4158–63.
[33] Frova C. The plant glutathione transferase gene family: genomic
structure, functions, expression and evolution. Physiol Plant
2003;119:469–79.
[34] Govrin EM, Levine A. The hypersensitive response facilitates plant
infection by the necrotrophic pathogen Botrytis cinerea. Curr Biol
2000;10:751–7.
[35] Lindberg M, Johansson M. Resistance of Picea abies seedlings to
infection by Heterobasidion annosum in relation to drought stress. Eur
J For Path 1992;22:115–24.
[36] Wiweger M, Farbos I, Ingouff M, Lagercrantz U, von Arnold
S. Expression of Chia4-Pa chitinase genes during somatic and zygotic
embryo development in Norway spruce (Picea abies): similarities and
differences between gymnosperm and angiosperm class IV chitinases.
J Exp Bot 2003;54:2691–9.
[37] Mayer A, Staples R, Gil-ad N. Mechanisms of survival of
necrotrophic fungal plant pathogens in hosts expressing the
hypersensitive response. Phytochemistry 2001;58:33–41.
[38] Karlsson M, Stenlid J, Olson A. Identification of a superoxide
dismutase gene from the conifer pathogen Heterobasidion annosum.
Physiol Mol Plant Pathol 2005;66:99–107.
[39] Haars A, Chet I, Huttermann A. Effect of phenolic compounds and
tannin on growth and laccase activity of Fomes annosus. Eur J For
Path 1981;11:67–76.
[40] Pocsi I, Prade RA, Penninckx MJ. Glutathione, altruistic metabolite
in fungi. Adv Microb Physiol 2004;49:1–76.
[41] Bradshaw R, Bhatnagar D, Ganley R, Gillman C, Monahan B,
Seconi J. Dothistroma pini, a forest pathogen, contains homologs of
aflatoxin biosynthetic pathway genes. Appl Environ Microbiol
2002;68:2885–92.
[42] Gardiner DM, Cozijnsen AJ, Wilson LM, Pedras MSC, Howlett BJ.
The sirodesmin biosynthetic gene cluster of the plant pathogenic
fungus Leptosphaeria maculans. Mol Microbiol 2004;53:1307–18.
[43] Wasmann CC, VanEtten HD. Transformation-mediated chromo-
some loss and disruption of a gene for pisatin demethylase decrease
the virulence of Nectria haematococca on pea. Mol Plant Microbe
Interact 1996;9:793–803.
[44] Hirotani M, O’Reilly J, Donnelly DMX, Polonsky J. Fomannoxin—
a toxic metabolite of Fomes annosus. Tetrahedron Lett 1977;18:651–2.
[45] Tomme P, Warren AJ, Gilkes NR. Cellulose hydrolysis by bacteria
and fungi. Adv Microb Physiol 1995;37:1–81.