
Quantification and Prediction of Biomass Yield of Temperate Low-Input High-Diversity Ecosystems
33
1 Quantification and prediction of biomass yield of temperate Low-Input High- 1 Diversity ecosystems 2 3 Koenraad Van Meerbeek 1 , Jonathan Van Beek 2 , Lore Bellings 1 , Wim Aertsen 1 , Bart Muys 1 4 and Martin Hermy 1 5 6 1 Division Forest, Nature and Landscape, Department of Earth and Environmental 7 Sciences, University of Leuven, Leuven, Belgium 8 2 M3-BIORES, Geomatics Lab, Departement of Biosystems, University of Leuven, Leuven, 9 Belgium 10 11 Correspondence: Koenraad Van Meerbeek, tel. +32 16 372 189, fax +32 16 329 760, e- 12 mail: [email protected] 13 14 15
-
Upload
independent -
Category
Documents
-
view
0 -
download
0
Transcript of Quantification and Prediction of Biomass Yield of Temperate Low-Input High-Diversity Ecosystems

1
Quantification and prediction of biomass yield of temperate Low-Input High-1
Diversity ecosystems 2
3
Koenraad Van Meerbeek1, Jonathan Van Beek2, Lore Bellings1, Wim Aertsen1, Bart Muys1 4
and Martin Hermy1 5
6
1 Division Forest, Nature and Landscape, Department of Earth and Environmental 7
Sciences, University of Leuven, Leuven, Belgium 8
2 M3-BIORES, Geomatics Lab, Departement of Biosystems, University of Leuven, Leuven, 9
Belgium 10
11
Correspondence: Koenraad Van Meerbeek, tel. +32 16 372 189, fax +32 16 329 760, e-12
mail: [email protected] 13
14
15

2
Abstract 16
Little is known about the biomass production and bioenergy potential of Low-Input High-17
Diversity (LIHD) systems in temperate non-forest conservation areas. In order to assess the 18
potential of the biomass for energetic or other purposes, accurate yield data from LIHD 19
systems are needed. We quantified the biomass yield in a wide range of semi-natural 20
systems (grasslands, marshes, tall-herb vegetation and heathlands). Our results show a 21
considerable variation in annual biomass yield ranging between 0.69 and 6.49 tDM ha-1 yr-1. 22
In addition, we provide an accurate method to determine the standing stock of harvestable 23
biomass in the field. We developed four predictive models: one multiple linear regression 24
(MLR) model and three boosted regression tree (BRT) models: (i) a vegetation model with 25
variables that are easy to measure in the field, (ii) a soil model with soil physical and 26
chemical variables and (iii) a vegsoil model with all available variables. Due to its ability 27
to fit non-linear response functions and threshold values, the boosted regression tree 28
technique outperformed the classical multiple linear regression. The vegetation model is 29
the preferred model, because it combines a good predictive performance (R²adj = 0.75 and 30
R²adjCV = 0.51) with a relatively simple application. 31
Keywords: bioenergy; boosted regression trees; LIHD; nature conservation; nature 32
reserves; predictive modelling; semi-natural areas; standing crop 33

3
Introduction 34
35
To date, the main focus of biomass production for bioenergy lies on conventional food 36
crops and lignocellulosic crops like poplar and Miscanthus [1,2]. These systems are called 37
High-Input Low-Diversity (HILD) systems because the high level of inputs such as water, 38
fertilizers, pesticides and low levels of biodiversity [3]. Bioenergy crops are usually grown 39
on fertile lands which therefore can no longer be used for food or fodder production. Food 40
and fodder crops are also increasingly used as a source for bioenergy, which forces their 41
prices upwards [4]. The resulting demand for land leads directly and indirectly to the 42
exploitation of new land for agriculture [5]. The environmental impact of these systems is 43
increasingly criticized [6,7], although the strategy of land sparing can decrease the pressure 44
of crop production on natural habitats [8]. In the search for other biomass sources, the last 45
decade Low-Input High-Diversity (LIHD) systems came into the picture [e.g. 3]. LIHD 46
systems receive little or no additional input and contain a high level of biodiversity. Recent 47
studies showed that LIHD biomass is promising for the production of bioenergy. Low-48
input biofuels potentially provide higher NEB ratios (Net Energy Balance ratio: ratio 49
between the sum of energy outputs and the sum of fossil energy inputs) compared to food-50
based biofuels [3,9]. Till recently, the emphasis of LIHD biofuel research was mostly on 51
grasslands sown on agriculturally degraded and abandoned lands [10-13]. 52
A lot of the European nature has its origin in traditional land-uses [14,15]. Because of the 53
long co-evolution of European landscapes, human activities and species, a lot of the 54
species-rich ecosystems depend on some kind of management to be preserved [16]. These 55
systems are therefore called semi-natural [14]. Because of the intensification of the land-56
use and abandonment of marginal lands, many of the semi-natural ecosystems are 57
threatened in their existence [17,18]. The key strategy to preserve these species-rich 58

4
ecosystems has been the establishment of protected areas, with an active conservation 59
management, based on the continuation of traditional agriculture practices like mowing or 60
grazing [14,15,17-19]. Many of the species-rich grasslands, heathlands and marshes in 61
conservation areas are thus being mowed to prevent succession and maintain the open 62
character [14,15,19]. Although this management produces each year a large amount of 63
biomass, nature conservation areas are commonly forgotten in biomass resource potential 64
assessments [20]. Because no fertilizers are applied and because of the late harvest date in 65
conservation areas, the forage quality is often low and therefore not used for livestock 66
production [21-23]. In some cases, the clippings originating from the management are 67
therefore even considered as a “waste product”, to which an extra cost is connected [24-68
27]. Subsequently, little is known about the biomass and bioenergy potential of the 69
different plant communities in conservation areas. To assess this potential, we need 70
accurate data on the biomass yield of semi-natural LIHD systems. As floristic variation in 71
LIHD systems is large, estimates of standing biomass per plant community are preferable. 72
Harvesting has been the most frequently used technique for the determination of the 73
standing biomass in grasslands and shrublands [28], which is rather time-consuming and 74
therefore expensive [29]. Moreover, it is a destructive technique and therefore not suitable 75
for monitoring the standing biomass. As an alternative, different non-destructive methods 76
have been proposed based on measurements in the field, remote sensing or other 77
environmental data [e.g. 30]. These methods often need local calibration and are not 78
universally applicable. 79
80
The first objective of this study was to quantify the average biomass yield in different 81
semi-natural plant communities in nature conservation areas in the temperate climate zone 82
of Western Europe. The collected data will be used to develop empirical models of the 83

5
standing biomass in the LIHD plant communities. We hypothesized that with these models, 84
the standing stock of harvestable biomass can be predicted and monitored in the field in a 85
quick, non-destructive and reliable manner [cf. 29]. By providing accurate data on the 86
average biomass yield in a wide range of plant communities, our study delivers 87
information for future biomass potential assessments and can be considered as an essential 88
intermediate step to scale up the data to a broader, regional scale (e.g. Europe). 89
90

6
Material and methods 91
92
Study area and data collection 93
94
This study was performed in Flanders, the northern part of Belgium, Western Europe 95
(range: 50°41’14”-51°30’18” N; 2°32’43”-5°54’38” E). The region is characterized by a 96
pronounced north-south soil texture gradient of decreasing sand and increasing silt 97
fractions resulting in different ecoregions. The climate is maritime temperate, with 98
significant precipitation in all seasons, a mean annual temperature of 9.8-10.5 °C and mean 99
annual precipitation of 733-832 mm [31]. In this densely populated region [466 inhabitants 100
km-1, 32] and in many areas of temperate Europe, the key strategy for protecting the 101
remaining biodiversity has been the establishment of a network of protected areas. No 102
fertilizers are applied within the boundaries of the protected areas, but as in large parts of 103
Europe, the study area is subjected to a relatively high atmospheric nitrogen deposition 104
[33], e.g. on average 25 kg N hectare-1 in 2009 [32]. 105
106
We focused on a wide range of semi-natural plant communities in protected areas with a 107
periodic mowing regime: dry and wet grasslands, reed marshes, tall-herb vegetation and 108
heathlands. From 2009 to 2011, 135 sites in nature reserves across the different ecoregions 109
in Flanders were sampled once (Fig. 1). The vegetation surveys spanned three consecutive 110
years to incorporate the yearly variability of biomass production within the different plant 111
communities. The surveys occurred from June till mid-October, corresponding to the 112
mowing period as implemented in the field to maintain or restore biodiversity. Each site 113
was sampled just prior to the date of management on that site to give an accurate 114
estimation of the harvestable biomass. The timing of mowing is usually based on the 115

7
reproduction stage of the present characteristic and rare species (key species) and does not 116
necessarily correspond to the timing of optimal biomass yield. 117
At each site, a plot of 10x10 m was positioned in homogeneous vegetation. Therein three 118
subplots of 0.5x0.5 m were taken randomly forming a composite sample. Within each 119
subplot, a detailed vegetation survey was performed: the % cover of each plant species was 120
visually estimated. Also total cover of the vegetation, average height with or without 121
inflorescences were recorded. In each subplot, the aboveground biomass was clipped, 122
harvested and weighed to determine the fresh weight (precision 0.1 g). Afterwards, the 123
biomass was oven-dried in a Binder drying oven at a temperature of 105 °C to constant 124
weight to obtain the dry weight. Per plot, a topsoil sample (0-15 cm) was analyzed to 125
determine the following soil variables: soil texture, pH-KCl, total and Kjeldahl nitrogen, 126
total and organic carbon content and plant-available amounts of other macronutrients (P, 127
K, Mg, Ca, Na) (for more details about methods see supporting information; Online 128
Resource 1). The soil drainage class is derived from the soil map of the Flemish Region 129
[34]. An overview of the measured and calculated vegetation and soil variables is given in 130
Table 1. Plant species nomenclature follows Van Landuyt et al. [35]. 131
132
Vegetation classification 133
134
Vegetation relevés were classified into plant communities using PC-ORD 6 [36]. After 135
transforming the abundance data (arcsine square root), the plots were clustered using 136
hierarchical clustering with the Sørensen distance measurement and flexible beta linkage 137
(β = -0.25) as group linkage method [37]. Indicator Species Analysis (ISA) indicated the 138
optimal number of groups in the cluster analysis [38]. 139
140

8
Biomass yield 141
142
Per plot, the fresh and dry weight of the harvested biomass were averaged over the three 143
subplots to get one value for each plot. In the yearly mown plant communities like 144
grasslands, the annual biomass yield is calculated as the mean of the measured standing 145
biomass of the plots within the plant community (in tons dry matter hectare-1 year-1), with 146
the standard deviation as a variance measure. In a number of plant communities the length 147
of the mowing interval (the mowing cycle) is more than one year in order to preserve a 148
particular vegetation type [39]. For example, heathlands are mown approximately every 15 149
years to let the vegetation pass all phases of its life cycle [40]. Reed and humid tall-herb 150
communities are optimally mown every 3 to 5 years [19,41]. For each of the multi-151
annually mown communities, we sampled the standing biomass at different phases of their 152
life cycle. Because of the limited time frame of the study, we used this space-for-time 153
substitution to analyze the evolution of the standing biomass during the life cycle. We 154
performed, per vegetation type, a log-linear regression between standing biomass and the 155
number of years since last mowing (Online Resource 2). The biomass yield per mowing 156
cycle (i.e. the standing biomass at the end of a mowing cycle) was then predicted based on 157
the regression function and the 95% confidence interval was used as a measure of 158
dispersion from the mean. The mean annual yield could be calculated by dividing the 159
obtained value by the number of years of the mowing cycle. In the case of abandoned and 160
unmanaged grasslands the optimal yearly management regime was not applied for several 161
years. From a conservation viewpoint a nature manager usually wants to transform these 162
degraded grasslands into more species-rich herbaceous plant communities by reinstalling 163
the yearly mowing cycle. For these communities we assumed that the optimal mowing 164
cycle of one year was reinstalled. 165
9
166
Modelling of standing biomass 167
168
In recent years, a variety of linear and non-parametric modelling techniques has been 169
developed and applied to predict ecological response variables from a wide range of 170
environmental variables. Aertsen et al. [42] compared the performance of five modelling 171
techniques for the prediction of forest site productivity in a multi-criteria analysis with 172
different model performance measures, ecological interpretability and user-friendliness as 173
criteria. From these techniques, we selected boosted regression trees (BRT), based on its 174
accuracy and ability to fit non-linear response functions and threshold values, which is 175
crucial in modelling the non-linear behavior of ecological processes [42,43]. Because user 176
friendliness and practical use in the field were important goals of the predictive model, 177
multiple linear regression (MLR) was also selected to model the standing biomass. 178
179
BRT incorporates important advantages of regression tree-based methods, including the 180
capacity of combining predictor variables of different types and distributions, the 181
automatic detection of predictor interactions and the capacity of handling missing values 182
based on ‘surrogate’ splitting [42]. The method is also invariant to monotonic 183
transformations of the predictor variables and is insensible to outliers as they are isolated 184
into a separate node and therefore have no further effect on the analysis. The boosting 185
technique is a numerical optimization algorithm that minimizes the loss function by 186
calculating a sequence of regression trees. In each step, a tree is added that best reduces the 187
loss function [44,45]. The final BRT model is a linear combination of all calculated trees 188
(hundreds to thousands). 189

10
We developed BRT models (R-code and user guide available in Online Resource 3) with 190
(i) vegetation variables that are easy to measure in the field, (ii) the soil physical and 191
chemical variables and (iii) all available variables, further referred to as the vegetation 192
model, the soil model and the vegsoil model. BRT models were constructed in R 2.15.3 193
[46], using the functions developed by Elith et al. [45], as an extension of the ‘gbm’ 194
package [47]. The models were fitted with the gbm.step function and a Gaussian response 195
type (aimed at minimizing squared error). The number of nodes in a tree was set to 3, as 196
recommended by Elith et al. [45] for small datasets and most effective settings for learning 197
rate (0.001-0.005) and bag fraction (0.75) were found by repeated trial-and-error. Models 198
were simplified by reducing the number of explanatory variables with the gbm.simplify 199
function. The simplification process was run within a 10-fold cross-validation procedure, 200
progressively simplifying the model. The average cross-validation error was used to decide 201
the number of variables that can be removed from the original model without affecting 202
predictive performance [45]. The predicted contribution of the predictor variables is a 203
measure of the predictor’s importance within the model and can be calculated as the 204
proportional contribution to the total error reduction. Predictor effects are visualized in 205
partial dependence plots and indicate how much the response is affected by a certain 206
predictor value, after accounting for the average effects of all other variables in the model. 207
[43,45]. Most important pairwise interactions were explored using the gbm.interactions 208
function. 209
The MLR model was constructed in R using the stepAIC function of the MASS-package 210
for selecting the most important predictor variables from the suite of vegetation variables 211
[48]. Like the vegetation BRT model, only variables that are easy to measure in the field 212
were included. All MLR and BRT models had an acceptable level of multicollinearity 213
between predictor variables (i.e. Pearson correlations between predictors <0.7, individual 214

11
variance inflation factor (VIF) <5 and median VIF <3). Model fit and predictive 215
performance after 10-fold cross-validation were quantified by the coefficient of 216
determination (R²), the adjusted R² (R²adj), the root mean squared error (RMSE), the 217
relative RMSE (rRMSE = RMSE / mean response) and the AIC (Akaike information 218
criterion) [42,49]. Cross-validation was preferred to split-sample techniques because it 219
offers the possibility to use all the data for fitting and validating the model [50]. 220
Particularly in small data sets, cross-validation is proven to be more robust and reliable 221
[51-53]. 222
223

12
Results 224
225
The cluster analysis was successful in capturing well-known phytosociological patterns 226
present in the data (Fig. 2). Based on the indicator species analysis, we chose to cut the 227
dendrogram at two points to obtain a classification with two hierarchical levels (dashed 228
and dotted lines, Fig. 2). This allowed us to select the appropriate grouping level for each 229
analysis. The first level contains 7 groups, namely reed marsh, tall-herb vegetation, wet 230
grasslans, mesotrophic grassland, dune slack, low productive grassland on sandy soils and 231
heathland. This level was used as a variable in the predictive modelling. In the second 232
level, we obtained a finer division into 12 plant communities, of which significant 233
indicator species and corresponding EUNIS (European Nature Information System) [54] 234
habitat types are given as supporting information (Online Resource 4). Per group we 235
calculated the mean annual yield and the standing biomass at the end of the mowing cycle. 236
The distribution of the samples over the different plant communities is shown in Table 2. 237
Within the yearly mown plant communities, tall-sedge dominated wetlands and the 238
abandoned and unmanaged grasslands had the highest annual yield (6.07-6.49 tDM ha-1 yr-1, 239
Table 2). The low productive grasslands had the lowest (2.59-2.69 tDM ha-1 yr-1). Wet and 240
dry heathlands had an average yield per mowing cycle of 10.35-15.28 tDM ha-1 and an 241
annual yield of 0.69-1.02 tDM ha-1 yr-1 (Table 2). 242
243
The vegsoil BRT model had the highest performance on the fitted data as well as after 244
cross-validation (R²adj for fit and cross validation of 0.81 and 0.55, Table 3). The height of 245
the vegetation (without inflorescences) and the number of years since last mowing 246
contributed most to the model (41.2% and 27.7%, Fig. 3). The cover of graminoid species 247
(without reed) was also a strong predictor of the standing biomass, together with the plant 248

13
community (level 1 grouping variable) and the total carbon content of the soil. The 249
vegetation model contained the same variables as the vegsoil model, except for the total 250
carbon content of the soil (Fig. 4). While only incorporating easy-to-measure variables, it 251
almost achieved an equally high performance as the vegsoil model (R²adj cross-validation 252
= 0.51). The soil model performed considerably less well (Table 3). It scored the worst of 253
the three BRT models on all model performance indicators (R², R²adj, RMSE, rRMSE and 254
AIC). Incorporated predictors were total carbon content of the soil (30%), plant-available 255
potassium (27.3%), pH-KCl (24.9%) and plant-available sodium (17.8%, Fig. 5). Most 256
important interactions between predictor variables as detected by the BRT technique are 257
visualized in Online Resource 5. 258
The final MLR model was a log linear model with height without inflorescences (Hwi), 259
years since last mowing (years SLM), date of harvest and sum of cover as predictors (eq. 1, 260
see Table 1 for the description of the variables). The MLR model performed well on the 261
goodness-of-fit (R²adj = 0.56), but had a low predictive performance (R²adj cross-262
validation = 0.23). Still, it scored better than the soil model on all performance indicators. 263
264
log10(standing biomass) = -0.31933 + 0.57284 * log(Hwi) + 0.00141 * sum of cover – 0.00105 265
* date + 0.77781 * HL * log(years SLM) - 0.13809 * HL * log(Hwi) 266
+ 0.23090 * THV * log(years SLM) (eq. 1) 267
where HL = 1 for heathlands and 0 for other plant communities 268
THV = 1 for tall-herb vegetation and 0 for other plant communities 269
270

14
Discussion 271
272
Biomass yield 273
274
The results show a considerable variation in annual biomass yield of temperate semi-275
natural LIHD systems ranging between 0.69 and 6.49 tDM ha-1 yr-1 (Table 2). The highest 276
annual yield was found in abandoned and unmanaged grasslands on rich soils. For 277
communities with a multi-annual mowing cycle, the annual biomass yield is calculated as 278
the biomass yield per mowing cycle divided by the length of the mowing cycle. Because 279
the seasonal decomposition of plant material is not taken into account, the values will 280
deviate from the net primary productivity [cf. 55]. The biomass yield per mowing cycle is 281
the biomass that can really be harvested and varies between 2.59 tDM ha-1 for dry acid and 282
neutral grasslands with Agrostis (MC = 1 year) and 15.28 tDM ha-1 for sub-Atlantic dry 283
heathlands (MC = 15 years). 284
Other research on LIHD systems reported comparable yields. In the USA, researchers 285
found 3.49-4.75 tDM ha-1 yr-1 on lands that are set aside under the Conservation Reserve 286
Program [CRP, 13] and an average of 3.7 tDM ha-1 yr-1 on degraded land were multispecies 287
mixtures were sown [3]. In Germany, six extensively managed grasslands had a yield 288
between 2.0 and 4.5 tDM ha-1 yr-1 [56]. As expected, the biomass production is substantially 289
lower compared to most HILD crops (e.g. 15 tDM ha-1 yr-1 for an intensively managed 290
grassland and 22 tDM ha-1 yr-1 for maize) [57], but LIHD biofuels provide a higher net 291
energy balance, as they require a lower amount of inputs [3]. 292
293
Little research has been done on the long-term effects of biomass removal on biomass 294
yield in LIHD ecosystems. Nutrients are removed during harvest and because no fertilizers 295
15
are applied in the conservation areas, it can lead to a depletion of nutrients in the system. 296
Bakker [58] reported an amount of 15-150 kg nitrogen per hectare removed by hay in 297
semi-natural plant communities. But the study area is subjected to a relatively high 298
atmospheric nitrogen deposition [32]. Bobbink et al. [59] found an increased biomass 299
production in different semi-natural ecosystems with N inputs (15-40 kg N ha-1) that 300
equaled the rates of the atmospheric deposition in the study area. Also, the effects of 301
biomass removal differ between communities and depend on the soil conditions and the 302
history of the management [58,60]. So, overall it is difficult to assess the long-term effects 303
on biomass yield. To incorporate some of this variability, we sampled sites with different 304
histories of biomass removal. Some sites were mown for a longer time without 305
fertilization, other sites were just recently subjected to conservation management. The 306
long-term effects are thus partly reflected in the variance of the mean annual yield. 307
308
Predictive models of standing biomass 309
310
We developed four predictive models of the standing biomass: one multiple linear 311
regression (MLR) model and three boosted regression tree (BRT) models. The vegsoil 312
model outperformed the other models, both in terms of goodness-of-fit and validation (R², 313
RMSE, rRMSE). Even when model complexity was taken into account, it remained the 314
best model (R²adj, AIC). However, it had higher values of the relative RMSE, which could 315
be caused by measurement errors, sampling bias or limitations in field data collection [43]. 316
The vegetation height without inflorescences and the number of years since last mowing 317
were the most important predictors of the vegsoil model. This is not surprising because the 318
height is a volume indicator and the number of years is an indicator of biomass 319
accumulation. The cover of graminoid species, the plant community (level 1) and the total 320

16
carbon content of the soil contributed each about 10% to the model. The high standing 321
biomass at low cover percentage of graminoids can be explained by the fact that graminoid 322
cover is low in heathlands and tall-herb vegetation which have high standing biomass. 323
Unexpected is the absence of soil drainage class as a predictor in the vegsoil model. The 324
effect of this variable is probably already largely incorporated in the plant community 325
variable. 326
The vegetation model is the same as the vegsoil model, except for the variable total carbon 327
content of the soil and consequently does not lose much of its predictive power (R²adj for 328
fit and cross validation of 0.75 and 0.51). It is the most cost-effective model to predict the 329
standing biomass in the field, because it only includes variables that are easy to measure on 330
the field. The predictive performance of the soil model was considerably less. The high 331
contribution of the total carbon content and soil acidity (pH-KCl) to the model was not 332
unexpected. Both variables also show a strong interaction with each other. Low carbon 333
content or high soil acidity result in lower biomass productivity. Plant-available potassium 334
and sodium completed the model. The unexpected absence of the nitrogen content in the 335
model is due to the high correlation between carbon and nitrogen content of the soil (r = 336
0.78, P<0.001). 337
The log-linear multiple regression model incorporated log(height), sum of cover and 338
log(years since last mowing) for heathland and tall-herb vegetation. Also the date of 339
harvest had a significant influence on standing biomass. At the end of the growing season, 340
standing biomass is reduced by death of plant parts and allocation of nutrients to 341
belowground parts. The final model had a reasonably good fit of the data (R²adj = 0.56), 342
but a less predictive performance (R²adj cross-validation= 0.23). It still performed better 343
than the soil model. 344
345

17
With an R²adj ranging from 0.52 to 0.81, our models perform relatively good compared to 346
other biomass yield studies [cf. 43,61]. But inevitably, our models still result in prediction 347
errors and could undoubtedly be improved by collecting more field data. Our models are 348
calibrated and validated for the region of Flanders. Based on similar climatic conditions, 349
soil types and plant communities in adjacent regions (e.g. lowlands of N-France, the UK, 350
the Netherlands and Germany), our models may have a broader geographic applicability. 351
The boosted regression trees technique has several advantages that make it especially 352
suitable for ecological research [42,45]. The major drawback of the BRT models is the 353
absence of a model function on paper that can be directly used in practice, as provided by 354
the MLR technique. The latter has the advantage of being very straightforward, user-355
friendly and easy to use in the field. But due to the simplicity of the technique, the model 356
compromised on its predictive performance and did not succeed very well in predicting 357
real-world ecological processes [cf. 45]. Overall, the vegetation model is the preferred 358
model, because of the combination of a good predictive performance and a relatively 359
simple application. 360

18
Conclusion 361
362
The studied semi-natural LIHD systems in temperate conservation areas had a considerable 363
variation in annual biomass yield ranging between 0.69 and 6.49 tDM ha-1 yr-1. Unlike 364
HILD systems, the biomass yield of these LIHD systems does not conflict with other 365
ecosystem services like biodiversity conservation, erosion control, carbon sequestration 366
and clean water production [62]. Management practices in conservation areas can be 367
compatible with fauna by delayed mowing or leaving uncut areas as a refuge [63-65]. The 368
conversion of biomass from conservation areas to bioenergy or materials is an opportunity 369
to reconcile biodiversity goals and energy policies and is also an incentive to preserve the 370
protection on the land [63]. 371
Given the vast areas of LIHD systems (e.g. ca. 6.8 million ha of the 13.8 million ha of CRP 372
land in the USA [66] or 385-473 million ha of abandoned agricultural land for the world 373
[10]) the potential of LIHD biomass is enormous. However, LIHD biomass is often widely 374
scattered and discontinuously available [56,67], making that biomass transport and 375
handling often is a great challenge and a limiting factor to the profitability of bioenergy 376
systems [20]. Network optimization and supply chain management are increasingly used 377
for the development of efficient bioenergy networks [68]. Accurate data and monitoring of 378
biomass availability in LIHD systems are essential for a correct dimensioning and location 379
of conversion plants and to allow the integration of LIHD biomass into the biomass-to-380
bioenergy supply chain. With predictive models and data on biomass production in a wide 381
range of semi-natural plant communities in conservation areas, we provide detailed 382
information to fill existing gaps in knowledge. Our research also paves the way for 383
biomass potential assessments and upscaling of the data to a broader, regional scale (e.g. 384
Europe). 385

19
Acknowledgements 386
We would like to thank Natuurpunt vzw and the Agency of Nature and Forestry (ANB) of 387
the Flemish government for the access to the nature reserves and Andreas Demey for the 388
permission to sample his permanent plots. The comments and suggestions of the 389
anonymous reviewers were greatly acknowledged. Research funded by a Ph.D. grant of the 390
Agency for Innovation by Science and Technology (IWT). 391
392

20
References 393
394
1. Hu F, Ragauskas A (2012) Pretreatment and Lignocellulosic Chemistry. BioEnergy Research 5 (4):1043-395 1066. doi:10.1007/s12155-012-9208-0 396
2. Bauen A, Berndes G, Junginger M, Londo M, Vuille F (2009) Bioenergy - A sustainable and reliable 397 energy source. A review of status and prospects. IEA Bioenergy, 398
3. Tilman D, Hill J, Lehman C (2006) Carbon-negative biofuels from low-input high-diversity grassland 399 biomass. Science 314 (5805):1598-1600. doi:10.1126/science.1133306 400
4. Headey D, Fan S (2008) Anatomy of a crisis: The causes and consequences of surging food prices. 401 International Food Policy Research Institute (IFPRI), 402
5. Searchinger T, Heimlich R, Houghton RA, Dong F, Elobeid A, Fabiosa J, Tokgoz S, Hayes D, Yu TH 403 (2008) Use of U.S. croplands for biofuels increases greenhouse gases through emissions from land-use 404 change. Science 319 (5867):1238-1240. doi:10.1126/science.1151861 405
6. Dauber J, Jones MB, Stout JC (2010) The impact of biomass crop cultivation on temperate biodiversity. 406 GCB Bioenergy 2 (6):289-309. doi:10.1111/j.1757-1707.2010.01058.x 407
7. Eggers J, Tröltzsch K, Falcucci A, Maiorano L, Verburg PH, Framstad E, Louette G, Maes D, Nagy S, 408 Ozinga WIM, Delbaere BEN (2009) Is biofuel policy harming biodiversity in Europe? GCB Bioenergy 1 409 (1):18-34. doi:10.1111/j.1757-1707.2009.01002.x 410
8. Phalan B, Onial M, Balmford A, Green RE (2011) Reconciling Food Production and Biodiversity 411 Conservation: Land Sharing and Land Sparing Compared. Science 333 (6047):1289-1291. doi:DOI 412 10.1126/science.1208742 413
9. Hill J, Nelson E, Tilman D, Polasky S, Tiffany D (2006) Environmental, economic, and energetic costs 414 and benefits of biodiesel and ethanol biofuels. Proc Natl Acad Sci U S A 103 (30):11206-11210. 415 doi:10.1073/pnas.0604600103 416
10. Campbell JE, Lobell DB, Genova RC, Field CB (2008) The Global Potential of Bioenergy on Abandoned 417 Agriculture Lands. Environmental Science & Technology 42 (15):5791-5794. doi:10.1021/es800052w 418
11. Nijsen M, Smeets E, Stehfest E, van Vuuren DP (2012) An evaluation of the global potential of 419 bioenergy production on degraded lands. GCB Bioenergy 4 (2):130-147. doi:10.1111/j.1757-420 1707.2011.01121.x 421
12. Jungers JM, Fargione JE, Sheaffer CC, Wyse DL, Lehman C (2013) Energy Potential of Biomass from 422 Conservation Grasslands in Minnesota, USA. PLoS One 8 (4):e61209. doi:10.1371/journal.pone.0061209 423
13. Gillitzer P, Wyse D, Sheaffer C, Taff S, Lehman C (2013) Biomass production potential of grasslands in 424 the oak savanna region of Minnesota, USA. BioEnergy Research 6 (1):131-141. doi:10.1007/s12155-012-425 9233-z 426
14. Ostermann OP (1998) The need for management of nature conservation sites designated under Natura 427 2000. Journal of Applied Ecology 35 (6):968-973. doi:10.1111/j.1365-2664.1998.tb00016.x 428
15. Plieninger T, Hochtl F, Spek T (2006) Traditional land-use and nature conservation in European rural 429 landscapes. Environ Sci Policy 9 (4):317-321. doi:DOI 10.1016/j.envsci.2006.03.001 430
16. Hampicke U (2006) Efficient conservation in Europe's agricultural countryside: Rationale, methods and 431 policy reorientation. Outlook on Agriculture 35 (2):97-105. doi:10.5367/000000006777641598 432

21
17. Halada L, Evans D, Romão C, Petersen J-E (2011) Which habitats of European importance depend on 433 agricultural practices? Biodivers Conserv 20 (11):2365-2378. doi:10.1007/s10531-011-9989-z 434
18. Bignal EM, McCracken DI (2000) The nature conservation value of European traditional farming 435 systems. Environmental Reviews 8 (3):149 436
19. Muller S (2002) Appropriate agricultural management practices required to ensure conservation and 437 biodiversity of environmentally sensitive grassland sites designated under Natura 2000. Agr Ecosyst Environ 438 89 (3):261-266. doi:Pii S0167-8809(01)00235-3 439 Doi 10.1016/S0167-8809(01)00235-3 440
20. Chum H, Faaij A, Moreira J, Berndes G, Dhamija P, Dong H, Gabrielle B, Goss Eng A, Lucht W, 441 Mapako M, Masera Cerutti O, McIntyre T, Minowa T, Pingoud K (2011) Bioenergy. In: Edenhofer O, Pichs-442 Madruga R, Sokona Y et al. (eds) IPCC Special Report on Renewable Energy Sources and Climate Change 443 Mitigation. Cambridge University Press, Cambridge, United Kingdom and New York, NY, USA, 444
21. Cop J, Vidrih M, Hacin J (2009) Influence of cutting regime and fertilizer application on the botanical 445 composition, yield and nutritive value of herbage of wet grasslands in Central Europe. Grass and Forage 446 Science 64 (4):454-465. doi:DOI 10.1111/j.1365-2494.2009.00713.x 447
22. Bovolenta S, Spanghero M, Dovier S, Orlandi D, Clementel F (2008) Chemical composition and net 448 energy content of alpine pasture species during the grazing season. Anim Feed Sci Tech 140 (1-2):164-177. 449 doi:DOI 10.1016/j.anifeedsci.2007.02.002 450
23. Fiems LO, De Boever JL, De Vliegher A, Vanacker JM, De Brabander DL, Carlier L (2004) Agri-451 environmental grass hay: Nutritive value and intake in comparison with hay from intensively managed 452 grassland. Arch Anim Nutr 58 (3):233-244 453
24. Britton AJ, Marrs RH, Carey PD, Pakeman RJ (2000) Comparison of techniques to increase Calluna 454 vulgaris cover on heathland invaded by grasses in Breckland, south east England. Biological Conservation 95 455 (3):227-232. doi:Doi 10.1016/S0006-3207(00)00047-1 456
25. Niemeyer M, Niemeyer T, Fottner S, Hardtle W, Mohamed A (2007) Impact of sod-cutting and 457 choppering on nutrient budgets of dry heathlands. Biological Conservation 134 (3):344-353. doi:DOI 458 10.1016/j.biocon.2006.07.013 459
26. Kahmen S, Poschlod P, Schreiber KF (2002) Conservation management of calcareous grasslands. 460 Changes in plant species composition and response of functional traits during 25 years. Biological 461 Conservation 104 (3):319-328. doi:Pii S0006-3207(01)00197-5 462 Doi 10.1016/S0006-3207(01)00197-5 463
27. Corton J, Bühle L, Wachendorf M, Donnison IS, Fraser MD (2013) Bioenergy as a biodiversity 464 management tool and the potential of a mixed species feedstock for bioenergy production in Wales. 465 Bioresour Technol 129 (0):142-149. doi:http://dx.doi.org/10.1016/j.biortech.2012.11.001 466
28. Sala OE, Austin AT (2000) Methods of estimating aboveground net primary productivity. In: Sala OE, 467 Jackson RB, Mooney HA, Howarth RW (eds) Methods in Ecosystem Science. Springer, New York, Berlin, 468 Heidelberg, pp 31-43 469
29. Flombaum P, Sala OE (2007) A non-destructive and rapid method to estimate biomass and aboveground 470 net primary production in arid environments. Journal of Arid Environments 69 (2):352-358. doi:DOI 471 10.1016/j.jaridenv.2006.09.008 472
30. Byrne KM, Lauenroth WK, Adler PB, Byrne CM (2011) Estimating Aboveground Net Primary 473 Production in Grasslands: A Comparison of Nondestructive Methods. Rangeland Ecol Manag 64 (5):498-474 505. doi:10.2111/rem-d-10-00145.1 475
31. Peel MC, Finlayson BL, McMahon TA (2007) Updated world map of the Köppen-Geiger climate 476 classification. Hydrol Earth Syst Sci 11 (5):1633-1644. doi:10.5194/hess-11-1633-2007 477

22
32. Van Steertegem M, Bossuyt M, Brouwers J, De Geest C, Dewolf N, Overloop S, Peeters B, Struyf I, Van 478 Hooste H, Vancraeynest L, Vander Putten E (2012) MIRA Indicator report 2012. VMM, 479
33. Stevens CJ, Duprè C, Dorland E, Gaudnik C, Gowing DJG, Bleeker A, Diekmann M, Alard D, Bobbink 480 R, Fowler D, Corcket E, Mountford JO, Vandvik V, Aarrestad PA, Muller S, Dise NB (2010) Nitrogen 481 deposition threatens species richness of grasslands across Europe. Environmental Pollution 158 (9):2940-482 2945. doi:http://dx.doi.org/10.1016/j.envpol.2010.06.006 483
34. AGIV (2001) Soil map of the Flemish Region. Ghent 484
35. Van Landuyt W, Hoste I, Vanhecke L, Van den Bremt P, Vercruysse W, De Beer D (2006) Atlas van de 485 Flora van Vlaanderen en het Brussels gewest. Nationale Plantentuin en het Instituut voor Natuur- en 486 Bosonderzoek i.s.m. Flo.Wer vzw, 487
36. McCune B, Mefford MJ (2011) PC-ORD. Multivariate analysis of ecological data. Version 6. MjM 488 Software, Gleneden Beach, Oregon, USA 489
37. McCune B, Grace JB (2002) Analysis of ecological communities. MjM Software Design, Gleneden 490 Beach, Oregon, USA 491
38. Dufrene M, Legendre P (1997) Species assemblages and indicator species: The need for a flexible 492 asymmetrical approach. Ecological Monographs 67 (3):345-366. doi:Doi 10.2307/2963459 493
39. Bakker JP, Berendse F (1999) Constraints in the restoration of ecological diversity in grassland and 494 heathland communities. Trends Ecol Evol 14 (2):63-68. doi:Doi 10.1016/S0169-5347(98)01544-4 495
40. Webb NR (1980) Management and Conservation of Heathlands - Synthesis. Bulletin D'Ecologie 11 (3-496 4):655-658 497
41. Tyler GA, Smith KW, Burges DJ (1998) Reedbed management and breeding bitterns Botaurus stellaris in 498 the UK. Biological Conservation 86 (2):257-266. doi:Doi 10.1016/S0006-3207(97)00174-2 499
42. Aertsen W, Kint V, van Orshoven J, Ozkan K, Muys B (2010) Comparison and ranking of different 500 modelling techniques for prediction of site index in Mediterranean mountain forests. Ecological Modelling 501 221 (8):1119-1130. doi:DOI 10.1016/j.ecolmodel.2010.01.007 502
43. Aertsen W, Kint V, De Vos B, Deckers J, Van Orshoven J, Muys B (2012) Predicting forest site 503 productivity in temperate lowland from forest floor, soil and litterfall characteristics using boosted regression 504 trees. Plant Soil 354 (1-2):157-172. doi:DOI 10.1007/s11104-011-1052-z 505
44. De'ath G (2007) Boosted trees for ecological modeling and prediction. Ecology 88 (1):243-251. doi:Doi 506 10.1890/0012-9658(2007)88[243:Btfema]2.0.Co;2 507
45. Elith J, Leathwick JR, Hastie T (2008) A working guide to boosted regression trees. J Anim Ecol 77 508 (4):802-813. doi:DOI 10.1111/j.1365-2656.2008.01390.x 509
46. R Development Core Team (2012) R: A language and environment for statistical computing. 2.15.3 edn. 510 R Foundation for Statistical Computing, Vienna, Austria 511
47. Ridgeway G (2013) Generalized boosted models: a guide to the gbm package. 512
48. Ripley B, Venables B, Hornik K, Gebhardt A, Firth D (2013) Support Functions and Datasets for 513 Venables and Ripley’s MASS. 514
49. Akaike H (1974) A new look at the statistical model identification. Automatic Control, IEEE 515 Transactions on 19 (6):716-723. doi:10.1109/tac.1974.1100705 516
50. Araujo MB, Whittaker RJ, Ladle RJ, Erhard M (2005) Reducing uncertainty in projections of extinction 517 risk from climate change. Global Ecol Biogeogr 14 (6):529-538. doi:DOI 10.1111/j.1466-822x.2005.00182.x 518

23
51. Hawkins DM, Basak SC, Mills D (2003) Assessing model fit by cross-validation. J Chem Inf Comp Sci 519 43 (2):579-586. doi:Doi 10.1021/Ci025626i 520
52. Stone M (1974) Cross-Validatory Choice and Assessment of Statistical Predictions. J R Stat Soc B 36 521 (2):111-147 522
53. Maggini R, Lehmann A, Zimmermann NE, Guisan A (2006) Improving generalized regression analysis 523 for the spatial prediction of forest communities. J Biogeogr 33 (10):1729-1749. doi:DOI 10.1111/j.1365-524 2699.2006.01465.x 525
54. European Nature Information System (2012) European Environment Agency. 526
55. Amthor JS, Baldocchi DD (2001) Terrestrial Higher Plant Respiration and Net Primary Production. In: 527 Roy J, Saugier B, Mooney HA (eds) Terrestrial Global Productivity. Academic Press, pp 33-59 528
56. Tonn B, Thumm U, Claupein W (2010) Semi-natural grassland biomass for combustion: influence of 529 botanical composition, harvest date and site conditions on fuel composition. Grass and Forage Science 65 530 (4):383-397. doi:10.1111/j.1365-2494.2010.00758.x 531
57. Loomis RS, Connor DJ (1992) Crop Ecology: productivity and management in agricultural systems. 532 Cambridge University Press 533
58. Bakker JP (1989) Nature management by grazing and cutting : on the ecological significance of grazing 534 and cutting regimes applied to restore former species-rich grassland communities in the Netherlands. Kluwer 535 Academic Publishers, Dordrecht ; Boston 536
59. Bobbink R, Ashmore M, Braum S, Fluckinger W, Van den Wyngaert IJJ (2003) Empirical nitrogen 537 critical loads for natural and semi-natural ecosystems: 2002 update. In: Achermann B, Bobbink R (eds) 538 Empirical Critical Loads for Nitrogen, Environmental Documentation No. 164. Swiss Agency for 539 Environment, Forest and Landscape SAEFL, Berne, 540
60. Jenkinson DS, Potts JM, Perry JN, Barnett V, Coleman K, Johnston AE (1994) Trends in herbage yields 541 over the last century on the Rothamsted Long-term Continuous Hay Experiment. The Journal of Agricultural 542 Science 122 (03):365-374. doi:doi:10.1017/S0021859600067290 543
61. Martin RC, Astatkie T, Cooper JM, Fredeen AH (2005) A comparison of methods used to determine 544 biomass on naturalized swards. J Agron Crop Sci 191 (2):152-160. doi:DOI 10.1111/j.1439-545 037X.2004.00145.x 546
62. Egoh B, Rouget M, Reyers B, Knight AT, Cowling RM, van Jaarsveld AS, Welz A (2007) Integrating 547 ecosystem services into conservation assessments: A review. Ecological Economics 63 (4):714-721. 548 doi:http://dx.doi.org/10.1016/j.ecolecon.2007.04.007 549
63. Fargione JE, Cooper TR, Flaspohler DJ, Hill J, Lehman C, Tilman D, McCoy T, McLeod S, Nelson EJ, 550 Oberhauser KS (2009) Bioenergy and Wildlife: Threats and Opportunities for Grassland Conservation. 551 BioScience 59 (9):767-777. doi:10.1525/bio.2009.59.9.8 552
64. Humbert JY, Ghazoul J, Walter T (2009) Meadow harvesting techniques and their impacts on field fauna. 553 Agr Ecosyst Environ 130 (1-2):1-8. doi:DOI 10.1016/j.agee.2008.11.014 554
65. Perkins AJ, Maggs HE, Wilson JD, Watson A (2013) Delayed mowing increases corn bunting Emberiza 555 calandra nest success in an agri-environment scheme trial. Agriculture, Ecosystems & Environment 181 556 (0):80-89. doi:http://dx.doi.org/10.1016/j.agee.2013.09.010 557
66. Walsh M, de la Torre Ugarte D, Shapouri H, Slinsky S (2003) Bioenergy Crop Production in the United 558 States: <i>Potential Quantities, Land Use Changes, and Economic Impacts on the Agricultural 559 Sector</i>. Environmental and Resource Economics 24 (4):313-333. doi:10.1023/a:1023625519092 560

24
67. de Wit M, Junginger M, Lensink S, Londo M, Faaij A (2010) Competition between biofuels: Modeling 561 technological learning and cost reductions over time. Biomass and Bioenergy 34 (2):203-217. 562 doi:http://dx.doi.org/10.1016/j.biombioe.2009.07.012 563
68. De Meyer A, Cattrysse D, Van Orshoven J (n.d.) Optimisation methods for the design and logistics of 564 biomass-for-bioenergy supply chains: A literature review. Working paper 565 566 567

25
Tables 568
569
Table 1 List of measured and calculated soil and vegetation variables 570
Soil variables
Soil texture Code
Clay fraction Soil fraction < 2 µm (%)
Loam fraction Soil fraction 2-50 µm (%)
Sand fraction Soil fraction > 50 µm (%)
Soil drainage Soil drainage condition (classes)
pH-KCl Soil acidity (KCl)
Phosporus Plant-available phosphorus (mg/100 g air dry soil)
Potassium Plant-available potassium (mg/100 g air dry soil)
Magnesium Plant-available magnesium (mg/100 g air dry soil)
Calcium Plant-available calcium (mg/100 g air dry soil)
Sodium Plant-available sodium (mg/100 g air dry soil)
Kjeldahl nitrogen Total Kjeldahl nitrogen (mg/100 g air dry soil)
Total carbon Total carbon content (% of air dried soil)
Vegetation variables
Years SLM Years since last mowing
Date Date of sampling (number of the day: 1-365)
Species diversity (S) Number of species per plot
Simpson diversity (D) 1/∑𝑝𝑖2
𝑛
𝑖
Simpson evenness (ED) D/S
Shannon diversity (H) −∑ 𝑝𝑖ln 𝑝𝑖𝑛
𝑖
Shannon evenness (EH) H/ln S
Dry weight Standing biomass (ton dry matter/ha)
Cover of graminoids Sum of cover of graminoid species without reed (%)
Cover of reed Sum of cover of reed (%)
Cover of legumes Sum of cover of leguminous species (%)
Cover of non-leguminous forbs Sum of cover of non-leguminous species (%)
Cover of woody species Sum of cover of woody species (%)
Sum cover (Csum) Sum of cover of all species (%)
Total cover (Ctot) Total cover of vegetation per plot (%)
Height without inflorescences (Hwi) Height of the vegetation without inflorescences (cm)
Total height (Htot) Maximum height of vegetation (cm)
Volume (Hwi*Csum) Volume (Height without inflorescences *Sum cover) (m³/m²)
Volume (Htot*Csum) Volume (Total height*Sum cover) (m³/m²)
Volume (Hwi*Ctot) Volume (Height without inflorescences*Total cover) (m³/m²)
Volume (Htot*Ctot) Volume (Total height*Total cover) (m³/m²)
571

26
Table 2 The two-level classification of the plant communities with the optimal mowing cycle, the mowing period, biomass yield per 572
mowing cycle (tDM ha-1 mowing cycle-1) and annual biomass yield (tDM ha-1 year-1). For yearly mown communities, the standard deviation is the 573
variance measure, for multiannual mown communities the 95% confidence interval of the regression is used (see Online Resource 2). The 574
mowing cycle (MC) is the length of the mowing interval (in years). Detailed information on the level 2 classification plant communities is given 575
in Online Resource 4. 576
Level 1 classification Level 2 classification Mowing
cycle
Mowing
period
Biomass yield
per mowing cycle
(tDM ha-1 MC-1)
Annual biomass
yield
(tDM ha-1 yr-1)
N
(plots)
Reed marsh Reed marsh 5 yr July-Aug 15.15 (11.64-19.72) 3.03 (2.33-3.94) 10
Tall-herb communities Humid tall-herb communities 3 yr July-Aug 6.11 (3.98-9.36) 2.04 (1.33-3.12) 13
Abandoned and unmanaged grasslands 1 yr June 6.49 ± 1.69 6.49 ± 1.69 10
Wet grasslands Calthion grasslands 1 yr June-July 4.56 ± 1.34 4.56 ± 1.34 17
Tall-sedge dominated grasslands 1 yr June-July 6.07 ± 2.65 6.07 ± 2.65 4
Mesotrophic grasslands Mesotrophic grasslands with R. repens
and T. repens
1 yr June-July 3.69 ± 1.34 3.69 ± 1.34 16
Mesotrophic graslands with A. elatius 1 yr June-July 4.60 ± 1.89 4.60 ± 1.89 13
Dune slacks Wet and moist dune slacks 1 yr Sept-Oct 2.94 ± 1.72 2.94 ± 1.72 5
Low productive
grasslands on sandy soils
Dry acid and neutral grasslands with
Agrostis
1 yr Aug-Sept 2.59 ± 0.95 2.59 ± 0.95 9
Dry and wet low productive
grasslands
1 yr Aug-Sept 2.69 ± 0.69 2.69 ± 0.69 17
Heathlands Sub-Atlantic dry heaths 15 yr Aug-Sept 15.28 (10.56-22.13) 1.02 (0.70-1.48) 11
Temperate northern wet heaths 15 yr Aug-Sept 10.35 (9.20-11.64) 0.69 (0.61-0.78) 6
577

27
Table 3 Model performance indicators of the constructed multiple linear regression 578
and boosted regression tree models: coefficient of determination (R²), adjusted R² (R²adj), 579
root mean squared error (RMSE in tDM ha-1), relative RMSE (rRMSE, in %) and AIC 580
(Akaike information criterion) for model fit and for 10-fold cross-validation 581
582
Model Fit Cross-validation
R² R²adj RMSE rRMSE AIC
R² R²adj RMSE rRMSE AIC
BRT Vegsoil model 0.82 0.81 1.50 28.87 68.31
0.56 0.55 2.30 44.28 129.85
BRT Vegetation
model 0.76 0.75 1.72 33.15 86.19
0.53 0.51 2.39 46.13 133.76
BRT Soil model 0.54 0.52 2.46 47.42 137.72
0.22 0.19 3.07 59.07 169.36
MLR model 0.60 0.56 2.27 42.65 129.02 0.30 0.23 3.05 57.38 171.47
583

28
Figures 584
585
586
Fig. 1 Location of the sampled sites in Flanders, the northern part of Belgium 587
588

29
589
Fig. 2 Hierarchical classification of vegetation relevés into plant communities with two 590
cluster levels (dashed line: level 1 with seven clusters – dotted line: level two with twelve 591
clusters). First dichotomy splits off the low productive (LP) plant communities on sandy 592
soils from the other communities (OC) 593
594

30
595
Fig. 3 Partial dependence plots of the response on the predictor variables in the vegsoil 596
boosted regression tree model (Plant communities: level 1 plant community). The plots 597
indicate how much the response is affected by a certain predictor value, after accounting 598
for the average effects of all other variables in the model. Predicted functions are centered 599
around the mean standing biomass (tDM ha-1). The relative contribution of each predictor is 600
reported between brackets. Hash marks along the top of the plots show the distribution of 601
the sample plots along that variable, in deciles 602
603

31
604
Fig. 4 Partial dependence plots of the response on the predictor variables in the vegetation 605
boosted regression tree model (Plant communities: level 1 plant community). The plots 606
indicate how much the response is affected by a certain predictor value, after accounting 607
for the average effects of all other variables in the model. Predicted functions are centered 608
around the mean standing biomass (tDM ha-1). The relative contribution of each predictor is 609
reported between brackets. Hash marks along the top of the plots show the distribution of 610
the sample plots along that variable, in deciles 611
612

32
613
Fig. 5 Partial dependence plots of the response on the predictor variables in the soil 614
boosted regression tree model. The plots indicate how much the response is affected by a 615
certain predictor value, after accounting for the average effects of all other variables in the 616
model. Predicted functions are centered around the mean standing biomass (tDM ha-1). The 617
relative contribution of each predictor is reported between brackets. Hash marks along the 618
top of the plots show the distribution of the sample plots along that variable, in deciles 619
620
33
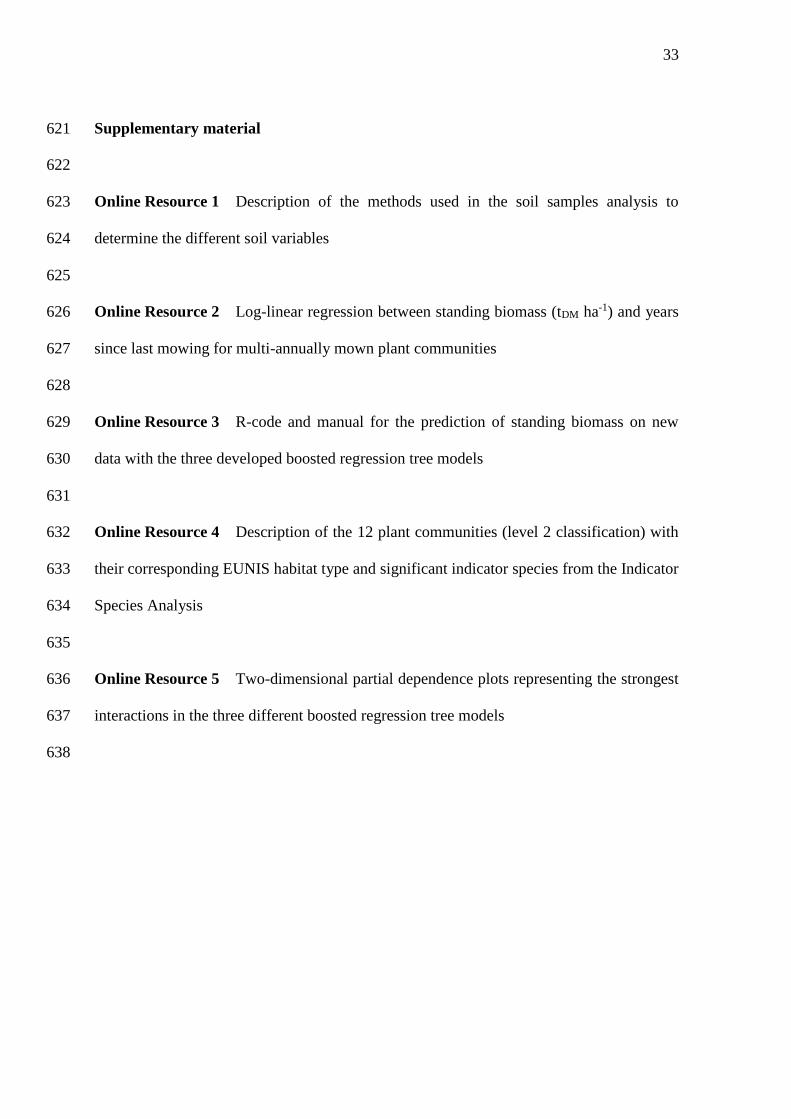
Supplementary material 621
622
Online Resource 1 Description of the methods used in the soil samples analysis to 623
determine the different soil variables 624
625
Online Resource 2 Log-linear regression between standing biomass (tDM ha-1) and years 626
since last mowing for multi-annually mown plant communities 627
628
Online Resource 3 R-code and manual for the prediction of standing biomass on new 629
data with the three developed boosted regression tree models 630
631
Online Resource 4 Description of the 12 plant communities (level 2 classification) with 632
their corresponding EUNIS habitat type and significant indicator species from the Indicator 633
Species Analysis 634
635
Online Resource 5 Two-dimensional partial dependence plots representing the strongest 636
interactions in the three different boosted regression tree models 637
638