Corporate Social Responsibility Practices in Banking Sector of ...
Upload
khangminh22Category
view
0download
0
QUALITY OF WORK LIFE OF EMPLOYEES
IN BANKING SECTOR
A STUDY OF BANK MANAGERS AND STAFF IN GOA
Thesis Submitted to
GOA UNIVERSITY
For the award of the Degree of
DOCTOR OF PHILOSOPHY
In
COMMERCE
BY
PRAVIN MAHABLESHWAR BHENDE
Under the guidance of
Dr. Y. V. Reddy
Sr. Professor
Goa Business School
Goa University
DEDICATION
This work is dedicated
to the Fond memory
of my parents
Shri. Mahableshwar S. Bhende
and
Smt. Rukmabai M. Bhende
with reverence and affection

i
DECLARATION
I, Pravin Mahableshwar Bhende, do hereby declare that this thesis titled
“Quality of Work Life of Employees in Banking Sector – A Study of Bank
Managers and Staff in Goa” is a record of original research work done by me
under the supervision of Dr. Y. V. Reddy, Sr. Professor Goa Business School,
Goa University.
I also declare that this thesis or any part thereof has not been submitted by me
for the award of any degree, diploma, title or recognition before.
Pravin Mahableshwar Bhende
Place: Goa University
Date: _______________
ii
CERTIFICATE
This is to certify that the Ph.D thesis titled “Quality of Work Life of Employees
in Banking Sector – A Study of Bank Managers and Staff in Goa” is an original
work carried out by Pravin Mahableshwar Bhende under my guidance at Goa
Business School, Goa University.
This thesis or any part thereof has not formed the basis for the award of any
Degree, Diploma, Title or recognition before.
Dr. Y. V. Reddy
Research Guide
Place: Goa University
Date: ____________

iii
ACKNOWLEDGEMENT
Research work is a product of cooperative effort. A Researcher is supported by
many people at different levels of his research. First and foremost, I thank the
Almighty for giving me the strength and courage to complete the work
undertaken in the midst of illness. I also offer my obeisance to the memory of
my parents, who took all hardships during my education. I express my sincere
gratitude and heartfelt thanks to many people, some on their own for helping me,
in my exercise.
I am very much grateful to my guide Dr. Y.V. Reddy, Professor, Goa Business
School, for showing me the path in the formative period of study, which helped
me to adopt a definitive approach to my work. His wide experience and deep
insight of the subject, helped to add value to research work. It was a wonderful
experience discussing various issues of my research work with him, which helped
me to have a relook at the work done at many places. I cannot forget the moral
support given by him during my illness, when the continuity and completion of
the research was threatened. He came to my rescue and stood solidly behind me
to ensure that I complete the work. I also express my sincere thanks to Prof.
Nandkumar Mekoth of Goa Business School and who is now with Goa Institute
of Management for coming forward on his own and going all out to help me in
all possible ways. His discussion about various statistical tools, and their
relevance, helped me in adopting proper approach at the time of analyzing and
Interpretation of Data. He went out of the way to find time from his academic
schedule to discuss issues connected with Data Analysis.
I am also thankful to Dr. M.R. Patil and Dr. Filipe Rodrigues who were the
experts on my Faculty Research Committee. They were kind enough to make
valuable suggestions during my various FRC Presentations. I am indebted to the
faculties of Goa Business School, more particularly Vice-Dean Dr. Dayanand,
Dr. B. Ramesh, Dr. Anjana Raju, Prof. K.B. Subhash for timely suggestions,
which I could incorporate into the present thesis. I also thank all the Research
scholars who remained present and took part in the discussions during my various
presentations.

iv
I am also grateful to Dr. Gopakumar V. Librarian of Goa University, for giving
me sufficient time and personally showing me the way in which to access
different Research papers.
I thank Anselmo Rosa, System Administrator, Goa University for being kind
enough to give me Virtual Private Network (VPN) which facilitated me to access
Goa University library portal for e-resources. In times of difficulties, he quickly
responded to my phone calls and resolved all queries.
I also thank Professor Anthony Satish Benedict of Govt.College, Quepem, for
helping me in the area of my work.
I am grateful to Shri. Bhaskar Khandeparkar, Chairman of Goa Vidyaprasarak
Mandal, for forwarding my proposal for a short study leave, which enabled me
to remain away from college duties and focus on Research. I am also thankful to
Dr. R.A. D’Costa, past Chairman, Goa Vidyaprasarak Mandal for forwarding my
proposal of research to Goa University with positive remarks.
I express my gratitude to Dr. M.M. Chikodikar, Vice-Principal of GVM’s GGPR
College of Commerce, for taking up the responsibility of administration and
making me relieved from college matters, which enabled me to focus on my
work. Thanks also go to Dr. C.N. Phadte, Associate Professor of Mathematics of
GVM’s GGPR College, for taking time out to engage me in involved discussion
on issues connected with my study, particularly use and application of statistical
tools, which helped me understand them in Data Analysis. I express my gratitude
to Mr. Walter Furtado, faculty in the department of Computer Science, GVM’s
GGPR College, who is well versed with statistical package for Social Science
(SPSS) and other tools. He was kind enough to sacrifice his time and discuss
several intricacies of statistical tools and its precise application in relation to my
Primary Data. His fruitful discussion opened up vistas of new approaches for
analysis and interpretation of Data.
I also thank Mr. Terence Rodrigues, Librarian of GVM’s GGPR College, for
helping me access good research papers and different useful websites. His advice
and discussion on specific aspects proved to be of immense help to me.
v
I am grateful to Mrs. Anita Carvalho, Jr. Steno of GVM’s GGPR College, for
undertaking typing work most efficiently, even sometimes sacrificing her
personal schedules. She came forward of her own to do the work, where her
quality of helping others was visible. I am also grateful to Mrs. Sonali Naik.
Computer Laboratory Instructor of GVM’s GGPR College, whose quality of
doing any work assigned to her is invaluable. She did all the alignments of
Tables, Figures and Graphics and other settings.
Thanks also go to Mrs. Devina Priolkar, employee, State Bank of India, Ponda,
for her whole hearted cooperation in helping me to get the required data about
Public and Private sector Banks in Goa. I also thank Manager of all Public sector
and Private Sector Banks that I visited as also the staff for giving the time and
completing the questionnaire.
I express my deep gratitude to Shri. Prasad Lolyekar, Director of Higher
Education for granting me study leave, as per my requirement, as also to Dr. Renji
George Amballoor, Deputy Director of Higher Education (Academic) for
processing, completing and speeding up my proposal for study leave. This
enabled me to give focused attention on my work. I am also grateful to Shri.
William Vaz of Comtech and to Shri. Sachin Vadangekar for undertaking part of
the typing work.
My special thanks to my wife Mrs. Seema Bhende and my daughter Miss.
Prajakta Bhende for their unstinted support without which it would have been
impossible to complete the work.
Pravin Mahableshwar Bhende

vi
Quality of Work Life of Employees in Banking Sector
- A study of Bank Managers and Staff in Goa
By: Shri. Pravin Mahableshwar Bhende
Research Guide: Dr. Y.V. Reddy
Sr. Professor, Goa Business School
Goa University
ABSTRACT
Banking is the important service sector contributing significantly to
national economy. From the traditional functions of merely accepting
deposits and lending money, it has ventured into multiple areas dealing
with wide variety of products. This has given an advantage for the
depositor and also helped him to diversify the money and invest in
different products.
People or human Resources constitute the major working force of the
Banking sector. A large number of people get employed in Banks in
different branches across the country. These people work at different
levels in different positions. They have to accept the challenges of the
work in changing times. This sometimes brings pressures affecting their
work and family life.
Therefore, it has become important that all organizations take utmost
care of the employees by addressing their work issues, minimizing their
stress and making the worker feel confident at the work place. Once this
happens, the worker is able to give enough time to his personal life, to
fulfill his other commitments. Thus his overall contribution to
productivity increases significantly. This in brief is the significance of
Quality of Work life. It is concerned with making the life of an
employee as comfortable as possible at the work place by providing

vii
everything that he needs, to do better work to remain efficient and to
become an active partner in the productivity of his organization.
The preliminary things provided to employees at work place are
identified as the dimensions of QWL, some of which are better working
environment, adequate and fair remuneration, Grievance Redressal
mechanism, Career opportunities, motivation.
An extensive Review of literature is made for the purpose of this study.
It is categorized as Review relating to demographic profile, Review
relating to stress and Review relating to improvement of QWL,
depending on the type of study made by the earlier Researchers. The
researchers have shown different dimensions as impacting QWL in the
studies conducted by them.
The present study is conducted among Respondents of Private and
Public sector Banks in North and South Goa. A sample of 412
Respondents is finally selected for the purpose of study. The data is
collected through a structured questionnaire from the Respondents
convenience sampling Technique is used for the purpose of selection of
sample. The data is analysed by applying tools of Descriptive statistics,
Factor analysis, Anova, Correlation, Regression and Friedman Test.
Keywords: Quality of Work life, Work life Balance, Productivity, Skill
Deployment and Efficiency.
viii
Table of Contents
Description Page Nos.
Declaration i
Certificate ii
Acknowledgements iii-v
Abstract vi - vii
Table of Contents viii – xi
List of Tables xii - xvii
List of Figures xviii
Abbreviations xix
Chapter Title Page Nos.
1. INTRODUCTION 1
1.1. Background 1
1.2. Stress at work place 3
1.3. Causes of work stress 7
1.4. Models of Stress 8
1.5. Stress Management Measures 9
1.6. Training and Development 10
1.7. Organisation Structure 11
1.8. Total Quality Management (TQM) 12
1.9. Human Resources Management of Banking Sector 13
1.10. Technology and Human Resource 14
1.11. Quality of Work life 15
1.11.1. Introduction 15
1.11.2. Evolution of Quality of work life 15
ix
Chapter Title Page Nos.
1.11.3. Definition of Quality of work life 17
1.11.4. Characteristics of Quality of Work Life 19
1.11.5. Walton’s frame work of Quality of Work Life 21
1.11.6. Development Process 26
1.11.7. Barriers to Quality of Work Life 26
1.11.8. Measures to improve QWL 27
1.11.9. Importance of QWL 28
1.11.10. QWL and Scientific Management 29
1.11.11. QWL and Motivation Theories 30
1.11.12. QWL issues as suggested by klatt, Murdick &
Schuster (1985) 31
1.11.13. Chapter Summary 32
References 33-35
2. REVIEW OF LITERATURE
2.1. Reviews related to demographic factors 36
2.2. Reviews relating to stress 39
2.3. Reviews related to Improving QWL 43
2.4. Chapter Summary 81
References 82-86
3. RESEARCH METHODOLOGY
3.1. Statement of the Problem 87
3.2. Objectives of the Study 89
3.3. Scope of Study 89
3.4. Need and significance of study 90
3.5. Research Design 90
3.6. Hypothesis of the study 91
3.7. Data Collection 91
3.8. Questionnaire Design 91
3.9. Tools of Data Analysis 92
3.10. Period of Study 92
3.11. Research Questions 92
x
3.12. Sample Design 92
3.13. Limitation of the Study 93
3.14. Scheme of Chapterisation 93
4. ANALYSIS AND INTERPRETATION OF PRIMARY DATA
4.1. Objective 1: To study the dimensions in Quality of Work Life
(QWL) of bank employees 133
4.2. Objective 2: To study the dimensions in Work Life Balance
(WLB) of bank employees 135
4.3. Objective 3: To study the dimension in Policy Measures
(PM) of bank 138
4.4. Objective 4: To study the relationship between Working
Environment and QWL in banks. 140
4.5. Objective 5: To study the relationship between Policy
Measures and QWL in banks 146
4.6. Objective 6: To study the impact of QWL on the Work
Life Balance of bank employees 151
4.7. Objective 7: To analyse the relationship between the
Security and Growth Opportunities and QWL in Banks 162
4.8. Objective 8: To analyse the relationship of Demographic Profile
with QWL, Work Life Balance and Policy Measures of bank 168
5. FINDINGS, SUGGESTIONS, CONCLUSION AND SCOPE FOR
FURTHER RESEARCH
5.1. Demographic Details of Respondents 181
5.2. Opinions of Respondents About QWL Dimensions 182
5.3. Impact of Working Environment on Freedom and Recognition
Dimension of QWL 183
5.4. Impact of Working Environment on Rewards Dimension of QWL 184
5.5. Impact of Working Environment on Grievance Redressal
Dimension of QWL 184
5.6. Impact of Policy Measures Dimensions on Freedom and
Recognition Dimension of QWL 185

xi
5.7. Impact of Policy Measures Dimensions On Rewards Dimension
of QWL 185
5.8. Impact of Policy Measures Dimensions on Grievance
Dimension of QWL 186
5.9. Impact of QWL Dimensions On Productivity Dimension
of Work Life Balance 187
5.10. Impact of QWL Dimensions on Skill Deployment and
Efficiency Dimensions of WLB 187
5.11. Impact of SGO on FR Dimension of QWL 188
5.12. Impact of SGO on Rewards Dimension of QWL 189
5.13. Impact of SGO on Grievance Redressal Dimension of QWL 189
5.14. Impact of QWL Dimensions, WLB Dimensions and PM
Dimensions on Demographic Profile 190
5.15. Suggestions 190
5.16. Conclusion 192
5.17. Scope for Further Research 193
Bibliography 195 - 206
Appendix 207 - 210

xii
List of Tables
Table No. Title Page Nos.
1.1 Dimensions of QWL by the previous researchers 23
1.2 Dimensions of QWL by the previous researchers 24
2.1: Prominent QWL Factors highlighted by previous Researchers 79
4.1.1 Public Sector Banks visited Taluka wise in North Goa 96
4.1.2 Public Sector Banks visited Taluka wise in North Goa 97
4.2.1 Private Sector Banks visited Taluka wise in North Goa 98
4.2.2 Private Sector Banks visited Taluka wise in North Goa 99
4.3.1 Public Sector Banks visited Taluka wise in South Goa 100
4.3.2 Public Sector Banks visited Taluka wise in South Goa 101
4.3.3 Public Sector Banks visited Taluka wise in South Goa 102
4.4.1 Private Sector Banks visited Taluka wise in South Goa 103
4.4.2 Private Sector Banks visited Taluka wise in South Goa 104
4.5 Selection of Sample Size Distribution of Sample Questionnaire 105
4.6 Status of Cases in Reliability Test 106
4.7 Reliability Test of Likert Scale 106
4.8 Age profile of respondents 106
4.9 Experience of respondents 107
4.10 Gender Profile of respondents 107
4.11 Demographic profile of Annual Income of the respondents 109
4.12 Education profile of the respondents 110
4.13 Bank category and respondents 111

xiii
4.14 Designation profile of respondents 113
4.15 Nature of employment of respondents 114
4.16 Gender wise discrimination at the time of recruitment 115
4.17 Gender wise discrimination for Nature of work 117
4.18 Gender discrimination for duration of work 118
4.19 Discrimination among Gender for promotion 120
4.20 Opinion of respondents about adequate and fair remuneration 121
4.21 Opinion of respondents about Working Environment 122
4.22 Opinion of respondents about Security and Growth Opportunities 123
4.23 Views of respondents about Motivation 124
4.24 Views of respondents regarding Respect at work 124
4.25 Views of respondents about Occupational Stress 125
4.26 Views of respondents about Recognition 125
4.27 Views of respondents about Autonomy and participation 126
4.28 Views of respondents about Grievances Procedure 127
4.29 Views of respondents about Policy Measures of Organisation 128
4.30 Views of respondents on Outcome and result of
Work Life Balance 129
4.31 Views of respondents on Quality of Work Life and
Work Life Balance 131
4.32 Total Variance of QWL 133
4.33 Rotated Component Matrix of QWL 134
4.34 Total variance of WLB 135

xiv
4.35 Rotated Component Matrix of WLB 136
4.36 Total variance of PM 138
4.37 Rotated Component Matrix of PM 139
4.38 Model summary of FR dimension with WE dimension 140
4.39 ANOVA of FR dimension with WE dimension. 140
4.40 Coefficient of FR dimension with WE dimension 141
4.41 Model summary of Rewards dimension with WE dimension 141
4.42 ANOVA of Rewards dimension with WE dimension 142
4.43 Coefficient of Rewards dimension with WE dimension 142
4.44 Model summary of GR dimension with WE dimension. 142
4.45 ANOVA of GR dimension with WE dimension 143
4.46 Coefficient of GR dimension with WE dimension 143
4.47 Working Environment 144
4.48 Descriptive statistics on component of
Working Environment (WE) 145
4.49 Friedman Test on Ranking on components of WE 145
4.50 Friedman Test Result 146
4.51 Model summary of FR dimension with PM dimensions. 146
4.52 ANOVA of FR dimension with PM dimensions. 146
4.53 Coefficient of FR dimension with PM dimensions. 147
4.54 Model summary of Rewards dimension with PM dimensions 147
4.55 ANOVA of Rewards dimension with PM dimensions 147
4.56 Coefficients of Reward dimension with PM dimensions 148

xv
4.57 Model summary of variable GR dimension with PM dimensions 148
4.58 ANOVA of GR dimension with PM dimensions. 148
4.59 Coefficient GR dimension with PM dimensions 149
4.60 Welfare Factor Representing Policy Measures 150
4.61 Health Camps Factor Representing Policy Measures 151
4.62 Model summary of Productivity dimension with QWL dimensions. 151
4.63 ANOVA of Productivity dimension with QWL dimensions. 152
4.64 Coefficient of Productivity dimension with QWL dimensions 152
4.65 Model summary of Skill Deployment and Efficiency dimension with
QWL dimensions 154
4.66 ANOVA of Skill Deployment and Efficiency dimension
with QWL dimensions 154
4.67 Coefficients of Skill Deployment and Efficiency dimension
with QWL dimensions 154
4.68 Freedom and Recognition Factor representing Quality
of Work Life 156
4.69 Rewards Factor representing Quality of Work Life 158
4.70 Grievance Redressal Factor representing Quality of Work Life 159
4.71 Productivity Factor representing Work Life Balance 159
4.72 Skill Deployment and Efficiency Factor representing
Work Life Balance 160
4.73 Model summary of FR dimension with SGO dimension 162
4.74 ANOVA of FR dimension with SGO dimensions 162
4.75 Coefficients of FR dimension with SGO dimensions 163

xvi
4.76 Model summary of Rewards dimension with SGO dimension 163
4.77 ANOVA of Rewards dimension with SGO dimension 163
4.78 Coefficients of Rewards dimension with SGO dimension 164
4.79 Model summary of GR dimension with SGO dimension 164
4.80 ANOVA of GR dimension with SGO dimensions 164
4.81 Coefficients of GR dimension with SGO dimension 165
4.82 Security and Growth Opportunities 165
4.83 Descriptive statistics on component of Security and Growth
Opportunities(SGO) 166
4.84 Friedman Test on Ranking on components of SGO 167
4.85 Friedman Test Result 167
4.86 Model summary of FR dimension with Demographic Profile
dimensions 168
4.87 ANOVA of FR dimension with Demographic Profile dimensions 168
4.88 Coefficients of FR dimension with Demographic
Profile dimensions 169
4.89 Model summary of Rewards dimension with Demographic
Profile dimension 170
4.90 ANOVA of Rewards dimension with Demographic
Profile Dimension 170
4.91 Coefficients of Rewards dimension with Demographic
Profile dimension 171
4.92 Model summary of GR dimension with Demographic
Profile dimension 172
4.93 ANOVA of GR dimension with Demographic Profile dimension 172

xvii
4.94 Coefficients of GR dimension with Demographic Profile
dimension 173
4.95 Model summary of Productivity dimension with Demographic
Profile dimensions 173
4.96 ANOVA of Productivity dimension with Demographic
Profile dimensions 174
4.97 Coefficients of Productivity dimension with Demographic
Profile dimensions 174
4.98 Model summary of Skill Deployment and Efficiency dimension
with Demographic Profile dimensions 175
4.99 ANOVA of Skill Deployment and Efficiency dimension with
Demographic Profile dimensions 175
4.100 Coefficients of Skill Deployment and Efficiency dimension
with Demographic Profile dimensions 176
4.101 Model summary of Welfare dimension with Demographic
Profile dimensions 177
4.102 ANOVA of Welfare dimension with Demographic Profile
dimensions 177
4.103 Coefficients of Welfare dimension with Demographic Profile
dimensions 178
4.104 Model summary of Health Camps dimension with Demographic
Profile dimensions 178
4.105 ANOVA of Health Camps dimension with Demographic Profile
Dimensions 179
4.106 Coefficients of Health Camps dimension with Demographic Profile
dimensions 179

xviii
LIST OF FIGURES
Figure No. Title Page Nos.
1.1 Organizational stressors 5
1.2 Cooper’s Dynamics of work stress (1988) 6
1.3 Walton’s Model of QWL 25
4.1 Gender Distribution of Respondent 108
4.2 Income Distribution of Respondent 110
4.3 Level of Education of Respondent 111
4.4 Banking Sector Classification 112
4.5 Job Classification of Respondents 113
4.6 Employment Status of Respondents 114
4.7 Measurement of Gender Discrimination on Recruitment 116
4.8 Measurement of Gender Discrimination on Nature of Work 117
4. 9 Measurement of gender discrimination on duration of Work 119
4.10 Measurement of Gender Discrimination on Promotion 120
4.11 Scree Plot to Determine Eigen Value of QWL Components 134
4.12 Scree Plot to Determine Eigen Values of WLB Components 136
4.13 Scree Plot to Determine Eigen Value of PM Component 139
4.14 Impact of Quality of Work Life On Productivity Dimension of
Work Life Balance 153
4.15 Impact of Quality of Work Life On Skill Deployment and
Efficiency Dimension of Work Life Balance 155

xix
ABBREVIATIONS
1. QWL – Quality of Work Life
2. FR – Freedom and Recognition
3. GR – Grievance Redressal
4. WLB – Work Life Balance
5. PR – Productivity
6. SDE – Skill Development and Efficiency
7. SGO – Security and Growth Opportunities
8. PM – Policy Measures
9. WE – Work Environment

1
Chapter I
Introduction
1.1 Background
Every person or Human Resource desires to engage himself in an activity, job,
an occupation or an enterprise. This may be called as work. The primary
objective is to keep oneself engaged, occupied and involved. The second
important attribute or outcome of the activity is the livelihood or income earning
potential of the work. Although social work is also recognized, Man’s ambitious
March is to earn money with the type of the work that he does. The type of the
work in which he ventures is with and expectation of giving him a decent living.
No one likes to do unproductive work, where your efforts will not be rewarded.
It is altogether a different issue that sometimes, you may not get anything, or
the enterprise may incur a loss. But the intention in starting the activity was
honest and genuine. Due to industrious nature of Mankind, he does not stop with
the activity at the point where he started. He is concerned with the general
growth of the activity. If it is an enterprise, he wishes to expand the existing
one, diversify his business, add extra products to his existing product line,
establish more branches, and do all things which will take his business to the
top. He is the owner of the enterprise with enormous responsibilities. He has to
think, find and execute ways and means to remain on top. Over the years, great
changes are taking place all around, and no activity of whatever nature remains
untouched from them. The winds of change have blown much faster in business
and corporate world. From the traditional ways and practices of business, gave
way to knowledge Industry, where employees had to redefine their roles vis-a-
vis the organisation they belonged to.
Further organisations led its way and embraced digitalization with technology
becoming all Pervasive. This gave a facelift to all commercial and Service
industries with structure, processes, systems and sub systems of organisations
re-modelled, and hierarchical positions of the employees Shaken. Expectations
both of employees and organisations grew in leaps and bounds. The ways of
working of the employees individually as well as in teams did not remain easy
as the concept of work itself underwent a sea change. All this, brought added

2
pressure on organisations in changing environment, and if employee or human
resource, which is an important component of the organisation had to be kept
active and alive, Periodic training programmes became an integral part of the
organisations. Not only the employees had to remain healthy, stress-free and
free from any tensions, but the other side they were also expected to give the
optimum to their organization. The fundamental activity of the work done by
human beings is central to all behavior of mankind and his future progress. Man
became increasingly concerned about the need for doing or engaging himself in
some or the other activity. Some activity is founded by Mankind to involve
himself wholly as in the case of Business, a factory or an Industry. In other case
he inherits the business of the earlier generation and takes upon himself to
shoulder its responsibility. In both these cases the activity is supreme and
significant and man will always try for its future growth. The primary desire is
to make the work as productive as possible. Sofer (1970) makes the following
distinct points about the work.
Work gives livelihood and is responsible for survival.
Work gives opportunity for inter personal relations and interaction with
others.
Work gives personal identity.
Work gives personal self-respect.
It brings competitive spirit for higher individual performance and
achieving and meeting higher goals.
Work gives enough scope to efficiently adjust with environment and
use this productively.
Work gives opportunities to serve society in whatever way possible.
Work is the primary activity which helps mankind, to remain active and devote
a part of his life as per his need and requirements. Work gives a sense of
identity to the people. It brings respect and a feeling of social status which are
very important attributes especially when he moves in society. The
management of the work, the adjustment with the work, and the final
performance of the work are very important as it can bring out the real quality
of the person as a Resource. If people are able to derive job satisfaction from
3
the work, they will put up high performance and will rise higher in
organisations or in places of their work. However, their inability to cope with
the work or to manage the work, can make the people stressful, resulting into
low performance, adversely affecting their performance.
1.2 Stress at Work Place
In the present Business environment, stress is most common and is usually
impacting the work places or adversely influencing human resources. with rapid
changes in means and methods of working, technology, challenges brought
about by changing times, competitive strategies of different organisations have
brought in a state of working, where work has out grown the capacities of human
beings. There is a mismatch between the schedules of work, and the extent and
volume of work to be accomplished resulting into complete imbalance. Inability
of the worker in not keeping pace with changing time, brings him under pressure
in the place of work. Which is usually described as stress. The worker is
confused, unclear, ambiguous, and is unable to deliver, the results all by himself.
A stress can affect the health of an employee, resulting into a grave problem if
not tackled at the right time. Employees can be stressed out due to factors such
as extreme temperatures, poor lighting, bad ventilation, noise and vibration,
dangerous chemicals, gases, vapors, and dust.
Stress can also be due to conflict with management or supervisors or co-
workers. Stress at work Place may arise out of different roles which an
individual is called upon to perform which are sometimes conflicting with each
other. Sometimes he has to perform the roles due to absence of the co-workers
in the organisation. In these situations, stress arises and the person may not be
able to do justice to any of the roles. Some of the prominent stressors may
include:
Reformation and Re-organisation of Business enterprise due to Mergers,
Acquisitions, Amalgamations, and absorptions.
New demands of organisation due to continued expansion,
diversification and adding a new line of products and expectations of
meeting new target.

4
New technology adoption in Business operations and consequent
changes it may bring in job profiles.
Changes in Business Environment due to globalization, Privatization
and its resultant effects on Business.
Modern Business practices expect employees to perform multi skilling
roles rather than sticking to only one role. This leads to higher stress.
Stress is a pressure on Psychological system of a person, arising out of one’s
work life.
According to Beehr and Newman, “stress is a condition arising from the
interaction of people and their jobs and Characterized by changes within people
that force them to deviate from their normal functioning.”
Fred Luthans defines the stress as “on adaptive response to an external
situation that results in physical, psychological and /or behavioral deviations for
organizational participants.”
“Stress is an inescapable reality of most working environments.” (Gladies and
Kennedy 2011).
“Stress in the workplace occurs when employees try to cope with the duties
responsibilities and other forms of pressure associated with their jobs, but
encounter difficulties, anxiety and worry in trying to manage them.” (Stranks
2005, cited in Mesko et al 2013 PP 53-45).
Business organisations must ensure that their business conditions and policies
do not give rise to any stress in the employees. On the other side employees
should learn to cope with and control the stress, which will not affect the
productivity. (Rojas and Kleiner, 2000) with the changed Business
environment, and ever increasing expectations in terms of extended working
hours, higher performance of employees, are putting pressure on the physical
and mental health of people in organisations. (Williams 2014). they have to
give proper attention to this factor.

5
Figure: 1.1
Organizational stressors
Policies and Strategies
Downsizing
Competitive Pressures
Pay compensation and Rewards
Rotating Shifts
Bureaucratic Rules
Advanced Technology
Organizational Structure & Design
Centralisation & formalisation
Hierarchical Conflicts
Specialisation
Confusion & ambiguity of work roles
No opportunity for advancement
Restrictive Culture
Organisational Process
Tight Controls
Only downward Communication
Little Performance Feedback
Centralized decision making
Lack of participation in decisions
Punitive appraisal systems.
Working Conditions
Crowded work area
Noise, heat or cold
Polluted Air
Strong odor
Unsafe, dangerous conditions
Poor lighting
Physical or mental strain
Toxic chemicals.
Source: Fred Luthans, Organisational Behaviors.
J
O
B
S
T
R
E
S
S
6
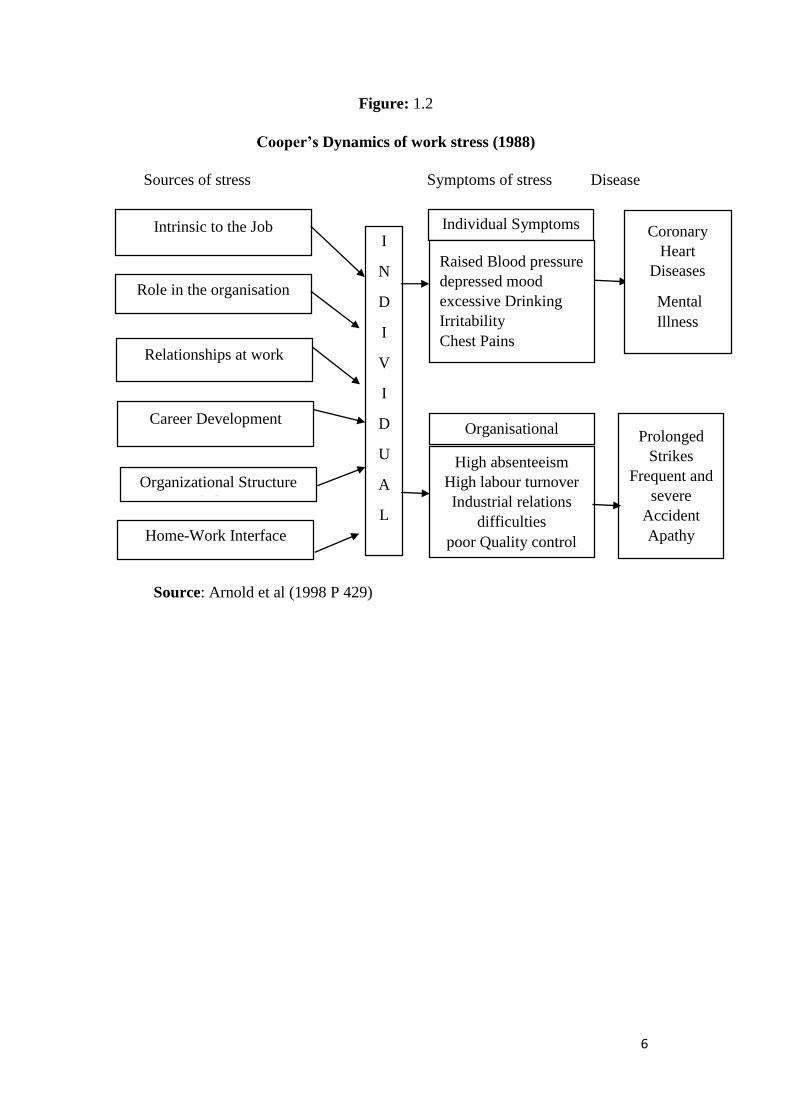
Figure: 1.2
Cooper’s Dynamics of work stress (1988)
Sources of stress Symptoms of stress Disease
Intrinsic to the Job
Role in the organisation
Relationships at work
Career Development
Organizational Structure
and climate
I
N
D
I
V
I
D
U
A
L
Individual Symptoms
Raised Blood pressure
depressed mood
excessive Drinking
Irritability
Chest Pains
Home-Work Interface
Coronary
Heart
Diseases
Mental
Illness
High absenteeism
High labour turnover
Industrial relations
difficulties
poor Quality control
Organisational
Symptoms Prolonged
Strikes
Frequent and
severe
Accident
Apathy
Source: Arnold et al (1998 P 429)

7
The above figure outlines the causes of work stress as
1.3 Causes of Work Stress
(a) Factors intrinsic to the job.
Workers become stressful with certain components, inherent in the job
like working faster, working for extended part of the hours to meet and
accomplish the targets, and working to raise job performance of the
organisation. This may make workers stressful. “The demands of a given
job can also contribute to the experience of stress and to subsequent
strain.” (Landy and Conte, 2010 p 452-453).
(b) Role within the organisation
stress in an organisation can be at minimum, when roles of the person
are well defined, clear and free from ambiguity. stress generally
increases when persons in organisation are called upon to play multiple
roles or perform Multiple tasks. This will lead to role conflict as persons
many times don’t have clear idea about functions involved in each job.
(c) Work life interface
Work life conflict is the result of an imbalance between the working in
the organisation and the time for the family. Pressure will be put on the
worker in the course of satisfying his family pursuits and it will turn into
stress, if they remain unfulfilled. In the same manner family
commitment should not come in the way of his performance of
organizational roles.
(d) Relationships at work.
This is the outcome of organisational environment, and the interpersonal
relations existing between different employees. When organisational
policies are not conducive for working, when employees are not treated
well, it will give rise to interpersonal conflict.
(e) Career development
A good organisational policy ought to ensure scope for upward mobility
of the employees in their hierarchical levels. If there is continued job
insecurity, it will result into a feeling of distrust for the employees which
will make them stressful at work. A policy of promotion of the
organisation is very important and significant for employees. There

8
should be no scope for any confusion in the policy. A well-defined, well
spelt out promotion policy directed towards the career progression of the
employees, will certainly act positively on reducing the stress in the
organisation.
1.4 Models of Stress
Modern organisations recognise stress as a significant impediment to the
progress and its high performance. Stress is caused at the work place due to poor
working conditions and job characteristics. (Berry 1998, p 445). Some of the
theories and models of stress developed are started below.
(a) Demand control model
This Model was founded and propagated by Karesek. It emphasis that
job Demands and control are significantly responsible for work stress.
Job Demands would involve the components of workload and
requirements of the Job. Job control would involve the freedom to
perform the job and freedom to use various skills of the employees.
Karesek argued that ‘high strains’ are caused by high activity and low
control jobs which in turn can lead to different health problems. Thus
employee in the organisation who have more pressing or compelling
work schedules with little control, will invite more health problems.
Individuals who are able to establish Balance and harmony between high
demand jobs and high control, are able to have good health and enjoy
the work.
(b) Person environment fit model
(P-E) fit Models was propounded by Dawis, French, Caplan &
Harrison 1982. It is the fit or the match between and individual and his
immediate environment. An individual’s personal traits and
characteristics, Psychological needs, skills and environmental factor of
cultural values, extrinsic rewards, are matched with each other. The
outcome or the result will determine the extent of stress. An ideal person
environment fit will happen when person’s skills and working abilities
match with the requirements of the environment. French, caplan &
Harrison found that weak Match between person and environment was
associated with increased strains.
9
(c) Effort reward imbalance model
This model as the very term signifies sets to establish a relationship
between efforts and Rewards. It emphasis that all efforts of employees
at work place should be compensated by suitable rewards and mismatch
or imbalance between the two will lead to stressful experiences. (Peter
& Siegrist 1999) Rewards generally refer to the returns in terms of
money, career options to the employee and the job security. Effort is the
initiative to work, which is out of personal Motivation and also the
pressures of workload.
(d) Control model
This model is propounded by Spector and Goh (2001). It suggests that
control becomes operational at work place due to freedom and
autonomy. This Model takes the holistic approach to stress without
specifically mentioning the features or attributes of the stressors but
gives attention to an individual being personally influenced by a
stressor, thereby resulting into the stress.
1.5 Stress Management Measures.
As stress acts at the hurdle in the path of progress and productivity of
organisations, as also affecting the health of employees, It is very significant for
the organizations to devise workable measures and follow policies designed to
tackle this problem. This will be better implemented if causes are known to the
organisation. The measures can directly focus on the individual. some of the
measures can also be employee specific. The measures taken by the organisation
should be directed to minimize the areas which cause organisational stress, it
should also have the component of training for employees, as well as health and
wellness programmes and periodic counselling sessions in the organisation.
Elkin and Rosch (1990), Arnold and Randall (2010) have laid down measures
designed to minimize stress among employees. Some of them are:
Redesigning the task.
Changing and redesigning work environment.
Flexibility in work schedules to suit convenience of employees.
Encouraging participative Management.

10
Enough scope for career options and career development of
employees.
Importance to team work and strong teams.
Setting clear, concise goals and its due analysis.
Social support and feedback.
Clear employment and promotion policies.
Sharing the Rewards.
The employees are also given enough training to bring adaptability in their
approach to work and environment by changing their thinking process. If
individuals learn to cope with the stressors, many of the stressful situations can
be reduced. A Programme of rehabilitation, can also be undertaken by the
organisations for those employees who are greatly affected by stress.
1.6. Training and Development
Training Programmes build competencies of the employees, to make them more
effective. Training gives them inputs with respect to the work, Methods of doing
the work, interpersonal relations, interaction and behavior with teammates and
subordinates and all the other attributes, which are intended to bring about their
holistic development. The workers Motivation level increases by the Quality of
these programmes. These motivated and effective employees can help the
organization in climbing up the ladder of success and in the accomplishment of
its goals. Industries on their part should give freedom and autonomy and
flexibility to the workers. Another important features of the employees are
innovation in the work and organization. Although all employees may not have
this trait atleast few of them can go an extra mile and allow the organization to
reap the benefits. Innovation can be in the work that they do to find better
process and methods of work, to make use of technology in improving Quality
of the work, or it can also be in the overhauling of organization to give better
results in terms of enhanced programmes and high productivity. The importance
of human resource in organization can never be underestimated. All
organisations make efforts to have effective recruitment policies to get the best
of the working force in their organisations.
11
In modern times, the importance of Training in service organisations is widely
acknowledged. The advent of technology has bought about complete change in
the nature and structure of organisations as well as the profiles of the jobs. Some
jobs have undergone complete re-designing while others have become obsolete.
It has made Human Resource to adjust and adopt like never before.
Organisations themselves are forced to undergo re-designing with downsizing,
clubbing of jobs wherever it is necessary. But the challenge brought about by
technology is widely accepted by employees and they find more scope for
upward mobility and career options. For this, organisations have also decided
to keep Periodic Training Programmes for its employees as a continued activity.
Employees also know that Training will keep them updated with new method
of work, and they can remain clear with their job recruitments and meet the
expectations of the organisations.
According to Price, training arises when there is a visible gap between the
present performance of the employees and his expected performance, which
makes clear that all organisations are making calculated expectations of
desirable performance of all employees.
1.7 Organisation Structure
The Quality of Work Life of an employee gets influenced by the extent and
performance of the work in the organisations. They seek to give clarity to the
employees concerning all their work and remove ambiguity. It defines the role
of the employees by means of policies, rules and guidelines, which make them
alert and comfortable as regards what to do in organisations.
It is a process of systematic determinations of tasks and responsibilities and
interrelationships in the fight of human and material resources.
(A. M Sarma 2019)
For the employees to perform better, in their duties and jobs, organizational
design is very important. The design process signifies the relationships and the
exercise of authority that exists between various hierarchical levels.
Organisations bring various inputs together to perform diverse activities and
give desired output to society. The output may be a product or a service. It

12
involves teamwork, where all people work to achieve a common goal.
Therefore, inter personal relations, team work and the actions between all the
workers and employees determine the scale of success of the organization. As
organizational structure helps in making a proper study and Analysis of aims
and objectives of the enterprise. Relationships at various levels external
environment, job profile, and Management styles, become important.
1.8. Total Quality Management (TQM)
The organisations across the world whether Manufacturing, service or any other
type are embracing TQM for bringing qualitative change in product, processes
and people. The Philosophy of TQM is to integrate all units of organisations to
achieve optimum efficiency. Quality is the defining attribute of Business
enterprises and organisations. They are greatly concerned with possible
problems in the products, process as also with the level of performance of its
people. TQM or the quality philosophy establishes a relationship with QWL of
employees. It values skills and feelings about a particular job. It gives them a
sense of identity and meaningful recognition. The workers remain on the path
of continuous and consistent improvement. Total Quality Management
empowers employees to be more innovative in their area of work. Employees
become autonomous (by the policies of organisations) to make decisions in their
area. Products going in the hands of customers or services rendered to them,
have become a matter of great concern to organisations. In order that an
organisation becomes highly efficient, it encourages the employees to identify
the stumbling blocks or problem areas, for bringing about immediate
improvement. The workers and the employees are found to be motivated in their
jobs, as they are given freedom to find workable and effective solutions.
The new thinking of the organisations involves prominently putting the focus
on the people or human resources. In designing the work and improving
processes, Workers will work according to the defined process and control
them. This has resulted into higher productivity and greater efficiency.
Organisations also have become highly competitive. Again skill development is
very significant in all organizations. Training and effective skill development
programme, building team work and interpersonal relations, giving proper
13
rewards and recognition for employees form the important component of TQM
of organisations. This process changes the entire work behavior of the
personnel. It draws them into making a concerted effort at all hierarchical levels
to give better products and services to the customers. These organisations
embrace a new culture of continuous improvement in quality to meet the high
expectations of the customers. Customer satisfaction is the key to TQM.
1.9. Human Resources Management of Banking Sector
Banking is the most important service industry of the country, contributing
substantially to its Gross Domestic Product. Roughly the contribution of
banking sector to GDP is about 7.7% also it has generated employment in the
economy for about 1.5 million people. Therefore, work force of the Banks at all
levels of hierarchy becomes very significant since they are the main drivers of
this industry. The type and Quality of Human Resources will significantly
impact the productivity. The policies of the government towards Banking can
also affect Quality of work life of its employees.
In the age of technology and digitalization, the customers are called upon to use
products and services of the Banks with the help of mobile phones, computers
or other electronic devices. The products have increased, services have become
more complex and it has added to the stress of human Resources. The pressure
of meeting the targets or goals is ever increasing. The government and RBI
regulations also are not very conducive to the working environment in Banks.
The Banks are also in the race for increasing its products and services from its
existing base. Hence to remain on competitive edge now a day, financial
products like Mutual funds, Gold bonds as well as life insurance and health
insurance and venture capital are offered by the Banks. Online transactions,
mobile and Internet Banking have made life more complex. The policies of the
government are allowing huge loans to favoured Industrialists resulted into
massive defaults. This impacted the quality of work life of employees and
brought them under extra stress. To keep the motivation level high and to keep
employees away from depression and frustration. Banks are embarking on
training programmes for it employees. The Banks these day want minimum
intervention of the customers with the employees. Banks want all its customers

14
to use the devices which are installed inside or in the rooms immediately
adjoining the Banks. Therefore, Deposits and withdrawals of cash, deposits of
cheques, passbook updating are done by electronically operated devices. It is
observed that in some banks there is no cooperation or support from the staff, if
these machines don’t work. Employees prefer to work in isolation.
1.10 Technology and Human Resource
The fundamental Principal of Human Resource is the contribution that they
make in the area of their work and to the organization. Their performance
enhances the productivity and adds to the General success of the organisations.
Therefore, organisations are useful in recruiting the best of the resources at each
level of working, wherever direct recruitment is necessary. Investment in
training programmes designed by organisations is also significant and
substantial, as organizations feel the need and urgency to keep its human
resources trained in all aspects of working as well as updated with immediate
changes taking place in Business Environment. The Quality of work life of
employees become higher and improves a great deal, if the organisations attend
to such issues of the people.
Technology brought about a sea-change in Banks and other service sector. It
changed the attitude, behavior, way of working, skills, abilities of the people. It
also changed the mode and method of work and structure of organisations.
Technology acted as change agent both for good as well as for worse. Redesign
of jobs and extension of work hours in many cases were resisted by the
employees. However, the employees realized that their welfare lies in
embracing Technology and their upward mobility in the jobs will be better
safeguarded, if they redesigned themselves to do the assigned work. Also
employees had to be innovative and creative with respect to their jobs and
orgnisations.

15
1.11 Quality of Work life
1.11.1. Introduction
The emergence of work as an activity and identification of person and
employees as a human resource, made it necessary to give greater attention to
persons, their feelings and conveniences at work places as his behavior was
influenced by these dimensions. Human Resources or the worker is fundamental
to any organistation. Quality of work life concerned with well-being health of
the workers, given them better environment of work, and providing to them
improved financial and other benefits. So that they contribute more to the
productivity of the organization. The organisations goals can also be better
fulfilled with active involvement of the workers. With the growth and
expansions of the organisations, the styles of working also changed. The
centralized pattern gave way to democratic and participative Management with
this change, organistations attend quickly to the grievances of the workers,
providing them conducive work environment and favourable Monetary terms
of employment. When QWL improves, it impacts productivity and performance
of the organisations positively.
As human resources improved the work and contributed to greater productivity,
it was significant to give them, a better quality of life, by giving attention to
factor such as income, health, better working environment and happiness. In the
early nineteenth century F.W Taylor developed the concept of scientific
management and drew the attention of the world to human resources. Scientific
management systematized the approach and way of looking at human resources.
Labour became more dignified, and a new thinking of division of labour,
supervision, freedom to workers became prominent. Scientific Management
promoted new research to bring about awareness in human behavior and also to
improve job satisfaction in organisations.
1.11.2. Evolution of Quality of Work Life
The quality of work life (QWL) can be traced to number of legislations enacted
in the early 20th century to safeguard and protect the employees from hazardous
working conditions. The unionization movement also became prominent in
1930 and 1940 which contributed to the growth of QWL. Efforts were made to

16
give due attention to job security of the workers, as well as to provide them
better working conditions and economic benefits. Walton R.E. 1973 argued
that evolution of QWL is from various phases in history. He said that QWL was
a broader concept and includes values, human needs and aspirations.
Psychologists developed different theories in 1950’s and 1960s which
established positive relationship between morale and productivity and discussed
the idea of improved human relations.
An international conference was held at Arden House, New York in 1972. It
was focused at having democratic practices at work places. In this conference
the term quality of work life was introduced by Louis Davis. The international
council for quality of work life was established in 1972. Thereafter greater
research started taking place in QWL and slowly, it became a significant
movement. The first open international conference organized in Toronto in Aug
1981, attracted large participants comprising managers, union representatives,
and academicians.
Jenkins (1981) observed that Tornto conference emphasized, QWL is an
important employee issue.
In India too, Quality became an important area at each unit of work
organisations felt the need to imbibe the culture of quality in order to enhance
its performance.
Indian organistaions realized the importance of Quality and began giving it the
highest importance. It became a primary tool which made organizations highly
efficient. Quality initiatives were directed towards human resources. This was
done by forming “Quality circles”.
A Quality circle is a small group of people or employees who meet regularly to
discuss the problems in their work area and find solutions. “Quality circle entails
involving a small group of employees who meet on a regular basis to identify,
analyse and resolve the various workplace related problems and issues. Quality
circles can greatly help in enhancing the QWL of workers in organisations.
“(Kumar and Tripathi) Quality circles help in building creative attitude in
workers at work places. All types of ideas connected with work improvement
and effectiveness became significant for the workers as well as for organization.

17
A systematic and well defined Quality circle lends professionalism to workers.
Workers become more encouraged towards creative thinking and problem
solving. Quality circles thus increases the effectiveness of organisations and
also improves QWL of workers.
1.11.3 Definition of Quality of work life.
As man tried to engage himself in the activity to seek a living some profound
relationship came to be established between himself and the work that he sought
to do. As the time passed by, machines became a powerful resource of work and
this relationship changed. Man began to make use of this resource for his better
work and for easier and improved work culture. Serious thinking was given to
work life quality and its improvement. Further information Technology
explosion, and digitisation brought complete transformation in the work and
made it qualitatively better. Man’s approach to work also changed. He began to
value factor and give primary importance to certain dimensions, which he
thought were necessary for him as human resource or as an entity of work. Most
definitions bring out the importance of these dimensions and significantly
underlie their importance.
Some definitions of QWL are stated below.
“QWL is an indicator of how free the society is from exploitation, injustice,
inequality, oppression and restrictions on the continuity of growth of man,
leading to his development to the fullest”. De (1976)
“QWL is the work culture that serves as the corner stone”. Richard Walton
(1975).
“QWL is the degree to which members of an organization are able to satisfy
important personal needs through their experiences in the organisations.”
Suttle (1977).
“QWL is “a process by which an organisation responds to employee needs by
developing mechanism to allow them to share fully in making the decisions that
design their lives at work.” – Robbins (1989).
18
“It is a process by which an organization attempts to unlock the creative
potential of its people by involving them in decisions affecting their work lives”
Robert, H. Guest (1979).
“QWL is the degree to which work in an organization contributes to material
and Psychological wellbeing of its Members.” Harrison, M. (2004).
“Quality of working life is a way of thinking about people work and
organstaions.” Nadler and Lawler (1983).
According to the Lippit, G.L. (1978) the term QWL refers to the degree to
which work provides an opportunity for an individual to satisfy a wide variety
of personal needs to survive with some security to interact with others to have
a sense of personal usefulness, to be recognized for achievement and to have an
opportunity to improve one’s skills and knowledge.
Gilgeous (1998) says that the Quality of life would be defined as an individual
satisfaction with his or her life dimensions comparing with his or her ideal life.
Evaluation of quality of life depends on individual’s value systems and on the
cultural environment where he lives.
According to Lau, Wong, Chan and Law (2001) QWL is the favorable
working environment that support and promote satisfaction by providing
employees with rewards, job security and career growth opportunities.
According to Hanna Sutela (2006), Quality of work life, is evaluation about
four categories, namely physical work environment, physical and social factors
in the work environment, health and stress symptoms, labour market position,
and family background variables.
According to Cunninghan, J.B. and T. Eberle, (1990), The elements that are
relevant to an individual’s quality of work life include the task, the physical
work, environment social environment within the organization administrative
system and relationship between life on and off the job.
According to Shamir, b and I. Salomon, (1985), QWL is a comprehensive
construct that includes an individual’s job related well-being and the extent to
19
which work experiences are rewarding, fulfilling and devoid of stress and other
negative personal consequences.
“In organizational design and development this is an approach that seeks to
improve the working environment and employee- employer relations “– Daya
Narayan (1997).
“QWL is the degree to which work in an organization contributes to material
and psychological well-being of its members.”-Harrison, M. (2004).
Task force of American society for training & Development (1979) defined
QWL as “a process of work organization which enables its members at all levels
to actively participate in shaping this organisation’s environment methods and
outcomes. This value based process is aimed towards meeting the twin goals of
enhanced effectiveness of organization and improved quality of life at work for
employees.”
Cohen and Rosenthal (1980) defined QWL as an “internationally designed
effort to bring about increased labour management cooperation to jointly solve
the problem of improving organizational performance and employee’s
satisfaction.
Davis (1995) held the view that QWL is quality of relationship between
employees and the total work environment.
1.11.4 Characteristics of Quality of Work Life
The above definitions bring out various salient features of QWL. Various
authorities have highlighted different areas as dimensions which they thought
to be significant factors influencing QWL. The definitions also indicate change
as they have made transition from the earlier years to the more recent ones. The
following chief characteristics are noticeable.
1) Respect for Human dignity:
The post Industrial Revolution period saw importance being given to
human beings as they were the fundamental resource of the activity.
Therefore, the companies respected their dignity, and feelings and also
gave attention to their growth opportunities.

20
Dedhia Narimns (1998) states “ quality is about behaving in a way that reflects
on individuals and organization understanding of the fundamental inter-
connectedness of structure, process and outcome.”
Hagerty, M.R., etal (2001) state that the QWL implies the quality of person’s
whole life, not just a separate component.
2) Good working environment
Working environment and working conditions greatly influence the
behavioral pattern of the employees and impact the organisations. Good
working environment and satisfactory working conditions, can motivate
the employees to do better the work assigned to them without becoming
bored. Therefore, proper layout of the building, allowing space for
machines, proper lighting, ventilation, space for movement of
employees, safety measures wherever necessary, are some of the things
which will make the work place better and efficient.
3) Job satisfaction & job Rotation
Companies should strive to ensure that employees derive maximum job
satisfaction. This will enhance their output and will increase
productivity. Periodic training programs are also undertaken to make the
employees comfortable with their work. The companies may also rotate
the work by giving different types of jobs to workers to remove
monotony. The employees also get equipped to do any work of the
company.
4) Team work and cooperation
Companies work better when there is a team work and cooperation
among all employees. Realizing the importance, companies take special
efforts in building up team work and cooperation among employees.
Good team work and interpersonal relationships among employees
positively impact the efficiency of the organization.
5) Participative Management
Workers feel better, and delighted when management considers their
suggestions in overall policy making. This brings democratic spirit in
the work and administration. Workers also can come with different
practical suggestions on issues affecting them.
21
6) Fair compensation
Companies must ensure adequate and fair remuneration for the work
done by the employees, so that no employee is left unhappy or
disgruntled. Policies of increments and other fringe benefits should be
oriented towards welfare of the employees.
1.11.5. Walton’s frame work of Quality of Work Life
Walton’s tremendous work on the structure and frame work of QWL is widely
accepted. Walton identified eight factors to measure QWL in organization.
These factors are:
I) Adequate and fair compensation
Fair compensation is the primary requirement of the employees,
which encourages them at their work place. The remuneration has to
be just and fair. The wage structure of the employees ought to be
designed in relation to the prevailing price index, which shall ensure
a decent standard of life for the employees.
II) Safe and healthy working conditions
Employers have to provide better working conditions for the
employers at their place of work. Health and safety of the employees
need to be safeguarded. Factories act 1948, also mandates that
employers provide this to the workers. Industrial safety against
hazardous processes is a paramount requirement. Working
environment also need to be conducive to work.
III) Opportunity to develop human capacities
The employees must have sufficient freedom to use their skills and
abilities to improve the work. The workers will be more encouraged
to come focused with their ideas and innovative ways which can
greatly help the organization to become more efficient and
productive. This freedom and autonomy will also improve QWL of
employees.
IV) Growth and security

22
The policies of promotion should be clear to the employees. QWL
will be positively impacted when employees are given opportunities
to grow and occupy higher positions.
V) Social Integration
The employers should be careful to ensure that employees become
loyal and develop a sense of belongingness to the organisation. The
feelings of the employees are not hurt by caste, creed or religion, nor
is there a discrimination practiced by the organisations. It will come
in the way of social integration and can adversely affect QWL of
employees.
VI) Constitutionalism
Every employee has a distinct identity and must be treated as such.
Therefore, organisations need to protect and respect his personal
privacy, right to expression, and right to be treated equitably at work
place. This ensures rule of law in the organisation.
VII) Total life span
The organisaiton should make every effort to maintain work life
balance of the employees. QWL is likely to be impacted adversely
by late hours of working or if they have to travel. As part of their
work, as they will have to remain away from their families.
VIII) Social relevance
Business organisations must be socially responsible for the work that
they do. Organsations owe to society a defined responsibility
towards their products, disposal of industrial waste, marketing
practices etc. QWL of the employees will be generally low if the
organization does not care for social responsibility or values towards
society.
This structure and frame work of Walton is the basis for the present
study.

23
Table: 1.1
Dimensions of QWL by the previous researchers
Author Year Main significant Dimensions
Hackman and
Oldham
1976 Psychological growth needs of skill
variety, task identity, tasks significance,
Autonomy, feedback.
Warr and
colleagues
1979 Work involvement, intrinsic job
motivation, job satisfaction, life
satisfaction, higher order need strength,
perceived intrinsic job characteristics.
Mirvis and lawler 1984 Safe work environment, equitable wages,
equal employment opportunities &
opportunities for advancement.
Baba and Jamal 1991 Job satisfaction, job involvement, work
role ambiguity work role conflict, work
role overload, job stress, organizational
commitment and turn over intentions.
Sirgy et.al. 2001 Need satisfaction based on job
requirement, need satisfaction based on
work environment, need satisfaction
based on supervisory behavior, need
satisfaction based on ancillary
programmes, organizational commitment.
Taylor 1979 Wages, hours and working conditions,
nature of the work, individual power,
employee participation in management,
fairness and equity, social support, use of
skills Self-Development meaningful
future at work, effect on extra work
activities.

24
Table: 1.2
Dimensions of QWL by the previous researchers
Author Year Main significant Dimensions
Walker 1975 Physical work environment, social
environment, administrative system of
establishment, relationship between life
and job.
Glasier 1976 Job security, good working conditions,
adequate and fair compensations.
Sayeed and Sinha 1981 Economic benefits, physical working
conditions, mental state , carrier
orientations, job stress, union
management relations, self-respect.
Maccoby 1984 Security, equity democracy
G.R. Mahaptra 1992 Fair compensation & security, social
relevance of work life, workers
participations in quality improvement
programmes, learning and growth
opportunities, safe and healthy working
conditions, promotion of human dignity.
Ellis and Pompli 2002 Poor working environment , lack of
involvement in decision making, lack of
recognition, professional isolation, lack
of opportunity to learn new skills.

25
Figure 1. 3
Walton’s Model of QWL
Source: Richard Walton’s (1974) Eight Dimensions Model.
Quality
Of
Work life
Adequate & fair
compensation
Opportunity to develop
human capacities
Constitutionalism
Growth
&
Security
Safe & Healthy
working Environment
Social Integrity
Total life space
Social relevance

26
1.11.6. Development Process
In the development process, QWL has undergone changes and modifications in
the conceptual structure and frame work. Nadler and Lawler (1983) undertook
the study of reviewing the stages of development depending on the type of work
environment.
First stage (1959-1972): QWL was taken as a “variable” and emphasis was on
individual worker and his behavior towards job-satisfaction, job – motivation
etc.
Second stage (1972-1979): QWL was taken as “approach”. Here the
organizational outcomes and results were ignored. The definitions in the
category seemed to be incomplete as organizational outcomes and results were
very important, along with individual worker’s behavior.
Third stage (1979-1984) : Here QWL was defined as “methods” for improving
work environment. All methods of work through better technology intended to
improve the work were included.
QWL thus includes all aspects which include the workers, there behavior pattern
working environment and the extent and use of technology in work.
1.11.7. Barriers to Quality of Work Life
It is established that quality of work life positively impacts and influences the
organisations, increases its productivity and puts it on progressively upward
scale. It also improves the quality of its human resource. However, some
stumbling blocks may impact its better execution. The following are some of
the factors, which act us hindrances to QWL.
1. Resistance to change:
It is common experience that people resist change, more so when they
are the employees of the organization. QWL will involve new ways of
working, new devices to be used. New technological working
environment, which may not be liked and accepted by employees. All

27
this is new learning and effort taking exercise. This is the strongest
hindrance and obstacle to QWL. Even if there is a change, the employees
may pretend that they have changed. Employers expectation may be
much higher than what is visible from employees. Thus there would be
a major gap between the expected and the actual change.
2. Cost factor
Not only the employees, but employers also may not like, its execution
due to extra costs. This is a great misconception and employers must
understand that the benefits to the organization of successful QWL are
far reaching than the costs involved.
3. Improved QWL may not increase productivity.
In the long term, continuous improvement in QWL may not
correspondingly increase productivity in organization. Short term
benefits are more significant as compared to long term increases.
4. Employee’s dissatisfaction.
There may be widespread dissatisfaction among employees for
observing the rules, regulations and guidelines of the management in
this regard. Employees also may not like the comparisons made between
various individuals with reference to their work. This may spoil cordial
atmosphere and may vitiate the working environment.
5. Faulty policies
Employees become unhappy if some policies affect them adversely and
impact their career options. This is particularly true of performance
appraisal system and promotion policies. Provisions of both these are to
be fully elaborated and taken before all employees to make them fully
understand the same.
1.11.8. Measures to improve QWL
The following measures by the organisations can improve QWL.
1. Giving proper attention to work-life issues
The organization should seriously consider work life issues of the
employees. Some senior members may be entrusted with the tasks of
making a proper and careful study of all issues impacting work life.
Suggestions of the workers may also be invited. This will also give
28
confidence to the employees as well as there will not be any fear of a
particular issue being ignored.
2. Self-confidence and belief in improvement
Workers and employees should feel confident and must have a strong
belief in them and the work that they do. This will have to be undertaken
by the group of seniors by designing periodic training programmes, staff
support programmes and other activities designed to make the employees
comfortable with the work. This will improve their QWL many fold.
3. Professional groups of mentors
Issues of QWL involve professional work of knowing and understanding
the job intricacies of each employee as well as issues connected with his
personal life. The group of people chosen by the management for this
purpose may also be trained. There can also be services of trained
counselors and psychologist who should be easily accessible to the
workers and in whom they can repose full trust. This will help the
organization in drafting employee friendly policy, which will address all
their issues. This will improve QWL.
4. Improvement in communication channel
All communication channels between employees and the management
and between different other employees, should be free, and operational.
If they are chocked, it will frustrate the employees, leading to adverse
impact on QWL.
5. Flexible working hours
Static working hours of many organisations act as major cause of stress
for the employees. This affects their efficiency and work output. With
this in mind, many organisations allow flexibility in working hours. This
enables the workers to bring out a balance between their work and family
life.
1.11.9. Importance of QWL
1. Increase in productivity
Programmes designed to address major issues of the workers connected with
their work and family life, and making them comfortable shall result in optimum

29
efficiency of the workers, thereby increasing the productivity of the
organisation.
2. Low Absenteeism
Organisations giving greater attention to QWL shall have low absenteeism of
workers. They tend to develop a sense of belongingness and loyalty to the place
of work.
3. Higher reputation and goodwill.
Companies with improved QWL enjoy a better goodwill and higher reputation
in the market. The workers will act as the ambassadors of goodwill and
reputation to the stake holders.
4. Job satisfaction
When workers are loyal and committed to the organization, there is higher job
satisfaction experienced by the employees. This will lead to higher
productivity.
5. Higher Retention
Organizations where QWL policies are employee friendly will have higher
retention of the staff. The rate of labour turnover will be minimal such
organisations will also attract good and skilled labour force, when they will find
that its policies are employee friendly.
1.11.10. QWL and Scientific Management
The process of Scientific Management (1947), initiated by Frederic Taylor
helped a great deal in further improving QWL. Taylor believed in minimizing
and even removing some aspects of planning, designing of the work, to make
him free to do only the assigned task. He also brought in the division of work,
to make the entire work, into smaller parts or jobs for the purpose of
simplification. The workers who were specialized in a particular part, were
given that work to perform. Thus the principle of ‘Right Work for Right Man’
was ensured. This reduced the burden of the entire work on the workers as they
had to perform only a small part. For this, he came out with the concept of time
study and work study. He also devised various incentive schemes for the
workers to reach as high level of performance as possible to take advantage of

30
the incentives. As it helped in improving the performance, concept of scientific
management was accepted by large member of industries across the world. It
contributed a lot to Quality of work life.
Fayol (1916) was also a significant contributor to scientific Management. He
came out with different principles which supported the concept and greatly
contributed in strengthening QWL. However, workers felt that repetitions of the
same work led to monotony. Scientific Management did not give any attention
to personal feelings of the employees. It considered them as just another factor
of production. It did not recognize the supremacy of the human resources over
other factors.
1.11.11. QWL and Motivation Theories
The process of QWL is closely related and works on the definite parameters or
dimensions to which organisations give high importance for improving its
performance. Different theories of motivation falling under content and process
categories also bring out its similarity with QWL. Content theories of
motivation focus on specific needs of the people in the order of priority
McGregor’s (1960) theory X, and theory Y, Maslow’s (1954) need Hierarchy
theory, Herzberg’s (1959) two factor theory are some of the theories that come
under this category. Theory x, and Theory y are based on the attitudinal
approaches of the employees. Theory x, pre-supposes that employees will
dislike the work and will avoid it, they don’t take any responsibility, and they
must be coerced, and threatened with punishment to get them to work. While
Theory y, works at the more positive side of employees, that they are committed
to organizational objectives and will take them as natural activity. They will
take the responsibility for what they do in the organization. This establishes a
work culture out of the behavioral approaches of the employees, which has a
relationship with QWL likewise Maslow’s motivational needs in the need
hierarchy theory are comparable with factors of QWL.
Herzberg also outlined certain factors like company policy, work conditions,
supervision, peer relations, relations with subordinates and called them as dis-
satisfiers. While other factors like achievement, recognition, and responsibility
were called as satisfiers, which were intended to scale up motivation of the

31
employees. QWL also recognizes similar factors to study their influence on
QWL. Thus QWL also has its origins in various theories of motivation.
Motivational theories became the source of foundation of QWL.
1.11.12 QWL issues as suggested by klatt, Murdick & Schuster (1985)
Some major issues as suggested by the above authorities influencing QWL
includes:
1. Pay package and employment stability
Good pay package is ever continuing source of attraction for the
employees. Pay schemes worked out by the organsiations shall satisfy
them, if the needs and requirements of the employees are considered.
Further the increments provided vis-a-vis cost of living as well as other
allowances should largely meet the expectations of the employees. This
will bring stability to employment.
2. Occupational stress
Adverse work environment, rigid work schedules, type of the work.
Invariably tend to make the employees stressful while they are on the
job. These factors as well as other stress related issues need to be
addressed by the management, so that performance levels of the
employees are not adversely affected.
3. Sense of Recognition
QWL is generally increased. When employees get recognition for good
work and for their efforts. Special achievements, innovative ideas, jobs
enrichment, should not go unnoticed. Management may devise a scheme
of recognition, which may be clear to the employees.
4. Flexible work schedules
Providing flexible work schedules as per the convenience of the
employees, can greatly help them in enhancing their QWL. This may be
done by calculating the total volume of work and the total work force in
the company. Flexibility should not affect the work performance of the
company.
5. Better Relations

32
Relations between worker’s supervisor as also between the workers as
team have to be harmonious and cordial. This will make the workers
comfortable and will help improving QWL.
6. Sufficient Resources
Management need to ensure sufficiency of all resources at the place of
work. This will inspire and motivate the workers to work better in
achieving higher performance.
7. Promotional policies
Promotional policies of the organization should be fair, just and intended
towards welfare of the employees. Seniority and merit is often the
criteria in the policies of the organization. The views and suggestions of
the workers’ representative need to be considered in formulating the
same. Once this is done, the workers will not remain dissatisfied.
1.11.13 Chapter Summary
This chapter focusses on different aspect of QWL. It tries to find out the origin
and the genesis of QWL Before it became important to organization. The
philosophy of total Quality Management (TQM) and the responsibilities of the
human resources are significant in this regard. The growth and development of
human resources brought about by organisations in view of changing
technology also affected QWL. Quality of work life and work life balance are
also closely associated with each other. The actual definition of QWL as given
by different authorities and researchers in the area give a deep insight of the
concept. Also the changes that have taken place in the definitions over different
periods give an idea of the emphasis by different authorities considering the
time factor. The changes that have taken place in various dimensions of QWL
also impact the definitions of QWL. The prominent factors acting as the barriers
to QWL and the way in which, they could be improved upon are also
highlighted. Some specific points of importance of QWL to organization are
mentioned. Scientific Management and Motivation theories have a role to play
in the discussion of QWL, since they relate to human resources, the nature of
work performed by them, the organization and the system of its working.
Therefore, their brief mention has become necessary.

33
References
Baba Vishwanath V., Jamal Muhammad. (1991, September). Routinization of
job context and job content as related to employees' quality of working
life: A study of Canadian nurses. Journal of Organisational Behavior,
12(5), 379-386.
Barling. (2003). High Quality Work, job Satisfication “pational injuties”.
Journal of Applied Psychology, 88(2), 173-177.
Cohen and Rosenthal, E. (1980). Should unions participate in Quality of
Working Life activities? Quality of Working Life. The Canadian
scene, 1(4), 7-12.
Cunningham, J.B. and T. Eberle. (1990). A Guide to job enrichment and
redesign. Personnel, 67, 56-61.
Davis L.E. (1972). 25-29. Arden House, Hariman New York: Paper presented
at International Conference.
Daya Narayain. (1997). Management Terms and Concepts. Vikas Publishing
House Pvt. Limited.
De, N.R. (1976). Some Dimensions of quality of working life. paper presented
at the National Seminar on quality of working life Bombay, 22-27.
Dedha, Navin S. (1998). Quality from many perspectives. Part I, 1. D.L Shah
Trust, Mumbai.
Elisaveta, S. (2006). Relationship among Perception of Quality of Work Life
and Job Satisfaction. Management and Organizational Review, 2(3),
459- 460.
Ellis, N. and Pompli, A. (2002). Quality of Working Life for Nurses.
Commonwealth Dept. of Health and Ageing. Canberra.
Gilgeous. (1998). The Quality of Work Life. Integrated Manufacturing
System, 9(1), 173-181.
Glasier, E. (1976). State of the art, question about quality of work life
Personnel.
Guest, R.H. (1979). Quality of Work Life-Learning from Tarrytown. Harvard
Business Review, 57, 76-87.
Hackman J, & Oldham G . (1974). ) The Job Diagnostic Survey. New Haven:
Yale University.
Hagerty, M. R., et al. (2001). Quality of life Indexes for National Policy:
Review and Agenda for. Social Indicator Research, 55(1), 1-96.
Hanna Sutela. (2006). Correlate with the Definition of QWL. Statistical
Journal of the United Nations, 23, 57- 67.

34
Harrison, M. (2004). Diagnosing organizations: methods, models, and
processes (3rd ed ed.). Thousand Oaks, CA: Sage.
Jenkins, D. (1981). QWL: Current Trends and Direction, A series of
occasional paper No.3. Ontario: Quality of Work Life Centre.
Klatt, Murdick and Schuster. (1985). Human Resource Management Ohio :
CharlesE. Merrill Publishing Company.
Kumar, A. and Tripathy, S.K. (1993). Small group participation and Quality of
working life: A study in Rourkela Steel Plant. The Indian Journal of
Labour economics, 36(4), 825-828.
Lau, Wang, Chan and Law. (2001). Information Technology and Work
Environment- Doers it Change the way People Interact at Work.
Human System Management, 9(3), 267-280.
Lippitt, G. (1978). Quality of Work Life: Organizational Renewal in Action.
Training & Development Journal, 7, 4-10.
Mahapatra, G.R. (1992). Quality Circles for Quality of Work Life.
Management and Labour Studies, 17(3), 126-136.
Maslow, A.H. (1954). Motivation and Personality. Harvard Business Review,
91.
McGregor, D. (1960). The Human Side of Enterprise. McGraw Hill, New
Delhi, 4.
Michael Maccoby. (1984). Helping the Labour and Firm set up a QWL
Programme. Monthly Labour Review, 107(3), 28-32.
Mirvis and Lawler. (1984). Accounting for the quality of work life. Journal of
Organizational Behavior , 5(3), 197 - 212.
Misra Shaili. (2013, September). Quality of Working Life: A key to Humane
Working. 2(6).
Nadler, D.A., and Lawler, E.E. (1983). Quality of work life: Perceptions and
Direction. .Organizational Dynamics, Winter., 11(3), 20-30.
Nagpal Asmita, Nitin Yadav. (2014, April). An Overview of Quality of Work-
life. International Journal of 360o Management Review, 2(1).
Robins, S.P. (1989). Organizational Behaviour: Concepts, Controversies, and
Applications. New Jersy: Prentice Hall.
Sayeed, O.B. and Sinha, P. (. (1981). Quality of Working Life (QWL) in
relation to Job Satisfaction and Performance in Two Organizations.
Managerial Psychology, 2, 15-30.
Shamir. B and Salomon, I. (1985). Work at home and the quality of working
life. Academy of Management Review, 10, 455- 464.

35
Sirgy, M. J., Efraty, D., Siegel, P & Lee, D. (2001). A new measure of quality
of work life (QoWL) based on need satisfaction and spillover theories.
Social Indicators Research, 55, 241-302.
Suttle, J.L. (1977). Improving life at work problems and prospects In J.R.
Hackman & J.L. Suttle (Eds.). Improving Life at Work: Behavioural
Science Approaches To Organizational Change, 1-29.
Taylor J C in Cooper, CL and Mumford, E. (1979). The quality of working life
in Western and Eastern Europe. ABP.
Walker, K.F. (1975). Workers’ Participation in Management: Concepts and
Reality. Bangladesh Psychological Studies, 6, 31-37.
Walton, Richard E. (1973). Quality of Work Life: What is it? Sloan
Management Review, 15(1), 11-21.
Warr, P, Cook, J and Wall, T. (1979). Scales for the measurement of some
work attitudes and aspects of psychological well being. Journal of
Occupational Psychology, 52, 129-148.
36
Chapter II
Review of Literature
This chapter deals with Review of literature. This is concerned with an elaborate
study, examination and analysis of knowledge on a specific subject. An
academic Research review makes an objective, unbiased assessment and gives
an insight into the subject of study. A major component of any research is to
know and find out the extent of the work done before, by the researchers in the
particular area. It may be in the form of primary data collection. Projects
undertaken or theoretical articles or peer-reviewed articles subjected to Scrutiny
by a team of experts. Literature review prepares the mind of the Researcher and
enables him to decide upon the approach of his current research. It makes the
job of researcher in preparing a detailed research plan more easier. It also
highlights and identifies the gaps existing in the work done by others and to
make efforts to fill those gaps by undertaking detailed and extensive study.
2.1 Reviews related to demographic factors
Quality of work life is observed to be different with respect to different
demographic factors like Age, education, experience, gender, income level,
marital status etc. Even within the same factor, the sample and respondents
show different result. The studies undertaken tend to show this and its influence
on QWL.
Billingsley and Cross (1992) made a study of general and special educators in
Virginia. The result showed that demographic variables like age, experience,
gender do not influence job satisfaction and organizational commitment as
much as components of leadership style, role ambiguity and work stress.
Bolhar (2011) made a study of the extent of variations found in levels of QWL
of employees of IT Companies. The result of the study suggested that factors of
age, experience and income were found to influence QWL.
In a study made by Chen Huang (2005), to find the impact of QWL on
organisation’s commitment, it was found that demographic factors of age,
gender, marital status significantly impacted QWL and organisational
commitment.

37
Das and Tripathi (2011) Made a study of QWL of Municipal employees in
Odisha. The findings of the study showed that workers were not satisfied with
career options, Pay, promotions, welfare policies, social security and
participation in decision making system. They felt that they were disadvantaged
with other workers in Public Sector understandings. The female employees
were found to be more dissatisfied than male employees.
Ganapathi R & Bhaskar Padma(2011) Made a study of QWL among
employees of Public Sector Banks in Coimbatore city. Factors of age, gender,
income level, education were considered in making this study. Primary QWL
components of pay, job security, decision making, work stress, Welfare
measures were highlighted. The study found that age group of employees and
the job satisfaction was significant.
Geetha V. et. al. (2010) Made a study of specific factors of QWL of employees
of IT industry. The study was to find the relationship between components of
QWL of job satisfaction, fatigue and monotony and work stress with other
factors of safe working conditions, adequate and fair compensation, welfare
measures and demographic attributes of age, marital status and education.
Hunjara et al. (2010) made a study to find the influence of certain factors like
work autonomy, work environment leadership behavior on job satisfaction. The
study covered the employees of banking sector in Pakistan. The results of the
study showed that there is a positive relationship between work environment,
autonomy, type of leadership and job satisfaction. The results also showed
differences in the level of job satisfaction between male and female employees.
Hussain (1999) made a study where he revealed that age and income
significantly influences QWL. He also found that employees of Public sector
Banks derive better Job satisfaction than their counterparts in private sector
banks.
Indumathi and Salvan (2013) Made a Study of the level of QWL of male and
female employees in IT companies. The result showed that there is no
significant difference between male and female employees extent of QWL. It
38
was found that female employees are dissatisfied with work stress, social
integration and interpersonal communication. Male employees were found to
be dissatisfied with job security, and management policies.
Kanagalakshmi et. al. (2003) made a study of the relationship between
demographic factors with certain specific parameters related to work such as
work environment, welfare measures, safety measures, supervision and
interpersonal communication. The results showed that there was no close
relationship between the factors of experience, family size and income and
perceived quality of work life, however age and education had close association
with Quality of work life.
M. Thamizhselvi(2020) has conducted a study titled Gender difference and its
impact on QWL. The primary objective of the study is to find out QWL among
employees of banking sector in Bangalore. The data was collected from the
employees of 15 public sector and private sector banks in Bangalore city. The
researchers used the tools of multiple linear regression, t-test and factor analysis.
The study found that QWL is not impacted by gender and employees
experienced QWL in equal degree and extent. The emotional element was found
to be existing more in women and they had inclination towards public sector
bank other facilities and benefits offered by public sector banks was also an
attraction for them. Male employees were found in more number in private
sector banks.
Mehrotra and khandelwal (2015) conducted a study of the relation of
demographic factor of age, gender and income with QWL of employees in
technical institutes in Bareilly. The study showed association between QWL
and demographic factors. The satisfaction level of female employees was higher
than the male employees with respect to QWL.
Narayanan R. & Zafar syed M (2011) Examined the factors impacting job
satisfaction among software professionals, in IT park, Chennai. The result
showed that work environment Superior-Subordinate relationship, employee
experience directly influences job satisfaction of employees.
39
Rose et. al. (2006) Studied QWL of managers of Multinational corporations
and small and medium industries, in relation to their career options. The results
of the study showed that age, marital status, income, education positively
impacts quality of work life. It was found that career satisfaction increases with
age and long years in service. Employees of multinational corporations were
seen to have higher QWL than small and medium industries.
Shibu N.S. (2011) Made a study of job satisfaction of faculty members of
Private Universities in Tamil Nadu. It was found that overall they are satisfied
with their job and conditions of work. However, there was also emphasis laid
on proper course allocation, adequate training facilities and other physical
facilities.
Tabassum Rahman and Jahan (2010) made a study and found that male
employees had higher QWL than their female counterparts. This is particularly
significant to Banks and other service organizations, which make effort in
attracting and retaining quality human resources. The study suggests that some
dimensions of QWL like development of human capacities, flexible timings,
fair compensation, healthy working environment, which if given importance
will lead to better QWL.
Tanushree Bhatnagar and Harvinder Soni (2015) made a study to examine
the influence of QWL on job satisfaction considering variables of gender, work
experience and age of teachers in the city of Udaipur. It is observed that there
is relationship between job satisfaction and QWL.
2.2 Reviews relating to stress
Stress is an important predictor of QWL. It influences an employee’s behavior
at work place, by making him feel uneasy, tense, frustrated and low in
confidence. His QWL also gets adversely affected. As the stress has direct
influence on the work and jobs of the employees’ organizations now a days take
all efforts to make the employees less stressful by suitable policies which are
designed to specifically address this issue. Literature review made herein, helps
to know the extent of stress arising out of employee behavior with reference to
his work and job, and the measures taken by the organization towards its
minimization.

40
Ahmad et. al (1985) conducted a study to find the extent of stress levels among
executives of Public and Private sector organisations. It was found that
executives in Public sector organisations had a significantly higher stress level
than those of Private sector organisations.
Akhtar and Vadra (1990) made a comparative study of extra organizational
stress among women employees in the research paper. They argued that many
sources of stress in the organisations can be attributed to outside Events. Some
factors like conflict in family, financial crises, health issues and illness are the
primary sources of stress.
Akinnusi (1994) made a study of the relationship between personal attributes,
stressors, stress reactions among workers. The results revealed that higher
education and highly qualified workers are more prone to psychological stress.
They are also impacted by organizational stressors than other lower qualified
employees.
Chaudhry (1990) made a study of relationship between job satisfaction and
role stress of Bank officer. Results showed that role stress and job satisfaction
were negatively related in all age group of Bank officers.
Edwards and Rothbard (2000) made a study and observed that stress and
conflicts arise from non-fulfillment of demands and requirements of work and
family life. Such conflicts are time related, strain related and type of behavior
an employee exhibits.
Fiedler et. al. (1979) made a study to investigate how persons in leadership as
well as staff positions behave, in using their intelligence and experience in
military organizations. It was found that persons behave effectively and use
their intelligence, if the relationship with their immediate superior is cordial and
non-stressful. Intelligence is misused and behavior is erratic in the situations of
high stress.
Jagdish (1983) made a study and tried to establish the relationship between
work stress and job satisfaction and mental health of supervisors. The study
established that work stress comprising of excess work, inter personal conflicts,
disturbed relation with peers, low status significantly impacted job satisfaction.

41
Jamshed et. al. (2011) observed in his study that bank employees experience
stress at their work places because of prolonged time to work, lack of support
from higher authorities, and excessive pressure of meeting the work targets. All
this, results into increased stress and leads to lower employee performance.
Lindstrom (1991) in his study observed that employees who deal with cash
transactions and who are actually handling cash are more stressful because of
additional risks as well as for the possibility of making a mistake connected with
cash.
Michailidis and Georgiou (2005) conducted a study and found that stress
levels of employees of Banks are directly proportional to their educational
levels. The study bought out the practices of some employees of taking work
related problems home, and conversely, also bringing their family problems to
their work places. This severely disturbs QWL and becomes a major cause of
stress.
Mishra (1994) made a study of occupational stress, ego, strength and job
satisfaction and found that some stressors did not have any relation between job
satisfaction and involvement.
Mishra (1997) did a study on employees of public and Private sector
organisations and to compare the levels of job stress among them. It was found
that workers of Public sector were more stressful than their counterparts in
Private Sector. Factors of role-conflict, poor team relations lack of freedom and
enough authority were significantly impacting the job stress.
Mohd Abass Bhat (2013) made an empirical study of the stress among
employees of Bank. He observed that work stress of the employees increase
when there is an imbalance in work life. Added to this are the other factors of
poor supervision and control, poor relationship with co-workers and unclear job
profile, which resulted into higher stress.
Montowidlo, packered and manning (1986) have come out with their study
that organisations which have stress related problems of employees, adversely
affect job satisfaction, which result into increased absenteeism and greater staff
turnover.
42
Parashuram (1981) made a study and found that hierarchical levels and
positions of work give rise to frustrations thereby leading to stress. Constant
interference in assigned jobs and lack of enough freedom significantly lead to
stressful situations.
Pleck (1985) did a study on conflicts between work and family life, and
suggested that women take more family stress in their role as household
performers. The demands and requirement of the family come in the way of
performing the work more than the men. Thus gender wise difference is
observed in performance level of the work.
Reddy and Ramamurti (1992) attempted to study the levels of stress among
the executives of the organisation. The study found that some older executives
experienced more stress compared to others. Stress had a direct relation with
some predictors like working with colleagues, work environment, and working
conditions.
Samdani and Deshmukh (2014) investigated into various issues relating to
stress at work and QWL. The causes and adverse effects of occupational stress
on the health and well being of employee were highlighted. They also studied
extensively various research papers dealing with stress at work and QWL.
Sen (1982) made a study of Managers with low educational qualifications and
their Behavioral commitment to work. It was found that because of their lower
qualification and lesser chances of going up the promotional ladder, they were
inactive and less committed to the work of the organisation.
Shah (1980) made a study to find out the influence of stress on the work
behavior of employees of Co-operative Banks, Consumer society, and co-
operative department. The study found that employees felt significant changes
in their behavior by way of fatigue, tiredness, headaches, loss of appetite,
indigestion and loss of sleep.
Shilpa Sankpal, Pushpa Negi and Jeetendra Vashishtha (2010) conducted a
study to find out the levels and the extent of stress among employees of Public
and Private sector Banks in Gwalior city. The study found a great difference in
the levels of stress of Public and Private sector Banks employees. The

43
employees of Private sector Banks experienced high stress than the employees
in Public sector Banks.
Siegrist and klein (1990) examined the occupational stress of employees and
its impact on cardiovascular reactivity. The study found that high blood pressure
fluctuations is the result of high occupational stress.
Singh and Nath (1991), made a study to examine the effects of organizational
climate role stress and focus of control on job involvement of banking
personnel. Results showed that employees in higher positions in organisations
had higher organizational role stress than others.
Srilatha (1988) made a study about occupational stress at management levels
in certain organisations. The study found that young managers with higher
salaries are highly satisfied than the managers who are older and earned less
salary. This also had the relation with increased stress among elders.
Srivastava and Krishna (1991) studied the relationship of different levels of
workplace stress with job performance of employees. It was found that workers
with lesser level of stress performed their jobs effectively.
Vachom (1987) carried out a study to investigate the extent of stress of
executives while performing their professional work in the organization. It is
observed that stress is experienced by executives both inside the organisation as
well as in the family.
2.3 Reviews related to Improving QWL
Quality of work life of employees is made up of various dimensions or
predictors which differ in the degree of importance or satisfaction for
employees. Therefore, organisations take utmost care to strengthen the
dimensions through different programs and policies. A review is also taken
periodically of the polices and due changes are made to make it more employee
friendly. The following studies undertaken show the results towards its
achievements.

44
A Sabarirajan, N. Geethanjali (2011) have done a study, which finds that
organisational excellence has higher impact on the level of QWL in an
organisation. The performance of organisation can only be improved if human
resources are satisfied with higher quality of working life. The other dimensions
of QWL like job stability, climate, performance and development, promotion,
welfare measures need to be strengthened.
Ajala (2013) made a study of QWL by highlighting the dimensions of job
satisfaction, supervisory support, organizational support and growth and
development. It was found that all these dimensions positively impacted the
working environment and influenced QWL.
Ajala (2013) studied the relationship and impact of health and well-being of
workers on QWL. The study found that predictors of job satisfaction, effective
supervision, support of organization positively influenced health and well being
of employees.
Allan and Loseby (1993) suggested that Quality of work life positively
influences and builds up more loyal, Committed and motivated workforce,
which are essential in determining the productivity and profitability of
company.
Amin (2013) made a study of public sector service organizations in Indonesia.
This was done to find out the career and growth opportunities of employees.
Demographic variables of Age, sex, education, experience, gender were used
for the purpose of study. It was found that there is significant relationship of the
dimension of growth opportunity and QWL.
Anbarasan et. al. (2010) in their study tried to find out dimensions of QWL
among sales executive in pharmaceuticals, finance, banking and insurance
sector. It is revealed that sales people were quite low on the dimensions of
QWL. They were aware about their job profile and were committed to their jobs,
but their work environment was not conducive, thereby affecting their QWL.
Anjali Jacob (2018) has done a study which found that major factor that affect
overall perception of QWL is job satisfaction. Majority of the workers are
satisfied with physical working conditions. There exists relationship between

45
compensation and social recognition. The suggestions for improving QWL is to
provide flexible working time to reduce frequent transfer of employees, and to
provide recreational and canteen facilities.
Antle J. Beverly (2006) made a study of the quality of work life of social
workers in Ontario. The result of the study showed that social workers are more
stressful for unpaid work. The stress comprised of depression, illness, not
having timely meals. It was also found that levels of stress were different in men
and women.
Anukool Hyde and Barkha Gupta (2018) have done a study which conclude
that certain factors like respect at the work place and better working
environment impact Quality of Work. Employees must also feel valued and
appreciated for the work that they do.
Aravinda M. Ratna Kishore (2016) have conducted a study, which finds out
that employees are in favor of shift wise working systems. The Managerial
employees are ready to share their responsibility with other employees in the
Bank. Most of the employees prefer 5 days’ week so as to give more time to
families. Employees desire that facility for conduct of Health camps and yoga
camps be made available. Many employees also felt that support from the boss
is significant in balancing work life. The study finds that flexible time, home
working, child care facilities and option to work part time are some facilities to
be introduced.
Aryee, Fields and Luk (1999) conducted a study to find out the significance of
specific dimensions of QWL. They found that job satisfaction of the employees
was the prime factor that influence QWL.
Asgari et. al. (2011) observed that in order to scale up orgnisational
committment of employees, certain qualities of employees’ life, training,
organizing, decision making and ensuring maximum presence at work place
need to be effectively strengthened. A strong employee and a good manager will
help in raising productivity and performance of the organization.
Avni sharma, Roopam Kothari (2014) have done a study, which reveals that
Public Sector Bank employees are dissatisfied with compensation but Private
46
Sector Bank employees get compensation on the basis of their performance. It
is also found that there are more career opportunities for the employees of
private sector Bank to grow as compared to public sector Banks. In both Public
and Private sector Banks, it is found that it is difficult to maintain work life
balance as the work pressure is more.
Ayesha et.al. (2011) have made a study to find out and make comparative
analysis between male and female Bank Employees of private commercial
Banks, as regards dimensions of Quality of work life. The data is collected
through field survey of male and female employees separately. The differences
are observed as regards the dimensions, of adequate remuneration, flexibility in
Banking, job assignment, job design and team work and employee relation. The
findings of the study suggest that management of the Banks should take note of
this, for ensuring better efficiency in the Banks. Environment directly influences
work performance of employees.
Azril, M.S.H. et. al. (2010) have done a study of Quality of work life of
employees of Agriculture. The study focused nine factor of QWL. The study
points out that all nine factors have significant and positive relationship with
performance and they are directly correlated. Some factors like job satisfaction,
Job policy work, Professionalism and its extent, and systematic approach of
organisations.
Baba and Jamal (1991) focused on certain factors such as Job satisfaction, Job
involvement, Job stress, work role ambiguity, organizational commitment and
work role conflict. He suggested that these factors have a positive influence on
Quality of work life.
Balkrishnan, V. (1976) made a study of motivational approach to Industrial
Management, where he tried to find out the importance of certain factors like
social, financial, rewards and recognitions and growth of industrial employees.
Results showed that physical and financial factors were important to workers as
compared to other factors.
Bandara Nayak (1999) made a study on leadership styles and job satisfactions
among supervisors. The result showed that relationship with supervisors was a
highly significant factor for increased level of satisfaction. Those employees
47
who had cordial relationship with supervisors were found to be highly satisfied.
Where there was strict supervision and relationship was not cordial, resulted
into employees being less satisfied.
Barkha Gupta (2016) made a study which reveals that bank authorities should
enhance good functioning of the factor Particularly training and personal care
of woman which can reduce the rate of attrition in the organisation.
Barkha Gupta and Dr. Anukool M. Hyde (2013) have done a study in which
they observe that Quality of Work Life refers to the level of happiness or
dissatisfaction with one’s work in the organisation. The authors make a point
that good Quality of Work Life provided by the organisations lead to motivation
of the employees. Quality of Work Life revolves around the working Conditions
and the degree and the manner in which it is impacting the workings in the
organisation. The result of the study shows that gender, experience, age, income
does not make any significant impact on Quality of Work Life of Managerial
employees of Private and Public sector Banks. The Study also shows that
Managerial employees have good relationship among themselves in work
related situations.
Bearfield (2003) conducted a study of QWL of workers in Australia, and
concluded that employees, who have higher level of education derive greater
job satisfaction than others whose education level is low.
Behzad Janmohammadil (2014) made a study to find out the impact of factors
of QWL on the performance of the staff of Tax Department. The study found
positive and significant influence between QWL factors and performance.
Beukema (1987) conducted a study and suggests that QWL is positively
influenced by the extent of power and authority given to the employees by the
Management. Employees if given sufficient powers, freedom and authority are
able to adjust their jobs and work better. The study suggests that the interest of
the individual is of prime importance which will make work environment better
and will result into improved QWL of employees.
Bhandari (2004) came out with the findings of his study about the Quality of
life of women, and asserted that their lives are greatly influenced by the roles
they play in the family at home and the other that they play at the work place as

48
part of the organization. He also observed the primary issues of significance of
quality of their life.
Bing and Stanley (2014) did a study and tried to relate job satisfaction to
dignity of employees. An organization become higher in the eyes of the
employees when it is able to maintain their dignity. Their loyalty to the company
increases when employees feel more dignified and job efficiency also becomes
higher.
Black and Forro (1999) made a study and found that humour among the
employees at places of work also contributes to better QWL. It leads to job
satisfaction among employees and they also become more productive and
innovative.
Bowen et. al. (2008) made a study to take an overview of QWL and found that
specific factors of participation in decision making process, greater autonomy
in doing the work, recognition for performance have an effect on Job
satisfaction.
Braun (1985) made a study by a Research paper titled American workers and
quality of working life. According to him organisations want QWL to increase
physical productivity. He opined that productivity can be better defined and
understood by including and asking for the views of the workers. Workers are
better equipped to suggest ways and means to improve productivity and reduce
cost. Workers have a right to demand Industrial justice and work with relatively
moderate or average effects.
Burke and Greenglass (1999) in their study observed that conflicts and
interferences of employees in both work to life and life to work result into lower
level of job satisfaction and commitment to organization.
Celia and Karthick (2012) conducted a study of QWL in IT sector. It is
observed that job satisfaction, recruitment and retention of employees is closely
related to QWL.
Chakraborty (1986) found that there are many hidden situations in
organisations which may influence QWL. Therefore, Researchers should take a

49
deep insight of all such factors, which outwardly are not visible. But which has
the power to influence QWL.
Chan and Wyatt (2007) made a study of Quality of work life of employees in
China. They identified factors of job satisfaction, affective commitment
turnover intention, life satisfaction and General well-being of the employees on
their satisfaction levels. The study finds out that Esteem need is the most
important in the job satisfaction of employees. Knowledge, health and safety
are impacting affective commitment.
Chan Choon Hian et. al. (1990) made a study to investigate the influence of
QWL on trade union and organization in Canada and united states. The study
examined various issues concerning union participation in QWL programs,
structure of QWL programs, the nature and extent of benefit for the employees
etc.
Chan et. al. (2000) made a study by focusing on the dimensions of work stress,
satisfaction of general practitioners, lawyers, engineers, teachers and life
Insurance employees. The outcome of the study showed that pressure of
performance and work family imbalances caused greater stress and affected
their QWL. It was also found that work stress, security of jobs and performance
pressure negatively impacted work satisfaction.
Chandranshu Sinha (2012) made a study of factors affecting QWL in Indian
organizations. Her study revealed that there were three identifiable factors,
which were playing a significant role in meeting the need of the employees the
three factors were existing relationships and its sustenance.
Chapman and Judith Ann (2007) made a study particularly by taking the
approach of and highlighting safety at workplace as they thought this to be very
important in good QWL. They observed that industrial and workers’ safety
should be the central issue which should form the essence of organizational
policies.
Charu Datta, Jeet Singh (2015) have done a study, which found that level of
satisfaction is lower in ICICI and Axis Bank. Welfare policies in Private sector
Banks are not clear. But in public sector banks they are clear and legally
50
implemented. Job security in Private Sector Bank is low as compared to Public
sector Banks. The study recommends that salary to be paid as per experience
and knowledge of the employee. Stress reducing techniques like yoga and
meditation be made available. Proper award be given for overtime. Periodic
brain storming between employees and employers and issues related to work
life be conducted.
Chaturvedi Vijit (2010) made a study of employees of hotel Industry in Delhi
National Capital Region (NCR) focused on parameter like compensation,
communication, Training & Development, supervision and nature of the work.
The employees were selected by convenience sampling. The study was more
focused at finding out job satisfaction of employees. The outcome of the study
suggested that all parameters significantly influenced job satisfaction and
employees were satisfied with nature of communication adopted by the
industry, which led to clear understanding of instructions and orders from the
top management.
Chaudhari (2004) in his study develops a relationship between QWL and
customer satisfaction and employee satisfaction. The study focuses and
concludes that employees need to do learning for keeping them updated as well
as for the betterment of the organizations.
Chinomona et. al. (2013) studied and tried to analyse the impact of QWL on
job satisfaction, and loyalty and commitment of employees of small and
medium enterprises. It was observed that job satisfaction, job commitment of
SMEs, favorably influences QWL.
Chomal and Nitu (2014) studied the relationship between performance and
rewards and its effect on the job satisfaction level of Managers and clerical staff
of banking sector. It was found that clerical staff were highly dissatisfied with
the prevailing performance reward relationship.
Cohen and Rosenthal (1980) in their study came out with the observation that
QWL mechanism brings out a cooperative approach between workers and
Management thus benefitting the organizations. It ought to take an overview of
the problems, difficulties and obstacles in the way of higher performance and
take suitable measures to overcome them.

51
Cooke and Rousseau (1984) observed that Multi-role performing employees
generally give rise to stressful situations. Expectations of the employees in work
performance leads to stress, arising out of conflicting roles, work overload and
imbalances in different multi-jobs.
Costello and Sang (1974) observed that new job recruits of public sector utility
firms were satisfied with security and social needs, but behaved differently in
fulfillment of other needs of self-esteem, autonomy and self-actualization.
Cox and cooper (1989) in their study found that individual aspiration and
ambition to go ahead and occupy the highest positions was a significant
predictor of advancement and such employees enjoyed working for longer
hours.
Daljeet Kaur (2010) conducted a study which found that, the employees were
happy with working conditions of the Bank. The employees also felt that they
were safe and secure in the Bank. They felt that transport facility should be
provided to them. However, employees felt that growth opportunities were
limited. Extra facilities like health camps should also be provided to them.
Debabrata Mitra (2012) in his study found that organizations have given prime
importance to the health and well-being of employees and therefore have put
restrictions on the number of hours of overtime which employees can do.
Debasish Sur et.al. (2012) did a study of work life Balance of college Teachers
and concluded that most of the teachers want to have a better WLB, which can
improve their performance. In this connection it is also important to have better
policies of the university towards them. The employer – employees’ relations
also matter, a great deal in these regard for increased job satisfaction, the college
teacher felt that, better infrastructure is necessary for teaching, learning and
other academic activities.
Delamotte and walker (1974) made a study titled “Humanisation of work and
the quality of working life - Trends and issues”. They indicated that more
significance is given to the human aspects of the work and the human
components such as protection of workers from industrial accidents, ensuring

52
proper safety of the workers, consideration for human feelings and compassion
and protection of workers from arbitrary laws of management.
Demir and Mahmut (2011) conducted a study to find out the feelings of
employees about their organization and QWL. It is observed that there is
positive relationship between QWL and the feelings of employees to continue
to work in organization.
Dhillon and Dandona (1988) Made a study of Quality of work life of Managers
of public and private sector banks. The Managers of two categories of Banks
were compared with the dimension of Job commitment. Significant differences
were observed.
Dhillon, P.K. and Dondona, N (1988) made a comparative study of managers
of Public and Private sector Banks with reference to QWL and job involvement
in a research paper. The results of the study found significant difference in QWL
and variable related to job involvement, in Public and Private sector Banks.
Dinger et. al. (2010) tried to study work family conflict of IT Professionals.
The pattern of work and Individual behaviour of employees was found to be the
prime cause of imbalance between work and family life. The dimension of job
security, when employees have high job security. Is the stage where this work
family conflict reduces substantially.
Divya Negi and Seema Singh (2012) have done a study which concluded that
it is a primary desire of professionals of public and private sector Banks to
significantly consider the personal and family interest, which if given due time,
shall positively impact their working in the organisation.
Donaldson, et. al. (1999) made a study about health promotion programs
towards improving QWL of workers. Findings suggested that work system
improves where workers are involved and made a part of the health promotion
activity by the organization.
Elizur (1990) conducted a study of the employees in Israel and found that
quality circles improve the job satisfaction of employees and QWL in
organisations. The study investigated about job satisfaction of employees, and
perception about Quality circles.
53
Elmuti et. al. (2010) made a study to find the effects of outsourcing of the work
of employees of industry on QWL. The result of the study was that, the
outsourcing of activities had a negative impact on QWL of employees.
Eurofound (2006) conducted a study and observed that QWL to be better and
effective, there needs to be a balance between work life and personal life. More
important dimensions of QWL can bring better balance between work life and
personal life.
Farjad et. al. (2013) conducted a study focusing on certain dimensions
impacting QWL and commitment to organization. It was observed that health,
better working conditions and scope for development of human capabilities
directly impacted commitment of employees to organization. However, salary
and remuneration did not significantly impact loyalty and organizational
commitment.
Fields and Thacker (1992) made a study to investigate the effect of unionism
on commitment of employees in QWL programs. It was found that employees
showed positive relationship to QWL program, only when it was to their
advantage.
Gain (1993) suggests that QWL should significantly consider human element
in the workers and give it high importance. Improvement than should be brought
about in their working through specific training programs, innovating better
work practices, and providing a conclusive working environment. This will
raise the level of QWL of the organisations.
Galinsky and stern (1990) emphasized that an un stable work environment and
family commitments adversely impacted employee morale and motivation. This
reduced productivity and increased burnout.
Gallie and Duncan (2010) investigated QWL of individual performers,
members of team work performers and consultants. The study found individual
tasks performers to be more effective followed by the consultants.
Ganesan and Johnson (1992) made a study of stress and its effect on health of
supervisors. It was found that lower level supervisors experienced higher stress
than others.

54
Gani (1993) found that the essence of QWL is highly respecting the worker as
a human being at the workplace, bringing improvements in working
environment, changing, modifying, re-designing work practices and worker to
be primary element in decision making.
Gardon (1984) suggested in his study that QWL, looked at from the angle of
productivity and satisfaction of workers, Working Environment, Interpersonal
relations, ability of working in teams give better result to the individual as well
as to the organisation and thereby leads to better Quality of work life.
Gary (1988) conducted a study to find the QWL of new interns with managers
using employees of Insurance Company. He found that Quality of work
relationship is directly related to the work outcomes of the interns.
Gaurav Deep Rai (2015) has done a study which indicates that Quality of Work
Life in the Banking sector can be enriched by the introduction of flexible
timings, employee integration in decision making, work restructuring, job
designs and unionization. The study and its analysis proves that experience and
designation has a significant impact on the perception of QWL. Stress relieving
process through proper training, importance of employees in decision making
process, grievance redressal of employees, development of inter and intra
personal relations can help develop QWL.
Ghalawat suman and Dahiya Promila (2010) Made a study of factors
impacting work life balance of employees of banks and insurance companies.
The study suggested that factors such as multi-tasking roles, extended working
hours, peer pressures, influenced the personal and professional life of
employees. It was also found that flexible working hours, training and
development programs of the employees and promotional policies also
impacted their work life balance.
Ghosh (1992) compared QWL programs of two different organisations with
specific defined dimensions and came to the conclusion that in spite of
difference in the working, employees of both organizations attained high
standard on QWL programs.

55
Goodwin’s Booke and Dickenson (1996) found in their study that satisfaction
of the workers increases with fulfillment of factors like healthcare, pay and
remuneration, career opportunities and maintaining proper work life balance.
Graham (1985) made a study to find out Behavioral pattern of employees while
they are engaged in the work. QWL Programs are accepted or rejected as per
reactions of the workers to policies decided. Results of the study showed that,
when workers are closer to organizations and Management and if their relations
are strong, QWL of workers will be higher. If working procedure disturbs the
team spirit and interpersonal relations among workers, QWL is likely to be
affected adversely.
Greenhaus (2003) does a study to find out relation between work family
balance and Quality of work life. He examines three components in this regard.
Time balance, where division of time is properly made between work and
family, Involvement balance between work and family and satisfaction balance
where he derives equal satisfaction between work and family. The result of the
study shows that, those workers who spent greater time on the family
experienced higher Quality of work life than those, who made a balance
between work and family.
Gupta et. al. (2009) made a study and conducted scientific survey of Public
sector organisation. The study highlighted prominent factors affecting
satisfaction level in the organisation.
Ha Que (1992) has suggested that QWL is impacted by Job satisfaction. He
found out that there is significant relation between QWL and performance.
Heckscher (1984) considers in his study work environment, job security better
compensation and reward system, career and growth opportunities to be
significant factors of QWL. He suggests that QWL is a multi-dimensional
Matrix of these factors.
Heskett, Sasser and Sehlesinger (1997) in their study highlight the feelings of
employees to be important dimension which influences profitability and
productivity of organisations. Positive feelings of employees towards their jobs,
their co-workers result into better QWL.

56
Hetanshi Vakta (2014) conducted a study to find out different implications of
work life balance and Quality of work life among women employees of Public
and Private sector organizations. The study found out that work related factors
had a negative influence on QWL. It also showed that women employees are
not happy or satisfied and this has unfavorable impact on their families this also
affected the organizations.
Himesh Sharma, Karminder Ghuman and S.N. Ghosh (2016) made a study
which reveals that top Management should take corrective measures to provide
higher QWL for their employees. The finding of the study indicates the
existence of positive and significant correlation among various dimensions of
QWL as well as with overall Quality of Work Life for managers of public &
private Banks.
Hoque, M. Ekramel, Rahman and Alinoor (1999) Made a study to find out
quality of work life of Industrial workers of public and Private sector
organisations in Bangladesh (Dhaka) and to investigate whether there is any
significant relationship among QWL and job behavior of the workers. The study
showed that workers of Private sector organizations perceived higher QWL than
the workers of Public Sector organisations. QWL of the workers directly varies
with their performance.
Hossain and Islam (1999) conducted a study to find out QWL, and job
satisfaction of nurses of Govt. hospitals in Bangladesh. There was a significant
correlation between QWL and job satisfaction.
Hosseini (2010) made a study and found that certain factors like Growth
opportunities, career satisfaction, achievements and rewards play a major role
in motivating the employees, which in turn increases their QWL.
Hour et. al (1994) in their study suggest that many companies believe that,
worker or employees are likely to choose an organization which is giving high
QWL. This will enable more job satisfaction to employees which will also lead
to high performance.
Ismail (2008) makes a study about relationship between work family conflict
and quality of life. The main purpose of this study is to link social support to

57
work family conflict and quality of work life. Findings of the study point out
that work Family conflict has relationship with quality of life. The author
suggests that quality of work life and non-work life are mediators between work
family conflict and quality of life.
Jacobson et. al. (2014) did a study to find out whether the levels of employees
were impacted by specific factors of work life. The factors chosen were work
satisfaction, emotional and extent of sick leave.
Jain Bindu & swami Yashik (2014) made a study of QWL in Indian academic
sector and found that QWL of teacher is not satisfactory. They are not happy
with their policies of promotion. Many factors such as participation of teachers
in decision making process, improvement in actual working environment and
autonomy can raise QWL of employees in academic sector. It is observed that
training programs, orientation and refresher Courses, workshops seminars shall
upscale the teachers and improve their QWL.
Jasmine (1987) conducted a comparative study of job related stress among
public sector and private sector employees. The result of the study found that
employees of public sector organization are more stressful than that of private
sector organization.
Jayakumar and Kalaiselvi (2012) made a general study to get an overview
and insight into Quality of work life of employees. They studied the definitions,
reviewed the meaning, as also determinants of QWL. They also suggested
measures of improving QWL.
Jerome (2013) made a study on QWL and specific factors influencing it. The
factor chosen were work environment, wage and compensation, career
opportunities, and health and hygiene. The outcome of the study showed no
relationship between the variables.
Jyoti Bahl (2013) made a study to find out the importance of various QWL
factors in organisation and to identify differences in perception of employees
based on demographic variables. The study was specifically conducted in banks
and its branches. The result of the study showed that job security of the
employees largely impacts QWL. Other factors such as fringe benefits, welfare
58
measures adequate and fair compensation, opportunity to develop human
capacity, participation in decision making also influences QWL.
K. Buvaneswari (2011) has done a study, which revels that employees get more
satisfaction when there is high degree of Autonomy to carry out the work, as
also greater freedom in decision making. It is also observed that working
conditions which are not conducive lead to inefficiency and absenteeism.
Grievance settling mechanism of the employees should also be perfect, and
finally participation of workers in management increases loyalty of the
employees to the organisation which will enhance productivity.
Kadumbri Kriti Randev & Tanuj Nandan (2017) have done a study which
points out three critical challenges faced by the Banks concerning their human
resources. Recruiting and retaining top talent, creating incentives for better
performance and encouraging critical competencies. Quality of Work Life of
employees employed in banking sector may help in preparing and designing a
road map for retention of employees. The study shows that Banking sector
should provide great opportunities to its employees for their career growth.
Setting personal Goals, and working towards them should happen out of career
management training system which will increase productivity of the employee
and will help in Contributing towards organizational success. Banks should
reduce monotony in jobs by careful job design and individual training programs.
This will keep individual motivation high and will add to his productivity and
Banks should develop employee Retention and talent acquisition programs
which will focus on high significance of human Resources in the organization.
Karrir and Khurana (1996) made a study to find out the relationship of QWL
dimensions among managers of Public, Private and Cooperative sector
organisations. Specific parameters of work satisfaction, job involvement were
chosen for study.
Keng-Boon Ooi et. al. (2013) conducted a study to find out extent of influence
and relationship between total quality Management (TQM) and QWL, in
manufacturing firms in Malaysia. The study concluded that styles of leadership,
Management practices is impacting QWL.

59
Kershaw (1994) made a study to find the levels of satisfaction with the quality
of their life in schools depending on age, gender, and teaching experience.
Findings suggested that satisfaction levels changed as per the locations of
school. The school site and other school factors were found to the significant.
Khodadadi et. al. (2014) conducted a study to find out the impact of specific
dimensions on QWL. Compensation policies, Safety provisions and growth and
career options were the factors chosen for the study. The study found that pay
package has a positive impact on job satisfaction and happiness of employees.
Khushbu Doshi (2014) has done a study which finds that job satisfaction is not
related to Quality of Work Life in private sector Banks. There is no impact of
Quality of Work Life on job satisfaction of ICICI and HDFC Bank employees.
However, the study finds that employee supportive programs like flexible
timings, Child care assistance can be helpful in reducing employee stress and
perform the work better.
Kleinfeld et. al. (1986) made a study about job satisfaction among teachers of
school in Alaska. The study was conducted with the help of a structured
questionnaire. The teachers were found to be satisfied with their compensation
and pay benefits. However, they were not happy with the progress and
performance of their students.
Kongkiti Phusavat, (2001) has made a research to investigate and study the
interrelationship between Quality of work life and productivity. It was observed
that this relationship is strengthened by the time element. QWL is greatly
influenced by labour productivity.
Kornbluh (1984) observed that organizations adopt the practice of keeping
significant member of workers and showing as if they participate in all decision
making processes on the agenda of labour – Management. This is a strategy to
increase employee’s QWL.
Kothapalle Inthiyaz (2017) has conducted a study which reveals that there is
high level of satisfaction among employees regarding Quality of Work Life.
The factor such as adequate and fair compensation, safe and healthy working
conditions, opportunities to use and develop human capacity, opportunity for

60
career growth, Social integration in the work force and remedy for grievance
and performance appraisal are positively correlated with Quality of Work Life.
Kotze (2005) observed that Quality of work life is concerned with making the
workers more human and familiar with the place of work, and to enrich the job
experience of workers. By this way they will have a better QWL, as well as they
will contribute to organizational performance by their way of working.
Kumar (1995) made a study of some industries in Thiruvananthapuram and
found that workers were positively influenced by QWL programs of the
industries. Only dissatisfaction that was evident was when employees were
grouped on the basis of remuneration, talent and experience.
Kumar and Bohra (1978) made a study to establish a relationship between
organizational culture, climate and philosophy and the satisfaction levels of the
workers. Results showed that such relationship does exists. Where the working
of the organisation is democratic, with freedom to workers, autonomy in
decision making, it resulted in higher level of job satisfaction. Organisations
which had centralized way of working with concentration of power and
authority, generally led to low level of job satisfaction or sometimes
dissatisfaction.
Lai, Chang and Hsu (2012) made a study to find out the quantum of workload
and its effect on QWL. It was found that with increased workload, QWL of
younger employees is negatively affected. However increased work load does
not have any significant effect on higher age employees.
Lalita Kumari (2013) has done a study, which found that there is positive
relationship between performance and individual Quality of Work Life factors.
Also it is observed that there is positive relationship between QWL and job
satisfaction. The growth of the Banking sector depends on its employees and
therefore all efforts towards improving QWL would raise the motivation of
employees which would result in higher productivity.
Lan and May (1998) tried to study the profitably and performance of two
companies and its possible influence in company’s QWL. Sales growth, return
61
on capital, Asset position were some factor highlighted. It was found that higher
QWL positively impacts Growth and performance.
Lewchuk et. al. (2001) made a study of lean production and its possible
influence on QWL in automobile Industry. Lean production seeks to cut down
waste of products, ensures cost savings and saving in time by speeding up
production. To ensure this, organisations have to lay down new norms of
working and practice new standards. This change in manufacturing affects
QWL of workers.
Luthans (1973), made a study and found that QWL is concerned with the work
environment provided by organisations, and the pattern of working of the
employees in such organisations. The study also significantly supports the
dimensions of employee participation in decision making as it makes the
organization more effective and productive.
Madhuri Ban and U. V. Panchal (2017) conducted a study and observed that
emotional intelligence positively influences work–Life Balance. It is also
observed that organisation can positively Guide emotions of employees to
improve performance and productivity.
Mafini et. al. (2014) tried to study the relationship between motivation and job
satisfaction of employees of Public organization. They concluded that
motivation as well as team work, remuneration, supervision, have positive
relation with job satisfaction and QWL.
Maimunah Ismail (2008) made a study to find out quality of work life of
information technology professionals. It was found that work environment
greatly impacted information Technology professionals. Hence organisation
ought to provide best work environment for the efficiency of such employees to
be higher. Besides this, the other dimensions of QWL which mattered were
health, job security, and job satisfaction.
Malone et. al. (2013) made a study of the women workers of construction
industry in USA, by emphasizing specific factors of job satisfaction, work life
balance and organizational commitment.
62
Mankidy Jacob (2000) has found out in a study that factors such as flexible
hours of work, better wages, better working conditions, job satisfactions, better
career opportunities, employment benefits are directly impacting Quality of
work life. The performance and productivity of the organization also improved.
Manoochehr Ataei (2013) studied the relationship between QWL, highlighting
the factors of wages, better working environment, security and growth
opportunities and scope for development of human capabilities. It was observed
that there exists a positive relationship between QWL and loyalty and
commitment of employees to the organization.
Martins, Nico and Yolandi (2012) tried to investigate the link if any, between
QWL and employee loyalty and trust to organization. It is revealed that there is
a positive and favourable relationship between styles and workings of
management and orgnisational trust. However, dimensions of employee
personality had an adverse and negative influence on orgnisational trust.
Maryam Fallah (2006) made a study to examine the relationship between
qualities of work Life and performance of Kosar Economical organization staff
and found that performance of staff is positively influenced by QWL and there
exists a relation between the two. Walton’s components formed the basis for
this study.
Md. Shahidul Islam, and Md. Mainul Islam (2014) have done a comparative
study of job satisfaction in Public and Private Banking in Bangladesh. It is found
from the study that employees of private sector Banks had greater satisfaction
as compared to employees of public sector Banks. As such their QWL was
found to be low. Job satisfactory depends on the feelings of employees as they
work in banking environment so management of Public sectors Banks need to
focused to a large extent on the employees’ job satisfaction for improved quality
of work life.
Mee lin and Bain (1990) studied the impact of QWL programs on
organizational effectiveness. It was more towards investigating labour
management relations. It was found that workers studied under 3 categories viz
Individual, groups & stores of Industry showed positive influence to QWL

63
programs. However, worker did not favorably respond to the dimensions of
grievance redressal, absenteeism, and organizational discipline.
Meenakshi Gupta and Vikas Sharma (2009) did a study of Bank employees
of Jammu Region to find out how Quality of work life impacts satisfaction
levels of Bank employees. The study was carried out, with Job experience,
income, family size was taken as independent variables. It was found that
personal encouragement of employees by the organisation significantly
impacted satisfaction levels and Quality of work life. Also other dimensions of
employee participation in decision making significantly influenced satisfaction
levels of employees.
Mehta (1982) In his research paper “rising Aspirations, Quality of life and work
organizations” considers workers as important predictor of QWL. The attitudes
of the workers and changes in their attitudes significantly impacts QWL.
Mirvis and Lawler have done a study, which pointed out the key factors of
wages, hours of working and working conditions are most basic for the
employees to derive satisfaction. Quality of Work Life will greatly improve if
the organisations focus their attention on these factor.
Mohan and Ashok (2011) made a study of employees of Textile and weaving
mills. They identified factor of growth and career options, job satisfaction, job
security, interpersonal relations and wages and adequate compensation. The
study revealed that the factors are very significant in QWL of employees.
Mortimer J. et.al (1989) did a study on satisfaction and involvement:
Disentangling a deceptively simple relationship. The Researchers in their study
forward spillover theory which propounds that level of job satisfaction of
employees can spillover and impact his behavior in other areas. As such QWL
influences his other work related areas.
Mruduka and VRP Kashyap (2004) in their study make out a case for flexible
time schedules and work procedure. They make out a case that flexible work
options can result into creativity and employees may take greater initiatives in
doing the work as they can opt for different schedules as per their convenience.
This can also result into higher commitment of the employees.

64
Namrata and Prabhakar (2012) made a study to find out prominent factors
impacting QWL in Banking sector. The data Analysis and outcome of the study
revealed that supportive leadership, opportunity for personal growth, better
work environment and work life balance significantly influenced QWL.
Nanthini (2010) did a study of QWL of women employees working in Private
Banks and also their psychological well-being. The findings of the study
revealed that respondents are quite low on Psychological well-being. Therefore,
Management needed to give considerable attention to improve their QWL.
Nasreen and Ansari (1997) conducted a study and found that some
psychological variables related to personality traits of the workers did not
significantly influence QWL programs.
A study done by Nitish (1984) identified certain dimensions of Quality of work
life such as organizational forum, hierarchy and staffing pattern, size of the
work group, internal communication, concern for quality and concern for people
to be significant. An organisation with reduced supervisory and managerial
control will have better quality of work life.
Nithin Venugopal and Sreela Krishnan (2018) have done a study, which
reveals that Bank management and employees should mutually decide the job
content and job should be challenging for improved Quality of Work Life.
Normala, Daud (2010) studied the relationship between QWL and
committment to organisations in Malaysia. Certain dimensions of growth,
working environment, participation in policy making, extent of supervision and
pay and compensation and found that there is significant relation between QWL
and committment to organisation.
O.P. Verma and Rumina Roy (1998) made a study and found that there is
positive relationship between job satisfaction and organizational commitment.
Motivation and job satisfaction are significant in bringing and building
organizational commitment and all organisations should act as source of
motivation and accomplish job satisfactions of their employees. This will
inspire the employees to be more loyal and committed to organisations.

65
Oliver (2009) in his study suggests some approaches to motivate the employees
to increase their job satisfactions and QWL. He says that employees to be
treated with highest respect and considering them as the most valuable asset.
Improving the general working conditions, improving channels of
communication and involving the workers in decision making process will bring
about the desired result.
The study made by Ojedokun et. al. (2015) found that there is balance and
strong relationship between QWL and involvement at work place. The study
found that committment of employees to work and organization depends on job
involvement and should be promoted in the organization.
Oluyinka et. al. (2015) made a study to investigate the relationship and impact
of reputation and Goodwill as external factor on QWL and loyalty and
commitment of Public sector employees in Ghana. The result showed that QWL
is positively related to external factor of image and reputation and
organizational commitment.
Osipaw et.al. (1985) made a study and showed that older employees
experienced greater stress out of extra load of work and responsibility than the
young employees.
P.S. Vijaylakshmi and M. Anusuya (2015) made a study which shows that
challenging job of the employees gives them greater motivation and influences
their Quality of Work Life. Appropriate pay strategies when evolved give fair
and adequate compensation to the employees. Organisations should make all
efforts to fill vacant posts as soon as possible. Adequate number of staff should
be recruited.
Patiraj Kumari and Pooja Khanna (2007) Made study to investigate Mental
Health of Bank Employees and its relation to Quality of work life. The study
was made among employees from Public and Private sector Banks from
Haridwar and Dehradun. The study showed that there is significant difference
between QWL of employees of Public and Private sector Banks. Private sector
Bank employees were found mentally more healthier than Public sector Banks.
The mental health of the employees in Public sector Banks was influenced more
66
on account of social integration in work organization and in Private sector
Banks by safe and healthy working conditions.
Pawar (2013) made a study to find out the relations between QWL and job
satisfaction. For this he selected the factors of wages, better working
environment, better interpersonal relations, and supportive and cooperative
employers. The results of the study showed that Grievances of the employees
were not adequately addressed and there was no proper Grievance redressal
Mechanism.
Pirjo and Seppo (2000) studied the relationship of certain factors like
psychological job requirements, conflict, supervisory control and monotony on
employee’s burnout. The study was conducted in retail and metal Industry. The
outcome of the study showed that psychological job requirements had greater
impact on employee burnout.
Prema Manoharan (2011) has done a study, to know the demographic
characteristics of the respondents and to find whether the respondents are
satisfied with dimensions of QWL provided by the Bank. The study suggested
that there is less awareness among Bank employees as regards welfare schemes.
Therefore, management and trade unions must make them aware about the
same. Transport facilities needs to be provided where the number of employees
is large.
R. Indusmathy and Kamalraj S. (2012) Made a study of Quality of work life
of workers of Textile Industry in Tripura District. The outcome of the study
indicated that workers were satisfied with work environment and safety
measures of the orgranisation. They were not happy with salary, job security
and interpersonal relations with co-workers in organisation.
Rama Joshi (2007) made a study to find out and identify the role of women
employees in service industries of Banks, Insurance and Hospitals, and to give
specific suggestion to the employers to make policies to help improve QWL of
women employees. It was revealed that in spite of conditions of working the
level of satisfaction of women employees in their organization was found to be
higher. It was also found that except for hospitals, in other service organisation,
women specific issues were ignored by the trade unions.
67
Ramesh (2013) made a study of QWL and its relation with job satisfaction in
the service sector. He suggested that QWL is very significant and is impacting
job satisfaction, Productivity, employer employee relations and all factors
which are correlated with the efficiency of any organization.
Rao et.al. (2009) in his study concludes that wage and compensation is a very
significant aspect, if the organisation wants their employees to put high
performance, and accomplish the target set. The employer and employee both
can be benefitted, if certain parameters like Mutual respect team work, Trust
worthiness are given prominence.
Rathi and Neerpal (2010) observed in their study that there is a strong
relationship between QWL and certain psychological factors of employees.
Therefore, policy makers in the organization should account for this, while
making policies, which should be directed towards strengthening QWL.
Rekha U. Manon and V. P. Sukumaran (2016) have found that Quality of
Work Life should bring wellbeing of the employee in the holistic manner
instead of only focusing on work related areas. The study advances the argument
that Quality of Work Life should ensure as much development of human
resource as it is required in changing times. Training programs on periodical
basis, which seeks to bring familiarity with new techniques shall be organized.
The study also gives importance to the working conditions. The organisations
should ensure better working conditions which promote worker’s abilities to
perform well even as parent, citizen and spouse.
Working women although risen higher in leadership and set examples in leading
organisations, the percentage is very small. Working women have also to
perform household Chores, rearing the children, and also looking after families.
There are also conflicting situations which may de motivate women from taking
up higher positions and performing leadership duties. This is great loss to the
organisations. Therefore, they have to ensure that a good Quality of Work Life
balance is established. The policy of Reserve Bank of India of providing
holidays on second and fourth Saturday is believed to be a step in this direction.
The optional transfers for female employees to the preferred locations also help
in maintaining better work life balance.

68
Rethinam and Ismail (2008) studied various dimensions of QWL of
employees in Malaysia. The study was focused around prominent factors of job
security, work environment, health and safety, and Growth and development.
The study found out that it is difficult for the organisations to provide and ensure
all dimensions in QWL.
Rhinehard et. al. (1969) made a study of Managers of government agencies
and compared them with those from business and industries. It was observed
that need fulfillment gap increases at the lower level.
Rhodes and Eisenberger (2002) made a study on perceived organizational
support for the employees from organisations. The result of the study found that
the organizational commitment, Job satisfaction and employee performance is
directly influenced positively by the support provided to employees by the
organization. The QWL was also found to be higher.
Rice and others (1984-85) in their study found the relationship between Job
Satisfaction and QWL. Organisations must ensure that QWL programs must
incorporate and stress those dimensions which can increase Job satisfaction of
the workers and also their family life.
Richard and Thackray (1981) studied the effects of monotonous work an
QWL and found that monotony adversely influences quality of work life.
Rish Roy (2006) made a study and suggested that good quality of work life
increases job performance at work and improves productivity and poor QWL
hampers individual performance. The changing mood, feelings, emotions are
influencing the employee behavior at work place.
Rishu Roy (2006) makes a study to find out the extent and degree of
performance as impacted by QWL. He suggests that it is neither influenced by
motivation or by any financial or nonfinancial rewards but it is related to the
workers and the working environment in which, they work. The modern
economy and work procedures have raised the expectations of the workers.
Therefore, the job performance has come to be directly correlated to QWL. In a
survey that was made, it showed that good quality of work like is directly
impacting job performance.
69
Riyaz Raiaye (2005) made a study of the employees of State Bank of India and
Jammu and Kashmir Bank. He identified certain dimensions like work
environment, welfare schemes, career advancement, job security, team work,
employee loyalty and commitment, work stress and union - Management
relations. It was found that QWL to a large extent in these banks was
satisfactory. Working environment was also found to the better.
Robbins (2005) conducted a study and found that schedule of working in
organization is closely related to QWL. The result of the study showed that
flexible work schedule results into high job satisfaction and therefore helps in
maintaining a good work life balance.
Robert (1998) made a study with the assumption that organizational
commitment of employees is influenced by suspicious mind-sets.
Roland K. Yeo & Jessica Li (2011) have done a study, which emphasizes eight
factors which were found to influence Quality of Work Life. The outcome of
the factors helps the managers to know better Quality of Work Life of their
employees.
Rosemiller (1992) made a study of QWL of secondary teachers and principals
and found that principals largely influenced positively, the involvement of
teachers in decision making, use of skills and teaching –learning environment.
Royuela, Tanayo and Surinach (2007) Observed, European commission (EC)
proposed nine predicators for QWL, they are:
Intrinsic job Quality
Skills, life-long learning and career development
Gender equality,
Health and safety at work
Flexibility and security
Inclusion and access to the labour market
Social dialogue and worker involvement,
Diversity and non-discrimination
Overall work performance.

70
Runci (1980) made a study and found that employees having positive approach
of quality of work life, will work further in the direction to improve working
conditions, increase production and ensure better quality products.
Rupashree and Shivganesh (2009) did a study and observed that there is a
positive relationship between QWL and specific dimensions like organizational
policies, control and supervisory support and work - family characteristics.
Further it was observed that supervisory support and control positively
influenced job satisfaction and happiness.
S. Naganandini, Dr. P. Subburethina Bharathi & D. Victor Seelan (2017)
made a study on women employees in Private Banks in Coimbatore District.
The study found, that married women employees have more fear of transfer,
than their unmarried counterparts, also Bank should concentrate on training and
personal care of women employees with less than five years’ experience.
S. Raju, Jasmine Sugirthabai R, and Jackson (2017) have done a study,
which shows that there is significant difference between job satisfaction, Age,
Qualification and type of Banks. No differences are observed between male &
female employees on the dimensions of work life balance.
Sairam Subramaniam and Saravanan (2012) Made study of factors
influencing quality of work life of employees in Banks in Coimbatore city. The
study found that personal benefits like salary, increment, bonus, allowances,
gratuity, provident fund, directly influenced their quality of work life. The other
factors like, freedom and autonomy in jobs, and environment in work place also
influences job satisfaction and Quality of work life of employees.
Sajjad and Abbasi (2014) made an attempt to study Relationship between
Quality of work life and commitment of the employees, as also other prominent
factors. Their study revealed that all the factors like work environment, scope
for development of human capabilities and constitutionalism positively
influenced QWL of employees.
Saklani (2003) in his study selected thirteen dimensions of QWL to develop a
scale to examine QWL in his Research. thirteen dimensions were selected,
which were adequate and fair compensation, fringe benefits and welfare

71
measures, job security, physical environment, work load and job stress,
opportunity to develop human capacity, opportunity for career growth, human
relations and social aspects of life, reward and penalty administration, equality,
justice and grievance handling, work and total life space and image of
organization. He pointed out that top management is found to be wanting in
their loyalty and fulfillment of the objectives of the organisation.
Sandrick (2003) made a study and suggested that good employees can only be
attracted and retained by high quality of work life. Therefore, organisations
must endeavor to attain this by giving due attention to all necessary dimensions
of QWL.
Sanyal and Singh (1982) remarked that Quality of work life improvement is
concerned with improvement of work satisfaction of employees. It can be
achieved through reorientation, training and reorganization of job content.
Sarwar et. al. (2013) conducted a study to find the relationship between age
and length of service on job satisfaction of engineers of Public sector in
Pakistan. The study found the existence of relationship of age and length of
service on job satisfaction.
Sengupta and sekaran (1985) studied QWL of Bank employees and found that
it is adversely affected by external factors affecting work environment as well
as frequent interference of unions in the workings of the Banks. As such
decisions of the Banks are affected by this. Results showed that Banks make
efforts to overcome the adversity by improving work environment, giving
greater autonomy to employees, acknowledging the performance and greater
participation of employees in Management will help improve QWL.
Sharma (1983) made a study to find out the effects of organizational
environment on the job satisfaction of the managers. It was revealed that certain
factors of Grievance Mechanism and procedures, career prospects, recognition
and involvement in decision making were significantly influencing
organizational environment in positive way.
Shivi Srivastava (2019) has done a study which finds out that, the relationship
between women employees and Quality of Work Life is found to be positive. It
72
was also found that higher participation of women employees in the policies of
the organisation enhances their QWL.
Shobha B. Hangarki (2014) has done a study, which finds that there is
relationship between employee’s satisfaction and parameters of Quality of
Work Life. It was revealed that majority of the employees are not satisfied with
long working hours, heavy workload, and gender issues. Finally, the study
suggests that there has to be review by the banks of QWL to provide better
working environment.
Similar study done by Johnson and Marcrum (1968) also observed that
greater unhappiness was found among managers of government agencies as
compared to business and industries.
Singh and Dewani (1982) in their study conclude that hierarchy levels in
nationalized Banks determine job satisfaction as important dimensions of QWL.
An employee in Bank is highly satisfied when he enjoys higher position in
Bank.
Singh Y.P. (2013) observed that passion of the employees to learn new and
remain updated about the work in organization directly impacts QWL and helps
him in scaling up his organizational performance.
Singh, Sengupta (1993) in their study focused on the dimension of authority
and power among the top hierarchical Management. Inter level relations
between top and middle level management can be strained by power and
authority equation. This could disturb QWL programs in organisation. The
interference of unions could further damage these relations. The programs
should envisage a spirit of cooperativeness between workers and managers.
Singhal (1983) made a holistic study of quality of life, and emphasized that
QWL will be meaningful, only if workers and people are happy. More attention
to be paid to economic, and health related aspects of employees. He also argued
that there has to be constant revision, and modifications with issues related to
QWL with changes in time.
Singh-Sengupta (1993) made the study of relationship and power of two
groups of managers and workers. They observed that these two groups are
73
interdependent on each other. The power relations are the most prominent
element of QWL. If the interdependence is cordial and harmonious, it will lead
to positive QWL.
Singh (1988) made a study of work stress of executives of private and public
sector organisations. Lack of team spirit, role conflict, autonomy and freedom
and lack of authority and responsibility were the factors highlighted with
reference to work stress. It was found that lower level executives experienced
more stress than middle level executives.
Sipin Narongrit and supit Thongdri (2001) Made a study of impact of QWL
on commitment to organization. It was found that QWL positively influenced
organizational commitment.
Sirgy et.al. (2001) focused the attention on various factors and related them to
the strength of satisfying one’s needs. They considered several factors such as
supervisory behavior, work environment and organizational commitment.
Quality of work life was impacted significantly on the strength & power of
satisfaction of one’s needs.
Skinner and Ivancevich (2008) emphasized in their study that QWL is
influenced by such factors as fair compensation, safe and healthy working
conditions, opportunities for continuous growth, job security, opportunity to
develop human capacities, and better relations between union and management.
Srivastava (1996) made a study of General working environment in
organization and some specific factors related to work commitment. Results
showed that some variables and dimensions of self-esteem, autonomy should
form part of QWL programs in organisations.
Srivastava and Pratap (1984) made a study on perception of jobs, and
organizational climate and found that there is a positive relationship between
organizational climate and job satisfaction.
Straw and Heckscher (1984) state that people as the most important Resource
is given high importance by the organisations which become their culture,
working policy and philosophy. Therefore, all programs and policy measures
designed by the organisations are directed towards wellbeing, and also showing

74
respect and dignity to workers. Workers as human resource are believed to be
faithful, productive, and innovative in the design of work of the organisation.
All this lead to improved Quality of work life of organizations.
Suman Ghalawat (2010) in a study makes a holistic approach and states that
QWL should encourage organisations to motivate their employees to give better
environment and processes and methods of work. This will help improve QWL
of employees.
Suri et. al. (1991) conducted a study to find out processes of implementation of
QWL in manufacturing and service organizations in India. It was found that,
Public and Private sector organisations did not give any significant importance
to QWL programs.
Syed Hussain M.M.E. (2006) has done a study to find out and measure the
extent and level of quality of work life of employees of public and Private sector
banks in Sivagangai District. He has identified 11 factors to be impacting QWL
and has given the Banks as per their importance to the employees in Banks. He
observed that except for the factors of seniority and promotions and inter
personal relations, all other factors are treated similarly by the employees of
Private and Public sector Banks.
T. Srinivasan and M. Mohamad Ismail (2016) have done a study which
brings out the high importance of human resource in service organisations.
Hence greater importance needs to be given to Quality of Work Life of
employees. The study focuses on Quality of life of an individual in the positions
of their work in the organisation. It is assumed to be a progressive indicator in
the function and working of organisations. The issues of Recruitment,
motivation, retention of the employees are directly influenced by the type of
Quality of Work Life provided by the organisation. It also impacts the success
of the organisation. It is observed that a large number of female employees in
Private sector Banks are significantly contributing to productivity by their
skills, knowledge and efforts. It is also observed that employee encouragement
is important for maintaining better Quality of Work Life. Individual
contributions of the employees greatly impact the productivity of the
organisations.

75
T.S. Tomar (2015) has done a study which concludes that Private Sector Bank
employees enjoy better working condition than employees of public sector.
Private sector Bank employees maintain better cordial relations with team
members as well as seniors and bosses. Also employees of private sector Banks
participate in decision making process concerning their jobs, compared to their
counterparts in public sector Banks. Employee feedback surveys be carried out
and data so collected should be incorporated in the policies of bank. The banks
should encourage participatory management and communication in the
organisation.
Tabassum Rahman and Jahan (2010) made a study and found that male
employees had higher QWL than their female counterparts. This is particularly
significant to Banks and other service organizations, which make effort in
attracting and retaining quality human resources. The study suggests that some
dimensions of QWL like development of human capacities, flexible timings,
fair compensation, healthy working environment, which if given importance
will lead to better QWL.
Terry et. al.(1993) observed that increased work stress of employees adversely
affects job satisfaction and well-being.
Thalang et. al. (2010) felt that organisations need to ensure QWL as part of
corporate social responsibility and made a study with that approach. Study was
conducted in Electrical and electronic organisations in Thailand. They focused
on work environment, total life span, work life balance, adequate and fair
remuneration as factors of QWL. The results found that good QWL will ensure
the organisations better awareness towards corporate social responsibility.
The result showed that job satisfaction positively influenced QWL of
employees. It also showed that as the rate of job satisfaction increases, it leads
to an increase in QWL level of employees, and it decreases with works stress,
insecurity of job and fatigue.
The results showed that levels of employees were greatly impacted by work
satisfaction emotional factors had a moderate influence and the extent of sick
leave was insignificant.

76
Triveni S, et.al. (2005) have conducted a study to find out the extent of Quality
of Work Life of nationalised and other bank employees. The study was
conducted in Hubli - Dharwad area. The results of the study suggested that
employees of nationalized banks have higher QWL than their counterparts are
non-nationalised banks. The parameters of autonomy and freedom, speed of the
job were stressed for the study. It is also shown that employees who had higher
satisfaction had higher QWL than others.
Tseng and Ismail (1991) conducted a study of high technology equipped
organisations in Singapore. The main purpose of the study was to find out
whether such industries cause high stress to the working human resources. The
study found that QWL programs help the organisations to make its employees
motivated towards raising their professional competency and to be more
knowledgeable and qualified.
Tung Chun Huang et. al. (2007) conducted a study of QWL of Auditors of
Public accounting firms in Taiwan and their commitment to organization. It was
found that different dimensions of QWL can have different effects on their
loyalty and commitment to organization.
Umasekaran (1985) has made a study of Quality of work life of employees in
banking organisation with reference to different organizational levels and job
positions. She found that Quality of work life of employees in Banking is not
high due to imbalances observed in various dimensions of QWL. Highly
qualified employees appointed for routine jobs, faulty reward system,
discouraging better performing employees, less chances of promotion are
reasons for poor QWL. It is suggested that freedom and autonomy to
employee’s, authority will enable the banks to recruit right people for right jobs
and improve quality of work life of employees in Banks.
Vander and de Hues (1993) made a study of work stress among male and
female managers. Work stress was observed to be less, when organization
provided support to managers.
Veeraiah and Manchala (2012) conducted a study on policies and practices
and their effects on the employees of State Bank of India, Hyderabad in
Telangana. It is suggested from the study that working conditions, opportunities
77
for growth, compensation and fair reward, constitutionalism were prominent
factors that could influence QWL.
Venkatachalam, et. al., (1997) studied that productivity of the organisation
increases with increased QWL. Dimensions of work environment, job
satisfaction, rewards positively impact QWL. Relationship was also evident
between QWL and organizational commitment.
Vijaimadhavan and Raju Venkatarama (2013) Made a study in establishing
correlation between factors of QWL and its impact on employees of IT Industry.
The outcome indicated that relationship between employer & employee and
amongst co-workers greatly impacted QWL in IT Industry.
Vikaram Singh, Suresh Choudhary (2017) have done a study, which reveals
that employees of Private sector Banks feel insecure about their jobs. The
performance of the employees in Private Banks is always questioned. The
higher authorities are not giving any freedom and autonomy to employees to
take decisions.
Vinita Sinha and K. S. Subramanian (2013) have done a study to find out
whether work related factor are influencing quality of work life. In the present
study more focus is given on work environment as it exists in the organisation.
A sample of 60 employees from Public sector, Private sector as well as
entrepreneurs are selected for the purpose the study. The study reveals that there
are wide spread differences observed in the scores of each category of
employees. Hence work related factors have significant and prominent
influence on QWL and work life Balance.
Vloisky and Aguilar (2009) in their study have suggested that job security has
a strong and positive relationship on QWL, by virtue of influencing employee
work performance. It is found that organizational policy, organizational culture,
and good organizational support influences the work performance. It is the duty
of the employer to ensure better policy, and support for enhanced productivity.
Wadud (1996) in the study conducted, found the QWL of Private sector women
employees was higher than their counterparts in public sector.

78
Waheeda Khan, Meena Osmany and M. Waseem, Jamia Millia Islamia
(2002) Made a study and found that QWL was higher among women employees
in Private sector Banks, than their counterparts in Public sector. It was also
found that older employees as well as low experienced employees had low
perceptions of QWL than those comprising younger group as well as those with
high experience.
Walton and Richards (1973) came with the model of eight dimensions or
groups and tried to find out how it affected organisations. Organisations can
find the outcome by applying each category or structure to the working of
organisation and thereby find QWL.
Walton et. al. (1974) in his research work suggested eight dimensions for
improvement of QWL. They tried to establish relationship between individual
preferences of employees and the actual work.
Wilson (2003) emphasized the factors of work environment, supervision and
opportunities of promotion. It was found that workers are happy about the work
environment. The workers in public sector organisations were happier than their
private organisation counterparts. Both type of workers satisfied with
supervision. However, they were not happy with promotion opportunities. The
team work and interpersonal relations were found to be better and higher among
Private sector workers.
Wright and Marina (1991) did a study on Quality of work life in the knitwear
factory of the Canadian Textile industry, in which it was found that decisions
making activity concerning the work was absent. Only information sharing was
happening between the managerial employees. Therefore, the workers felt that
there was no scope for them to contribute to decision making process.
Yaghi and Ihsan (2014) conducted a study of QWL of employees of Public
and Private sector companies. They found that pay and remuneration, and career
and growth opportunities significantly influence QWL.
Zahir (2007) observed that Monetary, financial benefits, job security, social
welfare and leave policy positively influences QWL of workers.
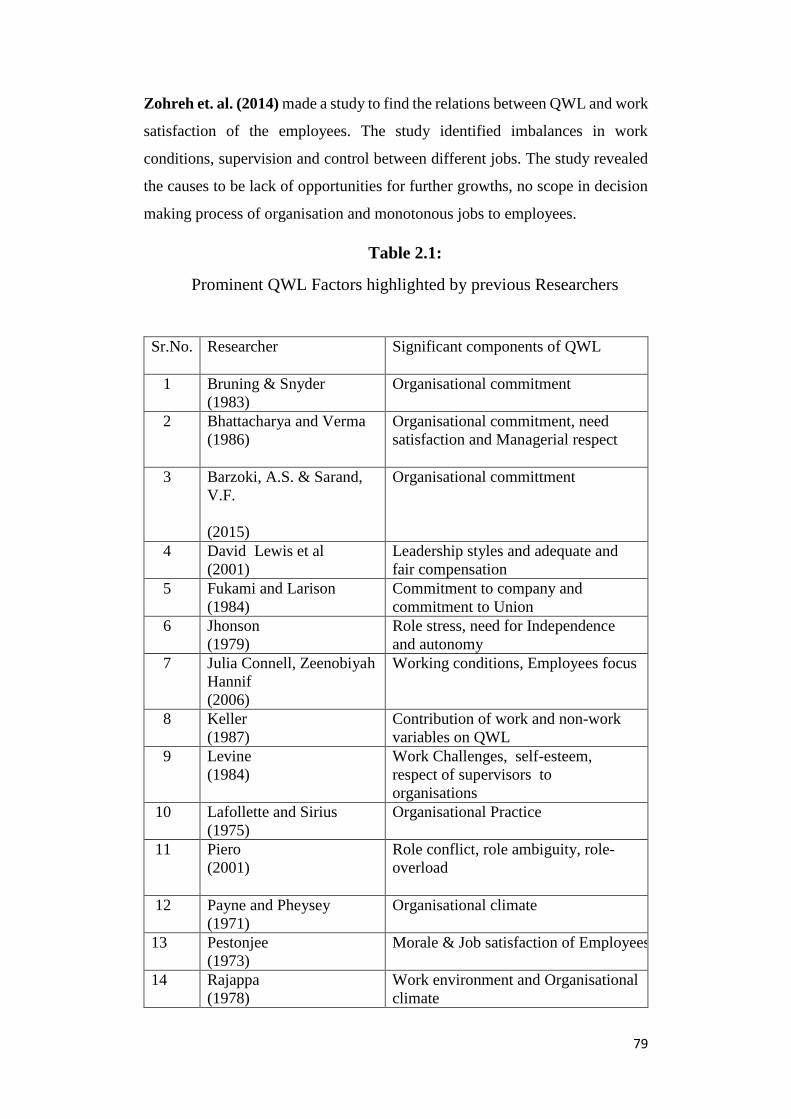
79
Zohreh et. al. (2014) made a study to find the relations between QWL and work
satisfaction of the employees. The study identified imbalances in work
conditions, supervision and control between different jobs. The study revealed
the causes to be lack of opportunities for further growths, no scope in decision
making process of organisation and monotonous jobs to employees.
Table 2.1:
Prominent QWL Factors highlighted by previous Researchers
Sr.No. Researcher Significant components of QWL
1 Bruning & Snyder
(1983)
Organisational commitment
2 Bhattacharya and Verma
(1986)
Organisational commitment, need
satisfaction and Managerial respect
3 Barzoki, A.S. & Sarand,
V.F.
(2015)
Organisational committment
4 David Lewis et al
(2001)
Leadership styles and adequate and
fair compensation
5 Fukami and Larison
(1984)
Commitment to company and
commitment to Union
6 Jhonson
(1979)
Role stress, need for Independence
and autonomy
7 Julia Connell, Zeenobiyah
Hannif
(2006)
Working conditions, Employees focus
8 Keller
(1987)
Contribution of work and non-work
variables on QWL
9 Levine
(1984)
Work Challenges, self-esteem,
respect of supervisors to
organisations
10 Lafollette and Sirius
(1975)
Organisational Practice
11 Piero
(2001)
Role conflict, role ambiguity, role-
overload
12 Payne and Pheysey
(1971)
Organisational climate
13 Pestonjee
(1973)
Morale & Job satisfaction of Employees
14 Rajappa
(1978)
Work environment and Organisational
climate
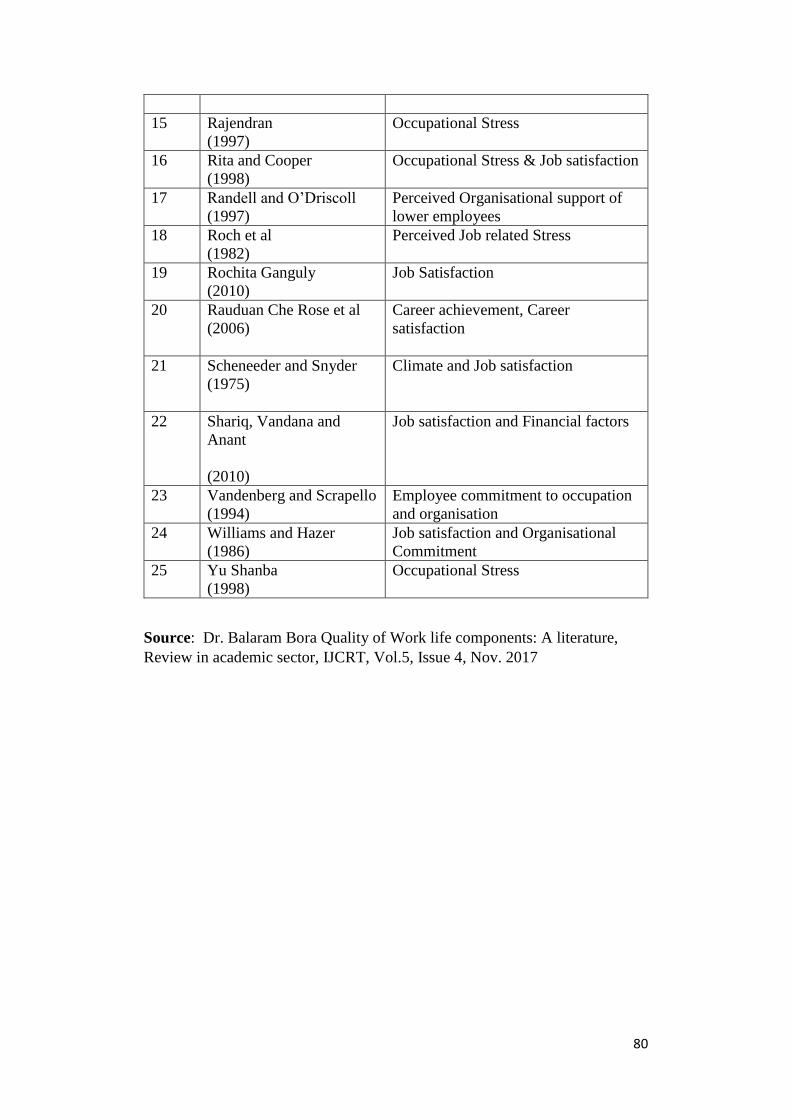
80
15 Rajendran
(1997)
Occupational Stress
16 Rita and Cooper
(1998)
Occupational Stress & Job satisfaction
17 Randell and O’Driscoll
(1997)
Perceived Organisational support of
lower employees
18 Roch et al
(1982)
Perceived Job related Stress
19 Rochita Ganguly
(2010)
Job Satisfaction
20 Rauduan Che Rose et al
(2006)
Career achievement, Career
satisfaction
21 Scheneeder and Snyder
(1975)
Climate and Job satisfaction
22 Shariq, Vandana and
Anant
(2010)
Job satisfaction and Financial factors
23 Vandenberg and Scrapello
(1994)
Employee commitment to occupation
and organisation
24 Williams and Hazer
(1986)
Job satisfaction and Organisational
Commitment
25 Yu Shanba
(1998)
Occupational Stress
Source: Dr. Balaram Bora Quality of Work life components: A literature,
Review in academic sector, IJCRT, Vol.5, Issue 4, Nov. 2017
81
2.4 Chapter Summary
This chapter of literature Review gives systematic insight into various
dimensions of QWL and the significance of each dimension in the study
undertaken by each researcher. When a systematic examination of any scholarly
literature or a body of knowledge takes place, it benefits the Researcher and his
ongoing research. It gives a proper direction and helps to strengthen the
roadmap in conducting the ongoing research. Literature review broadens the
horizons of Researchers and opens new vista and Pathways for conduct of his
research. Literature review helps in analyzing, evaluating, interpreting the data,
and also to know the research findings. It helps in knowing the research gaps
and also in identifying what needs to be done further in chosen area of interest.
Various studies made, and highlighted in this chapter gives significance and
shows relevance of different dimensions of QWL. It is seen that the behavior of
employees and their quality of work life gets influenced in a definite pattern in
some banks and some service organisations, whereas in others it is seen to be
erratic and irrational. Again gender wise studies made show differences in
behavior of male and female employees with reference to certain dimensions of
QWL. Other demographic variables of educations, age, experience are also seen
to influence QWL significantly.

82
References Ajala, E. M. (2013). Quality of Work Life and Workers Wellbeing: The
Industrial Social Workers Approach. IFE Psychology, 212(2), 46-56.
Akhtar, S. and Vadra, P. . (1990). A comparative study of extra organizational
stress among women teacher and nursing staf. Paper presented at the
27th Annual Conference of lAAP, A.M.U. Aligarh.
Akinnusi, D.M. (1994). Relationship between personal attributes, stressors,
stress reactions, and coping styles. Management and Labour Studies,
19(4), 211-218.
Balakrishnan V. (1976). Motivational approach to industrial management.
Indian manager, 7(3), 259-287.
Bearfield, S. (2003). Quality of Working Life. Aciirt Working paper 86.
University of Sydney. www.acirrt.com.
Behzad Janmohammadi. (2014). Study Of the Dimensions of Quality of Work
Life and Organizational Productivity of the Staff of Tax Organization
of Alborz Province. Indian Journal of Fundamental and Applied Life
Sciences, 5, 297-308.
Braun, Jarome S. (1985). American workers and the quality of work life.
Paper presented at the 1985 annual meeting of the Rural Sociological
Society.
Castello, J.M. and Sang, I.M. (1974). Need fulfilment and job satisfaction of
professionals. Public Personnel Management, 3(5), 454-461.
Chakraborty, S.K. (1986). The will-to-yoga; key to better quality of work Life.
Vikalpa,, 11(2), 114-124.
Chaturvedi Vijit. (2010). A Study on Factors Affecting Job Satisfaction of
Employees in Hotel Industry: A Study with Reference to few
Categorized Hotels in NCR. Summer Intership Society, 2(1), 40-51.
Chaudhry, A. (1990). A study of relationship between job satisfaction and role
stress of bank officers Unpublished M.A. Dissertation. Department of
Psychology. University of Rajasthan. Jaipur.
Chinomona et al. (2013). influence of Quality of Work Life on Employee Job
Satisfaction, Job Commitment and Tenure Intention in the Small and
Medium Enterprise Sector. South African Journal of Economic and
Management Sciences (SAJEMS), 16(4), 363-378.
Cox, C.J. and Cooper, C.L. . (1989). The making of the British CEO:
Childhood work experience, personality and management style.
Academy of Management Executive 3, 241 – 245.
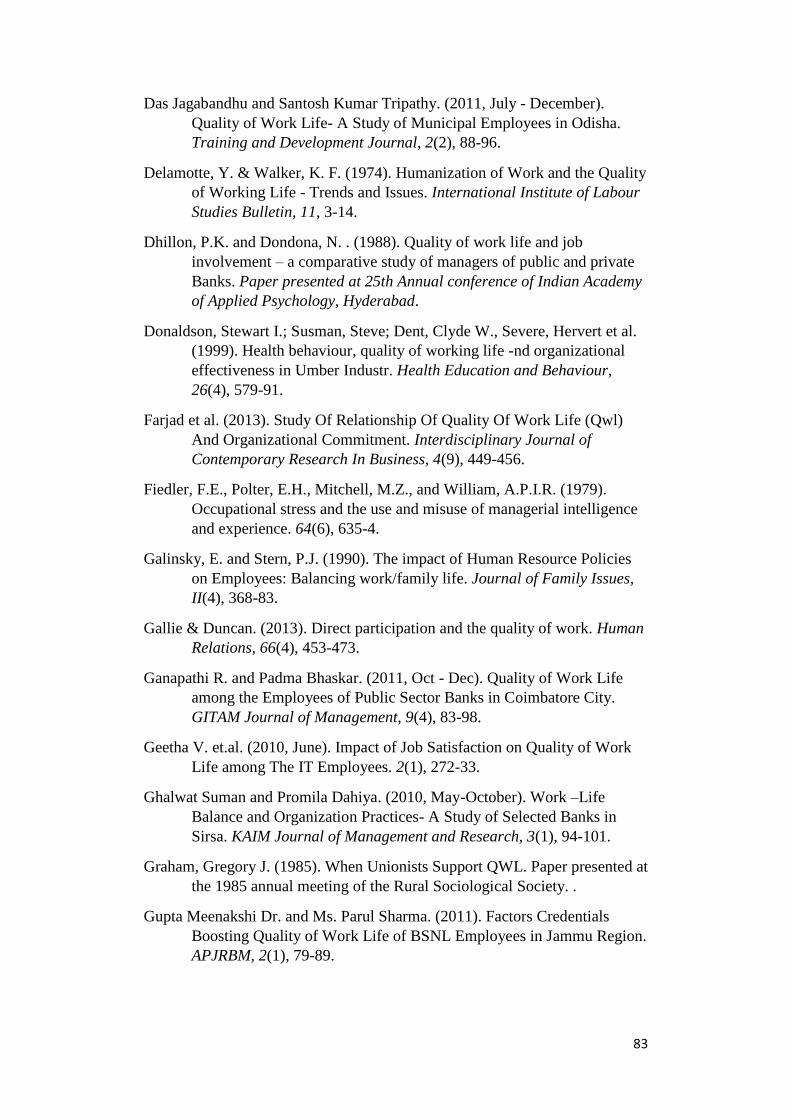
83
Das Jagabandhu and Santosh Kumar Tripathy. (2011, July - December).
Quality of Work Life- A Study of Municipal Employees in Odisha.
Training and Development Journal, 2(2), 88-96.
Delamotte, Y. & Walker, K. F. (1974). Humanization of Work and the Quality
of Working Life - Trends and Issues. International Institute of Labour
Studies Bulletin, 11, 3-14.
Dhillon, P.K. and Dondona, N. . (1988). Quality of work life and job
involvement – a comparative study of managers of public and private
Banks. Paper presented at 25th Annual conference of Indian Academy
of Applied Psychology, Hyderabad.
Donaldson, Stewart I.; Susman, Steve; Dent, Clyde W., Severe, Hervert et al.
(1999). Health behaviour, quality of working life -nd organizational
effectiveness in Umber Industr. Health Education and Behaviour,
26(4), 579-91.
Farjad et al. (2013). Study Of Relationship Of Quality Of Work Life (Qwl)
And Organizational Commitment. Interdisciplinary Journal of
Contemporary Research In Business, 4(9), 449-456.
Fiedler, F.E., Polter, E.H., Mitchell, M.Z., and William, A.P.I.R. (1979).
Occupational stress and the use and misuse of managerial intelligence
and experience. 64(6), 635-4.
Galinsky, E. and Stern, P.J. (1990). The impact of Human Resource Policies
on Employees: Balancing work/family life. Journal of Family Issues,
II(4), 368-83.
Gallie & Duncan. (2013). Direct participation and the quality of work. Human
Relations, 66(4), 453-473.
Ganapathi R. and Padma Bhaskar. (2011, Oct - Dec). Quality of Work Life
among the Employees of Public Sector Banks in Coimbatore City.
GITAM Journal of Management, 9(4), 83-98.
Geetha V. et.al. (2010, June). Impact of Job Satisfaction on Quality of Work
Life among The IT Employees. 2(1), 272-33.
Ghalwat Suman and Promila Dahiya. (2010, May-October). Work –Life
Balance and Organization Practices- A Study of Selected Banks in
Sirsa. KAIM Journal of Management and Research, 3(1), 94-101.
Graham, Gregory J. (1985). When Unionists Support QWL. Paper presented at
the 1985 annual meeting of the Rural Sociological Society. .
Gupta Meenakshi Dr. and Ms. Parul Sharma. (2011). Factors Credentials
Boosting Quality of Work Life of BSNL Employees in Jammu Region.
APJRBM, 2(1), 79-89.
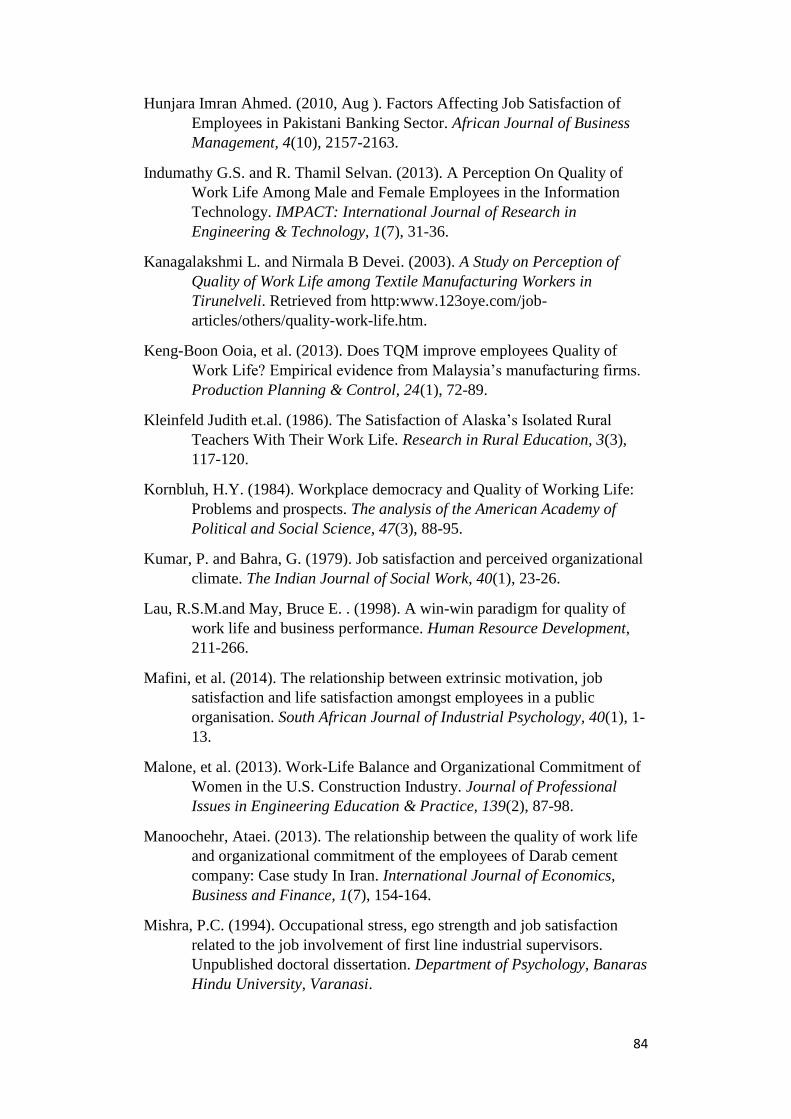
84
Hunjara Imran Ahmed. (2010, Aug ). Factors Affecting Job Satisfaction of
Employees in Pakistani Banking Sector. African Journal of Business
Management, 4(10), 2157-2163.
Indumathy G.S. and R. Thamil Selvan. (2013). A Perception On Quality of
Work Life Among Male and Female Employees in the Information
Technology. IMPACT: International Journal of Research in
Engineering & Technology, 1(7), 31-36.
Kanagalakshmi L. and Nirmala B Devei. (2003). A Study on Perception of
Quality of Work Life among Textile Manufacturing Workers in
Tirunelveli. Retrieved from http:www.123oye.com/job-
articles/others/quality-work-life.htm.
Keng-Boon Ooia, et al. (2013). Does TQM improve employees Quality of
Work Life? Empirical evidence from Malaysia’s manufacturing firms.
Production Planning & Control, 24(1), 72-89.
Kleinfeld Judith et.al. (1986). The Satisfaction of Alaska’s Isolated Rural
Teachers With Their Work Life. Research in Rural Education, 3(3),
117-120.
Kornbluh, H.Y. (1984). Workplace democracy and Quality of Working Life:
Problems and prospects. The analysis of the American Academy of
Political and Social Science, 47(3), 88-95.
Kumar, P. and Bahra, G. (1979). Job satisfaction and perceived organizational
climate. The Indian Journal of Social Work, 40(1), 23-26.
Lau, R.S.M.and May, Bruce E. . (1998). A win-win paradigm for quality of
work life and business performance. Human Resource Development,
211-266.
Mafini, et al. (2014). The relationship between extrinsic motivation, job
satisfaction and life satisfaction amongst employees in a public
organisation. South African Journal of Industrial Psychology, 40(1), 1-
13.
Malone, et al. (2013). Work-Life Balance and Organizational Commitment of
Women in the U.S. Construction Industry. Journal of Professional
Issues in Engineering Education & Practice, 139(2), 87-98.
Manoochehr, Ataei. (2013). The relationship between the quality of work life
and organizational commitment of the employees of Darab cement
company: Case study In Iran. International Journal of Economics,
Business and Finance, 1(7), 154-164.
Mishra, P.C. (1994). Occupational stress, ego strength and job satisfaction
related to the job involvement of first line industrial supervisors.
Unpublished doctoral dissertation. Department of Psychology, Banaras
Hindu University, Varanasi.

85
Motowidlo, S.J., Packard, J.S. and Manning, M.R. (n.d.). Occupational stress:
It causes and consequences for Job performance. Journal of Applied
Psychology, 71, 618 – 629.
Nitish, R.D. (n.d.). Quality of Work Life and QWL: Towards an Appreciation.
Productivity, XXV(2), 129-141.
Ojedokun, et al. (n.d.). Journal of Psychology in Africa (Routledge), 25(3),
235-241.
Oluyinka, et al. (2015). Perceived external prestige as a mediator between
quality of work life and organisational commitment of public sector
employees in Ghana. SA Journal of Industrial Psychology/ SA Tydskrif
vir Bedryfsielkunde, 41(1), 1-10.
R. Indumathy. & Kamalraj. S. (2011). A Study on Quality of Work Life
among Workers with Special Reference to Textile Industry in Tirupur
District- A Textile Hub. ZENITH. International Journal of
Multidisciplinary Research, 2(4), 265-279.
Rajeswara Rao, K.V.S and Bakkappa, B. (2009). Modeling Approach to the
analysis of the Influence of Human Resource Practices on Quality of
Work Life in Call Center Industries using Optimization techniques. JK
Journal of Management & Technology, 1(1), 34-54.
Rhinehard, B. and Dewolf. (1969). Comparative study of need satisfaction in
Government and Business hierarchies. Journal of Applied Psychology,
5(3), 230-235.
Rice, R.W. (1984). Organizational work and the overall quality of life. Applied
Social Psychology, 5, 155-178.
Rice, R.W. (1985). Organizational work and the perceived quality of life
toward a conceptual model. Academy of Management Review, 10(2),
296-310.
Richard, I., Thackray, Ph.D. (1981, April). The stress of Boredom and
Monotony: A consideration of evidence. Psychosomatic Medicine,
43(2).
Runci, J.F. (1980). Dynamic systems and the Quality of work life. Personnel,
57(6), 13-24.
S. Khodadadi et al. (2014). Investigating the QWL dimensions effect on the
employees’ job satisfaction. Applied Mathematics in Engineering,
Management and Technology, 2(1).
Samdani and Deshmukh. (2014). Occupational Stress and Quality of Work
Life: A Review of Literature. Pezzottaite Journals, 3(4).
Sandhu Namarata and Rahul Prabhakar. (2012). Factors Influencing the
Quality of Work Life in Indian Banking Industry- An Empirical Study.
IPEDR, 55(23), 115-119.

86
Sanyal, A. and Singh, B.R. (1982, November). Improving the Quality of
Working life”. Lok Udyog, 27-35.
Sarwar, et al. (2013). Determining the impact of age and LOS on job
satisfaction: a case study of Pakistan automotive industry.
International Journal of Human Resource Management, 24(2), 415-
435.
Siegrist, J. and Klein , D. (1990). Occupational stress and cardiovascular
reactivity in blue collour Workers. Work and Stress, 4(4), 295-304.
Singh, A.P. and Natha, K. (1991). Effects of organizational climate role stress
and locus of control on job involvement of banking personnel. Indian
Journal of Industrial Relations, 27(2), 63-75.
Singh, Y.P. (2013). Quality of Work Life and its Impact on Organizational
Performance. Asia Pacific Journal of Management &
Entrepreneurship Research (APJMER), 2(1), 240.
Singhal, S. (1983). Quality of work life : A re-examination of assumptions.
Hyderabad:. National Symposium on quality of working life, 25-26.
Srilatha, P. (1988). Occupational stress at middle management level with
respect to certain organizational and personality correlated in selected
public and private enterprises. Ph.D. thesis, Osmania University,
Hyderabad.
Srivastava, A.K. and Krishna, A. (1990). A test of inverted 'U' hypothesis of
stress performance relationship in the industrial context. Psychological
Studies, 36(1), 34-48.
Srivastava, S.K. and Pratap, S. (1984). Perception of job satisfaction,
organizational climate. Perspective in psychological Researchers, 7(1),
41-43.
Subramaniam Sairam B. L. (2012). Empirical Study on Factors Influencing on
Quality of Work Life of Commercial Bank Employees. European
Journal of Social Sciences, 28(1), 119-127.
Yaghi & Ihsan. (2014). Quality of Work Life in the Postnationalization of
Human Resources: Empirical Examination of Workforce Emiratization
in the United Arab Emirates. International Journal of Public
Administration, 37(4), 224-236.

87
Chapter III
Research Methodology
Here an effort is made to focus on the statement of the problems, objectives of
the study, scope of the study, limitations of the study, sample design and sample
size, statistical tools used to analysis the data.
3.1 Statement of the Problem
The Banking Industry is the most important and significant industry in our
country in the service sector. It acts as the Barometer of the progress and
performance of the economy. The growth rate of the country is largely
influenced by the performance of the Banking sector. The citizens and the
society at large become curious to know the quarterly performance of the
Banking sector in the country. This is also true of Corporate sector. The
performance of the Banks in terms of its profitability is the major indicator of
analysis by the stakeholders. Technology has changed the banking sector like
never before. Technology has made possible variety of services for its
customers. It has also changed its internal method of working by adjustment,
readjustment and reorganisation of work vis-a-vis its human resources.
Competition both internal as well as global has also changed the attitude and
outlook of working of the Banking sector. The quality of Human Resource is
predominant in the success of this Banking Industry. There is also a stiff
competition from foreign banks which lure the clients and corporates to its side.
The progress graph of the banks has to be rising and they need to show that they
contribute to national economy in real terms. Today, the Government is keenly
looking at the progress and contribution made by banks to national economy.
Banks which are lagging behind or are found wanting on certain parameters of
the Government or RBI are merged with other Banks. A policy of Merger and
Acquisition of Banks also influences its employees and affect QWL.
As Cunningham says, the factors such as work and the task, work environment,
social environment, administrative system within the organisation affect QWL
of employees.

88
Although Banking sector offers a wide variety of products, the frauds and
scandals taking place frequently are affecting QWL of employees adversely.
The internal policies and conditions of working have changed. The prolonged
hours of work are putting added pressures on employees. Those who deal with
different financial products or cash, become more stressful or face more
problems.
Therefore, banking organisation, its management and employees appreciate the
need for better QWL for its employees. It will ensure (i) higher productivity
and performance (ii) A better working environment in the Banks will keep the
satisfaction levels of the employees higher.
The present study makes an attempt to investigate and examine QWL issues of
employees of Public and Private sector Banks in Goa. Convenience Sampling
Method is used to select Banks and the employees as Sample.
Ever since Louis Davis (1972) brought out and introduced this concept at the
First International Quality of work life conference in Toronto, it gained
recognition and acceptance in the major organisations of the world. In India
also, it has gained immense popularity and realising its importance and
significance organisations want to make a part of its policy formulation. QWL
can positively influence the internal working of the organisation by evolving a
Corporate Philosophy, introducing different training programmes as per the
needs of the workers, designing new techniques and methods of doing work and
devising freedom autonomy, responsibility and authority for the workers
(Anonymous 2005). A high and better Quality of work life is necessary to
attract, retain and to continue the employees working in organisations
(Sandrick, 2003).
The QWL is a cooperative rather than authoritarian, evolutionary and open
rather than static and rigid; informal rather than rule-bound; impersonal rather
than mechanistic, mutual respect and trust rather than hatred against each other
(Rao V.S.P., 2009). To be able to give better QWL to employees, organisations
engage themselves constantly in the improvement, exercise of Primary

89
parameters of QWL, which include health and well-being, work place safety,
proper design and layout of place of work, skills, training programs undertaken
and a good working environment. The overall goals of the organisation are to
be matched against these QWL dimensions to help the organisations prepare a
roadmap for higher productivity and performance. This is more particularly
true of Banking sector which works towards fulfilment of their targets in
deposits, loans and advances and many other areas. A group of highly satisfied
employees can help in achieving this.
3.2 Objectives of the Study
The proposed study is undertaken with the following specific objectives.
1. To study the dimensions in Quality of Work Life of Bank employees.
2. To study the dimensions in Work Life Balance of Bank employees
3. To study the dimensions in Policy Measures of bank
4. To study the relationship between Work Environment and QWL in
banks.
5. To study the relationship between Policy Measures and QWL in banks.
6. To study the impact of QWL on the Work Life Balance of bank
employees.
7. To analyse the relationship between the Security and Growth
Opportunities and QWL in Banks.
8. To analyse the relationship of Demographic Profile with QWL, Work
Life Balance and Policy Measures of bank.
3.3 Scope of Study
The study is limited to select Public sector and Private sector Banks from North
Goa and South Goa chosen by convenience sampling. A total of four
respondents, comprising Manager and Clerks selected by Random Sampling are
the subjects of this study. The following major dimensions of QWL are focused
in the study:
a) Remuneration and compensation
b) Working environment
c) Security and Growth opportunities
d) Motivation

90
e) Respect at work
f) Occupational stress
g) Recognition at work place
h) Autonomy and Participation
i) Grievance Procedure
j) Policy measures
k) Outcome and Result of Work Life Balance
3.4 Need and significance of study
Human Resource is primary and fundamental to Banking sector and therefore
the Banking Industry takes all measures to upskill its employees from time to
time. QWL is largely influenced by the importance given by Banks to have a
high Quality of Work life for all its employees. The policies of the banks
designed towards its Human Resource shall address to all major dimensions of
QWL. The policies shall be in harmony with establishing a balance between
work and family life.
This will keep an employee satisfied and motivated to work with all enthusiasm.
This will positively influence the performance and productivity of the banking
sector. The present study makes an attempt to investigate and examine the
dimensions of select employees of Banking sector in Goa and the extent of their
impact on Quality of Work life. Significant size of employees’ value quality
dimensions more than mere monetary factors. As organisations succeed in
evolving a culture of belongingness, friendliness, team-work, the employees
develop a strong loyalty and commitment.
3.5 Research Design
The present Research is descriptive in nature. The field survey is undertaken in
Banks both Public and Private sector in North and South Goa. The Researcher
personally visited all the Banks, met the Manager and other employees for
getting factual information. The Manager in some cases also provided the
information outside the questionnaire which became valuable for Research.

91
3.6 Hypothesis of the study
The following are the Research hypothesis of the study:
1. H0: There is no positive relationship between work environment and
QWL in Banks.
H1: There is positive relationship between work environment and
QWL in Banks.
2. H0: There is no positive relationship between Policy Measures and
QWL in Banks.
H1: There is positive relationship between Policy Measures and QWL
in Banks.
3. H0: QWL does not positively impacts Work Life Balance.
H1: QWL positively impacts Work Life Balance.
4. H0: Security and Growth Opportunities does not affect QWL
positively.
H1: Security and Growth Opportunities affect QWL positively
5. H0: Demographic profile does not significantly impact QWL, Work
Life Balance and Policy Measures of Bank.
6. H1: Demographic profile significantly impacts QWL, Work Life
Balance and Policy Measures of Bank.
3.7 Data Collection
The data for the present study is collected by visiting Public sector and Private
sector Banks in North and South Goa. The data was collected through personal
interviews and by a structured questionnaire to Managers and four other clerical
staff. The Banks and Respondents were selected through random sampling.
This comprised the primary source of data. The questionnaire was tested by a
pilot study. The secondary Data was collected through published Research
papers, articles, books and thesis on the area of study.
3.8 Questionnaire Design
The questionnaire was structured with an intension of obtaining as much
information and Data as it was relevant for the present study. Therefore, major
dimensions of QWL as they apply to the employees of Banking sector were
carefully selected as Variables for the study. In doing this, the internal system
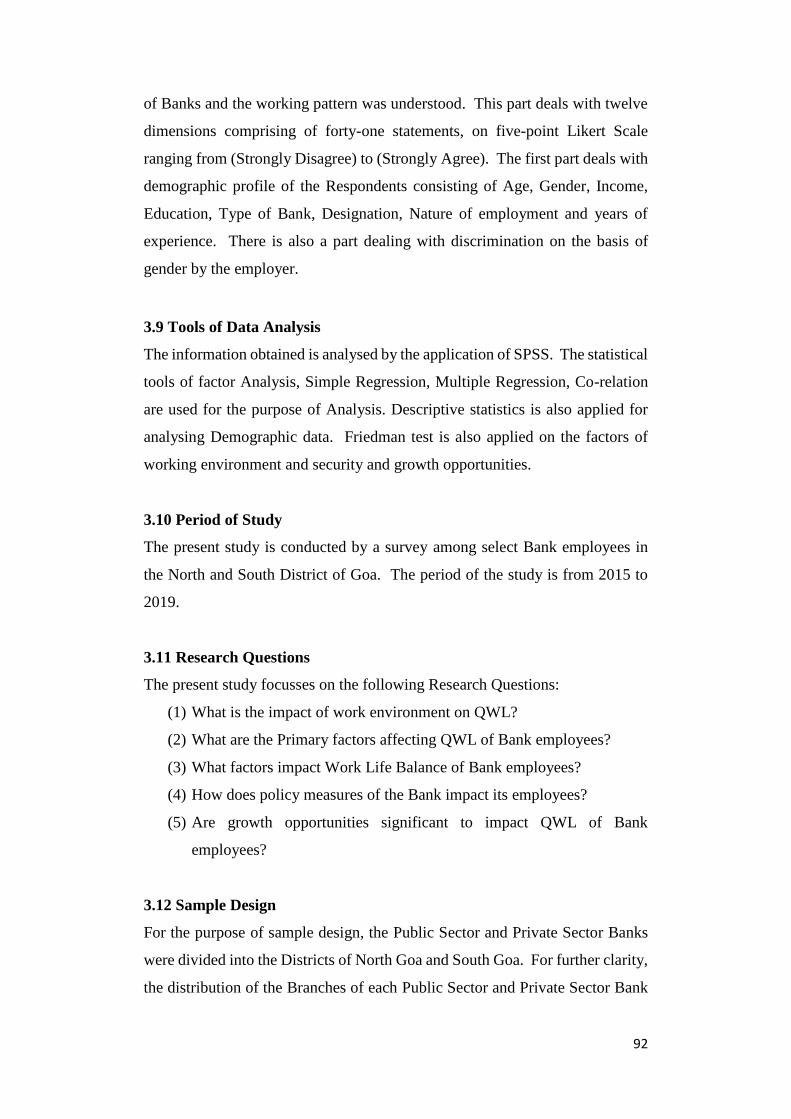
92
of Banks and the working pattern was understood. This part deals with twelve
dimensions comprising of forty-one statements, on five-point Likert Scale
ranging from (Strongly Disagree) to (Strongly Agree). The first part deals with
demographic profile of the Respondents consisting of Age, Gender, Income,
Education, Type of Bank, Designation, Nature of employment and years of
experience. There is also a part dealing with discrimination on the basis of
gender by the employer.
3.9 Tools of Data Analysis
The information obtained is analysed by the application of SPSS. The statistical
tools of factor Analysis, Simple Regression, Multiple Regression, Co-relation
are used for the purpose of Analysis. Descriptive statistics is also applied for
analysing Demographic data. Friedman test is also applied on the factors of
working environment and security and growth opportunities.
3.10 Period of Study
The present study is conducted by a survey among select Bank employees in
the North and South District of Goa. The period of the study is from 2015 to
2019.
3.11 Research Questions
The present study focusses on the following Research Questions:
(1) What is the impact of work environment on QWL?
(2) What are the Primary factors affecting QWL of Bank employees?
(3) What factors impact Work Life Balance of Bank employees?
(4) How does policy measures of the Bank impact its employees?
(5) Are growth opportunities significant to impact QWL of Bank
employees?
3.12 Sample Design
For the purpose of sample design, the Public Sector and Private Sector Banks
were divided into the Districts of North Goa and South Goa. For further clarity,
the distribution of the Branches of each Public Sector and Private Sector Bank

93
are also divided Talukawise as North and South Goa. The actual places of
Branches in Talukas are also highlighted, in case of more than one Branch.
Convenience sampling technique is used for selecting Banks and Branches. For
the purpose of present study, Banks and its Branches located in Rural (R), Urban
(U) and Semi Urban (SU) are chosen. The Researcher visited 150 Banks (Public
and Private Sector) in North and South Goa. 470 questionnaires were used for
the purpose of Survey. The managers of the Banks were explained the purpose
and significance of the study undertaken. They were also requested to give the
same to other three employees in the clerical cadre. Finally, 430 questionnaires
were returned back. Out of these, 18 questionnaires were incomplete and only
412 were taken for the purpose of Analysis. Majority of the Respondents are
from Banks located in Urban, Semi Urban and Rural areas.
3.13 Limitations of the Study
The study is conducted by taking the sample size by convenience sampling. As
such a sizable size of the respondents has remained outside the purview of the
field work and has not formed the component of data collection. The survey has
also not covered the lower hierarchical employees of class IV category. The
respondents of bank of co-operative sector are also ignored. The size of
respondents of Private Sector Banks is comparatively small than that of their
counterparts in Public Sector Banks. No classification and separate study is
done of the respondents of banks in Semi Urban and Rural areas. There is also
no proportionate selection of banks as well as respondents among North Goa
and South Goa. There is also no uniform selection of the banks done among all
Talukas of North and South Goa. This can impact the dimensions of QWL of
respondents.
3.14 Scheme of Chapterisation
The following chapterisation scheme is as follows:
Chapter I – Introduction
This chapter outlines and gives a broad overview of Quality of Work Life. It
gives the origin of the term, its evolution and the significance of QWL. The

94
definitions given by various authorities and the changes and the developments
that have taken place over the years are summarised.
Chapter II – Review of Literature
Previous studies done in this area by different Researchers are highlighted. The
main dimensions of QWL focused by the earlier researchers are noted and
observed. The developments that have taken place over the years are also
observed.
Chapter III – Research Methodology
In this Chapter, the problem statement is outlined. The objectives of study,
scope of study, need and significance of study are underlined. The Research
design, Data collection, Questionnaire design, tools of data analysis are
signified. Sample design is also mentioned by showing details of sample of
Public Sector Banks and Private Sector Banks in North and South Goa, as also
their respective Branches in different Talukas of North and South Goa.
Chapter IV – Analysis and Interpretation of Primary Data
In this Chapter, detailed analysis and Interpretation of primary Data is made to
test the fulfilment of objectives of study and the acceptance of hypothesis. This
is done by application of tools such as Descriptive Statistics, Correlation,
Multiple Regression, Factor Analysis, ANOVA and Friedman’s Test.
Chapter V – Findings, Suggestions, Conclusion and Scope for further
Research
This Chapter contains the findings derived from Data Analysis, Suggestions,
Conclusion and areas for further Research.

95
CHAPTER IV
ANALYSIS AND INTERPRETATION OF PRIMARY DATA
The present study is conducted to find out the extent and effect of QWL factors
on bank employees. The data collected from a sample of 412 respondents is
systematically processed and analysed. The results obtained are classified and
expressed in the form of tables and figures. The analysis is done by using the
tools of descriptive statistics, ANOVA, Chi-Square Test, Correlations Simple
and Multiple Regression Analysis, Factor analysis and Friedman Test.
The details of sample respondents for the present study are drawn from various
branches of Public Sector and Private Sector banks from North and South Goa.
The branches of the bank are chosen by convenience sampling. The following
tables show the details of banks visited by the researcher in North Goa and
South Goa.

96
Table: 4.1.1
Public Sector Banks visited Taluka wise in North Goa
State Bank
of India
Tiswadi Bardez Bicholim Perne
m
Sattar
i
Old
Goa R
Mapuca
Main
S
U Bicholim
S
U Pernem R
Honda
Sattari R
Panaji
City
S
U
Panaji
Main
S
U
Allahabad
Bank - - - - -
Andhara
Bank - - - - -
Bank of
Baroda Panaji
S
U Mapuca
S
U Bicholim
S
U Morjim R
Bank of
India
Panaji S
U Mapuca
S
U Bicholim
S
U Morjim R
Honda
Sattari R
Patto
Plaza
S
U
Porvori
m
S
U
Sanqueli
m
S
U
Bank of
Maharashtr
a
Panaji S
U
Porvori
m
S
U
Mapuca S
U
Canara
Bank
Old
Goa R
Canara
Bk
Bicholim
S
U
Canara
Bank R
Panaji S
U
Patto
Panaji
S
U Pernem R
Corporatio
n Bank Panaji
S
U Mapuca
S
U Bicholim R
Ribanda
r R
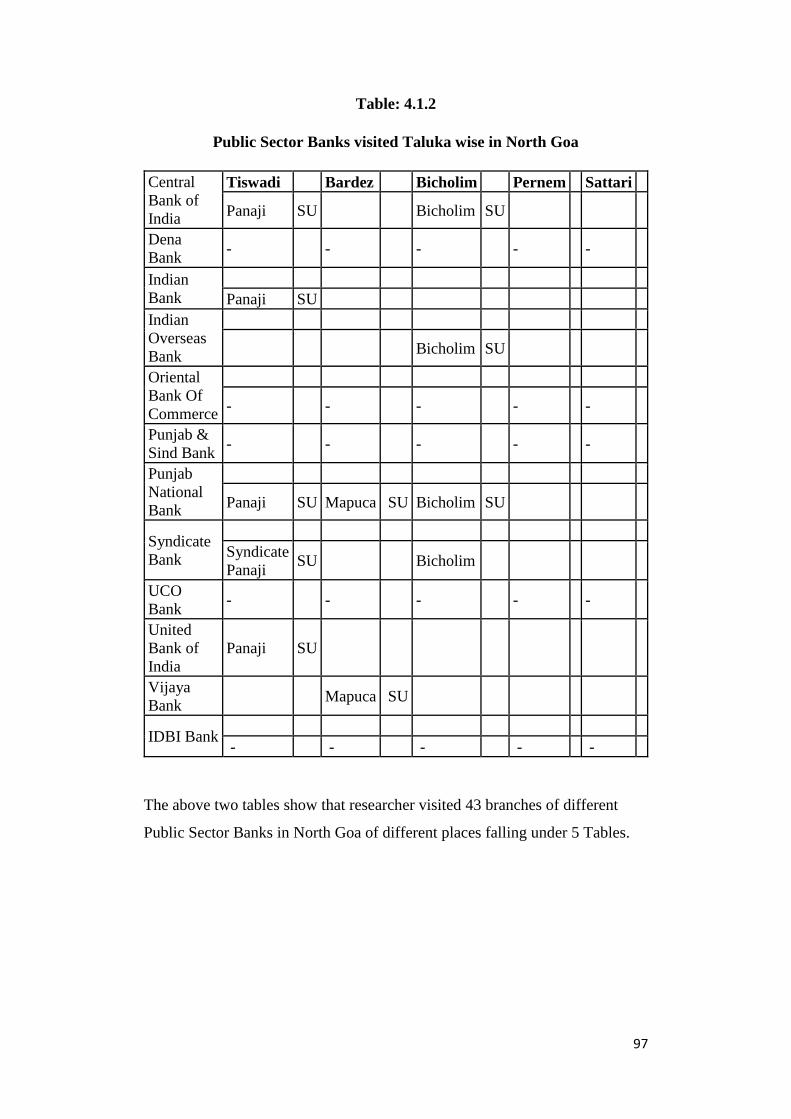
97
Table: 4.1.2
Public Sector Banks visited Taluka wise in North Goa
Central
Bank of
India
Tiswadi Bardez Bicholim Pernem Sattari
Panaji SU Bicholim SU
Dena
Bank - - - - -
Indian
Bank
Panaji SU
Indian
Overseas
Bank
Bicholim SU
Oriental
Bank Of
Commerce
- - - - -
Punjab &
Sind Bank - - - - -
Punjab
National
Bank
Panaji SU Mapuca SU Bicholim SU
Syndicate
Bank
Syndicate
Panaji SU Bicholim
UCO
Bank - - - - -
United
Bank of
India
Panaji SU
Vijaya
Bank Mapuca SU
IDBI Bank
- - - - -
The above two tables show that researcher visited 43 branches of different
Public Sector Banks in North Goa of different places falling under 5 Tables.

98
Table: 4.2.1
Private Sector Banks visited Taluka wise in North Goa
Tiswa
di
Barde
z
Bicholi
m
Perne
m
Satta
ri
Axis Bank
Ltd.
Panaji
Branc
h
S
U
Mapuc
a
S
U - - -
Catholic
Syrian
Bank Ltd.
- - - - -
Developm
ent Credit
Bank Ltd.
- - - - -
Federal
Bank Ltd. Panaji
S
U - - - -
Hdfc
Bank Ltd. Panaji
S
U
Bicholi
m
S
U -
HDFC
Bank
P
R -
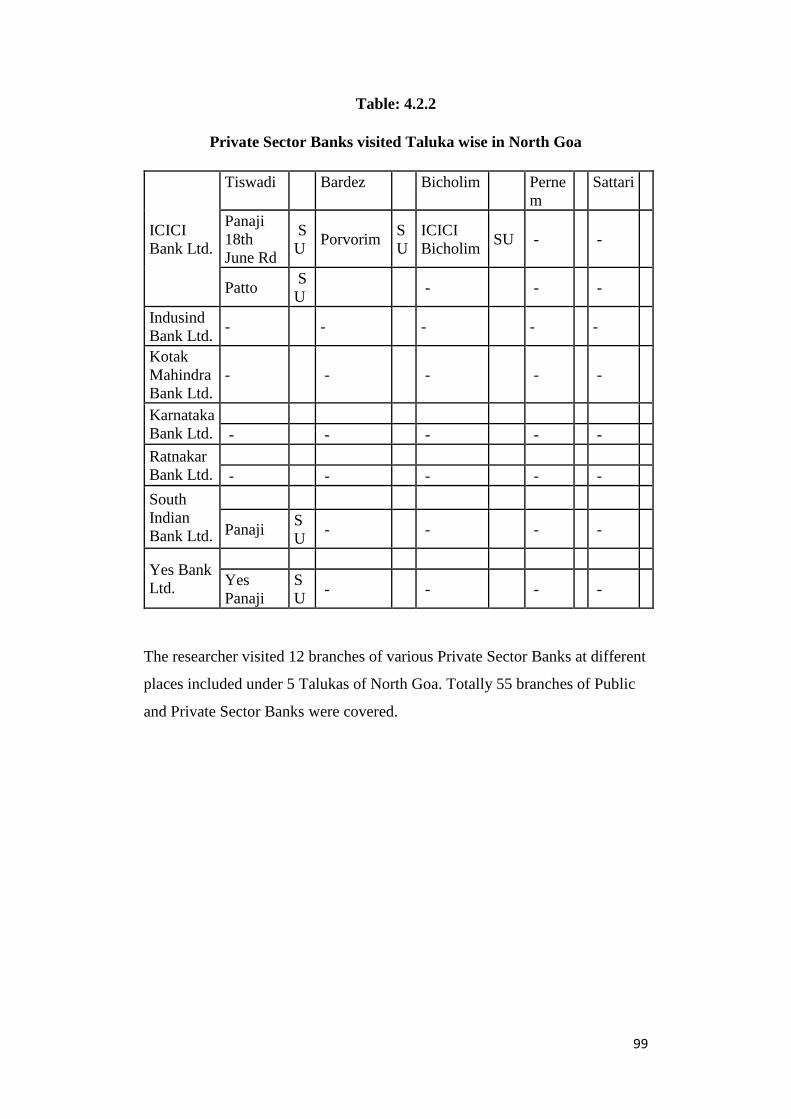
99
Table: 4.2.2
Private Sector Banks visited Taluka wise in North Goa
ICICI
Bank Ltd.
Tiswadi Bardez Bicholim Perne
m
Sattari
Panaji
18th
June Rd
S
U Porvorim
S
U
ICICI
Bicholim SU - -
Patto S
U - - -
Indusind
Bank Ltd. - - - - -
Kotak
Mahindra
Bank Ltd.
- - - - -
Karnataka
Bank Ltd.
- - - - -
Ratnakar
Bank Ltd.
- - - - -
South
Indian
Bank Ltd.
Panaji S
U - - - -
Yes Bank
Ltd.
Yes
Panaji
S
U - - - -
The researcher visited 12 branches of various Private Sector Banks at different
places included under 5 Talukas of North Goa. Totally 55 branches of Public
and Private Sector Banks were covered.

100
Table: 4.3.1
Public Sector Banks visited Taluka wise in South Goa
STATE
BANK OF
INDIA
Salc
ete
Quepe
m
Morm
ugao
Ponda Cana
cona
Dharba
ndora
Sang
uem
Mar
gao
S
U
Sanvo
rdem
S
U Major
da R
Borim
Shirod
a
R Cana
cona
S
U
Gog
ol
S
U
Quepe
m
S
U
Vasco
Main
S
U Ponda
S
U
Priol
Mang
ueshi
R
Mar
gao
City
Br
S
U
Curti S
U
ALLAHA
BAD
BANK
Mar
gao
S
U
Ponda
S
U
ANDHAR
A BANK - - - - - - -
BANK OF
BARODA
Ponda
S
U
BANK OF
INDIA
Mar
gao
S
U
Quepe
m
S
U
Ponda
(SA)
S
U
Shirod
a
S
U
BANK OF
MAHARA
SHTRA
Mar
gao
S
U
Ponda S
U
101
Table: 4.3.2
Public Sector Banks visited Taluka wise in South Goa
Salcet
e
Quepe
m
Morm
ugao
Pon
da
Cana
cona
Dharba
ndora
Sang
uem
CANARA
BANK
Fatord
a
S
U
Curch
orem R
Mar
dol R
Quepe
m
S
U
Pon
da
S
U
Shir
oda
S
U
CENTRA
L BANK
OF INDIA
Marga
o
S
U
Pon
da
S
U
CORPOR
ATION
BANK
Vidya
nagar
S
U
Sirvoi
Amon
a
S
U
Marga
o
S
U
Curch
orem
S
U
DENA
BANK
Pon
da
S
U
INDIAN
BANK
Marga
o
S
U
Pon
da
S
U
INDIAN
OVERSE
AS BANK
Marga
o
S
U
Pon
da
S
U
Gogal
Marga
o
S
U
ORIENT
AL
BANK OF
COMME
RCE
Marga
o
S
U
Pon
da
S
U
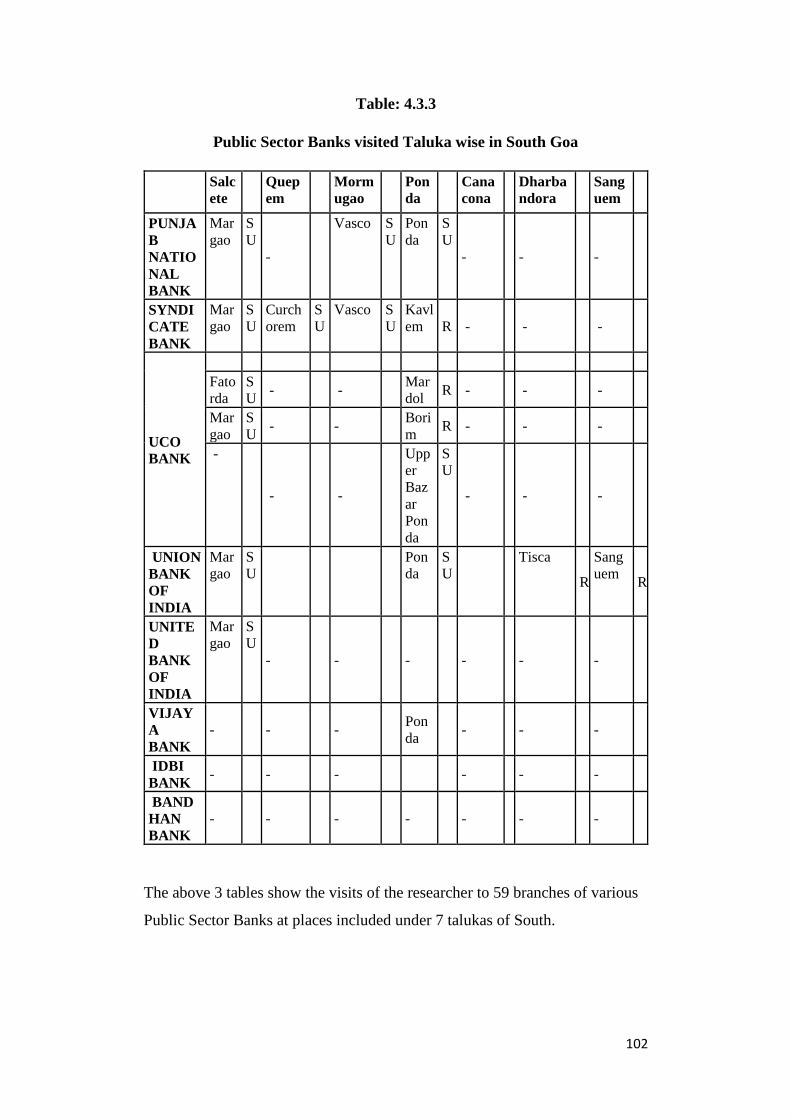
102
Table: 4.3.3
Public Sector Banks visited Taluka wise in South Goa
Salc
ete
Quep
em
Morm
ugao
Pon
da
Cana
cona
Dharba
ndora
Sang
uem
PUNJA
B
NATIO
NAL
BANK
Mar
gao
S
U
-
Vasco S
U
Pon
da
S
U
- - -
SYNDI
CATE
BANK
Mar
gao
S
U
Curch
orem
S
U
Vasco S
U
Kavl
em R - - -
UCO
BANK
Fato
rda
S
U - -
Mar
dol R - - -
Mar
gao
S
U - -
Bori
m R - - -
-
- -
Upp
er
Baz
ar
Pon
da
S
U
- - -
UNION
BANK
OF
INDIA
Mar
gao
S
U
Pon
da
S
U
Tisca
R
Sang
uem R
UNITE
D
BANK
OF
INDIA
Mar
gao
S
U
- - - - - -
VIJAY
A
BANK
- - - Pon
da - - -
IDBI
BANK - - - - - -
BAND
HAN
BANK
- - - - - - -
The above 3 tables show the visits of the researcher to 59 branches of various
Public Sector Banks at places included under 7 talukas of South.

103
Table: 4.4.1
Private Sector Banks visited Taluka wise in South Goa
AXIS
BANK
LTD.
Salce
te
Quepe
m
Morm
ugao
Pon
da
Cana
cona
Dharba
ndora
Sang
uem
Marg
ao
S
U - -
Pon
da
S
U - - -
CATHOLI
C SYRIAN
BANK
LTD.
- - - - - - -
DEVELOP
MENT
CREDIT
BANK
LTD.
- - - - - - -
FEDERAL
BANK
LTD.
Marg
ao
S
U - -
Pon
da
S
U - - -
HDFC
BANK
LTD.
Aque
m
S
U
Curch
orem
S
U
Pon
da
S
U
Cana
cona
S
U -
Sang
uem R
Marg
ao
S
U
- -
Shir
oda
S
U
- -
-
Fator
da
S
U
- -
- - - -
Gogo
l
S
U
- -
- - - -
ICICI
BANK
LTD.
Marg
ao
S
U
Curch
orem
S
U -
Pon
da
S
U
Cana
cona
S
U
Tisk
Usgao
R
Cunc
olim
S
U
Quepe
m
S
U -
- - - -
INDUSIN
D BANK
LTD.
-
Sanvo
rdem
S
U -
Pon
da
R
- - -

104
Table: 4.4.2
Private Sector Banks visited Taluka wise in South Goa
KARNATA
KA BANK
LTD.
Marga
o
S
U - -
Pond
a
S
U - - -
KOTAK
MAHINDR
A BANK
LTD. - - - - - - -
RBL BANK
LTD
Marg
ao
S
U - - - - - -
SOUTH
INDIAN
BANK LTD. - - -
Pond
a
S
U - - -
YES BANK
LTD.
Curchore
m
S
U
Pond
a
S
U
The above two tables show the details of 28 branches of various Private Sector
Banks at various places included under 7 talukas of South Goa. 87 branches of
various Public Sector and Private Sector Banks were visited.

105
Table: 4.5
Selection of Sample Size
Distribution of Sample Questionnaire
Number
of
questio
nnaires
distribu
ted
Number
of
questionn
aires not
received
back
Number
of
question
naires
received
back
Number
of
questionn
aires
received
blank
Number
of
questionn
aires
taken for
analysis
Public and
Private
Sector
Banks in
North and
South Goa
470 20 450 38 412
The above table shows the details of distribution of questionnaire and
selection of final sample size for analysis.
Cochran’s Formula
Where:
• e is the desired level of precision (i.e. the margin of error),
• p is the (estimated) proportion of the population which has the attribute
in question
• q is 1 – p.
((1.96)2 (0.5) (0.5)) / (0.05)2 = 385.
Cochrans Formula has been adopted in our study to determine the sample
size of unknown and large population. The z-value or z-score stated refers
to our selected confident level. It has been set at 95 percent with the margin
of error at 5 percent. The estimated proportion of population is set at 0.5
which assumes maximum variability in the data of our sample. On
95% Z Score = 1.96

106
computing we get a sample size of Respondents rounded to 385. The sample
size of the study for the purpose of analysis is 412.
Table 4.6
Status of Cases in Reliability Test
Case Processing Summary
N %
Cases
Valid 60 67.4
Excludeda 29 32.6
Total 89 100.0
a. Listwise deletion based on all variables in the procedure.
Table 4.7
Reliability Test of Likert Scale
Reliability Statistics
Cronbach's Alpha Cronbach's Alpha Based
on Standardized Items
N of Items
.954 .954 41
89 pilot samples were taken for Reliability test, 60 cases were considered valid
and 29 cases were excluded as shown in table above. Reliability test shows
Cronbach's alpha is 0.954, which indicates an excellent level of internal
consistency for our Likert scale as shown in table above
Table 4.8
Age profile of respondents
Descriptive Statistics
N Range Minimum Maximum Mean Std.
Deviation
Age 407 35 24 59 40.27 9.784
Valid N
(listwise) 407
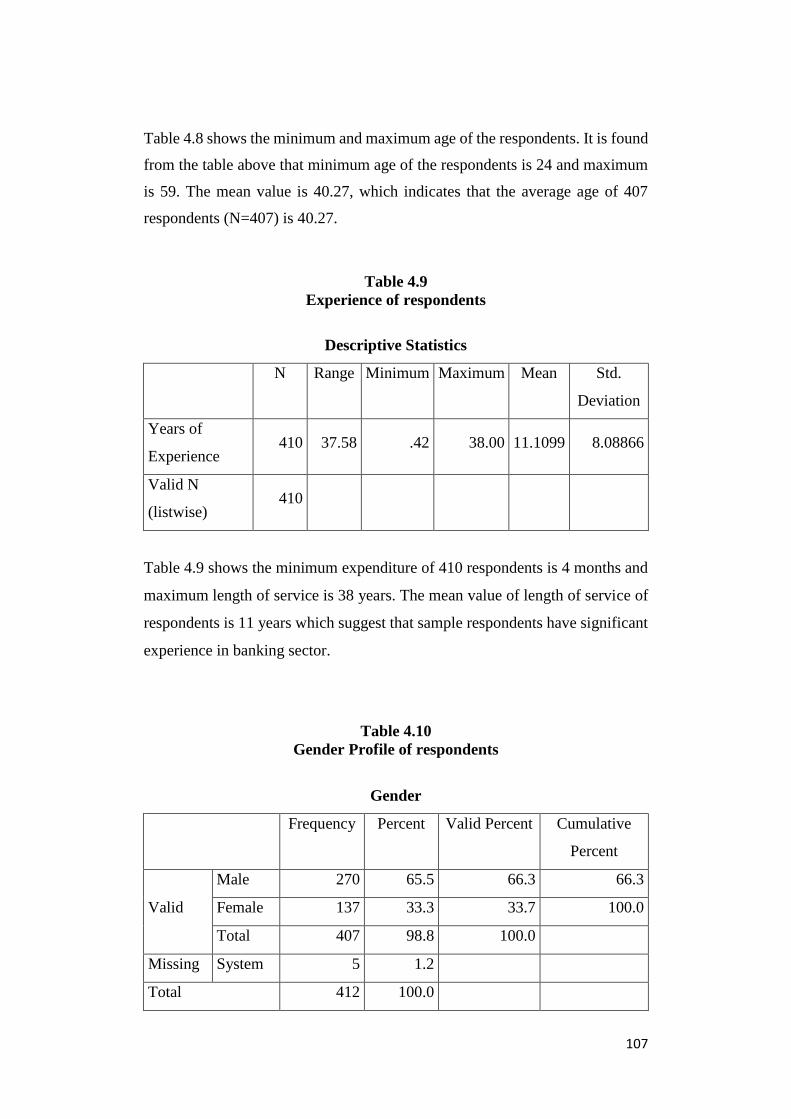
107
Table 4.8 shows the minimum and maximum age of the respondents. It is found
from the table above that minimum age of the respondents is 24 and maximum
is 59. The mean value is 40.27, which indicates that the average age of 407
respondents (N=407) is 40.27.
Table 4.9
Experience of respondents
Descriptive Statistics
N Range Minimum Maximum Mean Std.
Deviation
Years of
Experience 410 37.58 .42 38.00 11.1099 8.08866
Valid N
(listwise) 410
Table 4.9 shows the minimum expenditure of 410 respondents is 4 months and
maximum length of service is 38 years. The mean value of length of service of
respondents is 11 years which suggest that sample respondents have significant
experience in banking sector.
Table 4.10
Gender Profile of respondents
Gender
Frequency Percent Valid Percent Cumulative
Percent
Valid
Male 270 65.5 66.3 66.3
Female 137 33.3 33.7 100.0
Total 407 98.8 100.0
Missing System 5 1.2
Total 412 100.0
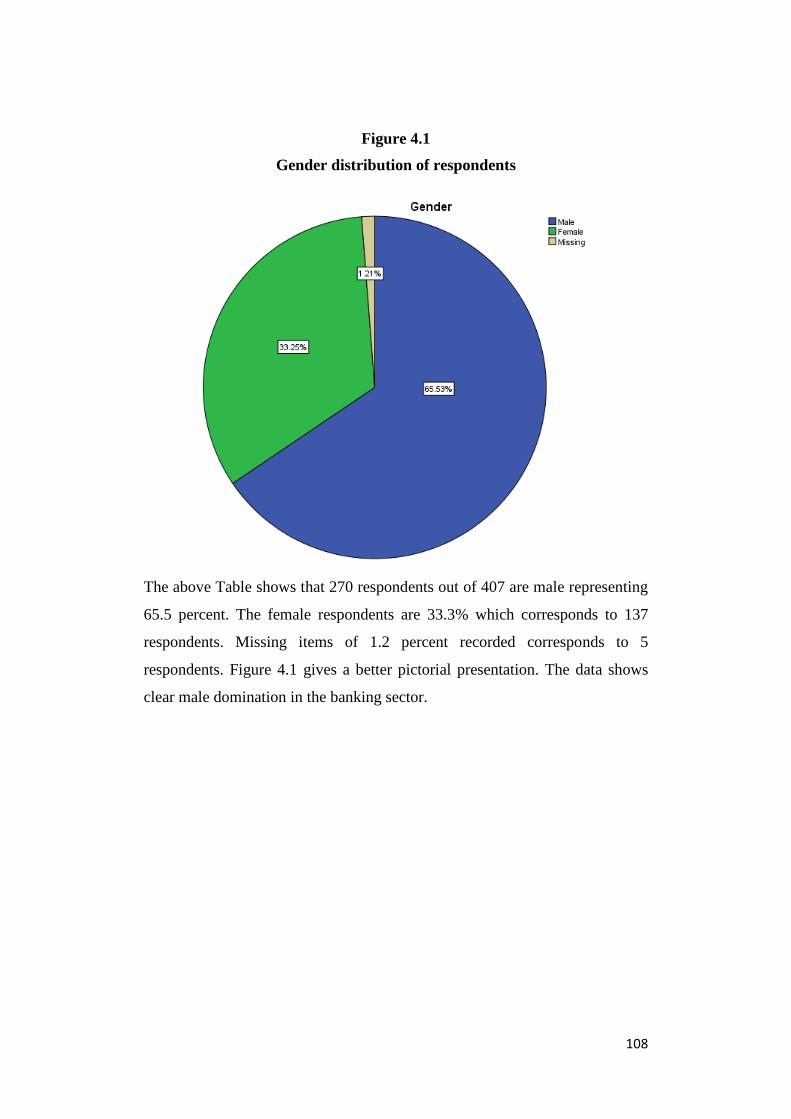
108
Figure 4.1
Gender distribution of respondents
The above Table shows that 270 respondents out of 407 are male representing
65.5 percent. The female respondents are 33.3% which corresponds to 137
respondents. Missing items of 1.2 percent recorded corresponds to 5
respondents. Figure 4.1 gives a better pictorial presentation. The data shows
clear male domination in the banking sector.
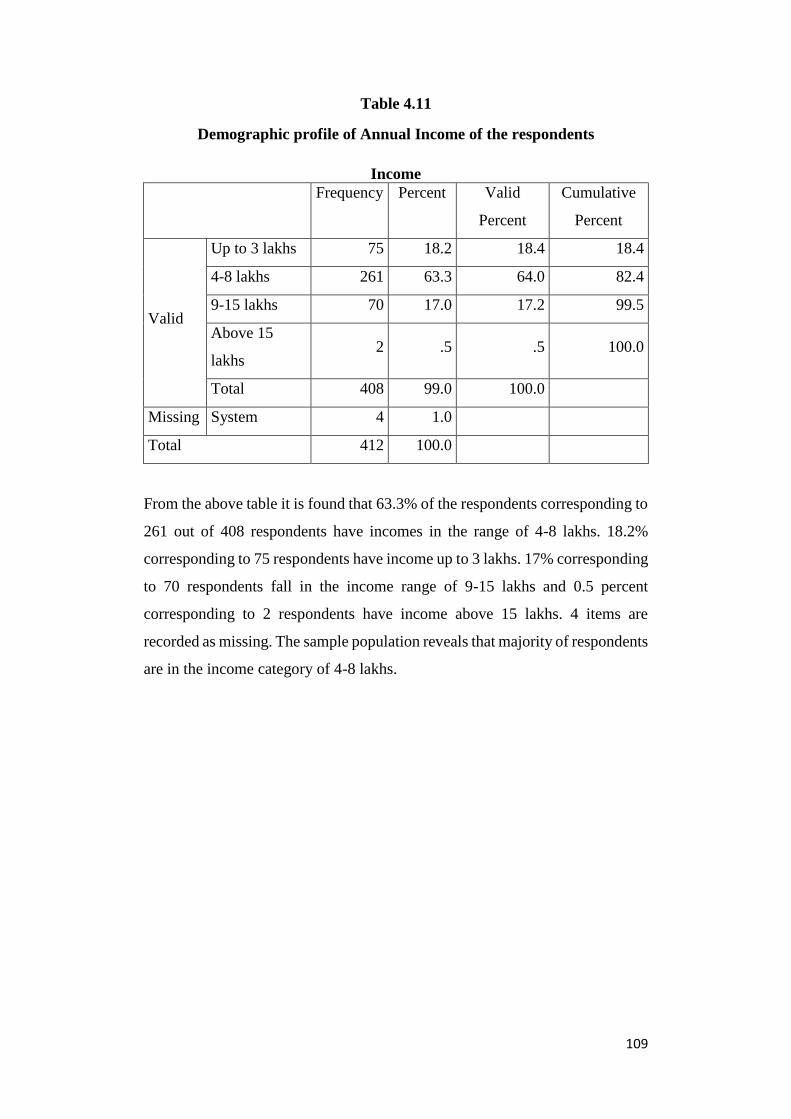
109
Table 4.11
Demographic profile of Annual Income of the respondents
Income
Frequency Percent Valid
Percent
Cumulative
Percent
Valid
Up to 3 lakhs 75 18.2 18.4 18.4
4-8 lakhs 261 63.3 64.0 82.4
9-15 lakhs 70 17.0 17.2 99.5
Above 15
lakhs 2 .5 .5 100.0
Total 408 99.0 100.0
Missing System 4 1.0
Total 412 100.0
From the above table it is found that 63.3% of the respondents corresponding to
261 out of 408 respondents have incomes in the range of 4-8 lakhs. 18.2%
corresponding to 75 respondents have income up to 3 lakhs. 17% corresponding
to 70 respondents fall in the income range of 9-15 lakhs and 0.5 percent
corresponding to 2 respondents have income above 15 lakhs. 4 items are
recorded as missing. The sample population reveals that majority of respondents
are in the income category of 4-8 lakhs.

110
Figure 4.2
Income distribution of respondents
Table 4.12
Education profile of the respondents
Education
Frequency Percent Valid
Percent
Cumulative
Percent
Valid
HSSC 21 5.1 5.1 5.1
Graduation 275 66.7 67.4 72.5
Post-
Graduation 112 27.2 27.5 100.0
Total 408 99.0 100.0
Missing System 4 1.0
Total 412 100.0
Source: Primary Data
Table 4.12 shows educational profile of the respondents. They are classified into
Higher Secondary Level, Graduation and Post-Graduation. As shown in the
above table out of the total valid respondents of 408, 66.7 % corresponding to
275 are graduates. 112 respondents corresponding to (27.2%) are post-graduates
and 5.1% which equals 21 respondents are HSSC. This is also shown in the
figure and it indicates that majority respondents are graduates.

111
Figure 4.3
Level of education of respondents
Table 4.13
Bank category of respondents
Bank
Frequency Percent Valid
Percent
Cumulative
Percent
Valid
Public Sector 319 77.4 77.8 77.8
Private
Sector 91 22.1 22.2 100.0
Total 410 99.5 100.0
Missing System 2 .5
Total 412 100.0
Source: Primary Data

112
Figure 4.4
Banking sector classification
The table 4.13 shows each of the type of bank along with number of cases. The
frequencies are shown as 410 as valid data and 2 as missing data. 319
respondents constitute 77.4% of the total valid respondents working in public
sector. 91 respondents constitute 22.1% of the total valid respondents working
in private sector. The sample population reveals that majority of respondents
are working in public sector banks.

113
Table 4.14
Designation profile of respondents
Designation
Frequency Percent Valid Percent Cumulative
Percent
Valid
Managerial 151 36.7 36.7 36.7
Staff 260 63.1 63.3 100.0
Total 411 99.8 100.0
Missing System 1 .2
Total 412 100.0
Figure 4.5
Job classification of respondents
The designation of respondents is classified as Managerial and Staff. The above
table shows that 63.1%. represents 260 respondents are the staff of the banking
sector. 36.7% corresponding to 151 respondents are the managers, out of total
valid respondents of 411. The sample population reveals that majority of
respondents are staff representing 63.1 percent.

114
Table 4.15
Nature of employment of respondents
Nature of Employment
Frequency Percent Valid Percent Cumulative
Percent
Valid
Permanent 408 99.0 99.3 99.3
Temporary 3 .7 .7 100.0
Total 411 99.8 100.0
Missing System 1 .2
Total 412 100.0
Figure 4.6
Employment status of respondents
The Table 4.15 shows the nature of employment along with number of cases.
The frequencies are shown as 411 as valid data and 1 as missing data. 408
respondents constitute to 99% of the total valid respondents working as
permanent employees and 3 respondents constitute to 0.7 % of the total valid

115
respondents working as temporary employees. The sample population reveals
that the majority of respondents are working as permanent employees in
banking sector.
Table 4.16
Gender wise discrimination at the time of recruitment
Have you observed any discrimination on Gender made by employer
while recruitment?
Frequency Percent Valid Percent Cumulative
Percent
Valid
Yes 2 .5 .5 .5
No 407 98.8 99.5 100.0
Total 409 99.3 100.0
Missing System 3 .7
Total 412 100.0
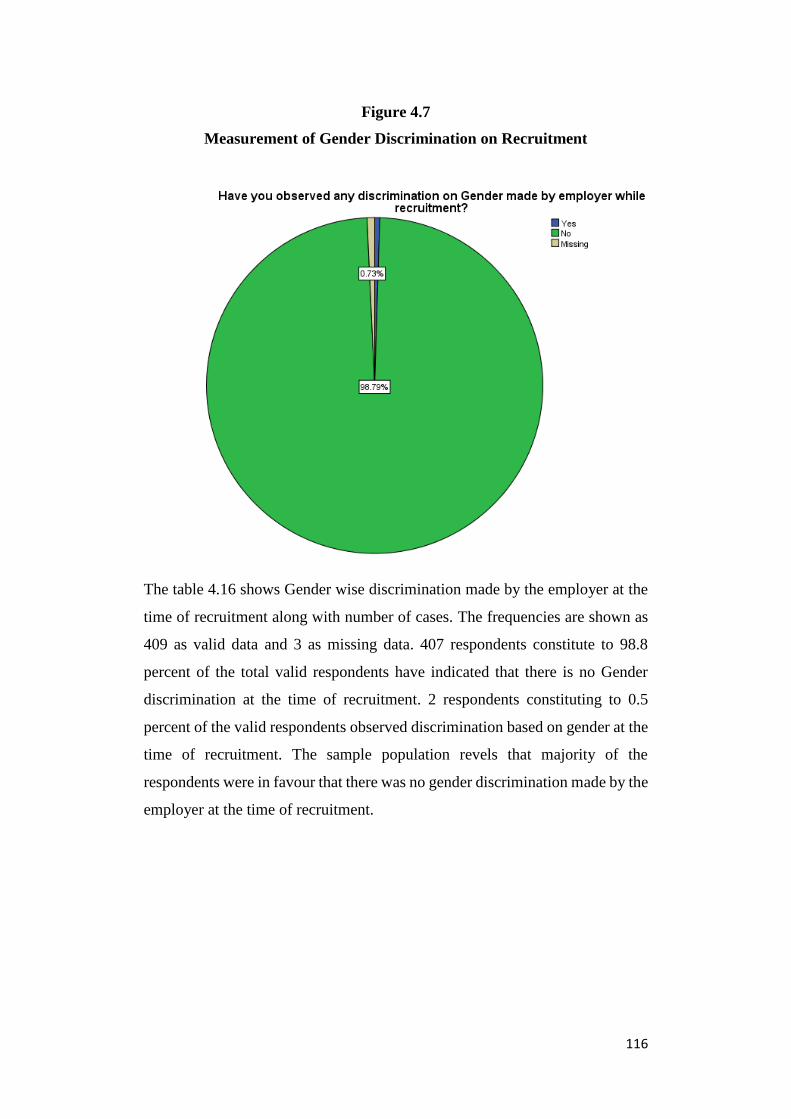
116
Figure 4.7
Measurement of Gender Discrimination on Recruitment
The table 4.16 shows Gender wise discrimination made by the employer at the
time of recruitment along with number of cases. The frequencies are shown as
409 as valid data and 3 as missing data. 407 respondents constitute to 98.8
percent of the total valid respondents have indicated that there is no Gender
discrimination at the time of recruitment. 2 respondents constituting to 0.5
percent of the valid respondents observed discrimination based on gender at the
time of recruitment. The sample population revels that majority of the
respondents were in favour that there was no gender discrimination made by the
employer at the time of recruitment.
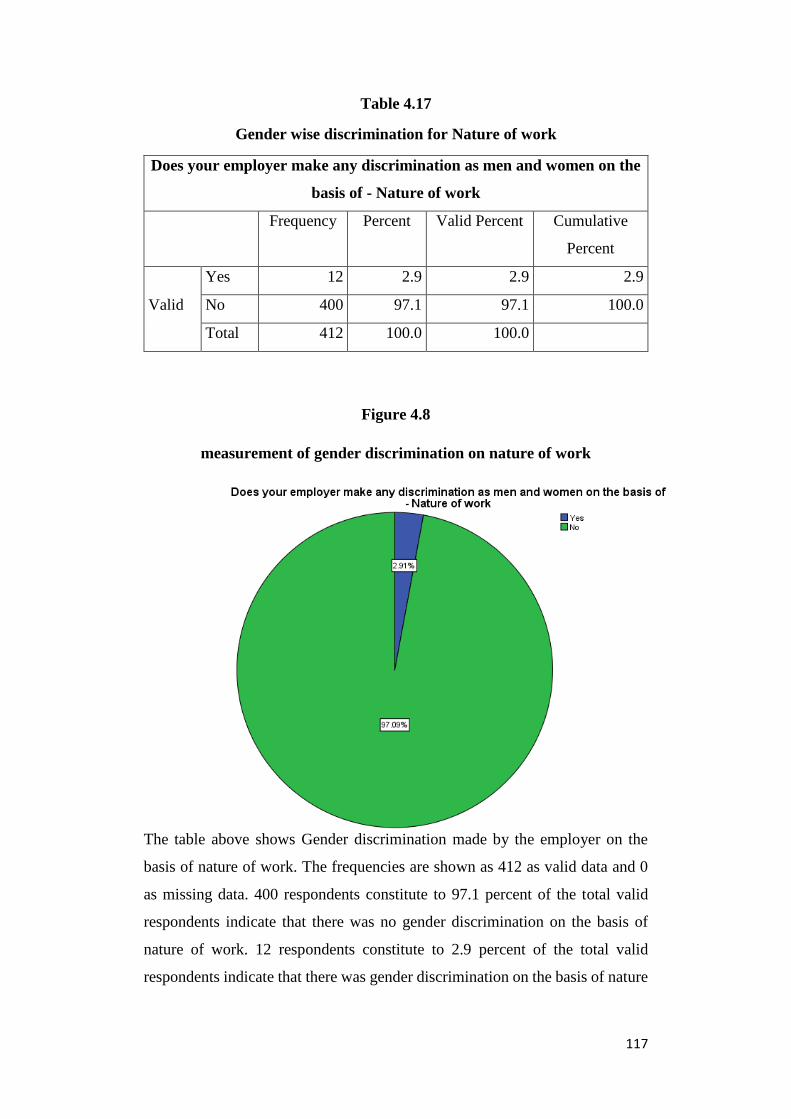
117
Table 4.17
Gender wise discrimination for Nature of work
Does your employer make any discrimination as men and women on the
basis of - Nature of work
Frequency Percent Valid Percent Cumulative
Percent
Valid
Yes 12 2.9 2.9 2.9
No 400 97.1 97.1 100.0
Total 412 100.0 100.0
Figure 4.8
measurement of gender discrimination on nature of work
The table above shows Gender discrimination made by the employer on the
basis of nature of work. The frequencies are shown as 412 as valid data and 0
as missing data. 400 respondents constitute to 97.1 percent of the total valid
respondents indicate that there was no gender discrimination on the basis of
nature of work. 12 respondents constitute to 2.9 percent of the total valid
respondents indicate that there was gender discrimination on the basis of nature

118
of work. The sample population reveals that majority of respondents have
observed that there was no gender discrimination with respect to nature of work.
Table 4.18
Gender discrimination for duration of work
Does your employer make any discrimination as men and women on the
basis of - Duration of work
Frequency Percent Valid Percent Cumulative
Percent
Valid
Yes 13 3.2 3.2 3.2
No 398 96.6 96.8 100.0
Total 411 99.8 100.0
Missing System 1 .2
Total 412 100.0

119
Figure 4. 9
Measurement of gender discrimination on duration of work
The table 4.18 shows Gender discrimination made by the employer on the basis
of duration of work. The frequencies are shown as 411 as valid data and 1 as
missing data. 398 respondents constitute to 96.6 percent of the total valid
respondents have indicated no gender discrimination on the basis of duration of
work. 13 respondents constitute to 3.2 percent of the total valid respondents
observed gender discrimination on the basis of duration of work. The sample
population reveals that majority of the respondents did not observe any Gender
discrimination based on duration of work.

120
Table 4.19
Discrimination among Gender for promotion
Does your employer make any discrimination as men and women on the
basis of - Promotion
Frequency Percent Valid Percent Cumulative
Percent
Valid
Yes 7 1.7 1.7 1.7
No 403 97.8 98.3 100.0
Total 410 99.5 100.0
Missing System 2 .5
Total 412 100.0
Figure 4.10
Measurement of Gender discrimination on promotion
The table 4.19 shows Gender discrimination made by the employer among
Gender on the basis of promotion along with number of cases. The frequencies
are shown as 410 as valid data and 2 as missing data. 403 respondents constitute
to 97.8 percent of the total valid respondents indicate that there was no Gender
discrimination on the basis of promotion. 7 respondents constitute to 1.7 percent
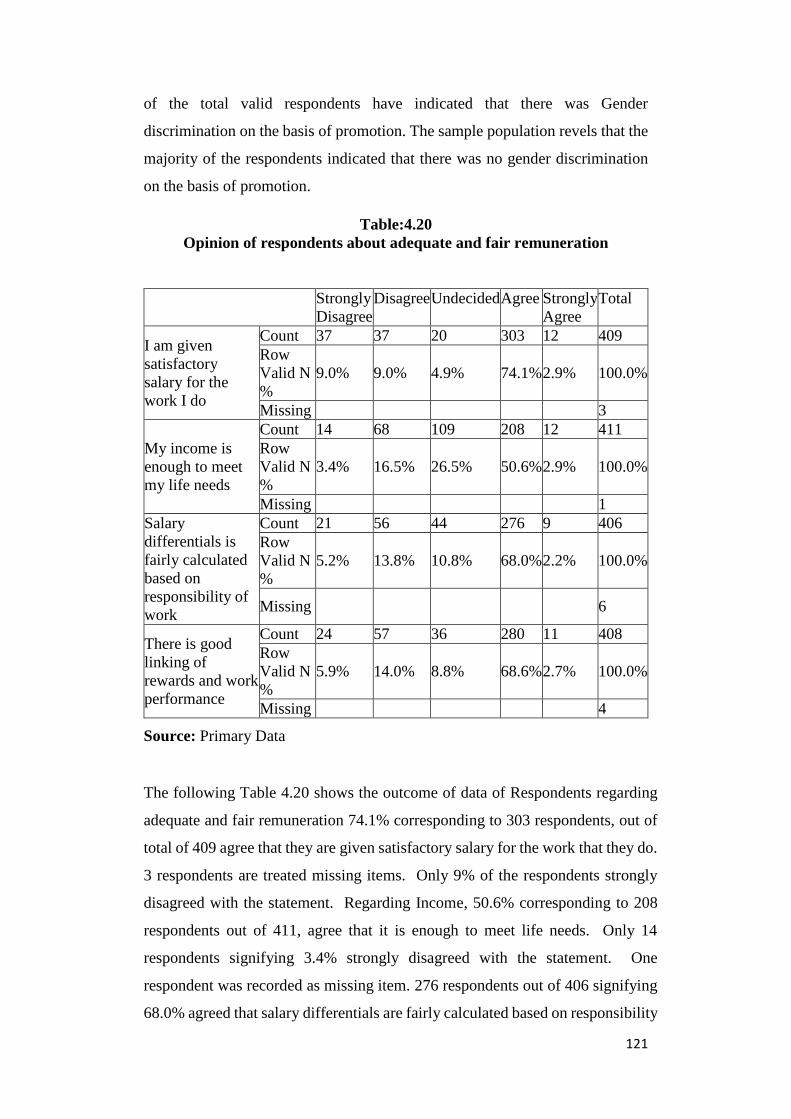
121
of the total valid respondents have indicated that there was Gender
discrimination on the basis of promotion. The sample population revels that the
majority of the respondents indicated that there was no gender discrimination
on the basis of promotion.
Table:4.20
Opinion of respondents about adequate and fair remuneration
Strongly
Disagree
Disagree Undecided Agree Strongly
Agree
Total
I am given
satisfactory
salary for the
work I do
Count 37 37 20 303 12 409
Row
Valid N
%
9.0% 9.0% 4.9% 74.1% 2.9% 100.0%
Missing 3
My income is
enough to meet
my life needs
Count 14 68 109 208 12 411
Row
Valid N
%
3.4% 16.5% 26.5% 50.6% 2.9% 100.0%
Missing 1
Salary
differentials is
fairly calculated
based on
responsibility of
work
Count 21 56 44 276 9 406
Row
Valid N
%
5.2% 13.8% 10.8% 68.0% 2.2% 100.0%
Missing
6
There is good
linking of
rewards and work
performance
Count 24 57 36 280 11 408
Row
Valid N
%
5.9% 14.0% 8.8% 68.6% 2.7% 100.0%
Missing 4
Source: Primary Data
The following Table 4.20 shows the outcome of data of Respondents regarding
adequate and fair remuneration 74.1% corresponding to 303 respondents, out of
total of 409 agree that they are given satisfactory salary for the work that they do.
3 respondents are treated missing items. Only 9% of the respondents strongly
disagreed with the statement. Regarding Income, 50.6% corresponding to 208
respondents out of 411, agree that it is enough to meet life needs. Only 14
respondents signifying 3.4% strongly disagreed with the statement. One
respondent was recorded as missing item. 276 respondents out of 406 signifying
68.0% agreed that salary differentials are fairly calculated based on responsibility

122
of work. Only 5.2% corresponding to 21 respondents strongly disagreed with the
statement. 6 Respondents were recorded as missing items. The percentage of
Respondents who agreed that there is good linking of rewards and work
performance were 68.6% corresponding to 280 out of total of 408. 5.9%
constituting 24 respondents Strongly disagreed with statement. 4 Respondents
were treated as missing items.
Table: 4.21
Opinion of respondents about Working Environment
Strongly
Disagree
Disagree Undecided Agree Strongly
Agree
Total
Working
environment in
the organisation
is participative
Count 8 17 14 349 20 408
Row
Valid N
%
2.0% 4.2% 3.4% 85.5% 4.9% 100.0%
Missing 4
The physical
working
conditions in the
organisations are
very conducive to
work
Count 5 23 18 340 17 403
Row
Valid N
%
1.2% 5.7% 4.5% 84.4% 4.2% 100.0%
Missing
9
Work assigned as
per qualification
and skills
Count 8 51 17 321 10 407
Row
Valid N
%
2.0% 12.5% 4.2% 78.9% 2.5% 100.0%
Missing 5
You are satisfied
with working
hours of
organisation
Count 26 48 202 116 17 409
Row
Valid N
%
6.4% 11.7% 49.4% 28.4% 4.2% 100.0%
Missing 3
The working
hours enables
you to maintain
balance between
work and
personal life
Count 25 67 95 208 10 405
Row
Valid N
%
6.2% 16.5% 23.5% 51.4% 2.5% 100.0%
Missing
7
Source: Primary Data
It is observed from the Table above that 85.5% corresponding to 349 of the
Respondents out of 408 agree that the working environment in the organization
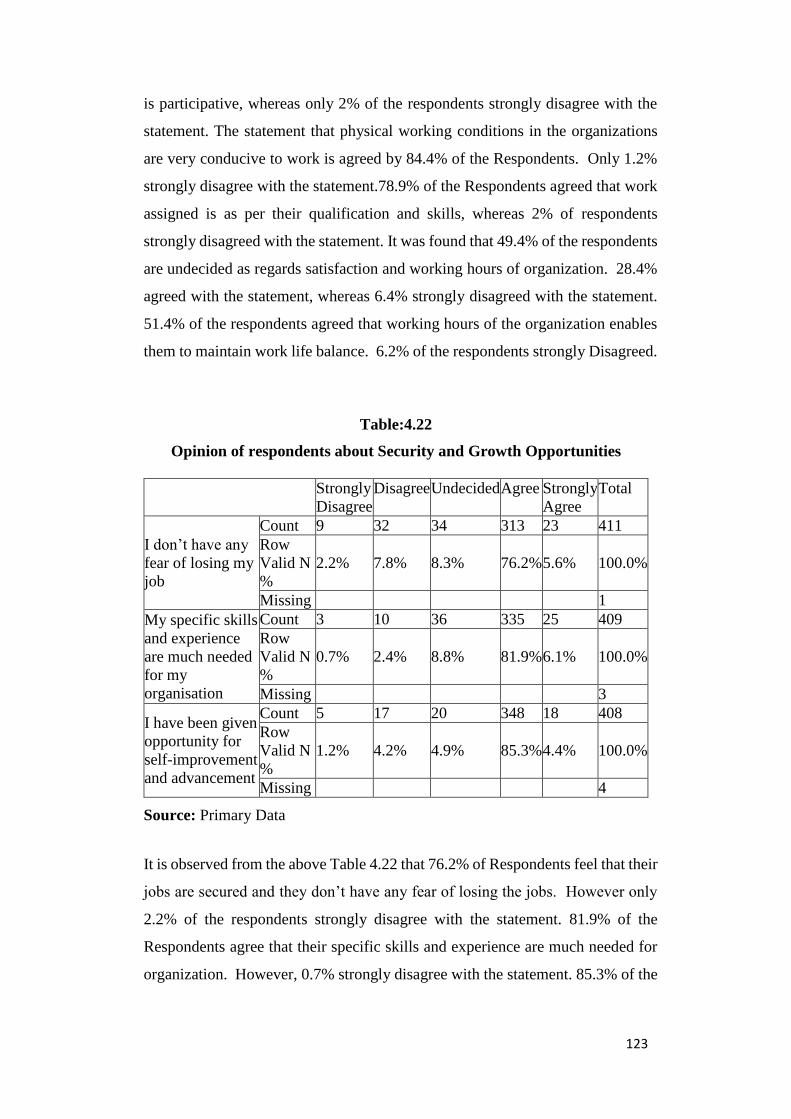
123
is participative, whereas only 2% of the respondents strongly disagree with the
statement. The statement that physical working conditions in the organizations
are very conducive to work is agreed by 84.4% of the Respondents. Only 1.2%
strongly disagree with the statement.78.9% of the Respondents agreed that work
assigned is as per their qualification and skills, whereas 2% of respondents
strongly disagreed with the statement. It was found that 49.4% of the respondents
are undecided as regards satisfaction and working hours of organization. 28.4%
agreed with the statement, whereas 6.4% strongly disagreed with the statement.
51.4% of the respondents agreed that working hours of the organization enables
them to maintain work life balance. 6.2% of the respondents strongly Disagreed.
Table:4.22
Opinion of respondents about Security and Growth Opportunities
Strongly
Disagree
Disagree Undecided Agree Strongly
Agree
Total
I don’t have any
fear of losing my
job
Count 9 32 34 313 23 411
Row
Valid N
%
2.2% 7.8% 8.3% 76.2% 5.6% 100.0%
Missing 1
My specific skills
and experience
are much needed
for my
organisation
Count 3 10 36 335 25 409
Row
Valid N
%
0.7% 2.4% 8.8% 81.9% 6.1% 100.0%
Missing 3
I have been given
opportunity for
self-improvement
and advancement
Count 5 17 20 348 18 408
Row
Valid N
%
1.2% 4.2% 4.9% 85.3% 4.4% 100.0%
Missing 4
Source: Primary Data
It is observed from the above Table 4.22 that 76.2% of Respondents feel that their
jobs are secured and they don’t have any fear of losing the jobs. However only
2.2% of the respondents strongly disagree with the statement. 81.9% of the
Respondents agree that their specific skills and experience are much needed for
organization. However, 0.7% strongly disagree with the statement. 85.3% of the

124
Respondents agree that they have been given opportunity for self-improvement
and advancement, whereas 1.2% strongly disagree with the statement.
Table:4.23
Views of respondents about Motivation
Strongly
Disagree
Disagree Undecided Agree Strongly
Agree
Total
My work
environment is
highly motivating
for better
performance
Count 12 39 28 310 21 410
Row
Valid N
%
2.9% 9.5% 6.8% 75.6% 5.1% 100.0%
Missing 2
Source: Primary Data
From the above Table 4.23 75.6% of the Respondents agree that work
environment is highly motivating for better performance. 2.9% strongly
disagreed with the statement.
Table:4.24
Views of respondents regarding Respect at work
Strongly
Disagree
Disagree Undecided Agree Strongly
Agree
Total
I feel my
personal rights
are protected in
my organisation
Count 4 23 25 335 24 411
Row
Valid N
%
1.0% 5.6% 6.1% 81.5% 5.8% 100.0%
Missing 1
Source: Primary Data
Above Table 4.24 shows that 81.5% of the respondents agree that their personal
rights are protected in their organization. However, 1% strongly disagree with
the statement.

125
Table:4.25
Views of respondents about Occupational Stress
Strongly
Disagree
Disagree Undecided Agree Strongly
Agree
Total
My work place is
stress free
Count 29 67 29 273 12 410
Row
Valid N
%
7.1% 16.3% 7.1% 66.6% 2.9% 100.0%
Missing 2
Adequate time is
given to complete
my task
Count 14 40 24 317 12 407
Row
Valid N
%
3.4% 9.8% 5.9% 77.9% 2.9% 100.0%
Missing 5
Source: Primary Data
The Table 4.25 above shows that 66.6% of the respondents agree that their work
place is stress free. 7.1% strongly disagree with the statement. 77.9% of the
respondents agree that adequate time is given to complete their task. 3.4%
strongly disagree with the statement.
Table:4.26
Views of respondents about Recognition
Strongly
Disagree
Disagree Undecided Agree Strongly
Agree
Total
I am recognised
when I do some
outstanding
performance
Count 5 22 28 321 35 411
Row
Valid N
%
1.2% 5.4% 6.8% 78.1% 8.5% 100.0%
Missing 1
Table 4.26 shows that 78.1% of the respondents agree that they are recognized
when they do some outstanding performance. 1.2% strongly disagree with the
statement.

126
Table:4.27
Views of respondents about Autonomy and participation
Strongly
Disagree
Disagree Undecided Agree Strongly
Agree
Total
I have been given
adequate freedom
to carry out my
work activities
Count 6 29 18 338 18 409
Row
Valid N
%
1.5% 7.1% 4.4% 82.6% 4.4% 100.0%
Missing 3
My preferences
are considered
when they assign
my work area
Count 13 46 111 223 14 407
Row
Valid N
%
3.2% 11.3% 27.3% 54.8% 3.4% 100.0%
Missing 5
My organisation
gives me option
to give my
suggestion and it
really considers
for its
implementation if
reasonable
Count 6 30 30 326 17 409
Row
Valid N
%
1.5% 7.3% 7.3% 79.7% 4.2% 100.0%
Missing
3
Source: Primary Data
Table 4.27 indicates that 82.6% of the respondents agree that they have been
given adequate freedom to carry out their work activities. 1.5% strongly disagree
with the statement. 54.8% agree that their preferences are considered when they
assign work area, but 3.2% of the respondents strongly disagree with the
statement. 79.7% of respondents agree that organization gives them option to
give suggestions and considers for implementation if reasonable. But 1.5%
strongly disagree with the statement.

127
Table:4.28
Views of respondents about Grievances Procedure
Strongly
Disagree
Disagree Undecided Agree Strongly
Agree
Total
I know where to
approach if I
have any
complaint
Count 6 9 19 352 23 409
Row
Valid N
%
1.5% 2.2% 4.6% 86.1% 5.6% 100.0%
Missing 3
My grievances
are fairly
enquired and
resolved
Count 11 23 48 311 16 409
Row
Valid N
%
2.7% 5.6% 11.7% 76.0% 3.9% 100.0%
Missing 3
Source: Primary Data
The above Table 4.28 indicates that 86.1% of the respondents agree that they
know where to approach in the organization if they have any complaint whereas
1.5% of the respondents strongly disagree with the statement. 76% agree that
their grievances are enquired and resolved while 2.7% respondents strongly
disagree with the statement.

128
Table:4.29
Views of respondents about Policy Measures of Organisation
Strongly
Disagree
Disagree Undecided Agree Strongly
Agree
Total
Organisation
takes initiatives
to manage work
life balance of
employees
Count 18 53 85 242 10 408
Row
Valid N
%
4.4% 13.0% 20.8% 59.3% 2.5% 100.0%
Missing 4
Organisation is
keen to
implement
maximum
welfare measures
to employees
Count 12 44 166 173 9 404
Row
Valid N
%
3.0% 10.9% 41.1% 42.8% 2.2% 100.0%
Missing
8
Organisation
conducts
periodical health
camps for
employees
Count 20 262 47 68 9 406
Row
Valid N
%
4.9% 64.5% 11.6% 16.7% 2.2% 100.0%
Missing 6
Organisation
makes special
arrangement of
medical care to
employees in
times of
emergency
Count 11 51 20 310 12 404
Row
Valid N
%
2.7% 12.6% 5.0% 76.7% 3.0% 100.0%
Missing
8
Organisation
occasionally
conducts
recreational
camps and
picnics for
maintaining work
life balance
Count 28 272 29 68 9 406
Row
Valid N
%
6.9% 67.0% 7.1% 16.7% 2.2% 100.0%
Missing
6
Source: Primary Data
The above Table 4.29 shows the views of respondents about Policy Measures.
59.3% of respondents agreed that organization takes initiatives to manage work
life balance of employees while 4.4 percent strongly disagreed with the statement.
42.8 % of the respondents agreed that organization is keen to implement
maximum welfare measures to employees. 3% of the respondents strongly
disagreed with the statement. Only 16.7% of the respondents agreed that

129
organization conducts periodic health camps for employees. While a sizeable
64.5% of the respondents disagreed.76.7% of the respondents agreed that
organization makes special arrangement of medical care to employees in times of
emergency, 2.7% strongly disagreed with the statement. Only 16.7 % of the
respondents agreed that organization occasionally conducts recreational camps
and picnics for maintaining work life balance, while a significant 67% disagreed
with the statement.
Table:4.30
Views of respondents on Outcome and result of Work Life Balance
Strongly
Disagree
Disagree Undecided Agree Strongly
Agree
Total
The work
schedule of my
organisation
enables all
employees to
maintain an
effective work
life balance
Count 18 53 70 260 9 410
Row
Valid N
%
4.4% 12.9% 17.1% 63.4% 2.2% 100.0%
Missing
2
The productive
working of my
organisation is
high due to
effective work
life balance
Count 15 51 73 261 8 408
Row
Valid N
%
3.7% 12.5% 17.9% 64.0% 2.0% 100.0%
Missing
4
The retention of
employees in the
organisation is
high due to
effective work
life balance
Count 12 50 71 267 7 407
Row
Valid N
%
2.9% 12.3% 17.4% 65.6% 1.7% 100.0%
Missing
5
My job requires
that I keep
learning new
things
Count 6 6 16 348 33 409
Row
Valid N
%
1.5% 1.5% 3.9% 85.1% 8.1% 100.0%
Missing 3
My job requires
that I work very
fast
Count 1 10 18 336 38 403
Row
Valid N
%
0.2% 2.5% 4.5% 83.4% 9.4% 100.0%
Missing 9
Count 4 5 14 358 27 408

130
On my job, I
know exactly
what is expected
of me
Row
Valid N
%
1.0% 1.2% 3.4% 87.7% 6.6% 100.0%
Missing 4
My job gives me
scope to use my
skills and
abilities
Count 3 16 23 343 25 410
Row
Valid N
%
0.7% 3.9% 5.6% 83.7% 6.1% 100.0%
Missing 2
At the place
where I work I
am treated with
respect
Count 0 9 18 354 27 408
Row
Valid N
%
0.0% 2.2% 4.4% 86.8% 6.6% 100.0%
Missing 4
In my
organisation, I
work as part of
team and not
mostly on my
own
Count 1 8 9 355 36 409
Row
Valid N
%
0.2% 2.0% 2.2% 86.8% 8.8% 100.0%
Missing
3
I am given
enough freedom
to decide how to
do my own work
Count 5 18 23 338 25 409
Row
Valid N
%
1.2% 4.4% 5.6% 82.6% 6.1% 100.0%
Missing 3
Source: Primary Data
The above Table 4.30 shows that 63.4% of respondents agreed that work schedule
of their organization enables all employees to maintain an effective work life
balance. While 4.4% of employees strongly disagreed with the statement. The
productive working of their organization is high due to effective work life balance
is agreed by 64% of the respondents. While 3.7% strongly disagreed with the
statement. 65.6% of respondents agree that the retention of employees in the
organization is high due to effective work life balance. 2.9% of the respondents
strongly disagreed with the statement. 85.1% of the respondents agreed that their
job required that they kept learning new things. Only 1.5% of the respondents
strongly disagreed with the statement. 83.4% of the respondents agreed that their
job required that they worked very fast. While only 2% strongly disagreed with
the statement.
87.7% of respondents agreed that on their job they know exactly what was
expected of them. Only 1% of respondents strongly disagreed with the statement.

131
83.7% agreed that their job gives enough scope for them to use their skills and
abilities. Only 0.7% strongly disagreed with the statement. 86.8% of the
respondents agreed that at the place where they work, they are treated with
respect. Only 2.2% of the respondents disagreed. 86.8 % of the respondents
agreed that in their organization they work as part of team and not mostly on their
own. 0.2 % of the respondents strongly disagreed with the statement. 82.6% of
respondents agreed that they are given enough freedom to decide how to do their
own work. But 1.2% strongly disagreed.
Table:4.31
Views of respondents on Quality of Work Life and Work Life Balance
Strongly
Disagre
e
Disagre
e
Undecide
d
Agree Strongl
y Agree
Total
All
employees
have
developed a
sense of
belongingnes
s to the
organisation
Count 1 18 28 338 25 410
Row
Valid
N %
0.2% 4.4% 6.8% 82.4
% 6.1%
100.0
%
Missin
g
2
The
organisation
recognises
the respect
and self-
esteem for
the
organisation
Count 3 10 26 349 19 407
Row
Valid
N %
0.7% 2.5% 6.4% 85.7
% 4.7%
100.0
%
Missin
g
5
My
organisation
values job
security of
employees
which
impacts
working
positively
Count 2 17 31 340 21 411
Row
Valid
N %
0.5% 4.1% 7.5% 82.7
% 5.1%
100.0
%
Missin
g
1
Count 5 20 21 332 32 410

132
The
organisation
also
undertakes
socially
beneficial
projects as its
commitment
to society
Row
Valid
N %
1.2% 4.9% 5.1% 81.0
% 7.8%
100.0
%
Missin
g
2
Source: Primary Data
82.4% of respondents agreed that all employees have developed a sense of
belonging to the organization, 0.2 % of respondents strongly disagreed. 85.7%
agreed that the organization recognizes the respect and self-esteem for the
organization. While 0.7% strongly disagreed with the statement. 82.7% of the
respondents agreed that the organization values job security of employees which
impacts working positively, while 0.5% of respondents strongly disagreed with
the statement. 81% of the respondents agreed that the organization also
undertakes socially beneficial projects as its commitment to society. 1.2% of
respondents strongly disagreed with the statement.
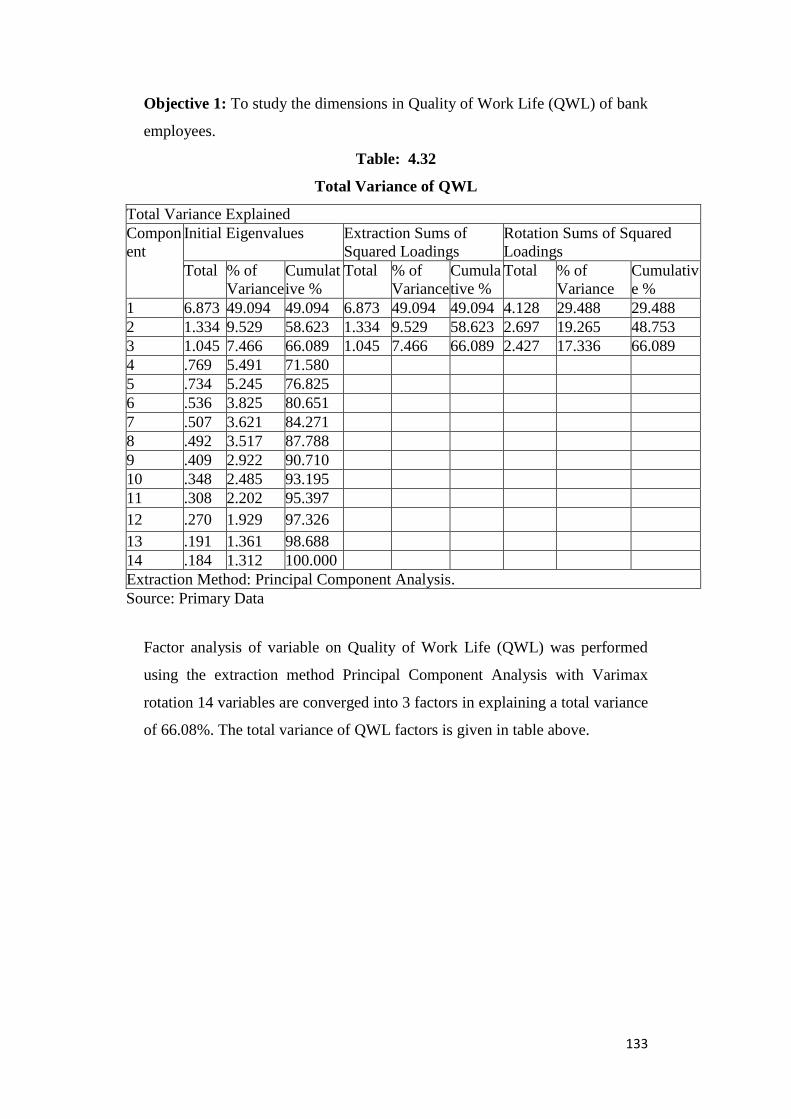
133
Objective 1: To study the dimensions in Quality of Work Life (QWL) of bank
employees.
Table: 4.32
Total Variance of QWL
Total Variance Explained
Compon
ent
Initial Eigenvalues Extraction Sums of
Squared Loadings
Rotation Sums of Squared
Loadings
Total % of
Variance
Cumulat
ive %
Total % of
Variance
Cumula
tive %
Total % of
Variance
Cumulativ
e %
1 6.873 49.094 49.094 6.873 49.094 49.094 4.128 29.488 29.488
2 1.334 9.529 58.623 1.334 9.529 58.623 2.697 19.265 48.753
3 1.045 7.466 66.089 1.045 7.466 66.089 2.427 17.336 66.089
4 .769 5.491 71.580
5 .734 5.245 76.825
6 .536 3.825 80.651
7 .507 3.621 84.271
8 .492 3.517 87.788
9 .409 2.922 90.710
10 .348 2.485 93.195
11 .308 2.202 95.397
12 .270 1.929 97.326
13 .191 1.361 98.688
14 .184 1.312 100.000
Extraction Method: Principal Component Analysis.
Source: Primary Data
Factor analysis of variable on Quality of Work Life (QWL) was performed
using the extraction method Principal Component Analysis with Varimax
rotation 14 variables are converged into 3 factors in explaining a total variance
of 66.08%. The total variance of QWL factors is given in table above.
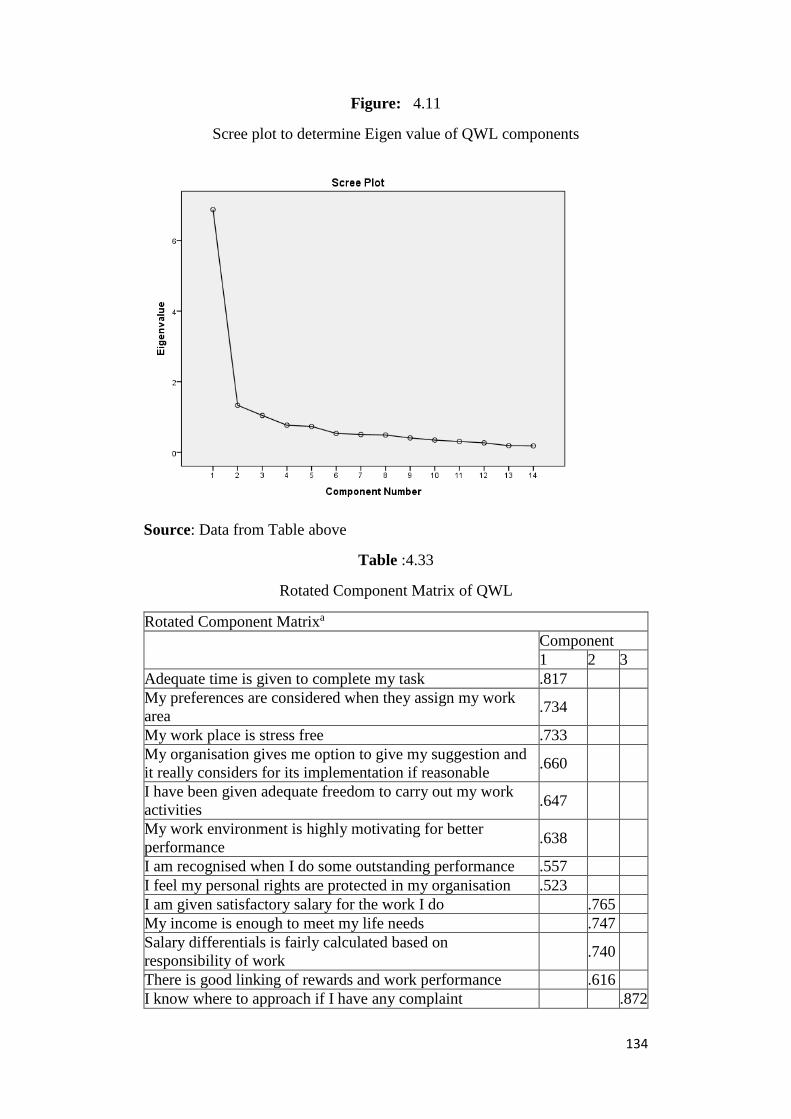
134
Figure: 4.11
Scree plot to determine Eigen value of QWL components
Source: Data from Table above
Table :4.33
Rotated Component Matrix of QWL
Rotated Component Matrixa
Component
1 2 3
Adequate time is given to complete my task .817
My preferences are considered when they assign my work
area .734
My work place is stress free .733
My organisation gives me option to give my suggestion and
it really considers for its implementation if reasonable .660
I have been given adequate freedom to carry out my work
activities .647
My work environment is highly motivating for better
performance .638
I am recognised when I do some outstanding performance .557
I feel my personal rights are protected in my organisation .523
I am given satisfactory salary for the work I do .765
My income is enough to meet my life needs .747
Salary differentials is fairly calculated based on
responsibility of work .740
There is good linking of rewards and work performance .616
I know where to approach if I have any complaint .872

135
My grievances are fairly enquired and resolved .739
Extraction Method: Principal Component Analysis.
Rotation Method: Varimax with Kaiser Normalization.
a. Rotation converged in 7 iterations. Source: Primary Data
The three factors representing Quality of Work Life (QWL) are
1. Freedom and Recognition factor comprising of 8 variables
2. Rewards factor comprising of 4 variables.
3. Grievance Redressal factor comprising of 2 variables.
The Related Component Matrix of QWL factor is given in table above.
Objective 2: To study the dimensions in Work Life Balance(WLB) of bank
employees
Table :4.34
Total variance of WLB
Total Variance Explained
Compone
nt
Initial Eigenvalues Extraction Sums of
Squared Loadings
Rotation Sums of
Squared Loadings
Tota
l
% of
Varian
ce
Cumulati
ve %
Tota
l
% of
Varian
ce
Cumulati
ve %
Tota
l
% of
Varian
ce
Cumulati
ve %
1 4.48
4 44.838 44.838
4.48
4 44.838 44.838
3.16
1 31.614 31.614
2 1.70
6 17.057 61.895
1.70
6 17.057 61.895
3.02
8 30.281 61.895
3 .952 9.516 71.412
4 .827 8.271 79.683
5 .528 5.276 84.958
6 .459 4.590 89.549
7 .386 3.862 93.411
8 .319 3.194 96.605
9 .213 2.133 98.738
10 .126 1.262 100.000
Extraction Method: Principal Component Analysis. Source: Primary Data
Factor analysis of variable on Work Life Balance(WLB) was performed using
the extraction method Principal Component Analysis with varimax rotation 10
variables are converged into 2 factors in explaining a total variance of 61.89%.
The total variance of WLB factors is given in above table.

136
Figure: 4.12
Scree Plot to determine Eigen values of WLB components
Table: 4.35
Rotated Component Matrix of WLB
Source: Primary Data
Rotated Component Matrixa Component
1 2
The productive working of my organisation is high due to
effective Work Life Balance .924
The work schedule of my organisation enables all employees to
maintain an effective Work Life Balance .918
The retention of employees in the organisation is high due to
effective Work Life Balance .882
In my organisation, I work as part of team and not mostly on
my own .727
My job requires that I keep learning new things .704
On my job, I know exactly what is expected of me .680
My job gives me scope to use my skills and abilities .667
At the place where I work I am treated with respect .660
My job requires that I work very fast .570
I am given enough freedom to decide how to do my own work .531
Extraction Method: Principal Component Analysis.
Rotation Method: Varimax with Kaiser Normalization.
a. Rotation converged in 3 iterations.
Source: Data from Table above

137
The 2 factors representing Work Life Balance (WLB) are:
1. Productivity factor comprising of 3 variables. 2. Skill Development
and Efficiency factor comprising of 7 variables.
The Rotated Component Matrix of WLB factor is given in above table.

138
Objective 3: To study the dimension in Policy Measures (PM) of bank.
Table: 4.36
Total variance of PM
Total Variance Explained
Compone
nt
Initial Eigenvalues Extraction Sums of
Squared Loadings
Rotation Sums of
Squared Loadings
Tota
l
% of
Varian
ce
Cumulati
ve %
Tota
l
% of
Varian
ce
Cumulati
ve %
Tota
l
% of
Varian
ce
Cumulati
ve %
1 2.38
2 47.640 47.640
2.38
2 47.640 47.640
1.74
5 34.897 34.897
2 1.08
7 21.750 69.390
1.08
7 21.750 69.390
1.72
5 34.493 69.390
3 .675 13.503 82.893
4 .485 9.708 92.601
5 .370 7.399 100.000
Extraction Method: Principal Component Analysis. Source: Primary Data
Factor analysis of variable on Policy Measures (PM) was performed using
extraction method - Principal Component Analysis with Varimax rotation. 5
variables are converged into 2 factors explaining a total variance of 69.39%.
The total variance of PM factor is given in the above table.
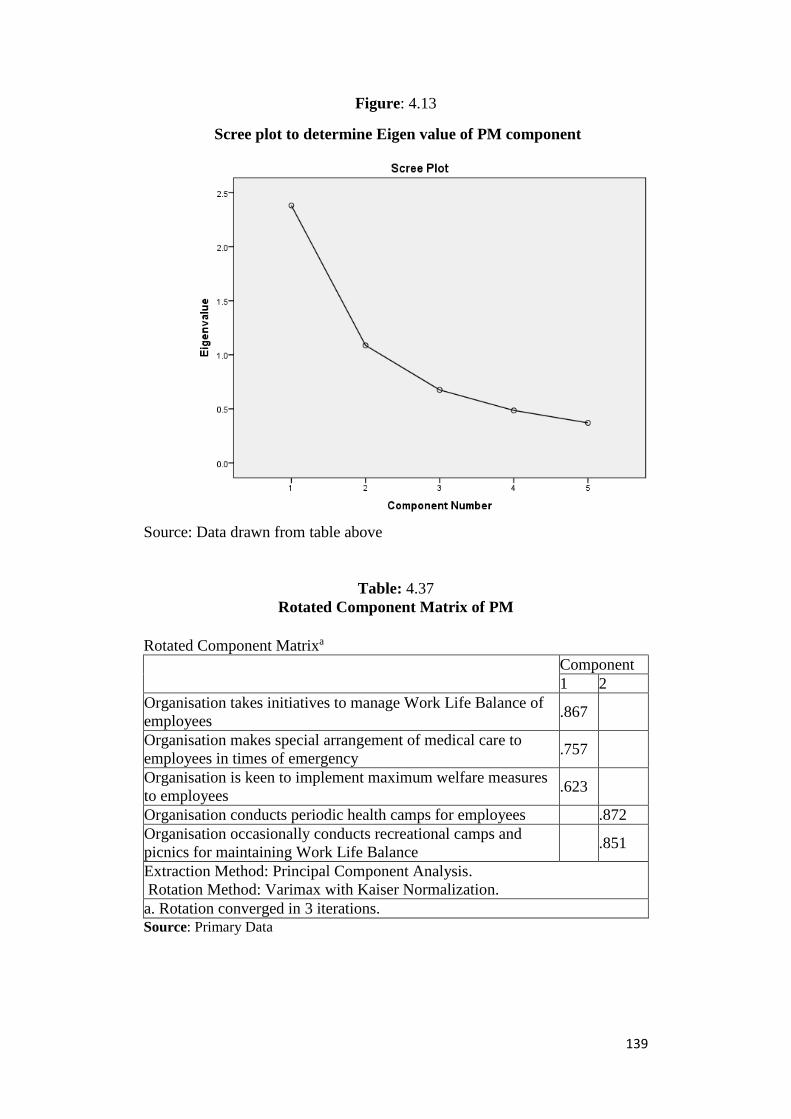
139
Figure: 4.13
Scree plot to determine Eigen value of PM component
Source: Data drawn from table above
Table: 4.37
Rotated Component Matrix of PM
Source: Primary Data
Rotated Component Matrixa
Component
1 2
Organisation takes initiatives to manage Work Life Balance of
employees .867
Organisation makes special arrangement of medical care to
employees in times of emergency .757
Organisation is keen to implement maximum welfare measures
to employees .623
Organisation conducts periodic health camps for employees .872
Organisation occasionally conducts recreational camps and
picnics for maintaining Work Life Balance .851
Extraction Method: Principal Component Analysis.
Rotation Method: Varimax with Kaiser Normalization.
a. Rotation converged in 3 iterations.
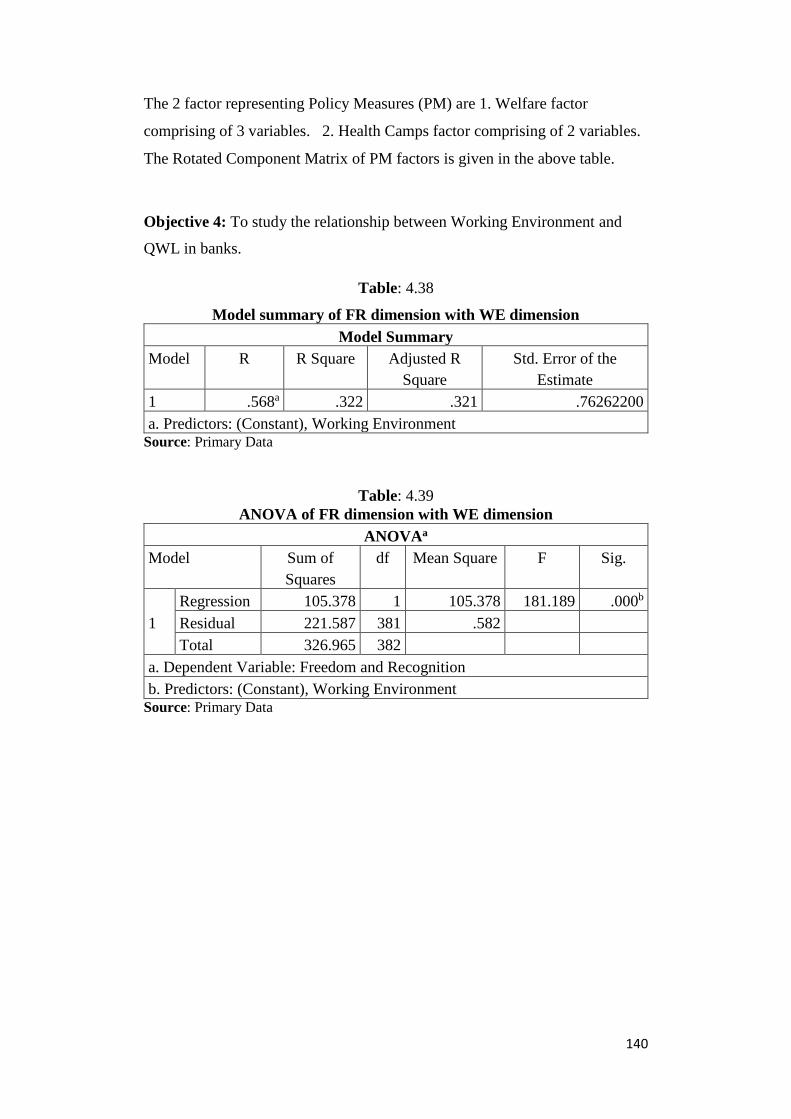
140
The 2 factor representing Policy Measures (PM) are 1. Welfare factor
comprising of 3 variables. 2. Health Camps factor comprising of 2 variables.
The Rotated Component Matrix of PM factors is given in the above table.
Objective 4: To study the relationship between Working Environment and
QWL in banks.
Table: 4.38
Model summary of FR dimension with WE dimension
Model Summary
Model R R Square Adjusted R
Square
Std. Error of the
Estimate
1 .568a .322 .321 .76262200
a. Predictors: (Constant), Working Environment Source: Primary Data
Table: 4.39
ANOVA of FR dimension with WE dimension
ANOVAa
Model Sum of
Squares
df Mean Square F Sig.
1
Regression 105.378 1 105.378 181.189 .000b
Residual 221.587 381 .582
Total 326.965 382
a. Dependent Variable: Freedom and Recognition
b. Predictors: (Constant), Working Environment Source: Primary Data
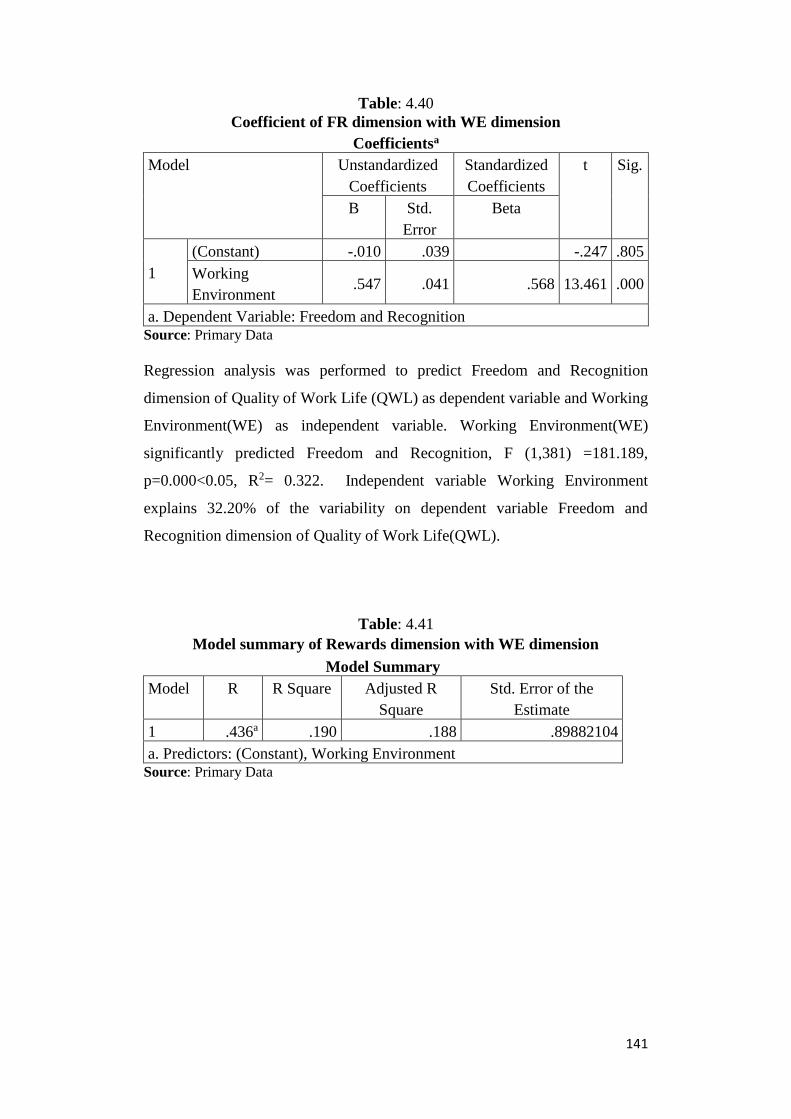
141
Table: 4.40
Coefficient of FR dimension with WE dimension
Coefficientsa
Model Unstandardized
Coefficients
Standardized
Coefficients
t Sig.
B Std.
Error
Beta
1
(Constant) -.010 .039 -.247 .805
Working
Environment .547 .041 .568 13.461 .000
a. Dependent Variable: Freedom and Recognition Source: Primary Data
Regression analysis was performed to predict Freedom and Recognition
dimension of Quality of Work Life (QWL) as dependent variable and Working
Environment(WE) as independent variable. Working Environment(WE)
significantly predicted Freedom and Recognition, F (1,381) =181.189,
p=0.000<0.05, R2= 0.322. Independent variable Working Environment
explains 32.20% of the variability on dependent variable Freedom and
Recognition dimension of Quality of Work Life(QWL).
Table: 4.41
Model summary of Rewards dimension with WE dimension
Model Summary
Model R R Square Adjusted R
Square
Std. Error of the
Estimate
1 .436a .190 .188 .89882104
a. Predictors: (Constant), Working Environment Source: Primary Data
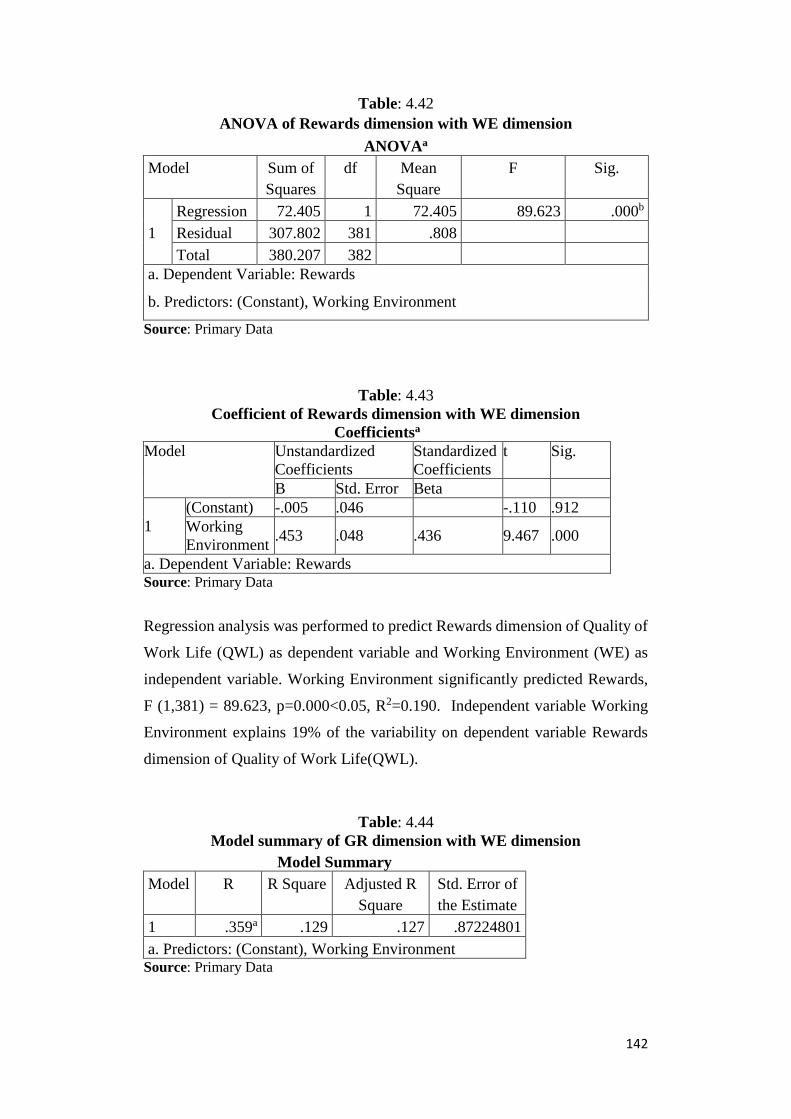
142
Table: 4.42
ANOVA of Rewards dimension with WE dimension
ANOVAa
Model Sum of
Squares
df Mean
Square
F Sig.
1
Regression 72.405 1 72.405 89.623 .000b
Residual 307.802 381 .808
Total 380.207 382
a. Dependent Variable: Rewards
b. Predictors: (Constant), Working Environment
Source: Primary Data
Table: 4.43
Coefficient of Rewards dimension with WE dimension
Coefficientsa
Model Unstandardized
Coefficients
Standardized
Coefficients
t Sig.
B Std. Error Beta
1
(Constant) -.005 .046 -.110 .912
Working
Environment .453 .048 .436 9.467 .000
a. Dependent Variable: Rewards Source: Primary Data
Regression analysis was performed to predict Rewards dimension of Quality of
Work Life (QWL) as dependent variable and Working Environment (WE) as
independent variable. Working Environment significantly predicted Rewards,
F (1,381) = 89.623, p=0.000<0.05, R2=0.190. Independent variable Working
Environment explains 19% of the variability on dependent variable Rewards
dimension of Quality of Work Life(QWL).
Table: 4.44
Model summary of GR dimension with WE dimension
Model Summary
Model R R Square Adjusted R
Square
Std. Error of
the Estimate
1 .359a .129 .127 .87224801
a. Predictors: (Constant), Working Environment Source: Primary Data

143
Table: 4.45
ANOVA of GR dimension with WE dimension
ANOVAa
Model Sum of
Squares
df Mean Square F Sig.
1
Regression 42.887 1 42.887 56.370 .000b
Residual 289.871 381 .761
Total 332.758 382
a. Dependent Variable: Grievance Redressal
b. Predictors: (Constant), Working Environment Source: Primary Data
Table: 4.46
Coefficient of GR dimension with WE dimension
Coefficientsa
Model Unstandardized
Coefficients
Standardized
Coefficients
t Sig.
B Std. Error Beta
1
(Constant) .006 .045 .132 .895
Working
Environment .349 .046 .359 7.508 .000
a. Dependent Variable: Grievance Redressal Source: Primary Data
Regressions analysis was performed to predict Grievance Redressal dimension
of Quality of Work Life (QWL) as dependent variable and Working
Environment (WE) as independent variable. Working Environment
significantly predicted Grievance Redressal, (1,381) =56.370, p=0.000<0.05,
R2=0.129. Independent variable Working Environment explains 12.90% of the
variability on dependent variable Grievance Redressal dimension of Quality of
Work Life (QWL).

144
Table: 4.47
WORKING ENVIRONMENT
Correlations
I II III IV V
Spearman's
rho
I
Correlation
Coefficient 1.000 .634** .529** .411** .433**
Sig. (2-tailed) . .000 .000 .000 .000
N 408 401 405 406 404
II
Correlation
Coefficient .634** 1.000 .476** .304** .399**
Sig. (2-tailed) .000 . .000 .000 .000
N 401 403 401 401 398
III
Correlation
Coefficient .529** .476** 1.000 .227** .427**
Sig. (2-tailed) .000 .000 . .000 .000
N 405 401 407 405 402
IV
Correlation
Coefficient .411** .304** .227** 1.000 .554**
Sig. (2-tailed) .000 .000 .000 . .000
N 406 401 405 409 405
V
Correlation
Coefficient .433** .399** .427** .554** 1.000
Sig. (2-tailed) .000 .000 .000 .000 .
N 404 398 402 405 405
**. Correlation is significant at the 0.01 level (2-tailed).
Source: Primary Data
I. Working Environment in the organisation is participative.
II. The physical working conditions in the organisations are very
conducive to work.
III. Work assigned as per qualification and skills.
IV. You are satisfied with working hours of organisation.
V. The working hours enables you to maintain balance between work
and personal life.

145
Spearman’s correlation was performed to determine the relationship between
all the components of Working Environment(WE). The component ‘Working
Environment in the organisation is participative’ and the component ‘The
physical working conditions in the organisations are very conducive to work’
has the highest correlation among all the other correlations and it also explains
a moderate positive correlation statistically significant (rs=0.634, N=401,
p=0.000<0.05). The results are displayed in correlation matrix as shown in table
above.
Table: 4.48
Descriptive statistics on component of Working Environment (WE)
Descriptive Statistics
N Mean Std.
Deviation
Minimum Maximum
Working Environment in the
organisation is participative 395 3.88 .621 1 5
The physical working conditions in
the organisations are very conducive
to work
395 3.87 .584 1 5
Work assigned as per qualification
and skills 395 3.70 .778 1 5
You are satisfied with working hours
of organisation 395 3.12 .880 1 5
The working hours enables you to
maintain balance between work and
personal life
395 3.29 .965 1 5
Source: Primary Data
Table: 4.49
Friedman Test on Ranking on components of WE
Ranks
Mean Rank
Working Environment in the organisation is participative 3.57
The physical working conditions in the organisations are very
conducive to work 3.53
Work assigned as per qualification and skills 3.34
You are satisfied with working hours of organisation 2.03
The working hours enables you to maintain balance between
work and personal life 2.53
Source: Primary Data

146
Table: 4.50
Friedman Test Result
Test Statisticsa of WE
N 395
Chi-Square 548.835
df 4
Asymp. Sig. .000
a. Friedman Test
As per the table above the Mean Rank of Working Environment (WE)
dimension shows that the component ‘Working Environment in the organisation
is participative’ has the highest Mean Rank of 3.57 whereas the component
‘You are satisfied with working hours of organisation’ has a lowest mean Rank
of 2.03 among all the 5 components of Working Environment(WE). From the
test statistics of Working Environment (WE) as shown in table above the Chi –
square χ 2 (df=4, N=395) =548.835, p=0.000<0.05 shows that, there exists
significant difference between the Mean Ranks on all the components of
Working Environment(WE).
Objective 5: To study the relationship between Policy Measures and QWL in
banks
Table: 4.51
Model summary of FR dimension with PM dimensions
Model Summary
Model R R Square Adjusted R Square Std. Error of the
Estimate
1 .482a .232 .228 .85644654
a. Predictors: (Constant), Health Camps, Welfare Source: Primary Data
Table : 4.52
ANOVA of FR dimension with PM dimensions
ANOVAa
Model Sum of
Squares
df Mean Square F Sig.
1
Regression 84.383 2 42.191 57.520 .000b
Residual 279.464 381 .734
Total 363.846 383
a. Dependent Variable: Freedom and Recognition
b. Predictors: (Constant), Health Camps, Welfare Source: Primary Data

147
Table: 4.53
Coefficient of FR dimension with PM dimensions
Coefficientsa
Model Unstandardized
Coefficients
Standardized
Coefficients
t Sig.
B Std. Error Beta
1
(Constant) -.030 .044 -.684 .495
Welfare .480 .045 .475 10.574 .000
Health
Camps .078 .044 .080 1.784 .075
a. Dependent Variable: Freedom and Recognition Source: Primary Data
Multiple regression analysis was performed to predict Freedom and
Recognition dimension of Quality of Work Life(QWL) as dependent variable
from Welfare and Health Camps as independent variables. Both Welfare and
Health Camps, the dimension of Policy Measures of bank collectively and
significantly predicted Freedom and Recognition F (2,381) =57.250,
p=0.000<0.05, R2=0.232. Coefficient table shows welfare is a significant
predictor, p=0.000<0.05, whereas Health Camps is not a significant predictor
p=0.75>0.05. Independent variables, welfare and Health Camps explains
23.20% of the variability on dependent variable Freedom and Recognition
dimension of Quality of Work Life(QWL).
Table: 4.54
Model summary of Rewards dimension with PM dimensions
Model Summary
Model R R Square Adjusted R Square Std. Error of the
Estimate
1 .493a .243 .239 .86173828
a. Predictors: (Constant), Health Camps, Welfare Source: Primary Data
Table: 4.55
ANOVA of Rewards dimension with PM dimensions
ANOVAa
Model Sum of
Squares
df Mean Square F Sig.
1
Regression 90.714 2 45.357 61.079 .000b
Residual 282.928 381 .743
Total 373.642 383
a. Dependent Variable: Rewards
b. Predictors: (Constant), Health Camps, Welfare Source: Primary Data

148
Table: 4.56
Coefficients of Reward dimension with PM dimensions
Coefficientsa
Model Unstandardized
Coefficients
Standardized
Coefficients
t Sig.
B Std. Error Beta
1
(Constant) -.012 .044 -.267 .789
Welfare .495 .046 .483 10.845 .000
Health
Camps -.095 .044 -.096 -2.143 .033
a. Dependent Variable: Rewards Source: Primary Data
Multiple regression analysis was performed to predict Rewards dimension of
Quality of Work Life (QWL)as dependent variable from Welfare and Health
Camps. Both Welfare and Health Camps, the dimension of Policy Measures
(PM) of bank collectively and significantly predicted rewards, F (2,381)
=61.079, p=0.000<0.05, R2=0.243. Independent variable welfare and Health
Camps explains 24.30% of the variability on dependent variable Rewards
dimension of Quality of Work Life(QWL).
Table :4.57
Model summary of variable GR dimension with PM dimensions
Model Summary
Model R R Square Adjusted R Square Std. Error of the
Estimate
1 .368a .136 .131 .89642884
a. Predictors: (Constant), Health Camps, Welfare Source: Primary Data
Table: 4.58
ANOVA of GR dimension with PM dimensions
ANOVAa
Model Sum of
Squares
df Mean Square F Sig.
1
Regression 47.997 2 23.998 29.864 .000b
Residual 306.166 381 .804
Total 354.163 383
a. Dependent Variable: Grievance Redressal
b. Predictors: (Constant), Health Camps, Welfare Source: Primary Data
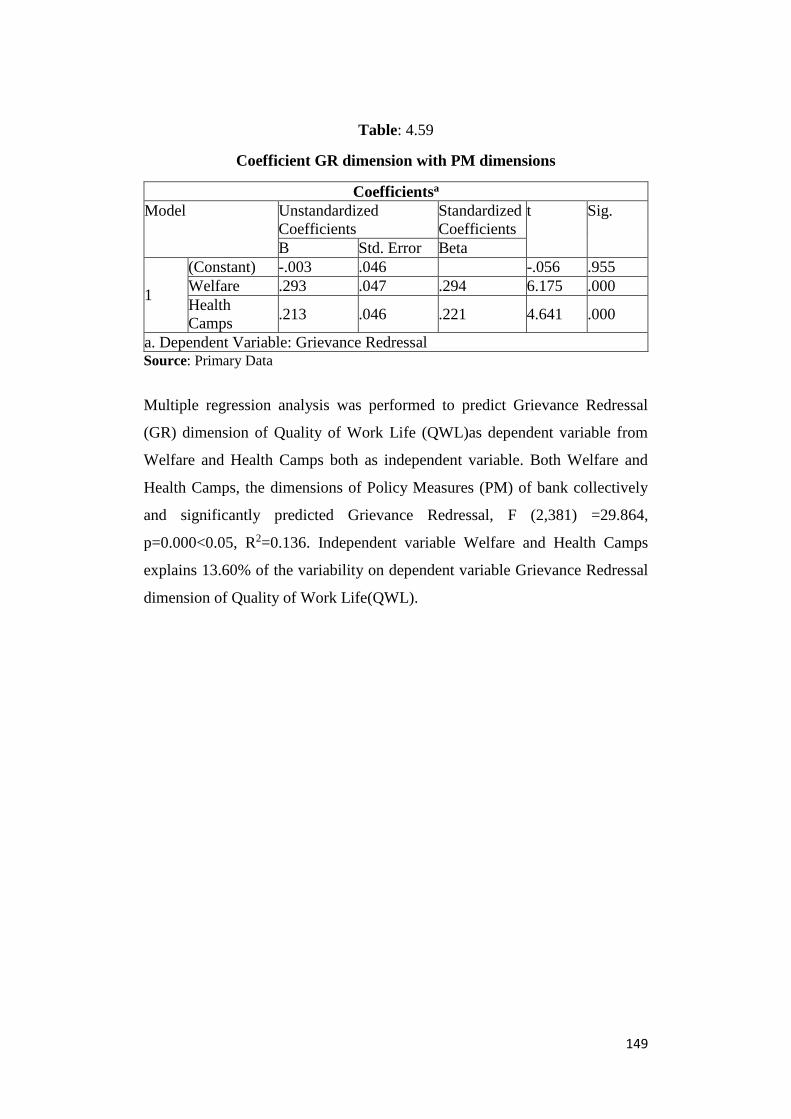
149
Table: 4.59
Coefficient GR dimension with PM dimensions
Coefficientsa
Model Unstandardized
Coefficients
Standardized
Coefficients
t Sig.
B Std. Error Beta
1
(Constant) -.003 .046 -.056 .955
Welfare .293 .047 .294 6.175 .000
Health
Camps .213 .046 .221 4.641 .000
a. Dependent Variable: Grievance Redressal Source: Primary Data
Multiple regression analysis was performed to predict Grievance Redressal
(GR) dimension of Quality of Work Life (QWL)as dependent variable from
Welfare and Health Camps both as independent variable. Both Welfare and
Health Camps, the dimensions of Policy Measures (PM) of bank collectively
and significantly predicted Grievance Redressal, F (2,381) =29.864,
p=0.000<0.05, R2=0.136. Independent variable Welfare and Health Camps
explains 13.60% of the variability on dependent variable Grievance Redressal
dimension of Quality of Work Life(QWL).
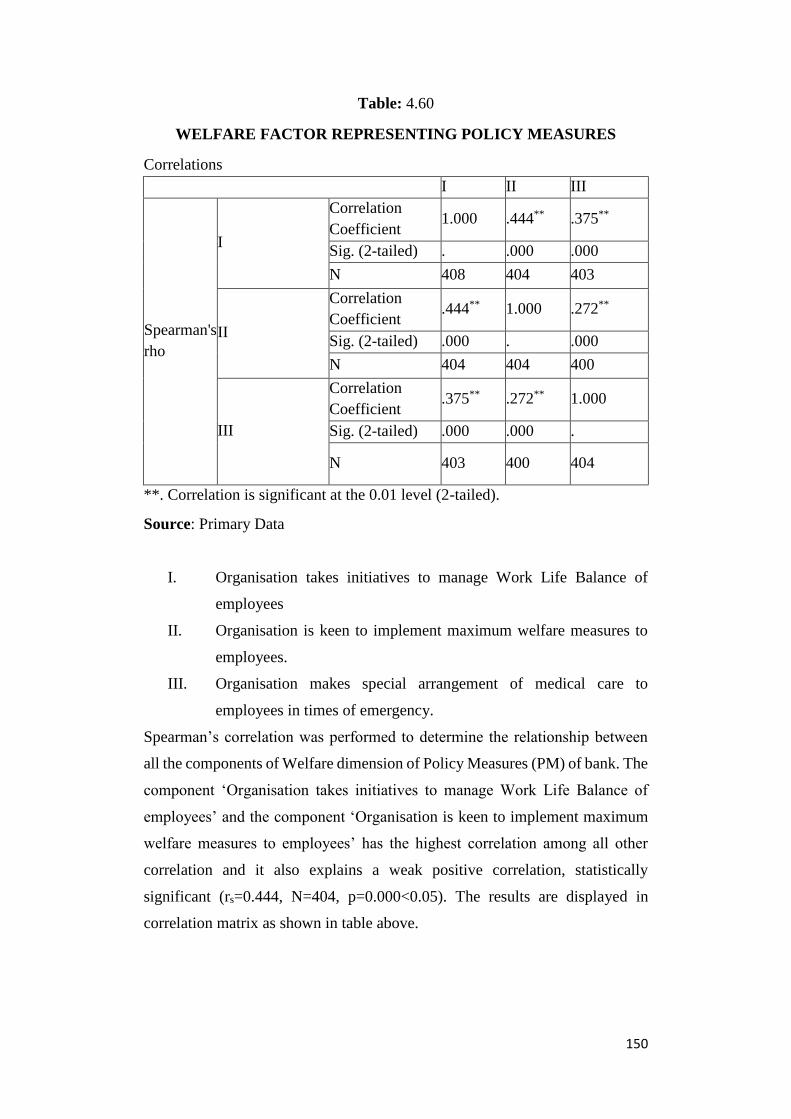
150
Table: 4.60
WELFARE FACTOR REPRESENTING POLICY MEASURES
Correlations
I II III
Spearman's
rho
I
Correlation
Coefficient 1.000 .444** .375**
Sig. (2-tailed) . .000 .000
N 408 404 403
II
Correlation
Coefficient .444** 1.000 .272**
Sig. (2-tailed) .000 . .000
N 404 404 400
III
Correlation
Coefficient .375** .272** 1.000
Sig. (2-tailed) .000 .000 .
N 403 400 404
**. Correlation is significant at the 0.01 level (2-tailed).
Source: Primary Data
I. Organisation takes initiatives to manage Work Life Balance of
employees
II. Organisation is keen to implement maximum welfare measures to
employees.
III. Organisation makes special arrangement of medical care to
employees in times of emergency.
Spearman’s correlation was performed to determine the relationship between
all the components of Welfare dimension of Policy Measures (PM) of bank. The
component ‘Organisation takes initiatives to manage Work Life Balance of
employees’ and the component ‘Organisation is keen to implement maximum
welfare measures to employees’ has the highest correlation among all other
correlation and it also explains a weak positive correlation, statistically
significant (rs=0.444, N=404, p=0.000<0.05). The results are displayed in
correlation matrix as shown in table above.

151
Table: 4.61
HEALTH CAMPS FACTOR REPRESENTING POLICY MEASURES
Correlations
I II
Spearman's
rho
I
Correlation
Coefficient 1.000 .540**
Sig. (2-tailed) . .000
N 406 403
II
Correlation
Coefficient .540** 1.000
Sig. (2-tailed) .000 .
N 403 406
**. Correlation is significant at the 0.01 level (2-tailed).
Source: Primary Data
I. Organisation conducts periodic Health Camps for employees.
II. Organisation occasionally conducts recreational camps and picnics
for maintaining Work Life Balance.
Spearman’s correlation was performed to determine the relationship between
all the components of Health Camps dimension of Policy Measures(PM) of
bank. The component ‘Organisation conducts periodic Health Camps for
employees’ and the component ‘Organisation occasionally conducts
recreational camps and picnics for maintaining Work Life Balance’ explains a
moderate positive correlation, statistically significant. (rs=0.540, N=403,
p=0.000<0.05). The results are displayed in correlation matrix as shown in table
above.
Objective 6: To study the impact of QWL on the Work Life Balance of bank
employees
Table: 4.62
Model summary of Productivity dimension with QWL dimensions
Model Summary
Model R R Square Adjusted R Square Std. Error of the
Estimate
1 .752a .566 .562 .65187823
a. Predictors: (Constant), Grievance Redressal, Rewards, Freedom and
Recognition Source: Primary Data
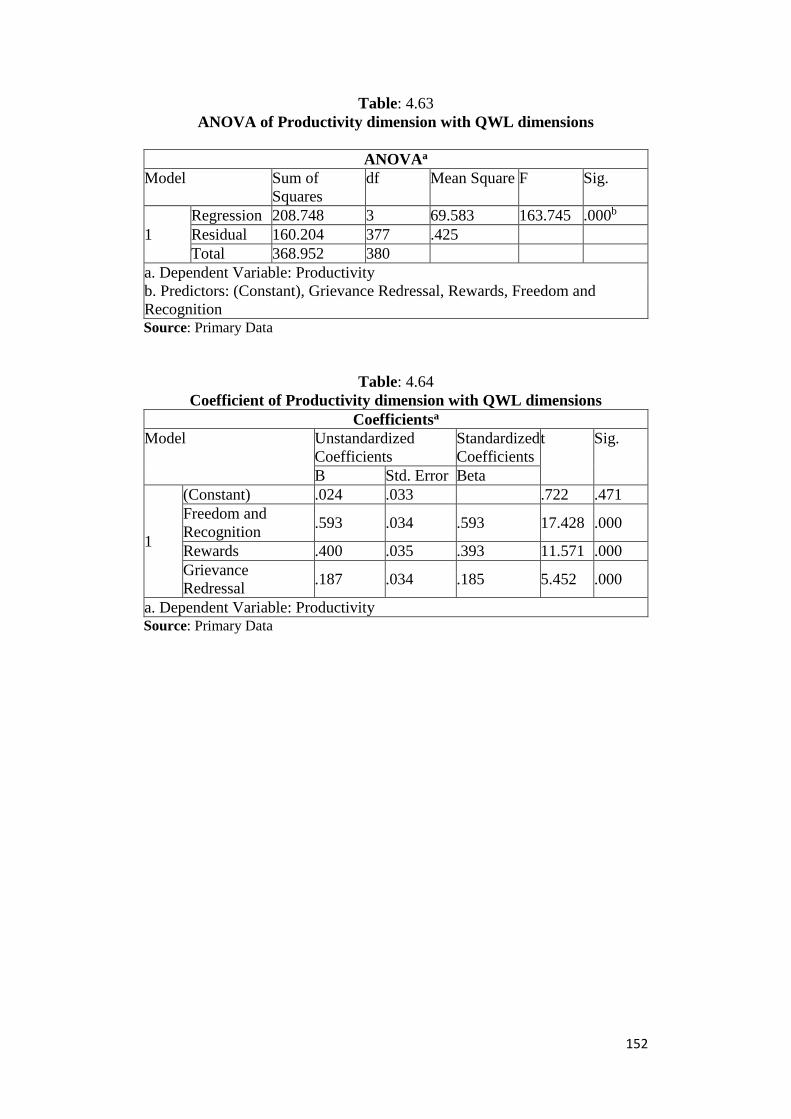
152
Table: 4.63
ANOVA of Productivity dimension with QWL dimensions
ANOVAa
Model Sum of
Squares
df Mean Square F Sig.
1
Regression 208.748 3 69.583 163.745 .000b
Residual 160.204 377 .425
Total 368.952 380
a. Dependent Variable: Productivity
b. Predictors: (Constant), Grievance Redressal, Rewards, Freedom and
Recognition Source: Primary Data
Table: 4.64
Coefficient of Productivity dimension with QWL dimensions
Coefficientsa
Model Unstandardized
Coefficients
Standardized
Coefficients
t Sig.
B Std. Error Beta
1
(Constant) .024 .033 .722 .471
Freedom and
Recognition .593 .034 .593 17.428 .000
Rewards .400 .035 .393 11.571 .000
Grievance
Redressal .187 .034 .185 5.452 .000
a. Dependent Variable: Productivity Source: Primary Data
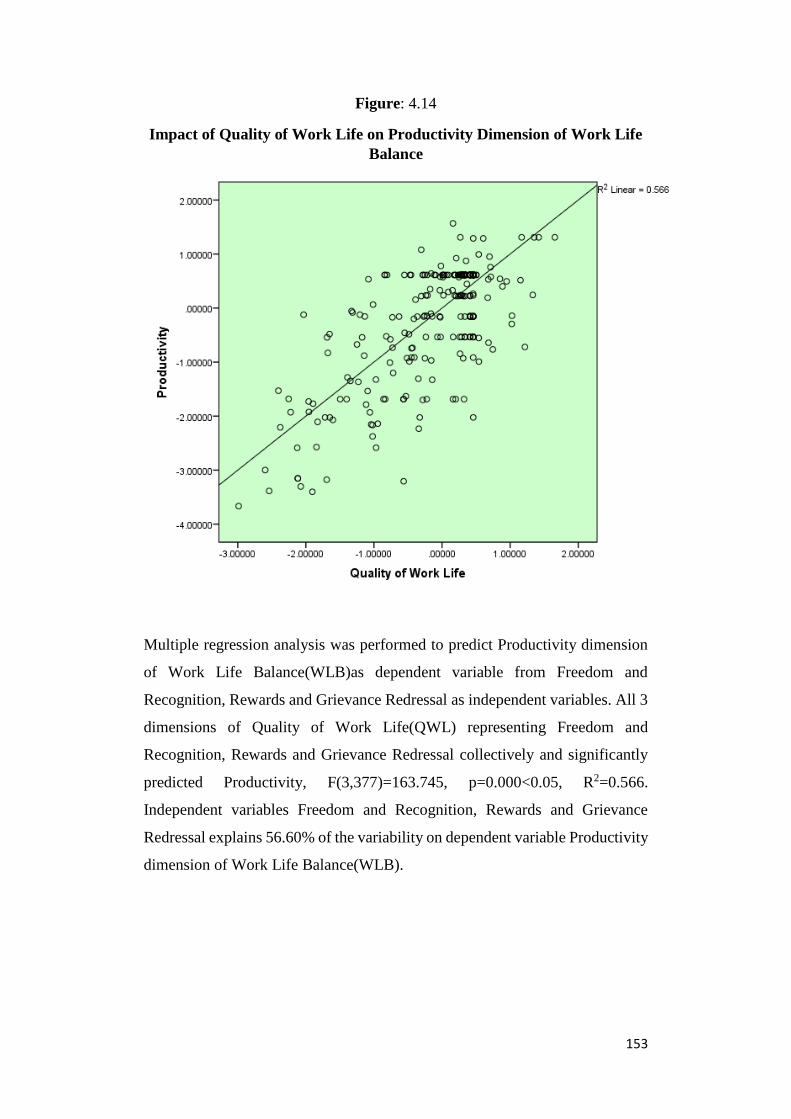
153
Figure: 4.14
Impact of Quality of Work Life on Productivity Dimension of Work Life
Balance
Multiple regression analysis was performed to predict Productivity dimension
of Work Life Balance(WLB)as dependent variable from Freedom and
Recognition, Rewards and Grievance Redressal as independent variables. All 3
dimensions of Quality of Work Life(QWL) representing Freedom and
Recognition, Rewards and Grievance Redressal collectively and significantly
predicted Productivity, F(3,377)=163.745, p=0.000<0.05, R2=0.566.
Independent variables Freedom and Recognition, Rewards and Grievance
Redressal explains 56.60% of the variability on dependent variable Productivity
dimension of Work Life Balance(WLB).
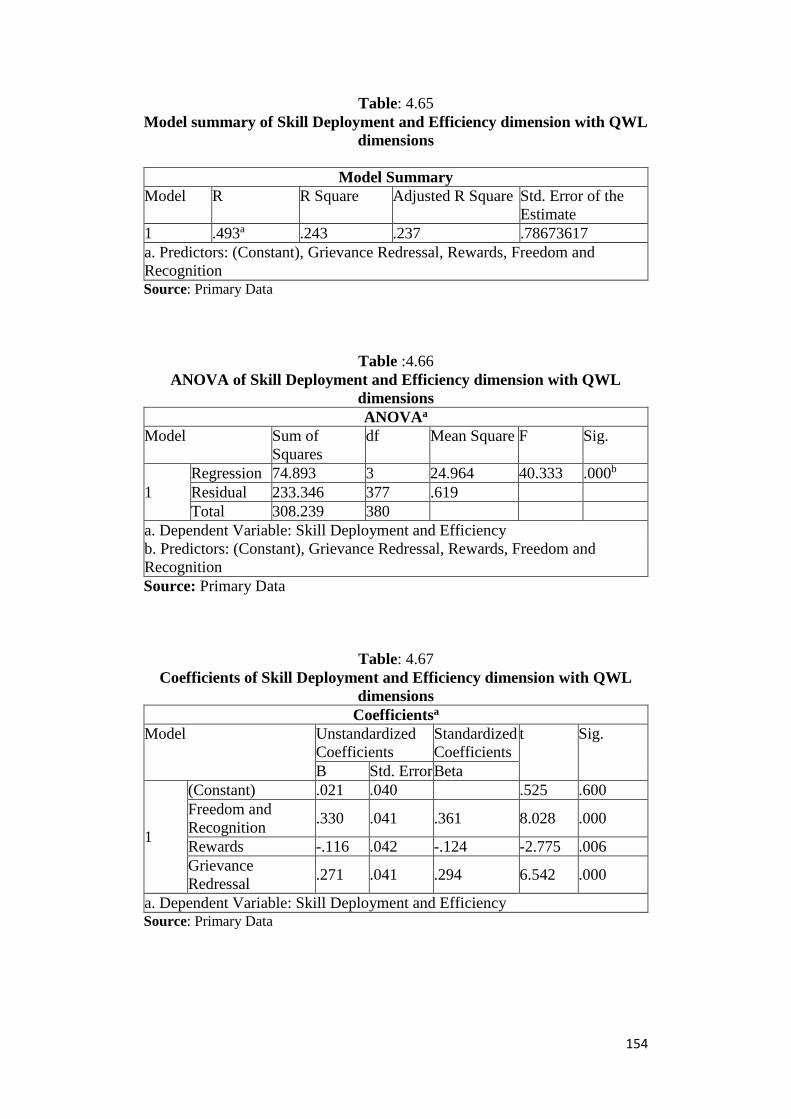
154
Table: 4.65
Model summary of Skill Deployment and Efficiency dimension with QWL
dimensions
Model Summary
Model R R Square Adjusted R Square Std. Error of the
Estimate
1 .493a .243 .237 .78673617
a. Predictors: (Constant), Grievance Redressal, Rewards, Freedom and
Recognition Source: Primary Data
Table :4.66
ANOVA of Skill Deployment and Efficiency dimension with QWL
dimensions
ANOVAa
Model Sum of
Squares
df Mean Square F Sig.
1
Regression 74.893 3 24.964 40.333 .000b
Residual 233.346 377 .619
Total 308.239 380
a. Dependent Variable: Skill Deployment and Efficiency
b. Predictors: (Constant), Grievance Redressal, Rewards, Freedom and
Recognition
Source: Primary Data
Table: 4.67
Coefficients of Skill Deployment and Efficiency dimension with QWL
dimensions
Coefficientsa
Model Unstandardized
Coefficients
Standardized
Coefficients
t Sig.
B Std. Error Beta
1
(Constant) .021 .040 .525 .600
Freedom and
Recognition .330 .041 .361 8.028 .000
Rewards -.116 .042 -.124 -2.775 .006
Grievance
Redressal .271 .041 .294 6.542 .000
a. Dependent Variable: Skill Deployment and Efficiency Source: Primary Data

155
Figure: 4.15
Impact of Quality of Work Life on Skill Deployment and Efficiency
dimension of Work Life Balance
Source: Primary Data
Multiple regression analysis was performed to predict Skill Deployment and
Efficiency(SDE) dimension of Work Life Balance(WLB) as dependent variable
from Freedom and Recognition, Rewards and Grievance Redressal as
independent variables. All 3 dimension of Quality of Work Life(QWL)
representing Freedom and Recognition, Rewards and Grievance Redressal
collectively and significantly predicted Skill Deployment and Efficiency,
F(3,377)=40.333, p=0.000<0.05, R2=0.243. Independent variables Freedom
and Recognition, Rewards and Grievance Redressal explains 24.30% of the
variability on dependent variables Skill Deployment and Efficiency dimension
of Work Life Balance(WLB).

156
Table: 4.68
Freedom and Recognition Factor representing Quality of Work Life
Correlations
I II III IV V VI VII VIII
Spearman's
rho
I
Correlation
Coefficient 1.000 .668** .566** .566** .620** .482** .496** .540**
Sig. (2-
tailed) . .000 .000 .000 .000 .000 .000 .000
N 410 410 409 406 410 409 407 408
II
Correlation
Coefficient .668** 1.000 .481** .462** .567** .444** .393** .438**
Sig. (2-
tailed) .000 . .000 .000 .000 .000 .000 .000
N 410 411 410 407 411 409 407 409
III
Correlation
Coefficient .566** .481** 1.000 .753** .352** .479** .414** .502**
Sig. (2-
tailed) .000 .000 . .000 .000 .000 .000 .000
N 409 410 410 407 410 408 406 408
IV
Correlation
Coefficient .566** .462** .753** 1.000 .387** .525** .456** .512**
Sig. (2-
tailed) .000 .000 .000 . .000 .000 .000 .000
N 406 407 407 407 407 405 403 407
V
Correlation
Coefficient .620** .567** .352** .387** 1.000 .509** .418** .474**
Sig. (2-
tailed) .000 .000 .000 .000 . .000 .000 .000
N 410 411 410 407 411 409 407 409
VI
Correlation
Coefficient .482** .444** .479** .525** .509** 1.000 .523** .544**
Sig. (2-
tailed) .000 .000 .000 .000 .000 . .000 .000
N 409 409 408 405 409 409 407 407
VII
Correlation
Coefficient .496** .393** .414** .456** .418** .523** 1.000 .459**
Sig. (2-
tailed) .000 .000 .000 .000 .000 .000 . .000
N 407 407 406 403 407 407 407 405
VIII
Correlation
Coefficient .540** .438** .502** .512** .474** .544** .459** 1.000
Sig. (2-
tailed) .000 .000 .000 .000 .000 .000 .000 .
N 408 409 408 407 409 407 405 409
**. Correlation is significant at the 0.01 level (2-tailed).
I. My work environment is highly motivating for better performance

157
II. I feel my personal rights are protected in my organisation
III. My work place is stress free
IV. Adequate time is given to complete my task
V. I am recognised when I do some outstanding performance
VI. I have been given adequate freedom to carry out my work activities
VII. My preferences are considered when they assign my work area
VIII. My organisation gives me option to give my suggestion and it really
considers for its implementation if reasonable
Spearman’s correlation was performed to determine the relationship between
all the components of Freedom and Recognition dimension of Quality of Work
Life. The component ‘My work place is stress free’ and the component
‘Adequate time is given to complete my task’ has the highest correlation among
all the other correlations and it also explains a strong positive correlation
statistically significant. (rs=0.753, N=407, p=0.000<0.05). The results are
displayed in correlation matrix as shown in table above.
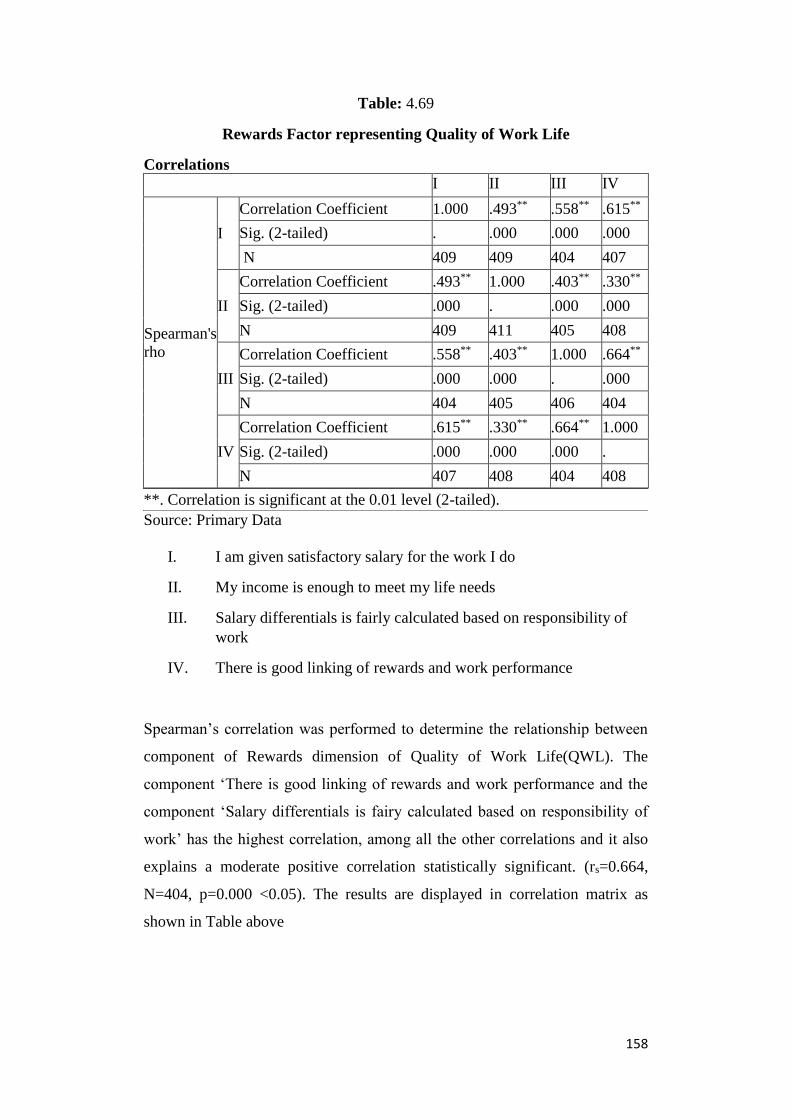
158
Table: 4.69
Rewards Factor representing Quality of Work Life
Correlations
I II III IV
Spearman's
rho
I
Correlation Coefficient 1.000 .493** .558** .615**
Sig. (2-tailed) . .000 .000 .000
N 409 409 404 407
II
Correlation Coefficient .493** 1.000 .403** .330**
Sig. (2-tailed) .000 . .000 .000
N 409 411 405 408
III
Correlation Coefficient .558** .403** 1.000 .664**
Sig. (2-tailed) .000 .000 . .000
N 404 405 406 404
IV
Correlation Coefficient .615** .330** .664** 1.000
Sig. (2-tailed) .000 .000 .000 .
N 407 408 404 408
**. Correlation is significant at the 0.01 level (2-tailed).
Source: Primary Data
I. I am given satisfactory salary for the work I do
II. My income is enough to meet my life needs
III. Salary differentials is fairly calculated based on responsibility of
work
IV. There is good linking of rewards and work performance
Spearman’s correlation was performed to determine the relationship between
component of Rewards dimension of Quality of Work Life(QWL). The
component ‘There is good linking of rewards and work performance and the
component ‘Salary differentials is fairy calculated based on responsibility of
work’ has the highest correlation, among all the other correlations and it also
explains a moderate positive correlation statistically significant. (rs=0.664,
N=404, p=0.000 <0.05). The results are displayed in correlation matrix as
shown in Table above
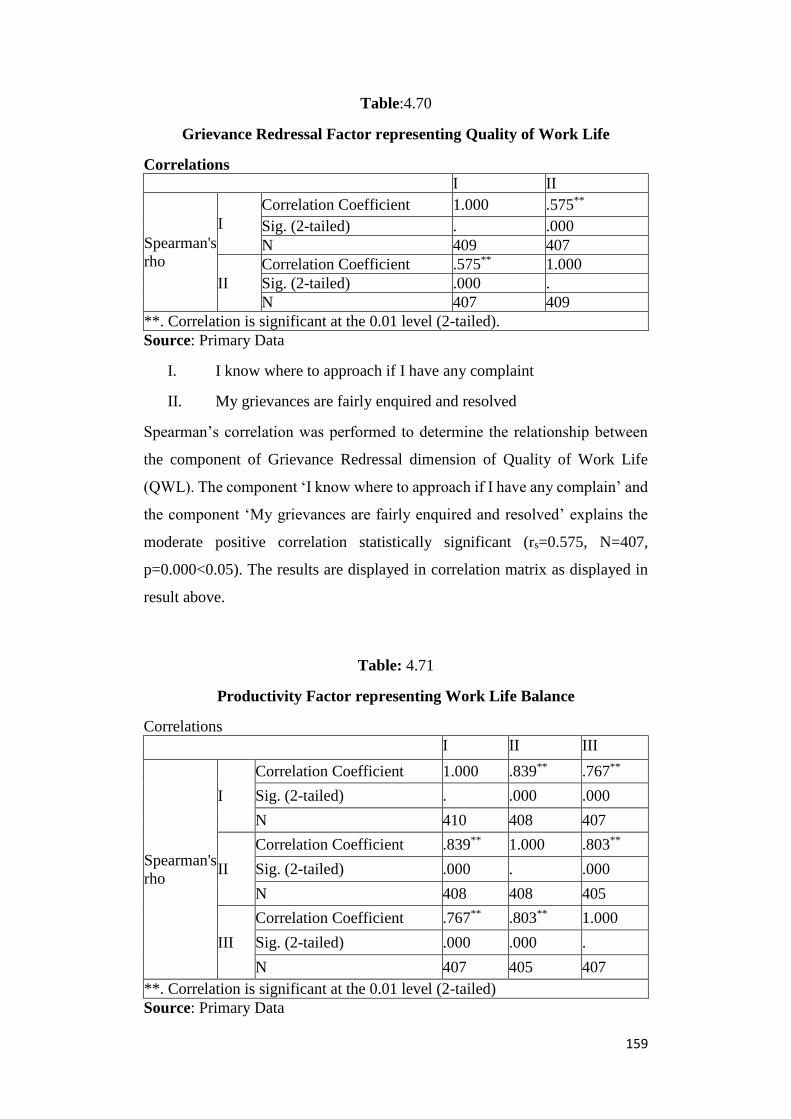
159
Table:4.70
Grievance Redressal Factor representing Quality of Work Life
Correlations
I II
Spearman's
rho
I
Correlation Coefficient 1.000 .575**
Sig. (2-tailed) . .000
N 409 407
II
Correlation Coefficient .575** 1.000
Sig. (2-tailed) .000 .
N 407 409
**. Correlation is significant at the 0.01 level (2-tailed).
Source: Primary Data
I. I know where to approach if I have any complaint
II. My grievances are fairly enquired and resolved
Spearman’s correlation was performed to determine the relationship between
the component of Grievance Redressal dimension of Quality of Work Life
(QWL). The component ‘I know where to approach if I have any complain’ and
the component ‘My grievances are fairly enquired and resolved’ explains the
moderate positive correlation statistically significant (rs=0.575, N=407,
p=0.000<0.05). The results are displayed in correlation matrix as displayed in
result above.
Table: 4.71
Productivity Factor representing Work Life Balance
Correlations
I II III
Spearman's
rho
I
Correlation Coefficient 1.000 .839** .767**
Sig. (2-tailed) . .000 .000
N 410 408 407
II
Correlation Coefficient .839** 1.000 .803**
Sig. (2-tailed) .000 . .000
N 408 408 405
III
Correlation Coefficient .767** .803** 1.000
Sig. (2-tailed) .000 .000 .
N 407 405 407
**. Correlation is significant at the 0.01 level (2-tailed)
Source: Primary Data

160
I. The work schedule of my organisation enables all employees to
maintain an effective Work Life Balance.
II. The productive working of my organisation is high due to effective
Work Life Balance
III. The retention of employees in the organisation is high due to
effective Work Life Balance
Spearman’s correlation was performed to determine the relationship between
all the components of Productivity dimension of Work Life Balance(WLB). The
component ‘The work schedule of my organisation enables all employees to
maintain an effective Work Life Balance’ and the component ‘The productive
working of my organisation is high due to effective Work Life Balance’ has the
highest correlation among all the other correlation and it also explains the strong
positive correlation statistically significant (rs= 0.839, N=408, p=0.000<0.05).
The results are displayed in correlation matrix as shown in table above.
Table: 4.72
Skill Deployment and Efficiency Factor representing Work Life Balance
Correlations
I II III IV V VI VII
Spearman's
rho
I
Correlation
Coefficient 1.000 .432** .606** .615** .443** .404** .390**
Sig. (2-tailed) . .000 .000 .000 .000 .000 .000
N 409 403 407 409 407 407 408
II
Correlation
Coefficient .432** 1.000 .313** .290** .401** .340** .147**
Sig. (2-tailed) .000 . .000 .000 .000 .000 .003
N 403 403 401 403 402 402 402
III
Correlation
Coefficient .606** .313** 1.000 .577** .354** .409** .446**
Sig. (2-tailed) .000 .000 . .000 .000 .000 .000
N 407 401 408 408 406 406 407
IV
Correlation
Coefficient .615** .290** .577** 1.000 .541** .445** .538**
Sig. (2-tailed) .000 .000 .000 . .000 .000 .000
N 409 403 408 410 408 408 409
V
Correlation
Coefficient .443** .401** .354** .541** 1.000 .545** .549**
Sig. (2-tailed) .000 .000 .000 .000 . .000 .000

161
N 407 402 406 408 408 407 407
VI
Correlation
Coefficient .404** .340** .409** .445** .545** 1.000 .505**
Sig. (2-tailed) .000 .000 .000 .000 .000 . .000
N 407 402 406 408 407 409 407
VII
Correlation
Coefficient .390** .147** .446** .538** .549** .505** 1.000
Sig. (2-tailed) .000 .003 .000 .000 .000 .000 .
N 408 402 407 409 407 407 409
**. Correlation is significant at the 0.01 level (2-tailed).
Source: Primary Data
I. My job requires that I keep learning new things.
II. My job requires that I work very fast’.
III. On my job, I know exactly what is expected of me.
IV. My job gives me scope to use my skills and abilities.
V. At the place where I work I am treated with respect.
VI. In my organisation, I work as part of team and not mostly on my
own.
VII. I am given enough freedom to decide how to do my own work.
Spearman’s correlation was performed to determine the relationship between
all the components of Skill Development and Efficiency dimension of Work
Life Balance(WLB). The component ‘My job requires that I keep learning new
things’ and the component ‘My job gives me scope to use my skills and abilities’
has the highest correlation among all the other correlations and it also explains
a moderate positive correlation statistically significant (rs=0.615, N=409,
p=0.000<0.05). the results are displayed in correlation matrix as shown in table
above.
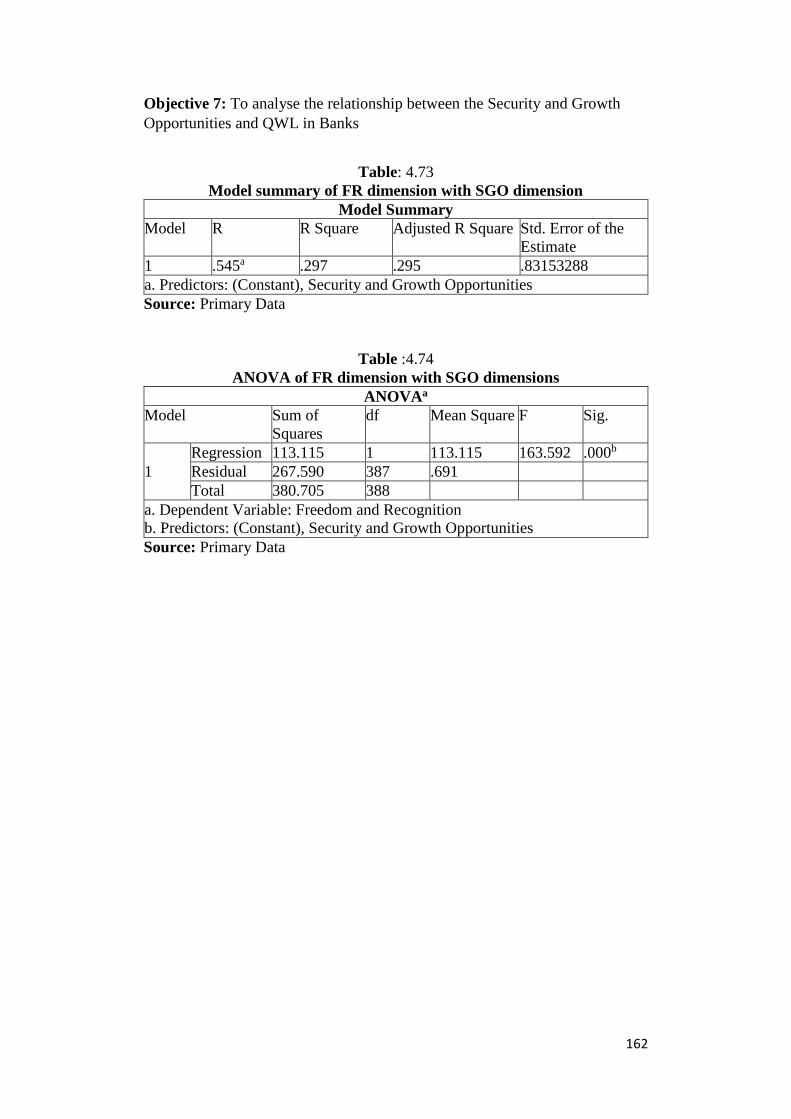
162
Objective 7: To analyse the relationship between the Security and Growth
Opportunities and QWL in Banks
Table: 4.73
Model summary of FR dimension with SGO dimension
Model Summary
Model R R Square Adjusted R Square Std. Error of the
Estimate
1 .545a .297 .295 .83153288
a. Predictors: (Constant), Security and Growth Opportunities
Source: Primary Data
Table :4.74
ANOVA of FR dimension with SGO dimensions
ANOVAa
Model Sum of
Squares
df Mean Square F Sig.
1
Regression 113.115 1 113.115 163.592 .000b
Residual 267.590 387 .691
Total 380.705 388
a. Dependent Variable: Freedom and Recognition
b. Predictors: (Constant), Security and Growth Opportunities
Source: Primary Data

163
Table: 4.75
Coefficients of FR dimension with SGO dimensions
Coefficientsa
Model Unstandardized
Coefficients
Standardized
Coefficients
t Sig.
B Std. Error Beta
1
(Constant) -.022 .042 -.532 .595
Security and
Growth
Opportunities
.624 .049 .545 12.790 .000
a. Dependent Variable: Freedom and Recognition
Source: Primary Data
Regression analysis was performed to predict Freedom and Recognition
dimension of Quality of Work Life (QWL) as dependent variable and Security
and Growth Opportunities (SGO) as independent variable. Security and Growth
Opportunities (SGO) significantly predicted Freedom and Recognition,
F(1,387)= 163.592, p=0.000<0.05, R2=0.297. Independent variable Security
and Growth Opportunities(SGO) explains 29.70% of the variability on
dependent variable Freedom and Recognition dimension of Quality of Work
Life(QWL).
Table:4.76
Model summary of Rewards dimension with SGO dimension
Model Summary
Model R R Square Adjusted R
Square
Std. Error of the Estimate
1 .127a .016 .014 .99504702
a. Predictors: (Constant), Security and Growth Opportunities
Source: Primary Data
Table :4.77
ANOVA of Rewards dimension with SGO dimension
ANOVAa
Model Sum of
Squares
df Mean Square F Sig.
1
Regression 6.279 1 6.279 6.342 .012b
Residual 383.176 387 .990
Total 389.455 388
a. Dependent Variable: Rewards
b. Predictors: (Constant), Security and Growth Opportunities
Source: Primary Data

164
Table: 4.78
Coefficients of Rewards dimension with SGO dimension
Coefficientsa
Model Unstandardized
Coefficients
Standardized
Coefficients
t Sig.
B Std. Error Beta
1
(Constant) -.007 .051 -.138 .890
Security and
Growth
Opportunities
.147 .058 .127 2.518 .012
a. Dependent Variable: Rewards
Source: Primary Data
Regression analysis was performed to predict Rewards dimension of Quality of
Work Life (QWL) as dependent variable from Security and Growth
Opportunities(SGO) as independent variable. Security and Growth
Opportunities(SGO) significantly predicted rewards, F(1,387)= 6.342,
P=0.012<0.05, R2=0.016. Independent variable Security and Growth
Opportunities(SGO) explains 1.60% of the variability on dependent variable
Rewards dimension of Quality of Work Life(QWL).
Table :4.79
Model summary of GR dimension with SGO dimension
Model Summary
Model R R Square Adjusted R Square Std. Error of the
Estimate
1 .320a .102 .100 .93988347
a. Predictors: (Constant), Security and Growth Opportunities
Source: Primary Data
Table: 4.80
ANOVA of GR dimension with SGO dimensions
ANOVAa
Model Sum of
Squares
df Mean Square F Sig.
1
Regression 38.942 1 38.942 44.083 .000b
Residual 341.868 387 .883
Total 380.810 388
a. Dependent Variable: Grievance Redressal
b. Predictors: (Constant), Security and Growth Opportunities
Source: Primary Data

165
Table: 4.81
Coefficients of GR dimension with SGO dimension
Coefficientsa
Model Unstandardized
Coefficients
Standardized
Coefficients
t Sig.
B Std. Error Beta
1
(Constant) -.029 .048 -.616 .538
Security and
Growth
Opportunities
.366 .055 .320 6.639 .000
a. Dependent Variable: Grievance Redressal
Source: Primary Data
Regression analysis was performed to predict Grievance Redressal dimension
of Quality of Work Life (QWL) as dependent variable and Security and Growth
Opportunities(SGO) as independent variable. Security and Growth
Opportunities(SGO) significantly predicted Grievance Redressal, F(1,387)=
44.083, p=0.000<0.05, R2=0.102. Independent variable Security and Growth
Opportunities(SGO) explains 10.20% of the variability on dependent variable
Grievance Redressal dimension of Quality of Work Life(QWL).
Table: 4.82
Security and Growth Opportunities
Correlations
I II III
Spearman's
rho
I
Correlation
Coefficient 1.000 .196** .190**
Sig. (2-tailed) . .000 .000
N 411 409 408
II
Correlation
Coefficient .196** 1.000 .522**
Sig. (2-tailed) .000 . .000
N 409 409 407
III
Correlation
Coefficient .190** .522** 1.000
Sig. (2-tailed) .000 .000 .
N 408 407 408
**. Correlation is significant at the 0.01 level (2-tailed).
Source: Primary Data
I. I don’t have any fear of losing my job.
II. My specific skills and experience are much needed for my
organisation.

166
III. I have been given opportunity for self-improvement and
advancement.
Spearman’s correlation was performed to determine the relationship between
all the components of Security and Growth Opportunities(SGO). The
component ‘My specific skills and experience are most needed for my
organisation’ and the component ‘I have been given opportunity for self-
improvement and advancement’ has the highest correlation as compared to the
correlations of other remaining components and it also explains a moderate
positive correlation (rs =0.522, N=407, p=0.000<0.05). The results are
displayed in correlation matrix as shown in Table above.
Table: 4.83
Descriptive statistics on component of Security and Growth
Opportunities(SGO)
Descriptive Statistics
N Mean Std.
Deviation
Minimum Maximum
I don’t have any fear of
losing my job 407 3.75 .760 1 5
My specific skills and
experience are much
needed for my
organisation
407 3.90 .550 1 5
I have been given
opportunity for self-
improvement and
advancement
407 3.88 .590 1 5

167
Table: 4.84
Friedman Test on Ranking on components of SGO
Friedman Test
Ranks
Mean Rank
I don’t have any fear of losing my job 1.92
My specific skills and experience are much needed for my
organisation 2.04
I have been given opportunity for self-improvement and
advancement 2.03
Source: Primary Data
Table: 4.85
Friedman Test Result
Test Statisticsa of SGO
N 407
Chi-Square 14.948
df 2
Asymp. Sig. .001
a. Friedman Test
As per the Table above the Mean Rank of Security and Growth Opportunities
(SGO) dimension shows that the component ‘My specific skills and experience
are much needed for my organisation’ has the highest Mean Rank of 2.04,
whereas the component ‘I don’t have any fear of losing my job’ has a lowest
Mean Rank of 1.92 among all the 3 components of Security and Growth
Opportunities(SGO). From the test statistics of SGO as shown in table above
the chi-Square χ 2 (df=2, N=407) =14.948, P=0.001<0.05 shows that there exists
significant difference between the Mean Ranks on all components of Security
and Growth Opportunities (SGO).
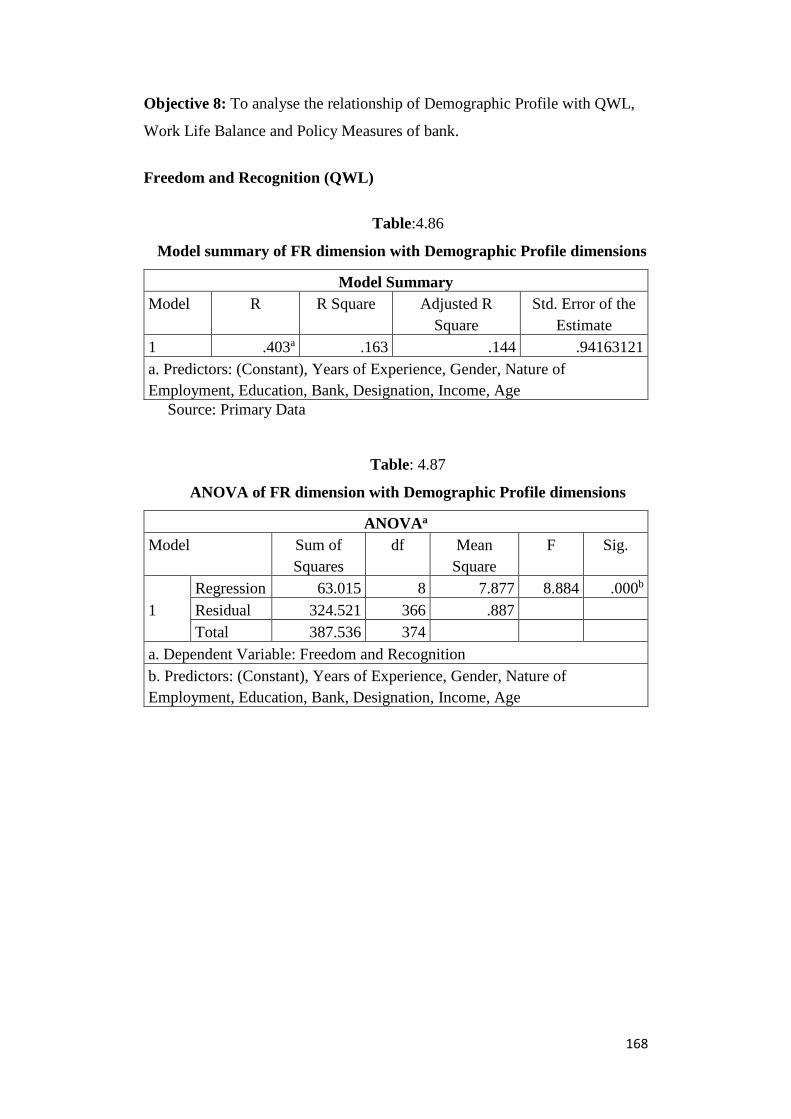
168
Objective 8: To analyse the relationship of Demographic Profile with QWL,
Work Life Balance and Policy Measures of bank.
Freedom and Recognition (QWL)
Table:4.86
Model summary of FR dimension with Demographic Profile dimensions
Model Summary
Model R R Square Adjusted R
Square
Std. Error of the
Estimate
1 .403a .163 .144 .94163121
a. Predictors: (Constant), Years of Experience, Gender, Nature of
Employment, Education, Bank, Designation, Income, Age
Source: Primary Data
Table: 4.87
ANOVA of FR dimension with Demographic Profile dimensions
ANOVAa
Model Sum of
Squares
df Mean
Square
F Sig.
1
Regression 63.015 8 7.877 8.884 .000b
Residual 324.521 366 .887
Total 387.536 374
a. Dependent Variable: Freedom and Recognition
b. Predictors: (Constant), Years of Experience, Gender, Nature of
Employment, Education, Bank, Designation, Income, Age

169
Table: 4.88
Coefficients of FR dimension with Demographic Profile dimensions
Coefficientsa
Model Unstandardized
Coefficients
Standardized
Coefficients
t Sig.
B Std. Error Beta
1
(Constant) -1.176 .727 -1.618 .106
Gender .059 .117 .027 .503 .615
Age .042 .009 .400 4.940 .000
Income -.407 .116 -.246 -3.505 .001
Education -.157 .100 -.079 -1.567 .118
Bank .314 .124 .131 2.532 .012
Designation .238 .132 .113 1.803 .072
Nature of
Employment .214 .554 .019 .387 .699
Years of
Experience -.040 .010 -.305 -4.253 .000
a. Dependent Variable: Freedom and Recognition
Source: Primary Data
Multiple Regression was performed on Freedom and Recognition of QWL as
dependent variable with the Demographic Profile as Independent variables. The
R square value indicates that 16.30 percent of the variance on Freedom and
Recognition of QWL can be predicated from the Demographic Profile variables.
These variables indicates statistical significance of the regression model
F(8,366)=8.884, p=0.000<0.05, R2=0.163. The coefficient for Age, Income,
Bank and Years of Experience are statistically significant at the 0.05 level,
p<0.05.

170
Rewards (QWL)
Table:4.89
Model summary of Rewards dimension with Demographic Profile
dimension
Model Summary
Model R R Square Adjusted R
Square
Std. Error of the
Estimate
1 .423a .179 .161 .93026697
a. Predictors: (Constant), Years of Experience, Gender, Nature of
Employment, Education, Bank, Designation, Income, Age
Source: Primary Data
Table: 4.90
ANOVA of Rewards dimension with Demographic Profile dimension
ANOVAa
Model Sum of
Squares
df Mean
Square
F Sig.
1
Regression 69.075 8 8.634 9.977 .000b
Residual 316.735 366 .865
Total 385.810 374
a. Dependent Variable: Rewards
b. Predictors: (Constant), Years of Experience, Gender, Nature of
Employment, Education, Bank, Designation, Income, Age
Source: Primary Data

171
Table: 4.91
Coefficients of Rewards dimension with Demographic Profile dimension
Coefficientsa
Model Unstandardized
Coefficients
Standardized
Coefficients
t Sig.
B Std. Error Beta
1
(Constant) -3.256 .718 -4.534 .000
Gender .070 .115 .032 .606 .545
Age .056 .008 .529 6.597 .000
Income .122 .115 .074 1.064 .288
Education .016 .099 .008 .160 .873
Bank .157 .123 .065 1.278 .202
Designation .146 .131 .069 1.115 .265
Nature of
Employment .459 .548 .040 .837 .403
Years of
Experience -.026 .009 -.193 -2.720 .007
a. Dependent Variable: Rewards
Source: Primary Data
Multiple Regression was performed on Rewards of QWL as dependent variable
with the Demographic Profile as Independent variables. The R square value
indicates that 17.90 percent of the variance on Rewards of QWL can be
predicated from the Demographic Profile variables. These variables indicates
statistical significance of the regression model F(8,366)=9.977, p=0.000<0.05,
R2=0.179. The coefficient for Age and Years of Experience are statistically
significant at the 0.05 level, p<0.05.

172
Grievance Redressal (QWL)
Table: 4.92
Model summary of GR dimension with Demographic Profile dimension
Model Summary
Model R R Square Adjusted R
Square
Std. Error of the
Estimate
1 .323a .105 .085 .96646219
a. Predictors: (Constant), Years of Experience, Gender, Nature of
Employment, Education, Bank, Designation, Income, Age
Source: Primary Data
Table: 4.93
ANOVA of GR dimension with Demographic Profile dimension
ANOVAa
Model Sum of
Squares
df Mean
Square
F Sig.
1
Regression 39.941 8 4.993 5.345 .000b
Residual 341.862 366 .934
Total 381.803 374
a. Dependent Variable: Grievance Redressal
b. Predictors: (Constant), Years of Experience, Gender, Nature of
Employment, Education, Bank, Designation, Income, Age
Source: Primary Data

173
Table: 4.94
Coefficients of GR dimension with Demographic Profile dimension
Coefficientsa
Model Unstandardized
Coefficients
Standardized
Coefficients
t Sig.
B Std. Error Beta
1
(Constant) -2.083 .746 -2.792 .006
Gender .015 .120 .007 .127 .899
Age .021 .009 .203 2.423 .016
Income -.109 .119 -.066 -.911 .363
Education .218 .103 .110 2.116 .035
Bank .699 .127 .294 5.484 .000
Designation -.175 .136 -.083 -1.288 .198
Nature of
Employment .445 .569 .039 .782 .435
Years of
Experience -.009 .010 -.068 -.913 .362
a. Dependent Variable: Grievance Redressal
Source: Primary Data
Multiple Regression was performed on Grievance Redressal of QWL as
dependent variable with the Demographic Profile as Independent variables. The
R square value indicates that 10.50 percent of the variance on Grievance
Redressal of QWL can be predicated from the Demographic Profile variables.
These variables indicates statistical significance of the regression model
F(8,366)=5.345, p=0.000<0.05, R2=0.105. The coefficient for Age, Education
and Bank are statistically significant at the 0.05 level, p<0.05.
Productivity
Table: 4.95
Model summary of Productivity dimension with Demographic Profile
dimensions
Model Summary
Model R R Square Adjusted R
Square
Std. Error of the
Estimate
1 .440a .193 .176 .92219273
a. Predictors: (Constant), Years of Experience, Gender, Nature of
Employment, Education, Bank, Designation, Income, Age
Source: Primary Data

174
Table: 4.96
ANOVA of Productivity dimension with Demographic Profile dimensions
ANOVAa
Model Sum of
Squares
df Mean
Square
F Sig.
1
Regression 74.854 8 9.357 11.002 .000b
Residual 312.111 367 .850
Total 386.966 375
a. Dependent Variable: Productivity
b. Predictors: (Constant), Years of Experience, Gender, Nature of
Employment, Education, Bank, Designation, Income, Age
Source: Primary Data
Table: 4.97
Coefficients of Productivity dimension with Demographic Profile
dimensions
Coefficientsa
Model Unstandardized
Coefficients
Standardized
Coefficients
t Sig.
B Std. Error Beta
1
(Constant) -1.982 .705 -2.813 .005
Gender .020 .116 .009 .168 .866
Age .067 .008 .637 8.012 .000
Income -.363 .112 -.218 -3.238 .001
Education -.120 .099 -.061 -1.213 .226
Bank .376 .123 .154 3.059 .002
Designation .141 .128 .067 1.098 .273
Nature of
Employment .153 .543 .013 .282 .778
Years of
Experience -.055 .009 -.426 -5.961 .000
a. Dependent Variable: Productivity
Source: Primary Data
Multiple Regression was performed on Productivity of WLB as dependent
variable with the Demographic Profile as Independent variables. The R square
value indicates that 19.30 percent of the variance on Productivity of WLB can
be predicated from the Demographic Profile variables. These variables indicate
statistical significance of the regression model F(8,367)=11.002, p=0.000<0.05,

175
R2=0.193. The coefficient for Age, Income, Bank and Years of Experience are
statistically significant at the 0.05 level, p<0.05.
Skill Deployment and Efficiency
Table: 4.98
Model summary of Skill Deployment and Efficiency dimension with
Demographic Profile dimensions
Model Summary
Model R R Square Adjusted R
Square
Std. Error of the
Estimate
1 .188a .035 .014 1.00761653
a. Predictors: (Constant), Years of Experience, Gender, Nature of
Employment, Education, Bank, Designation, Income, Age
Source: Primary Data
Table: 4.99
ANOVA of Skill Deployment and Efficiency dimension with
Demographic Profile dimensions
ANOVAa
Model Sum of
Squares
df Mean
Square
F Sig.
1
Regression 13.595 8 1.699 1.674 .103b
Residual 372.612 367 1.015
Total 386.206 375
a. Dependent Variable: Skill Deployment and Efficiency
b. Predictors: (Constant), Years of Experience, Gender, Nature of
Employment, Education, Bank, Designation, Income, Age
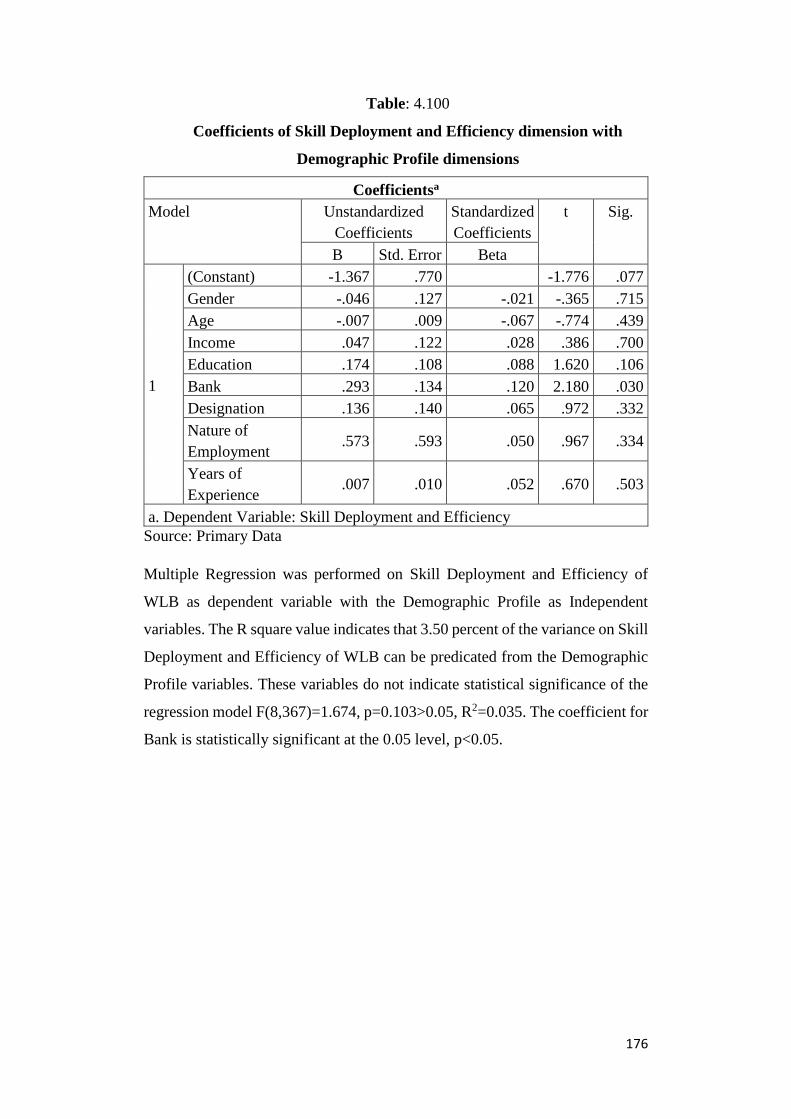
176
Table: 4.100
Coefficients of Skill Deployment and Efficiency dimension with
Demographic Profile dimensions
Coefficientsa
Model Unstandardized
Coefficients
Standardized
Coefficients
t Sig.
B Std. Error Beta
1
(Constant) -1.367 .770 -1.776 .077
Gender -.046 .127 -.021 -.365 .715
Age -.007 .009 -.067 -.774 .439
Income .047 .122 .028 .386 .700
Education .174 .108 .088 1.620 .106
Bank .293 .134 .120 2.180 .030
Designation .136 .140 .065 .972 .332
Nature of
Employment .573 .593 .050 .967 .334
Years of
Experience .007 .010 .052 .670 .503
a. Dependent Variable: Skill Deployment and Efficiency
Source: Primary Data
Multiple Regression was performed on Skill Deployment and Efficiency of
WLB as dependent variable with the Demographic Profile as Independent
variables. The R square value indicates that 3.50 percent of the variance on Skill
Deployment and Efficiency of WLB can be predicated from the Demographic
Profile variables. These variables do not indicate statistical significance of the
regression model F(8,367)=1.674, p=0.103>0.05, R2=0.035. The coefficient for
Bank is statistically significant at the 0.05 level, p<0.05.

177
Welfare (PM of Banks)
Table:4.101
Model summary of Welfare dimension with Demographic Profile
dimensions
Model Summary
Model R R Square Adjusted R
Square
Std. Error of the
Estimate
1 .389a .151 .133 .93614877
a. Predictors: (Constant), Years of Experience, Gender, Nature of
Employment, Education, Bank, Designation, Income, Age
Source: Primary Data
Table:4.102
ANOVA of Welfare dimension with Demographic Profile dimensions
ANOVAa
Model Sum of
Squares
df Mean
Square
F Sig.
1
Regression 57.964 8 7.245 8.268 .000b
Residual 325.135 371 .876
Total 383.099 379
a. Dependent Variable: Welfare
b. Predictors: (Constant), Years of Experience, Gender, Nature of
Employment, Education, Bank, Designation, Income, Age
Source: Primary Data

178
Table: 4.103
Coefficients of Welfare dimension with Demographic Profile dimensions
Coefficientsa
Model Unstandardized
Coefficients
Standardized
Coefficients
t Sig.
B Std. Error Beta
1
(Constant) -2.788 .715 -3.898 .000
Gender .092 .116 .043 .795 .427
Age .061 .008 .585 7.214 .000
Income -.114 .113 -.069 -1.003 .317
Education .066 .099 .034 .670 .504
Bank .361 .123 .151 2.942 .003
Designation .203 .129 .098 1.570 .117
Nature of
Employment .007 .551 .001 .012 .990
Years of
Experience -.047 .010 -.352 -4.860 .000
a. Dependent Variable: Welfare
Source: Primary Data
Multiple Regression was performed on Welfare of PM of Banks as dependent
variable with the Demographic Profile as Independent variables. The R square
value indicates that 15.10 percent of the variance on Welfare of PM of Bank can
be predicated from the Demographic Profile variables. These variables indicates
statistical significance of the regression model F(8,371)=8.268, p=0.000<0.05,
R2=0.151. The coefficient for Age, Bank and Years of Experience are
statistically significant at the 0.05 level, p<0.05.
Health Camps (PM of Banks)
Table: 4.104
Model summary of Health Camps dimension with Demographic
Profile dimensions
Model Summary
Model R R Square Adjusted R
Square
Std. Error of the
Estimate
1 .382a .146 .127 .93398329
a. Predictors: (Constant), Years of Experience, Gender, Nature of
Employment, Education, Bank, Designation, Income, Age
Source: Primary Data

179
Table: 4.105
ANOVA of Health Camps dimension with Demographic Profile
dimensions
ANOVAa
Model Sum of
Squares
df Mean
Square
F Sig.
1
Regression 55.173 8 6.897 7.906 .000b
Residual 323.632 371 .872
Total 378.806 379
a. Dependent Variable: Health Camps
b. Predictors: (Constant), Years of Experience, Gender, Nature of
Employment, Education, Bank, Designation, Income, Age
Source: Primary Data
Table: 4.106
Coefficients of Health Camps dimension with Demographic Profile
dimensions
Coefficientsa
Model Unstandardized
Coefficients
Standardized
Coefficients
t Sig.
B Std. Error Beta
1
(Constant) -.435 .713 -.610 .542
Gender .007 .115 .003 .056 .955
Age -.029 .008 -.280 -3.434 .001
Income -.004 .113 -.002 -.032 .974
Education .036 .099 .018 .365 .716
Bank .550 .122 .233 4.502 .000
Designation -.173 .129 -.084 -1.343 .180
Nature of
Employment .623 .549 .055 1.133 .258
Years of
Experience .046 .010 .348 4.784 .000
a. Dependent Variable: Health Camps
Source: Primary Data
Multiple Regression was performed on Health Camps of PM of Banks as
dependent variable with the Demographic Profile as Independent variables. The
R square value indicates that 14.60 percent of the variance on Health Camps of
PM of Banks can be predicated from the Demographic Profile variables. These
variables indicate statistical significance of the regression model F (8,371)

180
=7.906, p=0.000<0.05, R2=0.146. The coefficient for Age, Bank and Years of
Experience are statistically significant at the 0.05 level, p<0.05.

181
CHAPTER V
Findings, Suggestions, Conclusion and Scope For
Further Research
This chapter highlights summary and brief commentary on the findings,
suggestions, conclusion and scope for further Research on the study Quality of
Work Life of Employees in Banking Sector – A Study of Managers and Staff
of Banks in Goa. The following are the major findings of the study.
5.1 Demographic Details of Respondents
The sample Respondents for the study were from both Public sector
and Private Sector Banks.
The Gender Profile of the Sample shows that 270 comprising 65.5
percent of the respondents were male and 137 comprising 33.3
percent of respondents were female. A sample of 5 respondents
comprising 1.2 percent are treated missing items.
The Result shows that 261 respondents (63.3 percent) are in the
range of income level of 4-8 lakhs and only 70 respondents (17.0
percent) are in the income level of 9-15 lakhs.
The education profile of the respondents shows that majority of
them (66.7 percent) are Graduates.
Majority of the respondents (77.4 percent) are from Public sector
Banks.
Respondents comprised of 36.7 percent managerial staff and 63.1
percent other staff.
The study showed that 99.0 percent of the respondents had
permanent nature of employment.
The results showed that 98.8 percent of the respondents did not
observe any discrimination on gender basis by the employer at the
time of recruitment.
The study showed that 97.1 percent of respondents did not observe
any discrimination by the employer on gender basis as regards
nature of work.

182
Majority of respondents (96.6 percent) did not observe any
discrimination concerning work schedule and duration of work.
The results showed that 97.8 percent of the respondents did not
observe any discrimination by the employer on gender basis at the
time of promotion.
5.2 Opinions of Respondents About QWL Dimensions
Majority of respondents agree that “adequate time is given to
complete my task”.
Results show that majority of the respondents agree with statement
“My preferences are considered when they assign my work area”.
Analysis show that majority of respondents have agreed to the
statement “My work place is stress free”.
Results show that majority of the respondents have agreed with the
statement “I have been given adequate freedom to carry out my
work activities”.
As is clear, majority of the respondents agreed with the statement “I
am given satisfactory salary for the work I do”.
Results of the study show that majority of the respondents have
agreed with the statement that “salary differentials is fairly
calculated based on responsibility of work”.
Majority of Respondents also agree with the statement “There is
good linking of rewards and work performance”.
Results show that majority of the respondents have agreed with the
statement “I know where to approach, if I have any problem”.
It is concluded from the analysis that majority of the respondents
agree with the statement “My grievances are fairly enquired and
Resolved”.
It is clear from the results that majority of respondents have agreed
with the statement “The productive working of my organization is
high due to effective work life balance”.
Results show that majority of the respondents agree with the
statement “My job requires that I keep learning new things”.
183
Majority of respondents agree with the statement “My job gives me
scope to use my skills and abilities”.
Analysis show that majority of the respondents agree with the
statement “At the place where I work, I am treated with respect”.
Results show that majority of the respondents agree with the
statement “I am given enough freedom to decide how to do my own
work”.
It is clear from the results that majority of the respondents agree
with the statement “Organisation takes initiatives to manage work
life Balance of Employees”.
Majority of the respondents agree with the statement “Organisation
makes special arrangement of medical care to employees in times
of emergency”.
5.3 Impact of Working Environment on Freedom and Recognition Dimension of
QWL
Working Environment explains 32.20 percent of the variability on
Freedom and Recognition dimension of QWL. R2 = 0.322 indicates
a weak strength and shows that 32.20 percent of data fit our
regression model of Freedom and Recognition dimension of QWL
with Working Environment.
ANOVA result shows that Working Environment at high level
significance (p=0.000) predicted Freedom and Recognition
dimension of QWL.
Coefficient table shows that Working Environment has a positive
unstandardized coefficient (B=0.547) and is statistically significant
(p=0.000).

184
5.4 Impact of Working Environment on Rewards Dimension of QWL
Working Environment explains 19 percent of the variability on
Rewards dimension of QWL. R2 = 0.190 indicates a weak strength and
shows that 19 percent of data fit our regression model of Rewards
dimension of QWL with Working Environment.
ANOVA result shows that Working Environment at high level
significance (p=0.000) predicted Rewards dimension of QWL.
Coefficient table shows that Working Environment has a positive
unstandardized coefficient (B=0.453) and is statistically significant
(p=0.000).
5.5 Impact of Working Environment on Grievance Redressal Dimension
of QWL
Working Environment explains 12.90 percent of the variability on
Grievance Redressal dimension of QWL. R2 = 0.129 indicates a weak
strength and shows that 12.90 percent of the data fit our regression
model of Grievance Redressal dimension of QWL with Working
Environment.
ANOVA result shows that Working Environment at high level
significance (p=0.000) predicted Grievance Redressal dimension of
QWL.
Coefficient table shows that Working Environment has a positive
unstandardized coefficient (B=0.349) and is statistically significant
(p=0.000).
Spearman’s Correlation indicates that the component “Working
Environment in the organizations is participative” and the component “The
Physical working conditions in the organization are very conducive to
work” has the highest moderate positive correlation and is statistically
significant among Working Environment components (rs=0.634, p=0.000).
Friedman Test indicates that the component “Working Environment in the
organization is participative” has the highest mean ranks of 3.57. The Chi-
185
square analysis shows that there is a significant difference between the
mean rank and all the components of Working Environment.
5.6 Impact of Policy Measures Dimensions on Freedom and Recognition
Dimension of QWL
Welfare and Health Camps both dimensions of Policy Measures of Bank
explains 23.20 percent of the variability on Freedom and Recognition
dimension of QWL. R2 = 0.232 indicates a weak strength and shows that
23.20 percent of data fit our regression model of Freedom and
Recognition dimension of QWL with predictors Welfare and Health
Camps.
ANOVA result shows that both Welfare and Health Camps collectively
at high level significance (p=0.000) predicted Freedom and Recognition
dimension of QWL.
Coefficient table shows that
⇒Welfare dimension of PM has a positive unstandardized coefficient
(B=0.480) and is statistically significant (p=0.000).
⇒ Health Camps dimension of PM has a positive unstandardized
coefficient (B=0.078) and is not statistically significant (p=0.075).
5.7 Impact of Policy Measures Dimensions on Rewards Dimension of QWL
Welfare and Health Camps, both dimensions of Policy Measures of
Bank explains 24.30 percent of the variability on Rewards dimension of
QWL. R2 = 0.243 indicates a weak strength and shows that 24.30
percent of the data fit our regression model of Rewards dimension of
QWL with predictors welfare and health camps.
ANOVA result shows that both Welfare and Health Camps collectively
at high level significance (p=0.000) predicted Rewards dimension of
QWL.
Coefficient table shows that

186
⇒ Welfare dimension of PM has a positive unstandardized coefficient
(B=0.495) and is statistically significant (p=0.000).
⇒ Health Camps dimension of PM has a negative unstandardized
coefficient (B=-0.095) and is statistically significant (p=0.033).
5.8 Impact of Policy Measures Dimensions on Grievance Redressal
Dimension of QWL
Welfare and Health Camps, both dimensions of Policy Measures of
Bank explains 13.60 percent of the variability on Grievance Redressal
dimension of QWL. R2 = 0.136 indicates a weak strength and shows
that 13.60 percent of the data fit our regression model of Grievance
Redressal dimension of QWL with predictors Welfare and Health
Camps.
ANOVA result shows that both Welfare and Health Camps collectively
at high level significance (p=0.000) predicted Grievance Redressal
dimension of QWL.
Coefficient table shows that
⇒ Welfare dimension of PM has a positive unstandardized coefficient
(B=0.293) and is statistically significant (p=0.000).
⇒Health Camps dimension of PM has a positive unstandardized
coefficient (B=0.213) and is statistically significant (p=0.000).
Spearman’s Correlation indicates that the component “Organisation
takes initiatives to manage work life balance of employees” and the
component “Organisation is keen to implement maximum welfare
measures to employees” has the highest correlation and also explains a
weak positive correlation and is statistically significant among welfare
dimension representing Policy Measures of Bank (rs=0.444, p=0.000).
Spearman’s Correlation indicates that the component “Organisation
conducts periodic Health Camps for employees” and the component
“Organisation occasionally conducts recreational camps and picnics for
maintaining Work Life Balance” explains a moderate positive

187
correlation and is statistically significant in Health Camps dimension
representing Policy Measures of Bank (rs=0.540, p=0.000).
5.9 Impact of QWL Dimensions on Productivity Dimension of Work Life
Balance
Freedom and Recognition, Rewards and Grievance Redressal, the
dimensions of QWL explains 56.60 percent of the variability on
productivity dimension of WLB. R2=0.566 indicate a moderate strength
and shows that 56.60 percent of the data fit our regression model of
productivity dimension of WLB with dimensions of QWL.
ANOVA result shows that all dimensions of QWL collectively at high
level significance (p=0.000) predicted productivity dimension of WLB.
Coefficient table shows that all dimensions of QWL namely Freedom
and Recognition, Rewards and Grievance Redressal individually are
statistically significant and has a positive unstandardized coefficient
(B=0.593), (B=0.400), (B=0.187) respectively.
5.10 Impact of QWL Dimensions on Skill Deployment and Efficiency
Dimension of WLB
Freedom and Recognition, Rewards and Grievance Redressal, the
dimensions of QWL explains 24.30 percent of the variability on Skill
Deployment and Efficiency dimension of WLB. R2=0.243 indicates a
weak strength and shows that 24.30 percent of the data fit our regression
model of Skill Deployment and Efficiency dimension of WLB with
dimensions of QWL.
ANOVA result shows that all dimensions of QWL collectively at high
level significance (p=0.000), predicted Skill Deployment and Efficiency
dimension of WLB.
Coefficient table shows that all dimensions of QWL namely Freedom
and Recognition, Rewards and Grievance Redressal individually are
statistically significant. Freedom and Recognition and Grievance
188
Redressal has a positive unstandardized coefficient (B=0.330),
(B=0.271) respectively and Rewards has a negative unstandardized
coefficient (B = - 0.116).
Spearman’s Correlation indicates that the component “My work place is
stress free” and the component “Adequate time is given to complete my
task” has the highest and a strong positive correlation statistically
significant among Freedom and Recognition components (rs=0.753,
p=0.000).
Spearman’s Correlation indicates that the component “There is good
linking of rewards and work performance” and the component “salary
differentials is fairly calculated, based on responsibility of work” has the
highest and moderate positive correlation statistically significant among
Rewards components (rs=0.664, p=0.000)
Spearman’s Correlation indicates that the component “I know where to
approach, if I have any complaint” and the component “My grievances
are fairly enquired and resolved” explains the moderate positive
correlation statistically significant (rs=0.575, p=0.000).
5.11 Impact of SGO on Freedom and Recognition Dimension of QWL
SGO explains 29.70 percent of the variability on Freedom and
Recognition dimension of QWL. R2 = 0.297 indicates a weak strength
and shows that 29.70 percent of the data fit our Regression model of
Freedom and Recognition dimension of QWL with SGO.
ANOVA result shows that SGO at high level significance (p=0.000)
predict Freedom and Recognition dimension of QWL.
Coefficient table shows that SGO has a positive unstandardized
coefficient (B=0.624) and is statistically significant (p=0.000).
189
5.12 Impact of SGO on Rewards Dimension of QWL
SGO explains 1.60 percent of the variability on rewards dimension of
QWL. R2 = 0.016 indicates a weak strength and shows that 1.60 percent
of the data fit our Regression model of Rewards dimension of QWL with
SGO.
ANOVA result shows that SGO significantly predicted Rewards
dimension of QWL (p=0.012).
Coefficient table shows that SGO has a positive unstandardized
coefficient (B=0.147) and is statistically significant (p=0.012).
5.13 Impact of SGO on Grievance Redressal dimension of QWL
SGO explains 10.20 percent of the variability on Grievance Redressal
dimension of QWL. R2 = 0.102 indicates a weak strength and shows
that 10.20 percent of the data fit our regression model of Grievance
Redressal dimension of QWL with SGO.
ANOVA result shows that SGO at high level significance (p=0.000)
predicted Grievance Redressal dimension of QWL.
Coefficient table shows that SGO has a positive unstandardized
coefficient (B=0.366) and is statistically significant (p=0.000).
Spearman’s Correlation indicates that the component “My specific skills and
experience most needed for my organization” and the component “I have been
given opportunity for self-improvement and advancement” has the highest and
moderate positive correlation among SGO components (rs = 0.522, p=0.000).
Friedman Test indicates that the component “My specific skills and experience
are much needed for my organization” has the highest Mean Ranks of 2.04. The
Chi-square analysis shows that there is a significant difference between the
Mean Ranks on all the components of SGO.

190
5.14 Impact of QWL Dimensions, WLB Dimensions and Pm Dimensions on
Demographic Profile
ANOVA result shows that the demographic profile predictors namely
years of experience, gender, nature of employment, education, Bank,
designation, income and age, collectively at high level significance
predicted QWL dimensions and PM dimensions. Productivity dimension
of WLB is significantly predicted, whereas Skill Deployment and
Efficiency of WLB is not significantly predicted.
5.15 Suggestions
The Researcher has made detailed analysis of the dimensions of QWL
immediately impacting the Bank employees in the present study. The
Researcher personally visited the banks for data collection. Besides the
structured questionnaire, he talked to some staff and managers. Based on the
analysis and informal talks with employees, the following points of suggestions
are highlighted.
Employees need more freedom and autonomy at work place. This will give
them the scope to do the work efficiently and productively. They will be
more innovative at their jobs, which will also motivate them to perform the
job better. Control or constant monitoring tend to make the worker
withdraw from his work and may give him dissatisfaction.
Employees attach great importance to working environment, as their
working hours sometimes extend beyond normal schedule. Working
environment should induce them to work better and make high productive
contribution.
Employer’s need to organize training programmes for the employees
concerning their work. This will ease the problems if any associated with
the work.
Employees will also need training associated with team work, interpersonal
relations, customer interaction, which will give them enough confidence.
Some employees particularly the women employees favour flexible
working hours, which can help them to maintain a good work life Balance.
191
As the staff in the Banks is large, the Banks need to provide the facility of
Rest rooms, lunch rooms, canteens and a place for recreational facilities.
Provision of canteens can save the time of employees. Moreover, in rural
places, there may be no restaurants which can inconvenience employees.
Provision of these facilities will also raise the job satisfaction of employees.
Technology upgradation, maintenance and repairs need to be undertaken,
so that worker can use the devices safely without breakdown and customers
also get timely benefits. This will lead to saving of real time.
Adequate and fair compensation related to cost of living index is what the
employer need to give to its employees along with other fringe benefits.
This will keep the employees satisfied.
Grievance Redressal Mechanism should be in place. Employers shall make
arrangements to form small councils consisting of seniors to address
grievances of workers and employees so that conflicts are resolved.
A good promotion policy shall always act as motivating factor for the
employees at work. Service conditions also ought to favour the employees
to derive maximum satisfaction.
There should not be any gender discrimination either at the time of
recruitment or later at the time of promotion or for other benefits. This will
demotivate the workers and will affect the work.
The employers can give importance to worker’s participation in
management at the time of its decision making. If it is already existing, the
proportion of participation can be enhanced.
Health and wellness or periodic Health camps should be organized in Banks
separately for male and female employees by professionals. The
employees will be alerted about their medical issues if any and the same
can be resolved.
As far as possible female employees should not be transferred to distant
areas or out of the State. This will disturb their family life and households,
thus greatly disturbing the employee on the jobs.
Sometimes vacancies arising in the banks are prolonged and does not get
filled up in time. This can frustrate the existing employees as the extra

192
work gets rotated among them. This brings a feeling of dissatisfaction and
it may demotivate the existing employees in their jobs.
Good work done by the employees should be appreciated. This will
motivate them and raise their morale.
5.16 CONCLUSION
In the present study, it is ascertained that Quality of Work Life is very
significant for the employees of Banking Sector. The Management and the
employers have realized this and are making all efforts to continuously improve
the same. The investments are also made for conducting different programmes,
workshops which will provide new ways of working methods familiarising the
workers with technology as well as addressing the issues concerning their
family life. The employers also hire the services of counsellors to deal with
specific issues concerning their staff. The dimension of Working Environment
is greatly appreciated by workers and all employees and they desire that there
ought to be constant improvement in the same. The employers also are keen to
do this, as they realize that, the working of the employees can be more
productive if they are given good environment to work.
Autonomy, Freedom and Recognition is also the dimension which is significant
for the employees at the place of work. The policies of the Government in
having mergers and acquisitions of some Banks have brought some employees
under stress. The policies change and new dimensions of QWL emerge. The
scams and scandals in some banks also forces the Government to have more
stringent policies impacting the QWL of employees.
Realising the need and importance, the study of Quality of Work Life and Work
Life Balance, there has to be an unending work, as it directly affects the Human
Resource and the employees. New dimensions shall also emerge with changing
times and some of the old dimensions can become insignificant.
The Quality of Work Life is the primary constituent in Banking Sector.
Adequate time given to complete the task enhances Freedom and Recognition.
Rewards dimension relates to satisfactory salary for the work done by the
employees. Grievances in organisations have to be addressed fairly and have to
be resolved with a good approach. The present study reveals that proper working
193
hours enables an employee to maintain a balance between work and personal
life. The study also shows that organisation must continue to take initiatives to
manage Work Life Balance of employees. Such good policy measures will
boost the welfare of employees. Periodic health camps conducted enhances
Work Life Balance of the employees in an organisation.
The study also reveals that effective Work Life Balance leads to high productive
work in an organisation. Team work is required in an organisation for efficiency
and optimum output. The analysis of the present study also reveals that the Bank
employees should keep learning new skills upon given an opportunity by an
organisation. The study also shows that Quality of Work Life significantly
predicts Work Life Balance.
5.17 Scope for Further Research
The results and finding s of the present study are limited with respect to its
nature, type and approach. A more detailed and elaborate study can be
undertaken by including different other aspects.
Rural and Semi-Urban branches can be taken separately to find out if
QWL of employees gets affected or remains unaffected with reference
to dimensions of QWL.
The number of Branches of the Banks could be enlarged to include all
the Banks.
The Sample size of the Respondents can also be enlarged to cover all
employees working in the Banks.
A comparative study of Public Sector, Private Sector and Co-operative
Sector can also be made with reference to the impact of dimensions of
QWL on employees working in such Banks.
More dimensions of QWL can also be taken, against which data can be
collected from all the Respondents of such Banks. New dimensions of
QWL may also become impactful in changing times.
The impact of QWL dimensions on the employees can also be assessed
in view of mergers and acquisitions of Banks and the policy changes

194
therein. Study could be conducted to find out the impact of QWL
dimensions on employees.
Elaborate study can be conducted by including more variables of Work
Life and Family life in the Work Life Balance of employees in Banks.
A separate study can also be conducted by taking managerial staff as
well as other levels of staff in the Bank separately. This will help to
know how QWL dimensions impact employees at different levels.

195
Bibliography:
A. Jayakumar and K. Kalaiselvi. (2012, October ). Quality of Work LIFE-An Overview.
International Journal of Marketing, Financial Services & Management
Research, 1(10), 140-151.
A. Sabarirajan, N. Geethanjali. (2011). A Study on Quality of Work Life and
Organisational Performance among the Employees of Public and Private
Banks in Dindigul. International Journal of Economics Research, 2(6), 38-45.
Allan, P, Loseby, P.H (1993),. No-layoff policies and corporate financial performance.
S.A.M. Advanced Management Journal, 58(1), 44-8.
Ajala, E. M. (2013). Quality of Work Life and Workers Wellbeing: The Industrial Social
Workers Approach. IFE Psychology, 212(2), 46-56.
Akhtar, S. and Vadra, P. . (1990). A comparative study of extra organizational stress
among women teacher and nursing staf. Paper presented at the 27th Annual
Conference of lAAP, A.M.U. Aligarh.
Akinnusi, D.M. (1994). Relationship between personal attributes, stressors, stress
reactions, and coping styles. Management and Labour Studies, 19(4), 211-
218.
Amin. (2013). Quality of Work Life in Indonesian Public Service Organizations: The
Role of Career Development and Personal Factors. International Journal of
Applied Psychology. 3(3),38-44.
Anbarasan, Vanmathy & Mehta, Nikhil. (2010). Quality of Working Life among Sales
Professionals in Pharmaceuticals, Insurance, Banking & Finance Companies.
Indian Journal of Industrial Relations. 46. 138-149.
Anjali Jacob. (2018, September ). A Study On Quality of Work Life Of Employees In
Nationalized Banks In Ranny Thaluk. International Journal of Management,
IT & Engineering, 8(7).
Anukool Manish Hyde, Barkha Gupta (2018, September). Factors affecting Quality of
Work Life among Nationalized Bank Employees. International Journal of
Management, IT & Engineering, 8(9).
Antle and Beverley, J., 2006, OASW Quality of Work Life Survey, final report of
Ontario Association of Social Workers.
Aravinda M Ratna Kishore. (2016, May ). Quality of Work Life of Indian Bank
Employees: A Study in Warangal District Telangana. International Journal of
Advanced Engineering Management and science, 2(5).
Aryee, S., Fields, D. & Luk, V. 1999. A cross-cultural test of model of the work-family
interface. Journal of Management, 25(4). 491-511.
Asgari, M. H., &Dadashi, M. A. (2011). Determining the Relationship Between Quality
of Work Life (QWL) and Organizational Commitment of Melli Bank Staff in

196
West Domain of Mazandaran in. Australian Journal of Basic and Applied
Sciences, 5 (8). 682- 687.
Avni Sharma, Roopam Kothari. (2014). Quality of Work Life: A Comparative Study
between Public Sector Banks and Private Sector Banks of Rajasthan Region.
IIS University Journal of Commerce Management, 3(1), 76-90.
Ayesha T. et. al (2011), Quality of Work Life Among Male and Female Employees of
Private Commercial Banks in Bangladesh, International Journal of Economics
and Management, 5(1),266 - 282.
Azril Hayrol, M.SH. et. al. (2010). Can Quality of Work life affect work performance
among government agriculture extension officers? A case from Malaysia.
Journal of Social Sciences, 6(1), 64–73
Baba and Jamal, M. (1991). Reutilization of Job Context and Job Content as Related
to Employee’s Quality of Working Life: a study of psychiatric nurses.
Journal of organizational behavior, 12. 379-386.
Balkrishnan V. (1976). Motivational approach to industrial management. Indian
manager, 7(3), 259-287.
Barkha Gupta. (2016, March). Factor Affecting Quality of Work Life Among Private
Bank Employees. Pacific Business Review International, 8(9).
Barkha Gupta, Dr. Anukool Manisha Hyde. (2013, September). Demographical Study
on Quality of Work life in Nationalised Banks. 17(3), 223-231. Sage
Publication.
Bearfield, S. (2003). Quality of Working Life. Aciirt Working paper 86. University of
Sydney. www.acirrt.com.
Behzad Janmohammadi. (2014). Study Of the Dimensions of Quality of Work Life and
Organizational Productivity of the Staff of Tax Organization of Alborz
Province. Indian Journal of Fundamental and Applied Life Sciences, 5, 297-
308.
Billingsley, B.S. and Cross, L.H. (1992). Predictors of commitment, job satisfaction
and intent to stay in teaching: A comparison of general and special
educators. Journal of special Education, 25 453 – 471.
Bolhari et. al. (2011). The Relationship between Quality of Work Life and
Demographic Characteristics of Information Technology Staffs. International
Conference on Computer Communication and Management Proc .of CSIT, 5,
374-378.
Braun, Jarome S. (1985). American workers and the Quality of Work Life. Paper
presented at the 1985 annual meeting of the Rural Sociological Society.
Beukema, L. (1987). Kwaliteit Van De Arbeidstijdverkorting [Quality of reduction of
working hours]. Groningen: Karstapel. In: Suzanne, E. J. Arts, Ada Kerkstra,
Jouke Van Der Zee, and Huda Huyer Abu Saad, (eds.) (2001). Quality of
Working Life and Workload in Home Help Services: A Review of the

197
Literature and a Proposal for a Research Model. Scandinavian Journal of
Caring Society. 15. 12-24.
Bhandari. (2004). Quality of Life of Urban Working Women. Abhijeet Publication.
292.
Black and Forro.(1999). Humor in the academic library : You must be joking! Or, how
many academic librarians does it take to change a light bulb? College and
Research Libraries 60 (2). 65-72.
Burke, Ronald & Greenglass, Esther. (1999). Work-Family Congruence and Work-
Family Concerns Among Nursing Staff. Canadian journal of nursing
leadership. 12. 21-9.
Castello, J.M. and Sang, I.M. (1974). Need fulfilment and job satisfaction of
professionals. Public Personnel Management, 3(5), 454-461.
Celia and Karthick (2012, February). A Study on Quality of Work Life in The IT Sector,
Journal of Sri Krishna Research & Education Consortium, Asia Pacific Journal
of Research in Business Management, APJRBM: Vol.3(2). 27-35.
Chakraborty, S.K. (1986). The will-to-yoga; key to better Quality of Work Life.
Vikalpa,, 11(2), 114-124.
Chan and Wyatt. (2007 , October). Quality of Work Life: A Study of Employees in
Shanghai, China. Asia Pacific Business Review, 13(4), 501-517 .
Chandranshu Sinha. (2012, February). FACTORS AFFECTING QUALITY OF WORK LIFE:
Empirical Evidence From Indian Organizations. Australian Journal of Business
and Management Research, 1(11), 31-40.
Charu Datta , Jeet Singh. (2015). A Comparative Study of Job Satisfaction of Private
and Public Banking Sector of Delhi and Noida. Asian Journal of Management
Research, 6(1).
Chaturvedi Vijit. (2010). A Study on Factors Affecting Job Satisfaction of Employees
in Hotel Industry: A Study with Reference to few Categorized Hotels in NCR.
Summer Intership Society, 2(1), 40-51.
Chaudhry, A. (1990). A study of relationship between job satisfaction and role stress
of bank officers Unpublished M.A. Dissertation. Department of Psychology.
University of Rajasthan. Jaipur.
Chen Huang, Chia (2005). The effect of Quality of Work Life on organizational
commitment. Human resource management.
Chinomona et al. (2013). influence of Quality of Work Life on Employee Job
Satisfaction, Job Commitment and Tenure Intention in the Small and
Medium Enterprise Sector. South African Journal of Economic and
Management Sciences (SAJEMS), 16(4), 363-378.
Choudrhari, K. K. (2004, Oct-Dec). In Search of Quality of Work Life. Personnel Today,
25(3).
198
Cohen and Rosenthal. (1980). Should Union Participate in Quality of Work Life
Activities. The Quality of Work Life- the Canadian Scene, Vol. 1(4). 7-12.
Cooke and Rousseau. (1984). Stress and strain from family roles and work – role
expectation. Journal of Applied Psychology, 69. 252-260.
Cox, C.J. and Cooper, C.L. . (1989). The making of the British CEO: Childhood work
experience, personality and management style. Academy of Management
Executive 3, 241 – 245.
Daljeet Kaur. (2010, August ). Quality of Work Life in ICICI Bank Ltd. Chandigarh
International Research Journal, 1(11).
Das Jagabandhu and Santosh Kumar Tripathy. (2011, July - December). Quality of
Work Life- A Study of Municipal Employees in Odisha. Training and
Development Journal, 2(2), 88-96.
Debasish Sur, Susanta Mitra And Kaushik Chakraborty. ( 2012, April-June). Work Life
Balance: A Study of the Perceptions of College Teachers. The Indian Journal
of Commerce, 65(2).
Delamotte, Y. & Walker, K. F. (1974). Humanization of Work and the Quality of
Working Life - Trends and Issues. International Institute of Labour Studies
Bulletin, 11, 3-14.
Dhillon, P.K. and Dondona, N. . (1988). Quality of work life and job involvement – a
comparative study of managers of public and private Banks. Paper presented
at 25th Annual conference of Indian Academy of Applied Psychology,
Hyderabad.
Divya Negi, Seema Singh. (2012, June). Work Life Balance for Banking Employees: A
Comparative Study. International Journal of Research in Commerce, Economics and
Management, 2(6).
Donaldson, Stewart I.; Susman, Steve; Dent, Clyde W., Severe, Hervert et al. (1999).
Health behaviour, quality of working life -nd organizational effectiveness in
Umber Industr. Health Education and Behaviour, 26(4), 579-91.
Edwards, J.R. and Rothbard, N.P. (2000). Mechanism linking work and family:
classifying the relationship between work and family constructs, Academy of
Management Journal, Vol. 25.178-199.
Farjad et al. (2013). Study Of Relationship Of Quality Of Work Life (Qwl) And
Organizational Commitment. Interdisciplinary Journal of Contemporary
Research In Business, 4(9), 449-456.
Fiedler, F.E., Polter, E.H., Mitchell, M.Z., and William, A.P.I.R. (1979). Occupational
stress and the use and misuse of managerial intelligence and experience.
64(6), 635-4.
Galinsky, E. and Stern, P.J. (1990). The impact of Human Resource Policies on
Employees: Balancing work/family life. Journal of Family Issues, II(4), 368-83.

199
Gallie & Duncan. (2013). Direct participation and the quality of work. Human
Relations, 66(4), 453-473.
Ganapathi R. and Padma Bhaskar. (2011, Oct - Dec). Quality of Work Life among the
Employees of Public Sector Banks in Coimbatore City. GITAM Journal of
Management, 9(4), 83-98.
Gaurav Deep Rai. (2015). An Empirical Study of Banker's Perception towards their
Quality of Work Life. International Journal of Advanced Research in Management
and Social Service, 04(06).
Geetha V. et.al. (2010, June). Impact of Job Satisfaction on Quality of Work Life
among The IT Employees. 2(1), 272-33.
Ghalwat Suman and Promila Dahiya. (2010, May-October). Work –Life Balance and
Organization Practices- A Study of Selected Banks in Sirsa. KAIM Journal of
Management and Research, 3(1), 94-101.
Graham, Gregory J. (1985). When Unionists Support QWL. Paper presented at the
1985 annual meeting of the Rural Sociological Society.
Greenhaus, et al. (2003 ). The Relation between Work–family Balance and Quality of
Life. Journal of Vocational Behavior , 63, 510–531.
Guna Seelan R. and Maimunah Ismail. ( 2008, November). Constructs of Quality of
Work Life: A Perspective of Information and Technology Professionals.
European Journal of Social Sciences, 7(1), 58-70.
Gupta Meenakshi Dr. and Ms. Parul Sharma. (2011). Factors Credentials Boosting
Quality of Work Life of BSNL Employees in Jammu Region. APJRBM, 2(1), 79-
89.
Ha Que A. B. M. Z. (1992). Perceived Quality of Working Life and Job Satisfaction of
Industrial Workers in relation to Certain Demographic Variables. Bangladesh
Journal of Psychology, 13.
Hetanshi Vakta. (2014). An Empirical Study on Work Life Balance and Quality of Life
of Working Women in Public and Private Sector. International Proceedings
of Economics Development and Research (IPEDR), 78(13).
Himesh Sharma, Karminder Shuman and S.N Ghosh. (2016, March ). Quality of Work
Life in Indian Banking Industry: A Cross section Analysis of constituent
dimensions. The catalyst – Journal of Management, 1(1).
Hunjara Imran Ahmed. (2010, Aug ). Factors Affecting Job Satisfaction of Employees
in Pakistani Banking Sector. African Journal of Business Management, 4(10),
2157-2163.
Hussain M. M. (1999, January). Quality of Working Life and Job Satisfaction of
Govnment Hospital Nurses in Bangladesh. Industrial Journal of Industrial
Relations, 34(3).
Indumathy G.S. and R. Thamil Selvan. (2013). A Perception On Quality of Work Life
Among Male and Female Employees in the Information Technology.

200
IMPACT: International Journal of Research in Engineering & Technology,
1(7), 31-36.
Ismail, et al. (2008). Relationship between work-family conflict and Quality of Life:
An investigation into the role of social support. Journal of Managerial
Psychology, 25(1), 58-81.
Jagabandhu Das and Santosh Kumar Tripathy (2011). Quality of Work Life - A Study
of Municipal Employees in Odisha, journal of Training and Development, 2(2)
July-December 2011, 88-96.
Jagdish (1983). An investigation into the relationship of perceived occupational
stress with job satisfaction and mental health of first level of supervisors.
Unpublished Ph.D. thesis. Banaras Hindu University. Varanasi.
Jamshed et.al. (2011). Occupational stress and burnout in Pakistan’s banking sector.
African Journal of Business Management, 5(3), 810-817.
Jyoti Bahl. (2013, Feb). Quality of Work LIfe A Tool Enhance Confidence among
Employees. Indian Journal of Research in Commerce, IT and Management,
3(2), 124-127.
K. Buvneshwari. (2011, November ). Quality of Work Life in Banks A Micro Level
Comparative Analysis. Indian Journal of Commerce and Management
Studies, Educational Research Multimedia & Publications,India, 2(7), 34-39.
Kadumbri Kriti Randev, Tanuj Nandan. (2017, Jan). Quality of Work Life Indicators for
sustainable Development in the Indian Banking Sector. International Journal
of Management and Applied Science, 3(1), 6-10.
Kanagalakshmi L. and Nirmala B Devei. (2003). A Study on Perception of Quality of
Work Life among Textile Manufacturing Workers in Tirunelveli. Retrieved
from http:www.123oye.com/job-articles/others/quality-work-life.htm.
Karrir N., and Khurana A. (1996). Quality of work life of managers in Indian industry.
Journal of the Indian Academy of Applied Psychology, 22(12),19-26.
Keng-Boon Ooia, et al. (2013). Does TQM improve employees Quality of Work Life?
Empirical evidence from Malaysia’s manufacturing firms. Production
Planning & Control, 24(1), 72-89.
Kershaw C.(1994). Teacher’s perception about their quality of school life. Paper
Presented at the annual meeting of the Mid-south Educational Research
Association, New Orleans, LA.
Khusbhu Doshi. (2014, May). A Comparative Study on Quality of Work Life Balance
and its Impact on Job Satusfaction of Private Bank Employees with Special
Reference to ICICI and HDFC Banks in Rajkot. International Journal of
Research in Management, 3(4).
Kleinfeld Judith et.al. (1986). The Satisfaction of Alaska’s Isolated Rural Teachers
With Their Work Life. Research in Rural Education, 3(3), 117-120.

201
kongkiti phusavat. (2001). Productivity Management in an Organization
Measurement and Analysis.ToKnowPress.
Kornbluh, H.Y. (1984). Workplace democracy and Quality of Working Life: Problems
and prospects. The analysis of the American Academy of Political and Social
Science, 47(3), 88-95.
kothapalle Inthiyaz. (2017, March-April). A Study on Quality of Work Life of
Employees in Andhra Pragathi Grameena Bank with Special Reference to
Y.S.R District. International Journal of Engineering and Management
Research, 7(2), 459-466.
Kotzé, M. (2005). The nature and development of the construct. Quality of work life.
ActaAcademica, 37(2), 96–122.
Kumar, P. and Bahra, G. (1979). Job satisfaction and perceived organizational
climate. The Indian Journal of Social Work, 40(1), 23-26.
K.V.S. Rajeswara Rao and B. Bakkappa. (2009). Modelling Approach to the Analysis
of the Influence of Human Resource Practices on Quality of Work Life in Call
Centre Industries using Optimization techniques. JK Journal of Management
& Technology, 1(1), 77-88.
Lalita Kumari. (2013, May ). Bank’s Employees’ perception about Quality of Work
Life and its impart in Job Behaviour in District Ludhiana. Indian Journal of
Commerce and Management Studies, 4(2).
Lau, R.S.M.and May, Bruce E. . (1998). A win-win paradigm for quality of work life
and business performance. Human Resource Development, 211-266.
M. Thamizhselvi. (2020, March ). Gender difference and its impact on QWL (A study
on banking sector, Banglore). TRANS Asian Journal of Marketing &
Management Research (TAJMMR), 9(2). 4-12.
Madhu A.,. (2015, October). A Comparative Analysis on Quality of Work Life of
Employees in Private Sector Banks and Public Sector Banks in Tirunelveli.
Manonmaniam Sundaranar University, 50-52.
Mafini, et al. (2014). The relationship between extrinsic motivation, job satisfaction
and life satisfaction amongst employees in a public organisation. South
African Journal of Industrial Psychology, 40(1), 1-13.
Malone, et al. (2013). Work-Life Balance and Organizational Commitment of Women
in the U.S. Construction Industry. Journal of Professional Issues in
Engineering Education & Practice, 139(2), 87-98.
Manoochehr, Ataei. (2013). The relationship between the quality of work life and
organizational commitment of the employees of Darab cement company:
Case study In Iran. International Journal of Economics, Business and Finance,
1(7), 154-164.

202
Meenakshi Gupta and Vikas Sharma. (2009). Quality of Work Life - A Study of Bank
Employees in Jammu Region. AJBMR, 4(2), 1-8.
Mehrotra and Khandelwal. (2015, April). Association of Demographic Variables
(Gender and Salary) On Quality of Work Life of Teaching Employees in
Private Technical Institutions in Bareilly Region. International Journal of
Education and Science Research Revie, 2(2). 1-6.
Michailidis & Georgiou et. al. (2005). Employee Occupational Stress in Banking.
Work, University of Nicosia Research Portal, 24(2), 123-137.
Mishra, P.C. (1994). Occupational stress, ego strength and job satisfaction related to
the job involvement of first line industrial supervisors. Unpublished doctoral
dissertation. Department of Psychology, Banaras Hindu University, Varanasi.
Mohd Abass Bhat (2013, January). Occupational Stress Among Bank Employees: An
Empirical Study, International Journal of Scientific Research, 2(1), 169-170.
Motowidlo, S.J., Packard, J.S. and Manning, M.R. (n.d.). Occupational stress: It
causes and consequences for Job performance. Journal of Applied
Psychology, 71, 618 – 629.
Narayana R. and Dr. M. Syed Zafar (2011). Factors Influencing Job Satisfaction
among Young Software Professionals in India. International Journal of
Business Economics and Management Research, 2(5), 32-42.
Nithin Venugopal & Sreela Krishnan. (2018, March ). Quality Of Work Life In Private
Sector Bank With Special Reference To Dhanlaxmi Bank. Journal of Advance
Management Research, 6(3).
Nitish, R.D. (n.d.). Quality of Work Life and QWL: Towards an Appreciation.
Productivity, XXV(2), 129-141.
Ojedokun, et al. (n.d.). Journal of Psychology in Africa (Routledge), 25(3), 235-241.
Oluyinka, et al. (2015). Perceived external prestige as a mediator between quality of
work life and organisational commitment of public sector employees in
Ghana. SA Journal of Industrial Psychology/ SA Tydskrif vir Bedryfsielkunde,
41(1), 1-10.
P.S. Vijaylakshmi and M. Anusuya. (2015, March ). A Study on Quality of Work Life
among Employees of Public Sector Banks In Tiruchirappalli District. Journal
of Exclusive Management Science, 4(3).
Prema Manoharam. (2011, December). Quality of Work Life among Bank
professionals: A Study undertaken at Indian Bank, Chennai. International
Journal of Research in Commerce Economics and Management, 1(8).
R. Ganapathi and Padma Bhaskar (2011). Quality of Work Life among the employees
of Public Sector Banks in Coimbatore City. Gitam Journal of Management
9(4), 83-98.
203
R. Indumathy. & Kamalraj. S. (2011). A Study on Quality of Work Life among Workers
with Special Reference to Textile Industry in Tirupur District- A Textile Hub.
ZENITH. International Journal of Multidisciplinary Research, 2(4), 265-279.
Rama Joshi. (2007, January). Quality of Work Life of Women Workers: Role of Trade
Unions. Indian Journal of Industrial Relations, 42(3), 355-382.
Rajeswara Rao, K.V.S and Bakkappa, B. (2009). Modeling Approach to the analysis of
the Influence of Human Resource Practices on Quality of Work Life in Call
Center Industries using Optimization techniques. JK Journal of Management
& Technology, 1(1), 34-54.
Rajeev Mehrotra and Vinay Khandelwal (2015). Association of Demographic
Variables (Gender and Salary) On Quality of Work Life of Teaching
Employees in Private Technical Institutions in Bareilly Region, International
Journal of Education and Science Research Review,2(2)
Reddy, V.S. and Ramamurthy, P.V. (1991). The relation between stress experience
on the job age, personality and general ability. Psychological Studies, 36(2),
87-95.
Rekha Menon; V. P. Sukumaran. (2016, Octomber). Quality of Work Life of Women
Bankers: The Need of the Hour. International Journal of Human Resource
Management and Research, 06(05), 1-4.
Rhinehard, B. and Dewolf. (1969). Comparative study of need satisfaction in
Government and Business hierarchies. Journal of Applied Psychology, 5(3),
230-235.
Rice, R.W. (1984). Organizational work and the overall quality of life. Applied Social
Psychology, 5, 155-178.
Rice, R.W. (1985). Organizational work and the perceived quality of life toward a
conceptual model. Academy of Management Review, 10(2), 296-310.
Richard, I., Thackray, Ph.D. (1981, April). The stress of Boredom and Monotony: A
consideration of evidence. Psychosomatic Medicine, 43(2).
Riyaz Raiaye. (2005, October-December). Quality of Work life in Banks: A Micro-level
Comparative Analysis. The Indian Journal of Commerce, 58(4), 113-121.
Roland K Yeo and Jesica Li. (2011, June). Working out the Quality of Work Life: A
career development perspective with insights for human resource
management. Human Resource Management International Digest, 19(3), 39-
45.
Rose. et. al. (2006).Quality of Work Life: Implications of career dimensions, Journal
of Social Sciences, 2(2), April.
Runci, J.F. (1980). Dynamic systems and the Quality of work life. Personnel, 57(6),
13-24.

204
S. Khodadadi et al. (2014). Investigating the QWL dimensions effect on the
employees’ job satisfaction. Applied Mathematics in Engineering,
Management and Technology, 2(1).
S. Naganandini, et al. (2017, April). A study on Quality of Work Life Feeling of
Woman Employees in Private Banks in Coimabatore District. International
Journal in Management and Social Science, 05(04).
S. Raju, Jasmine Sugirthabai R. Jackson. (2017). An Empirical Study towards Work life
Balance among Bank Employees in Madhurai Region. International Journal
of Economics & financial Research & applications, 1(1).
Sajjad and Abbasi. (2014, February). Studying the Relationship between Quality of
work life and Organizational Commitment. Research Journal of Recent
Sciences, 3(2), 92-99.
Samdani and Deshmukh. (2014). Occupational Stress and Quality of Work Life: A
Review of Literature. Pezzottaite Journals, 3(4).
Sandhu Namarata and Rahul Prabhakar. (2012). Factors Influencing the Quality of
Work Life in Indian Banking Industry- An Empirical Study. IPEDR, 55(23), 115-
119.
Sandrick K. Putting the emphasis on employees. Trustee 2003;56(1):6-10, 1.
Sankpal, Shilpa, Negi Pushpa, and Vashishtha, Jeetendra (2010). Organizational Role
Stress of Employees: Public Vs Private Banks. Vidwat Journal, 3(1), 4-16.
Sanyal, A. and Singh, B.R. (1982, November). Improving the Quality of Working life”.
Lok Udyog, 27-35.
Sarwar, et al. (2013). Determining the impact of age and LOS on job satisfaction: a
case study of Pakistan automotive industry. International Journal of Human
Resource Management, 24(2), 415-435.
Sen Gupta (1982): Industrial man in Indian reconsidered, Economic and Political
weekly, 17(22), pp.52-56.
Shahidul Islam, Mainul Islam. (2014, June). A Comparative Study of Job Satisfaction
in Banking (A Case Study of Public and Private Bank Sectors). European
Journal of Business and Management, 6(21), 105-111.
Shibu, N. S. (2011). Job Satisfaction of Faculty Members of Private Engineering
Colleges - In Context of Tamil Nadu, India. Global Journal of Finance and
Management, 3 (1), 1-13.
Shivi Shrivastava. (2019, July ). The Impact of Women Participation on their Quality
of Work Life with Special Reference to select Public Banks. International
Journal of Management, IT & Engineering, 9(7).
Shobha Hangarki. (2014). Quality of Work Life among Employee in Banking Sector : A
Study Undertaken at Nationalised Banks, Hyderabad Karnataka Region.
Research Journal of Humanities and Social Sciences, 5(2).
205
Siegrist, J. and Klein , D. (1990). Occupational stress and cardiovascular reactivity in
blue collour Workers. Work and Stress, 4(4), 295-304.
Singh, A.P. and Natha, K. (1991). Effects of organizational climate role stress and
locus of control on job involvement of banking personnel. Indian Journal of
Industrial Relations, 27(2), 63-75.
Singh, Y.P. (2013). Quality of Work Life and its Impact on Organizational
Performance. Asia Pacific Journal of Management & Entrepreneurship
Research (APJMER), 2(1), 240.
Singhal, S. (1983). Quality of work life : A re-examination of assumptions.
Hyderabad:. National Symposium on quality of working life, 25-26.
Srilatha, P. (1988). Occupational stress at middle management level with respect to
certain organizational and personality correlated in selected public and
private enterprises. Ph.D. thesis, Osmania University, Hyderabad.
Srivastava, A.K. and Krishna, A. (1990). A test of inverted 'U' hypothesis of stress
performance relationship in the industrial context. Psychological Studies,
36(1), 34-48.
Srivastava, S.K. and Pratap, S. (1984). Perception of job satisfaction, organizational
climate. Perspective in psychological Researchers, 7(1), 41-43.
Subramaniam Sairam B. L. (2012). Empirical Study on Factors Influencing on Quality
of Work Life of Commercial Bank Employees. European Journal of Social
Sciences, 28(1), 119-127.
Syed Hussain M.M.E. (2006, June). A study on the Perceived Quality of Work life of
the Employees of Banks in Sivagangai District . Raj Journal of Commerce, 49-
50.
T. Shrinivasan, M Mohamed Ismail. (2016, November). Factor Affecting the the
Quality of work Life in Public and Private Sector Bank Employees in Madurai
District. Asian Pacific Journal of Research in Bussiness Management, 7(11).
T. S. Tomar. (2015, March-April ). Quality of Work Life of Employees working in
Public & Private sector Banks of Uttara khand. online International
interdisciplinary research journal volume, 5(2).
Tabassum, Rahman, and Jahan (2010, December). Quality of Work Life among the
Male and Female Employees of Private Commercial Banks in Bangladesh.
Proceedings of The International Conference on Business Competencies in a
Changing Global Environment, South East University, Dhaka.
Tanushree Bhatnagar & Dr. Harvinder Soni,(2015). Impact Of Quality Of Work Life
On Job Satisfaction Of School Teachers In Udaipur City. Iosr Journal Of
Business And Management, 17(3),10-14.
Triveni S, and Vijayalaxmi A., Amminabhavi A. (2005, July-December). A Study of
Quality of Work Life of Nationalized and Non Nationalized Bank Employees.
Ushus Journal of Business Management, 4(2), 11-17.

206
Uma Sekaran. (1985). The Perceived Quality Of Working Life in banks in major cities
in India, Prajnan,. 14(3), 273-284.
Vachon, MLS (1987). Occupational stress in the care of the critically ill, the dying and
the bereaved. New York: Harper and Row Publisher3(2–3):75–103
Vikram Singh Suresh Choudhary . (2017). A Study on Quality of Work Life Among
Private Sector Banking Employees . Inspira Journal of Commerce, Economics
& Computer Science Volume 03, No. 04, Oct.-Dec, 83-88.
Vloisky, R. P and F. X. Aguilar. (2009, April ). A Model of Employee Satisfaction:
Gender Differences in Cooperative Extension. Journal of Extension, 47(2).
Yaghi & Ihsan. (2014). Quality of Work Life in the Postnationalization of Human
Resources: Empirical Examination of Workforce Emiratization in the United Arab
Emirates. International Journal of Public Administration, 37(4), 224-236.
Wadud, N. (1996). Job Stress and Quality of Working Life among working women.
Bangladesh Psychological Studies, 6. 31-37.

207
Appendix: 1

208
Appendix: 2

209

210
Appendix: 3
Papers Published
1. P.M.Bhende, Y V Reddy, (2019) Quality of Work Life: The need and Relevance
to Organisation. ALFOMINE: Int. Journal (Humanities and Social Science). 6(8).
96-101.
2. Pravin Bhende, Nandakumar Mekoth, Varsha Ingalhalli, Y V Reddy. (2020).
Journal of Human Values Sage Scopus.
Copyright © 2022 FDOKUMEN