Hermawan Kartajaya BANKING COMPETITION IN 2013 IN THE TIME OF REGULATORY TRANSITION

COMPETITION IN THE EUROPEAN BANKING SECTOR
by
Ioannis Samantas
A thesis submitted in partial fulfilment of the requirements for the degree
of Doctor of Philosophy (DPhil)
National and Kapodistrian University of Athens
Department of Economics
2013

ii

I Ioannis Samantas declare that the work presented in this PhD thesis is my own.

ii
Acknowledgments
This thesis is dedicated to Grigoris and Mary, my parents, Kalliopi, my grandmother
and Thanassis, my brother. Had there not been their patience as well as their
emotional and financial support, that thesis would not reach its completion.
I wish to thank my principal supervisor, Prof. Panayotis Alexakis for his
encouragement, guidance and support during my thesis-writing phase. His availability
upon my request for any issues popped up, and sincere interest in my progress are
deeply appreciated. I also owe sincere thanks to the other two members of my thesis
scientific committee, Prof. Yannis Bilias and Prof. Manolis Xanthakis for their
advice.
I also wish to express my gratitude to Bank of Greece and, especially, to Prof. Ioannis
Papadakis, Deputy Governor of Bank of Greece, and Dr. Heather Gibson, Director-
Advisor in the Economic Research department of Bank of Greece, for granting me
with access to bank-specific data of the Bankscope database. Without their assistance,
I could not possibly move on to the econometric analysis of my thesis.
I onw special thanks to the participants of the XXI European Workshop on Efficiency
and Productivity Analysis (EWEPA), the 18th Annual Conference of Multinational
Finance Society, the conference on Advances in Financial and Insurance Risk
Management, the International Conference on Applied Business and Economics and
the 10th Annual Conference of the Hellenic Finance and Accounting Association for
their valuable comments.
Last but not least, I am also indebted to my close friends in Greece and abroad for
being patient and supportive with me, and for making my life emotionally ample and
consistent.

iii
Table of contents
CHAPTER 1 PROLEGOMENA ........................................................................................... 1
1.1. General standpoint .......................................................................................................... 3
1.2. Research questions........................................................................................................... 5
1.3. Contribution of the thesis ................................................................................................ 8
1.4. Structure of the thesis .................................................................................................... 12
CHAPTER 2 COMPETITIVE ISSUES .............................................................................. 17
2.1. Introduction .................................................................................................................... 19
2.2 Institutional perspective .................................................................................................. 20
2.2.1 Efficiency ................................................................................................................... 20
2.2.2 Consolidation .............................................................................................................. 22
2.2.3 Relationship banking .................................................................................................. 24
2.3 Macro finance perspective .............................................................................................. 26
2.3.1 Regulatory developments ........................................................................................... 26
2.3.1.1 International initiatives ....................................................................................... 28
2.3.1.2 Towards a single EU financial market ................................................................ 36
2.3.1.3. Basel III – framework in progress ...................................................................... 42
2.3.1.4. Free banking ....................................................................................................... 46
2.3.2. Integration ................................................................................................................. 47
2.3.3. Financial stability ...................................................................................................... 49
1.4. Conclusion ....................................................................................................................... 52
CHAPTER 3 EMPIRICAL MODELS OF COMPETITION IN THE EUROPEAN
BANKING .............................................................................................................................. 53
3.1. Introduction .................................................................................................................... 55
3.2. Non-formal structural methods ..................................................................................... 55
3.2.1. The Structure – Conduct – Performance (SCP) paradigm - The relative efficiency
(RE) hypothesis ................................................................................................................... 55
3.2.2. Formal structural approaches .................................................................................... 60
3.2.2.1. The HHI in a S – P model ................................................................................... 62
3.2.2.2. The CRk in a S - P model ................................................................................... 65

iv
3.2.3. Concentration ratios................................................................................................... 66
3.2.3.1. The k bank concentration ratio ........................................................................... 68
3.2.3.2. Herfindah - Hirschman Index (HHI) .................................................................. 69
3.2.3.3. The Hall - Tideman Index (HTI) and Rosenbluth Index (RI) .............................. 71
3.2.3.4. The comprehensive industrial concentration measure ....................................... 72
3.2.3.5 The Hannah and Kay index ................................................................................. 73
3.2.3.6. The U index......................................................................................................... 74
3.2.3.7. The Hause indices ............................................................................................... 75
3.2.3.8 Entropy measure .................................................................................................. 77
3.3. Non-structural methods ................................................................................................. 78
3.3.1. The New Empirical Industrial Organisation (NEIO) approach ................................. 78
3.4. Alternative models .......................................................................................................... 83
3.5. Review of empirical analysis .......................................................................................... 91
3.5.1. Panzar – Rosse methodology ..................................................................................... 91
3.5.1.1. Cross-country comparisons ................................................................................ 91
3.5.1.2. Country-specific studies ..................................................................................... 94
3.5.2. Bresnahan-Lau methodology ..................................................................................... 97
3.5.2.1. Cross-country applications................................................................................. 97
3.5.2.2. Country-specific studies ..................................................................................... 97
3.5.3. Lerner index .............................................................................................................. 99
3.6. Conclusion ..................................................................................................................... 100
Chapter 3 Appendix ............................................................................................................ 101
CHAPTER 4 A REVIEW OF EFFICIENCY ANALYSIS ............................................. 111
4.1. Introduction .................................................................................................................. 113
4.2. Definition of bank ......................................................................................................... 113
4.3. Measurement of X – efficiency .................................................................................... 114
4.3.1. Parametric approaches ............................................................................................. 115
4.3.1.1. The Stochastic Frontier Analysis ...................................................................... 115
4.3.1.2. Distribution-free approach ............................................................................... 116
4.3.1.3. Thick frontier approach .................................................................................... 117
4.3.2. Non-parametric approaches ..................................................................................... 120
4.3.2.1. Data Envelopment Analysis .............................................................................. 120
4.3.2.2. The free disposal Hull approach ...................................................................... 122
4.4. Review of empirical applications ................................................................................ 125
4.4.1. International comparisons ....................................................................................... 125
4.4.2. European cross-country comparisons ...................................................................... 129

v
4.4.3. Developed economies .............................................................................................. 133
4.4.4. Transition economies............................................................................................... 137
4.4.5. Country – specific studies ....................................................................................... 141
4.5. Conclusion ..................................................................................................................... 148
Chapter 4 Appendix ............................................................................................................ 149
CHAPTER 5 THE NEXUS BETWEEN BANK COMPETITION AND FINANCIAL
STABILITY ......................................................................................................................... 155
5.1. Introduction .................................................................................................................. 157
5.2. Theory............................................................................................................................ 157
5.3. Empirical review ........................................................................................................... 162
5.4. Conclusion ..................................................................................................................... 167
Chapter appendix..................................................................................................................157
CHAPTER 6 INCOME-SPECIFIC ESTIMATES OF COMPETITION IN EUROPEAN
BANKING ............................................................................................................................ 177
6.1. Introduction .................................................................................................................. 179
6.2. Methodology .................................................................................................................. 180
6.3. Competition determinants ........................................................................................... 183
6.4. Data ................................................................................................................................ 185
6.5. Results............................................................................................................................ 189
6.6. Conclusion ..................................................................................................................... 213
CHAPTER 7 COST AND PROFIT EFFICIENCY IN EUROPEAN BANKING:
COMPARISON OF PARAMETRIC METHODOLOGIES AND CONVERGENCE
DYNAMICS ......................................................................................................................... 217
7.1. Introduction .................................................................................................................. 219
7.2. Methodological issues ................................................................................................... 222
7.3. The model ...................................................................................................................... 225
7.4. Sample - Evidence ........................................................................................................ 228
7.5. Scale economies ............................................................................................................. 240

vi
7.6. Convergence .................................................................................................................. 245
7.7. Other stylized facts ....................................................................................................... 250
7.8. Conclusion ..................................................................................................................... 254
Chapter 7 appendix ............................................................................................................. 256
CHAPTER 8 BANK COMPETITION AND FINANCIAL (IN)STABILITY IN
EUROPE: A SENSITIVITY ANALYSIS ......................................................................... 263
8.1. Introduction .................................................................................................................. 265
8.2. Methodology .................................................................................................................. 266
8.3. The model ...................................................................................................................... 269
8.4. Determinants of stability .............................................................................................. 272
8.4.1. Bank-specific variables ........................................................................................... 272
8.4.2. Macroeconomic variables ........................................................................................ 273
8.4.3. Regulatory environment .......................................................................................... 273
8.5. Data ................................................................................................................................ 275
8.6. Main results ................................................................................................................... 281
8.7. Does the effect of market structure variables alter with the interplay between
regulation and ownership? ................................................................................................. 292
8.8. Are there other governance indicators that enter non-linearly? .............................. 295
8.9. Are the results robust to alternative measures of risk? ............................................ 298
8.10. How market structure variables behave per specialization group? ...................... 303
8.11. Other robustness checks ............................................................................................ 305
8.12. Conclusion ................................................................................................................... 308
Chapter 8 Appendix ............................................................................................................ 311
CHAPTER 9 SYNOPSIS .................................................................................................... 317
9.1. Major findings of the research .................................................................................... 319
9.2. Policy implications of the research ............................................................................. 325
9.3. Limitations of research ................................................................................................ 329
9.4. Suggestions for further research ................................................................................. 331
REFERENCES .................................................................................................................... 333
THESIS APPENDIX ........................................................................................................... 390

vii
List of tables
TABLE 1: NUMBER OF BANKS .............................................................................................................. 186
TABLE 2: SUMMARY STATISTICS OF VARIABLES IN MODEL 6.1 .............................................................. 187
TABLE 3: SUMMARY STATISTICS OF VARIABLES IN MODELS 6.4 AND 6.5 ............................................. 188
TABLE 4: MARGINAL COSTS AND LERNER INDEXES ................................................................................. 190
TABLE 5: REGRESSION OUTPUT (WHOLE SAMPLE) ................................................................................... 191
TABLE 6: REGRESSION OUTPUT PER BANK TYPE ....................................................................................... 196
TABLE 7: SUR FOR COMMERCIAL BANKS ................................................................................................... 200
TABLE 8: SUR FOR COOPERATIVE BANKS .................................................................................................. 204
TABLE 9: SUR FOR SAVINGS BANKS ............................................................................................................. 207
TABLE 10: SUR FOR 'OTHER' BANKS ........................................................................................................... 210
TABLE 11: NUMBER OF BANKS ...................................................................................................................... 229
TABLE 12: COST EFFICIENCY (INTERMEDIATION APPROACH) ............................................................... 231
TABLE 13: COST EFFICIENCY (VALUE-ADDED APPROACH) ..................................................................... 233
TABLE 14: PROFIT EFFICIENCY (INTERMEDIATION APPROACH) ........................................................... 235
TABLE 15: PROFIT EFFICIENCY (VALUE-ADDED APPROACH) ................................................................. 237
TABLE 16: COST/PROFIT EFFICIENCY BY PRODUCTIVE SPECIALISATION AND ASSET CLASS ............ 239
TABLE 17: SCALE ECONOMIES BY COUNTRY .............................................................................................. 241
TABLE 18: SCALE ECONOMIES BY BANK TYPE AND ASSET CLASS .......................................................... 244
TABLE 19: Β-CONVERGENCE AND Σ-CONVERGENCE OF COST EFFICIENCY .......................................... 248
TABLE 20: Β-CONVERGENCE AND Σ-CONVERGENCE OF PROFIT EFFICIENCY ...................................... 249
TABLE 21: DISTRIBUTION OF COST/PROFIT EFFICIENCY ......................................................................... 253
TABLE 22: DESCRITIVE STATISTICS OF KEY VARIABLES ......................................................................... 277
TABLE 23: CORRELATION BETWEEN COUNTRY-LEVEL VARIABLES ...................................................... 280
TABLE 24: REGRESSION OUTPUT OF MODEL 8.1 ........................................................................................ 283
TABLE 25: EXTREME BOUNDS OF MODEL 8.1 ............................................................................................. 286
TABLE 26: REGRESSION OUTPUT OF MODEL 8.2 ........................................................................................ 288
TABLE 27: EXTREME BOUNDS OF MODEL 8.2 ............................................................................................. 291
TABLE 28: SENSITIVITY ANALYSIS OF MODEL 8.7 ..................................................................................... 294
TABLE 29: SENSITIVITY ANALYSIS OF MODEL 8.8 ..................................................................................... 297
TABLE 30: SENSITIVITY ANALYSIS OF MODEL 8.9 ..................................................................................... 299
TABLE 31: SENSITIVITY ANALYSIS WITH ALTERNATIVE MEASURES OF STABILITY ............................ 302
TABLE 32: MODEL 8.1 OUTPUT PER BANK TYPE ........................................................................................ 304
TABLE 33: FURTHER EBA OF MODEL 8.1 ................................................................................................... 306
TABLE 34: FURTHER EBA OF MODEL 8.2 ................................................................................................... 308

viii
Abstract
The aim of the thesis is to investigate the structure of banking sectors in the European
Union during the period 2002-2010. It encompasses the theoretical premises of bank
competition and how it is interrelated to contemporary issues in European banking.
For this purpose, the thesis comprises two parts; the former refers to the literature
review of theoretical and empirical analysis and, the latter, to the econometric
analysis.
The first aspect of this thesis is the measurement of the degree of competition in the
developed sub-group of European Union since the advent of Euro. We, therefore,
estimate the marginal cost out of a translog cost function and then investigate
potential correlates of income-specific estimates of market power for commercial,
cooperative and savings banks as well as other financial institutions.
We next compare parametric methodologies widely employed in the literature in
order to estimate cost and profit efficiency scores of financial institutions. In so doing,
we juxtapose the results from different definitions of bank outputs/inputs, namely the
intermediation and value-added approach. Other section reports time-varying
estimates of scale economies per banking market, bank type and asset class, while the
analysis concludes with the investigation of beta and sigma convergence of cost/profit
efficiency along with equality and other distribution issues.
The final part of the thesis deals with the competition-stability nexus; that is, whether
and to what extent bank competition and concentration drive to systemic stability or
fragility. We conduct sensitivity analysis of the underlying relationship subject to
different informational sets so as to construct the extreme bounds of their beta
coefficients and draw remarks on their statistical and sign persistence. The analysis
allows for non-linearities between competition and controls of regulation, ownership,
various governance indicators for robustness-checking reasons.

CHAPTER 1
Prolegomena

2

3
1.1. General standpoint
The operation of banks in the wake of a single currency system has had a considerable
impetus to the economic growth and financial stability of the European banking
sector. Social welfare is theoretically accomplished by the competitive conduct and
high economic efficiency of profit-maximising financial institutions. All firms and
consumers take advantage of the broad supply of banking services at low prices
within a context of fast-developing financial markets that eventually foster economic
development.
From a policy perspective, there exists a number of banking issues that have
embarked the academic debate and a series of international initiatives in order to
„unfreeze‟ the potential of financial system. To this end, structural reforms have taken
place since the „80s culminating in the advent of Euro and until the onset of current
financial crisis. In particular, banks increased the range of their products in response
to free trade of foreign-owned banks in domestic markets bringing about the
classification of the financial institutions with respect to their productive
specialisation. Hence, high competitive pressures have made banks engage in lower
costs, efficient risk management, new corporate governance structures and alternative
non-traditional income activities.
That dynamic tendency of integration comes under the Financial Service Action Plan,
which seeks to alleviate centrifugal forces that undermine the harmonisation in retail
and wholesale markets; European Commission (2002) identifies heterogeneous
consumer protection schemes, regulation, costly asset allocation and payment in
cross–border banking, among others. The premises of Basel Accord constitute a new
regime that imposes requirements on capital reserves with asymmetric implications on
competition and efficiency. In fact, capital requirements enable banks in the form of
better risk management to price competitively and thereby eschewing from cross-
subsidising practices followed in an unsystematic and unsophisticated way. In
contrast, it might be the case of banks aiming not at market shares but implementing
high prices to preserve their profit margins. Although pillar II sets out some degree of
supervisory discretion, which dismantles a level-playing field for all banking markets,

4
the estimation of capital requirements pertains to a portion of non-banking firms
through standard as well as sophisticated methods of quantifying risk.
The motivation towards greater consolidation is traced to the importance of the
aforementioned techniques. Standard methodology is preferable to smaller sized
banks, as it is less cumbersome and expensive than more advanced techniques, albeit
the estimated capital requirements in the former case constitute a greater burden than
that of the latter. Thus, mergers and acquisitions are motivated by the superior
structure of large banks to afford more expensive but effectively economising capital
reserves.
The ongoing financial crisis since 2008 has rendered the mandate of further reforms,
since in perfect hindsight we are able to cast doubt on traditional tenets in finance. For
example, the risk-free asset allocations on Treasury bills and other bonds turn out to
withhold a considerable risk once the exacerbation of country spreads (due to
speculation in fixed-income markets), institutional shortcomings and investment
shortage have put additional risks on banks‟ solvency. By the time politics and
banking go one step further to restructure the Euro zone, the institutional reform
seems to be advancing previous policies that have already been proved inadequate to
armour financial institutions in times of bank crises. Accordingly, the most
contemporary act of Basel Accord III expected to take place in 2013 builds upon the
premises of previous initiatives to strengthen banks by requiring more fraction of
common equity, Tier 1 capital and additional buffers in periods of high credit growth.
In a nutshell, competition constitutes a multidimensional concept of bank behaviour
and operation in a context of efficiently regulated financial system. If regulatory
initiatives do not effectively account of the importance of shadow banking system
along with financial innovation (derivatives) and off-balance sheet practices, negative
externalities are bound to expose the rickety financial apparatus vis-à-vis potential
shocks.

5
1.2. Research questions
The general purpose of this thesis is to shed some light on banking issues related to
competition. To this end, we assess the level of competition, efficiency and financial
stability and their interconnections amongst them as well as with contemporary
concepts of regulation and supervision, bank-level specificities and other
macroeconomic conditions. We classify the research questions into three groups
according to the three chapters (6, 7, 8) of the empirical part, which are theoretically
and empirically reviewed in chapters 3, 4 and 5. In particular, we provide answers to
the following research questions.
1. What is the level of competition in Europe? Are there any determinants of
competition with respect to specific sources of banking income? What does
the analysis tell us about the pricing conduct of differently specialized
financial institutions?
2. What is the level of cost and profit efficiency in European banking according
to different parametric methodologies and definitions of bank outputs/inputs?
Are relative rankings of banking markets, bank types and asset classes stable
across all specifications? What pattern has the evolution of scale economies
followed since 2003? Do we experience beta and sigma convergence of cost
and profit efficiency even after allowing for dynamic effects?
3. Does market structure variables drive to financial stability and to what extent?
Which are the bounds that their respective coefficients lie within? Is this
tendency persistent and robustly significant? Are there non-linearities among
competition, regulation, ownership and other governance indicators that
determine bank soundness? Are alternative measures of stability explained by
similar model specifications? Which banks are affected the most by market
structure?

6
Research question 1
This question highlights a new endeavour of investigating competitive conditions in
the European banking industry. Since the vast literature of competition modeling has
produced mixed results, the proposed methodology goes one step further De Guevara
et al. (2005), Bolt and Humphrey (2010) and Carbo et al. (2009) in order to produce
income-specific competition indicators providing the intensity of their key effects on
bank competition breaking further down the subsets of bank activities.
We therefore employ the translog cost function of Ariss (2010b) that omits the price
of borrowed funds as input price, since it may capture some degree of monopoly
power of incumbent banks in the deposit markets. Next, we construct Lerner indexes
with respect to total income as well as income on loans, other interest income, fees
and commissions and other non-interest income. As such indexes reflect unobserved
bank pricing on relative products, we employ Seemingly Unrelated Regression (SUR)
framework to run regressions concurrently and account thereby of the within error
correlation across the models.
The sample comprises nine of the most developed banking markets in the European
region during the period 2002-2010. In so doing, we draw remarks over the
explanatory power of traditional collusion, relative market power, efficiency and other
key controls on bank pricing conduct.
Research question 2
We aim to shed light on the comparison of different parametric methodologies in
measuring cost and profit efficiency in European banking. We therefore employ
REM, DEA their truncated versions at 1%, 5% and 10% of each distribution tail,
along with the TFA producing averaged efficiency scores at the bank level and its
time-varying specification. The analysis follows alternative definitions of bank
inputs/outputs, which seem to be widely applied in the literature, namely under the
intermediation and value-added approach. We report time-varying country averages to
conclude on relative rankings and their persistence across different specifications. We
next estimate economies of scale to see whether and to what extent they are evolving
through time per banking market, bank type and asset size class.

7
We also employ OLS and ADL specifications to verify the significance of „catching-
up effect‟ and dispersion of cost and profit efficiency according to IA and VA
approaches. We conclude on how the efficiency distribution shifted in terms of
skewness and kurtosis from 2003 to 2008, apart from the mean and standard deviation
of EU-15 and EU-12 European regions. We also observe whether the evolution of
cost and profit efficiency scores make banks more equal in the distribution of the
employed European sample.
Research question 3
We attempt to address the question of causality of bank soundness from market
structure variables in a sample of banks headquartering within the enlarged European
Union for the period 2002-2008. We utilize concentration and competition in a
sensitivity analysis that determine bank risk subject to different information sets of
regulatory, macroeconomic and bank specific factors. Due to our heterogeneous
sample, we employ Random Effects (RE) methodology to the baseline models that
allow for (non-) linearities between regulatory/supervisory factors and bank
competition. Thus, we implement extreme bound analysis of the values that the
Lerner and Herfindahl indexes can take across all the possible combinations of key
deterministic factors. Furthermore, we implement ad hoc regressions employing the
quadratic term of competition to verify whether it is the case of U-shaped relationship.
We also extend the analysis allowing for non-linear relationships between regulatory
and foreign ownership variables to see if market structure variables lie in the
estimated bounds. As a next step, interactions of competition and governance
indicators retrieved from the World Bank come into play for more robust results. And
last, we decompose the explanatory power of independent variables on alternative
measures of financial stability and systemic risk.
Last section of chapter 8 replicates the analysis for commercial, cooperative, savings
and „other‟ banks of the sample and provides support to the model fit that is
representatively attributed to certain bank specialisation groups.

8
1.3. Contribution of the thesis
The thesis pertains to the field of studying the level of bank-level competition and its
potential correlates in European banking. It investigates sample of 9 out of the most
developed banking markets since the advent of Euro whereas other papers deal with
the previous decade since the first years of Euro zone. Hence, it might be the case of
structural break around the year 2002 and even if it is econometrically feasible to
account of such institutional events, it does not make sense when comparing periods
before and after 2002, and from a policy perspective to verify how competition
evolves within the Euro system in conjunction with other competitive issues.
The per se fact that there is no extensive literature for the period 2002-2010 over a
heterogeneous European sample is attributed to the fact that Bankscope database has
no available data for European countries especially after 2005. Our attempt is to adapt
the methodology of cost and profit function to include the most available variables not
at the expense of model fit. We rely on the work of Ariss (2010b), who omits the
price of borrowed funds as input price in a version of the cost function as it could
capture some degree of monopoly power of large banks in the deposit markets. That
enables us to come up with competition-adjusted measures of marginal cost that is
subsequently employed to measure competition at the bank level (Lerner index).
Paper 1 updates the analysis of De Guevara et al. (2005) adding some other potential
correlates of competition, like credit risk, income diversification, equity capital,
liquidity, efficacy of regulatory laws and cyclicality with respect to price and
population effects. What seems totally new to the empirical literature is the estimation
of income-specific estimates of market power although it has no merit of cross-
country comparison. Our aim is to investigate how the aforementioned effects
determine simultaneously the pricing behaviour of certain banking products and to
what extent. In so doing, we replicate the analysis for every productive specialisation
group across different specifications allowing for sample asymmetries and
unobserved bank specificities. Thus, it is the first time that we can explain, at least
partially, differences on relative market power at the income level although the
mechanisms lying underneath are not a priori known.

9
Paper 2 contributes more on the literature that studies cross-country comparison of
efficiency in the European region, with a particular focus on various parametric
approaches. Non-parametric methodologies have produced quite divergent results and
given that data shortage brings about bias in the analysis, we opt to report even more
detailed evidence with truncated versions of random effects methodology (REM),
distribution free approach (DFA) and thich frontier approach (TFA). The problematic
application of SFA, failing to accomplish curvature conditions in the maximum
likelihood technique, advocates to our employed methoology.
We also extend the literature that applies both profit and cost functions and compares
the results across various regions or countries. The underlying juxtaposition of
efficiency scores is facilitated by the employment of different definitions of bank
outputs, which is addressed scarcely in a handful of studies. Scale economies come
out of the employed cost models and draw remarks on their evolution since 2002; in
contrast, almost all relevant studies seem outdated published before 2003 and
generally in the „90s. Last, convergence analysis for bank efficiency is a new area of
research and our application aims at contributing to this accumulating knowledge.
Paper 3 contributes to the literature by extending the limited number of studies
investigating the competition-stability nexus over a European sample rather than on
specific countries or sub-regions. We also provide support of the U-shaped
relationship between competition and bank soundness, as proposed by Martinez-
Miera and Repullo (2010), on top of the applications of Berger et al. (2009) and Beck
et al. (2012).
By means of extreme bound analysis, which has not been applied in the banking
literature so far, we observe how the effects of competition and concentration take
shape along with different informational sets and specifications. The latter consists in
regulation and supervision variables, governance indicators and ideas about non-linear
effects of competition and bank ownership, among others. We, thus, produce various
robustness checks coming up with remarks on collateral banking issues.
The findings of the above research are presented on the synopsis chapter and mainly
refer to the significant:

10
1) negative relationship between asset size and market power in cooperative,
savings and „other‟ banks. In more detail, higher size drives to low prices on
loans (cooperative, „other‟ banks), other interest products (commercial,
cooperative banks) and other non-interest bearing activities (commercial,
cooperative, „other‟ banks); however, higher scale operation comes in line with
higher (lower) fees in cooperative (savings and „other‟) banks. Non-linearities
imply positive bearing of size on market power switching to negative in savings
and „other‟ banks (of higher levels of total assets). We also see this inverse U-
shaped (positive-negative) pattern in loans (commercial, cooperative, „other‟
banks), fees and commissions (cooperative, savings, „other‟ banks) and other
interest income (savings banks) whereas a U-shaped (negative-positive) path is
traced in loans of savings banks, other interest-bearing activities in „other‟ banks
and other non-interest products in commercial, cooperative and „other‟ banks.
2) SCP doctrine with the persistent effect of market concentration on banks‟
monopolistic pricing (especially in the case of savings banks). In particular,
commercial (savings) banks seem to enjoy higher fees (other interest income)
whereas cooperative banks exploit collusion in the deposits (loans) market
through lower (higher) loan rates. „Other‟ banks respond to the monopolistic
structure of deposit markets through competitive loan rates and high prices on
other interest activities.
3) relative market power in „other‟ banks and cooperative banks of relatively large
market share. Higher market share is associated with lower fees (in commercial
and cooperative banks), other interest charges (in cooperative and savings banks)
and other non-interest rates (savings banks) while „other‟ banks tend to compete
in loans and other non-interest products and act monopolistically for the
remainder. Higher shares in the deposit markets induce banks to compete each
other for loan rates and „other‟ banks to charge higher fees. In contrast, higher
loan prices (of commercial and cooperative banks) and lower fees (for
commercial and cooperative banks) are evident once share is considerable in
loans markets.
4) relative efficiency hypothesis, according to which lower costs enable banks to
impose low prices on their products systematically across all specifications.

11
5) differences in cost and profit efficiency across various parametric methodologies
and definitions of bank outputs. However, they converge in levels if we assess
their truncated levels (TFA though is much lower due to negative efficiency
scores) and seem to produce almost identical country rankings.
6) discrepancies in yearly scale economies with the intermediation approach
demonstrating diminishing pattern from diseconomies of scale whereas the
production approach comes from below unity towards their full exploitation.
7) catching-up effect and converging dispersion of cost and profit efficiency insofar
as dynamic effects are employed. Above unity coefficient (in cost efficiency
under VA) has no economic sense due to the oscillation of negative values to
positive and back, albeit the lagged dependent variable operates in a
counterbalancing manner.
8) inequality amongst the cost efficiency scores within their frequency distribution,
while IA (VA) approach shows increasing (decreasing) path until 2006 and
exacerbates (ameliorates) thereafter.
9) fragile relationship between market power and systemic stability even after
accounting for interaction terms with country-specific factors of regulation,
supervision and macroeconomic conditions.
10) U-shaped relationship between competition and stability since the quadratic term
appears significant in the extreme bounds of the Lerner and Herfindahl-
Hirschman index. The devastating turn of market power effect coming at the
expense of stability lie at the point of 28.5%.
11) positive - albeit of marginal fragility in persistence - impact of concentration on
bank soundness and even higher slopes in markets of monopolistic conduct.
12) positive association of stability with capital regulation and market discipline as
well as negative one with low activity restrictions, supervisory intervention and
foreign ownership especially in cases of well-developed governance.
13) risk-taking tendency in markets with high degree of foreign ownership if coupled
with official intervention, considerable capital regulation, granted market entry
applications and information requirements.

12
1.4. Structure of the thesis
To fulfil the aim of providing answers to the aforementioned research questions, the
structure of my thesis takes the following form:
Chapter 2 refers to contemporary banking issues that are closely related to bank
competition. In fact, by „competition‟ we do not imply several models that have been
proposed in the literature for the measurement of its level, but particularly delineate
policy-relevant concepts in an institutional and macro finance perspective. The former
comprises efficiency (section 2.2.1), - some of its standard constituents, namely X-
efficiency, allocative efficiency, economies of scale and scope, synergies and
technological change -consolidation (section 2.2.2) - expressed by means of mergers
and acquisitions, the motivation behind such practices and cross-border activity – and
relationship banking (section 2.2.3) along with its definition, motivation, benefits and
primary costs.
On the other hand, the latter points out the importance of macroprudential regulation
(section 2.3.1) and the evolution of international initiatives (Basel I, II, III) since the
„80s. Integration (section 2.3.2) follows, which is literally a broader concept that
consolidation since it is also expressed by the organic growth of branches and
subsidiaries and the cross-border provision of financial services. Last, we investigate
the theoretical underpinnings of financial stability (section 2.3.3) and the implications
of potential empirical evidence on bank competitiveness. Section 2.4 summarizes the
analysis on competitive issues.
Chapter 3 deals with the empirical models of competition proposed in the literature
and the applications based upon their premises. It covers the structural approach that
engulfs the whole range of concentration ratios and their empirical importance on
bank performance. That link is firmly grounded on the Relative efficiency (RE) and
Structure-Conduct-Performance (SCP) paradigms (section 3.2) and the empirical
models implemented in the literature to verify their significance.
The New Empirical Industrial Organisation (NEIO) approach (section 3.3) is then
analysed as the alternative empirical literature, which defines market competition in
terms of the pricing conduct of banks. We therefore adduce the non-structural

13
methods of Iwata (1974), Bresnahan (1982), Lau (1982) and Panzar and Rosse
(1987), coupled with the notion of contestability, the practice of incumbent banks to
impose competitive prices in fear of policies against abnormal profits through „hit-
and-run‟ market entries.
We last report some alternative models (section 3.4) that propose a non-systematic
methodology of measuring competition intensity. In particular, some examples are the
generalized linear pricing model of Hefernan (2002), the so-called Boone indicator of
Leuvensteijn et al. (2011), the error-specification model of Carbo et al. (2009), the
empirical model of Delis and Tsionas (2009) that simultaneously estimate market
power and operating efficiency, and the attempt of Bolt and Humphrey (2010) to
measure competition efficiency along the lines of efficiency-related standard
methodology (DFA). Section 3.5 sums up the theoretical and empirical review on
competition.
Chapter 4 lays down alternative definitions of bank output/inputs (section 4.2),
namely the production and intermediation approach (among others), before it comes
to the measurement of X-efficiency based on various parametric (section 4.3.1) and
non-parametric approaches (section 4.3.2). The former comprises the Stochastic
Frontier Analysis (SFA) of Aigner et al. (1977) and Meeusen and Van de Broeck
(1977), the Distribution-free approach of Bauer et al. (1992) and the Thick frontier
approach of Berger and Humphrey (1991). On the other hand, the latter includes the
linear programming method of Data Envelope Analysis (DEA) first proposed by
Charnes et al. (1978) and the free disposal Hull approach (FDH) of Deprins et al.
(1984).
Section 4.4 presents a thorough review of empirical applications conducting
international comparisons of efficiency estimates, European cross-country
comparisons, developed economies, transition economies and country-specific
studies. Conclusion is offered in the last section (section 4.5).
Chapter 5 makes reference to the relationship between bank competition and
financial stability. In other words, there are two strands of the literature (section 5.3)
that endorse whether competitive conduct of banks is a conducive channel-through of
systemic risk in international and European samples. On the one hand, we report the
so-called „franchise (charter) value‟ paradigm of Keeley (1990), which appears to

14
trace in a competitive market banks eager to recoup their squeezed profit margins by
engaging in risky projects. On the other hand, Stiglitz and Weiss (1981) put ‟blame‟
on incumbent banks for imposing high prices and exacerbating thereby their risk
profile due to potential defaults. Along the lines of both theories, we review the whole
argumentation stemming from theoretical papers to establish the underlying
relationship (section 5.2).
We also document the proposition of Martinez-Miera and Repullo (2010), who concur
that the two contending theories need not be mutually exclusive as a U-shaped
relationship may unify them if occurring at markets of different bank competition.
Section 5.3 offers some concluding remarks.
Chapter 6 initiates the empirical analysis of the thesis investigating the intensity of
competitive conditions in nine of the most developed European banking industries.
Section 6.2 refers to the methodology followed with respect to the translog cost
function in order to estimate the marginal cost. We then end up with estimates of
competition through the Lerner index referring to the overall banking income and to
its decomposition into loans, other interest income, fees and commission and other
non-interest operating income. We also propose a model of potential correlates of
market power for commercial, cooperative, savings and „other‟ banks as well as to the
whole sample.
The analysis in section 6.3 makes a brief description of competition determinants that
proxy for bank-specific, industry-specific and macroeconomic variables along with
time and country fixed effects. In section 6.4 we delineate descriptive statistics of the
employed variables and the way each banking market represents the sample
represents over the whole period. Section 6.5 shows the results of empirical modeling
the (income-specific) estimates of competition, and section 6.6 summarizes the
analysis.
Chapter 7 documents some methodological issues (section 7.2) regarding alternative
definitions of bank outputs/inputs, specifications of the cost function and the reasons
beneath our decision to apply specific methodologies. Section 7.3 presents the
employed model the results from the comparison of various parametric methodologies
(REM, DFA, TFA) that estimate cost and profit efficiency scores under alternative
definitions of bank outputs/inputs. We come up with relative rankings of country
15
rankings as well as rankings of different productive specialisations and asset size
classes. We next measure economies of scale (section 7.4) through the partial
derivative of total costs with respect to total assets and observe how they have
evolved since 2003 under both IA and VA approaches.
Section 7.5 investigates the beta and sigma convergence dynamics of cost and profit
efficiency scores. We apply the models for all cases along the lines of standard linear
modeling and dynamic specifications. Last, section 7.6 draws remarks on the
evidence.
Chapter 8 shows a sensitivity analysis of the causal effect of market structure
variables, namely concentration and market power, on bank soundness. In so doing, in
section 8.2 we present the methodology of extreme bound analysis as set out by
Leamer (1983; 1985) and Leamer and Leonard (1983) as well as the methodological
issues of modeling the underlying relationship. Section 8.3 lays down the employed
cost function and the formulas to estimate the marginal cost and the Lerner index in
the first place. Next, in section 8.4 we make reference to the determinants of
competition with regard to regulation and supervision alongside other controls of
bank specificities and economic development. Section 8.5 displays descriptive
statistics correlation matrices between key variables and section 8.6 provides full
account of the empirical evidence stemming from the baseline models.
We also investigate in section 8.7 how the impact of competition takes shape in
response to the interplay between regulation and foreign ownership. The analysis goes
one step further allowing for non-linear relationship between competition and
indicators of institutional development (section 8.8), such as corruption, government
effectiveness, dissemination of credit information, among others. Section 8.9 allows
for the constituents of Z-score to be used as dependent variables in order to verify
which aspects of bank soundness are explained by the model. Section 8.10
investigates how market structure variables behave for commercial, cooperative,
savings and „other‟ banks of the market, and section 8.11 makes a synopsis of the
results.
Chapter 9 provides the concluding remarks (section 9.1) of the empirical analysis
and pertinent policy implications (section 9.2), coupled with methodological
limitations (section 9.3) and some suggestions for further research (section 9.4).

16

17
CHAPTER 2
Competitive issues

18

19
2.1. Introduction
European banking has undergone a state of structural reforming either in an
institutional or macro finance perspective. The evolving financial engineering along
with regulatory initiatives and advanced information technology have contributed to
bank disintermediation as more and more funds are transferred away to insurance
corporations, pensions or investments funds. Firms often use capital markets as a
means of portfolio diversification and debt financing while households are keen on
equity investments to reap high returns in buoyant periods.
Advocate to this trend has been the impact of information technology on the
internationalisation of capital and money markets. The integration of European
financial markets was intensified in the aftermath of the Euro adoption fostering
higher levels of competitive conduct. In addition, bank assets are reported roughly
over 15% to be in hands of foreign owners, especially subsidiaries (branches
secondarily) in Southeastern union to procyclically anticipate and, therefore, affect
economic growth in this region. Further evidence is derived in the significant external
position of European banks in terms of cross-border asset/liability holding and income
geography.
However, the by-product of nonbank competition does not imply a modest role in the
provision of financial services. The driving force of large-scale R&D and allocative
efficiency, potential market entries or market structure impinges on interest rate
margins and bank profitability over time and across different sectors and size classes.
As such continuous process is unfolding, the implications on stability is a matter of
economic theorising and empirical application. On the one hand, Stiglitz and Weiss
(1981) allege that monopolistic markets tend to adopt higher interest rate margins and
thereby inducing potential defaults, whereas Keeley (1990) attributes financial
instability to competition when banks in an attempt to recoup returns carry on riskier
projects.
Before moving onto the literature review of empirical competition models, it is
necessary to define every single issue involved and the way they are related to each
other.

20
2.2 Institutional perspective
2.2.1 Efficiency
Considerable empirical research has been conducted on the X – efficiency of European
Banks. It is measured in terms of costs and profits to highlight the ability of specific
sectors to control costs or revenues with better management and/or technological
advancement. A profit-maximising bank is intended to be close to or right on the
efficiency frontier and, therefore, to eliminate expense preference behaviour of
managers when not acting to the best interests of shareholders. Above and beyond that
threshold, only technological changes can bring about further efficiency levels.
Two measures here are related to X – efficiency: scale and scope economies; that is,
the marginal (negative) change of unit costs in response to the employment of the
total volume of production or range of products, respectively. Possible allocative
inefficiencies are attributed to administrative costs or insufficient management and
staff productivity. In other words, efficiency can be accomplished by the optimal
allocation – and the efficient utilisation, therefore - of the input mix.
However, the fact of whether there is such thing in banking as scale economies has
occupied an extensive part of banking literature. Strictly speaking, it underlines the
possibility of altering the production level on the grounds of varying all factor inputs.
Some problems may arise here; it is quite hard to allege that all inputs are totally
variable and even if we do so, the risk profile of a bank may be at odds with the
maximisation of the shareholders utility. For example, how is it possible to triple the
deposit accounts? And is that action worth taking given that the prospective provision
of loans implies higher portfolio risk? Besides, the problem of indivisibilities rules out
any change of an input unit by a fraction; there is no way of adding one-third of an
ATM machine or so. Last, the range of financial services worldwide makes it hard to
quantify multiple outputs and empirically verify the extent to which scale economies
do exist.
On the other hand, the concept of scope economies stands out in cost minimisation
when it comes to evaluate the positive effects of a merger or acquisition. As a
causatum, it is not always obvious, if at all possible, that a joint production is bound

21
to plunge costs through intermediation. They can apply when supposing, for instance,
the core banking activity of intermediation, whereby a predetermined fraction of
deposits is loaned out to borrowers. However, the payments service system in Europe
is quite fragmented, comparatively to USA, and that constitutes a hindrance to exploit
cost complementarities. Correspondent and custody services as well as payments
through debit/credit charges are not sufficiently spread out in European countries to
be conducive to cost reductions.
The business term of economies of scope is synergy, through capturing a more
dynamic process. It consists in the blend-up of skilful employees and exertion of a
considerable influence on suppliers for further reduction in input prices, among
others. In banking, this concept often proves to be costly in cases where innovation
forces fall short of mixing different cultures or inspiring the entrepreneurial spirit of
small financial boutiques. Consequently, the extent to which scale/scope economies
and synergies exist in European banking is indispensable for strategic decision-
making. However tough it is to come up with such measures, empirical evidence
gives mixed results whether large and multiproduct banks have a comparative cost
advantage over smaller types.
Technological change is the other important component of the efficiency compound.
Irrespectively whether it is applied in either cost or profit equations, it is estimated by
taking the partial derivative of the already cost/profit function with respect to the time
trend. It seems quite possible to draw some lines regarding the constituents of
technological innovation (Baltagi and Griffin, 1988); that is, the pure technological
progress – the effect of time trend depicting knowledge advancement - the non-
neutral change - the elasticity of cost/profit to variation in input prices - the scale
augmenting change - the sensitivity of cost/profit to changes in bank outputs - and
quasi-fixed factor augmenting change – cost reduction attributed to changes in fixed
factors. Empirical evidence has shown that technological change improves profits to
make up for the foregone technology investment up to a point where everything is
diffused and decreasing revenues are offset by greater costs.
It appears to be a hidden trade-off between reductions in costs and profitability,
though not verified on the whole. In countries where big banks endeavoured to taper
costs by increasing ATMs or closing branches faced a much poorer quality in services

22
thereby incurring a considerable profit plummeting. Only commercial banks have
accomplished greater profitability as they utilized innovation for better services and
risk management purposes. However, smaller commercial banks have been subject to
diminishing revenues and smaller cost reductions, probably sticking to reap the
benefits of innovative forces over non-cost channels.
2.2.2 Consolidation
In the European landscape, the consolidation of banks and financial firms is expressed
either by the merger of two independent banks or by the acquisition; the former turns
out to establish a single unit and the latter refers to the control of the acquired bank
through holding the majority of its shares. In such a case, the assets are not integrated
and by no means constitute any form of combination of the two firms. Strategic
alliances can also lead to monopolistic power when tacit agreements come into play
thereby exerting a considerable influence on the other banks‟ competitive stance.
In reality, academics may be up against consultants when they are called to articulate
a word about an imminent merger. There is not always a clear-cut answer whether the
deal is worthwhile as no one is able to back it up with convincing evidence. After all,
both can be right if, for example, bankers are focusing on the cost cuts in the post-
merger phase and at the same time economists observe no efficiency gains in cases
where revenues are moving downwards in line with costs (Rhoades, 1994).
M&As could actually take place for several reasons. In case of expecting efficiency
gains, either stemming from scale/scope economies or cost/profit X – efficiencies
from better organisation and management, the resulting market power of the new
entity may end up to higher pricing and value-added for the shareholders. Moreover,
it might be the case of managerial selfish ego the intimate motive of a merger in a
way to maintain and even enhance their personal power. In addition, structural
changes in the European banking sector have rendered M&As to be imperative and
intensified their operation in off-balance sheet activities (bancassurance) and other
non-interest income sources (commission, fees). By and large, the latter occupies a
large proportion of the income of European banks and keeps on escalating up to 50%
particularly in larger diversified banks (Laeven and Levine, 2007).

23
The empirical literature has been testing the effects of M&As by applying the event
study method – whether and to what extent abnormal returns of stock market shares
are created when announcements about an imminent merger make agents form
relative expectations – and comparing efficiency and performance ratios before and
after the time of a merger/acquisition.
In general, European bank merging has experienced great abnormal returns when the
announcements of deals involved domestic banks and insurance companies for
product differentiation purposes (Cybo-Ottone and Murgia, 2000). In fact, Campa and
Hernando (2006) conclude that only the target banks enjoyed positive market
expectations around the time of the announcement and, on average, improvements in
performance and efficiency; the latter remains put, according to Vennet (1996), but
especially in cases of equal-sized domestic banks and cross-border acquisitions. For a
strategic standpoint, Figueira and Nellis (2007) found consolidation to have incurred
more efficient gains than alternative development strategies from other large banking
entities. However, higher performance has been evidently feasible by domestic banks
of equal balance sheet structure, and cross-border deals that drive similar loan
portfolios, risk management strategies, and capital - cost structures (Altunbas and
Marques, 2008).
Cross-border activity is supposed to be conducive to the integration of European
banking sector. Barros et al. (2005) point out that the tendency towards the creation of
subsidiaries and not branches constitute a hindrance that deters full integration or even
geographic diversification and deregulation enforcement. In the case of horizontal
product differentiation and exogenously determined sunk costs, the banking sector
becomes more fragmented and deconcentrated the greater the market size (Sutton,
1991). If customers acknowledge different quality in financial products (vertical
differentiation), and incumbent banks are able to endogenously affect sunk cost
expenditures, they are highly motivated to operate in a higher efficient scale by
financially and technologically innovating and branch networking. Discretionary sunk
cost competition is, therefore, focused on fixed costs and take several forms, most
inclined with propagating effects to advertising and, primarily, to information
technology (Vives, 2001). On the other hand, competition on variable costs is
profoundly the typical strategy if concentration is negatively associated to market

24
size; in the „80s, Gual (1999) empirically came up with an ongoing deconcentrated
landscape in European banking with the same patterns.
2.2.3 Relationship banking
The role of relationship banking lies in the definition of the bank‟s raison d‟être. In a
typical balance sheet, bank liabilities (e.g. deposits) are liquid since anyone can
withdraw on demand while assets (e.g. loans) are not marketable due to informational
frictions. The latter includes both asymmetric and proprietary information that needs
to be developed when the provision and pricing of loans requires ruthless screening of
the potential borrowers. The qualitative transformation of assets in the contemporary
financial intermediation theory consists in the way banks are able to serve long-term
loans with short-term deposits, guaranteeing at the same time the liquidity of savings
and inevitably undertaking credit and liquidity risks.
Hence, relationship banking is called to provide specific (proprietary) information for
every customer and evaluate whether the repeated provision of financial services
across time is profitable (Elyasiani and Goldberg (2004). The key thing here is that
banks obtain information when screening and monitoring services in the lending case
(Allen, 1990; Winton, 1995). As Berger (1999) puts it, relationship banking holds if
there is something more to be obtained than the readily available information, it is
confidential and a product out of many repetitive interactions with the customer over
a range of financial products. However, relationship banking is present in nonbank
intermediation and involves other financial services like deposits, check clearing and
so forth.
Now securitization comes into play, being an ongoing funding development in the
contemporary banking finance. Although it seconds more transaction-oriented rather
than relationship-oriented interactions, the so-called credit enhancement is facilitated
by lots of collaterals and letters of credit. The bank, on the other hand, is now more
cautious to price its assets credibly and keep on monitoring collaterals so as to acquire
the necessary proprietary information that abridges default risk; even so, the bank
should be able to preserve accountability in reports and internalise a portion of the
incurred cost.

25
The benefits of relationship banking seem quite obvious once we cerebrate that
bilateral exchangeability is maximized between borrowers and banks when they are
both more willing to reveal exclusive information. The social welfare is positively
affected by long-term agreements that allow for more discretion, – flexibility and
negotiation of contract terms - contractual covenants, - adaptive to the underlying
information set after negotiation takes place as being more effective in loans (Berlin
and Mester, 1992) – collaterals, - mitigating adverse selection and moral hazard
problems (Stiglitz and Weiss, 1981) on the grounds it is monitored closely as far as
relationship banking makes it possible - and time – bearing losses in the short term but
then recouped as relationship has been established. These losses may include
subsidies to new borrowers without which, they would be condemned due to adverse
selection and moral hazard problems. Before moving to the costs of relationship
banking it should not be overlooked that bank provision of loans constitutes a
credential of financial soundness and the quality of the borrower when being
monitored seems to complement capital market funding.
The primary costs of relationship banking are the soft-budget problem and the hold-up
constraint. The former pertains to the lack of bank credible threat (Dewatripont and
Maskin, 1995) to enforce the credit terms since the bank is bound to extend the loaned
money to avert borrower‟s default. It seems quite obvious that the borrower may
demonstrate inadequate endeavour to survive on its own unless the seniority of bank‟s
debt structure renders the threat credible and the overall value insensitive to the claim.
The hold-up problem pertains to the monopoly power a bank has gained from
proprietary information. Borrowers run the risk of getting charged higher interest rates
and trammelled to carry on thus forfeiting valuable investments (Rajan, 1992).
However, multiple bank relationships could disperse the burden of credit at the
expense of less valuable information to be obtained and greater competition, which is
reluctant to lend to young firms. The only way out, as put forward by Von Thadden
(1995), is the long-term contracting and continuation of it upon performance. In other
words, poor projects may be terminated or get compensated depending on some
parameters or alternatively, refinanced at prespecified terms. Therefore, ex post
bargaining power of banks is circumscribed and firms are induced to keep up valuable
projects with single bank relationships.

26
It is quite ambiguous whether competition is negatively correlated with relationship
banking. One strand of argumentation falls in the competitive environment that
enables customers to switch to other banks; that is deemed to imply negative
repercussions relative to reduced and shorter relationship-intense investments
inhibiting costly proprietary information and so forth. However, Degryse and Ongena
(2008) have emphasised the importance of switching costs – e.g. search and shoe-
leather costs, that is time and effort to open/close accounts, transfer funds, etc. – that
amplifies the development of relationship banking. In such case, screening becomes
an integral part of the relationship though it may end up inefficient for borrowers,
whose assets are dominantly intangible (Houston and James, 2001). It could be much
worse for new firms that need to be subsidised in the first place as loan rates may
escalate intertemporally to offset the prospect of no retrievalibility of bank rents.
On the other hand, Boot and Thakor (2000) emphasise that relationship banking may
be part of a bank‟s competitive advantage increasing the welfare of the some. Tailor-
made services render the bank unique in the eyes of borrowers even amid fierce
interbank competition. However, capital market competition is expected to downplay
relationships and the per se lending orientation. In contradistinction, Dell‟ Ariccia
(2000) argues exactly the opposite, that there is a potential trade-off between market
share and relationship banking. As competition heats up, banks are aware of fewer
borrowers (adverse selection problem) and have therefore an incentive to screen.
However, the more banks are competing each other, the higher is the motive to switch
into transaction-oriented mode and grasp greater market share. Empirical evidence
has showed that single bank relationship has resulted in more value-added than
multiple schemes, the less the duration of such relationship, the greater is the distance
between bank and firm and less is that between bank and its competitors (Farinha and
Santos, 2002; Degryse and Ongena, 2001; 2005).
2.3 Macro finance perspective
2.3.1 Regulatory developments
Before delving into the regulatory directives put forth to the unification of the
European countries, we should have a look at the rationale of the purpose of

27
regulating banking markets. To the best interests of any investor, regulation applies
for his protection by providing sufficient information for hidden risks of traded
financial products. Even in cases of law breach, illegal activities, like tax evasion,
money laundering, find their way to judicial prosecution and investors are alarmed for
not engaging in. In addition, the abuse of potential oligopolistic markets make
authorities keep a vigilant eye on mergers and acquisitions to verify whether such
restructurings will have a considerable impact on market shares and product pricing.
Along the lines, negative market externalities might otherwise undermine financial
stability and the viability of intermediation.
Prudential regulation at the microeconomic level is indispensable once the
repercussions of a bank run can have a detrimental effect at the macroeconomic level;
that emanates from the banks operation in a homogenous product market and thus
their exposure to the same kind of risk. However, the reputation of a bank, if exists,
compensates for the prohibitive costs of acquiring information, the transparent
activities as depicted in the balance sheets, among others. A bank failure is
susceptible to the variable confidence of investors, which may then metastasize to
other banks as investors herd to withdraw their deposits before their bank liquidate
their assets. The underlying contagion is exacerbated by the systemic risk possibly
disturbing wholesale and retail markets and, in the extreme, the collapse of bank
intermediation, shortage of liquidity services and problematic resource allocation.
Therefore, social costs are quite severe to be overlooked given that the aggregate
consequences of potential bank runs in the European union render the
macroprundential regulation of primary concern (Borio, 2003, 2006; Acharya, 2009).
On the other hand, if banks are secured in view of upcoming runs on deposits, moral
hazard problems may arise. Banks may be willing to undertake risky investments if
deposits are protected by some insurance scheme or the state treat banks as being too-
big-to-fail institutions. The looting hypothesis as first articulated by Akerlof and
Romer (1993) provides some answers to the managers‟ gambling attitude. If managers
are well informed about the imminent collapse of their bank, they tend to engage in
risky projects to increase short-term profits and therefore share prices to exercize their
put options. Even shareholders overlook the underlying gambling when enjoying
share overvalues whereas well-informed shareholders have the opportunity to sell at
high prices. In the end, if gambling has averted the imminent collapse, everyone is

28
better off; if not, managers have managed to flee with profits abandoning the bank
with major losses. The key argument here is that managers are expected to be
uninterested in deposit losses while shareholders are falling on the realisation of short-
term profits even if deposit insurance is capped at certain level, if there is co-
insurance scheme or if the deposit type is not qualified for it (Heffernan, 2005).
2.3.1.1 International initiatives
In response to the harsh bank failures in 1980s, the Basel committee was established
as a permanent secretariat at the Bank of International Settlements. It consists of the
supervisory authorities of G-10 countries, Luxembourg and Switzerland, meeting up
once every three months.
In 1975, the Basel concordat was the first agreement upon the way responsibilities are
split into home and host country supervisors. Host countries were charged with the
solvency and liquidity of foreign bank subsidiaries while home countries were
responsible only for the liquidity of foreign branches. An amendment was put forth in
1983 (Revised Basel concordat) after the panic triggered by the suicide of Roberto
Calvo, the chairman of the Banco Ambrosiano bank. That incident made depositors
withdraw all their money and Bank of Italy provide a rescue plan, though in vain. The
bank failure underlined the gaps in regulation when a bank‟s subsidiary located in
Luxembourg declared bankrupt after the refusal of both host and home country
authorities to inject cash. Ever since, liquidity problems lie in the joint jurisdiction of
host and home authorities, either occurring in branches or subsidiaries. Solvency
responsibilities are split to the home state‟s central bank for branches whereas to both
home and host countries for subsidiaries.
However, until then there had been no provisions of the lender of last resort in many
territories in the EU. Although rescue packages were quite frequent the last fifty
years, the coordination of authorities on the rescue of branches and subsidiaries as
precipitated by the upcoming failure of their headquarters. On the top of that, the
Basel Committee addressed the issue of applying deposit insurance on other bank
liabilities. However, in interbank and wholesale activities there is limited information
asymmetry to require insurance; even currency deposits are preferred to be unsecured

29
since the concern of shifting away from the foreign bank to its headquarters cannot be
overlooked.
The Basel Accord was passed in 1988 to set out the capital required to safeguard the
financial health of banks with reference to their assets and liabilities. Stemming from
the Cooke ratio, the risk assets ratio is defined to be the capital over assets and credit
risk equivalents. Specifically,
Capital (tier 1&2) / risk-weighted assets + credit risk equivalents
Where,
Tier 1 (core capital): equity capital, including common shares, non-cumulative
preferred stock and other hybrid instruments, disclosed reserves,
Tier 2 (supplementary capital): undisclosed reserves, cumulative preferred stock,
revaluation reserves, hybrid debt instruments, general provisions, loan loss
allowances, subordinated debt.
The risk weights of all assets are categorised by credit type:
0%: cash, gold and bonds issued by OECD countries and U.S. treasuries
20%: bonds issued by OECD banks, municipal governments, securities issued by U.S.
agencies and insured mortgages
50%: uninsured mortgages
100%: corporate bonds, claims on non-OECD banks and under-developed countries,
real estate, plant and equipment.
The other component of the denominator, namely credit risk equivalents, refers to the
(non-)trading off-balance sheet instruments (futures, swaps, letters of credit, etc),
which are assigned the weight of the counterparty‟s type in tandem with the given
claim. The Basel Accord sets out the minimum of 8% of capital for banks to set aside
vis-à-vis imminent risks (credit, counterparty). Hence the capital requirement for
every single asset category of a bank is calculated by the risk-weighted asset times the
8% minimum capital. The off-balance sheet charges are supposed to be the product of
the credit exposure of derivatives according to the Basel accord. Last, the credit risk

30
charge for off-balance sheet items falls under the same formula for on-balance sheet
items, though imposing a 50% weighting. The latter is justified to address a good
quality of credit, since only large and sophisticated banks are able to engage in such
behaviour.
Some objections have been raised against the effectiveness of Basel Accord to
accomplish a level playing field for international banking. First, there is a debate on
whether the use of book-market values of equity in capital ratios is appropriate.
However, in times of interest rate and stock price volatility, the use of book values is
expected to mitigate the fluctuations of capital assets ratios, thus without having to act
correctively to abide by the rule of 8%. Second, tier 1 and 2 capital is measured
differently across countries in line with the discrepancies of national accounting,
regulatory and tax systems. Thus, it seems hard to quantify risks and compare capital
ratios amongst European states. Third, the credit risk equivalents of off-balance sheet
instruments do not account for any risks involved other than the credit risk. The
operational and market risk may jeopardize the default on certain instruments, when
no capital is set aside to guarantee against volatility in interest rates, liquidity and
currency risks, among others. Forth, the weightings assigned to every asset category
follow an one-size-fits-all approach.
The classification of assets according to its credit risk applies falsely to every
instrument within any category. For example, a bond issued by an OECD bank which
receives AA rating, gets lower weight (20%) that that of a loan to an enterprise with
AAA rating (100%). Last, regulatory capital arbitrage can exploit gaps in regulation
to retain lower capital than that corresponding to a bank‟s risk exposure. In case, for
example, a bank has unsecured mortgages, it can pass them (sell) on to a special-
purpose vehicle (SPV; subsidiary), to use them as a collateral for the issuance of new
bonds. In that way, the bond investors are classified to priority/seniority tranches, and
the stream of mortgage payments is used to pay off the coupons on a rollover basis,
first serving the most senior tranches followed by the next senior ones, etc. The key
thing is that senior tranches have comparatively high credit ratings, allowing for low
capital requirements outweighing – totally in absolute numbers - the higher
guarantees for the least safe tranche.

31
The imperative of filling the loopholes in regulations came along with the Basel
amendment in 1996. In two years time, its provisions were introduced internationally
to capture the changes in market risk; that is perceived to include the market and
specific equity price risk, interest rate risk, currency risk and commodity risk. In that
way, the off-balance sheet items are treated in a more sophisticated way, rendering the
approach of credit risk equivalents as inefficient and lumpy. Besides, in the nominator
of the Basel ratio, the tier 3 capital, marking the capital charges in response to the
underlying market risk, is added up to define the short-term subordinated debt on the
grounds that the minimum capital requirement is fulfilled at all costs (interest,
principal).
The use of a particular internal model to quantify the market risk was left up to the
discretion and the approval of national regulators. The internal model involves the
average market VaR and the stressed value-at-risk numbers over a period of sixty
days. In each case, bank models of VaR require:
daily computation
one-tailed confidence interval set out to be 99%
minimum „holding period‟ of 10 days prior to asset liquidation, unless
otherwise sufficiently justified for employing shorter periods
the time series of sample observations not less than one year
data update at least once a month, unless otherwise called for vis-a-vis great
price volatility
no particular model prescription but contingent on the nature of portfolio
whatsoever. In addition, the employed model could be linear (covariance
matrices, factor modeling, diagonal modeling), nonlinear (gamma,
convexities), historical or Monte Carlo simulations, coupled with the
necessary stress-testing of scenarios, correlations and policy responses that
may infer great bank losses.

32
though banks are required to empirically model all the risk factors influencing
rates and prices, including non-linearities in options (-like) positions.
The alternative model of market risk follows the standardized approach which
determines the capital charge as accrued by the involved risks and the conversion of
off-balance sheet iterms into spot equivalents. Portfolio diversification is dismissed in
the way price changes in equity prices, commodity prices, interest rates and exchange
rates do not comprise covariance factors.
Concerning the risk in gold and exchage rates, the capital charge of derivatives is
computed on the 8% basis of the sum of long or short positions – whichever the
greater in absolute values is – along with the net gold position. The equity risk
computation involves the capital charge to be applied on both specific and market
risks. In particular, the capital required to be set aside is the sum of the factor specific
risk – net position times 8% - and the market risk factor – gross position times 4%,
assuming that the systematic risk is the same and diversification is left off to the
discretion of national authorities for approval. Commodity risk‟s source engulfs a
great pool of commodities, such as metals, gas, grains among others, and appertains
price changes (exchange rates worldwide, etc) and other risks inherent even in the
production process (namely, input cost, quantities, political instability).
However, the underlying approach is reminiscent of the aforementioned methods, but
nonetheless unpopular. The reason is that there is no way to diversify risks by
accounting for correlations and the compliance to such risk management system is
bound to incur huge costs. Last, interest rate risks are accounted for by classifying all
debt instruments in time bands conditional on their maturity. A specific risk factor is
attributed to each time band that takes values between 0 (short maturity period) and
12.5 (long) and thereby reflects sensitivity of certain positions to conjectural interest
rate changes. For the valuation, in turn, of the net position in each time band, vertical
disallowance (10% capital charge levied on the smaller of long/short position) is
applied to offset possible duration mismatches within each band (namely, basis and
gap risk). Then, the underlying time bands are classified further into three zones - 0-1
year, 1-4, 4-over 20 years – and the net position is calculated for every single zone.
That is so to account for correlation of interest rate movements in different time

33
bands. Thus, a risk factor is implemented on the net position of each zone (horizontal
disallowance), 40%, 30% and 30% respectively. Thereafter, banks should come up
with the net positions between zones in pairs and set aside a 40% capital for adjacent
time zones (1-2, 2-3) and 100% capital for the zones 1 and 3. Finally, the net positions
are rolling over the aforementioned steps as soon as the calculation of the capital
charge is rounded off.
On May 2004, the new Basel Accord (II) was passed much to the following
commentary reports of banks and the impact studies of members of the Basel
committee to propose further changes in the initial proposal (2001). Though a
between-season was provided for G-10 countries to abide by the standardized
approach by 2006 and the advanced ones by 2007, capital charges were calculated on
the basis of both Basel I and II rules. Only a small number of US banks and the
majority of broker dealers were supposed to adhere to the new rules, while the rest
would keep on operating to the letter of Basel I. Contrary to such subversive attitude,
provisions of the new Basel accord became part of European directives and ratified by
the European parliament. In addition, countries with no explicit representation on the
Committee were eager to abide by the new rules in the aftermath of the affiliation of
developing countries in the membership body of the Bank of International
Settlements.
It comprises a 3-pillar approach setting out the measurement of all risks, the role of
supervisory authorities and the establishment of market laws regarding soundness and
transparency. In particular, credit risk is calculated by the new standardized approach
that applies quite different pro-rata risk weightings. Alternatively, the bank may opt
to utilize the credit scores published by qualified Export Credit Agencies (ECAs) or
those participating in the „Arrangement on officially supported export credits‟ (OECD
trade directorate). Banks assign a risk weight lying in the next less favourable rating
to the respective rating of a country or alternatively, a risk weight based on the
external assessments of themselves. See in detail the comprehensive version, Basel II
: June 2006.
In reference to the above assigned risk weightings, debt instruments are likely to be
allocated to higher-rated firms since otherwise banks may be required to set aside

34
more capital as counterbalance for potential losses. In absolute terms, that is the 8%
capital charge of total risk assets that remains put from Basel I.
The alternative internal ratings based approaches (IRB henceforth) have been devised
in order to allow banks to use sophisticated risk-weighting techniques. By using
internal ratings and information, the capital to be set aside covers unexpected losses
along with potential default on credit. The opportunity for banks to do so is granted by
the discretionary decision of the Committee upon the fulfilment of explicit criteria:
risk differentiation, internal validation, probability of default estimated for each group
of borrowers with data covering a period of at least 2 years since Basel 2 kicked off,
loss given default (LGD) requiring 7 years of data for advanced IRB banks, approved
risk components by which risk weights are determined, internal ratings and VaR
methods to be employed in an integrated system of risk management for the definition
of economic capital as well as the establishment of disclosure standards.
Banks are asked to classify their assets to classes of several exposures according to
the definition of risk features underlying therein. Such classes are corporate,
sovereign, equity, bank and retail with further decomposition to sub-classes in some
cases. Even though banks are not required to apply what the Committee is asking for
risk management, they do have to comply with the treatment specified to each
exposure relative to the minimum capital requirements. The foundation and the
advanced approaches are founded now in terms of their risk components, the
functions that the latter is transformed into risk-weighted assets and the minimum
capital requirements for each asset class.
As far as the risk components are concerned, banks are asked to place their own
estimates of probability of default (PD), loss given default (LGD), exposure at default
(EAD) and maturity (M). All the functions applied to derive the risk-weighted assets
are laid down in paragraphs 270 to 370 whereas the minimum requirements for first
entry to IRB methods and on-going use of it – e.g. leasing, disclosure, corporate
governance, among others - are presented in paragraphs 388 to 537.
Apart from that, the Basel Committee recognizes securitisations by means of
collaterals, guarantees and derivatives as risk mitigants. If a bank is originating
securitisation, then an amount of capital requirement should be calculated as if that
asset was not securitized at all. In fact, the definition of transactions that are treated as
35
securitisations are explicitly provided in the conditions part of paragraphs 543 to 552.
However, cases when securitisations are not accounted for the calculation of risk-
weighted assets are boiled down to the operational requirements of paragraphs 554 to
559.
For the collateral treatment, the standardized approach of credit risk is applied
utilising specific risk weights. The key types of recognized collaterals are cash, gold,
government bonds of at least BB- rating or BBB-rated bonds and other unrated
securities when issued banks or securities firms, among others. If now banks are
qualified to use the IRB approach by their national authorities, the components
involved are again the aforementioned previously plus receivables and several types
of residential property. The maximum requirement is the equivalent to the „sheer‟ IRB
result had there not been securitisation; deduction from tier 1 and 2 (50% each) is also
provided, unless it is not the case of an equity increase, which should be deducted
from tier 1, or an implicit support. For an extensive analysis of IRB approaches, see
„Treatment of securitisation exposures, section 4 (BIS, 2003a).
Guarantees are recognized on the grounds of the guarantor‟s ability to pay off all
„non-payments‟ of the counterparty. Credit derivatives, especially credit default
swaps, are more preferable since they provide insurance in cases of imminent
defaults.
The last component of pillar 1 deals with operational risk. It is defined as ‘…the risk
of losses resulting from inadequate or failed internal processes, people and systems, or
external events.‟ There are three approaches of methodology, namely the basic
indicator, the standardized and the advanced measurement approach(es). The first
amounts to the average gross income over a three-year period times an alpha factor
that highlights the level of capital charge. All negative values are to be deducted from
both numerator and denominator.
As for the standardized approach, all banks services are classified into eight classes
and assigned specific beta factors. Thus, the capital requirement is the average capital
charges across all eight classes over a period of three years. Last, the advanced
measurement approaches (AMAs) are available to greater-sized banks, which are able
to purchase insurance in order to reduce the capital charge by at most 20%. However,
the subordination of banks to this option is contingent on certain conditions and

36
approval of host country authorities. Large banks may opt to include diversification
benefits within their operation and not those of the whole spectrum of their group
activities.
Pillar 2 sets out the responsibilities of national supervisors. More specifically, they are
expected to produce Basel ratios according to the provisions of the aforementioned
methodology and evaluate the risk management of banks guaranteeing the
preservation of an appropriate operational level. Moreover, they have to keep a close
eye on the fulfilment of minimum capital requirements and go through immediate
action in the advent of capital deviations. However, the framework of supervisory
conducting is not provided to the letter of any endorsed directive, turning out thereby
to play a back-up role in the execution of pillar 1. Pillar 3 last reinforces banks to
adhere to the provisions of the other two pillars. They should abide by the definitions
of risk exposures, the computation of respective capital charges through the
appropriate methodology and the disclosure of transparent information to the market.
2.3.1.2 Towards a single EU financial market
Initiatives to the harmonisation of the regulations in the Euro area are traced back to
the treaty of Rome in 1957, when free trading was to be accomplished with the
convergence of national regulative directives. The subsequent Single European act in
1986 proved to be an accelerating mechanism to second integration of markets
transforming the whilom perception of collective convergence into the principle of
mutual recognition of a minimum set of rules. European Commission has put forward
the minimum requirements, upon which the so-called European passport can be
applied; that are the provision of financial services and the establishment of bank
branches across the borders. All countries and banks headquartering in the euro area,
should abide by the rules of financial supervision and controlling.
Amongst the acts to be applied, banking markets could achieve higher degrees of
integration according to the first banking directive in 1977. The notion of credit
institution was defined to be a bank entity that loans out its deposits and other
repayable funds. The overall supervision of all credit institutions is in the jurisdiction

37
of the member state where the head office of a bank is located in order to secure
savings and ensure competitive conditions.
The second banking directive followed in 1989 to define the measures with which the
European passport would be accomplished. Before this promising general banking
framework, banking business was hindered by and subject to the specific
requirements of the host countries laws; e.g. authorisation or endowment capital on
entry. But ever since, the pursuit of business has been prescribed by the notification of
a bank, intending to establish a branch, to the home country authorities. Unless they
have reason to cast doubt on the endeavour, the host country‟s authorities should be
informed within three-months period. The endorsement of consolidated supervision
came along with rendering the host country authorities responsible for the supervision
of the liquidity of banks and their branches in cooperation with the home country,
though the final decision of whether a bank is to be liquidated lies in the hands of the
home country supervisor. Full responsibility of the host country applies in the
supervision of risk management and implementation of monetary policy. For
example, if a European country hosts a subsidiary of an outsider, then it is subject to
the monetary policy of the European Central Bank.
On the contrary, prudential supervision of any credit institution, reflecting the
soundness of administration and accounting procedures as well as the provision of
internal audit mechanisms, is the responsibility of the home country competent
authorities. In general, the principle of equal treatment applies everywhere. Disputes
that may occur when European banks find themselves to be unequally treated with the
subsidiaries of third country banks, since different sets of regulation apply, are
resolved using the right of suspending banking licences, negotiating bilateral terms or
taking refuge in the World Trade Organisation.
Hence, it seems to be the most important directive that gives palpable guidelines and
sets out a great range of bank activities like deposits and other repayable funds,
lending, factoring, forfaiting and financial leasing, money transmission mechanisms
(cheques, ATMs, credit/debit cards), derivatives, money market and exchange rate
instruments, securities, portfolio management and consulting on capital structure,
strategy, M&As and personal finance, safekeeping and administration of securities,
credit reference and custody services.

38
The underlying directive set out the minimum equity capital requirement to be 8%
and any deviation of it, must be restored by all means as soon as possible. In addition,
competent authorities must be notified in cases when more than 10% of the equity is
acquired by single shareholders, and the bank stock holdings exceed the threshold of
10% of non-financial firm‟s value and/or 60% of the bank‟s capital. Apart from
those provisions, some other directives have been adopted to determine a level
playing field of the minimum requirements.
The Large exposures directive was passed in 1992 and put into effect in 1994. Credit
institutions are required to be exposed at most by 15 per cent of their equity capital to
an individual borrower or 40 per cent of bank‟s funds. Banks are subject to the
threshold of 25 per cent exposure to one borrower (or group of), which by no means
can exceed eight times their own funds.
The Investment Services directive was passed in 1993 and implemented in 1995. It is
reminiscent of the second bank directive, that is, the mutual recognition on some
minimum requirements set out to second investment services. The objective is to fill
the loops of national regulations in order to ease the provision of investment services
by banks and securities firms. Such services have granted cross-border access to
trading systems and include derivatives, money market instruments, transferrable
securities and unit trusts.
The directive on deposit guarantee schemes (1994) and its amending acts (2005;
2009) as precipitated partly by the financial crisis, have been established to avert bank
failures and at the same time protect small depositors/investors. Banks are bound to
finance a minimum fund of 50,000 Euros (20,000 Euros in the beginning) to cover up
deposits on Euro or foreign currency. This amount is fixed up to 100,000 Euros by the
31st December 2010. There is also the option – or the mandate in states like UK - for
co-insurance, according to which, depositors contribute as much as 10 per cent of
their deposits to the insurance fund as an incentive to monitor bank‟s activities.
However, a member state‟s branch located in another European country is covered by
the host country whereas out-of-the-union banks with branches located in the
European territory is required to provide an equivalent cover or otherwise be
subjugated to insurance schemes already operating in the host country along with the
dissemination of the underlying information to actual and potential investors.

39
Passed in 1999, Financial Services Action Plan was an ambitious endeavour aspiring
the integration of wholesale and retail markets, the financial stability and the
optimality in the operation of the single financial market. In doing so, it establishes a
set of conditions, rules and supervisory directives as a framework of action and
introduces the methodology, that is, a group of measures to assess the economic
impact of FSAP on banking, insurance and securities markets.
The directives of consolidated supervision, the first passed in 1982 but replaced by
another in 1992 and implemented in 1993, referred to the consolidation of accounting
reporting of financial groups. According to it, parent institutions are required to own
at least 20 per cent of the capital of their own financial subsidiaries.
The Reorganisation and winding-up of credit institutions directive was passed in
2001, at a time when financial services were at a glooming path. It sets out that in the
case of a credit institution with branches in other member countries going bankrupt,
the underlying procedure of the country (home state) which hosts the headquarters is
to be followed. Besides, at short notice the competent authorities of the host country
should be informed about the winding-up proceedings. Otherwise, there might have
been conflicts of jurisdiction and unequal treatment between creditors. The same
applies in the reorganisation case of an institution, where the consumer is protected
vis-à-vis potential conflicts in employed approaches. However, if the head office is
located outside the EU, the branch, which is going to be wound up, lies in the
jurisdiction of the member country.
The Statute for the European Company (known in Latin as Societas Europeae or SE)
came into force in 2004 after being passed in 2001. The European company can be the
product of four possible ways of formation: merger of public limited companies from
different member states, holding company available to both private and public limited
companies headquartering in different member states or having branches/subsidiaries
in countries different from those where their offices are registered, joint subsidiary –
the same laws apply - and public limited company previously pertained to the national
law of a member state. The registered office may change location within European
union without being dissolved and established again. Moreover, it is indicative that
the initial capital for a SE is 120,000 Euros unless otherwise required by a member
state for certain kind of activities.

40
The directive of financial conglomerates was signed in 2002 to consolidate the
supervision of them in a way to stabilize the international financial system. They are
defined as entities engaged in at least two out of the sectors of banking, insurance and
investment. Their main activity (usually banking) should contribute at least 40 per
cent to their balance sheet and the secondary one at least 10 per cent. The benefits
stem from their ability to diversify risks and exploit economies of scale through
moving assets in different activities. Still the lack of harmonized legislation
encourages potential fraud and capital arbitrage to different divisions within the
conglomerate to avoid great capital charges. Maybe the most discouraging drawback
is the fact that there is no provision of the way total risk can be quantified since
financial products are hardly sorted out by sector along with the different risk
exposures of banking, insurance and investment to financial products.
As for the EU takeover directive, it was agreed in 2003 after long negotiations. There
has been no provision of a level playing field and member states are not obliged to
abide by every single article of it. Its general principles are the protection of all
holders of the securities of the offeree company in terms of equal treatment, time and
information to decide on the takeover bid and its effects on employment among
others. There should not exist any false markets to leap at the chance of the bid,
benefiting from the temporary destabilation of any company‟s prices. The bid should
be able to be fulfilled by the offeror and by no means delay considerably the way
offeree company‟s affairs have been conducted so far. Moreover, the supervisory
authority of the bid is the member country at which the securities of the offeree
company have been accepted for trading, notwithstanding the usual case being the
home supervisory authority that is where its office is registered. Last, the mandatory
bid is required to be included in the takeover rules if that confers control of the offeree
company. The latter is to be determined by the percentage of voting rights, that is a
threshold that has neither maximum limits nor the same values across companies or
states. Rather, the bid is used to being made at an equitable price, namely the highest
of those during the last period of six to twelve months. Of course, discretion is
provided to the authorities to adjust it upwards or downwards.
The leitmotif of the European monetary Union was the initiatives to strengthen the
regulatory framework and supervision in the financial sector. The Lamfalussy report,
launched in 2001 comprised a four-level action in banking, insurance and securities

41
markets; namely, the adoption of the legal framework and the proper implementation
of those measures provided by Community directives, the coordinated action of
supervisory authorities and the diffusion of such policies in national laws. The advice
of the underlying directive rules lies in the jurisdiction of Committee of European
Securities Regulators (ESRC), which passes their propositions onto the European
Securities Committee (ESC). The ESC is charged to make further legislative changes
to keep up with rapid changes in financial markets, before they are endorsed by the
EU parliament. Hence, the new legislative process has been established to overcome
thorny problems at a higher pace, though in some crucial cases (e.g. Basel II)
European Commission opted for the traditional ratification process, which is bound to
creep up for at least 3 years until passing through the EU parliament.
The aims that the Financial Services Action Plan (FSAP) had envisioned for,
followed the White Paper on Financial Services Policy for the period 2005-2010.
Apart from that, the integration of financial markets is deemed to be accomplished by
transpositing the progress across all European territories, perfection of the employed
measures, harmonisation of the supervisory action and the removal of any barriers
involved. Priorities are identified especially in retail services, long-term savings
products and venture capital markets through more effective lawmaking, ex-post
evaluation of the measures and coherent compaction between European and national
body laws. Thus, by that time, the untapped potential for further employment and
economic growth is now accompanied - and to a degree backed up – by running
projects on retail banking, sound and transparent shareholdings, regulatory framework
in insurance market and efficient clearing and settlements in cross-border
transactions.
The European Parliament ratified the directive on Markets in Financial Instruments
and Investment Services (MiFID) in 2004. Along with the aforementioned action
plans, efficiency and integration in financial markets, investor protection and the
establishment of requirements that authorize bank activities were put forth in the
amendment of legislative framework in investment services. Incumbent upon the
Member states, the operation of banks, stock exchanges and other firms across the
borders is subject to the same conditions and procedures while prospective
acquisitions are evaluated according to harmonized assessment criteria, which
explicitly lay down notification thresholds, qualifying shareholdings, among others. In

42
addition, investors are protected by competent member authorities, which constantly
monitor potential breaches of law. On the other hand, market credibility is ensured by
a pre-trading transparency rule, according to which firms („internalisers‟) are obliged
to make quotes publicly for preferable transactions, but having the right to alter or
withdraw them in view of high risks jeopardising their position.
2.3.1.3. Basel III – framework in progress
Basel III is a new development of the Basel Committee to reform bank-level
regulation for the resilience of financial institutions during bank crises, and
macroprudential regulation that mitigates the impact of systemic risk and its
procyclical impetus over time. In particular, it pertains to two main banking variables
that are presumed to play a vital role in banks‟ solvency: equity capital and liquidity.
First, the classification of the issue of capital into three pillars takes the following
form:
Pillar 1: level of capital buffers, risk coverage and leverage ratio
Pillar 2: Risk management and supervision
Pillar 3: Market discipline
According to Pillar 1, banks are required to withhold 4.5% of risk-weighted assets as
common equity (2% in Basel II) and an extra capital conservation buffer (2.5% of
risk-weighted assets). There is also a countercyclical buffer within the range of (0-
2.5%) imposed at the discretion of the supervisory authorities on banks if they deem
that the pace of credit growth can result in high systemic risk. Furthermore, Tier 1
capital includes predominantly common shares and retained earnings and less by
other subordinated instruments with non-accumulative dividends and coupons, no
maturity dates or redeeming incentive. The instruments of Tier 2 will be harmonized
and those of Tier 3 totally phased out. There is also the alternative in cases of bank
insolvency for the private sector to resolve banking crises by contracting for common
shares in lieu of write-offs or conversions; a practice that reduces moral hazard if
financial support is provided „externally‟.

43
Risk coverage renders the need to reform against risk potentially related to (on- and
off-) balance sheet items and derivatives. The committee strengthens with more
rigorous analysis the capital requirements for securisation exposures that are
externally rated. We also have the introduction of stressing value-at-risk capital
requirements over a 12-month period of banking stress for the bank‟s trading book
(trading, other derivatives) coupled with a capital charge that accounts for risks
(default, migration) inherent in unsecuritized credit products. Pillar 2 extends its
coverage over counterparty credit risk by the use of stressed inputs in a
countercyclical context. It is also binding for banks to adapt their capital buffers in
line with mark-to-market losses that illustrate essentially how the creditworthiness of
the counterparty is fading out. This credit valuation adjustment (CVA) builds upon
the premise of Basel II that only outright defaults are addressed in the analysis.
For derivatives exposures, the committee asks for more effective collateral
management and longer margining periods, makes banks be subject to low risk weight
(2%) if they use central counterparties (clearing houses - CCP); default fund
exposures will be capitalized in CCPs according to a risk-based method. Hence, by
imposing more capital requirements for OTC derivative exposures, banks are
motivated to utilize the CCP facility. Moreover, exposures to the financial sector are
deemed more correlated than those to non-bank sector, and thus require higher risk
weights for the sake of systemic risk.
Containing leverage is the last constituent of the Pilar 1, which is not grounded on risk
exposure. Rather it puts a restriction on bank leverage in order to mitigate the
tendency of deleveraging during bank crises. In such times, the banking sector is
compelled to lower leverage driving to diminishing asset prices, high losses and credit
crunch. For measurement purposes, the leverage ratio is easily estimated in an easily
comparable way allowing for adjustments in differences of accounting standards.
Pillar 2 provides further framework on risk management and supervision. It addresses
a set of measures that mitigate procyclicality and banking sector vulnerability in times
of economic growth. In particular, the failure of Basel II was the procyclical
mismatch of minimum capital requirements against exposures on trading,
securitisations and off-balance-sheet activities. Such capital coverage fosters effective
risk sensitivity across financial institutions albeit at the expense of introducing some

44
degree of cyclicality on risk-weighted requirements. Hence, the Committee allows the
use of data over longer time horizons in order to estimate default probabilities, losses
given default (LGD) that are then expressed in appropriate capital requirements. Apart
from assessing the impact of cyclicality of the minimum requirement as set out by
Basel II, the Committee may reconcile risk sensitivity and stability in capital
requirements by utilising probabilities of default in internal ratings-based models for
the status of banks‟ portfolios during deteriorating economic conditions.
The Committee also promotes less procyclical provisioning practices based on
forward looking. In particular, the use of the expected loss (EL) approach instead of
the old „incurring cost‟ approach stems from different accounting standards that
highlight actual losses in a more transparent way. We also have incentives for greater
provisioning along with explicit guidance to the supervisory authorities about the
effective employment of the EL approach.
As far as the capital conservation buffer is concerned, the Committee enabled
supervisors to effectively introduce it under a framework that prescribes a
harmonisation of conservation standards internationally. The banking sector becomes
more resilient during economic downturns as banks are subject to a range of possible
actions consistent with the standard. That alleviates procyclicality given that market
fails to adapt accordingly to deteriorating economic conditions in the fear of sending
negative signals and thus banks, even if their profitability recovers, fall short of
engaging in adequate lending due to low capital buffers.
This new framework of strengthening equity capital comes into play in times of
excess credit growth. The Committee introduces a range of buffer level contingent on
the point of the business cycle we are standing at. We therefore make up for
unexpected losses through the cyclicality of the minimum capital requirements and
other additional buffers. There might be cases when extra buffers are necessary above
the cyclical minimum even if the latter is zero; supervisory authorities may require
that in anticipation of exogenous shocks.
We also have the issue of systemic risk and interconnectedness in Pillar 2. Since
procyclicality is amplified by the degree of interconnectedness among the banks of
high systemic risk, the Committee promoted an integrated approach of quantitative
and qualitative features that defines which bank seems important. Then, these banks

45
are required to have a higher capacity of loss absorbency by means of more capital
requirements, liquidity charges and ruthless supervision. We have also mentioned
other supplementary measures including higher requirements for exposures on the
financial sector, derivatives, securitisations and off-balance sheet activities, incentives
to resort to central counterparties for OTC derivatives, and higher liquidity
requirements if banks tend to fend their long-term assets by interbank (short term)
funding.
Pillar 3 refers to the transparency of capital and market discipline, according to which
banks are forced 1) to reconcile all capital regulatory elements in the audited financial
statements, 2) to disclose any items not deducted from Tier 1 equity capital, 3) to
encompass all relevant limits and minima set out by the committee, 4) to describe
features of the issued capital instruments and 5) to disclose explicit explanation on
how certain ratios of regulatory capital are estimated. All requirements are
accompanied with terms and conditions of the whole set of instruments of the
regulatory capital to be published on banks‟ websites.
Apart from the three-pillars approach extending that of Basel II, the Committee deems
strong liquidity base of equal importance with capital. The financial crisis brought out
how management overlooked the resilience of banks when liquidity was fading out
and this shortage has been long lasting. On these grounds, alongside principles of
better risk management and supervisory guidance on their effective implementation,
the Committee introduced complementary objectives. First, the liquidity coverage
ratio (LCR) aims at making banks resilient to short-term liquidity risk and second, net
stable fund ratio (NSFR) employs a longer horizon (one year) in order to incentivize
banks to use stable fund resources for their activities. For harmonisation purposes, the
Committee has introduced a minimum set of information for supervisors so as to
monitor contractual maturity mismatch, funding concentration, unencumbered assets,
LCR by currency and market-based tools like asset prices, spreads of credit default
swaps (CDS) and ability for wholesale funding.

46
2.3.1.4. Free banking
An alternative thought would be the dismantling of bank regulation, the laisser-faire
of bank conduct. As already experienced in Canada, Scotland, Sweden and
Switzerland with success, high degree of competition drives innovation and profits by
means of establishing branches and subsidiaries, loaning-out facilities, among others.
Free banking is an ill-defined notion, devised to depict the operation of a competitive
banking market without the regulatory counterpart of a central bank. Deposit
insurance and lender-of-last-resort schemes could be provided by private institutions
(banks, clearing houses) to secure themselves from bank-runs. Under such conditions,
market concentration is favoured when bigger banks are free to impose great charges
on payment and settlement services. However, moral hazard problems are still
possible in that case, since emergency way-outs undermine monitoring of bank‟s
activities and managers‟ gambling behaviour. From a macroeconomic perspective, the
excessive issuance of bank notes may contaminate the stability of the financial
system.
In fact, if those notes are – or perceived to be – perfect substitutes, smaller banks have
an incentive to issue demand liabilities (wildcat banking). Given that informational
asymmetries and mistrust do exist concerning banks‟ solvency and assets,
noteholders, in fear of not redeeming at par, are likely to redeem in specie at larger
banks and affect a run on their fractional reserves. Nelder (2003) supported the over-
issuance of notes by small banks since it is highly likely to be redeemable by bigger
Swiss banks. They all turned out to depreciate franc and approve the establishment of
central bank, as the institution with the jurisdiction of notes issue. An alternative
explanation is given by Rockoff (1975): If it is easy for everyone to set up a bank, just
by depositing a government bond or mortgage in order to issue notes, the way these
notes are valued in conjunction with bonds determines the probability of financial
fragility. In particular, in case of having bonds valued at par and notes depicting the
same value, when the market value is (temporarily) below face value, the „banker‟ has
an incentive to flee with a „loan‟ to himself and bank closure. In addition, Rolnick and
Webber (1984) give credit to the declining value of bonds rather than the wildcatting
47
hypothesis1 as the general constituent of bank failures in free-banking periods of US
states.
However, considerable failures in free banking era should drive further research to
address potential endogeneity in banks‟ operations, failure of bank regulation to cope
with various bank specificities and policy implications of those failures to the recent
deregulating trend (Rolnick and Webber, 1983). Notwithstanding the importance of
such an issue, modern practice is directed to the advancement of international
regulation, setting such an „experiment‟ out of the westernized frame.
2.3.2. Integration
By and large, financial markets have become integrated in the aftermath of the
adoption of the euro. The fast converging bond and equity markets seem to have
outreached the banking industry, which is falling behind with considerable time lag
(Gropp and Kashyap, 2009). Cross-border integration can be expressed in three forms
according to Walkner and Raes (2005), the organic growth of branches and
subsidiaries, M&As and the provision of banking services.
The advent of Euro as a single currency amongst the European countries has already
eliminated the exchange rate risk and transaction costs induced by currency
conversion in arbitrage practices. Cultural and language differences as well as
consumer preferences may also jeopardize the law of one price, or alternatively, the
complete levelling of the prices of assets and financial services (interest rates). Under
free capital flows, a complete convergence may stick at informational asymmetries in
cases where incumbent national banks have a comparative advantage over foreign
entries about clients; the latter is mainly present in relationship-based operations.
Impediments to this ongoing process may be judicial systems that encourage banks to
price loans heavily to customers, who run the risk of going default, to make up for
potential recovery costs. Besides, the fiscal conditions - that is taxes and subsidies -
1 During the period 1816-1863 in US, the only form of banking was degenerated to some dubiously
sound banks being subject to national and not federal regulation and operating in distant places where
only wild cats can thrive (Luckett, 1980). These banks issued private notes circulated at par and backed
by dubious securities (bonds, mortgages, etc). The fact that these notes were redeemable only on those
remote banks caused abuses and swindles by bankers insofar as the National bank act came in 1863 to
forbid „wildcat‟ currency.

48
are likely to directly affect the cost of capital and the relative corporate finance
decisions. Barro and Sala-i-Martin (1992) have put forward the notion of conditional
convergence which simply highlights the tendency of each economy (and interest
rates, too) to reach a different steady state, on the grounds there exist such
macroeconomic conditions that enable special microeconomic fundamentals to have
an effect on market prices.
Local too-big-to-fail champions are also favoured by political interference along with
labour market rigidities and lack of economic diversification hurdling cross-border
mergers in many cases. Integration seems to be high in wholesale banking
(underwriting, rating, trading, brokerage, M&A) and low in retail banking since long-
term relationship business has rendered the proximity to clients and informational
advantage a strong competitive edge (Barros et al., 2005; Fernandez et al., 2007).
Cross-border activity can be intensified by the deployment of branches and/or
subsidiaries in other European countries. Alternatively, banks may join strategic
partnerships with institutions or place particular operations in other states. Structural
break is placed on the date of adopting Euro as a single currency, while developed
countries like France, Germany, Spain and Netherlands have witnessed an increase in
their equity market interdependence, followed closely by United Kingdom and
Sweden. Gropp and Kashyap (2009) found that unlisted, cooperative and savings
banks seem to have no convergence point, constituting thereby a detrimental
impediment of integration.
However, integration might be problematic in terms of diversification. Assuming a
fully integrated area, where business cycles are totally synchronized, there is no room
for portfolio diversification. The per se fact that cross-border activity is hindered by
various barriers in euro area, eliminates any systemic risk potentially emanated by
bank failures and crises. In addition, bank-lending behaviour has demonstrated pro-
cyclical behaviour, in that during economic upturns credit is provided excessively,
followed by stringent loan granting in recessions. In any case, the change in bank
lending is proportionally greater than that of the business cycle exacerbating the
economic conditions either way. Some possible explanations that have been tested in
the empirical literature are informational asymmetries, herding behaviour,
institutional memory, agency problems, etc.

49
Therefore, regulation is deemed to nationalize credit when growth is escalating in
order to alleviate potential loan losses, and boost the economy when it is creeping at
the rock bottom. It is actually debatable whether the regulator of the interbank activity
should be either the home or the host country. On the one hand, the home country
might drive to conflicts of interest to shut down a branch or a subsidiary in another
country as the latter is bound to suffer the economic repercussions of such an event,
whereas in some cases a small country cannot afford to bail out problematic
international bank groups. Fragmentation especially in retail banking defers the
necessity of a supervisory and regulatory body whereby European interbank activity
comes under; what is flickering in the nigh future is a consolidated entity that will
take over in cases of inefficient national actions.
2.3.3. Financial stability
Banks may be a significant channel-through of instability in the economy once
considering liquidity and credit pause drying out payment services and interbank
lending. From a policy perspective, a significant part of the banking literature
investigates the fact whether competition drives to either financial stability or
fragility.
Keeley (1990) showed the franchise value paradigm, that if the market power of
banks, along with profit margins, is diminishing in response to greater competitive
pressures, banks in order to recoup increased returns tend to take on risky projects.
Bank failures are likely to occur when adverse selection and moral hazard make loan
portfolios comprise marginal applicants and thus exacerbate the risk exposure.
However, another severe source of instability is traced at deposit competition; thanks
to the ongoing deregulation of financial markets, interest rates have slumped on the
sly ever since the endeavour of removing entry barriers and expanding restrictions
flourished. In such a situation, banks strive to curb low franchise value and
profitability engaging in riskier asset allocation given that in hard times of insolvency
and banks runs, deposit insurance schemes are stand by to intervene. Hence, it is
deemed to be essential for the authorities to impose restrictions on deposit
competition to discourage „gambling for resurrection‟ (Cole et al., 1995).

50
The other strand of literature contending the competition-stability nexus, emanates
from Stiglitz and Weiss (1981) who showed that monopolistic market structures are to
be blamed for great charges on loans and thereby upcoming defaults. Safe borrowers
are repelled by high borrowing costs and information asymmetries render a significant
part of loans nonperforming and hence constituent of financial instability. Boyd and
De Nikolo (2005) employed the loan market channel in their analysis to conclude that
the positive relationship between risk and competition is fragile. As monopolistic
structures increase loan rates, borrowers surrender to riskier projects. Thus, the
probability of default rates is conditional on banks‟ pricing conduct in the loan
markets. Almost the same applies to Boyd et al. (2006), in which a positive
relationship between competition and financial stability as well as, ceteris paribus,
bank willingness to lend was found after running different model specifications.
Matutes and Vives (1996) put forward a model of unregulated bank competition.
They consider the self-fulfilling expectations of depositors to endogenously affect the
quality – or the failure probability - of a bank. In other words, the bank, which enjoys
depositors‟ trust, will enjoy higher margins and greater market share as perceived to
be diversified and hence safer in their eyes. In addition, they examine the welfare
implications of deposit insurance equilibria: notwithstanding the positive impact of
insurance in preventing crises, mitigating transport costs and extending the market,
deposit insurance guarantee that all banks are credible. Hence, in the absence of no
expected diversification gains to exploit, all banks are discounted at the same rate and
the resulting higher competition hits high failure probabilities. If decisive regulatory
authorities allow for takeovers of the failed banks, banks‟ assets remain put
contributing further to financial stability (Perotti and Suarez, 2000; Nagarajan and
Sealey, 1995).
That is not the case for the model of mean shifting investment technologies by
Koskela and Stenbacka (2000), since higher competition diminishes the loan rates
without necessarily triggering default risk in equilibrium out of the increased
demanded volume of investments. Caminal and Matutes (2002) found the same
pattern, that monopolistic markets bearing the costs of monitoring tend to be more
susceptible to risky loans and thereby subsequent failures. Even Schaeck et al. (2009)
after applying different sets of samples, econometric methodologies and periods, and

51
controlling for macroeconomic factors and concentration, the competition measure
(H-statistic) was persistently related to bank stability.
On the other hand, Allen and Gale (2004) put forward a number of theoretical models
of competition and financial stability trying to shed light on the multifaceted
underlying relationship. They include aspects like spatial and Schumpeterian
competition, agency costs, financial intermediaries and contagion to highlight the
efficient levels of potential trade-off between competition and stability. It is Pareto
optimal, though socially undesirable, to have instability in cases of a) perfect
competition and complete markets, b) present agency problems due to the incentive to
acquire greater market share and „last bank standing effect‟ (Perotti and Suarez,
2002)2 and c) many banks occupying the same locations and lack of innovation
(Schumpeterian competition). Contagion might well be an outcome triggered by the
systemic risk of an aggregate shock on liquidity only where competitive interbank
market leaves price takers off to liquidate their assets.
Along the lines, Boyd et al. (2004) underscore inflation as another key determinant of
bank failure irrespectively to the underlying banking system. When the nominal rate
of interest (inflation) is below a certain threshold, a relatively higher probability of
bank failure is present in monopolies on the grounds that the incentive of loaning out
cash reserves dominates that of paying low rates on deposit accounts. Secondly, asset
loss is greater in competitive structures in times of a crisis, as monopolies tend to
make profits upon the liquidation of assets (e.g. deposits) except cash, for they are
able to provide inter-temporally much lower deposit insurance.
Matutes and Vives (2000), in an imperfect competition model, show that deposit
limits can produce some welfare gains in an uninsured competitive market when the
social cost of failure is prohibitive. In the presence of risk-based insurance on
deposits, the prudent behaviour of banks can be restored improving further social
welfare. In the same vein, Hellmann et al. (2000) allege that the imposition of capital
requirements may have adverse effects on decreasing franchise values inducing banks
to embark on gambling behaviour. However, deposit-rate controls are more Pareto-
efficient instruments that promote prudency in investments even off the equilibrium
2 Supporting the competition-stability literature, it concedes the prudent bank behavior as precipitated
by the probability of the other market players be hit by random solvency shock. At the end, duopolies
turn out to produce great monopoly rents.

52
path. Even when there exist only large institutions in the market, supervisory
authorities should keep a vigilant eye on their prudent operation while the limited role
of deposit insurance schemes should not undermine their per se existence along with
government safety net in times of emergency (Mishkin, 1999).
Martinez-Miera and Repullo (2010) concur that there exist a U-shaped relationship
between competition and bank failure risk. In particular, monopolistic markets
experience the risk-shifting effect, that is more competition with low loan rates
stabilize banks as they run less risk of default whereas the margin effect – lower
revenues of total non-defaulting loans may jeopardize banks in view of potential
entries – occurs usually in competitive markets. Empirical studies of the UK banking
market show less competitive market structures to be stable during the period 1840
and 1940 (Capie, 1995) and sustainably profitable in the past few decades as
compared to the variable performance of German banks. Last, Laeven and Levine
(2009) empirically investigate how risk taking is interconnected with ownership
structures and national regulations. In fact, more powerful owners and equity holders
are willing to engage in riskier investments than debt holders and non-shareholding
managers.
1.4. Conclusion
We reviewed the theoretical underpinnings of competitive issues in European
banking. Academic research has had a particular interest in the structural analysis of
competition along with the pricing conduct of financial institutions since the „80s in
order to provide evidence with fruitful implications for antitrust policies and
institutional reforming of the whole financial system. Hence, to the best interest of
social welfare, bank competition constitutes an indispensable issue closely related to
economic development and financial stability.

53
CHAPTER 3
Empirical models of competition in the European banking

54

55
3.1. Introduction
The review is going to cover the structural approach, whose focal point is the
description of all the extensively applied concentration ratios, discussing their
theoretical characteristics and relative strengths or weaknesses when it comes to apply
and assess them empirically. Next step is to build up a link between structural changes
and bank performance, mainly on the grounds of the Relative Efficiency (RE) and the
Structure-Conduct-Performance paradigm (SCP). Non-structural measures developed
in response to the deficiencies of structural models to quantify bank competition
based on monopoly power measures - the New Empirical Industrial Organization
(NEIO) approach. Another case may be the degree of contestability in a bank market;
that is, few banks or only one implement competitive pricing in order to second its
monopoly power.
Due to the limited capacity of SCP and relative efficiency, Heffernan (2002) made a
step further by proposing a general linear model of competitive pricing of the
important retail banking products: deposits, loans, credit cards and mortgages. Further
insights will be discussed regarding the circumstances under which competition
measures can be significantly differentiated in cross-country and within-country
comparisons. Accounting for all possible reasons hidden thereof, a new indicator of
competition is proposed when employing particular error-correction specifications
(Carbo et al. 2009). Last, Leuvensteijn et al. (2011) first applied the Boone indicator
in the banking industry to see whether efficiency drives profitability in terms of
market shares.
3.2. Non-formal structural methods
3.2.1. The Structure – Conduct – Performance (SCP) paradigm - The relative
efficiency (RE) hypothesis
The Structure-Conduct-Performance model is an empirical model developed after the
Second World War for industrial economics. It is based on empirical studies of
manufacturing industries during 1940s and „50s when monopolistic conditions were

56
quite evident (high fixed costs, firm entry and few competitors). However, this
method lacks any theoretical gratification capturing the idea that a change in the
market structure affects the behaviour and performance of banks. They are willing to
operate inefficiently by not minimising their relative costs as the market is getting
more concentrated.
The so-called collusion hypothesis relates high concentration with reduced costs of
collusion resulting in high prices and profits. Sketching out the model in more
concrete way, structure is determined by the interaction of supply and demand in a
particular industry (Reid, 1987; Scherer and Ross, 1990), conduct is the pricing
behaviour of banks as determined by the cost structure, barriers to entry and the
number of buyers-sellers and performance is equivalent to the profitability measured
by the bank‟s conduct.
The causal relationship that may replicate the reality goes from structure through
prices to profitability proxies like higher profits. The underlying links address the
common practice of oligopolies where banks achieve higher margins by offering
lower deposit rates and higher loan rates. Unlike the monopolistic framework of
Cournot and Dixit-Stiglitz, there is an implicit assumption that monopolistic
competition is exogenously formulated to bar potential entries. Since there exist high
barriers out there, it is wise to give emphasis on the SCP paradigm.
However, it has been critisized by (e.g) Bos (2002), Gilbert (1984) and Vesala (1995)
especially for the one-way causality hidden thereof and the failure of capturing the
recent development of industrial organisation. The component of „conduct‟ has been
overlooked in the empirical literature showing explicit interest in the S – P
relationship.
The Relative Efficiency Hypothesis was developed by Demsetz (1973) and Peltzman
(1979) to give another interpretation of the profitability of banks; high profits are
attributed to the efficient operation, which predicates the higher produced output or
higher capabilities of undergoing low prices. The latter is exactly the opposite of what
SCP surmise about the positive correlation between concentration and prices. Hence,
the degree of efficiency determines the profit maximising conduct (high output/low
prices – Molyneux and Forbes, 1995) and through the increased market share to high
performance (profits).

57
Conjectural sources of efficiency may include a production technology or a better
management much to the X-efficiency of lower costs. High profit margins per unit of
output materialize in the presence of product diversification and/or scale economies,
which are transmuted into higher, market shares (concentration). In this regard,
Vesala (1995) opines that the market structure is endogenously determined by the
performance of more efficient banks.
It is evident how important the hypothesis employed to conduct policymaking is. The
SCM model signifies the imperative of intervening to reduce the market power by
giving incentives to new firms to enter the market. Alternatively, regulatory measures
may be taken to bound the prices such as setting out explicitly how much deposit
(loan) rates can go below (above) the central bank rate. Confirmation of the relative
efficiency gives way to bank consolidation through mergers and acquisitions.
However, particular emphasis should be placed on whether a merger promotes
relative efficiency or just amplifies concentration; the latter case must be forbidden by
all means.
To test the validity of both SCP and relative efficiency hypotheses, a general function
of estimated equations is presented to best capture the vast published work, e.g.
Molyneux et al. (1996), Berger (1995) and Smirlock (1985). Schematically,
Pi,t a0 a1C j,t a2MSi,t ak2Xi, j,tk
k
(3.1)
where
Pi,t : measure of performance of bank i at time t (profits or price)
Cj,t : market structure of the market j at time t, proxied by a concentration measure
MSi,t : market share of bank i at time t
Xi, j,tk : vector of control variables including bank-specific and country-specific
features. Some examples are market demand (per capita income, immigration,
population density), variables to reflect cost and size-reflected differentials (scale

58
economies), various market risks (Molyneux et al., 1996) and state ownership of
banks (Lloeyd-Williams et al., 1994).
The SCP model, reminiscent of Molyneux and Forbes (1996), is verified once we see
only a statistically significant α1 coefficient (α2 = 0), while for the relative efficiency
the exactly opposite must hold. Berger and Hannan (1992) regressed the deposit
interest rate on concentration ratios and various control variables to verify directly
whether SCP and relative hypothesis hold. In this case, the negative sign of the
relative beta coefficient of concentration endorses SCP power. In contrast, if the
dependent variable were the loan rate, SCP hypothesis would be in line with positive
coefficient of the concentration variable.
Alternatively, Berger (1995) elaborated the previous model with measures of X-
efficiency and economies of scale, testing four hypotheses: the market power (MP)
hypotheses, those of SCP and relative market power, and efficient structure (ES)
hypotheses, that is the relative X-efficiency and relative scale efficiency. Hence, SCP
hypothesis would require positive relationship between profits and concentration
ratios, the relative market power positive correlation between profits and market
share, whereas any measure of ES hypotheses prerequisites not only their statistical
significance with respect to profits in the initial model but also vis-à-vis both
concentration and market share variables in separate reduced form equations. That
idea was quite interesting since in previous models, simultaneity problems due to the
relationship of concentration and market share variables biased the respective
coefficients.
Corvoisier and Gropp (2002), employing a Cournot model, regressed the differences
of money market rates from those of retail interest rates for each bank and country
(margins) on concentration (HHI), probability of borrower‟s default, operating costs
(proxied by average cost to income ratio), aggregate demand for loans (proxy:
confidence indices), market capitalisation in each country (proxy: assets to GDP ratio)
and indicator dummies to underline whether the HHI measure is used or not. The
relevant equation was tested for a pool of loan and deposit products.
In general, special attention should be drawn to the different measures of
performance, namely price and profitability proxies. Heffernan (2005) illustrates a
summary of them as occurring in a bulk of published work:

59
Price proxies
Loan rates – interest rates on (e.g.) personal/business loans or residential
mortgages.
Deposit rates – interest rates on term/deposit savings or money market
accounts
Bank service charges levied on a current or standard account
Profitability measures
Return on assets (ROA) – net income/total assets
Return on capital (ROC) – net income/capital
Return on equity (ROE) – net income/stockholder‟s equity
The first group of proxies employs either the average price or the price of particular
products and services (business loans). Even if data on defined product markets is
employed for good, it is usually the case of potential cross-subsidization in multi-
product kind of banks that blur the validity of the overall performance results.
Relevant product markets constitute an interesting issue, as well. The second group of
measures is extensively used in the most recent literature since it groups the profits
and losses of multi-product activities. Some criticisms have been raised here by
Molyneux et al. (1996) and Vesala (1995), who opined for the shortcoming of
profitability measurement upon the basis of both stock and flow variables and for the
likely negative relationship of market power and profitability when banks suffer from
operational inefficiencies. Moreover, the aggregation of profit measures takes no
account of the market power in individual markets.

60
Before delving into the reservations of the underlying models, a brief summary of the
indicators usually met to proxy the market structure should be considered. In various
empirical studies, there are four categories of proxies according to Bikker and Haaf
(2002); Concentration – HHI, k ratio, number of banks, other measures - Market
share – though mostly used to capture bank efficiency - Entry barriers3- Regulatory
barriers: bank charters/branches with the conditions involved, Non-regulatory
barriers: minimum efficiency size, technology, scale economies, product
differentiation – and Number of branches.
It has been argued against the aforementioned models that bank performance is ill-
proxied or poorly explained by a great number of industry and bank-specific
variables; that explains the vague results in favour of either hypothesis (Cetorelli
(2004); Cetorelli and Gamberra (2001) and Beck et al. (2003). The US literature finds
persistence evidence lately that the relative efficiency holds, whereas in European
banking structural factors tend to determine significantly competitive behaviour
(Goddard et al., 2001).
Carletti (2006) argues that financial stability is a new issue closely related to the
collusion hypothesis. Stability is more at stake if monopolistic conditions do not lead
to higher spreads and profitability and banks do not take on risky investments to
imperil their positive market valuations (Hellman et al., 2000). Boyd and De Nikolo
(2005) alternatively argue that borrowers may bear great risks to cope with the higher
interest payment service. Thus, the default risk of borrowers jeopardize the banks‟
loan portfolio; that underlines a disadvantage of SCP paradigm when empirical
studies give more emphasis on structure and much less on conduct.
3.2.2. Formal structural approaches
Martin (1993) has summarized the studies that attempted to formalize the underlying
analysis with the use of certain profitability measures; in most cases, they generalized
the Lerner index of monopoly power. The following framework relies on the premises
3 Vesala (1995) attributes the correlation between concentration and profitability to the dual positive
correlation of regulation with both concentration and profitability.

61
of industrial organizational theory, replicating the derivations of profit maximization
problems made by Cowling (1976) and Cowling and Waterson (1976). Suppose now
there are n banks of different size in the market producing a homogenous product. To
capture this inequality, banks have different cost functions ci xi included in the
profit function:
i pxi ci xi FCi (3.2)
where
πi : profit
xi : the volume of output
ci : the variable costs
FCi : the fixed costs of bank i and
p p X p x1 x2 ... xn (3.3)
The profit maximization of bank i yields the first order condition:
ixi
p p X dX / dxi xi ci xi 0,i 1,2,...,n (3.4)
or
p p X 1 i xi ci xi 0 (3.5)
given that i d x j / dxij i
n
is defined to be the conjectural variation of bank i with
respect to the other banks j i in the market. In other words, it shows how the
market output will adjust in response to a change of the bank i. Cowling argues that
this concept incorporates expectations on potential entries and the behaviour of

62
market rivals if the banks‟ reaction functions are continuous to allow for the
parameterisation of any static/dynamic equilibrium though differentiation in various
market forms.
In case of perfect competition, no change in the market output and price will be
resulted by any marginal change of a bank, so dX / dxi 0 1 i , and thus i 1 .
In a Cournot oligopoly, a bank operates independently since it expects no retaliation
from other banks; that is, market share will increase by the same amount:
dX / dxi 11 i , with i 0 . In perfect collusion, all banks intend to preserve
their market share in view of any potential change of bank i‟s output. Hence, banks
will increase their output such that the ratio X / x will remain put for any unit change
of bank i. The conjectural variation will become i X xi / xi x j xij i
n
.
3.2.2.1. The HHI in a S – P model
Multiplying the equation (3.5) with xi and X2 X 2
, as well as summing all the banks‟
yields,
pxi p X dX / dxi i1
n
i1
n
xi
2
X2
X2 c xi
i1
n
xi 0 (3.6)
Then, we divide both sides by pX,
pxi c xi xi pX xi
2
X 2
p X X 2
pX dX / dxi
i1
n
i1
n
and multiply with dxi / dxi the right-hand side:

63
pxi c xi xi pXi1
n
si2 dpX2
dXdxi pX
i1
n
dXdxi dxi
where si2
xi2
X 2
pxi c xi xi i1
n
/ pX si2
i1
n
1 d x j / dxiji
n
dpX 2dxi
dXdxi pX
where dX / dxi 1 d x j dxiji
n
pxi c xi xi / pX si2
i1
n
i1
n
dxi
dxi d x j / dxi
ji
n
dpX
dXp
pxi c xi xi i1
n
/ pX si2
i1
n
dxi
dxi d x j / dxi
ji
n
n
D
as nD dXp / dpX
pxi c xi xi / pX 1 i1
n
HHI / nD (3.7)
where

64
ixi2 / xi
2
i1
n
i1
n
. The last equation expresses the average price-cost margins in
terms of the elasticity of demand (nD), the Herfindahl index (HHI) and conjectural
variation term (γ). It is in line with the SCP framework, for the high degree of
concentration will ensue great price-cost margins; HHI seems to be appropriate in the
underlying case so long as the γ term is known and the same for all banks.
Dickson (1981) proposed the final expression of the average price-cost margin to be
reparameterized in terms of the conjectural variation elasticity (ti), namely the
proportional change of market output as expected by bank i:
ti dX
dxi
xi
X (3.8)
This new insight is truly welcome since expectations on the degree of banks‟
retaliation illuminate the market structure, let alone it is theoretically derived that
concentration measures can determine price-cost margins. Alternatively, it is
redefined as:
A sitii1
n
, with ti si 1 i (3.9)
Hence, siti si2 1 i
i1
n
i1
n
HHI HHI i 1 HHIi1
n
(3.10)
Suchlike the parameter μi of conjectural variation, the elasticity term ti take values
according to specific market structure. In a Cournot oligopoly,
ti dX
dxi
xi
X 1
xi
X si , while ti
dX
dxi
xi
X 0
xi
X 0 in perfect competition. Last, the
perfect collusion case requires ti dX
dxi
xi
XdX
XX
dX 1 .

65
3.2.2.2. The CRk in a S - P model
Suppose in a market there are n banks, out of which k banks are involved in a cartel.
Hence, n-k banks constitute the competitive fringe of price takers and maximize their
profits when operating at levels where prices are equal to the marginal cost
[competitive condition: p MCi , k 1 ,...,n ]. The supply of the n-k banks is
defined to be the reciprocal of their cost function, i.e. ci1 p ; the aggregate supply is
therefore Snk p Ci1 p
ik1
n
. The market demand is DN p with DN p 0
but what portion of it is faced by the cartel is derived from:
Dk p DN p Snk p , where Dk p 0 and Sn k p 0 . Taking the derivatives
of both sides with respect to p and dividing them with Dk p / p , we have:
Dk p p
Dk p DN p
p
Dk p Sn k p
p
Dk p (3.11)
nDk nDNDN p Dk p
nSnkSn k p Dk p
(3.12)
The k-bank cartel maximizes its profits according to the letter of Lerner index. In
particular, it sets the P-MC margin equal to the reciprocal of the elasticity of its
demand.
p c j
p
1
nDk
1
nDNDN p Dk p
nSnkSnk p Dk p
Ck
nDN nSnk 1Ck
where

66
DN p Dk p
1
Ck and
Sn k p Dk p
DN p Dk p
Ck
1
Ck1
1 Ck
Ck (3.13)
It is finally justified to include the CRk concentration ratio in the empirical
applications of S – P model, given that the market is dominated by a cartel of k banks.
3.2.3. Concentration ratios
Concentration ratios capture the structural features of a market. They are used in
models or interpreted in conjunction with other performance measures to explain the
competitive behaviour of a specific industry without sufficing stand-alone to
extrapolate competitive conditions. Even changes in concentration can be deduced
regarding market entries and exits, a feature widely used in U.S for anti-trust
purposes.
The literature of industrial concentration has proposed a bulk of measures, all
showing a final convergence towards the inclusion of two elements: number of banks
and the size of them. The general form (concentration indices) of all the measures to
be presented hereinafter is captured by:
CI SiWi
i1
n
(3.14)
where
Si: the market share of each bank i
Wi: the weight attached to each share
n: the number of banks

67
Marfels (1971) and Dickson (1981) made a theoretical classification of ten
concentration measures according to their weighting scheme and structure; in some
cases, some ratios are consistent with more than one weighting schemes or with none.
The weighting scheme refers to the sensitivity of each measure to changes in the tails
of a bank distribution.
I. To an arbitrary k number of banks, a weight of unity (i k) is attached,
while to the rest a weight of zero (i > k) . Example: K concentration ratio.
II. The market shares are properly weighted by the per se shares (Wi Si ,i) .
All banks are employed in this case with larger banks getting larger shares.
Example: Herfindahl-Hirschman Index (HHI).
III. The weights of all banks take the form of the ranking number of banks either
in ascending or descending order (Wi i,i) . Examples: Rosenbluth index
and Hall-Tideman index.
IV. Although Marfels used as weights those of a weighted geometric mean, Bikker
and Haaf (2002) proposed the negative of the market share logarithm
(Wi logSi ,i) . Thus, larger banks get a smaller absolute weight;
examples: Entropy index.
The relative structure of its concentration ratio is discrete or cumulative. The former
refers to the level of the concentration curve at a conjectural point (recall k
concentration ratio). The concentration curve measures the cumulative market share
(vertical axis) against the bank rankings in the market (horizontal axis). The curve
increases from left to right with a diminishing rate reaching the level of 100 per cent
of the market share at the point (x) where all banks of the market are included. In the
following graph, 85% of the market is held by 10 banks while the other 15% by the
remaining 10 banks.

68
Graph 1: The concentration curve
100
75
50
0
10 20
Advantages of this category are the simple limited data needed, as those markets
dominated by few large banks will change marginally by all the rest institutions.
Concerns against it have been raised stressing a severe disadvantage of discrete
indexes: they cannot capture structural changes in the number of banks which are out
of the index, overlooking the possibility that the competitive behaviour of small banks
may force the dominant ones to act appropriately.
Cumulative measures of concentration examine the whole bank distribution, capturing
all the structural changes occurred in every part of it. Some examples are HHI, CCI,
RI and E. Juxtaposed to them, discrete measures cannot easily identify the changes
precipitated either by the changing number or by the size disparity.
3.2.3.1. The k bank concentration ratio
It is the most frequently used in the empirical literature. The following general form
simply sums the market shares of an arbitrary number of large banks, treating equally
the k leading banks. Small banks are out of the frame, as the ratio is one-dimensional
measure taking values from zero to unity. In the case of zero, we have an infinite
number of equally sized banks whereas unity suggests that the chosen banks make up
for the whole market.

69
CRk Sii1
k
(3.15)
Assuming that a market comprises n banks of equal size then,
CRk 1n kn ne
kCRki1
k
(3.16)
Ne denotes the Numbers-equivalent as proposed by Adelman (1951) and White (1982)
later on. It simply transforms the concentration ratio to a number of equally sized
banks, which represent a level of concentration similar to the ratio.
3.2.3.2. Herfindahl - Hirschman Index (HHI)
It is widely known in the theoretic literature and in politics as a usual benchmark of
antitrust enforcement laws. Cetorelli (1999) gives some guidelines for the evaluation
of an imminent merger; it is approved if the post-merger market has a HHI ratio lower
than 0.18 so long as the change of the ratio compared with the pre-merger market is
0.02 at most. Alternatively called full-information index as incorporating all features
of the entire distribution, it has the following form:
HHI Si2
i1
n
(3.17)
The interesting feature of the index is that a greater weight is assigned to large banks
(squared market shares) and all small banks are included in the estimation; it avoids
arbitrary cut-offs and inertia to market share changes, as opposed to the CRk ratio that

70
finds it hard to resolve. It takes values ranging from 1/n and 1; the former illustrates a
market of equally sized banks and the latter monopolistic conditions. Davies (1979)
concludes that the more sensitive the index becomes the less the number of banks in
the market. Adelman (1969) and Kwoka (1985) rewrote the HHI in terms of the mean
𝑛 , the index ends up with the following form:
HHI s Si s 2
i1
n
or HHI 1n n 2 (3.18)
Observing the equation (2.5), the relationship of HHI with its both constituents is not
straightforward. Holding the number of banks constant, Adelman (1969) asserts that
the HHI increases with the variance, but the latter is a function of the per se number of
banks. On the top of this, HHI can take the same values with different combinations
of variance and bank number (Kwoka, 1985), without constituting necessarily a
blemish. In the same vein, Rhoades (1995) foresees the same HHI derived by great
inequality in market shares across different bank markets.
To derive the numbers equivalent of HHI, we again consider equal size in all banks:
HHI 1
n
i1
n
2
n1
n
2
1
n (3.19)
Recall that the value 1/n is the minimum value in the space of the standard HHI; thus,
HHI can be a measure of at least two different size distributions.
Hart (1975) followed a slightly different method for cases where the number of banks
was not exactly known. Surmising that the only available information is the banking
market size and its classification, he proposes to split up the distribution of bank sizes
into classes and estimate the parameters of the original distribution by parameter
estimations of the second moment distribution (the distribution of bank size among
size classes); to do so, a relationship between the distributions is given. Hart (1975)

71
concludes that HHI is derived by n0
2 1
N, where n0
2 is the coefficient variation. The
latter is generally defined as:
c V / x (3.20)
where x the mean bank size and
V xi x 2
i1
n
n (3.21)
3.2.3.3. The Hall - Tideman Index (HTI) and Rosenbluth Index (RI)
The HTI and RI indices were proposed by Hall and Tideman (1967) and Rosenbluth
(1955), respectively. Hall and Tideman (1967) wrote down a set of rules that all
concentration ratios should satisfy, and only under such conditions they could accept
HHI. Their index assigns great absolute weights to the small banks, rendering it very
sensitive to small bank entries. It takes the following form:
HTI 1 2 isi 1i1
n
(3.22)
The market share of each bank is weighted by its order ranking, ranging from i =1 for
the largest banks and higher values (on) the more banks are listed. The index takes
value from zero to unity, namely from perfect competition case of infinitely equal-
sized banks, to monopoly. Alike HHI, in the case of equally sized banks, HTI gets the
value of 1/n. Thus, the numbers equivalent is derived to be ne 1 / HTI .
The Rosenbluth index is highly sensitive to small banks in the distribution, as it uses
the same weights with the HTI measure. It essentially depicts the distance (C) from

72
above the concentration curve to the horizontal line where the curve becomes
marginally tangent at 100 per cent market share. It takes the form:
HTI 1 2C (3.23)
Hause (1977) criticizes the usefulness of the RI measure in highly concentrated
markets, as it fails down to capture the real change in competition when displaying
high sensitivity in entries of small banks.
3.2.3.4. The comprehensive industrial concentration measure
This measure has been the product of a hot debate over the appropriability of
measures when capturing either concentration or dispersion in the banking sector. The
former takes account (only) the structural changes occurring in the largest banks while
the latter (e.g. the Lorenz curve and the Gini coefficient) estimates the dispersion of
the market undervaluing the share of the large firms. Horvath (1970) constructed a
new measure that captures and alleviates the deficiencies of earlier studies. It has the
following form, reminiscent a bit of the HHI:
CCI s1 si2 1 1 si
i2
n
(3.24)
where
s1: the market share of the leading bank and
si: the market share of the rest.
The most interesting thing about this measure is the absolute accentuation of the
leading bank and the relative dispersion of effect due to the smaller banks. It gets

73
values of unity if monopoly is the dominant market structure and values greater than
the absolute value of s1 the larger is the number of the remaining banks.
3.2.3.5 The Hannah and Kay index
The general form of the index as proposed by Hannah and Kay (1977) is the
following:
HKI sia
i1
n
1 1a
, a 0 and a 1 (3.25)
where the parameter a is the elasticity of concentration with respect to entries/exits of
the market and sales shifting through banks. The choice of what value this parameter
should take reflects the alternative and contradictious beliefs of the weighting scheme;
that is to be placed either on large banks (upper segment) or on smaller ones (low
segment of the distribution).
If, for instance, α tends to zero (0) the index gets closer to the number of banks in the
market, and if α goes to infinity the index amounts to the reciprocal of the largest
bank share. The numbers equivalent can be easily derived by solving for ne:
HKI ne 1 ne a
1 1a (3.26)
The effective average size of the banks within a market is defined to be the market
size divided by the numbers equivalent. The reduction in the concentration index will
be the greatest if a bank, whose size is equal to the effective average size (EAS), steps
in the market. If a bank of greater EAS enters, concentration will be less affected to
diminish; it might be the case of being reversed if the size effect outweighs the
number(s) (equivalent) effect. However, in cases of a bank expanding its size more
(less) than the EAS, the HKI of a given market will aggravate (abate).

74
3.2.3.6. The U index
Davies (1979) developed the index in response to the usual shortcoming of many
indices, which place overweight either on market inequality or the number of banks in
it. It takes the form:
U I an1 , where a 0 (3.27)
I: measure of inequality
n: number of banks and
α: the elasticity parameter which can be estimated after running the model i Ci
where πi and Ci are the price-cost margin and concentration in the market I,
respectively. Before doing so, U replaces Ci and logarithms transform the model into
the following form:
log i loga a log Ii logni ui loga 1 log Ii 2 logni ui (3.28)
where β1 = αβ and β2 = - β. Combining β1, β2 the parameter α can be derived by
1 / 2 . According to Davies‟ cogitation, U index is theoretically approached by
plugging in the Equation (3.27) the inequality defined to be a simple transformation of
the coefficient of variation (c2), 1 c2
. Given that the latter is estimated by
xi x 2
/ ni1
n
x 2
, it is straightforward to extrapolate the final expression of
inequality:
I xi
2
i1
n
nx 2
xi
2
i1
n
n
xii1
n
2
n2 n si
2
i1
n
(3.29)

75
since sii1
n
2
1
U n si2
i1
n
a
n1 na1 a si
2
i1
n
a
si sina1 a
i1
n
a
(3.30)
Davies attempted to investigate the sensitivity of U index to mergers and new bank
entries. As anti-trust policies base decision rules upon the well-known Herfindahl
index, the average effective size should equal to the industry size over the numbers
equivalent calculated from the HHI. The elasticity parameter a is proposed to be
bounded (∴≤ 1) allowing for the empirical studies to provide plausible results. In this
regard, the U index is increasing with a merger indicating greater concentration,
whereby the proportionate change is directly linked to the size of merging banks.
However, the sensitivity of the U index with respect to different kind of mergers is
prescribed by the high values of α apart from the large size of the merging banks.
If a bank enters the market, concentration will shrink, provided that its size in no more
than twice as much as the EASHHI; the recorded reduction can be maximized if the
bank size hits the exact average effective size. Small banks, on the other hand, will
result in minimal effects depending on the „sensitivity‟ values of α. The practical
justification of the restriction of α is nonetheless over against the theoretical
gratification of oligopoly. In particular oligopolistic incentives of mergers will not be
realized as long as α is sufficiently greater than unity. Hence, the only case of
delivering plausible and theoretically justifiable results is when the elasticity
parameter takes the value of one (1) – U index coincides with HHI.
3.2.3.7. The Hause indices
Hause (1977) proposed two industrial (Cournot) concentration indices that abide by
the six rules he thought important for a measure to be theoretically grounded. Inspired
by the Cournot model, his concern is over collusion effects (parameter α) in an

76
oligopolistic environment. He made numerical applications to conclude finally in the
advent of new banks n in the market, low values of α (high collusion) make the
transmission „creep‟ into higher degrees of competition. It takes the form:
Hm a, si si
2 si HHI si2
a
i1
n
(3.31)
where
HHI: the Herfindahl index
α: inversely related to the degree of collusion
The parameter α is then restricted for to secure the index to be a decreasing
convex function of the numbers equivalent. As α is getting closer to infinity, the index
approaches HHI. Hause went on identifying the range of the power of si given the
underlying restriction; the component si HHI si2
a
of the si exponent is always
less than unity, implying that the overall power exceeds unity.
However, the extent to which the index is rendered to be valid relies on the per se
values of α. If, say, the parameter α tends to infinity, the weights attached to every
single bank‟s market share collapse to those of HHI. The values of the Hause index
ranges from unity to 1 n 1 n1 n3
0 for monopoly and infinite number of equally
sized banks; the latter case seems to converge to Herfindahl‟s index minimum
(1 n 0 , if n ). Alternatively, Hause proposed the adjusted Cournot measure,
defined as:
Ha , si si2 si HHI si
2
a i1
n
, 1 (3.32)
77
The restriction guarantees the convergence of the index to the HHI as the number of
banks is escalating. If the market comprises banks of equal size, the Hα index gets
values according to the relationship: n1 n12 1 n1
.
3.2.3.8 Entropy measure
This measure lays its theoretical underpinnings in the ex-ante expectations of a
distribution‟s information content. Its typical form is:
si log2 sii1
n
(3.33)
It takes values from 0 to over and above unity since its maximum is log2 n . Lower
values of it indicate high monopolistic conditions, whereas values closer to its
maximum imply equal market shares and low concentration. In addition, White
(1982) observed the index falling as inequality exacerbates amongst a fixed number of
banks, and the weights attached to market shares decrease in absolute terms as these
shares become larger. Last, the numbers equivalent of the index gets the form
ne 2E .
Apart from the CRk and HHI, all the other measures have been rarely applied in
empirical studies. These two measures are used as proxies for the market
concentration in the so-called structural approaches of competition – the SCP
paradigm and the efficiency hypothesis. Not surprisingly, when it comes to use all the
aforementioned methods for the same market, the results are patchy and diverging
reflecting thereby the different weighting schemes. Policymakers assess the relative
impact of small/big banks each time, the size distribution or the number of them on
the market concentration so as to use certain indices that fit in the special features of
the market.
78
3.3. Non-structural methods
An alternative analysis of market competition can be directed towards the observation
of the pricing behaviour and the degree of market contestability, a notion developed
initially by Baumol (1982) and Baumol et al. (1982). To assess the predictive power
of SCP paradigm, non-structural indicators should be employed as the case under
examination is the „competing oligopolists‟. Lerner‟s (1934) measures of competition
constitute the ground upon which all the non-structural indicators have been
developed. In particular, the measures are Iwata (1974), Bresnahan (1982), Lau
(1982) and Panzar and Rosse (1987). The underlying empirical literature is known as
the New Empirical Industrial Organization (NEIO) approach, which sets out
behavioural equations concerning the price/output specification.
The measures have a common factor: they all stem from equilibrium states of a static
framework and signify price deviations from an ad hoc competitive benchmark.
Unobserved bank data cannot endorse bank conduct at the point where marginal
revenue equals marginal cost. However, an indirect measure could be to observe the
patterns of variation in the employed variables and then see how the pricing rule is
treated to justify them.
3.3.1. The New Empirical Industrial Organisation (NEIO) approach
The empirical literature of the New Empirical Industrial Organisation approach has
extensively applied the Bresnahan and Panzar and Rosse models. The Lerner index, as
applied in the Italian industry by Angelini and Cetorelli (2003), is defined as „the
relative mark-up of price over marginal cost‟. Schematically,
Lc n (3.34)
where
n: number of firms

79
ε: the elasticity of demand
ν: the conjectural variation of output (a bank‟s expectations about the industry output
to be responsive to a change of its own output).
Competition is escalating the lower the index. In that study, it was regressed on a pool
of independent variables (e.g. HHI, number of firms) to investigate sources of
potential mark-ups. Positive sign was found in the number coefficient and negative in
the concentration one. That finding implied the rejection of the SCP hypothesis and
was attributed to the increased efficiency gains once banks, facing market
contestability, were to go about strategic consolidation. However, contestability is at
odds with the positive and significant coefficient of number of firms whereas
simultaneity problems that pop up when HHI measure is constructed by the number of
firms, jeopardize the interpretation of the underlying results.
Bresnahan (1989) constructed an empirical framework of the market power
determination of the average bank, on the basis of the previous work of Breshanan
(1982) and Lau (1982). It turns out to be a straightforward transformation of Lerner
index, the mark-up of price/average revenue over marginal cost. The method includes
a parameter of conjectural variation: d x j / dxij i
n
/ n,0 1 , which is
determined by the simultaneous equations of market demand and supply. Recall that
dX / dxi 1 d x j / dxiji
n
is a different thing since under bank equality assumption,
μ is unique for the average bank. Shaffer (1993) argues that for profit maximization
purposes, banks set marginal cost equal to a perceived marginal revenue which
coincides both with the competitive demand price and the marginal revenue of the
market collusive extreme.
Tracking the extrapolation of the μ values in the previous section, in the perfect
competition case, 𝜇 is equal to zero so as to equate 𝑝 with the marginal cost. In the
Cournot oligopoly, dX / dxi 1 d x j / dxij i
n
1 , thus d x j / dxij i
n
0 and

80
k 1 n . Perfect collusion requires d x j / dxiji
n
X xi xi and in a final analysis
k 1 X xi / xi / n xi / nxi 1,i .
Banking markets may be contestable in cases where few banks or only one
implements competitive pricing in order to second its monopoly power. By setting
prices close/equal to marginal cost, there are no barriers to entry or exit for
newcomers. Hence, if incumbent firms raise their prices to earn abnormal profits, new
firms will hasten to reap the high margins. That highlights the „hit and run‟ entry and
exit at the time the former banks decide to lower the prices. In this manner, oligopoly
or even monopoly in banking market demonstrates a persistent competitive behaviour.
The potential of new coming banks to hit the market is also prescribed by further
market features such as whether the time lag of bank repricing is greater than that of
costumers to switch suppliers, whether the access to the employed technology or
factors is similar for all participants along with no sunk costs at all; the latter consists
in fixed costs that become irrevocable since a bank cannot sell it in a secondary
market when forced to step out of the market. Under such conditions, new banks entry
the market when (e.g.) incumbent firms price deposit (loan) rates lower (higher) than
in a perfectly competition state, and thereby capture a market share with lower prices
insofar as incumbent banks react by narrowing down the margins.
If a particular market is found to be contestable, the fear of entry implies the
maximisation of consumer surplus on the grounds that competitive pricing of
incumbent firms is present to discourage policy measures against abnormal profits.
Shaffer (1982) first argues as well as Nathan and Neave (1989) later on that Panzar –
Rosse (1982; 1987) statistic (PR) constructed until then for competition tests in
newspaper industries could be applied in the US and Canadian banking markets.
The aforementioned models of SCP, relative efficiency have been set aside as
suffering from many difficulties. Berger (1995) adduces their limited capacity of
explaining bank profits although a bulk of empirical studies employed them during
the last two decades and provided patchy results. Even the PR statistic has its
limitations stopping short at testing the degree of competition in a bank market.

81
Panzar and Rosse statistic, on the other hand, presupposes that banks will maximize
their profits at the point where marginal revenues are equal to marginal costs:
R xi ,n,ri Ci xi ,vi , zi 0 (3.35)
where
xi : output of bank i
n : number of banks
ri : a vector of exogenous factors that shifts the revenue function
vi : a vector of k factor input prices of bank i
zi : a vector of exogenous variables that shift the cost function.
In the non-profit state of market equilibrium, we end up with the equilibrium values
of specific variables (denoted by *):
Ri* x*,n*,ri Ci* x*,vi ,zi 0
The method measures the change in equilibrium revenues in response to a change
in factor input prices. PR constructed a measure of competition as being the sum of
elasticities of the reduced form of revenues with respect to the factor input prices.
H Ri
*
vkii1
n
vki
Ri*
(3.36)

82
For a given increase in factor prices, competitive markets are expected to experience
an equiproportionate H = 1 change in total revenue, whereas monopoly should
realize reduction in revenues − ∞ < H < 0 as higher costs increase price in the
elastic part of the market demand curve. Monopolistic competition should be the case
along the space 0,1.
Before making reference to the alternative models of competition, we should note the
Hall-Roeger methodology even if it is popular in applications of the manufacturing
industry. It is essentially developed by Hall (1988) and extended by Roeger (1995) in
the US industry. Hall (1988) argued that „the variation of the standard Solow residual
must be unaffected by the log-change of output in the change of monopoly‟ (Rezitis,
2010). Roeger (1995) showed the way we can get rid of unobservable productivity
shocks through the use of differences of Solow residuals that stem from production
and cost. If we assume that the banking market produces output Q through the
utilisation of labour l and capital k, the production function has the following form:
Qt t f (lt ,kt ) (3.37)
where θ denotes the term of Hicks-neutral productivity. The production-based Solow
residual (SR) is defined as the difference between the growth of output and input,
with the latter weighted by their contribution to the total value added. That is
theoretically grounded on the presumption of constant returns of scale, perfect
competition in the inputs market as well as imperfect competition in the products
market. Hence, SR is estimated by the following equation:
SR Qi,t
Qi,t i,t
li,t
li,t 1 i,t
ki,t
ki,t Li,t
Qi,t
Qi,tki,t
ki,t
1 Li,t
i,t
i,t (3.38)
where γ defines the cost of labour over total value added wtlt / ptQt , where wage
amounts to wt, and pt the output price. The L coefficient highlights the degree of
market power, which is effectively the price mark-up over marginal cost (the Lerner
index). However, when it comes to estimate the above equation, the productivity term

83
θ is correlated with the error term producing biased results. Roeger (1995) proposed a
resolution to the problem in the underlying estimation by obtaining from a cost
function the difference between the changes in weighted factor inputs and that in
prices:
DSR twi,t
wi,t 1 i,t
ci,t
ci,tpi,t
pi,t Li,t
pi,t
pi,tci,t
ci,t
1 Li,t
i,t
i,t (3.39)
where ct is the (user) cost of capital. We subtract equation (2.27) from equation (2.26)
to get rid of the productivity shock:
Qi,t
Qi,tpi,t
pi,t
i,t
li,t
li,twi,t
wi,y
1 i,t
ci,t
ci,twi,t
wi,t
Li,tQi,t
Qi,tpi,t
pi,t
ci,t
ci,twi,t
wi,t
(3.40)
3.4. Alternative models
Heffernan’s generalized linear pricing model proposed an alternative approach of
competitive pricing of the important retail banking products in UK market: deposits,
loans, credit cards and mortgages. The intuition behind is focusing on the factors
affecting the pricing setting behaviour in the retail banking sector.
Heffernan (2002) then tried to investigate how UK retail banking market price loans,
mortgages and credit cards. The proposed model is the following:
Rdi,t a0 jLibort j t iDi nt i,tj (3.41)
where

84
Rdit: gross domestic rate paid by firm i at time t
Libort-j, j=0, 1, 2, 3: monthly lags used on the London interbank offer rate
n: number of banks offering the same product
t: time trend
Di: dummy variable for each financial firm i (1,0)
For loans and mortgages, the dependent variable is Rlit, namely the annual percentage
rate imposed by firms i at time t:
Rli,t a0 jLibort j t iDi nt i,tj (3.42)
For the credit cards, the Rlit variable remains put but on the right-hand side of the
equation (5.2) the fit variable is added up to capture the fee charged by firms i at t:
Rli,t a0 jLibort j t iDi nt t fi,t i,tj (3.43)
The data4 of all variables were on monthly basis over a period of 1993-99 and the
underlying equations were estimated by running ordinary least squares. This method
was appropriate for pooled data set of banks but utterly inefficient when more data
available for each bank produced high orders of autocorrelation. To resolve the
problem, an autorgressive error regression model was employed to compute the
maximum likelihood (ML) estimators with more than 95% fit (R2) and no
autocorrelation evidence from the relevant Durbin – Watson test (DW).
4 For the complete explanation of how the representative account was determined along with the rate
quoted, see Heffernan (2002).

85
After running the econometric models and coming up with the results, a benchmark is
needed as a proxy of the competitive rate to compare the involved rates. Heffernan
proposed the rate quoted by each bank for its overnight transactions, that is the Libor
rate. It represents the opportunity cost of all bank‟s assets, the basis upon which the
marginal cost of all liabilities as well as the marginal revenue of all assets are
estimated. It is the best proxy of an international competitive level of all rates –
including deposit, loan, mortgage and credit card - especially when all banks have
access to it. In this regard, some pricing intertia with respect to current Libor leads to
the employment of a lagged rate by up to three months, as explicitly determined by
the monthly average of the daily three-month Libor.
The n variable is chosen to test for Cournot behaviour in case its coefficient is
positive (negative) in the deposit (loan) equations. It is also an implicit test for market
contestability since a significant coefficient of n variable throughout all equations
rejects the null hypothesis of contestability; that is the price setting is not sensitive to
the number of incumbent banks.
The dummy variable of each firm relies on the model of monopolistic competition as
developed by Salop and Stiglitz (1977). When market conditions are such (lower
fixed costs, increased demand) that favour an increase in the number of firms, it is
matter of information to actualize a good buy. Information costs are unforeseen while
some costumers know how prices are distributed across banks and some customers do
not. In the former case, low prices are accomplished (bargains) otherwise banks will
step out of the market; the latter case simply includes banks charging higher prices
(rip offs) exploiting the market ignorance of ill-informed customers. Hence, a bank
market incorporates firms, which make profits either by offering expensive products
as long as ignorant customers purchase them, or by selling a higher volume of cheaper
products.
In order to test the competitive behaviour of a bank, the dummy variable gets values
„1‟ for the rate values of a particular bank and „0‟ otherwise (for other banks). For a
certain product, the respective coefficient of all banks is then displayed in terms of a
default bank; in other words, the coefficient of the default bank is subtracted from all
banks‟ coefficients to construct a margin of deviations around which the relative best
bargain and the worst rip off can be spotted. It should be noted that the selection of a

86
default bank is firmly grounded on its available set of data of all under-investigation
products allowing for the major players as well as new players to be ranked. Had there
been another comparator as the default bank, neither the range of deviations nor the
relative rankings would have altered.
An interesting insight would be if the coefficient on the number of firms is juxtaposed
to that on the dummy variable of the Salop-Stiglitz model. The Cournot model is
compatible with the practice of bargains/rip-offs under certain circumstances; that is,
a rise in the number of firms might result in adopting the practice of lower prices as
determined by the relative effect of bargains and rip offs. In any case, the SS model
measures the monopolistic competition irrespectively of the number of firms that
formulates it. For example, the markets could be characterized as contestable if the
margins are low in tandem with the insignificant coefficient on the number of firms
(in the case of savings).
Hence, net interest margin seems to be appropriate to measure competition in
traditional banking services (deposit/loan) in Europe. In contrast, Lerner index and
ROA capture competition better in the general banking activity since they include
both non-interest returns (fee and off-balance sheet returns) and non-interest
(operating) cost.
Leuvensteijn et al. (2011) proposed the application of the Boone indicator as a new
measure of competition on the loan markets of the major European countries, Japan,
US and UK. It is differentiated, hence, to the other measures, in that its application
may lie in particular segments of the banking market and for several types of banks
without even requiring a great pool of data. It is the first measure that is used in the
banking sector, though firstly proposed and elaborated by Boone (2000; 2004) and
Boone et al. (2004). It measures the extent to which efficiency affects performance in
terms of market shares or profits, thus to be verifying the relative efficiency
hypothesis. It assumes that part of the efficiency gains are passed on to the clients
while its shortcoming is that the model does not control for qualitative features like
design and attractiveness of innovation.
Leuvensteijn et. al (2011) build upon one of the preceding theoretical models of
Boone (2000; 2001; 2004) and Boone et al. (2004). According to the latter, each bank
i produces output qi facing the following demand function:

87
p qi ,q j i a bqi d qiji
(3.44)
Each bank is facing constant marginal costs mci and we assume that a mci and
a d b . The first-order condition of the profit maximisation problem
pi mci qi is simply the following Cournot-Nash equilibrium:
a 2bqi d qi mci 0i j
(3.45)
In case N banks are producing positive outputs, the N first-order derivations end up
with the following form:
qi ci 2b / d 1 a 2b / d N 1 mci mc jj
/ 2b d N 1 2b / d 1
(3.46)
Entry costs ε are excluded in this case and, in equilibrium, banks are willing to entry
the market as far as i . In the underlying market, competition is likely to heat up
the closer substitutes are the interbank services and the lower is the entry cost (ε).
Then the following model is constructed after computing the market share by
si qi / q jj
:
ln si a lnmci (3.47)
Any bank facing lower marginal costs is becoming more efficient in the market. The
greater is the competition the stronger will be the effect on obtained market shares.
The parameter β, the Boone indicator, is therefore expected to have a negative sign
and obtain high absolute values amid competitive pressures. Although the model was
formerly specified in log-linear form to eliminate heteroskedasticity, this form enables

88
interpretation across equations, as the parameter β is elasticity. As being time
dependent it is calculated separately for each year to verify whether there exists a
significant change over time in the same industry. Such interpretations are less robust
if the parameter β is cross-sectionally compared across different sectors or countries at
the same date.
Efficiency in banks may be expressed either by increased profits through cost
minimisation or by low prices to gain market share. Boon indicator is intuitively
constructed to explain bank behaviour in between these two extrema. Therefore, it
presupposes that banks pass part of their efficient gains to their clients. That is quite
expected in the passing-on activity of all banks, whereby convergence to such pattern
is justified.
The advantage of this model is that marginal costs are focusing certain banking
sectors where no information are available and the use of market share, rather than
profits, which can take negative values. In line with the theory, by employing translog
cost function (TCF) we derive the marginal costs so as to avoid averaging variable
costs. It is actually a second-order Taylor expansion around the mean value of the
dual cost function satisfying the rules of linear homogeneity and cost exhaustion. For
every national banking sector, it incorporates bank outputs (securities, loans, other
services), factor inputs (wages, other expenses) and a control variable (equity ratio) to
correct for loan portfolio risks as proposed by Berger and Mester (1997).
Carbo et al. (2009) constructed an alternative metric of bank pricing power,
accounting for differences amongst the aforementioned competition measures. What
might explain those cross-country differences is boiled down to cases when TR is
shared by fees and off-balance sheet revenues (non-traditional banking services),
operating cost is diminishing at a different rate (ATMs, etc), banks of unequal average
size imply different scale economies across countries and taxes - loan losses are
different as well.
Hence, as country-specific indicators may distort competition measures, Carbo et al.
(2009) proposed a linear error-specification model of the employed competition
measures with the following independent variables:

89
Operating cost to asset value (OCTA) – the intuition hidden here is that influences in
profitability and rate of return explain cross-country discrepancies in cost efficiency.
The lower the ratio, the greater the cost efficiency is. Annual rate of real GDP growth
(GDPGR) – bank profitability is expected to rise in the peak of the business cycle due
to extensive loan provision. Cost of living index (COL) – high inflation is directly
linked to the previous case. Fee income to asset value (FEEINC) – as already
mentioned, banks deal with traditional and non-traditional activities; the former
engulfs the deposit and loan services, which are less sophisticated but, nonetheless,
more efficiently priced in the market. The latter comprises fund management,
derivatives, insurance services, underwriting and so on rendering the control of them
an imperative to verify whether it is the case of affecting competition measures. Type
of the bank (TYPEBANK) – commercial, savings, cooperative.
The regression model with all the presented variables is schematically the following:
CM i a0,i a1,iOCTA a2,iGDPGR a3,iCOL a4,iFEEINC a5,iTYPEBANK ui i
(3.48)
where
i = NIMTA, Lerner index, ROA, and H-statistic
The expression ui i is supposed to include the random error ui and the
unexplained part εi of each competition measure (CMi). Carbo et al. (2009)
interestingly propose this part to be a proxy for the bank pricing power after being
subjected to adjustment for the effects of the independent variables, i.e. cost
efficiency, non-traditional banking activities and changes due to inflationary pressures
and the business cycle. The process of doing so is to take averages of the whole
expression concerning all banks over time and add the estimated intercept of each
equation to the error term so as only the real effects of the independent variables are
not „accounted‟.

90
The adjusted measure highlights the cross-country bank average control over prices
and increase significantly pairwise correlations between the new concentration
measures. That is because NIMTA, Lerner index and ROA are influenced by the
operating cost or the fee income irrespectively whether they are expressed either in
the quantity or the weighted average price component of the change in the
concentration ratios (or both). However, the H-statistic is affected only by the
association of changes in the input prices and not at all by changes in the operating
input quantities as it assumes fixed bank output and composition. Carbo et al. (2009)
observed that H-statistic did not perform well, possibly due to relatively greater
changes in the output component.
The most recent development in literature regarding the measurement of competition
is that of Bolt and Humphrey (2010). The latter has inspired the idea from efficiency
analysis applying frontier methodology for the ranking of countries in terms of
competition intensity instead of estimating absolute measures of market structure. The
motivation here is that the existing literature has focused on single measures that
provide inconsistent results when compared in cross-country and time-varying
comparative studies, while they fall short of covering non-interest activities other than
traditional ones. Such insights are addressed by applying the distribution-free
approach on a SUR framework and surmising that the key determinants of bank
revenues are boiled down to the effects of unit operating costs, factor input
productivity and competition in the banking market. The general form of employed
models is schematically the following:
ln(R /OC) f (X,P) lne lnu (3.49)
where R denotes R1: non-interest income over total operating cost, and R2: revenues
from the spread of deposit-loan rate. P is a vector of the average price of labour, the
market interest rate that expresses the opportunity cost of investment in bank physical
capital. X expresses the vector of unit costs of processing payment transactions, and
ATMs, indicators of labour productivity and substitution of ATMs with branch
offices, GDP output gap (in model R1) and the risk proxy of capital (in model R2).
What is left off, after the standard error (lnu) fades out over the time, is the
component (lne), out of which we estimate competition efficiency according to

91
e / emin 1. The underlying evidence, when juxtaposed to the results of standard
competition measures (H-statistic, CR-3, among others), demonstrates weak levels of
consistency. Hence, the choice upon the use of specific measure is likely to produce
different, if not erroneous, results and remarks should be drawn with caution.
Delis and Tsionas (2009) proposed the theoretical gratification of an empirical model
that estimates simultaneously market power and operating efficiency scores of
individual banks. The proposed methodology is econometrically challenged by local
maximum likelihood technique (LML).
3.5. Review of empirical analysis
3.5.1. Panzar – Rosse methodology
3.5.1.1. Cross-country comparisons
There exist plenty of studies conducting cross-country comparisons of competitive
conditions across different continents as well as within certain regions like US, Latin
America, Europe, Middle East, Africa, Asia and Indonesia. The most widely applied
model in the banking literature is the Panzar – Rosse statistic for comparison reasons
along with its relationship with other competitive issues.
In particular, we have the studies of Claessens and Laeven (2004) and Bikker et al.
(2012) over a sample of 50 and 63 countries (respectively) around the world to
conclude that monopolistic competition is commonplace to the world banking market
during the period 1994-2004; a result that becomes evident in Bikker and Haaf (2002)
using a narrower sample of 23 industrialized countries within 1988-1998. However,
Sun (2011) investigated US, UK and EU from 1995 until the onset of the financial
crisis and found monopolistic competition for foreign and domestic commercial,
cooperative and savings banks in contrast with smaller banks of Netherlands before
EMU that demonstrated perfectly competitive conduct. More evidence between 1998-
2004 on G7 countries identifies Italy in perfect competition, Germany and France in
monopolistic competition and Japan, UK and US in perfect monopoly (Goddard and
Wilson, 2009).

92
Other studies on Islamic banking are those of Ariss (2010a) and Weill (2011)
investigating 13 and 17 Islamic countries, respectively, and drawing remarks on
persistent monopolistic competition. The same pattern is evident by Murjan and Ruza
(2002) in Arab Midlle East from 1993 to 1997, whereas Al-Mugarrami et al. (2006)
extending the sample until 2002 for 6 GCC banking markets found Qatar and Bahrain
with monopolistic competition, Oman with monopoly and perfect competition in
Kuwait, Saudi Arabia and UAE. Jordan has also demonstrated low competition with a
diminishing trend during the period 1994-2006 as other peer economies like Israel,
Lebanon, Morocco and Tunisia (Dermiguc-Kunt and Peria, 2010).
Almost similar samples constitute the MENA5 region, which appears with
considerable market power according to the studies of Al-Fayoumi and Abuzayed
(2010), Anzoategni et al. (2010) and Ariss (2009). For the CEMAC6 region, evidence
remains the same and in long-run equilibrium within the period 1993-2004 (Saab and
Vacher, 2007) as in EAC7 territory, particularly in Kenya, Tanzania, Rwanda and
Uganda from 2001 to 2008 (Gaertner and Sanya, 2012).
Laeven (2005) came up with colluding behaviour on 7 East Asian countries for the
period 1994-2004 in line with Perera et al. (2006) for Bangladesh, India, Pakistan, Sri
Lanka, Nguyen et al. (2012) for ASEAN countries and Anzoategui et al. (2010) for
Russia, China, India and Brazil. In addition, Olivero et al. (2011) compare a sample of
Asian and Latin American countries highlighting India, Korea, China and Venezuela
as countries lying off the equilibrium in the short-run or under monopolistic conduct.
The Latin America region appears to be monopolistically competitive except the
perfect competitive markets of Peru and Paraguay during 1999-2006 (Chortareas et
al., 2012). In the same vein, Yeyati and Micco (2003) found monopolistic competition
in 8 Latin American countries between 1994 and 2002 while Gelos and Roldos (2004)
for the same period picked up Argentina as an exception and Hungary out of the
Central Eastern European region.
European samples may be classified in transition and developed economies along
with other versions like EU-10, EU-15, European Monetary Union (EMU), Central
5 Middle East and North Africa region
6 It stands for Central African Economic and Monetary Community comprising the countries of
Cameroon, Chad, the Central African Republic, Equatorial Guinea, Gabon and the Republic of Congo.
7 East African community: Burundi, Kenya, Rwanda, Tanzania and Uganda.

93
and Eastern Europe (CEE) or other sub-regions. Monopolistic competition is quite
common in large European samples in Hussan and Mustapha (2008), Kasman (2010),
Staikouras and Koutsomanoli-Fillipaki (2006) as well as for EU-15 according to Casu
and Girardone (2006), Bikker and Groenveld (2000). Other papers dealing with
similar samples are those of Weill (2004b) on 12 EU countries during 1994-1999,
Schaeck (2006) on 10 countries over 1999-2004, Mamatzakis et al. (2005) on
Southeastern European economies during the five years before Euro. Moreover,
smaller samples on Europe boil down to Drummond et al. (2007) ending up with
monopolistic competition for France, Germany, Italy, Spain UK and US between
1998 and 2004 as well as De Bandt and Davis (2000), Boutillier et al. (2005) and
Casu and Girardone (2009) analysing the same sample for the „90s without UK/Spain,
US/UK and US, respectively. Delis et al. (2008) similarly found the PR statistic
between 0 and 1 for Greece, Latvia and Spain during the period 1993-2004.
Cases where the outcome does not advocate monopolistic competition are traced in
Delis (2010), who came up with monopoly in Bosnia, Estonia, FYROM and
Kazakhstan during the decade 1996-2006. Brissimis and Delis (2011) investigated 20
transition economies between 1999-2006, out of which Bulgaria, Hungary, Latvia,
Lithuania and Slovenia experienced monopolistic conditions; however, when they
employed country-specific countries in the revenue function monopoly became
prevalent in Croatia, FYROM, Hungary, Latvia and Lithuania. Other pick-ups off the
standard pattern lie in the prevalent monopolistic tendency in Latvia and FYROM
over the period 1993-2000 (Yildirim and Philippatos, 2007a), in Latvia according to
Drakos and Konstantinou (2005), and Italy during the subperiod 1987-1989
(Molyneux et al., 1994).
On the other hand, Bikker and Haaf (2000) through the PR methodology endorsed
high competitive conditions in 9 developed European countries between 1971 and
1998 apart from the deposits market of Portugal, which experienced colluding
practices. Last, Delis et al. (2008) identified higher market power in dynamic
specifications relative to the static reduced-form revenue function.

94
3.5.1.2. Country-specific studies
We now delve into country-specific applications of Panzar-Rosse statistic. In
particular, different US samples stand within the studies of Shaffer (1982; 2002;
2004) between 1979 and 1999 extrapolating monopolistic competition in Texas and
New York. In contrast, Chang et al. (2012) argued about perfectly competitive
conditions in a broader US sample within the period 1990-2005. We also deem
Canada as being under perfect competition after 1982 until 1994, except for the period
1983-‟84 when higher market power is explicitly evident (Nathan and Neave, 1989).
Jamaica turns out in monopolistic competition between 1989 and 2002 (Duncan,
2003) whereas Daley and Matthews (2012) identify perfect competition in
commercial banks and monopoly in the wholesale banking sector since 1998.
Relatively high market power is also existent in Colombia within the time period
1985-1998 (Barajas et al., 2000).
As for the Latin America region, monopolistic competition is significant in Brazil
during the period 1997-2011 according to Belaisch (2003) and Tabak et al. (2012),
whereas Lucinda (2010) provide inconclusive evidence and long-run disequilibrium
during 2000-2005. Likewise, the banking market of Chile comes with significant
market power for 10 years after the mid-nineties (Karasulu, 2007) although the
private pension system appears under monopoly since 1996. Uruguay is the last sole-
studied country by Gelfand and Spiller (1987) in the region with monopolistically
competitive propensity during 1977-1980.
In the Asia market, Chen and Wuong (2012) found China experiencing high market
power during the period 1998-2007 corroborating the results of Masood and Sergi
(2011) and Ziyi et al. (2005). However, Ou and Tan (2011) argued that the intensity
of competitive conditions is fluctuating periodically in the region. Furthermore, we
observe monopolistic competition in Armenia (Mkrtchyan, 2005), India (Prasad and
Ghosh, 2007), Malaysia (Sufian, 2011; Sufian and Habibullah, 2012), Indonesia
except the monopolistic conduct of large banks (Rachmaningtyas, 2006) and Nepal
(Gazurel and Pradhan, 2012). There are also cases of perfect competition in Ηong
Kong during the „90s, in Philippines (Pasadilla ad Millo, 2005) and Korea since 2007
(Simpere and Hall, 2012). On the contrary, before 2007 until 1992 Korea had been
under significant market power according to Lee and Lee (2005) and Park (2009); in

95
the sub-period between 1997 and 2001, Korean banking market seems to be operating
under perfect monopoly Chun and Kim, 2004). Along the lines, Malaysia within the
period 1996-2008 turns out in long-run equilibrium under monopolistic competitions
as Sufian (2011) and Sufian and Habibullah (2012) argue about. Moreover, Molyneux
et al. (1996) verify the evidence of Lloyd-Williams et al. (1991), who traced
monopoly conditions in 1986 and monopolistic competition in 1988.
In the Africa region, monopolistic competition prevails in Egypt during the period
1992-2007 (Pashakwale and Qian, 2011), Ghana since 1998 (Buchs and Mathisen,
2005; Biekpe, 2011), Kenya (Mweha, 2011), Tanzania (Simpasa, 2011), Tunisia
(Hamza, 2011; Mensi, 2012) and Uganda (Hauner and Peiris, 2005). For South
Africa, we have mixed evidence as Mlambo and Ncumbe (2011) alongside
Simbanegavi and Greenberg (2012) found relative market power opposing to
Greenberg and Simbanegavi (2009), who decomposed the PR estimation into
different asset sizes. Indeed, the while sample as well as the larger banks operative in
perfect competitive conditions whereas smaller banks engage in monopolistic
competition.
In the Islamic world, Kuwait tends to have operated under perfect competition over
the period 1993-2002 while Lebanon since 2000 turns out with PR statistic between 0
and 1 highlighting monopolistic competition, which expends even in Qatar (Al-
Muharrami, 2009a) and Saudi Arabia (Al-Muharrami, 2009b). Turkey, which appears
more popular in the banking literature, maintains a pattern of monopolistic
competition between 1990 and 2010 according to the recent papers of Abbasoglu et
al. (2007), Gunalp and Celik (2006), Macit (2012) and Masood and Aktan (2010).
However, in nich markets like the credit card and non-life insurance market
monopolistic conditions do prevail during 2002-2008 and 1996-2001, respectively;
nevertheless, the latter demonstrates monopolistic competition for the period 2002-
2004.
Over the European region monopolistic competition, which covers the whole range
between the two extrema, is addressed significantly on the grounds of fulfilling the
long-run equilibrium prerequisite. In the developed world, Germany follows similar
pattern during 1988-2002 across different samples employed by Gischer and Stiele
(2009), Hempell (2002) and Lang (1997). Same results are traced in the studies of

96
Hahn (2008) analysing the Austrian market within the period 1995-2002, De Rozas
(2012) for Spain during 1986-2005, Habte (2012) for Sweden since 2003 and Rime
(1999) for Switzerland over 1987-1994. Vesala (1995) investigated the period 1985-
1992 in the Finnish banking market with PR statistic indicating monopolistic
competition during the periods 1985-1988 and 1991-1992, as well as perfect
competition over 1989-1990.
Hondroyiannis et al. (1999) argue about significant market power in Greece between
1993 and 1995, which is contradistinction with Rezitis (2010), who remarked on
perfect competitive tendency for the whole period 1995- 2004 and the subperiod
1995-1998; however, in 1999-2004 monopolistic competition dominated the market.
Furthermore, studies on Italy (e.g. Coccorese, 2004; Trivieri, 2007) highlight
monopolistic competition in the late 90‟s even over samples of single-branched banks
up until 2005 (Coccorese, 2009). Evidence to the contrary is traced in the insurance
market experiencing monopoly and some degree of collusive oligopoly (Coccorese,
2012) during 1998-2003 and perfect competitive conditions in 1992 and 1994.
Moreover, Portugal since 1991 has undergone institutional restructuring that brought
about a significant bearing on the level of competition. Indeed, Boucinha and Ribeiro
(2009) found monopolistic competition between 1991 and 2004, with weaker
competition during 1991-1996, an unstable period of 4 years when restructuring took
place, and stronger competition over 2001-2004.
Amongst the developing European economies, monopolistic competition does hold in
Croatia during the period 1994-2004 (Kraft, 2006), Estonia within 1995-2001 (Kalle,
2002), Georgia since 1999 (Mercan, 2012), Lithuania between 2000 and 2006
(Vaškelaitis and Deltuvaitė, 2007) and Romania over 2003-2009 (Marius and Bogdan,
2011). Czech Republic experiences equivalent conditions between 2005 and 2009,
although five years before perfect competition becomes prevalent according to
Stavarek and Pepkova (2011). Last, Poland comes with PR statistic lying between the
range (0,1) when total interest income is employed as the dependent variable.
However, when the latter is subject to deflation with respect to total assets the PR
methodology shows perfect monopoly over the period 1997-2009 (Pawlowska, 2012).
97
3.5.2. Bresnahan-Lau methodology
3.5.2.1. Cross-country applications
The underlying non-structural methodology has met a handful of cross-country
applications relatively to the popularity of PR statistic. In particular, international
samples are only traced in Shaffer (2001) dealing with North America, Europe and
Asia during the period 1979-1991. They provide evidence over contestability or,
alternatively, Cournot-like oligopoly in Belgium, Denmark, France, Japan and US
whereas competitive structures are evident in Canada, Germany, Italy, Norway,
Sweden and Finland.
Neven and Röller (1999) argued about colluding behaviour in the banking markets of
Belgium, France, Spain, Germany, Denmark and UK over the period 1981-1999,
albeit with a considerable diminishing trend over time. Last, Delis et al. (2008)
applied additional dynamic error-correction specifications along the lines of Steen and
Salvanes (1999) and concluded about potential bias of static models when they fail to
capture short-run dynamics. Indeed, monopolistic competition is generally evident but
in dynamic models the market power is relatively higher. Bikker (2003) reported on a
European sample within the period 1987-1997 with respect to deposits and loans
markets. Especially, the deposit markets of the entire European region as well as those
of Germany and Spain operate under monopolistic competition, while at the same
time the same holds for the lending markets of Germany, Portugal, Spain, Sweden and
UK.
3.5.2.2. Country-specific studies
To our knowledge, there are three studies on US banking market; Shaffer (1989)
examined the periods 1941-1975 and 1941-1993 and remarked on the perfect
competitive conduct of US banks. The latter seems to corroborate the period right
after, namely 1990-2005, when high competition is significant albeit coupled with
some degree of market power in the long run (Chang et al., 2012). In addition,
Hannan and Liang (1993) came up with considerable market power in the money
market deposits between 1983-1989. Likewise, Shaffer and DiSalvo deemed bank

98
behaviour as imperfectly competitive rather than collusive between 1970 and 1986 in
South Central Pennsylvania.
In Colombia, Barajas et al. (1999) allege about stable average spread over time
although the per se market power diminished significantly during almost two decades
after 1974. Furthermore, Uruguay in the „70s experienced oligopolistic rivalry when
legal barriers on potential market entries made banks more willing to engage in
anticompetitive behaviour (Gelfand and Spillerm 1987). However, as soon as
permissions were granted to a specific banking segment (US dollar-denominated
lending), incumbent banks had little air for colluding practices. Along the lines,
Spiller and Favaro (1984) encompass the banking market as Stackelberg-like
structure, in which incumbent banks are supposed to have commitment power and
rationally avoid colluding interactions due to the per se relaxation of entry barriers.
Gruben and Koo (1997) verified competitiveness in Argentina during the period
1991-1997.
Over the European territory, Greece experienced a significant shift towards
anticompetitive practices after 1998 up until 2004 (Rezitis, 2010). Similarly, the
deposits and loans markets turn out as oligopolistic in Netherlands with the exclusion
of mortgage market, where competition intensified significantly over the period 1957-
1990 (Swank, 1995). On the other hand, Toolsema (2002) concluded on perfectly
competitive conditions between 1993 and 1996 in the underlying banking industry.
Berg and Kim (1994) argued that the Cournot and cost-minimisation models do not fit
the data of Norwegian banking market in the „80s, endorsing the explanatory power of
conjectural variation, namely the situation in which banks operate expecting
retaliation in response to changes in their output. For the next three years, Norway
maintained its oligopolistic tendency in retail and corporate banking according to
Berg and Kim (1996). We also observe monopolistic competition in Portugal during
1990-1995 (Canhoto, 2004) as in the case of Sweden with significant market power in
the deposits market during 1989-1997 (Oxenstierna, 2000) and over the period 1996-
2002 (Sjoberg, 2004).
Last, a recent paper of Simbanegavi and Greenberg (2012) infers monopolistic
competition in the South African region.
99
3.5.3. Lerner index
The underlying index has been widely applied in the banking literature especially
investigating correlations of the degree of competition with other contemporary
competitive isssues. Hence, it is rarely juxtaposed to the aforementioned
methodologies so as to compare and thereby challenge the robust persistence of
market power levels. Exception to this rule is the study of Hussain and Hassan (2012),
who dealt with the US market through the application of Bresnahan-Lau model and
Lerner index over the period 2003-2007; the former illustrated perfect competition
when the negative values of the latter implied predatory pricing through pricing below
marginal cost.
Additionally, Dermiguc-Kunt and Peria (2010) utilized structural (concentration
indices) and non-structural measures (PR-Lerner) of bank competition in Jordan and
the analysis produced evidence of mismatch between lower concentration and low
levels of competition, which seems to be deteriorating during 1994-2006. Through the
same measures, Poshakwale and Qian (2011) report V-shaped temporal changes of
competition and average monopolistic competition in Egypt within the period 1992-
2007 by means of conjectural variation, PR statistic and Lerner index.
Other studies used the paradigm of price mark-up over marginal cost in order to shed
light on the relationship between competition and issues like regulation, efficiency,
liquidity, economic growth, financial stability, among others. For example, Skully and
Perera (2012) found a U-shaped relationship between market power and liquidity
across 113 countries, that is banks with low and rising market power tend to lend in
the interbank market and withhold liquid assets up to a point where they allocate less
on liquid assets and become net borrowers in the interbank market. Bramer et al.
(2012) analysed the level of domestic competition in the European Monetary Union
since 2003 and documented its tendency to determine significantly the lending rates.
Khiabani and Hamidisahneh (2012) conducted analysis on the Iranian banking sector
and observed how the estimated market power increased over the period 1996-2006 in
response to the deregulation of the market in the form of market entries. In particular,
bank competition remained stable (until 2000) as soon as entry derestrictions took
place and made them act more competitively. Moreover, Coccorese and Pellechia

100
(2010) came up with not remarkable bearing of market power on efficiency for the
Italian industry during 1992-2007.
Other issues in banking closely related to bank competition are traced to the economic
growth and financial stability. Soedarmono (2010) verified for the Asian region that
in countries with relatively higher economic freedom, market power tends to
undermine potential growth capabilities. As far as the issue of competition-stability
nexus is concerned, we reserve our right to analyse it in the following chapters (5,8)
reviewing the pertinent literature and empirically testing it within the enlarged
European Union. Last, all the aforementioned issues that presuppose the estimation of
the Lerner index to be used at a second stage of analysis, are not exhaustive of the
literature as such work by no means constitutes the scope of any paper.
3.6. Conclusion
We analysed the state of knowledge with respect to the relevant models proposed in
the literature as well as the studies that applied them over various samples and time
periods. That signifies the importance of estimating the true level of competition in
order for researchers to investigate a wide set of objectives like operational
performance, access to services and financial stability, among others. Apart from the
theoretical sophistication in some of the aforementioned models, the empirical
literature is vast and to a certain degree converging to monopolistic competition in
various regions and continents. That induced financial institutions to promote
investment strategies, product differentiation and considerable low costs that
intensified further access to banking services.
It is therefore of utmost importance for incessant progress in the measurement
techniques of competition in order to adapt relevant institutional policies to
contemporary challenges mandated by adverse economic conditions and exogenous
shocks.

101
Chapter 3 Appendix
Review of empirical analysis
Author(s) Period Countries Results
PANZAR AND ROSSE METHODOLOGY
International studies
Al-Fayoumi and
Abuzayed (2010) 1998-2007
MENA MC
Al-Muharrami et al.
(2006) 1993-2002 6 Arab GCC countries
MC (Bahrain, Qatar)
M (Oman)
PC (Kuwait, Saudi
Arabia, UAE)
Anzoategni et al.
(2010) 1994-2008 MENA MC
Anzoategui et al.
(2010) 2002-2008
Russia
Comparison to Brazil,
China, India
MC
Bikker and Haaf
(2002) 1988-1998
23 Industrialized
countries MC
Bikker et al. (2012) 1994-2004 63 countries MC
Chortareas et al.
(2012) 1999-2006 Latin America
MC
C (Peru and Paraguay)
Claessens and Laeven
(2004) 1994-2001 50 countries MC
Dermiguc-Kunt and
Peria (2010) 1994-2006
Jordan (comparison to
Israel, Lebanon, Morocco
and Tunisia)
Doku et al. (2012) 1999-2008 Africa MC
Gaertner and Sanya
(2012) 2001-2008
EAC (Kenya, Tanzania,
Rwanda, Uganda) MC
Gelos and Roldos
(2004) 1994-1999
8 Latin American and
CEE countries
MC (except Argentina
and Hungary)
Goddard and Wilson
(2009) 1998-2004 G7
Italy: C
Germany, France: MC
Japan, UK and US: M
Laeven (2005) 1994-2004 7 East Asian countries MC

102
Murjan and Ruza
(2002) 1993-1997 Arab Middle East MC
Olivero et al. (2011) 1996-2006 Asia and Latin America
MC
M (India, Korea,
China and Venezuela)
or short-run
disequilibrium
Perera et al. (2006) 1995-2003 Bangladesh, India,
Pakistan, Sri Lanka MC
Saab and Vacher
(2007) 1993-2004 CEMAC countries MC
Skully and Perera
(2012) 1996-2010 113 countries
U-shaped relationship
between market power
and liquidity.
Skully and Pereva
(2012) 1998-2008
ASEAN (Indonesia,
Malaysia, Philippines,
Thailand, Vietnam)
MC
Soedarmono (2010) 1999-2007 Asia
Market power in
countries with higher
economic freedom
undermine economic
growth
Soedarmono et al.
(2011) 2001-2007 12 Asian countries
Market power drives
to financial instability
Sun (2011) 1995-2009 EU, UK, US
MC (all countries,
foreign and domestic
banks, commercial,
savings and
cooperative banks)
C (Netherlands for
small banks before
EMU)
Ariss (2009) 2000-2006 MENA MC
M (North Africa)
Ariss (2010a) 2000-2006 13 Islamic countries MC
Ariss (2010b) 1999-2005
Africa, Asia, Pacific,
Europe, Latin America,
Middle East
MC
Weill (2011) 2000-2007 17 Islamic countries MC
Yeyati and Micco
(2003) 1993-2002
8 Latin American
countries MC
European studies
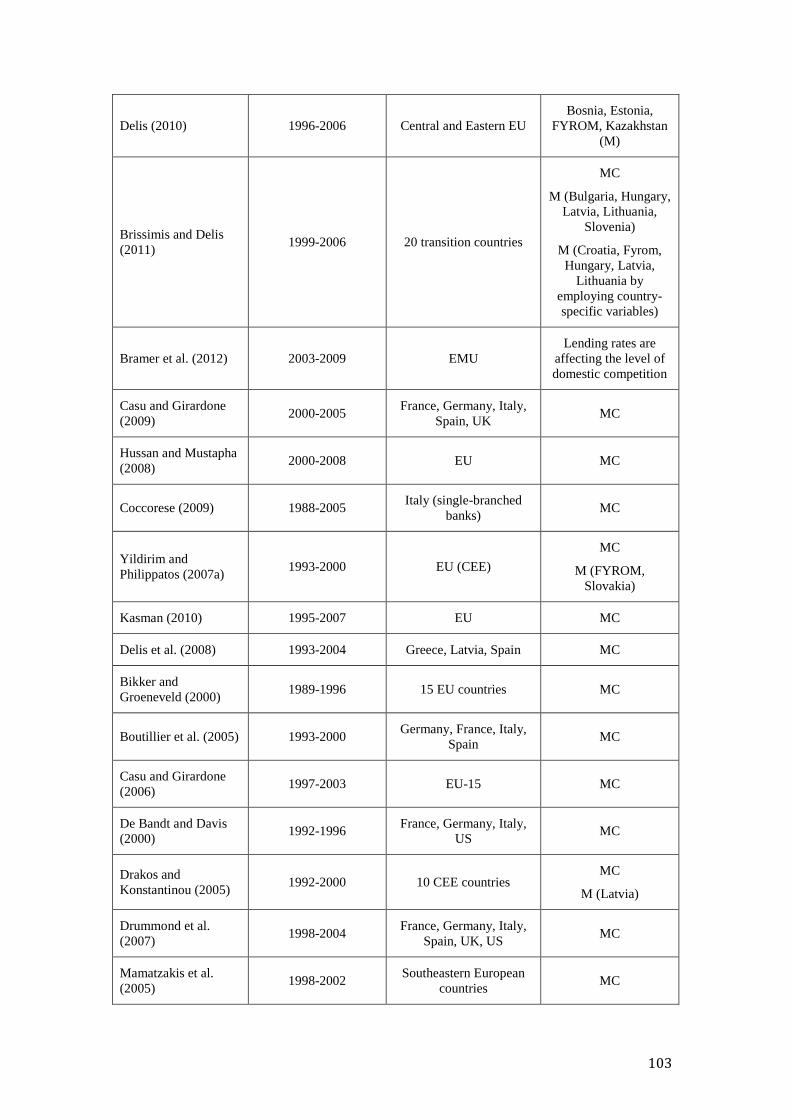
103
Delis (2010) 1996-2006 Central and Eastern EU
Bosnia, Estonia,
FYROM, Kazakhstan
(M)
Brissimis and Delis
(2011) 1999-2006 20 transition countries
MC
M (Bulgaria, Hungary,
Latvia, Lithuania,
Slovenia)
M (Croatia, Fyrom,
Hungary, Latvia,
Lithuania by
employing country-
specific variables)
Bramer et al. (2012) 2003-2009 EMU
Lending rates are
affecting the level of
domestic competition
Casu and Girardone
(2009) 2000-2005
France, Germany, Italy,
Spain, UK MC
Hussan and Mustapha
(2008) 2000-2008 EU MC
Coccorese (2009) 1988-2005 Italy (single-branched
banks) MC
Yildirim and
Philippatos (2007a) 1993-2000 EU (CEE)
MC
M (FYROM,
Slovakia)
Kasman (2010) 1995-2007 EU MC
Delis et al. (2008) 1993-2004 Greece, Latvia, Spain MC
Bikker and
Groeneveld (2000) 1989-1996 15 EU countries MC
Boutillier et al. (2005) 1993-2000 Germany, France, Italy,
Spain MC
Casu and Girardone
(2006) 1997-2003 EU-15 MC
De Bandt and Davis
(2000) 1992-1996
France, Germany, Italy,
US MC
Drakos and
Konstantinou (2005) 1992-2000 10 CEE countries
MC
M (Latvia)
Drummond et al.
(2007) 1998-2004
France, Germany, Italy,
Spain, UK, US MC
Mamatzakis et al.
(2005) 1998-2002
Southeastern European
countries MC

104
Molyneux et al.
(1994) 1986-1989
France, Germany, Italy,
Spain, UK
MC
M (Italy: 1987-1989)
Schaeck (2006) 1999-2004 10 European countries MC
Staikouras and
Koutsomanoli (2006) 1998-2002 EU-10, EU-15 MC
Weill (2004b) 1994-1999 12 EU countries MC
Yildirim and
Philippatos (2002) 1993-2000 14 CEE countries
MC (except FYROM
and Slovakia)
Bikker and Haaf
(2000) 1971-1998
Belgium, France,
Germany, Italy, Spain,
Netherlands, UK,
Portugal, Sweden
High competition;
oligopoly in the
deposits market of
Portugal
Delis et al. (2008) 1993-2004 Greece, Latvia, Spain
MC (Higher market
power in dynamic
models)
Country-specific studies
Mkrtchyan (2005) 1998-2002 Armenia MC
Hahn (2008) 1995-2002 Austria MC
Belaisch (2003) 1997-2000 Brazil MC
Lucinda (2010) 2000-2005 Brazil
In long-run
disequilibrium
Inconclusive evidence
Tabak et al. (2012) 2001-2011 Brazil MC
Nathan and Neave
(1989) 1982-1994 Canada
MC (1983-‟84)
PC
Karasulu (2007) 1995-2004 Chile MC
Sepulveda (2012) 1996-2008 Chile (private pension
system) M
Chen and Wuong
(2012) 1998-2008 China MC
Masood and Sergi
(2011) 2004-2007 China MC
Ou and Tan (2011) 1993-2007 China Competition fluctuates
periodically
Ziyi et al. (2005) 1993-2003 China MC
Barajas et al. (2000) 1985-1998 Colombia MC

105
Kraft (2006) 1994-2004 Croatia MC
Stavarek and Pepkova
(2011) 2001-2009 Czech Republic
C (2001-2005)
MC (2005-2009)
Poshakwale and Qian
(2011) 1992-2007 Egypt MC
Kalle (2002) 1995-2001 Estonia MC
Vesala (1995) 1985-1992 Finland
MC (1985-1988,
1991-1992)
PC (1989-1990)
Giustiniani and Ross
(2008) 1997-2005 FYROM M or perfect cartel
Mercan (2012) 1999-2010 Georgia MC
Gischer and Stiele
(2004) 1993-2002 Germany MC
Gischer and Stiele
(2009) 1993-2002 Germany MC
Hempell (2002) 1993-1998 Germany MC
Lang (1997) 1988-1992 Germany MC
Buchs and Mathisen
(2005) 1998-2003 Ghana MC
Biekpe (2011) 2000-2007 Ghana (commercial) MC
Hondroyiannis et al.
(1999) 1993-1995 Greece MC
Rezitis (2010) 1995-2004 Greece
C (for the whole
period and 1995-1998)
MC (1999-2004)
Jiang et al. (2004) 1992-2002 Hong Kong PC
Prasad and Ghosh
(2005) 1996-2004 India MC
Prasad and Ghosh
(2007) 1996-2004 India MC
Rachmaningtyas
(2006) 1999-2004 Indonesia
MC
M (large banks)
Khiabani and
Hamidisahneh (2012) 1996-2006 Iran
Entry regulation on
competition

106
Coccorese (2002) 1988-1996 Italy MC
PC (1992, 1994)
Coccorese (2004) 1997-1999 Italy MC
Coccorese and
Pellechia (2010) 1992-2007 Italy
„The impact of market
power on efficiency in
not remarkable‟
Trivieri (2007) 1996-2000 Italy MC
Coccorese (2012) 1998-2003 Italy (insurance) M (and collusive
oligopoly)
Coccorese (2009) 1988-2005 Italy (single-branched
banks) MC
Daley and Matthews
(2012) 1998-2009 Jamaica
M (merchant banking
sector)
C (commercial)
Duncan (2003) 1989-2002 Jamaica MC
Lloyd-Williams et al.
(1991) 1986,1988 Japan
M (1986)
MC (1988)
Molyneux et al.
(1996) 1986-1988 Japan M (1986), MC (1988)
Al-Jarrah and Dirasat
(2010) 2001-2005 Jordan MC
Mwega (2011) 1998-2007 Kenya MC
Chun and Kim (2004) 1994-2001 Korea MC before 1997
M after 1997
Lee and Lee (2005) 1992-2002 Korea MC
Park (2009) 1992-2004 Korea MC
Shin-Kim (2012) 1992-2007 Korea MC
Simpere and Hall
(2012) 2007-2011 Korea C
Al-Muharrami (2008) 1993-2002 Kuwait C
Moussawi and Saad
(2012) 2000-2010 Lebanon MC
Vaškelaitis and
Deltuvaitė, 2007 2000-2006 Lithuania MC
Sufian (2011) 1996-2008 Malaysia MC

107
Sufian and Habibullah
(2012) 1996-2008 Malaysia MC
Gazurel and Pradhan
(2012) 2001-2009 Nepal MC
Pasadilla and Milo
(2005) 1990-2002 Philippines PC
Pawlowska (2005) 1997-2002 Poland MC
Pawlowska (2012) 1997-2009 Poland
MC (interesting
income as a dependent
variable)
M (interesting income
over total assets as a
dependent variable)
Boucinha and Ribeiro
(2009) 1991-2004 Portugal
MC (1991-1996 weak
competition; 1997-
2000 restructuring in
disequilibrium; 2011-
2004 stronger
competition)
Al-Muharrami (2009) 1993-2002 Qatar MC
Marius and Bogdan
(2011) 2003-2009 Romania MC
Al-Muharrami (2009) 1993-2006 Saudi Arabia MC
Greenberg and
Simbanegavi (2009) 1998-2007 South Africa
C (larger and all
banks)
MC (small banks)
Mlambo and Ncube
(2011) 1999-2008 South Africa MC
Simbanegavi and
Greenberg (2012) 1992-2008 South Africa MC
De Rozas (2012) 1986-2005 Spain MC
Habte (2012) 2003-2010 Sweden MC
Rime (1999) 1987-1994 Switzerland MC
Simpasa (2011) 2004-2008 Tanzania MC
Hamza (2011) 1999-2008 Tunisia MC
Mensi (2012) 1990-2007 Tunisia MC
Abbasoglu et al.
(2007) 2001-2005 Turkey MC

108
Gunalp and Celik
(2006) 1990-2000 Turkey MC
Macit (2012) 2005-2010 Turkey MC
Masood and Aktan
(2010) 1998-2008 Turkey MC
Akin et al. (2012) 2002-2008 Turkey (credit card
market) M
Kasman and Turgutlu
(2008) 1996-2004
Turkey (non-life
insurance)
M (1996-2001)
MC (2002-2004)
Hauner and Peiris
(2005) 1999-2004 Uganda MC
Matthews and Zhao
(2007) 1980-2004 UK MC
Gelfand and Spiller
(1987) 1977-1980 Uruguay MC
Chang et al. (2012) 1990-2005 US C
Hussain and Hassa
(2012) 2003-2007 US
Lerner: Predatory
pricing
Bresnahan-Lau:
Perfect competition
Shaffer (2002) 1984-1999 US (Jayton, Texas) MC
Shaffer (1982) 1979 US (New York) MC
Shaffer (2004) 1988-1994 US (Texas Kentucky) MC
BRESNAHAN-LAU METHODOLOGY
Cross-country studies
Neven and Roller
(1999) 1981-1990
Belgium, France, Spain,
Germany, Denmark, UK,
Colluding behaviour
Diminishing trend
over time
Shaffer (2001) 1979-1991 North America, Europe,
Asia
Contestability or
Cournot oligopoly
(Belgium, Denmark,
France, Japan, US)
Competitive (Canada,
Germany, Italy,
Norway, Sweden,
Finland)
Bikker (2003) 1987-1997 EU MC (deposit markets

109
of the entire EU,
Germany and Spain;
lending markets of
Germany, Portugal,
Spain, Sweden and
UK).
Country-specific studies
Oxenstierna (1998) „Asymmetric game-theoretic static Bertrand-type oligopoly model‟
Gruben and Koo
(1997) 1991-1997 Argentina Competitiveness
Shaffer (1993)
Barajas et al. (1999) 1974-1996 Colombia
Decreased market
power although
average spread
remained put
Suominen (1994) Finland
Rezitis (2010) 1995-2004 Greece
„Shift to non-
competitive market
structure after 1998‟
Uchida and Tsutsui
(2005) 1974-2000 Japan
„Cournot oligopoly
cannot be rejected
Swank (1995) 1957-1990 Netherlands
Oligopolistic
conditions in the
deposits and loans
market
Intensified competition
in the mortgage market
Toolsema (2002) 1993-1996 Netherlands C
Berg and Kim (1994) 1980-89 Norway
„Banks behave as if
they expect their
competitors to retaliate
in response to output
change‟.
Berg and Kim (1998) 1990-1992 Norway
Oligopolistic
behaviour in retail and
corporate banking
Canhoto (2004) 1990-1995 Portugal MC
Simbanegavi and
Greenberg (2012) 1998-2008 South Africa MC
Shaffer and DiSalvo
(1994) 1970-1986
South Central
Pennsylvania
„The conduct appears
imperfectly
competitive, but far

110
from collusive.
Oxenstierna (2000) 1989-1997 Sweden Market power in the
deposit market
Sjoberg (2004) 1996-2002 Sweden Intermediate
competition
Gelfand and Spiller
(1987) 1977-1980 Uruguay
Oligopolistic rivalry
Entry barriers
conducive to non-
competitive behaviour
Spiller and Favaro
(1984) Late „70s Uruguay
Stackelberg-like
industry (entry barriers
diminish oligopolistic
interactions)
Chang et al. (2012) 1990-2005 US
High competition
Some degree of market
power in the long run.
Hannan and Liang
(1993) 1983-1989 US
Market power in
money market deposit
Shaffer (1989) 1941-1975/1993 US C

111
CHAPTER 4
A review of efficiency analysis

112

113
4.1. Introduction
Market structure has undergone remarkable changes the recent years by the
deregulation in the provision of financial services, the designation of monetary policy
in the discretion of European central bank and waves of large-scale consolidation. To
investigate the extent to which all these developments have vitally affected the
European banking sector, it is necessary to review the methodological foundations of
market concentration and efficiency in the competition-related framework.
First, it is of utmost importance to lay down the alternative definitions of bank output,
namely the intermediation and production approach. The treatment is expressed in
terms of capital, labour or values of loan and alternative investments followed by
shortcomings explicitly articulated in the literature. Second, concentration ratios
utilising the number of banks and their market shares under a different weighting
scheme, capture market structure and facilitate an indirect competition assessment
along the lines of SCP paradigm. Last, efficiency scores across banking sectors and
countries are retrievable through stochastic or DEA modeling as summarized
hereinafter.
4.2. Definition of bank
The production approach treats banks as firms and measures their output taking into
account the employment of capital and labour for the production of different kinds of
deposit and loan accounts. The quantitative measurement is based on the number of
accounts or the total transactions per account thereby constituting a flow of output per
unit of time independently of inflation biases (Heffernan, 2005).
There are some problems with this approach; first, there is not an explicit way of
computing the output and weighting every bank service and second, interest rate costs
are disregarded as of minor importance without accounting for the negative
relationship of the deposit rates and the number of branches. During the recent years,
almost all countries are on their way to converge towards International Financial
Reporting. Until then, different accounting systems make bank data of different
countries difficult to derive relative efficiency gains.
114
The intermediation approach simply considers a bank as an intermediary, not the
producer of accounts and loans. Bank output is treated as stock, namely, the value of
loans and investments. Total costs are supposed to be the sum of operating costs (the
factor cost of labour and capital) plus interest costs. In addition, some argue that
deposits should be treated as output, as earning assets (e.g. loans, securities, etc),
being in total contradistinction with Sealey and Lindley (1977). It is nonetheless
impossible to account for the whole range of the financial products since the unit cost
of an otherwise traditional intermediary bank will increase (unless weights indices are
used).
The contemporary practice favours the view of having earning assets produced by
specific factor inputs. The former includes the multiproduct of loans, securities,
interbank assets, deposits and non-interest income whereas the latter the labour cost,
the cost of physical capital (proxy: non-interest expenses/fixed assets) and that of
financial capital (proxy: interest paid/purchased funds).
When it comes to the empirical work, many problems arise from the way output is
measured. For example, some studies use the number of deposit accounts for which
banks incur costs to serve intermediation and liquidity but cannot loan out all the
deposit value whatsoever. On top of that, maturity structure and any risks associated
with and attached to each loan are generally ignored. If interest margins are getting
lower due to the fierce competition, output will decrease with reference to the national
accounts; the other approaches record output fluctuations in case margins influence
the volume of loans.
4.3. Measurement of X – efficiency
The empirical application of the X – efficiency methodology has been based on the
long-standing parametric and non-parametric approaches. Their striking difference is
that the former prerequisites an explicit model of the key determinants of inefficiency;
that is, the case of factor inputs being sub-optimally used (technical) or that of
inefficient allocation of resources due to ineffective management or expense
preference behaviour (Berger and Hannan, 1998).

115
4.3.1. Parametric approaches
4.3.1.1. The Stochastic Frontier Analysis
The development of the Stochastic Frontier Analysis (SFA) is traced back at the
pioneering studies of Aigner et al. (1977) and Meeusen and Van de Broeck (1977).
The idea behind the model specification lies in the definition of the composite error
component in terms of the classical random error and an inefficient term; that is why
Fried et al. (1993) pointed out that the production lag (inefficiency) of banks might
not be ascribed to the banks themselves, but to the unpredicted (random) error effects
whatsoever. The underlying model is schematically the following:
(4.1)
The last two components are supposed to be independently distributed along with the
X vector of variables. The random error is the symmetric disturbance that follows
independently the normal distribution [~ N (0, )] while for the inefficient term u,
various one-sided distributions have been proposed including, among others, the
normal distribution truncated above at zero (half normal)8 and the exponential one.
Such error specifications have been suggested when previous mathematical
programming methods lack any economic gratification and difficulties in statistical
inference. Furthermore, by postulating a non-positive error term (u), the problem of
having observations above the maximum frontier is effectively alleviated.
Thus, the derivation of the distribution function of the composite error is
straightforward (see Weinstein, 1964) in order to produce the conditional density of u
given ε. The inefficient measures may, thus, be obtained by the mode and mean value
of the per se conditional distribution, or alternatively the maximum likelihood
estimators from the maximisation of the joint density of u and ε, subject to the
contraint .
8 It refers to the inefficient term taking the absolute values of a N (0,
2
) variable.

116
4.3.1.2. Distribution-free approach
The underlying approach was developed by the studies of Bauer et al. (1992), Berger
(1993) and Berger and Humphrey (1992) following Schmidt and Sickles (1984). It
postulates a different modeling in error specification, as the inefficiency component is
disentangled by relaxing the assumptions of other models. In fact, the efficiency
follows no particular distribution and relative differences across firms tend to be
stable over time leaving the random error to be averaged out. The formalisation of the
process that sorts out the two components of the composite error consists of three
steps. For a start, the cost – or profit – function of the European banking sector is
estimated for each period by employing unbalanced panel data analysis9, secondly
the predicted series of cost (profit) is deducted from the observed cost to give out the
persistent residuals. Finally, the inefficiency measures are calculated by normalising
the underlying indicators accordingly:
(4.2)
where is the vector of averaged residuals and highlights the most
efficient bank. What really distinguishes this method pertains to the fact that the result
show how efficient a bank is over time relatively to market conditions, rather than the
degree of relative efficiency. That consigns greater explanatory power amid various
conditions in the economy, e.g. interest rates, business cycle, technology, or in the
environment that may impose a considerable burden upon bank swifts in operational
performance.
The shortcomings of the method are quite sensitive to the length of the period. For the
assumptions to be satisfied, random errors should cancel each other out and the
inefficiency component to be stable over time. In case of too short period, the error
term needs more time to vanish asymptotically, thus whatever left off depicts the
inefficiency component, which has not been disentangled, yet. On the other hand, a
longer period tends to strangle the stabilising average efficiency through the
aggregation and intensity of market conditions. Mester (2003) has proposed a 6-year
period, the best solution that counterbalances the aforementioned centrifugal forces.
9 Otherwise, biases may pop up and alter their relative rankings (Akhavein et al., 1997).

117
4.3.1.3. Thick frontier approach
As developed by Berger and Humphrey (1991), this approach estimates a cost
function for the quartiles of the lowest and highest average cost. The thick frontier
refers to the former, by which banks are classified as being of higher than average
efficiency. It assumes that the error terms within the cost functions of each quartile
are random reflecting potential measurement errors and luck. Moreover, the
differences in the predicted costs are further decomposed into the component captured
by market factors and the one explained by inefficiency. In other words, the cost
function is estimated to ex post predict the average cost of the quantiles. Then, the
quantile of the highest AC is estimated by employing the most efficient technology of
the lowest AC quantile in a way to account of all the exogenous market factors of an
economy where banks operate. The difference of the predicted costs of the highest
AC quantile depict the per se inefficiencies, which may be further decomposed to
verify what degree of inefficiency is attributed to market factors and operating costs
(allocative, technical), interest on deposits, among others.
This methodology treats data and in particular the outliers in a way that its impact
poses little, if any, bias on the overall ineffciency level in banking. Allowing for no
specific distribution of the random errors, a potential cost is hidden thereof: surmising
that the random errors follow thick-tailed distribution and get high absolute values,
then the predicted cost differences are not attributed to inefficiencies, which may
follow a flat and thin-tailed distribution, but to the per se random errors.
The most noteworthy extended strand of conventional stochastic frontier modeling
has been the development of Bayesian analysis from Van de Broeck et al. (1994) and
Koop et al. (1994). The former compared alternative models attaching prior
probabilities to the same general model with respect to the distribution of the
composed error term. Thus, Monte Carlo simulations enable posterior inference to
spot the resulting differences in efficiency parameters. The latter utilized Gibbs
sampling10
techniques for flexible stochastic forms of cost function in order to draw
posterior inferences under variable returns to scale and assymptotically ideal
modeling.
10
An algorithm produces several samples from the joint probability distribution of random variables.

118
Koop et al. (1997) extended the framework by allowing for time component in a cost
frontier model. In other words, fixed-random effects modeling, the n effects are
supposed to independently follow marginal or conditional distribution across time or
firms, respectively. Unike the fixed-effect analysis of Schmidt and Sickles (1984),
inefficiency is not derived from the occuring deviations from the most efficient firm,
but interestingly from the relative firm-specific efficiency, which is a function of the
number of firms (n). When accounting for random effects, the postulate of
hierarchical structure is developed on the way firm efficiencies are functionally
formed by exogenous variables or by a common distribution. A similar approach is
ascribed to Osiewalski and Steel (1998) and Fernandez et al. (1997), who extended
the panel analysis of efficiency to construct a priori dependence upon firms‟
charasteristics.
A unifying study that shed some light on the interdependence of various Bayesian
models and empirical results is attributed to Kim and Schmidt (2000). They compared
classical - (e.g.) univariate version, bootstrapping, maxim likelihood - and Bayesian
approaches to the same data set to infer technical efficiency scores in SFM with panel
data and, eventually, verify little differences in the underlying estimators. Further
insights are drawn by Koop (2001) and Fernandez et al. (2000; 2002) to account of
multiple outputs and undesired outputs, respectively. Tsionas (2002) and Huang
(2004), among others, formulated stochastic frontier modeling with gamma
distribution to extrapolate better statistical inference for panel-data applications.
Atkinson and Dorfman (2005) further developed the models of Kim (2002) and
Zellner and Tobias (2001) proposing input distance function specifications.
Toward the end of relaxing the restrictive assumptions of particular functional forms
of the composed error term, Fan et al. (1996) and Kumbhakar et al. (2007) extended
Aigner et al‟s (1977) linear SF model to a semiparametric frontier model that
estimates nonparametric inefficiency scores and pseudo-likelihood variances of the
composed errors utilising a kernel-based technique of the conditional mean function.
Deng and Huang (2008) and Tran and Tsionas (2009) extended former models (viz
Kumbhakar et al., 1991; Batesse and Coelli, 1995), of technical efficiency to be
contingent upon time and other variables within the context of SF production
technology. In a more generalized perspective, Kumbhakar and Tsionas (2008) build
a linking framework between nonparametric frontier analysis and SF modelliing by

119
the use of local ML methodology that drops the adoption of a unique production
technology and provides returns to scale measures.
Park and Simar (1994) proposed alternative estimators of linear semiparametric
frontier modeling, followed by Park et al. (1998; 2007) to include lagged dependent
variable and dependency structures between random errors and regressors,
respectively. Adams et al. (1999) built upon the latter framework to develop
multioutput stochastic distance technologies that mitigate endogeneity and
mispecification problems. Sickles (2005) provided a thoughtful review on the
microfoundations and properties of all estimators that the whole spectrum of
theoretical panel models produce in the literature, and compare them with respect to
various mispecified settings.
Shifting the attention to the employment of multioutput technologies, Fare et al.
(2010) used Monte Carlo simulations to investigate the performance of distance
functions so as to realize that quadratic forms of technology produce better results
than translog representations. In the same vein, Zhang and Garvey (2008) found that
there exist correlations between the results obtained by stochastic distance function,
ray and DEA frontier models whether inefficiency effects are accounted of or not.
However, the criterion according to which input or output dintance function is
applicable is to some extent given by Kumbhakar et al. (2007), who utilize latent class
modeling to identify the factors of efficiency orientation with the necessary indices to
cross-estimate technical inefficiencies.
Sickles et al. (2002) also compared empirically various semiparametric and
nonparametric estimates of a stochastic (multiple input/output) distance frontier
model - introducing multivariate kernel measures and Malmquist index numbers,
respectively – finding poor convergence of technical efficiency between them. Coelli
and Perelman (2000) analysed various distance functions recommending the
robustness of multilateral Tornqvist output index rather than revenue as a proxy of
aggregate ouput in production functions. On the contrary, Hailu and Veeman (2000)
incorporated (un)desirable outputs in an input distance frontier model to produce
efficiency scores that are friendly to the environment.

120
4.3.2. Non-parametric approaches
4.3.2.1. Data Envelopment Analysis
It is the most frequently used method in the empirical literature as far as non
parametric approaches are concerned. Data envelope analysis (DEA) was firstly
developed to compute the „best practice‟ of non-profit-making organisations due to
the lack of accounting measures (Charnes et al., 1978). Since then, theoretical
developments and empirical applications have been published covering up an endless
literature, which is beyond the scope of any paper.
Three assumptions are crucial for the construction of DEA model: constant returns of
scale, convex production function and free disposability of inputs. Charnes et al.
(1978) proposed a non-linear (fractional) programming problem to estimate the
efficiency upon a ratio of weighted outputs to weighted inputs. Given that these
weights are not known, out of a pool of all banks‟ data, the maximized (best-practice)
ratio constitutes the benchmark, which the efficiency of every single bank is
compared to. According to Charnes and Cooper (1962), the problem can be expressed
in linear terms allowing for the comparison to be based upon the horizontal (vertical)
projection of every bank‟s point (input, output) to the estimated frontier for input
(output)-oriented approaches.
However, Banker et al. (1984) dropped the assumption of constant returns of scale.
They added an additional unrestricted variable (convexity condition) to deploy
comparisons of inefficient firms to efficient ones of similar size, thereby eliminating
any scale effect on technical efficiency. Such scale classification, within which
efficiency scores are comparable, has been proposed by applying the SE index
method (Fare et al., 1994) or Banker‟s (1984) idea adopting the scale size of greatest
productivity. In the case of multiple optima, where scale classification is not unique
but subject to the specific solution, Zhu and Shen (1995), Seiford and Zhu (1997),
among others, have proposed ways to reconcile multiple optimal solutions with
returns-to-scale classification (RTS).
Another interesting insight on the development of DEA model comes from Charnes et
al. (1985a). They constructed the additive (Pareto-Koopmans) model, which
combines the output and input orientation into a single linear optimisation problem.

121
Since the model does not provide a measure of (in)efficiency, Charnes et al. (1985b)
proposed the Q measure to be subject to the model‟s restrictions; Consistency to the
aforementioned baseline models was restored by Sueyoshi (1990), who made the
efficiency measure (1-Q) take values between [0,1]. The possibility of the latter
measure to take negative values urged Tone (2001) to construct a slack-based
measure (SBM) that gets over the non-linearities of Green et al.‟s (1997) model and
produces efficiency scores within the interval [0,1] with the following two properties:
measurement units invariance and decreasing monotonicity. Along the lines, Cooper
et al. (2006) alleged that the Russell model of Fare and Lovell (1978), or even the
enhanced version of Pastor et al. (1999), turns out to be equivalent with SBM in the
case of taking the underlying constraints as equalities.
Multiplicity in DEA modeling constitutes another area of the literature, investigating
the evolution of efficiency measurement in reference various situations. The studies
of Fare and Grosskopf (1996) with network models, Zhu (2003) and Seiford and Zhu
(1999) with supply chain settings, are typical in examining the structure of production
process. Furthermore, research has been done for the restrictions imposed on the
multipliers of DEA models. Pertinent methodologies comprise absolute bounds (Roll
et al. (1991), cone ratio restrictions (Charnes et al., 1990), assurance regions to mould
the differences in multipliers (Thompson et al., 1986; 1990; Cook and Zhu, 2008),
facet models to overcome zero weights on multipliers (Bessent et al., 1988; Greene et
al., 1996) and unobserved decision making units (DMU) to extend observed facets
(Thanassoulis and Allen, 1998).
Several extensions of DEA models also include the use of non-discretionary
variables. However, the first model, proposed by Banker and Morey (1986), may
inhere upward bias in technical efficiency due to existing production impossibilities
(Ruggiero, 1996). The model of the latter has excluded such impossibilities and found
empirically to produce good efficiency scores according to Syrjanen (2004) and
Muniz et al. (2006). Provisions for categorical variables (Banker and Morey, 1986),
ordinal variables (Cooper et al. 1999; Cook et al., 1993; 1996;) and flexible variables
(Cook and Greene, 2005; Cook and Zhu, 2007) are also suggested in DEA
applications (Cook and Seiford, 2009).

122
DMUs may exhibit different efficiency scores when it comes to account for several
alterations in the employed parameters or data variability. Sensitivity analysis refers
to whether, and to what degree, the change of the number of DMUs (Wilson, 1995) or
the shocks in input and output values (Neralic, 1997; 2004) may have an impact on
the relative efficiency scores. In the case of super efficiency model, the problem of
ranking DMUs with unity efficiency is approached by Andersen and Petersen (1993),
Lovell and Rouse (2003) and Cook et al. (2008), who proposed a way to resolve the
issue of infeasible solutions that may come up under certain conditions.
Thore (1987), Cooper et al. (1996, 2004) and Land et al. (1992, 1994) have modelled
technical efficiency assuming that input and output variables are random, but
nonetheless following known distributions. Such data variability, though in a time-
series context, is allowed by means of window analysis (Charnes et al., 1985a) in
order to produce robust efficiency scores. In so doing, window is referring to the m
portions that observations of each DMU are divided by and, thus, m scores are
produced for the DMU itself; then, the analysis is rolling over the sample period on a
portion-by-portion basis ending up with m x n scores. A shortcoming of this
approach, articulated by Cooper et al. (2006), is that the very beginning and ending
periods are not used as often as all the others in between. In panel data methodology,
along with the window analysis, the Malmquist index was developed by Fare et al.
(1994) to measure how productivity is evolving across time in terms of its two
components: technology and technical efficiency. Last, a robust treatment of data
variability is provided by the studies of Banker and Maindratta (1992), Banker and
Natarasan (2004), which proposed an estimator on the grounds of stochastic
deviations from an arbitrary concave production function.
4.3.2.2. The free disposal Hull approach
The model was developed by Deprins et al. (1984) and subsequently by Tulkens
(1993) to generate the frontier of the observed production activities of DMUs. The
convexity assumption of the production function is dropped while keeping fixed the
variable returns of scale and the free disposability of inputs and outputs as the
nomination of the approach is explicitly highlighting. The study of Banker et al.
(1984) constitutes the reference baseline model, upon which convexity is relaxed

123
through the inclusion of an additional restriction. The production technology depicts
the reference frontier whereby the horizontal projections from the input-output data
points are utilized to produce the efficiency scores.
Given that the underlying frontier is a feasible set of input-output vectors constructed
on a linear piecewise technology of dominating combinations of observed (only) data,
the production set is a priori unknown, albeit right on or inside the DEA frontier. That
implies, according to Deprins et al. (1984), that inefficient DEA combinations are not
always inefficient in FDH models, whereas the opposite does hold. Average
efficiency scores are larger in this case due to the higher percentage of efficient
observations, albeit performing better fit for the observed data than DEA (Tulkens,
1993). However, this approach befalls in limited empirical studies since any statistical
inference in finite samples, or even bootstrapping, is rendered to be cumbersome, if
not unreliable, from discontinuous FDH estimators. Thus, Jeong and Simar (2006)
proposed a linear version of FDH model without losing the non-convexity assumption
in the production set.
Other attempts that fall within the nonparametric literature are quite a few. Contrary
to the postulates and intuition of the additive models, Frei and Harker (1999), Portela
et al. (2003) and Aparicio et al. (2007), among others, proposed models that estimate
the closest distance projection to the Pareto-efficient frontier, rather than all the facets
of it. In addition, another interesting insight is to rank DMUs with respect to their
respective operating performance without betaking to restricting weights schemes on
multipliers (Sexton et al. 1986). The impossibility of acquiring the optimal weights,
cross efficiency is jeopardized to encompass no useful gratification according to
Doyle and Greene (1994). From a game theoretic perspective, Liang et al. (2008) ends
up with the whole set of efficiency scores by setting out DMUs as players, who are
trying to maximize their efficiency in view of given scores of the others, and this
process is rolling over a stream of updated scores till the point of a perfect
competitive equilibrium.
The most recent contributions have managed to shed some light on the shortcomings
of DEA models. The determinacy of non-statistical methodology, or in other words
the lack of statistical inference has been challenged through pinning down maximum
likelihood properties for DEA estimators. Grosskopf (1996) conducted a selective

124
review on regularity tests and sensitivity analysis of univariate DEA frameworks
along with Kneip et al. (1998) and Park et al. (2000). The limitations here pop up in
small samples where asymptotic properties are off the frame and extra noise
jeopardizes the consistency of the constructed confidence intervals.
Bootstrapping methods have been devised to allow for efficiency sensitivity to
sampling variations introducing a stochastic component into efficiency estimators.
Ferrier and Hirschberg (1997) estimated the confidence intervals from the computed
empirical distributions of the efficiency scores, though failing down to eliminate the
bias of DEA estimators through bootstrapping. Simar and Wilson (1998; 2000a) made
a step further by establishing a resampling procedure of generating data that do
correct the bootstrap distribution; Simar and Wilson (2000b) extended the initial
model by refining the correcting bias mechanism and allowing for efficiency
heterogeneity.
The sensitivity of such deterministic methodology to outliers is revisited by Cazals et
al. (2002), who introduced a trimming parameter to get rid of the effect of outliers and
extreme values; in so doing, partial frontiers produce efficiency estimators that do not
envelope all the data points. Aragon et al. (2005) enhanced the methodology by
proposing the concept of conditional quantile-based efficiency scores on the grounds
of continuous partial frontiers of a univariate framework. Daouia and Simar (2007)
expressed further the asymptotic properties of Aragon et al.‟s (2005) estimators in a
multi-dimensional vector of inputs and outputs as well as providing some numerical
illustrations to verify the robustness of estimators.
Other advances of dynamic and stochastic DEA models that account of noise
inclusion are traced in the pioneering work of Sengupta (1990) along with other
relative programming formulations. Olesen and Petersen (1995), Cooper et al. (1996,
2002), applied the theory of chance constrained programming to model the
confidence regions for observed multiple combinations of outputs and inputs;
sensitivity of efficiency scores to changes in probability levels of data variability
highlight the indirect effect of data noise. Kneip and Simar (1996) articulated the
general framework of DEA modeling with panel data along with a (semi)parametric
firm-effect model that captures random effects. The rate convergence of estimators is
also comparatively investigated in each model specification. However, in the case of

125
(ratio) bounded or ordinal data, the Imprecise DEA (IDEA) has been developed by
Cooper et al. (1999) and Kim et al. (1999) to make linear the problem of variable
variability in terms of either scale or variable mix. The resulting nonlinearities in the
presence of weight restrictions made Chen et al. (2002) and Zhu (2002) estimate a
nonlinear IDEA in the context of the basic CCR model obtaining valid results.
4.4. Review of empirical applications
4.4.1. International comparisons
Allen and Rai (1996) investigated the operational efficiency of international
commercial banks of fifteen European countries applying stochastic cost frontier
model with translog and distribution-free specification. In doing so, the required
analysis consists in the examination of technical and allocative X-efficiencies as well
as the contribution of scale and scope economies to bank‟s output. During 1988-1992,
input inefficiencies were present and relatively greater than output inefficiencies in
large banks that operate in non-integrated banking countries; however, the most
efficient banks seem to operate in Australia, Austria, Canada, Denmark, Germany and
Sweden and the worst performers in France, Italy, UΚ and US.
Fitzpatrick and McQuinn (2008) utilize the framework of Batesse and Coelli (1995) –
that of simultaneously computing the inefficiency scores and regressing the latter on a
set of independent variables – in a stochastic profit model. Their contribution lies in
the use of managerial effects as regressors on inefficiency to capture and verify the
hypotheses of bad luck and management practices. An interesting result is that, during
1996-2002, the average profit loss due to inefficiency is as much as 31% essentially
exacerbated by the worst efficient player, UK, among Ireland, Austria and Canada.
In the same period, Gonzalez (2009) examined the relative effects of efficiency and
on market structure after controlling for political economy variables across the
different environments of Europe, Asia, US, Caribbean and Latin America. More
specifically, he estimated a different frontier for each country to allow for comparison
of efficiency between banks within national borders and verify whether that may
affect on concentration and market share. Along the same line, such an effect is

126
tracked whether and to what extent varies across countries of all regions under
constant and variable returns to scale. Applying the two-stage least squares random
effects estimator of Baltagi (2001) (EC2SLS), the results give credit to the indirect
effects of instrumented political economy variables (e.g. infrastructure, supervision
and regulation) on the statistically significant efficiency-structure hypothesis. From a
policy standpoint, the findings propose antitrust measures that may either jeopardize
efficiency in industries where private monitoring and sufficient contracting
environment are present, or second countries with less stringent regulation and better
deposit insurance schemes.
Hagendorff and Keasey (2009) examined the ex post effect of different M&As
strategies on performance in US and Europe during 1996-2004 in a way to infer ex
ante merger strategies. Interestingly, US banks tend to capitalize on institutional
restructurings by increasing revenues from interest and non-interest income assets.
That, in practice, raises questions on the inefficacy of US governance to fortify any
kind of stakeholders against the inherent risk of value destruction. In Europe, the
integration of member states has rendered the lagged consolidation of credit
institutions to be an imperative factor in policy making. Contrary to the US findings,
post merger accounting data endorse the cost-cutting strategy of European M&As
along with the substantial cut on loan provisions.
Lensink et al. (2008) made a step further on the efficiency effect of foreign ownership
allowing for the institutional differences in quality between home and host countries
to explain the gap from the best practice (frontier). By pooling commercial banks of
105 countries worldwide over the period 1998-2003, the empirical results draw
remarks on the better efficiency of foreign banks, the greater the institutional quality
and the smaller the differences in the institutional governance between host and home
countries.
Lozano-Vivas and Pasiouras (2010) run an international empirical study on the extent
to which the so-called non-traditional bank activities have an impact on operational
performance. Sampling publicly traded commercial banks of 87 countries, they used a
multi-product translog cost specification and variables encompassing economic
conditions, industry features and the regulatory environment in order to control for
inefficiency differences all over the world. On average, the inclusion of off-balance

127
sheet items and non-interest income in the output vector points at facilitating
efficiency gains emanated from countries with less government- and foreign-owned
banks, greater stock market development, protection schemes for shareholders and
developed derivatives stock exchanges (more ascribed for cost efficiency).
Similarly, Maudos and Pastor (2001) analysed the profit and cost efficiency in the
European Union, Japan and USA for the years 1984-1995. The contribution of this
paper pertains to the estimation of the profit efficiency, its comparison with cost
efficiencies scores and hence its contribution to bank profitability since almost all
previous studies overlooked the potential bias of the effects of competition,
production qualities and regulatory environment on the cost side of efficiency. The
stochastic frontier analysis concluded that Japan constantly looses efficiency levels
from 1988 onwards while USA and Europe are able to reap the benefits from
competition intensities as demonstrated in the aggregate profitability data of the
OECD countries.
Meon and Weill (2005) used stochastic frontier analysis to examine the magnitude of
six indicators of governance on aggregate efficiency of banks in 62 countries. After
controlling for openness, latitude and „ethno-linguistic‟ features, they estimated six
frontiers plugging in the inefficiency structure one specific index at a time. The
empirical results show a positive correlation of efficiency and institutional quality
though government efficiency has greater explanatory power, followed secondarily,
by probity and rule of law. It is noteworthy that all the other coefficients of the
production function demonstrate a remarkable stability.
Another potential source of efficiency, namely regulation and supervision, is studied
by Pasiouras (2008b). He followed the DEA approach using a bank data of 95
countries around the world for the year 2003. In a nutshell, the efficiency results, as
decomposed into technical, pure and scale efficiency, are presented by region and by
the percentage of banks within each region that exhibit constant and variable returns
of scale. Asia Pacific and Western Europe stand out as more efficient ranging from
75.67% to 97.66% and from 68.8% to 94.61%, respectively, contrary to the ill-
performed counterparts Eastern Europe and Latin and Caribbean America, which
roughly take values in between the range of 53.71% and 90.16%. In a second stage of
analysis, he utilized tobit regressions for efficiency modeling - since it takes values

128
between the interval [0,1] - to see how and to what extent macroeconomic conditions,
bank-specific features, financial development, market structure, the legal system and
the access to banking services determine operational performance of banks.
Evidently, market discipline mechanisms remain robust across all the employed
specifications backed by the statistically significant factors of market concentration
and capitalisation, government and foreign ownership, property rights and the number
of branches.
In view of the shortcomings of the previous study with respect to the static analysis
(not time variant) of technical, pure and scale efficiency and not the broader concepts
of cost and profit efficiency, Pasiouras et al. (2009) uses stochastic frontier analysis
for commercial banks of 74 countries over the period 2000-2004. The remarks drawn
confer power on the supervision that enforce stringent disclosure requirements and
market discipline incentives on the grounds of controlling for various macroeconomic
conditions, market structure and financial development. In fact, it is the case of
negative (positive) effect of capital requirements on profit (cost) efficiency probably
due to the preference of less profitable assets (less risk management costs). Therefore,
in the context of policy making, the indirect interactions of competition, efficiency
and financial stability should be accounted given that deregulation may induce
competitive entities to imprudently engage in risk taking activities (Keeley, 1990).
Pastor et al. (1997) in response to the deregulation of the Spanish banking system
shed some light on the efficiency differences of the US and European banking sectors
for the year 1992. Applying DEA methodology along with the productivity index of
Malmquist (1953), all countries are analysed in terms of the catching-up effect within
the national borders and distance to the reference frontier; in other words, the latter
highlights how much efficient a bank of a country is with respect to the technology of
other countries. On those grounds, Spain, France, UK and USA exhibit high
efficiency internally but employing low levels of technology (productivity) as
compared with the exactly opposite cases of Germany, Austria, Italy and Belgium.
Pastor and Serrano (2006) fill the gap of specialisation effects omitted in the
internally compared efficiency scores of the previous study. The banking systems
under investigation are European during the period 1992-1998 and the analysis
postulates the decomposition of inefficiency in two distinct constituents: the

129
inefficiency difference both in the composed spectrum of specialisation in every
single banking system and in the per se specialisation of their own. Greece and Spain
lead the group of cost inefficient banking sectors, accompanied by France, Germany
and Denmark, which productively specialize more in retail banking. Given that the
specialisation effect discounts significantly the composite inefficiency scores, retail
banking increases its positive contribution to total efficiency since its relative –
though poor - performance dominates that of other activities (wholesale and universal
banking).
4.4.2. European cross-country comparisons
It is beyond doubt that the methodological and empirical investigation of efficiency in
banking sector constitutes a hot area for academic debate. US studies have been by far
numerous and dominant over any other regional research, though losing some pace
after the inundating European interest in late 1990s and onwards. Berger and
Humphrey (1997) reviewed 130 studies applying various frontier approaches in 21
countries. The average efficiency stands at around 77% across models and the relative
rankings do not seem to coincide with those of the computed efficiency scores of
firms. Ever since, the cross-country efficiency literature of EU developed economies
can be divided in specific strands: a) the research conducted to measure the technical
change, productivity growth, scale and scope economies in the European region
employing various models and output specifications, b) the considerable interest in
the environmental factors that influence the conjectural variation of bank efficiency,
namely, country-level features (location, (de)regulation), industry-wide (market
structure, share, M&As) and bank-specific (profitability, off-balance sheet items, risk-
taking, corporate governance) and c) integration of banking sectors measuring the
evolutionary convergence of efficiency scores.
The first studies of convergence are ascribed to Tomova (2005) who applied sigma
convergence, ANOVA and beta convergence tests on the grounds of regulation and
commercial bank objectives. The results show a significant convergence of profit
efficiency scores across all European countries and, especially, a faster pace in new
member states. However, there are persistent disparities of efficiency average levels
with respect to commercial objectives and statistically insignificant differences for
130
regulatory purposes in the old and CEE countries during 2001. In addition, panel data
analysis gives credit to such differences identifying greater efficiency to old EU
member states and some Eastern countries like Malta, Czech Republic, Croatia and
Poland; in contrast, Lithuania, Romania and Estonia demonstrate the poorest
performance. Last, in contrast with inflation, market share, GDP growth and equity
share of total assets turn out to be positive and significant determinants of efficiency.
According to Weill (2009), β- and σ-convergence methodology for panel data
supports bank integration in the European region in terms of both concepts of cost
efficiency convergence over the period 1994-2005. However, Koutsomanoli-Fillipaki
and Mamatzakis (2010) employing a quadratic loss function of a „forward-looking-
rational-expectations‟ model, assess the speed of adjustment in efficiency scores. The
findings endorse undoubted progress during 1998-2005 but, still, there is a long way
to go eliminating the obstacles that hinder cross-border competition in retail banking
and European integration.
Few studies have investigated scale and scope economies in the European context.
Schure and Wagenvoort (1999) followed the Recursive Thick Frontier Approach
(RTFA) for an augmented Cobb-Douglas model to conclude almost absent positive
economies of scale (up to 6-million size) and potential of 6% cost reduction in
savings banks. The average 4% reduction of inefficiency out of 16% potential
comprise the poor performance in Germany, Austria, Luxembourg and France and the
unexploited capacity in terms of scope economies. Accounting for bank types, X-
efficient mortgage banks incur lower costs than commercial and savings banks
altogether. Similarly, Turati (2003) drew the same results finding insignificant
differences in terms of mean efficiency across countries and unexploited scale and
scope economies. Elasticities of substitution and derived demand highlight the
constraining laws that make banks unable to substitute inputs in view of relative price
fluctuations.
As for the M&As effects on banks‟ operating performance, there is no supporting
evidence of the passing-through effect on X-efficiency according to Punt and Van
Rooij (1999). The matter of antitrust policy rests on unfavourable price setting that
currently seems „faint‟, and the potential social welfare gains. In contrast, Huizinga et
al. (2001) analysed 52 horizontal bank mergers during 1994-1998 and realized
positive correlations between mergers and cost efficiency and little, if any, impact on

131
profit efficiency. Their findings on motivation for consolidation corroborate most of
the empirical evidence about unexploited scale economies, inefficient management
and technological advancement. Along the same lines, domestic consolidation is
favoured by differences of banks in capitalisation, innovation strategies and
technology while dissimilarities in strategies concerning earnings, loans and deposits
undermine performance-enhancing goals (Altunbas and Marques, 2008); for cross-
border mergers, the remarks go the other way around. During the period 1996-2004,
Lensink and Maslennikova (2008) document a predominant domestic trend of
horizontal consolidation that provided abnormal returns for the acquirers roughly
around the deal of imminent mergers.
Other effects on bank performance comprise the contribution of off-balance sheet
items, IT investment, ownership, risk and regulation. Casu and Girardone (2005)
explicitly allege that the inclusion of OBS in bank output dismantles misspecification
problems and seems to increase productivity growth in terms of technological change
rather than efficiency variation. Becalli (2007) confronted a profitability paradox
when concluded that European banks having invested a lot in IT, during 1995-2000,
gleaned little gains in profits and efficiency. However, the heterogeneous impact of IT
types conveys performance-related advantage on IT services from external providers,
whereas hardware and software tend to diminish both profit efficiency and profits.
The probability, however, of better performance is greater for loan-oriented balance
sheets and limited sizes during 1993-2001, after the analysis Barros et al. (2007)
conducted with a mixed logit model. That is juxtaposed to the deregulatory endeavour
of policymakers to intensify cross-border activity and penetration to foreign bank
markets.
The omitted component of risk-taking preferences in the efficiency literature was
lately studied by Pastor (2002). He decomposed bad loan provisioning in its
exogenous and endogenous part so as to identify what extent of credit risk is
attributed to economic factors and bad management. The results show efficiency in
risk management to be enhancing in Spanish banks, stabilising in German and Italian
banks, and worsening in French banking sector. Pastor and Serrano (2005) further
contributed to the analysis with the estimation of risk-adjusted efficiency in EU – 11
to see whether risk behaviour was modest or imprudent. Average cost efficiency was
about 89.5% at its best in France and Luxembourg and essentially in commercial

132
banks. The worst performance was identified in Spain and Portugal at savings banks.
The adjusted cost efficiency gave no significant changes while discrepancies exist
between the already lower profit efficiency and risk-adjusted metric. Hence, it is quite
interesting that risk matters especially in the revenue side: France is the least profit
efficient and Portugal and Spain the most profit efficient contrary to the previous
results.
On the other hand, stable and great efficiency in risk management is reported in
Portugal, Luxemburg, Belgium, and Germany, in mortgage banks and those of
medium size. Altunbas et al. (2007) found that inefficiency in banks is positively
related with less risk-taking and more capital profoundly in line with the stringent
regulation. That is the case for all types of banks except for inefficient mortgage ones,
which tend to hold significantly lower capital. As far as ownership is concerned,
private and mutual banks are riskier and more profitable than public banks in 15
European countries for the period 1999-2004 (Iannotta et al., 2007). The mutual banks
engage in relationship banking enjoying better loan portfolio and lower operational
costs. Profitability, however, tends to shrink due to unexploited scale economies and
different asset mix; as they are getting closer to the services of large private banks,
policy makers should remove ownership hurdles of „one-member-one-vote‟ systems,
in order to facilitate market contestability through progressive restructurings.
Other studies have focused on the impact of regulatory initiatives on the European
market structure and banks‟ operational performance. From a theoretical perspective,
there are conflicting views as to which directives do work and whether a general
policy is applicable in a unified market. Empirical evidence delineates the key role of
the third pillar of Basel II, namely the market discipline. Policy-making, therefore,
should ensure the timely disclosure of information and create motives that intensify
private banking (Delis et al., 2011). Since 1999 the efficiency of acquiring banks is
greater than that of the acquired while the resultant competitive forces, due to the
combination of market entries and better local competitors, make incumbent banks
operate with lower costs and inefficiency (Evanoff and Ors, 2008). Indeed,
deregulation has entailed the elimination of entry barriers and the gradual
convergence of efficiency scores across the European banking systems. The
productivity gains, as precipitated by pertinent regulatory reforms, show Germany as
the most efficient banking region followed by Austria, Belgium and Denmark,

133
whereas Greece, Spain and Portugal are encompassed by the lowest rankings
(Kondeas et al., 2008).
4.4.3. Developed economies
An interesting way of reviewing the latest literature of cross-country differences in
efficiency of the developed European economies is to assess the empirical evidence
by the employed methodology from 90‟s and onwards. Berg et al. (1993) examined
the Nordic region in 1990, identifying significant efficiency discrepancies between
Norway and Finland, whose market structure contains the largest and the smallest
pool of banks, respectively. The Swedish banks demonstrate the highest scores of
Malmquist indices, constituting a productivity gap of 40-46% with Norwegian and
52-63% with Finnish banks. Accounting for constant and variable returns of scale,
Swedish banks are the most efficient performers than the least efficient Norwegian by
64%; a key remark is the technological advantage of small Norwegian banks since the
contribution of technology frontier contributes the most to the overall performance.
For 1993, Lozano-Vivas (2002) applied DEA in ten European countries by means of
incorporating the most influential environmental variables on the basic model and
comparing the corresponding output with that of the original model. In doing so,
cross-country efficiency comparisons are inferred by coupling score changes with bad
country-specific environmental conditions. Belgium, Portugal, Spain and Denmark
have had an average efficiency of 70% followed by Luxembourg, Germany, UK,
Netherlands, and the worst performers, namely France and Italy.
Casu and Molyneux (2003) examined the same period 1993-1997 utilising the DEA
methodology and bootstrapping technique in order to infer statistical estimates. That
powerful statistical approach was originated by Efron (1979) to correct the bias from
the inherent dependency of efficiency scores – first articulated by Xue and Harker
(1999) – by means of deriving confidence intervals from the resultant empirical
distribution of efficiency scores. Hence, after the estimation of DEA, they compare
the output of Tobit regression and that of bootstrap Tobit regressions: Productive
efficiency turns out to converge within the European market except for the case of
Italy, although ranging at low levels whatsoever. Eventually, empirical evidence
signifies the role of country-specific factors in explaining efficiency scores reflecting

134
thereby the national regulation and managerial stance vis-à-vis fierce competitive
pressures exacerbated by information technology and financial innovation. Extending
a bit the examined period for 1994-2002, Tomova (2005) estimated a common
frontier for 25 states of the European union plus the accession countries that have
been following the run-up procedure of convergence. The DEA approach revealed the
less efficient eastern part of Europe, as opposed to the developed western group,
whereas the hypothesis of convergence, or in other words the equality of relative
variances, could not have been rejected. The same pattern of decreasing dispersion of
average efficiency variability was identified in the accession countries, as well.
The SFA methodology and its amendments caught much more attention of the
researchers in the 90‟s till 2005. Thus, for the period 1989-1997, Altunbas et al.
(2001) applied Fourier-flexible form of the cost frontier model to produce X-
efficiency, technical change and scale economies. The results show that large-sized
banks exploit technological advantages and are potentially capable of accomplishing
efficiency through the reduction of managerial performance below the current high
levels 20-25%. Nonetheless, they tend to have no scale economies (average 5-7%)
over their smaller competitors. For the same period 1989-1996, Carbo et al. (2002)
followed the same methodology to remark that smaller-sized savings banks are
qualified to have relatively better managerial efficiency and strong motivation to
capitalize economies of scale through cross-border consolidation. Contrary to
Altunbas et al. (2001), scale economies are apparent in larger bank sizes and banks
persistently take refuge in them over time since competition has urged them to curtail
X-inefficiencies and take advantage of their size benefits.
Bikker (2002) employed multiproduct translog functional form to examine efficiency
in fifteen European countries over the period 1990-1996. Inefficiency scores are
creeping an average of 30% classifying Luxembourg, Switzerland as the most
efficient banking industries, Germany, Portugal, UK and Netherlands as intermediate
performers and Greece, France, Italy and Belgium as the least efficient regions. The
alternative measures that show, instead of measures of managerial (in)ability, cost
levels across countries in order to account for economic and institutional differences.
Such levels tend to highlight average cost differences of 20% between each group;
inefficiency and cost discrepancies are related but deviations are likely to exist.
Moreover, more inefficiency scores are identified in larger banks twice as much as in

135
smaller-sized, and in commercial banks of over double levels with respect to
cooperative and savings banks. However, the cost levels track a different pattern since
savings and investment banks operate with 10-20% higher cost levels than
cooperative and commercial banks. Last, deregulation and financial integration have
brought about inefficiency scores to cover up 45% reduction as opposed to the
respective 10% in cost levels.
In the same period, financial conglomerates exhibit higher operational and profit
efficiency in universal banking services whereas traditional banking confers no cost
disadvantage on other specialized institutions (Vennet, 2002). Moreover, Williams
and Gardener (2003) ended up with high rates of mean efficiency (around 93%) for
regional banks leaving the remainder to correlate with liquidity, capitalisation and
corporate structure.
It is noteworthy the endeavour of a few researchers to employ sophisticated or, at
least, new models that stand out of the common. For instance, De Guevara and
Maudos (2002) examined the inequalities of the European banking sectors by means
of decomposing the Theil index. By doing so, cost efficiency demonstrates great
differences across institutional clusters (savings, cooperative, commercial, other,
which the respective type of productive specialisation and country effects convey
explanatory power to. As for the profit efficiency, it is accredited to country
differences, rather than between specialisation clusters.
In addition, the metafrontier approach has come along in response to some studies
that set the research question „how is it possible to pin down a framework of making
comparison of efficiency across countries accounting for different production
technologies?‟. Such studies are Dietsch and Lozano-Vivas (2000), Lozano-Vivas et
al. (2001) and Bos and Kolari (2005), which early pointed out the mandate to correct
for potentially inherent estimation bias. Bos and Schmiedel (2007) are seeking to
identify whether there exists a unique cost frontier in the European commercial
banking for the period 1993-2004. Accounting for heterogeneity that may influence
efficiency modeling in many other ways (distribution of error term, shifts in frontiers
of bank groups), they establish a framework of comparing efficiency across countries
by assuming a common functional form, but the implied common production
technology is corrected by the location of country-specific frontiers and technology

136
gaps. The results converge to those of country-specific results without standing afar of
a single European frontier as low technology gap ratios predicate. From a policy
perspective, it is sufficiently nationalized to succumb to cross-border mergers once
the results advocate the low probability of banks‟ successful (equal-to-home)
performance abroad. On the other hand, profit efficiency scores are deterministically
explained by competitive power in the local market.
Another methodology followed in the efficiency literature is the accounting ratio
approach. Staikouras et al. (2008a) examined a bulk of explanatory factors/proxies of
size, ownership structure, risk and (non)traditional activities that determine
operational performance in European banking. Notwithstanding the unquestionable
reduction in bank inefficiency, its persistent high levels are positively related to the
loan portfolio quality, size, bank and economic development and negatively
associated with liquidity and loans ratio. Furthermore, Delis and Tsionas (2009)
applied an amended local maximum likelihood approach to simultaneously estimate
market power and efficiency at banking level. This method stems from the studies of
Uchida and Tsutsui (2005) and Brissimis et al. (2008) concerning the gratification and
application of Cournot-related theoretical framework. They examined US and
European markets for the years 1996-2005 confirming the competitive behaviour of
banks and the „quiet life‟ hypothesis. At higher levels of efficiency, the efficiency-
structure hypothesis is endorsed implying that banks exercize higher market power
than average.
Contrary to the vast majority of empirical studies, Maudos et al. (2002) focus on the
estimation of bank inefficiency lying both on the cost and revenue side. For the period
1993-1996, they applied REM, FEM, SFA and DFA to compare cost and profit
efficiencies of ten European countries. The results verify the lower levels of
efficiency in profits than those on the cost side. The variation of scores across
countries is structured by factors of size, productive specialisation, industrial and
economic conditions; higher efficiency is identified in banks of medium size and high
loans to assets ratio. The higher (lower) the market concentration is, the higher the
profit efficiency is (enhanced profitability by exploiting increased market
power/share) and the lower the cost efficiency (indication of „quiet life‟ hypothesis as
banks feel less bound to diminish costs). Profit efficiency is positively associated with
higher risk (proxied by the standard deviation of asset returns) and GDP growth along

137
with cost efficiency being adversely affected by high network density (structural
overheads).
In the same vein, Weill (2004a) ran SFA, DEA and DFA for five European banking
markets, namely France, Germany, Italy, Spain and Switzerland, over the period
1992-1998. Unfortunately, he came up with mixed results that lean towards the
substantially and persistently different estimates of all models, with some exceptions
that corroborate the rule. More research is needed to shed light on the differences of
the underlying efficiency measures as the latter is the outcome of specific
presuppositions of models. However, they have contributed to the tiny niche of the
vast literature that explicitly lays down the comparability of empirical evidence from
different methodologies.
4.4.4. Transition economies
The recent literature of efficiency in the European transition economies enumerates
the predominant application of stochastic frontier methodology with some few
exceptions (Grigorian and Manole, 2002; Stavarek. 2003; 2005). More specifically,
DEA methodology is employed by Grigorian and Manole (2005a) to assess the
performance of commercial banks during the period 1995-1998. As a second stage of
analysis, a censored tobit model was applied to explain cross-country differences in
terms of macroeconomic, regulatory and institutional factors. Evidently, foreign
ownership and consolidation are likely to contribute to the optimal efficiency of the
underlying banking region.
Between 1999-2002, Stavarek (2003) examined the Visegrad region by means of the
aforementioned methodology (DEA, tobit modeling). Given the integration that took
place in the Central Europe since the Communist period, the V4 countries are
reckoned for their heterogeneous structure and their lagging performance with
reference to their developed European counterparts. Slovakia seems to have
demonstrated the poorest performance 28% gap followed by Poland (12%) while
Czech Republic recorded a smooth and stable efficiency of up to 83% over the period,
with Hungary accomplishing to catch up by more than 10% efficiency gains. As for
the efficiency factors, country specific conditions best determine country

138
heterogeneity coupled with the significant impact of profitability, asset size and
foreign ownership. According to Stavarek (2005), with the addition of Portugal,
Greece, Romania and Bulgaria in the previous region for the years 2002-2003, the
first two countries seem to lead the CEE-6 group in exhibiting relatively higher
average efficiency levels. From a policy perspective, better input utilisation is
proposed to tackle the great scale inefficiency of large banks since higher real output
cannot be attained by further betaking themselves to mergers but, alternatively,
developing products and services of high quality.
Delis and Papanikolaou (2009) derived efficiency scores from the application of
input-oriented DEA over the period 1994-2005. Instead of using censored Tobit
model to regress environmental factors on (in)efficiency, the bootstrap procedure is
followed along the guidelines of Simar and Wilson (2007) to resolve the serial
correlation of efficiency scores of the previous step with output and inputs and
therefore with the standard errors of the second stage and the exogenous factors, as
well. Hence, better inference reveals greater explanatory power of bank size
(positive), concentration (negative) and investment environment (positive).
Weill (2002) used the Iterative Seemingly Unrelated Regression (ITSUR) to estimate
the efficiency scores of Poland and Czech Republic in 1994 and 1997. Czech
Republic is persistently reported as the most efficient banking system in the literature
of transition banking markets and Poland turns out to increase cost efficiency by
4.12% but, nonetheless, not sufficiently enough to make up for its lag in 1997 (1.2%).
Over the same period (1996), the degree of openness of the banking industry in terms
of foreign ownership positively determines efficiency scores not by its correlation
with asset size but, rather, by the impartment of know-how and diffusion of
technology. Besides, in the context of cross-country gap in the performance of
Western and Eastern European region, convergence has already taken place between
1996 and 2000; efficiency discrepancies are ill-defined by risk preferences or
environment and best fitted in the degree of managerial competence (Weill, 2004a).
Bonin et al. (2005a) conducted bank efficiency estimations for eleven economies for
the period 1996-2000. Their contribution consisted in the inclusion of time and year
dummies in the cost function and the examination of ownership impact on cost/profit
efficiency. The results give credit to the significant positive effect of asset size and a

139
combined impact of strategic foreign investment, majority foreign ownership and
international institutional participation on efficiency of over 18% on cost efficiency
and of 16% on profit efficiency. Without identifying any causality, foreign strategic
ownership incurs a more robust effect on both profit and cost specifications while
international investors tend to seek for higher returns (profit efficiency). Almost the
same results are confirmed by Dimova (2005) for Central and Eastern Europe with
respect to the performance superiority of foreign banks in terms of managerial
competence, loan portfolio quality and profitability. However, besides the amendment
of operational performance throughout those years, low levels of cost efficiency and
even much lower for profit efficiency are identified by Rossi et al. (2005). According
to Bonin et al. (2005b), greater inefficiency of large state-owned banks constitutes a
„drawing power‟ of privatisation strategies. The cream-skimming hypothesis is
persistent in foreign banking (Borovicka, 2007) whereas de novo and privatized banks
are used to collecting deposits, reducing loan provisioning and offering commission-
intensive services.
Kasman and Yildirim (2006) applied the Fourier functional form of SFA
methodology on commercial banks for the period 1995-2002 to end up with 20.7%
for average cost and 36.7% for profit inefficiency. Still, foreign ownership is charged
for advanced performance in the `90s after controlling for macroeconomic and
reforming conditions prevalent in that period. Along the lines, Yildirim and
Philippatos (2007b) applied SFA and DFA for 12 transition economies to find out
almost the same levels of inefficiencies posing significant positive (negative) effects
of competition on cost (profit) efficiency. Foreign ownership attributes more to cost
reduction rather than profit efficiency, which is often traced in domestic ownership
schemes of both private and public banking entities. On the contrary, Green et al,
(2004) rejected the hypothesis of more efficiency in foreign ownership schemes since
costs reductions have hardly been accomplished by scale and scope efficiency.
Fries et al. (2006) with a model of monopolistic competition verified higher margins
in privatized banks than in de novo and state-owned banks but such differences were
trimmed further down the road; any significant mark-ups were traced in privatized
banks of domestic owners. In addition, state-owned banks failed down to preserve
average mark-ups due to their inability of either keeping up with cost reductions or
attracting demand for their banking services. Holló and Nagy (2006) made a step

140
further drawing remarks in the comparison of 25 European countries over the period
1999-2003. As the cost efficiency gap between the old and new member states tends
to shrink, profit efficiency differences are detected if and only if there exist controls
for market conditions. That highlights the non-competitive pricing of oligopolistic
banking industries of new states and the possibility of whether efficiency gains are
going to move towards either an internally or externally operating process; in other
words, the former prerequisites managerial efficacy to squeeze out cost burden, and
the latter presupposes the passive avail out of the existent financial integration and
economic growth in developing countries.
Vo Thi (2009) and Vo Thi and Vencappa (2008) examine the role of foreign entry
either by mergers and acquisitions or by Greenfield investments in Poland, Czech
Republic and Hungary. Alongside the convergence period of the banking markets,
legal reforms have leant against drags on new market entries. Bank performance, as
broadly defined in terms of profitability, operational efficiency and net interest
margins, turns out to have been significantly affected by M&As and not so by
Greenfield projects at the very beginning of the foreign entry. Hence, cost efficiency
has been increased as well as profits and margins have diminished thereby
overshadowing the minor impact of Greenfield banks in domestic markets. After a
while (4 years or so), bank performance rebounds as M&As follow an inverse U-
shaped path although Greenfield mode of entry convey greater efficiency gains than
M&As and not statistical difference in those of M&As and domestic banks. Even
profit efficiency over the same period is positively correlated with structural reforms
that kicked in towards the liberalisation of the banking industry (Koutsomanoli-
Filippaki et al., 2009).
Staikouras et al. (2008b) and Mamatzakis et al. (2008) examine different emerging
banking markets of the Southeastern European Union for the years 1998-2003. They
applied SFA methodology identifying foreign ownership as a more efficient vehicle
of operational performance with significant differences across members of such
transition groups. As a normal outcome of financial integration, convergence of cost
efficiency scores is evident and contingent on the positive correlations with market
share and bank capitalisation. A more comprehensive study was carried out by
Poghosyan and Kumbhakar (2010), who examined 20 former communist countries on

141
the grounds of the heterogeneous nature of national economic conditions.
Technological regimes are classifying banking markets in clusters in line with the
latent class SFA methodology developed by Orea and Kumbhakar (2004); evidence
shows that inefficiency is attributed to the combination of otherwise distinct and
significant effects of technology differences, risk and market concentration.
4.4.5. Country – specific studies
Austria has drawn the attention of Hahn (2007) and Egger and Hahn (2010), who
endeavoured to quantify the endogenous effect of mergers and acquisitions on
banking performance. The former study samples banks over the period 1996-2002
and utilizes a two-stage analysis: DEA methodology and tobit regressions to account
for the underlying variation. Banks that engaged in domestic restructurings
experienced a higher productive efficiency than those, which did not. The latter study
complements the analysis with panel methodology to conclude that horizontal
mergers were evident over the same period producing greater cost performance gains
to smaller banks and, especially, before the merger takes place.
Podpiera and Podpiera (2005) estimated mean cost efficiencies of Czech Republic‟s
banks running three models: the stochastic frontier, the random and the fixed effects
models. They used their findings in the model of Cox proportional hazards to explain
to what extent cost efficiency affects the risk of bank failure. Statistically robust
results underline poor cost management one year before the subsequent failure almost
of all banks as a legitimate signal of warning. Pruteanu-Podpiera et al. (2007)
estimated competition with Lerner index and applied Granger-causality model to
verify the banking specificities and quiet life hypothesis. The results endorse the
former, that is the negative relationship of efficiency and competition, as fierce
competition dismantles relationship banking, making thereby monitoring costs
unbearable, and leave scale economies unexploited. Moreover, the evolution of
competition in such a transition economy over the period of 1994-2005 is pronounced
as falling concentration till 2000 and then turned off due to mergers and failures.
However, the European passport made possible the cross-border establishment of

142
branches and subsidiaries and hence, enhanced competition by the provision of
services and loan products.
For the Croatian banking sector, Kraft and Tirtiroglu (1998) and Kraft et al. (2006)
use stochastic frontier analysis employing the translog and the Fourier-flexible form,
respectively. In times of transition, the old and state-owned banks have performed
substantially in the industry although the regulatory framework, political and
macroeconomic conditions constitute major hindrance against competitiveness.
Privatisation to foreign investors could have brought about large efficiency gains had
liberalisation policies eliminated the free-riding problem. Nonetheless, Kraft et al.
(2006) in the period 1994-2000 attributed the profitability of the Croatian banking
system to bank management that treated costs and inherent risks prudently. In
contrast, the DEA methodology of Jemric and Vujcic (2002) found during the same
period the new banks to be more efficient than old ones and the smaller banks
globally efficient; large banks are, too, efficient once we consider variable returns of
scale. In the same vein, Primorac and Troskot (2005) applied DEA analysis to observe
relative technical efficiency between the range [34.46%, 50.92%], though in the
Malmquist productivity index the decomposed components - the change of efficiency
and technology – favours, on average, the former with 142% vis-à-vis the latter
(88.79%) over the examined period 2000-2003.
The French banking industry enumerates two studies. Dietsch (1993) demonstrated
the evidence of scale and scope economies, though of limited contribution.
Furthermore, universal banking tend to have the most competitive advantage amongst
the alternative productive specialisations. Brack and Jimborean (2010) juxtaposed
bank efficiency in French banks to that in Europe and the United States. Data
envelope analysis shows them to be relatively more efficient with the gap to be
narrowing from 1994 to 2000. Tobit regressions of efficiency scores on various
factors underline new capitalized banks, operating in countries with low GDP per
capita and employing austere Tier 1 capital ratios, to be the most cost-efficient.
Lang and Welzel (1996) analysed the efficiency and technical progress of the
cooperative banks of Germany using a translog multi-product specification for the
years 1989-1992. Evidence shows significant scale and scope economies most
favouring universal banking and moderate economies evident in all size classes. The

143
degree of cost efficiency is far away from the frontier. The classes of small-sized
banks tend to achieve greater productivity gains in terms of cost reductions due to
recorded technical progress. Fiorentino et al. (2006) compared the results of SFA and
DEA methodologies during the period 1993-2004. The most crucial issues involving
the underlying comparison is the heterogeneity of banking groups, time variation,
random errors and outliers. In particular, both approaches perform best for distinct
groups per year recording correlation in their ranking up to 44%. DEA is supported in
lieu of SFA if the researcher anticipates great measurement errors whereas the latter
fits in the cases of time series, present outliers and benchmarking whole banking
systems. Last, Lang and Welzer (1996) applied a panel-based SFA for the mergers
wave of cooperative banks during the period 1989-1997. The concluding remarks
show size effects in a merger if that endeavour closes part of the acquired bank‟s
branches, pre-merger motives and post-merge performance unfavouring efficiency
gains but rather a convergence in their operational performance. Bos et al. (2009)
accounted for heterogeneity in German cooperative and by plugging vectors of
variables in the deterministic kernel and in the exogenous part to affect the
distribution of the error term. Eventually, size, location and specific bank type explain
the significant systematic differences over the period 1993-2005.
The Hungarian experience was studied by Hasan and Marton (2003) throughout its
transition period towards a more liberalized and market-oriented system. During 90‟s,
banking system was reorganized through initiatives of privatisation and policies that
liberalized the status quo of corporate governance towards foreign ownership, or at
least high involvement of it. In line with the results of Claessens et al. (2001a),
foreign banks were more efficient and profitable that the domestic state-owned
structures of a transition economy like Hungary. In this way, new financial services
and business lines coupled with other comparative advantages of the region promoted
competitiveness of the banking sector.
The multiproduct bank of Ireland has been the subject of Glass and McKillop (1992),
in which the presence of scale and scope economies was investigated. The empirical
results show total diseconomies of scale in response to branch closures for cost-
cutting purposes occurring in that period; however, significant product-specific scale
efficiency traced to loans and inefficiency to investments. As for the scope

144
economies, there exist no cost complementarities, thus literally suggesting
diseconomies of productive activities.
Bos and Kool (2006) investigated the efficiency of the banking sector in Netherlands
for the years 1998-1999. Their method is based upon stochastic frontier analysis but
incorporating the exogeneity of input prices rather than endogeneity adopted widely
in the vast literature. Next, the inefficiency scores are regressed on indicators of
macroeconomic conditions, industry specific features and strategic choices.
Netherlands appears to be a region of larger bank inefficiencies with the new
methodology employed and, profoundly, more ascribed to managerial X-inefficiency.
Greek banks have been examined quite extensively since 2008. Apart from it,
Christopoulos et al. (2002) employed a translog cost function accounting for
heteroskedasticity in the error term; results show heteroskedastic inefficiency to be
appropriate for capturing the efficiency effects of bank‟s size. Large banks are less
efficient than small and medium-sized and in order to recoup some gains the
reduction of the asset portfolio is suggested. In addition, economic performance,
investments and loans are positively related to cost efficiency. Kamberoglou et al.
(2004) analysed the efficiency of Greek banks during the period 1993-1999, in which
the sector was exposed to financial deregulation in line with the economic
convergence towards EMU. Differences in inefficiency, that indirectly constitute the
unexploited potential, seem to be determined by ownership (public), size (large), risk
attitude (aversion), technological innovations and scale economies. The results are in
line of Noulas (1997), who found small banks to be more efficient and larger ones
being beneficially affected by technological progress. Giokas (2008a; 2008b) and
Noulas (2008) investigated the efficiency impact of Greek bank branches on
generating profits. On average, their operational performance has been poor hitting up
to 30%, rural regions do play a positive role on efficiency and, within branch
networks, larger and more profitable branches tend to be more efficient. Kosmidou
and Zopounidis (2008) highlighted the relatively strong tendency of performance-
ranked commercial banks to expand their customers‟ base and competitively operate
and gain profits; the results of cooperative banks were inconclusive as their profits
and market shares follow adverse pace. In addition, Pasiouras et al. (2008) regressed
the annual returns of bank share prices on the change of efficiency controlling for size
and risk; in a nutshell, the underlying relationship was significant for the period 2001-

145
2005 with no scale efficiency effects recorded. Chortareas et al. (2009) analysed
quantitatively the levels of bank efficiency utilising DEA and TFP methodologies.
Over the years 1998-2003, Greece demonstrated 4.3% increase in cost efficiency and
gains of profit efficiency by 93%; last, productivity has been enhanced by 15% with
off-balance sheet items showing no significant effect.
In the run-up of Polish banks towards the deregulation of its industry, Havrylchyk
(2006) found no evidence during 1997- 2001 in favour of cost efficiency gains and its
components, namely technical, allocative, pure technical and scale effects. Contrary
to these findings, Pawlowska (2003) examined the impact of mergers and acquisitions
on cost efficiency and productivity change and underlined the upward shift of all
efficiency and productivity measures, especially though amongst the large banks that
traditionally engage in M&As and perform higher efficiency already. The key
influencing factors of efficiency are recorded to lie upon bank‟s size and foreign
ownership. Along the same lines, Figueira et al. (2007) corroborate to the competitive
efficiency of polish banks with respect to the benchmark of UK banks‟ performance.
In the advent of economic changes, the banking industry seems to pass the „stress‟ test
of EU competition.
In the Portugal case, Canhoto and Dermine (2003) employed DEA methodology to
assess the efficiency of old and new banks between 1990 and 1995. The performance
of foreign and new banks (77%) dominated that of old ones (62%) recording a stable
tendency over time. Portela and Thanassoulis (2007) innovated upon DEA by
decomposing performance of bank branches into the transactional, operational and
profit components. The results show positive interconnections among service quality,
profit and operational efficiency; however, although there exists a positive
relationship between operational and transactional performance, the latter is,
surprisingly, not affected by service quality. On the other hand, SFA methodology
enumerates the studies of Mendes and Rebelo (1999), De Pinho (2001) and Boucinha
et al. (2009), Lima (2008) and Lima and Pinho (2008) along with Mendes and Rebelo
(2000), who applied them both. Pinho (2001) shows an increase in average efficiency
of Portuguese banks, identifying scale economies for smaller banks and cost
complementarities of loans and deposits. Rebelo and Mendes (2000) found strong
productivity progress both for small and large banks, positive efficiency shares of
bank consolidation (Lima, 2008) but comparatively greater productivity and

146
technological change for urban banks. In contradistinction, during the same period,
Mendes and Rebelo (1999) realized no profound evidence of stable increasing path of
efficiency and exact causality on size and cost efficiency since inefficient smaller
banks enjoy economies of scale and efficient larger institutions suffer by
diseconomies of scale. In the latest study of Boucinha et al. (2009) for the period
1992-2004, banks were found to be more efficient in the case of low credit risk, idle
liquidity and increased capitalisation; the latter is likely to explain the alleviation of
agency problems and the ability to attract the most efficient management. On average,
banks record total productivity increased by 31.4%, inefficiency levels of 9% and
higher share of technological innovation on cost minimisation (3.2% from 2.2%).
Romanian banks are analysed in terms of their performance during 1996-2002 as a
response to the tightening of regulatory framework by the National Bank of Romania.
Notwithstanding stochastic frontier analysis showing policy changes to operate
against technical inefficiency, such an effect is dominated by the short-run costs of
additional regulatory burden; indeed, technical inefficiency share on total costs has
been substantially diminished from 41% to 21%. After the examined period, the
restrictive framework paid off in the form of constructing a more sound mechanism of
absorbing shocks and limited losses of loan portfolios (from 35.4% to 1.1%).
In Sweden, Bergendahl and Lindblom (2008) measured the service efficiency of
savings banks and the extent to which the results are differentiated from a profit
oriented evaluation of a commercial bank. Employing a DEA methodology, more
small and medium-sized banks are service efficient, rather than profit efficient,
though the average efficiency scores tend to coincide over the period. Large savings
banks face fierce competition and exhibit lower profit efficiency as well as service
efficiency due to their operation in large networks of populated districts.
Rime and Stiroh (2003) examined the case of Switzerland, pooling a sample of banks
for the period 1996-1999. They applied stochastic frontier analysis with translog cost
and profit functions and distribution-free specification for the inefficiency component
of the error term. The evidence supports significant profit and cost efficiency as well
as economies of scale for the small and medium-sized banks. Greater dispersion in
performance is observed in large banks whereby the initiatives of consolidation and
restructurings explain the dominating trend over the decade. The proliferation of

147
universal banks with a broad mix of outputs – e.g. brokerage, OBS items, portfolio
management and trading - falls short of reaping the benefits of scale and scope
efficiencies.
The paper of Mertens and Urga (2001) examined the whole spectrum of efficiency
dimensions of the 79 commercial banks in Ukraine. They applied stochastic frontier
analysis and thick frontier approach for the year 1998, drawing remarks about the
small banks being more cost efficient and at the same time less profit efficient than
large banks; the latter is possibly explained by the presence of monopoly power in the
banking industry. Another finding is the remarkable dispersion of economies of scales
between differently-sized banks: large banks face diseconomies of scale while smaller
ones great scale efficiency. That, in part, could be explained by the hurdle of current
technology to diffuse in the production process and evolve in an efficient way. Market
concentration is, therefore, far from taking significant levels, though being the case
for the market of small banks.
During the period of 1982-1995, Drake (2001) and Webb (2003) conducted DEA
analysis for UK banks differentiating with each other by applying window analysis
and Malmquist productivity indices between periods, respectively. They both
corroborate on the findings that overall productivity has increased since „80‟s,
technically the upward frontier shifts dominating the negative catching-up effect.
Excess capacity has been a long-lasting problem and rationalisation in terms of pure
technical efficiency takes time to give out tangible results, and if any, they are
identified in banks clustering above 100bn asset sizes. Both consent to the thorny
problem in UK banking that scale inefficiency affected severely very large banks as
well as very small banks according to Drake (2001).

148
4.5. Conclusion
The methodology of competition modeling comprises the issues of market structure
and efficiency. The key question arises regarding the potential effects of
concentration and efficiency, as decomposed into economies of scale and scope
economies, technology, management practice, on bank behaviour. Conditional on the
line of reasoning, viz. SCP paradigm and efficiency hypothesis, several measures of
concentration and efficiency approaches are used to verify their explanatory power on
competitive conditions. However, the employment of particular methodology implies
particular shortcomings and advantages, according to which the empirical analysis
should be treated with cushion.
In particular, to the best interest of research questions, CRk and HHI are the most
widely used in the literature, without overlooking the consistency of all the others to
markets of different features. Efficiency stands out as a stand-alone theme of financial
literature, comprising traditional data envelope analysis, stochastic modeling and
semiparametric methodology. Whether it is the case of deterministically estimating
efficiency from deviations from the observed best practice, defining the functional
form of the inefficiency component of the random error or combining those two in
two-stages procedures, among others, technical and allocative efficiency may be the
source of survival in fierce competition or the ultimate end of prospective
consolidations amid conditions of integrated and deregulated European market.

149
Chapter 4 appendix
Table of reviewed papers
Author(s) Approach Period Countries
International comparisons
Allen and Rai
(1996)
SFA (distribution-
free) 1988-1992
AUSTR, AUS, CAN, SWISS, GER, DEN,
SP, IT, SW, JAP, BEL, FIN, FR, UK, US
Amel et al. (2004) Review – efficiency gains from M&As
Berger (2007) Review
Berger and
Humphrey (1997) Review – performance effects from M&As
Correa (2009)
Fitzpatrick and
McQuinn (2008) SFA (ML) 1996-2002 IR, UK, CAN, AUSTR
Gonzalez (2009)
EFF and Political
economy effects
on MS, CONC
1996-2002 69 countries (Europe, US, Latin and
Carribean countries, Asia)
Hahendorff and
Keasey (2009)
M&A effects on
performance 1996-2004 US, EU-15 plus SWISS
Kasman et al.
(2005) SFA (Fourier) 1996-2001 16 Latin and Carribean countries
Lensink et al.
(2008) SFA (translog) 1998-2003 105 countries worldwide
Lozano-Vivas and
Pasiouras (2010) SFA (translog) 1999-2006 87 countries
Maudos and
Pastor (2001) SFA (translog) 1984-1995
Europe, Japan, US
Meon and Weill
(2005) SFA 62 countries
Pasiouras (2008b) DEA 2003 95 countries
Pasiouras et al.
(2009) SFA 2000-2004 74 countries
Pastor and
Serrano (2006)
Specialisation
effect on
efficiency
1992-1998 GER, AUS, BEL, DEN, SP, FR, GR, IT,
LUX
Pastor et al.
(1997) DEA 1992 US, Europe
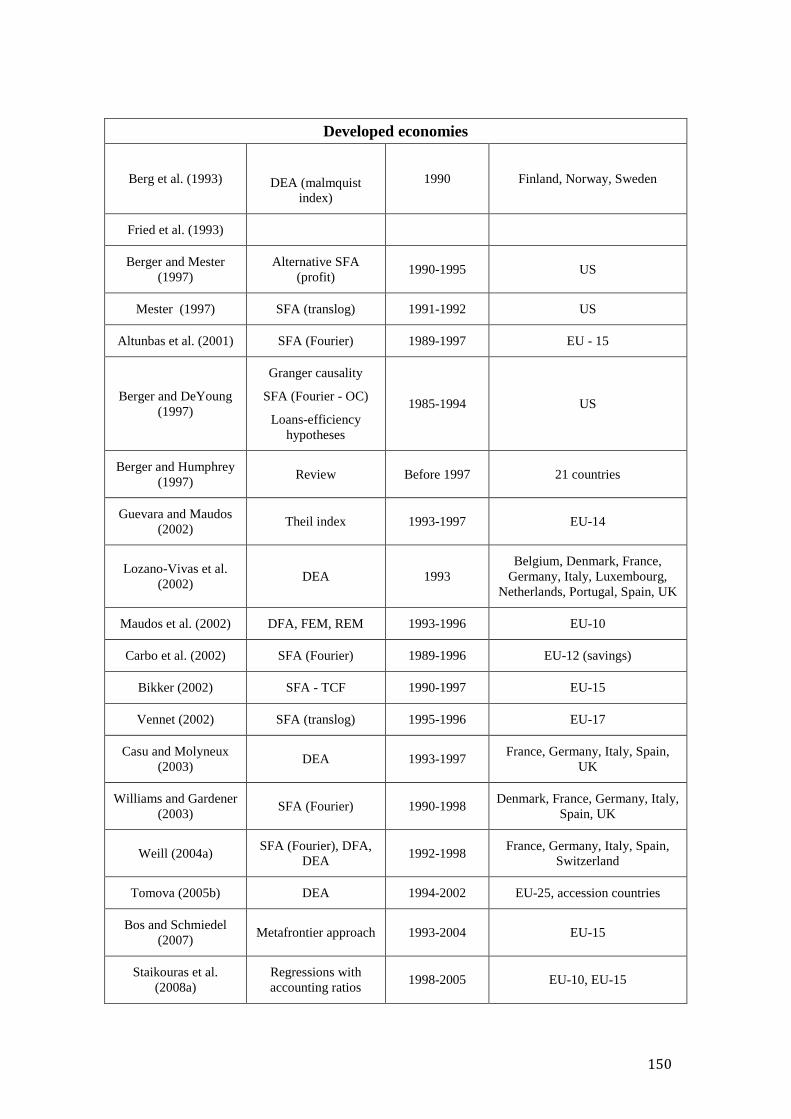
150
Developed economies
Berg et al. (1993)
DEA (malmquist
index)
1990 Finland, Norway, Sweden
Fried et al. (1993)
Berger and Mester
(1997)
Alternative SFA
(profit) 1990-1995 US
Mester (1997) SFA (translog) 1991-1992 US
Altunbas et al. (2001) SFA (Fourier) 1989-1997 EU - 15
Berger and DeYoung
(1997)
Granger causality
SFA (Fourier - OC)
Loans-efficiency
hypotheses
1985-1994 US
Berger and Humphrey
(1997) Review Before 1997 21 countries
Guevara and Maudos
(2002) Theil index 1993-1997 EU-14
Lozano-Vivas et al.
(2002) DEA 1993
Belgium, Denmark, France,
Germany, Italy, Luxembourg,
Netherlands, Portugal, Spain, UK
Maudos et al. (2002) DFA, FEM, REM 1993-1996 EU-10
Carbo et al. (2002) SFA (Fourier) 1989-1996 EU-12 (savings)
Bikker (2002) SFA - TCF 1990-1997 EU-15
Vennet (2002) SFA (translog) 1995-1996 EU-17
Casu and Molyneux
(2003) DEA 1993-1997
France, Germany, Italy, Spain,
UK
Williams and Gardener
(2003) SFA (Fourier) 1990-1998
Denmark, France, Germany, Italy,
Spain, UK
Weill (2004a) SFA (Fourier), DFA,
DEA 1992-1998
France, Germany, Italy, Spain,
Switzerland
Tomova (2005b) DEA 1994-2002 EU-25, accession countries
Bos and Schmiedel
(2007) Metafrontier approach 1993-2004 EU-15
Staikouras et al.
(2008a)
Regressions with
accounting ratios 1998-2005 EU-10, EU-15

151
Dellis and Tsionas
(2009) LML technique 1999-2006 EMU, US
Transition economies
Bonin et al. (2005a) SFA - ownership 1996-2000
Poland, Croatia, Hungary, Romania,
Bulgaria, Lithuania, Slovenia,
Slovakia, Latvia, Estonia, Czech
Republic
Bonin et al. (2005b) SFA 1994-2002 Bulgaria, Czech Republic, Croatia,
Hungary, Poland, Romania
Borovicka (2007) SFA 1995-2004 19 European transition countries
Dimova (2005) Ratio approach - SFA 1997-2002
Poland, Hungary, Czech Republic,
Estonia, Latvia, Lithuania, Bulgaria,
Romania, Slovenia, Slovakia,
Fethi et al. (2008)
Various
methodologies – see
references
1998-2003
Poland, Czech Republic, Estonia,
Latvia, Lithuania, Hungary, Slovenia,
Slovakia,
Fries and Taci (2005) SFA 1994-2001 15 East European countries
Fries et al. (2006) SFA (REM, FEM) 1995-2004 Post-communist countries in Eastern
region
Dellis and
Papanikolaou (2009) DEA, bootstrap 1994-2005 10 newly acceded countries
Green et al. (2004) SFA 1995-1999
Bulgaria, Croatia, Czech Republic,
Estonia, Hungary, Latvia, Lithuania,
Poland, Romania
Grigorian and
Manole (2002) DEA 1995-1998
Central, Southeastern Europe plus the
Commonwealth of Independent States
Hollo and Nagy
(2006) SFA (Fourier) 1999-2003 25 European countries
Kasman and Yildirim
(2006) SFA (Fourier) 1995-2002
Czech Republic, Estonia, Hungary,
Latvia, Lithuania, Poland, Slovak
Republic, Slovenia
Koutsomanoli-
Fillipaki et al. (2009) SFA 1999-2003
Hungary, Poland, Czech Republic,
Slovakia
Mamatzakis et al.
(2008) SFA 1998-2003
Cyprus, Czech Republic, Estonia,
Hungary, Latvia, Lithuania, Malta,
Poland, Poland, Slovak Republic,
Slovenia
Poghosyan and
Kumbhakar (2010) SFA 1995-2005 20 former socialist countries

152
Rossi et al. (2005) SFA 1995-2002 9 Central and Eastern European
countries
Staikouras et al.
(2008b) SFA 1998-2003
Bosnia-Herzegovina, Bulgaria, Croatia,
FYR of Macedonia, Romania, Serbia–
Montenegro
Stavarek (2003) DEA 1999-2002 Czech Republic, Hungary, Poland,
Slovakia
Stavarek (2005) DEA 2002-2003
Portugal, Greece, Czech Republic,
Hungary, Poland, Slovakia, Bulgaria,
Romania
Tong Wu (2006) SFA, SURE 2000-2004 7 accession and 10 non-accession
countries
Von Thi (2008) Accounting measures 1994-2004 Czech Republic, Hungary, Poland
Von Thi and
Vencappa (2008) SFA 1994-2004 Czech Republic, Hungary, Poland
Weill (2002) SFA 1994, 1997 Poland, Czech Republic
Weill (2004a) SFA (Fourier) – input
shares 1996, 2000
11 Western and 6 Eastern European
countries
Yildirim and
Philippatos (2007b) SFA, DFA 1993-2000
Czech Republic, Estonia, Croatia,
Hungary, Lithuania, Latvia, FYR
Macedonia, Poland, Romania, Russian
Federation, Slovenia, Slovakia
Country-specific studies
Egger and Hahn
(2010) Matching framework 1996-2002 Austria
Hahn (2007) DEA 1996-2002 Austria
Podpiera and
Podpiera (2006) SFA, REM, FEM 1994-2003 Chech Republic
Prutaneu-Podpiera et
al. (2007) SFA (translog) 1994-2005
Chech Republic
Podpiera and Weill
(2008) GMM panel 1994-2005
Jemric and Vujcic
(2002)
DEA
Croatia Kraft and Tirtiroglu
(1998) SFA (translog) 1994-1995
Kraft et al. (2006) SFA (Fourier) 1994-2000

153
Primorac and Troskot
(2005) Malmquist index 2000-2003
Dietsch (2003) SFA (translog) 1987
France Jimborean and Brack
(2010) DEA 1994-2006
Fiorentino et al.
(2006) SFA (translog), DEA 1993-2004
Germany Lang and Weizel
(1996) SFA (translog) 1989-1992
Lang and Weizel
(1999) SFA (translog) 1989-1997
Chortareas et al.
(2009)
DEA,
Malmquist index 1998-2003
Greece
Christopoulos et al.
(2009)
SFA (translog –
hetegeneity) 1993-1998
Giokas (2008a) DEA 2001
Giokas (2008b) DEA 2002
Kamberoglou et al.
(2004) FEM 1993-1999
Kosmidou and
Zopounidis (2008)
Promethee method
(CAMEL rating
system)
2003-2004
Noulas (1997) Malmquist index 1991-1992
Noulas et al. (2008) DEA 2000-2001
Pasiouras et al.
(2008) DEA 2001-2005
Rezitis (2008) Output distance
function 1993-2004
Hasan and Marton
(2003) SFA (translog) 1993-1998 Hungary
Glass and McKillop
(1992) SFA (hybrid translog) 1972-1990 Ireland
Bos and Kool (2006) SFA (translog) 1998-1999 Netherlands
Figueira et al. (2007) SFA (translog) 1999-2004
Poland Havrylchyk (2006) DEA 1997-2001
Pawlowska (2003) DEA 1997-2001

154
Boucinha et al.
(2009) SFA (translog) 1992-2004
Portugal
Canhoto and Dermine
(2003) DEA 1990-1995
Portela and
Thanassoulis (2007) DEA 2001-2002
Mendes and
Rebelo(1999) SFA (translog) 1990-1995
Rebelo and Mendes
(2000) Malmquist index 1990-1997
de Pinho (2001) SFA (translog) 1986-1992
Asaftei and
Kumbhakar (2008) SFA (translog) 1996-2002 Romania
Bergendahl and
Lindblom (2008) DEA 1987-1992 Sweden
Rime and Stiroh
(2003) SFA (translog), DFA 1996-1999 Switzerland
Beccalli (2004) SFA (translog) 1995-1998
UK
Drake (2001) DEA – Malmquist
index 1984-1995
Fitzpatrick and
McQuinn (2005) DEA – SFA (translog) 1996-2001
McKillop et al.
(2002) DEA 1996
Webb (2003) DEA window analysis 1982-1995
Mertens and Urga
(2001) SFA (translog) 1998 Ukraine

155
CHAPTER 5
The nexus between bank competition and financial stability

156

157
5.1. Introduction
Banks may be a channel-through conducive for instability and welfare loss11
in the
economy once considering liquidity, credit pause drying out payment services and
interbank lending, among others. Its definition may be conceptually clear depending
on the angle we evaluate incidents of financial distress. For example, a brief overview
should comprise financial stability to be a situation of information asymmetries that
jeopardize asset allocations (Mishkin, 1999), of systemic risks (domino effect)
inherent in the interconnections of financial institutions that witness distress of few
banks (Summer, 2003), of asset pricing that serves as a means of optimally planning
savings and investments (Haldane, 2004).
In addition, the last mergers wave has rendered the analysis of concentration on bank
risk-taking an imperative to absorb shocks of potential real output losses since
consolidation plans are subject to the approval of antitrust authorities. However, the
design of the so-called macroprudential regulation12
and supervision comes into play
to configure prudent conduct of banks as well as monetary and fiscal policies in order
to create indispensable synergies of all the relevant authorities.
5.2. Theory
The analysis13
of the underlying relationship stems from the seminal contribution of
Keeley (1990) following those of Marcus (1984) and Chan et al. (1986), who
proposed the „franchise (charter) value‟ paradigm, that is if the diminishing market
power of banks, in line with the emergence of great competitive pressures, squeezes
profit margins, banks in order to recoup increased returns take refuge in risky
projects. Bank failures are likely to occur when adverse selection and moral hazard
problems indicate that banks are getting more reluctant to monitor borrowers and
thereby falling short of exploiting the benefits of relationship banking (Boot and
Greenbaum, 1993). Thus, loan portfolios tend to comprise marginal applicants and
11
See Haldane et al. (2004) for the economic repercussions of financial stability and resolution
practices. 12
See Borio (2006) and Borio and Lowe (2002) for further discussion. 13
See Carletti and Hartman (2003), Beck (2008) and Vanhoose (2010) for a comprehensive theoretical
and empirical review.

158
potentially exacerbate the risk exposure (Allen and Gale, 2000). In contrast,
monopolistic banking markets promote the prudent conduct of banks in engaging in
less risky projects amid conditions of more profit-making opportunities and capital
cushions (Beck, 2008).
However, another severe source of instability is traced at the liability side; thanks to
the ongoing deregulation of financial markets, interest rates have slumped on the sly
ever since the endeavour of removing entry barriers and expanding restrictions
flourished. In such a situation, banks strive to curb low franchise value and
profitability engaging in riskier asset allocation given that in hard times of insolvency
and banks runs, deposit insurance schemes are stand by to intervene. Hence, it is
deemed to be essential for the authorities to impose restrictions on deposit
competition to discourage „gambling for resurrection‟ (Cole et al., 1995).
Matutes and Vives (2000), in an imperfect competition model, show that deposit
ceilings can produce some welfare gains in an uninsured competitive market when the
social cost of failure is prohibitive. With the employment of deposit insurance
schemes at a fixed rate deposit competition is escalating insofar as risk-taking and
profit margins can afford (Cordella and Yeyati, 2002). In the presence of risk-based
insurance on deposits, the prudent behaviour of banks can be restored improving
further social welfare. In the same vein, Hellmann et al. (2000) allege that the
imposition of capital requirements may have adverse effects on decreasing franchise
values inducing banks to embark on gambling behaviour. However, deposit-rate
controls are more Pareto-efficient instruments that promote prudency in investments
even off the equilibrium path. Even when there exist only large institutions in the
market, supervisory authorities should keep a vigilant eye on their prudent operation
while the limited role of deposit insurance schemes should not undermine their per se
existence along with government safety net in times of emergency (Mishkin, 1999).
In addition, they examine the welfare implications of deposit insurance equilibria:
notwithstanding the positive impact of insurance in preventing crises, mitigating
transport costs and extending the market, deposit insurance guarantee that all banks
are credible. Hence, in the absence of no expected diversification economies to
exploit, all banks are discounted at the same rate and the resulting higher competition
hits high failure probabilities. If decisive regulatory authorities allow for takeovers of

159
the failed banks, the incentive of behaving prudently dominates that of profiteering by
taking risks. Hence, there is a trade-off between the so-called „last bank effect‟ and
risk-taking on the grounds that competition is treated as endogenous: banks are
anticipating the failure of the others to reap short-term benefits from the resulting
concentration. (Perotti and Suarez, 2002). Should consolidation policies be coupled
with vibrant easy entry ones, the temporarily enhanced charter values of incumbent
banks will slump along the way of restoring long-run competition.
According to Allen and Gale (2000; 2004), it is Pareto optimal, though socially
undesirable, to have instability in cases of perfect competition and complete markets.
Contagion and welfare loss might well be an outcome triggered by the systemic risk
of a liquidity shock on a bank if all banks in the market rationally act as price takers
and are reluctant to liquidate its assets through the interbank market (Besanko and
Thakor, 1993). However, the alternative to rescue a troubled bank with liquidity
deficiencies by the coordination of few banks is strategically feasible (Saez and Shi,
2004).
On the top of that, Matutes and Vives (1996) consider the self-fulfilling expectations
of depositors to endogenously affect the quality – or the failure probability - of a
bank. In other words, the bank with high depositors‟ trust will enjoy higher margins
and greater market share as perceived to be diversified and hence safer in their eyes.
Such endogenous evaluation is not contingent on the perception that in concentrated
markets few banks are too big to fail or can freely exploit more opportunities;
multiple equilibria may come up even in the case of market concentration. The
assumption that concentration is conducive for lower competition is erroneous but, at
least, possible to bring about financial stability if the preservation of long-term
relationships can exploit the private and exclusive information about the way liquidity
needs are probabilistically distributed (Smith, 1984).
Even it is the case that anticompetitive conduct is not an inherent feature of large
banks, a relative market structure may induce stability effects in the presence of well-
diversified portfolios and economies of scale (Diamond, 1984; Williamson, 1986).
The size, therefore, does matter in concentrated markets and recent economic history
advocates fewer episodes of bank insolvency and runs occurred in Canada than in
U.S. (Allen and Gale, 2000). Capie (1995) show less competitive market structures in

160
UK to be stable during the period 1840 and 1940 and sustainably profitable in the past
few decades as compared to the variable performance of German banks. The
argument here is in favour of large banks and concentrated markets, upon which
supervisory authorities can bear the burden of monitoring and regulating.
Along the lines, Boyd et al. (2004) underscore inflation as another key determinant of
bank failure irrespectively to the underlying banking system. When the nominal rate
of interest (inflation) is below a certain threshold, a relatively higher probability of
bank failure is present in monopolies on the grounds that the incentive of loaning out
cash reserves dominates that of paying low rates on deposit accounts. Secondly, asset
loss is greater in competitive structures in times of a crisis, as monopolies tend to
make profits upon the liquidation of assets (e.g. deposits) except cash, for they are
able to provide inter-temporally much lower deposit insurance.
The other strand of literature contending the competition-stability nexus emanates
from Stiglitz and Weiss (1981), who showed that monopolistic market structures are
to be blamed for great charges on loans and thereby upcoming defaults. Safe
borrowers are repelled by high borrowing costs and information asymmetries render a
significant part of loans nonperforming and hence constituent of financial instability.
Boyd and De Nikolo (2005) employed the loan market channel in their analysis to
conclude that the positive relationship between risk and competition is fragile. As
monopolistic structures increase loan rates, borrowers surrender to riskier projects.
Thus, the probability of default rates is conditional on banks‟ pricing conduct in the
loan markets.
That is not the case for the model of mean shifting investment technologies by
Koskela and Stenbacka (2000), since higher competition diminishes the loan rates
without necessarily triggering default risk in equilibrium out of the increased
demanded volume of investments. Caminal and Matutes (2002) found that
monopolistic markets, bearing the costs of monitoring, tend to be more susceptible to
risky loans and thereby subsequent failures. Thus, failing credit rationing, bank
willingness to loan out places the bank course in jeopardy. On the other hand, De
Nikolo and Luchetta (2009) proved out of a general equilibrium framework that
efficiency, optimal portfolio quality and diversification rents best feature competitive
markets, though non-perfect competition constitutes second-best alternative.

161
Under the perspective of supervision and precautionary regulation, interesting
arguments have been articulated in the literature. The assertion that it is easier to
monitor few and large banks rather than much more and smaller banks, does not
cohere with operating complexity of large entities. Under conditions of expanding
restructurings, universal banks and conglomerates provide the whole spectrum (or
part of) of financial services - e.g. consulting (M&As), instrument and proprietary
trading (derivatives included), stock broking, investment management, insurance –
which have been previously offered by more specialized banks, such as commercial,
investment, and merchant banks. The subject is apparently multifarious for
supervisory authorities to inspect and timely intervene rendering financial instability a
presumptive reality.
However, the effect of deregulation and in particular the removal of branching
restrictions in US on banks‟ risk taking is likely contingent on the corresponding
market structure and organisational form (Goetz, 2010). His theoretical model meets
econometric verification that the liberalisation of intrastate restrictions affects risk
taking downwards for banks branching in other states but not following the trend of
other competitors to expand in real estate markets. That is even more pervasive in
markets where the information for borrowers is less verifiable.
In contradistinction to the aforementioned mandate of having concentrated markets at
the convenience of authorities, policies are likely to lean towards the provision of
large subsidies and bail-outs in an attempt to eschew from impawning the viability of
too-big-to-fail banks. Under the auspices of such tutelar policies, bank managers have
an incentive to take risks potentially exacerbating the contagion risk of large and
insolvent banks (Mishkin, 1999).
Without constraining ourselves to surrender to any side of contending hypotheses, it
could be the case that there exists a matching point. Martinez-Miera and Repullo
(2010) concur that there exists a U-shaped relationship between competition and bank
failure risk. In particular, monopolistic markets experience the risk-shifting effect,
that is more competition with low loan rates stabilizes banks as they run less risk of
default whereas the margin effect – lower revenues of total non-defaulting loans may
jeopardize banks in view of potential entries – occurs usually in competitive markets.
162
5.3. Empirical review
The pertinent literature of empirical analysis on whether it is the case that bank
competition drives to financial stability, enumerates several - though not adequate -
studies on European Union, USA, Asia and Latin America. Recent studies that focus
on regions outside European territory are Yeyati and Micco (2007) for Latin
American countries and Cerqueiro et al. (2008) for the US banking industry. In
addition, Boyd et al. (2009) and De Nikolo and Loukoianova (2007) conducted
broader investigation of 133 non-industrialized countries for the period 1993-2004.
However, the developed economies comprising several European states are analysed
by Beck et al. (2006a), Berger et al. (2009), Laeven and Levine (2009), Schaeck and
Cihak (2008) and Schaeck et al. (2009). Last, other papers deal with the EMU – e.g.
Agoraki et al. (2009)(CEE), Cipollini and Fiordelisi (2009), Uhde and Heimeshoff
(2009) - and/or specific European countries like Germany (Beck et al., 2009) and
Spain (Jimenez et al., 2010).
5.3.1. International studies
Other regions outside the EU have triggered less attention regarding contemporary
issues of financial stability partly due to the immature operation mechanism of
European financial markets under the umbrella of a single currency union. Hence,
Cerqueiro (2008) examined why concentration in US bank markets gives out peculiar
effects on loan supply. The reason comes into play providing interesting insights for
the research of financial stability: the credit quality is contaminated once banks raise
loan rates and are willing to grant loans to induced borrowers of relatively less credit
worthiness. In contrast, the Latin American territory witnessed high levels of
concentration and foreign penetration due to the operation of foreign branches and
subsidiaries (Yeyati and Micco, 2007). Τhe competitive conduct of banks lost ground
and the positive correlation of risk and competition highlights a positive relationship
between foreign banking and financial stability notwithstanding the recorded high-
risk indicators of foreign ownership.
Boyd et al. (2009) run several cross-section and panel regressions for US and
international samples. The common idea of the former is the set up of two models,

163
that is one running OLS with fixed effects and at the same time setting as dependent
variables Z-scores and loans to assets ratios, and the other utilising Cox
transformation of the loans to deposits ratio to capture the location-specific effects of
state clustering. The international sample is used for static and dynamic forms of
panel regressions; including HHI and other controls, the former type consists in two
specifications: one with all variables and the other omitting firm-specific variables.
The latter type applies the GMM procedure set out by Arellano and Bond treating all
dependent and independent variables as predetermined and, thus, instrumented by
their lags. The resultant trend of the empirical evidence lies in the negative
association of competition measures and probability of bank failures (Z-score). Other
robustness tests suggest higher competition implying either higher overall bank risk or
default probability of bank‟s borrowers (moral hazard effect) according to the way we
interpret the indication of loan losses ratio. In addition, notwithstanding the
ambiguous effect sign of loans-to-deposits ratio on competition, the propensity of
banks to lend is empirically favoured by competitive markets.
De Nikolo and Loukoianova (2007) articulated in a general equilibrium model the
significance of ownership in the competition-stability nexus since the underlying
effect seems much stronger for large and state-owned banks. They run several sets of
panel regression models examining the conditional means of intercepts and HHI beta
coefficients with respect to ownership type even after the inclusion of time-invariant
bank-specific controls. Last, the analysis is further enhanced by allowing for bank
heterogeneity: how much the risk profile (Z-scores) of banks of a specific ownership
type is sensitive to changes in the market structure (HHI) of the rest competitors on
the grounds that such a change is offset by adverse movements of the structure of the
whole market or that of banks of other ownership types. For the period 1993-2004, it
is indicative for regulation to promote the analysis of financial stability up to the point
of accounting of the specific relationship of ownership schemes and market structure,
along with the contemporary dimensions of risk-taking, consolidation and
competition, among others.
The IMF group of banking industries has been under investigation by Berger et al.
(2009). The GMM estimation of regressions comes along to resolve problems of
within-country correlation of the error term and heteroskedasticity after validating

164
market power instruments against potential endogeneity problems. The usual proxies
of financial distress are regressed on three versions of instrumented measures of
market power (Lerner index, HHI deposits/loans) and their quadratic terms providing
not a clear-cut answer. In fact, the opposing strands of the underlying relationship are
not necessarily mutually exclusive in the sense that banks of high market power does
exacerbate credit risk but their high franchise value may induce banks to protect
themselves mitigating the overall risk profile by higher equity capital, loan portfolios
of smaller size, among others.
Laeven and Levine (2009) empirically investigate how risk taking is interconnected
with management structures and national regulations in 48 countries for the period
1996-2001. They followed a pairwise examination by first estimating the extent to
which ownership (proxied by cash flow rights) affects solvency risk and, then,
quantifying the interaction of ownership and regulation on risk taking. The latter is
precipitated by the studies of Shleifer and Vishny, (1986) and Buser et al. (1981)
producing results that explicitly convey significant power on their interaction but
preserve individual effects whatsoever. Last, the interconnections among them could
be ascribed to bank valuations; that is, risk taking might be induced in the case of
having bank valuation be diminished as a response to national regulations (deposit
insurance, capital requirements, activity restrictions14
). Evidence highlights the
willingness of more powerful owners and equity holders to engage in riskier
investments than debt holders and non-shareholding managers.
Schaeck et al. (2009) examined 31 banking crises in a sample of 45 countries making
comparisons of duration and standard tobit modeling. Their explicit difference is that
the latter records a systemic financial crisis at the time of occurrence unconditionally
of the past, while the former defines the conditional probability of a crisis at a time,
until which no crisis has been experienced. Both models control for national legal
origins, key macroeconomic conditions under various specifications to conclude that
competition never appears to intensify systemic risk and produce equivocal effect
signs with concentration. In duration models, competition and concentration maintain
14
Barth et al. (2000) identified restrictions on securities activities to undermine bank viability in a large
sample of banking markets. However, the endogeneity of credit supply has been overlooked as an ex-
post anagnosis of the US crisis in 2007/8 (Shin, 2009).

165
the positive effect on the transitory period to crisis while both effects come along with
less inference after the inclusion of ownership, regulation and private monitoring.
Schaeck and Cihak (2008) used datasets of Europe and U.S. to assess first whether
competition Granger causes efficiency. The proxies employed here are the Lerner
Index and a translog specification of a cost as well as profit and alternative profit
functions. They also run the model of the so-called Boone indicator, which
presumably assumes that the relative performance of a bank is attributed to
differences in efficiency. Despite its shortcomings alleged in the literature, Z-scores
are regressed on it apart from control factors; however, instrumental variable
techniques are employed to resolve potential endogeneity bias of bank soundness,
Boone indicator and bank size. Some aspects here: First, the last two concepts are
correlated since vulnerable banks of little size may exacerbate their risk profile by
intensifying loan provision, which constitutes an indication of greater competition.
Second, this effect may acquire a negative sign if the Boone indicator captures the
entry of small firms that provide substitute banking services and thereby forcing
incumbent banks to curtail their costs more efficiently. The instruments employed are
the financial freedom index and fixed assets to total assets for the Boone indicator and
bank size, respectively. In so doing, efficiency tends to have an effect on competition
in both samples, by the construction of which efficiency is an active conduit of
competitive effects on bank‟s risk-taking conduct.
Beck et al. (2006a) examined the relationship of concentration and probability of
systemic instability in a large sample of 69 countries. They hypothesized mechanisms
– competition, monitoring and risk diversification - that are conducive to it in the
context of policy conducting and general academic debate. Controlling for several
factors that are treated as indicators of the above mechanisms, even different
measures of concentration turn out to express market features other than those
presumably supposed (competition) and used in the literature. The employed
methodology follows the logit probability model of Demirgüc-Kunt and Detragiache
(1998; 2002) and Gonzalez-Hermosillo et al. (1997). Empirical evidence gives credit
to concentration-stability advocating since less concentrated markets seem to
exacerbate the likelihood of systemic crisis to occur. The results are persistently
robust under different specifications that account for reverse causality, membership in
G10 group, non linearities and different samples.

166
5.3.2. European studies
In particular, Uhde and Heimeshoff (2009) examined the nexus between market
concentration and financial stability for the whole region of EU. Hence, upon the
theoretical arguments of Murphy et al. (1992) regarding the heterogeneous impact of
regulatory reforms in different countries, the employed methodology pertains to a
random-effect panel regression of Z-scores on concentration rates and other controls.
Sensitivity analysis that comprise other concentration measures, instrument variables
(among others) endorse the persistent negative effect of market concentration on
banks‟ soundness. In contrast, Cipollini and Fiordelisi (2009) identified a positive
effect in the EU-25 for the period 2003-2007. The employed methodology is inspired
by the GMM proposition of Bertscheck and Lechner (1998) for a panel probit model
that proxies financial distress as the lowest observations of the risk-adjusted
shareholder value.
Agoraki et al. (2009) studied Central and Eastern European banking industries
estimating the effect of competition and regulation on bank‟s risk-taking. The Lerner
index is used to proxy banks‟ market power by means of running a translog cost
function that includes deviations from the variable means (Uchida and Tsutsui, 2005;
Brissimis et al., 2008). Regulation is expressed quantitatively in terms of regulatory
indices along with the inclusion of other factors controlling for size, efficiency,
ownership and market discipline, among others. The results show that the stand-alone
effect of regulation on credit and solvency risk is contingent on the relative market
power of banks; contrary to capital requirements and restrictions on banks‟ activities,
official regulatory power turns out to diminish both risks.
Utilizing the same methodology and a unique database, Beck et al. (2009) examined
which ownership scheme contains higher stabilizing effects in Germany.
Corroborating the remarks of Cihak and Hesse (2007), cooperative and savings (of
any size) banks persistently exhibit lower insolvency and failure risk; stability levels
are intensified by lower volatility of recorded profits despite the negative, though
inadequate, forces of low profitability and high credit risk. Contrary to such findings,
the reckless and unsettled risk profile of large and private-owned banks jeopardizes

167
their imminent insolvency - withholding lower capital as they grow in size - while
lowers distress probabilities whatsoever.
At the country level, Beck et al. (2009) and Jimenez et al. (2010) studied Germany
and Spain, respectively. Beck et al. (2009) used a dataset for the period 1995-2007
contributing to the literature by commenting on the relationship of size and ownership
types with insolvency, credit risk and distress probability. Evidence showed stability
patterns for government-owned and cooperative banks and savings banks due to low
volatility in profits and credit risk and less distress probabilities for savings banks.
However, large and private-owned banks tend to withhold less capital along their
expansion thereby being less likely to fail but nonetheless closer to insolvency
conditions. On the other hand, Jimenez et al. (2010) tested the hypothesis that banks
with possessing market power lead to less risk taking along the lines of franchise
value paradigm. Their model verified it by identifying no causal effect of
concentration on risk-taking and significant persistence of market power (measured
by Lerner index).
5.4. Conclusion
The chapter reviews the theory and empirical applications on the trade-off between
market power and financial stability. Amid competitive conditions, we may
experience failure in coordination between investors and depositors although with
appropriate regulation we can accomplish stability alongside liberalisation
procedures. On the other hand, the dynamics towards market concentration through
mergers and acquisitions should be accompanied with policies that consider
intertemporal incentives of too-big- to-fail institutions and collaboration between
credible competition and regulatory authorities.

168
Chapter 5 Appendix
Table of reviewed papers
Theoretical foundations
Allen and Gale
(2004) Theoretical framework
Beck (2008) Good theoretical and empirical review
Besanko and
Thakor (1993)
Relationship banking, deposit insurance and bank portfolio choice
Theoretical framework
Borio (2003) Micro- and macroprudential dimensions of financial instability
Borio (2006) Macroprudential regulation and supervision
Borio et al.
(2002) Asset prices, credit, monetary stability to financial stability
Boyd and de
Nikolo (2005) General equilibrium modeling of risk-taking in concentrated bank markets
Boyd et al.
(2004) Relative probabilities of crises in monopolistic versus competitive markets
Boyd et al.
(2009) Theoretical framework of competition, risk and asset allocation

169
Carletti and
Hartman (2002) Good theoretical and empirical review
Crockett (1996) Good theory
Cordella and
Yeyati (2002) Spatial competition model (Salop (1979) under various scenarios (deposit insurance and information disclosure)
Martinez-Miera
and Repullo
(2010)
Risk-shifting effect (monopolistic) and marginal effect (competitive markets)
Matutes and
Vives (1996) Fragility induced by coordination problems of depositors – economies of scale, deposit insurance
Matutes and
Vives (2000) Welfare performance of market and appropriateness of regulation contingent on rivalry degree and deposit insurance regime
Mishkin (1999) Consolidation leads to inherent systemic risk but larger banks can be protected by vigilant supervision and government safety net
De Nikolo and
Lucchetta
(2009)
Financial intermediation, competition and risk – A GE exposition
Fischer and
Genard (1997) Financial liberalization and fragility
Goetz (2010) Bank risk taking as states remove branching barriers – channels of effect

170
Haldane et al.
(2004)
Financial stability and bank solvency
Economic effects of banking crises
Hellmann et al.
(2000)
Dynamic model of moral hazard
Capital requirements are not enough unless coupled with deposit-rate controls
Koskela and
Stenbacka
(2000)
Model of mean-shifting investment technologies
Market structure – risk taking – social welfare
Competition-stability without conditioning interest rates on investments and credit rationing
Perotti and
Suarez (2002) Dynamic relationship of charter value with future competition (takeover of failed banks)
Schaeck (2009) Good review of concentration, competition and stability - measures
Vanhoose
(2010) Good theoretical analysis of competition, stability and regulation
Review of empirical analysis
Author(s) Methodology Notes Period Countries
Agoraki et al.
(2009)
Non-performing loans to total loans, Z index regressed
on market power, 3 regulatory indices (Barth et al., 2001;
2006; 2008), interaction term, bank and macroeconomic
controls plus an AR(1) specification
Risk-taking (r), competition (Lerner-mc by translog a la
Uchida and Tsutsui, 2005; Brissimis et al., 2008),
(lagged) regulation
1998-2005 13 CEE countries
Barth et al.
(2000) Financial stability (competition, bank and securities
development): Regulation-banks ability to engage in

171
securities, insurance, real estate, restrictions on banking
mix and commerce (banks owning nonfinancial firms
and vice versa), countries with state-owned banks
Beck et al.
(2006a) DD (1998; 2002)
Growth, terms of trade change, real interest rate,
inflation, M2/reserves, depreciation, credit growth (t-2),
real GDPPC, moral hazard, concentration, entry
applications denied, activity restrictions, required
reserves, capital regulatory index, banking freedom,
economic freedom, KKZ_composite, dummies of
national legal origin, latitude, ethnic fractionalisation and
religion (3)
1980-1997 69 countries
Beck et al.
(2005)
Logit model (Cole and Gunther, 1995; Gonzalez-
Hermosillo et al., 1997; Demirguc-Kunt, 1989; DD,
1998; 2002)
Macroeconomic Controls: real GDPGR, terms of trade
change, inflation, real interest rate, international forces
on bank vulnerability: depreciation, M2/reserves), credit
growth (t-2), economic development: GDPPC, moral
hazard
Regulation: fraction of entry denied, activity restrictions,
required reserves, capital regulatory index, official
supervisory power
Ownership: state, foreign
Openness, competition, institutional: banking freedom,
economic freedom, KKZ_Composite
1980-1997 69 countries
Beck et al.
(2009)
3 measures of financial stability
Comparison of 3 ownership groups
Relationship of the latter and bank size across different
ownership schemes
Financial stability proxied by Z-score, non-performing
loans, distress probabilities 1995-2007 Germany

172
Beck et al.
(2012)
FE
OLS (country, year dummies)
Cross-country heterogeneity in the competition-stability
relationship with respect to institutional and financial
development, regulation , supervision, herding and
market structure.
Z-score, conditional correlation between Lerner and Z-
score on information sharing, stock market turnover,
capital regulation, deposit insurance coverage, multiple
supervision, external governance index, activity
restrictions, heterogeneity in bank revenues, systemic
stability
1994-2009 79 countries
Berger et al.
(2009)
GMM regression model of financial stability on market
structure, bank controls, business environment
NPLS, Z-score, E/TA on
Lerner derived by TCF, HHI-deposit, HHI-loan indices
Bank size, foreign ownership, ln(GDPPC), legal rights
index
Market power variables instrumented by activity
restrictions, banking freedom, percent of state-owned
banks
1999-2005 30 developed countries
(IMF)
Bonfirm and
Dai (2009) Fixed effects panel model
Interest rates on the number of bank relationships, time
dummies
Firm controls: turnover, tangible assets% debt, leverage,
credit risk, debt coverage, firm age, assets and assets2
3-month Euribor, number of banks granting credit,
GDPGR instead of time dummies
1996-2004 Portugal
Boyd et al.
(2009)
Stability proxies (Z score, NPL) on HHI, country- and
bank-specific controls
Z score, NPLs, - HHI
-GDPGR, inflation, GDPPC population
-total assets, non-interest operating costs to total income
June 2003
1993-2004
US
134 countries

173
Cerqueiro
(2008) Heckman (1979) – probit model
Probit model of Firm‟s (bank‟s) economic benefit of
applying for (granting) a bank loan on variables
Loan - rate equation
1993 US
Cipollini and
Fiordelisi
(2009)
Panel probit regression
GMM (Bertscheck and Lechner, 1998)
HHI, C5, id, size, GDPPC 2003-2007 EU - 25
Cole et al.
(1995)
OLS
FIML by Anemiya (1973)
Risk weighted assets, tangible net worth, net interest
margin, state charters, mortgages, loans, investments,
securities, goodwill, failure (time) dummies
1986-1989 US
De Nikolo and
Loukoianova
(2007)
Plus theory
Z scores on ownership, HHI, country and bank-specific
controls
Other various specifications
1993-2004 133 countries
Jimenez et al.
(2010)
Arellano and Bond (1991) procedure (first differences) -
GMM
Risk on AR(1), 2 structure factors, GDPG, AR(1), ROA,
size, loan ratio 1988-2003 Spain
Keeley (1990) Competition – asset risk and capital reductions (fragility) Risk on instrumented market value of bank assets and
financial and other controls 1952-1986 US
Laeven and
Levine (2009)
Ownership is instrumented by cash flows rights
Simultaneous estimation of risk and Tobin‟s q
Z scores, equity and earnings volatility on country
regulation controls (GDP volatility, risk: capital
regulations (requirements, stringency), activity
restrictions index, deposit insurance, shareholder
protection rights, national enforcement of laws, M&As),
bank - level controls: (managerial ownership, revenue
1996-2001 48 countries

174
growth, market share, NYSE, size, NPLs, liquidity
ratios) and regulation measures, cash flow rights
Olivero et al.
(2010)
Dynamic Panzar-Rosse measure by GMM model of
Arellano and Bond (1991)
Bank lending channel
Loan growth rates on monetary policy indicator,
competition, their interaction term, crisis dummy,
GDPGR, bank size, capitalization and liquidity
1996-2006 10 Asian and Latin
American countries
Schaeck and
Cihak (2008)
Efficiency by TCF, Lerner,
Efficiency on AR(1), Lerner and AR(1), bank-specific
and other controls
Lerner on efficiency…(fixed effects panel)
Boone indicator (GMM)
Z score on Boone indicator/size (instrumented by bank‟s
market share, financial freedom index, fixed assets to
total assets, total assets, equity ratio and asset growth,
LLP to total assets, diversification index, [HHI, total
banks‟ assets, GDPPC, real interest rate]) plus country
and type dummies
1995-2005 Europe, US
Schaeck et al.
(2009)
H statistic
Duration analysis
Logit model
Inflation, GDP growth, real interest rate, depreciation,
terms of trade, credit growth, moral hazard index, legal
origins, continent dummies, H-stat, concentration
Activity restrictions, entry restrictions, foreign
ownership, government ownership, official supervisory
power, private monitoring index, capital regulatory
index.
1980-2005 45 countries
Shin (2009) Origins of the us crisis - interesting Accounting framework- profile of banks dependent on
equity, leverage and funding
2001-2007
1998-2007
US
UK

175
Uhde and
Heimeshoff
(2009)
Z-score on concentration, macroeconomic, bank-specific,
regulatory and institutional factors
Good robustness tests – 2SLS
Z score, ROAA, capital ratio, s.d.ROAA, concentration
(4), HHI, basic economic attitude, EU-integration,
Duration, GDPPC, real GDPGR, inflation, real interest
rate (t-1), credit growth, net interest margin, loan loss
provisions, cost-income ratio, moral hazard index, entry
restrictions, activity restrictions, capital regulatory index,
governmental ownership, economic freedom, British-
French-German-Scandinavian-Soviet legal origin
1997-2005 EU-25
Yeyati and
Micco (2007)
Time invariant (OLS) - varying (WLS / panel)
H stat
H on concentration and foreign penetration
Z score and its components on foreign ownership, size,
country-year fixed effect
Z score on the share of foreign assets, H stat and macro
controls (real growth and exchange rate volatility),
[Including bank effects: proxies of bank size and foreign
ownership]
Foreign entry instrumented by average of the foreign
shares in the rest sample countries
3 alternative z-scores [Z, ln(Z), system Z] on foreign
assets to total assets, GDP, exchange rate volatility,
concentration (average CS3, average country lnTA, H
stat)
1993-2002 8 Latin American countries

176

177
CHAPTER 6
Income-specific estimates of competition in European banking

178

179
6.1. Introduction
A significant number of empirical applications of contemporary competition
modeling has proposed indicators of market structure that suffer from either limited
comparability across European countries or over time. The structural approach, that is
concentration ratios capturing the structural features of a market, is used in models or
interpreted in conjunction with other performance measures to explain the
competitive behavior of a specific industry without sufficing stand-alone to
extrapolate competitive conditions. Even changes in concentration can be deduced
regarding market entries and exits, a feature widely used in U.S for anti-trust
purposes.
Next step is to build up a link between structural changes and bank performance,
mainly on the grounds of the Relative Efficiency (RE) and the Structure-Conduct-
Performance paradigm (SCP). Non-structural measures developed in response to the
deficiencies of structural models to quantify bank competition are based on monopoly
power measures - the New Empirical Industrial Organization (NEIO) approach. It sets
out behavioral equations concerning the price/output specifications of Iwata (1974),
Bresnahan (1982), Lau (1982) and Panzar and Rosse (1987) upon the grounds of
Lerner (1934). Another case may be the degree of contestability in a bank market;
few banks implement competitive pricing as price takers in order to discourage „hit
and run‟ behavior of new entries and thereby second their monopoly power.
Due to the limited capacity of SCP and relative efficiency, Heffernan (2002) tests for
contestability and Cournot/Salop-Stiglitz behavior in UK banking industry by
proposing a general linear model of competitive pricing of the important retail
banking products: deposits, loans, credit cards and mortgages. There is also
considerable attention in the literature to Leuvensteijn et al. (2011) for the first
empirical application of the so-called Boone indicator that measures competitive
conditions insofar as they are expressed by efficiency dynamics. The most recent
models coming to shed some light on the cross-country comparability of alternative
competition measures and incorporate the switch of banking income to not-interest
bearing sources are those of Carbo et al. (2009) and Bolt and Humphrey (2010),
respectively. The econometric analysis applies an error-correction specification to
distill competition measures from country-specific effects, and stochastic frontier

180
methodology to provide rankings of banking sectors in terms of relative competitive
measures of market structure.
The paper follows the analysis of De Guevara et al. (2005) investigating the key
effects of market power as proxied by the Lerner index. The contribution is threefold:
a) the sample is focusing on nine developed countries within the European union
since the advent of Euro, b) the emphasis is more on the measurement of marginal
costs in order to abstain from potential bias triggered by traditional modeling in the
literature, c) it is the first time, at least to our knowledge, that effects on market power
are investigated at the income level.
6.2. Methodology
The underlying paper estimates the price mark-up over marginal cost combining the
estimation of average prices and marginal costs at the bank level. The average prices
are estimated over total assets (TA) along the lines of Shaffer (1993) and Berg and
Kim (1994), instead of other earning assets in an attempt to expand as much as
possible the observations of the sample since 2002. First, we have to estimate
marginal costs by means of running a translog cost function, similar to the version of
Ariss (2010b) that excludes the use of price of borrowed funds as input price on the
grounds that it presumably captures some degree of monopoly power of incumbent
banks in the deposit market. The employed model takes the following form15
:
(6.1)
where TC: total costs, Q: total assets, W1: price of labour (personnel expenses over
total assets), W2: price of physical capital (other operating expenses over fixed
15
The panel model utilizes observations of each bank i at time t. We omit subscripts for convenience
purposes.

181
assets), Z1: fixed assets deflated by total equity, Z2: Off-balance sheet activities (non-
interest operating income) deflated by total equity and T: time trend. We introduce
fixed effects to account for different bank specificities and run model (6.1) separately
for each banking market to reflect different technologies in the region. We also allow
for a time trend to interact with the deterministic kernel in order to capture time-
varying and non-neutral technological progress in the banking sector. Homogeneity of
degree one in input prices (Σγk=1) and symmetry conditions in all quadratic terms are
imposed in model (6.1).
When it comes to the estimation of the Lerner index, we extrapolate the marginal
costs by running the following model, which is schematically the partial derivative of
total costs with respect to total assets (see Berger et al. 2009; Ariss, 2010):
(6.2)
We are then able to construct the Lerner index (L) with respect to specific bank
activities before delving into the analysis of competition determinants. According to
the following structural model,
(6.3)
where AR denotes the average revenue estimated by total income over total assets and
MC the marginal cost derived through model (6.2). Their subscripts signify the use of
Lerner index as the only proxy of market power at the bank level over time. The
following model (6.4) encompasses the conditioning of market power to various
information sets that comprise some key effects that have been under scrutiny in the
literature and other variables depicting conditions in the banking industry,
institutional and macroeconomic environment. Therefore, we maintain the structure of
four specifications in models 6.4 and 6.5 in order to draw upon the changes of
significance in the key coefficients employed.

182
L f BANKS, INDUSTRY ,ECONOMY ,DUMMIES (6.4)
There are some econometric issues involved in this case. First, we run Hausman test
to see whether fixed or random effects are appropriate, an amended Wald test for
present groupwise heteroskedasticity, Wooldridge test for first degree of
autocorrelation and the significance of using time fixed effects (testparm). We come
up with concurrent heteroskedasticity, autocorrelation in the model urging us to opt
for standard errors clustered at the bank level.
As a next step, we go further down the analysis replacing the aforementioned Lerner
index with indexes that are based upon specific bank activities, namely income on
loans, other interest-bearing income, fees and commissions and other non-interest
income. We fell short of employing other sources of bank income since they lack
considerable amount of information. In the underlying case, we opt for the Seemingly
Unrelated Regressions (SUR) framework to account for error autocorrelation within
banks. In other words, running equation-by-equation OLS regressions would be
consistent but, nonetheless, inefficient since all equations are interrelated through the
correlation of the error term. It is also of interest to verify, through the Breusch-Pagan
test, the degree of error correlation across the equations of each bank and thereby the
imperative to employ the SUR framework.
The following model (6.5) comprises the contemporaneous pricing power of specific
bank products based upon various information sets. The latter refers to the key
features of banking entities, the market they operate within and other effects of
economic environment. We denote as li the income on loans, other interest income16
,
fees and commissions and other non-interest income17
:
16
Interest income stemming from the trading book, investment securities and other short-term funds. It
excludes insurance-related income (Bankscope definition).
17 Sustainable operating income that is related to the core business of a bank, totally demarcated from
trading, derivatives, other securities and insurance income (Bankscope definition).

183
l1
l2
l3
l4
f BANKS, INDUSTRY ,ECONOMY ,DUMMIES
1
2
3
34
(6.5)
For the SUR to be properly applied, the models of every income-specific Lerner index
should have exactly the same size but different information set. Otherwise, the
estimation falls into equation-by-equation OLS.
6.3. Competition determinants
Size is introduced in the form of log of total assets as a control variable in order to
allow for the heterogeneous European sample that is associated with either relative
market power or scale economies. We opt to plug in the model a quadratic term to
verify whether it is the case of non-linear relationship between size and competition.
We test the SCP paradigm with the significance of Herfindahl-Hirschman index
(concentration), which is the sum of the squared market shares of all banks operating
in a country. Taking into account Corvoisier and Gropp (2002), the effect of
concentration may be different if expressed in terms of total deposits and loans. On
the contrary to the use of aggregated information for the concentration proxy, we opt
for the estimation of HHI from the sample data in order to examine how the synthesis
of market shares may constitute an exogenous force towards market power. However,
data from non-consolidated accounts by no means exclude large banks that otherwise
would depict larger-than-national regions, since they comprise information of at least
a part of banks‟ operations disaggregated at national levels.
Market share reflects the ratio of a bank‟s total assets over those of a national banking
industry. We use it also in terms of total deposits and loans to specify the channel,
through which the efficiency hypothesis may hold. However, its statistical
significance should be interpreted in conjunction with that of efficiency and
concentration in order to give credit to the power of alternative competition theories.
We use the first order lag of loan impairment charges over average gross loans as a
proxy of credit risk. We abstain from the traditional non-performing loans over gross
loans since it lacks considerable amount of observations from 2002 and onwards.

184
Moreover, the former is a direct measure of loan losses as it is deducted at the end of
the year from profits and, hence, is taken into account when it comes to price bank
products the year after; the latter is more obscure when it comprises doubtful loans
that may or may not end up nonperforming.
We employ cost-to-income ratio as a direct measure of operational performance that
may be attributed to superior management or production technologies. The RE
hypothesis assumes that banks of higher efficiency engage in competitive pricing in
order to grasp greater market shares, leading to high market concentration. We also
utilize the degree of income diversification of bank portfolios as indicated by the
proxy of off-balance sheet activities over total assets. It is ambiguous whether the sign
of effect is going to be positive or negative since banks willing to engage in other than
traditional loan and deposit services may have a different strategic pricing contingent
on the bank type, region, economic cycle, among others.
Total equity as a percentage of total assets (capital) accounts for further size effects
on the Lerner index of other non-interest income. The intuition here is that banks of
greater size or high capital buffers are willing to expand non-traditional banking.
Liquidity proxied by the amount of liquid assets over customer deposits and short
term funding is an important driver in the models of interest-bearing Lerner indexes
so as to quantify the correlation of pricing conduct with the ability of banks to
facilitate a potential bank run.
Elasticity of aggregate demand. We opt for the bank claims on the private sector over
GDP so as to verify whether the dependence on bank financing may be associated
with benefits for the real economy or loan losses and bank instability.
Apart from the effect of real GDP growth (cyclicality) boiling down the procyclical or
countercyclical effect of market expansion on market power, we utilize the real GDP
per capita and inflation to see whether it is the case of population (GDPPC) or price
effect (Inflation) of the business cycle in Europe. In addition, we control for sector
regulation by the strength of legal rights index as it essentially measures the efficacy
of regulatory laws with respect to collateral and bankruptcy issues in order to
safeguard the rights of borrowers and lenders. It takes values between 0 and 10, with
higher scores indicating that access to credit is facilitated to expand further.

185
We use dummies for the divergent specialisation of European banks, viz. commercial
banks, savings banks, cooperative banks and „other‟ banks that incorporate any bank
holding and holding companies, clearing institutions and custody, finance companies,
group finance companies, investment and trust corporations, investment banks,
Islamic banks, other non-banking credit institutions, private banking and asset
management companies, real estate and mortgage banks, securities firms and
specialized governmental credit institutions. The last dummy „other‟ is excluded for
multicollinearity reasons. We apply the Dummy Variable Least Squares (DVLS)
version of the fixed effects modeling, using country dummies for Austria, Denmark,
France, Germany, Luxembourg, Netherlands, Spain, Sweden and UK; Netherlands
are excluded to eschew multicollinearity. We add time dummies to allow for time
fixed effects after verifying their significance each time the information set is altered
in the regression model.
Other effects already tested in the literature, namely liquidity risk, implicit interest
payments or degree of risk aversion turn out to be insignificant without affecting the
regression output whatsoever. We omit additional bank-specific and institutional
variables since they lack sufficient statistical information during the underlying
period.
6.4. Data
The sample encompasses features of financial statements of banks operating within
nine developed countries of the European Union as they enjoy the most available data
recently. Particularly, they amount to 19187 observations of 2950 banks in Austria,
Denmark, France, Germany, Italy, Luxemburg, Spain, Sweden and United Kingdom.
We retrieve data of unconsolidated accounts from the Bankscope database,
macroeconomic and other regulatory variables from the World Bank and Eurostat.
We drop banks out of the sample that are not capable of preserving a satisfactory time
dimension (3 years) during the period 2002-2010.
We get rid of the outliers in order to come up with appropriate values of the Lerner
index that lie in-between negative infinity and one. All the determinants of bank

186
competition as a second stage of our analysis narrow down the observations to 15219
and, even, to levels of 9503 observations. Last, the third stage substantiates the
persistence of market power effects on income-specific Lerner indexes analysing a
sample that fluctuates between 798 and 8798 observations.
Table 1: Number of banks
Country 2002 2003 2004 2005 2006 2007 2008 2009 2010 Total
Austria 27 125 143 147 155 159 146 133 106 1141
Denmark 11 44 47 47 50 50 62 61 56 428
France 25 62 65 75 74 75 66 62 53 557
Germany 326 1328 1346 1619 1625 1609 1565 1515 1344 12277
Italy 18 19 22 572 581 595 582 555 406 3350
Luxembourg 27 50 54 52 51 55 53 44 27 413
Spain 8 9 15 68 69 52 56 61 48 386
Sweden 25 75 73 77 71 69 58 56 56 560
UK 14 50 61 71 76 82 83 81 69 587
Total 481 1762 1826 2728 2752 2746 2671 2568 2165 19699
Source: Own estimations of data retrieved from Bankscope.
Table 1 displays the summary statistics of the key variables used in the stochastic
frontier model (1) averaged by country over the period 2002-2010. It is evident that
Germany dominates the sample enumerating more than the half of total observations
(62.3%) while the year 2002 displays the least available information for all countries
with a gradual escalation year by year. The sample includes fewer banks for Spain
and relatively more banks for Italy and Austria; all the rest observations are close to
the range of 413 to 587 banks. Table 2 summarizes the key statistics of the variables
employed in model 1. Total costs over total assets stand at 4.9% and ranges from 3.8
in Spain to 7.1% in France. In terms of total assets, banks in UK and Luxembourg
bear comparably higher costs in levels up to 4.7 and 8.2 million euro, respectively; the
rest sectors take values from 240.82 in Sweden to 2182.14 millions in France.

187
Table 2: Summary statistics of variables in model 6.1
Country TOTAL
COSTS
TOTAL
ASSETS
PERS
EXP
OTHER
OPER
EXP
FIXED
ASSETS OBS EQUITY
Austria 0.045 842.83 0.013 0.011 0.017 0.014 0.087
Denmark 0.053 625.65 0.019 0.016 0.012 0.018 0.140
France 0.071 2182.14 0.016 0.020 0.014 0.028 0.112
Germany 0.049 1443.27 0.015 0.011 0.015 0.011 0.068
Italy 0.044 1519.12 0.015 0.013 0.016 0.012 0.117
Luxembourg 0.052 4757.09 0.013 0.013 0.005 0.030 0.104
Spain 0.038 1345.14 0.011 0.009 0.017 0.009 0.117
Sweden 0.044 240.82 0.015 0.016 0.014 0.016 0.141
UK 0.062 8273.54 0.018 0.023 0.011 0.032 0.155
Average 0.049 1661.42 0.015 0.012 0.015 0.013 0.087
All figures are expressed as a percentage of total assets apart from total assets being in millions of Euro.
Source: Bankscope database.
Furthermore, personnel expenses over total assets stand at 1.5%, ranging from 1.1%
in Spain to 1.9 in Denmark. As for the other operating expenses over total assets, it
has a mean up to 1.2, with values from 0.9% in Spain to 2.3% in United Kingdom.
Fixed assets to total assets stand at 1.5%, ranging from 0.5% in Luxembourg to 1.7%
in Austria and Spain. Moreover, the average off-balance sheet activities deflated by
total assets is 1.3%, while it ranges from 0.9% in Spain to 3.2% in United Kingdom.
Last, capital ratio stands at 8.7% taking values within the range of 6.8% in Germany
and 15.5% in United Kingdom.
In table 3, we report the man values of the key variables of models 4 and 5 per
industry sector. Concentration creeps in moderate average levels below 15% except
the case of United Kingdom where it is about 27%. The degree of concentrated in
specific markets like deposits market ranges between 1% in Germany and 37.3 in UK,
whereas in loans markets the pattern is almost the same for Germany (1.1%) and UK
(42.4%). Market share stands at values in between the range of 0.8% in Austria and
2.3% in Luxembourg. Product-specific market shares coincide in almost all cases with
values between the extreme bounds 0.1% in Germany and 2.3% in Spain and
Luxembourg.

188
Cost efficiency as proxied by total cost over total income is identified in Luxembourg
(58.6%) whereas the worst performer is Germany (70.8%) and UK (80%). The quality
of loan books is proxied by net charge-offs over average gross loans as limited data
were available for the standard ratio of NPLs over gross loans. It gets values from
67.5% in Italy to 217.3% in Germany, which consists in the share of loans finally
purged from the books. The negative average value in France means that delinquent
debt classified as gross charge-offs turns out to be repaid; thus, the recoveries are
greater than charge-offs since French banks have been moderate in evaluating bad
loans.
Moreover, the diversification ratio of off-balance sheet activities as a percentage of
asset size stands at levels in between the range of 1.1% for the cooperative banks of
Germany and 3.2% in UK. The capital cushion against potential asset malfunction
(Equity/TA) that insulates a bank at least up to the degree of investment in it, has
figures from 6.8% in German to 15.5% in UK banks. Liquidity risk is proxied by
liquid assets to customer deposits and short-term funds, which essentially forms the
share of deposits and other funds that could be met in case of a sudden bank run. Its
figures take values between 16.6% in Sweden and 83.3% in Luxemburg.
As far as economic conditions are concerned, the average growth rate of GDP
annually performs worse by 0.2% in Italy and by 2.8% in Luxembourg. Italy also has
the least private credit granted to the private sector (deflated by GDP) at levels of
0.976 while Denmark performs much better with 1.878. In addition, in order to
account for the population effect, GDP over midyear population ranges between
20900 in Spain and 65344 in Luxembourg. Besides, the inflation rate (deflated by
GDP) had a much higher pace in Spain during the period 2002-2010 at about 2.83%
whereas Germany is considered to have accomplished the lowest rate at 1.6%. Last,
the strength of legal rights index indicates that bankruptcy and collateral laws are
reinforced to better protect lending in UK (10.0) and considerably less in Italy (3.0).
Table 3: Summary statistics of variables in models 6.4 and 6.5
Variable AUS DEN FRA GER IT LUX SP SWED UK

189
The estimation of CONC and market share along with their constitutents takes account of the available
information in Bankscope database, which enumerates up to 19761 observations of our sample. Source: World
Bank, Eurostat and own estimations.
6.5. Results
Table 4 depicts the mean values of the Lerner index and those indexes at the income
level per banking industry as well as the average marginal costs that used for the
estimation of the former. What really stands out in the column of marginal cost is the
high values of the banking sectors in United Kingdom and France at about 6.7%; the
remainder falls in-beween the range of 3.8% in Sweden to 5.4% in Luxembourg.
When it comes to compute the Lerner index, we expect sectors with high marginal
costs to enjoy relatively greater competitive conduct. In contrast to the almost perfect
competition in UK, France demonstrates 21%, which is higher than other values in
countries of higher marginal costs. However, Sweden and Denmark enjoy the highest
CONC 0.071 0.133 0.059 0.013 0.107 0.123 0.150 0.040 0.273
CONC (deposits) 0.073 0.075 0.062 0.010 0.113 0.127 0.155 0.040 0.373
CONC (loans) 0.071 0.142 0.053 0.011 0.136 0.126 0.127 0.048 0.424
Market share 0.008 0.021 0.016 0.001 0.003 0.022 0.023 0.016 0.015
Market share
(deposits) 0.008 0.021 0.016 0.001 0.003 0.022 0.023 0.016 0.016
Market share
(loans) 0.008 0.021 0.016 0.001 0.003 0.023 0.023 0.016 0.017
TC/TI 0.669 0.679 0.665 0.708 0.691 0.586 0.628 0.642 0.800
Loan impairment 0.893 1.204 -2.821 2.173 0.675 0.807 1.912 0.604 1.430
OBS/TA 0.014 0.018 0.028 0.011 0.012 0.030 0.009 0.016 0.032
EQ/TA 0.087 0.140 0.112 0.068 0.117 0.104 0.117 0.141 0.155
Liquidity 0.306 0.245 0.273 0.188 0.273 0.831 0.296 0.166 0.653
GDPGR 0.017 0.006 0.011 0.009 0.002 0.028 0.019 0.022 0.016
Private credit 1.147 1.878 0.996 1.116 0.970 1.486 1.633 1.167 1.754
GDPPC 30367 3798
9 27322 27789 24367 65344 20900 33044 30289
Ιnflation 1.811 1.944 1.867 1.600 2.222 2.689 2.833 1.811 2.200
Legal Strength 7.000 8.714 6.000 7.571 3.000 6.800 6.000 6.714 10.000

190
monopolistic rents at levels of circa 39 and 33.3%, respectively. The negative sign in
Spain indicates irrational behaviour of bank managers pricing products below
marginal costs.
Table 4: Marginal costs and Lerner indexes
Country MC L L1 L2 L3 L4
Austria 0.049 0.103 -4.107
(16.2%)
-0.488
(68.8%)
-16.312
(12.6%)
-90.441
(2.4%)
Denmark 0.048 0.332 -0.953
(60.4%)
-2.470
(21.3%)
-5.389
(14.4%)
-190.856
(3.9%)
France 0.068 0.210 -2.179
(47.4%)
-15.724
(27.8%)
-18.621
(18.1%)
-90.447
(6.7%)
Germany 0.052 0.118 -0.604
(66.4%)
-12.776
(18.2%)
-8.513
(12.3%)
-44.055
(3.1%)
Italy 0.049 0.126 -2.561
(70.3%)
-11.748
(15.9%)
-8.082
(10.9%)
-37.187
(2.9%)
Luxembourg 0.054 0.215 -3.081
(69.6%)
-77.182
(12.8%)
-5.010
(13.3%)
-72.152
(4.3%)
Spain 0.050 -0.010 -0.846
(2.1%)
-9.623
(61.5%)
-18.705
(35.4%)
-120.919
(1%)
Sweden 0.038 0.390 -1.061
(71.5%)
-21.066
(9.8%)
-3.650
(17.1%)
-89.223
(1.6%)
UK 0.066 0.003 -4.307
(7.7%)
-32.977
(41.7%)
-16.982
(47.1%)
-81.170
(3.5%)
Average 0.051 0.129 -1.062 -13.526 -9.255 -53.557
MC=Marginal Cost; L=Lerner index; L1=Lerner with respect to income on loans; L2=Lerner index
with respect to other interest income; L3=Lerner index with respect to Fees and Commissions;
L4=Lerner index with respect to other non-interest income. All estimates are expressed in average
terms per industry sector with the last row estimating the averages of the 9-country sample. The
percentage in the parentheses highlights the weights of income sources on banks‟ portfolio.
Supposing that irrational behaviour takes the form of competitive market in the eyes
of customers, the results are close to the competition efficiency scores estimated by
Bolt and Humphrey (2010). In addition, the negative values in the last four columns,
bank-specific indexes are supposed to constitute not a straightforward metric of
income-specific market power but, alternatively, the relative contribution of each Li to
the construction of the Lerner index. Ideally, the overall index (L) should be the sum
of the 4 sub-indexes, although some sources are excluded from the analysis as
unavailable and thus the lack of data does not permit us to delineate rankings of
relative market power at income level, but rather to investigate its possible effects
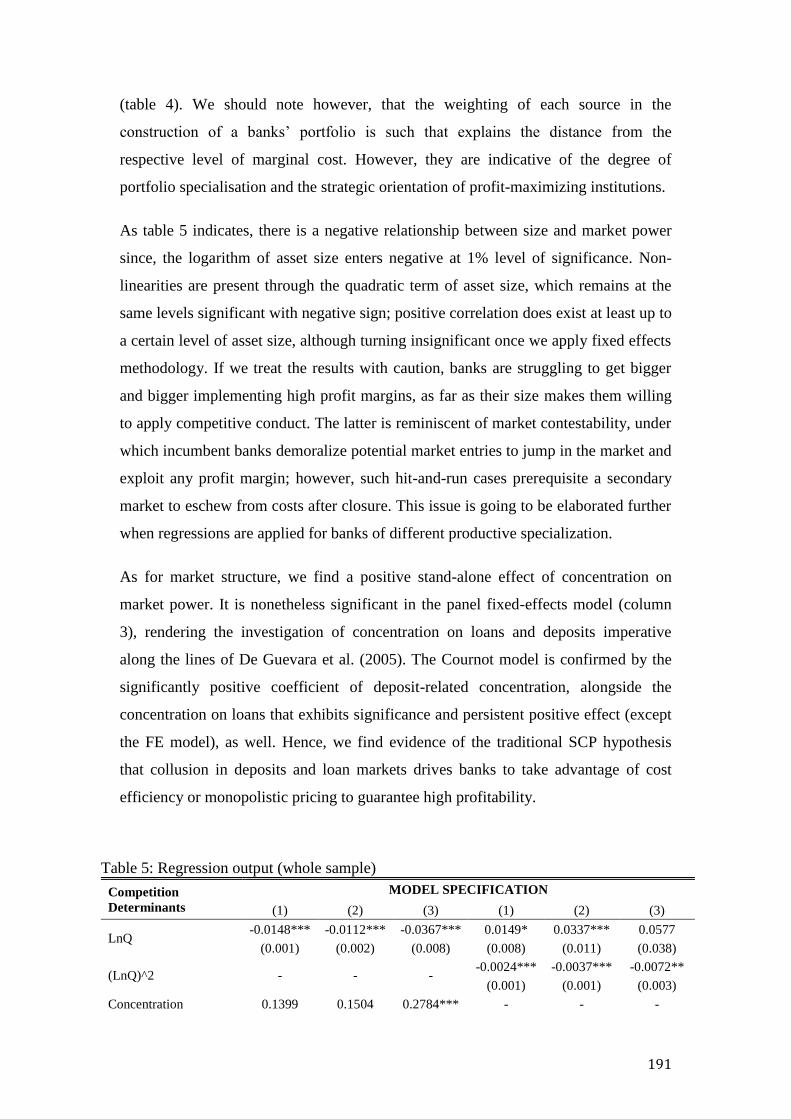
191
(table 4). We should note however, that the weighting of each source in the
construction of a banks‟ portfolio is such that explains the distance from the
respective level of marginal cost. However, they are indicative of the degree of
portfolio specialisation and the strategic orientation of profit-maximizing institutions.
As table 5 indicates, there is a negative relationship between size and market power
since, the logarithm of asset size enters negative at 1% level of significance. Non-
linearities are present through the quadratic term of asset size, which remains at the
same levels significant with negative sign; positive correlation does exist at least up to
a certain level of asset size, although turning insignificant once we apply fixed effects
methodology. If we treat the results with caution, banks are struggling to get bigger
and bigger implementing high profit margins, as far as their size makes them willing
to apply competitive conduct. The latter is reminiscent of market contestability, under
which incumbent banks demoralize potential market entries to jump in the market and
exploit any profit margin; however, such hit-and-run cases prerequisite a secondary
market to eschew from costs after closure. This issue is going to be elaborated further
when regressions are applied for banks of different productive specialization.
As for market structure, we find a positive stand-alone effect of concentration on
market power. It is nonetheless significant in the panel fixed-effects model (column
3), rendering the investigation of concentration on loans and deposits imperative
along the lines of De Guevara et al. (2005). The Cournot model is confirmed by the
significantly positive coefficient of deposit-related concentration, alongside the
concentration on loans that exhibits significance and persistent positive effect (except
the FE model), as well. Hence, we find evidence of the traditional SCP hypothesis
that collusion in deposits and loan markets drives banks to take advantage of cost
efficiency or monopolistic pricing to guarantee high profitability.
Table 5: Regression output (whole sample)
Competition
Determinants
MODEL SPECIFICATION
(1) (2) (3) (1) (2) (3)
LnQ -0.0148*** -0.0112*** -0.0367*** 0.0149* 0.0337*** 0.0577
(0.001) (0.002) (0.008) (0.008) (0.011) (0.038)
(LnQ)^2 - - - -0.0024*** -0.0037*** -0.0072**
(0.001) (0.001) (0.003)
Concentration 0.1399 0.1504 0.2784*** - - -

192
(0.101) (0.119) (0.101)
Concentration
(deposits) - - -
0.1852* 0.2347** 0.2653***
(0.098) (0.106) (0.081)
Concentration (loans) - - - 0.1630*** 0.1604*** 0.0530
(0.050) (0.054) (0.048)
Market share -0.5458 -0.7222 0.0857
- - - (0.344) (0.448) (0.770)
Market share (deposits) - - - -0.5367 -0.1282 1.0430
(0.413) (0.527) (0.662)
Market share (loans) - - - 0.1381 -0.2285 -0.6136
(0.399) (0.601) (0.547)
Cost/TI -0.5834*** -0.5738*** -0.5795*** -0.5821*** -0.5734*** -0.5722***
(0.034) (0.046) (0.066) (0.034) (0.046) (0.065)
Loan impairment 0.0103*** 0.0088* -0.0081 0.0107*** 0.0092* -0.0082
(0.004) (0.005) (0.008) (0.004) (0.005) (0.008)
OBS/TA 0.7486*** 0.7920*** 0.3526** 0.7433*** 0.7818*** 0.3682**
(0.181) (0.180) (0.142) (0.180) (0.178) (0.154)
GDPGR 0.0164 0.0757 0.1038*** 0.0489 0.1253 0.0874***
(0.149) (0.198) (0.017) (0.147) (0.193) (0.017)
Private credit -0.0582** -0.0330 -0.0106 -0.0979*** -0.1058*** -0.0433**
(0.028) (0.037) (0.019) (0.026) (0.034) (0.021)
Legal strength -0.0071** -0.0075* -0.0098*** -0.0047* -0.0026 -0.0087***
(0.003) (0.004) (0.001) (0.003) (0.004) (0.001)
Commercial 0.0522*** 0.0608***
-
0.0524*** 0.0603***
-
(0.013) (0.016) (0.013) (0.016)
Cooperative 0.0567*** 0.0614*** 0.0543*** 0.0578***
(0.012) (0.014) (0.011) (0.014)
Saving 0.0597*** 0.0580*** 0.0586*** 0.0580***
(0.012) (0.014) (0.012) (0.04)
Austria 0.1167*** 0.1357*** 0.0904*** 0.0837**
(0.036) (0.042) (0.034) (0.039)
Denmark 0.3852*** 0.3843*** 0.3860*** 0.3804***
(0.031) (0.032) (0.032) (0.033)
France 0.2479*** 0.2654*** 0.2173*** 0.2066***
(0.039) (0.048) (0.037) (0.044)
Germany 0.1679*** 0.1865*** 0.1474*** 0.1398***
(0.040) (0.049) (0.037) (0.043)
Italy 0.1253*** 0.1433*** 0.1111*** 0.1130***
(0.033) (0.039) (0.031) (0.035)
Luxembourg 0.2729*** 0.2679*** 0.2581*** 0.2472***
(0.033) (0.035) (0.034) (0.036)
Sweden 0.3849*** 0.4103***
-
0.3638*** 0.3634***
- (0.036) (0.043) (0.034) (0.039)
UK 0.1575*** 0.1516*** 0.0460 0.0197
(0.034) (0.037) (0.038) (0.044)
T2003 - -
-
- -
- T2004
-0.0017 - -
-0.0040
(0.001) (0.002)
T2005 - 0.0015 0.0036** -

193
(0.002) (0.001)
T2006 -0.0033 0.0008 -0.0027 -0.0068
-0.005 (0.006) (0.004) (0.007)
T2007 -0.0235*** -0.0217*** -0.0229*** -0.0280***
(0.003) (0.004) (0.003) (0.005)
T2008 -0.0425*** -0.0406*** -0.0393*** -0.0418***
(0.002) (0.003) (0.003) (0.003)
T2009 -0.0034 0.0048 0.0035 0.0096
(0.008) (0.012) (0.009) (0.010)
T2010 0.0138** 0.0142** 0.0167*** 0.0136*
(0.005) (0.006) (0.004) (0.007)
Intercept 0.5166*** 0.4372*** 0.8223*** 0.4701*** 0.3971*** 0.5511***
(0.051) (0.061) (0.055) (0.052) (0.062) (0.126)
R-squared 0.750 0.770 0.901 0.753 0.776 0.901
Obs 15219 15219 15219 15216 15216 15216
Column 1): standard OLS regression with standard errors clustered at the bank level using country and time
fixed effects to allow for unobserved heterogeneity; Column (2): Fixed effects model estimation with clustered
standard error at the bank level along with probability country weights. In so doing, we apply the inverse of the
number of banks operating within a national banking sector for cases where sample is overrepresented by some
countries (e.g. Germany); Column (3): Fixed effects model estimation with clustered standard error at the bank
level with time fixed effects. Standard errors are in parentheses while asterisks ***, **, * denote the
significance level being at 1%, 5% and 10%, respectively18
.
Contrarily opposed to the Relative market power hypothesis, market share performs
insignificant and negative coefficient whatsoever. However, if we juxtapose the
disaggregation of market share in the product categories of deposits and loans, it
remains of negligible contribution across all model specifications. Efficiency structure
hypothesis is verified by the negative and significant coefficient of cost-to-income
ratio at the 1% level. In fact, banks with better management or technology tend to
bear lower costs that are transmuted to higher market shares and overall great
concentration. In our specifications where the element of increased market share is
not verified empirically as it is assumed by the theory, banks with lower costs have
relatively higher margins along the lines of pure efficiency hypothesis.
Credit risk as proxied by loan impairment charges over average gross loans has a
significant effect on market power, which is in contradiction with theoretical
premises. It bears negligible effect in the FE model as indicated by its opposite
coefficient and statistical insignificance, though the omission of it causes almost a 3%
loss of explanatory power. That is attributable to the total absorption of bank
specificities in the panel FE model, since our heterogeneous sample may blur the
18
We drop the dummies of 2002 and Spain for multicollinearity reasons.

194
trend of banks with different specialisation. Furthermore, portfolio diversification
proclaimed by the use of off-balance sheet activities over total assets demonstrates a
stable positive pattern with a level of significance ranging between one and 5% level.
Thus, banks are willing to impose greater prices on products if their portfolios are
well diversified against potential market and credit risks.
The effect of GDP growth remains insignificant in all but one specification, while its
positive sign implies procyclical rather than countercyclical force. That means in
times of economic expansion, banks enjoy relatively higher margins exacerbating
thereby the economic conditions further down the road either seconding bubbles or
deepening the recession spiral. However, the significance is not robust and, thus, any
remark should be drawn with caution. The elasticity of aggregate demand proxied by
private credit over GDP, which is a bank-oriented form of firm financing, is
significant up to 1% level in four specifications. The negative effect means that as
more credit is demanded and granted to the private sector, banks tend to narrow down
profit margins. The elasticity of aggregate demand is assumed in this study to
empirically verify its considerable importance when coupled with concurrent
conditions.
After accounting of all fixed effects in European banking, the negative effect of
lending-facilitating laws is considerably significant on the Lerner index. Regulatory
and supervisory policies are expressed in the degree of law stringency acting
preventively against monopolistic practices and in favour of borrowers and lenders in
order to facilitate access to credit.
Country and specialisation effects in table 5 persistently appear to be significant at 1%
level in the first three columns, and once we allow for non-linearities and
disaggregation of concentration and market share they remain put; time effects are
present almost after 2007 and onwards. We next rerun the above regressions for four
bank categories, namely commercial, cooperative, savings and „other‟ banks, which
include all the rest failing to construct a sufficient size of panel series. The necessity
of conducting regressions per bank type is to explain how the pricing conduct of each
specialisation is formulated given the divergence of strategic priorities and corporate
expertise. We can also see how the model behaves in a disaggregated analysis and to

195
what extent the per se pricing conduct is determined by the following SUR framework
of income-specific market power.
Hence, table 6 displays the results of six regressions, out of which two models are
implemented to four bank categories. The first model employs bank size,
concentration and market share and all the other variables that proxy for market
conditions, whereas the second includes the quadratic term of total assets (in logs),
and disaggregates concentration and market share into the broad product categories of
deposits and loans. The fit of the models ranges between 79.6% (other banks) to
87.5% (savings banks) while commercial banks, which constitute by far the most
fragmented market in Europe, perform moderately up to 65.6%. Cooperative banks
dominate the half of the sample with 8798 observations and the rest is shared among
saving, commercial and „other‟ banks with 4009, 1612 and 800 observations,
respectively.
A notable result is that asset size and market power are negatively related in
cooperative, saving and „other‟ banks while commercial banks fail to demonstrate any
significance. In fact, cooperative banks show only linear association, while for
savings and „other‟ banks, the positive sign is significant up to a certain level of asset
size before it turns negative at much higher sizes. Collusion hypothesis holds in loans
markets for commercial banks and „other‟ banks whereas in the deposits markets, the
commercial category is significant at ten% level. That comes in contradistinction with
the significant effect of concentration in table 5 thereby implying that sample
heterogeneity questions the credibility of the whole sample.

196
Table 6: Regression output per bank type
Competition Determinants MODEL SPECIFICATION
Commercial Cooperative Savings Other
LnQ -0.0085 -0.0085 -0.0171*** -0.0163** -0.0089*** 0.0423** -0.0390*** 0.1419***
(0.006) (0.038) (0.001) (0.006) (0.001) (0.017) (0.009) (0.035)
(LnQ)^2 - -0.0001
- -0.0001
- -0.0036***
- -0.0124***
(0.002) (0.001) (0.001) (0.002)
Concentration 0.0799
- 0.0272
- -0.3895*
- 0.0937
- (0.176) (0.056) (0.215) (0.293)
Concentration (deposits) - 0.2490*
- -0.7215
- -0.0990
- 0.1804
(0.130) (0.520) (0.432) -0.217
Concentration (loans) - 0.1374**
- 0.7243
- -0.1395
- 0.2707*
(0.066) (0.504) (0.398) (0.153)
Market share -1.2176***
- -1.3911***
- 0.6267
- 1.0301*
- (0.417) (0.265) (0.404) (0.556)
Market share (deposits) - -1.2171
- -3.2271***
- 0.5640
- 0.8079
(0.738) (0.670) (0.831) (1.193)
Market share (loans) - 0.3098
- 1.8082***
- -0.3401
- 0.7306
(0.796) (0.566) (0.570) (0.689)
Cost/TI -0.5112*** -0.5075*** -0.6216*** -0.6218*** -0.6448*** -0.6356*** -0.6431*** -0.6362***
(0.072) (0.073) (0.012) (0.012) (0.020) (0.020) (0.030) (0.028)
Loan impairment 0.0197*** 0.0197*** 0.4730*** 0.4812*** 0.2974 0.2949 -0.0096* -0.0093
(0.004) (0.004) (0.128) (0.123) (0.223) (0.219) (0.006) (0.006)
OBS/TA 0.6101*** 0.6031*** 3.7762*** 3.7687*** 5.1893*** 4.8759*** 0.6541** 0.7350***
(0.191) (0.198) (0.517) (0.519) (1.071) (1.026) (0.269) (0.260)
GDPGR -1.2818*** -1.2030** 0.0814 0.1429 0.4602** 0.4771*** 0.5598 0.6401
(0.465) (0.467) (0.098) (0.113) (0.184) (0.180) (0.549) (0.546)
Private credit -0.2033*** -0.2502*** -0.0981*** -0.1060*** -0.0394 -0.0464 0.2093 -0.0132
(0.056) (0.053) (0.020) (0.022) (0.035) (0.035) (0.130) (0.154)

197
Legal strength -0.0053 -0.0013 -0.0124*** -0.0104*** -0.0007 -0.0025 -0.0149 -0.0052
(0.005) (0.005) (0.003) (0.003) (0.004) (0.004) (0.010) (0.011)
Austria 0.0081 0.0046 0.0783*** 0.0770*** 0.1280*** 0.1253** 0.3076* 0.1854
(0.078) (0.080) (0.021) (0.022) (0.045) (0.050) (0.180) (0.172)
Denmark 0.3735*** 0.4014*** 0.3408*** 0.3092*** 0.4030*** 0.4089*** -0.0069 0.0835
(0.072) (0.080) (0.041) (0.036) (0.033) (0.049) (0.137) (0.187)
France 0.1040 0.0974 0.2528*** 0.2460*** 0.2098*** 0.2201*** 0.3680** 0.2259
(0.076) (0.078) (0.029) (0.026) (0.052) (0.059) (0.186) (0.179)
Germany -0.0055 0.0009 0.1243*** 0.1209*** 0.1681*** 0.1606*** 0.3265* 0.2317
(0.078) (0.076) (0.024) (0.025) (0.053) (0.055) (0.196) (0.186)
Italy -0.0463 -0.0290 0.0644*** 0.0752*** 0.1654*** 0.1524*** 0.2472 0.1597
(0.076) (0.078) (0.020) (0.018) (0.043) (0.048) (0.175) (0.164)
Luxembourg 0.2462*** 0.2465***
- - 0.1953*** 0.2324*** 0.3059** 0.3022**
(0.067) (0.076) (0.070) (0.074) (0.145) (0.146)
Sweden 0.3899*** 0.3862***
- - 0.3644*** 0.3779*** 0.3951* 0.3128
(0.079) (0.078) (0.047) (0.051) (0.212) (0.205)
UK 0.1377** 0.0297
- - - - 0.1207 -0.0200
(0.066) (0.075) (0.147) (0.177)
T2003 -
T2004 0.0100
- -0.0022** -0.0020* -0.0132** -0.0103* -0.0040 -0.0128
(0.008) (0.001) (0.001) (0.006) (0.006) (0.012) (0.014)
T2005 - -0.0020
- - -0.0072 -0.0041
- - (0.009) (0.007) (0.007)
T2006 0.0223 0.0156 -0.0250*** -0.0260*** -0.0258*** -0.0235*** -0.0140 -0.0332
(0.012)* (0.013) (0.003) (0.003) (0.004) (0.004) (0.020) (0.024)
T2007 -0.0004 -0.0046 -0.0315*** -0.0327*** -0.0395*** -0.0376*** -0.0277 -0.0409*
(0.013) (0.014) (0.002) (0.003) (0.006) (0.005) (0.022) (0.024)
T2008 -0.0462*** -0.0508*** -0.0476*** -0.0454*** -0.0396** -0.0390*** -0.0505*** -0.0529***

198
(0.010) (0.011) (0.002) (0.003) (0.005) (0.005) (0.014) (0.015)
T2009 -0.0421 -0.0430 -0.0088* -0.0022 0.0222 0.0247 0.0112 0.0170
(0.025) (0.027) (0.005) (0.008) (0.016) (0.015) (0.028) (0.028)
T2010 0.0729*** 0.0654*** 0.0038 0.0040
- - -0.0003 -0.0049
(0.016) (0.016) (0.004) (0.004) (0.021) (0.019)
Intercept 0.7863*** 0.8063*** 0.7156*** 0.7085*** 0.4751*** 0.3196*** 0.3334 -0.0161
(0.123) (0.178) (0.035) (0.037) (0.071) (0.089) (0.274) (0.309)
R-squared 0.656 0.655 0.833 0.834 0.870 0.875 0.796 0.809
Obs 1612 1611 8798 8798 4009 4009 800 798
Note: OLS regressions for every single productive specialisation of banks (commercial, cooperative, savings, other) with clustered standard errors at the bank level
utilising country and time fixed effects to allow for unobserved heterogeneity. The second column per bank type is the expansion of the information set to
comprise the quadratic term of asset size as well as the concentration and market share with respect to deposits and loans markets. Standard errors are in
parentheses while asterisks ***, **, * denote the significance level being at 1%, 5% and 10%, respectively19
.
19
We drop the dummies of 2002 and Spain for multicollinearity reasons.

199
On the other hand, market power in terms of market share appears significant only in
the aggregate for commercial, cooperative and other banks; however, market share of
cooperative banks with respect to deposits and loans is highly correlated with the
Lerner index. Such results seem to replicate the falsities of the whole sample
explained above.
Efficiency hypothesis is again persistently existent in all bank categories as cost-to-
income ratio performs robustly at 1% level of significance. Moreover, credit risk is
positively related to Lerner index and significant for commercial and cooperative
banks thereby implying risk-taking behavior. The „other‟ category demonstrates a
negative relationship, though significant at ten% level in the first model. Moreover,
exposure to more off-balance sheet activities makes all banks insulate to potential
risks and, therefore, free to apply high profit margins.
The procyclical effect of GDP growth on competition is persistent for commercial and
saving banks while the elasticity of aggregate demand is significant for commercial
and cooperative banks at 5% level with a sign indicating a negative relationship
between credit granting to private sector and market power. Strength of legal rights is
significant only in the category of cooperative banks maintaining the same negative
sign as in table 5.
Up next in table 7, we apply seemingly unrelated regressions of income-specific
Lerner indexes on key features of market structure and power (Herfindahl index, asset
size, marker share) along with the quadratic term and disaggregated variables on bank
deposits and loans. We employ different information set for each index since
otherwise the methodology would fall into equation-by-equation OLS. The dependent
variables are Lerner on loans (L-loans), other interest income (L-otherint), fees (L-
fees) and other non-interest income (L-othernint). In particular, we include the
following new variables most akin to the previous factors employed:
L-loans: cost-to-income ratio, loan losses and liquidity
L-otherint: liquidity, GDP per capita and legal strength
L-fees: diversification, private credit and inflation
L-othernint: diversification, equity and private credit.

200
Table 7: SUR for commercial banks
Commercial L-loans L-otherint L-fees L-othernint L-loans L-otherint L-fees L-othernint
lnQ 0.034*** -0.716** -0.021 -3.629** 0.340*** -2.127 -2.515** -32.562***
2.84 -2.16 -0.09 -2.15 5.00 -1.27 -1.98 -3.60
(LnQ)^2 - -0.022*** 0.103 0.175** 2.044***
-4.73 0.84 2.20 3.36
Concentration -1.395 2.978 15.554** 98.523
- 1.57 0.19 2.20 0.94
Concentration (deposits) - -1.484 2.375 10.059 78.132
-1.38 0.10 0.86 0.71
Concentration (loans) - -0.691 7.454 4.973 -22.432
-1.42 0.60 0.57 -0.31
Market share -0.917 28.477 -19.847** 50.969
- -1.01 0.93 -1.99 0.54
Market share (deposits) - -4.316*** 78.435 -24.921 230.891
-3.14 1.62 -1.56 1.40
Market share (loans) - 5.635*** -65.045 -2.822 -308.762**
4.69 -1.56 -0.19 -2.21
Cost/TI -0.480***
- - - -0.416***
- - - -3.65 -3.36
Loan impairment -0.064***
- - - -0.052***
- - - -4.37 -3.88
OBS/TA - - 14.791 104.071
- - 13.811 93.689
0.53 0.59 0.51 0.60
EQ/TA - - - 14.561
- - - 10.694
0.75 0.55

201
Liquidity -0.157*** -0.118
- - -0.124** -0.510
- - -2.76 -0.13 -2.28 -0.52
GDPPC - 1.673
- - 2.032
- - 0.15 0.18
Private credit - - 1.017 9.263
- - 0.106 13.017
0.66 0.46 0.06 0.61
Inflation - - -46.226***
- - - -51.325***
- -2.83 -3.10
Legal strength - -1.036**
- - - -1.038**
- - -2.38 -2.38
Country effects YES YES
Time effects NO NO
R-squared 0.660 0.656 0.627 0.645 0.684 0.659 0.632 0.653
Obs 830 830 830 830 830 830 830 830
The table summarizes the results of commercial banks through two Seemingly Unrelated Regressions, the first one including total assets, market share and
concentration apart from other controls and country fixed effects and the other analysing the effect of total assets squared, concentration and market share with respect
to deposits and loans. We opt to exclude time fixed effects since otherwise standard errors could not be estimated. The estimation allows for correlation among errors
across the four models within each bank as well as heteroskedasticity by means of bootstrapping. The four models have as independent variables Lerner indexes
specific to four distinctive sources of bank income: Loans, other interest income, fees/commissions and other non-interest income. The information sets of the models
are equally sized but not equivalent whatsoever; otherwise we would fall into the standard case of equation-by-equation OLS. T-statistic is reported below each
coefficient while asterisks ***, **, * denote the significance level being at 1%, 5% and 10%, respectively.

202
First, the selection of these variables stems from the ability of the banking literature to
pin down a theory of the interconnection amongst them and to verify it empirically.
Thus, we pick up the factors (as well as those of the baseline model) that determine
the highest possible explanatory power for the whole sample before it comes to repeat
the regressions for every bank type. Otherwise, limited comparability across
heterogeneous subsets of the sample makes it hard for us to draw remarks on the
empirical evidence. We also use bootstrapping methodology to reduce the inference
bias induced by groupwise heteroskedasticity along with the within-panel correlation
of standard error across models. In some cases (commercial, other banks) where
standard errors could not be computed by bootstrapping due to limited observations,
we opt to exclude time effects from the analysis.
Table 8 exhibits the lowest fit of the 830 observations, as R-squared ranges between
62.7% and 68.4%. Along the lines of Petersen and Rajan (1995) and Berlin and
Mester (1999) that banks specialized in lending/deposit-taking enjoy higher margins
due to long-lasting relationships, we may justify the low explanatory power of the
commercial modeling. Furthermore, asset size seems to be highly significant for L-
otherint and L-othernint models with a negative bearing while it turns negative for L-
loans. In other words, as banks increase their size, prices on other interest and non-
interest products (loans) are plummeting (increasing). Non-linearities exist in all cases
but L-otherint; as banks are getting bigger in asset size they tend to offer lower other
interest and non-interest profit margins and higher loan rates. After a certain point,
higher bank size goes the other way around making banks follow the exactly opposite
trend.
Moreover, we find an insignificant correlation between concentrated structures in
loans (deposits) with all Lerner indexes (L-loans) failing to corroborate the studies of
Cetorelli and Gamberra (2001) and Angelini and Cetorelli (2003). The significant and
positive effect of aggregate concentration on the Lerner index of fees partly justifies
the ability of European member states to exploit concentrated markets in order to
boost their performance (Gondat-Larralde and Lepetit, 2001). Besides, the market
share is negatively correlated with monopolistic pricing in the L-fees case; however,
when it comes to their disaggregated constituents, banks tend to decrease (increase)
prices on loans as their market share in the deposits (loans) markets is getting higher.

203
Such evidence, coupled with relative efficiency gains (significant TC/TI), is
indicative of the „cream skimming‟ phenomenon, which assumes that the process of
integration forces foreigners to pick up banks of higher operational efficiency to grasp
higher market shares monopolising loan markets. Accounting for the negative
coefficient of market share in deposits we give more credit to the competitive conduct
of banks in the deposit market so as to attract new customers. It is also interesting that
the pattern of market share in the loan markets is opposite between traditional (loans)
and off-balance sheet activities (othernint) possibly on account of risk sharing or
hedging. These results are perhaps reminiscent of the hold-up problem of relationship
banking, namely the ability of banks with monopoly power and proprietary
information to charge higher loan rates on customers.
Loan losses have a significant and negative impact on L-loans, implying that banks
may tend to react by imposing lower loan prices and holding other risk-free
investments in order to rationalize their loan books. Commercial banks with high
share of liquid assets are willing to impose lower prices on loans, a pattern which is
not accepted ex ante. In fact, banks may consider liquid assets as a safety net for
potential losses and have no need for excessive risk-taking. In times of economic
booms when inflation pressures are considerable, commercial banks lessen their fees
and commissions in an attempt to boost the volume of transactions. In addition, legal
framework that protects both borrowers and lenders enhances competition in other
interest products.
In table 8, cooperative banks enumerate 6331 observations with a R-squared ranging
from 64.5% in L-otherint to 89.4% in L-fees; the rest are up to levels of 77.9% and
77.5% for L-loans and L-othernint, respectively. The natural logarithm of total assets
is negatively associated with all cases but L-fees at 1% level of significance while
there exists non-linear relationship in the models of L-loans and L-fees. It is positive
up to a certain level of assets when it turns negative at higher levels of scale
economies. However, we observe the opposite trend in L-othernint, according to
which the negative bearing switches to positive.

204
Table 8: SUR for cooperative banks
Cooperative L-loans L-otherint L-fees L-othernint L-loans L-otherint L-fees L-othernint
LnQ -0.019*** -0.353*** 0.399*** -3.747*** 0.053** -0.574 5.001*** -11.900***
-5.24 -4.30 10.87 -15.89 2.49 -1.12 16.13 -8.23
(LnQ)^2 - -0.006*** 0.018 -0.396*** 0.700***
-3.67 0.34 -16.69 4.63
Concentration 0.585 -3.215 0.355 16.908
- 1.62 -0.54 0.07 0.84
Concentration (deposits) - -13.175*** 80.076 -33.922 -822.439
-3.03 0.34 -0.20 -0.68
Concentration (loans) - 13.854*** -83.087 37.683 818.669
3.02 -0.35 0.23 0.66
Market share 0.947 -113.862*** -59.845*** 44.741
- 1.29 -3.87 -4.41 0.30
Market share (deposits) - -26.258*** 140.772 47.742 154.660
-4.94 1.50 1.17 0.62
Market share (loans) - 23.452*** -224.168*** -21.603*** -212.271
3.03 -4.11 -5.31 -1.37
Cost/TI -1.087***
- - - -1.095***
- - - -21.93 -41.96
Loan impairment -4.427***
- - - -4.612***
- - - -8.47 -5.05
OBS/TA - - 294.011*** 2166.794***
- - 271.227*** 2215.934***
9.26 13.26 9.16 32.33
EQ/TA - - - 115.077***
- - - 116.478***
5.08 59.67
Liquidity 0.007 -3.048*** - - 0.047 -3.263*** - -

205
0.24 -3.88 1.26 -4.62
GDPPC - 12.327
- - 16.067***
- - 1.11 8.65
Private credit - - -5.097*** 8.358
- - -6.281* 9.174
-3.17 0.79 -1.93 0.30
Inflation - - 66.989*
- - - 34.653
- 1.82 0.95
Legal strength - 1.000
- - - 1.000
- - 1.16 1.16
Country effects YES YES
Time effects NO NO
R-squared 0.776 0.645 0.886 0.754 0.779 0.646 0.894 0.755
Obs 6331 6331 6331 6331 6331 6331 6331 6331
The table summarizes the results of cooperative banks through two Seemingly Unrelated Regressions, the first one including total assets, market share and
concentration apart from other controls and country/time fixed effects and the other analysing the effect of total assets squared, concentration and market share with
respect to deposits and loans. The estimation allows for correlation among errors across the four models within each bank as well as heteroskedasticity by means of
bootstrapping. The four models have as independent variables Lerner indexes specific to four distinctive sources of bank income: Loans, other interest income,
fees/commissions and other non-interest income. The information sets of the models are equally sized but not equivalent whatsoever; otherwise we would fall into the
standard case of equation-by-equation OLS. T-statistic is reported below each coefficient while asterisks ***, **, * denote the significance level being at 1%, 5% and
10%, respectively.

206
SCP paradigm is rejected on the grounds of insignificant effect of aggregate
concentration on the price of any income source. We nonetheless observe negative
association of concentration in the deposit market with L-loans. The positive sign in
the loans markets, as Corvoisier and Gropp (2002) argued also about, instantiates the
passing-through mechanism of causality in the specific case of cooperative banks.
In addition, banks with greater market share behave competitively when they impose
prices on other interest income, fees and commissions. Relative market power is
scantily existent in the L-loans model having a negative (positive) bearing in the
deposit (loan) market. It is also the case of Efficient structure hypothesis for L-loans
as the pertinent coefficient is negative at 1% level of significance with considerable
credit losses making also banks reluctant to succumb to high prices on loans.
According to it, amid competitive conditions in the market more efficient banks are
likely to survive by means of eliciting greater market share from less efficient
institutions (Demsetz, 1973).
The share of OBS to total assets has a considerably positive impact on L-fees and L-
otherint corroborating the tendency of well-diversified banks to impose high margins.
Bank capital demonstrates, as expected, a positive sign suggesting that a higher
degree of risk aversion (high capital ratio) is transmuted to higher margin on OBS
activities to make up for the inherent systematic risk20
. What is more, the degree of
liquidity of bank assets turns out to have a negative effect on L-otherint, as opposed to
the case of more liquid commercial banks that prefer to lower prices on loans.
Private credit is also an important factor for L-fees with a negative sign without losing
significance when there is disaggregation of concentration and market share or the
non-linear term of asset size. Moreover, we observe an indication that the price effect
of economic growth as well as proactive legal initiatives in favour of consumer
protection operates procyclically towards monopolistic practices in fee and other
interest income, respectively.
20
Alternatively, it may constitute a signal in the market of creditworthiness, but since the sample
comprises only developed economies with strong legal environment, there is need in having high
capital buffers in order to restore depositor confidence (Claeys and Vennet, 2008).

207
Table 9: SUR for savings banks
Savings L-loans L-otherint L-fees L-othernint L-loans L-otherint L-fees L-othernint
LnQ -0.005 0.185 -0.125*** 6.242*** -0.044*** 2.393* 2.216*** 6.305*
-1.28 1.12 -3.21 9.67 -3.01 1.66 6.03 1.70
(LnQ)^2 - 0.003*** -0.159* -0.162*** 0.012
3.34 -1.89 -7.36 0.04
Concentration -1.17 61.661** -11.216 -185.585
- -1.06 1.99 -1.32 -0.88
Concentration (deposits) - -3.643 51.943 -35.470 -1041.498
-1.03 0.24 -0.56 -1.34
Concentration (loans) - -0.268 138.899 31.849 689.327
-0.10 1.62 0.58 0.92
Market share 0.176 -108.646*** 5.136 -377.764
- 0.57 -3.87 0.52 -1.25
Market share (deposits) - -7.610 305.896 -21.090 -959.774
-1.15 0.73 -0.53 -0.73
Market share (loans) - 7.438 -385.343 6.085 500.170
0.87 -0.73 0.15 0.31
Cost/TI -1.032***
- - - -1.032***
- - - -28.73 -34.39
Loan impairment -10.857***
- - - -10.820***
- - - -21.10 -22.35
OBS/TA - - 415.473*** 4333.502***
- - 407.844*** 4474.753***
14.21 16.03 10.72 5.60
EQ/TA - - 74.371**
- - - 67.813*
2.10 1.68
Liquidity -0.321*** 11.551*** - - -0.304*** 10.803*** - -

208
-6.79 19.91 -4.56 3.62
GDPPC - 22.278
- - - 37.148
- - 0.83 1.63
Private credit - - -0.727 -103.363***
- - -2.108 -104.621***
-0.56 -7.62 -1.29 -8.14
Inflation - - 8.931
- - - 2.253
- 0.30 0.06
Legal strength - -0.990***
- - - -1.015***
- - -2.65 -3.03
Country effects YES YES
Time effects YES YES
R-squared 0.778 0.605 0.953 0.777 0.780 0.610 0.954 0.779
Obs 3390 3390 3390 3390 3390 3390 3390 3390
The table summarizes the results of savings banks through two Seemingly Unrelated Regressions, the first one including total assets, market share and concentration
apart from other controls and country/time fixed effects and the other analysing the effect of total assets squared, concentration and market share with respect to
deposits and loans. The estimation allows for correlation among errors across the four models within each bank as well as heteroskedasticity by means of bootstrapping.
The four models have as independent variables Lerner indexes specific to four distinctive sources of bank income: Loans, other interest income, fees/commissions and
other non-interest income. The information sets of the models are equally sized but not equivalent whatsoever; otherwise we would fall into the standard case of
equation-by-equation OLS. T-statistic is reported below each coefficient while asterisks ***, **, * denote the significance level being at 1%, 5% and 10%, respectively.

209
We next analyse the regression output for savings banks (table 9) based upon 3390
observations in each model. The fit here is between 60.5% (L-otherint) and 95.4% (L-
fees) while the rest settles at about 78%. Asset size does have a positive effect on L-
othernint and a negative one on L-fees. Non-linearities are traced in the L-loans
following a negative trend as soon as it turns negative in higher scale economies. In
contrast, L-fees and L-otherint models report a positive-to-negative nexus, although
the latter comes with 10% significance level. Concentration in EU member states has
only a positive effect in the aggregate on L-otherint followed by the market share with
the same pattern, as well.
Cost efficiency along with credit risk is negatively interconnected with L-loans at 1%
level compatible with the practice of banks to exercize market power on the grounds
of reducing costs. Thus, there is no indication of „quit life‟ hypothesis, according to
which banks not vulnerable to intense competition, managers by no means seek to
maximize profits through an everlasting cost reduction (Berger and Hannan, 1998;
Delis and Tsionas, 2009). Rather pure efficiency hypothesis comes into play, which
sets out the ability of efficient banks to engage in monopolistic price without
intending to higher market share. In addition, diversified portfolios make banks feel
safer to charge higher margins on OBS activities offsetting at least in part the positive
effect of loan losses on loans competitive pricing.
Moreover, banks with high share of liquid assets engage in competitive pricing on
loans and monopolistic conduct on other interest-bearing activities; however, that is in
contradistinction to the pattern observed in cooperative banks. As cooperative banks
operate in a decentralized system of rather national as well as regional outreach,
liquid assets enable banks to enhance long-standing relationships through cheaper
loans and more expensive prices on trading and investment securities. That may also
be conducive from the opportunity cost that banks are bound to bear as a result of
their obligation to withhold liquid reserves. Thus, higher loan prices compensates for
potentially higher interest rates being available in the financial markets (Hawtrey and
Liand, 2008). It is intuitively relevant the argument of Lakonishok et al (1992),
according to which larger banks with low liquid assets share demonstrate a herding
behaviour in excessive risk-taking in other (interest) income sources by charging
higher profit margins.
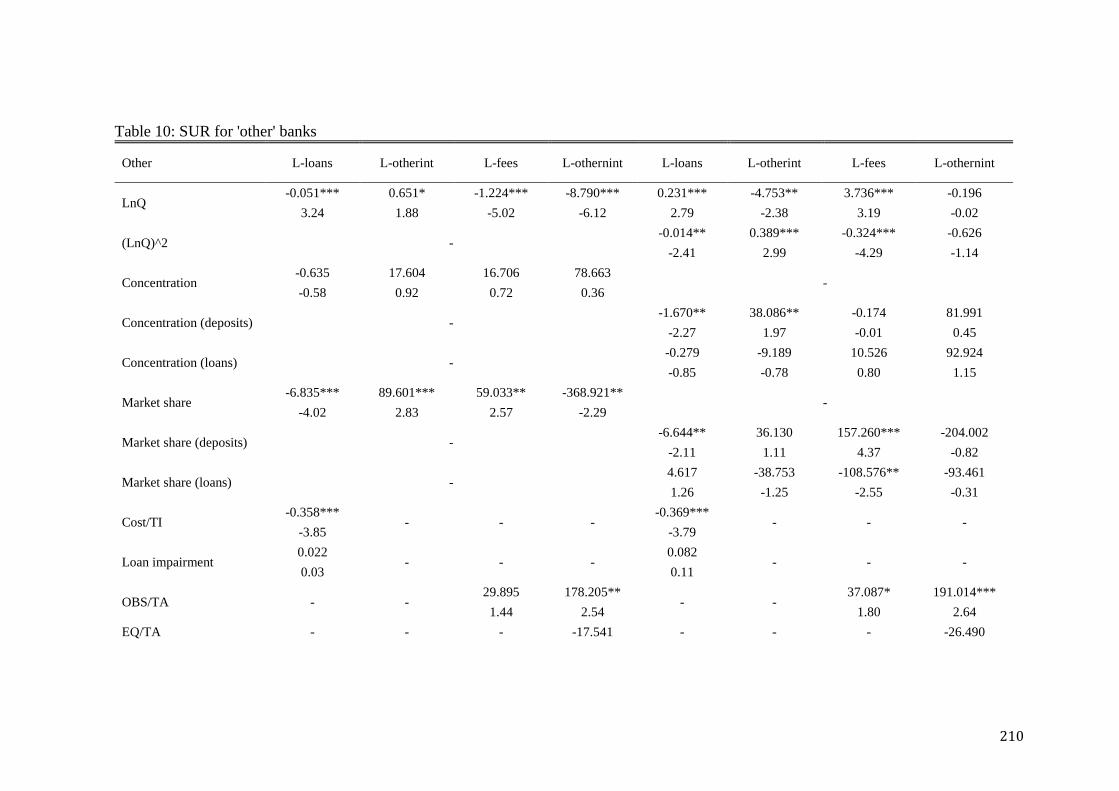
210
Table 10: SUR for 'other' banks
Other L-loans L-otherint L-fees L-othernint L-loans L-otherint L-fees L-othernint
LnQ -0.051*** 0.651* -1.224*** -8.790*** 0.231*** -4.753** 3.736*** -0.196
3.24 1.88 -5.02 -6.12 2.79 -2.38 3.19 -0.02
(LnQ)^2 - -0.014** 0.389*** -0.324*** -0.626
-2.41 2.99 -4.29 -1.14
Concentration -0.635 17.604 16.706 78.663
- -0.58 0.92 0.72 0.36
Concentration (deposits) - -1.670** 38.086** -0.174 81.991
-2.27 1.97 -0.01 0.45
Concentration (loans) - -0.279 -9.189 10.526 92.924
-0.85 -0.78 0.80 1.15
Market share -6.835*** 89.601*** 59.033** -368.921**
- -4.02 2.83 2.57 -2.29
Market share (deposits) - -6.644** 36.130 157.260*** -204.002
-2.11 1.11 4.37 -0.82
Market share (loans) - 4.617 -38.753 -108.576** -93.461
1.26 -1.25 -2.55 -0.31
Cost/TI -0.358***
- - - -0.369***
- - - -3.85 -3.79
Loan impairment 0.022
- - - 0.082
- - - 0.03 0.11
OBS/TA - - 29.895 178.205**
- - 37.087* 191.014***
1.44 2.54 1.80 2.64
EQ/TA - - - -17.541 - - - -26.490

211
-0.87 -1.17
Liquidity -0.097 -1.411
- - -0.066 -1.825
- - -1.59 -1.10 -1.08 -1.38
GDPPC - 20.913
- - - 18.341
- - 1.32 1.11
Private credit - - 10.877** 3.890
- - 5.368 -40.142
2.55 0.11 1.05 -1.10
Inflation - - 0.777
- - - -6.282
- 0.02 -0.21
Legal strength - -1.666***
- - - -1.676***
- - -3.28 -3.06
Country effects YES YES
Time effects NO NO
R-squared 0.746 0.661 0.781 0.663 0.747 0.664 0.314 0.667
Obs 396 396 396 396 396 396 396 396
The table summarizes the results of „other‟ banks through two Seemingly Unrelated Regressions, the first one including total assets, market share and concentration
apart from other controls and country fixed effects and the other analysing the effect of total assets squared, concentration and market share with respect to deposits and
loans. We opt to exclude time fixed effects since otherwise standard errors could not be estimated. The estimation allows for correlation among errors across the four
models within each bank as well as heteroskedasticity by means of bootstrapping. The four models have as independent variables Lerner indexes specific to four
distinctive sources of bank income: Loans, other interest income, fees/commissions and other non-interest income. The information sets of the models are equally sized
but not equivalent whatsoever; otherwise we would fall into the standard case of equation-by-equation OLS. T-statistic is reported below each coefficient while
asterisks ***, **, * denote the significance level being at 1%, 5% and 10%, respectively.

212
More private credit and legal stringency are persistently significant and negatively
related to L-othernint and L-otherint, respectively. As inflation and GDP per capita
are insignificant we conclude that there pricing conduct is not contingent on different
stages of economic development.
The remaining banking sector (table 10) constitutes a heterogeneous group of
different financial institutions. In table 10, the results are produced out of 396
observations concluding to moderate R-squared values ranging from 66.1% in L-
othernint to 74.7% in L-loans model; the 31.4% fit in L-fees model is the half of that
in the first specification of no disaggregation and non-linear term. That may be
attributed to the more terms that exacerbate the degree of multicollinearity.
As for asset size, it takes a positive coefficient at 1% significance level for L-otherint
and negative for L-loans, L-fees and L-otherint. Besides, non-linear relationship
between size and competition is evident in the first three models, in which savings
banks seem to charge higher (lower) prices on loans and fees (other interest-bearing
products) but further down the road they reap the benefits of scale economies to
reverse their strategy.
In the model of L-loan, some sort of contestability justifies the negative sign of
concentration in the deposits markets at 5% level of significance. On the other hand,
collusion in the deposit market motivates incumbent banks to monopolize the market
through higher margins on other interest income. Furthermore, banks tend to exploit
their relative market power by imposing higher prices on other interest-bearing
products and fees, and lower margins on loans and other non-interest activities. That
is further decomposed into a negative bearing of market share in deposits markets on
L-loans as well as positive (negative) effect of it in the deposits (loans) market.
Cost efficiency persistently contains a negative effect on L-loans corroborating the
results of Maudos and De Guevara (2007) diversification in bank portfolios and
demand elasticity positively affect L-othernint and L-fees, respectively. Legal
stringency maintains its preemptive repercussion against market monopoly.

213
6.6. Conclusion
The aim of the paper is to investigate potential effects of bank competition as the
latter is defined as the price mark-up over marginal cost. We end up with
monopolistic pricing to be persistently associated with low levels of asset size for
cooperative, savings and „other‟ banks. The relationship turns out to be non-linear for
savings and „other‟ banks following a positive pattern for low levels of total assets up
to a point where contestable conduct or economies of scale turn it negative.
Cooperative banks experience a negative pattern only in lower values of total assets
since the dominating cooperative banks of Germany constitute a homogenous set of
equally sized institutions.
The positive sign of concentration gives credit to the SCP paradigm once we see the
general picture of European banking sectors as well as the savings banks themselves.
When it comes to construct Herfindahl-Hirschman indices for deposits and loans
products, concentration is significant only for „other‟ banks in loans market, and for
commercial banks in both deposits and loans markets. Notwithstanding that relative
market power bears no significance in the whole sample, a positive indication is
traced in „other‟ banks and in greater levels of market share of cooperative banks.
However, a more competitive pricing seems a common practice for commercial banks
and for cooperative banks of relatively low market share.
Relative efficiency hypothesis is verified against „quit life hypothesis‟ by the negative
effect of total cost over total income variable at 1% level of significance along the
lines of Koetter et al. (2012), who concluded the same for US banks. We verify,
therefore, the strategic option of banks to exploit lower costs in favour of their
customers either in the form of lower loan rates or higher deposit rates (Vennet,
2002). Furthermore, credit risk motivates commercial and cooperative banks to apply
higher profit margins, a strategy which is contradistinction with that of „other‟ banks.
As for the economic conditions, we can only examine the effect of GDP growth rate
on banks of specific specialization. In fact, high rates of economic expansion operate
procyclically for savings banks and countercyclically for commercial banks. Higher
elasticity of aggregate demand also induces banks to offer lower prices, especially in

214
the case of commercial and cooperative banks. Legal stringency proves to have a
positive impact only on the competitive behavior of cooperative banks.
Next, we delve into the analysis of how such - or next akin to – effects influence the
pricing conduct of banks at the income level. In the same vein, commercial banks of
greater asset size tend to impose low prices on other interest and non-interest
products, a case that remains the same for cooperative banks, which opt for
competitive price on loans as well as higher fees. Economies of scale seem to produce
lower fees and higher prices on other non-interest products for savings banks whereas
„other‟ banks apply generally lower prices except for other interest activities. Non-
linearities have the same pattern for commercial, cooperative and „other‟ banks
yielding a negative sign on L-othernint as soon as it turns positive at higher levels of
total assets; in savings banks there is only a linear and positive association. Contrary
to commercial assets, all the other banks demonstrate first a positive effect on L-fees,
which then turns into negative whereas the same tendency is traced for L-loans in all
cases except savings banks. Profit margins on other interest products demonstrate a
diminishing (increasing) trend when „other‟ (savings) banks are getting bigger,
notwithstanding higher scale economies reverse the sign.
Collusion hypothesis does play a significant role for commercial banks in
implementing higher fees while savings banks follow exactly the same strategy for
other interest income. Greater collusion in the deposit market promotes competitive
loan rates by cooperative and „other‟ banks, with the former reaping the benefits of
collusion in the loans market through higher loan rates. „Other‟ banks utilize
monopolistic structure in the deposit market by enjoying relatively higher prices on
other interest activities.
Higher market share is correlated with lower fees in commercial and cooperative
banks and lower other interest charges in cooperative and savings banks; the latter
also prefers the utilization of low other non-interest rates. „Other‟ banks apply lower
rates on loans and other non-interest products and higher prices on the remainder.
Higher relative market power in the deposit market drives all banks to compete each
other for loan rates, a behaviour which alters in commercial and cooperative banks
when they enjoy higher market share in the loans market. In addition, a common

215
feature for cooperative and „other‟ banks of greater market share in the loans market
consists in the use of lower fees but only „other‟ banks are able to impose higher fees
when they acquire market share in the deposits market. Moreover, charges on other
interest and non-interest activities contain their negative nexus market share in the
loans market.
Cost efficiency drives all banks to charge low loan rates, which are even affected by
loan losses in the portfolios of commercial, cooperative and savings banks. More
portfolio diversification makes cooperative and savings banks eager to charge fees
and other non-interest rates with an indication that same holds for „other‟ banks when
it comes to charge fees. Higher level of total equity that reflects risk aversion or an
explicit signal of bank creditworthiness enables cooperative and savings banks to
deploy a monopolistic strategy on other non-interest activities. Cooperative banks
with more liquid assets enjoy lower rates on other interest products followed by
commercial banks in offering cheaper loans. Savings banks do the same as
commercial banks but additionally compensate the underlying opportunity cost of
liquid assets through higher levels of non-interest rates.
Average country income has a positive impact on cooperative banks in charging
higher other interest prices, while demand elasticity motives cooperative and savings
banks to apply lower fees and other non-interest charges. On the other hand, „other‟
banks seem to take advantage of higher fees. In periods of high inflation rate,
cooperative banks operate in contradistinction to commercial banks enjoying
considerable fees in order to possibly counterbalance potential losses on fixed loan
rates. Last, stricter lending laws turns out to bring about higher other interest charges
on behalf of cooperative banks against the stream of diminishing returns for the rest
banking specialisations.

216

217
CHAPTER 7
Cost and profit efficiency in European banking: Comparison of
parametric methodologies and convergence dynamics

218

219
7.1. Introduction
Operational performance is a hot topic in the banking literature since it is related to
contemporary issues of policy making like macroprudential regulation, market
structure and systemic risk. There is a bulk of published papers investigating the way
we model cost functions and extrapolate inefficiency scores, the relationships between
performance and risk, competition, M&As, ownership, profitability and regulation
until convergence and cross-country comparisons.
Some topics though seem to be outdated as covering periods in the „90s and 80‟s,
skewed in favour of other markets (e.g. US), or even new areas of academic research.
For example, the comparison of different methodologies in estimating bank
performance is addressed in the study of Bauer et al. (1998) juxtaposing the results of
DEA, SFA, TFA and DFA for a sample of US banks over the period 1977-1988 to
conclude about the consistency within the set of parametric and nonparametric
approaches and inconsistency between them. The results are corroborated by
Cummins and Zi (1998), who studied the US life insurance industry during 1988-
1992 and alleged about the significant differences between the results of DEA/FDH
and DFA; however, nonparametric approaches (DEA, FDH) had considerable
divergence, as well. In the same vein, Huang and Wang (2002) covered the banking
sector of Taiwan from 1982 until 1997 coming up with robust evidence within
nonparametric approaches and parametric models and inconsistency between
SFA/DFA and DEA.
Other studies on European samples are those of Maudos et al. (2002), Casu et al.
(2004), Weill (2004a) and Delis et al. (2009). Maudos et al. (2002), which endorse
similar country rankings in Europe among DFA, FEM and REM during the period
1993-1996, a result which seems close to the conclusion of Casu et al. (2002) about
„not markedly different results‟ for DEA and TFA approaches in France, Germany,
Italy, Spain and UK. Moreover, considering an almost similar sample of countries and
time period, Weill (2004a) found significant correlation between SFA and DFA but
no relationship between them and DEA, whatsoever.
Next, another group of studies analyse cost and profit efficiency concurrently. Higher
performance in the cost side is evident in the majority of empirical studies, except

220
some few cases. The latter includes SFA methodology traced in Isik and Hasan
(2002), who concluded about the higher performance in the output mix of Turkish
banks during 1988-1996, Mertens and Urga (2001) for Ukraine in 1998, Vennet
(2002) over a European sample in 1995 and 1996 that traced high profit efficiency in
financial conglomerates and non-German universal and specialized banks, and Srairi
(2010) within the period 1997-2007 for Oman.
As for country specific studies, relatively higher cost efficiency is found in China
under SFA and DEA during 1993-2004 (Ariff and Can, 2008; Berger et al., 2009), in
India according to DEA from 1992 to 2004 (Das and Ghosh, 2009; Ray and Das,
2010), in Spain under DEA within the period 1985-1996 (Maudos and Pastor, 2003)
and Ukraine in 1998 for the special case of TFA methodology (Mertens and Urga,
2001). In addition, Bonin et al. (2005) and Yildirim and Philippatos (2007b)
corroborate cost-side effectiveness in samples of European developing countries
under SFA along the lines of Kasman and Yildirim (2006), who employ an enlarged
European group during the years 1995-2002. The remainder comprises international
samples, such as those of Gulf cooperation council countries (Srairi, 2010), EU, Japan
and US (Maudos and Pastor (2001), Africa, Asia and Middle East (Bader et al. 2008)
and 74 countries (Pasiouras et al., 2009), which all settle to high cost efficiency under
SFA and DEA approaches.
A quite smaller group of studies employ different definitions of bank outputs, namely
the intermediation and value-added approaches in particular. They are used either for
comparison purposes or for robustness checking purposes. Indeed, Glass et al. (1998)
implemented the cost function of Pulley and Braunstein (1992) for Japan within the
period 1977-1993 to come up with mixed results between economies of scale and
scope and better fit of VA approach. Sufian (1999) employed DEA for the Malaysian
banking industry and verified relatively higher average technical and scale efficiency
under VA approach, whereas Tortosa-Ausina (2002) highlighted similarly a higher
and more stable DEA efficiency scores in Spain.
The concept of economies of scale has been widely analysed for the US region since
the „80s dominating the literature by a clear mile. Hughes and Mester (1998)
identified explicit economies of scale through IA-based function augmented by OBS
activities as well as Evanoff et al. (1990) by means of a shadow-price model.

221
Under IA approach, Jagtiani et al. (1995) identify through the model of Christensen et
al. (1973) economies of scale, which turn out to be lower than 5% according to Berger
and Humphrey (1991). Scale economies do exist only in smaller sizes according to
Noulas et al. (1990), Gilligan and Smirlock (1984), Wheelock and Wilson (2001),
Cavallo and Rossi (2001), Gilligan et al. (1984), McAllister and McManus (1993),
who employed translog and quadratic specifications, kernel regressions, spline
regressions and polynomial smoothing, the model of Benston (1972) and Bell and
Murphy (1968), the intermediation, value-added and production approaches, among
others. Furthermore, diseconomies of scale are traced across branching and unit state
asset classes (Berger et al., 1987), money center and super-regional banks and
diversified US securities banks.
As for European studies, Altunbas and Molyneux (1996) observe scale economies in
banks of all size classes and different outputs over a sample of France, Germany, Italy
and Spain. Similar evidence comes out of dynamic modeling by Carvallo and Rossi
(2001) although some degree of exhaustion takes place at low output levels. Large
branch offices in Finland experience scale economies up until 2.5 million Finn marks
(Zardakoohi and Kolari, 1994) opposing to the case of Norway, which picks up
economies of scale in small banks and mixed results in any asset size class when total
assets are used as a single output variable (Humphrey and Vale, 2004). Scale
economies are evident across all asset classes in mutual funds of France in 1987 and
in the cooperative banks of Germany during the period 1989-1992. Last, Pasiouras
(2008a) draw remarks on the persistent scale economies of purely domestic banks and
relatively lower economies in international banks for the period 2000-2004.
Last, to our knowledge, beta and sigma convergence of bank efficiency enumerates
four papers. The US banking market experiences conditional convergence of DEA
scores among bank holding companies within the period 1996-2003 (Fung, 2006).
Casu and Girardone (2010) employ DEA and dynamic models over the developed
European group to endorse the lagging-behind rather than the catching-up tendency of
cost efficiency during the 1997-2003 period, whereas Weill (2009) across different
specifications found beta and sigma convergence in cost efficiency. At that time, the
developing European subgroup documents catching-up effect and dispersion
exclusively in the cost efficiency case.

222
Hence, the aim of this paper is threefold: First, to estimate the consistency of cost and
profit efficiency scores for the whole European region by means of various parametric
approaches and under different definitions of bank outputs. Second, we estimate scale
economies under the intermediation and value-added approach for each banking
market alongside different productive specialisations and asset classes. Third, we
verify whether the European challenge of market integration is accompanied by beta
and sigma convergence of cost and profit efficiency amongst financial institutions.
7.2. Methodological issues
This chapter comprises a set of methodological issues that need to be considered for
the sake of efficient data application. The first refers to the need of deciding upon the
best approach among parametric and non-parametric approaches; that is, econometric
modeling and linear programming. The observed inconsistency of the empirical
studies is attributed to the different structure of employed modeling as DEA and FDH
excludes the random error that accounts for shocks, measurement errors and data
problems.
In contrast, researchers have employed various structures of the inefficiency term in
SFA, apart from the other constituent of the composite error term that presumably
follows the standard normal distribution. SFA is also preferred against thick frontier
and distribution-free approaches since the former poses the strict assumption of
constancy on the error term and the latter runs the risk of ascribing cost differences to
the large values of the random error. In particular, panel data analysis constitutes a
better methodology for the estimation of technical inefficiency according to Baltagi
and Griffin (1988), Cornwell et al. (1990) and Kumbhakar (1993). The random effects
model is also suggested due to its fit in studies of large N bank groups since the fixed
effects model is arguably inappropriate for leading to reliable indicators of efficiency
(Gathon and Perelman, 1992; Simar, 1992) due to potential loss of freedom (Baltagi,
1995) and confounded efficiency scores across different asset sizes (Berger, 1993).
The way inputs and outputs of banks are defined determines the empirical analysis
quantitatively since the efficiency scores are different (Resti, 1997). Several
approaches have been proposed in the literature, namely the intermediation and

223
production approach as well as the asset, user cost and value-added approach. In
particular, the intermediation approach as first proposed by Sealey and Lindley (1977)
treat deposits as input; their cogitation tracks the operating process from the pool of
depository funds to their final transformation to loans and other assets through the
utilisation of capital and labour. The production approach by Ferrier and Lovell
(1990) treats deposits from a different angle. It measures loans and deposits in
quantities and considers them as the bank‟s production of services with the use of
labour and capital and the inclusion of interest expenses in total cost (as
intermediation approach sets out).
The other three are employed in relatively limited cases: the value-added approach
(Berger and Humphrey, 1992) defines output as any item, irrespectively of which side
of the balance sheet it gets into, being the product or a share of the capital-labour mix,
otherwise as input. According to Humphrey and Pulley (1997) it is assumed that
banks provide two types of financial services: intermediation and loan services and
payment, liquidity and safekeeping services. As for the user cost approach, deposits
and any other item are bank output if its net contribution to revenues is positive.
However, asset approach is sparsely used, though as a variant of the intermediation
approach much to the idea of accounting liabilities (deposits) as inputs and assets as
outputs. In this paper the intermediation and value-added approaches are adopted to
allow for cross-study comparisons in the European region.
The comparison of efficiency scores across borders and different sectors in another
issue that should be resolved. Anything that is out of managers‟ jurisdiction and area
of control might be proxied by country and industry specific factors that capture the
underlying variation. Otherwise, under the same cost frontier, the necessary
assumption that the efficiency differences are attributed only to managers‟ decisions
seems quite unrealistic and jeopardizes, for one thing, the empirical analysis.
However, we opt alternatively to compute as many frontiers as are the European
countries so as to exploit data availability, even in the Southeastern Union, and
thereby draw secure remarks on cross-country rankings.
Moreover, the appropriate specification of the cost function should be concluded upon
the data of the sample and amongst three alternatives: the translog cost function (TL),
the Box-Cox form (BC) and the Fourier-Flexible specification (FF). The TL form is

224
the most widely applied in empirical studies once it generalizes the important in
microeconomics Cobb-Douglas function and requires few restrictions on the cost
structure and its dual production function. In contrast, the underlying form stops short
at producing scale and scope economies at zero production output whereas White
(1980) suggests that the second order calculation of the Taylor expanded function is
not necessarily identified by TL estimates. The BC formulation alleviates the former
problem by accounting for zero values; however, non-homogeneity in input prices -
found by Shaffer (1994) - is surpassed by applying transformation in a specific
function each time that suits the output data. A pitfall might be the arbitrary
approximation of the modified version using various quadratic forms.
Last, the FF specification was first developed by Gallant (1981,1982), in response to
the critique of White (1980) on the restrictive property of second order Taylor
expansion function; it was further developed by Elbadawi et al. (1983) and Gallant
and Souza (1991) while first applied in banking later on by McAllister and McManus
(1993), Berger et al. (1994), Spong et al. (1995), Mitchell and Onvural (1996), Berger
and Mester (1997). It comprises in fact the TF form enriched with trigonometric
transformation of the variables as addends, any combination of which can
demonstrate a good fit in various multivariate functions (Tolstov, 1962). In so doing,
a better fit of the data is achieved through getting better inference on the coefficients
of the cost function (De Young and Hasan, 1998)21
, although it requires further
truncations of data (Hasan and Marton, 2003) and produces similar efficiency scores
to TL (Berger and Mester, 1997).
To contribute more on the ongoing cross-country literature that tests the consistency
of efficiency scores, the remaining error component is better depicted by the per se
utilisations of different methodologies and specifications. It is also indicative that
DEA is not part of the empirical analysis since pertinent software can by no means
tolerate missing values and therefore, a considerably shrank sample is not appealing
for the scope of our research. In addition, the literature has come to a consensus
regarding differences in results between parametric and nonparametric approaches
(Bauer et al., 1998; Cummins and Zi, 1998; Delis et al., 2009; Huang and Wang,
2002; Weill, 2004a). SFA too falls short at accomplishing curvature conditions when
21
Carbo et al. (2002) thoroughly explain the reasons why FF form is more appropriate.

225
applying maximum likelihood technique along the lines of Batesse and Coelli (1992,
1995).
To this end, I opt for the REM, DFA and TFA along with the use of the
intermediation and value-added approaches.
7.3. The model
The employed model examines the effect of banks‟ activities – whether traditional or
not – on efficiency in the European region. The framework of such analysis is based
upon the construction of a „paneuropean‟ efficiency frontier against which all banks
within national markets and across regions are compared. The DFA and TFA
methodologies to be followed hereinafter contribute to the literature of comparative
studies of profit and cost efficiency such as those of Maudos et al. (2002), Bauer et al.
(1998), among others.
The models of cost and alternative profit function are estimated to produce efficiency
scores over the examined period. The latter specification instead of the traditional
profit function allows for the profit function to be determined by input prices and
output quantities thus implying uncompetitive pricing or heterogeneous groups within
the European region (Kasman and Yildirim, 2006; Maudos et al., 2002; Pasiouras et
al., 2009).
The cost and profit models are a function of the output and input vector, the level of
inefficiency (u) and the standard error term (e). Schematically,
Y Y y,w,u,e (7.1)
where Y denotes total costs and total profits before taxes of bank i at time t22
. Taking
logs at both sides, we have:
lnY f (w,q) lne lnu (7.2)
22
Subscripts are omitted for convenience purposes.

226
where lnY is the logarithm of total costs (TC) and profits before taxes (PBT), q and w
are the vectors of bank outputs and inputs, respectively. The error term is decomposed
into two parts: the e factor being identically and independently distributed that
accounts for measurement errors and luck, and the u term denoting the inefficiency
term23
. Supposing the profit maximising and cost minimising conduct of banks,
inefficiency is bound to inflate costs and diminish profits. Thus, the plus and minus
sign is appropriately assumed in cost and profit functions, respectively.
The fully expanded model takes the following form:
lnY a i lnWi
i
ii
lnQi 1
2i, j
j
i
lnWi lnW j 1
2 i, j
j
i
lnQi lnQ j
i. jj
lnWi lnQ j
i
1 lnE 1
22 lnE2 3,i
i
lnE lnWi 4,i
i
lnE lnQi lne lnu
(7.3)
First, total costs (TC) and profits before taxes (PBT) are the dependent variables. To
avoid negative data when it comes to apply logarithmic time series, the minimum
absolute value of PBT over the whole sample plus „1‟ is added to the PBT so as to
give out in the extreme at least zero values [ln(PBT+|PBTmin|+1)]. The input vector
comprises the price of labour (P1) proxied by personnel expenses over total assets
since there is no reliability of the number of bank employees, price of physical capital
(P2) (operating costs of plant and equipment (net of personnel) over fixed assets).
As for the output, loans (Q1), other earning assets (Q2) are often used in the literature
whereas off-balance sheet items (Q3) in nominal terms are employed since otherwise
their exclusion would understate total output (Jagtiani and Khanthavit, 1996). The
level of equity (E) as fixed netput is quasi que non for its use according to Berger and
Mester‟s (1997) argumentation; risk preferences vis-à-vis informational asymmetries,
regulation and financial distress are scaled over the whole sample of European banks,
the omission of which would otherwise identify inefficiency in banks that behave
optimally in line with managers‟ stance for risk taking. We also employ the value-
added approach including in the input vector the price of labour (W1) and physical
23
It is modeled with positive sign in the cost function, as inefficiency can by no means diminish total
costs, whereas in the profit model the negative sign highlights reduction in banks profits.
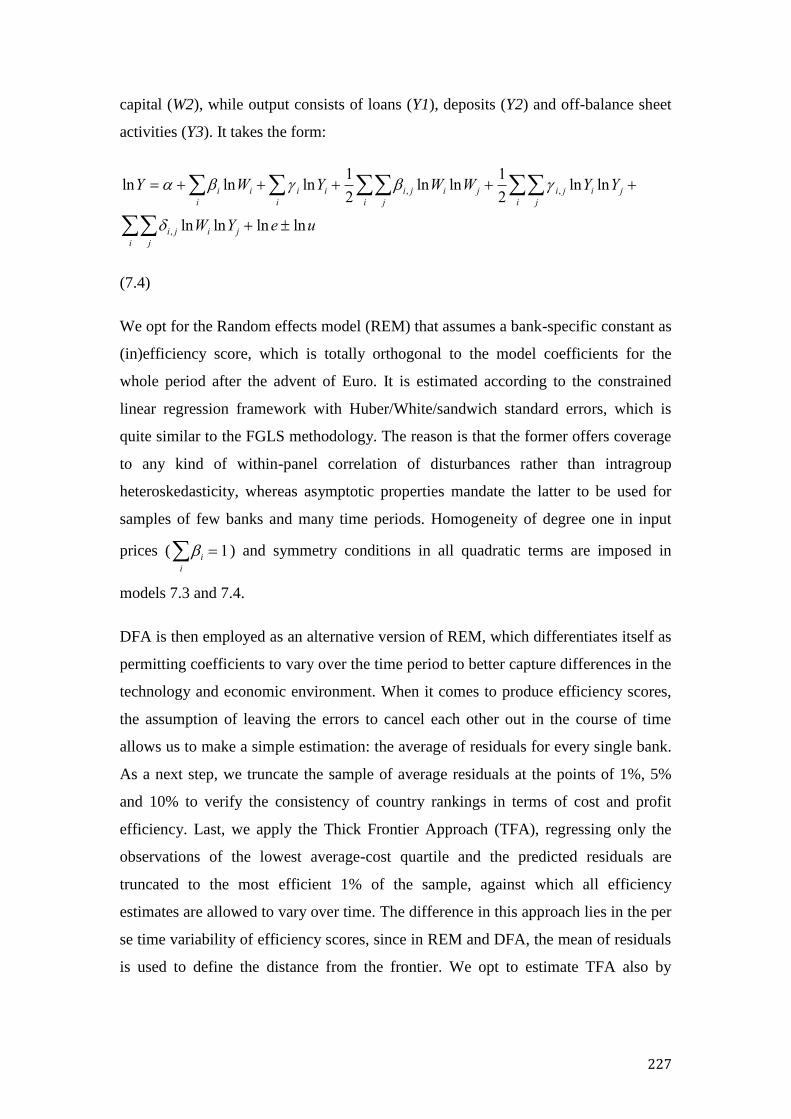
227
capital (W2), while output consists of loans (Y1), deposits (Y2) and off-balance sheet
activities (Y3). It takes the form:
lnY ii
lnWi ii
lnYi 1
2i, j
j
lnWi
i
lnW j 1
2 i, j
j
lnYii
lnY j
i, j lnWi lnY j lne lnuj
i
(7.4)
We opt for the Random effects model (REM) that assumes a bank-specific constant as
(in)efficiency score, which is totally orthogonal to the model coefficients for the
whole period after the advent of Euro. It is estimated according to the constrained
linear regression framework with Huber/White/sandwich standard errors, which is
quite similar to the FGLS methodology. The reason is that the former offers coverage
to any kind of within-panel correlation of disturbances rather than intragroup
heteroskedasticity, whereas asymptotic properties mandate the latter to be used for
samples of few banks and many time periods. Homogeneity of degree one in input
prices ( ii
1 ) and symmetry conditions in all quadratic terms are imposed in
models 7.3 and 7.4.
DFA is then employed as an alternative version of REM, which differentiates itself as
permitting coefficients to vary over the time period to better capture differences in the
technology and economic environment. When it comes to produce efficiency scores,
the assumption of leaving the errors to cancel each other out in the course of time
allows us to make a simple estimation: the average of residuals for every single bank.
As a next step, we truncate the sample of average residuals at the points of 1%, 5%
and 10% to verify the consistency of country rankings in terms of cost and profit
efficiency. Last, we apply the Thick Frontier Approach (TFA), regressing only the
observations of the lowest average-cost quartile and the predicted residuals are
truncated to the most efficient 1% of the sample, against which all efficiency
estimates are allowed to vary over time. The difference in this approach lies in the per
se time variability of efficiency scores, since in REM and DFA, the mean of residuals
is used to define the distance from the frontier. We opt to estimate TFA also by

228
applying the cost function over the whole period in order to come up with average
efficiency scores similarly to the aforementioned methodologies.
After ending up with the parameter estimates of the translog cost function, we apply
the following expression:
EC exp[(lni lnimin )] (7.5) where lni lniti
T
.Or more formally,
Ec exp f y,w exp ln umin
exp f y,w exp ln u umin
u (7.6)
As for the profit efficiency, we estimate respectively the following expression:
E exp f y,w exp ln u 1
exp f y,w exp ln umax 1 (7.7)
7.4. Sample - Evidence
The unbalanced panel dataset comprises 11374 observations of at most 2228 banks
for the period 2003-2008 as retrieved from the database Bankscope Van Dijk. The
dataset covers the whole group of 27 countries in the European Union, viz. Austria,
Belgium, Bulgaria, Cyprus, Czech Republic, Denmark, Estonia, Finland, France,
Germany, Greece, Hungary, Ireland, Italy, Latvia, Lithuania, Luxembourg, Malta,
Netherlands, Poland, Portugal, Romania, Slovakia, Slovenia, Spain, Sweden and
United Kingdom. The year 2002 was excluded in the beginning since a huge amount
of missing values could undermine the panel setting of analysis. As table 11
highlights, the break down of the sample by year and country, the developed
economies dominate the sample with a considerable weight on Germany, Italy and
Austria. It is quite common in the literature to employ few banks for the Southeastern
Union due to the extreme data unavailability in Bankscope database.

229
Table 11: Number of banks
2003 2004 2005 2006 2007 2008 Total
Austria 113 132 136 151 156 132 820
Belgium 14 17 25 25 23 21 125
Bulgaria 5 66 8 8 9 10 106
Cyprus 8 9 8 11 12 10 58
Czech R. 8 13 13 15 14 11 74
Denmark 22 31 38 39 41 32 203
Estonia 4 5 5 6 4 3 27
Finland - 3 5 4 5 6 23
France 61 89 129 141 143 138 701
Germany 770 790 941 966 965 937 5369
Greece 2 13 15 16 14 13 73
Hungary 10 11 12 12 11 12 68
Ireland 3 6 15 13 16 12 65
Italy 4 11 394 408 409 414 1640
Latvia 10 12 12 13 13 12 72
Lithuania 8 8 9 9 9 7 50
Luxembourg 35 38 42 44 52 48 259
Malta 3 5 5 5 4 4 26
Netherlands 6 17 26 26 27 22 124
Poland 8 14 14 14 15 19 84
Portugal 2 7 19 21 19 16 84
Romania 8 10 12 11 12 11 64
Slovakia 6 6 7 7 7 7 40
Slovenia 6 7 10 9 9 9 50
Spain 2 34 88 91 81 89 385
Sweden 40 42 48 52 54 46 282
UK 38 57 98 101 104 104 502
EU-27 1196 1453 2134 2218 2228 2145 11374
Source: Bankscope database.
The following tables delineate the cost and profit efficiency scores as extrapolated
from the REM, DFA and TFA methodologies coupled with their truncated versions at
1%, 5% and 10% distribution level along with the specifications of intermediation and
value-added approach. Although the current financial crisis stems roughly from 2009,
the period under investigation commences from 2003 until 2008.
The first column (table 12) shows very low average efficiency scores following REM
methodology probably due to different parameter slopes prior to 2008, but also to the
extreme values of efficiency scores that may depict other random effects than the per
se operational performance that have not enough time to cancel each other out in the
course of time. Thus, the truncation point at 1%, 5% and 10% eliminates such effects

230
and efficiency levels rise considerably from 6% to almost 86%. DFA results in the
next four columns follow the same pattern although they are slightly bigger as long as
we come up with convergence at 5% and 10% truncation point.
Moreover, we apply TFA in the last two columns displaying the average cost
efficiency scores by country that, first, stem from average bank performance, and
secondly from time-varying efficient scores. At a closer look, TFA results are very
similar once we estimate them in averages by bank or allowing them to vary in the
time course. Furthermore, their levels also lie in between the scores of REM and DFA
when truncated at 1% and 5% distribution point. Corroborating the results of Maudos
et al. (2002), country rankings seem invariant across different methodologies as the
best performers (Denmark, Spain, Sweden) and poor performers (Hungary, Romania,
Bulgaria) remain remarkably stable.
TFA efficiency scores are estimated running regressions for the whole period as well
as by year to better reflect bank technology and economic conditions. Indeed, we
estimate relative efficiency scores against the most efficient frontier by taking the
average of residuals ending up with bank-specific constants of inefficiency over the
period (TFA column). The last column highlights efficiency scores after computing
the distance of the residuals from the 1% most efficient banks indentified per year and
truncated at the 1% and 99% points of the sample. It is evident that the level of
efficiency for each country differs considerably but, nonetheless, we compare all three
methodologies by picking up scores that come out of 5% truncation point, to which
they seem to converge in levels.
The coefficients of Spearman rank-order correlation (reported in the chapter
appendix) show how that REM and DFA demonstrate average rank correlation .99,
which is quite expected as the scores come out of the standard error of similarly
specified cost models. However, they both document .53 and .63 correlation with the
time-invariant TFA and time-varying case of TFA-Y, which seems to reflect
consistency in parametric estimation as Bauer et al. (1998). Hence, the resulting
differences of between DFA and TFA scores seem to vary from 9% to 22%, whereas
estimates of the same methodology differ substantially up to 85% in the case of
different truncations of DFA and between 25% and 83% for TFA. In addition, the

231
performance of the EU-15 group outpaces that of developing region by at least 6%
according to all methodologies.
Table 12: Cost efficiency (Intermediation approach)
REM REM-99 REM-95 REM-90 DFA DFA-99 DFA-95 DFA-90 TFA TFA-Y
Austria 0.0548 0.4698 0.7553 0.8466 0.1334 0.4863 0.7545 0.8454 0.6184 0.6010
Belgium 0.0608 0.4345 0.6672 0.7714 0.1488 0.4440 0.6731 0.7743 0.5573 0.5595
Denmark 0.0625 0.5145 0.8059 0.8902 0.1497 0.5242 0.8016 0.8874 0.6192 0.5998
Finland 0.0670 0.5385 0.7801 0.8549 0.1572 0.5380 0.7825 0.8556 0.6180 0.5567
France 0.0538 0.4495 0.7165 0.8101 0.1287 0.4641 0.7152 0.8074 0.5191 0.5143
Germany 0.0512 0.4488 0.7195 0.8076 0.1239 0.4620 0.7146 0.8014 0.5750 0.5535
Greece 0.0510 0.4489 0.7119 0.7920 0.1232 0.4613 0.7051 0.7854 0.5519 0.5208
Ireland 0.0718 0.5403 0.7650 0.8340 0.1636 0.5416 0.7481 0.8211 0.5907 0.5677
Italy 0.0539 0.4714 0.7542 0.8440 0.1310 0.4874 0.7519 0.8409 0.5890 0.5736
Luxembourg 0.0560 0.4147 0.6543 0.7508 0.1343 0.4332 0.6654 0.7594 0.4801 0.4734
Netherlands 0.0543 0.4559 0.7188 0.8024 0.1306 0.4662 0.7138 0.7965 0.5257 0.5097
Portugal 0.0423 0.3501 0.5911 0.6999 0.1028 0.3618 0.5887 0.6946 0.4324 0.4242
Spain 0.0563 0.4863 0.7723 0.8589 0.1377 0.5060 0.7751 0.8610 0.6381 0.6351
Sweden 0.0717 0.5589 0.8552 0.9269 0.1718 0.5726 0.8528 0.9252 0.6398 0.6239
UK 0.0629 0.3835 0.6224 0.7263 0.1378 0.3963 0.6266 0.7278 0.4746 0.4778
EU-15 0.0580 0.4644 0.7260 0.8144 0.1383 0.4763 0.7246 0.8122 0.5620 0.5461
Bulgaria 0.0394 0.3470 0.5682 0.6714 0.0975 0.3651 0.5776 0.6775 0.3999 0.4102
Cyprus 0.0442 0.3900 0.6340 0.7405 0.1119 0.4209 0.6639 0.7570 0.4642 0.4507
Czech R. 0.0546 0.4474 0.7379 0.8371 0.1370 0.4765 0.7401 0.8354 0.5566 0.5598
Estonia 0.0505 0.4450 0.7131 0.8196 0.1215 0.4550 0.7102 0.8224 0.4370 0.5060
Hungary 0.0358 0.2775 0.5165 0.6467 0.0865 0.2863 0.5180 0.6431 0.3569 0.3411
Latvia 0.0562 0.4949 0.7663 0.8337 0.1382 0.5176 0.7706 0.8373 0.5546 0.5460
Lithuania 0.0501 0.4410 0.7068 0.7845 0.1211 0.4533 0.7006 0.7779 0.5261 0.5119
Malta 0.0646 0.4849 0.6951 0.7856 0.1488 0.4866 0.6931 0.7846 0.5985 0.5567
Poland 0.0487 0.3970 0.6514 0.7480 0.1199 0.4159 0.6591 0.7496 0.4754 0.4960
Romania 0.0358 0.3182 0.5278 0.6494 0.0852 0.3214 0.5193 0.6350 0.3263 0.3348
Slovakia 0.0477 0.4200 0.6772 0.7575 0.1150 0.4307 0.6744 0.7551 0.5005 0.4862
Slovenia 0.0545 0.4802 0.7302 0.8054 0.1287 0.4817 0.7309 0.8060 0.5835 0.5201
EU-12 0.0485 0.4119 0.6604 0.7566 0.1176 0.4259 0.6631 0.7568 0.4816 0.4766
The table reports cost efficiency scores according to the intermediation approach on averages per banking industry across
different specifications. In particular, REM and DFA methodologies comprise versions of truncated distributions at 1%,
5% and 10% level of each tail. TFA produces average efficiency scores at the bank level over a common frontier whereas
TFA-Y replicates the procedure for every year in order to highlight the evolution of banking performance. EU-15 denotes
the average cost efficiency deflated by the number of banks operating within each country of the relatively more
developed European region, and EU-12 the developing region along with the inclusion of Bulgaria and Romania.
The results of table 13 come out of the VA approach giving estimates a bit lower than
those of table 2 persistently at about 10% across all specifications of REM and DFA;
the TFA results, however, may be up to 20% lower without altering the relative

232
rankings of banking markets. We also see the model fit relatively lower than that of
IA approach opposing the results of Glass et al. (1998). When it comes to compare
efficiency scores under VA approach, there is a convergent pace between DFA and
TFA estimates since the most efficient markets of Sweden, Czech Republic and
Latvia, as well as the least ones of Hungary, Romania and Portugal coincide in
relative rankings.
However, REM and DFA methodology fall short of depicting reliable results amid
conditions of economic growth and downturn; on those grounds, we opt to utilize the
truncated specifications at 5% of each side of the distribution for cross-country
comparisons. We also see the unobserved country-specific effects to impact REM and
DFA divergence from their own truncated scores at 88% the most. Thus, the
Spearman coefficient for the truncated versions of DFA and REM scores (at 5% of
the distribution) signifies identical rankings at .99 level, while that between them and
TFA and TFA-Y, correlation is still considerable (as in table 12) at levels .93 and .70,
respectively.
A notable difference between IA and VA approaches is that in the aggregate, the
comparison of the developed and developing world is not identical. In particular, the
value-added approach identifies rather a homogeneous sample with respect to cost
efficiency since EU-15 barely stands out by 1%. The result is reminiscent of the
stability in efficiency scores of Tortosa-Ausina (2002) albeit she argues – along with
Sufian (2009) - about higher levels under VA approach, which comes in
contradistinction with our results.
The intuition here is that in VA model we include deposits as bank output instead of
other earning assets, which highlights marked differences in the structure of banks‟
balance sheets. The fact that the EU-15 group performs better with the use of „other
earning assets‟, implies that extensive trading through derivatives and other
investment securities (property investments, government bills, insurance assets) has
yielded significant asset value on books given the existent cost structure. That,
however, is not related to potential losses on bank activities as the latter appear in
yearly income statements.

233
Table 13: Cost efficiency (Value-added approach)
REM REM-99 REM-95 REM-90 DFA DFA-99 DFA-95 DFA-90 TFA TFA-Y
Austria 0.0096 0.3686 0.6538 0.7581 0.0136 0.3890 0.6578 0.7589 0.3965 0.4267
Belgium 0.0109 0.3304 0.5840 0.7003 0.0158 0.3508 0.5923 0.7054 0.4211 0.4734
Denmark 0.0109 0.3874 0.6991 0.8070 0.0156 0.4088 0.7026 0.8080 0.4330 0.4648
Finland 0.0121 0.4403 0.7046 0.8186 0.0165 0.4445 0.7008 0.8129 0.4778 0.4731
France 0.0099 0.3764 0.6514 0.7478 0.0139 0.3969 0.6565 0.7508 0.4030 0.4315
Germany 0.0090 0.3576 0.6253 0.7197 0.0128 0.3765 0.6284 0.7198 0.3677 0.3928
Greece 0.0103 0.4161 0.7136 0.8005 0.0147 0.4380 0.7152 0.7989 0.4280 0.4480
Ireland 0.0142 0.4600 0.7090 0.7951 0.0185 0.4666 0.7029 0.7895 0.4840 0.4947
Italy 0.0098 0.3887 0.6768 0.7757 0.0140 0.4095 0.6806 0.7764 0.3920 0.4248
Luxembourg 0.0113 0.3615 0.6082 0.7161 0.0156 0.3774 0.6135 0.7193 0.3888 0.4185
Netherlands 0.0106 0.3836 0.6583 0.7574 0.0148 0.4009 0.6595 0.7545 0.4473 0.4591
Portugal 0.0079 0.2951 0.5395 0.6549 0.0113 0.3118 0.5437 0.6585 0.3143 0.3427
Spain 0.0119 0.4640 0.7971 0.8858 0.0168 0.4884 0.8016 0.8868 0.4825 0.5135
Sweden 0.0135 0.4799 0.8396 0.8997 0.0192 0.5044 0.8425 0.9010 0.5368 0.5766
UK 0.0241 0.2922 0.5498 0.6643 0.0255 0.3077 0.5530 0.6670 0.3867 0.4076
EU-15 0.0117 0.3868 0.6674 0.7668 0.0159 0.4047 0.6701 0.7672 0.4240 0.4499
Bulgaria 0.0093 0.3505 0.6263 0.7265 0.0131 0.3673 0.6260 0.7227 0.3898 0.4242
Cyprus 0.0090 0.3367 0.5794 0.6958 0.0128 0.3514 0.5831 0.6986 0.3560 0.3621
Czech R. 0.0113 0.4319 0.7246 0.8245 0.0161 0.4532 0.7281 0.8267 0.4740 0.5265
Estonia 0.0103 0.4153 0.7247 0.8279 0.0148 0.4393 0.7322 0.8340 0.3899 0.4681
Hungary 0.0070 0.2214 0.4726 0.6082 0.0098 0.2332 0.4740 0.6071 0.3157 0.3093
Latvia 0.0126 0.4749 0.7701 0.8483 0.0180 0.4948 0.7704 0.8459 0.4775 0.5177
Lithuania 0.0108 0.4327 0.7525 0.8369 0.0153 0.4545 0.7544 0.8362 0.4341 0.4620
Malta 0.0350 0.5116 0.7415 0.8257 0.0434 0.5192 0.7326 0.8132 0.5550 0.5058
Poland 0.0088 0.3235 0.5856 0.6909 0.0129 0.3512 0.6050 0.7046 0.3704 0.4106
Romania 0.0073 0.2808 0.5059 0.6179 0.0106 0.3010 0.5177 0.6214 0.3006 0.3505
Slovakia 0.0099 0.3968 0.6901 0.7809 0.0140 0.4162 0.6909 0.7785 0.4388 0.4622
Slovenia 0.0106 0.4286 0.7272 0.8143 0.0147 0.4388 0.7284 0.8125 0.4426 0.4392
EU-12 0.0118 0.3837 0.6584 0.7582 0.0163 0.4017 0.6619 0.7584 0.4120 0.4365
The table reports cost efficiency scores according to the value-added approach on averages per banking
industry across different specifications. In particular, REM and DFA methodologies comprise versions of truncated
distributions at 1%, 5% and 10% level of each tail. TFA produces average efficiency scores at the bank level over a
common frontier whereas TFA-Y replicates the procedure for every year in order to highlight the evolution of banking
performance. EU-15 denotes the average cost efficiency deflated by the number of banks operating within each country
of the relatively more developed European region, and EU-12 the developing region along with the inclusion of Bulgaria
and Romania.
In table 14, we see profit efficiency scores following the intermediation approach per
banking industry. The picture in this case differentiates from previous results as profit
performance accounts for efficiency gains not only from the cost side but also from
the output mix. Thus, negative values in profit efficiency scores are justified by
fluctuations in the profitability of differently specialized financial institutions rather
than the bearing of extreme outliers. It is clear that profit efficiency being much lower
than cost efficiency is evident and quite robust across empirical studies like Bonin et

234
al. (2005), Maudos and Pastor (2001; 2003), Kasman and Yildirim (2006), Yildirim
and Philippatos (2007b), among others. The developed group of the European Union
appears to be more vulnerable to profit performance since the developing markets
have more ground to cover up and, thus, more opportunities to exploit. Similar cases
of higher profit efficiency even above the level of cost efficiency are evident in the
developing markets of Turkey (Isik and Hasan, 2002), Ukraine (Mertens and Urga,
2001) and Oman (Srairi, 2010)24
. In fact, we come up with a considerable difference
up to 11.27% between the two European groups, especially in the time-varying case
of TFA.
When comparing REM and DFA results, we expect the same country rankings since
their only key difference lies in the latter allowing for variation of model parameters
over time vis-à-vis a common frontier. Hence, we identify Ireland, Malta and Cyprus
hitting the greatest negative scores (up to -23%) while Belgium, Hungary and Czech
Republic accomplish more than 30%. In the case of TFA, we verify that country
rankings remain stable as far as the least efficient markets are concerned, whereas the
best performers appear to be Slovakia, Bulgaria and Slovenia. This divergence lies in
the fact that TFA produces the distance from the frontier, which is constructed for
every single year while the other two methodologies construct the frontier and the
distance from it in average terms either the latter stems from regression over the
whole period or per year to allow for parameter variation. Moreover, negative profit
efficiency constitutes an issue hard to interpret from a rational perspective that all
banks should be profit-maximizers. In fact, it seems as if banks tend to completely
forego potential profits (Berger and Mester, 2000) possibly due to some random
effects or strategic failures.
24
What stands out in the developed world as more profit efficient is the financial conglomerates in the
EU during 1994-1995, the non-German universal and specialized banks of Germany (Vennet, 2002).

235
Table 14: Profit efficiency (Intermediation approach)
REM REM-99 REM-95 REM-90 DFA DFA-99 DFA-95 DFA-90 TFA TFA-Y
Austria 0.0185 0.1305 0.2194 0.2927 0.0182 0.1300 0.2207 0.2853 0.0712 -0.0109
Belgium 0.0362 0.3776 0.4795 0.5506 0.0390 0.3889 0.4904 0.5370 0.3116 0.0531
Denmark 0.0023 0.0754 0.0523 0.0545 -0.0032 0.0670 0.0417 0.0506 -0.0427 -0.1646
Finland 0.0014 0.1312 0.1943 0.2803 0.0144 0.1885 0.2957 0.3925 0.1495 -0.0835
France 0.0114 0.0927 0.1443 0.1650 0.0114 0.0897 0.1347 0.1684 0.0472 -0.0662
Germany -0.0073 -0.0287 -0.0627 -0.0944 -0.0071 -0.0303 -0.0646 -0.0888 -0.1943 -0.1399
Greece -0.0055 -0.0273 -0.0235 0.0060 -0.0078 -0.0393 -0.0365 -0.0095 -0.1214 -0.0762
Ireland -0.0847 -0.2310 -0.1729 -0.1177 -0.0753 -0.2220 -0.1207 -0.0449 -1.2949 -1.4855
Italy 0.0026 0.0248 0.0452 0.0659 0.0023 0.0233 0.0412 0.0624 -0.1028 -0.0946
Luxembourg 0.0341 0.1889 0.3513 0.4538 0.0323 0.1691 0.3329 0.4329 0.0527 -0.5090
Netherlands 0.0091 0.1229 0.2324 0.3045 0.0108 0.1312 0.2286 0.2871 0.0119 -0.2528
Portugal 0.0175 0.2087 0.3424 0.3669 0.0247 0.2357 0.3673 0.3952 0.1594 -0.0632
Spain 0.0361 0.2043 0.3510 0.4290 0.0388 0.2181 0.3541 0.4275 0.1411 0.0243
Sweden 0.0192 0.1821 0.3624 0.4783 0.0195 0.1835 0.3607 0.4779 -0.0045 -0.0433
UK 0.0077 0.2317 0.3230 0.3933 0.0081 0.2214 0.2981 0.3631 0.0780 -0.2824
EU-15 0.0066 0.1123 0.1892 0.2419 0.0084 0.1170 0.1963 0.2491 -0.0492 -0.2130
Bulgaria 0.0460 0.2299 0.3881 0.4730 0.0625 0.3160 0.5232 0.6100 0.2214 0.1571
Cyprus -0.0097 -0.0484 -0.0246 -0.0583 -0.0159 -0.0806 -0.0925 -0.0560 -0.4146 -0.4083
Czech R. 0.0659 0.3461 0.5262 0.5822 0.0504 0.3309 0.5158 0.5858 0.3307 -0.0174
Estonia -0.0015 -0.0073 0.0817 0.1461 -0.0049 -0.0246 0.0669 0.1536 -0.1025 -0.0996
Hungary 0.0070 0.3026 0.3750 0.3762 -0.0010 0.2730 0.3352 0.3451 0.2223 -0.1310
Latvia 0.0343 0.1714 0.3578 0.4679 0.0284 0.1437 0.3004 0.3982 0.0857 -0.0682
Lithuania 0.0445 0.2225 0.4031 0.4948 0.0439 0.2218 0.4237 0.5134 0.2719 0.1004
Malta -0.0922 -0.1875 -0.1280 -0.0948 -0.1097 -0.2772 -0.1687 -0.1181 -1.4742 -1.0797
Poland 0.0580 0.2573 0.3425 0.3926 0.0528 0.2446 0.3316 0.3764 0.2291 0.0939
Romania 0.0540 0.0947 0.0411 0.0354 0.0232 0.0644 -0.0211 -0.0134 0.0195 -0.0838
Slovakia 0.0402 0.2011 0.4249 0.6054 0.0436 0.2205 0.4610 0.5944 0.2821 0.1981
Slovenia 0.0417 0.2086 0.40994 0.5669 0.0436 0.2207 0.4492 0.5897 0.2369 0.1348
EU-12 0.0240 0.1492 0.2665 0.3323 0.0181 0.1378 0.2604 0.3316 -0.0076 -0.1003
The table reports profit efficiency scores according to the intermediation approach on averages per banking industry
across different specifications. In particular, REM and DFA methodologies comprise versions of truncated distributions at
1%, 5% and 10% level of each tail. TFA produces average efficiency scores at the bank level over a common frontier
whereas TFA-Y replicates the procedure for every year in order to highlight the evolution of banking performance. EU-
15 denote the average profit efficiency deflated by the number of banks operating within each country of the relatively
more developed European region, and EU-12 the Southeastern region along with the inclusion of Bulgaria and Romania.
In table 15, we observe the same pattern with the developed world coming short of
demonstrating efficiency on input-output mix at 22% lower than rest members of
European Union. Contrary to the analysis of cost efficiency, the VA approach better
fits the profit model along the lines of Glass et al. (1998). Drawing some comparisons
with respect to the relative rankings, we verify that Malta and Ireland keep their
considerable efficiency gap followed by Estonia, which is close to the performance of
Cyprus of the previous table. As for the best performers of REM and DFA, Hungary
still stands out while Slovenia and Portugal surpass Belgium and Czech Republic by

236
at most 3%. Furthermore, the trend of TFA leans towards the same pick-ups as the
other methodologies under both value-added and intermediation approaches. Thus, we
see Ireland, Malta and Luxemburg experiencing the lowest profit efficiency, or in
more abstract terms limited „loss‟ efficiency. The Spearman‟s rank correlation
between DFA and REM is again above .99, whereas both of them give similar
efficiency ranks to TFA and TFA-Y at correlation levels above .82 and .76,
respectively.
Therefore, to the extent that all employed methodologies and output-input definitions
sufficiently measure bank efficiency, negative scores may intuitively encompass
hidden (toxic) liabilities like collateralized debt obligations, among others. On the
other hand, the trinity of Bulgaria, Slovakia and Slovenia enjoy efficiency scores
between the range 24%-30% according to TFA. However, the results appear quite
ambivalent between TFA and REM/DFA with markedly divergence up to 25%.
In table 16, we see that relative rankings between IA and VA approaches are not the
same as in the cross-country analysis. In especial, the former concludes that
cooperative, savings and securities banks are the best performers in cost efficiency
(above 73%) while the latter picks up commercial, cooperative and private
banking/asset management companies at about 65%. As for profit efficiency, IA
approach identifies finance, real estate and specialized governmental credit
institutions leading the market with 28% to 34% score following Clearing institutions
and custody, finance companies and investment/trust corporations performing above
40% under VA approach.
In quantitative terms, the intermediation and value-added approach predictions are
very close in the cost/profit efficiency albeit the degree of divergence is
asymmetrically distributed endorsing thereby the relative ranking changes. In
contrast, with TFA and TFA-Y we depict average and yearly snapshots of rankings
subject to the inherent and potentially problematic assumptions of the underlying
methodology. In particular, sample heterogeneity makes efficiency predictions be
contingent on the bank technology of the lowest (highest) average cost (profit) profile
of each asset size quartile irrespectively of whether that thick frontier25
suffices as a
25
The thick frontier is constructed by truncating the best practice of the most efficient banks at the 1%
point of the efficiency distribution.

237
benchmark. Second, there exist cases where we observe negative profits and, thus, the
estimation of profit efficiency ends up negative according to expression (7.7).
Table 15: Profit efficiency (Value-added approach)
REM REM-99 REM-95 REM-90 DFA DFA-99 DFA-95 DFA-90 TFA TFA-Y
Austria 0.0250 0.1625 0.2818 0.3551 0.0128 0.1741 0.2857 0.3673 0.1206 0.0788
Belgium 0.0218 0.3605 0.4346 0.4975 0.0081 0.3471 0.4117 0.4681 0.3238 -0.0938
Denmark -0.0235 0.0766 -0.0317 -0.0230 -0.0098 0.0861 0.0113 0.0118 -0.0076 -0.2379
Finland -0.0162 0.0625 0.0474 0.1110 -0.0025 0.1042 0.1260 0.2145 -0.0284 -0.2708
France 0.0059 0.0670 0.1044 0.1599 0.0041 0.0773 0.1278 0.1790 0.0222 -0.0897
Germany -0.0052 -0.0043 -0.0283 -0.0333 -0.0030 -0.0101 -0.0310 -0.0393 -0.1105 -0.0825
Greece 0.0027 0.0117 0.0300 0.0787 0.0033 0.0314 0.0639 0.1132 -0.0657 -0.0801
Ireland -0.1512 -0.2259 -0.1816 0.0220 -0.0736 -0.2714 -0.1588 0.0129 -1.0358 -2.1541
Italy 0.0071 0.0510 0.0867 0.1211 0.0038 0.0520 0.0805 0.1094 -0.0295 -0.0537
Luxembourg 0.0046 0.0958 0.2345 0.3341 0.0010 0.0888 0.2273 0.3188 -0.2121 -0.6921
Netherlands -0.0290 -0.0057 -0.0065 0.0933 -0.0151 -0.0187 -0.0205 0.0665 -0.0944 -0.4038
Portugal 0.0548 0.3128 0.4618 0.5206 0.0289 0.3425 0.4757 0.5351 0.2943 0.0852
Spain 0.0479 0.1960 0.3665 0.4775 0.0301 0.2163 0.3646 0.4755 0.1168 0.0662
Sweden 0.0052 0.1695 0.2133 0.2756 0.0035 0.1783 0.2260 0.2929 0.1391 0.0067
UK 0.0057 0.3247 0.4204 0.5157 0.0012 0.3177 0.4119 0.5032 0.1898 -0.1443
EU-15 -0.0030 0.1103 0.1622 0.2337 -0.0005 0.1144 0.1735 0.2419 -0.0252 -0.2711
Bulgaria 0.0417 0.2580 0.4436 0.5401 0.0226 0.2845 0.4486 0.5491 0.2774 0.2489
Cyprus -0.0381 -0.0780 -0.1403 -0.0514 -0.0256 -0.1463 -0.1343 -0.0608 -0.3682 -0.3353
Czech R. 0.0543 0.2510 0.4566 0.5839 0.0248 0.2555 0.4465 0.5714 0.2407 0.0518
Estonia -0.0181 -0.0795 -0.1741 -0.0437 -0.0104 -0.0980 -0.1723 -0.0287 -0.2932 -0.0974
Hungary 0.0465 0.4776 0.5745 0.6461 0.0248 0.4879 0.5693 0.6212 0.4516 0.1518
Latvia 0.0149 0.0658 0.1528 0.2543 0.0069 0.0648 0.1415 0.2375 -0.0064 -0.0913
Lithuania 0.0399 0.1758 0.3700 0.4446 0.0222 0.2092 0.3898 0.4719 0.1768 0.1913
Malta -0.2225 -0.4843 -0.3607 -0.1305 -0.1062 -0.5384 -0.3372 -0.1490 -1.5587 -1.2112
Poland 0.0335 0.2514 0.3617 0.4042 0.0155 0.2488 0.3391 0.3799 0.2605 0.1677
Romania 0.0127 -0.0049 -0.1358 -0.0737 -0.0012 -0.0178 -0.1262 -0.0912 -0.0630 -0.2778
Slovakia 0.0423 0.1864 0.4145 0.5705 0.0246 0.2322 0.4612 0.6491 0.2756 0.2936
Slovenia 0.0600 0.2643 0.5132 0.6363 0.0325 0.3068 0.5215 0.6606 0.2829 0.3111
EU-12 0.0056 0.1070 0.2063 0.3151 0.0025 0.1074 0.2123 0.3176 -0.0270 -0.0497
The table reports profit efficiency scores according to the value-added approach on averages per banking industry across
different specifications. In particular, REM and DFA methodologies comprise versions of truncated distributions at 1%,
5% and 10% level of each tail. TFA produces average efficiency scores at the bank level over a common frontier whereas
TFA-Y replicates the procedure for every year in order to highlight the evolution of banking performance. EU-15 denote
the average profit efficiency deflated by the number of banks operating within each country of the relatively more
developed European region, and EU-12 the Southeastern region along with the inclusion of Bulgaria and Romania.
Last, DFA seems the most reliable measure of efficiency as it allows random effects
to cancel each other out as time passes leaving an average performance score at the
bank level; on the contrary, yearly frontiers of TFA-Y may pick up a portion of
238
random effects and potentially spoil relative performance. Hence, the per se fact that
country rankings demonstrate sufficient stability, is attributed to the symmetric
distribution of different bank types across European markets.
We next analyse the operational efficiency of the banking market with respect to size
classifying it into four distinct asset classes (table 6). In so doing, we define banking
groups to lie within each class among the 25%, 50% and 75% of the average size
distribution, namely 222.78, 710.56 and 3033.95 millions of Euro, respectively. Cost
efficiency seems more evident by at most 4% in the first two asset classes across all
specifications with a diminishing tendency in banks of higher asset profile. That may
be indicative of there being something more than scale economies and bank
specialisation; in fact, X-efficiency is deemed in contemporary efficiency analysis to
sufficiently explain cost dispersion even amongst banks of similar type or asset size.
Although it might be the case of allocative efficiency, that is the ability of a bank to
allocate its inputs on observable or potential growth opportunities, researchers
generally ignore it by assuming perfect allocation26
.
In particular, the last two classes turn out to be more efficient than smaller-sized
banks as far as we come up with the scores of the last rows. Intuitively, the
skyrocketing negative values in the higher-sized class are traced in some extreme
outliers that lie far off the yearly frontier. That issue becomes more discernible once
we compare the scores of the time-invariant TFA; that is, a more balanced trend
across asset classes implies no clear-cut winners. However, if we analyse the pattern
within each methodology, we identify a negative correlation between cost and profit
efficiency, implying that especially banks other than of commercial, cooperative or
savings type tend to make up for high average costs by utilising their high market
share (for monopolistically pricing) and different output composition.
26
Greene (1980), Schmidt (1984), Kumbhakar (1997), Schmidt and Lovell (1979), Maietta, (2002),
Kumbhakar and Tsionas (2005) and Brissimis et al. (2010) (among others) addressed the issue
theoretically and quantitatively in the literature.

239
Table 16: Cost/profit efficiency by productive specialisation and asset class
REM DFA TFA TFA-Y REM DFA TFA TFA-Y
Cost efficiency Profit efficiency
Bank Holding & Holding
Companies
0.6666 0.6650 0.4838 0.4884 0.1920 0.2051 0.0426 0.0136
0.5690 0.5767 0.3629 0.4116 0.1841 0.1739 0.0737 -0.0697
Clearing Institutions & Custody 0.6175 0.6249 0.4430 0.4648 0.3338 0.2910 -0.1709 -0.8980
0.5569 0.5572 0.4594 0.4764 0.4784 0.4435 0.0514 -1.2369
Commercial 0.7038 0.7043 0.5243 0.5136 0.1808 0.1787 0.0277 -0.1293
0.6472 0.6511 0.3919 0.4215 0.1588 0.1647 -0.0182 -0.1499
Cooperative 0.7520 0.7468 0.6135 0.5836 -0.0222 -0.0172 -0.1359 -0.0838
0.6750 0.6783 0.3955 0.4209 -0.0054 -0.0061 -0.0885 -0.0538
Finance Companies 0.6175 0.6179 0.4056 0.4305 0.4078 0.3945 0.0933 -0.3399
0.5762 0.5805 0.4343 0.4736 0.4159 0.4285 0.2783 -0.2851
Investment & Trust Corp. 0.5903 0.6303 0.3673 0.3803 0.2091 0.1711 -0.7210 -0.7221
0.4616 0.4866 0.3622 0.4028 0.7416 0.7255 0.5737 -0.4238
Investment 0.6707 0.6767 0.4354 0.4506 0.2622 0.2566 -0.0711 -0.2386
0.6026 0.6047 0.4227 0.4401 0.2222 0.2437 0.0019 -0.3103
Private Banking & Asset Mgt 0.7088 0.7116 0.4746 0.4725 0.1827 0.1631 0.0995 -0.0206
0.6657 0.6663 0.4286 0.4490 -0.0103 -0.0180 -0.0169 -0.1437
Real Estate & Mortgage 0.6353 0.6425 0.4823 0.4760 0.4021 0.3495 -0.0140 -0.3712
0.5655 0.5741 0.3555 0.3837 0.4547 0.4281 0.1755 -0.1099
Savings 0.7382 0.7349 0.6069 0.5792 0.0183 0.0140 -0.1313 -0.0860
0.6598 0.6628 0.3882 0.4079 0.0818 0.0800 -0.0432 0.0342
Securities 0.7380 0.7324 0.4581 0.4364 0.1462 0.1215 -0.3376 -1.1362
0.5858 0.5807 0.4102 0.4309 0.3845 0.3825 0.0254 -1.2499
Specialized Governmental
Credit
0.6704 0.6735 0.5072 0.5114 0.3548 0.2855 0.0714 -0.3205
0.4863 0.4925 0.2634 0.2936 0.2388 0.2526 0.0616 -0.5860
Asset class 1 (0-222.78)) 0.7286 0.7243 0.5547 0.5443 0.0798 0.0777 -0.0745 -0.0791
0.6584 0.6624 0.3955 0.4266 0.0596 0.0590 -0.0309 -0.1227
Asset class 2 (222.78-710.56) 0.7412 0.7376 0.5867 0.5652 0.0391 0.0422 -0.0934 -0.0803
0.6565 0.6590 0.3918 0.4149 0.0446 0.0491 -0.0338 -0.0219
Asset class 3 (710.56-3033.95) 0.7087 0.7083 0.5618 0.5475 0.1228 0.1151 -0.0624 -0.1005
0.6426 0.6466 0.3991 0.4190 0.1855 0.1825 0.0362 0.0160
Asset class 4 (3033.95-) 0.7051 0.7054 0.5586 0.5464 0.1269 0.1177 -0.0793 -0.2644
0.6313 0.6353 0.3843 0.4124 0.1427 0.1432 -0.0641 -0.2509
The table reports averaged cost and profit efficiency scores for every bank type and asset size class. For space considerations we include only those truncated versions of
REM and DFA (at 5% of each distribution tail) that they are closer with each other in levels; TFA and TFA-Y produce average and time-varying scores, respectively.
The IA and VA approach produce scores that appear in the first and second row for every combination of bank type and frontier methodology.

240
7.5. Scale economies
As a next step, the analysis moves on the examination of whether and to what extent,
banks are operating in efficient scale. Previous empirical studies of Altunbas et al.
(1996) and Cavallo and Rossi (2001) found limited, though many unexploited, scale
economies in banks of small size and no significance in cost complementarities.
Along the lines of Mester (1997) and Altunbas et al. (2001), we estimate scale
economies for each banking market per year by using the model parameters of the
employed methodologies and output-input definition approaches. In so doing, by
taking the partial derivative of total cost with respect to bank output we come up with
the cost elasticity that is evaluated at the mean bank output, input and equity capital
levels for every single asset class.
SEi,t 1 lnTC
lnQi i i, j lnQi
j
i
i
i
i, j lnWi
j
i
4,i lnEi
(7.8)
SEi,t 2 lnTC
lnQi i i, j lnQi
j
i
i
i
i, j lnWi
j
i
(7.9)
We have increasing returns of scale when SE get values less than unity SE 1 ,
constant returns of scale when SE equal unity SE 1 and decreasing returns of scale
if SE are more than unity SE 1 . Hence, we report in the following table scale
economies averaged by country from 2003 to 2008 under both intermediation and
value-added approach (table 17). At a first glance, we see that they are fully exploited,
if not over exploited so as to allege about diseconomies of scale. Nevertheless, there
exists a pattern of convergence or variation around the mean of unity; that is, in the
case of increasing returns of scale in Romania, Netherlands and France at the
beginning of the period, the tendency leans towards full employment of scale
dynamics as far as potential diseconomies strive for managerial correction. In
contrast, the majority of European banking industries starts off with decreasing scale
returns and, eventually, gets closer to constant scale economies.

241
Table 17: Scale economies by country
2003 2004 2005 2006 2007 2008 2003 2004 2005 2006 2007 2008
Intermediation approach Value-added approach
Austria 1.0899 1.0431 1.0807 1.0098 0.9681 0.9741 0.9558 0.9955 0.9951 0.9880 0.9653 0.9634
Belgium 0.9900 0.9972 0.9547 1.0583 1.0266 1.0149 1.0010 0.9864 0.9798 1.0045 1.0060 1.0334
Denmark 1.0249 1.0171 0.9967 1.0482 1.0187 1.0164 0.9605 0.9632 0.9649 0.9913 0.9897 1.0226
Finland 0.9920 0.9178 1.0744 1.0192 1.0231 0.9395 0.9579 1.0081 1.0300 1.0524
France 0.9620 0.9938 0.9615 1.0572 1.0195 1.0263 0.9946 0.9521 0.9617 0.9991 1.0118 1.0307
Germany 1.0484 1.0245 1.0489 0.9988 0.9782 0.9874 0.9734 0.9838 0.9871 0.9894 0.9714 0.9767
Greece 1.0866 1.0352 1.0262 1.0450 0.9914 0.9916 0.9598 0.9662 0.9803 0.9956 1.0023 0.9963
Ireland 1.2272 1.0515 1.0501 1.0785 1.0346 0.9900 0.9278 1.0236 1.0261 1.0054 0.9894 1.0387
Italy 1.0751 0.9873 1.0464 1.0480 1.0027 0.9763 0.9171 0.9457 0.9776 0.9862 0.9733 0.9684
Luxembourg 1.0088 0.9833 0.9893 1.0203 0.9998 1.0245 1.0115 0.9981 0.9902 1.0056 0.9864 1.0352
Netherlands 0.9709 1.0063 0.9701 1.0262 1.0096 1.0263 0.9671 0.9619 0.9751 1.0034 1.0157 1.0499
Portugal 1.0836 1.0300 1.0189 1.0490 1.0056 0.9945 0.9531 0.9634 0.9776 0.9962 0.9984 1.0015
Spain 1.0207 1.0875 1.1201 1.0391 0.9621 0.9340 0.9673 0.9949 1.0035 0.9855 0.9693 0.9308
Sweden 1.0581 1.0406 1.0107 1.0722 1.0321 1.0078 0.9544 0.9550 0.9578 0.9865 0.9854 0.9927
UK 0.9785 0.9924 0.9690 1.0536 1.0203 1.0169 1.0221 0.9685 0.9729 1.0002 1.0013 1.0295
EU-15 1.0446 1.0188 1.0107 1.0452 1.0059 1.0003 0.9690 0.9732 0.9805 0.9963 0.9931 1.0081
Bulgaria 1.0290 1.0244 1.0540 1.0138 0.9687 0.9832 0.9539 0.9713 0.9742 0.9871 0.9795 0.9580
Cyprus 1.0271 1.0249 1.0435 1.0151 0.9939 0.9670 0.9723 0.9809 0.9947 0.9917 0.9801 0.9676
Czech R. 1.0069 1.0355 1.0297 1.0505 0.9955 0.9770 0.9806 0.9739 0.9842 0.9926 0.9899 0.9839
Estonia 1.0042 1.0130 0.9941 1.1261 1.0312 1.0100 0.9487 0.9614 0.9460 0.9877 0.9879 0.9990
Hungary 0.9966 1.0150 0.9931 1.0548 1.0110 1.0402 0.9779 0.9568 0.9609 0.9935 1.0067 1.0466
Latvia 1.0521 1.0354 1.0368 1.0490 0.9872 0.9966 0.9575 0.9918 0.9731 0.9919 0.9804 0.9832
Lithuania 1.1097 1.0547 1.0833 1.0170 0.9557 0.9891 0.9198 0.9819 0.9886 0.9872 0.9800 0.9821
Malta 1.0524 1.0533 1.0831 1.0726 0.9887 0.9807 0.9512 1.0290 1.0164 0.9978 0.9667 0.9915
Poland 1.0037 0.9988 0.9778 1.0619 1.0122 1.0335 1.0033 0.9634 0.9764 1.0003 1.0082 1.0277
Romania 0.9804 0.9801 0.9886 1.0812 0.9944 1.0107 0.9640 0.9566 0.9557 0.9882 1.0059 0.9801
Slovakia 1.0425 1.0004 1.0056 1.0436 0.9966 1.0015 0.9624 0.9811 0.9783 0.9988 1.0018 1.0056
Slovenia 1.0294 1.0459 1.0666 1.0138 0.9637 0.9618 0.9599 0.9838 0.9881 0.9894 0.9845 0.9534
EU-12 1.0278 1.0235 1.0297 1.0500 0.9916 0.9959 0.9626 0.9777 0.9780 0.9922 0.9893 0.9899
The table reports (average) time-varying economies of scale for every European country under IA and VA approaches. The average values are deflated by the number of banks
operating within each banking market.

242
If we compare the results with those of value-added approach, there is a considerable
discrepancy in the measurement of scale economies. In fact, we hardly observe a
country that is above the threshold of unity with the exception of Belgium,
Luxembourg, UK and Poland. By and large, scale economies take values between the
range of 0.015 and 0.083 implying that 100% increase in bank outputs tend to inflate
total costs by 98.5% and 91.7%, respectively. Between the developed and developing
banking markets, differences in scale economies are on average 0.6% and evolve over
time by at most 1.2%. Italy, Finland, Estonia, Austria and Spain share the best scores
throughout the whole period with an escalation traced in 2006 and 2007 before it
settles in 2008. The results alo endorse the persistent scale economies found by
Pasiouras (2008a) in Greece (only under VA approach) and those of several countries
included in the studies of Altunbas and Molyneux (1996) and Carvallo and Rossi
(2001), though not robustly over both approaches.
From a micro-level perspective, we identify under the intermediation approach the
highest average of scale economies in investment banks and securities firms although
all bank types experience decreasing scale returns at some point in time (table 18). To
the contrary, the value-added approach turns out to produce increasing scale
economies in cooperative banks and finance companies followed by savings banks.
On the other side of the spectrum, under intermediation approach decreasing scale
economies (on average terms) are evident in specialized credit institutions, investment
and trust corporations. In contrast, securities banks and bank holding and holding
companies operate with scale diseconomies as far as the value-added approach
verifies the tendency. Notwithstanding the relative rankings of banking markets are
identical when efficiency scores are clustered by country, the underlying similarity
does not hold for different productive specialisations.
That is due to the way we define bank outputs and inputs in the applied cost function.
Intermediation approach, which has been widely used in empirical studies, defines
banks operation as transforming financial resources into loans and other investments.
In so doing, this approach overlooks bank production in terms of earning assets and
deposits (Aly et al., 1990; Berger and Humphrey, 1991). The latter issue as well as
any important output, which comes out of the contribution of labour and capital is

243
accounted for by value-added approach27
. Thus, both approaches see banks from a
different perspective, according to whether and to what extent banks are specialized to
alternative assets; in particular, no allowance of deposits make IA pick up
diseconomies of scale in banks whose outputs are not well specified in the cost
function. Along the lines of VAA, scale economies are higher in those financial
institutions that engage strategically in securities and other earning assets.
As the literature draws remarks regarding the existence of scale economies on
particular asset classes, there seems to be evident in the US territory (Hughes and
Mester, 1998; Jagtiani et al., 1995; Evanoff et al., 1990) and particularly in smaller-
sized banks (Berger and Humphrey, 1994; Gilligan and Smirlock, 1984; MacAllister
and MacManus, 1993; Goldberg et al., 1991). We corroborate similar results as Fries
and Taci (2005) did for Europe exclusively though under value-added approach in our
case. Besides, economies of scale are common in the European Union (under VA
approach) across all asset classes in samples of several developed economies
(Altunbas and Molyneux, 1996; Carvallo and Rossi, 2001), in France (Dermine and
Roller, 1992), Norway (Humphrey and Vale, 2004).
It seems that we verify about „moderate scale economies‟ in Germany as Lang and
Welzel did for the period 1989-1992, and „less than 5% scale economies‟ over the
whole period and across all productive specialisations and countries in line with the
findings of Berger and Humphrey (1991) for the US market in 1984. We should also
note that the quantile of the largest asset size depletes in scale economies after 2005,
since when IA approach shows some scale economies at below 1% level.
27
Other studies dealing with value-added approach are Olivei (1992), Resti (1993) and Berg et al.
(1993), among others.

244
Table 18: Scale economies by bank type and asset class
2003 2004 2005 2006 2007 2008 2003 2004 2005 2006 2007 2008
Intermediation approach Value-added approach
Bank Holding & Holding Companies 0.9734 0.9864 0.9674 1.0376 1.0066 1.0272 1.0001 0.9647 0.9823 1.0075 1.0221 1.0563
Clearing Institutions & Custody 1.0194 0.9780 0.8953 1.0891 1.0109 1.0218 1.0283 0.9665 0.9635 1.0155 1.0036 1.0438
Commercial 0.9943 1.0030 0.9931 1.0426 1.0075 1.0123 0.9888 0.9718 0.9747 0.9973 0.9959 1.0170
Cooperative 1.0772 1.0375 1.0701 1.0103 0.9768 0.9703 0.9617 0.9893 0.9874 0.9853 0.9631 0.9559
Finance Companies 0.9865 1.0034 0.9464 1.0836 1.0385 1.0425 0.9427 0.9208 0.9315 0.9877 1.0229 1.0159
Investment & Trust Corp. 0.9965 1.0422 1.0820 1.1499 1.0239 1.0430 0.9886 0.9888 0.9864 0.9950 0.9822 1.0459
Investment 0.8641 0.9481 0.9208 1.0700 1.0446 1.0585 1.0174 0.9498 0.9540 1.0049 1.0158 1.0599
Private Banking & Asset Mgt 0.9546 0.9392 0.8928 1.0458 1.0511 1.0771 1.0037 0.9507 0.9452 1.0018 1.0148 1.0722
Real Estate & Mortgage 1.0656 1.0457 1.0620 1.0265 1.0027 0.9785 0.9898 0.9742 0.9997 0.9877 0.9744 0.9881
Savings 1.0526 1.0388 1.0638 1.0119 0.9761 0.9757 0.9710 0.9868 0.9927 0.9896 0.9751 0.9727
Securities 0.9145 0.8897 0.8402 1.0948 1.0741 1.0940 1.0324 0.9644 0.9394 1.0188 1.0297 1.1003
Specialized Governmental Credit 1.0751 1.0272 0.9865 1.0708 1.0337 0.9950 1.0064 0.9926 0.9828 0.9978 0.9916 1.0221
Asset class 1 (0-222.78) 1.0798 1.0194 1.0438 1.0251 0.9995 0.9912 0.9631 0.9824 0.9746 0.9840 0.9615 0.9661
Asset class 2 (222.78-710.56) 1.0531 1.0222 1.0475 1.0148 0.9836 0.9855 0.9676 0.9836 0.9819 0.9878 0.9709 0.9721
Asset class 3 (710.56-3033.95) 1.0342 1.0260 1.0408 1.0247 0.9858 0.9887 0.9756 0.9782 0.9836 0.9910 0.9819 0.9844
Asset class 4 (3033.95-) 0.9967 1.0218 1.0154 1.0344 0.9957 0.9926 0.9948 0.9769 0.9909 1.0001 1.0020 1.0144
The table reports time-varying economies of scale for every bank type and asset size class under IA and VA approaches.

245
7.6. Convergence
The concepts of growth convergence in terms of β (beta) and σ (sigma) methods of
Barro and Sala-i-Martin (1992) and Sala-i-Martin (1996) are very well known in the
cross-country comparisons of GDP convergence in the literature. Expressed in terms of
bank efficiency, it takes the following form approximately,
ln effs,t 1 ln effs,t1 us,t (7.10)
where effi,t and effi,t-1 are respectively the means of bank efficiency scores of countries
s 1,...,N during the period 2003-2008. β-convergence is reflected by the significant
negative coefficient of β lying in the range 0,1 . We opt to employ a lagged
dependent variable to compare the results as to whether there are any dynamic
effects28
. The former regresses growth rates on its initial levels implying that banks
with low efficiency demonstrate higher rates of growth as convergence comes along to
make up for the lag.
Following panel data specification of Canova and Marcet (1995), we further extend it
by employing country fixed effects and a lagged dependent variable,
lneffs,t
effs,t1
ln effs,t1 ln
effs,t1
effs,t2
s
s
D us,t (7.11)
where Di the country dummies to capture a portion of fixed effects in the sample and
us,t the error term. Quah (1996) pointed out the conceptual limitation of the latter as it
implies that low efficient banks are growing faster and surpass in performance the
more efficient ones ending up, therefore, with no convergent tendency at all. In
addition, it can by no means identify how the efficiency trend is dispersed across
countries.
28
We use only OLS as two-step dynamic GMM methodology needs greater time dimension, especially
in our case where the respective test (estat abond) of zero autocorrelation in first-differenced errors
highlights zero p-values for higher than two-order autocorrelation.

246
That dispersion implies the evolution of variance as a function of its lagged values and
the β-convergence itself, as our sample comprises a large enough number of banks (N)
to imply that sample variance is close to the population variance. Hence, from equation
(7.10), we derive
(7.12)
and steady-state variance as
*2 u
2
1 1 2
. (7.13)
We substitute in equation (7.12) u
2from equation (7.13) to get,
(7.14)
As we can see, β-convergence is an important factor of σ-convergence, which settles in
equilibrium as β and u
2 are getting higher and lower values, respectively. We now
turn to empirically estimate σ-convergence with the application of pooled OLS in the
following model29
:
effs,t efft effs,t1 efft1
effs,t1 efft1
effs,t1 efft1 effs,t2 efft2
s
s
D us,t
(7.15)
29
Mamatzakis et al., 2008) regress the standard deviation of efficiency scores on a time trend to see
whether its (negative) coefficient is indicative of convergence. However, such methodology requires the
efficiency scores to be estimated under the same frontier through SFA. Alternatively, Weill (2009)
employs SFA under the Iterated Seemingly Unrelated Regression (ITSUR) framework.

247
where effs.t is cost (or profit) efficiency of country s 1,...,27 at t 1,...,6 , efft the
average efficiency of the EU-27 at time t, and us,t the standard error term. Convergence
does exist if β is statistically significant and negative converging from effs,t1 to
efft either estimating the lagged dependent variable (γ parameter) or not. All efficiency
scores are expressed in their natural logarithm and produced by TFA that allows for
time varying scores at the bank level each year. All the rest methodologies estimate
average scores of banks throughout the whole period and, thus, confine the analysis of
convergence30
.
Table 19 reports whether it is a case of β-convergence for cost efficiency in the
European Union under both intermediation and value-added approach. Equation (7.11)
endorses the tendency of convergence in cost efficiency scores under both approaches
(IA, VA) between the range 55.1% and 89.6%. The ADL model identifies significance
in the positive effect of lagged dependent variable as β-coefficient maintains its
converging pattern at about 35.9% to 78.7%. Moreover, we come up with converging
dispersion of cost efficiency scores ranging from 59.1% to 97.9%, (under OLS) as
soon as the lagged regressor absorbs dynamic effects and thereby shortens the
underlying bound to [56.3%, 86.4%]. The results are in line with Mamatzakis et al.
(2008) and Weill (2009), who examined Europe during a period that covers before and
after the time of EMU.
30
Other studies (e.g. Weill, 2008) run regressions on different sub-periods in the form of (e.g.) 2003-
2005, 2006-2008, 2009-2011, so as to construct a sufficient time dimension of averaged efficiency
scores; however, our small sample period rules out any such possibility.

248
Table 19: β-convergence and σ-convergence of cost efficiency
β-convergence σ-convergence
IA VA IA VA
α -0.299*** -0.778*** 0.034*** -0.004***
(0.003) (0.006) (0.002) (0.001)
β -0.551*** -0.896*** -0.591*** -0.979***
(0.007) (0.007) (0.007) (0.007)
Country dummies YES YES YES YES
R-squared 0.5336 0.7202 0.6142 0.7548
Obs 12667 12667 12667 12667
Autoregressive Distributed Lag model
α -0.415*** -0.312*** 0.060*** -0.013***
(0.005) (0.016) (0.002) (0.001)
β -0.787*** -0.359*** -0.864*** -0.563***
(0.010) (0.019) (0.013) (0.019)
γ - AR(1) 0.292*** 0.052*** 0.284*** 0.156***
(0.008) (0.004) (0.008) (0.004)
Country dummies YES YES YES YES
R-squared 0.6313 0.3636 0.6443 0.5007
Obs 10132 10132 10132 10132
We run pooled OLS with robust standard errors and AR(1) specification along with sampling
weights at the country level as some banking markets are asymmetrically represented; IA:
intermediation approach, VA: value-added approach; Standard deviation are reported in
parentheses denoting *, **, *** for significance at 10%, 5% and 1% level, respectively.
In table 20, we document the evidence from pooled OLS with robust standard errors
and an autoregressive distributed lag specification of order one to pick up, if any,
dynamic effects. Sampling weights are also employed at the country level to account
for the dominance of some markets (e.g. Germany) in the sample; otherwise we come
up with significance of unit roots and false sign changes (particularly in σ-
convergence).
In fact, IA approach shows a stable „catch-up effect‟ at 88.9%, which turns to 110.1%
under VA approach and even higher values in the ADL model. Similarly, efficiency
dispersion converge as well at 85.5% and 98.1% according to IA and VA approaches
notwithstanding the inclusion of lagged dependent variable decomposes σ-convergence
into positive AR(1) effect and negative β-parameter at unstable (>1) and economically
meaningless pace. That is due to the theoretical definition of β taking values between
the range [0,1] as it is conceptually close to income per capita convergence. Above-
unity values are possible if there are negative values31
and imply that previous values
31
Negative values of profit efficiency are addressed in the literature as a possibility, but once we intend
to investigate convergence dynamics we should express efficiency scores in natural logarithms. Hence,
if we just make the relative transformations the regression output will be misleading on the grounds that

249
of profit efficiency are negatively related to current levels, which potentially drive
panel series to oscillation between negative to positive values period by period.
However, this unstable tendency of ADL specification is mitigated by the positive
impetus of the lagged dependent variable.
Table 20: β-convergence and σ-convergence of profit efficiency
β-convergence σ-convergence
IA VA IA VA
α 1.013*** 1.709*** 0.956*** 1.477***
(0.050) (0.054) (0.038) (0.028)
β -0.889*** -1.101*** -0.855*** -0.981***
(0.044) (0.035) (0.035) (0.019)
Country dummies YES YES YES YES
R-squared 0.5185 0.6296 0.5210 0.5895
Obs 12667 12667 12667 12667
Autoregressive distributed Lag model
α 1.450*** 1.715*** 1.381*** 1.858***
(0.076) (0.042) (0.057) (0.027)
β -1.274*** -1.105*** -1.239*** -1.235***
(0.067) (0.027) (0.052) (0.018)
γ - AR(1) 0.329*** 0.166*** 0.332*** 0.333***
(0.052) (0.014) (0.047) (0.010)
Country dummies YES YES YES YES
R-squared 0.4658 0.7874 0.4933 0.7265
Obs 10132 10132 10132 10132
We run pooled OLS with robust standard errors and AR(1) specification along with sampling
weights at the country level as some banking markets are asymmetrically represented; IA:
intermediation approach, VA: value-added approach; Standard deviation are reported in
parentheses denoting *, **, *** for significance at 10%, 5% and 1% level, respectively.
The converging dispersion of profit efficiency does not verify the evidence of
Mamatzakis et al. (2008), according to which only cost efficiency demonstrates β and
σ-convergence. However, the next section gives some credit to the lagging-behind
pattern of EU-15 over the years 2004-2005 (particularly under IA approach) and 2007-
2008, exactly when efficiency dispersion settles down significantly.
negative values become missing as inconvertible. Therefore, we opt to rescale them according to the
standard practice of rescaling total profits as a dependent variable in a profit function:
ln eff effmin 1 .

250
7.7. Other stylized facts
Other measures on the symmetry of efficiency distribution that can provide further
information on the way convergence evolves since 2003 are skewness and kurtosis. We
also decompose average cost and profit efficiencies into the respective scores of its two
constituent sub-regions, namely the developed EU-15 and developing EU-12. In
addition, the notion of equality in the efficiency convergence by means of Theil and
Gini index facilitates whether convergence comes along with (in)equality of banking
markets in cost and profit efficiency.
Graph 2: Kernel Density of cost/profit efficiency under IA/VA approaches
Graph 2 summarizes in a snapshot how the kernel density of efficiency scores shifted
during the period. The distribution of cost had the level of its peak lowered
(diminishing kurtosis) by 23.3% and 32.6% according to IA and VA approaches,
respectively. Furthermore, the asymmetry of the probability function changed in shape

251
from right leaning Skewness2003 0.451 to left-leaning Skewness2008 1.172
tails; VA approach highlights the same tendency albeit towards normality (non-
negative skewness). On the contrary, profit efficiency gets a sharper peak across both
IA and VA approaches and the left tail seems quite long and thin enough to cover up a
small portion of financial institutions that forego 100% of potential profits.
Gini and Theil coefficients32
are alternative measures of statistical dispersion within
the range [0,1], with higher values effectively highlighting inequality amongst the
efficiency scores of their respective frequency distribution (see table 21). According to
VA approach, the evolution of equality seems to deteriorate up until 2006 whence it
gains ground as far as the onset of the financial crisis. In contrast, IA approach
identifies this „arched‟ path of equality, which diminishes in the advent of Euro, then
settles down during the period 2005-2006 and exacerbates back again thereafter. Thus,
although it turns out that ups and downs take place throughout the period, once we
compare the first and last year of the underlying period (even the year before),
inequality is evident over the whole European region.
Moreover, there is one question not addressed so far in the analysis: which banking
markets make the beta and sigma convergence be verified empirically on the realistic
presumption that there must exist centrifugal forces? And which are those? By and
large, the dispersion of cost and profit efficiency under both approaches attests
convergence during 2004-2005 and 2007-2008; that tendency is also indicative in some
banking industries even in 2003 and 2006, notwithstanding it is surpassed in the
aggregate.
Utilising the common pick-ups of both approaches (IA, VA), Austria, Denmark,
Portugal and Netherlands appear as out of the convergent pace experiencing a
reduction between 8.16% and 25.3%; in the other extreme, Italy, Germany, Romania
and Slovakia enhance their average cost efficiency by more than 16.9%. Belgium,
Germany, Sweden and UK stand out with considerable efficiency dispersion increased
at most by 66.5% throughout the whole period, during which we see plummeting in the
standard deviation of cost efficiency scores within the bound [-66.5%, -8.3%].
32
They are both applied in cost efficiency scores only, as profit efficiency lies on average below zero
thereby driving Gini and Theil indexes off their theoretical bound.

252
Belgium, Cyprus and Slovakia outpace the poor performance of Italy, Sweden, Malta
and Estonia in the β-convergence of profit efficiency. Sigma convergence is also
verified by the best performance of Greece, Italy and Slovakia, which counterbalances
that of Denmark, Spain, Cyprus and Malta. The reason why some of the
aforementioned countries do not perform beta and sigma convergence concurrently lies
in the equations (7.12)-(7.14) as Young et al (2008) argue about. In fact, the beta
coefficient depicts how fast a banking market regains its footing after a shock. When
such random events occur, their persistence is contingent upon the speed of
convergence to the steady-state variance. Hence, under β-convergence the initial levels
of efficiency dispersion govern the sign of adjustment towards a balanced growth path.
In other words, if the initial level of dispersion is high (low) relatively to the variance
of a random shock, then the convergence pattern takes place from above (below). That
is also consistent with the extent to which shock variance within the sample is widely
different from the population variance of shocks even if many N banks asymptotically
justify population inference.
There may be other reasons for the discrepancy between β and σ convergence. As our
sample comprises countries of different economic and institutional development, the
adoption of Euro identify banking sectors starting from different positions vis-à-vis
their balanced growth path. Alongside (beta) converging markets of similar efficiency
level, it might be the case that a market lagging considerably behind in the beginning is
bound to increase t
2much more than another that lies close to its balanced growth
path. Less likely, the dispersion of balanced growth paths ( *2 ) could get higher levels
in contrast with the ongoing institutional homogeneity of the European Union.
All the aforementioned reasons may effectively construe a divergent propensity
between efficiency catching-up and dispersion across certain markets or time periods.
However, in our analysis the tendency stands robustly convergent in the aggregate
although there exists some sort of centrifugal tendency.

253
Table 21: Distribution of cost/profit efficiency
2003 2004 2005 2006 2007 2008
Cost efficiency mean (EU) 0.517 0.508 0.499 0.531 0.530 0.495
(IA) mean (EU-15) 0.468 0.467 0.454 0.502 0.508 0.457
mean (EU-12) 0.451 0.431 0.442 0.502 0.521 0.470
s.d. (EU) 0.142 0.147 0.139 0.150 0.155 0.146
s.d. (EU-15) 0.126 0.141 0.122 0.135 0.144 0.127
s.d. (EU-12) 0.136 0.130 0.126 0.142 0.144 0.115
skewness 0.451 0.011 -0.402 -0.318 -0.905 -1.172
kurtosis 7.259 5.863 5.481 6.270 5.828 5.564
Gini 0.111 0.153 0.132 0.116 0.126 0.131
Theil 0.026 0.033 0.035 0.028 0.036 0.039
Cost efficiency mean (EU) 0.413 0.423 0.440 0.447 0.457 0.455
(VA) mean (EU-15) 0.410 0.444 0.453 0.462 0.447 0.448
mean (EU-12) 0.417 0.397 0.424 0.429 0.470 0.464
s.d. (EU) 0.160 0.154 0.151 0.159 0.161 0.161
s.d. (EU-15) 0.165 0.165 0.150 0.161 0.156 0.165
s.d. (EU-12) 0.154 0.141 0.153 0.155 0.168 0.156
skewness 1.666 1.775 1.809 1.171 0.937 1.020
kurtosis 10.762 9.263 8.961 7.245 7.775 7.245
Gini 0.141 0.159 0.159 0.162 0.151 0.149
Theil 0.040 0.049 0.048 0.049 0.046 0.043
Profit efficiency mean (EU) -0.095 -0.194 -0.176 -0.137 -0.124 -0.215
(IA) mean (EU-15) -0.180 -0.236 -0.181 -0.145 -0.210 -0.309
mean (EU-12) 0.004 -0.142 -0.169 -0.127 -0.017 -0.099
s.d. (EU) 0.584 0.623 0.559 0.632 0.622 0.687
s.d. (EU-15) 0.716 0.669 0.617 0.682 0.717 0.812
s.d. (EU-12) 0.431 0.565 0.486 0.571 0.504 0.532
skewness -4.653 -4.494 -4.425 -3.769 -3.928 -4.612
kurtosis 40.750 36.015 36.454 30.980 31.079 35.078
Profit efficiency mean (EU) -0.145 -0.378 -0.324 -0.206 -0.224 -0.312
(VA) mean (EU-15) 0.117 -0.087 -0.061 -0.100 -0.013 -0.087
mean (EU-12) 0.585 0.696 0.708 0.725 0.660 0.816
s.d. (EU) 0.681 0.774 0.800 0.748 0.754 0.943
s.d. (EU-15) 0.480 0.599 0.594 0.696 0.543 0.657
s.d. (EU-12) 0.560 0.651 0.649 0.645 0.624 0.732
skewness -3.866 -4.159 -3.860 -3.690 -3.859 -4.560
kurtosis 31.173 29.010 27.576 25.797 25.185 33.503
The table reports averaged values of the mean, standard deviation, skewness and kurtosis of cost/profit
distribution under IA/VA approach along with alternative measures of equality in cost efficiency scores, namely
the Gini and Theil index.
254
7.8. Conclusion
Our study aims to contribute to the literature that compares alternative parametric
methodologies of estimating profit and cost efficiency under widely employed
definitions of bank inputs/outputs, namely the intermediation and value-added
approach. Hence, we applied REM, DFA and TFA methodologies along with
differently truncated versions of them at 1%, 5% and 10% level of their distribution
tails in order to produce averaged efficiency scores at the bank level. Only the
specification of TFA estimated for each year enables us to utilize time-varying
efficiency scores of differently specialized financial institutions over the period 2003-
2008 for the enlarged EU-27 region.
We conclude that all methodologies turn out to produce different levels of efficiency
although they may be comparable if we juxtapose their truncated specifications.
Interestingly, the relative rankings of banking markets and asset classes with respect to
their averaged cost/profit efficiency are almost identical across all approaches; in
contrast, that is not the case for different productive specializations. According to the
latter, cost efficiency is prevalent in the developed European region and in
evolutionary dominating pace over that of EU-12; however, the developing sub-group
has experienced persistently higher profit efficiency reaping the benefits of their better
opportunities for operational expansion.
Next we estimate annual scale economies for every banking market and observe
considerable discrepancies between their average values. Apart from few exceptions33
in the analysis, both approaches start from different points, that is IA approach comes
from above to converge eventually to the unity level in 2008, while VA approach
identifies increasing scale economies at the beginning of the period and then settles to
full scale exploitation.
Last, we end up with significant „catching-up effect‟ and converging dispersion of cost
efficiency scores under both IA and VA approaches and dynamic specifications. Profit
efficiency demonstrates the same converging pattern at even higher levels albeit
beta/sigma convergence is clearly evident in so far ADL specification allows for
dynamic effects. Above-unity cases if assessed individually make little economic sense
33
Belgium, Luxembourg, United Kingdom and Poland.

255
as highlighting efficiency series fluctuate between negative and positive values year by
year. However, that pattern is counterbalanced by the positive bearing of AR(1)
variable.
Last, we also verify inequality amongst the cost efficiency scores within their
frequency distribution, while IA (VA) approach shows increasing (decreasing) path
until 2006 and exacerbates (ameliorates) thereafter.

256
Chapter 7 appendix
Table of reviewed papers
Literature on
Methodology comparison Period Countries Methodology Evidence
Bauer et al. (1998) 1977-1988 US DEA, SFA,
TFA, DFA
Consistency among parametric
approaches, and nonparametric
approaches
Inconsistency between
parametric and nonparametric
approaches.
Casu et al. (2004) 1994-2000
France,
Germany,
Italy, Spain,
UK
DEA (TFP),
TFA „Not markedly different results‟
Cummins and Zi (1998) 1988-1992
US life
insurance
industry
DEA, FDH,
DFA
Differences between DEA and
FDH, and between econometric
and mathematical programming
methods
Delis et al. (2009) 1993-2005 Greece SFA, DEA
Differences between parametric
(lower inefficiency) and non-
parametric approaches
Huang and Wang (2002) 1982-1997 Taiwan SFA, DFA,
DEA
Consistency among parametric
approaches, and nonparametric
approaches
Inconsistency between
parametric and nonparametric
approaches.
Maudos et al. (2002) 1993-1996 EU DFA, FEM,
REM Similar country rankings
Weill (2004a) 1992-1998
France,
Germany,
Italy, Spain,
Switzerland
SFA, DFA,
DEA
Correlation between SFA and
DFA
No relationship between
SFA/DFA and DEA
Literature on Cost-Profit
efficiency Period Country Methodology More efficient on
Ariff and Can (2008) 1995-2004 China DEA Cost
Bonin et al. (2005) 1996-2000 EU SFA Cost

257
developing
countries
Isik and Hasan (2002) 1988- 1996 Turkey SFA Profit
Maudos and Pastor (2003) 1985-1996 Spain DEA Cost
Maudos et al. (2002) 1993-1996 EU DFA, FEM,
REM Cost
Mertens and Urga (2001) 1998 Ukraine SFA, TFA Profit (SFA)
Cost (TFA)
Pasiouras et al. (2009) 2000-2004 74 countries SFA Cost
Vennet (2002) 1995-1996 EU SFA
Cost (+OBS)
Profit (Financial conglomerates,
non-German universal and
specialized banks
Maudos and Pastor (2001) 1984-1995 EU, Japan,
US SFA Cost
Bader et al. (2008) 1990-2005
21 countries
(Africa,
Asia, Middle
East)
DEA Cost
Berger and Mester (1999) 1991-1997 US
Berger et al (2009) 1994-2003 China SFA Cost
Das and Ghosh (2009) 1992-2004 India DEA Cost
Kasman and Yildirim (2006) 1995-2002 EU SFA Cost
Ray and Das (2010) 1997-2003 India DEA Cost
Srairi (2010) 1999-2007
Gulf
cooperation
council
countries
SFA Cost
Profit (Oman)
Yildirim and Philippatos
(2007b) 1993-2000
EU
(developing
countries)
SFA, DFA Cost
Literature on IA-VA
approaches Period Country Methodology Evidence
Glass et al. (1998) 1977-1993 Japan
Pulley and
Braunstein
(1992)
Better fit of VA approach
Mixed results between scale and
scope economies
258
Suflan (2009) 1995-1999 Malaysia DEA
Greater average technical and
scale efficiency under VA
approach
Tortosa-Ausina (2002) 1985-1997 Spain DEA Higher and more stable efficiency
scores under VA approach.
Literature on Scale
economies Period Country Methodology Evidence
Fries and Taci (2005) 1994-2001 15 East EU SFA Average-sized banks: CRS
Smaller banks: scale economies
Berger et al. (1987) 1983 US
SUR model
(Production
and
intermediation
approach)
Consistent diseconomies of scale
across branching and unit state
size classes.
Hughes and Mester (1998) 1989-1990 US IA approach
plus OBS Economies of scale
Jagtiani et al. (1995) 1988 US
Christensen et
al. (1973)
IA/VA
approach
Economies of scale under IA
approach
Noulas et al. (1990) 1986 US Production/IA
approach
Economies of scale for 1-3 billion
asset size class
Diseconomies for greater sizes
Berger and Humphrey
(1994) 1980-1992 US Review
Scale economies for smaller
banks only
Gilligan and Smirlock
(1984) 1973-1978 US
Benston
(1972); Bell
and Murphy
(1968)
Scale economies for smaller
banks only
Jagtiani and Klauthavit
(1996) 1984-1991 US
Employing
dummies for
technology
and risk-based
requirements
Diseconomies for money center
and super-regional banks
Hughes et al. (2001) 1994 US
Inclusion of
capital
structure and
risk-taking in
the production
unction
Scale economies may be elusive
since potentially obscured by risk-
taking

259
Berger and Humphrey
(1991) 1984 US
TF cost
function Less than 5% scale economies
Evanoff et al. (1990) 1972-1987 US Shadow-price
model Scale economies
Altunbas and Molyneux
(1996) 1988
France,
Germany,
Italy and
Spain
Intermediation
approach
„Scale economies over a wider
range of outputs, including the
largest banks‟
Wheelock and Wilson
(2001)
1985, 1989,
1994 US
Translog,
Fourier, kernel
regression and
polynomial
smoothing
Scale economies if banks expand
their assets to 300-500$.
Evident also in banks of $1 billion
asset size.
Zardakohi and Kolari (1994) 1988 Finland IA approach
Scale economies for large branch
offices – exhausted at 2.5 million
Finn marks.
Carvallo and Rossi (2001) 1992-1997
France,
Germany,
Italy,
Netherlands,
Spain, UK
GMM
(Arellano--
Bond)
Scale economies evident in small
banks, at any production scale and
organizational type albeit
exhausted at low levels of output.
Clark (1988) Review
Gilligan et al. (1984) 1978 US Translog Scale economies only in low
output levels
Humphrey and Vale (2004) 1987-1998 Norway
Translog,
fourier
flexible, spline
Scale economies in small banks
(translog)
Scale (dis)economies evident in
smaller and larger banks when
TA used as single output.
McAllister and McManus
(1993) 1984-1990 US
Translog,
fourier
flexible,
kernel, spline
VA approach
Scale economies for banks with
less that $500 million total assets.
Dermine and Roller (1992) 1987
France
(mutual
funds)
Translog.
quadratic
Scale economies for all asset
classes under translog (higher in
smaller ones though)
Scale economies for banks with
assets more than 100 and fewer
than 2900 FF million
Goldberg et al. (1991) 1983 US Translog Scale economies in smaller,
specialized firms and
260
(securities) diseconomies in more diversified
firms.
Lang and Welzel (1996) 1989-1992 Germany
(cooperative) Translog
Moderate scale economies in all
size classes
Pasiouras (2008a) 2000-2004 Greece DEA
Persistent scale economies in
purely domestic banks
Lower scale economies in
international Greek banks
Literature on Convergence Period Sample Methodology Result
Casu and Girardone (2010) 1997-2003 EU-15
DEA (cost
efficiency)
Dynamic
models
Lagging behind rather than
catching up
Mamatzakis et al. (2008) 1998-2003 EU-10
SFA
(cost/profit
efficiency)
Some beta and sigma
convergence in cost efficiency
(only)
Fung (2006) 1996-2003 US DEA Conditional convergence among
bank holding companies
Weill (2009) 1994-2005 10 EU
(developed)
SFA (Fourier)
Robustness
checks: FE,
DFA,
production
approach
Beta and sigma convergence in
cost efficiency

261
Spearman’s rank correlation among all efficiency scores
TFA-Y
(VA)
TFA-Y
(IA) TFA (VA) TFA (IA)
DFA-90
(VA)
DFA-95
(VA)
DFA-99
(VA) DFA (VA)
DFA-90
(IA)
DFA-95
(IA) Profit efficiency
REM (IA) 1 0.7839* 0.7774* 0.6600* 0.6861* 0.6862* 0.6865* 0.6865* 0.5630* 0.5638* TFA-Y (VA)
REM-99 (IA) 1.0000* 1 0.6459* 0.7116* 0.5458* 0.5473* 0.5475* 0.5475* 0.5647* 0.5657* TFA-Y (IA)
REM-95 (IA) 1.0000* 1.0000* 1 0.8443* 0.8343* 0.8357* 0.8357* 0.8357* 0.6936* 0.6949* TFA (VA)
REM-90 (IA) 0.9996* 0.9996* 0.9996* 1 0.7726* 0.7740* 0.7740* 0.7740* 0.8055* 0.8062* TFA (IA)
REM (VA) 0.6553* 0.6553* 0.6551* 0.6540* 1 0.9995* 0.9994* 0.9994* 0.8477* 0.8481* DFA-90 (VA)
REM-99 (VA) 0.6553* 0.6553* 0.6551* 0.6540* 1.0000* 1 0.9999* 0.9999* 0.8476* 0.8483* DFA-95 (VA)
REM-95 (VA) 0.6551* 0.6551* 0.6549* 0.6538* 0.9999* 0.9999* 1 1.0000* 0.8473* 0.8481* DFA-99 (VA)
REM-90 (VA) 0.6542* 0.6542* 0.6541* 0.6532* 0.9994* 0.9994* 0.9995* 1 0.8474* 0.8481* DFA (VA)
DFA (IA) 0.9907* 0.9907* 0.9907* 0.9903* 0.6537* 0.6537* 0.6534* 0.6523* 1 0.9996* DFA-90 (IA)
DFA-99 (IA) 0.9907* 0.9907* 0.9907* 0.9903* 0.6537* 0.6537* 0.6534* 0.6523* 1.0000* 1 DFA-95 (IA)
DFA-95 (IA) 0.9907* 0.9907* 0.9907* 0.9903* 0.6535* 0.6535* 0.6533* 0.6523* 1.0000* 1.0000* DFA-99 (IA)
DFA-90 (IA) 0.9903* 0.9903* 0.9903* 0.9906* 0.6528* 0.6529* 0.6527* 0.6518* 0.9996* 0.9996* DFA (IA)
DFA (VA) 0.6534* 0.6534* 0.6532* 0.6521* 0.9966* 0.9966* 0.9965* 0.9959* 0.6533* 0.6533* REM-90 (VA)
DFA-99 (VA) 0.6534* 0.6534* 0.6532* 0.6521* 0.9966* 0.9966* 0.9965* 0.9959* 0.6533* 0.6533* REM-95 (VA)
DFA-95 (VA) 0.6531* 0.6531* 0.6529* 0.6519* 0.9965* 0.9965* 0.9965* 0.9960* 0.6530* 0.6530* REM-99 (VA)
DFA-90 (VA) 0.6525* 0.6525* 0.6523* 0.6514* 0.9959* 0.9959* 0.9960* 0.9964* 0.6522* 0.6522* REM1 (VA)
TFA (IA) 0.5381* 0.5381* 0.5378* 0.5363* 0.5317* 0.5317* 0.5317* 0.5310* 0.5432* 0.5432* REM-90 (IA)
TFA (VA) 0.6406* 0.6406* 0.6404* 0.6394* 0.9404* 0.9404* 0.9402* 0.9394* 0.6389* 0.6389* REM-95 (IA)
TFA-Y (IA) 0.6361* 0.6361* 0.6361* 0.6352* 0.3269* 0.3269* 0.3266* 0.3256* 0.6392* 0.6392* REM-99 (IA)
TFAY (VA) 0.4896* 0.4896* 0.4894* 0.4882* 0.7046* 0.7046* 0.7043* 0.7026* 0.4939* 0.4939* REM (IA)
Cost efficiency REM (IA) REM-99
(IA)
REM-95
(IA)
REM-90
(IA) REM (VA)
REM-99
(VA)
REM-95
(VA)
REM-90
(VA) DFA (IA)
DFA-99
(IA)

262
DFA-99 (IA) DFA (IA)
REM-90
(VA)
REM-95
(VA)
REM-99
(VA) REM (VA)
REM-90
(IA)
REM-95
(IA)
REM-99
(IA) REM (IA) Profit efficiency
REM (IA) 0.5638* 0.5638* 0.6776* 0.6776* 0.6777* 0.6777* 0.5585* 0.5592* 0.5593* 0.5593* TFA-Y (VA)
REM-99 (IA) 0.5658* 0.5658* 0.5353* 0.5367* 0.5368* 0.5368* 0.5448* 0.5457* 0.5459* 0.5459* TFA-Y (IA)
REM-95 (IA) 0.6950* 0.6950* 0.8260* 0.8274* 0.8275* 0.8275* 0.6887* 0.6899* 0.6902* 0.6902* TFA (VA)
REM-90 (IA) 0.8063* 0.8063* 0.7666* 0.7679* 0.7679* 0.7679* 0.7962* 0.7969* 0.7970* 0.7970* TFA (IA)
REM (VA) 0.8483* 0.8483* 0.9906* 0.9903* 0.9902* 0.9902* 0.8424* 0.8426* 0.8427* 0.8427* DFA-90 (VA)
REM-99 (VA) 0.8485* 0.8485* 0.9903* 0.9909* 0.9908* 0.9908* 0.8424* 0.8428* 0.8430* 0.8430* DFA-95 (VA)
REM-95 (VA) 0.8483* 0.8483* 0.9903* 0.9908* 0.9909* 0.9909* 0.8421* 0.8426* 0.8429* 0.8429* DFA-99 (VA)
REM-90 (VA) 0.8483* 0.8483* 0.9903* 0.9908* 0.9909* 0.9909* 0.8421* 0.8426* 0.8429* 0.8429* DFA (VA)
DFA (IA) 0.9995* 0.9995* 0.8465* 0.8462* 0.8460* 0.8461* 0.9803* 0.9802* 0.9802* 0.9802* DFA-90 (IA)
DFA-99 (IA) 1.0000* 1.0000* 0.8469* 0.8469* 0.8468* 0.8468* 0.9802* 0.9807* 0.9807* 0.9807* DFA-95 (IA)
DFA-95 (IA) 1 1.0000* 0.8470* 0.8471* 0.8470* 0.8470* 0.9802* 0.9807* 0.9807* 0.9807* DFA-99 (IA)
DFA-90 (IA) 0.9996* 1 0.8470* 0.8471* 0.8470* 0.8470* 0.9802* 0.9807* 0.9807* 0.9807* DFA (IA)
DFA (VA) 0.6532* 0.6525* 1 0.9995* 0.9994* 0.9994* 0.8504* 0.8507* 0.8508* 0.8508* REM-90 (VA)
DFA-99 (VA) 0.6532* 0.6525* 1.0000* 1 0.9999* 0.9999* 0.8502* 0.8507* 0.8510* 0.8510* REM-95 (VA)
DFA-95 (VA) 0.6529* 0.6523* 0.9999* 0.9999* 1 1.0000* 0.8500* 0.8506* 0.8508* 0.8508* REM-99 (VA)
DFA-90 (VA) 0 0.6521* 0.6516* 0.9994* 0.9994* 0.9994* 1 0.8500* 0.8506* 0.8508* 0.8508* REM (VA)
TFA (IA) 0.5428* 0.5415* 0.5325* 0.5325* 0.5325* 0.5319* 1 0.9995* 0.9995* 0.9995* REM-90 (IA)
TFA (VA) 0.6388* 0.6382* 0.9378* 0.9378* 0.9376* 0.9366* 0.5660* 1 1.0000* 1.0000* REM-95 (IA)
TFA-Y (IA) 0.6390* 0.6385* 0.3304* 0.3304* 0.3302* 0.3294* 0.7637* 0.3385* 1 1.0000* REM-99 (IA)
TFA-Y (VA) 0.4938* 0.4929* 0.7120* 0.7120* 0.7117* 0.7097* 0.3565* 0.7509* 0.5264* 1 REM (IA)
Cost efficiency DFA-95 (IA) DFA-90
(IA) DFA (VA)
DFA-99
(VA)
DFA-95
(VA)
DFA-90
(VA) TFA (IA) TFA (VA)
TFA-Y
(IA)
TFA-Y
(VA)
The table reports Spearman‟s rank correlations between efficiency scores of all employed methodologies. For space considerations we include both profit and cost efficiency output in
one table, displayed in grey and white background, respectively. The asterisks denote significant correlation at 5% level.

263
CHAPTER 8
Bank competition and financial (in)stability in Europe:
A sensitivity analysis

264

265
8.1. Introduction
The deregulation process paves the way towards the intensification of competitive
conditions, amid which financial institutions struggle to survive posing a threat to the
potential incidence of financial crises. Systemic risk is large especially for incumbent
banks, whose high market share may imply negative externalities to national
economies in cases where cross-border activity is significant.
The ongoing restructuring towards aggregate concentration for income diversification
and risk management purposes has rendered financial regulation imperative building
upon the failing premises of Basel II. In the light of the present financial crisis, capital
regulation has been deficient falling short of taking account of systemic effects,
market discipline ineffective due to too-big-to-fail policies, risk evaluations deficient
once we consider the operation of credit ratings agencies while supervision exhausted
its jurisdiction to non-shadow banking system. In line with the ongoing debate on the
dynamics of competition and financial stability taking into consideration
contemporary institutional reforms we shed light on the dynamics of competition in
association with the evergreen topic of financial stability.
The contribution of the underlying paper is threefold: first, apart from Cipollini and
Fiordelisi (2009), Uhde and Heimeshoff (2009) and Agoraki et al. (2009) (for the
Southeastern region) there are no other empirical applications focusing exclusively on
Europe; comparative analysis of countries including Europe has been conducted by
Schaeck and Cihak (2008), Boyd et al. (2009), De Nikolo and Loukoianova (2007),
Berger et al. (2009) and Laeven and Levine (2009). Second, the U-shaped relationship
of competition and financial stability as theoretically proposed by Martinez-Miera and
Repullo (2010) is investigated empirically since no one but Berger et al. (2009) and
Beck et al. (2012) allowed for it. Third, it is interesting to see if the effects of
concentration of market power and concentration are persistent along with the
statistical significance of other sets of variables included in the deterministic kernel.

266
8.2. Methodology
The decision upon which key variables are theoretically and empirically grounded to
constitute the crux of deterministic group is not that apparent. The underlying
literature has proposed different econometric modeling – (e.g) GMM methodology,
panel, probit, logit models and duration analysis, etc. – and various determinants of
bank risk of failure. Such unwieldy bulk of variables amounts to almost 50
institutional, macroeconomic, financial, industrial and bank-specific variables that end
up with mixed results depending each time on the econometric specification and the
independent set of the regression model. On those grounds, this paper considers
interesting the prospect of analysing the statistical power of key effects (market
power, concentration) of bank risk conditioned to the variation of every single subset
of variables. In other words, utilising extreme bound analysis (EBA) as set out by
Leamer (1983; 1985) and Leamer and Leonard (1983), the partial correlations of
dependent and independent variables are examined to endorse whether such
relationships are fragile or robust at standard confidence levels.
Hence, the employed methodology is a sensitivity analysis of linear modeling
regarding multiple regressions of bank risks on explicit groups of variables. We
embark upon the group of interest that comprises the effects of market power and
concentration along with their quadratic terms to allow for non-linearities as
theoretically proposed by Martinez-Miera and Repullo (2010). Along the lines, both
centrifugal strands of literature can be verified without precluding the significant
power of the other. The so-called U-shaped relationship of competition and bank risk
of failure highlights that in monopolistic markets the risk-shifting effect is dominant –
greater competition lowers loans rates and makes banks safer – and the marginal
effect – greater competition lowers the revenues from non-performing loans providing
limited buffer for potential loan losses and thereby jeopardising bank viability –
prevails in more competitive markets.
The following steps of analysis include reasonable subsets of cautiously pooled
variables that one can identify as statistically significant in the literature.
Schematically,
267
Financial stability (Z) = f [Market structure variables (M) | institutional (I)
|macroeconomic and bank-specific factors (C)] + ε (8.1)
The market power set of variables comprises the Lerner index as applied to capture
the pricing conduct of banks. The mark-up of price seems appropriate in our case but
the procedure of extrapolating marginal costs should follow first the standard
stochastic modeling of equation (8.3) along with the estimation of the partial
derivative of total costs with respect to total assets (equation 8.4). Concentration is
delineated by Herfindahl-Hirschman ratio since it is deemed in the literature to depict
real market conditions in antitrust policies and represent the stepping-stone of SCP
paradigm. The selection of both measures that have drawn attention to the empirical
analysis is cautious of the fact that they have been overwhelmingly applied in the
literature interchangeably to explain market conditions34
; along the lines of the
analysis, we opt to plug them both in regressions to compare the accruing evidence.
All variables allowed to have variation at the bank level, namely competition and
several other controls that encompass the bank‟s business model, are lagged one
period to avoid reverse causality among them. In other words, the endogeneity of
market power may reflect the impact of insolvency on market structure and pricing
conduct of banks subsequently. The fact that country-level factors are not supposed to
interact with market power and stability comes at the expense of correlation of the
error term with some independent effects. However, the use of regulatory variables
that by nature have little variation over time leads to limited, if not negligible,
variation of market power at the bank level. In addition, fixed effects modeling is
more appropriate for a particular sample set, whereas largely heterogeneous N groups
(as in our case) would induce significant loss in the degrees of freedom (Baltagi,
1995). Thus, EBA methodology requires bank and time random effects as well as
clustered standard errors at the bank level in order to get a prima facie insight of the
potential drivers of country heterogeneity.
The bound analysis kicks off at the point where the baseline model regresses financial
stability on the variables of interest (M) after controlling other bank-specific factors
and adverse macroeconomic conditions (C) across the region to deduct as much a
34
See Schaeck (2009) for a thorough review on measures of concentration, market power and financial
stability in the literature.

268
possible the error effects and convey real depiction in levels and significance of the
underlying coefficients. Next, we add in various bank-specific factors that encompass
different aspects of banks‟ balance sheet, income structure, corporate governance and
general strategic planning investigating thereby their stand-alone and „en masse‟
effect. As a next step thereafter, institutional factors that encompass different legal
systems, regulatory schemes and market discipline mandates (I) are plugged in to pin
down the bounds of the coefficients of interest.
Thus, the extreme upper and low bounds of the coefficient values are constructed by
allowing for all possible combinations of (I) effects expanding the analysis up to 62
regressions for each model. The degree to which partial correlations between market
structure and financial stability are robust or fragile is defined by the persistence of
the sign and the statistical significance in-between the range of the bound. Otherwise,
we should treat the variables of interest with less confidence as far as their causal
effect on risk is concerned since the fragility in the underlying relationships in terms
of sign and statistical inference is contingent on the employed information set.
However, the analysis does not aim to come up with a single model that breaks down
the competition-(in)stability nexus. Rather, we assess the interconnections in between
on the grounds of what has been proposed in the empirical literature and always on
the mandate of ever-afresh institutional reform.
We also endeavour to resolve the adverse results on the relationship between
competition and concentration through the employment of the quadratic term of
Lerner index to verify whether it is the case of U-shaped relationship as argued by
Martinez-Miera and Repullo (2010). We plug it ad hoc only in the models that
construct the extreme bounds of competition and concentration so as to estimate the
infection point that is the value of competition above which the relationship of
soundness-competition alters; otherwise, the use of it in all model combinations
would blur the effective bounds. In case of no significance in the coefficient of the
Lerner index that constructs the extreme bounds, we opt to utilize a different
information set of the same size.
Moreover, the aim of gauging the impact of country-level variables on risk seems to
be insufficient, if not inappropriate due to the possibility that the underlying effect
may not be expressed in levels but also in slopes (model 2). Hence, we include

269
interaction terms between country-level factors and the Lerner index along with
lagged bank-specific controls. However, the only drawback with this approach is that
interaction terms may bring about multicollinearity problems that are partially
counterbalanced by more degrees of freedom due to the regression analysis conducted
on a whole sample. Such problems are depicted in inflated standard errors and,
consequently, in higher coefficients of (M) variables revealing thereby a potential
weak-data problem; the latter consists in the little variation of a specific independent
factor to determine cross-sectional differentials (Leamer, 1978; Levine and Renelt,
1992). The model is schematically the following:
Financial stability (Z) = f [Competition (L), Concentration*L | institutional (I)*L
|macroeconomic*L and bank-specific factors)] + ε (8.2)
In contrast with Levine and Renelt (1992), the variables of interest are only the Lerner
index and concentration, which are included in the analysis simultaneously since they
tend to reflect different features of bank competitiveness. Second, we utilize all
possible combinations of three I-variable sets in order to juxtapose the results with
those when different-sized sets are employed for robustness-checking reasons. In
addition, apart from the M-variables each model comprises 5 bank-specific variables,
three country-level variables and any combination of the I-variables, a procedure that
relaxes the „prescription‟ of Kormendi and Meguire (1985), Barro (1991) and Levine
and Renelt (1992).
8.3. The model
We should first estimate the price mark-up over marginal cost (Lerner index)
combining the estimation of average prices and marginal costs at the bank level. The
average prices are estimated over total assets (TA) along the lines of Shaffer (1993)
and Berg and Kim (1994), instead of other earning assets in an attempt to expand as
much as possible the observations of the sample since 2002. First, we have to estimate
marginal costs by means of running a translog cost function, similar to the version of
Ariss (2010b) that excludes the use of price of borrowed funds as input price on the
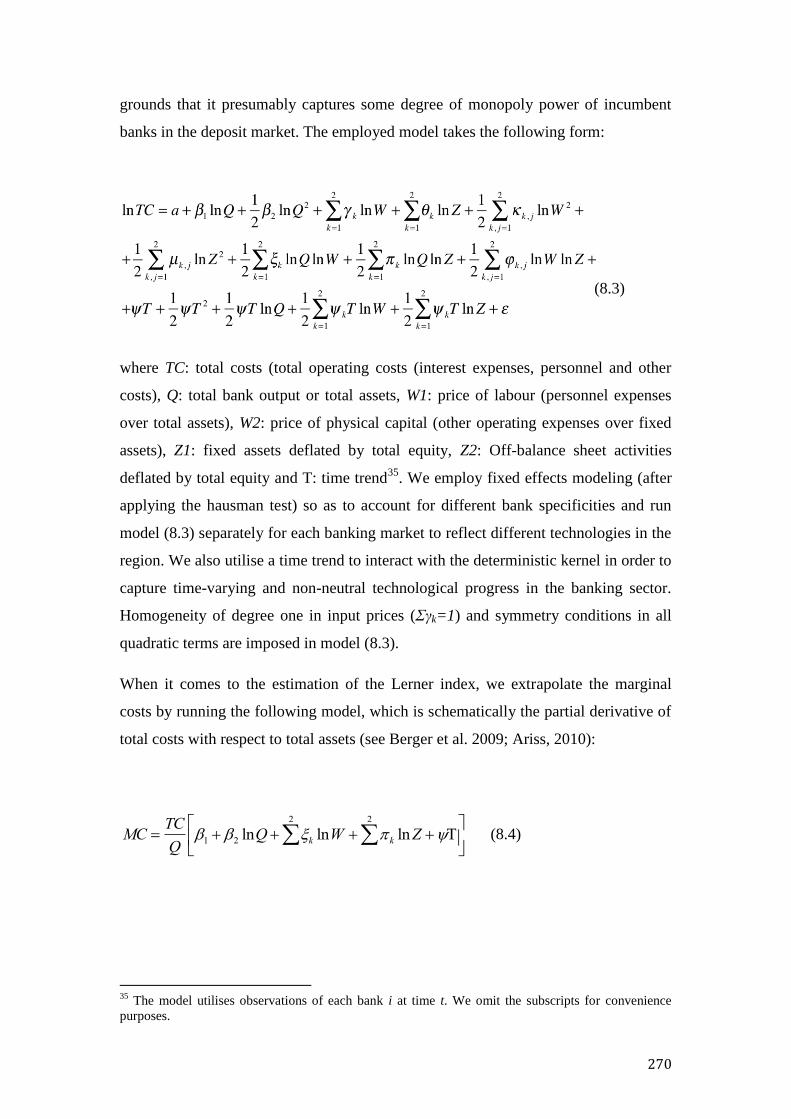
270
grounds that it presumably captures some degree of monopoly power of incumbent
banks in the deposit market. The employed model takes the following form:
(8.3)
where TC: total costs (total operating costs (interest expenses, personnel and other
costs), Q: total bank output or total assets, W1: price of labour (personnel expenses
over total assets), W2: price of physical capital (other operating expenses over fixed
assets), Z1: fixed assets deflated by total equity, Z2: Off-balance sheet activities
deflated by total equity and T: time trend35
. We employ fixed effects modeling (after
applying the hausman test) so as to account for different bank specificities and run
model (8.3) separately for each banking market to reflect different technologies in the
region. We also utilise a time trend to interact with the deterministic kernel in order to
capture time-varying and non-neutral technological progress in the banking sector.
Homogeneity of degree one in input prices (Σγk=1) and symmetry conditions in all
quadratic terms are imposed in model (8.3).
When it comes to the estimation of the Lerner index, we extrapolate the marginal
costs by running the following model, which is schematically the partial derivative of
total costs with respect to total assets (see Berger et al. 2009; Ariss, 2010):
MC TC
Q1 2 lnQ k lnW k lnZ
2
2
(8.4)
35
The model utilises observations of each bank i at time t. We omit the subscripts for convenience
purposes.

271
We are then able to construct the Lerner index (L) with respect to specific bank
activities before delving into the analysis of competition determinants. According to
the following structural model,
Li,t ARi,t MCi,t
ARi,t (8.5)
AR denotes the average revenue of banks estimated by total income over total assets
and MC the marginal cost derived through model (8.4). Their subscripts signify the
use of Lerner index as the only proxy of market power at the bank level over time.
We then estimate the natural logarithm of Z-score, which has been widely accepted in
the literature as the most reliable proxy of distance from a situation of insolvency. We
compute it with the following expression,
Zi,t ROAi,t E /TA
i,t
ROAi,t (8.6)
where ROA: returns on assets, EQ/TA: total equity to total assets, σ(ROA): standard
deviation of returns on assets, all expressed at for bank i at time t. It is interpreted as
the number of standard deviations by which ROA should fall under the mean so as to
extinguish the equity of a bank (Boyd and Runkle, 1993). We opt to estimate profit
volatility for the whole time period at the expense of subsequent time invariance of
the denominator; in some studies where time periods are much larger, a three-year
rolling window is implemented so as to potentially attribute the variation of the Z-
score not only to the variation of profitability and capital, but also to the volatility of
bank profitability. When it comes to set it as a dependent variable, we take the natural
logarithm of Z-score in order to normalize its extreme values due to high skewness. In
the literature, any possible negative values are alleviated by transforming them
through truncation at zero point [ln(1+Z-score)] or winsorising at 1% level and then
taking logs. Since the latter produces non-negative values, we opt for it.

272
8.4. Determinants of stability
8.4.1. Bank-specific variables
Asset size has been used in the literature by Bonfirm and Dai (2009), Liu et al. (2010)
and Beck et al. (2012) in an attempt to see whether financial stability comes from
managers‟ attitude to exploit scale economies or by the perception that too-big-to-fail
policies will constitute the facility of last resort in the form of governmental subsidies,
among others.
Capital ratio is the value of total equity deflated by a bank‟s total assets. We employ
it to account for differentials in risk preference behaviour of bank managers along the
lines of Stiroh (2004), Schaeck and Cihak (2008) and Berger et al. (2009).
Cost efficiency turns out to be the most widely employed accounting variable that
proxy for cost efficiency as contemporary efficiency modeling may produce bias due
to certain methodological and econometric assumptions. We prima facie expect a
negative effect on stability since inefficient banks tend to engage in risky behaviour to
make up for insufficient performance (Uhde and Heimeshoff, 2009; Liu et al. 2010).
However, a lagged variable may have stabilising repercussions when it is coupled
with divergent institutional reform.
Liquidity is controlled for by the ratio of liquid assets over customer deposits and
short-term funding. It measures what percentage of deposits and funding can be
served in case there is a sudden bank run. The higher this ratio is the less vulnerable a
bank is vis-à-vis a deposit run-off case. We see similar proxies in the literature, such
as liquid assets over liquid liabilities or over total assets (Laeven and Levine, 2009;
Olivero et al., 2010), with no substantial difference in practice.
Diversification indicates the ability of a bank to expand its operations to off-balance
sheet activities, namely to insurance, real estate and securities activities; thus, we
proxy it as the total non-interest operating income over total income (Liu et al., 2010).
We expect a negative association between diversification and risk but it also might be
the case that banks with high-income diversification are exposed to greater risks in
their attempt to accomplish economies of scope (Stiroh, 2004).
273
8.4.2. Macroeconomic variables
GDP growth rate has been employed by the studies of Bonfirm and Dai (2009),
Jimenez et al. (2010) and Olivero et al. (2010) in order to control for different stages
of economic development. As for its expected effect, higher customer demand after
the adoption of Euro may have resulted in better managerial efficiency in terms of a
relatively superior utilisation of production factors (Conrad et al., 2009; Liu et al.,
2010). Economic prosperity reduced the probability of a potential bank crisis, which
usually comes along with loan risk during economic recessions. On the other hand,
loan losses can occur during economic booms if high growth GDP rates promote
optimistic evaluations over borrowers‟ creditworthiness leading to less stringent
policies, and when competitive structures make managers more willing for risk-taking
activities (Jimenez et al., 2010).
Stock market turnover is defined as the total value of traded shares over the average
stock market capitalisation. We employ the degree of liquidity in stock markets in
order to take account of alternative funding means of firms, which may be related to
greater dissemination of credit information and, thus, to greater bank soundness (Beck
et al., 2012).
8.4.3. Regulatory environment
Capital regulatory index measures the degree of regulation on bank capital that
should be set aside as a buffer for potential market and credit risks. In particular, it is
about the initial capital stringency, that is which type - and to what extent - of
regulatory funds other than cash, governmental securities or borrowed funds, is
appropriate and verifiable by the official regulatory authorities. It is also about the
overall capital stringency, according to which the regulatory capital is estimated
accounting for risks and value losses. Thus, we quantify it by ascribing values of 0 or
1 to every single one of the nine questions included in the appendix, with the
observations ranging between 0 (no stringency) and 9 (high stringency). After the
advent of Euro, the necessity to build upon the inefficient or inadequate regulatory
directives as set out by the Accord of the Basel Committee (Basel I), Basel II and III
constitute the product of sedulous research. Empirical studies are split between the

274
invigorating effects of capital requirements on less loan losses and the detrimental
implications on risk-taking. Required reserves of capital may constitute sufficient
buffers vis-à-vis potential liquidity shocks notwithstanding the case of banks seeking
for monopolistic rents in order to make up for the utility loss of powerful bank owners
(Laeven and Levine, 2009).
Official supervisory power measures the degree of supervisory power exercized by
the official authorities and their „intervention‟ to the decisions of bank managers. It
takes values from 0 to 10 ascribing 0 and 1 to negative and positive responses,
respectively. From a theoretical perspective, strong supervision tends to demoralize
managers to engage in excessive risk-taking - especially in countries with low
accounting requirements (Fernandez and Gonzalez, 2005) - whereas it may be
associated with corruption in lending transactions, and obstruction of bank operations
(Barth et al., 2004).
Private monitoring index is indicating the degree of information released to the public
and officials relative to requirements of auditing authorities and credit rating agencies.
It takes values between 0 and 10 after taking into account the „no‟ and „yes‟ responses
of 10 questions, respectively. Hence, higher values highlight greater private insight
over the economic performance of banks. It has been overlooked in the literature and
only recently has been utilized by Schaeck et al. (2009), who argue about the
insignificant concentration due to the common practice of investors, regulatory
authorities and credit agencies to inspect large entities closely.
Activity restrictions is an interesting variable commensurate with the extent to which
bank activities like securities, insurance and real estate activities are under constraint.
In particular, it takes the responses of „prohibited‟, „restricted‟, „permitted‟ or
„unrestricted‟ and we quantify them by assigning the values of 4, 3, 2 and 1,
respectively. We, finally, get the average value of the overall index and draw remarks
over the degree of activity restriction. In the literature, there are two strands of
reasoning in favour or against their effect on bank soundness. In cases when such
restrictions forbid banks to engage in riskier fee-based projects (securities, real estate
and insurance), we observe financial stability (Uhde and Heimeshoff, 2009).
However, if banks are restricted to diversify their portfolio to non-interest bearing

275
products, the concomitant utility loss induces powerful bank owners to herding and
thus to riskier systemic conduct (Laeven and Levine, 2009).
Foreign ownership is calculated as the total assets of banks, which are owned by
foreigners with more than 50% stake, as a percentage to the total assets of the banking
system they operate within. It is addressed in many studies like those of Yeyati and
Micco (2007), Berger et al. (2009) and Laeven and Levine (2009), among others. The
issues related to penetration of foreign banks in a national market are the screening
costs of local customers that tend to attenuate through acquired experience, and the
guarantees of the parent bank that constitute a safety net in times of insolvency and
liquidity shocks (De Nikolo and Loukoianova, 2007; Claessens et al. 2001b).
There is also the option to pick up national banks of monopolistic markets (dodging
competition hypothesis), higher operational efficiency (cream skimming hypothesis),
or large market shares through branches and subsidiaries (quest for market power
hypothesis). There might be also the case that foreign ownership affects bank
soundness in slopes rather in levels, entering significantly in the competition-
(in)stability nexus; this possibility is included in the robustness-check section in order
to verify the persistency of the underlying relationship.
Fraction of entry denied consists in the fraction of denied entry applications of
domestic and foreign entities over their total volume. Its possible impact on bank
soundness has been profound in contestable markets, in which too-big-to-fail banks
operate competitively (Beck et al., 2006a); Beck, 2007). A positive sign is likely to
depict a monopolistic banking market where banks reap the benefits of diversifying
portfolios, stock market financing and proprietary information (Beck et al. 2012). In
contrast, financial crisis may occur in response to either unbearable operational
inefficiencies or to the limited relationship lending in a competitive market (Boot and
Thakor, 1993).
8.5. Data
The sample includes financial data of at most 2421 banks headquartering in the
enlarged European Union (27-EU). We retrieved data from consolidated accounts of

276
the Bankscope database, and when that is not possible, we use unconsolidated
accounts. The data amount to 9296 observations for the period 2002-2008 and pertain
to Austria, Bulgaria, Cyprus, Denmark, Estonia, France, Germany, Greece, Hungary,
Italy, Luxemburg, Portugal, Slovakia, Slovenia, Spain, Sweden and United Kingdom.
The decision to analyse a period up to the crack of the financial meltdown emanates
from the employment of supervision and regulatory variables36
, which are available
until June 2008 and we further assume that for the whole year of 2008 the data remain
the same.
To avoid losing observations-outliers in an already limited sample, we winsorize at
1% level of the distribution of the Lerner index and the Z-score to smooth out the
their impact and come up with robust standard errors. The sample also includes the
whole spectrum of productive specialisation in European banking, namely bank
holding and holding companies, clearing institutions and custody, commercial banks,
cooperative banks, finance companies (credit card, factoring and leasing), group
finance companies, investment and trust corporations, investment banks, islamic
banks, micro-financing institutions, other non-banking credit institutions, private
banking and asset management companies, real estate and mortgage banks, saving
banks, securities firms and specialized governmental credit institutions.
Table 22 contains summary statistics of the key bank-specific and regulation variables
employed throughout the main econometric part. Each column exhibits the mean
values per country as well as the average of the Euro zone (EU-15) and the rest
European Union (EU-17)37. In particular, EU-15 is far more stable throughout the
period 2002-2008 than European banking sectors; Germany and Spain stand out as
the best performers in contrast with Finland and Luxembourg, which are below the
average of EU-12. In the latter case, Lithuania, Czech Republic and Slovakia enjoy
greater bank soundness whereas Romania, Cyprus and Latvia lie below the lowest
score of EU-15 countries.
36
In particular, the variables activity restrictions, capital regulation, foreign ownership, official
supervision, fraction of entry denied and private monitoring index are quantified in order to produce
time series for every country through the use of questionnaires disseminated in many financial
institutions. The methodology (and data) followed to quantify more than one answers is explicitly
encompassed in the appendix as retrieved from Barth et al. (2004; 2005; 2008).
37
We include Bulgaria and Romania in the EU-10 as they constitute the enlarged Southeastern part of
European Union.

277
Table 22: Descritive statistics of key variables
Z-score Lerner TA TC/TI TNINTI/TI LIQ/DEP CONC GDPGR Inflation Stock MT
Activity
R.
Capital
Reg.
Foreign
Own.
Official
Sup.
Fraction
ED
Private
Mon.
Austria 55.071 0.305 5873.057 0.659 0.203 0.365 0.638 0.023 0.020 0.350 7.000 5.857 0.194 10.143 - 4.000
Belgium 29.233 0.074 44573.660 0.652 0.295 0.417 0.850 0.020 0.023 0.678 7.571 3.571 0.210 9.286 0.000 5.714
Denmark 34.256 0.208 9384.117 0.602 0.211 0.360 0.805 0.014 0.020 0.634 9.286 5.571 0.150 8.286 0.000 6.429
Finland 22.267 -0.030 34316.880 0.657 0.386 0.498 0.958 0.031 0.016 1.064 8.714 5.000 0.426 7.429 0.048 6.000
France 63.441 0.242 36018.890 0.659 0.306 0.426 0.580 0.015 0.021 0.812 8.143 6.571 0.155 6.286 0.000 6.429
Germany 168.847 0.168 5417.424 0.718 0.180 0.230 0.700 0.014 0.019 0.453 7.000 6.714 0.059 6.857 0.286 6.714
Greece 34.050 0.246 18160.340 0.657 0.215 0.317 0.842 0.035 0.035 0.587 8.571 4.571 0.108 9.143 0.076 6.429
Ireland 32.189 -0.171 40898.670 0.395 0.037 0.871 0.543 0.039 0.031 0.524 7.000 2.286 - 10.286 0.000 7.000
Italy 69.178 0.176 6903.262 0.669 0.199 0.349 0.422 0.008 0.025 0.425 11.429 4.286 0.096 6.286 0.130 6.714
Luxemburg 28.827 0.406 7723.828 0.551 0.283 0.834 0.304 0.040 0.031 1.638 8.143 7.000 0.946 9.429 0.000 6.000
Netherlands 30.412 0.019 88215.220 0.664 0.159 0.657 0.686 0.020 0.021 0.922 6.000 5.286 0.069 5.714 0.000 7.429
Portugal 41.970 0.181 12145.250 0.746 0.201 0.484 0.891 0.009 0.028 0.396 11.429 7.429 0.165 12.571 0.000 5.714
Spain 99.873 0.203 22986.740 0.569 0.171 0.219 0.774 0.030 0.034 0.880 6.714 9.000 0.097 9.000 0.026 7.429
Sweden 27.886 0.353 12957.060 0.597 0.210 0.236 0.960 0.027 0.018 1.007 9.429 3.000 - 5.143 0.010 5.714
UK 37.935 0.253 52002.790 0.735 0.351 0.726 0.587 0.023 0.020 1.247 4.286 5.714 0.519 7.429 - 7.000
EU-15 51.696 0.176 26505.146 0.635 0.227 0.466 0.703 0.023 0.024 0.774 8.048 5.457 0.246 8.219 0.044 6.314

278
Cyprus 14.255 -0.249 5458.085 0.627 0.090 0.468 0.873 0.036 0.028 0.579 11.000 6.429 0.301 9.429 0.333 6.714
Czech R. 40.790 0.238 6219.384 0.670 0.303 0.291 0.663 0.047 0.024 0.283 12.000 5.571 0.860 8.000 0.000 6.000
Estonia 19.374 0.281 985.089 0.675 0.372 0.782 0.976 0.062 0.048 0.314 7.143 5.143 0.992 11.857 0.000 6.000
Hungary 21.442 0.304 2134.387 0.823 0.180 0.648 0.679 0.032 0.054 0.260 11.000 7.143 0.940 12.571 0.000 6.429
Latvia 16.513 0.537 1318.662 0.638 0.296 0.485 0.551 0.073 0.071 0.107 7.714 6.286 0.563 9.429 0.167 6.714
Lithuania 43.599 0.205 1844.011 0.692 0.254 0.295 0.684 0.075 0.034 0.224 10.143 4.286 22.995 11.714 0.057 6.429
Malta 29.773 0.104 1891.901 0.704 0.109 0.597 0.764 0.025 0.025 0.536 10.286 6.714 0.632 12.571 0.000 6.714
Poland 25.862 0.372 3406.975 0.674 0.248 0.337 0.592 0.046 0.024 0.286 7.714 4.143 20.128 7.286 0.000 6.000
Slovakia 50.793 -0.040 4554.698 0.671 0.340 0.364 0.758 0.066 0.046 0.069 10.286 5.143 0.923 11.857 0.250 3.571
Slovenia 29.490 0.209 1428.511 0.709 0.201 0.250 0.711 0.045 0.045 0.310 10.286 5.857 0.197 11.286 - 6.714
Bulgaria 39.837 0.557 908.921 0.735 0.249 0.429 0.488 0.061 0.067 0.202 9.714 7.286 0.734 9.571 0.133 5.714
Romania 18.231 0.422 2253.744 0.797 0.258 0.506 0.662 0.064 0.112 0.170 11.286 5.714 0.473 8.286 0.273 5.000
EU-12 29.163 0.245 2700.364 0.701 0.242 0.454 0.700 0.053 0.048 0.278 9.881 5.810 4.145 10.321 0.110 6.000
Z-score: the unlogged version of Z-score before winsorizing it; Lerner: the Lerner index before winsorizing it, in order to draw remarks on its mean values across the European region; TA:
total assets; TC/TI: total cost over total income; TNINTI/TI: total non-interest income over total income; LIQ/DEPSTF: liquid assets over total deposits and short-term funding; CONC:
market concentration; GDPGR: the growth rate of GDP; Inflation: inflation rate; Stock MT: stock market turnover; Activity R.: activity restrictions; Capital Reg.: Capital regulation index;
Foreign Own.: the share of foreign-owned assets in a banking industry; Official Sup.: official supervisory power; Fraction ED: fraction of entry denied; Private Mon.: Private monitoring
index. EU-15: the average values of all variables deflated by the number of banks within a banking market; EU-12: the average values of all variables deflated by the number of banks
within a banking market including Bulgaria and Romania of the enlarged European Union. Source: World Bank, Eurostat and own estimations.

279
Furthermore, harsher monopolistic conditions occur in Luxemburg and, especially in
Latvia and Bulgaria. In contrast, Finland, Ireland, Cyprus and Slovakia have negative
values of the Lerner index, indicating an irrational behaviour on pricing their
products. The largest markets in terms of total assets are those of Netherlands, UK
and Belgium while Estonia and Bulgaria are quite underdeveloped in EU. Thus, EU-
15 region is ten times as much bigger than that of EU-12 along with their associated
costs. Total costs over total income take values above 60%, with Ireland
demonstrating twice as much lower than the rest. In addition, income diversification
as proxied by the share of non-interest income over total income is more profound in
the Southeastern Union, albeit more than 35% takes place in Finland, UK, Slovakia
and Hungary. Liquid assets as a percentage of deposits and short-term funding stand
at 46% for the whole European region notwithstanding Ireland, Luxembourg and
Estonia get more than 78% as opposed to Germany, Spain, Estonia and Czech
Republic.
As for country-level conditions, there is a considerable degree of concentration in
Finland, Sweden and Estonia approaching almost perfect monopoly; less colluding
markets are those of Luxemburg, Italy and Bulgaria creeping at levels of up to 50%.
Moreover, higher rates of economic expansion as depicted by GDPGR and inflation
rates are expected to lie in the underdeveloped EU-12 region, especially so in Latvia
and Lithuania that hit 7% economic growth. On the contrary, stock market activity
has been more intense in the most capitalized markets of UK, Luxembourg, Finland
and Sweden, followed by the EU-12 countries falling far behind.
Information on regulation and supervision are quite interesting to see whether
pertinent policies lean towards too-big-to-fail cases by protecting the domestic
markets or institutionally reforming information dissemination, supervisory control or
capital adequacy. What stands out is Romania and Germany that protect incumbent
banks by denying market entry to almost 28% of the submitted applications. Further
restrictions on activities are imposed to Italy and Portugal as well to the vast majority
of underdeveloped European territory. Capital adequacy requirements are more
common in Luxembourg, Portugal, Spain and, secondarily, to Hungary and Bulgaria.
In addition, the ability of official authorities to intervene in the banking process of
decision-making is more evident in Malta and Portugal whereas EU-15, and

280
especially the markets of Sweden and Netherlands, affords the opportunity for more
freedom in the hands of bank managers. We also observe higher information
requirements from auditing authorities and credit rating agencies in Netherlands and
Spain, with the case of Slovakia falling much less behind the standards of the
remainder. Last, the banking markets of Luxembourg, Estonia, Hungary and Slovakia
differentiate themselves from the rest European sample, as foreigners at more than
94% level own their assets. In contradistinction, Germany, Netherlands, Italy and
Spain lie in scores lower than 8% level.
Table 23 provides information on pairwise correlations of the country-specific
variables employed in the analysis. As we can see, correlation is significant at 1%
level between the variables of regulation, supervision and governance. In particular,
countries with high market concentration experience more liquidity in the stock
market and more restrictions on securities, insurance and real estate activities. Greater
growth rate of GDP and inflationary pressures are correlated with less control power
on bank managers‟ decisions and increased private insight on banks‟ economic
performance. Furthermore, the relationship of stock market turnover with both
activity restrictions and private monitoring index is negative at 28.5% level.
Table 23: Correlation between country-level variables
Concentration GDPGR Inflation
Stock
market
turnover
Activity
restrictions
Capital
regulation
Foreign
ownership
Official
supervision
Fraction
of denied
entries
Private
monitor
Concentration 1
GDPGR 0.031 1
Inflation -0.064 0.201 1
Stock market
turnover -0.421 -0.049 0.236 1
Activity
restrictions 0.32 0.064 0.024 -0.355 1
Capital
regulation -0.035 0.116 -0.058 -0.024 0.009 1
Foreign
ownership 0.175 0.104 0.09 -0.091 0.090 0.074 1
Official
supervision 0.031 -0.49 -0.322 -0.163 -0.088 -0.031 0.445 1
Fraction of
denied entries -0.077 0.016 0.014 0.035 0.242 -0.072 -0.510 -0.511 1
Private
monitor -0.099 0.359 -0.144 -0.285 0.066 -0.055 -0.112 -0.284 0.213 1
Source: Bankscope database, World Bank, own estimations.

281
Denied market entries are strongly related to activity restrictions as both determine
competitive conditions, and private monitoring index operating as a supplement
strategy to induce transparency in a protected market of incumbent banks. They are
also negatively correlated to less official supervision, since the latter may operate as a
substitute mechanism to correct imprudent practices not through the protection of the
national market but through the direct control of managerial decisions, and less
foreign ownership as restricted to integrate in other regions through the organic
growth of subsidiaries and branches. Last, official supervisory power is associated
with markets of more foreign-owned banks and less bank information required by
public authorities. Hence, in monopolistic markets we see more restrictions on market
entries and activities as well as more private monitoring through the dissemination of
bank information. In contrast, less protected markets experience the incoming of
foreign interest and the decisive intervention of supervisory authorities to the
decisions of bank managers.
8.6. Main results
Table 24 displays the results of the sensitivity analysis conducted to see whether and
to what extent factors of regulation and supervision have an independent impact on
bank soundness. The baseline model in the first column excludes everything but the
macroeconomic and bank-specific controls while the rest comprises the results we add
one key variable at a time in order to see the variables of market structure. The
coefficient of Lerner remains significant with a negative effect only when we include
activity restrictions and capital regulation. That highlights the devastating effect of
monopolistic conduct on bank stability in cases where managers are constrained to
diversify their portfolio risks and exploit their capital base. In contrast, market
concentration enters with positive bearing on bank soundness up to 1% significance
level except three cases. The first two are the same that bank competition enters
significantly therein, namely with the inclusion of restrictions on activities and capital
reserves. The third lies when we plug all institutional variables in the model bringing
about a negative resultant force for HHI; that might be the case of multicollinearity
problems when all institutional policies are assumed to co-exist in an economy.
282
There is an explicit significance of regulatory variables when they are assessed
individually. Once we plug them all in the model their „en masse‟ effect turns out to
be significant at 1% level. Significance of activity restrictions38
denotes that managers
are restricted to enter other non-traditional business lines for diversification purposes,
taking on more risks and exacerbating thereby their portfolio risk exposure. On the
contrary, capital regulation enters significant at 1% level fostering stability to the
banking sector. Hence, more capitalization makes banks immune to liquidity shocks
although the opportunity cost of such a „tax burden‟ in cases of powerful owners,
constitute a considerable motive for risk taking by means of monopolistic conduct
(Laeven and Levine, 2009).
Similarly, foreign ownership is linearly related to bank fragility meaning that the
openness to foreign institutions leads to excessive competition and diminishing profit
margins dominating their invigorating impact of adopting better practices that
enhance further operational performance. Bank soundness peters out as official
supervision becomes more stringent on the grounds that some degree of corruption in
lending activities undermines systemic efficiency due to limited firms access to bank
finance (Beck et al., 2006b; 2007). Μore rejections on potential market entries that
intensify the degree of contestability and leave incumbent banks free to take
advantage of profit opportunities, equity financing and other informational rents,
demonstrate no linear effect on stability. Last, private monitoring is highly significant
with a positive bearing on banking system stability, without losing the explanatory
power of market concentration. That underlines the significant role of too-big-to-fail
banks that have been subject to close monitoring and inspection due to their potential
systemic repercussions. However, once we employ the whole set of I-variables, we
come up with the same pattern notwithstanding denied market entries enter positive at
10% significance level and private monitoring changes sign possibly due to its
negative correlation with official supervisory power.
38
The stabilizing effect of activity restrictions is also found by Berger et al. (2009) and Beck et al.
(2011) unlike Beck et al. (2007), Laeven and Levine (2009) and Uhde and Heimeshoff (2009)
advocating to the contrary.

283
Table 24: Regression output of model 8.1
Variables Baseline Sensitivity analysis
Lerner -0.155 -0.210** -0.252*** -0.001 0.155 0.023 0.064 -0.077
(0.128) (0.098) (0.094) (0.120) (0.096) (0.138) (0.104) (0.151)
Concentration 0.537*** -0.019 0.069 0.689*** 0.614*** 0.696*** 0.516*** -0.442**
(0.082) (0.091) (0.081) (0.085) (0.087) (0.102) (0.082) (0.175)
Institutional variables (Regulation, supervision, governance)
Activity restrictions -0.089*** -0.091***
(0.007) (0.016)
Capital regulation 0.138*** 0.094***
(0.009) (0.016)
Foreign ownership -0.658*** -0.854***
(0.086) (0.221)
Official supervision -0.091*** -0.081***
(0.011) (0.018)
Fraction of denied entries -0.159 0.393*
(0.166) (0.238)
Private monitor 0.143*** -0.395***
(0.017) (0.054)
Country-specific variables
GDPGR 2.402*** 1.996*** 2.280*** 4.555*** 3.843*** 5.912*** 3.488*** 9.220***
(0.735) (0.726) (0.740) (0.862) (0.764) (1.315) (0.785) (1.886)
Inflation -4.831*** -4.458*** -6.338*** -2.126** -2.341*** -7.073*** -5.297*** 4.029**
(0.860) (0.823) (0.851) (0.974) (0.871) (1.607) (0.872) (1.851)
Stock market turnover -0.079*** -0.190*** -0.188*** 0.101*** -0.113*** -0.577*** -0.127*** -0.188*
(0.030) (0.032) (0.030) (0.029) (0.031) (0.073) (0.032) (0.097)

284
Bank-specific variables
Q 0.002 -0.001 -0.008 -0.013 0.004 0.015 -0.005 -0.007
(0.009) (0.009) (0.008) (0.009) (0.009) (0.011) (0.009) (0.011)
E/TA 0.343** 0.560*** 0.473*** 0.396** 0.361** 0.211 0.258 0.713***
(0.165) (0.161) (0.161) (0.168) (0.164) (0.238) (0.169) (0.238)
Cost to income -0.016 -0.048 -0.069 -0.001 -0.036 0.059 0.044 -0.041
(0.055) (0.044) (0.045) (0.063) (0.048) (0.076) (0.060) (0.057)
TNINTINC/TI -0.391*** -0.394*** -0.420*** -0.485*** -0.435*** -0.249** -0.426*** -0.442***
(0.080) (0.080) (0.079) (0.083) (0.080) (0.104) (0.080) (0.104)
Liquidity -0.039** -0.054*** -0.044*** -0.036** -0.036** -0.061** -0.030* -0.084***
(0.016) (0.016) (0.016) (0.017) (0.016) (0.023) (0.016) (0.028)
TIME DUMMIES YES YES YES YES YES YES YES YES
COUNTRY DUMMIES YES YES YES YES YES YES YES YES
OBSERVATIONS 9120 9120 9120 8683 9120 7541 9120 7066
BANKS 2408 2408 2408 2300 2408 1979 2408 1876
COUNTRIES 27 27 27 23 27 18 27 15
Random effects (RE) model with standard errors clustered at the bank level employing time dummies to capture time-varying random effects, as their significance is
evident after running standard F-tests. The first column reports the results of the baseline model, that is the regression of Z-score on banks specific and macroeconomic
variables totally devoid of any institutional controls. We then include one at a time controls for regulation, supervision and governance in order to verify their stand-
alone effect on bank stability as well as their „en masse‟ explanatory power in the last column. Z-score is logged for robustness in standard errors and all bank-specific
variables are lagged one period to avoid the possibility of reverse causality. Standard errors are in parentheses while asterisks ***, **, * denote the significance level
being at 1%, 5% and 10%, respectively.

285
Furthermore, times of high market demand as expressed by GDP growth make banks
utilize production factors in a more efficient way of diminishing average costs
(Conrad et al., 2009), while the combination of policies altogether are able to boost
further the impact of the business cycle towards more stabilising practices. In contrast
to the persistent positive effect of GDP growth across all specifications, the stand-
alone impact of inflation on bank stability is significantly negative. However, in the
last column we see that contemporary regulatory policies may attenuate the
destabilising effect of inflationary switching eventually its respective sign. More
liquidity in stock markets has persistent bearing on financial fragility across different
specifications, although there is indication at 1% significance level for the opposite.
That is, countries with high share of foreign-owned banks have more effective stock
markets that stabilize the market through alternative funding resources for the private
sector.
We also observe an insignificant association between asset size and bank soundness
persistently coupled with a limited effect of cost efficiency. Hence, we conclude that
financial fragility is not traced through economies of scale but also either through the
motivation of bank managers to take on more risk vis-à-vis potential government
subsidies and other „too-big-to-fail‟ policies. However, the inclusion of equity ratio
itself may eliminate the explanatory power of asset size to the extent that bank capital
is indicative of bank size. Thus, total equity over total assets maintains its positive
bearing at 1% significance level as it constitutes a buffer that insulates a bank from
low profitability or profit volatility commensurate with the degree of managers‟ risk
aversion. However, it loses power once we include denials on market entries and
private monitoring index as such policies focus directly on their protection and public
control and any change in capital stops short at explaining the variation of Z-
nominator. Moreover, portfolio diversification is explicitly significant in jeopardizing
bank stability on the grounds that banks on their way to accomplish economies of
scope engage in excessive risk-taking (Stiroh, 2004, Beck at al., 2009). The same
destabilizing pattern lies in the coefficient of liquid assets implying opportunity cost
that is potentially compensated by risky portfolio allocations.
We then construct the extreme bounds from every combination of regulatory
variables in an attempt to conclude for the persistence of bank competition and
concentration in sign and significance (table 25). Hence, the coefficient of Lerner
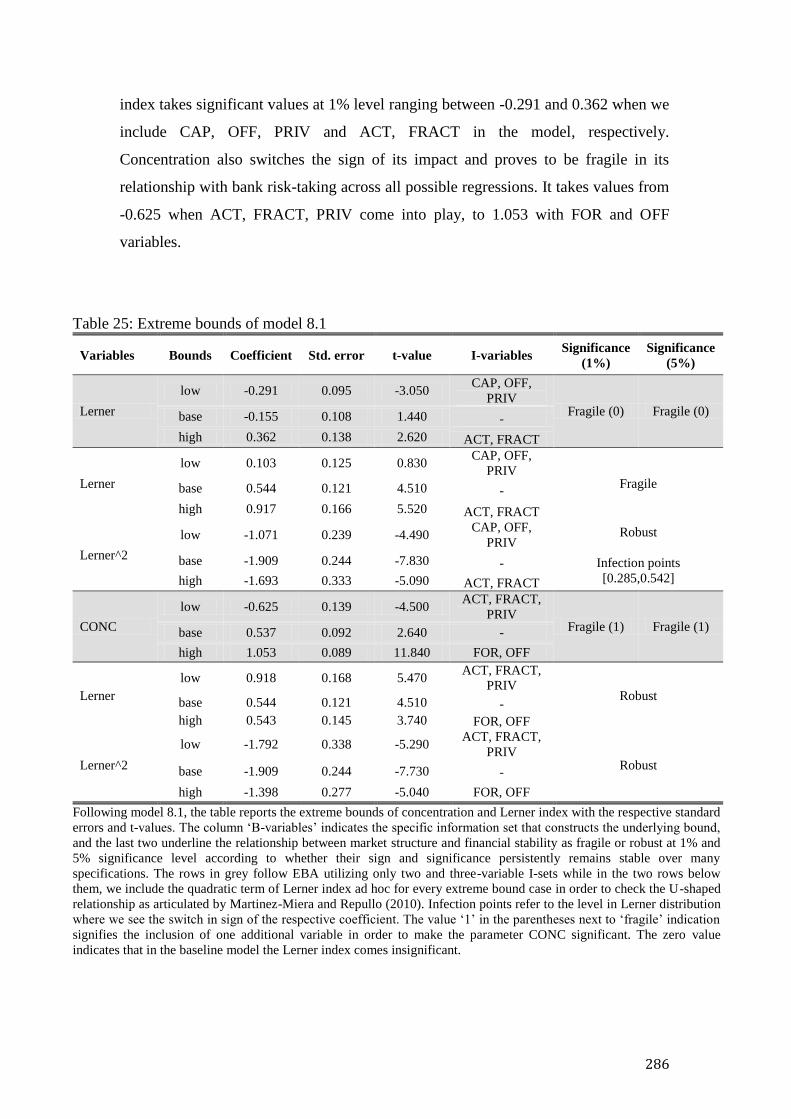
286
index takes significant values at 1% level ranging between -0.291 and 0.362 when we
include CAP, OFF, PRIV and ACT, FRACT in the model, respectively.
Concentration also switches the sign of its impact and proves to be fragile in its
relationship with bank risk-taking across all possible regressions. It takes values from
-0.625 when ACT, FRACT, PRIV come into play, to 1.053 with FOR and OFF
variables.
Table 25: Extreme bounds of model 8.1
Variables Bounds Coefficient Std. error t-value I-variables Significance
(1%)
Significance
(5%)
Lerner
low -0.291 0.095 -3.050 CAP, OFF,
PRIV Fragile (0) Fragile (0) base -0.155 0.108 1.440 -
high 0.362 0.138 2.620 ACT, FRACT
Lerner
low 0.103 0.125 0.830 CAP, OFF,
PRIV Fragile base 0.544 0.121 4.510 -
high 0.917 0.166 5.520 ACT, FRACT
Lerner^2
low -1.071 0.239 -4.490 CAP, OFF,
PRIV Robust
Infection points
[0.285,0.542]
base -1.909 0.244 -7.830 -
high -1.693 0.333 -5.090 ACT, FRACT
CONC
low -0.625 0.139 -4.500 ACT, FRACT,
PRIV Fragile (1) Fragile (1) base 0.537 0.092 2.640 -
high 1.053 0.089 11.840 FOR, OFF
Lerner
low 0.918 0.168 5.470 ACT, FRACT,
PRIV Robust
base 0.544 0.121 4.510 -
high 0.543 0.145 3.740 FOR, OFF
Lerner^2
low -1.792 0.338 -5.290 ACT, FRACT,
PRIV Robust
base -1.909 0.244 -7.730 -
high -1.398 0.277 -5.040 FOR, OFF
Following model 8.1, the table reports the extreme bounds of concentration and Lerner index with the respective standard
errors and t-values. The column „B-variables‟ indicates the specific information set that constructs the underlying bound,
and the last two underline the relationship between market structure and financial stability as fragile or robust at 1% and
5% significance level according to whether their sign and significance persistently remains stable over many
specifications. The rows in grey follow EBA utilizing only two and three-variable I-sets while in the two rows below
them, we include the quadratic term of Lerner index ad hoc for every extreme bound case in order to check the U-shaped
relationship as articulated by Martinez-Miera and Repullo (2010). Infection points refer to the level in Lerner distribution
where we see the switch in sign of the respective coefficient. The value „1‟ in the parentheses next to „fragile‟ indication
signifies the inclusion of one additional variable in order to make the parameter CONC significant. The zero value
indicates that in the baseline model the Lerner index comes insignificant.
287
In the next two arrows below the grey ones, we employ in the models that construct
the per se extreme bounds the quadratic term of market power and concentration to
verify whether it is a case of non-linear relationship between Lerner index and Z-
score. The linear effect of market power takes values between the range [0.103,
0.917] and the narrower one [0.918, 0.543] when we assess the extreme bounds of the
Lerner index and HHI, respectively. The former bounds indicate fragility in the
underlying relationship as opposed to the significance at 1% level in the latter. On the
other hand, the respective bounds for the quadratic term are [-1.071, -1.693] and [-
1.792, -1.398] while t-values show persistent explanatory power. We, thus, conclude
that the U-shaped relationship between competition and risk does exist and sign
change occurs at the infection points [0.285, 0.542].
In table 26, we replicate the procedure by allowing for the effect of country-level
factors not only to take place in levels but also in the slope of the competition-
stability nexus. The effect of Lerner index is quite unclear in the sensitivity analysis
of model 8.2. Market power drives to bank stability in concentrated markets where
we see effective systems of less restrictions on bank activities, more capital
requirements, less share of foreign-owned banks, limited intervention of supervisory
authorities on a bank‟s decisions and less private monitoring.
If we assess the stand-alone impact of capital requirements and private monitoring we
see their positive bearing on stability while market power is positively associated
with market instability. That may lie in individual policies failing to explain the
variation of the Z-score as long as they are seconded by supplementary initiatives. In
addition, the employment of interaction terms extracts some portion of explanatory
power of competition in the form of other conducive pass-through mechanisms but
their simultaneous use brings about a huge Lerner effect. The change in the sign of
private monitoring index depicts its negative correlation with official supervisory
power at almost 50% level.

288
Table 26: Regression output of model 8.2
Variables Baseline Sensitivity analysis
Lerner -0.010 1.937*** -1.539*** -0.083 0.669** 1.240*** -2.150*** 11.890***
(0.149) (0.272) (0.229) (0.169) (0.278) (0.297) (0.348) (1.521)
Concentration*L 0.604*** 0.469*** 0.463*** 0.867*** 0.607*** 0.741*** 0.592*** 0.500***
(0.083) (0.085) (0.081) (0.086) (0.084) (0.096) (0.083) (0.130)
Institutional variables (Regulation, supervision, governance)
Activity restrictions*L -0.171*** -0.204***
(0.024) (0.050)
Capital regulation*L 0.310*** 0.247***
(0.036) (0.065)
Foreign ownership*L -0.721*** -2.202***
(0.224) (0.673)
Official supervision*L -0.098*** -0.325***
(0.032) (0.060)
Fraction of denied
entries*L
-1.037 0.485
(0.691) (0.758)
Private monitor*L 0.343*** -1.375***
(0.051) (0.217)
Country-specific variables
GDPGR*L 2.311* 0.508 1.860 4.188*** 3.418** 15.217*** 3.845*** 23.044***
(1.246) (1.380) (1.304) (1.434) (1.318) (3.650) (1.412) (5.277)
Inflation*L -5.233*** -11.719*** -8.471*** -3.074* -3.811** -19.440*** -5.528*** 10.630
(1.575) (1.764) (1.659) (1.612) (1.586) (6.475) (1.650) (8.190)
Stock market turnover*L -0.122* -0.416*** -0.251*** 0.184*** -0.161** -1.727*** -0.185*** -0.512

289
(0.063) (0.069) (0.065) (0.062) (0.064) (0.214) (0.067) (0.339)
Bank-specific variables
Q 0.000 -0.068*** -0.012 -0.014 -0.001 0.008 -0.003 -0.026**
(0.009) (0.008) (0.009) (0.009) (0.009) (0.011) (0.009) (0.011)
E/TA 0.316* -0.024 0.353** 0.382** 0.307* 0.196 0.251 0.512**
(0.168) (0.172) (0.163) (0.171) (0.168) (0.245) (0.175) (0.235)
Cost to income -0.013 -0.009 0.023 -0.033 -0.021 0.095 0.016 0.011
(0.055) (0.071) (0.061) (0.066) (0.062) (0.081) (0.063) (0.094)
TNINTINC/TI -0.367*** -0.909*** -0.393*** -0.432*** -0.376*** -0.275*** -0.393*** -0.432***
(0.081) (0.078) (0.080) (0.084) (0.081) (0.105) (0.081) 0.108
Liquidity -0.039** -0.082*** -0.045*** -0.039** -0.038** -0.057** -0.031* -0.073***
(0.016) (0.018) (0.017) (0.016) (0.016) (0.024) (0.016) (0.026)
TIME DUMMIES YES YES YES YES YES YES YES YES
OBSERVATIONS 9120 9120 9120 8683 9120 7415 9120 7066
BANKS 2408 2408 2408 2300 2408 1967 2408 1876
COUNTRIES 27 27 27 23 27 18 27 15
Random effects (RE) model with standard errors clustered at the bank level employing time dummies to capture time-varying random effects, as their significance is
evident after running standard F-tests. The first column reports the results of the baseline model, that is the regression of Z-score on banks specific and macroeconomic
variables totally devoid of any institutional controls; however, to attest the possibility of country-level factors affecting bank soundness in slopes through their
interaction with bank competition. We then include one at a time interacting controls of regulation, supervision and governance with the Lerner index, in order to verify
their stand-alone effect on bank stability as well as their „en masse‟ explanatory power in the last column. Z-score is logged for robustness in standard errors and all
bank-specific variables are lagged one period to avoid the possibility of reverse causality. Standard errors are in parentheses while asterisks ***, **, * denote the
significance level being at 1%, 5% and 10%, respectively.
290
We also verify considerable significance in the independent effects of interaction
terms between lagged competition and macroeconomic variables. We conclude that
GDP growth bolsters the stabilizing bearing of market power across all cases but
those of evaluating the individual effects of capital regulation and activity
restrictions. Furthermore, inflation pressures and stock market liquidity does harm to
the stability of banking industry. However, in the last column we see clearly the fact
that regulation policies tend to deprive stock market funding and price increases from
non-linear correlations with bank soundness.
Corroborating the results on table 24, income diversification and share of liquid
assets seem to undermine financial stability persistently at 1% level. Equity capital
maintains its positive impact although with some loss of its significance when
activity restrictions, denies entries and private monitoring index comes into play. On
the contrary, we end up with a significant of asset size when we include capital
regulation and all policies simultaneously indicating the possibility that managers
engage in risk-taking on expecting governmental too-big-to-fail policies for their own
„resurrection‟. We engage in constructing extreme bounds for Lerner and HHI index
through re-running the model for every possible combination of interaction terms. It
is interesting that bank competition bears no significance either at 5% level or 10%
level throughout 62 regressions.
In table 27, the extreme bounds of competition and concentration, emanated from two
to three-variable sets, range in-between the values of [-2.630, 7.073] and [0.209,
1.058], respectively. For the latter case, the model comprises ACT, FRACT (low
bound) and FOR, OFF and FRACT (high bound). In addition, the partial correlation
both at 5% and 1% significance level is fragile and it takes the replacement of one I-
variable to change sign or lose significance. Once we plug the squared term, the
linear effect across all extreme bounds of the Lerner index and its interaction with
HHI lies between the ranges [0.300. 0.557] and [0.929, 0.584]. The quadratic variable
gets values ranging from -1.262 to -1.909 with a persistent significance at 1% level
across all specifications.

291
Table 27: Extreme bounds of model 8.2
Variables Bounds Coefficient Std. error t-value B-variables Significance
(1%)
Significance
(5%)
Lerner
low -2.630 0.357 -7.370 CAP, PRIV
Fragile (0) Fragile (0) base -0.010 0.108 1.420 -
high 7.073 1.622 4.360 FOR, FRACT,
PRIV
Lerner
low 0.300 0.125 2.410 CAP, PRIV
Fragile base 0.542 0.121 4.490 -
high 0.557 0.215 2.590 FOR, FRACT,
PRIV
Lerner^2
low -1.262 0.242 -5.210 CAP, PRIV
Fragile base -1.909 0.244 -7.830 -
high -1.485 0.420 -3.540 FOR, FRACT,
PRIV
CONC*L
low 0.209 0.105 1.990 ACT, FRACT
Fragile (1) Robust base 0.604 0.092 2.680 -
high 1.058 0.110 9.580 FOR, OFF,
FRACT
Lerner
low 0.929 0.166 5.580 ACT, FRACT
Fragile base 0.542 0.121 4.490 -
high 0.584 0.207 2.820 FOR, OFF,
FRACT
Lerner^2
low -1.718 0.333 -5.160 ACT, FRACT
Robust base -1.909 0.244 -7.830 -
high -1.272 0.409 -3.110 FOR, OFF,
FRACT
Following model 8.2, the table reports the extreme bounds of concentration and Lerner index with the respective standard
errors and t-values. The column „B-variables‟ indicates the specific information set that constructs the underlying bound,
and the last two underline the relationship between market structure and financial stability as fragile or robust at 1% and
5% significance level according to whether their sign and significance persistently remains stable over many
specifications. The rows in grey follow EBA utilizing only two and three-variable I-sets while in the two rows below
them, we include the quadratic term of Lerner index ad hoc for every extreme bound case in order to check the U-shaped
relationship as articulated by Martinez-Miera and Repullo (2010). The value „1‟ in the parentheses next to „fragile‟
indication signifies the inclusion of one additional variable in order to make the parameter CONC*L significant. The zero
value indicates that in the baseline model the Lerner index comes insignificant.
292
8.7. Does the effect of market structure variables alter with the
interplay between regulation and ownership?
There exist some theories reckoning the correlation between ownership and risk
being variant in line with different national regulatory policies (John et al. 2008;
Laeven and Levine, 2009). We, therefore, embark on a sensitivity analysis including
interaction terms of regulatory variables with foreign ownership (F) to see whether
prudential policies are crucially determined by certain governance structures. We
additionally opt to keep the interactions between country-level factors and the Lerner
index extending the previous analysis one step further.
Financial stability (Z) = f [Competition (L), Concentration*L | institutional (I)*F
|macroeconomic*L and bank-specific factors)] + ε (8.7)
Τable 28 confirms no linear impact of market power on bank soundness and the
persistence of concentrated markets to less risk-taking behaviour. In the regressions
containing one I-variable each time, there is considerable stand-alone effect of
regulation and supervision on bank soundness that is materially contingent to the
degree of foreign ownership; however, exception to the trend constitutes the
interaction between foreign ownership and activity restrictions. In particular, foreign
ownership is positively associated with financial stability in markets where more a)
bank capital reserves are required, c) entry applications are granted and d)
requirements on bank credit information are utilized by rating agencies and auditing
authorities.
However, when it comes to the analysis of the whole set simultaneously, the evidence
ends up equivocal. First, the coefficient of concentration follows the same trend
irrespectively of the degree of co linearity amongst interaction terms. Moreover, we
find again insignificant in-level bearing of market power, whereas foreign-owned
financial institutions guarantee the stability of the financial system. That verifies the
fact that banks operating within a national industry feel safer when competition is
obstructed by pertinent policies and thus keep up a low risk profile. An indication of
10% significance withstands in the inclusion of I-variables altogether.

293
The whole set of I-variables enters significant, albeit differently when juxtaposed to
the output of previous columns. In fact, the coefficient of capital regulation turns
from -0.012 to 0.255 and the positive bearing of denied entries turns insignificant.
Both capital stringency and capital requirements, when coupled with other regulatory
policies, tend to make bank managers abstain from risk-taking behaviour so as
otherwise make up for potential utility loss; especially in cases of „sufficiently large‟
foreign owners (Laeven and Levine (2009). In the same vein, information of
information to the private sector demonstrate a negative sign at 10% significance
level as foreign-owned incumbent banks have ample space to exploit profit
opportunities amid conditions of ongoing institutional reforming.
As for the rest controls, GDP growth signifies its stabilising effect of market power
on the banking system across all specifications. On the other hand, inflation comes in
line with risk-taking conduct except the last column, in which the inclusion of the
whole interacting set of I-variables blurs the analysis. Moreover, the coefficient of
stock market activity is quite unclear as its contribution to the stabilising impetus of
market power is only evident when we allow for non-linearities between entry
restrictions and foreign ownership.
From the set of bank-specific variables, income diversification and asset liquidity
enters robustly negative corroborating the results of previous sections. Equity capital
also enjoys a positive impact, which persistently maintains its sign across all
specifications, as it constitutes one of the stabilising forces in banking through equity
capital and appears in the nominator of the Z-score.

294
Table 28: Sensitivity analysis of model 8.7
Random effects (RE) model with standard errors clustered at the bank level employing time dummies to capture
time-varying random effects, as their significance is evident after running standard F-tests. The first column reports
the results of the baseline model, that is the regression of Z-score on banks specific and macroeconomic variables
totally devoid of any institutional controls; however, to attest the possibility of country-level factors affecting bank
soundness in slopes through their interaction with bank competition. We then include one at a time interacting
controls of regulation, supervision and governance with foreign ownership, in order to verify whether, and to what
degree, the (significant) effect of market structure on bank stability does change. Z-score is logged for robustness in
standard errors and all bank-specific variables are lagged one period to avoid the possibility of reverse causality.
Standard errors are in parentheses while asterisks ***, **, * denote the significance level being at 1%, 5% and 10%,
respectively.
Variables Sensitivity analysis
Lerner -0.149 -0.153 -0.150 0.024 -0.152 0.087
(0.118) (0.117) (0.117) (0.155) (0.117) (0.152)
Concentration*L 0.858*** 0.854*** 0.844*** 0.939*** 0.850*** 0.494***
(0.089) (0.084) (0.084) (0.111) (0.084) (0.116)
Institutional variables (Regulation, supervision, governance)
Foreign ownership -0.086 0.070** -0.098*** -0.024*** 0.182*** 3.805***
(0.102) (0.032) (0.018) (0.004) (0.025) (1.308)
Activity restrictions*F 0.011 -0.247***
(0.014) (0.046)
Capital regulation*F -0.012** 0.255***
(0.005) (0.051)
Official supervision*F -0.010*** 0.041
(0.002) (0.033)
Fraction of denied entries*F 0.172*** -1.518
(0.017) (1.038)
Private monitor*F -0.034*** -0.594***
(0.004) (0.204)
Country-specific variables
GDPGR*L 2.362*** 2.406*** 2.393*** 7.320*** 2.380*** 12.110***
(0.811) (0.788) (0.787) (1.619) (0.785) (1.682)
Inflation*L -5.306*** -5.078*** -5.170*** -8.394*** -4.891*** -0.215
(0.982) (0.939) (0.940) (1.474) (0.933) (1.854)
Stock market turnover*L 0.015 0.015 0.016 -0.301*** 0.018 -0.489***
(0.029) (0.028) (0.028) (0.081) (0.028) (0.088)
Bank-specific variables
Q -0.013 -0.013 -0.013 -0.008 -0.013 -0.004
(0.009) (0.009) (0.009) (0.011) (0.009) (0.011)
E/TA 0.437** 0.442** 0.444** 0.444* 0.448*** 0.586**
(0.172) (0.172) (0.172) (0.245) (0.171) (0.243)
Cost to income -0.035 -0.039 -0.037 0.019 -0.039 0.026
(0.059) (0.059) (0.059) (0.078) (0.059) (0.075)
TNINTINC/TI -0.449*** -0.450*** -0.448*** -0.361*** -0.451*** -0.385***
(0.083) (0.083) (0.083) (0.107) (0.083) (0.105)
Liquidity -0.042** -0.043*** -0.043** -0.075*** -0.043*** -0.087***
(0.016) (0.016) (0.016) (0.027) (0.016) (0.028)
TIME/SPEC DUMMIES YES YES YES YES YES YES
OBSERVATIONS 8683 8683 8683 7066 8683 7066
BANKS 2300 2300 2300 1876 2300 1876
Wald χ2 1135.02 1155.09 1195.41 2382.75 1205.44 5950.43

295
8.8. Are there other governance indicators that enter non-linearly?
The fact that supervisory authorities practice has come over an uphill path since
„80s coming from a quiet life into their obligation to fulfil the expectations of
„peckish‟ financial system. That probably stems from the process of financial
liberalisation and advancement in risk management techniques that incentivized for
more competitive pressure, leverage and the implicit option of bank managers at the
same time to surrender in safety net schemes (Crockett, 2003). Although we defined
different regulation and supervision policies, we need to see how market agents and
official authorities influence not only each other but also the competition-stability
nexus. That is because the way their operating role in the market is supposed to
govern their shared responsibility of systemic resilience and efficiency (Das et al.,
2003).
In table 29, we conduct sensitivity analysis on six dimensions of governance39
for
the enlarged (27-EU) group of European Union. We replicate the previous
methodology, namely the effect of different governance features on the interaction
between bank competition and financial stability, maintaining lagged values on all
bank-specific variables to take account of reverse causality problems. We
acknowledge the human capacity to produce estimation bias when quantifying
qualitative data on supervision and regulation and, therefore, employ 6 alternative
indicators that measure the institutional quality that any regulatory policy relies to
and thrives.
First, we include 1) voice and accountability - capturing the general perception of
the ability of a country‟s citizens to pick their government exercising their
constitutional rights of free expression, association, etc – 2) political stability -
measuring the probability of that national government of losing control or
overturning by violent or terrorist parties – 3) government effectiveness estimates
the quality of public and civil service, the degree of its independence from political
pressures, the quality of policy formulation and conducting as well as the
commitment for accomplishment – 4) rule of law engulfing the whole spectrum of
law enforcement by police and judicial system so as to prevent crime, violence and
breach of personal rights. It is also indicative of how much agents trust and comply
39
The data are based upon 30 indicators that have been constructed by the interaction of private
firms, research institutes, non-governmental organisations, think tanks and international
organisations. See their definition in the chapter appendix.

296
with rules – 5) control of corruption indicates the degree of corruption as being
expressed by the exploitation of public power to the best interests of elites and other
private parties – 6) credit depth of information sharing, that is the quality and
accessibility of credit information disseminated by public or private registries in
order to facilitate lending transactions. Hence we run the following model:
Financial stability (Z) = f [Competition (L), Concentration*L | Governance*L
|macroeconomic*L and bank-specific factors)] + ε (8.8)
Financial stability (Z) = f [Competition (L), Concentration*L | Governance*I
|macroeconomic*L and bank-specific factors)] + ε (8.9)
The Lerner index shows persistent significance with negative bearing on financial
stability unless we account for the exercising power of constitutional rights (table
29). On the contrary, market concentration maintains its significance and the
relative coefficient between the same bounds. We plug in the model one governance
indicator at a time as they are theoretically interconnected with respect to the level
of institutional development over a particular region and thus, high degree of
correlation would incur multicollinearity bias. All six governance indicators show
the expected positive non-linear effect on market power-stability nexus, indicating
that the stabilising effect of market power is stronger in countries where the
exercize of a) constitutional rights, b) political stability, c) efficient civil and public
service, d) law enforcement, e) control of corruption and f) accessibility of
qualitative information on credit, are more developed. It is, therefore, crucial when
monopolistic practices are present that the need for smooth and efficient functioning
of the state is by all means fulfilled in tandem with higher GDP growth rates and
limited burden of inflation and non-bank finance.
The positive correlation between market power and bank soundness strengthens in
times of high market demand, low stock market funding and inflationary pressures.
However, the latter is only significant when political stability and credit information
come in individually. In addition, high Z-scores tend to go in line with high levels
of equity capital as well as limited income diversification and liquidity in asset
structure.

297
Table 29: Sensitivity analysis of model 8.8
Variables Sensitivity analysis
Lerner -0.162 -0.178* -0.186* -0.238*** -0.215** -0.181*
(0.102) (0.103) (0.102) (0.102) (0.101) (0.099)
CONC*L 0.193** 0.501*** 0.065 -0.045 0.001 0.325***
(0.087) (0.082) (0.098) (0.103) (0.102) (0.084)
Other Governance indicators
Accountability*L 0.735***
(0.080)
Political stability*L 0.126***
(0.039)
Government effectiveness*L 0.275***
(0.032)
Rule of law*L 0.309***
(0.032)
Control of corruption*L 0.245***
(0.027)
Information depth*L 0.146***
(0.015)
Country-specific variables
GDPGR*L 3.524*** 1.773** 1.980*** 2.449*** 3.018*** 3.458**
(0.733) (0.735) (0.710) (0.716) (0.726) (0.724)
Inflation*L -1.183 -4.200*** -3.054*** -2.633*** -2.170** -3.459***
(0.959) (0.885) (0.881) (0.882) (0.892) (0.855)
Stock market turnover*L -0.170*** -0.072** -0.170*** -0.182*** -0.203*** -0.068**
(0.031) (0.029) (0.032) (0.033) (0.034) (0.028)
Bank-specific variables
Q 0.003 0.005 0.003 0.004 0.005 0.005
(0.009) (0.009) (0.009) (0.009) (0.009) (0.009)
E/TA 0.438*** 0.390** 0.465*** 0.515*** 0.501*** 0.452***
(0.162) (0.165) (0.160) (0.159) (0.160) (0.171)
Cost to income -0.007 -0.018 -0.022 -0.036 -0.030 -0.029
(0.056) (0.055) (0.052) (0.050) (0.050) (0.054)
TNINTINC/TI -0.389*** -0.385*** -0.431*** -0.391*** -0.393*** -0.356***
(0.079) (0.080) (0.079) (0.078) (0.078) (0.083)
Liquidity -0.047*** -0.043** -0.046*** -0.052*** -0.051*** -0.039**
(0.016) (0.016) (0.016) (0.016) (0.016) (0.016)
TIME/SPEC DUMMIES YES YES YES YES YES YES
OBSERVATIONS 9120 9120 9120 9120 9120 8811
BANKS 2408 2408 2408 2408 2408 2385
Wald χ2 1101.2 1075.84 1109.55 1110.46 1103.25 1044.47
COUNTRIES 1101.2 1075.84 1109.55 1110.46 1103.25 1044.47
Random effects (RE) model with standard errors clustered at the bank level employing time dummies to capture
time-varying random effects, as their significance is evident after running standard F-tests. The first column reports
the results of the baseline model, that is the regression of Z-score on banks specific and macroeconomic variables
totally devoid of any institutional controls; however, to attest the possibility of country-level factors affecting bank
soundness in slopes through their interaction with bank competition, we include one at a time interacting controls of
governance with the Lerner index, in order to verify their stand-alone effect on bank stability as well as their „en
masse‟ explanatory power in the last column. Z-score is logged for robustness in standard errors and all bank-
specific variables are lagged one period to avoid the possibility of reverse causality. Standard errors are in
parentheses while asterisks ***, **, * denote the significance level being at 1%, 5% and 10%, respectively.

298
In table 30, we report the regression output of the sensitivity analysis of the model
8.10. For space considerations, 30 distinct regressions are depicted for every single
regulation/supervision variable (I-variables, 1-5 columns) and combination of each
governance indicator itself alongside its interaction with every I-variable. The last
two columns report the extreme bounds of the Lerner index and the non-linear
relationship between the latter and market concentration. In order to keep track of the
origin of each bound, we report a number in parentheses, which corresponds to the
regression model that comprises the particular regulation/supervision variable. We
also highlight in grey the models that produce insignificant market power.
The evidence shows that activity restrictions, official intervention in the decision
making of bank managers are positively associated with bank risk-taking if and only
if institutional development lies in high levels. Put differently, in countries where the
public sector governance is well founded, restrictions on bank activities and
intervention of official authorities deprive banks to venture in other markets and
diversify their risk exposure through alternative asset allocations. In contrast,
regulation on capital reserves and private sector monitoring tend to stabilize the
financial system in markets where 1) agents are able to elect and monitor their
government, 2) sound policies are followed and 3) institutions that control economic
and social interactions are fully respected (Kaufmann et al., 2009). Moreover, the
degree of foreign ownership in a national banking market fosters financial stability
when corruption is persistent and requirements on credit information sufficiently
substandard.
It is also interesting that banks‟ pricing conduct has no linear effect on financial
stability, when the model allows for interactions between political stability and
activity restrictions, information depth, foreign ownership and official supervisory
power, while all non-linear effects of governance with private monitoring dry out the
impact of market power persistently. We, therefore, conclude that market power is
linearly related to bank risk-taking in cases of banks operating in institutionally
developed markets, considerable capital regulation and foreign-owned bank assets.

299
Table 30: Sensitivity analysis of model 8.9
Variables Sensitivity analysis
ACT CAP FOR OFF PRIV Extreme bounds
(1) (2) (3) (4) (5) Lerner CONC
Accountability 0.874*** -0.081 0.739*** 1.078*** -0.021
-0.250 (2) 0.246 (4) (0.081) (0.094) (0.090) (0.094) (0.106)
Accountability*I -0.061*** 0.107*** -0.007 -0.060*** 0.130***
-0.160 (4) 0.449 (3) (0.006) (0.007) (0.011) (0.008) (0.013)
Political stability 0.959*** -1.078*** 0.207*** 0.739*** -0.929***
-0.302 (2) 0.162 (1) (0.086) (0.076) (0.041) (0.106) (0.111)
Political stability*I -0.116*** 0.192*** -0.002 -0.078*** 0.176***
-0.170 (4) 0.781 (3) (0.010) (0.011) (0.015) (0.012) (0.017)
Government
effectiveness
0.525*** -0.353*** 0.259*** 0.720*** -0.500*** -0.253 (3) -0.201 (5)
(0.050) (0.051) (0.035) (0.057) (0.068)
Government
effectiveness*I
-0.041*** 0.095*** -0.009 -0.064*** 0.130*** -0.192 (1) 0.328 (3)
(0.006) (0.006) (0.020) (0.007) (0.011)
Rule of law 0.557*** -0.383*** 0.274*** 0.768*** -0.446***
-0.313 (3) -0.419 (5) (0.050) (0.053) (0.035) (0.057) (0.066)
Rule of law*I -0.044*** 0.104*** -0.022 -0.065*** 0.133***
-0.214 (1) 0.236 (3) (0.006) (0.007) (0.024) (0.007) (0.010)
Control of corruption 0.496*** -0.375*** 0.216*** 0.660*** -0.472***
-0.261 (3) -0.343 (5) (0.049) (0.046) (0.031) (0.054) (0.061)
Control of corruption*I -0.040*** 0.100*** -0.049* -0.058*** 0.123***
-0.194 (1) 0.288 (3) (0.006) (0.006) (0.029) (0.007) (0.010)
Information depth 0.181*** -0.102*** 0.165*** 0.275*** -0.045*
-0.273 (2) -0.297 (2) (0.015) (0.018) (0.016) (0.020) (0.024)
Information depth*I -0.014*** 0.033*** -0.184*** -0.021*** 0.028***
-0.220 (1) 0.413 (4) (0.002) (0.002) (0.018) (0.002) (0.003)
COUNTRY-LEVEL
CONTROLS YES YES YES YES YES
BANK-SPECIFIC
CONTROLS YES YES YES YES YES
TIME/SPEC
DUMMIES YES YES YES YES YES
The table reports the evidence of 30 regressions in a condensed output along with the extreme bounds of the coefficients of
Lerner index and CONC*L. With respect to each regulation/supervision proxy (I-variable, columns 1-5), every regression
model comprises the linear effect of one-at-a-time governance indicator and its interaction with the respective I-variable.
The cells in grey indicate the cases where market power fails to demonstrate significance, while the extreme bounds are
constructed by the significant only coefficients of market power and CONC*L. Hence, we pick up the lowest and highest
bound among the regressions that appear horizontally in the table, and indicate in parentheses the number, which
corresponds to the regulation/supervision factor that appears in the particular model of the bound. We also employ country-
level variables interacting with the Lerner index, lagged bank-specific variables and the standard time and specialisation
dummies. Standard errors are in parentheses while asterisks ***, **, * denote the significance level at 1%, 5% and 10%,
respectively.

300
8.9. Are the results robust to alternative measures of risk?
Last, we test alternative measures of market stability and to what degree the fully-
fledged model (8.10) can predict their variation. We, therefore, employ all the
components that build up the Z-score along with the logged nominator, the Z-score
with the denominator being averaged over the whole period and credit risk as proxies
by loan loss charges over average gross loans.
Risk = f [Market structure variables (M) | institutional (I) |macroeconomic and bank-
specific factors (C)] + ε (8.10)
Market power determines at 1% significance level the variation of bank profitability,
the logged nominator of Z-score and loan losses (table 31). It loses significance in
models of average equity capital and overall risk (Z-score) as dependent variables,
whereas market concentration turns out significant in predicting stand-alone
constituents of Z-score except for the case of bank profitability. We also see that the
volatility of ROA itself cannot be determined by market structure variables thereby
showing the lowest fit of the model.
Activity restrictions enter positively up at 1% significance level across all models and
seem to contribute to bank soundness through not only profitability and equity capital
but also through fewer loan losses. On the other hand, they seem to exacerbate the
fragility of the banking system by not allowing banks to diversify their risk and take
advantage of OBS activities. Thus, they are bound to experience considerable income
variation extend although the theoretical premise of granting more loans either to
marginal applicants or to customers-defaulters does not seem to hold. Furthermore,
more capital requirements undermine the ability of banks to gain profits by
experiencing considerable loan losses. Likewise, the share of foreign owned assets in
a banking system does harm to stability to the extent that is associated with lower
profitability that stems from losses on loans.
Official supervision demonstrates a negative impact on bank soundness, through
intensifying credit risk and secondarily through equity capital. The latter is expected
since stricter authorities tend to intervene in bank decisions through suspending
dividends, superseding the rights of shareholders thereby such burden on bank

301
management may provoke corruption in lending activities and other centrifugal
forces of risk-taking. Restrictions on market entries lead to bank soundness by
lowering profits volatility as banks are released from potential competitive pressures
and therefore managers are engaged in less risk-taking activities when there exist
enough profit opportunities to exploit within a monopolistic environment. Moreover,
the fact that financial institutions are allowed to be subject to the scrutiny of private
monitoring has a negative bearing on financial stability, as it is the product of the
opposite forces of greater Z-score nominator and even higher credit risk.
We also observe GDP growth to predict significantly bank stability and profitability
along with less credit risk and variation in profits. In contrast, inflationary pressures
drive to diminishing asset returns and high volatility in banks‟ profits. Furthermore,
stock market activity tends to have no impetus on bank soundness although it seems
to predict asset returns mitigate losses occurring in lending activities.
As for the bank-level controls, financial fragility is attributed to asset size, which
tends to diminish every single component of Z-score at 1% significance level. Equity
capital seems to stabilize banks particularly through the Z-score nominator that
outpace its adverse repercussions on profit volatility. Cost inefficiency is associated
with low profitability and greater losses without the per se impact being sufficient to
determine bank stability. Last, income diversification and asset liquidity are
significant determinants of ROA, equity capital and sore but once we combine them
to construct the Z-score as dependent variable its effect fades out.

302
Table 31: Sensitivity analysis with alternative measures of stability
Random effects (RE) model with standard errors clustered at the bank level employing time dummies to capture time-
varying random effects, as their significance is evident after running standard F-tests. The first column reports the results
of the baseline model, that is the regression of alternative measures of risk on banks specific and macroeconomic
variables totally devoid of any institutional controls. We then include one at a time controls of regulation, supervision and
governance, in order to verify their stand-alone effect on bank stability as well as their „en masse‟ explanatory power in
the last column. All bank-specific variables are lagged one period to avoid the possibility of reverse causality. Standard
errors are in parentheses while asterisks ***, **, * denote the significance level being at 1%, 5% and 10%, respectively.
All dependent variables are winsorized at 1% of their distribution to mitigate the effect of outliers.
Variables ROA E/TA σROA Lon(ROA+
E/TA) Loan losses Z
Lerner 0.014*** 0.015 -0.005 0.409*** 0.015*** -0.901
(0.004) (0.019) (0.005) (0.121) (0.005) (5.456)
Concentration 0.002 0.022* 0.006** 0.205* 0.006* 17.531***
(0.009) (0.012) (0.003) (0.107) (0.003) (6.189)
Other Governance indicators
Activity restrictions 0.001** 0.007*** 0.0005* 0.078*** -0.001* -12.344***
(0.000) (0.002) (0.000) (0.011) (0.000) (2.075)
Capital regulation -0.001 -0.0001 -0.0002 -0.030*** 0.001** 4.450
(0.000) (0.003) (0.000) (0.009) (0.000) (3.088)
Foreign ownership -0.0002** 0.0003 0.0001 0.002 0.001** -35.368
(0.000) (0.001) (0.000) (0.006) (0.000) (22.468)
Official supervision 0.0001 -0.001 0.0001 0.003 -0.001* -9.045***
(0.000) (0.002) (0.000) (0.011) (0.000) (3.045)
Fraction of denied
entries
0.002 0.001 -0.009* 0.049 -0.001** 49.659***
(0.004) (0.018) (0.005) (0.140) (0.003) (16.865)
Private monitor 0.001 0.004 0.001 0.064* 0.003*** -19.250***
(0.001) (0.008) (0.001) (0.038) (0.001) (7.127)
Country-specific variables
GDPGR 0.062** -0.116 -0.052** 1.489** -0.073*** 144.442***
(0.024) (0.120) (0.022) (0.695) (0.025) (39.303)
Inflation -0.093** -0.080 0.083** -1.430 0.033 45.916
(0.123) (0.109) (0.037) (1.486) (0.032) (44.175)
Stock market turnover 0.007*** 0.001 -0.001 0.351*** -0.014*** 4.281
(0.002) (0.008) (0.001) (0.044) (0.002) (3.203)
Bank-specific variables
Q -0.001*** -0.017*** -0.0004** -0.071*** -0.000 -3.240
(0.000) (0.002) (0.000) (0.010) (0.000) (2.133)
E/TA 0.012 0.013* 3.307*** 0.003 62.171
(0.009) (0.008) (0.723) (0.007) (40.159)
Cost to income -0.004** 0.010 -0.003 0.069 0.007** 0.834
(0.002) (0.011) (0.003) (0.068) (0.003) (2.637)
TNINTINC/TI 0.010*** 0.050*** 0.008*** 0.258*** 0.001 0.201
(0.003) (0.018) (0.003) (0.091) (0.004) (7.427)
Liquidity 0.004** 0.031*** 0.003*** -0.049 0.002 0.769
(0.002) (0.007) (0.003) (0.043) (0.001) (2.506)
TIME/SPEC DUMMIES YES YES YES YES YES YES
OBSERVATIONS 7186 7188 7125 7175 6944 7186
BANKS 1888 1888 1877 1888 1823 1888
Wald χ2 775.77 622.70 269.29 3715.29 340.62 436.69

303
8.10. How market structure variables behave per specialization
group?
We opt to run model 1 for every bank group productive specialisation in order to see
how the results of the whole – albeit extremely heterogeneous - sample is determined.
To this end, if we employ the institutional variables set out in the previous analysis we
are bound to end up with incomparable regression output since data are not available
in all countries, in which banks are headquartering. Hence, we utilize the governance
indicator of World bank that proxies for general institutional quality instead of
encompassing distinct regulatory and supervisory policies. In an attempt to ease the
sensitivity analysis, we run model 8.1 for four large groups of bank specialisation; that
is, commercial, cooperative, savings and „other‟ banks. The latter further comprises all
the rest financial system40
that cannot construct a different group of appropriate size.
In table 32, we observe a negative bearing of market power on financial stability when
assessing the results of the full sample, which is further decomposed into the
respective destabilising effect in cooperative and savings banks as well as the opposite
tendency in „other‟ banks. Concentration maintains no explanatory power when the
analysis is conducted for specific bank types, whereas the full sample concludes on the
stabilising significance of HHI at 5% level. Moreover, regulatory quality enters
negative (positive) in commercial (cooperative, savings) banks resulting in an
increasing impact on bank soundness.
Other effects of the business cycle in terms of GDP growth boil down to a procyclical
tendency for the whole sample, with an indication at 10% significance level for the
cooperative banking group. Along the same lines, stock market turnover demonstrates
a negative effect only in the aggregate European banking sector. In contrast, the price
effect of economic development tends to diminish stability across all bank types but
the case of cooperative banks.
40
See the data section (8.5), which stipulates the structure of the sample.

304
Table 32: Model 8.1 output per bank type
Variables Commercial Cooperative Savings Other Full sample
Lerner 0.116 -1.032** -0.819* 0.242* -0.172*
(0.120) (0.506) (0.444) (0.142) (0.103)
Concentration -0.133 0.447 -0.053 0.206 0.191**
(0.119) (0.376) (0.392) (0.169) (0.091)
Other Governance indicators
Regulatory quality -0.137* 0.750*** 0.537** -0.077 0.389***
(0.070) (0.201) (0.210) (0.097) (0.049)
Country-specific variables
GDPGR -0.791 6.243* 1.301 -1.721 2.790***
(0.767) (3.502) (2.563) (1.750) (0.734)
Inflation -6.366*** 2.417 -6.774** -4.666** -3.622***
(1.043) (3.982) (3.356) (2.157) (0.876)
Stock market turnover 0.026 0.036 -0.461 -0.000 -0.164***
(0.039) (0.137) (0.177) (0.064) (0.033)
Bank-specific variables
Q -0.053*** 0.017 0.070** -0.025* 0.005
(0.011) (0.019) (0.030) (0.013) (0.009)
E/TA 0.798*** 2.842*** -5.584*** 0.654*** 0.469***
(0.258) (1.039) (0.987) (0.177) (0.162)
Cost to income -0.095 0.037 0.401** -0.038 -0.011
(0.076) (0.364) (0.169) (0.060) (0.054)
TNINTINC/TI -0.674*** 1.374*** -0.235 -0.846*** -0.389***
(0.126) (0.328) (0.519) (0.098) (0.079)
Liquidity -0.038 -0.321** -0.507* -0.035** -0.050***
(0.029) (0.126) (0.303) (0.015) (0.016)
TIME DUMMIES YES YES YES YES YES
SPECIALISATION
DUMMIES YES YES YES YES YES
OBSERVATIONS 1866 3887 2089 1278 9120
BANKS 509 1016 466 417 2408
COUNTRIES 27 13 16 23 27
The table reports evidence of model 8.1 replicating regressions for each productive specialisation group.
Because some of the I-variables are unavailable in countries with certain bak types, we alternatively
employ the indicator of regulatory quality as constructed by the World Bank, which gives an overall
picture of the institutional framework. Standard errors are in parentheses while asterisks ***, **, * denote
the significance level being at 1%, 5% and 10%, respectively.
Last, asset size follows a stabilising pattern in savings banks as opposed to the
opposite force in commercial and „other‟ banks; however, the underlying effect stands

305
negligible in the last column. In addition, the robust relationship between lagged
equity capital and Z-score across all previous results is addressed in the whole sample
but also in commercial, cooperative and „other‟ banks. In contrast, savings banks
appear to emit negative equity signals on their solvency levels. Additionally, cost
inefficiency has negative albeit insignificant impact on Z-score in line of the argument
that banks take on more risks so as to enhance their operating performance. On the
contrary, savings banks enjoy an opposite tendency probably due to their strategic
orientation to internalize potential costs.
Income diversification through OBS activities tends to plummet Z-scores in all bank
categories except for the savings and cooperative banks, in which risk diversification
takes place and insulates them from potential shocks. Therewithal, the partial
correlation between asset liquidity and stability comes negative over the majority of
financial institutions due to incurring opportunity costs. Exception to this rule
constitutes the case of commercial banks, the operation of which is more vulnerable to
a range of market risks.
8.11. Other robustness checks
In table 33, we re-estimate the model that gives out the extreme bounds of competition
and concentration taking account of all the possible combinations from four to five-
variable information sets. The low bound of the Lerner index is getting smaller to -
0.319 at 1% significance level with the extra addition of PRIV. However, the upper
bound stays put even after utilizing more than three-variable sets. The Herfindahl-
Hirschman index spreads the bound margin [-0.909, 1.053] by altering only the lower
bound when employing ACT, CAP, FOR, FRACT and PRIV. Thus, we conclude
about the fragility of market structure that needs only one replacement of I-variable set
in order to see an opposite sign or significance loss in the underlying partial
correlations.
When it comes to account for non-linearities, the U-shaped relationship is not traced in
the lower bound of market power whereas in that of HHI there exists no linear
association. In the other two cases (base and high bound), competition tends to
destabilize the banking market at the point where the Lerner index takes values 0.285

306
and 0.542, respectively. Apart from that, the base and high values of market structure
variables are similar to those in table 25, and the lower bound expands further in both
cases. On those grounds, we end up with fragile relationship between Z-score and
market power when it ranges from -0.179 to 0.917; however, the non-linear impact
becomes robust across the extreme bounds of market concentration [-1.005, -1.398] in
contradiction with insignificant bearing in the lower bound of market power.
Table 33: Further EBA of model 8.1
Variables Bounds Coefficient Std.
error t-value I-variables
Significance
(1%)
Significance
(5%)
Lerner
low -0.319 0.129 -2.48 CAP, OFF, FRACT,
PRIV Fragile(0) Fragile(0) base -0.155 0.108 1.44 -
high 0.362 0.138 2.62 ACT, FRACT
Lerner
low -0.179 0.165 -1.08 CAP, OFF, FRACT,
PRIV Fragile base 0.544 0.121 4.51 -
high 0.917 0.166 5.52 ACT, FRACT
Lerner^2
low -0.412 0.331 -1.24 CAP, OFF, FRACT,
PRIV Fragile
Infection points
[0.285, 0.542)
base -1.909 0.244 -7.83 -
high -1.693 0.333 -5.09 ACT, FRACT
CONC
low -0.909 0.160 -5.69 ACT, CAP, FOR,
FRACT, PRIV Fragile(1) Fragile(1)
base 0.537 0.092 2.64 -
high 1.053 0.089 11.840 FOR, OFF
Lerner
low 0.188 0.208 0.90 ACT, CAP, FOR,
FRACT, PRIV Fragile
base 0.544 0.121 4.51 -
high 0.543 0.145 3.74 FOR, OFF
Lerner^2
low -1.005 0.404 -2.49 ACT, CAP, FOR,
FRACT, PRIV Robust base -1.909 0.244 -7.83 -
high -1.398 0.145 3.74 FOR, OFF
Following model 8.1, the table reports the extreme bounds of concentration and Lerner index with the respective standard
errors and t-values. The column „B-variables‟ indicates the specific information set that constructs the underlying bound,
and the last two underline the relationship between market structure and financial stability as fragile or robust at 1% and
5% significance level according to whether their sign and significance persistently remains stable over many
specifications. The rows in grey follow EBA utilizing four and five-variable I-sets for robustness-checking reasons while
in the two rows below them, we include the quadratic term of Lerner index ad hoc for every extreme bound case in order
to check the U-shaped relationship as articulated by Martinez-Miera and Repullo (2010). Infection points refer to the
level in Lerner distribution where we see the switch in sign of the respective coefficient. The value „1‟ in the parentheses
next to „fragile‟ indication signifies the inclusion of one additional variable in order to make the parameter CONC
significant. The zero value indicates that in the baseline model the Lerner index comes insignificant.

307
We next conduct EBA from a pool of interaction terms that are affected by the
inclusion of four to five B-variables (table 34). We observe a different pattern in this
case as we end up with the same lower bound for Lerner index and the same upper
bound for HHI. In particular, the former ranges between [-2.630, 12.173] whereas
concentration withholds significance between the bounds [0.148, 1.058], with the use
of ACT, FOR, OFF, FRACT, PRIV (upper bound - Lerner) and CAP, FRACT (low
bound - HHI).
In contrast with table 27, in which all partial relationships are fragile and it takes only
the replacement of one variable to observe a switch in sign or loss in significance, at
least for the case of assessing two to three I-variables as conditioning information sets
we come up with a robust non-linear relationship between concentration and bank
soundness. In other words, market concentration affects the slope of market power on
risk-taking as long as we utilize different combinations of institutional variables.
When it comes to expand the size of I-variables set, the CONC*L interaction seizes to
demonstrate such robustness in a single case; that is, when the regression model
comprises ACT, CAP, FRACT and PRIV.
In this case, the argument of Martinez-Miera and Repullo (2010) about the risk-
shifting and margin effects that makes the relationship between competition and bank
failure risk switch sign still holds water across the whole range of bounds. In
particular, the purely linear bearing of Lerner index lies in-between 0.300 and 0.633,
which are very close to the results of table 6. On the contrary, the squared Lerner
index enters negative ranging from -1.084 and -1.272 for the CONC*L bounds and
even expanding in absolute levels between -1.262 and -1.400.

308
Table 34: Further EBA of model 8.2
Variables Bounds Coefficient Std. error t-value B-variables Significance
(1%)
Significance
(5%)
Lerner
low -2.630 0.357 -7.37 CAP, PRIV
Fragile(0) Fragile(0) base -0.010 0.108 1.42 -
high 12.173 1.650 7.38 ACT, FOR, OFF,
FRACT, PRIV
Lerner
low 0.300 0.125 2.41 CAP, PRIV
Fragile base 0.542 0.121 4.49 -
high 0.633 0.209 3.04 ACT, FOR, OFF,
FRACT, PRIV
Lerner^2
low -1.262 0.242 -5.21 CAP, PRIV
Fragile base -1.909 0.244 -7.83 -
high -1.400 0.416 -3.37 ACT, FOR, OFF,
FRACT, PRIV
CONC*L
low 0.148 0.106 1.40 ACT, CAP, FRACT
Fragile(1) Fragile(1) base 0.604 0.092 2.68 -
high 1.058 0.110 9.58 FOR, OFF, FRACT
Lerner
low 0.380 0.167 2.28 ACT, CAP, FRACT
Fragile base 0.542 0.121 4.49 -
high 0.584 0.207 2.82 FOR, OFF, FRACT
Lerner^2
low -1.084 0.328 -3.31 ACT, CAP, FRACT
Robust base -1.909 0.244 -7.83 -
high -1.272 0.409 -3.11 FOR, OFF, FRACT
Following model 8.2, the table reports the extreme bounds of concentration and Lerner index with the respective standard
errors and t-values. The column „B-variables‟ indicates the specific information set that constructs the underlying bound,
and the last two underline the relationship between market structure and financial stability as fragile or robust at 1% and
5% significance level according to whether their sign and significance persistently remains stable over many
specifications. The rows in grey follow EBA utilizing four and five-variable I-sets for robustness-checking reasons while
in the two rows below them, we include the quadratic term of Lerner index ad hoc for every extreme bound case in order
to check the U-shaped relationship as articulated by Martinez-Miera and Repullo (2010). The value „1‟ in the parentheses
next to „fragile‟ indication signifies the inclusion of one additional variable in order to make the parameter CONC*L
significant. The zero value indicates that in the baseline model the Lerner index comes insignificant.
8.12. Conclusion
This study addresses whether the relationship between market structure and financial
stability is significant under different specifications for the European Union since the
advent of the single currency. Thus, it extends the bulk of empirical analysis to draw
remarks on the validity of the underlying relationship subject to different information
sets out of a pool of various bank-specific, macroeconomic and institutional factors
that have been already addressed in the literature.

309
EBA methodology systematically investigates the partial correlations of market
concentration and bank competition with bank soundness employing a) linear effects
of regulatory and supervisory variables, b) non-linear effects I-variables with
competition, c) interactions of I-variables with bank market power, d) foreign
ownership, e) non-linearities between governance indicators with competition, f)
different dependent variables that encompass different aspects of bank risk and g)
sensitivity analysis per bank specialization.
We found a fragile relationship between the Lerner index and Z-score both at 5% and
1% significance level, when utilising the effect of I-variables in levels (model 8.1).
When interactions come into play, the Lerner index follows the same pattern taking
account of different-sized information sets. However, once we run model 8.1 and 8.2
with the inclusion of quadratic term, the underlying fragility stems particularly from
the pure linear impact of market power, as the squared term is persistently significant
across all extreme bounds. We also trace this U-shaped relationship to take place in
cooperative and savings banks and the whole sample of the European financial system
in general. Market power seems to empower bank solvency up to the level of 28.5%,
where monopolistic behaviour have devastating repercussions.
Concentrated markets are highly correlated with bank soundness across any
specification and robustness check. Such impact is traced in the tendency of
concentration to predict significantly equity capital at 10% level, respectively.
However, fragility emanates from bank managers who engage in risk-taking in lending
transactions, and model 1, which investigates its impact on Z-score in levels. Once we
analyze whether HHI affects the relationship between market power and Z-score in
slopes, we end up with robust bearing in the standard EBA (table 27) whereas in table
34 it becomes fragile in only one case out of 20 regressions of different I-variable
information sets.
Besides, we come up with collateral issues that have been appealing in many studies in
terms of the policy implications they put forward. In general, the majority of
institutional variables is capable of affecting bank stability individually. When we
assess their significance, more financial stability is traced in markets where we
observe more capital regulation and requirements of information dissemination
whereas restrictions on non-traditional activities as well as supervisory intervention

310
and foreign ownership tend to destabilize the financial system. Besides, when they are
interacting with market power, we identify the same tendency amid conditions of
monopolistic competition.
Going one step beyond the non-linear effects of country-level variables, we assess
how market variables affect Z-score when I-variables interact with foreign ownership.
In short, banking markets, within which foreign-owned banks are subject to 1) more
capital regulation, 2) official supervisory intervention, 3) freer market entries and 4)
much information requirements for the private sector, experience relatively higher
degree of risk-taking. Market power has no impact in bank risk-taking while market
concentration determines the market power-stability nexus at considerable level.
The same pattern is evident when utilising governance indicator to be interacting with
bank-level competition. The Lerner index maintains its significance in all cases except
that of plugging voice and accountability in the model as opposed to the non-linear
explanatory power of HHI taking place when market power underperforms. The price
mark-up over marginal cost has a considerable bearing on bank soundness the more
the state fulfils individual rights and implements policies free of potential political
interventions. In particular, bank soundness comes in tandem with low activity
restriction and official intervention as well as higher capital requirements and private
monitoring within a context of well-developed and respectful institutions.
Once we employ different aspects of bank risk, some interesting results pop up. First,
ROA and credit risk are sufficiently predicted by market power while market
concentration is associated with more capital buffers and losses on lending activities.
Amid conditions of ongoing regulatory policies, cooperative and savings banks are
more vulnerable to the bearing of market power as opposed to the operational strength
of „other‟ banks.

311
Chapter 8 Appendix
Information on the construction of Regulatory and Supervisory Variables
Variable(s) Definition Source and Quantification World Bank Guide Questions
(a) Securities
Activities
The extent to which banks
may engage in
underwriting, brokering
and dealing in securities,
and all aspects of the
mutual fund industry.
OCC and WBG 4.1 (higher values, more
restrictive)
4.1 What is the level of regulatory
restrictiveness for bank participation in
securities activities (the ability of banks
to engage in the business of securities
underwriting, brokering, dealing, and all
aspects of the mutual fund industry)?
Unrestricted = 1 = full range of activities can be
conducted directly in the bank; Permitted = 2 = full
range of activities can be conducted, but some or
all must be conducted in subsidiaries; Restricted =
3 = less than full range of activities can be
conducted in the bank or subsidiaries; and
Prohibited = 4 = the activity cannot be conducted in
either the bank or subsidiaries.
(b) Insurance
Activities
The extent to which banks
may engage in insurance
underwriting and selling.
OCC and WBG 4.2 (higher values, more
restrictive)
4.2 What is the level of regulatory
restrictiveness for bank participation in
insurance activities (the ability of banks
to engage in insurance underwriting and
selling)?
Unrestricted = 1 = full range of activities can be
conducted directly in the bank; Permitted = 2 = full
range of activities can be conducted, but some or
all must be conducted in subsidiaries; Restricted =
3 = less than full range of activities can be
conducted in the bank or subsidiaries; and
Prohibited = 4 = the activity cannot be conducted in
either the bank or subsidiaries.
(c) Real Estate
Activities
The extent to which banks
may engage in real estate
investment, development
and management.
OCC and WBG 4.3 (higher values, more
restrictive)
4.3 What is the level of regulatory
restrictiveness for bank participation in
real estate activities (the ability of banks
to engage in real estate investment,
development, and management)?
Unrestricted = 1 = full range of activities can be
conducted directly in the bank; Permitted = 2 = full
range of activities can be conducted, but some or
all must be conducted in subsidiaries; Restricted =
3 = less than full range of activities can be
conducted in the bank or subsidiaries; and
Prohibited = 4 = the activity cannot be conducted in
either the bank or subsidiaries.

312
(d) Bank
Owning
Nonfinancial
Firms
The extent to which banks
may own and control
nonfinancial firms.
OCC and WBG 4.4 (higher values, more
restrictive)
4.4 What is the level of regulatory
restrictiveness for bank ownership of
nonfinancial firms? Unrestricted = 1 = a bank may own 100 percent of
the equity in any nonfinancial firm; Permitted = 2 =
a bank may own 100 percent of the equity of a
nonfinancial firm, but ownership is limited based
on a bank's equity capital; Restricted = 3 = a bank
can only acquire less than 100 percent of the equity
in a nonfinancial firm; and Prohibited = 4 = a bank
may not acquire any equity investment in a
nonfinancial firm.
Activity
restrictions
(overall index)
The sum of (a), (b), (c) and
(d).
(a)+(b)+(c)+(d)
Higher values indicate more actovity restrictions.
Fraction of
Entry
Applications
Denied
The degree to which
applications to enter
banking are denied.
WBG (1.9.1 + 1.10.1) / (1.9 + 1.10) (pure number)
1.9 In the past five years, how many
applications for commercial banking
licenses have been received from
domestic entities?
1.9.1 How many of those applications
have been denied?
1.10 In the past five years, how many
applications for commercial banking
licenses have been received from
foreign entities?
1.10.1 How many of those applications
have been denied?
(a) Overall
Capital
Stringency
Whether the capital
requirement reflects certain
risk elements and deducts
certain market value losses
from capital before
minimum capital adequacy
is determined.
WBG 3.1.1 + 3.3 + 3.9.1 + 3.9.2 + 3.9.3 + (1 if 3.6
< 0.75)
3.1.1 Is the minimum capital-asset ratio
requirement risk weighted in line with
the Basel guidelines? Yes / No
Yes = 1; No = 0 3.3 Does the minimum ratio vary as a
function of market risk? Yes / No
Higher values indicating greater stringency.
3.9.1 Are market value of loan losses
not realized in accounting books
deducted? Yes / No
3.9.2 Are unrealized losses in securities
portfolios deducted? Yes / No 3.9.3 Are
unrealized foreign exchange losses
deducted? Yes / No

313
3.6 What fraction of revaluation gains is
allowed as part of capital?
(b) Initial
Capital
Stringency
Whether certain funds may
be used to initially
capitalize a bank and
whether they are officially
verified.
WBG 1.5: Yes = 1, No = 0: WBG 1.6&1.7: Yes=0,
No=1.
1.5 Are the sources of funds to be used
as capital verified by the
regulatory/supervisory authorities? Yes /
No
Higher values indicating greater stringency.
1.6 Can the initial disbursement or
subsequent injections of capital be done
with assets other than cash or
government securities? Yes / No
1.7 Can initial disbursement of capital
be done with borrowed funds? Yes / No
Capital
Regulatory
Index
The sum of (a) and (b).
(a) + (b)
Higher values indicate greater stringency.
Official
Supervisory
Power
Whether the supervisory
authorities have the
authority to take specific
actions to prevent and
correct problems.
WBG 5.5 + 5.6 + 5.7 + 6.1 + 10.4 + 111.2 + 11.3.1
+ 11.3.2 +11.3.3 + 11.6 + 11.7 + 11.9.1 + 11.9.2 +
11.9.3
5.5 Does the supervisory agency have
the right to meet with external auditors
to discuss their report without the
approval of the bank? Yes / No
Yes = 1; No = 0
5.6 Are auditors required by law to
communicate directly to the supervisory
agency any presumed involvement of
bank directors or senior managers in
elicit activities, fraud, or insider abuse?
Yes / No
Sum of these assigned values, with higher values
indicating greater power.
5.7 Can supervisors take legal action
against external auditors for negligence?
Yes / No
6.1 Can the supervisory authority force a
bank to change its internal
organizational structure? Yes / No
10.4 Are off-balance sheet items
disclosed to supervisors? Yes / No
11.2 Can the supervisory agency order
the bank's directors or management to
constitute provisions to cover actual or
potential losses? Yes / No
11.3 Can the supervisory agency
suspend the directors' decision to
distribute: 11.3.1 Dividends? Yes / No
11.3.2 Bonuses? Yes / No
11.3.3 Management fees? Yes / No
11.6 Can the supervisory agency legally

314
declare-such that this declaration
supersedes the rights of bank
shareholders-that a bank is insolvent?
Yes / No
11.7 Does the Banking Law give
authority to the supervisory agency to
intervene that is, suspend some or all
ownership rights-a problem bank? Yes /
No 11.9 Regarding bank restructuring
and reorganization, can the supervisory
agency or any other government agency
do the following: ? Yes / No
11.9.1 Supersede shareholder rights?
Yes / No
11.9.2 Remove and replace
management? Yes / No
11.9.3 Remove and replace directors?
Yes / No
(a) Certified
Audit Required
Whether there is a
compulsory external audit
by a licensed or certified
auditor.
WBG 5.1 * 5.3 (Yes = 1; No = 0)
5.1 Is an external audit a compulsory
obligation for banks? Yes / No 5.3 Are
auditors licensed or certified? Yes / No
(b) Percent of
10 Biggest
Banks Rated by
International
Rating
Agencies
The percentage of the top
ten banks that are rated by
international credit rating
agencies.
WBG 10.7.1 (percent)
10.7.1 What percent of the top ten banks
are rated by international credit rating
agencies (e.g., Moody's, Standard and
Poor)?
(c) No Explicit
Deposit
Insurance
Scheme
Whether there is an explicit
deposit insurance scheme
and, if not, whether
depositors were fully
compensated the last time a
bank failed.
WBG 1 if 8.1=0 and 8.4=0; 0 otherwise 8.1 Is there an explicit deposit insurance
protection system? Yes / No
Yes =1; No =0
8.4 Were depositors wholly
compensated (to the extent of legal
protection) the last time a bank failed?
Yes / No
Higher values indicate more private supervision
(d) Bank
Accounting
Whether the income
statement includes accrued
or unpaid interest or
principal on nonperforming
loans and whether banks
are required to produce
consolidated financial
statements.
WBG (10.1.1 - 1)*(-1) + 10.3 + 10.6
10.1.1 Does accrued, though unpaid
interest/principal enter the income
statement while the loan is still non-
performing?
Yes=1; No=0 10.3 Are financial institutions required
to produce consolidated accounts
covering all bank and any non-bank
financial subsidiaries? 10.6 Are bank
directors legally liable if information
disclosed is erroneous or misleading?
Sum of assigned values, with higher values
indicating more informative bank accounts.

315
Private
Monitoring
Index
Whether (a) occurs, (b)
equals 100%, (c) occurs,
(d) occurs, off-balance
sheet items are disclosed to
the public, banks must
disclose risk management
procedures to the public,
and subordinated debt is
allowable (required) as a
part of regulatory capital.
WBG: (a) + [1 if (b) equals 100% ; 0 otherwise] +
(c) + (d) + 10.4.1 + 10.5 + 3.5
10.4.1 Are off-balance sheet items
disclosed to the public? Yes / No
Yes = 1; No = 0
10.5 Must banks disclose their risk
management procedures to the public?
Yes / No
Higher values indicating more private supervision. 3.5 Is subordinated debt allowable
(required) as part of capital? Yes / No
Foreign-Owned
Banks
The extent to which the
banking system's assets are
foreign owned.
WBG 3.8 (percent)
3.8 What fraction of the banking
system's assets is in banks that are 50%
or more foreign owned?
Definition of Governance indicators
Variables Description
Voice and accountability
It captures the general perception of the ability of a country‟s citizens
to pick their government exercising their constitutional rights of free
expression, association, etc.
Political stability It measures the probability of that national government of losing
control or overturning by violent or terrorist parties.
Government effectiveness
It estimates the quality of public and civil service, the degree of its
independence from political pressures, the quality of policy
formulation and conducting as well as the commitment for
accomplishment
Rule of law
It engulfs the whole spectrum of law enforcement by police and
judicial system so as to prevent crime, violence and breach of
personal rights. It is also indicative of how much agents trust and
comply with rules.
Control of corruption
It indicates the degree of corruption as being expressed by the
exploitation of public power to the best interests of elites and other
private parties.
Credit depth of information
sharing
It measures the quality and accessibility of credit information
disseminated by public or private registries in order to facilitate
lending transactions.

316

317
CHAPTER 9
Synopsis

318

319
9.1. Major findings of the research
In chapter 6, we investigate potential effects of bank competition as the latter is
defined as the price mark-up over marginal cost. We end up with monopolistic pricing
to be persistently associated with low levels of asset size for cooperative, savings and
„other‟ banks. The relationship turns out to be non-linear for savings and „other‟
banks following a positive pattern for low levels of total assets up to a point where
contestable conduct or economies of scale turn it negative. Cooperative banks
experience a negative pattern only in lower values of total assets since the dominating
cooperative banks of Germany constitute a homogenous set of equally sized
institutions.
The positive sign of concentration gives credit to the SCP paradigm once we see the
general picture of European banking sectors as well as the savings banks themselves.
When it comes to construct Herfindahl-Hirschman indices for deposits and loans
products, concentration is significant only for „other‟ banks in loans market, and for
commercial banks in both deposits and loans markets. Notwithstanding that relative
market power bears no significance in the whole sample, a positive indication is
traced in „other‟ banks and in greater levels of market share of cooperative banks.
However, a more competitive pricing seems a common practice for commercial banks
and for cooperative banks of relatively low market share.
Relative efficiency hypothesis is verified against „quit life hypothesis‟ by the negative
effect of total cost over total income variable at 1% level of significance along the
lines of Koetter et al. (2012), who concluded the same for US banks. We verify,
therefore, the strategic option of banks to exploit lower costs in favour of their
customers either in the form of lower loan rates or higher deposit rates (Vennet,
2002). Furthermore, credit risk motivates commercial and cooperative banks to apply
higher profit margins, a strategy which is contradistinction with that of „other‟ banks.
As for the economic conditions, we can only examine the effect of GDP growth rate
on banks of specific specialisation. In fact, high rates of economic expansion operate
procyclically for savings banks and countercyclically for commercial banks. Higher
elasticity of aggregate demand also induces banks to offer lower prices, especially in

320
the case of commercial and cooperative banks. Legal stringency proves to have a
positive impact only on the competitive behaviour of cooperative banks.
Next, we delve into the analysis of how such - or next akin to – effects influence the
pricing conduct of banks at the income level. In the same vein, commercial banks of
greater asset size tend to impose low prices on other interest and non-interest
products, a case that remains the same for cooperative banks, which opt for
competitive price on loans as well as higher fees. Economies of scale seem to produce
lower fees and higher prices on other non-interest products for savings banks whereas
„other‟ banks apply generally lower prices except for other interest activities. Non-
linearities have the same pattern for commercial, cooperative and „other‟ banks
yielding a negative sign on L-othernint as soon as it turns positive at higher levels of
total assets; in savings banks there is only a linear and positive association. Contrary
to commercial assets, all the other banks demonstrate first a positive effect on L-fees,
which then turns into negative whereas the same tendency is traced for L-loans in all
cases except savings banks. Profit margins on other interest products demonstrate a
diminishing (increasing) trend when „other‟ (savings) banks are getting larger,
notwithstanding higher scale economies reverse the sign.
Collusion hypothesis does play a significant role for commercial banks in
implementing higher fees while savings banks follow exactly the same strategy for
other interest income. Greater collusion in the deposit market promotes competitive
loan rates by cooperative and „other‟ banks, with the former reaping the benefits of
collusion in the loans market through higher loan rates. „Other‟ banks utilize
monopolistic structure in the deposit market by enjoying relatively higher prices on
other interest activities.
Higher market share is correlated with lower fees in commercial and cooperative
banks and lower other interest charges in cooperative and savings banks; the latter
also prefers the utilisation of low other non-interest rates. „Other‟ banks apply lower
rates on loans and other non-interest products and higher prices on the remainder.
Higher relative market power in the deposit market drives all banks to compete each
other for loan rates, a behaviour which alters in commercial and cooperative banks
when they enjoy higher market share in the loans market. In addition, a common
feature for cooperative and „other‟ banks of greater market share in the loans market

321
consists in the use of lower fees but only „other‟ banks are able to impose higher fees
when they acquire market share in the deposits market. Moreover, charges on other
interest and non-interest activities contain their negative nexus market share in the
loans market.
Cost efficiency drives all banks to charge low loan rates, which are even affected by
loan losses in the portfolios of commercial, cooperative and savings banks. More
portfolio diversification makes cooperative and savings banks eager to charge fees
and other non-interest rates with an indication that same holds for „other‟ banks when
it comes to charge fees. Higher level of total equity that reflects risk aversion or an
explicit signal of bank creditworthiness enables cooperative and savings banks to
deploy a monopolistic strategy on other non-interest activities. Cooperative banks
with more liquid assets enjoy lower rates on other interest products followed by
commercial banks in offering cheaper loans. Savings banks do the same as
commercial banks but additionally compensate the underlying opportunity cost of
liquid assets through higher levels of non-interest rates.
Average country income has a positive impact on cooperative banks in charging
higher other interest prices, while demand elasticity motivate cooperative and saving
banks to apply lower fees and other non-interest charges. On the other hand, „other‟
banks seem to take advantage of higher fees. In periods of high inflation rate,
cooperative banks operate in contradistinction to commercial banks entertaining
considerable fees in order to possibly counterbalance potential losses on fixed loan
rates. Last, stricter lending laws turns out to bring about higher other interest charges
on behalf of cooperative banks against the stream of diminishing returns for the rest
banking specialisations.
Chapter 5 aims to contribute to the literature that compares alternative parametric
methodologies of estimating profit and cost efficiency under widely employed
definitions of bank inputs/outputs, namely the intermediation and value-added
approach. Hence, we applied REM, DFA and TFA methodologies along with
differently truncated versions of them at 1%, 5% and 10% level of their distribution
tails in order to produce averaged efficiency scores at the bank level. Only the
specification of TFA estimated for each year enables us to utilize time-varying

322
efficiency scores of differently specialized financial institutions over the period 2003-
2008 for the enlarged EU-27 region.
We conclude that all methodologies turn out to produce different levels of efficiency
although they may be comparable if we juxtapose their truncated specifications.
Interestingly, the relative rankings of banking markets and asset classes with respect
to their averaged cost/profit efficiency are almost identical across all approaches; in
contrast, that is not the case for different productive specializations. According to the
latter, cost efficiency is prevalent in the developed European region and in
evolutionary dominating pace over that of EU-12; however, the developing sub-group
has experienced persistently higher profit efficiency reaping the benefits of their
better opportunities for operational expansion.
Next, we estimate yearly scale economies for every banking market and observe
considerable discrepancies between their average values. Apart from few exceptions41
in the analysis, both approaches start from different points, that is IA approach comes
from above to converge eventually to the unity level in 2008, while VA approach
identifies increasing scale economies at the beginning of the period and then settles to
full scale exploitation. Last, we end up with significant „catching-up effect‟ and
converging dispersion of cost efficiency scores under both IA and VA approaches and
dynamic specifications. Profit efficiency demonstrates the same converging pattern at
even higher levels albeit beta/sigma convergence is clearly evident in so far ADL
specification allows for dynamic effects. Above-unity cases if assessed individually
make little economic sense as highlighting efficiency series fluctuate between
negative and positive values year by year. However, that pattern is counterbalanced
by the positive bearing of AR(1) variable.
In chapter 8, we provide evidence on whether the statistical relationship between
market structure and financial stability turns out significant under different
specifications for the European Union since the advent of the single currency. Thus, it
extends the bulk of empirical analysis to draw remarks on the validity of the
underlying relationship subject to different information sets out of a pool of various
bank-specific, macroeconomic and institutional factors that have been already
addressed in the literature.
41
Belgium, Luxembourg, United Kingdom and Poland.

323
EBA methodology systematically investigates the partial correlations of market
concentration and bank competition with bank soundness employing a) linear effects
of regulatory and supervisory variables, b) non-linear effects I-variables with
competition, c) interactions of I-variables with bank market power, d) foreign
ownership, e) non-linearities between governance indicators with competition, f)
different dependent variables that encompass different aspects of bank risk and g)
sensitivity analysis per bank specialization.
We found a fragile relationship between the Lerner index and Z-score both at 5% and
1% significance level, when utilising the effect of I-variables in levels (model 1).
When interactions come into play, the Lerner index follows the same pattern taking
account of different-sized information sets. However, once we run model 1 and 2 with
the inclusion of quadratic term, the underlying fragility stems particularly from the
pure linear impact of market power, as the squared term is persistently significant
across all extreme bounds. We also trace this U-shaped relationship to take place in
cooperative and savings banks and the whole sample of the European financial system
in general. The significance of squared Lerner index keeps pace with that of the
Lerner index itself, as we run ad hoc regressions when competition turns significant.
Reconciling of seemingly contending strands of the relevant literature, competition
and bank soundness follow a U-shaped path with a reverse in the pertinent coefficient
at the points 0.285 and 0.542 of the distribution.
Concentrated markets are highly correlated with bank soundness across any
specification and robustness check. Such impact is traced in the tendency of
concentration to predict significantly equity capital at 10% level, respectively.
However, fragility emanates from bank managers who engage in risk-taking in
lending transactions, and model 1, which investigates its impact on Z-score in levels.
Once we analyze whether HHI affects the relationship between market power and Z-
score in slopes, we end up with robust bearing in the standard EBA (table 6) whereas
in table 12 it becomes fragile in only one case out of 20 regressions of different I-
variable information sets.
Besides, we come up with collateral issues that have been appealing in many studies
in terms of the policy implications they put forward. In general, stringent activity

324
restrictions coupled with harsh exercize of supervisory power on managerial decisions
and foreign ownership are conducive to instability in the financial system.
Going one step beyond with I-variables interacting with foreign ownership we verify
that in banking markets of considerably foreign-owned bank assets, activity more
capital regulation, official supervisory intervention, freer market entries and sufficient
information requirements for the private sector, experience relatively higher degree of
risk-taking. We therefore end up with contradictory results, which endorse the
mandate for special treatment of foreign institutions since they require fewer
restrictions on capital reserves, loose intervention of supervisory authorities and
limited information transparency for their operational robustness.
The same pattern is evident when utilising governance indicator to be interacting with
bank-level competition. The Lerner index maintains its significance along with the
explanatory power of HHI when market power comes at 10% significance level. The
price mark-up over marginal cost has a considerable bearing on bank soundness the
more the state fulfils individual rights and implements policies free of potential
political interventions. In particular, bank soundness comes in tandem with low
activity restriction and official intervention as well as higher capital requirements and
private monitoring within a context of well-developed and respectful institutions.
Once we employ different aspects of bank risk, some interesting results pop up. First,
ROA and credit risk are sufficiently predicted by market power while market
concentration is associated with more capital buffers and losses on lending activities.
Amid conditions of ongoing regulatory policies, cooperative and savings banks are
more vulnerable to the bearing of market power as opposed to the operational strength
of „other‟ banks.

325
9.2. Policy implications of the research
The advent of Euro and the concomitant formulation of a single market brought about
considerable challenges and opportunities for the whole banking industry. In chapter
6, our analysis of the market power in 9 developed markets suggests imperfect
competition but not at levels that signify collusive tendency. However, the market of
Denmark and Sweden seem to experience more than 33% of price mark-up over
marginal cost whereas Spain lies in the other extreme with negative Lerner index. The
latter is justified by possible predatory pricing or irrational pricing conduct since cost-
raising strategy is not illustrated by high marginal costs.
We then attempt to explain competition in terms of which are the significant drivers
conducive to it. In particular, monopolistic pricing appears a common practice in
small-sized savings and „other‟ financial institutions as far as their increased size
makes them act competitively. In contrast, cooperative banks tend to impose low
prices in an attempt for high market shares albeit at greater levels the same positive
pattern holds. We take account of non-linearities, if any, between asset size and
market power and provide evidence that different bank types tend to behave
asymmetrically along the pace of increasing assets. Indeed, monopolistic pricing on
other non-interest bearing products comes along in savings banks and „other‟ banks of
higher size while banks turn out to impose high prices on loans (except savings
banks), fees (except commercial banks); other interest income activities are highly
charged by savings banks of limited asset class. Our analysis, therefore, gives insight
to the contribution of size on pricing behaviour and its role in upcoming bank failures.
We endorse also the necessity for antitrust policies that stand up against collusive
practices of concentrated markets, as savings (commercial) banks implement higher
other interest income (fees). With concentrated loans markets, market power is also
evident in „other‟ and commercial banks while the same holds for the latter in
deposits markets. Even so, cooperative („other‟) banks enjoy higher profit margins on
loans (other interest products) if the loans (deposits) market is considerably
concentrated. Likewise, banks with high market shares as well as those striving to get
the maximum out of it tend to behave competitively opposing to the operation of
„other‟ banks, which appear to enjoy higher fees due to their high market share in the
deposits market. Hence, we cannot verify (except for „other‟ banks) the relative

326
market power hypothesis and suggest policy makers should take account of certain
bank specialisations that enjoy high margins in specific product categories amid
collusive practices across either loans or deposits markets.
In addition, the efficient operation turns out significant in European banking as low
costs induce banks to charge lower interest rates on loans or higher deposit rates.
However, that gives no credit to the inherent impetus of banks for higher market
shares in order to exploit their power, with the exception of „other‟ banks and in high
levels of market share of cooperative banks. In contrast, commercial, cooperative with
higher market shares impose low fees, while cooperative and savings banks utilize
low other interest charges. Cost economies, therefore, constitute an indispensable
catalyst of convergence towards competitive prices while incentives in favour of
income diversification induce banks (cooperative, commercial, „other) in charging
higher fees and others (cooperative, commercial) for high other non-interest rates.
More capitalized banks (cooperative, savings) also tend to surrender in high prices of
other non-interest bearing activities, an issue which is directly linked to capital
requirements given that they constitute a considerable part of a bank‟s portfolio.
Furthermore, we signify the extension of Basel III in incorporating liquidity
requirements towards stable institutions that provide liquidity to market participants
effectively and manage payment transactions across different regions. Along the lines,
the analysis shows that more liquid cooperative (commercial) banks offer other
interest products (cheap loans) at low prices although savings banks tend also to
counterbalance the opportunity cost of liquid assets through higher non-interest rates.
The ongoing process of regulation with Basel III that sets out additional requirements
on a countercyclical basis, our analysis verifies such need only for savings given that
commercial banks react contrarily to the business cycle. The latter, however, may
imply poor monitoring and screening practices as well as (limited) securitisation of
low „quality‟. In addition, in economies of high GDP per capita and inflation
cooperative banks tend to charge higher other interest prices to make up for possible
losses on fixed loan rates even under strict lending loans. Hence, there is room for
further institutional reforming in such cases especially in the group of „other‟ banks,
which seems to exploit higher elasticity of aggregate demand and impose higher fees.

327
Although there has been a considerable progress towards the contestability of the
European banking industry, the concomitant pressure on profitability is bound to
bring about restructuring and consolidation procedures. Hence, our analysis of cost
and profit efficiency across various methodologies and approaches aims at providing
evidence if convergence dynamics is taking place. However, we acknowledge the
heterogeneity of financial institutions and the utopian scope of perfect competitive
banking market due to the per se idiosyncratic features of banks.
In chapter 7, we report similar rankings of banking industries and asset classes across
different specifications with respect to cost and profit efficiency although of different
level, whatsoever. We need to know the underlying differences of European countries
so as for policy makers to boost the integration procedure especially for the
developing subgroup. Although rankings with respect to various productive
specialisations diverge due to bank specificities, the way that banking markets are
structured gives more insight at a disaggregated level. The gap in cost efficiency
between EU-15 and EU-12 seems to be closing while profit efficiency of the latter is
in dominating pace. After the adoption of Euro, fierce competition drove banks of the
developed world to less developed regions as deregulation gave permission to new
market entries in the form of branches and subsidiaries or through mergers and
acquisitions. In so doing, these entries have set new standards in risk management and
operational performance by means of economising on input costs as well as on input
and output mix.
The analysis on scale economies produces mixed evidence if we employ different
definitions of bank output. In general, by the onset of the financial crisis banks settled
to constant returns of scale converging from different starting points. If we define cost
function in terms of producing securities, European countries seem to experience
diseconomies of scale due to irrational profligacy of trading losses whereas if we
consider deposits as part of the production output, economies of scale have been
considerable up to the point of a „deadlock‟ in 2008. On the whole, the catching-up
effect in cost and profit efficiency turns out significant according to various
specifications as well as the their dispersion across the whole European market.
Coupled with intensified competitive conditions, financial institutions have employed
the best practices to enhance their operating performance and it poses challenges for

328
further progress on regulation, supervision and corporate governance towards market
integration and level-playing field in the financial system.
The aforementioned analysis on competition and efficiency turns out to be conducive
to economic development and financial stability. After conducting sensitivity analysis
of market structure variables on bank soundness (Z-score), we utilized various
information sets of regulation and supervision variables up to the most recent year
available (2008). As there exist diverging strands of the literature on the competition-
stability nexus, the results report robust evidence on the fragility of the inderlying
relationship as being contingent on specific aspects of banks‟ institutional framework.
We also reconcile them by investigating the significance of the quadratic term of the
Lerner index, concluding about the inverse U-shaped relationship of market power
and stability. At the lowest level of its coefficient, market power has only negative
bearing on stability, while all the other possibilities illustrate that the change in sign
occurs within the bound [0.285, 0.542], which corroborates the respective values of
0.28 and 0.33 of Beck et al. (2012).
Evidence on concentration verifies its persistent significance in determining bank
solvency although excessive loan provision undermines the underlying relationship.
Hence, we endorse the importance of too-big-to-fail policies in the financial system in
conjunction with pertinent regulatory standards on capital requirements, liquidity
issues and stress testing. The set of institutional variables used in the analysis enters
highly significant if assessed individually or collectively. In particular, low activity
restrictions, foreign ownership and supervisory power are conducive catalysts of
financial instability, whereas higher capital requirements and private monitoring
operating to the contrary. Therefore, efforts to more effective capital regulation as set
out in Basel III should continue unabated considering some interesting issues. First,
there is little room for income diversification so the authorities should reconsider the
destabilising impact of banks‟ engagement in risky projects.
In addition, foreign ownership brings about negative repercussions on bank soundness
possibly due to the potential cost burden that the parent bank has to bear vis-à-vis
insolvency and liquidity shocks (Claessens et al., 2001b). The latter is evident if
exploitation of market power in foreign markets takes the form of acquiring national
banks in monopolistic markets, taking advantage of their high cost efficiency or

329
establishing branches and subsidiaries in quest of large market shares and there exists
concurrently considerable inadequacy of „self-protection‟. Thus, policies need to
incorporate – though they have done so to some extent - additional requirements on
capital and liquidity within the foreign-owned banking group. Moreover, supervisory
authority should take into consideration that high degree of intervention to managerial
decisions ends up destabilising the market if associated with corruption in lending and
obstruction of bank operations (Barth et al., 2004).
On the other hand, in markets of high degree of foreign ownership the analysis
suggests few capital requirements, less intensified supervision, limited market entries
and information dissemination to the private sector. The results show that the previous
recommendations have an adverse effect if institutional controls demonstrate non-
linear effects on bank soundness through foreign-owned structures.
9.3. Limitations of research
Before moving into some possible recommendations for further research in European
banking, we should mention several methodological problems and limitations that are
quite common amongst similar studies of empirical research.
Considering the first contribution on bank competition and its possible determinants
even at the level of income sources, a considerable drawback is the lack of
information with respect to the price of borrowed funds as a standard bank input.
However, this drawback constitutes the explanatory strength of our model since the
inclusion of the underlying input may capture some degree of market power of the
incumbent banks in deposits markets, and thus may produce bias on the level of
marginal cost and, concomitantly, that of competition (Ariss, 2010). Thus, we can by
no means juxtapose the results of our model with that specification comprising the
additional input, albeit the necessity of doing so is dominated by the potential bias of
the results and the significant fit of our model specification.
As for the estimation of the Lerner index, with respect to specific income sources, we
utilize only those with sufficient information. Our analysis would be fully fledged had
we had a balanced sample of all the relevant constituents of banks‟ portfolio structure.

330
In addition, all empirical studies that employ bank-specific factors presumably
suppose that bank outputs and inputs are homogenous or at least the degree of
heterogeneity is not enough to render the analysis erroneous. Surmising, for example,
the inputs of loans and other investments, the Bankscope database does not account of
different categories of loans and investments but alternatively aggregates them into
one general group.
The second contribution on the efficiency analysis of the European banking industry
is contingent on some methodological assumptions. For example, the DFA approach
assumes that over the sample period the error term cancels each other out and what is
left off is the average efficiency level for each financial institution. If the period is too
short, we cannot disentangle the overall bank inefficiency out of the composed error
term, and in case of being too long market conditions may pose a threat on the
stability of bank inefficiency. Notwithstanding we follow the recommendation of
Mester (2003) for 6-year period as the best time interval for counterbalancing the
underlying centrifugal forces, the introduction of EMU may challenge the robustness
of the results. Furthermore, the TFA approach may also highlight the fact that
efficiency analysis in not a matter of a unique approach. Indeed, it is theoretically
founded in the arbitrary assumption that the thick frontier, constructed by the
technology of the most cost and profit efficient 1% within each asset class of the
distribution, is well defined and represented. Even the REM is potentially suspect if
we consider that the inherent bank specificities42
, or in other words the correlation
between the error term and regressor(s) may obscure the evidence; however, a
heterogeneous sample of different institutional types may be more appropriate in that
it considers the stochastic nature of bank efficiency (Simar, 1992).
As different methodologies of efficiency analysis should be treated with caution, we
constrain the comparison in various parametric approaches but not in non-parametric
one. This shortcoming, whoever, stems from the fact that previous studies have
concluded on considerable differences between them, and thus a more rigorous
analysis was imperative especially if coupled with different definitions of bank
output. We should mention that not all approaches are applicable in our sample; for
42
In the FEM case, the most efficient bank is that having the lowest fixed effect. Thus, it has a
deterministic character contrary to the inefficiency extrapolated by REM, which assumes it as part of
the error term.

331
example, SFA could not achieve concavity conditions on MLE iterative process while
distance function methodology demonstrated limited fit. Moreover, a highly
unbalanced sample makes DEA analysis potentially biased due to many missing
values in the EU-27 region.
Last, the third contribution on the competition-stability nexus includes the estimation
of the Lerner index through a cost function that omits price of funds but, as already
mentioned, illustrates better the effect of bank market power on bank soundness. In
doing so, we employ regulation and supervision variables updated up to 2008, prior to
the onset of the financial crisis. That stresses considerable limitation to the analysis
although we figure out the way we have been forming the conditions conducing to the
crisis. Moreover, we conduct sensitivity analysis along the lines of Extreme Bound
Analysis (EBA) given a set of macroeconomic, institutional and bank-specific
variables that we consider as parsimonious and sufficiently representative.
9.4. Suggestions for further research
There exist plenty of topics for academic research despite the ceaselessly progressive
nature of banking literature. From a theoretical perspective, research should lean
towards the detailed mapping-out of contemporary reforms in international banking
that have emerged since 2008 in order to be assessed in relation to the degree of
market concentration and bank market power. We need to develop new methods of
modeling financial risks in an attempt to forecast with perfect hindsight the causes of
financial bubbles and take lessons from other recent crises. Thus, it is an imperative
factor to investigate the nexus between politics and banking in restructuring the
European financial system with respect to institutional reforms that may resolve
„culpable‟ interconnections between the banking markets, fiscal policies and
investment strategies in EU.
We also need to shed some light on the patterns of profitability, corporate governance
and operational performance in banks of cross-border activity. As financial
institutions struggle to survive in a single market, their strategic options lie in the
structure of their portfolios, which may enclose potential threats for systemic risk

332
within a context of relaxed supervision and owners‟ control. Hence, further research
may also focus on models for forecasting risk on banks‟ future earnings through the
employment of (dis)aggregated accounting data. The per se issue of bank size and its
optimal level may constitute the principal scope before engaging in risk management
policies since it engulfs all the endogenous drivers of bank failures.
Other useful extension closely pertaining to the financial system and banking, could
be how fiscal policies (e.g. taxation) interact with competition and macroprudential
regulation, or the general equilibrium and empirical framework of public debt
management coupled with bank competitiveness. Additionally, the passing-through
mechanism of monetary policy in (cross-border) banking is of utmost importance
since their impact on stabilising inflation and output may occur through interest rates,
asset prices, exchange rates and bank credit (see Mishkin, 1995; Bernanke and
Gertler, 1995; Hubbard, 1995). On the top of that, amid conditions of sovereign debt
crisis, credit ratings at the bank and country level may predict financial distress
through its impact on bond yields and market structure of banks.
Financial institutions in the European union have been operating in a fast-changing
environment, which is subject to the ongoing trend of technological advancement and
deregulation. Thus, we need to analyse the key determinants of bank integration and
consolidation so as to perceive how banks are adapting their operations through their
competitive conduct at any point of the business cycle. Last, all issues that this thesis
touches upon constitute fruitful areas of academic research while the debate on
challenging institutional reforms continues unabated.

333
References
Abbasoglu O.F., Aysan A.F. and Gunes, A. (2007). Concentration, competition,
efficiency, and profitability of the Turkish banking sector in the Post-Crisis Period,
Banks and Bank Systems, vol. 2, no. 3, pp. 106-115.
Acharya, V.V. (2009). A theory of systemic risk and design of prudential bank
regulation, Journal of financial stability, vol. 5, pp. 224-255.
Adams, R.M., Berger, A.N. and Sickles, R.C. (1999). Semiparametric approaches to
stochastic panel frontiers with applications in the banking industry, Journal of
Business and Economic Statistics, vol. 17, pp. 349–358.
Adelman, M.A. (1951). The Measurement of Industrial Concentration, The Review of
Economics and Statistics, vol. 33, no. 4, pp. 269-296.
Adelman, M.A. (1969). Comment on the "H" concentration measure as a numbers-
equivalent, The Review of economics and statistics, vol. 51, no. 1, pp. 99-101.
Agoraki, M-E, Delis, M.D. and Pasiouras, F. (2009). Regulations, competition and
bank risk-taking in transition countries, Journal of Financial Stability,
doi:10.1016/j.jfs.2009.08.002.
Aigner, D.J., Lovell, C.A.K. and Schmidt, P. (1977). Formulation and estimation of
stochastic frontier production models, Journal of Econometrics, vol. 6, pp. 21–37.
Akhavein, J.D., Berger, A.N. and Humphrey, D.B. (1997). The effects of
megamergers on efficiency and prices: Evidence from a bank profit function, Review
of industrial Organization, vol. 12, no. 1, pp. 95-139.
Akin, G.G., Aysan, A.F., Borici, D. and Yildiran, L. (2012). Regulate one service,
tame the entire market: Credit cards in Turkey, Journal of Banking and Finance, vol.
37, no. 4, pp. 1195-1204.
Al Fayoumi, N. and Abuzayed, B. (2010). Competitive Conditions in MENA Banking
Markets.
Al-Jarrah, I.M. (2010). Competition in the Jordanian‟s Banking Sector. Dirasat:

334
Administrative Sciences, vol. 37, no. 2.
Al-Muharrami, S. (2008). Testing the contestability in Kuwait banking industry,
Studies in Economics and Finance, vol. 25, no. 4, pp. 253-266.
Al-Muharrami, S. (2009a). Analysis of competitiveness in Qatar banking industry,
International Journal of Business Innovation and Research, vol. 3, no. 2, pp. 168-181.
Al-Muharrami, S. (2009b). The competition and market structure in the Saudi Arabia
banking, Journal of Economic Studies, vol. 36, no. 5, pp. 446-460.
Allen, F. (1990). The market for intermediation and the origin of financial
intermediation, Journal of Financial Intermediation, vol. 1, pp. 3-30.
Allen, F. and Gale, D. (2000). Comparing financial systems. Cambridge, MA: MIT
Press.
Allen, F. and Gale, D. (2004). Competition and financial stability, Journal of Money,
Credit and Banking, vol. 36, no. 3, pp. 453-480.
Allen, L. and Rai, A. (1996). Operational efficiency in banking: An international
comparison, Journal of Banking and Finance, vol. 20, no. 4, pp. 655-672.
Altunbas, Y. and Marques, D. (2008). Mergers and acquisitions and bank
performance in Europe: The role of strategic similarities, Journal of Economics and
Business, vol. 60, no. 3, pp. 204-222.
Altunbas, Y. and Molyneux, P. (1996). Economies of scale and scope in European
banking, Applied Financial Economics, vol. 6, no. 4, pp. 367-375.
Altunbas, Y., Carbo, S., Gardener, E.P. and Molyneux, P. (2007). Examining the
relationships between capital, risk and efficiency in European banking, European
Financial Management, vol. 13, no. 1, pp. 49-70.
Altunbaş, Y., Gardener, E. P., Molyneux, P. and Moore, B. (2001). Efficiency in
European banking, European Economic Review, vol. 45, no. 10, pp. 1931-1955.
Aly, H.Y., Grabowski, R., Pasurka, C. and Rangan, N. (1990). Technical, scale, and
allocative efficiencies in US banking: an empirical investigation, The Review of

335
Economics and Statistics, pp. 211-218.
Andersen, P. and Petersen, N.C. (1993). A procedure for ranking efficient units in
DEA, Management Science, vol. 39, pp. 1261–1264.
Andrieş, A.M. and Capraru , B. (2012). Competition and efficiency in EU27 banking
systems, Baltic Journal of Economics, vol. 12, no. 1, pp. 41-60.
Angelini, P. and Cetorelli, N. (2003). The effects of regulatory reform on competition
in the banking industry, Journal of Money, Credit and Banking, vol. 35, pp. 663-684.
Anzoategui, D., Martinez Peria, M. and Rocha, R. (2010). Bank competition in the
Middle East and northern Africa region, World Bank Policy Research Working Paper
Series, vol. 5363.
Anzoategui, D., Martinez Peria, M.S. and Melecky, M. (2010). Banking Sector
Competition in Russia (October 1, 2010). World Bank Policy Research Working
Paper Series, no. 5449.
Aparicio, J., Ruiz, J. and Sirvent, I. (2007). Closest targets and minimum distance to
the Pareto-efficient frontier in DEA, Journal of Productivity Analysis, vol. 28, pp.
209-218.
Aragon, Y., Daouia, A. and Thomas-Agnan, C. (2005). Nonparametric frontier
estimation: a conditional quantile-based approach, Econometric Theory, vol. 21, pp.
358-389.
Ariff, M. and Can, L. (2008). Cost and profit efficiency of Chinese banks: A non-
parametric analysis. China Economic Review, vol. 19, no. 2, pp. 260-273.
Ariss, R.T. (2009). Competitive behaviour in Middle East and North Africa banking
systems. The Quarterly Review of Economics and Finance, vol. 49, no. 2, pp. 693-
710.
Ariss, R.T. (2010a). Competitive conditions in Islamic and conventional banking: A
global perspective, Review of Financial Economics, vol. 19, no. 3, pp. 101-108.
Ariss, R.T. (2010b). On the implications of market power in banking: Evidence from

336
developing countries, Journal of Banking and Finance, vol. 34, no. 4, pp. 765-775.
Atkinson, S.E. and Dorfman J.H. (2005). Bayesian measurement of productivity and
efficiency in the presence of undesirable outputs: crediting electric utilities for
reducing air pollution, Journal of Econometrics, vol. 126, pp. 445-468.
Bader, M.K.I., Mohamad, S.H.A.M.S.H.E.R., Ariff, M. and Hassan, T. (2008). Cost,
revenue and profit efficiency of Islamic versus conventional banks: international
evidence using data envelopment analysis, Islamic Economic Studies, vol. 15, no. 2,
pp. 23-76.
Baltagi, B. (1995). Econometric Analysis of Panel Data, John Wiley and Sons, New
York.
Baltagi, B.H. and Griffin, J.M. (1988). A general index of technical change, The
Journal of Political Economy, vol. 96, no. 1, pp. 20-41.
Baltagi, H.B. (2001). Econometric analysis of panel data, New York: John Wiley and
Sons.
Banker, R.D. and Maindiratta, A. (1992). Maximum likelihood estimation of
monotone and concave production frontiers, Journal of Productivity Analysis, vol. 3,
pp. 401–415.
Banker, R.D. and Morey, E.C. (1986). The use of categorical variables in data
envelopment analysis, Management Science, vol. 32, no. 12, pp. 1613–1627.
Banker, R.D. and Natarasan, R. (2004). Statistical tests based on DEA efficiency
scores. In: Cooper, W.W., Seiford, L.M., Zhu, J. (Eds.), Handbook on Data
Envelopment Analysis, Kluwer Academic Publishers, Norwell, MA (Chapter 11).
Banker, R.D., Charnes, A. and Cooper, W.W., (1984). Some models for estimating
technical and scale inefficiencies in data envelopment analysis, Management Science,
vol. 30, pp. 1078–1092.
Barajas, A. (1996). Interest Rates, Market Power, and Financial Taxation: An
Application to Colombian Banks 1974–1988. (unpublished; Washington: IMF ,
November).

337
Barro, J.R. and Sala-i-Martin, X. (1992). Convergence, The Journal of Political
Economy, vol. 100, no. 2, pp. 223-251.
Barro, R.J. (1991). Economic growth in a cross section of countries, The Quarterly
Journal of Economics, vol. 106, no. 2, pp. 407-443.
Barro, R.J. and Sala-i-Martin, X. (1992). Convergence, Journal of Political Economy,
vol. 100, no. 2, pp. 223-251.
Barros, C.P., Ferreira, C. and Williams, J. (2007). Analysing the determinants of
performance of best and worst European banks: A mixed logit approach, Journal of
Banking and Finance, vol. 31, no. 7, pp. 2189-2203.
Barros, P.P., Berglof, E., Fulghierri, J., Gual, J., Mayer, C. and Vives, X. (2005).
Integration of European Banks: The Way Forward. Centre for Economic Policy
Research, London.
Barth, J. R., Caprio, G. and Levine, R. (2005), Rethinking bank regulation: Till angels
govern, Cambridge University Press.
Barth, J.R., Caprio Jr. and Levine, R. (2000). Banking systems around the globe: do
regulation and ownership affect performance and stability?, World Bank Policy
Research Working paper, Washington DC.
Barth, J.R., Caprio, G. and Levine, R. (2004). Bank regulation and supervision: what
works best?, Journal of Financial intermediation, vol. 13, no. 2, pp. 205-248.
Barth, J.R., Caprio, G. and Levine, R. (2008). Bank regulations are changing: For
better or worse?, Comparative Economic Studies, vol. 50, no. 4, pp. 537-563.
Battese, G.E. and Coelli T.J. (1995). A Model for Technical Inefficiency Effects in a
Stochastic Frontier Production Function for Panel Data, Empirical Economics, vol.
20, pp. 325–332.
Battese, G.E. and Coelli, T.J. (1992). Frontier production functions, technical
efficiency and panel data: with application to paddy farmers in India, Journal of
productivity analysis, vol. 3, no. 1, pp. 153-169.

338
Bauer, P.W., Berger, A.N. and Humphrey, D.B. 1993. “Efficiency and productivity
growth in US banking”. In The Measurement of Productive Efficiency. Techniques
and applications, Edited by: Fried, H. O., Lovell, C. A. and Schmidt, S. S. 386–413.
Oxford: Oxford University Press.
Bauer, P.W., Berger, A.N., Ferrier, G.D. and Humphrey, D.B. (1998). Consistency
conditions for regulatory analysis of financial institutions: a comparison of frontier
efficiency methods, Journal of Economics and Business, vol. 50, no. 2, pp. 85-114.
Baumol, W. (1982). Contestable markets: An uprising in the theory of industry
structure, American Economic Review, vol. 72, pp. 1-15.
Baumol, W., Panzar, J. and Willig, R. (1982). Contestable markets and the theory of
industry structure, Harcourt Brace Jovanovich, San Diego.
Beccalli, E. (2007). Does IT investment improve bank performance? Evidence from
Europe, Journal of Banking and Finance, vol. 31, no. 7, pp. 2205-2230.
Beck, T. (2007). Bank Concentration and Fragility. Impact and Mechanics, In The
Risks of Financial Institutions (pp. 193-234), University of Chicago Press.
Beck, T. (2008). Bank Competition and Financial Stability: Friends or Foes?, World
Bank Policy Research, Working Paper 4656, June.
Beck, T., De Jonghe, O. and Schepens, G. (2012). Bank competition and stability:
cross-country heterogeneity, Journal of Financial Intermediation.
Beck, T., Demirguc-Kunt, A. and Levine, R. (2006a). Bank concentration,
competition, and crises: first results, Journal of Banking and Finance, vol. 30, pp.
1581–1603.
Beck, T., Demirgüç-Kunt, A. and Levine, R. (2006b). Bank supervision and
corruption in lending, Journal of Monetary Economics, vol. 53, no. 8, pp. 2131-2163.
Beck, T., Demirguc-Kunt, A. and Maksimovic, V. (2003). Bank competition,
financing obstacles and access to credit, World Bank policy research working paper
no. 3041.

339
Beck, T., Hesse, H., Kick, T. and von Westernhagen, N. (2009). Bank ownership and
stability: evidence from Germany, Bundesbank Working Paper Series.
Benston, G.J. (1972). Economies of scale of financial institutions, Journal of Money,
Credit and Banking, vol. 4, no. 2, pp. 312-341.
Berg, S.A., Førsund, F.R., Hjalmarsson, L. and Suominen, M. (1993). Banking
efficiency in the Nordic countries, Journal of Banking and Finance, vol. 17, no. 2, pp.
371-388.
Berg, S.A. and Kim, M. (1994). Oligopolistic interdependence and the structure of
production in banking: an empirical evaluation, Journal of Money, Credit and
Banking, vol. 26, no. 2, pp. 309-322.
Berg, S.A. and Kim, M. (1998). Banks as multioutput oligopolies: An empirical
evaluation of the retail and corporate banking markets, Journal of Money, Credit and
Banking, vol. 30, no. 2, pp. 135-153.
Bergendahl, G. and Lindblom, T. (2008). Evaluating the performance of Swedish
savings banks according to service efficiency, European Journal of Operational
Research, vol. 185, no. 3, pp. 1663-1673.
Berger, A.N., Hasan, I. and Zhou, M. (2009). Bank ownership and efficiency in
China: What will happen in the world‟s largest nation?, Journal of Banking and
Finance, vol. 33, no.1, pp. 113-130.
Berger, A., Leusner, J. and Mingo, J. (1994). The efficiency of bank branches. Center
for Financial Institutions Working Papers.
Berger, A.N. and Humphrey, D.B. (1997). Efficiency of financial institutions:
International survey and directions for future research, European Journal of
operational research, vol. 98, no. 2, pp. 175-212.
Berger, A.N., Hanweck, G.A. and Humphrey, D.B. (1987). Competitive viability in
banking: Scale, scope, and product mix economies, Journal of Monetary Economics,
vol. 20, no. 3, pp. 501-520.
Berger, A.N., Klapper, L.F. and Ariss, R.T. (2009). Bank competition and financial

340
stability, Journal of Financial Services Research, vol. 35, no. 2, pp. 99-118.
Berger, N.A. (1993). “Distribution-free” estimates of efficiency in the US banking
industry and tests of the standard distributional assumptions, Journal of Productivity
Analysis, vol. 4, no. 3, pp. 261-292.
Berger, N.A. (1995). The profit-structure relationship in banking – tests of market-
power and efficient-structure hypotheses. Journal of Money, Credit, and Banking, vol.
27, pp. 404-415.
Berger, N.A. (1999). The big picture about relationship-based finance, Proceedings,
Federal Reserve Bank of Chicago, issue March, pp. 390-400.
Berger, N.A. and Hannan, H.T. (1992). The price-concentration relationship in
banking: A reply, The Review of Economics and Statistics, vol. 74, no. 2, pp. 376-379.
Berger, N.A. and Hannan, H.T. (1998). The Efficiency Cost of Market Power in the
Banking Industry: A Test of the "Quiet Life" and Related, The Review of Economics
and Statistics, vol. 80, no. 3, pp. 454-465.
Berger, N.A. and Hannan, Η.Τ.. (1989). The price-concentration relationship in
banking, Review of Economics and Statistics, vol. 71, no. 2, pp. 291-299.
Berger, N.A. and Humphrey, D.B. (1991). The dominance of inefficiencies over scale
and product mix economies in banking, Journal of Monetary Economics, vol. 28, pp.
117–148.
Berger, N.A. and Humphrey, D.B. (1992). Measurement and Efficiency Issues in
Commercial Banking. In Output Measurement in the Service Sectors, Z. Griliches
(Eds.). National Bureau of Economic Research Studies in Income and Wealth, vol.
56, Chicago, University of Chicago Press.
Berger, N.A. and Mester, L.J. (1997). Inside the black box: What explains differences
in the efficiencies of financial institutions? Journal of Banking and Finance, vol. 21,
no. 7, pp. 895–947.
Berger, N.A., Klapper, F.L. and Ariss, R.T. (2009). Bank competition and financial
stability, Journal of Financial Service research, vol. 35, pp. 99-118.

341
Berlin, M. and Mester, J. L. (1992). Debt covenants and renegotiation, Journal of
Financial Intermediation, vol. 2, no. 2, pp. 95-133.
Berlin, M. and Mester, L.J. (1999). Deposits and relationship lending, Review of
Financial Studies, vol. 12, no. 3, pp. 579-607.
Bertschek, I. and Lechner, M. (1998). Convenient Estimators for the Panel Probit
Model, Journal of Econometrics, vol. 87, pp. 329‐371.
Besanko, D. and Thakor, A. (1993). „Relationship banking, deposit insurance and
bank portfolio choice, in C. Mayer and X. Vives, eds., Capital markets and financial
intermediation, Cambridge University Press.
Bessent, A., Bessent, W., Elam, J. and Clark, T. (1988). Efficiency frontier
determination by constrained facet analysis, Journal of Operational Research Society,
vol. 36, pp. 785–796.
Biekpe, N. (2011), The Competitiveness of Commercial Banks in Ghana. African
Development Review, 23: 75–87, pp.1467-8268.
Bikker A.J. and Haaf, K. (2002). Competition, concentration and their relationship:
An empirical analysis of the banking industry, Journal of Banking and Finance, vol.
26, no. 11, pp. 2191-2214.
Bikker, A.J. (2003). Testing for imperfect competition on EU deposit and loan
markets with Bresnahan's market power model, Kredit und Kapital, vol. 36, no. 2, pp.
167-212.
Bikker, A.J. and Groeneveld, J.M. (2000). Competition and concentration in the EU
banking industry, Kredit Und Kapital, vol. 33, pp. 62–98.
Bikker, A.J., Shaffer, S. and Spierdijk, L. (2012). Assessing Competition with the
Panzar-Rosse Model: The Role of Scale, Costs, and Equilibrium, vol. 94, no. 4, pp.
1025-1044.
Bikker, J.A. (2002). Efficiency and cost differences across countries in a unified
European banking market, De Nederlandsche Bank.

342
Bolt, W. and Humphrey, D. (2010). Bank competition efficiency in Europe: A frontier
approach, Journal of Banking and Finance, vol. 34, no. 8, pp. 1808-1817.
Bonfim, D., Dai, Q. and Franco, F. (2009). The number of bank relationships,
borrowing costs and bank competition, Borrowing Costs and Bank Competition
(February 5, 2009).
Bonfim, D., Dai, Q. and Franco, F. (2009). The number of bank relationships,
borrowing costs and bank competition, Borrowing Costs and Bank Competition
(February 5, 2009).
Bonin, J.P., Hasan, I. and Wachtel, P. (2005). Bank performance, efficiency and
ownership in transition countries, Journal of Banking and Finance, vol. 29, no. 1, pp.
31-53.
Bonin, J.P., Hasan, I. and Wachtel, P. (2005b). Privatization matters: Bank efficiency
in transition countries, Journal of Banking and Finance, vol. 29, no. 8, pp. 2155-2178.
Boone J., Griffith, R. and Harrison, R. (2004). Measuring Competition, presented at
the Encore Meeting 2004 Measuring competition.
Boone, J. (2000). Measuring Product Market Competition, CEPR Working Paper
2636.
Boone, J. (2001). Intensity of competition and the incentive to innovate, International
Journal of Industrial Organization, vol. 19, no. 5, pp. 705-726.
Boone, J. (2004). A new way to measure competition, CEPR Discussion Paper Series
No. 4330.
Boot, A.W. and Greenbaum, S. (1993). Bank regulation, reputation, and rents: Theory
and policy implications. In: Mayer, C., and Vives, X. (eds), Capital markets and
financial intermediation. Cambridge, UK: Cambridge University Press, 292-318.
Boot, A.W.A and Thakor, A.V. (2000). Can relationship banking survive
competition?, Journal of Finance , vol. 55, pp. 679–713.
Borio, C. (2006). „The Macroprudential Approach to Regulation and Supervision:

343
Where do we Stand?‟, Chapter 7 in Erfaringer og utfordringer Kredittilsynet 1986–
2006 (the special volume celebrating the 20th anniversary of Kredittilsynet).
Kredittilsynet : Norway.
Borio, C. and Lowe, P. (2002). Asset prices, financial and monetary stability:
exploring the nexus, BIS Working Paper No. 114.
Borio, Cl. (2003). Towards a macroprudential framework for financial supervision
and regulation?, BIS Working papers, no. 128.
Borovicka, J. (2007). Banking Efficiency and Foreign Ownership in Transition: Is
There an Evidence of a “Cream-Skimming” Effect, CERGE-EI Working Paper.
Bos J. (2002). European banking: market power and efficiency, University Press,
Maastricht.
Bos, J.W. and Kolari, J.W. (2005). Large Bank Efficiency in Europe and the United
States: Are There Economic Motivations for Geographic Expansion in Financial
Services?, The Journal of Business, vol. 78, no. 4, pp. 1555-1592.
Bos, J.W. and Kool, C.J. (2006). Bank efficiency: The role of bank strategy and local
market conditions, Journal of Banking and Finance, vol. 30, no. 7, pp. 1953-1974.
Bos, J.W., Koetter, M., Kolari, J.W. and Kool, C.J. (2009). Effects of heterogeneity
on bank efficiency scores, European Journal of Operational Research, vol. 195, no.
1, pp. 251-261.
Boucinha, M. and Ribeiro, N. (2009). An assessment of competition in the Portuguese
banking system in the 1991-2004 period. Financial Stability Report| 2007, 165.
Boucinha, M., Ribeiro, N. and Weyman-Jones, T. (2009). An assessment of
Portuguese banks‟ costs and efficiency, Banco de Portugal, Working Paper, 22.
Boutillier, M., Gaudin, J. and Grandperrin, S. (2005). La situation concurrentielle des
principaux secteurs bancaires européens entre 1993 et 2000: quels enseignements
pour la future structure des marchés financiers issue de l'UEM?, Revue d'économie
financière, vol. 81, no. 4, pp. 15-42.
344
Boyd, H.J., De Nicolò, G. and Jalal M.A. (2009). Bank competition, risk and asset
allocations, IMF Working Paper, no. 09/143.
Boyd, J.H. and De Nicolo, G. (2005). The theory of bank risk taking and competition
revisited, Journal of Finance, vol. 60, pp. 1329–1343.
Boyd, J.H. and Runkle, D. E. (1993). Size and performance of banking firms: Testing
the predictions of theory, Journal of Monetary Economics, vol. 31, no. 1, pp. 47-67.
Boyd, J.H., De Nicoló, G. and Smith, B.D. (2004). Crises in competitive versus
monopolistic banking systems, Journal of Money, Credit and Banking, vol. 36, pp.
487–506.
Boyd, J.H., De Nikolo, G. and Al Jalal, A. (2006). Bank risk taking and competition
revisited: New theory and evidence, IMF Working paper, no. 06/297.
Boyd, J.H., De Nikolo, G. and Smith, B. D. (2004). Crises in competitive versus
monopolistic banking systems, Journal of Money, Credit and Banking, vol. 36, no. 3,
pp. 487-506.
Boyd. J. and De Nicoló, G. (2005). The theory of bank risk taking revisited, Journal
of Finance , vol. 60, pp. 1329–1343.
Bramer, P., Gischer, H., Richter, T. and Weiß, M. (2012). Diverse Degrees of
Competition within the EMU and their Implications for Monetary Policy (no. 10).
Otto- von-Guericke University Magdeburg, Faculty of Economics and Management.
Bresnahan, T.F. (1982). The oligopoly solution concept is identified, Economic
Letters, vol. 10, pp. 87- 92.
Bresnahan, T.F., (1989). Empirical studies of industries with market power. In:
Schmalensee, R., Willig, R.D.(Eds.), In: Handbook of Industrial Organization, vol. 2.
Elsevier Science Publishers, pp. 1011–1058.
Brissimis, S.N. and Delis, M.D. (2011). Bank-level estimates of market power,
European Journal of Operational Research, vol. 212, no.3, pp. 508-517.
Brissimis, S.N., Delis, M.D. and Papanikolaou, N.I. (2008). Exploring the nexus

345
between banking sector reform and performance: evidence from newly acceded EU
countries, Journal of Banking and Finance, vol. 32, pp. 2674–2683.
Cameron, A.C. and Trivedi, P.K. (2010). Microeconometrics using stata (Vol. 5).
College Station, TX: Stata Press, p. 166.
Caminal, R. and Matutes, C. (2002). Market power and banking failures,
International Journal of Industrial Organization, vol. 20, pp. 1341-61.
Campa M.J. and Hernando, I. (2006). M&As performance in the European financial
industry, Journal of Banking & Finance, vol. 30, no. 12, pp. 3367-3392.
Canhoto, A. (2004). Portuguese banking: A structural model of competition in the
deposits market, Review of Financial Economics, vol. 13, no. 1, pp. 41-63.
Canhoto, A. and Dermine, J. (2003). A note on banking efficiency in Portugal, New
vs. Old banks, Journal of banking and finance, vol. 27, no. 11, pp. 2087-2098.
Canova, F. and Marcet, A. (1995). The poor stay poor: Non-convergence across
countries and regions.
Capie, F. (1995). Prudent and stable but inefficient?: Commercial Banks in Britain,
1890-1940. In: Bordo, M.D., Sylla, R. (Eds.), Anglo-American Financial Systems:
Institutions and Markets in the Twentieth Century, Irwin, New York.
Carbo, S., Humphrey, D. and Rodriguez , F. (2003). Deregulation, bank competition
and regional growth, Regional Studies, vol. 37, pp. 227-237.
Carbo, S., Humphrey, D., Maudos, J. and Molyneux, P. (2009). Cross-country
comparisons of competition and pricing power in European banking, Journal of
International Money and Finance, vol. 28, no. 1, pp. 115-134.
Carletti, E. (2006). Competition and regulation in banking. In: Boot, A., Thakor, A.
(Eds.), Handbook of Corporate Finance, Financial Intermediation and Banking,
North Holland, London.
Carletti, E. and Hartmann, P. (2003). Competition and financial stability: what‟s
special about banking? In: Mizen P (ed) Monetary history, exchange rates and

346
financial markets: essays in honour of Charles Goodhart, vol. 2. Edward Elgar,
Cheltenham, UK.
Casu, B. and Girardone, C. (2005). An analysis of the relevance of off-balance sheet
items in explaining productivity change in European banking, Applied Financial
Economics, vol. 15, no. 15, pp. 1053-1061.
Casu, B. and Girardone, C. (2006). Bank competition, concentration and efficiency in
the single European market, The Manchester School, vol. 74, no. 4, pp. 441-468.
Casu, B. and Girardone, C. (2009). Competition issues in European banking, Journal
of Financial Regulation and Compliance, vol. 17, no. 2, pp.119 – 133.
Casu, B. and Girardone, C. (2010). Integration and efficiency convergence in EU
banking markets. Omega, vol. 38, no. 5, pp. 260-267.
Casu, B. and Molyneux, P. (2003). A comparative study of efficiency in European
banking, Applied Economics, vol. 35, no. 17, pp. 1865-1876.
Casu, B., Girardone, C. and Molyneux, P. (2004). Productivity change in European
banking: A comparison of parametric and non-parametric approaches, Journal of
Banking and Finance, vol. 28, no. 10, pp. 2521-2540.
Cavallo, L. and Rossi, S. P. (2001). Scale and scope economies in the European
banking systems, Journal of multinational financial management, vol. 11, no. 4, pp.
515-531.
Cazals, C., Florens, J.P. and Simar, L. (2002). Nonparametric Frontier Estimation: A
Robust Approach. Journal of Econometrics, vol. 106, no. 1, pp. 1–25.
Cerqueiro, G. (2008). Bank concentration, credit quality and loan rates, CentER
mimeo.
Cetorelli, N. (1999). Competitive analysis in banking: Appraisal of the
methodologies, Economic perspectives, Federal Reserve Bank of Chicago, pp. 2-15.
Cetorelli, N. (2004). Real effects of bank competition, Federal Reserve Bank of
Chicago working paper no. 00-09.

347
Cetorelli, N. and Gamberra, M. (2001). Banking market structure, financial
dependence and growth: International evidence from industry data, Journal of
Finance, vol. 56, pp. 617–648.
Chan, Y.S., Greenbaum, S. and Thakor, A. (1986). Information reusability,
competition and bank asset quality, Journal of Banking and Finance, vol. 10, pp. 243-
53.
Chang, S.C., Chang, J.C.D. and Huang, T.H. (2012). Assessing market power in the
US commercial banking industry under deregulation, Economic Modeling, vol. 29,
no. 5, pp. 1558-1565.
Charnes, A. and Cooper, W.W. (1962). Programming with linear fractional
functionals, Naval Research Logistics Quarterly, vol. 9, pp. 67–88.
Charnes, A., Clarke, C., Cooper, W.W. and Golany, B. (1985a). A development study
of DEA in measuring the effect of maintenance units in the U.S. Air Force, Annals of
Operations Research, vol. 2, pp. 95–112.
Charnes, A., Cooper, W.W. and Rhodes, E.L. (1978). Measuring the efficiency of
decision making units, European Journal of Operational Research, vol. 2, pp. 429–
444.
Charnes, A., Cooper, W.W., Golany, B., Seiford, L.M. and Stutz, J. (1985b).
Foundations of data envelopment analysis and Pareto–Koopmans empirical
production functions, Journal of Econometrics, vol. 30, pp. 91– 107.
Charnes, A., Cooper, W.W., Huang, Z.M. and Sun, D.B. (1990). Polyhedral cone-
ratio DEA models with an illustrative application to large commercial banks, Journal
of Econometrics, vol. 46, pp. 73–91.
Chen, Y., Seiford, L.M. and Zhu, J. (2002). Imprecise data envelopment analysis,
Management Science.
Chen, Y.Y. and Yang, W.L. (2012). Financial Market Development and Competition
Degree in China's Banking Industry - An Empirical Study Based on Panzar-Rosse
Model, Journal of Dalian University of Technology (Social Sciences), 1, 003.

348
Chenard, K., Das, U.S. and Quintyn, M. (2004). Does Regulatory Governance Matter
for Financial System Stability? An Empirical Analysis (EPub). International
Monetary Fund.
Chortareas, G.E., Garza-Garcia, J.G. and Girardone, C. (2012). Competition,
Efficiency and Interest Rate Margins in Latin American Banking. International
Review of Financial Analysis, vol. 24, pp. 93-103.
Chortareas, G.E., Girardone, C. and Ventouri, A. (2009). Efficiency and productivity
of Greek banks in the EMU era, Applied Financial Economics, vol. 19, no. 16, pp.
1317-1328.
Christensen, L.R., Jorgenson, D.W. and Lau, L. J. (1973). Transcendental logarithmic
production frontiers, The review of economics and statistics, vol. 55, no. 1, pp. 28-45.
Christopoulos, D.K., Lolos, S.E. and Tsionas, E.G. (2002). Efficiency of the Greek
banking system in view of the EMU: a heteroscedastic stochastic frontier approach,
Journal of Policy Modeling, vol. 24, no. 9, pp. 813-829.
Cihak, M. and Hesse, H. (2007). Cooperative Banks and Financial Stability. IMF
Working Paper No. 2, Washington D.C.
Cipollini, A. and Fiordelisi, F. (2009). The Impact of Bank Concentration on
Financial Distress: The Case of the European Banking System (November 30, 2009).
EMFI Working Paper No. 2. Available at SSRN: http://ssrn.com/abstract=1578718
Claessens, S. (2009). Competition in the financial sector: overview of competition
policies, The World Bank Research Observer, vol. 24, no. 1, pp. 83-118.
Claessens, S. and Laeven, L. (2004). What drives bank competition? Some
international evidence, Journal of Money, Credit and Banking, vol. 36, no.2, pp. 563-
583.
Claessens, S., Demirgüç-Kunt, A. and Huizinga, H. (2001a). How does foreign entry
affect domestic banking markets?, Journal of Banking and Finance, vol. 25, no. 5, pp.
891-911.

349
Claessens, S., Klingebiel, D. and Laeven, L. (2001b). Financial restructuring in
banking and corporate sector crises: What policies to pursue? (No. 8386), National
Bureau of Economic Research.
Claeys, S. and Vennet, R.V. (2008). Determinants of bank interest margins in Central
and Eastern Europe: A comparison with the West, Economic Systems, vol. 32, no. 2,
pp. 197-216.
Coccorese, P. (2004). Banking competition and macroeconomic conditions: A
disaggregate analysis, Journal of Financial Markets, Institutions and Money, vol. 14,
pp. 203-219.
Coccorese, P. (2005). Competition in markets with dominant firms: A note on the
evidence from the Italian banking industry, Journal of Banking and Finance, vol. 29,
no. 5, pp. 1083-1093.
Coccorese, P. (2009). Market power in local banking monopolies, Journal of Banking
and Finance, vol. 33, no. 7, pp. 1196-1210.
Coccorese, P. (2012). Information sharing, market competition and antitrust
intervention: a lesson from the Italian insurance sector, Applied Economics, vol. 44,
no. 3, pp. 351-359.
Coccorese, P. and Pellecchia, A. (2010). Testing the „quiet life‟ hypothesis in the
Italian banking industry, Economic Notes, vol. 39, no. 3, pp. 173-202.
Coelli, T. and Perelman, S. (2000). Technical Efficiency of European Railways: A
Distance Function Approach, Applied Economics, vol. 32, no. 15, pp. 1967–76.
Cole, R.A., McKenzie, J. A. and White, L.J. (1995). Deregulation gone awry: Moral
hazard in the savings and loan industry, The Causes and Costs of Depository
Institution Failures, pp. 29-73.
Conrad, A., Neuberger, D. and Trigo Gamarra, L. (2009). The impact of regional and
demographic factors on the efficiency of German savings banks (No. 111), Thünen-
series of applied economic theory.
Cook W.D. and Seiford L.M. (2009). Data envelopment analysis (DEA) - thirty years

350
on, European Journal of Operational Research, vol.192, pp. 1–17.
Cook, W.D. and Green, R.H. (2005). Evaluating power plant efficiency: A
hierarchical model, Computers and Operations Research, vol. 32, pp. 813–823.
Cook, W.D. and Zhu, J. (2007). Classifying inputs and outputs in data envelopment
analysis, European Journal of Operational Research, vol. 180, no. 2, pp. 692–699.
Cook, W.D. and Zhu, J. (2008). CAR-DEA: Context dependent assurance regions in
DEA, Operations Research, vol. 56, no. 1, pp. 69-78.
Cook, W.D., Kress, M. and Seiford, L.M. (1993). On the use of ordinal data in data
envelopment analysis, Journal of the Operational Research Society, vol. 44, pp. 133–
140.
Cook, W.D., Kress, M. and Seiford, L.M. (1996). Data envelopment analysis in the
presence of both quantitative and qualitative factors, Journal of the Operational
Research Society, vol. 47, pp. 945–953.
Cook, W.D., Liang, L., Zha, Y. and Zhu, J. (2008). A modified super-efficiency DEA
model for infeasibility, Journal of the Operational Research Society, vol. 60, pp. 276-
281.
Cooper, R.J. and McLaren, K.R. (1996). A system of demand equations satisfying
effectively global regularity conditions, Review of Economics and Statistics, vol. 78,
pp. 359–364.
Cooper, W.W., Deng, H., Huang, Z.M. and Li, S.X. (2002). Change constrained
programming approaches to technical efficiencies and inefficiencies in stochastic data
envelopment analysis, Journal of the Operational Research Society, vol. 53, pp.
1347– 1356.
Cooper, W.W., Huang, Z. and Li, S. (1996). Satisficing DEA models under chance
constraints, Annals of Operations Research, vol. 66, pp. 279–295.
Cooper, W.W., Huang, Z. and Li, S. (2004). Chance constraint DEA. In: Cooper,
W.W., Seiford, L.M., Zhu, J. (Eds.), Handbook on Data Envelopment Analysis,
Kluwer Academic Publishers, Norwell, MA.

351
Cooper, W.W., Park, K.S. and Yu, G. (1999). IDEA and AR-IDEA: Models for
dealing with imprecise data in DEA, Management Science, vol. 45, pp. 597– 607.
Cooper, W.W., Seiford, L.M. and Tone, K. (2006). Introduction to Data Envelopment
Analysis and its Uses, Springer Science.
Cordella, T. and Yeyati, E.L. (2002). Financial opening, deposit insurance, and risk in
a model of banking competition, European Economic Review. vol. 46, pp. 471–485.
Cornwell, C., Schmidt, P. and Sickles, R.C. (1990). Production frontiers with cross-
sectional and time-series variation in efficiency levels, Journal of econometrics, vol.
46, no. 1, pp. 185-200.
Corvoisier, S. and Gropp, G. (2002). Bank concentration and retail interest rates,
Journal of Banking and Finance, vol. 26, no. 11, pp. 2155-2189.
Cowling, K. (1976). On the theoretical specification of industrial structure-
performance relationships, European Economic Review, vol. 8, no. 1, pp. 1-14.
Cowling, K. and Waterson, M. (1976). Price-cost margins and market structure,
Economica, vol. 43, pp. 267-274.
Cummins, J.D. and Zi, H. (1998). Comparison of frontier efficiency methods: An
application to the US life insurance industry, Journal of Productivity Analysis, vol.
10, no. 2, pp. 131-152.
Cybo-Ottone, A. and Murgia, M. (2000). Mergers and shareholder wealth in European
banking, Journal of Banking and Finance, vol. 24, no. 6, pp. 831-859.
Daley, J. and Matthews, K. (2012). Competitive conditions in the Jamaican banking
market 1998–2009, International Review of Financial Analysis, vol. 25, pp. 131-135.
Daouia, A., and Simar, L. (2007), Nonparametric efficiency analysis: A multivariate
conditional quantile approach, Journal of Econometrics, vol. 140, pp. 375–400.
Das, A. and Ghosh, S. (2009). Financial deregulation and profit efficiency: a
nonparametric analysis of Indian banks, Journal of Economics and Business, vol. 61,
no. 6, pp. 509-528.

352
Davies, St. (1979). Choosing between concentration indices: The Iso-concentration
curve, Economica, New series, vol. 46, no. 181, pp. 67-75.
De Bandt, O. and Davis, P. (2000). Competition, contestability and market structure
in European banking sectors on the eve of EMU, Journal of Banking and Finance,
vol. 24, pp. 1045-1066.
De Guevara, J.F. and Maudos, J. (2002). Inequalities in the efficiency of the banking
sectors of the European Union, Applied Economics Letters, vol. 9, no. 8, pp. 541-544.
De Guevara, J.F., Maudos, J. and Perez, F. (2005). Market power in European
banking sectors, Journal of Financial Services Research, vol. 27, no. 2, pp. 109-137.
De Guevara, J.F., Maudos, J. and Perez, F. (2007). Integration and competition in the
European financial markets, Journal of International Money and Finance, vol. 26, no.
1, pp. 26-45.
De Nicolo G. and Loukoianova, E. (2007). Bank ownership, market structure, and
risk, IMF Working Paper, Washington, D.C.
De Nicolo, G. and Lucchetta, M. (2009). Financial intermediation, competition, and
risk: A general equilibrium exposition, IMF Working Papers 09/105.
De Pinho, P.S. (2001). Using accounting data to measure efficiency in banking: an
application to Portugal, Applied Financial Economics, vol. 11, no. 5, pp. 527-538.
De Rozas, L.G. (2007). Testing for competition in the Spanish banking industry: The
Panzar-Rosse approach revisited (No. 0726), Banco de Espana.
Degryse, H. and Ongena, S. (2008). Competition and regulation in the banking sector:
a review of the empirical evidence on the sources of bank rents, Handbook of
financial intermediation and banking, 2008, pp. 483-554.
Degryse, H., Ongena, S. (2001). Bank relationships and firm profitability. Financial
Management, vol. 30, pp. 9–34.
Degryse, H., Ongena, S. (2005). Distance, lending relationships and competition.
Journal of Finance, vol. 60, pp. 231–266.

353
Delis, M.D. (2010). Competitive conditions in the Central and Eastern European
banking systems, Omega, vol. 38, no. 5, pp. 268-274.
Delis, M.D. and Papanikolaou, N.I. (2009). Determinants of bank efficiency: evidence
from a semi-parametric methodology, Managerial Finance, vol. 35, no. 3, pp. 260-
275.
Delis, M.D., Koutsomanoli-Fillipaki, A., Staikouras, C.K. and Katerina, G. (2009).
Evaluating cost and profit efficiency: a comparison of parametric and nonparametric
methodologies, Applied Financial Economics, vol. 19, no. 3, pp. 191-202.
Delis, M.D., Staikouras, K.C. and Varlagas, P.T. (2008). On the measurement of
market power in the banking industry, Journal of Business Finance and Accounting,
vol. 35, no. 7-8, pp. 1023-1047.
Dell‟ Ariccia, G. (2000). Learning by lending, competition, and screening incentives
in the banking industry. Center for Financial Institutions working paper no. 00-10,
Wharton School Center for Financial Institutions, University of Pennsylvania.
Deltuvaitė, V., Vaškelaitis, V. and Pranckeviciute , A. (2007). The impact of
concentration on competition and efficiency in the Lithuanian banking sector,
Engineering Economics, vol. 4, no. 54, pp. 7-19.
Demirgüç-Kunt, A. and Detragiache, E. (1998). The determinants of banking crises in
developing and developed countries, IMF Staff Papers, vol. 45, no.1, pp. 81–109,
Washington, D. C.: International Monetary Fund.
Demirgüç-Kunt, A. and Detragiache, E. (2002). Does deposit insurance increase
banking system stability? An empirical investigation, Journal of Monetary
Economics, vol. 49, pp. 1373–1406.
Demirgüç-Kunt, A. and Huizinga, H. (1999). Determinants of commercial bank
interest margins and profitability: Some international evidence. The World Bank
Economic Review, vol. 13, no. 2, pp. 379-408.
Demirguc-Kunt, A. and Martinez Peria, M. (2010). A framework for analyzing
competition in the banking sector: an application to the case of Jordan, World Bank

354
Policy Research Working Paper Series, no. 5499.
Demsetz, H. (1973). Industry structure, market rivalry and public policy, Journal of
Law and Economics, vol. 16, pp. 1-10.
Deng, W.-S. and Huang T.-H. (2008). A Semiparametric Approach to the Estimation
of the Stochastic Frontier Model with Time-Variant Technical Efficiency, Academia
economic papers, vol. 36, no. 2, pp. 167–193.
Deprins, L., Simar, L. and Tulkens, H. (1984). Measuring labour efficiency in post
offices. In: Marchand, M., Pestieau, P., Tulkens, H. (Eds.), The Performance of Public
Enterprises: Concepts and Measurement, North Holland, Amsterdam, pp. 243–267.
Dewatripont, M. and Maskin, E. (1995). Credit and Efficiency in centralized and
decentralized economies, The Review of Economic studies, vol. 62, no. 4, pp. 541-
555.
Diamond, D.W. (1984). Financial intermediation and delegated monitoring, Review of
Economic Studies, vol. 51, pp. 393-414.
Dickson, V.A. (1981). Conjectural variation elasticities and concentration, Economics
Letters, vol. 7, pp. 281-285.
Dietsch, M. (1993). Economies of scale and scope in French commercial banking
industry, Journal of productivity Analysis, vol. 4, no. 1, pp. 35-50.
Dietsch, M. and Lozano-Vivas, A. (2000). How the environment determines banking
efficiency: A comparison between French and Spanish industries, Journal of Banking
and Finance, 24, no. 6, pp. 985-1004.
Dimova, D.D. (2005). The Benefits of Privatizing Banks to Strategic Foreign
Investors: A Survey of Central and Eastern Europe, Undergraduate Economic
Review, vol. 2, no. 1.
Doku, J.N., Abor, J., Adjasi, C.K. and Andoh, C. (2012). Assessing Competitive
Behaviour in Emerging Banking Market: African Evidence. Research in Accounting
in Emerging Economies, vol. 12, pp. 25-51.
355
Doyle, J. and Green, R. (1994). Efficiency and cross efficiency in DEA: Derivations,
meanings and the uses, Journal of the Operational Research Society, vol. 45, no. 5,
pp. 567–578.
Drake, L. (2001). Efficiency and productivity change in UK banking. Applied
Financial Economics, vol. 11, no. 5, pp. 557-571.
Drakos, K. and Konstantinou, P. (2005). Competition and contestability in transition
banking: An empirical analysis, South-Eastern Europe Journal of Economics, vol. 2,
pp. 183-209.
Drummond, P., Maechler, A.M. and Marcelino, S. (2007). Italy: Assessing
competition and efficiency in the banking system, International Monetary Fund
Working Paper 07/26.
Efron, B. (1979). Bootstrap methods: another look at the jackknife, The annals of
Statistics, vol. 7, no. 1, pp. 1-26.
Egger, P. and Hahn, F.R. (2010). Endogenous bank mergers and their impact on
banking performance: Some evidence from Austria, International Journal of
Industrial Organization, vol. 28, no. 2, pp. 155-166.
Elbadawi, I., Gallant, A.R. and Souza, G. (1983). An elasticity can be estimated
consistently without a priori knowledge of functional form, Econometrica: Journal of
the Econometric Society, vol. 51, no. 6, pp. 1731-1751.
Elyasiani, E., Goldberg, L. (2004). Relationship lending: A survey of the literature,
Journal of Economics and Business, vol. 56, pp. 315–330.
Evanoff, D.D. and Ors, E. (2008). The competitive dynamics of geographic
deregulation in banking: Implications for productive efficiency, Journal of Money,
Credit and Banking, vol. 40, no. 5, pp. 897-928.
Evanoff, D.D., Israilevich, P.R. and Merris, R.C. (1990). Relative price efficiency,
technical change, and scale economies for large commercial banks, Journal of
Regulatory Economics, vol. 2, no. 3, pp. 281-298.
Fadzlan S. and Muzafar S.H. (2013). Financial Sector Consolidation and Competition

356
in Malaysia: An Application of the Panzar-Rosse Method, Journal of Economic
Studies, vol. 40, no. 3.
Fan, Y., Li, Q. and Weersink, A. (1996). Semiparametric estimation of stochastic
production frontier models, Journal of Business and Economic Statistics, vol. 14, pp.
460–468.
Fare R., Martins-Filho C. and Vardanyan M. (2010). On functional form
representation of multi-output production technologies, Journal of Productivity
analysis, vol. 33, no. 2, pp. 81-96.
Fare, R. and Grosskopf, S. (1996). Intertemporal Production Frontiers: With Dynamic
DEA, Kluwer Academic, Boston, MA.
Fare, R.S. and Lovell, C.A.K. (1978). Measuring the technical efficiency of
production, Journal of Economic Theory, vol. 19, pp. 150–162.
Fare, R.S., Grosskopf, S. and Lovell, C.A.K. (1994). Production Frontiers, Cambridge
University Press.
Farinha, L.A., Santos, J.A.C. (2002). Switching from single to multiple bank lending
relationships: Determinants and implications. Journal of Financial Intermediation,
vol. 11, pp. 124–151.
Fernandez, A.I. and Gonzalez, F. (2005). How accounting and auditing systems can
counteract risk-shifting of safety-nets in banking: Some international evidence,
Journal of Financial Stability, vol. 1, no. 4, pp. 466-500.
Fernandez, C., Koop, G. and Steel, M.F.J. (2000). A Bayesian Analysis of Multiple-
Output Production Frontiers, Journal of Econometrics, vol. 98, pp. 47–79.
Fernandez, C., Koop, G. and Steel, M.F.J. (2002). Multiple-Output Production with
Undesirable Outputs: An Application to Nitrogen Surplus in Agriculture, Journal of
the American Statistical Association, Applications and Case Studies, vol. 97, pp. 432–
442.
Fernandez, C., Osiewalski, J. and Steel, M.F.J. (1997). On the Use of Panel Data in
Stochastic Frontier Models with Improper Priors, Journal of Econometrics, vol. 79,

357
pp. 169–193.
Ferrier, G.D. and Hirschberg, J.G. (1997). Bootstrapping Confidence Intervals for
Linear Programming Efficiency Scores: With an Illustration Using Italian Bank Data,
Journal of Productivity Analysis, vol. 8, pp. 19–33.
Ferrier, G.D. and Lovell, C.A. (1990). Measuring cost efficiency in banking:
econometric and linear programming evidence, Journal of Econometrics, vol. 46,
no.1, pp. 229-245.
Figueira, C. and Nellis, J. (2009). Bank merger and acquisitions activity in the EU:
much ado about nothing?, The Service Industries Journal, vol. 29, no. 7, pp. 875-886.
Figueira, C., Nellis, J.G. and Parker, D. (2007). Challenges facing the polish banking
industry: A comparative study with UK banks, Managing Global Transitions, vol. 5,
no. 1, pp. 25-44.
Fiorentino, E., Karmann, A. and Koetter, M. (2006). The cost efficiency of German
banks: a comparison of SFA and DEA, Available at SSRN 947340.
Fitzpatrick, T. and McQuinn, K. (2008). Measuring bank profit efficiency, Applied
Financial Economics, vol. 18, no. 1, pp. 1-8.
Frei, F. and Harker, P. (1999). Projections onto efficient frontiers: Theoretical and
computational extensions to DEA, Journal of Productivity Analysis, vol. 11, pp. 275–
300.
Fried, H. O., Lovell, C. A. K. and Schmidt, S. (eds.). (1993). The Measurement of
Productive Efficiency: Techniques and Applications, New York: Oxford University
Press.
Fries, S., Neven, D. and Seabright, P. (2002). Bank performance in transition
economies.
Fung, M.K. (2006). Scale economies, X-efficiency, and convergence of productivity
among bank holding companies, Journal of banking and finance, vol. 30, no. 10, pp.
2857-2874.

358
Gaertner, M. and Sanya, S. (2012). Assessing Bank Competition within the East
African Community, IMF working paper series, WP/12/32.
Gajurel, D.P. and Pradhan, R.S. (2012). Concentration and competition in Nepalese
banking, Journal of Business, Economics, vol. 1, no. 1, pp. 5-16.
Gallant, A.R. (1982). Unbiased determination of production technologies, Journal of
Econometrics, vol. 20, no. 2, pp. 285-323.
Gallant, A.R. (1981). On the bias in flexible functional forms and an essentially
unbiased form: the Fourier flexible form, Journal of Econometrics, vol. 15, no. 2, pp.
211-245.
Gallant, A.R. and Souza, G. (1991). On the asymptotic normality of Fourier flexible
form estimates, Journal of Econometrics, vol. 50, no. 3, pp. 329-353.
Gathon, H.J. and Perelman, S. (1992). Measuring technical efficiency in European
railways: a panel data approach, Journal of Productivity Analysis, vol. 3, no. 1, pp.
135-151.
Gelfand, M.D. and Spiller, P.T. (1987). Entry barriers and multiproduct oligopolies:
Do they forebear or spoil?, International Journal of Industrial Organization, vol. 5,
no. 1, pp. 101-113.
Gilbert, R. (1984). Bank market structure and competition – A survey, Journal of
Money, Credit and Banking, vol. 16, pp. 617-645.
Gilligan, T., Smirlock, M. and Marshall, W. (1984). Scale and scope economies in the
multi-product banking firm, Journal of Monetary Economics, vol. 13, no. 3, pp. 393-
405.
Gilligan, T.W. and Smirlock, M.L. (1984). An empirical study of joint production and
scale economies in commercial banking, Journal of Banking and Finance, vol. 8, no.
1, pp. 67-77.
Giokas, D.I. (2008a). Assessing the efficiency in operations of a large Greek bank
branch network adopting different economic behaviors, Economic Modeling, vol. 25,
no. 3, pp. 559-574.

359
Giokas, D.I. (2008b). Cost efficiency impact of bank branch characteristics and
location: An illustrative application to Greek bank branches, Managerial Finance,
vol. 34, no. 3, pp. 172-185.
Gischer, H. and Stiele, M. (2009), Competition Tests with a Non-Structural Model:
the Panzar–Rosse Method Applied to Germany's Savings Banks. German Economic
Review, vol. 10, pp. 50–70.
Giustiniani, A. and Ross, K. (2008). Bank competition and efficiency in the FYR
Macedonia, South-Eastern Europe Journal of Economics, vol. 2, pp. 145-167.
Glass, J.C. and McKillop, D.G. (1992). An empirical analysis of scale and scope
economies and technical change in an Irish multiproduct banking firm, Journal of
Banking and Finance, vol. 16, no. 2, pp. 423-437.
Glass, J.C., McKillop, D.G. and Morikawa, Y. (1998). Intermediation and value-
added models for estimating cost economies in large Japanese banks 1977-93, Applied
financial economics, vol. 8, no. 6, pp. 653-661.
Goddard, J. and John Wilson, O.S. (2009). Competition in banking: A disequilibrium
approach, Journal of Banking and Finance, vol. 33, no. 12, pp. 2282-2292.
Goddard, J., Molyneux, P. and Wilson, J.O.S. (2001). European Banking: Efficiency,
Technology and Growth, John Wiley, Chichester, UK.
Goetz, M. (2010). Bank Organization, Market Structure and Risk Taking: Theory and
Evidence from U.S. Commercial Banks, Working Paper, Brown University.
Gondat-Larralde, C. and Lepetit, L. (2001). 19. The impact of market structure and
efficiency on bank profitability: an empirical analysis of banking industries in Central
and Eastern Europe. Financial and Monetary Integration in the New Europe:
Convergence Between the Eu and Central and Eastern Europe, 416.
Gonzalez-Hermosillo, B., Pazarbasioglu, C. and Billings, R. (1997). Banking system
fragility: Likelihood versus timing of failure - An application to the Mexican financial
crisis, IMF Staff Papers.
Gonzalez, F. (2009). Determinants of Bank‐Market Structure: Efficiency and Political

360
Economy Variables, Journal of Money, Credit and Banking, vol. 41, no. 4, pp. 735-
754.
Green, C.J., Murinde, V. and Nikolov, I. (2004). The efficiency of foreign and
domestic banks in Central and Eastern Europe: Evidence on economies of scale and
scope, Journal of emerging market finance, vol. 3, no. 2, pp. 175-205.
Green, R., Doyle, J. and Cook, W.D. (1996). Efficiency bounds in data envelopment
analysis, European Journal of Operational Research, vol. 89, pp. 482–490.
Green, R.H., Cook, W.D. and Doyle, J. (1997). A note on the additive data
envelopment analysis model, Journal of the Operational Research Society, vol. 48,
no. 4, pp. 446–448.
Greenberg, J. B. and Simbanegavi, W. (2009, November). Testing for Competition in
the South African Banking Sector. In Faculty of Commerce University of Cape Town,
(November).
Grigorian, D.A. and Manole, V. (2002). Determinants of commercial bank
performance in transition: an application of data envelopment analysis, World Bank
Policy Research Working Paper, (2850).
Gropp. R. and Kashyap A. (2009). A new metric for banking integration in Europe,
Centre for European Economic research, Discussion Paper No. 08-102.
Grosskopf, S. (1996). Statistical Inference and Nonparametric Efficiency: A Selective
Survey, Journal of Productivity Analysis, vol. 7, pp. 161–176.
Gruben, W.C. and Koo, J. (1997). Contestability and Capital Flows in Argentina‟s
Banking System (unpublished; Dallas, Texas: Federal Reserve Bank of Dallas).
Gual, J. (1999). Deregulation, integration and market structure in European banking.
European Investment Bank Papers, vol. 4, pp. 35–48.
Habte, Y. (2012). Competitive Conditions in the Swedish Banking System.
Hahn, F.R. (2008). Testing for profitability and contestability in banking: evidence
from Austria. International Review of Applied Economics, vol. 22, no. 5, pp. 639-653.

361
Hagendorff, J. and Keasey, K. (2009). Post‐merger strategy and performance:
evidence from the US and European banking industries, Accounting and Finance, vol.
49, no. 4, pp. 725-751.
Hahn, F.R. (2007). Domestic mergers in the Austrian banking sector: a performance
analysis, Applied Financial Economics, vol. 17, no. 3, pp. 185-196.
Hailu, A. and Veeman, T. (2000). Environmentally Sensitive Productivity Analysis of
the Canadian Pulp and Paper Industry, 1959–1994: An Input Distance Function,
Journal of Environmental Economics and Management, vol. 40, no. 3, pp. 251–274.
Haldane, A., Hoggarth, G., Saporta, V. and Sinclair, P. (2004). “Financial Stability
and Bank Solvency,” Chapter 5 from the book “Systemic Financial Crises. Resolving
Large Bank Insolvencies,” editors: Evanoff, D., and Kaufman, G., World Scientific
Publishing (2005), London.
Haldane, A.G. (2004), Defining monetary and financial stability, Bank of England
mimeo.
Hall M. and Tideman N. (1967). Measures of concentration, American Statistical
Association Journal, vol. 62, no. 317, pp. 162-168.
Hamza, R.A. Validation Panzar-Rosse Model in determining the structural
characteristics of Tunisian banking industry, Journal of Economics and International
Finance, vol. 3, no. 5, pp. 259-268.
Hannah, L. and Kay, J.A. (1977). Concentration in modern industry, MacMillan
Press, London.
Hannan, T.H. and Liang, J.N. (1993). Inferring market power from time-series data:
The case of the banking firm, International Journal of Industrial Organization, vol.
11, no. 2, pp. 205-218.
Hart, P.E. (1975). Moment distribution in Economics: An exposition, the Journal of
the Royal Statistical Society, series A, vo. 138, pp. 423-434.
Hasan, I. and Marton, K. (2003). Development and efficiency of the banking sector in
a transitional economy: Hungarian experience, Journal of Banking and Finance, vol.

362
27, no. 12, pp. 2249-2271.
Hause, J.C. (1977). The measurement of concentrated industrial structure and the size
distribution of firms, Annals of Economic and Social Measurement, vol. 6, pp. 73-
107.
Havrylchyk, O. (2006). Efficiency of the Polish banking industry: Foreign versus
domestic banks, Journal of Banking and Finance, vol. 30, no. 7, pp. 1975-1996.
Hawtrey, K. and Liang, H. (2008). Bank interest margins in OECD countries, The
North American Journal of Economics and Finance, 1vol. 9, no. 3, pp. 249-260.
Heffernan, S.A. (2002). How do UK financial institutions really price their banking
products?, Journal of Banking and Finance, vol. 26, no. 10, pp. 1997–2016.
Heffernan, S.A. (2005). Modern Banking, Wiley, London.
Hellman, T.F., Murdock K. and Stiglitz J. E. (2000), Liberalisation, moral hazard in
banking and prudential regulation: Are capital requirements enough?, American
Economic Review, vol. 90, no. 1, pp. 147-165.
Hempell, H. (2002). Testing for competition among German banks.
Hoggarth, G.A., Milne, A. and Wood, G.E. (1998). Alternative routes to banking
stability: A comparison of UK and German banking systems, Financial Stability
Review, vol. 5, pp. 55-68.
Holló, D. and Nagy, M. (2006). Bank efficiency in the enlarged European Union. BIS
Papers, no. 28, pp. 217-235.
Hondroyiannis, G., Lolos, S. and Papapetrou, E. (1999). Assessing competitive
conditions in the Greek banking system, Journal of International Financial Markets,
Institutions and Money, vol. 9, pp. 377-391.
Horvath, J. (1970). Suggestion for a comprehensive measure of concentration,
Southern Economic Journal, vol. 36, no. 4, pp. 446-452.
Houston, J.F. and James, C.M. (2001). Do relationships have limits? Banking
relationships, financial constraints and investment, Journal of Business, vol. 74, pp.

363
347–374.
Huang, H.C. (2004). Estimation of technical inefficiencies with heterogeneous
technologies, Journal of Productivity Analysis, vol. 21, no. 3, pp. 277-296.
Huang, T.H. and Wang, M.H. (2002). Comparison of economic efficiency estimation
methods: Parametric and non–parametric techniques, The Manchester School, vol. 70,
no. 5, pp. 682-709.
Hughes, J. P. and Mester, L.J. (1998). Bank capitalization and cost: Evidence of scale
economies in risk management and signaling, Review of Economics and Statistics,
vol. 80, no. 2, pp. 314-325.
Huizinga, H.P., Nelissen, J.H. and Vennet, R.V. (2001). Efficiency Effects of Bank
Mergers and Acquisitions (No. TI 01-088/3), Tinbergen Institute.
Humphrey D.B. (1992). Flow versus stock indicators in bank output: Effects on
Productivity and scale economy measurement, Journal of financial services research,
vol. 6, pp. 115-135.
Humphrey, D.B. and Pulley, L.B. (1997). Banks' responses to deregulation: Profits,
technology, and efficiency, Journal of Money, Credit, and Banking, vol. 29, no.1, pp.
73-93.
Humphrey, D.B. and Vale, B. (2004). Scale economies, bank mergers, and electronic
payments: A spline function approach, Journal of Banking and Finance, vol. 28, no.
7, pp. 1671-1696.
Hussain, M. and Hassan, M. (2012). Competition, Risk Taking and Efficiency in the
US Commercial Banks Prior to 2008 Financial Crisis. Available at SSRN 2003066.
Hussain, M.E. and Mustapha, N. (2010). Determinants of Bank Competition (March
1, 2010). Available at SSRN: http://ssrn.com/abstract=2004746 or http://dx.doi.org/
10.2139/ssrn.2004746
Iannotta, G., Nocera, G. and Sironi, A. (2007). Ownership structure, risk and
performance in the European banking industry, Journal of Banking and Finance, vol.
31, no. 7, pp. 2127-2149.

364
Isik, I. and Hassan, M.K. (2002). Technical, scale and allocative efficiencies of
Turkish banking industry, Journal of Banking and Finance, vol. 26, no. 4, pp. 719-
766.
Iwata, G. (1974). Measurement of conjectural variations in oligopoly, Econometrica,
vol. 42, pp. 947-966.
Jagtiani, J., Nathan, A. and Sick, G. (1995). Scale economies and cost
complementarities in commercial banks: On-and off-balance-sheet activities, Journal
of Banking and Finance, vol. 19, no. 7, pp. 1175-1189.
Jemric, I. and Vujcic, B. (2002). Efficiency of banks in Croatia: A DEA approach.
Comparative Economic Studies, vol. 44, no. 2-3, pp. 169-193.
Jeong, S.-O. and Simar, L. (2006). Linearly interpolated FDH efficiency score for
nonconvex frontiers, Journal of Multivariate Analysis, vol. 97, no. 10, pp. 2141-2161.
Jimborean, R. and Brack, E. (2010). The cost-efficiency of French banks.
Jiménez, G., Lopez, J. and Saurina Salas, J. (2010). How does competition impact
bank risk-taking?.
John, K., Litov, L. and Yeung, B. (2008). Corporate Governance and Risk‐Taking,
The Journal of Finance, vol. 63, no. 4, pp. 1679-1728.
Kamberoglou, N.C., Liapis, E., Simigiannis, G.T. and Tzamourani, P. (2004). Cost
efficiency in Greek banking, Bank of Greece WP.
Karasulu, M. (2007). Competition in the Chilean Banking Sector: A Cross-Country
Comparison, Economia, vol. 7, no. 2, pp. 1-32.
Kasman, A. (2010). Consolidation and Competition in the Banking Industries of the
EU Member and Candidate Countries, Emerging Markets Finance and Trade, vol. 46,
no. 6, pp. 121-139.
Kasman, A. and Turgutlu, E. (2008). Competitive Conditions in the Turkish Non-Life
Insurance Industry, Review of Middle East Economics and Finance, vol. 4, no. 1, pp.
81-96.

365
Kasman, A. and Yildirim, C. (2006). Cost and profit efficiencies in transition
banking: the case of new EU members, Applied Economics, vol. 38, no. 9, pp. 1079-
1090.
Kaufmann, D., Kraay, A. and Mastruzzi, M. (2009). Governance matters VIII:
aggregate and individual governance indicators, 1996-2008, World bank policy
research working paper, (4978).
Keeley, M. (1990). Deposit insurance, risk and market power in banking. American
Economic Review, vol. 80, pp. 1183–1200.
Khiabani, N. and Hamidisahneh, M. (2012). The effects of entry regulation on bank
competition: The case of the Iranian banking industry, Journal of Applied Economics,
vol. 15, no. 1, pp. 119-137.
Kim S.H., Park C.G. and Park K.S. (1999). An application of data envelopment
analysis in telephone offices evaluation with partial data, Computers and Operations
Research, vol. 26, pp. 59–72.
Kim, J.Y. (2002). Limited information likelihood and Bayesian analysis, Journal of
Econometrics, vol. 107, pp. 175–193.
Kim, Y. and Schmidt, P. (2000). A Review and Empirical Comparison of Bayesian
and Classical Approaches to Inference on Efficiency Levels in Stochastic Frontier
Models with Panel Data, Journal of Productivity Analysis, vol. 14, pp. 91–118.
Kneip, A. and Simar, L. (1996). A General Framework for Frontier Estimation with
Panel Data, Journal of Productivity Analysis, vol. 7, pp. 161–176.
Kneip, A., Park, B.U. and Simar, L. (1998). A Note on the Convergence of
Nonparametric DEA Estimators for Production Efficiency Scores, Econometric
Theory, vol. 14, pp. 783–793.
Koetter, M., Kolari, J.W. and Spierdijk, L. (2012). Enjoying the quiet life under
deregulation? Evidence from adjusted Lerner indices for US banks, Review of
Economics and Statistics, vol. 94, no. 2, pp. 462-480.
Kondeas, A.G., Caudill, S.B., Gropper, D.M. and Raymond, J.E. (2008). Deregulation

366
and productivity changes in banking: evidence from European unification, Applied
Financial Economics Letters, vol. 4, no. 3, pp. 193-197.
Koop, G. (2001). Comparing the Performance of Baseball Players: A Multiple Output
Approach, Working paper in http://www.gla.ac.uk/Acad/PolEcon/Koop/.
Koop, G., Osiewalski, J. and Steel, M.F.J. (1994). Bayesian Efficiency Analysis with
a Flexible Form: The AIM Cost Function. Journal of Business and Economic
Statistics, vol. 12, pp. 339–346.
Kormendi, R.C. and Meguire, P.G. (1985). Macroeconomic determinants of growth:
cross-country evidence, Journal of Monetary economics, vol. 16, no. 2, pp. 141-163.
Koskela, E. and Stenbacka, R. (2000). Is there a tradeoff between bank competition
and financial fragility? Journal of Banking and Finance, vol. 24, no.12, pp. 1853–
1873.
Kosmidou, K. and Zopounidis, C. (2008). Measurement of bank performance in
Greece, South Eastern Europe Journal of Economics, vol. 1, pp. 79-95.
Koutsomanoli-Filippaki, A. and Mamatzakis, E.C. (2010). Estimating the speed of
adjustment of European banking efficiency under a quadratic loss function. Economic
Modeling, vol. 27, no. 1, pp. 1-11.
Koutsomanoli-Filippaki, A., Mamatzakis, E. and Staikouras, C. (2009). Structural
reforms and banking efficiency in the new EU States, Journal of Policy Modeling,
vol. 31, no. 1, pp. 17-21.
Koutsomanoli-Fillipaki, N. and Staikouras, C. (2004). Competition in the new
European banking landscape, European Financial Management, vol. 12, no. 3, pp.
443-482.
Kraft, E. and Tirtiroğlu, D. (1998). Bank efficiency in Croatia: A stochastic-frontier
analysis, Journal of Comparative Economics, vol. 26, no. 2, pp. 282-300.
Kraft, E., Hofler, R. and Payne, J. (2006). Privatization, foreign bank entry and bank
efficiency in Croatia: a Fourier-flexible function stochastic cost frontier analysis,
Applied Economics, vol. 38, no. 17, pp. 2075-2088.

367
Kumbhakar, S.C. (1993). Production risk, technical efficiency, and panel data.
Economics Letters, vol. 41, no. 1, pp. 11-16.
Kumbhakar, S.C. and Tsionas, E.G. (2005). The Joint Measurement of Technical and
Allocative Inefficiencies, Journal of the American Statistical Association, vol. 100,
no. 471, pp. 736-747.
Kumbhakar, S.C. and Tsionas, E.G. (2008). Scale and efficiency measurement using a
semiparametric stochastic frontier model: evidence from the US commercial banks.
Empirical Economics, vol. 34, no. 3, pp. 585-602.
Kumbhakar, S.C., Ghosh, S. and McGuckin, J.T. (1991). A generalized production
frontier approach for estimating determinants of inefficiency in US dairy farms,
Journal of Business and Economic Statistics, vol. 9, pp. 279–286.
Kumbhakar, S.C., Park, A., Simar, S. and Tsionas, E.G. (2007). Nonparametric
stochastic frontiers: A local maximum likelihood approach, Journal of Econometrics,
vol. 237, pp. 1–27.
Kwoka, J. (1985). The Herfindahl index in theory and practice, Anti-trust bulletin,
vol. 30, no. 4, pp. 915-947.
Laeven, L. and Levine, R. (2007). Is there a diversification discount in financial
conglomerates?, Journal of Financial Economics, vol. 85, pp. 331-367.
Laeven, L. and Levine, R. (2009). Bank governance, regulation and risk taking,
Journal of Financial Economics, vol. 93, pp. 259–275.
Lakonishok, J., Shleifer, A. and Vishny, R.W. (1992). The impact of institutional
trading on stock prices, Journal of financial economics, vol. 32, no. 1, pp. 23-43.
Land, K.C., Lovell, C.A.K. and Thore, S. (1992). Productive efficiency under
capitalism and state socialism: The chance constrained programming approach, Public
Finance in a World of Transition, vol. 47, pp. 109–121.
Land, K.C., Lovell, C.A.K. and Thore, S. (1994). Production efficiency under
capitalism and state socialism: An empirical inquiry using chance constrained data
envelopment analysis, Technological Forecasting and Social Change, vol. 46, pp.

368
139– 152.
Lang, G. and Welzel, P. (1996). Efficiency and technical progress in banking
Empirical results for a panel of German cooperative banks, Journal of Banking and
Finance, vol. 20, no. 6, pp. 1003-1023.
Lau, L. (1982). On identifying the degree of competitiveness from industry price and
output data, Economics Letters, vol. 10, pp. 93-99.
Leamer, H. (1983). Let's Take the Con Out of Econometrics, American Economic
Review, vol. 73, pp. 31-43.
Leamer, H. (1985). Sensitivity Analyses Would Help, American Economic Review,
vol. 75, pp. 308-13.
Leamer, H. and Leonard, H. (1983). Reporting the Fragility of Regression Estimates,
Review of Economics and Statistics, vol. 65, pp. 306-17.
Lensink, R. and Maslennikova, I. (2008). Value performance of European bank
acquisitions, Applied financial economics, vol. 18, no. 3, pp. 185-198.
Lensink, R., Meesters, A. and Naaborg, I. (2008). Bank efficiency and foreign
ownership: Do good institutions matter?, Journal of Banking and Finance, vol. 32,
no. 5, pp. 834-844.
Lerner, A. (1934). The Concept of Monopoly and the Measurement of Monopoly
Power, Review of Economic Studies, vol. 1, pp. 157-175.
Levine, R. and Renelt, D. (1992). A sensitivity analysis of cross-country growth
regressions, The American Economic Review, vol. 82, no. 4, pp. 942-963.
Levy-Yeyati, E. and Micco, A. (2007). Concentration and foreign penetration in Latin
American banking sectors: impact on competition and risk, Journal of Banking and
Finance, vol. 31, no. 6, pp. 1633–1647.
Liang, L.F., Wu, J., Cook, W.D. and Zhu, J. (2008). The DEA cross efficiency model
and its Nash equilibrium, Operations Research, forthcoming.
Lima, F. (2008). Product differentiation and the measurement of cost efficiency in

369
banking: the case of Portuguese banks, New Developments in Financial Modeling,
vol. 1, no. 1, pp. 34-76.
Lima, F. and Soares de Pinho, P. (2008). Financial disintermediation and the
measurement of efficiency in banking: the case of Portuguese banks, International
Journal of Banking, Accounting and Finance, vol. 1, no. 2, pp. 133-148.
Liu, H., Molyneux, P. and Wilson, J.O. (2010). Competition and stability in European
banking: A regional analysis, The Manchester School, vol. 81, no. 2, pp. 176-201.
Lloeyd-Williams D.M., Molyneux P. and Thornton J. (1994). Market structure and
performance in Spanish banking, Journal of Banking and Finance, vol. 18, pp. 433-
443.
Lovell, C.A.K., Rouse, A.P.B. (2003). Equivalent standard DEA models to provide
super-efficiency scores, Journal of the Operational Research Society, vol. 54, no.1,
pp. 101–108.
Lozano-Vivas, A. and Pasiouras, F. (2010). The impact of non-traditional activities on
the estimation of bank efficiency: international evidence, Journal of Banking and
Finance, vol. 34, no. 7, pp. 1436-1449.
Lozano-Vivas, A., Pastor, J.T. and Hasan, I. (2001). European Bank Performance
Beyond Country Borders: What Really Matters?, European Finance Review, vol. 5,
no. 1-2, pp. 141-165.
Lozano-Vivas, A., Pastor, J.T. and Pastor, J.M. (2002). An efficiency comparison of
European banking systems operating under different environmental conditions,
Journal of Productivity Analysis, vol. 18, no. 1, pp. 59-77.
Lucinda, C.R. (2010). Competition in the Brazilian loan market: an empirical
analysis. Estudos Economicos (Sao Paulo), vol. 40, no. 4, pp. 831-858.
Luckett, G.D. (1980). Money and Banking, 2nd
ed. New York: McGraw-Hill.
Macit, F. (2012). Recent evidence on concentration and competition in Turkish
banking sector, International Research Journal of Finance and Economics, (96).

370
Malmquist, S. (1953). Index numbers and indifference surfaces, Trabajos de
Estadistica y de Investigacion Operativa, vol. 4, no. 2, pp. 209-242.
Mamatzakis, E., Staikouras, C. and Koutsomanoli-Fillipaki, N. (2005). Competition
and concentration in the banking sector of the South Eastern European region,
Emerging Markets Review, vol. 6, no. 2, pp. 192-209.
Mamatzakis, E., Staikouras, C. and Koutsomanoli-Filippaki, A. (2008). Bank
efficiency in the new European Union member states: Is there convergence?,
International Review of Financial Analysis, vol. 17, no. 5, pp. 1156-1172.
Marcus, A.J. (1984). Deregulation and bank financial policy, Journal of Banking and
Finance, vol. 8, pp. 557-565.
Marfels, C. (1971). Absolute and relative measures of concentration reconsidered,
Kyklos, vol. 24, pp. 753–66.
Marius, A.A. and Bogdan, C. (2011). Competition in Romanian Banking Sector.
Annals of Faculty of Economics, vol. 1, no. 1, pp. 455-460.
Martin S. (1993). Advanced industrial Economics, Blackwell, New York and Oxford.
Martinez-Miera, D. and Repullo, R. (2010). Does competition reduce the risk of bank
failure?, Review of Financial Studies, vol. 23, no. 10, pp. 3638-3664.
Masood, O. and Aktan, B. (2010). The State of Competition of the Turkish Banking
Industry: An Application of the Panzar-Rosse Model, Journal of Business Economics
and Management, no. 1/2010, pp. 131-145.
Masood, O. and Sergi, B.S. (2011). China‟s banking system, market structure, and
competitive conditions, Frontiers of Economics in China, vol. 6, no. 1, pp. 22-35.
Matthews, K., Murinde, V. and Zhao, T. (2007). Competitive conditions among the
major British banks, Journal of Banking and Finance, vol. 31, no. 7, pp. 2025-2042.
Matutes C. and Vives X. (1996). Competition for deposits, fragility and insurance,
Journal of Financial Intermediation, vol. 5, no.2, pp. 184-216.
Matutes, C. and Vives, X. (2000). Imperfect competition, risk taking, and regulation
371
in banking, European Economic Review, vol. 44, pp. 1-34.
Maudos, J. and De Guevara, J.F. (2007). The cost of market power in banking: Social
welfare loss vs. cost inefficiency, Journal of Banking and Finance, vol. 31, no. 7, pp.
2103-2125.
Maudos, J. and Pastor, J.M. (2001). Cost and profit efficiency in banking: an
international comparison of Europe, Japan and the USA, Applied Economics Letters,
vol. 8, no. 6, pp. 383-387.
Maudos, J. and Pastor, J.M. (2003). Cost and profit efficiency in the Spanish banking
sector (1985–1996): A non-parametric approach, Applied Financial Economics, vol.
13, no. 1, pp. 1-12.
Maudos, J. and Perez , F. ( 2003). Competencia vs . poder de mercado en la banca
espanola, Moneda y Credito, vol. 217, pp. 139-166.
Maudos, J., Pastor, J. M., Perez, F. and Quesada, J. (2002). Cost and profit efficiency
in European banks, Journal of International Financial Markets, Institutions and
Money, vol. 12, no. 1, pp. 33-58.
McAllister, P.H. and McManus, D. (1993). Resolving the scale efficiency puzzle in
banking, Journal of Banking and Finance, vol. 17, no. 2, pp. 389-405.
Meeusen, W. and van den Broeck, J. (1977). Efficiency Estimation from Cobb-
Douglas production functions with composed error. International Economic Review,
vol. 18, pp. 435–444.
Mendes, V. and Rebelo, J. (1999). Productive efficiency, technological change and
productivity in Portuguese banking, Applied Financial Economics, vol. 9, no. 5, pp.
513-521.
Mensi, S. (2010). Measurement of competitiveness degree in Tunisian deposit banks:
An application of the Panzar and Rosse model, Panoeconomicus, vol. 57, no. 2, pp.
189-207.
Méon, P.G. and Weill, L. (2005). Does better governance foster efficiency? An
aggregate frontier analysis, Economics of Governance, vol. 6, no. 1, pp. 75-90.

372
Mercan, M. (2012). Competitive Conditions in the Banking Industry of Georgian
Economy: PR H Model, Procedia-Social and Behavioral Sciences, vol. 62, pp. 1260-
1264.
Mertens, A. and Urga, G. (2001). Efficiency, scale and scope economies in the
Ukrainian banking sector in 1998, Emerging Markets Review, vol. 2, no. 3, pp. 292-
308.
Mester, L.J. (2003). Applying Efficiency Measurement Techniques to Central Banks,
FRB of Philadelphia Working Paper No. 03-13. Available at SSRN: http://ssrn.com/
abstract=572442 or doi:10.2139/ssrn.572442
Mester, L.J. (2012). A multiproduct cost study of savings and loans, The Journal of
Finance, vol. 42, no. 2, pp. 423-445.
Mishkin F. S. (1999). Financial consolidation: Dangers and opportunities, Journal of
Banking and Finance, vol. 23, pp. 675-691.
Mitchell, K. and Onvural, N. M. (1996). Economies of scale and scope at large
commercial banks: Evidence from the Fourier flexible functional form, Journal of
Money, Credit and Banking, vol. 28, no. 2, pp. 178-199.
Mlambo, K. and Ncube, M. (2011). Competition and efficiency in the banking sector
in South Africa. African Development Review, vol. 23, no.1, pp. 4-15.
Molyneux P. and Forbes W. (1995). Market structure and performance in European
banking, Applied Economics, vol. 27, pp. 155-159.
Molyneux P., Altunbas Y. and Gardener E. (1996). Efficiency in European banking,
John Wiley and Sons, Ltd.
Molyneux, P., Lloyd-Williams, D. and Thornton, J. (1994). Competitive conditions in
European banking, Journal of Banking and Finance, vol. 18, pp. 445-459.
Moussawi, C.E. and Saad, W. (2012). Measuring the Degree of Competition in the
Lebanese Banking System, International Research Journal of Finance and
Economics, no. 94.

373
Muniz, M., Paradi, J., Ruggiero, J. and Yang, Z.J. (2006). Evaluating alternative DEA
models used to control for non-discretionary inputs, Computers and Operations
Research, vol. 33, pp. 1173–1183.
Murphy, K., Shleifer, A. and Vishny, R. (1992). The transition to a market economy:
Pitfalls of partial reform, Quarterly Journal of Economics, vol. 107, pp. 889-906.
Mwega, F. (2011). The competitiveness and efficiency of the financial services sector
in Africa: A case study of Kenya, African Development Review, vol. 23, no. 1, pp. 44-
59.
Nagarajan, S. and Sealey, C.W. (1995). Forbearance, deposit insurance pricing, and
incentive compatible bank regulation, Journal of Banking and Finance, vol. 19, no. 6,
pp. 1109-1130.
Nathan, A. and Neave, H.E. (1989). Competition and Contestability in Canada‟s
Financial System: Empirical Results, Canadian Journal of Economics, vol. 22, 576–
594.
Nelder, M. (2003). Competition necessarily tends to produce excess: The experience
of free banking in Switzerland, German Economic review, vol. 4, no. 3, pp. 389-408.
Neralic, L. (1997). Sensitivity in data envelopment analysis for arbitrary perturbations
of data, Glasnik Matematicki, vol. 32, pp. 315–335.
Neralic, L. (2004). Preservation of efficiency and inefficiency classification in data
envelopment analysis, Mathematical Communications, vol. 9, pp. 51– 62.
Neven, D. and Roller , L.H. (1999). An aggregate structural model of competition in
the European banking industry, International Journal of Industrial Organization, vol.
17, no. 7, pp. 1059-1074.
Nguyen, M., Skully, M. and Perera, S. (2012). Bank market power and revenue
diversification: Evidence from selected ASEAN countries, Journal of Asian
Economics. vol. 3, no. 6, pp. 688-700.
Nguyen, M., Skully, T.M. and Perera, S. (2012). Bank Market Power and Liquidity:
Evidence from 113 Developed and Developing Countries, 25th Australasian Finance

374
and Banking Conference 2012.
Noulas, A.G. (1997). Productivity growth in the Hellenic banking industry: state
versus private banks, Applied Financial Economics, vol. 7, no. 3, pp. 223-228.
Noulas, A.G., Ray, S.C. and Miller, S.M. (1990). Returns to scale and input
substitution for large US banks, Journal of Money, Credit and Banking, vol. 22, no. 1,
pp. 94-108.
Olesen, O.B. and Petersen, N.C. (1995). Chance Constrained Efficiency Evaluation,
Management Science, vol. 41, pp. 442–457.
Olivero, M.P., Li, Y. and Jeon, B. N. (2011). Competition in banking and the lending
channel: Evidence from bank-level data in Asia and Latin America. Journal of
Banking and Finance, vol. 35, no. 3, pp. 560-571.
Orea, L. and Kumbhakar, S.C. (2004). Efficiency measurement using a latent class
stochastic frontier model, Empirical Economics, vol. 29, 1, pp. 169-183.
Osiewalski, J. and Steel, M.F.J. (1998). Numerical Tools for the Bayesian Analysis of
Stochastic Frontier Models, Journal of Productivity Analysis, vol. 10, pp. 103–117.
Ou, Chao-min and Tan, Yue-Jin. (2011). Multi-perspective Studies on Competition
Degree of Chinese Banking Industry: Empirical Analysis Based on Panzar-Rosse
Method, Systems engineering, 02/2011.
Oxenstierna, G. (1998). An Asymmetric Oligopoly Model and a Method for its
Empirical Application, Journal of Economics, vol.67, no.1, pp 39-61.
Oxenstierna, G. (2000). Testing for Market Power in the Swedish Banking Oligopoly,
working paper 2/2000, Sodertorns hogskola.
Panzar, J.C., Rosse, J.N. (1982). Structure, conduct and comparative statistics, Bell
Laboratories Economics discussion paper, Bell Laboratories.
Panzar, J.C., Rosse, J.N. (1987). Testing for „monopoly‟ equilibrium, The Journal of
Industrial Economics, vol. 35, pp. 443-456.
Park, B.U. and Simar, L. (1994). Efficient semiparametric estimation in a stochastic

375
frontier model, Journal of the American Statistical Association, vol. 89, pp. 92–936.
Park, B.U., Sickles, R.C. and Simar, L. (2007) Semiparametric efficient estimation of
dynamic panel data models, Journal of Econometrics, vol. 136, pp. 281-301.
Park, B.U., Simar, L. and Sickles, R.C. (1998). Stochastic panel frontiers: a
semiparametric approach, Journal of Econometrics, vol. 84, pp. 121–152.
Park, B.U., Simar, L. and Weiner, Ch. (2000). The FDH Estimator for Productivity
Efficiency Scores: Asymptotic Properties, Econometric Theory, vol. 16, pp. 855–877.
Park, K.H. (2009). Has bank consolidation in Korea lessened competition?, The
Quarterly Review of Economics and Finance, vol. 49, no. 2, Pages 651-667.
Pasiouras, F. (2008a). Estimating the technical and scale efficiency of Greek
commercial banks: the impact of credit risk, off-balance sheet activities, and
international operations, Research in International Business and Finance, vol. 22, no.
3, pp. 301-318.
Pasiouras, F. (2008b). International evidence on the impact of regulations and
supervision on banks‟ technical efficiency: an application of two-stage data
envelopment analysis, Review of Quantitative Finance and Accounting, vol. 30, no. 2,
pp. 187-223.
Pasiouras, F., Liadaki, A. and Zopounidis, C. (2008). Bank efficiency and share
performance: evidence from Greece, Applied Financial Economics, vol. 18, no. 14,
pp. 1121-1130.
Pasiouras, F., Tanna, S. and Zopounidis, C. (2009). The impact of banking regulations
on banks' cost and profit efficiency: Cross-country evidence, International Review of
Financial Analysis, vol. 18, no. 5, pp. 294-302.
Pastor, J., Perez, F. and Quesada, J. (1997). Efficiency analysis in banking firms: An
international comparison, European Journal of Operational Research, vol. 98, no.2,
pp. 395-407.
Pastor, J.M. (2002). Credit risk and efficiency in the European banking system: A
three-stage analysis, Applied Financial Economics, vol. 12, no. 12, pp. 895-911.

376
Pastor, J.M. and Serrano, L. (2005). Efficiency, endogenous and exogenous credit risk
in the banking systems of the Euro area, Applied Financial Economics, vol. 15, no. 9,
pp. 631-649.
Pastor, J.M. and Serrano, L. (2006). The Effect of Specialisation on Banks'
Efficiency: An International Comparison, International Review of Applied Economics,
vol. 20, no. 1, pp. 125-149.
Pastor, J.T., Ruiz, J.L. and Sirvent, I. (1999). An enhanced DEA Russell graph
efficiency measure, European Journal of Operational Research, vol. 115, pp. 596–
607.
Pawlowska, M. (2003). The Impact of M&A on Technical Efficiency, Scale
Efficiency and Productivity Change in the Polish Banking Sector: a Non-Parametric
Approach (No. 29), National Bank of Poland, Economic Institute.
Pawlowska, M. (2012). Competition, concentration and foreign capital in the Polish
banking sector (prior and during the financial crisis). National Bank of Poland
Working Paper, (130).
Peltzman, S. (1977). The gains and losses from industrial concentration, Journal of
Law and Economics, vol. 20, pp. 229-263.
Perotti, C.E. and Suarez, J. (2002). Last bank standing: What do I gain if you fail?,
European Economic Review, vol. 46, pp. 1599-1622.
Petersen, M.A. and Rajan, R.G. (1995). The effect of credit market competition on
lending relationships, Quarterly Journal of Economics, vol. 110, no. 2, pp. 407-443.
Podpiera, A. and Podpiera, J. (2005). Deteriorating Cost Efficiency in Commercial
Banks Signals an Increasing Risk of Failure, Czech National Bank.
Poghosyan, T. and Kumbhakar, S.C. (2010). Heterogeneity of technological regimes
and banking efficiency in former socialist economies, Journal of Productivity
Analysis, vol. 33, no. 1, pp. 19-31.
Portela, M. and Thanassoulis, E. (2007). Comparative efficiency analysis of
Portuguese bank branches, European Journal of Operational Research, vol. 177, no.

377
2, pp. 1275-1288.
Portela, M., Castro, P. and Thanassoulis, E. (2003). Finding closest targets in non-
oriented DEA models: The case of convex and non-convex technologies, Journal of
Productivity Analysis, vol. 19, pp. 251–269.
Poshakwale, S.S. and Qian, B. (2011). Competitiveness and Efficiency of the Banking
Sector and Economic Growth in Egypt, African Development Review, vol. 23, no. 1,
pp. 99-120.
Prasad, A. and Ghosh, S. (2007). Competition in Indian Banking An Empirical
Evaluation, South Asia Economic Journal, vol. 8, no. 2, pp. 265-284.
Primorac, M. and Troskot, Z. (2005). Measuring the Efficacy and Productiveness of
Croatian Banks with the Malmquist Index of Change in Total Factor Productivity,
Financial Theory and Practice, vol. 29, no. 4, pp. 309-325.
Pruteanu-Podpiera, A., Weill, L. and Schobert, F. (2007). Market Power and
Efficiency in the Czech Banking Sector. Working Papers, 6.
Pulley, L.B. and Braunstein, Y.M. (1992). A composite cost function for multiproduct
firms with an application to economies of scope in banking, The Review of Economics
and Statistics, vol. 74, no. 2, pp. 221-230.
Punt, L.W. and Van Rooij, M.C.J. (1999). The profit-structure relationship, efficiency
and mergers in the European banking industry: an empirical assessment, Research
Memorandum WO&E, 604.
Quah, D.T. (1996). Empirics for economic growth and convergence, European
economic review, vol. 40, no. 6, pp. 1353-1375.
Rajan, R.G. (1992). Insiders and outsiders: the choice between informed and arm‟ s-
length debt, Journal of Finance, vol. 47, pp. 1367–1400.
Ray, S.C. and Das, A. (2010). Distribution of cost and profit efficiency: Evidence
from Indian banking, European Journal of Operational Research, vol. 20, no. 1, pp.
297-307.

378
Rebelo, J. and Mendes, V. (2000). Malmquist indices of productivity change in
Portuguese banking: the deregulation period, International Advances in Economic
Research, vol. 6, no. 3, pp. 531-543.
Reid, G.C. (1987). Theories of industrial organisation, Blackwell, New York and
Oxford.
Resti, A. (1997). Evaluating the cost-efficiency of the Italian banking system: what
can be learned from the joint application of parametric and non-parametric
techniques, Journal of Banking and Finance, vol. 21, no. 2, pp. 221-250.
Rezitis, A.N. (2010). Evaluating the state of competition of the Greek banking
industry, Journal of international financial markets, institutions and money, vol. 20,
no. 1, pp. 68-90.
Rhoades, A.S. (1994). A summary of merger performance studies in banking, 1980-
93, and an assessment of the operating performance and event study methodologies,
Staff Studies 167, Board of Governors of the Federal Reserve System (U.S.).
Rhoades, A.S. (1995). Market share inequality, the HHI, and other measures of the
firm-composition of the market, Review of Industrial Organisation, vol. 10, no. 6, pp.
657-674.
Rime, B. (1999). Mesure de degre de concurrence dans le systeme bancaire Suisse a
l‟aide du modele de Panzar et Rosse , Revue Suisse d’Economie Politique et de
Statistique, vol. 135, no. 1, pp. 21-40.
Rime, B. and Stiroh, K.J. (2003). The performance of universal banks: Evidence from
Switzerland, Journal of banking and finance, vol. 27, no. 11, pp. 2121-2150.
Rockoff, H. (1975). The Free Banking Era: A Reconsideration, New York: Arno.
Roll, Y., Cook, W.D. and Golany, B. (1991). Controlling factor weights in data
envelopment analysis, IIE Transactions, vol. 23, pp. 2–9.
Rolnick, A.J. and Weber, W.E. (1983). New evidence on the free banking era, The
American Economic Review, vol. 73, no. 5, pp. 1080-1091.

379
Rolnick, A.J. and Weber, W.E. (1984). The causes of free bank failures: A detailed
examination, Journal of Monetary Economics, vol. 14, no. 3, pp. 267-291.
Rosenbluth, G. (1955). Measures of concentration, in business concentration and
Price policy, National Bureau Committee for Economic Research, Princeton, pp. 57-
99.
Rossi, S.P., Schwaiger, M. and Winkler, G. (2005). Managerial behavior and
cost/profit efficiency in the banking sectors of Central and Eastern European
countries, Oesterr. Nationalbank.
Ruggiero, J. (1996). On the measurement of technical efficiency in the public sector,
European Journal of Operational Research, vol. 90, pp. 553– 565.
Saez, L. and Shi, X. (2004). Liquidity pools, risk sharing and financial contagion,
Journal of Financial Services Research, vol. 25, pp. 5-23.
Sala-i-Martin, X.X. (1996). The classical approach to convergence analysis. The
Economic Journal, ωολ. 106, νο. 437, pp. 1019-1036.
Salamanca, D. (2005). Competencia en los mercados de credito y depositos en
Colombia: aplicacion de un modelo de oligopolio fijador de precios. Universidad de
los Andes.
Salop, S. and Stiglitz J. (1977). Bargains and rip-offs: A model of monopolistically
competitive price dispersion, Review of economic studies, vol. 4, pp. 493-510.
Schaeck, K. (2006). Bank Competition and Bank Soundness: New evidence.
Schaeck, K. (2009). Bank market structure, competition and stability: Issues and
concepts. In: M. Fratianni, A. Z., Alessandrini, P. (Eds.), The Changing Geography of
Banking. Springer, pp. 133–153.
Schaeck, K. and Cihak, M. (2008). How does competition affect efficiency and
soundness in banking? New empirical evidence. European Central Bank Working
Paper 932.
Schaeck, K., Cihak, M. and Wolfe, S. (2009). Are competitive banking systems more

380
stable?, Journal of Money, Credit and Banking, vol. 41, no. 4, pp. 711-734.
Scherer, F.M. and Ross D. (1990). Industrial Market structure and Economic
performance, Houghton Mifflin, Boston.
Schmidt, P. and Sickles, R.C. (1984). Production Frontiers and Panel Data, Journal of
Business and Economic Statistics, vol. 2, pp. 299–326.
Sealey, C.W. and Lindley, J.T. (1977). Inputs, outputs, and a theory of production and
cost at depository financial institutions, The Journal of Finance, vol. 32, no. 4, pp.
1251-1266.
Seiford, L.M. and Zhu, J. (1997). An investigation of returns to scale in data
envelopment analysis, OMEGA, vol. 27, pp. 1–11.
Seiford, L.M. and Zhu, J. (1999). Profitability and marketability of the top 55 US
commercial banks, Management Science, vol. 45, no. 9, pp. 1270–1288.
Sengupta, J.T. (1990). Transformation in Stochastic DEA Models. Journal of
Econometrics, vol. 46, no. 1–2, pp. 109–124.
Sepulveda, J.P. (2012). On the relationship between concentration and competition:
evidence from the Chilean private pension system, Applied Economics Letters, vol.
19, no. 14, pp. 1385-1389.
Sexton, T.R., Silkman, R.H., Hogan, A.J. (1986). Data envelopment analysis: Critique
and extensions. In: Silkman, R.H. (Ed.), Measuring Efficiency: An Assessment of
Data Envelopment Analysis, vol. 32. Jossey-Bass, San Francisco, pp. 73–105.
Shaffer, S. (1989) Competition in the U.S. Banking Industry, Economics Letters, vol.
29, no. 4, pp. 321–23.
Shaffer, S. (1993). A Test of Competition in Canadian Banking, Journal of Money,
Credit and Banking, vol. 25, no. 1, pp. 49-61.
Shaffer, S. (1994). A revenue-restricted cost study of 100 large banks, Applied
Financial Economics, vol. 4, no. 3, pp. 193-205.
Shaffer, S. (2001). Banking conduct before the European single banking license: a
381
cross-country comparison, The North American Journal of Economics and Finance,
vol. 12, no. 1, pp. 79-104.
Shaffer, S. and DiSalvo, J. (1994). Conduct in a banking duopoly, Journal of Banking
and Finance, vol. 18, pp. 1063-1082.
Shin, D.J. and Kim, B.H. (2012). Bank consolidation and competitiveness: empirical
evidence from the Korean banking industry, Journal of Asian Economics, vol. 24, pp.
41-50.
Shin, H. (2009). Securitization and Financial Stability, Economic Journal, vol. 119,
pp. 309-332.
Sickles, R.C. (2005). Panel estimators and the identification of firm-specific
efficiency levels in parametric, semi-parametric and non-parametric settings, Journal
of Econometrics, vol. 126, pp. 305-334.
Sickles, R.C., Good, D.H. and Getachew, L. (2002). Specification of distance
functions using semi- and nonparametric methods with an application to the dynamic
performance of Eastern and Western European air carriers, Journal of Productivity
Analysis, vol. 17, pp. 133–155.
Simar, L. (1992). Estimating efficiencies from frontier models with panel data: a
comparison of parametric, non-parametric and semi-parametric methods with
bootstrapping, Journal of productivity analysis, vol. 3, no. 1, pp. 171-203.
Simar, L. and Wilson, P.W. (1998). Sensitivity Analysis of Efficiency Scores: How to
Bootstrap in Nonparametric Frontier Models, Management Science, vol. 44, no. 11,
pp. 49–61.
Simar, L. and Wilson, P.W. (1999). Estimating and Bootstrapping Malmquist Indeces,
European Journal of Operations Research, vol. 115, pp. 459–471.
Simar, L. and Wilson, P.W. (2000a). Statistical Inference in Nonparametric Frontier
Models: The State of the Art, Journal of Productivity Analysis, vol. 13, pp. 49–78.
Simar, L. and Wilson, P.W. (2000b). A General Methodology for Bootstrapping in
Nonparametric Frontier Models, Journal of Applied Statistics, vol. 27, no. 6, pp. 779-
382
802.
Simbanegavi, W., Greenberg, J. and Gwatidzo, T. (2012). Testing for competition in
the South African banking sector.
Simpasa, A.M. (2011). Competitive conditions in the Tanzanian commercial banking
industry, African Development Review, vol. 23, no.1, pp. 88-98.
Simper, R. and Hall, M. (2012). Efficiency and Competition in Korean Banking,
Nottingham University Business School Research Paper, (2012-07).
Sjoberg, P. (2004), Market Power and Performance in Swedish Banking, Department
of Economics (Goteborg University).
Skully, M. and Perera, S. (2012). Bank Market Power and Liquidity: Evidence from
113 Developed and Developing Countries. Available at SSRN 2136743.
Smirlock, M. (1985). Evidence on the (non) relationship between concentration and
profitability in banking, Journal of Money, Credit, and Banking, vol. 17, no. 1, pp.
69-83.
Smith, B.D. (1984). Private information, deposit interest rates, and the „stability‟ of
the banking system, Journal of Monetary Economics, vol. 14, pp. 293-317.
Soedarmono, W. (2010). Bank competition, institution and economic development:
Evidence from Asia during 1999-2007, Economics Bulletin, vol. 30, no. 3, pp. 2119-
2133.
Soedarmono, W., Machrouh, F. and Tarazi, A. (2011). Bank market power, economic
growth and financial stability: Evidence from Asian banks, Journal of Asian
Economics, vol. 22, no. 6, pp. 460-470.
Spiller, P.T. and Favaro, E. (1984). The effects of entry regulation on oligopolistic
interaction: The Uruguayan banking sector, The Rand Journal of Economics, vol. 15,
no. 2, pp. 244-254.
Spong, K., Sullivan, R.J. and DeYoung, R. (1995). What makes a bank efficient? A
look at financial characteristics and bank management and ownership structure,

383
Federal Reserve Bank of Kansas City, Financial Industry Perspectives, December, 1-
19.
Srairi, S.A. (2010). Cost and profit efficiency of conventional and Islamic banks in
GCC countries, Journal of Productivity Analysis, vol. 34, 1, pp. 45-62.
Staikouras, C.K. and Koutsomanoli‐Fillipaki, A. (2006). Competition and
concentration in the new European banking landscape, European Financial
Management, vol. 12, no. 3, pp. 443-482.
Staikouras, C., Mamatzakis, E. and Koutsomanoli-Filippaki, A. (2008a). An empirical
investigation of operating performance in the new European banking landscape,
Global Finance Journal, vol. 19, no.1, pp. 32-45.
Staikouras, C., Mamatzakis, E. and Koutsomanoli-Filippaki, A. (2008b). Cost
efficiency of the banking industry in the South Eastern European region, Journal of
International Financial Markets, Institutions and Money, vol. 18, no. 5, pp. 483-497.
Stavarek, D. (2003). Banking efficiency in Visegrad countries before joining the
European Union. Available at SSRN 671664.
Stavarek, D. (2005). Efficiency of banks in regions at different stage of European
integration process. Available at SSRN 672184.
Stavarek, D. and Repkova, I. (2011). Estimation of the competitive conditions in the
Czech banking sector, pp. 299-305.
Steen, F. and Salvanes K. (1999). Testing for Market Power using a Dynamic
Oligopoly Model, International Journal of Industrial Organization, vol. 17, pp. 147–
77.
Stiglitz, E.J. and Weiss, A. (1981). Credit rationing in markets with imperfect
information, American Economic Review, vol. 71, no. 3, pp. 393-410.
Stiroh, K.J., (2004). Do community banks benefit from diversification? Journal of
Financial Services Research, vol. 25, pp. 135-160.
Sueyoshi, T. (1990). A special algorithm for the additive model in DEA, Journal of

384
the Operational Research Society, vol. 41, no. 3, pp. 249–257.
Sufian, F. (2009). Determinants of bank efficiency during unstable macroeconomic
environment: Empirical evidence from Malaysia, Research in International Business
and Finance, vol. 23, no. 1, pp. 54-77.
Sufian, F. (2011). The nexus between financial sector consolidation, competition and
efficiency: empirical evidence from the Malaysian banking sector, IMA Journal of
Management Mathematics, vol. 22, no. 4, pp. 419-444.
Sufian, F. and Habibullah, M.S. (2012). Financial Sector Consolidation and
Competition in Malaysia: An Application of the Panzar-Rosse Method, Journal of
Economic Studies, vol. 40, no. 3.
Summer, M. (2003). Banking regulation and systemic risk, Open Economies review,
vol. 14, pp. 43-70.
Sun, Yu. (2011). Recent Developments in European Bank Competition, IMF Working
Papers, vol. 11, no. 146, pp. 1-25, 2011.
Suominen, M. (1994). Measuring Competition in Banking: A Two-Product Model,
Scandinavian Journal of Economics, vol. 96, no. 1, pp. 95–110.
Sutton, J. (1991). Sunk Costs and Market Structure. MIT Press, London.
Swank, J. (1995). Oligopoly in loan and deposit markets: an econometric application
to the Netherlands, De Economist, vol. 143, no. 3, pp. 353-366.
Syrjanen, M.J. (2004). Non-discretionary and discretionary factors and scale in data
envelopment analysis, European Journal of Operational Research, vol. 158, pp. 20–
33.
Tabak, B.M., Gomes, G. and Junior, M. (2012). The Impact of Market Power at Bank
Level in Risk-Taking: The Brazilian Case (No. 283).
Thanassoulis, E. and Allen, R. (1998). Simulating weights restrictions in data
envelopment analysis by means of unobserved DMUs, Management Science, vol. 44,
no. 4, pp. 586–594.

385
Thompson, R.G., Dharmapala, S. and Thrall, R.M. (1995). Linked-cone DEA profit
ratios and technical inefficiencies with applications to Illinois coal mines,
International Journal of Production Economics, vol. 39, pp. 99– 115.
Thompson, R.G., Langemeir, L.N., Lee, C., Lee, E. and Thrall, R.M. (1990). The role
of multiplier bounds in efficiency analysis with application to Kansas farming,
Journal of Econometrics, vol. 46, pp. 93–108.
Thompson, R.G., Singleton, F.D., Thrall, R.M. and Smith, B.A. (1986). Comparative
site evaluations for locating a high-energy physics lab in Texas, Interfaces, vol. 16,
no. 6, pp. 35-49.
Thore, S. (1987). Chance-constrained activity analysis, European Journal of
Operational Research, vol. 30, pp. 267–269.
Tomova, M. (2005). X-efficiency of European banking-inequality and convergence,
Free University of Brussels.
Tone, K. (2001). A slacks-based measure of efficiency in data envelopment analysis,
European Journal of Operational Research, vol. 130, pp. 498–509.
Toolsema, L. (2002). Competition in the Dutch consumer credit market, Journal of
Banking and Finance, vol. 26, pp. 2215-2229.
Tortosa-Ausina, E. (2002). Bank cost efficiency and output specification, Journal of
Productivity Analysis, vol. 18, no. 3, pp. 199-222.
Tran, K.C. and Tsionas, E.G. (2009). Estimation of nonparametric inefficiency effects
stochastic frontier models with an application to British manufacturing, Econ Model,
vol. 26, pp. 904–909.
Trivieri, F. (2007). Does cross-ownership affect competition?: Evidence from the
Italian banking industry, Journal of International Financial Markets, Institutions and
Money, vol. 17, no. 1, pp. 79-101.
Tsionas, E.G. (2002). Stochastic Frontier Models with Random Coefficients, Journal
of Applied Econometrics, vol. 17, pp. 127–147.
386
Tulkens, H. (1993). On FDH efficiency analysis: Some methodological issues and
applications to retail banking, courts and urban transit, Journal of Productivity
Analysis, vol. 4, pp. 183–210.
Turati, G. (2003). Cost Efficiency and Profitability in European Commercial Banking:
Implications for Antitrust Analysis. Universitá di Torino, downloaded on Sept, 29.
Uchida, H. and Tsutsui, Y. (2005). Has competition in the Japanese banking sector
improved?, Journal of banking and Finance, vol. 29, no. 2, pp. 419-439.
Uhde, A. and Heimeshoff, U. (2009). Consolidation in banking and financial stability
in Europe: empirical evidence, Journal of Banking and Finance, vol. 33 pp. 1299–
1311.
Van den Broeck, J., Koop, G., Osiewalski, J. and Steel, M. (1994). Stochastic Frontier
Models: a Bayesian Perspective, Journal of Econometrics, vol. 61, pp. 273–303.
Van Leuvensteijn, M., Bikker, J.A., van Rixtel, A.A. and Sørensen, C.K. (2011). A
new approach to measuring competition in the loan markets of the euro area, Applied
Economics, vol. 43, no. 23, pp. 3155-3167.
Vaškelaitis, V. and Deltuvaitė, V. (2007). Competition, concentration, efficiency, and
their relationship in the Lithuanian banking sector, Taikomoji ekonomika: sisteminiai
tyrimai, (1/1), pp. 11-30.
Vennet, R.V. (1996). The effects of mergers and acquisitions on the efficiency and
profitability of EC credit institutions, Journal of Banking and Finance, vol. 20, pp.
1158–1531.
Vennet, R.V. (2002). Cost and profit efficiency of financial conglomerates and
universal banks in Europe, Journal of Money, Credit, and Banking, vol. 34, no. 1, pp.
254-282.
Vesala, J. (1995). Testing for competition in banking: Behavioral evidence from
Finland, Bank of Finland Studies, E1.
Vives, X. (2001). Competition in the changing world of banking, Oxford Review of
Economic Policy, vol. 17, pp. 535–545.

387
Vo Thi, N. (2009). Banking Market Liberalization and Bank Performance: the Role of
Entry Modes.
Vo Thi, N. and Vencappa, D. (2008). Does the Entry Mode of Foreign Banks Matter
for Bank Efficiency? Evidence from Czech Republic, Hungary, and Poland.
Von Thadden, E.-L. (1995). Long-term contracts, short-term investment and
monitoring, Review of Economic Studies, vol. 62, no. 4, pp. 557-575.
Wagenvoort, R.J. and Schure, P.H. (2006). A Recursive Thick Frontier Approach to
Estimating Production Efficiency, Oxford Bulletin of Economics and Statistics, vol.
68, no. 2, pp. 183-201.
Walkner, C. and Raes, J.P. (2005). Integration and Consolidation in EU Banking - An
Unfinished Business, European Commission – DG Economics and Financial Affairs,
Economic Papers 226, April.
Webb, R. (2003). Levels of efficiency in UK retail banks: a DEA window analysis,
International Journal of the Economics of Business, vol. 10, no. 3, pp. 305-322.
Weill, L. (2002). Does restructuring improve banking efficiency in a transition
economy?, Applied Economics Letters, vol. 9, no. 5, pp. 279-281.
Weill, L. (2004a). Measuring cost efficiency in European banking: A comparison of
frontier techniques. Journal of Productivity Analysis, vol. 21, no. 2, pp. 133-152.
Weill, L. (2004b). On the relationship between competition and efficiency in the EU
banking sector, Kredit und Capital, vol. 37, pp. 329–352.
Weill, L. (2009). Convergence in banking efficiency across European countries,
Journal of International Financial Markets, Institutions and Money, vol. 19, no. 5, pp.
818-833.
Weill, L. (2011). Do Islamic Banks Have Greater Market Power&quest, Comparative
Economic Studies, vol. 53, no. 2, pp. 291-306.
Weinstein, M. (1964). The sum of values from a normal and a truncated normal
distribution, Technometrics, vol. 6, pp. 104-105, 469-470.

388
Wheelock, D.C. and Wilson, P.W. (2001). New evidence on returns to scale and
product mix among US commercial banks, Journal of Monetary Economics, vol. 47,
no. 3, pp. 653-674.
White, A.P. (1982). A note on market structure measures and the characteristics of the
markets that they „Measure‟, Southern Economic Journal, vol. 49, no. 2, pp. 542-549.
White, H. (1980). Using least squares to approximate unknown regression functions,
International Economic Review, vol. 21, no. 1, pp. 149-170.
Williams, J. and Gardener, E. (2003). The efficiency of European regional banking,
Regional Studies, vol. 37, no. 4, pp. 321-330.
Williamson, S.D. (1986). Costly monitoring, loan contracts and equilibrium credit
rationing, Quarterly Journal of Economics, vol. 102, pp. 135-46.
Wilson, P.W. (1995). Detecting influential observations in data envelopment analysis,
Journal of productivity analysis, vol. 6, no. 1, pp. 27-45.
Winton, A. (1995). Delegated monitoring and bank structure in a finite economy,
Journal of Financial Intermediation, vol. 4, pp. 158-187.
Xue, M. and Harker, P.T. (1999). Overcoming the inherent dependency of DEA
efficiency scores: a bootstrap approach, Unpublished Working Paper, Wharton
Financial Institutions Center, University of Pennsylvania.
Yeyati, E.L. and Micco, A. (2007). Concentration and foreign penetration in Latin
American banking sectors: Impact on competition and risk, Journal of Banking and
Finance, vol. 31, no. 6, pp. 1633-1647.
Yildirim, H.S. and Philippatos, G.C. (2007a). Competition and contestability in
Central and Eastern European banking markets, Managerial Finance, vol. 33, no. 3,
pp. 195-209.
Yildirim, H.S. and Philippatos, G.C. (2007b). Efficiency of banks: recent evidence
from the transition economies of Europe, 1993–2000, European Journal of Finance,
vol. 13, no. 2, pp. 123-143.

389
Zardkoohi, A. and Kolari, J. (1994). Branch office economies of scale and scope:
Evidence from savings banks in Finland, Journal of Banking and Finance, vol. 18, no.
3, pp. 421-432.
Zellner, A. and Tobias, J. (2001). Further results on Bayesian method of moments
analysis of the multiple regression model, International Economic Review, vol. 42,
pp. 121-140.
Zhang, T. and Garvey, E. (2008). A comparative analysis of multi-output frontier
models, Journal of Zhejiang University – Science A, vol. 9, no. 10, pp. 1426-1436.
Zhu, J. (2003). Quantitative Models for Performance Evaluation and Benchmarking:
Data Envelopment Analysis with Spreadsheets, Kluwer Academic Publishers.
Zhu, J. (2004). Imprecise DEA via standard linear DEA models with a revisit to a
Korean mobile telecommunication company, Operations Research, vol. 52, no.2, pp.
323–329.
Zhu, J. and Shen, H.Z. (1995). A discussion of testing DMUs‟ returns to scale,
European Journal of Operational Research, vol. 81, pp. 590–596.

390
Thesis Appendix
Due to space considerations, we omit the regression output since it possibly covers
more than the half of the actual thesis size.
We maintain our commitment to provide evidence upon request.
Copyright © 2022 FDOKUMEN