Banking Sector Developments in India, 1980-2005
29
Banking Sector Developments in India, 1980-2005: What the Annual Accounts Speak? * The authors are Director and Assistant Adviser, respectively, in the Department of Statistical Analysis and Computer Services. The views expressed in the paper are those of the authors’ and not of the institution to which they belong. Ramasastri A.S. and Achamma Samuel* Banking sector in India is currently passing through an exciting and challenging phase. The reform measures have brought about sweeping changes in this vital sector of the country's economy. This paper is an attempt to study the trends in important banking indicators for the 25-year period from 1980 to 2005. Analysing the data from balance sheets of banks, the paper draws some important conclusions for the banking sector as a whole as well as for different bank groups. JEL Classification : G 21 Keywords : Commercial Banks, Annual Accounts, Income and Expenditure, Assets and Liabilities Reserve Bank of India Occasional Papers Vol. 27, No. 1 and 2, Summer and Monsoon 2006 Introduction The banking system is central to a nation’s economy. Banks are special as they not only accept and deploy large amounts of uncollateralised public funds in a fiduciary capacity, but also leverage such funds through credit creation. In India, prior to nationalisation, banking was restricted mainly to the urban areas and neglected in the rural and semi-urban areas. Large industries and big business houses enjoyed major portion of the credit facilities. Agriculture, small-scale industries and exports did not receive the deserved attention. Therefore, inspired by a larger social purpose, 14 major banks were nationalised in 1969 and six more in 1980. Since then the banking system in India has played a pivotal role in the Indian economy, acting as an instrument of social and economic change. The rationale behind bank nationalisation has been succinctly put forth by eminent bankers:
-
Upload
khangminh22 -
Category
Documents
-
view
6 -
download
0
Transcript of Banking Sector Developments in India, 1980-2005
Banking Sector Developments in India,1980-2005: What the Annual Accounts Speak?
* The authors are Director and Assistant Adviser, respectively, in the Departmentof Statistical Analysis and Computer Services. The views expressed in the paperare those of the authors’ and not of the institution to which they belong.
Ramasastri A.S. and Achamma Samuel*Banking sector in India is currently passing through an exciting and challenging
phase. The reform measures have brought about sweeping changes in this vital sectorof the country's economy. This paper is an attempt to study the trends in importantbanking indicators for the 25-year period from 1980 to 2005. Analysing the data frombalance sheets of banks, the paper draws some important conclusions for the bankingsector as a whole as well as for different bank groups.
JEL Classification : G 21
Keywords : Commercial Banks, Annual Accounts, Income and Expenditure,Assets and Liabilities
Reserve Bank of India Occasional PapersVol. 27, No. 1 and 2, Summer and Monsoon 2006
Introduction
The banking system is central to a nation’s economy. Banks arespecial as they not only accept and deploy large amounts ofuncollateralised public funds in a fiduciary capacity, but also leveragesuch funds through credit creation. In India, prior to nationalisation,banking was restricted mainly to the urban areas and neglected inthe rural and semi-urban areas. Large industries and big businesshouses enjoyed major portion of the credit facilities. Agriculture,small-scale industries and exports did not receive the deservedattention. Therefore, inspired by a larger social purpose, 14 majorbanks were nationalised in 1969 and six more in 1980. Since thenthe banking system in India has played a pivotal role in the Indianeconomy, acting as an instrument of social and economic change.The rationale behind bank nationalisation has been succinctly putforth by eminent bankers:
178 RESERVE BANK OF INDIA OCCASIONAL PAPERS
“Many bank failures and crises over two centuries, and thedamage they did under laissez faire conditions; the needs of plannedgrowth and equitable distribution of credit, which in privatelyowned banks was concentrated mainly on the controlling industrialhouses and influential borrowers; the needs of growing small scaleindustry and farming regarding finance, equipment and inputs; fromall these there emerged an inexorable demand for banking legislation,some government control and a central banking authority, addingup, in the final analysis, to social control and nationalisation” (Tandon,1989).
Post nationalisation, the Indian banking system registeredtremendous growth in volume. Despite the undeniable and multifoldgains of bank nationalization, it may be noted that the importantfinancial institutions were all state owned and were subject to centraldirection and control. Banks enjoyed little autonomy as both lendingand deposit rates were controlled until the end of the 1980s. Althoughnationalisation of banks helped in the spread of banking to the ruraland hitherto uncovered areas, the monopoly granted to the publicsector and lack of competition led to overall inefficiency and lowproductivity. By 1991, the country’s financial system was saddledwith an inefficient and financially unsound banking sector. Some ofthe reasons for this were (i) high reserve requirements, (ii)administered interest rates, (iii) directed credit and (iv) lack ofcompetition (v) political interference and corruption. Asrecommended by the Narasimham Committee Report (1991) severalreform measures were introduced which included reduction of reserverequirements, de-regulation of interest rates, introduction ofprudential norms, strengthening of bank supervision and improvingthe competitiveness of the system, particularly by allowing entry ofprivate sector banks. With a view to adopting the Basel Committee(1988) framework on capital adequacy norms, the Reserve Bankintroduced a risk-weighted asset ratio system for banks in India as acapital adequacy measure in 1992. Banks were asked to maintainrisk-weighted capital adequacy ratio initially at the lower level of 4per cent, which was gradually increased to 9 per cent. Banks werealso directed to identify problem loans on their balance sheets andmake provisions for bad loans and bring down the burgeoning problem
BANKING SECTOR DEVELOPMENTS IN INDIA, 1980-2005 179
of non-performing assets. The period 1992-97 laid the foundationsfor reform in the banking system (Rangarajan, 1998). The secondNarasimham Committee Report (1998) focussed on issues likestrengthening of the banking system, upgrading of technology andhuman resource development. The report laid emphasis on two aspectsof banking regulation, viz., capital adequacy and asset classificationand resolution of NPA-related problems.
Commercial banks in India are expected to start implementingBasel II norms with effect from March 31, 2007. They are expectedto adopt the standardised approach for credit risk and the basicindicator approach for operational risk initially. After adequate skillsare developed, both at the banks and at the supervisory levels, somebanks may be allowed to migrate to the internal rating based (IRB)approach (Reddy 2005).
At present, banks in India are venturing into non-traditional areasand generating income through diversified activities other than thecore banking activities. Strategic mergers and acquisitions are beingexplored and implemented. With this, the banking sector is currentlyon the threshold of an exciting phase.
Against this backdrop, this paper endeavours to study theimportant banking indicators for the last 25-year period from 1981to 2005. These indicators have been broadly grouped into differentcategories, viz., (i) number of banks and offices (ii) deposits and credit(iii) investments (iv) capital to risk-weighted assets ratio (CRAR)(v) non performing assets (NPAs) (vi) Income composition (vii)Expenditure composition (viii) return on assets (ROAs) and (ix) someselect ratios. Accordingly, the paper discusses these bankingindicators in nine sections in the same order as listed above. Thepaper concludes in section X by drawing important inferences fromthe trends of these different banking parameters.
Section I
Number of Banks and Offices
The number of offices of all scheduled commercial banks almostdoubled from 29,677 in 1980 to 55,537 in 2005. This rapid increase
180 RESERVE BANK OF INDIA OCCASIONAL PAPERS
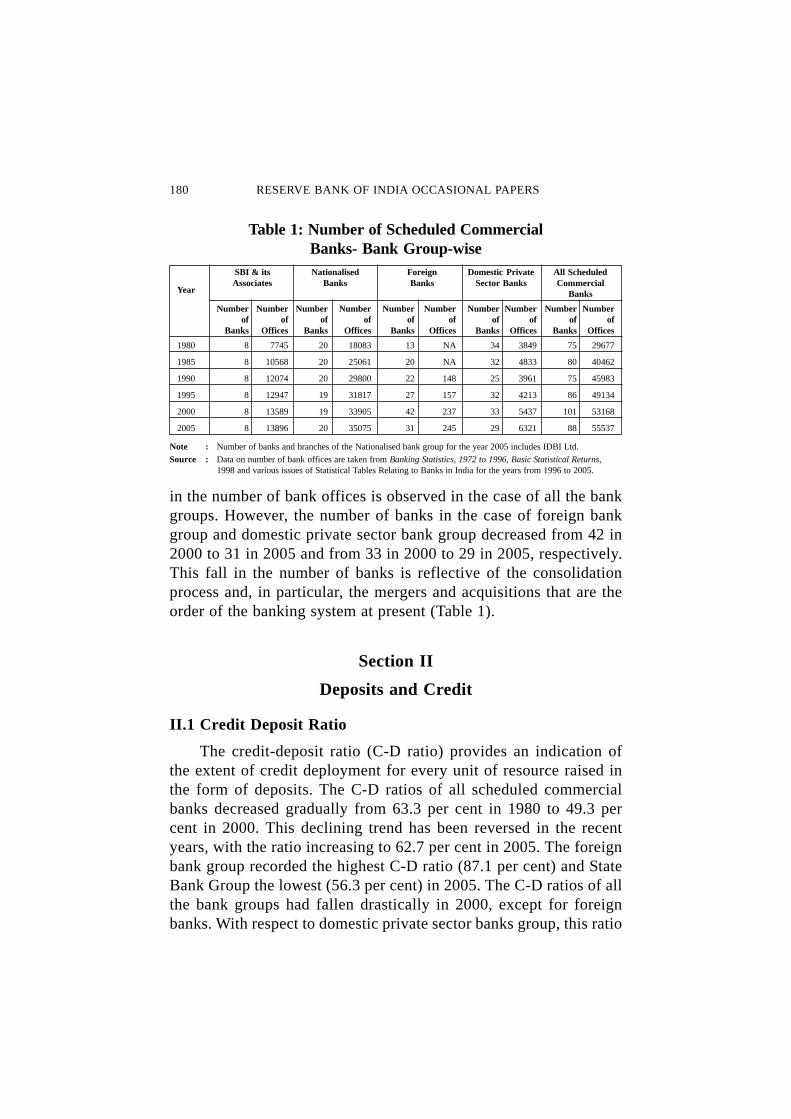
in the number of bank offices is observed in the case of all the bankgroups. However, the number of banks in the case of foreign bankgroup and domestic private sector bank group decreased from 42 in2000 to 31 in 2005 and from 33 in 2000 to 29 in 2005, respectively.This fall in the number of banks is reflective of the consolidationprocess and, in particular, the mergers and acquisitions that are theorder of the banking system at present (Table 1).
Section II
Deposits and Credit
II.1 Credit Deposit Ratio
The credit-deposit ratio (C-D ratio) provides an indication ofthe extent of credit deployment for every unit of resource raised inthe form of deposits. The C-D ratios of all scheduled commercialbanks decreased gradually from 63.3 per cent in 1980 to 49.3 percent in 2000. This declining trend has been reversed in the recentyears, with the ratio increasing to 62.7 per cent in 2005. The foreignbank group recorded the highest C-D ratio (87.1 per cent) and StateBank Group the lowest (56.3 per cent) in 2005. The C-D ratios of allthe bank groups had fallen drastically in 2000, except for foreignbanks. With respect to domestic private sector banks group, this ratio
Table 1: Number of Scheduled CommercialBanks- Bank Group-wise
SBI & its Nationalised Foreign Domestic Private All ScheduledAssociates Banks Banks Sector Banks Commercial
BanksYear
Number Number Number Number Number Number Number Number Number Numberof of of of of of of of of of
Banks Offices Banks Offices Banks Offices Banks Offices Banks Offices
1980 8 7745 20 18083 13 NA 34 3849 75 29677
1985 8 10568 20 25061 20 NA 32 4833 80 40462
1990 8 12074 20 29800 22 148 25 3961 75 45983
1995 8 12947 19 31817 27 157 32 4213 86 49134
2000 8 13589 19 33905 42 237 33 5437 101 53168
2005 8 13896 20 35075 31 245 29 6321 88 55537
Note : Number of banks and branches of the Nationalised bank group for the year 2005 includes IDBI Ltd.
Source : Data on number of bank offices are taken from Banking Statistics, 1972 to 1996, Basic Statistical Returns,1998 and various issues of Statistical Tables Relating to Banks in India for the years from 1996 to 2005.
BANKING SECTOR DEVELOPMENTS IN INDIA, 1980-2005 181
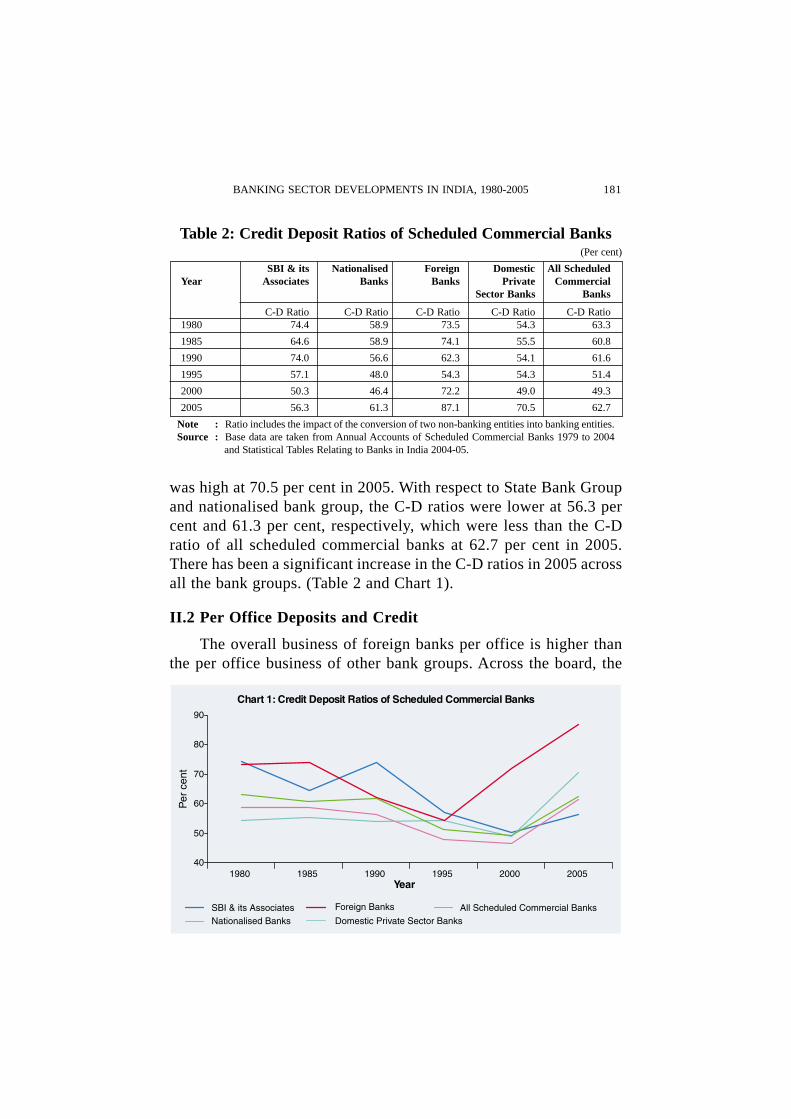
Table 2: Credit Deposit Ratios of Scheduled Commercial Banks(Per cent)
SBI & its Nationalised Foreign Domestic All ScheduledYear Associates Banks Banks Private Commercial
Sector Banks Banks
C-D Ratio C-D Ratio C-D Ratio C-D Ratio C-D Ratio1980 74.4 58.9 73.5 54.3 63.3
1985 64.6 58.9 74.1 55.5 60.8
1990 74.0 56.6 62.3 54.1 61.6
1995 57.1 48.0 54.3 54.3 51.4
2000 50.3 46.4 72.2 49.0 49.3
2005 56.3 61.3 87.1 70.5 62.7
Note : Ratio includes the impact of the conversion of two non-banking entities into banking entities.Source : Base data are taken from Annual Accounts of Scheduled Commercial Banks 1979 to 2004
and Statistical Tables Relating to Banks in India 2004-05.
was high at 70.5 per cent in 2005. With respect to State Bank Groupand nationalised bank group, the C-D ratios were lower at 56.3 percent and 61.3 per cent, respectively, which were less than the C-Dratio of all scheduled commercial banks at 62.7 per cent in 2005.There has been a significant increase in the C-D ratios in 2005 acrossall the bank groups. (Table 2 and Chart 1).
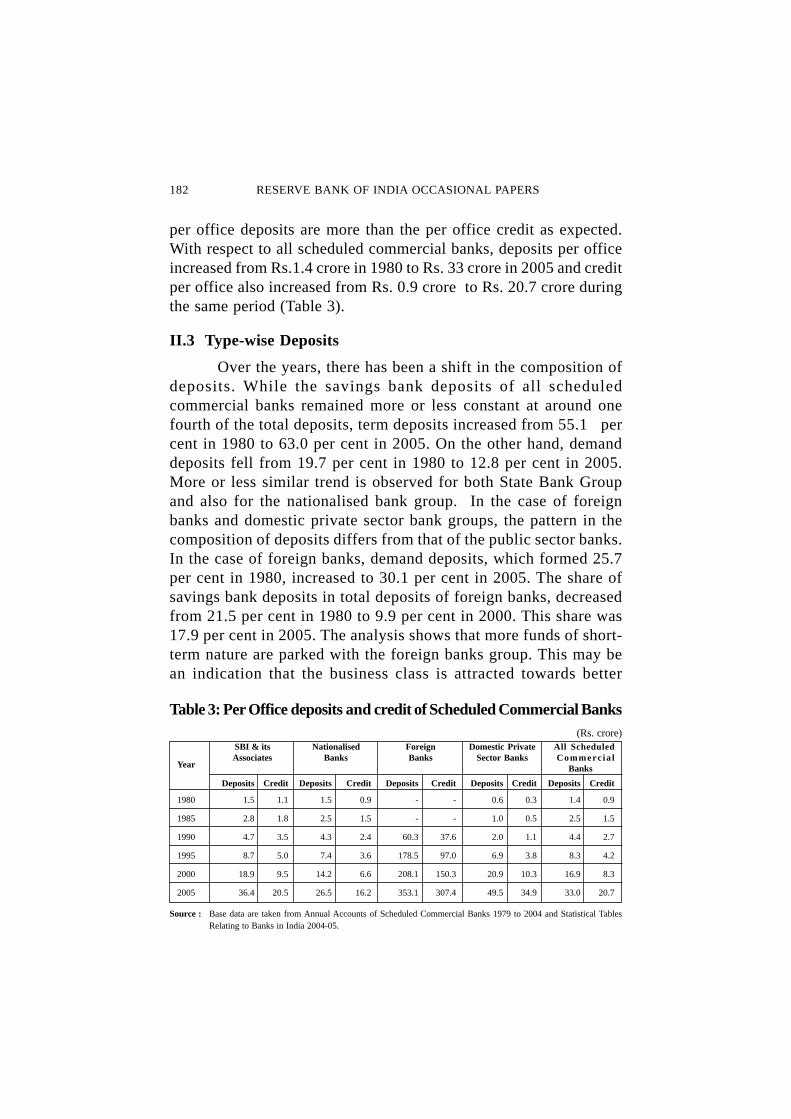
II.2 Per Office Deposits and Credit
The overall business of foreign banks per office is higher thanthe per office business of other bank groups. Across the board, the
182 RESERVE BANK OF INDIA OCCASIONAL PAPERS
per office deposits are more than the per office credit as expected.With respect to all scheduled commercial banks, deposits per officeincreased from Rs.1.4 crore in 1980 to Rs. 33 crore in 2005 and creditper office also increased from Rs. 0.9 crore to Rs. 20.7 crore duringthe same period (Table 3).
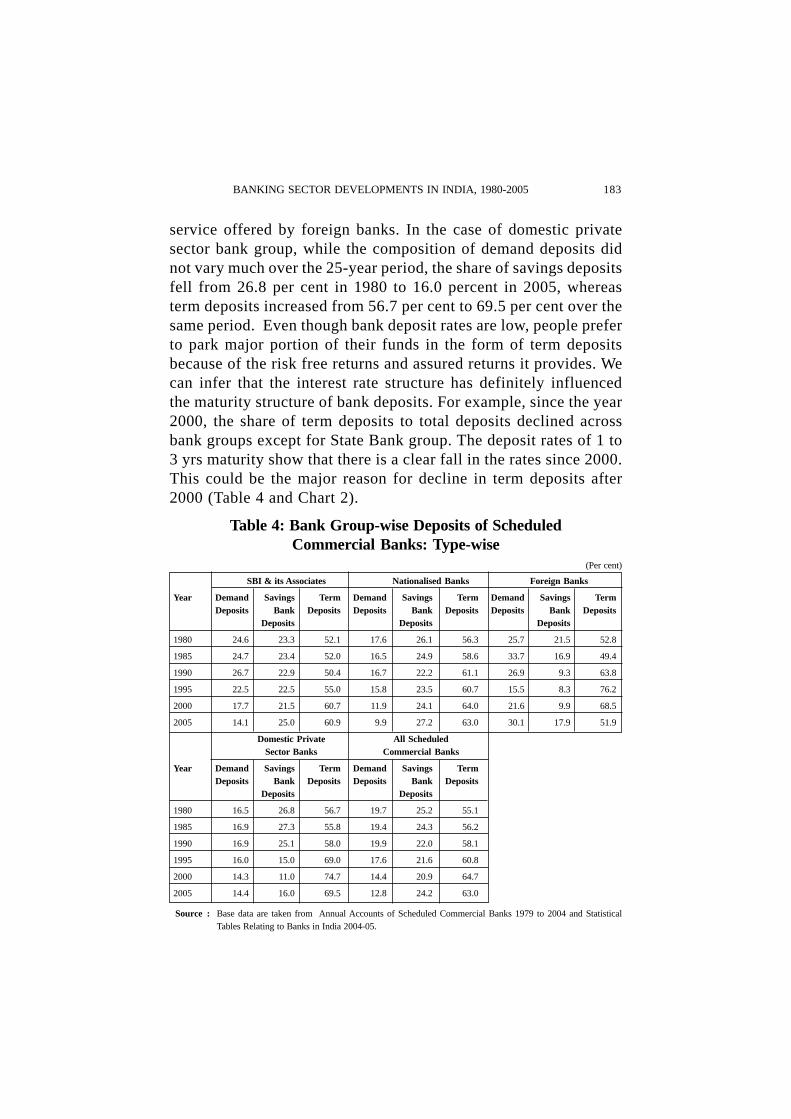
II.3 Type-wise Deposits
Over the years, there has been a shift in the composition ofdeposits. While the savings bank deposits of all scheduledcommercial banks remained more or less constant at around onefourth of the total deposits, term deposits increased from 55.1 percent in 1980 to 63.0 per cent in 2005. On the other hand, demanddeposits fell from 19.7 per cent in 1980 to 12.8 per cent in 2005.More or less similar trend is observed for both State Bank Groupand also for the nationalised bank group. In the case of foreignbanks and domestic private sector bank groups, the pattern in thecomposition of deposits differs from that of the public sector banks.In the case of foreign banks, demand deposits, which formed 25.7per cent in 1980, increased to 30.1 per cent in 2005. The share ofsavings bank deposits in total deposits of foreign banks, decreasedfrom 21.5 per cent in 1980 to 9.9 per cent in 2000. This share was17.9 per cent in 2005. The analysis shows that more funds of short-term nature are parked with the foreign banks group. This may bean indication that the business class is attracted towards better
Table 3: Per Office deposits and credit of Scheduled Commercial Banks(Rs. crore)
SBI & its Nationalised Foreign Domestic Private All ScheduledAssociates Banks Banks Sector Banks Commerc ia l
BanksYear
Deposits Credit Deposits Credit Deposits Credit Deposits Credit Deposits Credit
1980 1.5 1.1 1.5 0.9 - - 0.6 0.3 1.4 0.9
1985 2.8 1.8 2.5 1.5 - - 1.0 0.5 2.5 1.5
1990 4.7 3.5 4.3 2.4 60.3 37.6 2.0 1.1 4.4 2.7
1995 8.7 5.0 7.4 3.6 178.5 97.0 6.9 3.8 8.3 4.2
2000 18.9 9.5 14.2 6.6 208.1 150.3 20.9 10.3 16.9 8.3
2005 36.4 20.5 26.5 16.2 353.1 307.4 49.5 34.9 33.0 20.7
Source : Base data are taken from Annual Accounts of Scheduled Commercial Banks 1979 to 2004 and Statistical TablesRelating to Banks in India 2004-05.
BANKING SECTOR DEVELOPMENTS IN INDIA, 1980-2005 183
service offered by foreign banks. In the case of domestic privatesector bank group, while the composition of demand deposits didnot vary much over the 25-year period, the share of savings depositsfell from 26.8 per cent in 1980 to 16.0 percent in 2005, whereasterm deposits increased from 56.7 per cent to 69.5 per cent over thesame period. Even though bank deposit rates are low, people preferto park major portion of their funds in the form of term depositsbecause of the risk free returns and assured returns it provides. Wecan infer that the interest rate structure has definitely influencedthe maturity structure of bank deposits. For example, since the year2000, the share of term deposits to total deposits declined acrossbank groups except for State Bank group. The deposit rates of 1 to3 yrs maturity show that there is a clear fall in the rates since 2000.This could be the major reason for decline in term deposits after2000 (Table 4 and Chart 2).
Table 4: Bank Group-wise Deposits of ScheduledCommercial Banks: Type-wise
(Per cent)
SBI & its Associates Nationalised Banks Foreign Banks
Year Demand Savings Term Demand Savings Term Demand Savings TermDeposits Bank Deposits Deposits Bank Deposits Deposits Bank Deposits
Deposits Deposits Deposits
1980 24.6 23.3 52.1 17.6 26.1 56.3 25.7 21.5 52.8
1985 24.7 23.4 52.0 16.5 24.9 58.6 33.7 16.9 49.4
1990 26.7 22.9 50.4 16.7 22.2 61.1 26.9 9.3 63.8
1995 22.5 22.5 55.0 15.8 23.5 60.7 15.5 8.3 76.2
2000 17.7 21.5 60.7 11.9 24.1 64.0 21.6 9.9 68.5
2005 14.1 25.0 60.9 9.9 27.2 63.0 30.1 17.9 51.9
Domestic Private All ScheduledSector Banks Commercial Banks
Year Demand Savings Term Demand Savings TermDeposits Bank Deposits Deposits Bank Deposits
Deposits Deposits
1980 16.5 26.8 56.7 19.7 25.2 55.1
1985 16.9 27.3 55.8 19.4 24.3 56.2
1990 16.9 25.1 58.0 19.9 22.0 58.1
1995 16.0 15.0 69.0 17.6 21.6 60.8
2000 14.3 11.0 74.7 14.4 20.9 64.7
2005 14.4 16.0 69.5 12.8 24.2 63.0
Source : Base data are taken from Annual Accounts of Scheduled Commercial Banks 1979 to 2004 and StatisticalTables Relating to Banks in India 2004-05.

184 RESERVE BANK OF INDIA OCCASIONAL PAPERS
II.4 Bank Group-wise Share in Deposits
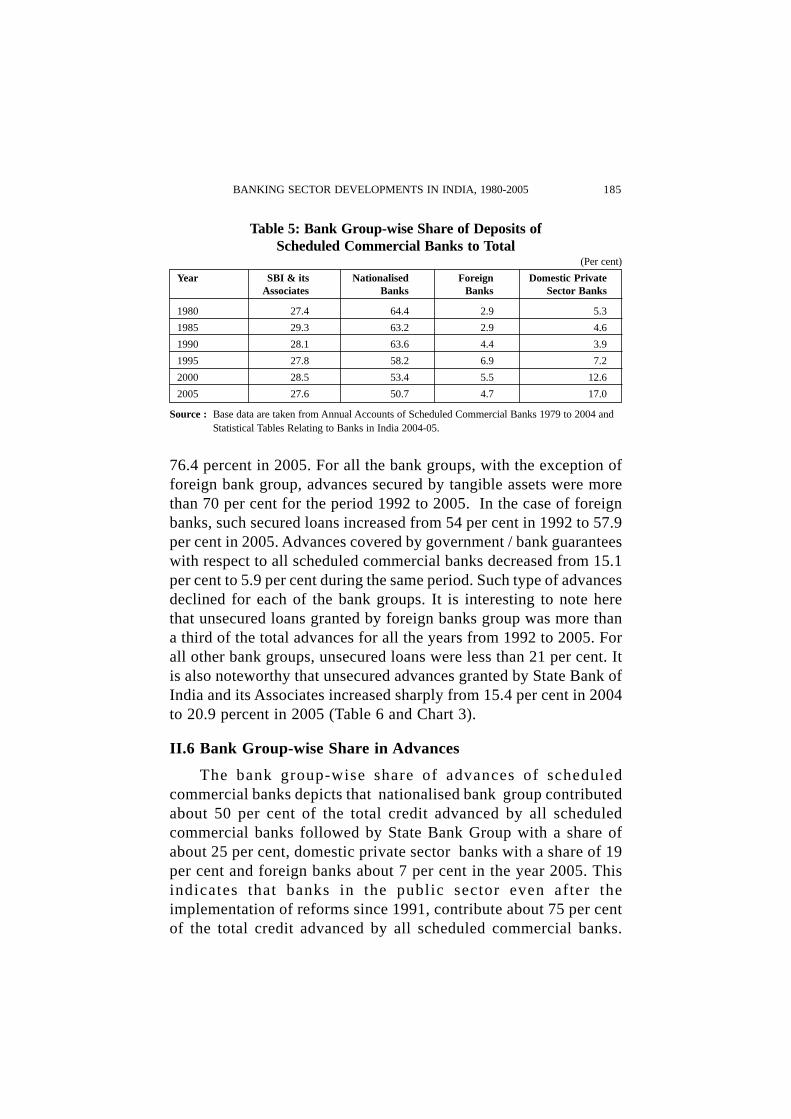
The bank group-wise share in deposits of scheduled commercialbanks depicts that nationalised bank group contributed more than 50per cent in the total deposits mobilised by all scheduled commercialbanks in the year 2005. This share dropped from 64.4 per cent in1980 to 50.7 per cent in 2005. The share of deposits of State Bankgroup remained more or less constant during the 25-year periodconstituting a little more than one fourth of the total deposits by allscheduled commercial banks. State Bank group is successful inholding on to its percentage share of deposits in total deposits of allscheduled commercial banks. However, nationalised bank group isseen to be slipping in this area. The share of foreign bank group intotal deposits is showing increasing trend. The share of foreign banksincreased from 2.9 per cent to 4.7 per cent and in the case of domesticprivate sector banks, it increased from 5.3 per cent in 1980 to 17.0per cent in 2005. This shows that banks in the private sector havetaken a head start in the deposit mobilisation after the liberalisationmeasures adopted with regard to entry of new private sector banks in1995 (Table 5).
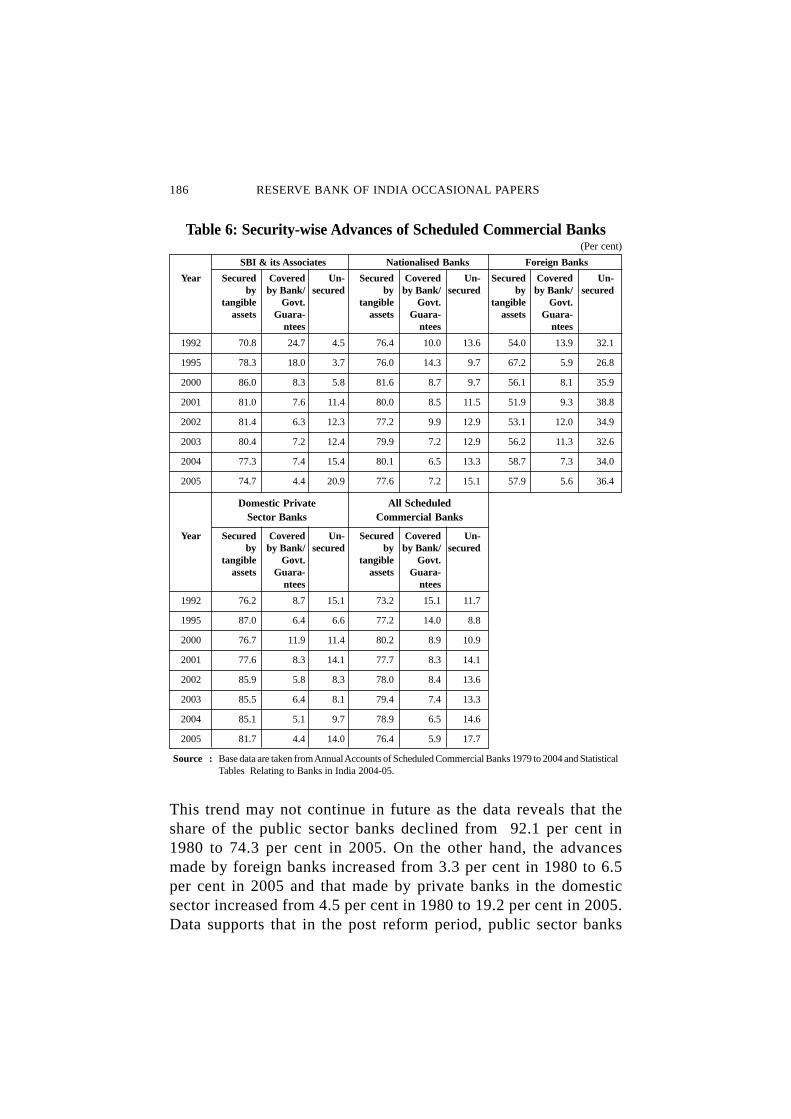
II.5 Security-wise Advances
The advances secured by tangible assets in the case of allscheduled commercial banks increased from 73.2 per cent in 1992 to
BANKING SECTOR DEVELOPMENTS IN INDIA, 1980-2005 185
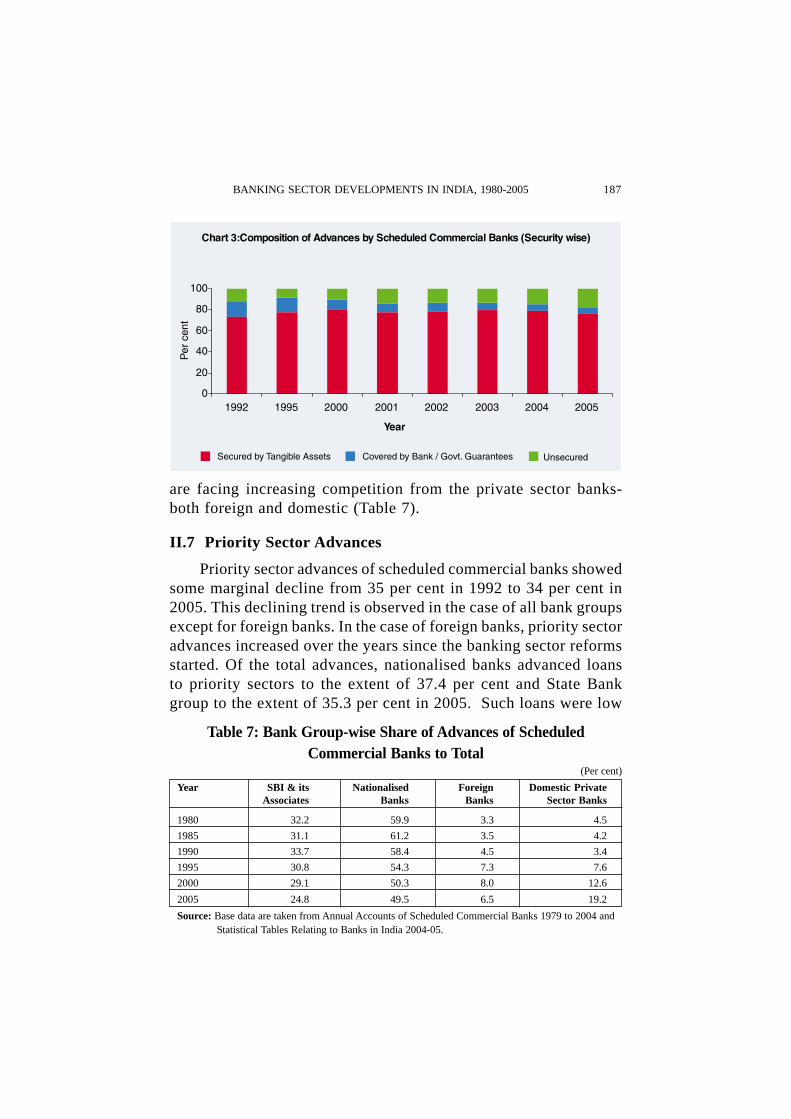
76.4 percent in 2005. For all the bank groups, with the exception offoreign bank group, advances secured by tangible assets were morethan 70 per cent for the period 1992 to 2005. In the case of foreignbanks, such secured loans increased from 54 per cent in 1992 to 57.9per cent in 2005. Advances covered by government / bank guaranteeswith respect to all scheduled commercial banks decreased from 15.1per cent to 5.9 per cent during the same period. Such type of advancesdeclined for each of the bank groups. It is interesting to note herethat unsecured loans granted by foreign banks group was more thana third of the total advances for all the years from 1992 to 2005. Forall other bank groups, unsecured loans were less than 21 per cent. Itis also noteworthy that unsecured advances granted by State Bank ofIndia and its Associates increased sharply from 15.4 per cent in 2004to 20.9 percent in 2005 (Table 6 and Chart 3).
II.6 Bank Group-wise Share in Advances
The bank group-wise share of advances of scheduledcommercial banks depicts that nationalised bank group contributedabout 50 per cent of the total credit advanced by all scheduledcommercial banks followed by State Bank Group with a share ofabout 25 per cent, domestic private sector banks with a share of 19per cent and foreign banks about 7 per cent in the year 2005. Thisindicates that banks in the public sector even after theimplementation of reforms since 1991, contribute about 75 per centof the total credit advanced by all scheduled commercial banks.
Table 5: Bank Group-wise Share of Deposits ofScheduled Commercial Banks to Total
(Per cent)
Year SBI & its Nationalised Foreign Domestic PrivateAssociates Banks Banks Sector Banks
1980 27.4 64.4 2.9 5.3
1985 29.3 63.2 2.9 4.6
1990 28.1 63.6 4.4 3.9
1995 27.8 58.2 6.9 7.2
2000 28.5 53.4 5.5 12.6
2005 27.6 50.7 4.7 17.0
Source : Base data are taken from Annual Accounts of Scheduled Commercial Banks 1979 to 2004 andStatistical Tables Relating to Banks in India 2004-05.
186 RESERVE BANK OF INDIA OCCASIONAL PAPERS
This trend may not continue in future as the data reveals that theshare of the public sector banks declined from 92.1 per cent in1980 to 74.3 per cent in 2005. On the other hand, the advancesmade by foreign banks increased from 3.3 per cent in 1980 to 6.5per cent in 2005 and that made by private banks in the domesticsector increased from 4.5 per cent in 1980 to 19.2 per cent in 2005.Data supports that in the post reform period, public sector banks
Table 6: Security-wise Advances of Scheduled Commercial Banks(Per cent)
SBI & its Associates Nationalised Banks Foreign Banks
Year Secured Covered Un- Secured Covered Un- Secured Covered Un-by by Bank/ secured by by Bank/ secured by by Bank/ secured
tangible Govt. tangible Govt. tangible Govt.assets Guara- assets Guara- assets Guara-
ntees ntees ntees
1992 70.8 24.7 4.5 76.4 10.0 13.6 54.0 13.9 32.1
1995 78.3 18.0 3.7 76.0 14.3 9.7 67.2 5.9 26.8
2000 86.0 8.3 5.8 81.6 8.7 9.7 56.1 8.1 35.9
2001 81.0 7.6 11.4 80.0 8.5 11.5 51.9 9.3 38.8
2002 81.4 6.3 12.3 77.2 9.9 12.9 53.1 12.0 34.9
2003 80.4 7.2 12.4 79.9 7.2 12.9 56.2 11.3 32.6
2004 77.3 7.4 15.4 80.1 6.5 13.3 58.7 7.3 34.0
2005 74.7 4.4 20.9 77.6 7.2 15.1 57.9 5.6 36.4
Domestic Private All ScheduledSector Banks Commercial Banks
Year Secured Covered Un- Secured Covered Un-by by Bank/ secured by by Bank/ secured
tangible Govt. tangible Govt.assets Guara- assets Guara-
ntees ntees
1992 76.2 8.7 15.1 73.2 15.1 11.7
1995 87.0 6.4 6.6 77.2 14.0 8.8
2000 76.7 11.9 11.4 80.2 8.9 10.9
2001 77.6 8.3 14.1 77.7 8.3 14.1
2002 85.9 5.8 8.3 78.0 8.4 13.6
2003 85.5 6.4 8.1 79.4 7.4 13.3
2004 85.1 5.1 9.7 78.9 6.5 14.6
2005 81.7 4.4 14.0 76.4 5.9 17.7
Source : Base data are taken from Annual Accounts of Scheduled Commercial Banks 1979 to 2004 and StatisticalTables Relating to Banks in India 2004-05.
BANKING SECTOR DEVELOPMENTS IN INDIA, 1980-2005 187
Table 7: Bank Group-wise Share of Advances of ScheduledCommercial Banks to Total
(Per cent)
Year SBI & its Nationalised Foreign Domestic PrivateAssociates Banks Banks Sector Banks
1980 32.2 59.9 3.3 4.5
1985 31.1 61.2 3.5 4.2
1990 33.7 58.4 4.5 3.4
1995 30.8 54.3 7.3 7.6
2000 29.1 50.3 8.0 12.6
2005 24.8 49.5 6.5 19.2
Source: Base data are taken from Annual Accounts of Scheduled Commercial Banks 1979 to 2004 andStatistical Tables Relating to Banks in India 2004-05.
are facing increasing competition from the private sector banks-both foreign and domestic (Table 7).
II.7 Priority Sector Advances
Priority sector advances of scheduled commercial banks showedsome marginal decline from 35 per cent in 1992 to 34 per cent in2005. This declining trend is observed in the case of all bank groupsexcept for foreign banks. In the case of foreign banks, priority sectoradvances increased over the years since the banking sector reformsstarted. Of the total advances, nationalised banks advanced loansto priority sectors to the extent of 37.4 per cent and State Bankgroup to the extent of 35.3 per cent in 2005. Such loans were low
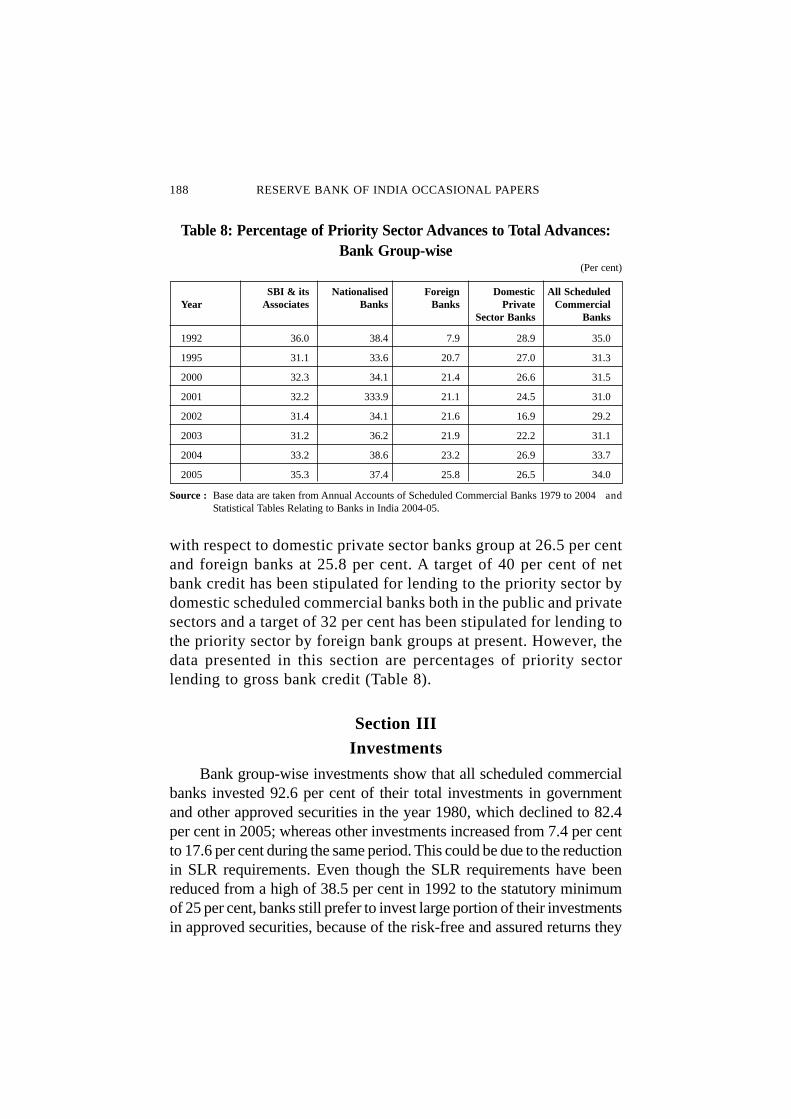
188 RESERVE BANK OF INDIA OCCASIONAL PAPERS
with respect to domestic private sector banks group at 26.5 per centand foreign banks at 25.8 per cent. A target of 40 per cent of netbank credit has been stipulated for lending to the priority sector bydomestic scheduled commercial banks both in the public and privatesectors and a target of 32 per cent has been stipulated for lending tothe priority sector by foreign bank groups at present. However, thedata presented in this section are percentages of priority sectorlending to gross bank credit (Table 8).
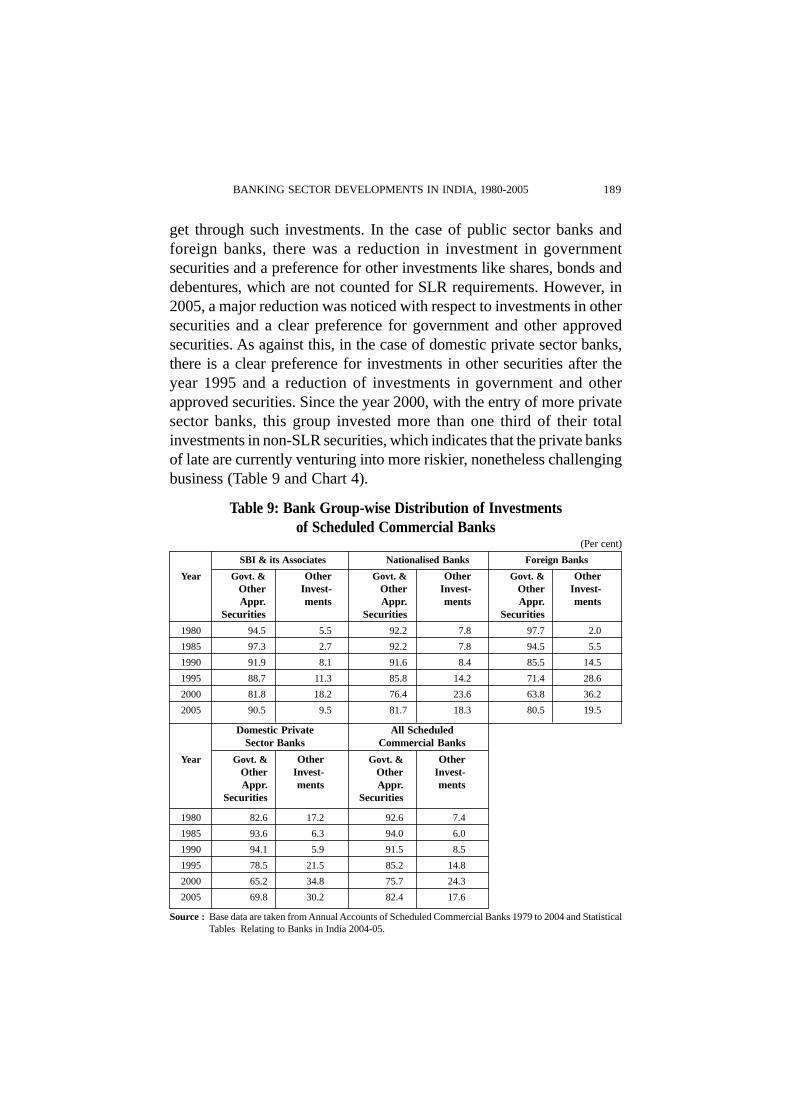
Section IIIInvestments
Bank group-wise investments show that all scheduled commercialbanks invested 92.6 per cent of their total investments in governmentand other approved securities in the year 1980, which declined to 82.4per cent in 2005; whereas other investments increased from 7.4 per centto 17.6 per cent during the same period. This could be due to the reductionin SLR requirements. Even though the SLR requirements have beenreduced from a high of 38.5 per cent in 1992 to the statutory minimumof 25 per cent, banks still prefer to invest large portion of their investmentsin approved securities, because of the risk-free and assured returns they
Table 8: Percentage of Priority Sector Advances to Total Advances:Bank Group-wise
(Per cent)
SBI & its Nationalised Foreign Domestic All ScheduledYear Associates Banks Banks Private Commercial
Sector Banks Banks
1992 36.0 38.4 7.9 28.9 35.0
1995 31.1 33.6 20.7 27.0 31.3
2000 32.3 34.1 21.4 26.6 31.5
2001 32.2 333.9 21.1 24.5 31.0
2002 31.4 34.1 21.6 16.9 29.2
2003 31.2 36.2 21.9 22.2 31.1
2004 33.2 38.6 23.2 26.9 33.7
2005 35.3 37.4 25.8 26.5 34.0
Source : Base data are taken from Annual Accounts of Scheduled Commercial Banks 1979 to 2004 andStatistical Tables Relating to Banks in India 2004-05.
BANKING SECTOR DEVELOPMENTS IN INDIA, 1980-2005 189
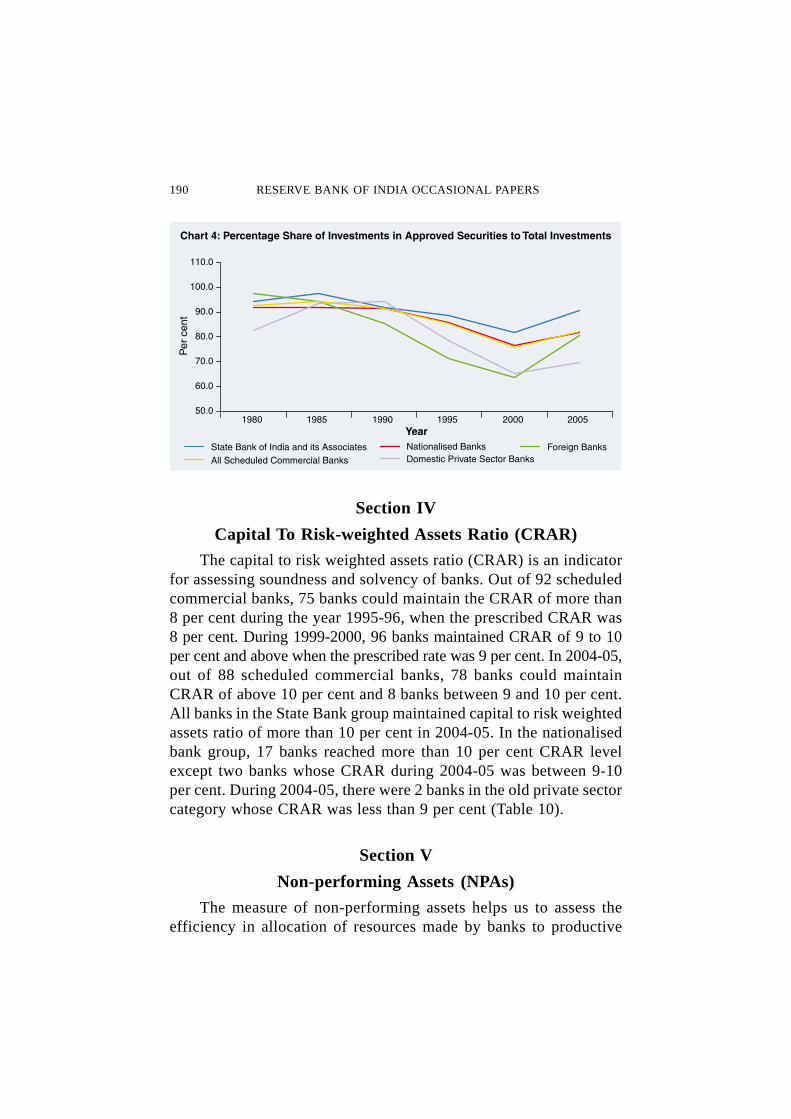
get through such investments. In the case of public sector banks andforeign banks, there was a reduction in investment in governmentsecurities and a preference for other investments like shares, bonds anddebentures, which are not counted for SLR requirements. However, in2005, a major reduction was noticed with respect to investments in othersecurities and a clear preference for government and other approvedsecurities. As against this, in the case of domestic private sector banks,there is a clear preference for investments in other securities after theyear 1995 and a reduction of investments in government and otherapproved securities. Since the year 2000, with the entry of more privatesector banks, this group invested more than one third of their totalinvestments in non-SLR securities, which indicates that the private banksof late are currently venturing into more riskier, nonetheless challengingbusiness (Table 9 and Chart 4).
Table 9: Bank Group-wise Distribution of Investmentsof Scheduled Commercial Banks
(Per cent)
SBI & its Associates Nationalised Banks Foreign Banks
Year Govt. & Other Govt. & Other Govt. & OtherOther Invest- Other Invest- Other Invest-Appr. ments Appr. ments Appr. ments
Securities Securities Securities
1980 94.5 5.5 92.2 7.8 97.7 2.0
1985 97.3 2.7 92.2 7.8 94.5 5.5
1990 91.9 8.1 91.6 8.4 85.5 14.5
1995 88.7 11.3 85.8 14.2 71.4 28.6
2000 81.8 18.2 76.4 23.6 63.8 36.2
2005 90.5 9.5 81.7 18.3 80.5 19.5
Domestic Private All ScheduledSector Banks Commercial Banks
Year Govt. & Other Govt. & OtherOther Invest- Other Invest-Appr. ments Appr. ments
Securities Securities
1980 82.6 17.2 92.6 7.4
1985 93.6 6.3 94.0 6.0
1990 94.1 5.9 91.5 8.5
1995 78.5 21.5 85.2 14.8
2000 65.2 34.8 75.7 24.3
2005 69.8 30.2 82.4 17.6
Source : Base data are taken from Annual Accounts of Scheduled Commercial Banks 1979 to 2004 and StatisticalTables Relating to Banks in India 2004-05.
190 RESERVE BANK OF INDIA OCCASIONAL PAPERS
Section IV
Capital To Risk-weighted Assets Ratio (CRAR)
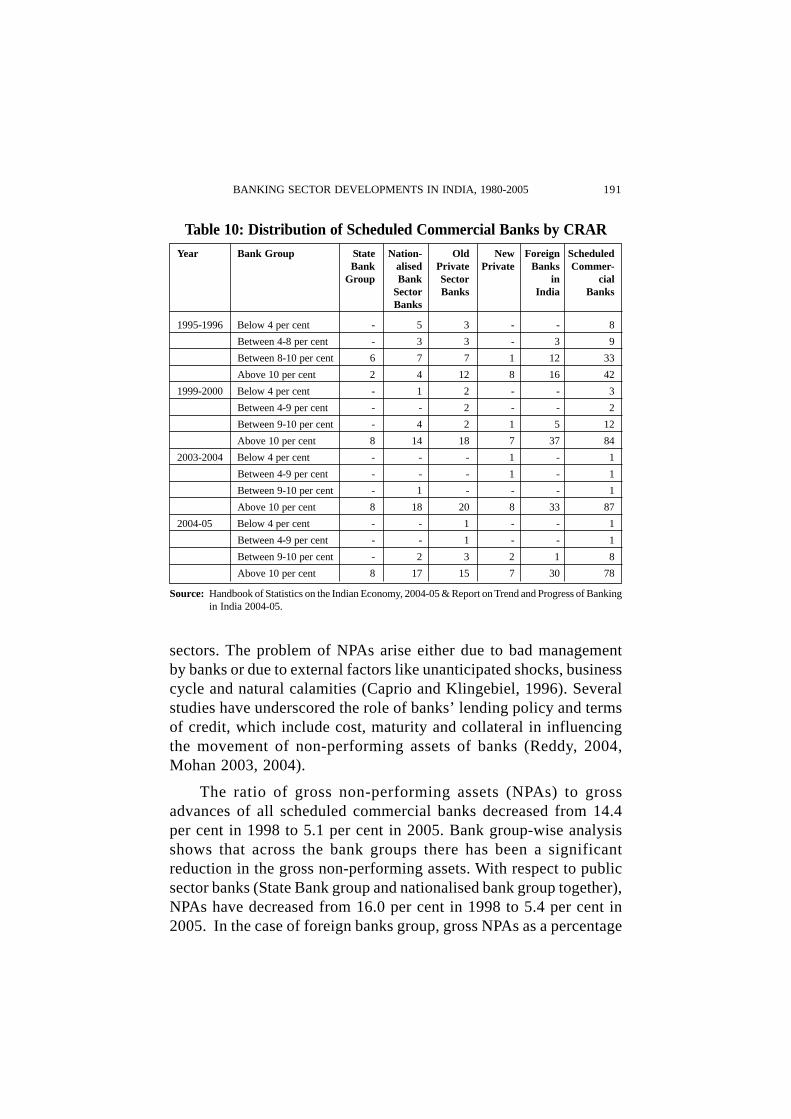
The capital to risk weighted assets ratio (CRAR) is an indicatorfor assessing soundness and solvency of banks. Out of 92 scheduledcommercial banks, 75 banks could maintain the CRAR of more than8 per cent during the year 1995-96, when the prescribed CRAR was8 per cent. During 1999-2000, 96 banks maintained CRAR of 9 to 10per cent and above when the prescribed rate was 9 per cent. In 2004-05,out of 88 scheduled commercial banks, 78 banks could maintainCRAR of above 10 per cent and 8 banks between 9 and 10 per cent.All banks in the State Bank group maintained capital to risk weightedassets ratio of more than 10 per cent in 2004-05. In the nationalisedbank group, 17 banks reached more than 10 per cent CRAR levelexcept two banks whose CRAR during 2004-05 was between 9-10per cent. During 2004-05, there were 2 banks in the old private sectorcategory whose CRAR was less than 9 per cent (Table 10).
Section V
Non-performing Assets (NPAs)
The measure of non-performing assets helps us to assess theefficiency in allocation of resources made by banks to productive
BANKING SECTOR DEVELOPMENTS IN INDIA, 1980-2005 191
sectors. The problem of NPAs arise either due to bad managementby banks or due to external factors like unanticipated shocks, businesscycle and natural calamities (Caprio and Klingebiel, 1996). Severalstudies have underscored the role of banks’ lending policy and termsof credit, which include cost, maturity and collateral in influencingthe movement of non-performing assets of banks (Reddy, 2004,Mohan 2003, 2004).
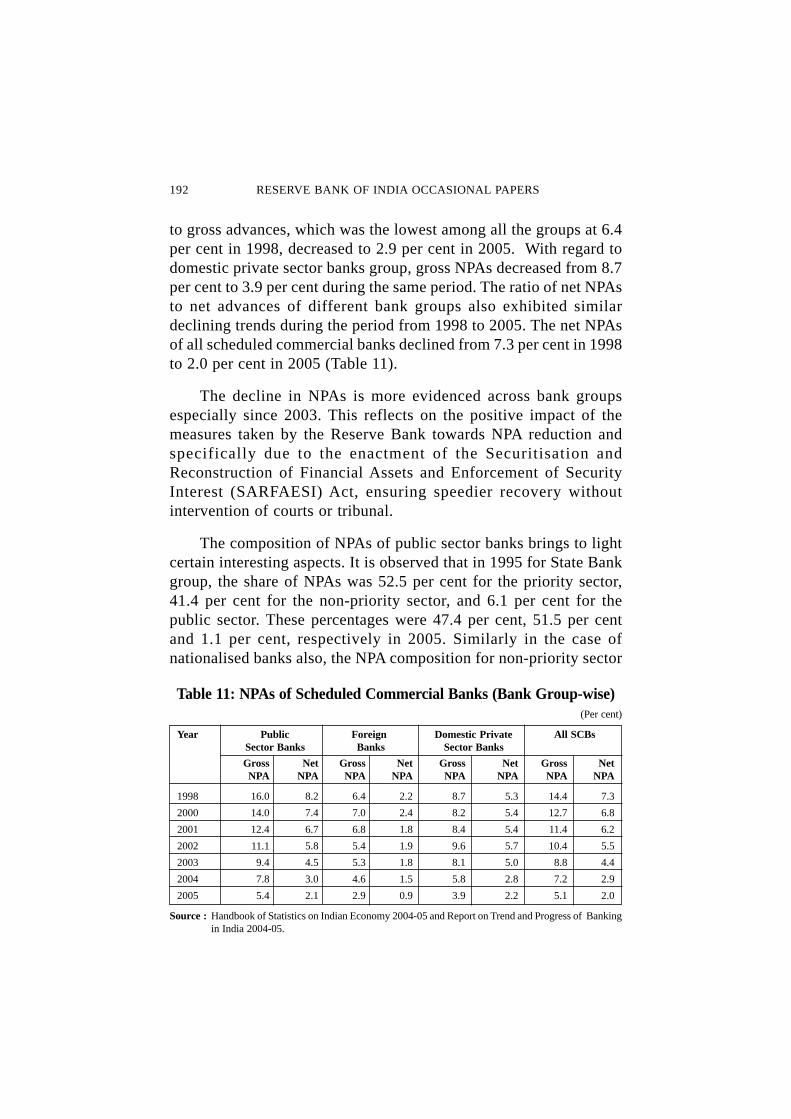
The ratio of gross non-performing assets (NPAs) to grossadvances of all scheduled commercial banks decreased from 14.4per cent in 1998 to 5.1 per cent in 2005. Bank group-wise analysisshows that across the bank groups there has been a significantreduction in the gross non-performing assets. With respect to publicsector banks (State Bank group and nationalised bank group together),NPAs have decreased from 16.0 per cent in 1998 to 5.4 per cent in2005. In the case of foreign banks group, gross NPAs as a percentage
Table 10: Distribution of Scheduled Commercial Banks by CRARYear Bank Group State Nation- Old New Foreign Scheduled
Bank alised Private Private Banks Commer-Group Bank Sector in cial
Sector Banks India BanksBanks
1995-1996 Below 4 per cent - 5 3 - - 8
Between 4-8 per cent - 3 3 - 3 9
Between 8-10 per cent 6 7 7 1 12 33
Above 10 per cent 2 4 12 8 16 42
1999-2000 Below 4 per cent - 1 2 - - 3
Between 4-9 per cent - - 2 - - 2
Between 9-10 per cent - 4 2 1 5 12
Above 10 per cent 8 14 18 7 37 84
2003-2004 Below 4 per cent - - - 1 - 1
Between 4-9 per cent - - - 1 - 1
Between 9-10 per cent - 1 - - - 1
Above 10 per cent 8 18 20 8 33 87
2004-05 Below 4 per cent - - 1 - - 1
Between 4-9 per cent - - 1 - - 1
Between 9-10 per cent - 2 3 2 1 8
Above 10 per cent 8 17 15 7 30 78
Source: Handbook of Statistics on the Indian Economy, 2004-05 & Report on Trend and Progress of Bankingin India 2004-05.
192 RESERVE BANK OF INDIA OCCASIONAL PAPERS
to gross advances, which was the lowest among all the groups at 6.4per cent in 1998, decreased to 2.9 per cent in 2005. With regard todomestic private sector banks group, gross NPAs decreased from 8.7per cent to 3.9 per cent during the same period. The ratio of net NPAsto net advances of different bank groups also exhibited similardeclining trends during the period from 1998 to 2005. The net NPAsof all scheduled commercial banks declined from 7.3 per cent in 1998to 2.0 per cent in 2005 (Table 11).
The decline in NPAs is more evidenced across bank groupsespecially since 2003. This reflects on the positive impact of themeasures taken by the Reserve Bank towards NPA reduction andspecifically due to the enactment of the Securitisation andReconstruction of Financial Assets and Enforcement of SecurityInterest (SARFAESI) Act, ensuring speedier recovery withoutintervention of courts or tribunal.
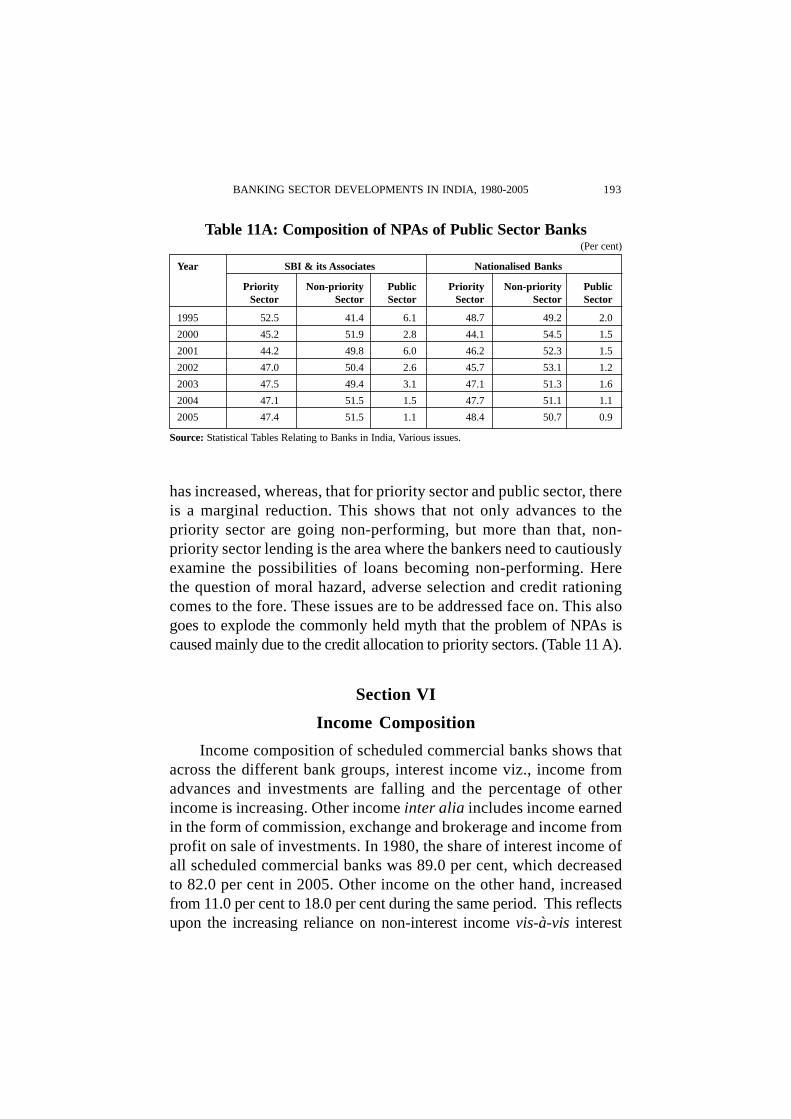
The composition of NPAs of public sector banks brings to lightcertain interesting aspects. It is observed that in 1995 for State Bankgroup, the share of NPAs was 52.5 per cent for the priority sector,41.4 per cent for the non-priority sector, and 6.1 per cent for thepublic sector. These percentages were 47.4 per cent, 51.5 per centand 1.1 per cent, respectively in 2005. Similarly in the case ofnationalised banks also, the NPA composition for non-priority sector
Table 11: NPAs of Scheduled Commercial Banks (Bank Group-wise)(Per cent)
Year Public Foreign Domestic Private All SCBsSector Banks Banks Sector Banks
Gross Net Gross Net Gross Net Gross NetNPA NPA NPA NPA NPA NPA NPA NPA
1998 16.0 8.2 6.4 2.2 8.7 5.3 14.4 7.3
2000 14.0 7.4 7.0 2.4 8.2 5.4 12.7 6.8
2001 12.4 6.7 6.8 1.8 8.4 5.4 11.4 6.2
2002 11.1 5.8 5.4 1.9 9.6 5.7 10.4 5.5
2003 9.4 4.5 5.3 1.8 8.1 5.0 8.8 4.4
2004 7.8 3.0 4.6 1.5 5.8 2.8 7.2 2.9
2005 5.4 2.1 2.9 0.9 3.9 2.2 5.1 2.0
Source : Handbook of Statistics on Indian Economy 2004-05 and Report on Trend and Progress of Bankingin India 2004-05.
BANKING SECTOR DEVELOPMENTS IN INDIA, 1980-2005 193
has increased, whereas, that for priority sector and public sector, thereis a marginal reduction. This shows that not only advances to thepriority sector are going non-performing, but more than that, non-priority sector lending is the area where the bankers need to cautiouslyexamine the possibilities of loans becoming non-performing. Herethe question of moral hazard, adverse selection and credit rationingcomes to the fore. These issues are to be addressed face on. This alsogoes to explode the commonly held myth that the problem of NPAs iscaused mainly due to the credit allocation to priority sectors. (Table 11 A).
Section VI
Income Composition
Income composition of scheduled commercial banks shows thatacross the different bank groups, interest income viz., income fromadvances and investments are falling and the percentage of otherincome is increasing. Other income inter alia includes income earnedin the form of commission, exchange and brokerage and income fromprofit on sale of investments. In 1980, the share of interest income ofall scheduled commercial banks was 89.0 per cent, which decreasedto 82.0 per cent in 2005. Other income on the other hand, increasedfrom 11.0 per cent to 18.0 per cent during the same period. This reflectsupon the increasing reliance on non-interest income vis-à-vis interest
Table 11A: Composition of NPAs of Public Sector Banks(Per cent)
Year SBI & its Associates Nationalised Banks
Priority Non-priority Public Priority Non-priority PublicSector Sector Sector Sector Sector Sector
1995 52.5 41.4 6.1 48.7 49.2 2.0
2000 45.2 51.9 2.8 44.1 54.5 1.5
2001 44.2 49.8 6.0 46.2 52.3 1.5
2002 47.0 50.4 2.6 45.7 53.1 1.2
2003 47.5 49.4 3.1 47.1 51.3 1.6
2004 47.1 51.5 1.5 47.7 51.1 1.1
2005 47.4 51.5 1.1 48.4 50.7 0.9
Source: Statistical Tables Relating to Banks in India, Various issues.
194 RESERVE BANK OF INDIA OCCASIONAL PAPERS
income of commercial banks. This is a welcome trend as it may reducethe risks arising out of the sole dependency on interest as the source ofincome (Ramasastri, Samuel & Gangadaran, 2004)
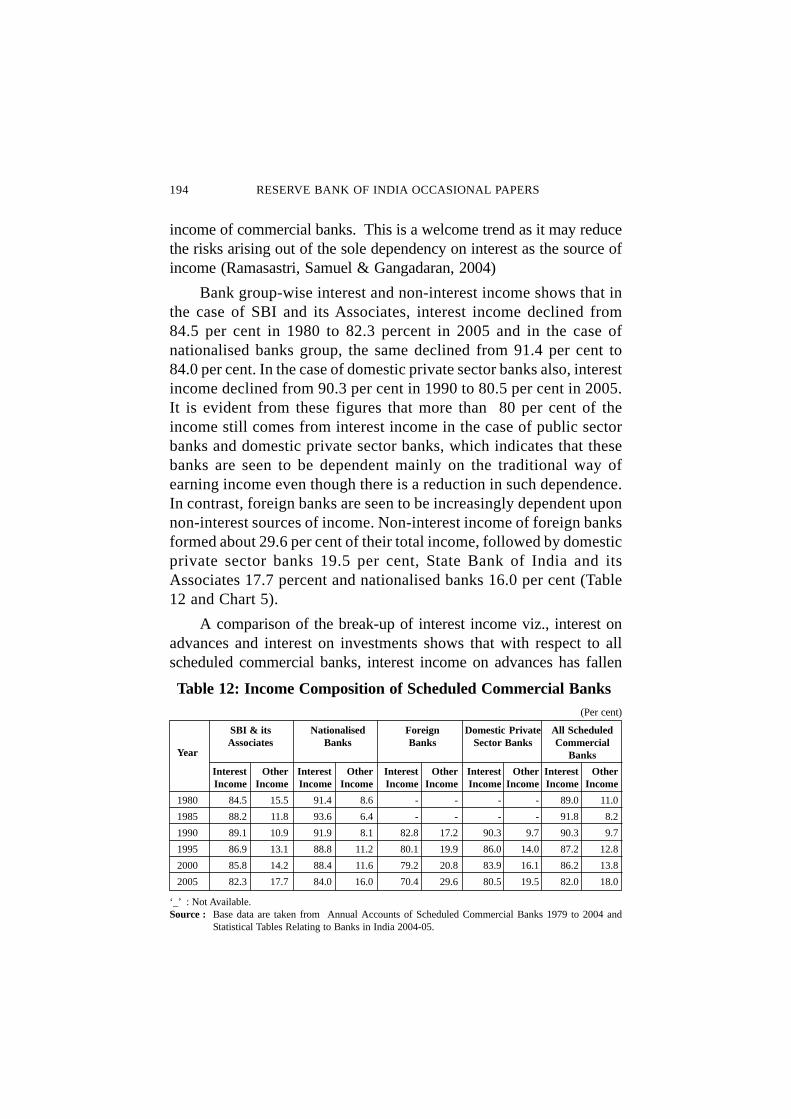
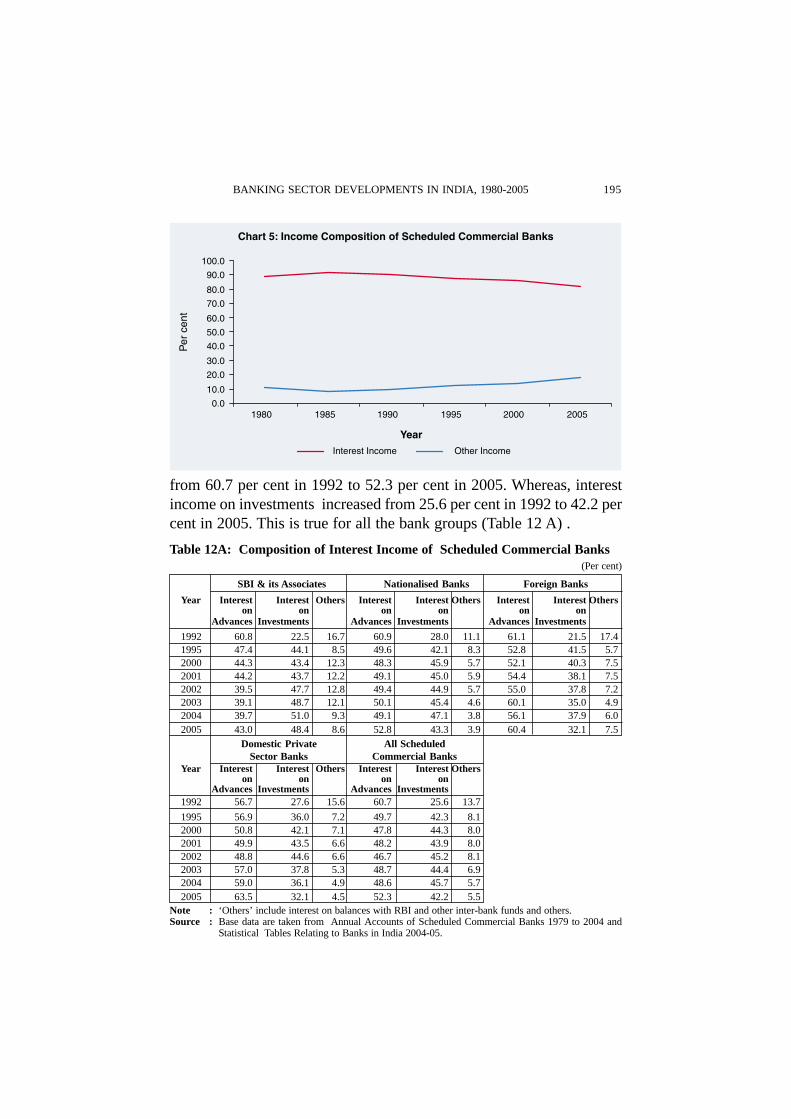
Bank group-wise interest and non-interest income shows that inthe case of SBI and its Associates, interest income declined from84.5 per cent in 1980 to 82.3 percent in 2005 and in the case ofnationalised banks group, the same declined from 91.4 per cent to84.0 per cent. In the case of domestic private sector banks also, interestincome declined from 90.3 per cent in 1990 to 80.5 per cent in 2005.It is evident from these figures that more than 80 per cent of theincome still comes from interest income in the case of public sectorbanks and domestic private sector banks, which indicates that thesebanks are seen to be dependent mainly on the traditional way ofearning income even though there is a reduction in such dependence.In contrast, foreign banks are seen to be increasingly dependent uponnon-interest sources of income. Non-interest income of foreign banksformed about 29.6 per cent of their total income, followed by domesticprivate sector banks 19.5 per cent, State Bank of India and itsAssociates 17.7 percent and nationalised banks 16.0 per cent (Table12 and Chart 5).
A comparison of the break-up of interest income viz., interest onadvances and interest on investments shows that with respect to allscheduled commercial banks, interest income on advances has fallen
Table 12: Income Composition of Scheduled Commercial Banks(Per cent)
SBI & its Nationalised Foreign Domestic Private All ScheduledAssociates Banks Banks Sector Banks Commercial
BanksYear
Interest Other Interest Other Interest Other Interest Other Interest OtherIncome Income Income Income Income Income Income Income Income Income
1980 84.5 15.5 91.4 8.6 - - - - 89.0 11.0
1985 88.2 11.8 93.6 6.4 - - - - 91.8 8.2
1990 89.1 10.9 91.9 8.1 82.8 17.2 90.3 9.7 90.3 9.7
1995 86.9 13.1 88.8 11.2 80.1 19.9 86.0 14.0 87.2 12.8
2000 85.8 14.2 88.4 11.6 79.2 20.8 83.9 16.1 86.2 13.8
2005 82.3 17.7 84.0 16.0 70.4 29.6 80.5 19.5 82.0 18.0
‘_’ : Not Available.Source : Base data are taken from Annual Accounts of Scheduled Commercial Banks 1979 to 2004 and
Statistical Tables Relating to Banks in India 2004-05.
BANKING SECTOR DEVELOPMENTS IN INDIA, 1980-2005 195
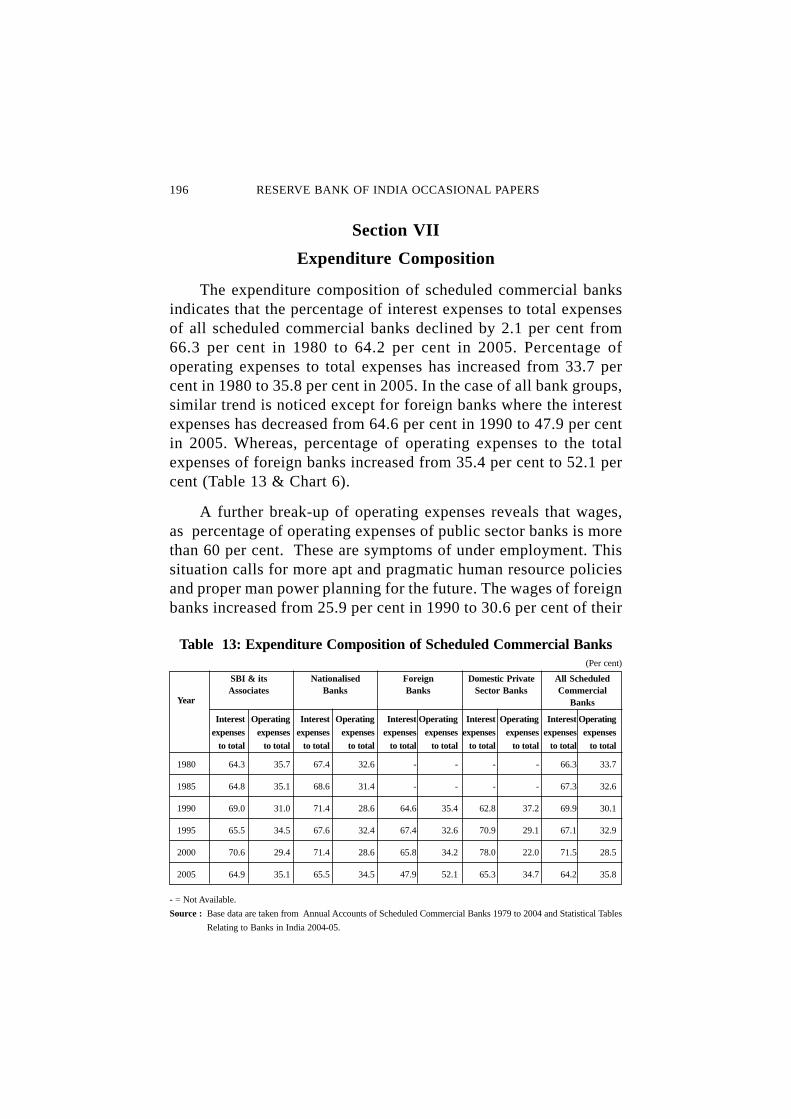
from 60.7 per cent in 1992 to 52.3 per cent in 2005. Whereas, interestincome on investments increased from 25.6 per cent in 1992 to 42.2 percent in 2005. This is true for all the bank groups (Table 12 A) .
Table 12A: Composition of Interest Income of Scheduled Commercial Banks(Per cent)
SBI & its Associates Nationalised Banks Foreign Banks
Year Interest Interest Others Interest Interest Others Interest Interest Otherson on on on on on
Advances Investments Advances Investments Advances Investments
1992 60.8 22.5 16.7 60.9 28.0 11.1 61.1 21.5 17.41995 47.4 44.1 8.5 49.6 42.1 8.3 52.8 41.5 5.72000 44.3 43.4 12.3 48.3 45.9 5.7 52.1 40.3 7.52001 44.2 43.7 12.2 49.1 45.0 5.9 54.4 38.1 7.52002 39.5 47.7 12.8 49.4 44.9 5.7 55.0 37.8 7.22003 39.1 48.7 12.1 50.1 45.4 4.6 60.1 35.0 4.92004 39.7 51.0 9.3 49.1 47.1 3.8 56.1 37.9 6.02005 43.0 48.4 8.6 52.8 43.3 3.9 60.4 32.1 7.5
Domestic Private All ScheduledSector Banks Commercial Banks
Year Interest Interest Others Interest Interest Otherson on on on
Advances Investments Advances Investments1992 56.7 27.6 15.6 60.7 25.6 13.7
1995 56.9 36.0 7.2 49.7 42.3 8.12000 50.8 42.1 7.1 47.8 44.3 8.02001 49.9 43.5 6.6 48.2 43.9 8.02002 48.8 44.6 6.6 46.7 45.2 8.12003 57.0 37.8 5.3 48.7 44.4 6.92004 59.0 36.1 4.9 48.6 45.7 5.72005 63.5 32.1 4.5 52.3 42.2 5.5
Note : ‘Others’ include interest on balances with RBI and other inter-bank funds and others.Source : Base data are taken from Annual Accounts of Scheduled Commercial Banks 1979 to 2004 and
Statistical Tables Relating to Banks in India 2004-05.
196 RESERVE BANK OF INDIA OCCASIONAL PAPERS
Section VII
Expenditure Composition
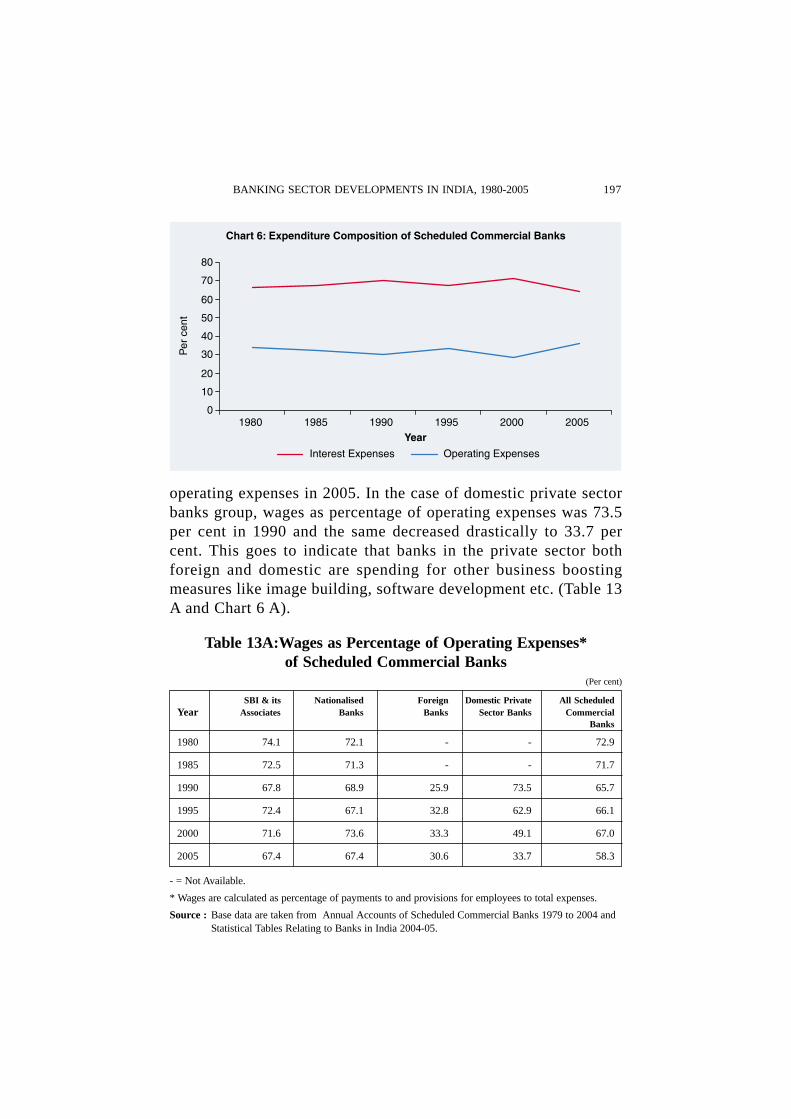
The expenditure composition of scheduled commercial banksindicates that the percentage of interest expenses to total expensesof all scheduled commercial banks declined by 2.1 per cent from66.3 per cent in 1980 to 64.2 per cent in 2005. Percentage ofoperating expenses to total expenses has increased from 33.7 percent in 1980 to 35.8 per cent in 2005. In the case of all bank groups,similar trend is noticed except for foreign banks where the interestexpenses has decreased from 64.6 per cent in 1990 to 47.9 per centin 2005. Whereas, percentage of operating expenses to the totalexpenses of foreign banks increased from 35.4 per cent to 52.1 percent (Table 13 & Chart 6).
A further break-up of operating expenses reveals that wages,as percentage of operating expenses of public sector banks is morethan 60 per cent. These are symptoms of under employment. Thissituation calls for more apt and pragmatic human resource policiesand proper man power planning for the future. The wages of foreignbanks increased from 25.9 per cent in 1990 to 30.6 per cent of their
Table 13: Expenditure Composition of Scheduled Commercial Banks(Per cent)
SBI & its Nationalised Foreign Domestic Private All ScheduledAssociates Banks Banks Sector Banks Commercial
BanksYear
Interest Operating Interest Operating Interest Operating Interest Operating Interest Operatingexpenses expenses expenses expenses expenses expenses expenses expenses expenses expenses
to total to total to total to total to total to total to total to total to total to total
1980 64.3 35.7 67.4 32.6 - - - - 66.3 33.7
1985 64.8 35.1 68.6 31.4 - - - - 67.3 32.6
1990 69.0 31.0 71.4 28.6 64.6 35.4 62.8 37.2 69.9 30.1
1995 65.5 34.5 67.6 32.4 67.4 32.6 70.9 29.1 67.1 32.9
2000 70.6 29.4 71.4 28.6 65.8 34.2 78.0 22.0 71.5 28.5
2005 64.9 35.1 65.5 34.5 47.9 52.1 65.3 34.7 64.2 35.8
- = Not Available.
Source : Base data are taken from Annual Accounts of Scheduled Commercial Banks 1979 to 2004 and Statistical Tables
Relating to Banks in India 2004-05.
BANKING SECTOR DEVELOPMENTS IN INDIA, 1980-2005 197
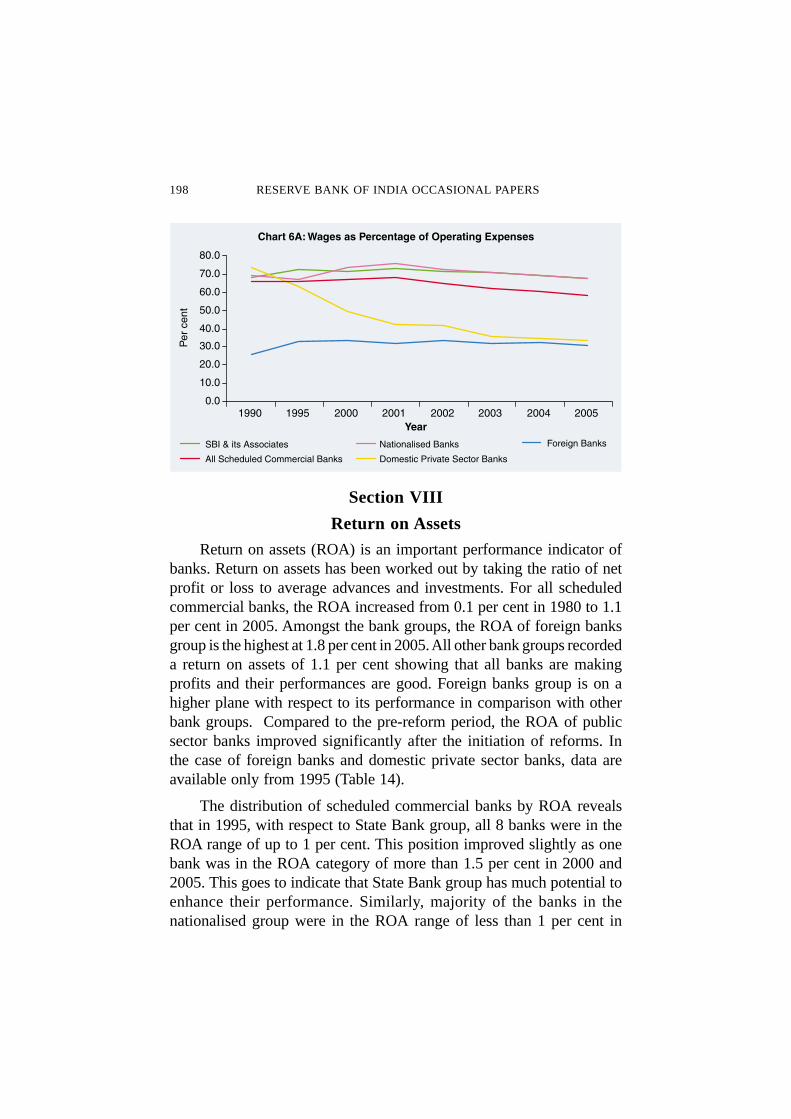
operating expenses in 2005. In the case of domestic private sectorbanks group, wages as percentage of operating expenses was 73.5per cent in 1990 and the same decreased drastically to 33.7 percent. This goes to indicate that banks in the private sector bothforeign and domestic are spending for other business boostingmeasures like image building, software development etc. (Table 13A and Chart 6 A).
Table 13A:Wages as Percentage of Operating Expenses*of Scheduled Commercial Banks
(Per cent)
SBI & its Nationalised Foreign Domestic Private All ScheduledYear Associates Banks Banks Sector Banks Commercial
Banks
1980 74.1 72.1 - - 72.9
1985 72.5 71.3 - - 71.7
1990 67.8 68.9 25.9 73.5 65.7
1995 72.4 67.1 32.8 62.9 66.1
2000 71.6 73.6 33.3 49.1 67.0
2005 67.4 67.4 30.6 33.7 58.3
- = Not Available.
* Wages are calculated as percentage of payments to and provisions for employees to total expenses.
Source : Base data are taken from Annual Accounts of Scheduled Commercial Banks 1979 to 2004 andStatistical Tables Relating to Banks in India 2004-05.
198 RESERVE BANK OF INDIA OCCASIONAL PAPERS
Section VIII
Return on Assets
Return on assets (ROA) is an important performance indicator ofbanks. Return on assets has been worked out by taking the ratio of netprofit or loss to average advances and investments. For all scheduledcommercial banks, the ROA increased from 0.1 per cent in 1980 to 1.1per cent in 2005. Amongst the bank groups, the ROA of foreign banksgroup is the highest at 1.8 per cent in 2005. All other bank groups recordeda return on assets of 1.1 per cent showing that all banks are makingprofits and their performances are good. Foreign banks group is on ahigher plane with respect to its performance in comparison with otherbank groups. Compared to the pre-reform period, the ROA of publicsector banks improved significantly after the initiation of reforms. Inthe case of foreign banks and domestic private sector banks, data areavailable only from 1995 (Table 14).
The distribution of scheduled commercial banks by ROA revealsthat in 1995, with respect to State Bank group, all 8 banks were in theROA range of up to 1 per cent. This position improved slightly as onebank was in the ROA category of more than 1.5 per cent in 2000 and2005. This goes to indicate that State Bank group has much potential toenhance their performance. Similarly, majority of the banks in thenationalised group were in the ROA range of less than 1 per cent in
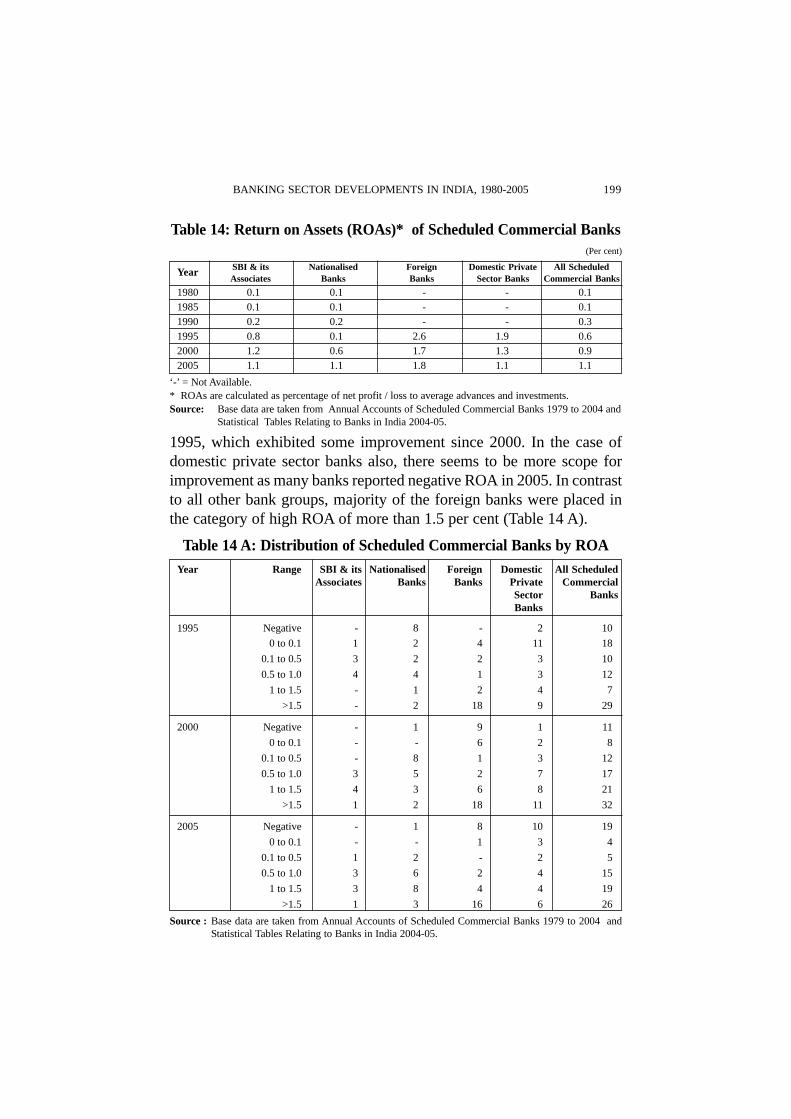
BANKING SECTOR DEVELOPMENTS IN INDIA, 1980-2005 199
Table 14: Return on Assets (ROAs)* of Scheduled Commercial Banks(Per cent)
Year SBI & its Nationalised Foreign Domestic Private All ScheduledAssociates Banks Banks Sector Banks Commercial Banks
1980 0.1 0.1 - - 0.11985 0.1 0.1 - - 0.11990 0.2 0.2 - - 0.31995 0.8 0.1 2.6 1.9 0.62000 1.2 0.6 1.7 1.3 0.92005 1.1 1.1 1.8 1.1 1.1
‘-’ = Not Available.* ROAs are calculated as percentage of net profit / loss to average advances and investments.Source: Base data are taken from Annual Accounts of Scheduled Commercial Banks 1979 to 2004 and
Statistical Tables Relating to Banks in India 2004-05.
1995, which exhibited some improvement since 2000. In the case ofdomestic private sector banks also, there seems to be more scope forimprovement as many banks reported negative ROA in 2005. In contrastto all other bank groups, majority of the foreign banks were placed inthe category of high ROA of more than 1.5 per cent (Table 14 A).
Table 14 A: Distribution of Scheduled Commercial Banks by ROAYear Range SBI & its Nationalised Foreign Domestic All Scheduled
Associates Banks Banks Private CommercialSector BanksBanks
1995 Negative - 8 - 2 10
0 to 0.1 1 2 4 11 18
0.1 to 0.5 3 2 2 3 10
0.5 to 1.0 4 4 1 3 12
1 to 1.5 - 1 2 4 7
>1.5 - 2 18 9 29
2000 Negative - 1 9 1 11
0 to 0.1 - - 6 2 8
0.1 to 0.5 - 8 1 3 12
0.5 to 1.0 3 5 2 7 17
1 to 1.5 4 3 6 8 21
>1.5 1 2 18 11 32
2005 Negative - 1 8 10 19
0 to 0.1 - - 1 3 4
0.1 to 0.5 1 2 - 2 5
0.5 to 1.0 3 6 2 4 15
1 to 1.5 3 8 4 4 19
>1.5 1 3 16 6 26
Source : Base data are taken from Annual Accounts of Scheduled Commercial Banks 1979 to 2004 andStatistical Tables Relating to Banks in India 2004-05.
200 RESERVE BANK OF INDIA OCCASIONAL PAPERS
Section IX
Some Select Ratios
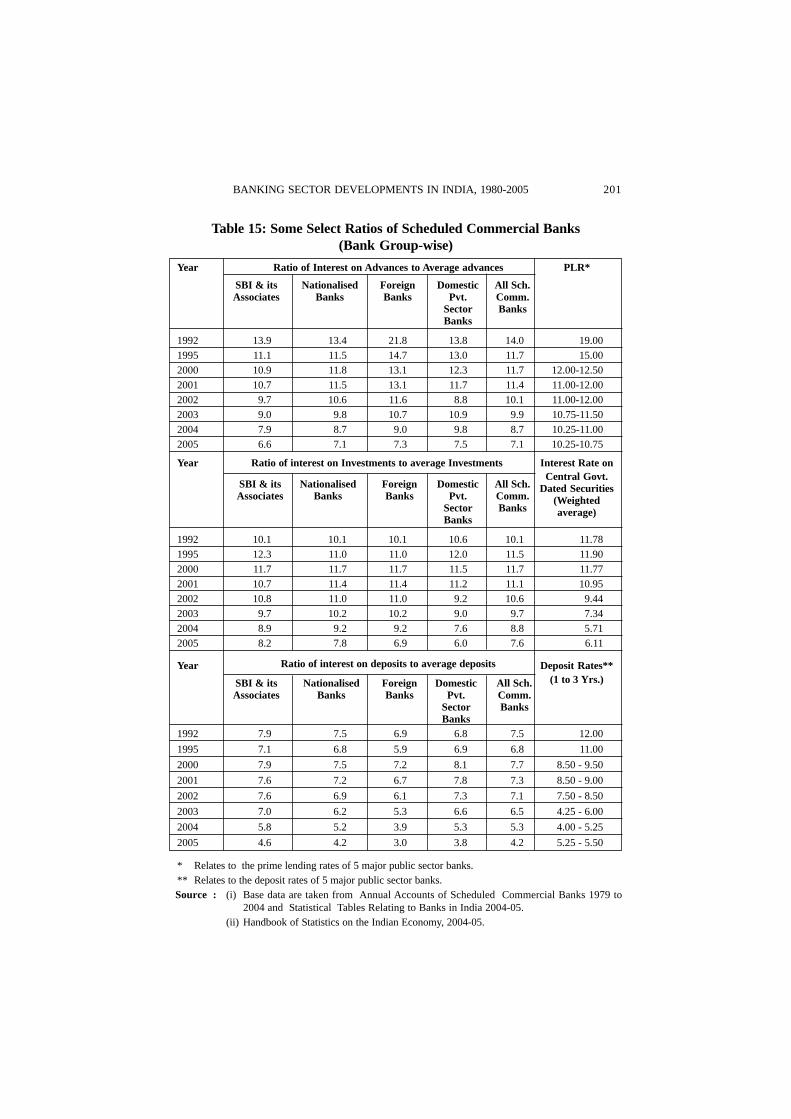
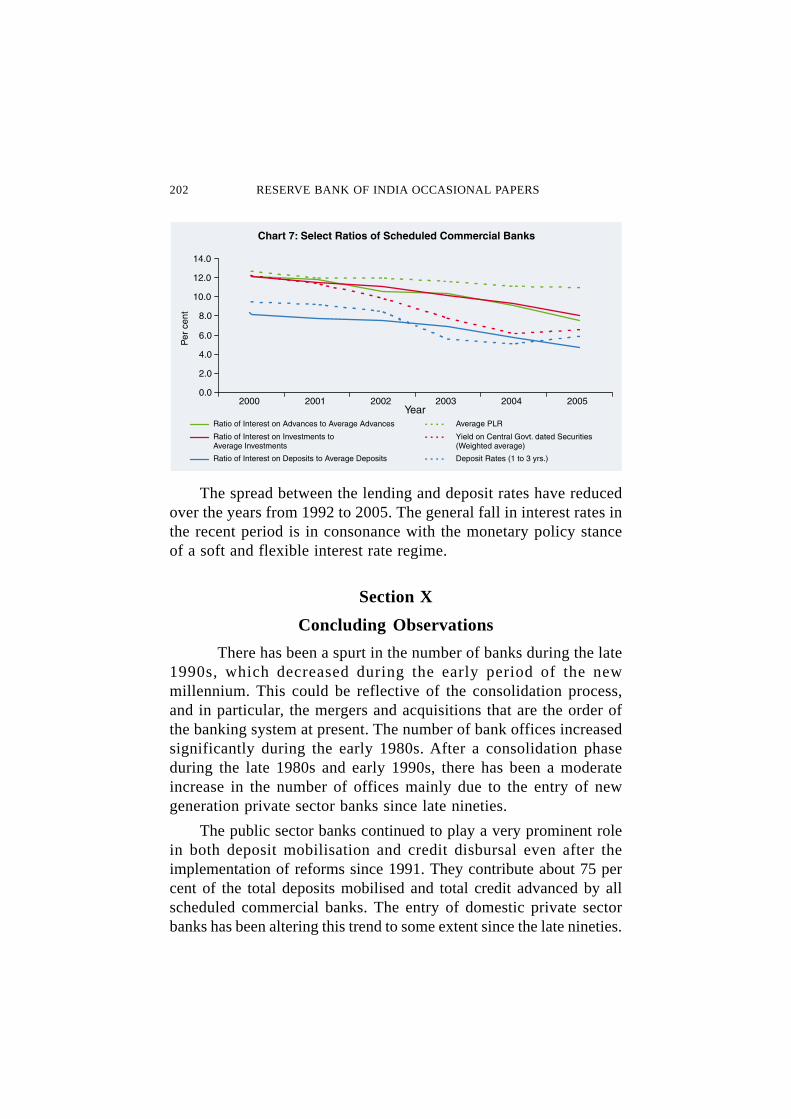
The data reveals that the ratio of interest on advances to averageadvances of all scheduled commercial banks, which is reflective ofthe lending rates, decreased from 14.0 per cent in 1992 to 7.1 percentin 2005. The prime lending rate was 19.0 per cent in 1992 and inthe range of 10.25 to 10.75 per cent in 2005. From this, it isevidenced that banks are lending at the sub prime lending rates.The gap between the PLR and lending rates of all scheduledcommercial banks was very less for the years 2000 to 2002.However, this gap widened since 2003. This is true for all the bankgroups, which is indicative of the fact that during the recent years,banks are lending at sub PLR rates with wider gaps between PLRand lending rates.
The ratio of interest on investments to average investments,which is reflective of the return on investments, shows that for allscheduled commercial banks, the rates have declined from 10.1 percent in 1992 to 7.6 percent in 2005. In comparison, the interest rateson central government dated securities (weighted average) declinedfrom 11.8 per cent in 1992 to 6.1 per cent in 2005. Overall trendsindicate that the return on investments made by the public sectorbanks is higher than that of all scheduled commercial banks. Aninteresting point to note here is that even though private sector banksinvested more of their funds in non-SLR securities, still their intereston investments as a percentage to average investments is lower thanthat obtained by the public sector banks. Between State Bank groupand nationalised bank group, the former was successful in gettinghigher yields on their investments than the latter group.
The ratio of interest on deposits to average deposits of scheduledcommercial banks, which is reflective of the deposit rate, declinedfrom 7.5 per cent in 1992 to 4.2 per cent in 2005. These rates arelower than the rates of deposits with 1 to 3 year maturity for all thebank groups. This indicates that banks are able to mobilise depositsat a lower rate than that of the rates for deposits of 1 to 3 years maturity(Table 15 and Chart 7).
BANKING SECTOR DEVELOPMENTS IN INDIA, 1980-2005 201
Table 15: Some Select Ratios of Scheduled Commercial Banks(Bank Group-wise)
Year Ratio of Interest on Advances to Average advances PLR*
SBI & its Nationalised Foreign Domestic All Sch.Associates Banks Banks Pvt. Comm.
Sector BanksBanks
1992 13.9 13.4 21.8 13.8 14.0 19.001995 11.1 11.5 14.7 13.0 11.7 15.002000 10.9 11.8 13.1 12.3 11.7 12.00-12.50
2001 10.7 11.5 13.1 11.7 11.4 11.00-12.002002 9.7 10.6 11.6 8.8 10.1 11.00-12.002003 9.0 9.8 10.7 10.9 9.9 10.75-11.50
2004 7.9 8.7 9.0 9.8 8.7 10.25-11.002005 6.6 7.1 7.3 7.5 7.1 10.25-10.75
Year Ratio of interest on Investments to average Investments Interest Rate on
SBI & its Nationalised Foreign Domestic All Sch.Central Govt.
Associates Banks Banks Pvt. Comm.Dated Securities
Sector Banks(Weighted
Banksaverage)
1992 10.1 10.1 10.1 10.6 10.1 11.781995 12.3 11.0 11.0 12.0 11.5 11.90
2000 11.7 11.7 11.7 11.5 11.7 11.772001 10.7 11.4 11.4 11.2 11.1 10.952002 10.8 11.0 11.0 9.2 10.6 9.44
2003 9.7 10.2 10.2 9.0 9.7 7.342004 8.9 9.2 9.2 7.6 8.8 5.712005 8.2 7.8 6.9 6.0 7.6 6.11
Year Ratio of interest on deposits to average deposits Deposit Rates**(1 to 3 Yrs.)SBI & its Nationalised Foreign Domestic All Sch.
Associates Banks Banks Pvt. Comm.Sector BanksBanks
1992 7.9 7.5 6.9 6.8 7.5 12.00
1995 7.1 6.8 5.9 6.9 6.8 11.00
2000 7.9 7.5 7.2 8.1 7.7 8.50 - 9.50
2001 7.6 7.2 6.7 7.8 7.3 8.50 - 9.00
2002 7.6 6.9 6.1 7.3 7.1 7.50 - 8.50
2003 7.0 6.2 5.3 6.6 6.5 4.25 - 6.00
2004 5.8 5.2 3.9 5.3 5.3 4.00 - 5.25
2005 4.6 4.2 3.0 3.8 4.2 5.25 - 5.50
* Relates to the prime lending rates of 5 major public sector banks.** Relates to the deposit rates of 5 major public sector banks.Source : (i) Base data are taken from Annual Accounts of Scheduled Commercial Banks 1979 to
2004 and Statistical Tables Relating to Banks in India 2004-05.(ii) Handbook of Statistics on the Indian Economy, 2004-05.
202 RESERVE BANK OF INDIA OCCASIONAL PAPERS
The spread between the lending and deposit rates have reducedover the years from 1992 to 2005. The general fall in interest rates inthe recent period is in consonance with the monetary policy stanceof a soft and flexible interest rate regime.
Section X
Concluding Observations
There has been a spurt in the number of banks during the late1990s, which decreased during the early period of the newmillennium. This could be reflective of the consolidation process,and in particular, the mergers and acquisitions that are the order ofthe banking system at present. The number of bank offices increasedsignificantly during the early 1980s. After a consolidation phaseduring the late 1980s and early 1990s, there has been a moderateincrease in the number of offices mainly due to the entry of newgeneration private sector banks since late nineties.
The public sector banks continued to play a very prominent rolein both deposit mobilisation and credit disbursal even after theimplementation of reforms since 1991. They contribute about 75 percent of the total deposits mobilised and total credit advanced by allscheduled commercial banks. The entry of domestic private sectorbanks has been altering this trend to some extent since the late nineties.
BANKING SECTOR DEVELOPMENTS IN INDIA, 1980-2005 203
There has been a significant change in the composition ofdeposits, with a clear shift in favour of term deposits, whereas demanddeposits witnessed a decline. The share of savings bank depositsremained more or less constant. It is observed that more funds ofshort-term nature in the form of demand deposits are parked with theforeign banks group. This may be an indication that the businessclass is attracted towards better service offered by foreign banks.
Even though the SLR requirements have been reduced to thestatutory minimum of 25 per cent, banks still prefer to invest largeportion of their investments in approved securities, due to the risk-free and assured returns they get through such investments. However,in the case of private sector banks in the domestic sector, there is aclear preference for investments in other securities and a reductionof investments in government and other approved securities. Sincethe year 2000, with the entry of more private sector banks, this groupinvested more than one third of their total investments in non-SLRsecurities, which indicates that the private banks, of late, are currentlyventuring into more riskier, nonetheless challenging business.
Across the bank groups, there has been a significant reductionin the non-performing assets (NPAs). The composition of NPAs ofpublic sector banks interestingly reveals that NPAs connected to non-priority sector has increased, whereas, NPAs relating to priority sectoradvances exhibited a decline. This goes to explode the commonlyheld myth that the problem of NPAs is caused mainly due to the creditallocation made to priority sectors.
The share of non-interest income in the total income has beenincreasing across the different bank groups. This is a welcome trendas it may reduce the risks arising out of the sole dependency on interestas the source of income.
Wages as a percentage of operating expenses of public sector banksis more than 60 per cent. This situation possibly calls for more apt andpragmatic human resource policies and proper manpower planning forthe future of these banks. Banks in the private sector both foreign anddomestic, however, have reduced their wage component in the operatingexpenses and are spending more for other business boosting measureslike image building, software development etc.
204 RESERVE BANK OF INDIA OCCASIONAL PAPERS
Compared to the pre-reform period, the ROA of public sectorbanks improved significantly after the initiation of reforms, althoughit is still lower as compared to foreign banks.
The objective of the analysis was to study the trends in bankingduring a span of 25 years, covering both pre- and post- reforms period.The study has clearly brought out the positive effects of the reformmeasures on the banking industry in general. A comparative analysisof various bank groups with respect to different variables has alsoidentified certain specific problem areas of the respective groups.The pace of the reform process is sometimes a cause for concern andcriticism. But, there seems to be a great wisdom in this gradualism.
The Indian approach to financial sector reforms is based onpancha sutra or five principles- cautious and proper sequencing;mutually re-inforcing measures, complementarity between reformsin the banking sector and changes in fiscal, external and monetarypolicies, developing financial infrastructure and developing financialmarkets (Reddy, 2000). The progress of the banking sector reformsthis far, albeit slow, vindicates this stand.
References
1. Banerjee Abhijit V., Cole Shawn and Duflo Esther (2004): “BankingReform in India”, Bureau for Research in Economic Analysis ofDevelopment, Policy Paper, No. 006, September, Harvard.
2. Caprio G. Jr. and Klingebiel D. (1996) “ Bank Insolvency: Bad Luck,Bad Policy, or Bad Banking ?” Annual World Bank Conference onDevelopment Economics 1996, Policy Research Working Paper, 1620,World Bank.
3. Fama E (1985): “ What’s Different about Banks” Journal of MonetaryEconomics, 15, pp. 29- 39.
4. Government of India (1998) Report of the Committee on Banking SectorReforms (Chairman: M Narasimham).
5. Mohan Rakesh (2003): “ Transforming Indian Banking: In Search of aBetter Tomorrow”, Reserve Bank of India Bulletin, January.
6. Mohan Rakesh (2004): “Finance for Industrial Growth”, Reserve Bankof India Bulletin, March.
BANKING SECTOR DEVELOPMENTS IN INDIA, 1980-2005 205
7. Ramanathan A & Samuel Achamma (1997-98): “FinancialLiberalization and Economic Development: The Theory andExperience”, The Indian Economic Journal, Vol. 46, July.
8. Ramasastri A S, Samuel Achamma & Gangadaran S (2004): “EmergingStructure of Indian Banking”, Seminar on Basel-II & Risk Management,Member Education Series, Indian Institute of Banking and Finance,Mumbai.
9. Ramasastri A S, Samuel Achamma & Gangadaran S (2004): “IncomeStability of Scheduled Commercial Banks Interest vis-à-vis Non-Interest Income”, Economic and Political Weekly, Vol. XXXIX No.12,March 20-26.
10. Rangarajan C (1998): Indian Economy: Essays in Money and Finance,UBSPD, New Delhi.
11. Reddy Y.V. (2000): Monetary and Financial Sector Reforms in India:A Central Bankers’s Perspective, UBSPD.
12. Reddy Y.V. (2004): “Credit Policy, Systems and Culture”, Reserve Bankof India Bulletin, March.
13. Reddy Y.V. (2005): “Banking Sector Reforms in India: An Overview”Reserve Bank of India Bulletin, June.
14. Reserve Bank of India: Report on Trend and Progress of Banking inIndia, Various issues.
15. Reserve Bank of India (1991): Report of the Committee on the FinancialSystem (Narasimham Committee Report).
16. Tandon Prakash (1989) Banking Century: A Short History of Bankingin India, Viking, New Delhi.