Quality of life and economic outcomes with surgical ventricular reconstruction in ischemic heart...
17
Quality of Life and Economic Outcomes with Surgical Ventricular Reconstruction in Ischemic Heart Failure: Results From the Surgical Treatment for Ischemic Heart Failure Trial Daniel B. Mark, M.D., M.P.H, J. David Knight, M.S., Eric J. Velazquez, M.D., Jonathan G. Howlett, M.D., John A. Spertus, M.D., M.P.H., Ljubomir T. Djokovic, M.D., Tina M. Harding, R.N., B.S.N., Gena R. Rankin, M.P.H., R.D., Laura A. Drew, R.N., B.S.N., Bozena Szygula- Jurkiewicz, M.D., Christopher Adlbrecht, M.D., and Kevin J. Anstrom, Ph.D. [on behalf of for the Surgical Treatment for Ischemic Heart Failure (STICH) Trial] Outcomes Research Group (DBM, JDK, TMH, LAD, KJA), Duke Clinical Research Institute (GRR, EJV), Duke University Medical Center, Durham, North Carolina; Department of Cardiac Sciences and Medicine, University of Calgary, Calgary, Alberta, Canada (JGH); Mid America Heart Institute, Kansas City, Missouri (JAS); Dedinje Cardiovascular Institute, Belgrade, Serbia (LTD); Department of Cardiology, Silesian Center for Heart Disease, Zabrze, Poland (BS), Department of Internal Medicine II, Medical University of Vienna, Vienna, Austria (CA) Abstract Background—Surgical ventricular reconstruction (SVR) is used in conjunction with coronary artery bypass graft surgery (CABG) to improve left ventricular function and clinical outcomes in selected patients with ischemic heart failure. The impact of SVR on quality of life and medical costs is unknown. Methods—We compared CABG plus SVR with CABG alone in 1000 patients with ischemic heart failure, a large anterior wall scar, and a left ventricular ejection fraction ≤ 0.35. In 991 (99% of eligible), we collected a battery of quality of life (QOL) instruments. The principal, pre-specified QOL measure was the Kansas City Cardiomyopathy Questionnaire (KCCQ), which evaluates the effects of heart failure symptoms on QOL using a scale from 0 to 100 with higher scores indicating better QOL. Structured QOL interviews were conducted at baseline, 4, 12, 24, and 36 months post randomization and were ≥ 92% complete. Cost data were collected on 196 of 200 (98%) patients enrolled in the United States. Results—Heart-failure-related QOL outcomes did not differ between the two treatment strategies out to 3 years (median KCCQ scores for CABG alone and CABG plus SVR, respectively: baseline 53 versus 54, p=0.53; 3 years 85 versus 84, p=0.89). There were no treatment-related differences in other QOL measures. In the US patients, total index hospitalization costs averaged over $14,500 higher for CABG plus SVR (P=0.004) due primarily to 4.2 extra post-operative high-intensity care days in the hospital. Address for Correspondence: Daniel B. Mark, MD, MPH, Director, Outcomes Research, Duke Clinical Research Institute, P.O. Box 17969, Durham, NC 27715, 2400 Pratt Street, Room 0311, Durham, NC 27705, E-mail: [email protected], 919-668-8775 (Phone), 919-668-7060 (Fax). DISCLOSURES Dr. John Spertus reports that he holds the copyright for the Kansas City Cardiomyopathy Questionnaire and the Seattle Angina Questionnaire. There are no other conflicts of interest to report. Publisher's Disclaimer: This is a PDF file of an unedited manuscript that has been accepted for publication. As a service to our customers we are providing this early version of the manuscript. The manuscript will undergo copyediting, typesetting, and review of the resulting proof before it is published in its final citable form. Please note that during the production process errors may be discovered which could affect the content, and all legal disclaimers that apply to the journal pertain. NIH Public Access Author Manuscript Am Heart J. Author manuscript; available in PMC 2010 May 1. Published in final edited form as: Am Heart J. 2009 May ; 157(5): 837–844.e3. doi:10.1016/j.ahj.2009.03.008. NIH-PA Author Manuscript NIH-PA Author Manuscript NIH-PA Author Manuscript
-
Upload
independent -
Category
Documents
-
view
5 -
download
0
Transcript of Quality of life and economic outcomes with surgical ventricular reconstruction in ischemic heart...
Quality of Life and Economic Outcomes with Surgical VentricularReconstruction in Ischemic Heart Failure: Results From theSurgical Treatment for Ischemic Heart Failure Trial
Daniel B. Mark, M.D., M.P.H, J. David Knight, M.S., Eric J. Velazquez, M.D., Jonathan G.Howlett, M.D., John A. Spertus, M.D., M.P.H., Ljubomir T. Djokovic, M.D., Tina M. Harding,R.N., B.S.N., Gena R. Rankin, M.P.H., R.D., Laura A. Drew, R.N., B.S.N., Bozena Szygula-Jurkiewicz, M.D., Christopher Adlbrecht, M.D., and Kevin J. Anstrom, Ph.D. [on behalf of forthe Surgical Treatment for Ischemic Heart Failure (STICH) Trial]Outcomes Research Group (DBM, JDK, TMH, LAD, KJA), Duke Clinical Research Institute (GRR,EJV), Duke University Medical Center, Durham, North Carolina; Department of Cardiac Sciencesand Medicine, University of Calgary, Calgary, Alberta, Canada (JGH); Mid America Heart Institute,Kansas City, Missouri (JAS); Dedinje Cardiovascular Institute, Belgrade, Serbia (LTD); Departmentof Cardiology, Silesian Center for Heart Disease, Zabrze, Poland (BS), Department of InternalMedicine II, Medical University of Vienna, Vienna, Austria (CA)
AbstractBackground—Surgical ventricular reconstruction (SVR) is used in conjunction with coronaryartery bypass graft surgery (CABG) to improve left ventricular function and clinical outcomes inselected patients with ischemic heart failure. The impact of SVR on quality of life and medical costsis unknown.
Methods—We compared CABG plus SVR with CABG alone in 1000 patients with ischemic heartfailure, a large anterior wall scar, and a left ventricular ejection fraction ≤ 0.35. In 991 (99% ofeligible), we collected a battery of quality of life (QOL) instruments. The principal, pre-specifiedQOL measure was the Kansas City Cardiomyopathy Questionnaire (KCCQ), which evaluates theeffects of heart failure symptoms on QOL using a scale from 0 to 100 with higher scores indicatingbetter QOL. Structured QOL interviews were conducted at baseline, 4, 12, 24, and 36 months postrandomization and were ≥ 92% complete. Cost data were collected on 196 of 200 (98%) patientsenrolled in the United States.
Results—Heart-failure-related QOL outcomes did not differ between the two treatment strategiesout to 3 years (median KCCQ scores for CABG alone and CABG plus SVR, respectively: baseline53 versus 54, p=0.53; 3 years 85 versus 84, p=0.89). There were no treatment-related differences inother QOL measures. In the US patients, total index hospitalization costs averaged over $14,500higher for CABG plus SVR (P=0.004) due primarily to 4.2 extra post-operative high-intensity caredays in the hospital.
Address for Correspondence: Daniel B. Mark, MD, MPH, Director, Outcomes Research, Duke Clinical Research Institute, P.O. Box17969, Durham, NC 27715, 2400 Pratt Street, Room 0311, Durham, NC 27705, E-mail: [email protected], 919-668-8775 (Phone),919-668-7060 (Fax).DISCLOSURES Dr. John Spertus reports that he holds the copyright for the Kansas City Cardiomyopathy Questionnaire and the SeattleAngina Questionnaire. There are no other conflicts of interest to report.Publisher's Disclaimer: This is a PDF file of an unedited manuscript that has been accepted for publication. As a service to our customerswe are providing this early version of the manuscript. The manuscript will undergo copyediting, typesetting, and review of the resultingproof before it is published in its final citable form. Please note that during the production process errors may be discovered which couldaffect the content, and all legal disclaimers that apply to the journal pertain.
NIH Public AccessAuthor ManuscriptAm Heart J. Author manuscript; available in PMC 2010 May 1.
Published in final edited form as:Am Heart J. 2009 May ; 157(5): 837–844.e3. doi:10.1016/j.ahj.2009.03.008.
NIH
-PA Author Manuscript
NIH
-PA Author Manuscript
NIH
-PA Author Manuscript
Conclusions—Addition of SVR to CABG in patients with ischemic heart failure did not improvequality of life but significantly increased health care costs.
KeywordsHeart failure; coronary artery bypass graft surgery; quality of life; cost; surgical ventricularreconstruction
INTRODUCTIONA subset of patients with ischemic cardiomyopathy develop progressive heart failure as aconsequence of adverse ventricular remodeling leading to a depressed ejection fraction, a largeakinetic region of myocardium, and an abnormal globular shape to the ventricular chamber.Over the past 25 years, cardiac surgeons have developed a novel procedure for excluding orexcising the ventricular scar and reshaping the left ventricle to a more normal geometry.1,2This procedure, known as surgical ventricular reconstruction (SVR), has shown encouragingresults in observational studies including significant improvement in heart failure symptomsand quality of life (QOL) relative to pre-surgery status.2-4 However, it remains unclear whatincremental clinical and QOL benefits are specifically provided by the SVR, since it is nearlyalways performed in conjunction with coronary bypass graft surgery (CABG) and in the settingof medical heart failure therapy. In addition, the economic consequences of this procedure havenot been previously reported.
Elsewhere we have reported on the primary results of the Surgical Treatment for IschemicHeart Failure (STICH) trial comparing CABG plus SVR with CABG alone in 1000 patientswith ischemic heart failure and a depressed ejection fraction.5 Our hypotheses at the start ofthis trial were that SVR would improve QOL relative to CABG alone and would be costeffective by conventional criteria. In this article, we provide data on the QOL and costoutcomes, both pre-specified secondary trial endpoints.
METHODSPatient Population and Clinical Results
The Surgical Treatment for Ischemic Heart Failure (STICH) trial is a National Heart, Lung,and Blood Institute-sponsored program consisting of two international, randomized clinicaltrials testing two related hypotheses about the use of surgical treatment for ischemic heartfailure. The left ventricular reconstruction hypothesis compared CABG plus surgicalventricular reconstruction with CABG alone in 1000 patients with symptomatic heart failure,an anterior wall scar, and a left ventricular ejection fraction ≤ 0.35.6 Rationale, trial design,and complete inclusion and exclusion criteria have been described elsewhere.6 One thousandpatients were enrolled into the left ventricular reconstruction hypothesis cohort betweenSeptember 12, 2002 and January 24, 2006.
As reported elsewhere, SVR had no effect on the primary clinical endpoint of all-cause deathor cardiac hospitalization at a median follow-up of 48 months (hazard ratio 0.99, p=0.89).5The SVR-plus-CABG operation produced a relative decrease of 25% in end systolic volumeindex compared with a 7% decrease seen in CABG-alone patients.
Quality-of-Life Data CollectionPatients were given a structured QOL interview at baseline (after enrollment but beforerandomized treatment was performed), 4, 12, 24, and 36 months post-randomization. Baselineinterviews were conducted by each site’s coordinators, who had been specially trained to
Mark et al. Page 2
Am Heart J. Author manuscript; available in PMC 2010 May 1.
NIH
-PA Author Manuscript
NIH
-PA Author Manuscript
NIH
-PA Author Manuscript

conduct the QOL interviews. Follow-up interviews for patients in the United States and Canadawere conducted via telephone by trained interviewers from the Duke Clinical ResearchInstitute’s Outcomes Research Group. Follow-up interviews for patients in all other countrieswere conducted by each site’s trained coordinators.
We collected baseline QOL data on 991 (99%) of 1000 patients randomized into the STICHtrial left ventricular reconstruction hypothesis cohort. From a total of 4509 expected patientcontacts, 4136 QOL questionnaires were collected, representing 82% to 99% of patientseligible for this assessment at each follow-up (Figure 1). Patient refusal was 0.8%, and 6.6%of forms collected were incomplete. A short proxy form was collected for incapacitatedpatients.
This study was conducted in collaboration with and supported by the NHLBI. This part of thestudy had no other funding. All patients provided informed consent and study protocol approvalwas obtained from each site’s institutional review board or ethics committee. The authorsdesigned the study, collected and analyzed the data, wrote all versions of this paper, and arefully responsible for its contents.
Quality of Life MeasuresOur principal, pre-specified quality of life measure was the Kansas City CardiomyopathyQuestionnaire (KCCQ) Overall Summary Score. The KCCQ is a 23-item, disease-specificQOL instrument used to measure the effect of heart failure symptoms on functional limitations,social limitations, self efficacy, and patient satisfaction with overall quality of life.7 In additionto the Overall Summary Score, scores can be calculated for six component subscales. KCCQscores range from 1-100, with higher scores indicating a more favorable status.7 A differenceof 5 points or more is considered clinically significant.8
To assess the effects of angina symptoms on QOL, we used three scales from the Seattle AnginaQuestionnaire (SAQ): anginal frequency, anginal stability, and quality of life.9 The anginalfrequency scale assesses the frequency of angina symptoms in the previous 4 weeks. Higherscores reflect lower incidence of anginal symptoms. The anginal stability scale measureschanges in angina frequency with a score of 50 representing no change. The quality of lifescale measures the effect of angina symptoms on patients’ perceptions of their quality of life,with higher scores being more favorable and a clinically significant difference being 5 pointsor greater.9
To supplement these condition-specific scales, we collected a brief overall generic measure ofheath status (the SF-12) plus five scales (psychological well-being, role physical, roleemotional, social function, and vitality) from the Medical Outcomes Study 36-Item Short-FormHealth Survey (SF-36).10 The SF-12 is scored in two summary scales, a Physical and a MentalComponent.11 Both the SF-12 and the SF-36 scales were scored by calculating the raw scoresthen transforming raw scores to a 0 to 100 score with larger values indicating more favorablehealth status. The scores were then standardized to a population norm-based score where avalue of 50 represents the average value obtained in the US general population in 1998. Inbrief, z-scores were first computed for each scale for each study subject by subtracting the USmean value from 1998 data for that scale and dividing by the standard deviation from the 1998US population. The result was then multiplied by 10 and added to 50 to produce a norm-basedscore with a mean of 50 and a standard deviation of 10. A clinically significant difference forthis scoring system has not been established but can be approximated by a ¼ standard deviationor 2.5 points or more.
To assess depressive symptoms, we used the Center for Epidemiologic Stress-Depression Scale(CES-D), a 20-item instrument that assesses if a patient is experiencing mild to moderate
Mark et al. Page 3
Am Heart J. Author manuscript; available in PMC 2010 May 1.
NIH
-PA Author Manuscript
NIH
-PA Author Manuscript
NIH
-PA Author Manuscript

depression or has a possibility of major depression.12 CES-D scores range from 0 to 60 witha score ≥ 16 indicating depression.12
The Cardiac Self-Efficacy Questionnaire (CSE) is a 13-item questionnaire designed to measurea patient’s confidence in controlling their disease symptoms and maintaining physicalfunctioning.13 Patient responses are scored on a 0-100 scale with higher scores reflectinghigher patient confidence.
The EuroQoL 5-D is a generic instrument consisting of two parts: a five dimension assessmentof health status that can be mapped to population utility weights and a self-rating (0-100) ofcurrent health-related quality of life.14,15
Resource Use and Data Collection and AnalysisResource use was collected on the case report form by site coordinators for all patients andincluded information about the length of the surgery, post-operative time in the ICU, totallength of stay, and rates of rehospitalization. We collected index hospitalization cost data from196 of 200 (98%) patients enrolled in the United States. One patient withdrew immediately,one died pre-surgery and no hospital bill was collected, one refused surgery, and one neverhad the surgery. Hospital costs were collected from UB 92/04 hospital billing data andconverted from charges to costs using department-level correction factors in each hospital’sannual Medicare Cost Report, as described previously.16,17 Physician costs were estimatedwith a previously derived algorithm using physician-based care identified on the clinical casereport form and the medical bills.16,18 Since our analyses took a societal perspective ratherthan a reimbursement perspective, we assigned costs to each identified unit of physician servicerather than employing a global reimbursement rate. Costs were then assigned using the 2008Medicare Fee Schedule. Costs are reported in 2008 U.S. Dollars.
Statistical AnalysesDescriptive statistics included percentages for discrete variables and medians with interquartileranges, means with standard deviations, or both for continuous variables. Comparisons wereperformed according to randomized treatment assignment. The chi-square test was used fordiscrete variable comparisons, and the Wilcoxon rank-sum variable was used for continuousvariables. Reported p-values were not adjusted for multiple comparisons. Along with thedifference in mean costs between the two arms, we calculated the difference in median costsusing the Hodges-Lehman statistic, and a non-parametric confidence limit for the differencewas calculated.
RESULTSPatient Population and Baseline Characteristics
Baseline characteristics of the two treatment arms were well balanced (data not shown).5 Themedian age of the study cohort was 62 years (25th and 75th percentiles, 55 years and 69 years).Fifteen percent were female and 9% were minorities. At baseline, 49% of patients had CanadianClass 3 or 4 angina and 49% had New York Heart Association Class 3 or 4 heart failure.
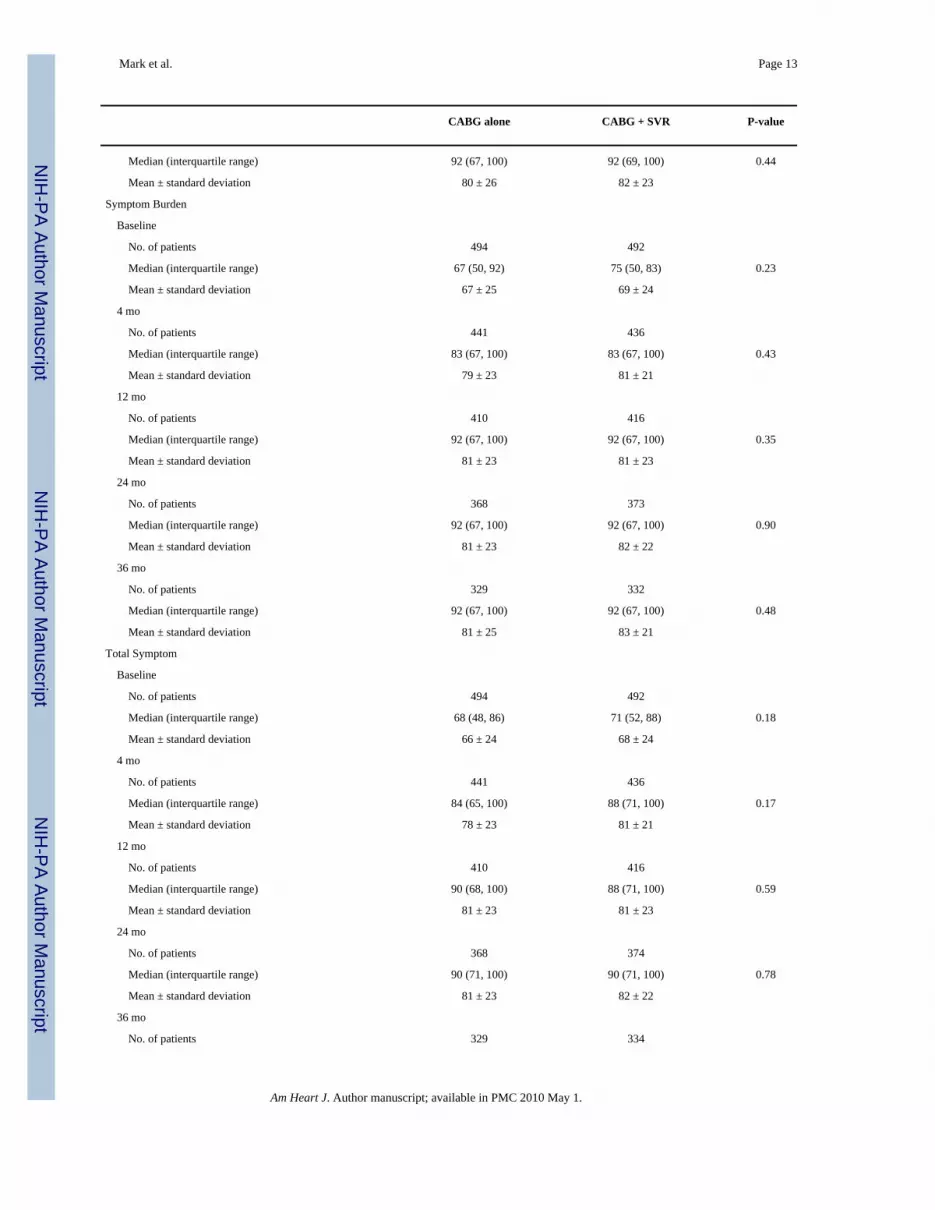
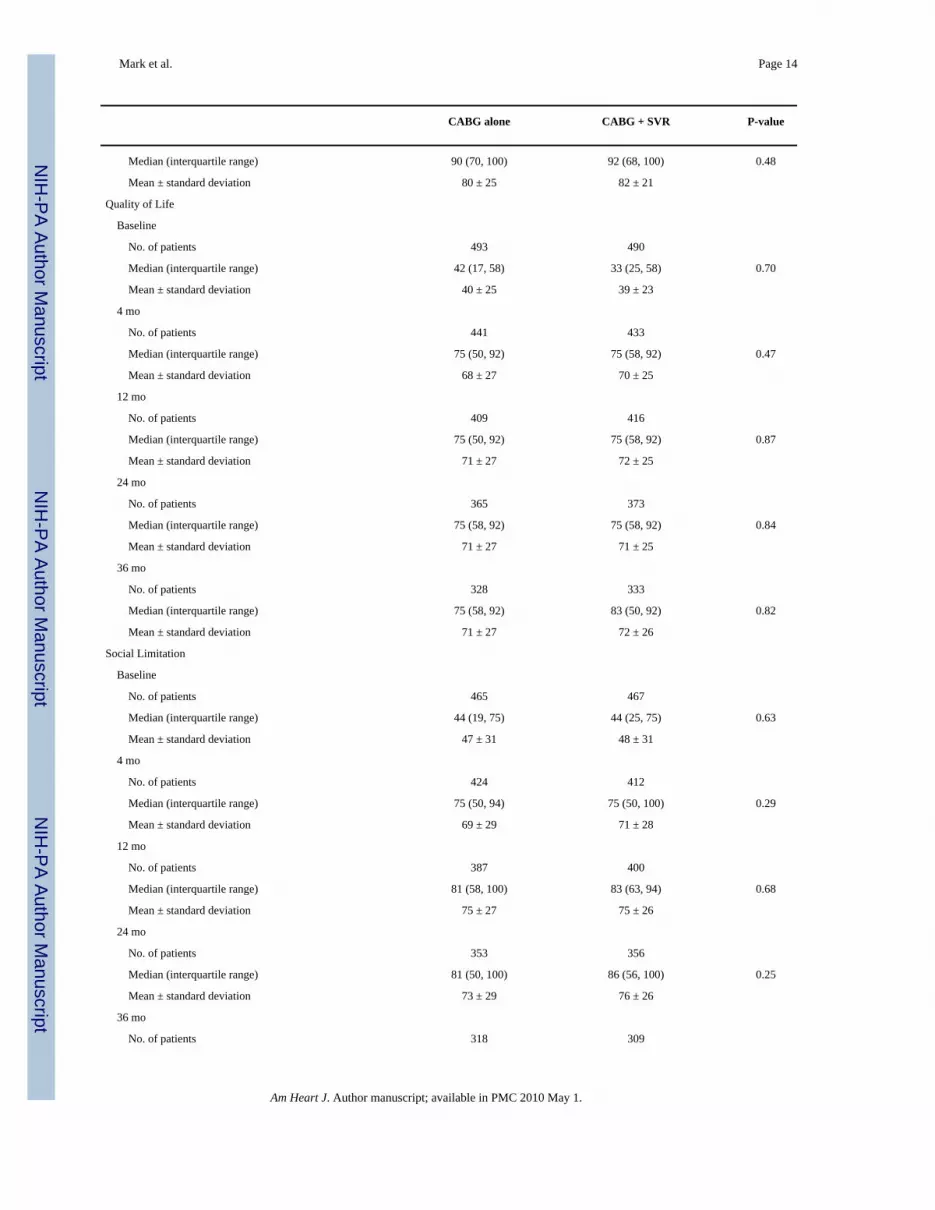
Quality of Life OutcomesBoth treatment groups significantly improved their KCCQ scores in follow-up compared withthe pre-operative assessment. The observed improvements in disease-specific health statusoccurred rapidly and were sustained throughout follow-up (baseline median KCCQ OverallSummary scores = 53 for CABG alone and 54 for CABG plus SVR; 4-month median scores= 79 and 79; 36-month median scores = 85 and 84). However, median KCCQ Overall Summaryscores did not differ between the two treatment groups at baseline or any follow-up interval
Mark et al. Page 4
Am Heart J. Author manuscript; available in PMC 2010 May 1.
NIH
-PA Author Manuscript
NIH
-PA Author Manuscript
NIH
-PA Author Manuscript

(Table 1). Results in the six KCCQ subscales were consistent with the Overall Summary scorecomparison.
No treatment differences were seen in the Seattle Angina Questionnaire anginal frequency,anginal stability, or quality of life scales (Appendix Table A).
The SF-12 Physical and Mental Component comparisons, reflecting generic health status,showed a single statistically significant difference for the Mental Component at one single timepoint that was not consistent with the remaining comparisons (Appendix Table A). A similarsingle significant difference at the same time point was seen for the SF-36 MHI-5, which shares2 questions with the SF-12 Mental Component. No treatment differences were seen in the otherSF-36 scales.
Depressive symptoms decreased significantly post-operatively in both treatment groups butwere not different between each group at any point during follow up (Appendix Table A).
No significant treatment-related differences were found in the 0-100 general health self-ratingscale or the EuroQoL 5-D.
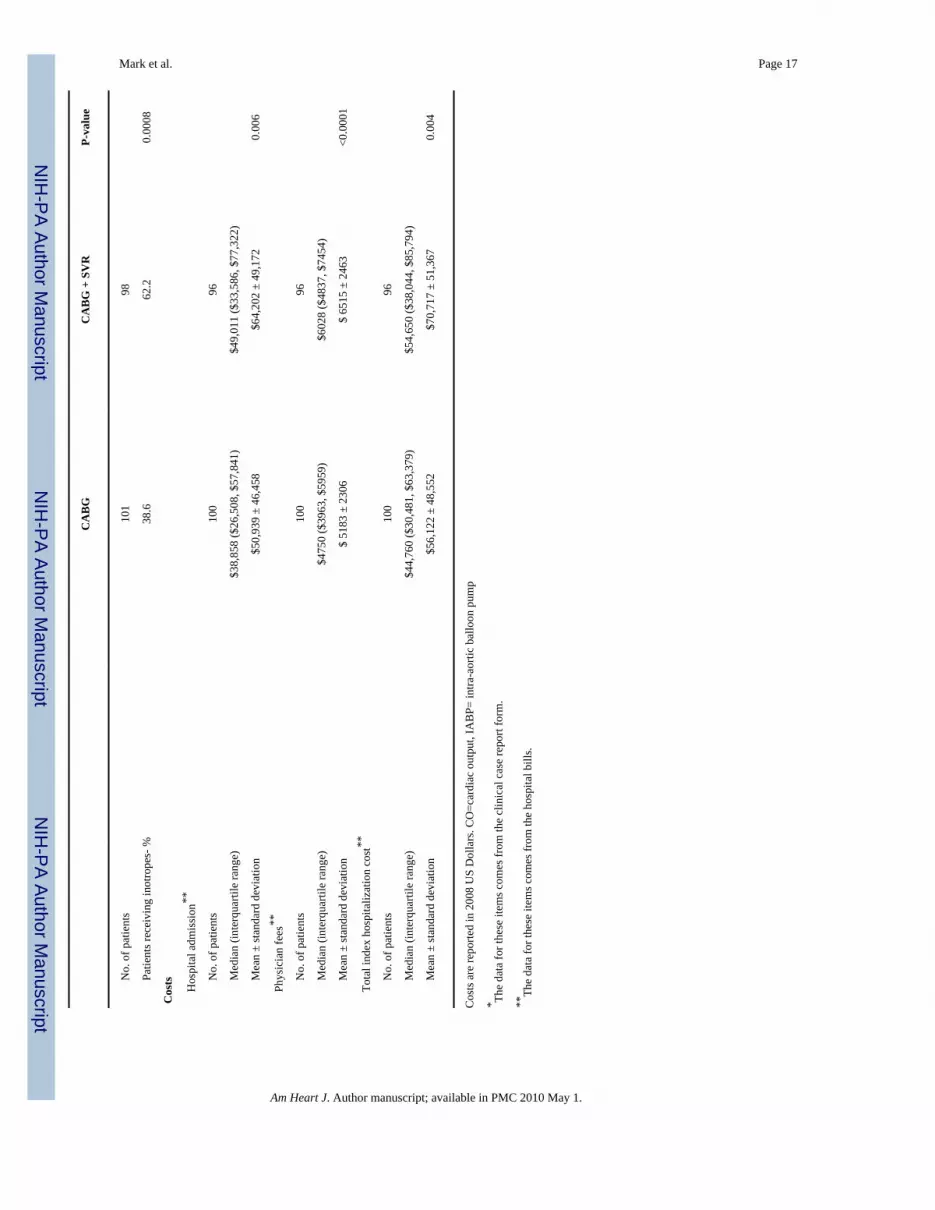
Resource Use and Medical Costs in US PatientsTotal operative time, need for post-operative PA catheters, intraaortic balloon pumps, andintravenous inotrope therapy were all greater in the CABG-plus-SVR arm (Table 2). TheCABG-plus-SVR arm had 4.2 extra post-operative intensive care unit days (p<0.001). Daysspent in non-ICU rooms and pre-operative days in the hospital did not differ significantly bytreatment. Total length of stay for the CABG-only group was 13.5 ± 13.0 days and for theCABG-plus-SVR group 16.8 ± 12.3 days (p=0.03). Rates of any follow-up all-causehospitalization from randomization to the latest follow-up were equivalent for the two arms(66.7% for CABG alone and 72.5% for CABG plus SVR, p=0.37).
Total index hospitalization costs were $14,595 higher for CABG plus SVR (p=0.006) (Table2 and Figure 2). The median difference in costs was $10,966 (Hodges-Lehman statistic) andthe 95% confidence limit was $3677 to $18,218 (p=0.004).
DISCUSSIONThe STICH trial provides the first comprehensive clinical, quality of life, and economicrandomized trial evaluation of the strategy of adding surgical ventricular reconstruction (SVR)to coronary bypass surgery in patients with advanced ischemic cardiomyopathy. Wehypothesized that the benefits of surgically creating a smaller, more normally shaped ventriclewould include reduced heart failure symptoms with consequent improved functioning and QOLand reduced need for rehospitalization. We also postulated that if these clinical results wereobtained, the incremental cost of the SVR procedure would be judged good value for moneybased on conventional cost-effectiveness criteria. However, our data do not show any evidenceof incremental benefit in health-related QOL by adding SVR to CABG in patients withischemic heart failure and large anterior scar. Because SVR significantly increases costs, wecan confidently conclude that there is no justification for routine performance of this techniquein STICH-eligible patients.
One notable feature of our trial results is the substantial and consistent improvement in multipledomains of QOL observed following surgery compared with the pre-operative state. Asreported in the primary clinical report from this trial, only 4% of patients had NYHA symptomsclass I pre-operatively and 15% had class IV symptoms, while post-operatively 40% of thesurvivors were class I and 2% were class IV.5 The Kansas City Cardiomyopathy Questionnaire
Mark et al. Page 5
Am Heart J. Author manuscript; available in PMC 2010 May 1.
NIH
-PA Author Manuscript
NIH
-PA Author Manuscript
NIH
-PA Author Manuscript

improved over time by about 30 points, corresponding to a large, clinically important treatmenteffect. For reference, a 5-point change for this scale is regarded as a small but clinicallymeaningful change, a 10-point change is considered a moderately large change, and changes>20 points are large.8 Notably, all 6 subscales of the KCCQ showed the same patterns ofimprovement. In addition, other measures of both functioning and well-being showed clinicallymeaningful improvements relative to the pre-operative state indicating significant increases inpsychological well-being, role functioning, social functioning, and self-efficacy with about a50% reduction in the prevalence of depressive symptoms. Further insights into these changeswill be provided by the second randomized trial in the STICH program, which comparesmedical therapy alone with medical therapy plus CABG in ischemic heart failure patientseligible for CABG.6
Several small observational studies have previously reported on the QOL effects of SVR.3,4While they observed post-operative improvement in QOL, the small samples and lack ofadequate controls made it impossible to discern what role the SVR had in creating theimprovement. The 1,198-patient RESTORE registry reported a similar level of improvementin heart failure symptoms to that seen in STICH but was also unable to isolate the contributionof the SVR due to the absence of a control group.2
No prior study of SVR has reported on the incremental costs of the procedure in the U.S.healthcare system. We expected the procedure to be at least modestly more expensive initially,since it required more operative time to perform relative to a CABG alone. Our study alsoshows that the post-operative course was more complex and required higher intensity, ICU-based care than CABG alone. We cannot discern from our data whether the patient’s clinicalcourse prompted the extra use of PA catheters, balloon pumps, inotropic stimulants, and extratime in the ICU or whether this was chosen out of an abundance of caution by the surgeons,who were not blinded to the treatment assignment.
Caveats relevant to our QOL results are primarily those that pertain to the underlying trial. Tothe extent that a cohort of SVR-eligible patients exists who were not enrolled in the trial,perhaps because clinicians did not have equipoise regarding their enrollment, our results mightnot be generalizable to such patients. However, one advantage of a large international clinicaltrial is that differences in equipoise and decision-making among investigators will often resultin enrollment of the same broad group of ischemic heart failure patients that are beingconsidered for these procedures in clinical practices. We did not calculate medical costs forpatients enrolled in STICH outside the United States, given the absence of suitable cost weightsand the possible effects of differences in practice patterns. While post-operative length of staydifferences were smaller in the non-U.S. centers, the CABG-plus-SVR group had a longerlength of stay. Although the magnitude of the cost difference between the treatment arms mightvary among centers, both in the United States and internationally, performing the SVRprocedure clearly increased costs due to a more complex post-operative course and there wasno evidence at all of a late decrease in rehospitalization or repeat cardiac procedures that mighthave provided some offset of the higher initial costs. In economic terms, any procedure thatcosts more and does not provide some incremental patient outcome benefits is dominated,meaning that the alternative less costly and equally effective treatment would always bepreferred.18
In summary, we found no evidence that adding surgical ventricular reconstruction to coronarybypass graft surgery provided any incremental improvements in quality of life out to 3 yearsfollowing surgery. Since SVR increases the complexity of post-operative care andconsequently significantly increases the cost of the procedure over CABG alone, our resultsdo not provide any justification for continued use of this procedure in STICH-eligible patients.
Mark et al. Page 6
Am Heart J. Author manuscript; available in PMC 2010 May 1.
NIH
-PA Author Manuscript
NIH
-PA Author Manuscript
NIH
-PA Author Manuscript

AcknowledgmentsThe authors appreciate the editorial assistance of Melanie R. Daniels. We are particularly indebted to the coordinatorsat the STICH sites that collected data for this portion of the STICH research effort and to the 1000 patients who agreedto participate in this clinical trial.
Supported by grant UO1 HL69011 from the National Heart, Lung, and Blood Institute/ National Institutes of Health,Bethesda, Maryland. The content is solely the responsibility of the authors and does not necessarily represent theofficial views of the National Heart, Lung, and Blood Institute or the National Institutes of Health.
References1. Dor V. Reconstructive left ventricular surgery for post-ischemic akinetic dilatation. Semin Thorac
Cardiovasc Surg 1997;9:139–45. [PubMed: 9253076]2. Athanasuleas CL, Buckberg GD, Stanley AW, Siler W, Dor V, Di DM, Menicanti L, meida de OS,
Beyersdorf F, Kron IL, Suma H, Kouchoukos NT, Moore W, McCarthy PM, Oz MC, Fontan F, ScottML, Accola KA. Surgical ventricular restoration in the treatment of congestive heart failure due topost-infarction ventricular dilation. J Am Coll Cardiol 2004;44:1439–45. [PubMed: 15464325]
3. Sartipy U, Albage A, Lindblom D. Improved health-related quality of life and functional status aftersurgical ventricular restoration. Ann Thorac Surg 2007;83:1381–7. [PubMed: 17383343]
4. Cotrufo M, Romano G, De Santo LS, Della CA, Amarelli C, Cafarella G, Maiello C, Scardone M.Treatment of extensive ischemic cardiomyopathy: quality of life following two different surgicalstrategies. Eur J Cardiothorac Surg 2005;27:481–7. [PubMed: 15740960]
5. Jones RH. STICH Hypothesis 2 Investigators. Surgical Treatment for Ischemic Heart Failure (STICH)trial evaluation of surgical ventricular reconstruction. 2009Submitted
6. Velazquez EJ, Lee KL, O’Connor CM, Oh JK, Bonow RO, Pohost GM, Feldman AM, Mark DB,Panza JA, Sopko G, Rouleau JL, Jones RH. The rationale and design of the Surgical Treatment forIschemic Heart Failure (STICH) trial. J Thorac Cardiovasc Surg 2007;134:1540–7. [PubMed:18023680]
7. Green CP, Porter CB, Bresnahan DR, Spertus JA. Development and evaluation of the Kansas CityCardiomyopathy Questionnaire: a new health status measure for heart failure. J Am Coll Cardiol2000;35:1245–55. [PubMed: 10758967]
8. Spertus J, Peterson E, Conard MW, Heidenreich PA, Krumholz HM, Jones P, McCullough PA, PinaI, Tooley J, Weintraub WS, Rumsfeld JS. Monitoring clinical changes in patients with heart failure:a comparison of methods. Am Heart J 2005;150:707–15. [PubMed: 16209970]
9. Spertus JA, Winder JA, Dewhurst TA, Deyo RA, Prodzinski J, McDonell M, Fihn SD. Developmentand evaluation of the Seattle Angina Questionnaire: a new functional status measure for coronaryartery disease. J Am Coll Cardiol 1995;25:333–41. [PubMed: 7829785]
10. Ware, JEJ.; Snow, KK.; Kosinski, M.; Gandek, B. SF-36 Health Survey: Manual & InterpretationGuide. Boston: The Health Institute, New England Medical Center; 1993.
11. Ware J Jr, Kosinski M, Keller SD. A 12-Item Short-Form Health Survey: construction of scales andpreliminary tests of reliability and validity. Med Care 1996;34:220–33. [PubMed: 8628042]
12. Radloff LS. The CES-D scale: a self-report depression scale for research in the general population.Applied Psychological Measurement 1977;1:385–401.
13. Sullivan MD, LaCroix AZ, Russo J, Katon WJ. Self-efficacy and self-reported functional status incoronary heart disease: a six-month prospective study. Psychosom Med 1998;60:473–8. [PubMed:9710293]
14. Rosser, RM.; Stintonen, H. The EuroQoL quality of life project. In: Walker, SR.; Rosser, RM., editors.Quality of Life Assessment: Key Issues in the 1990s. Dordrecht: Kluwer: Academic Publishers; 1993.p. 197-9.
15. EuroQol--a new facility for the measurement of health-related quality of life. The EuroQol Group.Health Policy 1990;16:199–208. [PubMed: 10109801]
16. Mark DB, Nelson CL, Anstrom KJ, Al-Khatib SM, Tsiatis AA, Cowper PA, Clapp-Channing NE,Davidson-Ray L, Poole JE, Johnson G, Anderson J, Lee KL, Bardy GH. Cost-effectiveness of
Mark et al. Page 7
Am Heart J. Author manuscript; available in PMC 2010 May 1.
NIH
-PA Author Manuscript
NIH
-PA Author Manuscript
NIH
-PA Author Manuscript

defibrillator therapy or amiodarone in chronic stable heart failure: results from the Sudden CardiacDeath in Heart Failure Trial (SCD-HeFT). Circulation 2006;114:135–42. [PubMed: 16818817]
17. Mark DB, Pan W, Clapp-Channing NE, Anstrom KJ, Ross JR, Fox RS, Devlin GP, Martin CE,Adlbrecht C, Cowper PA, Davidson-Ray L, Cohen EA, Lamas GA, Hochman JS. Quality of life afterlate invasive therapy for occluded arteries. N Engl J Med 2009;360:774–83. [PubMed: 19228620]
18. Mark DB, Hlatky MA. Medical economics and the assessment of value in cardiovascular medicine:Part I. Circulation 2002;106:516–20. [PubMed: 12135955]
Mark et al. Page 8
Am Heart J. Author manuscript; available in PMC 2010 May 1.
NIH
-PA Author Manuscript
NIH
-PA Author Manuscript
NIH
-PA Author Manuscript

Figure 1.This figure shows the rate of QOL data collection at each point in follow-up and reasons formissing data.
Mark et al. Page 9
Am Heart J. Author manuscript; available in PMC 2010 May 1.
NIH
-PA Author Manuscript
NIH
-PA Author Manuscript
NIH
-PA Author Manuscript
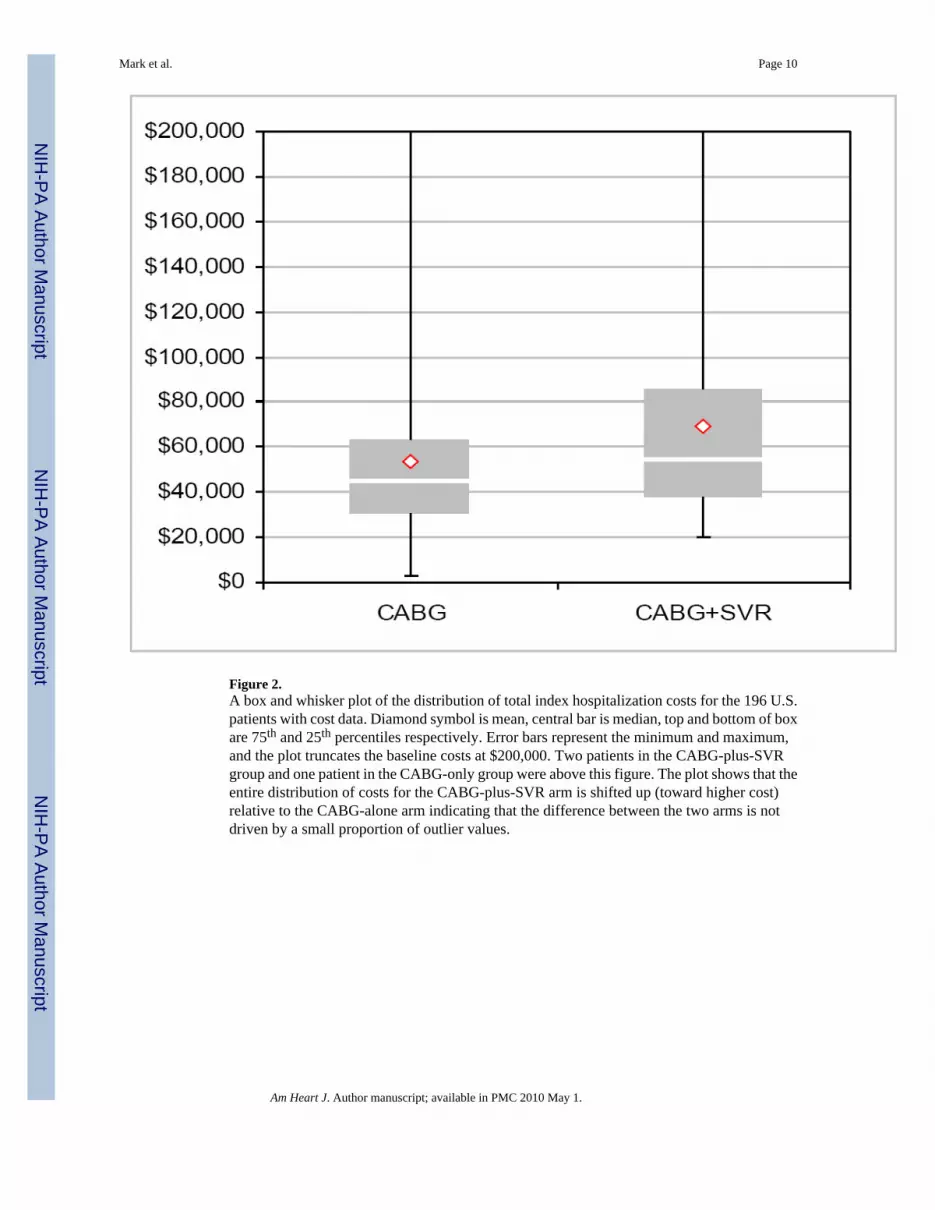
Figure 2.A box and whisker plot of the distribution of total index hospitalization costs for the 196 U.S.patients with cost data. Diamond symbol is mean, central bar is median, top and bottom of boxare 75th and 25th percentiles respectively. Error bars represent the minimum and maximum,and the plot truncates the baseline costs at $200,000. Two patients in the CABG-plus-SVRgroup and one patient in the CABG-only group were above this figure. The plot shows that theentire distribution of costs for the CABG-plus-SVR arm is shifted up (toward higher cost)relative to the CABG-alone arm indicating that the difference between the two arms is notdriven by a small proportion of outlier values.
Mark et al. Page 10
Am Heart J. Author manuscript; available in PMC 2010 May 1.
NIH
-PA Author Manuscript
NIH
-PA Author Manuscript
NIH
-PA Author Manuscript

NIH
-PA Author Manuscript
NIH
-PA Author Manuscript
NIH
-PA Author Manuscript
Mark et al. Page 11
Table 1Kansas City Cardiomyopathy Questionnaire Scores by Intention-to-Treat
CABG alone CABG + SVR P-value
Kansas City Cardiomyopathy Questionnaire
Overall Summary
Baseline
No. of patients 496 492
Median (interquartile range) 53 (36, 70) 54 (38, 72) 0.53
Mean ± standard deviation 54 ± 22 54 ± 22
4 mo
No. of patients 446 443
Median (interquartile range) 79 (56, 92) 79 (63, 92) 0.26
Mean ± standard deviation 72 ± 24 74 ± 23
12 mo
No. of patients 411 416
Median (interquartile range) 84 (59, 95) 82 (66, 94) 0.76
Mean ± standard deviation 76 ± 23 76 ± 22
24 mo
No. of patients 368 374
Median (interquartile range) 84 (60, 95) 84 (64, 94) 0.89
Mean ± standard deviation 75 ± 24 77 ± 22
36 mo
No. of patients 329 335
Median (interquartile range) 85 (65, 95) 84 (63, 95) 0.89
Mean ± standard deviation 75 ± 25 77 ± 22
Physical Limitation
Baseline
No. of patients 484 480
Median (interquartile range) 63 (38, 83) 63 (45, 80) 0.40
Mean ± standard deviation 59 ± 26 61 ± 25
4 mo
No. of patients 433 432
Median (interquartile range) 83 (58, 95) 83 (64, 96) 0.13
Mean ± standard deviation 74 ± 25 76 ± 25
12 mo
No. of patients 402 411
Median (interquartile range) 84 (65, 100) 88 (67, 96) 0.86
Mean ± standard deviation 77 ± 25 78 ± 24
24 mo
No. of patients 363 368
Median (interquartile range) 88 (60, 100) 85 (66, 96) 0.89
Mean ± standard deviation 77 ± 25 78 ± 23
36 mo
No. of patients 321 324
Am Heart J. Author manuscript; available in PMC 2010 May 1.

NIH
-PA Author Manuscript
NIH
-PA Author Manuscript
NIH
-PA Author Manuscript
Mark et al. Page 12
CABG alone CABG + SVR P-value
Median (interquartile range) 88 (69, 100) 88 (67, 96) 0.87
Mean ± standard deviation 78 ± 25 78 ± 23
Symptom Stability
Baseline
No. of patients 494 492
Median (interquartile range) 50 (25, 50) 50 (50, 50) 0.38
Mean ± standard deviation 48 ± 25 49 ± 24
4 mo
No. of patients 436 435
Median (interquartile range) 50 (50, 75) 50 (50, 75) 0.45
Mean ± standard deviation 57 ± 22 58 ± 22
12 mo
No. of patients 408 416
Median (interquartile range) 50 (50, 50) 50 (50, 50) 0.62
Mean ± standard deviation 53 ± 16 53 ± 19
24 mo
No. of patients 362 372
Median (interquartile range) 50 (50, 50) 50 (50, 50) 0.82
Mean ± standard deviation 50 ± 14 50 ± 15
36 mo
No. of patients 328 332
Median (interquartile range) 50 (50, 50) 50 (50, 50) 0.94
Mean ± standard deviation 49 ± 16 50 ± 13
Symptom Frequency
Baseline
No. of patients 493 491
Median (interquartile range) 67 (50, 88) 71 (50, 88) 0.19
Mean ± standard deviation 65 ± 26 67 ± 26
4 mo
No. of patients 440 434
Median (interquartile range) 83 (63, 100) 88 (67, 100) 0.07
Mean ± standard deviation 77 ± 24 80 ± 23
12 mo
No. of patients 409 415
Median (interquartile range) 90 (67, 100) 90 (71, 100) 0.94
Mean ± standard deviation 80 ± 24 80 ± 24
24 mo
No. of patients 367 374
Median (interquartile range) 92 (67, 100) 92 (69, 100) 0.67
Mean ± standard deviation 80 ± 24 81 ± 24
36 mo
No. of patients 329 334
Am Heart J. Author manuscript; available in PMC 2010 May 1.
NIH
-PA Author Manuscript
NIH
-PA Author Manuscript
NIH
-PA Author Manuscript
Mark et al. Page 13
CABG alone CABG + SVR P-value
Median (interquartile range) 92 (67, 100) 92 (69, 100) 0.44
Mean ± standard deviation 80 ± 26 82 ± 23
Symptom Burden
Baseline
No. of patients 494 492
Median (interquartile range) 67 (50, 92) 75 (50, 83) 0.23
Mean ± standard deviation 67 ± 25 69 ± 24
4 mo
No. of patients 441 436
Median (interquartile range) 83 (67, 100) 83 (67, 100) 0.43
Mean ± standard deviation 79 ± 23 81 ± 21
12 mo
No. of patients 410 416
Median (interquartile range) 92 (67, 100) 92 (67, 100) 0.35
Mean ± standard deviation 81 ± 23 81 ± 23
24 mo
No. of patients 368 373
Median (interquartile range) 92 (67, 100) 92 (67, 100) 0.90
Mean ± standard deviation 81 ± 23 82 ± 22
36 mo
No. of patients 329 332
Median (interquartile range) 92 (67, 100) 92 (67, 100) 0.48
Mean ± standard deviation 81 ± 25 83 ± 21
Total Symptom
Baseline
No. of patients 494 492
Median (interquartile range) 68 (48, 86) 71 (52, 88) 0.18
Mean ± standard deviation 66 ± 24 68 ± 24
4 mo
No. of patients 441 436
Median (interquartile range) 84 (65, 100) 88 (71, 100) 0.17
Mean ± standard deviation 78 ± 23 81 ± 21
12 mo
No. of patients 410 416
Median (interquartile range) 90 (68, 100) 88 (71, 100) 0.59
Mean ± standard deviation 81 ± 23 81 ± 23
24 mo
No. of patients 368 374
Median (interquartile range) 90 (71, 100) 90 (71, 100) 0.78
Mean ± standard deviation 81 ± 23 82 ± 22
36 mo
No. of patients 329 334
Am Heart J. Author manuscript; available in PMC 2010 May 1.
NIH
-PA Author Manuscript
NIH
-PA Author Manuscript
NIH
-PA Author Manuscript
Mark et al. Page 14
CABG alone CABG + SVR P-value
Median (interquartile range) 90 (70, 100) 92 (68, 100) 0.48
Mean ± standard deviation 80 ± 25 82 ± 21
Quality of Life
Baseline
No. of patients 493 490
Median (interquartile range) 42 (17, 58) 33 (25, 58) 0.70
Mean ± standard deviation 40 ± 25 39 ± 23
4 mo
No. of patients 441 433
Median (interquartile range) 75 (50, 92) 75 (58, 92) 0.47
Mean ± standard deviation 68 ± 27 70 ± 25
12 mo
No. of patients 409 416
Median (interquartile range) 75 (50, 92) 75 (58, 92) 0.87
Mean ± standard deviation 71 ± 27 72 ± 25
24 mo
No. of patients 365 373
Median (interquartile range) 75 (58, 92) 75 (58, 92) 0.84
Mean ± standard deviation 71 ± 27 71 ± 25
36 mo
No. of patients 328 333
Median (interquartile range) 75 (58, 92) 83 (50, 92) 0.82
Mean ± standard deviation 71 ± 27 72 ± 26
Social Limitation
Baseline
No. of patients 465 467
Median (interquartile range) 44 (19, 75) 44 (25, 75) 0.63
Mean ± standard deviation 47 ± 31 48 ± 31
4 mo
No. of patients 424 412
Median (interquartile range) 75 (50, 94) 75 (50, 100) 0.29
Mean ± standard deviation 69 ± 29 71 ± 28
12 mo
No. of patients 387 400
Median (interquartile range) 81 (58, 100) 83 (63, 94) 0.68
Mean ± standard deviation 75 ± 27 75 ± 26
24 mo
No. of patients 353 356
Median (interquartile range) 81 (50, 100) 86 (56, 100) 0.25
Mean ± standard deviation 73 ± 29 76 ± 26
36 mo
No. of patients 318 309
Am Heart J. Author manuscript; available in PMC 2010 May 1.

NIH
-PA Author Manuscript
NIH
-PA Author Manuscript
NIH
-PA Author Manuscript
Mark et al. Page 15
CABG alone CABG + SVR P-value
Median (interquartile range) 83 (58, 100) 83 (56, 100) 0.68
Mean ± standard deviation 73 ± 31 75 ± 27
Clinical Summary
Baseline
No. of patients 496 492
Median (interquartile range) 65 (46, 83) 68 (49, 84) 0.26
Mean ± standard deviation 63 ± 23 65 ± 22
4 mo
No. of patients 445 443
Median (interquartile range) 84 (63, 95) 84 (67, 96) 0.23
Mean ± standard deviation 76 ± 23 78 ± 22
12 mo
No. of patients 411 416
Median (interquartile range) 88 (66, 97) 86 (70, 96) 0.66
Mean ± standard deviation 79 ± 22 79 ± 22
24 mo
No. of patients 368 374
Median (interquartile range) 88 (65, 97) 87 (69, 96) 0.98
Mean ± standard deviation 79 ± 22 80 ± 21
36 mo
No. of patients 329 335
Median (interquartile range) 88 (67, 98) 88 (69, 98) 0.86
Mean ± standard deviation 79 ± 24 80 ± 21
*0-100 scale with higher scores representing better functioning
CABG=coronary artery bypass grafting surgery, SVR=surgical ventricular reconstruction.
P-value for continuous variables is based on Wilcoxon rank-sum test.
Am Heart J. Author manuscript; available in PMC 2010 May 1.

NIH
-PA Author Manuscript
NIH
-PA Author Manuscript
NIH
-PA Author Manuscript
Mark et al. Page 16Ta
ble
2In
dex
Hos
pita
l Cos
ts a
nd R
esou
rce
Use
in U
S Pa
tient
s
CA
BG
CA
BG
+ S
VR
P-va
lue
Res
ourc
e U
se
To
tal t
ime
in O
R* - h
ours
No.
of p
atie
nts
9996
Med
ian
(inte
rqua
rtile
rang
e)5.
4 (4
.7, 6
.6)
6.7
(5.7
, 7.7
)
Mea
n ±
stan
dard
dev
iatio
n5.
7 ±
1.3
6.8
± 1.
5<0
.001
Po
st-o
p tim
e in
ICU
/CC
U* - d
ays
No.
of p
atie
nts
9994
Med
ian
(inte
rqua
rtile
rang
e)2.
2 (1
.3, 4
.0)
4.8
(2.0
, 8.7
)
Mea
n ±
stan
dard
dev
iatio
n3.
4 ±
3.8
7.6
± 11
.5<0
.001
To
tal I
CU
tim
e**- d
ays
No.
of p
atie
nts
100
96
Med
ian
(inte
rqua
rtile
rang
e)4.
5 (2
.0, 7
.5)
6.0
(4.0
, 12.
0)
Mea
n ±
stan
dard
dev
iatio
n6.
0 ±
9.5
9.9
± 10
.60.
0002
Po
st-o
p le
ngth
of s
tay* - d
ays
No.
of p
atie
nts
9995
Med
ian
(inte
rqua
rtile
rang
e)7.
0 (5
.0, 1
0.0)
9.0
(7.0
, 17.
0)
Mea
n ±
stan
dard
dev
iatio
n9.
5 ±
10.5
13.4
± 1
1.7
<0.0
01
To
tal l
engt
h of
stay
**- d
ays
No.
of p
atie
nts
100
96
Med
ian
(inte
rqua
rtile
rang
e)11
.0 (7
.0, 1
6.0)
12.5
(8.0
, 18.
5)
Mea
n ±
stan
dard
dev
iatio
n13
.5 ±
13.
016
.8 ±
12.
30.
03
Oth
er R
esou
rce
Use
PA
Cat
hete
r*
No.
of p
atie
nts
101
98
Patie
nts r
ecei
ving
PA
cat
hete
r- %
17.8
27.6
0.10
IA
BP
for l
ow C
O*
No.
of p
atie
nts
101
98
Patie
nts r
ecei
ving
IAB
P- %
11.9
32.7
0.00
03
In
otro
pes f
or lo
w C
O*
Am Heart J. Author manuscript; available in PMC 2010 May 1.
NIH
-PA Author Manuscript
NIH
-PA Author Manuscript
NIH
-PA Author Manuscript
Mark et al. Page 17
CA
BG
CA
BG
+ S
VR
P-va
lue
No.
of p
atie
nts
101
98
Patie
nts r
ecei
ving
inot
rope
s- %
38.6
62.2
0.00
08
Cos
ts
H
ospi
tal a
dmis
sion
**
No.
of p
atie
nts
100
96
Med
ian
(inte
rqua
rtile
rang
e)$3
8,85
8 ($
26,5
08, $
57,8
41)
$49,
011
($33
,586
, $77
,322
)
Mea
n ±
stan
dard
dev
iatio
n$5
0,93
9 ±
46,4
58$6
4,20
2 ±
49,1
720.
006
Ph
ysic
ian
fees
**
No.
of p
atie
nts
100
96
Med
ian
(inte
rqua
rtile
rang
e)$4
750
($39
63, $
5959
)$6
028
($48
37, $
7454
)
Mea
n ±
stan
dard
dev
iatio
n$
5183
± 2
306
$ 65
15 ±
246
3<0
.000
1
To
tal i
ndex
hos
pita
lizat
ion
cost
**
No.
of p
atie
nts
100
96
Med
ian
(inte
rqua
rtile
rang
e)$4
4,76
0 ($
30,4
81, $
63,3
79)
$54,
650
($38
,044
, $85
,794
)
Mea
n ±
stan
dard
dev
iatio
n$5
6,12
2 ±
48,5
52$7
0,71
7 ±
51,3
670.
004
Cos
ts a
re re
porte
d in
200
8 U
S D
olla
rs. C
O=c
ardi
ac o
utpu
t, IA
BP=
intra
-aor
tic b
allo
on p
ump
* The
data
for t
hese
item
s com
es fr
om th
e cl
inic
al c
ase
repo
rt fo
rm.
**Th
e da
ta fo
r the
se it
ems c
omes
from
the
hosp
ital b
ills.
Am Heart J. Author manuscript; available in PMC 2010 May 1.