QTL analysis of fruit quality traits in two peach intraspecific populations and importance of...
16
ORIGINAL PAPER Genetic dissection of aroma volatile compounds from the essential oil of peach fruit: QTL analysis and identification of candidate genes using dense SNP maps Iban Eduardo & Giorgiana Chietera & Raul Pirona & Igor Pacheco & Michela Troggio & Elisa Banchi & Daniele Bassi & Laura Rossini & Alberto Vecchietti & Carlo Pozzi Received: 6 July 2011 / Revised: 1 June 2012 / Accepted: 1 July 2012 # The Author(s) 2012. This article is published with open access at Springerlink.com Abstract Volatile organic compounds (VOCs) in plants are involved in aroma and pest resistance. These compounds form a complex mixture whose composition is specific to species and often to varieties. Despite their importance as essential factors that determine peach fruit quality, understanding of molecular, genetic, and physiological mechanisms underlying aroma formation is limited. The aim of this study was the identification in peach of quantitative trait loci (QTLs) for fruit VOCs to understand their genetic basis using an F1 population of 126 seedlings deriving from the cross between “Bolero” (B) and “OroA” (O), two peach cultivars differing in their aroma profile. Dense single nucleotide polymorphism (SNP) and SSR maps covering the eight linkage groups of the peach genome were constructed by genotyping with the International Peach SNP Consortium peach SNP array v1, and data for 23 VOCs with high or unknown “odor activity value” were obtained by gas chromatography–mass spectrometry analysis of fruit essential oil in the years 2007 and 2008. A total of 72 Communicated by A. Abbott Alberto Vecchietti and Carlo Pozzi share senior authorship. Electronic supplementary material The online version of this article (doi:10.1007/s11295-012-0546-z) contains supplementary material, which is available to authorized users. I. Eduardo : R. Pirona : L. Rossini : A. Vecchietti : C. Pozzi Parco Tecnologico Padano, via Einstein, Loc. Cascina Codazza, 26900 Lodi, Italy G. Chietera : I. Pacheco : D. Bassi : L. Rossini (*) DiSAA, Università degli Studi di Milano, via Celoria 2, 20133 Milan, Italy e-mail: [email protected] M. Troggio : E. Banchi IASMA Research and Innovation Centre, Foundation Edmund Mach, Via Edmund Mach 1, 38010 San Michele all’Adige Trento, Italy Present Address: I. Eduardo IRTA, Center for Research in Agricultural Genomics CSIC-IRTA-UAB-UB, Campus UAB, Edifici CRAG, Bellaterra (Cerdanyola del Vallès), 08193 Barcelona, Spain Present Address: G. Chietera INRA Versailles, route de Saint Cyr, 78026 Versailles Cedex, France Present Address: A. Vecchietti Monsanto Vegetable Seeds Division, P.O. Box 1050, 2660 BB Bergschenhoek, The Netherlands Present Address: C. Pozzi IASMA Research and Innovation Centre, Foundation Edmund Mach, Via Edmund Mach 1, 38010 San Michele all’Adige Trento, Italy Tree Genetics & Genomes DOI 10.1007/s11295-012-0546-z
-
Upload
independent -
Category
Documents
-
view
0 -
download
0
Transcript of QTL analysis of fruit quality traits in two peach intraspecific populations and importance of...

ORIGINAL PAPER
Genetic dissection of aroma volatile compounds from the essentialoil of peach fruit: QTL analysis and identification of candidategenes using dense SNP maps
Iban Eduardo & Giorgiana Chietera & Raul Pirona &
Igor Pacheco & Michela Troggio & Elisa Banchi &Daniele Bassi & Laura Rossini & Alberto Vecchietti &Carlo Pozzi
Received: 6 July 2011 /Revised: 1 June 2012 /Accepted: 1 July 2012# The Author(s) 2012. This article is published with open access at Springerlink.com
Abstract Volatile organic compounds (VOCs) in plants areinvolved in aroma and pest resistance. These compounds forma complex mixture whose composition is specific to speciesand often to varieties. Despite their importance as essentialfactors that determine peach fruit quality, understanding ofmolecular, genetic, and physiological mechanisms underlyingaroma formation is limited. The aim of this study was theidentification in peach of quantitative trait loci (QTLs) for fruitVOCs to understand their genetic basis using an F1 population
of 126 seedlings deriving from the cross between “Bolero” (B)and “OroA” (O), two peach cultivars differing in their aromaprofile. Dense single nucleotide polymorphism (SNP) andSSR maps covering the eight linkage groups of the peachgenome were constructed by genotyping with the InternationalPeach SNP Consortium peach SNP array v1, and data for 23VOCs with high or unknown “odor activity value” wereobtained by gas chromatography–mass spectrometry analysisof fruit essential oil in the years 2007 and 2008. A total of 72
Communicated by A. Abbott
Alberto Vecchietti and Carlo Pozzi share senior authorship.
Electronic supplementary material The online version of this article(doi:10.1007/s11295-012-0546-z) contains supplementary material,which is available to authorized users.
I. Eduardo : R. Pirona : L. Rossini :A. Vecchietti :C. PozziParco Tecnologico Padano,via Einstein, Loc. Cascina Codazza,26900 Lodi, Italy
G. Chietera : I. Pacheco :D. Bassi : L. Rossini (*)DiSAA, Università degli Studi di Milano,via Celoria 2,20133 Milan, Italye-mail: [email protected]
M. Troggio : E. BanchiIASMA Research and Innovation Centre,Foundation Edmund Mach,Via Edmund Mach 1,38010 San Michele all’Adige Trento, Italy
Present Address:I. EduardoIRTA, Center for Research in Agricultural GenomicsCSIC-IRTA-UAB-UB,Campus UAB, Edifici CRAG,Bellaterra (Cerdanyola del Vallès),08193 Barcelona, Spain
Present Address:G. ChieteraINRAVersailles,route de Saint Cyr,78026 Versailles Cedex, France
Present Address:A. VecchiettiMonsanto Vegetable Seeds Division,P.O. Box 1050, 2660 BB Bergschenhoek,The Netherlands
Present Address:C. PozziIASMA Research and Innovation Centre,Foundation Edmund Mach,Via Edmund Mach 1,38010 San Michele all’Adige Trento, Italy
Tree Genetics & GenomesDOI 10.1007/s11295-012-0546-z
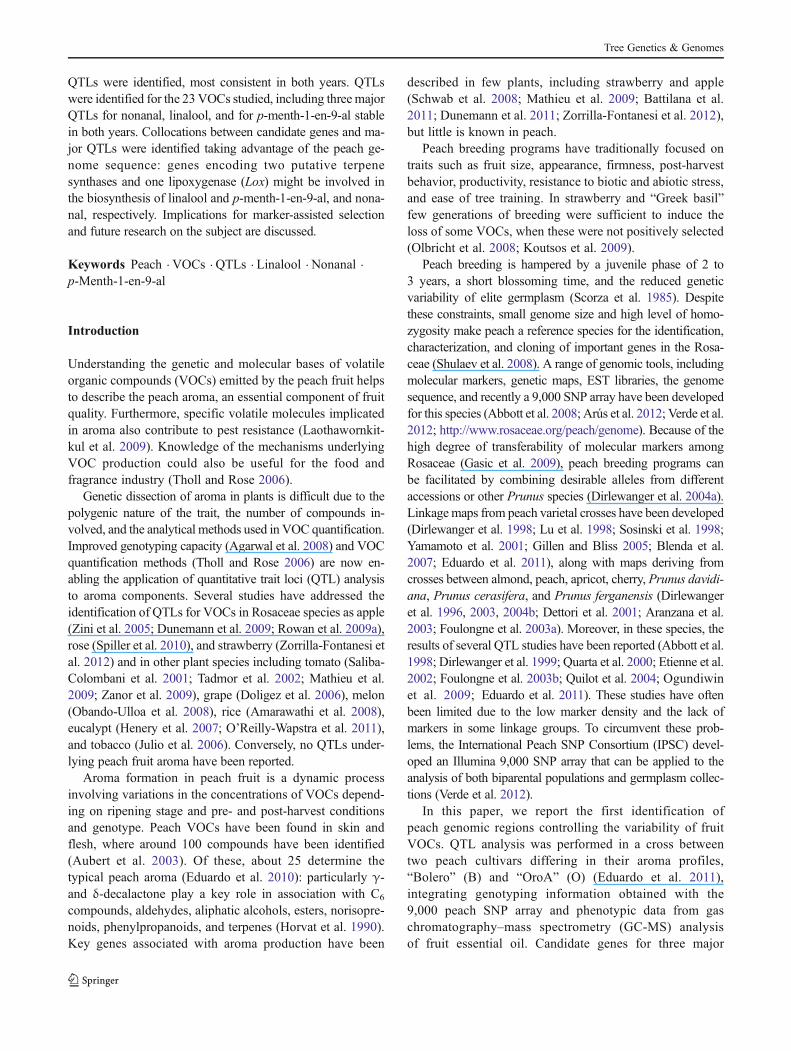
QTLs were identified, most consistent in both years. QTLswere identified for the 23VOCs studied, including threemajorQTLs for nonanal, linalool, and for p-menth-1-en-9-al stablein both years. Collocations between candidate genes and ma-jor QTLs were identified taking advantage of the peach ge-nome sequence: genes encoding two putative terpenesynthases and one lipoxygenase (Lox) might be involved inthe biosynthesis of linalool and p-menth-1-en-9-al, and nona-nal, respectively. Implications for marker-assisted selectionand future research on the subject are discussed.
Keywords Peach . VOCs . QTLs . Linalool . Nonanal .
p-Menth-1-en-9-al
Introduction
Understanding the genetic and molecular bases of volatileorganic compounds (VOCs) emitted by the peach fruit helpsto describe the peach aroma, an essential component of fruitquality. Furthermore, specific volatile molecules implicatedin aroma also contribute to pest resistance (Laothawornkit-kul et al. 2009). Knowledge of the mechanisms underlyingVOC production could also be useful for the food andfragrance industry (Tholl and Rose 2006).
Genetic dissection of aroma in plants is difficult due to thepolygenic nature of the trait, the number of compounds in-volved, and the analytical methods used in VOC quantification.Improved genotyping capacity (Agarwal et al. 2008) and VOCquantification methods (Tholl and Rose 2006) are now en-abling the application of quantitative trait loci (QTL) analysisto aroma components. Several studies have addressed theidentification of QTLs for VOCs in Rosaceae species as apple(Zini et al. 2005; Dunemann et al. 2009; Rowan et al. 2009a),rose (Spiller et al. 2010), and strawberry (Zorrilla-Fontanesi etal. 2012) and in other plant species including tomato (Saliba-Colombani et al. 2001; Tadmor et al. 2002; Mathieu et al.2009; Zanor et al. 2009), grape (Doligez et al. 2006), melon(Obando-Ulloa et al. 2008), rice (Amarawathi et al. 2008),eucalypt (Henery et al. 2007; O’Reilly-Wapstra et al. 2011),and tobacco (Julio et al. 2006). Conversely, no QTLs under-lying peach fruit aroma have been reported.
Aroma formation in peach fruit is a dynamic processinvolving variations in the concentrations of VOCs depend-ing on ripening stage and pre- and post-harvest conditionsand genotype. Peach VOCs have been found in skin andflesh, where around 100 compounds have been identified(Aubert et al. 2003). Of these, about 25 determine thetypical peach aroma (Eduardo et al. 2010): particularly γ-and δ-decalactone play a key role in association with C6
compounds, aldehydes, aliphatic alcohols, esters, norisopre-noids, phenylpropanoids, and terpenes (Horvat et al. 1990).Key genes associated with aroma production have been
described in few plants, including strawberry and apple(Schwab et al. 2008; Mathieu et al. 2009; Battilana et al.2011; Dunemann et al. 2011; Zorrilla-Fontanesi et al. 2012),but little is known in peach.
Peach breeding programs have traditionally focused ontraits such as fruit size, appearance, firmness, post-harvestbehavior, productivity, resistance to biotic and abiotic stress,and ease of tree training. In strawberry and “Greek basil”few generations of breeding were sufficient to induce theloss of some VOCs, when these were not positively selected(Olbricht et al. 2008; Koutsos et al. 2009).
Peach breeding is hampered by a juvenile phase of 2 to3 years, a short blossoming time, and the reduced geneticvariability of elite germplasm (Scorza et al. 1985). Despitethese constraints, small genome size and high level of homo-zygosity make peach a reference species for the identification,characterization, and cloning of important genes in the Rosa-ceae (Shulaev et al. 2008). A range of genomic tools, includingmolecular markers, genetic maps, EST libraries, the genomesequence, and recently a 9,000 SNP array have been developedfor this species (Abbott et al. 2008; Arús et al. 2012; Verde et al.2012; http://www.rosaceae.org/peach/genome). Because of thehigh degree of transferability of molecular markers amongRosaceae (Gasic et al. 2009), peach breeding programs canbe facilitated by combining desirable alleles from differentaccessions or other Prunus species (Dirlewanger et al. 2004a).Linkagemaps from peach varietal crosses have been developed(Dirlewanger et al. 1998; Lu et al. 1998; Sosinski et al. 1998;Yamamoto et al. 2001; Gillen and Bliss 2005; Blenda et al.2007; Eduardo et al. 2011), along with maps deriving fromcrosses between almond, peach, apricot, cherry, Prunus davidi-ana, Prunus cerasifera, and Prunus ferganensis (Dirlewangeret al. 1996, 2003, 2004b; Dettori et al. 2001; Aranzana et al.2003; Foulongne et al. 2003a). Moreover, in these species, theresults of several QTL studies have been reported (Abbott et al.1998; Dirlewanger et al. 1999; Quarta et al. 2000; Etienne et al.2002; Foulongne et al. 2003b; Quilot et al. 2004; Ogundiwinet al. 2009; Eduardo et al. 2011). These studies have oftenbeen limited due to the low marker density and the lack ofmarkers in some linkage groups. To circumvent these prob-lems, the International Peach SNP Consortium (IPSC) devel-oped an Illumina 9,000 SNP array that can be applied to theanalysis of both biparental populations and germplasm collec-tions (Verde et al. 2012).
In this paper, we report the first identification ofpeach genomic regions controlling the variability of fruitVOCs. QTL analysis was performed in a cross betweentwo peach cultivars differing in their aroma profiles,“Bolero” (B) and “OroA” (O) (Eduardo et al. 2011),integrating genotyping information obtained with the9,000 peach SNP array and phenotypic data from gaschromatography–mass spectrometry (GC-MS) analysisof fruit essential oil. Candidate genes for three major
Tree Genetics & Genomes

VOC QTLs are proposed, based on sequence analysis ofthe corresponding genomic regions.
Materials and methods
Plant material
The progeny assessed in this study is an F1 comprising 126seedlings obtained from a cross between the melting peachcultivar Bolero (B) and the non-melting peach cultivar OroA(O), chosen for their distinct fruit flavor (Eduardo et al. 2011).Trees located in the CRPV (fruit trees research unit “MarioNeri”) orchards in Castel S. Pietro (Emilia Romagna, northernItaly) were planted on their own roots, with spacing of 1 mwithin and 4 m between rows and trained as slender spindle(one stem with short lateral scaffolds). Pruning was performedyearly and standard cultural practices applied. Fruits werethinned before pit hardening to a load of only 30–40 fruitsper tree according to vigor, in order to allow a full expressionof fruit size not limited by competition.
Aroma compound analysis
Phenotypic evaluation was repeated over 2 years (2007 and2008). Each year, 20 fruits per tree were harvested at commer-cial maturity based on visual color change and manual evalu-ation of firmness. A slice was cut from each of the ten mostuniform fruits obtaining 150 g total of fruit pieces (comprisingflesh and skin), to which 200 ml of dichloromethane (Sigma,Italy) was added immediately after cutting. Dichloromethaneallows to elute the hydrophobic molecules and to avoid oxida-tion processes (Tava et al. 2009). Samples were stored at 4 °Cin the dark until steam distillation was performed.
Samples were steam-distilled for 1 h at 100 °C in aClevenger apparatus with distilled water followed by sol-vent separation at room temperature of the volatile organicfraction, with 20 ml dichloromethane and 50 ml diethylether. One milliliter of each 3-methyl cyclohexanone(0.161 mg ml−1) and 4-nonanol (0.077 mg ml−1) was addedas internal standards before the distillation started. Theorganic phase was concentrated in a rotary evaporator usinga heating bath at 37 °C, dried over anhydrous NaSO4 toreach a final volume of 100 μl, and stored at −20 °C untilchromatographic analysis.
Gas chromatography–flame ionization detector (GC-FID) analysis was carried out using a Perkin Elmer Clarus500 gas chromatograph equipped with a 30 m×0.32 mm i.d.Elite-5MS (5 % diphenyl/95 % dimethyl polysiloxane) cap-illary column (0.5 μm film thickness). Samples (0.5 μl)were injected with a column temperature program of 40 °C for 3 min, increasing to 300 °C at 4 °C/min and finallyheld at this last temperature for 5 min. Injector and detector
were set at 300 and 320 °C, respectively. The carrier gas washelium with a head pressure of 12.0 psi.
GC-MS analyses were carried out using a Perkin ElmerClarus 500 gas chromatograph equipped with a Clarus 500mass spectrometer, using the same capillary column andchromatographic conditions as for the GC-FID analyses.Mass spectra were acquired over the 40–500 amu range at1 scan/s, with ionizing electron energy of 70 eV and ionsource at 200 °C. The transfer line was set at 300 °C and thecarrier gas was helium at 1.0 ml/min. All measurementswere performed in triplicate.
The identification of the essential oil components was per-formed using their retention indices; mass spectra by compar-ison with the NIST database mass spectral library (NIST/EPA/NIHMass Spectral Database, Version 2.1, Perkin-Elmer Instru-ment LLC), published mass spectra 21, and authentic referencecompounds (Sigma Aldrich, Italy). Retention indices werecalculated using an n-alkane series (C6 to C32) under the samechromatographic conditions. Quantification was conducted us-ing internal standards equivalents and response factors calcu-lated from standard curves prepared with authentic compounds.A calibration factor curve, simulating compound behavior andrecovery rate during distillation process, concentration, andcolumn run, was obtained for the principal classes of com-pounds that better describe peach aroma. The calibration curvewas obtained performing a triple series of distillations of au-thentic reference compounds at different concentrations (0.5×,1×, 2×, 3×, and 4×) while the internal standards were kept at thesame concentration (1×) in all samples. A calibration curve andequation were obtained for aldehydes, C6 compounds, esters,lactones, long chain hydrocarbons, benzaldehyde, phenylace-taldehyde, eugenol, and β-ionone. Quantification for acids,terpenes, and miscellaneous compounds was performed asdirect comparison with internal standards peaks.
Using GC-FID and GC-MS analysis, we identified 49VOCs in 2007 and 57 in 2008 (Eduardo et al. 2010). Onlythe 23 VOCs that were identified in both years and with ahigh or unknown “odor activity value” (OAV) according toEduardo et al. (2010) were considered in QTL analysis.
Data analysis
R version 2.7.1 [R Development Core Team (2008). R: Alanguage and environment for statistical computing. R Foun-dation for Statistical Computing, Vienna, Austria. ISBN 3-900051-07-0, URL http://www.R-project.org] was used toproduce histograms of the different traits and to calculate thecorrelation coefficients between traits and between years.
SNP genotyping
The BxO F1 progeny was genotyped using the recently de-veloped Illumina 9,000 SNP array v1 for peach (Verde et al.
Tree Genetics & Genomes

2012) to further saturate the genetic map described in Eduardoet al. (2011). Four SNPs located in candidate genes were alsogenotyped using KASPar technology (see candidate genemapping section).
For 9,000 SNP array genotyping, DNAwas extracted withthe DNAeasy 96 Plant kit (Qiagen) and diluted to 50 ng/μl.Genotyping was performed at IASMA Research and Innova-tion Centre (San Michele all’Adige, Italy) following the man-ufacturer’s recommendations as described in Verde et al.(2012). SNP data were scored using GenomeStudio DataAnalysis software (Illumina Inc.) using a GenCall thresholdof 0.15. SNPs with GenTrain score<0.6 and those showingsevere segregation distortion (χ2 test, p<10−6) and more than1 % of missing data were excluded from further analyses.
Linkage mapping
Genetic linkage analysis and map constructions were per-formed with JoinMap 4.1 (Van Ooijen 2011). Three maps (Bmap, Omap, and BxOmap) were produced for the BxO cross,one for each parent and one for the linkage groups that couldbe integrated (double pseudo-test cross strategy). Groupingwas performed using independence LODwith groups present-ing a LOD score between 4 and 10. Map construction wasperformed using the multipoint maximum likelihood basedalgorithm. Linkage groups nomenclature was according to thePrunus reference map (TxE) (Dirlewanger et al. 2004a).
QTL analysis
QTL analysis was carried out by MAPQTL software v.6.0 (VanOoijen 2009) using the B, O, and BxO maps described in thelinkage mapping results. After a Shapiro–Wilk test, we foundeight VOCs presenting normal distributions in one (E-2-hexenylacetate, nonanal, 6-pentyl-α-pyrone, γ-decalactone, γ-dodecalactone, eugenol, unidentified1, and unidentified2) orboth years (E-β-damascenone); therefore, we decided to analyzeQTLs using both interval mapping (IM) and the non-parametricKruskal–Wallis rank-sum test (K-W). A QTL was consideredsignificant when presented LOD >3 in the IM or a stringentsignificance level of p<0.005 in the K-Wanalysis, as suggestedby Van Ooijen (2009). In one case, we also considered a QTLthat showed significance in one year and levels very close tosignificance in the other year (e.g., the phenylacetaldehyde QTLdetected on linkage group B6 in year 2008 with LOD 2.63). Inthe present study, a major QTL is defined as explaining morethan 20 % of the phenotypic variability in both years.
Candidate gene mapping
SNPs were identified in the sequences of the candidate genesbased on B and O genomic resequencing information (Inter-national PeachGenome Initiative, The genome sequence of
peach, a key diploid tree species, reveals unique patterns ofgenetic diversity, domestication and genome evolution, unpub-lished). SNPs identified in the terpene synthases candidategenes ppa003380m and ppa002670m were genotyped usingKASPar technology (KBiosciences, UK) and integrated intoBxO genetic maps (B, O, and BxO). SNP assays weredesigned by KBioscience (UK) and genotyping was carriedout at the PTP Genomics Platform following the standardKASPar protocol on an ABI 7900 Real Time PCR system(Applied Biosystems, Italy).
Phylogenetic analysis of peach LOX proteins
Peach protein sequences annotated as lipoxygenases in thepeach genome were downloaded from the Phytozome data-base (http://www.phytozome.org). LOX protein sequencesfrom other plant species were retrieved from Han et al.(2011). Multiple protein sequence alignment and phyloge-netic analysis was performed using MEGA4.0 software(http://www.megasoftware.net/).
Results
Linkage maps
Out of 8,144 SNPs from the 9,000 peach array, 2,744 did notpass the filtering criteria and 3,652 were homozygous in bothparents; therefore, they were discarded from the analysis. Atotal of 1,453 SNPs in B, 229 SNPs in O, and 66 SNPs in bothB and O were detected as heterozygous. We combined thisdataset with the available genotypes of the SSR markersdescribed in Eduardo et al. (2011), and with the genotypesobtained for the four SNPs from the terpene synthases candi-date genes ppa003380m and ppa002670m. Preliminary link-age analysis showed a very high number of markers thatcosegregated in clusters. To reduce the datasets (B, O,and BxO) for QTL analysis, we included in the finalmaps one marker for each cluster. The selected datasetsrecover the maximum number of recombination eventsthat could be detected with the available genotypes.
The B, O, and BxO linkage maps are reported in Supple-mentary Materials (SM1). The B map is composed of 231markers distributed in nine linkage groups (B1.1, B1.2, B2,B3, B4, B5, B6, B7, and B8) spanning a total genetic distanceof 405 cM and covering 67 % of the physical distance of thepeach genome (scaffolds 1 to 8). The groups B1.1 andB1.2 bothcorrespond to G1 from the Prunus reference map, but it was notpossible to integrate them in the same group. Interestingly, in thecase of B3, there were two SSR markers segregating, while noSNPs could be found. The two SSR markers that form the B3map,MA031 andAMPA101, are located in scaffolds 14 and 10,respectively, in the peach genome sequence.
Tree Genetics & Genomes

The O map is composed of 87 markers distributed in fivelinkage groups (O1, O2, O3, O5, and O7) spanning a totalgenetic distance of 228.5 cM and covering 17 % of thephysical distance of the peach genome (scaffolds 1 to 8). Noheterozygous markers were found for linkage groupscorresponding to G4, G6, and G8 of thePrunus reference map.
The BxO map is composed of 123 markers distributed inthree linkage groups (BxO2, BxO5, and BxO7) spanning agenetic distance of 199.6 cM and covering 27 % of thephysical distance of the peach genome (scaffolds 1 to 8).Given the availability of only two markers segregating inboth parents (one SSR and a cluster of SNPs), B1 and O1maps could not be properly integrated.
In general, marker order was in agreement with the peachgenome sequence v1.0 (www.rosaceae.org) with few excep-tions. We only found ten small inversions of adjacent SNPmarkers and two SNPmarkers located in B2 (IGA_461045 andIGA_458918) that are physically located on scaffold 4 in thepeach genome. In the case of the latter two SNPs, this incon-sistency is explained by a mis-assembly in the peach genomesequence (International PeachGenome Initiative, The genomesequence of peach, a key diploid tree species, reveals uniquepatterns of genetic diversity, domestication and genome evolu-tion, unpublished).
Compared to the SSR-based maps previously producedfor the BxO cross (Eduardo et al. 2011), these newly con-structed linkage maps considerably increase marker satura-tion and genome coverage, providing an ideal basis for QTLdissection in this intraspecific population.
Distribution and correlations of fruit VOCs in two parentsand in their F1 progeny
In this paper, we focus our analysis on 23 fruit VOCs thatcould be identified in both years of analysis (2007 and 2008)and representing high-impact compounds in peach. FifteenVOCs, hexyl acetate, Z-3-hexenyl acetate, nonanal, γ-octalactone, 6-pentyl-α-pyrone, γ-decalactone, δ-decalactone, γ-dodecalactone, 3-methylbutanoic acid, benzal-dehyde, phenylacetaldehyde, eugenol, linalool, E-β-damascenone,β-ionone, and E,E-2,4-decadienal, have alreadybeen described as high-impact compounds in peach due totheir OAV (Eduardo et al. 2010). Eight more VOCs, E-2-hexenyl acetate, E-3-nonen-2-one, chavicol, p-menth-1-en-9-al, squalene, unidentified1, and unidentified2, were included inthe analysis, since their odor thresholds were not available andOAVs could not be estimated and they could not be excludedas high-impact compounds participating to peach aroma.
Levels of VOCs in 2007mature fruit of the parents B andO,as well as the 2007 and 2008 mean, maximum, minimum, andstandard deviations of 126 seedlings of the BxO F1 progeny,are reported in Supplementary Materials (SM2). In 2008, fruitsfrom O were not available, but data from 2007 indicate a large
variation in VOC values between parents. For example, 3-methylbutanoic acid was two orders of magnitude higher inB (3,550.4 μg/kg of fresh weight) compared to O (31.3 μg/kgof fresh weight). Similar values between parents were foundfor hexyl acetate, nonanal, γ-octalactone, and benzaldehyde,with differences lower than 25%. In the F1 progeny, esters andcompounds derived from leucine and phenylalanine were low-er in 2008, while C9 compounds, γ-dodecalactone and β-ionone, were higher. Correlation of the concentrations of thesame VOCs between years was low (Table 1), with onlynonanal and linalool showing significant r values (Spearman)of 0.29 and 0.40, respectively. p-Menth-1-en-9-al also showeda positive, although not significant, value of 0.23.
Correlations between different VOCs were significant inboth years for several compounds. This was the case for thethree esters, hexyl acetate, Z-3-hexenyl acetate, and E-2-hexenyl acetate. Nonanal values were correlated with thoseof linalool and p-menth-1-en-9-al. E-3-nonen-2-one was cor-related with lactones (except δ-decalactone), chavicol, and E,E-2,4-decadienal. Lactones concentrations were correlatedwith each other, as well as with those of chavicol, E,E-2,4-decadienal, and two unidentified compounds. 3-Methylbutanoic acid correlated with chavicol and β-iononevalues, while chavicol with E,E-2,4-decadienal and the un-identified number 1. The concentrations of the two unidenti-fied compounds were highly correlated with each other.
The distribution of concentration values of each VOC inthe F1 progeny was similar in the 2 years (2007 data arereported in Fig. 1). The distribution of concentration valuesin the F1 progeny was different depending on the VOC con-sidered: some VOCs were present in all progenies, e.g., nona-nal, while others were found only in some seedlings, such aslinalool. Furthermore, VOCs with a bimodal distribution werenoted (the case of p-menth-1-en-9-al), while others, as benz-aldehyde and nonanal, had a distribution skewed towards lowor high values.
In the same year, transgressive segregation, i.e., proge-nies with values not included in the interval defined by thetwo parents, was observed for all VOCs, except for δ-decalactone and 3-methylbutanoic acid.
QTL analysis
A total of 72 QTLs were detected using IM and K-W analysison the three maps B, O, and BxO (Table 2). When QTLs for aspecific VOC were detected in the same chromosomal regions(with overlapping confidence intervals) in both years, theywere considered to coincide. On this basis, the initial 72 QTLscan be summarized into 43 unique QTLs for 23 differentVOCs: among them 29 (>67 %) were consistent over the2 years of phenotypic analysis and 14 were evident only in 1of the 2 years. Between one and four QTLs were detected foreach VOC. Out of the total 72 QTLs, 40 were detected with
Tree Genetics & Genomes

Tab
le1
Spearman’srank
correlations
p<0.
001
hexyl acetate
Z-3-hexenyl acetate
E-2-hexenyl acetate
nonanal
E-3-nonen-2-one
γ-octalactone
6-pentyl-α-pyrone
γ-decalactone
δ-decalactone
γ-dodecalactone
3-methylbutanoic acid
benzaldehyde
phenylacetaldehyde
eugenol
chavicol
linalool
p-menth-1-en-9-al
E-β-damascenone
squalene
β-ionone
E,E-2,4-decadienal
unidentified1
unidentified2
hexy
l ace
tate
0,14
0,86
0,97
0,07
-0,2
2-0
,08
0,13
0,07
0,39
0,28
0,02
0,48
0,41
0,22
-0,1
90,
090,
140,
110,
090,
27-0
,09
-0,0
1-0
,05
Z-3
-hex
enyl
ace
tate
0,73
0,09
0,86
0,21
-0,1
1-0
,03
0,18
0,14
0,35
0,33
-0,0
50,
380,
330,
18-0
,08
0,07
0,08
0,10
0,20
0,35
-0,1
20,
090,
06
E-2
-hex
enyl
ace
tate
0,80
0,65
0,01
0,05
-0,2
4-0
,14
0,08
-0,0
30,
370,
250,
010,
420,
420,
22-0
,21
0,05
0,10
0,16
0,11
0,29
-0,0
9-0
,07
-0,0
8
nona
nal
0,09
0,08
0,04
0,29
0,26
0,29
0,30
0,21
0,19
0,27
-0,0
70,
180,
090,
210,
260,
590,
57-0
,06
-0,0
10,
080,
040,
260,
28
E-3
-non
en-2
-one
-0,1
1-0
,14
-0,3
00,
05-0
,02
0,41
0,35
0,32
0,19
0,35
0,27
0,19
0,00
0,19
0,44
0,10
-0,0
10,
070,
11-0
,08
0,51
0,14
0,14
γ-oc
tala
cton
e-0
,24
-0,0
7-0
,22
0,11
0,50
0,04
0,62
0,61
0,19
0,35
0,24
0,20
0,09
0,25
0,60
0,02
0,06
0,01
0,25
-0,0
20,
480,
350,
22
6-pe
ntyl
-α-p
yron
e0,
030,
17-0
,25
0,11
0,49
0,45
0,10
0,68
0,23
0,40
0,10
0,15
0,16
0,09
0,57
0,07
0,08
0,09
0,25
-0,0
30,
430,
380,
32
γ-de
cala
cton
e-0
,07
-0,0
7-0
,36
-0,0
10,
660,
500,
760,
130,
270,
470,
060,
260,
040,
170,
460,
040,
04-0
,04
0,28
0,13
0,23
0,54
0,41
δ-de
cala
cton
e0,
08-0
,01
-0,2
0-0
,07
0,34
0,26
0,53
0,61
0,01
0,59
0,06
0,34
0,25
0,30
0,14
0,19
0,05
0,10
0,06
0,29
0,31
-0,0
5-0
,03
γ-do
deca
lact
one
-0,1
4-0
,13
-0,3
50,
020,
710,
580,
690,
820,
520,
120,
200,
370,
230,
310,
410,
050,
100,
190,
320,
160,
350,
220,
25
3-m
ethy
lbut
anoi
c ac
id0,
010,
01-0
,18
-0,1
20,
260,
240,
480,
510,
520,
330,
030,
230,
430,
160,
32-0
,21
-0,0
20,
310,
18-0
,32
0,42
-0,0
7-0
,12
benz
alde
hyde
0,23
0,23
0,03
0,19
0,09
0,10
0,06
0,06
0,08
0,08
0,21
0,03
0,38
0,54
0,01
0,21
0,14
0,05
0,02
0,16
0,13
0,05
0,03
phen
ylac
etal
dehy
de0,
080,
10-0
,09
-0,0
10,
07-0
,01
0,26
0,20
0,43
0,15
0,29
0,23
0,04
0,33
0,12
-0,0
10,
080,
250,
130,
000,
12-0
,27
-0,3
2
euge
nol
0,21
0,20
0,17
0,16
-0,0
20,
530,
240,
210,
280,
160,
260,
290,
100,
080,
150,
190,
200,
020,
050,
260,
150,
130,
11
chav
icol
-0,2
6-0
,07
-0,4
2-0
,03
0,58
0,57
0,73
0,70
0,53
0,70
0,34
0,02
0,11
0,12
0,09
-0,0
80,
000,
180,
20-0
,16
0,56
0,29
0,25
lina
lool
0,17
0,20
0,13
0,67
0,11
0,15
0,10
-0,0
6-0
,17
-0,0
4-0
,07
0,33
-0,0
10,
20-0
,06
0,40
0,70
-0,3
0-0
,16
0,20
-0,1
00,
050,
08
p-m
enth
-1-e
n-9-
al0,
130,
160,
060,
640,
190,
250,
290,
130,
140,
080,
100,
230,
070,
270,
210,
790,
23-0
,22
-0,0
80,
01-0
,09
0,16
0,14
E-β
-dam
asce
none
0,11
0,18
0,18
0,23
-0,1
9-0
,01
0,06
-0,0
80,
060,
00-0
,01
0,06
0,16
0,16
0,01
0,06
0,03
-0,0
50,
15-0
,21
0,27
-0,0
4-0
,10
squa
lene
-0,0
7-0
,01
-0,2
90,
090,
310,
260,
570,
590,
440,
440,
480,
080,
320,
260,
39-0
,01
0,11
0,15
0,02
0,25
0,19
0,21
0,18
β-io
none
0,01
0,01
-0,1
5-0
,04
0,36
0,39
0,63
0,67
0,64
0,57
0,40
-0,1
00,
200,
240,
63-0
,13
0,21
0,06
0,39
0,00
-0,1
80,
080,
11
E,E
-2,4
-dec
adie
nal
-0,0
10,
15-0
,11
0,01
0,35
0,49
0,53
0,40
0,45
0,45
0,26
0,15
0,23
0,28
0,61
-0,0
10,
100,
210,
250,
550,
050,
050,
01
unid
entif
ied1
-0,0
20,
060,
020,
090,
200,
520,
500,
390,
130,
410,
13-0
,14
-0,2
30,
270,
510,
110,
290,
170,
190,
470,
400,
130,
89
unid
entif
ied2
0,03
0,09
0,06
0,10
0,16
0,46
0,47
0,36
0,15
0,35
0,11
-0,1
5-0
,25
0,28
0,46
0,09
0,31
0,10
0,18
0,46
0,35
0,96
0,17
Diago
nalinclud
esvalues
correlatingtheconcentrations
ofthefruitVOCsin
theBxO
prog
enyin
the2yearsof
testing.
Below
andabov
ethediagon
al,respectiv
ely,
repo
rted
the20
07and20
08correlationvalues
betweendifferentVOCs.In
italicsarecorrelations
sign
ificantforp<0.00
1
Tree Genetics & Genomes

nonanal0 50 100 150 200 250 300 350
010
2030
40
Z-3-hexenyl acetate300 400 500 600
05
1015
2025
30
35
BO
E-2-hexenyl acetate300 400 500 600 700 800
05
101
520
B O
hexyl acetate300 400 500 600 700
05
1015
2025
30
BO B O
E-3-nonen-2-one0 20 40 60 80
01
020
30
405
0
B O
6-pentyl- -pyrone-decalactone-decalactone -dodecalactone-octalactone0 100 200 300 400 500
010
2030
40
0 100 200 300 400
010
2030
0 200 400 600 800
05
1015
20
2530
40 60 80 100 120 140 160 180
05
101
520
2530
35
0 50 100 150 200 250
010
2030
4050
BO BO BO BO BO
BO B O B O BO BO
edyhedlatecalynehpdica cionatublyhtem-3 benzaldehyde chavicol eugenol
qy
0 500 1000 1500
010
2030
4050
60
2000 4000 6000 8000 10000 12000
010
2030
4050
60
400 600 800 1000 1200 1400 1600
010
2030
40
100 200 300 400 500 600 700
010
2030
0 10 20 30 40 50 60 70
010
2030
4050
E- -damascenone0 50 100 150 200
010
20
3040
5060
70
qy
0 20 40 60 80 100 120
05
10
1520
2530
0 5 10 15 20 25 30
010
2030
4050
60
0 10 20 30 40 50
010
20
30
40
qy
0 20 40 60 80 100 120
010
2030
40
E,E-2,4-decadienal unidentified10 20 40 60 80
010
20
3040
5060
70
0 10 20 30 40 50
010
2030
0 10 20 30 40 50 60
010
2030
4050
squalenelinalool p-menth-1-en-9-al -ionone
BO BO BO BO BO
BO BO BO
unidentified2
Fig. 1 The distributions of VOCs values quantified in 2007 in maturefruits of the F1 population derived from the cross “Bolero” × “OroA”(BxO) are reported for the 23 VOCs analyzed in this study. Arrowsindicate the position of values detected for the two parents of the cross.
On the vertical axis, the frequency of given class for 119 individuals isreported. VOC concentrations are indicated as micrograms per kilogramof fresh weight
Tree Genetics & Genomes
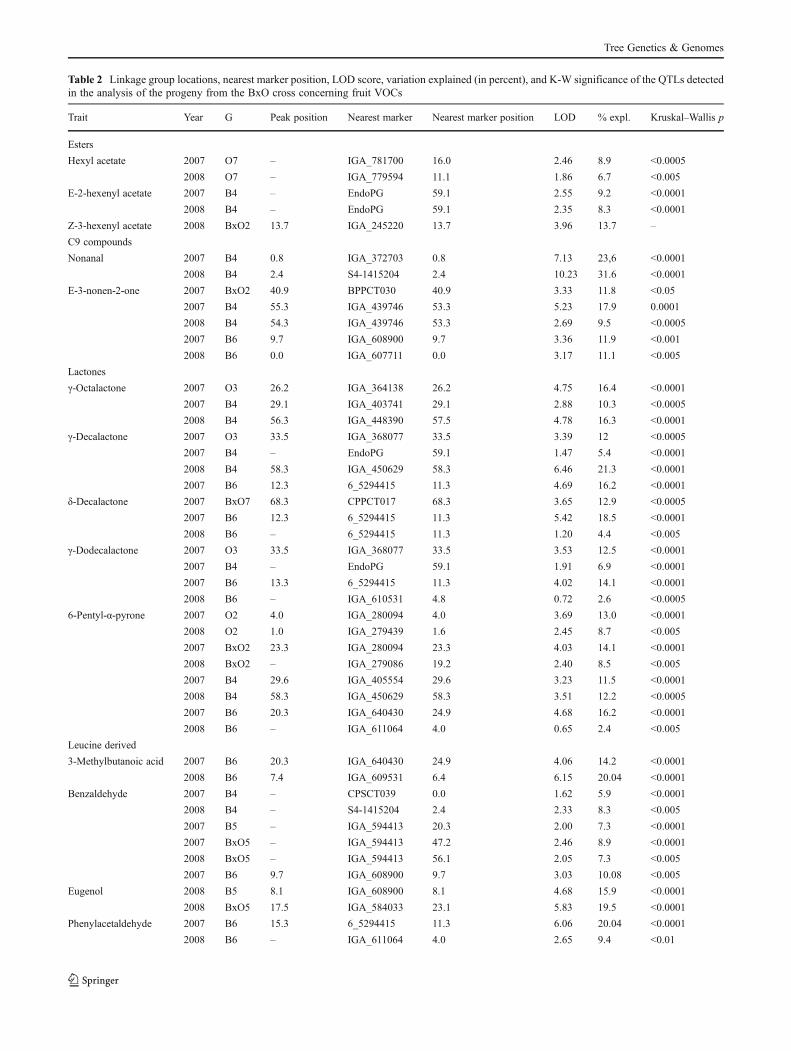
Table 2 Linkage group locations, nearest marker position, LOD score, variation explained (in percent), and K-W significance of the QTLs detectedin the analysis of the progeny from the BxO cross concerning fruit VOCs
Trait Year G Peak position Nearest marker Nearest marker position LOD % expl. Kruskal–Wallis p
Esters
Hexyl acetate 2007 O7 – IGA_781700 16.0 2.46 8.9 <0.0005
2008 O7 – IGA_779594 11.1 1.86 6.7 <0.005
E-2-hexenyl acetate 2007 B4 – EndoPG 59.1 2.55 9.2 <0.0001
2008 B4 – EndoPG 59.1 2.35 8.3 <0.0001
Z-3-hexenyl acetate 2008 BxO2 13.7 IGA_245220 13.7 3.96 13.7 –
C9 compounds
Nonanal 2007 B4 0.8 IGA_372703 0.8 7.13 23,6 <0.0001
2008 B4 2.4 S4-1415204 2.4 10.23 31.6 <0.0001
E-3-nonen-2-one 2007 BxO2 40.9 BPPCT030 40.9 3.33 11.8 <0.05
2007 B4 55.3 IGA_439746 53.3 5.23 17.9 0.0001
2008 B4 54.3 IGA_439746 53.3 2.69 9.5 <0.0005
2007 B6 9.7 IGA_608900 9.7 3.36 11.9 <0.001
2008 B6 0.0 IGA_607711 0.0 3.17 11.1 <0.005
Lactones
γ-Octalactone 2007 O3 26.2 IGA_364138 26.2 4.75 16.4 <0.0001
2007 B4 29.1 IGA_403741 29.1 2.88 10.3 <0.0005
2008 B4 56.3 IGA_448390 57.5 4.78 16.3 <0.0001
γ-Decalactone 2007 O3 33.5 IGA_368077 33.5 3.39 12 <0.0005
2007 B4 – EndoPG 59.1 1.47 5.4 <0.0001
2008 B4 58.3 IGA_450629 58.3 6.46 21.3 <0.0001
2007 B6 12.3 6_5294415 11.3 4.69 16.2 <0.0001
δ-Decalactone 2007 BxO7 68.3 CPPCT017 68.3 3.65 12.9 <0.0005
2007 B6 12.3 6_5294415 11.3 5.42 18.5 <0.0001
2008 B6 – 6_5294415 11.3 1.20 4.4 <0.005
γ-Dodecalactone 2007 O3 33.5 IGA_368077 33.5 3.53 12.5 <0.0001
2007 B4 – EndoPG 59.1 1.91 6.9 <0.0001
2007 B6 13.3 6_5294415 11.3 4.02 14.1 <0.0001
2008 B6 – IGA_610531 4.8 0.72 2.6 <0.0005
6-Pentyl-α-pyrone 2007 O2 4.0 IGA_280094 4.0 3.69 13.0 <0.0001
2008 O2 1.0 IGA_279439 1.6 2.45 8.7 <0.005
2007 BxO2 23.3 IGA_280094 23.3 4.03 14.1 <0.0001
2008 BxO2 – IGA_279086 19.2 2.40 8.5 <0.005
2007 B4 29.6 IGA_405554 29.6 3.23 11.5 <0.0001
2008 B4 58.3 IGA_450629 58.3 3.51 12.2 <0.0005
2007 B6 20.3 IGA_640430 24.9 4.68 16.2 <0.0001
2008 B6 – IGA_611064 4.0 0.65 2.4 <0.005
Leucine derived
3-Methylbutanoic acid 2007 B6 20.3 IGA_640430 24.9 4.06 14.2 <0.0001
2008 B6 7.4 IGA_609531 6.4 6.15 20.04 <0.0001
Benzaldehyde 2007 B4 – CPSCT039 0.0 1.62 5.9 <0.0001
2008 B4 – S4-1415204 2.4 2.33 8.3 <0.005
2007 B5 – IGA_594413 20.3 2.00 7.3 <0.0001
2007 BxO5 – IGA_594413 47.2 2.46 8.9 <0.0001
2008 BxO5 – IGA_594413 56.1 2.05 7.3 <0.005
2007 B6 9.7 IGA_608900 9.7 3.03 10.08 <0.005
Eugenol 2008 B5 8.1 IGA_608900 8.1 4.68 15.9 <0.0001
2008 BxO5 17.5 IGA_584033 23.1 5.83 19.5 <0.0001
Phenylacetaldehyde 2007 B6 15.3 6_5294415 11.3 6.06 20.04 <0.0001
2008 B6 – IGA_611064 4.0 2.65 9.4 <0.01
Tree Genetics & Genomes

both IM and K-W analysis, while three QTLs were onlydetected using IM. A total of 29 QTLs were only detectedusing K-W: of these, 13 had a LOD score in the IM between 2and 3, and 16 had a LOD score in the IM lower than 2. SixQTLs were detected using the integrated BxO map but not inthe B and O parental maps. QTLs were mapped to linkagegroups 4, 5, 6, and 7 on the B map; 2, 3, and 7 on the O map;and 2, 5, and 7 on the BxO map (Fig. 2). Most of them (52)were detected using the B map, 8 using the O map, and 12using the BxO map.
QTLs in the B map were grouped in three main clusters.The first cluster is located at the beginning of B4, where majorQTLs for nonanal (belonging to the aldehyde class), linalool,and p-menth-1-en-9-al (belonging to the terpene class) wereidentified in both years. Also in this cluster, a minor QTL forbenzaldehyde was identified in both years, but significant inK-Wanalysis only. The second cluster is located at the end ofB4, where QTLs were identified for one ester (E-2-hexenylacetate), one C9 compound (E-3-nonen-2-one), four lactones
(γ-octalactone, γ-decalactone, γ-dodecalactone, and 6-penthyl-α-pyrone), one phenylalanine-derived compound(chavicol), one terpenic compound (E-β-damascenone), andthe two unidentified compounds. All of them were detected inboth years except for γ-dodecalactone. The third cluster ofQTLs is located in B6, where QTLs were detected for one C9compound (E-3-nonen-2-one), four lactones (γ-decalactone,δ-decalactone, γ-dodecalactone, and 6-penthyl-α-pyrone),one leucine-derived compound (3-methylbutanoic acid),three phenylalanine-derived compounds (benzaldehyde,phenylacetaldehyde and chavicol), one terpenic com-pound (squalene), and one C13 norisoprenoid (β-ionone)and E,E-2,4-decadienal. All of them were detected inboth years except for γ-decalactone, benzaldehyde, squa-lene, and β-ionone. Also in the B map, a repeatable QTLfor phenylacetaldehyde was detected at the very south ofB7 and three minor QTLs detected only in 1 year, onefor β-ionone in B7 and two in B5 for benzaldehyde andeugenol.
Table 2 (continued)
Trait Year G Peak position Nearest marker Nearest marker position LOD % expl. Kruskal–Wallis p
2007 B7 – pchgms25 54.9 2.13 7.7 <0.001
2008 B7 43.2 IGA_789447 43.2 3.67 12.7 <0.01
2007 BxO7 72.8 IGA_791930 72.8 3.21 11.4 <0.001
2008 BxO7 63.6 IGA_789447 62,6 4.91 16.7 <0.0001
Chavicol 2007 O3 31.9 IGA_366233 31.9 4.01 14.1 <0.0001
2007 B4 59.1 EndoPG 59.1 3.28 11.7 <0.0001
2008 B4 53.3 IGA_439746 53.3 3.86 13.4 <0.0001
2007 B6 9.4 IGA_608900 9.7 3.65 12.9 <0.0001
2008 B6 – IGA_607711 0.0 1.12 4.1 <0.005
Terpenic compounds
Linalool 2007 B4 0.8 IGA_372703 0.8 16.35 46.1 <0.0001
2008 B4 2.4 S4-1415204 2.4 10.02 31.1 <0.0001
p-Menth-1-en-9-al 2007 B4 0.8 IGA_372703 0.8 30.98 68.9 <0.0001
2008 B4 3.4 S4-1415204 2.4 20.29 52.9 <0.0001
E-β-damascenone 2007 B4 – IGA_530079 60.7 1.88 6.9 <0.0005
2008 B4 42.9 IGA_414017 42.9 6.57 21.6 <0.0001
2007 BxO7 – IGA_711368 3.2 1.41 5.2 <0.001
2008 BxO7 28.6 IGA_776067 28.6 3.01 10.6 <0.0005
Squalene 2007 B6 14.3 6_5294415 11.3 4.25 14.8 <0.0001
C13 norisoprenoids
β-ionone 2007 B6 – IGA_608900 9.7 1.75 6.4 <0.0005
2007 B7 – IGA_791930 57.3 1.73 6.3 <0.001
Miscellaneous
E,E-2,4-decadienal 2007 B6 – IGA_608900 9.7 0.5 1.9 <0.005
2008 B6 – IGA_608900 9.7 2.82 9.9 <0.0001
Unidentified1 2007 B4 IGA_439746 53.3 1.34 4.9 <0.005
2008 B4 59.1 EndoPG 59.1 3.98 13.7 <0.0001
Unidentified2 2007 B4 – IGA_422191 47.7 0.88 3.3 <0.005
2008 B4 47.7 IGA_422191 47.7 4.65 15.9 <0.0001
VOCs are classified by chemical class
Tree Genetics & Genomes

CPSCT0390,0IGA_3727030,8IGA_3762381,6S4-14152042,4IGA_3814654,0IGA_3819674,8IGA_3830805,6IGA_3842446,4IGA_3847918,0IGA_3858998,8IGA_3862229,6IGA_38719813,8IGA_38979615,4IGA_39069416,2IGA_39552918,6IGA_39680419,4IGA_39716520,2IGA_39822821,0IGA_40026021,8IGA_40182923,4IGA_40225624,2IGA_40245625,0UDP96-00326,6IGA_40335327,4IGA_40374129,1IGA_40555429,9IGA_40590030,7IGA_40805933,1IGA_40850534,7IGA_40945335,5UDP97-40239,6IGA_41119641,3IGA_41163742,1IGA_41401742,9IGA_41538243,7IGA_41733644,5IGA_41834145,3AMPA10346,9IGA_42219147,7IGA_43716850,1IGA_43751651,7IGA_43810852,5IGA_43974653,3IGA_44839057,5IGA_45062958,3EndoPG59,1IGA_53007960,7IGA_54067862,3IGA_54080463,1
E-2-hexenylacetate-2007*******
E-2-hexenylacetate-2008*******
nonanal-2007*******
nonanal-2008*******E
-3-nonen-2-one-2007*******
E-3-nonen-2-one-200
8******
g-octalactone-2007******
g-octalactone-2008*******
g-decalactone-2007*******
g-decalactone-2008*******
g-dodecalactone-2007*******
6-pentyl-a-pyrone-2007*******
6-pentyl-a-pyrone-2008******
benzaldehyde-2007*******
benzaldehyde-2008****
chavicol-2007*******
chavicol-2008*******
linalool-2007*******
linalool-2008*******
p-Menth-1-en-9-al-2
007*******
p-Menth-1-en-9-al-20
08*******E
-b-damascenone-2007******
E-b-dam
ascenone-2008*******
unidentified1-2007****
unidentified1-2008*******
unidentified2-2007****
unidentified2-2008*******
B4
IGA_5840330,0IGA_5843151,6IGA_5858102,4IGA_5860434,0IGA_5862254,8
IGA_5874508,1IGA_5865238,3IGA_5877089,2IGA_58783210,5IGA_58886611,3IGA_59274113,3BPPCT01715,4IGA_59332017,0IGA_59348517,8IGA_59387418,0IGA_59441320,3IGA_59474521,9IGA_59464723,2IGA_59479624,7
CPDCT02828,5
IGA_59512632,5
IGA_59861536,1IGA_59886536,9IGA_59965839,3IGA_59999840,1IGA_60016940,9IGA_60025641,7IGA_60051743,3
Prp245,8
benzaldehyde-2007*******
eugenol-2008*******
B5
IGA_7243090,0IGA_7225750,8IGA_7215641,6IGA_7128282,4IGA_7113683,2IGA_7486374,0IGA_7504324,8
IGA_75881910,7
IGA_76061513,1
IGA_76253816,4IGA_76331117,2IGA_76391018,8UDP98-40819,3IGA_76884319,6IGA_76908420,4IGA_77000921,2IGA_77168424,5IGA_77455725,3IGA_77518126,1IGA_77606729,1IGA_77779829,4IGA_77813830,2IGA_77927631,8
CPPCT03335,9
IGA_78275040,9IGA_78367741,7IGA_78488942,5IGA_78544744,1
IGA_78706447,4IGA_78881149,0
pchgms2554,9CPPCT01755,7IGA_79150456,5pchgms21a56,9IGA_79193057,3
phenylacetaldehyde-2007*****
phenylacetaldehyde-2008***
b-ionone-2007*****
B7
IGA_2790860,0IGA_2794391,6IGA_2797192,4IGA_2800944,0IGA_2807555,6
IGA_2811288,9IGA_2812669,7
IGA_28267117,9IGA_28188118,5
IGA_28358121,3
IGA_28633523,3
6-pentyl-a-pyrone-2007*******
6-pentyl-a-pyrone-2008****
O2
IGA_3498610,0
IGA_35903511,6IGA_35872612,4IGA_35988114,03_1827022914,8IGA_36065815,6
IGA_36124720,6IGA_36272323,0IGA_36306023,8IGA_36340824,6IGA_36413826,2IGA_36460127,0IGA_36477728,6IGA_36564730,3IGA_36623331,9IGA_36760432,7IGA_36807733,5
g-octalactone-2007*******
g-decalactone-2007******
g-dodecalactone-2007*******
chavicol-2007*******
O3
IGA_7760670,0
IGA_77938610,3IGA_77959411,1CPPCT03312,7
IGA_78170016,0
IGA_78334225,6
pchcms233,3IGA_78667634,1IGA_78713435,8
IGA_78927940,8IGA_78935342,4IGA_78944743,2IGA_78982745,7IGA_78994147,3IGA_79018648,1IGA_79046948,9
pchgms21a53,8IGA_79287755,0
Hexylacetate-2007******
Hexylacetate-2008****
O7
IGA_6077110,0IGA_6184171,6IGA_6149353,2IGA_6110644,0IGA_6105314,8IGA_6095316,4
IGA_6089009,76_529441511,3
IGA_64043024,9IGA_64092826,5
IGA_67522943,4
IGA_68273547,5UDP02148,3
IGA_68289751,6
IGA_68396854,9IGA_68515855,7IGA_68646357,3IGA_68810358,1IGA_69172758,9IGA_69290859,7
E-3-nonen-2-one-2007*****
E-3-nonen-2-one-2008****
g-decalactone-2007*******
d-decalactone-2007*******
d-decalactone-2008****
g-dodecalactone-2007*******
g-dodecalactone-2008******
6-pentyl-a-pyrone-2007*******
6-pentyl-a-pyrone-2008****
3-methylbutanoicacid-2007*******
3-methylbutanoicacid-2008*******
benzaldehyde-2007****
phenylacetaldehyde-2007*******
phenylacetaldehyde-2008***
chavicol-2007*******
chavicol-2008****
squalene-2007*******
b-ionone-2007******
E,E
-2,4-decadienal-2007****
E,E
-2,4-decadienal-2008*******
B6
Fig. 2 QTL location. Map loca-tion of fruit VOC QTLs detectedin the BxO progeny determinedusing K-W and IM (2007 and2008 data). Genetic distances (incentimolar) and markers namesare shown, respectively, on theleft and on the right of eachlinkage group. Linkage groupsaccording to the nomenclature ofPrunus chromosomes are indi-cated on the top specifying theparent genotype (B for Bolero, Ofor OroA). QTLs are representedby block vertical bars positionedat the left of each linkage group.Thin lines correspond to LOD-2and black bars to LOD-1 confi-dence interval. The asteriskmarks the K-W significance.Only linkage groups with QTLsare presented. VOCs names arethe same used in the text or inthe tables and are followed bythe year in which they weredetected
Tree Genetics & Genomes

In the O map, repeatable QTLs were detected for 6-penthyl-α-pyrone in O2 and for hexyl acetate in O7. QTLswere detected in O3 for γ-octalactone, γ-decalactone, γ-dodecalactone, and chavicol, but only for 1 year.
In the BxO map, repeatable QTLs were detected for 6-penthyl-α-pyrone in BxO2, for benzaldehyde in BxO5, andfor phenylacetaldehyde and for E-β-damascenone in BxO7.Non-repeatable QTLs were detected in BxO2 for Z-3-hexenylacetate and E-3-nonen-2-one, in BxO5 for eugenol and inBxO7 for δ-decalactone.
Candidate genes and QTL collocations
The detected QTLs were compared to the map position offruit quality and aroma-related genes present in the Prunusreference map (Illa et al. 2011) and annotated in the peachgenome sequence (www.rosaceae.org) to identify potentialcandidate genes.
We identified two terpene synthases (ppa002670m andppa003380m) located in tandem within 7 kb of each otheron scaffold 4 and potentially involved in the major QTLs forlinalool and p-menth-1-en-9-al. In addition, a lipoxygenase(Lox) gene (ppa001082m) was identified as putatively impli-cated in the major QTL for nonanal at the beginning of G4.The reader is referred to the “Discussion” for further detailsregarding terpene synthase and Lox genes as candidates.
To obtainmore evidence for these collocations, we searchedfor SNPs in candidate gene sequences, using B and O genomicresequencing information (International PeachGenome Initia-tive, The genome sequence of peach, a key diploid tree species,reveals unique patterns of genetic diversity, domestication andgenome evolution, unpublished). Two SNPs in each terpenesynthase candidate genewere identified, genotyped in the BxOpopulation, and included in the map dataset. Three out of thefour SNPs mapped (SNPs S4_1420538 and S4_1420689 inppa002670m; SNP S4_1413937 in ppa003380m) caused ami-no acid variation in the N-terminal region of the proteinsequence. Positions, allele variations, annotations, and aminoacid changes of the SNPs are reported in SupplementaryMaterials (SM3). QTL analysis supports the possible involve-ment of these terpene synthase genes in controlling linaloolaccumulation, as they both co-map with the QTL peak(Table 2).
Candidate gene ppa001082m belongs to the Lox multigenefamily. The lypoxigenase pathway has been shown to yieldaldehydes from fatty acids (Schwab et al. 2008). To gain furtherinsight into the possible involvement of this CG in nonanalaccumulation, a phylogenetic analysis of the peach LOX familywas conducted. In the peach genome reference sequence, theLox gene family comprises 15 annotated genes. Phylogeneticanalysis of inferred amino acid sequences along with otherknown plant LOXs grouped seven and eight peach Lox geneswithin the 13-LOX and 9-LOX groups, respectively. Results
are reported in Supplementary Materials (SM4). Peach LOXppa001082m, ppa001085m, ppa001064m, and ppa000968m,ppa001634m, ppa001631m and ppa001316m clustered withinthe 9-LOX group. Conversely, peach LOXs ppa026489m,ppa001207m, ppa001216m, ppa017962m, ppa001016m,ppa001287m, ppa001293m, and ppa001311m clustered withinthe 13-LOXs group. Hence, the candidate gene ppa001082mwas part of the 9-LOX group. Neither SNPs nor deletion/insertion polymorphisms could be identified in the 5′- and 3′-UTRs, and in the coding sequence of this Lox gene.
Discussion
Linkage mapping
Genotyping with the IPSC 9,000 SNP array has allowed togreatly and efficiently increase saturation and coverage of theSSR-based maps previously developed for the BxO popula-tion (Eduardo et al. 2011). After testing 344 Prunus SSRs,only 81 and 47 were heterozygous in B and O, respectively.The phenomenon of low coverage of the genome and lack ofpolymorphic markers in some linkage groups was interpretedas an indication of extensive genome homozygosity, suggest-ing a case of “identity by descent” within the genomes of Band O (Eduardo et al. 2011). Although there are still somelinkage groups where no markers could be mapped (e.g., inO), the use of SNP markers allowed us to recover the newlinkage group B6 (59.2 cM) and create integratedmaps BxO2,BxO5, and BxO7, which were not present in our previousstudy (Eduardo et al. 2011). Lack of markers on O4, O6, andO8may be due to the already mentioned identity by descent orascertainment biases in the SNPs represented in the array(Nielsen et al. 2004; Albrechtsen et al. 2010). Availability ofgenomic resequencing information from B and O (Interna-tional Peach Genome Initiative 2012) will help to discriminatebetween these possibilities.
In some cases, we found regions covered by SSR markersand not by SNPs and vice versa. For example, two SSRs weremapped on B3, but no SNPs were positioned on this linkagegroup. These SSRs (MA031a, AMPA101) were previouslyassigned to linkage group 3 by genetic mapping (Howad etal. 2005; Dirlewanger et al. 2004b), and in the peach genomesequence they are associated to scaffolds 10 and 14. In thepeach 9,000 SNP array, there are only 19 SNPs that are notlocated in the eight main scaffolds corresponding to the eightchromosomes (Verde et al. 2012). These considerations mayhelp to explain the particular situation of B3. In the case of thedistal part of BxO5, coverage with SSR markers only mayreflect the ascertainment bias of the SNP panel used for thepeach 9,000 array. Surprisingly, the map of linkage group B6includes a high number of SNPs, but only one SSR. Here again,genomic resequencing information fromB and O (International
Tree Genetics & Genomes

PeachGenome Initiative, The genome sequence of peach, a keydiploid tree species, reveals unique patterns of genetic diversity,domestication and genome evolution, unpublished)may help tounderstand the distribution of polymorphisms along this link-age group and the lack of coverage from SSR markers. Inconclusion, the use of both SNP and SSR markers seemsappropriate to obtain maximum coverage in peach intraspecificmaps.
Peach fruit VOCs correlations, segregation, and QTL analysis
Statistical analyses of fruit VOC levels revealed low correla-tions of VOC values between years, a variety of patterns ofinheritance, a number of VOCs presenting transgressive seg-regation in the progenywith respect to the parents, major QTLsfor some VOCs, and clustering of QTLs underpinning VOCsfrom the same chemical family. Similar observations have beenreported in apple (Dunemann et al. 2009; Rowan et al. 2009b),strawberry (Olbricht et al. 2008; Zorrilla-Fontanesi et al. 2012),rose (Spiller et al. 2010), and in non Rosaceae species, such astomato (Tadmor et al. 2002; Zanor et al. 2009), grape (Doligezet al. 2006), and eucalypt (O’Reilly-Wapstra et al. 2011).
The low correlations observed for fruit VOC concentrationsbetween years are consistent with previous reports and mostprobably reflect the high variation in environmental conditionsof the field. Dunemann et al. (2009) showed that apple parentalcultivars had varying quantities of VOCs in three consecutiveyears. In strawberry, someVOCswere highly variable depend-ing on the time of harvest, while others were constant (Olbrichtet al. 2008). Despite this year-to-year variability, >67 % of theQTLs in the present studywere recovered in both years. This isin line with results recently reported for a similar study instrawberry, where 50 % of QTLs were reproducible over 2or 3 years of phenotypic analysis (Zorrilla-Fontanesi et al.2012). The fact that correlations are low, but significant, isdue to the fact that although there are some individuals thatpresent very different phenotypes in the different years, mostof the individuals present a correlation strong enough to pro-duce significant QTLs. A possible explanation for this is thatdifferent individuals are affected by the environment in differ-ent ways indicating the presence of GxE interaction. Anotherpossible explanation is that there are small QTLs that are onthe limit of detection, and depending on environmental effects,they are significant in 1 year and not in the other.
Interestingly, a significant correlation was found betweendifferent VOCs from the same biochemical pathway in bothyears. For example, the three esters, hexyl acetate, Z-3-hexenyl acetate, and E-2-hexenyl acetate, all deriving fromthe lipoxygenase pathway (Schwab et al. 2008), showed sig-nificant pairwise correlations in 2007 and 2008. Lactones werealso correlated with each other. Although the pathway or theenzymes involved in the biosynthesis of lactones have notbeen clarified (Schwab et al. 2008), a role for epoxide
hydrolases has been proposed (Schottler and Boland 1996)suggesting that a common mechanism may underlie the syn-thesis of these compounds. The concentrations of the twounidentified compounds were also highly correlated: consid-ering their highly similar mass spectra (Eduardo et al. 2010)and their slight difference in elution time, it is likely they areisomers. The correlations are consistent with the existence offew genomic regions controlling the levels of most of theinvestigated VOCs and with the clustering of QTLs for thesame compound class. A similar pattern has been observed inapple and was explained as the result of tight linkage betweendistinct loci or pleiotropic effects of a single locus (Dunemannet al. 2009). Clustering of QTLs controlling VOCs with sim-ilar chemical structure was also found in Arabidopsis (Lisec etal. 2008), tomato (Zanor et al. 2009), and very recently instrawberry (Zorrilla-Fontanesi et al. 2012). In our case, itremains to be established whether the observed QTL clusterscorrespond to a tight linkage between distinct loci, to genesacting upstream in the respective VOC metabolic pathways orare due to other pleiotropic effects. For example, the QTLsdetected at the south end of the linkage group 4 could be due topleiotropic effects of a major maturity date QTLmapped in thesame position as it has been proposed for other fruit qualitytraits (Eduardo et al. 2011).
Transgressive segregation was common for the VOCs an-alyzed except for δ-decalactone and 3-methylbutanoic acid. Intomato, transgressive segregation was also observed for VOCsbut not for primary metabolites (Zanor et al. 2009). The varietyof patterns of inheritance found in this work was also describedin VOC analyses in strawberry (Olbricht et al. 2008; Zorrilla-Fontanesi et al. 2012) and apple (Dunemann et al. 2009). Thecase of linalool, where approximately 50 % of the individualsaccumulate no linalool or very low levels (less than 10 % ofthe maximum value), was interpreted as the result of mixedqualitative and quantitative inheritance. In species as Menthaand Thymus, it has been suggested that monoterpene compo-sition was influenced by a combination of Mendelian inheri-tance and complex epistatic interactions, and in other species,major gene control was suggested for different terpenes(O’Reilly-Wapstra et al. 2011). Similarly, mixed qualitativeand quantitative inheritance was proposed by other authors forthe genetic control of external color of peach fruit, whenconsidering some progenies segregating 1:1 for partial red orno red to full red (Beckman and Sherman 2003; Beckman et al.2005) and others with a 3:1 segregation. These results could beinterpreted as deriving from the segregation of a single gene.This could also be the case for the major linalool QTL on B4,as individuals that were homozygous for the closest markershowed no linalool or very low levels of it. Thus, a locusmapping in the distal region of linkage group 4 is proposedto control presence or absence of linalool and additional ge-netic and/or environmental factors condition variation of con-centration among linalool-producing seedlings.
Tree Genetics & Genomes
Collocation of major QTLs and candidate genes
Linalool is an acyclic alcohol monoterpene contributing tothe aroma of fruits and leaves of several plant species,including citrus fruits (Kelebek and Selli 2011; Eduardo etal. 2010). In peach, the presence of linalool can discriminatepeach cultivars by their origin (Wang et al. 2009). In thiswork, a major QTL for linalool was detected in the distalpart of linkage group 4. In this same region, two terpenesynthases have been identified cosegregating with this QTL.Despite the substantial degree of amino acid sequence sim-ilarity among plant monoterpene and sesquiterpene syn-thases, similarity may depend more on taxonomic affinitiesof the species from which the gene was isolated rather thanfrom the type of products formed (Degenhardt et al. 2009).Because of this, it is very difficult to predict the finalproduct of a terpene synthase gene simply based on itssequence. Both terpene synthases present in the peach ge-nome scaffold 4 (ppa002670m and ppa003380m) exhibithigh similarities with linalool synthases, but significant lev-els of similarity are also detected with nerolidol, limonene,and 1,8-cineole synthases (data not shown). Linalool syn-thase is a terpene synthase and it was the first floral enzymeresponsible for scent to be isolated and characterized (Csekeet al. 1998). In basil, a 1-bp insertion in the (R)-linaloolsynthase gene, resulting in a frameshift mutation, causesdifferences in the amount and types of terpenes producedby different cultivars (Iijima et al. 2004). Similar resultswere obtained in snapdragon flowers, where two nearlyidentical terpene synthases catalyze the formation of neroli-dol and linalool, respectively (Nagegowda et al. 2008).
p-Menth-1-en-9-al was first isolated in Rosa damascena,and, as other oxygenated p-menthanes, was proposed to be aproduct of the photoxidation of limonene (Overton 1971).Limonene is a cyclic terpene possessing a strong smell oforanges; therefore, both terpene synthases mentioned abovecould also be candidate genes for the major p-menth-1-en-9-alQTL.
Nonanal is an aldehyde reported as an odor active com-pound in orange (Kelebek and Selli 2011). In the same ge-nomic region hosting the monoterpene QTLs in the distal partof linkage group 4, a major QTL affecting nonanal concen-tration collocated with a 9-Lox candidate gene (ppa001082m).LOX activities have been identified in a wide range of organ-isms, tissues, and developmental stages and have been impli-cated in a variety of processes including regulation of plantdevelopment, fruit ripening, plant senescence, disease, andpest resistance (Kolomiets et al. 2001; Zhang et al. 2006;Chen et al. 2004). The role of the LOX pathway in thebiosynthesis of fruit aroma compounds has already beenreported for tomato (Kausch and Handa 1997), olive (Salaset al. 2000), bell pepper (Matsui et al. 1997), apple (Rowan etal. 1999), citrus fruit (Gomi et al. 2003), and strawberry (Perez
et al. 1999). LOX proteins are classified into two groupsdepending on their ability to oxygenate the carbon chain atposition 9 (9-LOX) or 13 (13-LOX). Although the directinvolvement of LOX has not yet been demonstrated in thecase of nonanal production, 9-LOX can use linolenic andlinoleic acids as substrates for the synthesis of structurallysimilar volatile aldehydes, such as 3Z, 6Z-nonadienal(Schwab et al. 2008).
Implication for aroma MAS in peach
The results presented in this paper support the use of MAS forsome VOCs. For example, selection of the appropriate allelicconfigurations of molecular markers at the distal region oflinkage group 4 may assist identification of seedlings lackingor producing linalool and exhibiting higher or lower nonanaland p-menth-1-en-9-al concentrations. However, transferabil-ity of the identified markers to other populations should beverified. Analyses of other crosses segregating for otherVOCs, compared to the ones considered here, will also beimportant for a better understanding of the genetic basis ofpeach fruit aroma. Our results suggest that it will be difficult topredict segregation patterns based on parental concentrationsvalues, although an exception has been reported recently:Brandi et al. (2011) showed that the presence of norisopre-noids depends on carotenoid concentration and is thus asso-ciated with flesh color. VOC QTL analysis could be carriedout in the progeny of a cross between yellow and white fleshcultivars to verify these results. If this is true, efficient MASfor flesh color could also be used to select plants with high orlow levels of norisoprenoids. An additional target is the fur-ther dissection of lactone accumulation. An interesting startingmaterial for this could be the cultivar “Romagna Big” that wasshown to lack lactones in the fruit (Eduardo et al. 2010).
Conclusions
We report for the first time the identification of QTLs forVOCs in peach. To this end, we used the recently de-veloped Illumina 9,000 SNP array platform to producedense genetic maps, substantially increasing genome cov-erage compared to the existing SSR-based maps of theBxO cross (Eduardo et al. 2011). Despite being based ona single biparental population and in spite of the com-plexity of this trait, the results provide a first insight intothe genetic determinants of volatile composition in thisimportant fruit species. Three major QTLs for threedifferent VOCs were mapped in the same chromosomalregion, and candidate genes were identified by analysisof gene annotations from the corresponding genomicsequence. Importance of this region in VOC variationcan be validated analyzing other peach populations and
Tree Genetics & Genomes

germplasm collections and using different techniques forvolatile quantification. These data could open opportuni-ties for aroma MAS in peach. Further work is alsorequired to establish the relevance of linalool, nonanal,and p-menth-1-en-9-al in peach aroma perception. Thesignificance of these and other VOCs could be assessedby means of sensory experiments, using panel tests todetermine their involvement in the perception of peacharoma by humans.
Acknowledgments This work was supported by a grant fromMinistero dell’Istruzione, dell’Università e della Ricerca (MIUR) toPTP (Progetto industriale “Sviluppo di sistemi integrati per la caratter-izzazione, il miglioramento, la selezione e la propagazione di razzeanimali e vegetali. Utilizzazione di sistemi molecolari avanzati per ladiagnostica dei prodotti agrari”) and by an Italian grant to DB funded byprivate and public agencies “MAS.PES: apricot and peach breeding bymolecular-assisted selection”. Construction of the linkage map was partlyfunded under the EU seventh Framework Programme by the FruitBree-domics project no. 265582: “Integrated approach for increasing breedingefficiency in fruit tree crops.” GC was supported by two grants fromMIUR, PRIN project numbers 2005074520, 20074AX5CA. RP wassupported by MIUR FIRB grant RBIP06CTBR. The authors wish tothank C. Buscaroli, L. Castellari, S. Foschi, M. Lama, E. Olivi, and M.Rizzo for technical assistance in field and lab operations, as well as S.Biffani for advice on statistical analyses and F. Salamini, A. Fricano, J. L.Williams for critical reading of the manuscript.
Disclaimer The views expressed in this work are the sole responsibilityof the authors and do not necessarily reflect the views of the EuropeanCommission.
Open Access This article is distributed under the terms of the Crea-tive Commons Attribution License which permits any use, distribution,and reproduction in any medium, provided the original author(s) andthe source are credited.
References
Abbott AG, Rajapakse S, Sosinski B, Lu ZX, Sossey-Alaoui K,Gannavarapu M, Reighard G, Ballard RE, Baird WV, Scorza R,Callahan A (1998) Construction of saturated linkage maps ofpeach crosses segregating for characters controlling fruit quality,tree architecture and pest resistance. Fourth International PeachSymposium 1–2:41–49
Abbott AG, Arús P, Scorza R (2008) Genetic engineering andgenomics. In: Layne DR, Bassi D (eds) The peach: botany,production and uses. CABI, Cambridge, pp 85–105
Agarwal M, Shrivastava N, Padh H (2008) Advances in molecularmarker techniques and their applications in plant sciences. PlantCell Rep 27:617–631
Albrechtsen A, Nielsen FC, Nielsen R (2010) Ascertainment biases inSNP chips affect measures of population divergence. Mol BiolEvol 11:2534–2547
Amarawathi Y, Singh R, Singh AK, Singh VP, Mohapatra T, Sharma TR,Singh NK (2008) Mapping of quantitative trait loci for basmatiquality traits in rice (Oryza sativa L.). Mol Breeding 21:49–65
Aranzana MJ, Pineda A, Cosson P, Dirlewanger E, Ascasibar J,Cipriani G, Ryder CD, Testolin R, Abbott A, King GJ, Iezzoni
AF, Arús P (2003) A set of simple-sequence repeat (SSR)markers covering the Prunus genome. Theor Appl Genet106:819–825
Arús P, Verde I, Sosinski B, Zhebentyayeva T,Abbott AG (2012) The peachgenome. Tree Genet Genomes. doi:10.1007/s11295-012-0493-8
Aubert C, Gunata Z, Ambid C, Baumes R (2003) Changes in physi-cochemical characteristics and volatile constituents of yellow- andwhite-fleshed nectarines during maturation and artificial ripening.J Agr Food Chem 51:3083–3091
Battilana J, Emanuelli F, Gambino G, Gribaudo I, Gasperi F, Boss PK,Grando MS (2011) Functional effect of grapevine 1-deoxy-D-xylulose 5-phosphate synthase substitution K284N on Muscatflavour formation. J Exp Bot 62(15):5497–5508
Beckman TG, Alcazar JR, Sherman WB, Werner DJ (2005) Evidencefor qualitative suppression of red skin color in peach. Hortscience40:523–524
Beckman TG, Sherman WB (2003) Probable qualitative inheritance offull red skin color in peach. Hortscience 38:1184–1185
Blenda AV, Verde I, Georgi LL, Reighard GL, Forrest SD, Munoz-TorresM, Baird WV, Abbott AG (2007) Construction of a genetic linkagemap and identification of molecular markers in peach rootstocks forresponse to peach tree short life syndrome. Tree Genet Genomes3:341–350
Brandi F, Bar E, Mourgues F, Horváth G, Turcsi E, Giuliano G,Liverani A, Tartarini S, Lewinsohn E, Rosati C (2011) Study of‘Redhaven’ peach and its white-fleshed mutant suggests a keyrole of CCD4 carotenoid dioxygenase in carotenoid and noriso-prenoid volatile metabolism. BMC Plant Biol 11:24
Chen GP, Hackett R, Walker D, Taylor A, Lin ZF, Grierson D (2004)Identification of a specific isoform of tomato lipoxygenase (Tom-loxC) involved in the generation of fatty acid-derived flavorcompounds. Plant Physiol 136:2641–2651
Cseke L, Dudareva N, Pichersky E (1998) Structure and evolution oflinalool synthase. Mol Biol Evol 15:1491–1498
Degenhardt J, Köllner TG, Gershenzon J (2009) Monoterpene and ses-quiterpene synthases and the origin of terpene skeletal diversity inplants. Phytochemistry 70:1621–1637
Dettori MT, Quarta R, Verde I (2001) A peach linkage map integratingRFLPs, SSRs, RAPDs, and morphological markers. Genome44:783–790
Dirlewanger E, Pascal T, Zuger C, Kervella J (1996) Analysis ofmolecular markers associated with powdery mildew resistancegenes in peach (Prunus persica (L) Batsch) × Prunus davidianahybrids. Theor Appl Genet 93:909–919
Dirlewanger E, Pronier V, Parvery C, Rothan C, Guye A, Monet R(1998) Genetic linkage map of peach [Prunus persica (L.) Batsch]using morphological and molecular markers. Theor Appl Genet97:888–895
Dirlewanger E, Moing A, Rothan C, Svanella L, Pronier V, Guye A,Plomion C, Monet R (1999) Mapping QTLs controlling fruitquality in peach (Prunus persica (L.) Batsch). Theor Appl Genet98:18–31
Dirlewanger E, Cosson P, Poizat C, Laigret F, Aranzana MJ, Arús P,Dettori MT, Verde I, Quarta R (2003) Synteny within the Prunusgenomes detected by molecular markers. In: Janick J (ed), Geneticsand breeding of tree fruits and nuts, pp 177–187
Dirlewanger E, Graziano E, Joobeur T, Garriga-Caldere F, Cosson P,Howad W, Arús P (2004a) Comparative mapping and marker-assisted selection in Rosaceae fruit crops. P Natl Acad Sci USA101:9891–9896
Dirlewanger E, Cosson P, Howad W, Capdeville G, Bosselut N,Claverie M, Voisin R, Poizat C, Lafargue B, Baron O,Laigret F, Kleinhentz M, Arús P, Esmenjaud D (2004b)Microsatellite genetic linkage maps of myrobalan plum andan almond-peach hybrid-location of root-knot nematode re-sistance genes. Theor Appl Genet 109:827–838
Tree Genetics & Genomes

Doligez A, Audiot E, Baumes R, This P (2006) QTLs for muscat flavorand monoterpenic odorant content in grapevine (Vitis vinifera L.).Mol Breeding 18:109–125
Dunemann F, Ulrich D, Boudichevskaia A, Grafe C, Weber WE (2009)QTL mapping of aroma compounds analysed by headspace solid-phase microextraction gas chromatography in the apple progeny‘Discovery’ x ‘Prima’. Mol Breeding 23:501–521
Dunemann F, Ulrich D, Malysheva-Otto L, Weber WE, LonghiVelasco R, Costa F (2011) Functional allelic diversity ofthe apple alcohol acyl-transferase gene MdAAT1 associatedwith fruit ester volatile contents in apple cultivars. Mol Breeding29:609–625
Eduardo I, Chietera G, Bassi D, Rossini L, Vecchietti A (2010) Iden-tification of key odor volatile compounds in the essential oil ofnine peach accessions. J Sci Food Agr 90:1146–1154
Eduardo I, Pacheco I, Chietera G, Bassi D, Pozzi C, Vecchietti A,Rossini L (2011) QTL analysis of fruit quality traits in two peachintraspecific populations and importance of maturity date pleio-tropic effect. Tree Genet Genomes 7(2):323–335
Etienne C, Rothan C, Moing A, Plomion C, Bodenes C, Svanella-DumasL, Cosson P, Pronier V, Monet R, Dirlewanger E (2002) Candidategenes andQTLs for sugar and organic acid content in peach [Prunuspersica (L.) Batsch]. Theor Appl Genet 105:145–159
Foulongne M, Pascal T, Arús P, Kervella J (2003a) The potential ofPrunus davidiana for introgression into peach [Prunus persica(L.) Batsch] assessed by comparative mapping. Theor Appl Genet107:227–238
Foulongne M, Pascal T, Pfeiffer F, Kervella J (2003b) QTLs forpowdery mildew resistance in peach × Prunus davidiana crosses:consistency across generations and environments. Mol Breeding12:33–50
Gasic K, Han YP, Kertbundit S, Shulaev V, Iezzoni AF, Stover EW,Bell RL, Wisniewski ME, Korban SS (2009) Characteristics andtransferability of new apple EST-derived SSRs to other Rosaceaespecies. Mol Breeding 23:397–411
Gillen AM, Bliss FA (2005) Identification and mapping of markerslinked to the Mi gene for root-knot nematode resistance in peach.J Am Soc Hortic Sci 130:24–33
Gomi K, Yamasaki Y, Yamamoto H, Akimitsu K (2003) Characteriza-tion of a hydroperoxide lyase gene and effect of C6-volatiles onexpression of genes of the oxylipin metabolism in Citrus. J PlantPhysiol 160:1219–1231
Han M, Zhang T, Zhao C, Zhi J (2011) Regulation of the expression oflipoxygenase genes in Prunus persica fruit ripening. Acta PhysiolPlant 33:1345–1352
Henery ML, Moran GF, Wallis IR, Foley WJ (2007) Identification ofquantitative trait loci influencing foliar concentrations of terpenesand formylated phloroglucinol compounds in Eucalyptus nitens.New Phytol 176:82–95
Horvat RJ, Chapman GW, Robertson JA, Meredith FI, Scorza R,Callahan AM, Morgens P (1990) Comparison of the volatilecompounds from several commercial peach cultivars. J Agr FoodChem 38:234–237
Howad W, Yamamoto T, Dirlewanger E, Testolin R, Cosson P, CiprianiG, Monforte AJ, Georgi L, Abbott AG, Arus P (2005) Mappingwith a few plants: using selective mapping for microsatellitesaturation of the Prunus reference map. Genetics 171:1305–1309
Iijima Y, Davidovich-Rikanati R, Fridman E, Gang DR, Bar E,Lewinsohn E, Pichersky E (2004) The biochemical and molecularbasis for the divergent patterns in the biosynthesis of terpenes andphenylpropenes in the peltate glands of three cultivars of basil. PlantPhysiol 136:3724–3736
Illa E, Eduardo I, Audergon JM, Barale F, Dirlewanger E, Li X, MoingA, Lambert P, Le Dantec L, Gao Z, Poëssel JL, Pozzi C, RossiniL, Vecchietti A, Arús P, Howad W (2011) Saturating the Prunus
(stone fruits) genome with candidate genes for fruit quality. MolBreeding 28(4):667–682
Julio E, Denoyes-Rothan B, Verrier JL, de Borne FD (2006) Detection ofQTLs linked to leaf and smoke properties in Nicotiana tabacumbased on a study of 114 recombinant inbred lines. Mol Breeding18:69–91
Kausch KD, Handa AK (1997) Molecular cloning of a ripening-specific lipoxygenase and its expression during wild-type andmutant tomato fruit development. Plant Physiol 113:1041–1050
Kelebek H, Selli S (2011) Determination of volatile, phenolic, organicacid and sugar components in a Turkish cv. Dortyol (Citrussinensis L. Osbeck) orange juice. J Sci Food Agr 91:1855–1862
Koutsos TV, Chatzopoulou PS, Katsiotis ST (2009) Effects of individ-ual selection on agronomical and morphological traits and essen-tial oil of a “Greek basil” population. Euphytica 170:365–370
Kolomiets MV, Hannapel DJ, Chen H, Tymeson M, Gladon RJ (2001)Lipoxygenase is involved in the control of potato tuber develop-ment. Plant Cell 13:613–626
Laothawornkitkul J, Taylor JE, Paul ND, Hewitt CN (2009) Biogenicvolatile organic compounds in the Earth system. New Phytol183:27–51
Lisec J, Meyer RC, Steinfath M, Redestig H, Becher M, Witucka-WallH, Fiehn O, Torjek O, Selbig J, Altmann T, Willmitzer L (2008)Identification of metabolic and biomass QTL in Arabidopsisthaliana in a parallel analysis of RIL and IL populations. Plant J53:960–972
Lu ZX, Sosinski B, Reighard GL, Baird WV, Abbott AG (1998)Construction of a genetic linkage map and identification of AFLPmarkers for resistance to root-knot nematodes in peach rootstocks.Genome 41:199–207
Mathieu S, Cin VD, Fei ZJ, Li H, Bliss P, Taylor MG, Klee HJ, TiemanDM (2009) Flavour compounds in tomato fruits: identification ofloci and potential pathways affecting volatile composition. J ExpBot 60:325–337
Matsui K, Shibata Y, Tateba H, Hatanaka A, Kajiwara T (1997)Changes of lipoxygenase and fatty acid hydroperoxide lyaseactivities in bell pepper fruits during maturation. Biosci BiotechBioch 61:199–201
Nagegowda DA, Gutensohn M, Wilkerson CG, Dudareva N (2008)Two nearly identical terpene synthases catalyze the formation ofnerolidol and linalool in snapdragon flowers. Plant J 55:224–239
Nielsen R, Hubisz MJ, Clark AG (2004) Reconstituting the frequencyspectrum of ascertained single-nucleotide polymorphism data.Genetics 168:2373–2382
Obando-Ulloa JM, Ruiz J, Monforte AJ, Fernandez-Trujillo JP (2008)Aroma profile of a collection of near-isogenic lines of melon(Cucumis melo L.). Food Chem 118:815–822
Ogundiwin EA, Peace CP, Gradziel TM, Parfitt DE, Bliss FA, CrisostoCH (2009) A fruit quality gene map of Prunus. BMC Genomics10:587
Olbricht K, Grafe C, Weiss K, Ulrich D (2008) Inheritance of aromacompounds in a model population of Fragaria × ananassa Duch.Plant Breeding 127:87–93
O’Reilly-Wapstra JM, Freeman JS, Davies NW, Vaillancourt RE,Fitzgerald H, Potts BM (2011) Quantitative trait loci for foliarterpenes in a global eucalypt species. Tree Genet Genomes 7:485–498
Overton KH (1971) Terpenoids and steroids. A specialistic periodicalreport. Chemical Society
Perez AG, Sanz C, Olias R, Olias JM (1999) Lipoxygenase andhydroperoxide lyase activities in ripening strawberry fruits. JAgr Food Chem 47:249–253
Quarta R, Dettori MT, Sartori A, Verde I (2000) Genetic linkage mapand QTL analysis in peach. Proceedings of the XXV InternationalHorticultural Congress Pt 11:233–241
Tree Genetics & Genomes

Quilot B, Wu BH, Kervella J, Genard M, Foulongne M, Moreau K(2004) QTL analysis of quality traits in an advanced backcrossbetween Prunus persica cultivars and the wild relative species P.davidiana. Theor Appl Genet 109:884–897
Rowan DD, Allen JM, Fielder S, Hunt MB (1999) Biosynthesis ofstraight-chain ester volatiles in Red Delicious and Granny Smithapples using deuterium-labeled precursors. J Agr Food Chem47:2553–2562
Rowan DD, Hunt MB, Alspach PA, Whitworth CJ, Oraguzie NC(2009a) Heritability and genetic and phenotypic correlations ofapple (Malus × domestica) fruit volatiles in a genetically diversebreeding population. J Agr Food Chem 57:7944–7952
Rowan DD, Hunt MB, Dimouro A, Alspach PA, Weskett R, Volz RK,Gardiner SE, Chagne D (2009b) Profiling fruit volatiles in theprogeny of a ‘Royal Gala’ × ‘Granny Smith’ apple (Malus ×domestica) cross. J Agr Food Chem 57:7953–7961
Salas JJ, Sanchez J, Ramli US, Manaf AM, Williams M, Harwood JL(2000) Biochemistry of lipid metabolism in olive and other oilfruits. Prog Lipid Res 39:151–180
Saliba-Colombani V, Causse M, Langlois D, Philouze J, Buret M(2001) Genetic analysis of organoleptic quality in fresh markettomato. 1. Mapping QTLs for physical and chemical traits. TheorAppl Genet 102:259–272
Schottler M, Boland W (1996) Biosynthesis of dodecano-4-lactone inripening fruits: Crucial role of an epoxide-hydrolase in enantiose-lective generation of aroma components of the nectarine (Prunuspersica var nucipersica) and the strawberry (Fragaria ananassa).Helv Chim Acta 79:1488–1496
Schwab W, Davidovich-Rikanati R, Lewinsohn E (2008) Biosynthesisof plant-derived flavor compounds. Plant J 54:712–732
Scorza R, Mehlenbacher SA, Lightner GW (1985) Inbreeding andcoancestry of freestone peach cultivars of the Eastern-United-States and implications for peach germplasm improvement. JAm Soc Hortic Sci 110:547–552
Shulaev V, Korban SS, Sosinski B, Abbott AG, Aldwinckle HS, FoltaKM, Iezzoni A, Main D, Arús P, Dandekar AM, Lewers K,Brown SK, Davis TM, Gardiner SE, Potter D, Veilleux RE(2008) Multiple models for Rosaceae genomics. Plant Physiol147:985–1003
Sosinski B, Sossey-Alaoui K, Rajapakse S, Glassmoyer K, Ballard RE,Abbott AG, Lu ZX, BairdWV, Reighard G, TabbA, Scorza R (1998)Use of AFLP and RFLPmarkers to create a combined linkagemap inpeach [Prunus persica (L.) Batsch] for use in marker assisted selec-tion. Fourth International Peach Symposium 1–2:61–68
Spiller M, Berger RG, Debener T (2010) Genetic dissection of scentmetabolic profiles in diploid rose populations. Theor Appl Genet120:1461–1471
Tadmor Y, Fridman E, Gur A, Larkov O, Lastochkin E, Ravid U,Zamir D, Lewinsohn E (2002) Identification of malodorous,a wild species allele affecting tomato aroma that was selectedagainst during domestication. J Agr Food Chem 50:2005–2009
Tava A, Ramella D, Grecchi M, Aceto P, Paoletti R, Piano E(2009) Volatile constituents of Trifolium pratense and T.repens from N.E. Italian alpine pastures. Nat Prod Commun4:835–838
Tholl D, Rose USR (2006) Detection and identification of floral scentcompounds. Biol Floral Scent 3–25
Van Ooijen JW (2009) MapQTL® 6, Software for the mapping ofquantitative trait loci in experimental populations of diploid spe-cies. Kyazma BV, Wageningen
Van Ooijen JW (2011) Multipoint maximum likelihood mappingin a full-sib family of an outbreeding species. Genet Res93:343–349
Verde I, Bassil N, Scalabrin S, Gilmore B, Lawley CT et al (2012)Development and evaluation of a 9 K SNP array for peach byinternationally coordinated SNP detection and validation inbreeding germplasm. PLoS One 7(4):e35668
Wang YJ, Yang CX, Li SH, Yang L, Wang YN, Zhao JB, Jiang Q(2009) Volatile characteristics of 50 peaches and nectarines eval-uated by HP-SPME with GC-MS. Food Chem 116:356–364
Yamamoto T, Shimada T, Imai T, Yaegaki H, Haji T, Matsuta N,YamaguchiM, Hayashi T (2001) Characterization of morphologicaltraits based on a genetic linkage map in peach. Breeding Sci51:271–278
Zanor MI, Rambla JL, Chaib J, Steppa A, Medina A, Granell A, FernieAR, Causse M (2009) Metabolic characterization of loci affectingsensory attributes in tomato allows an assessment of the influenceof the levels of primary metabolites and volatile organic contents.J Exp Bot 60:2139–2154
Zhang B, Chen KS, Bowen J, Allan A, Espley R, KarunairetnamS, Ferguson I (2006) Differential expression within theLOX gene family in ripening kiwifruit . J Exp Bot57:3825–3836
Zini E, Biasioli F, Gasperi F, Mott D, Aprea E, Mark TD, Patocchi A,Gessler C, KomjancM (2005) QTLmapping of volatile compoundsin ripe apples detected by proton transfer reaction-mass spectrome-try. Euphytica 145:269–279
Zorrilla-Fontanesi Y, Rambla JL, Cabeza A, Medina JJ, Sánchez-Sevilla JF, Valpuesta V, Botella MA, Granell A, Amaya I (2012)Genetic analysis of strawberry fruit aroma and identification of O-methyltransferase FaOMT as the locus controlling natural varia-tion in mesifurane content. Plant Physiol. doi:10.1104/pp.111.188318
Authors’ contributions IE constructed the genetic map, conductedQTL analysis and drafted the manuscript. GC performed GC-MSanalysis of volatile compounds, analysed data, helped to draft themanuscript. IPC participated in construction of the genetic map, per-formed statistical analyses, helped to draft the manuscript. DB assessedthe potential of the plant material, developed the population, helped todraft the manuscript. RP analyzed data, identified and mapped candi-date genes, performed the LOX phylogenetic analysis, and helped todraft the manuscript. MT analysed SNP data, contributed to the revi-sion of the manuscript. EB performed SNP genotyping and contributedto SNP data analysis. LR managed and coordinated construction of thelinkage map, analysed data, helped to draft the manuscript. AV man-aged and coordinated the study, participated in its design, analyzeddata, helped to draft the manuscript. CP conceived and designed thestudy, managed its start up, helped to draft the manuscript. All authorsread and approved the final manuscript.
Tree Genetics & Genomes