Texture classification using invariant features of local textures
Upload
independentCategory
view
0download
0
1
Published in J. Agric. Food Chem. 2012, 60, 6594−6605 ; dx.doi.org/10.1021/jf301494j
Cell wall polysaccharide chemistry of peach genotypes with contrasted textures and
other fruit traits
Marc Lahaye1*, Xavier Falourd1, Bernard Quemener1, Marie Christine Ralet1, Werner
Howad2, Elisabeth Dirlewanger3, Pere Arús2
1 INRA, UR1268 Biopolymères Interactions Assemblages, BP 71627, F-44316 Nantes,
France
2 IRTA, Centre de Recerca en Agrigenòmica CSIC-IRTA-UAB-UB, Campus UAB,
Cerdanyola del Vallès (Bellaterra), 08193 Barcelona, Spain
3 INRA, UR419 Espèces Fruitières, BP 81, F-33883 Villenave d’Ornon, France
*Corresponding author (Phone: 33 (0)2 40 67 50 63. Fax: 33 (0)2 40 67 50 84. E-mail:

2
ABSTRACT: Cell wall composition, pectin and hemicellulose fine structure variation were
assessed in peach and related genotypes with contrasted texture and fruit shape. Cell walls
were prepared from four commercial peaches, eight genotypes from the Jalousia x Fantasia
peach cross, and six genotypes from the Earlygold peach x Texas almond cross. Sugar
composition was determined chemically while fine structure of homogalacturonan pectin and
xyloglucan hemicellulose were assessed by coupling pectin lyase and glucanase degradation,
respectively, with MALDI-TOF MS analysis of the degradation products. The results indicate
clear compositional and structural differences between the parents and their related genotypes
on the basis of pectin versus cellulose/hemicellulose content and on the fine structure of
homogalacturonan and xyloglucan. A relation between methyl- and acetyl-esterification of
pectin with fruit shape is revealed in the Fantasia x Jalousia peach genotypes.
KEYWORDS: Cell wall, hemicellulose, xyloglucan, pectin, homogalacturonan, pectin lyase,
glucanase, MALDI-TOF MS, texture, fruit shape

3
INTRODUCTION
Fleshy fruit quality embraces a large panel of characteristics, such as color, taste, aroma, size,
shape and texture. Among these, texture is one of the major quality issues for breeders,
growers, retailers, processors and consumers. Texture encompasses sensory and mechanical
aspects.1 It relies on combinations of several structural determinants involving, at the tissue
scale, cellular structure and, at the cellular scale, cell wall as well as turgor pressure.2 Fruit
size results from both cell division and cell expansion factors while shape involves the
regulated development of the constitutive fruit tissues that likely combines cell wall factors
and cell mechanical perception.3,4 The setting up and evolution of these determinants of
quality during fruit development and ripening are yet to be fully identified. Such basic
knowledge is required to develop strategies for controlling fruit quality all along production,
storage and processing, and for breeding new varieties with desired characteristics. Systems
biology and genetic approaches have been engaged in the aim of designing fruit genotypes
with chosen shape and texture.5-9 Due to the great complexity and interplay of the many
cellular factors involved in these traits, such studies imply measurements of specific
molecular and structural determinants at different scales among which cell walls are pivotal.
Their intrinsic mechanical and adhesive characteristics contribute to the control of cell
development, to the cellular cohesion in tissue and to the viscoelastic characteristics of the
tissue. Fleshy fruit cell walls have been the focus of many biochemical studies in relation with
fruit softening and texture disorders.10,11 They revealed cell wall reshuffling and disassembly
mechanisms through particular sets of enzymes and proteins mostly triggered in climacteric
fruit by the ethylene crisis at the onset of ripening. The variability of the chemical structures
of cell wall polysaccharides related to genetic or developmental factors can conveniently be
assessed through coupling specific enzymatic degradations and MALDI-TOF MS or HPLC
analysis of the oligosaccharides produced.12,13 This approach was successful in revealing cell

4
wall polysaccharide structural changes in near isogenic lines of tomato for texture QTL and in
assessing the structural variability and inheritance of hemicellulose structures in an apple
progeny.14,15
Among fleshy fruits, peach and nectarine are economically important crops. Peaches
are usually classified according to their melting, non-melting or stony-hard texture. Melting
versus non-melting is determined by a single gene located on chromosome 5, whereas, the
stony-hard trait is genetically independent from it.16,17 The nature of peach cell wall
polysaccharides, their modifications during fruit development, ripening and texture
elaboration have been the subject of several reports.18-28 Peach cell wall polysaccharides are
mainly composed of homogalacturonan (HG), rhamnogalacturonan I (RGI) rich pectin and
xyloglucan among the hemicellulose.19,21 Homogalacturonan consists in a linear chain of α-
1,4-linked D-galacturonic acids which can be partially esterified on O-6 by methanol and on
O-2 or O-3 by acetic acid. Rhamnogalacturonan I is based on a backbone of alternating α-1,4-
linked D-galacturonic acid and α-1,2-linked L-rhamnose residues. The latter sugar can bear
side chains made of β-1,4-linked D-galactose, α-1,5-linked L-arabinose, or more complex
combination of arabinose and galactose residues.29 Xyloglucans are based on a backbone
made of 1−>4 linked β-D-glucose residues mostly branched at O-6 by a α-D-xylosyl residue,
which can be further extended by one β-D-galactosyl, by one β-D-galactosyl residue bearing
one α-L-fucosyl residue or by other combinations including α-L-arabinosyl residue.30
In this work the cell wall polysaccharide chemistry was characterized in commercial types
of fruits and from the parents and offspring of specific crosses between two peach cultivars,
Jalousia and Fantasia, and between Earlygold peach and Texas almond showing contrasted
texture or morphological appearance. In particular, pectin-lyase and endoglucanase
degradations of cell walls coupled to MALDI-TOF MS analysis of the products were proven
useful to reveal genetically defined homogalacturonan and hemicellulose structures that are

5
discussed with regard to quality traits and cell wall enzymes potentially affected between
individuals.
MATERIALS AND METHODS
Peach Varieties and Hybrids. Fruits were from three groups of materials. A first group
(A) was composed of four peach varieties with contrasted morphology and texture (three
melting fruits: juicy nectarine “Zairegem – Royal Gem”, pasty peach “Elegant Lady” and
fibrous round peach “Maperla”, and one non-melting non-melting pavie peach “Coconet
Ice”). These fruits were harvested at maturity in 2007 at INRA Bordeaux. A second group of
fruits (B) was composed of individuals from crosses between Fantasia and Jalousia
cultivars.32 Besides the parents (Jalousia: flat peach, Fantasia: round peach), eight F2 progeny
with contrasted phenotypes (F2#25: round peach, F2#31: flat peach, F2#71: round nectarine,
F2#74: round peach, F2#82: round nectarine, F2#143: round peach, F2#178: flat peach,
F2#210: round peach) were harvested at maturity in 2009 at INRA-Bordeaux. The third group
of fruits (C) consisted of a collection of individuals from crosses between peach (Earlygold)
and almond (Texas).16 Besides the parents and their F1 hybrid (TxE_F1), three F2 (F2#17:
peach-like, F2#23: almond-like, F2#94: hybrid-like) and two backcross (BC1#9: juicy,
BC1#78: non-juicy) progeny were harvested at maturity in 2009 at IRTA-Barcelona. For all
groups, the flesh of 3 to 5 fruits per genotype was cut into about 1-2 cm3 pieces and
immediately frozen at -80 °C.
Cell Wall Preparation. The frozen flesh samples from three to five fruits per genotype
were freeze-dried. Each dried sample was ground to a fine powder (FastPrep, MP
Biomedicals, Solon, USA) and extracted with 80% ethanol at 85 °C and 35 bars in an
automated solvent extractor (ASE200, Dionex Sunnyvale, CA, USA) until the ethanol
solution was free of soluble sugars. The alcohol insoluble material (AIM) was dehydrated at

6
40 °C under vacuum over P2O5. All biochemical measurements were performed from dry
AIM.
Cell Wall Sugar Composition. Identification and quantification of cell wall neutral sugars
were performed by gas-liquid chromatography (GC) after sulfuric acid hydrolysis.33 AIM was
dispersed in 13 M sulfuric acid for 30 min at 30 °C and then hydrolyzed in 1 M sulfuric acid
(2h, 100 °C). Sugars were converted to alditol acetates and chromatographed on a DB 225
capillary column (J&W Scientific, Folsorn, CA, USA; temperature 205 °C, carrier gas H2).34
A standard sugars solution and inositol as internal standard were used for calibration. Uronic
acids in acid hydrolyzates were quantified using the metahydroxydiphenyl colorimetric acid
method.35
Cell Wall Polysaccharide Enzymatic Profiling. Cell wall material (5 mg) from each fruit
per genotype was suspended in 1 mL acetate buffer (5 mM, pH 5) or water and degraded by
pectin lyase prepared according to Ralet et al.36 (0.55 nkatal) or by commercial endo-1,4-β-
glucanase from Trichoderma longibrachiatum (Megazyme, Bray, Ireland; 20U), respectively.
After overnight digestion at 40 °C under head-over-tail mixing, the suspension was
centrifuged (10 min, 14000 g) and the supernatant solution was heated for 10 min in a boiling
water-bath to inactivate enzymes. Oligosaccharides in the hydrolyzates were analyzed by
MALDI-TOF MS in the positive mode using an Autoflex III MALDI-TOF/TOF spectrometer
(Bruker Daltonics, Bremen, Germany) equipped with a Smartbeam laser (355 nm, 200 Hz).
Two types of matrix were used for enzyme hydrolyzate analysis. For pectin-lyase
hydrolyzates, the ionic liquid matrix DMA/DHB prepared and used as reported.37 Calibration
was realized with galactomanno-oligosaccharides (DP 3 to 9) of known masses. The
glucanase hydrolyzates were analyzed using the Super DHB matrix.38 The matrix was
prepared by a mixture (90/10, v/v) of 2, 5-dihydroxybenzoic acid (DHB) at 10 mg/mL in
water and 2-hydroxy-5-methoxybenzoic acid at 10 mg/mL in pure methanol, respectively.

7
The instrument was externally calibrated using the monoisotopic masses of main
oligosaccharides ([M+Na]+ ion) released from xyloglucans (XXG: 791.243 Da.XXXG:
1085.338 Da.XXFGa1: 1435.459 Da.XLFGa1: 1597.512 Da; see below for nomenclature).
Spectra were recorded in the mass range m/z 600-1400 and 700-1700 for the pectin-lyase
and glucanase hydrolyzates, respectively. Spectra were exported to Flex Analysis 3.0 software
(Bruker) and pre-processed. Mass lists reporting m/z (monoisotopic masses, after deisotoping
with the SNAP algorithm, Bruker) and intensities of detected ions were then exported for
statistical analysis and graphical representation. Ions masses and intensities on the pectin-
lyase spectra were normalized according to the ion peak at m/z 783.191 attributed to DU4m4
(see below for nomenclature). Ion masses and intensities on the glucanase spectra were
normalized to that of the XXXG ion.
Identification of ions was done by comparison with the m/z lists registered (± 0.2 m/z) to
theoretical masses of the sodium adduct of different oligosaccharides.
For oligouronides released by pectin-lyase, this list took into account specificities of the
enzyme.36 In particular, because several oligosaccharide structures have similar m/z values
due to substitutions by methyl and acetyl esters and by different ion adduct types (sodium or
potassium) combined with various salt forms (Na-H) on acidic functions, ions identification
was performed according to a minimum methyl esterification per oligosaccharide (ie DP3: 1
to 3 methyl esters, DP4: 2 to 4, DP5: 2 to 5, DP6: 3 to 6 and DP7: 4 to 6) and a maximum of 1
to 2 acetyl groups depending on degree of polymerization (DP3 to 5: 1 acetyl, DP 6 and 7: 2
acetyl groups).
For oligomers released by the commercial glucanase, ion attribution was realized based on
combinations of hexoses, methyl-pentoses, pentoses and acetyl ester substituents. The enzyme
preparation is known to hydrolyze glucomannan and to contain minor xylanase and
galactanase contaminating activities.14 Xyloglucan structures were ions of mass

8
corresponding to combinations of hexose and pentose with methyl-pentose and/or acetyl ester
substituents. Ions of m/z corresponding to combinations of hexoses and acetyl ester
substituents were attributed to glucomannan structures. Ions of mass corresponding to pentose
and combinations of pentose and uronic acid were attributed to xylan.
Oligosaccharide nomenclature was as follows. For polyuronides the letter U corresponds to
uronic acid. The following number refers to the number of residues in the oligomer (ie DP).
Acetyl and methyl esters substitutions were referred to as a and m, respectively, followed by
the amount of groups. The unsaturation of the uronic acid at the non-reducing end of the
oligomer released by pectin-lyase was referred to as D. Other adducts of oligouronides were
referred to as Na-H and K. According to this nomenclature, DU4m4 refers to an oligo-
hexouronide of DP4 fully methyl esterified and unsaturated at the non-reducing end.
The nomenclature of oligomers released by glucanase followed that established for
xyloglucans extended to account for acetyl groups noted a (Table 1).30 Hexose containing
oligosaccharides attributed to glucomannans were noted Hex extended by the letter a for
acetyl esterification. The number following the structure codes denotes the number of
building structures and acetyl groups in the oligosaccharides (i.e. Hex3a2 corresponds to 3
hexosyl units and 2 acetyl groups).
Statistical Analysis. Data treatments and statistical analyses were performed with R
software.39 Exploratory statistics consisted in Principal Component Analysis of the chemical
data and MALDI-TOF MS ion intensities. Significant differences between individuals were
evaluated by a Student test performed on PCA individual coordinates on principal
components. Significant differences were set at a probability value of equality below 5%.
Pearson correlation coefficients were computed within MALDI-TOF MS ion datasets.

9
RESULTS
The Peach Cell Wall Sugar Composition Varies between Peach Genotypes. Cell wall
polysaccharides from the different genotypes are made of glucose, galactose, arabinose,
xylose, rhamnose, fucose, mannose and uronic acids (Supplementary Table 1) as already
reported in peaches.20,24,26,31 Variations in total neutral sugars and uronic acids on the cell wall
material dry weight basis and individual sugars on the molar percentage basis were assessed
by principal component analysis (PCA; Figure 1) by groups of peach genotypes. These
groups were composed of contrasted texture varieties (Figure 1 A), individuals from the cross
between Jalousia and Fantasia peaches (Figure 1 B), and individuals from the cross between
the Earlygold peach and Texas almond (Figure 1 C). Variations in total neutral sugars and
uronic acids were mainly accounted for by principal components 1 and 2, respectively (Figure
1-1). The contribution of the different sugars to the dispersion of individuals on the PCA
maps (Figure 1-2) is shown on Figure 1-3.
Among the contrasted texture peach varieties “juicy nectarine” differed from “pasty peach”
with a low uronic acid content (Figure 1 A1; Supplementary Table 2a). Individuals from the
Jalousia x Fantasia crosses differed on their total neutral sugar content (Figure 1 B1;
Supplementary Table 2b). The low neutral sugar content in the parent Fantasia significantly
differed from F2#31 and F2#74 as well as F2#143. Other significant differences were noted
between F2#31 and F2#71 as well as F2#82, between F2#71 and F2#74 as well as F2#143,
between F2#74 and F2#82 as well as F2#178, between F2#82 and F2#143, and between
F2#143 and F2#178. The cross between Earlygold peach and the Texas almond gave rise to
more contrasted individuals (Figure 1 C1; Supplementary Table 2c). On the neutral sugar
content basis, genotypes BC1#78 differed significantly from F2#94 and Texas, BC1#9
differed significantly from Earlygold and F2#17 as well as F2#94 and from Texas differed
from one another while the parent Earlygold with a low content in neutral sugars differed

10
from all genotypes except BC1#78 and F2#17. On the uronic acid content basis, F1#37
differed significantly from all other genotypes except BC1#78, BC1#9 and F2#23. Texas also
differed from all other individuals except Earlygold, F2#17 and F2#94. Other significant
differences were noted between BC1#78 and the three genotypes: Earlygold, F2#17, F2#94.
With regards to individual sugars, significant differences were noted between non-melting
pavie peach and juicy nectarine and pasty peach according to the first component. The latter
opposed glucose to arabinose contents (Figure 1 A2, A3). The non-melting pavie peach was
significantly richer in glucose compared to the pasty and juicy peaches (Supplementary Table
3a). Individuals from the cross between Fantasia and Jalousia differed from one another along
the first component, which reflected essentially variations in glucose and uronic acid
proportions (Figure 1 B2, B3). Significant differences were noted between Fantasia and
F2#74 as well as F2#143, between F2#71 and F2#143, between F2#74 and F2#82, between
F2#82 and F2#143, between F2#143 and F2#178 (Supplementary Table 3b). Again, the cross
between Earlygold and Texas yielded individual genotypes with remarkable composition
differences according to the two first principal components (Figure 1 C2, C3). The first axis
reflected essentially variations in xylose and glucose contents that were opposed to that of
uronic acid while variation in arabinose proportion was the main contributor to the second
axis. According to the first PCA axis, the parent Texas and F2#94, with a higher proportion of
xylose and glucose, were close and significantly different from all other genotypes
(Supplementary Table 3c). F2#17 differed significantly from the four genotyptes: BC1#78,
F1#37, F2#94 and Earlygold. On the second axis, F2#23 differed significantly from all other
genotypes with regard to a high arabinose proportion. On the opposite, Earlygold differed
significantly from all other genotypes except BC1#78 and F2#17. F2#17 differed from all
other genotypes except BC1#78 and Earlygold. Other significant differences were noted
between BC1#78 and the three genotypes: BC1#9, F1#37, Texas.
11
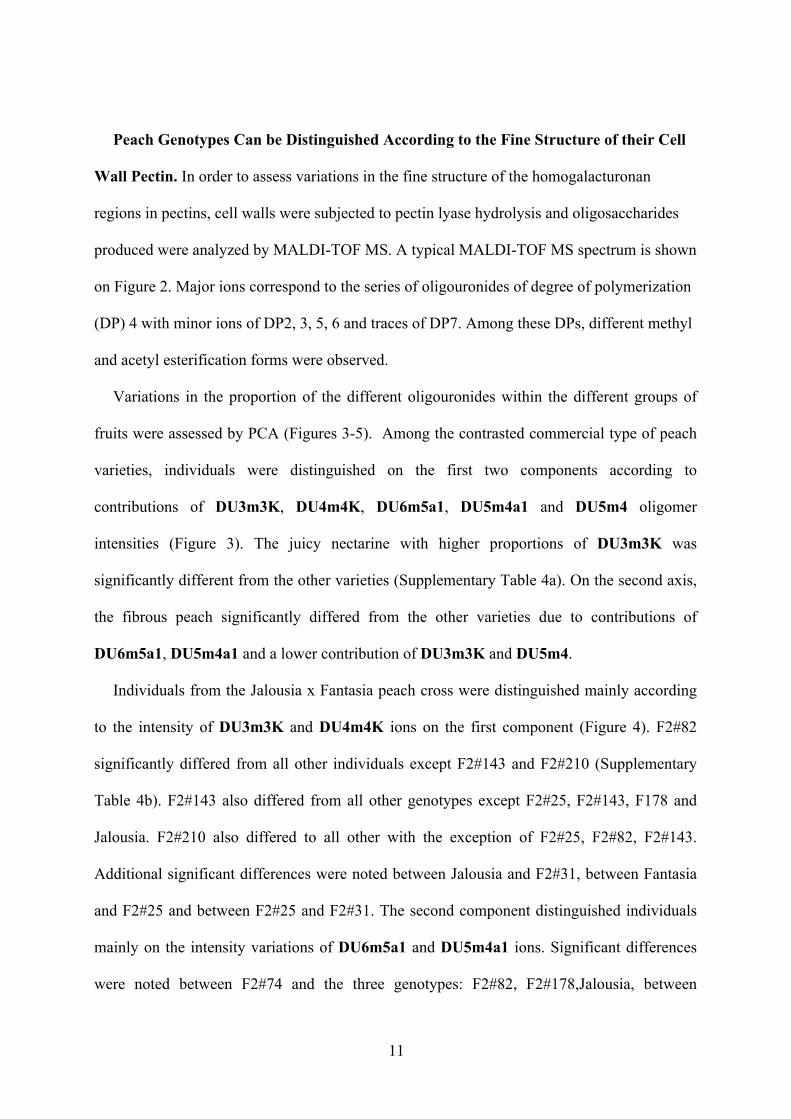
Peach Genotypes Can be Distinguished According to the Fine Structure of their Cell
Wall Pectin. In order to assess variations in the fine structure of the homogalacturonan
regions in pectins, cell walls were subjected to pectin lyase hydrolysis and oligosaccharides
produced were analyzed by MALDI-TOF MS. A typical MALDI-TOF MS spectrum is shown
on Figure 2. Major ions correspond to the series of oligouronides of degree of polymerization
(DP) 4 with minor ions of DP2, 3, 5, 6 and traces of DP7. Among these DPs, different methyl
and acetyl esterification forms were observed.
Variations in the proportion of the different oligouronides within the different groups of
fruits were assessed by PCA (Figures 3-5). Among the contrasted commercial type of peach
varieties, individuals were distinguished on the first two components according to
contributions of DU3m3K, DU4m4K, DU6m5a1, DU5m4a1 and DU5m4 oligomer
intensities (Figure 3). The juicy nectarine with higher proportions of DU3m3K was
significantly different from the other varieties (Supplementary Table 4a). On the second axis,
the fibrous peach significantly differed from the other varieties due to contributions of
DU6m5a1, DU5m4a1 and a lower contribution of DU3m3K and DU5m4.
Individuals from the Jalousia x Fantasia peach cross were distinguished mainly according
to the intensity of DU3m3K and DU4m4K ions on the first component (Figure 4). F2#82
significantly differed from all other individuals except F2#143 and F2#210 (Supplementary
Table 4b). F2#143 also differed from all other genotypes except F2#25, F2#143, F178 and
Jalousia. F2#210 also differed to all other with the exception of F2#25, F2#82, F2#143.
Additional significant differences were noted between Jalousia and F2#31, between Fantasia
and F2#25 and between F2#25 and F2#31. The second component distinguished individuals
mainly on the intensity variations of DU6m5a1 and DU5m4a1 ions. Significant differences
were noted between F2#74 and the three genotypes: F2#82, F2#178,Jalousia, between

12
Fantasia and F2#178 as well as Jalousia and between F2#143 and F2#178 as well as Jalousia.
Taking the different morphologies into account, flat fruits differed significantly from round
fruits on the second component (ANOVA p value = 0.0009 according to PC2). Round fruits
were characterized by a greater contribution of fully methylated oligouronides while partially
methylated and acetylated oliguronides characterized flat fruits.
Within individuals from the cross between Earlygold peach and Texas almond (Figure 5),
the almond parent with a high contribution of DU3m3K ion intensity differed significantly on
the first component from all other genotypes. On this axis, the almond-like F2#23 individual
also significantly differed from BC1#78 and F2#17 (Supplementary Table 4c). The second
component clearly distinguished BC1#78 from F2#94 as well as Texas, between BC1#9 and
F2#23, between Earlygold and the three genoytpes: F2#17, F2#94,Texas, between F1#37 and
Texas, between F2#17 and F2#23, between F2#94 and F2#23, and between F2#23 and Texas
mainly on the variable contribution of DU6m5a1 and DU5m4a1 ion intensities. The third
principal component explaining 10.5% of the total variance distinguished further individuals
(Figure 5). It mainly accounted for variations in the intensity of DU5m4, DU4m3, DU6m5,
DU5m3, DU5m4a1(Na-H) and DU6m5a1(Na-H) ions. In particular F2#23 significantly
differed from all other individuals except Earlygold. On the opposite, BC1#9 and BC1#78
differed from one another and from all other individuals except F1#37, F2#94. Additional
significant differences were noted between Earlygold and the four genotypes F1#37, F2#94,
F1#37, Texas and between F2#94 and Texas.
In order to search for relationships between homoglacturonan methyl and/or acetyl
esterification features within peach genotype groups, Pearson correlation coefficients were
calculated between oligomers MALDI-TOF ion intensity (r ≥ 0.7; Table 2). There was no or
rare correlations between monosodium adducts of partially methylated oligomers and the salt
form of the corresponding adduct (Na-H on the free carboxylic acid) or between sodium and

13
the potassium oligomer adducts. These reflected unclear complex ionization mechanisms of
oligouronides in DMA/DHB matrix. There were strong correlations between several
structures observed in the three groups of fruits: DU3m2(Na-H)/DU4m3(Na-H),
DU3m3K/DU4m4K, DU4m3/DU5m4, DU4m3a1/DU5m3a1/DU5m4a1/DU6m5a1,
DU5m4/DU6m5, DU5m4a1K/DU6m5a1K and DU6m5/DU6m5a1K. These correlations
testified structural similarities across the three groups of fruits and affiliations of oligomers
resulting from close de-methyl esterification mechanisms of pectin in cell walls. Other
correlations concerned two or only one group of samples. These reflected genotype specific
de-methyl esterification and/or acetyl esterification of pectin.
The Fine Structure of Hemicellulose in Peach Cell Wall Varies with Genotypes. The
cell wall polysaccharides in the peach collections were hydrolyzed by an endoglucanase to
assess the fine structure variability of hemicelluloses. A typical MALDI-TOF MS spectrum of
the hydrolysis products (Figure 6) showed major ions with m/z corresponding to XXFGa1,
XLFGa1, XXXG xyloglucan structures. Lower intensity ions correspond to XLXG,
XXFGa2, XLFGa2 xyloglucan structures, glucomannan oligomers (Hex6a1). Other small
ions were attributed to xyloglucan, glucomannans as well as minor contribution of xylan
substituted by uronic acid (Pen5u1). Structural variation in the glucanase hydrolysates of the
different fruit groups was assessed by PCA (Figures 7-9).
Texture contrasted peach varieties of commercial type were distinguished from one
another according to the second component (Figure 7) which opposed primarily XLXGa1,
XXG to XLFG, XXFG ion intensity variations. The four varieties differed significantly from
one another along this axis (Supplementary Table 5a), the pasty peach being the richest in
XLXGa1 and the juicy nectarine the richest in XXFG and XLFG structures which are highly
correlated.

14
The glucanase hydrolyzate profile allowed a limited discrimination among individuals
from the cross between Jalousia x Fantasia peaches on the first two principal components
(Figure 8). These two axes accounted for monoacetylated XLFGA1, XXFGa1, and
diacetylated XLFGa2, XXFGa2 ion intensity variations, which are highly correlated,
respectively. Component 2 opposed contributions of primarily XLFG, XXFG to that of
XLFGa2, XXFGa2 ion intensity. On the first axis, F2#178 significantly differed from the
four genotypes: Fantasia, F2#31, F2#71 and F2#74 and F2#82 differed significantly from
F2#31 and F2#71 (Supplementary Table 5b). On the second axis, Jalousia significantly
differed from F2#82 and F2#210 and Fantasia differed significantly from F2#25, F2#31,
F2#82 and F2#210. The third principal component furthered the differentiation of individuals
primarily on the basis of the variation in the ion intensity of XLFGa1 opposed to XLXFGa1,
XXFGa1, XXG and XLFGa1 xyloglucan structures. Jalousia differed significantly from all
other genotypes along this axis. F2#71 also differed from most other individuals except
F2#178. F2#210 significantly differed from most other individuals except Fantasia, F2#31,
F2#74, F2#143. Additional significant differences were noted between Fantasia and F2#178,
F2#25 and F2#74, F2#31 and F2#178 as well as between F2#74 and F2#178.
Genotypes from the cross between Texas almond and Earlygold peach presented
remarkable different glucanase profiles that allowed a clear distinction of nearly all genotypes
on the first principal component (Figure 9). This first axis mainly opposed XLFGa2, XLFG
to XXFGa1 ions intensity variations. All genotypes significantly differed according to this
axis except Earlygold, F2#17 and F2#94 and between F2#17 and F2#94 (Supplementary
Table 5c). The second axis essentially accounting for XLFGa1 ion intensity variation
distinguished Texas from all other genotypes except F2#94. F2#17 also significantly differed
from F2#94.

15
Few MALDI-TOF ion intensities of xyloglucan and glucomannan oligomers correlated
with each other (Table 3). Common correlations between XLFGa1 and XLFGa2 were only
observed for contrasted commercial type varieties and for genotypes from the Jalousia x
Fantasia peach cross.
DISCUSSION
Peach and nectarine cell wall polysaccharides composition are affected by genetic
factors.24,25,28,31 Accordingly, significant variations of uronic acids and total neutral sugars
composition on the weight basis of the cell wall material were observed between the different
individuals from the three groups of fruit in the present study. They reflected variable
contents in pectins (mainly HG), other matrix glycans (RGI-rich pectins and hemicellulose)
and cellulose as well as of non-sugar components (ie proteins). This composition
discriminated particularly the different genotypes from the cross of Texas almond and
Earlygold peach parents with contrasted fruit traits. The progenies were grouped between
their parents, some in close proximity of which they shared the overall fruit traits. The cell
wall sugar representative of the main cell wall polysaccharides discriminated better the
different individuals in the three groups of genotypes. Uronic acids (pectin), and glucose and
xylose (cellulose/xyloglucan) proportions were the main discriminants between the genotypes
and to a variable extent, arabinose and galactose attributed essentially to rhamnogalacturonan
I pectin side chains. Sugar composition may help distinguishing cell wall contributors to
contrasted fruit traits such as galactose and arabinose often associated to mealiness and
wooliness textures in peach.21,27 In the present case, xylose and/or glucose rich cell walls from
almond and hybrid-like phenotype or from non-melting pavie peach were distinguished from
other genotypes though the relation between these high sugar proportions with fruit shape or

16
texture remains to be established. In fact sugar composition was not able to distinguish fruits
with different shapes from the Fantasia x Jalousia peach cross.
Peach meltiness and stony-hard textures have been related to homogalacturonan pectin
structure while fruit softening implies hemicellulose structural changes with yet unclear
implications of its fine structure.19,20,24,25,40,41 More detailed structural cell wall polysaccharide
analysis was realized to provide clues on which sets of enzymes may contribute to cell wall
reshuffling in texture elaboration and fruit shape development.
Homogalacturonan (HG) pectin methyl esterification is known to impact cell-cell adhesion
and to regulate endo-polygalacturonase degradation with implications on fruit texture and
plant organ morphogenesis.42,43 Less documented, acetyl esterification of pectin is known to
perturb HG calcium mediated dimerization in vitro, which may potentially affects cell-cell
adhesion in vivo.44 Although the fruit ripening stage can affect the HG methyl esterification,
clear differences were observed between the different genotypes according to the proportion
of highly methylated oligomers and partially methyl and acetyl-esterified ones. Correlations
between the MS peak intensities of fully methyl-esterified or partially methyl- and acetyl-
esterified oligomers across the three different groups of fruits indicate similar processing
mechanisms of methyl-ester removal from the native highly esterified pectin by pectin
methyl-esterases (PME).29 In contrast correlations limited to specific groups highlight
genetically controlled PME activities. Of interest, is the relationship between fruit shape and
the proportion of partially methyl and acetyl-esterified oligomers. Fruit shape may involve
specific HG biosynthesis and pectin methyl- and/or acetyl-esterase remodeling during organ
development. Pectin methyl esterification modulation by PME has already been shown to
affect hypocotyl or stem growth.45,46
Xyloglucan plays a key role on fruit texture.47 Fruit ripening up regulates the hemicellulose
structural reshuffling by xyloglucan endo-transglusosylase/hydrolases (XET/XTH) as well as

17
the loosening of its interactions with cellulose by expansin. Its fine structure is known to vary
with genetics, with organ development and fruit ripening.12,14,15,48 The present results show
that its fine structure is also affected by genetics in peach. In fact, variations in the xyloglucan
fine structure discriminated better the different genotypes in the three peach groups than
pectin lyase hydrolysis did. The least discriminated genotypes were from the Jalousia and
Fantasia peach cross. Morphological traits do not appear to involve specific xyloglucan
structural features. The low level of correlation between structural variations shared by the
three groups of fruits indicates a tight genetic regulation of biosynthesis and/or remodeling of
peach xyloglucan. Structural variations impacted side chain sugars and acetyl-esterification
and may involve specific osidases.49 The relation between xyloglucan fine structure, cellulose
interactions, cell wall mechanical properties and fruit texture remains to be established.
Galactosylation of xyloglucan side chains appears to play a role in cell wall mechanical
properties.50 It may be important in regulating XET/XTH activities.51
With regards to the impact of genetics on cell wall chemistry, a strong correlation is
apparent between genetic distance of the individuals sampled and variability for all cell wall
polysaccharide characters studied here. In the parents and offspring of the most distant
progenies (almond x peach) results obtained were clearly contrasted and parents and progeny
were often distinguishable among them and with the parents. On the other hand, the two
parents of the peach F2, Jalousia and Fantasia, while differing in various morphological
characters of simple inheritance, were genetically close. Differences in cell wall
polysaccharides among them and in their offspring were slighter but showed significant
differences of methyl esterification of pectins related with their flat or round fruit
morphology. The four peach cultivars with contrasted fruit features were of different origins
and of an intermediate level of genetic diversity as corroborated with the chemical data.

18
In conclusion, the variation of cell wall polysaccharide composition and structure in
peaches and related genotypes with contrasted texture and morphological traits are
conveniently shown by chemical means and enzymatic degradation by pectin lyase and
glucanase coupled to MALDI-TOF MS. The results indicate that pectin methyl- and acetyl-
esterification appear associated with fruit shape and that xyloglucan fine structure is under a
fine genetic control that remains to be linked with texture. Such approach opens the way to
the identification of specific quantitative trait loci for cell wall determinants of texture and
peach shape.
ACKNOWLEDGMENTS
Part of the work was realized on the instrumental platform BIBS (INRA-Nantes)
SUPPORTING INFORMATION AVAILABLE:
Supplementary Table 1: Sugar composition of cell wall material from the 3 peach
collections.
Supplementary Tables 2a, b, c: Student’s t-test statistics of individual coordinates along the
first two principal components from the PCA of the cell wall sugar composition (% dry
weight) in peach contrasted texture genotypes (Sup. Table 2a), in individuals of the Jalousia x
Fantasia peach cross (Sup. Table 2b), in individuals of the Earlygold peach x Texas almond
cross (Sup. Table 2c).
Supplementary Tables 3a,b, c: Student’s t-test statistics of individual coordinates along the
first two principal components from the PCA of the cell wall sugar composition (% mol) in

19
peach contrasted texture genotypes (Sup. Table 3a), in individuals of the Jalousia x Fantasia
peach cross (Sup. Table 3b), in individuals of the Earlygold peach x Texas almond cross
(Sup. Table 3c).
Supplementary Table 4a, b, c: Student’s t-test statistics of individual coordinates along the
first two principal components from the PCA of MALDI-TOF MS spectra of the pectin lyase
hydrolyzate from cell walls of contrasted texture peach genotypes (Sup. Table 4a), of
individuals from the Jalousia x Fantasia peach cross (Sup. Table 4b), of individuals from the
Earlygold peach x Texas almond cross (Sup. Table 4c).
Supplementary Table 5a, b, c: Student’s t-test statistics of individual coordinates along the
first two principal components from the PCA of MALDI-TOF MS spectra of the glucanase
hydrolyzate from cell walls of contrasted texture peach genotypes (Sup. Table 5a), of
individuals from the Jalousia x Fantasia peach cross (Sup. Table 5b), of individuals from the
Earlygold peach x Texas almond cross (Sup. Table 5c).
This material is available free of charge via the Internet at http://pubs.acs.org.

20
REFERENCES
(1) Abbott, J. A. Textural quality assessment for fresh fruits and vegetables. Adv. Exp.
Med. Biol. 2004, 542, 265-279.
(2) Harker, F. R.; Redgwell, R. J.; Hallett, I. C.; Murray, S. H.; Carter, G. Texture of fresh
fruit. Hort. Rev. 1997, 20, 121-224.
(3) Bertin, N.; Borel, C.; Brunel, B.; Cheniclet, C.; Causse, M. Do genetic make-up and
growth manipulation affect tomato fruit size by cell number, or cell size and DNA
endoreplication? Ann. Bot.-London 2003, 92, 415-424.
(4) Mirabet, V.; Das, P.; Boudaoud, A.; Hamant, O. The role of mechanical forces in plant
morphogenesis. Annu. Rev. Plant Biol. 2011, 62, 365-385.
(5) Matas, A. J.; Gapper, N. E.; Chung, M. Y.; Giovannoni, J. J.; Rose, J. K. Biology and
genetic engineering of fruit maturation for enhanced quality and shelf-life. Curr. Opin.
Biotechnol. 2009, 20, 197-203.
(6) Seymour, G.; Poole, M.; King, G. J. Genetics and epigenetics of fruit development and
ripening. Curr. Opin. Plant Biol. 2008, 11, 58-63.
(7) Trainotti, L.; Zanin, D.; Casadoro, G. A cell wall-oriented genomic approach reveals a
new and unexpected complexity of the softening in peaches. J. Exp. Bot. 2003, 54, 1821-
1832.
(8) Mounet, F.; Moing, A.; Garcia, V.; Petit, J.; Maucourt, M.; Deborde, C.; Bernillon, S.;
Le Gall, G.; Colquhoun, I.; Defernez, M.; Giraudel, J. L.; Rolin, D.; Rothan, C.; Lemaire-
Chamley, M. Gene and metabolite regulatory network analysis of early developing fruit
tissues highlights new candidate genes for the control of tomato fruit composition and
development. Plant Physiol. 2009, 149, 1505-1528.

21
(9) Tanksley, S. D. The genetic, developmental, and molecular bases of fruit size and
shape variation in tomato. Plant Cell 2004, 16, S181-S189.
(10) Toivonen, P. M. A.; Brummell, D. A. Biochemical bases of appearance and texture
changes in fresh-cut fruit and vegetables. Postharvest Biol. Technol. 2008, 48, 1-14.
(11) Goulao, L. F.; Oliveira, C. M. Cell wall modifications during fruit ripening: when a
fruit is not the fruit. Trends Food Sci. Technol. 2008, 19, 4-25.
(12) Obel, N.; Erben, V.; Schwartz, T.; Kuhnel, S.; Fodor, A.; Pauly, M. Microanalysis of
plant cell wall polysaccharides. Mol. Plant 2009, 2, 922-932.
(13) Westphal, Y.; Schols, H. A.; Voragen, A. G.; Gruppen, H. MALDI-TOF MS and CE-
LIF Fingerprinting of plant cell wall polysaccharide digests as a screening tool for arabidopsis
cell wall mutants. J. Agric. Food Chem. 2010, 58, 4644-4652.
(14) Lahaye, M.; Quemener, B.; Causse, M.; Seymour, G. B. Hemicellulose fine structure
is affected differently during ripening of tomato lines with contrasted firmness. Int. J. Biol.
Macromol. 2012, submitted.
(15) Galvez-Lopez, D.; Laurens, F.; Quemener, B.; Lahaye, M. Variability of cell wall
polysaccharides composition and hemicellulose enzymatic profile in an apple progeny. Int. J.
Biol. Macromol. 2011, 49, 1104-1109.
(16) Dirlewanger, E.; Graziano, E.; Joobeur, T.; Garriga-Caldere, F.; Cosson, P.; Howad,
W.; Arus, P. Comparative mapping and marker-assisted selection in Rosaceae fruit crops.
Proc. Natl. Acad. Sci. U. S. A. 2004, 101, 9891-9896.
(17) Haji, T.; Yaegaki, H.; Yamaguchi, M. Inheritance and expression of fruit texture
melting, non-melting and stony hard in peach. Sci. Hortic.-Amsterdam 2005, 105, 241-248.

22
(18) Lurie, S.; Crisosto, C. H. Chilling injury in peach and nectarine. Postharvest Biol.
Technol. 2005, 37, 195-208.
(19) Muramatsu, N.; Tanaka, K.; Asakura, T.; Haji, T. Changes in cell wall
polysaccharides and physical properties of peach (Prunus persica Batsch) fruit during
ripening. J. Jpn. Soc. Hortic. Sci. 2004, 73, 534-540.
(20) Brummell, D. A.; Dal Cin, V.; Crisosto, C. H.; Labavitch, J. M. Cell wall metabolism
during maturation, ripening and senescence of peach fruit. J. Exp. Bot. 2004, 55, 2029-2039.
(21) Brummell, D. A.; Dal Cin, V.; Lurie, S.; Crisosto, C. H.; Labavitch, J. M. Cell wall
metabolism during the development of chilling injury in cold-stored peach fruit: association
of mealiness with arrested disassembly of cell wall pectins. J. Exp. Bot. 2004, 55, 2041-2052.
(22) Zhou, H. W.; Sonego, L.; Khalchitski, A.; Ben-Arie, R.; Lers, A.; Lurie, S. Cell wall
enzymes and cell wall changes in 'Flavortop' nectarines: mRNA abundance, enzyme activity,
and changes in pectic and neutral polymers during ripening and in woolly fruit. J. Am. Soc.
Hortic. Sci. 2000, 125, 630-637.
(23) Lurie, S.; Zhou, H. W.; Lers, A.; Sonego, L.; Alexandrov, S.; Shomer, I. Study of
pectin esterase and changes in pectin methylation during normal and abnormal peach
ripening. Physiol. Plantarum 2003, 119, 287-294.
(24) Yoshioka, H.; Hayama, H.; Tatsuki, M.; Nakamura, Y. Cell wall modifications during
softening in melting type peach "Akatsuki" and non-melting type peach "Mochizuki".
Postharvest Biol. Technol. 2011, 60, 100-110.
(25) Manganaris, G. A.; Vasilakakis, M.; Diamantidis, G.; Mignani, A. Diverse metabolism
of cell wall components of melting and non-melting peach genotypes during ripening after
harvest or cold storage. J. Sci. Food Agr. 2006, 86, 243-250.

23
(26) Manganaris, G. A.; Vasilakakis, M.; Diamantidis, G.; Mignani, I. Cell wall
physicochemical aspects of peach fruit related to internal breakdown symptoms. Postharvest
Biol. Technol. 2006, 39, 69-74.
(27) Yoshioka, H.; Hayama, H.; Tatsuki, M.; Nakamura, Y. Cell wall modification during
development of mealy texture in the stony-hard peach "Odoroki" treated with propylene.
Postharvest Biol. Technol. 2010, 55, 1-7.
(28) Karakurt, Y.; Huber, D. J.; Sherman, W. B. Qualtity characteristics of melting and
non-melting flesh peach genotypes. J. Sci. Food Agr. 2000, 80, 1848-1853.
(29) Mohnen, D. Pectin structure and biosynthesis. Curr. Opin. Plant Biol. 2008, 11, 266-
277.
(30) Scheller, H. V.; Ulvskov, P. Hemicelluloses. Annu. Rev. Plant Biol. 2010, 61, 263-
289.
(31) Kurz, C.; Carle, R.; Schieber, A. Characterisation of cell wall polysaccharide profiles
of apricots (Prunus armeniaca L.), peaches (Prunus persica L.), and pumpkins (Curcubita
sp.) for the evaluation of fruit product authenticity. Food Chem. 2008, 106, 421-430.
(32) Dirlewanger, E.; Pronier, V.; Parvery, C.; Rothan, C.; Guye, A.; Monet, R. Genetic
linkage map of peach [Prunus persica (L.) Batsch] using morphological and molecular
markers. Theor. Appl. Genet. 1998, 97, 888-895.
(33) Hoebler, C.; Barry, J.-L.; David, A.; Delort-Laval, J. Rapid acid hydrolysis of plant
cell wall polysaccharides and simplified quantitative determination of their neutral
monosaccharides by gas-liquid chromatography. J. Agr. Food Chem. 1989, 37, 360-365.
(34) Blakeney, A. B.; Harris, P. J.; Henry, R. J.; Stone, B. A. A simple and rapid
preparation of alditol acetates for monosaccharide analysis. Carbohyd. Res. 1983, 113, 291-
299.

24
(35) Blumenkrantz, N.; Asboe-Hansen, G. New method for quantitative determination of
uronic acids. Anal. Biochem. 1973, 54, 484-489.
(36) Ralet, M. C.; Williams, M. A. K.; Tanhatan-Nasseri, A.; Ropartz, D.; Quemener, B.;
Bonnin, E. Innovative enzymatic approach to resolve homogalacturonans based on their
methylesterification pattern. Biomacromolecules 2012, 13, 1615-1624.
(37) Ropartz, D.; Bodet, P. E.; Przybylski, C.; Gonnet, F.; Daniel, R.; Fer, M.; Helbert, W.;
Bertrand, D.; Rogniaux, H. Performance evaluation on a wide set of matrix-assisted laser
desorption ionization matrices for the detection of oligosaccharides in a high-throughput mass
spectrometric screening of carbohydrate depolymerizing enzymes. Rapid Commun. Mass
Spectrom. 2011, 25, 2059-2070.
(38) Karas, M.; Ehring, H.; Nordhoff, E.; Stahl, B.; Strupat, K.; Hillenkamp, F.; Grehl, M.;
Krebs, B. Matrix-assisted laser-desorption ionization mass spectrometry with additives to 2,5
dihydroxybenzoic acid. Org. Mass Spectrom. 1993, 28, 1476-1481.
(39) R Development Core Team R: A language and environment for statistical computing.
In R Foundation for Statistical Computing, http://www.R-project.org: Vienna, Austria, 2011.
(40) Callahan, A. M.; Scorza, R.; Bassett, C.; Nickerson, M.; Abeles, F. B. Deletions in an
endopolygalacturonase gene cluster correlate with non-melting flesh texture in peach. Funct.
Plant Biol. 2004, 31, 159-168.
(41) Zhou, H. W.; Ben-Arie, R.; Lurie, S. Pectin esterase, polygalacturonase and gel
formation in peach pectin fractions. Phytochemistry 2000, 55, 191-195.
(42) Jarvis, M. C.; Briggs, S. P. H.; Knox, J. P. Intercellular adhesion and cell separation in
plants. Plant Cell Environ. 2003, 26, 977-989.

25
(43) Peaucelle, A.; Braybrook, S. A.; Le Guillou, L.; Bron, E.; Kuhlemeier, C.; Hofte, H.
Pectin-Induced Changes in Cell Wall Mechanics Underlie Organ Initiation in Arabidopsis.
Curr. Biol. 2011, 21, 1720-1726.
(44) Ralet, M.-C.; Crepeau, M. J.; Buchholt, H. C.; Thibault, J. F. Polyelectrolyte
behaviour and calcium binding properties of sugar beet pectins differing in their degrees of
methylation and acetylation. Biochem. Eng. J. 2003, 16, 191-201.
(45) Pilling, J.; Willmitzer, L.; Fisahn, J. Expression of a Petunia inflata pectin methyl
esterase in Solanum tuberosum L-enhances stem elongation and modifies cation distribution.
Planta 2000, 210, 391-399.
(46) Derbyshire, P.; McCann, M.; Roberts, K. Restricted cell elongation in Arabidopsis
hypocotyls is associated with a reduced average pectin esterification level. BMC Plant Biol.
2007, 7, 31.
(47) Brummell, D. A.; Harpster, M. H. Cell wall metabolism in fruit softening and quality
and its manipulation in transgenic plants. Plant Mol. Biol. 2001, 47, 311-340.
(48) Lerouxel, O.; Cavalier, D. M.; Liepman, A. H.; Keegstra, K. Biosynthesis of plant cell
wall polysaccharides — a complex process. Curr. Opin. Plant Biol. 2006, 9, 621-630.
(49) Gunl, M.; Neumetzler, L.; Kraemer, F.; de Souza, A.; Schultink, A.; Pena, M.; York,
W. S.; Pauly, M. AXY8 Encodes an alpha-Fucosidase, Underscoring the Importance of
Apoplastic Metabolism on the Fine Structure of Arabidopsis Cell Wall Polysaccharides. Plant
Cell 2011, 23, 4025-4040.
(50) Pena, M. J.; Ryden, P.; Madson, M.; Smith, A. C.; Carpita, N. C. The galactose
residues of xyloglucan are essential to maintain mechanical strength of the primary cell walls
in Arabidopsis during growth. Plant Physiol. 2004, 134, 443-451.

26
(51) Maris, A.; Kaewthai, N.; Eklof, J. M.; Miller, J. G.; Brumer, H.; Fry, S. C.; Verbelen,
J. P.; Vissenberg, K. Differences in enzymic properties of five recombinant xyloglucan
endotransglucosylase/hydrolase (XTH) proteins of Arabidopsis thaliana. J. Exp. Bot. 2011,
62, 261-271.
FUNDING:
This work has been supported in part by funds from the program EU FP6 ISAFRUIT
(contract N° FP6-FOOD 016279-2).

27
Caption to figures
Figure 1 PCA analysis of sugar composition in the cell wall preparations from peach with
contrasted texture (A), from the Jalousia x Fantasia cross (B) and from the Texas almond and
Earlygold peach cross (C). 1) Neutral sugar and uronic acid content on the dry weight basis,
2) and 3) sugar composition on the molar percentage basis: 2) individual and 3) variable
maps. Minor contributions of sugars are not indicated on the variable map. Ellipses
correspond to 95% confidence region of individuals.
Figure 2 Mean MALDI-TOF MS spectrum of pectin lyase hydroyzate of peach/almond cell
walls. Only ions in their sodium adduct form are depicted except for oligomers of DP3
(DU3). Nomenclature of the ions is as described in the text.
Figure 3 PCA analysis of MALDI-TOF MS spectra from the pectin-lyase hydrolyzate of cell
wall preparations from texture contrasted peach. Left: individual map, right: variable map;
nomenclature as described in the text. Ellipses correspond to 95% confidence region of
individuals.
Figure 4 PCA analysis of MALDI-TOF MS spectra from the pectin-lyase hydrolyzate of cell
wall preparations from Jalousia x Fantasia cross. Left: individual map, right: variable map;
nomenclature as described in the text. Ellipses correspond to 95% confidence region of
individuals.

28
Figure 5 PCA analysis of MALDI-TOF MS spectra from the pectin-lyase hydrolyzate of cell
wall preparations from Earlygold peach x Texas almond. Left: individual map, right: variable
map, top: components 1 and 2, bottom: components 2 and 3; nomenclature as described in the
text. Ellipses correspond to 95% confidence region of individuals.
Figure 6 Mean MALDI-TOF MS spectrum of glucanase hydroyzate of peach/almond cell
walls. The nomenclature is as described in the text.
Figure 7 PCA analysis of MALDI-TOF MS spectra from the glucanase hydrolyzate of cell
wall preparations from texture contrasted peach. Left: individual map, right: variable map;
nomenclature as described in the text. Ellipses correspond to 95% confidence region of
individuals.
Figure 8 PCA analysis of MALDI-TOF MS spectra from the glucanase hydrolyzate of cell
wall preparations from the Jalousia x Fantasia cross. Left: individual map, right: variable
map, top: components 1 and 2, bottom: components 2 and 3; nomenclature as described in the
text. Ellipses correspond to 95% confidence region of individuals.
Figure 9 PCA analysis of MALDI-TOF MS spectra from the Texas almond and Earlygold
peach cross. Left: individual map, right: variable map; nomenclature as described in the text.
Ellipses correspond to 95% confidence region of individuals.

29
Table 1 Structure and Nomenclature Used to Refer to Hemicelluloses and to Pectic
Homogalacturonan Structures
Polysaccharides Chemical structure Code
Hemicelluloses Xyloglucan
Ga
X
L
F
Glucomannan
Hex
Hex
Xylan
Pen
u
Pectin Homogalacturonan
U
DU
Substituting groups
Methyl m
Acetyl
a
a Elementary building block of xyloglucan structures 43: XLFG is made of the linkage of X,
L, F and G elements. The number following Hex, Pen, m or a refers to the number of these
respective structures in the oligosaccharide
−β-D-Xylp-(14)-

30
Table 2 Correlation between Oligouronides Ion Intensity (X, Y) within the Three Groups of
Fruits: Contrasted Peach Varieties (A), Fantasia and Jalousia Peaches and Genotypes from
their Cross (B), Earlygold Peach and Texas Almond and Genotypes from their Cross (C).

31
Table 3 Correlation between Glucanase Maldi-TOF MS Ion Intensity (X, Y) within the Three
Groups of Fruits: Contrasted Peach Varieties (A), Fantasia and Jalousia Peaches and
Genotypes from their Cross (B), Earlygold Peach and Texas Almond and Genotypes from
their Cross (C).
X Y A B C
XLFG XXFG
0.82
XLFGa1 XLFGa2 0.77 0.72
XLLG Hex5a2
0.75
XLXGa1 XXG 0.82
XLXGa1 Hex6a1 0.76
XXFG XLFG 0.89
XXFGa1 XXFGa2 0.88
XXFGa1 XLXGa1
0.74
XXFGa1 XLFGa1
0.77
XLXG XLFGa2
0.73
XLXG XLLG
0.71
XLXGa1 XLFG -0.72
XXFGa2 XLFGa2
0.9
XXG Hex6a1 0.74
XXG XLFG -0.72
Hex6a1 Hex7a1
0.73

32
Figure 1
F2#94 Hybrid-like
!"#$%&'()#*$%&+),$*+
-*"'./&0/.1+
10 5 0 5 10
50
510
Dim 1 (70.69%)
Dim
2 (2
9.31
%)
Texas Almond
Earlygold Peach
F1#37 Hybrid
BC1#78 Non-juicy
F2#17 Peach-like
BC1#9 Juicy
F2#23 Almond-like
10 5 0 5
50
510
Earlygold Peach
Texas Almond BC1#9
Juicy
F1#37 Hybrid
F2#23 Almond-like
F2#17 Peach-like
BC1#78 Non-juicyF2#94
Hybrid-like
Dim 1 (67.07%)
Dim
2 (2
3.48
%)
3 2 1 0 1 2 3 4
21
01
23
Arabinose
XyloseGalactose
GlucoseUronic acids
20 15 10 5 0 5
105
05
10
F2#143 Round peach
F2#74 Round peach
F2#31 Flat peach
F2#210 Round peach
F2#25 Flat peach
Jalousia Flat peach
F2#178 Flat peach
Fantasia Round peach
F2#71 Round nectarine
Dim 1 (77.81%)
Dim
2 (1
5.6%
)
3 2 1 0 1 2 3
32
10
12
3
Arabinose
Xylose
GlucoseUronic acids
F2#82 Round nectarine
2 1 0 1 2
10
12
Arabinose Xylose
Galactose
Glucose
Uronic acids
6 4 2 0 2 4 6
64
20
24
6
Fibrous Round Peach
Non-melting pavie peach
Juicy Nectarine
Pasty Peach
Dim
2 (3
4.89
%)
2
!"#$%&'()#*$%&+),$*+
-*"'./&0/.1+
5 0 5 10
105
05
Dim 1 (58.98%)
Dim
2 (4
1.02
%)
F2#143 Round peach
F2#74 Round peach
F2#31 Flat peach
F2#178 Flat peach
F2#25 Flat peach
F2#71 Round nectarine
F2#82 Round nectarine
Fantasia Round peach
F2#210 Round peachJalousia
Flat peach
!"#$%&'()#*$%&+),$*+
-*"'./&0/.1+
6 4 2 0 2 4 6
64
20
24
6
Dim 1 (76.54%)
Dim
2 (2
3.46
%)
Juicy Nectarine
Pasty Peach
Fibrous Round Peach
Non-melting pavie peach
Dim 1 (62.28%)
3 4 5
0
6

33
Figure 2
600 800 1000 1200 1400
020
4060
8010
0
Mass (m/z)
Inte
nsity
(%)
DU
3m2(
Na-
H) 6
01D
U3m
3K 6
09D
U3m
2a1
621
DU
3m2a
1(N
a-H
) 643
DU
4m3
769
DU
4m4
783
DU
4m3a
1 81
1
DU
5m3
945
DU
5m4
959
DU
5m5
973
DU
5m3a
1 98
7D
U5m
4a1
1001
DU
5m3a
2 10
29
DU
6m5
1149
DU
6m4a
1 11
77D
U6m
5a1
1191
DU
7m3a
1/D
U7m
6 13
39D
U7m
6a1
1381

34
Figure 3
80 60 40 20 0 20 40 60
6040
200
2040
60
Juicy nectarine
Non-melting pavie peach
Pasty peach
Fibrous Peach
Dim 1 (66.77%)
Dim
2 (2
3.26
%)
20 10 0 10
100
1020
DU3m3K
DU4m4K
DU5m4
DU5m4a1DU6m5
DU6m5a1
DU7m6a1

35
Figure 4
100 50 0 50 100 150 200
100
500
5010
015
0
Fantasia Round peach
F2#74 Round peach
F2#82 Round nectarine
F2#143 Round peach
F2#178 Flat peach
F2#210 Round peach
Jalousia Flat peach
F2#71 Round nectarine
F2#31 Flat peach
F2#25 Flat peach
0 10 20 30 40 50
2010
010
2030
DU3m3KDU4m4K
DU5m4
DU5m4a1DU6m5a1
Dim 1 (74.21%)
Dim
2 (1
8.83
%)

36
Figure 5
0 5 10
42
02
46
8
DU3m3K
DU4m3
DU4m3a1
DU5m3
DU5m4
DU5m3a1
DU5m4a1
DU5m4a1(Na H)
DU6m5
DU6m4a1
DU6m5a1
DU6m5a1(Na H)
40 20 0 20 40 60
4020
020
40
Dim 2 (26.99%)
Dim
3 (1
0.45
%)
50 0 50 100 150
100
500
5010
0
Dim 1 (50.67%)
BC1#78 Non-juicy
BC1#9 Juicy
Earlygold Peach
F1#37 Hybrid
F2#17 Peach-like
F2#94 Hybrid-like
F2#23 Almond-like
Texas Almond
10 0 10 20
105
05
1015
2025
DU3m3K
DU3m2a1 DU4m3DU4m4K
DU4m3a1 DU5m4
DU5m4a1DU6m5a1
DU7m6a1
Dim
2 (2
6.99
%)
Texas Almond
F2#17 Peach-like
F2#94 Hybrid-like
BC1#9 Juicy
BC1#78 Non-juicy
F1#37 Hybrid
Earlygold Peach
F2#23 Almond-like

37
Figure 6
!"" #""" #$"" #%"" #&""
"$"
%"&"
!"#"
"#$
"
!"##$%&'()
*+,
-".$/0
. 112$/3.
4+5
67.
*+,
6".$83
0
192$360
*+,
:".$.;
661112$.;8
61<2$.;3
3
*+,
/".$.=
./1912$.=-
/1912".
$.=8
3
11<2$.03
01992$.-;
311<2".
$.-0
6
11<2"=
$.-/
/
19<2$.66
619<2".
$.63
/19<2"=
$.:0
3
>5?+5#@?A$%B)

38
Figure 7
!"#
$%$&'()*+,
-./(01
223
243-./5
-./501
2423
242301
2263
226301
22630%
2463246301
24630%
-./*
-./*01
!"# # "# $# %#
!"#
#"#
$#
!"#$1$&(*)*+,
100 50 0 50
500
5010
0
Juicy nectarine
Pasty peach
Non-melting pavie peach
Fibrous peach

39
Figure 8
!"#
$%$&'()*+,
!" # " $# $" %# %" &#
!$"
!$#
!"#
"$#
-./01' -./21'
343534351'
3365
33651'
33651%
346534651'
34651%
!"#$'$&*7)*+,
100 50 0 50 100 150
100
500
5010
0
Fantasia
25 Flat peach
31 Flat peach
71 Round nectarine
74 Round peach
82 Round nectarine
143 Round peach
178 Flat peach
210 Round peach
Jalousia
60 40 20 0 20 40 60
4020
020
4060
Dim
3 (8
.9%
)
Fantasia
F2#25
F2#31
F2#71
F2#74
F2#82 F2#143
F2#178
F2#210
Jalousia
Dim 2 (13.5%)10 5 0 5 10
105
05
10
Hex4a1
XXG
Hex6a1 XLXG
XLXGa1
XXFG
XXFGa1XXFGa2
XLFG
XLFGa1
XLFGa2

40
Figure 9
!"#
$%$&'()%*+
!"# !$# # $#
!%#
#%#
$#
&#
"#
'#
,-./01
2324232401
225401
22540%
235401
23540%
!"#$1$&/6)6*+
100 50 0 50 100 150 200
100
500
5010
015
0
BC1#78 Non-juicy BC1#9
Juicy
Earlygold F1#37 Hybdrid
F2#17 Peach-like
F2#94 Hybrid-like
F2#23 Almond-like
Texas

41
TOC Graphic
!"#$%!"&$#'(
!"%$)
80 60 40 20 0 20 40 60
6040
200
2040
60
Juicy nectarine
Non-melting pavie peach
Pasty peach
Fibrous Peach
!")$)* !"%$)'(!"+$+*
!"#$%'(
!,$
-.-/.+
0+1
2
!,$-(-/##0312
4567,85
95:)'(
;;<
;=< 95:#
95:#'(
;=;<
;=;<'(
;;><
;;><'(
;;><'.
;=><;=><'(
;=><'.
95:%
95:%'(
100 50 0 50
500
5010
0
Juicy nectarine
Pasty peach
Non-melting pavie peach
Fibrous peach
!,$
-.-/+)
0%1
2
!,$-(-/)%0%12
95$,65??@?AB5
Copyright © 2022 FDOKUMEN