The growth and composition of the tops of peach trees in sand ...
79
West Virginia Agricultural and Forestry Experiment Station Bulletins Davis College of Agriculture, Natural Resources And Design 1-1-1945 e growth and composition of the tops of peach trees in sand culture in relation to nutrient-element balance D. S. Brown Follow this and additional works at: hps://researchrepository.wvu.edu/ wv_agricultural_and_forestry_experiment_station_bulletins is Bulletin is brought to you for free and open access by the Davis College of Agriculture, Natural Resources And Design at e Research Repository @ WVU. It has been accepted for inclusion in West Virginia Agricultural and Forestry Experiment Station Bulletins by an authorized administrator of e Research Repository @ WVU. For more information, please contact [email protected]. Digital Commons Citation Brown, D. S., "e growth and composition of the tops of peach trees in sand culture in relation to nutrient-element balance" (1945). West Virginia Agricultural and Forestry Experiment Station Bulletins. 322. hps://researchrepository.wvu.edu/wv_agricultural_and_forestry_experiment_station_bulletins/325
-
Upload
khangminh22 -
Category
Documents
-
view
1 -
download
0
Transcript of The growth and composition of the tops of peach trees in sand ...

West Virginia Agricultural and Forestry ExperimentStation Bulletins
Davis College of Agriculture, Natural ResourcesAnd Design
1-1-1945
The growth and composition of the tops of peachtrees in sand culture in relation to nutrient-elementbalanceD. S. Brown
Follow this and additional works at: https://researchrepository.wvu.edu/wv_agricultural_and_forestry_experiment_station_bulletins
This Bulletin is brought to you for free and open access by the Davis College of Agriculture, Natural Resources And Design at The Research Repository@ WVU. It has been accepted for inclusion in West Virginia Agricultural and Forestry Experiment Station Bulletins by an authorized administrator ofThe Research Repository @ WVU. For more information, please contact [email protected].
Digital Commons CitationBrown, D. S., "The growth and composition of the tops of peach trees in sand culture in relation to nutrient-element balance" (1945).West Virginia Agricultural and Forestry Experiment Station Bulletins. 322.https://researchrepository.wvu.edu/wv_agricultural_and_forestry_experiment_station_bulletins/325


September 1945
The Growth and Composition of the
tops of Peach Trees in Sand Culture
in Relation to Nutrient-element
Balance
BY
D S. BROWN
Agricultural Experiment Station
College of Agriculture, Forestry, and Home Economics
West Virginia University
C. R. Orton, Director
Morgantown

TABLE OF CONTENTS
Page
Introduction. 3
I. Growth of the treesMaterials and methods 4
Appearance of the trees in the deficiency series 8
Measurements of growth 14
II. Composition of the trees
Methods*
.
• 26
The amount of the elements in the tops 28The relations between the elements 44
III. The relation between growth and composition 50
The diagnosis of deficiencies 58Summary. 60
Literature cited 63
Appendix tables • • 65
NOTE
The following dissertation was presented in partial fulfillmenlof the requirements for the degree of Doctor of Philosophy in theGraduate School of Ohio State University.
ACKNOWLEDGMENT
The assistance of the following is gratefully acknowledged:Professor F. S. Howlett, Department of Horticulture and Forestry,Ohio State University; Professors R. S. Marsh and R. H. Sudds,Department of Horticulture, West Virginia University; and Mr.James Stone, a former student. The courtesies of the Departmentsof Horticulture, of Agricultural Biochemistry, and of Agronomyand Genetics at West Virginia University and of the Department ofHorticulture at the University of Illinois are also acknowledged.

THE GROWTH AND COMPOSITION OF THE TOPS OF PEACHTREES IN SAND CULTURE IN RELATION TO
NUTRIENT-ELEMENT BALANCE
by D. S. Brown
INTRODUCTION
The concept of a balance in nutrient-element relation-ships has evolved as the result of the frequently demonstrat-ed interdependence of the elements in their effects on plantgrowth. Its significance in relation to fruit trees, al-though indicated, at least indirectly, by a number of inves-tigations ( e.g ., 1, 2, 6, 9, 15, 16, 19) has not been fullyevaluated. The objective of this investigation has been,therefore, to attain a better understanding of balance and,
more specifically, to evaluate its significance with respectto the elements nitrogen, phosphorus, potassium, and calciumin relation to the growth and composition of young peach trees.
Unfortunately, perhaps, balance has been subject to avariety of interpretations, ranging from those which are quitedefinite in conveying the idea of a fixed proportionality tothose which are indeterminate in their implication of somevariable sort of equilibrium between the elements. As a con-sequence, the term frequently has been ambiguous. The diffi-culty, however, seems to have resulted not so much from thevariability in the implications of the term as from its fre-quent use without enough definition or qualification to in-dicate the nature of the relationships which it was intendedto describe.
In this investigation, balance is considered essentiallyas a modification of the principle of limiting factors appliedto nutrient-element relationships. In applying this principleit is obvious that the degree of effectiveness of the nutrient-element supply is limited ultimately by the other environmen-tal factors and by the genetic nature of the plant. Conse-quently, for a given plant in a given environment there is amaximum amount of growth which will result when none of theelements is limiting. That combination of elements in whichnone of them is limiting constitutes the nutrient-elementsupply with the highest intensity of balance. Such a supplyis defined as that one with which results the maximum amountof growth possible within the limits of other environmentalfactors and of the genetic nature of the plant. Nutrient-

element balance, therefore, is always to be qualified, by
implication at least, by the limiting effect of the genetic
nature of the plant and by environmental factors other than
the nutrient-element supply.
Theoretically, at least, the nutrient-element supply
with the highest intensity of balance should be composed ofone and only one combination of the elements, each of which
is available in its proper amount. Therefore, if the supply
of any given element were deviated to a level either above
or below its proper amount, that element would then become
limiting, and a reduction in growth should result. However,within the limits of such an altered supply of the element
there also should be a maximum amount of growth which is
possible, but which is less than that resulting when the sup-
ply of the element is at its proper level under conditions
of the highest intensity of balance. For those conditions
in which an element is limiting, a balanced nutrient-elementsupply of a comparatively lower intensity may be defined,
therefore, as that one with which results the maximum amount
of growth possible within the limits of the supply of that
element
.
The application of the principle of limiting factors to
the concept of balance thus provides for a number of balanced
nutrient-element supplies of comparatively different inten-
sities, each of which may be defined and qualified by the
factors limiting growth. Such a provision is desirable be-
cause the maximum growth which results for a given plant in
a given environment when none of the nutrient elements is
limiting may not be of the type or quality actually desired;
for example, such growth might not be as conducive to fruit-fulness as the lesser growth which would result with a nutri-
ent-element supply of a lower intensity of balance.
I. GROWTH OF THE TREES
Materials and Methods
The experiment was conducted in a greenhouse of the De-
partment of Horticulture at West Virginia University. One-
year-old budded Elberta peach trees were planted on April 5
and 6, 1940. They were headed back at 18 inches above the
bud union and all laterals were removed. The roots were

washed free of dirt and pruned just enough to permit themto fit easily into the 4-gallon galvanized garbage pails inwhich the trees were planted. A total of 114 trees were used,
although only 108 were included finally in the experimentproper. The other six were planted so that reserves wouldbe available if any of the trees did not start properly. Thetrees were remarkably uniform in appearance.
The pails, which were coated on the inside with a pe-troleum asphalt, were fitted with a glass tube in the bottomfor drainage. The roots of the trees were covered to a pointapproximately an inch below the bud union with a fine quartzsand which was obtained from a glass factory in Morgantown,West Virginia. After the trees were planted the sand wasflushed thoroughly with water. Rain water which was divertedfrom the roof of the greenhouse into a large, asphalt-lined,concrete bin was used throughout the experiment.
The pails were arranged on supports on a concrete benchin the greenhouse. The supports were so constructed that aquart Mason jar could be placed underneath the pails, belowthe drainage outlet. At the beginning of the season thetrees were arranged in tiers of four across the bench, 28tiers in all, but later half of them were moved to anotherbench in the same house. At that time, they were arrangedin tiers of two across each bench so as to give maximum roomfor each tree.
There were 54 different treatments which represent allthe possible combinations of three concentrations each ofnitrogen, phosphorus, and potassium and two of calcium.There were two trees per treatment. The concentrations inparts per million in the culture solutions are given inTable 1.
Stock solutions of Ca(N03) 2 , CaCl2 , Mg(N03 ) 2 , MgS04 ,
MgHP04 , KHgP04 , EC1, and Kg3^* and Ca-acetate were used inthe preparation of the culture solutions. Manganese andboron were supplied from a stock solution of MnS04 and H3BO3.Ferric citrate was used as a source of iron.
No attempt was made to control the total concentrationof the solutions. Obviously those with the highest concen-trations of the elements had higher osmotic pressures thanthe more dilute solutions. Likewise, the initial pH of the
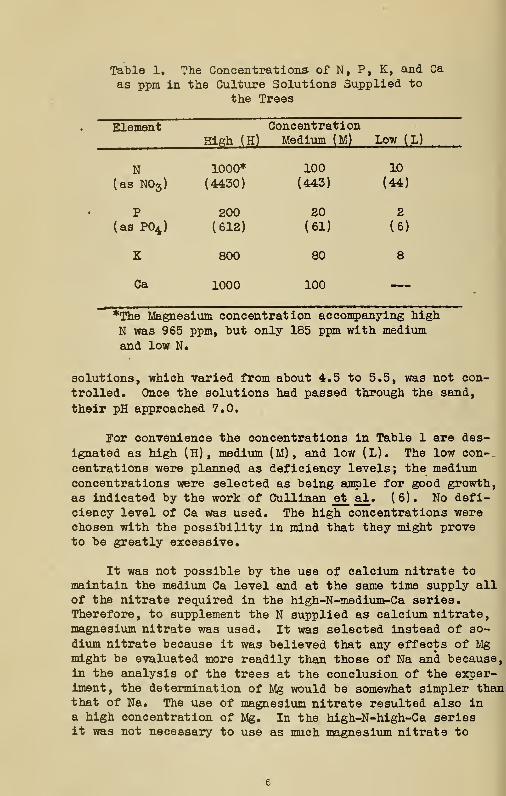
Table 1. The Concentrations of N, P, K, and Ca
as ppm in the Culture Solutions Supplied to
the Trees
ElementHigh (H)
ConcentrationMedium (M) Low (L)
N(as N03 )
1000*
(4430)
100
(443)
10
(44)
P(as P04 )
200(612)
20(61)
2
(6)
K 800 80 8
Ca 1000 100
*The Magnesium concentration accompanying high
N was 965 ppm, but only 185 ppm with mediumand low N.
solutions, which varied from about 4.5 to 5.5, was not con-
trolled. Once the solutions had passed through the sand,
their pH approached 7.0.
For convenience the concentrations in Table 1 are des-
ignated as high (H) , medium (M), and low (L). The low con-
centrations were planned as deficiency levels; the mediumconcentrations were selected as being ample for good growth,as indicated by the work of Cullinan et al . (6). No defi-ciency level of Ca was used. The high concentrations werechosen with the possibility in mind that they might proveto be greatly excessive.
It was not possible by the use of calcium nitrate tomaintain the medium Ca level and at the same time supply allof the nitrate required in the high-N-medium-Ca series.Therefore, to supplement the N supplied as calcium nitrate,magnesium nitrate was used. It was selected instead of so-
dium nitrate because it was believed that any effects of Mgmight be evaluated more readily than those of Na and because,in the analysis of the trees at the conclusion of the exper-iment, the determination of Mg would be somewhat simpler thanthat of Na. The use of magnesium nitrate resulted also ina high concentration of Mg. In the high-N-high-Ca seriesit was not necessary to use as much magnesium nitrate to

maintain the N concentration because more calcium nitrate
could be used; however, the Mg level was made equal to that
in the high-N-medium-Ca series by the use of magnesium sul-
fate. It was thought that this level of Mg might prove to
be undesirably high, expecially when Ca was medium, so the
Mg concentration of the medium and low N series was reduced
to a uniformly lower concentration throughout those two se-
ries (Table 1).
About the middle of August the supply of ferric citrate
on hand was depleted; ferric sulfate, which was available,
was substituted. About two weeks later certain trees began
to show signs of excessive wilting. However, most of those
affected wilted only during the day and recovered at night.
It was learned later that peach trees in sand culture are
not tolerant to ferric sulfate (5), although apple trees
apparently will withstand a considerable concentration of
the salt. The few trees which were most severely affected
were partly defoliated at the time they were harvested, which
was about ten days after the first wilting was observed.
Since differences in growth were definitely established be-
fore the wilting occurred, the growth relations of the trees
under the different treatments were not altered. The wiltingalso had no apparent effect on the results of the chemicalanalyses. It is believed that the trees were harvested be-
fore any major alterations in their composition had occurred.
One quart of water was applied daily to each tree untilApril 13, on which date a similar application of the solutioncontaining the lowest concentrations of all four elements
was begun. New shoots developed rapidly within the next
two weeks. All but three of the strongest were removed from
each tree, an effort being made to leave shoots which were
spaced at intervals along the trunk. With but one or two
exceptions, all those selected continued to develop.
On April 27 the differential treatments were assignedto the trees at random with the restriction that no two re-
ceiving the same treatment were adjacent. At first, each
tree received one quart of solution daily, poured on the sur-
face of the sand. The leachings were collected, made to
volume with water, and reused once. Beginning May 31, the
quart which was prepared from the preceding leachate was
applied at 8 a.m.; this was followed at 4 p.m. by the appli-
cation of another which was freshly prepared. Beginning in
July, the largest trees were using considerable water as
evidenced by the fact that the solution applied in the after^

noon did not leach through; these were given a quart of wa-
ter about 2 p.m. whenever the day was bright and warm. The
sand in all the pails was flushed with water once a week.
The diameters of the trunks were measured at a point
just above the bud union at planting time, two measurements
being taken at right angles to each other. They were meas-
ured again just before harvest. The increase in diameter
was calculated, and the values for the two measurements on
each trunk were averaged. The length of the shoots to the
nearest five millimeters was measured a few days before the
trees were harvested.
Harvest was begun on September 7 and completed on Sep-tember 13. The tops of 27 trees were sampled on each of the
first four days. The leaves were stripped from the shoots
in the morning, after which the tops were cut off at the
bud union and separated into shoots and trunks. The woodwas split into small sections. The samples vjere put into
cheese-cloth sacks and placed in a forced-draft oven at a
temperature of 100-105° C. Leaf samples were left in theoven for 20 to 30 minutes, the wood samples 30 to 35 minutes.The number of samples prepared at any one time was adjustedso that a new lot could be placed in the oven when the pre-ceding lot was removed. After the samples were taken fromthe oven they were hung in a drying room used by the Depart-ment of Agronomy and Genetics for drying large numbers of
samples. The temperature of this room was variable between50 and 60° C.
After all of the tops were harvested, the roots wereremoved from the sand, washed, and weighed. The fine roots,approximately 2 to 3 mm and under in diameter, were separatedfrom the larger roots, which included the stock below thebud union; both lots were treated in the same mariner as thetops.
All of the samples were removed from the drying roomafter about two weeks, then weighed.
Appearance of the Trees in theDeficiency Series
The trees as a whole grew well and reacted quickly tothe different treatments, the duplicates being remarkablysimilar. As the season progressed, the slower growth and

the development of characteristic symptoms by the trees in
the deficiency series became especially noticeable.
The low-N series : Nitrogen deficiency symptoms were
apparent among the trees of the low-N series by the middle
of May; the leaves were lighter green than those on trees
receiving more N. The linear growth of the shoots was slow;
only a few laterals to the main shoots developed. Maximum
growth for most of the trees of this series was reached by
the middle of July. Figure 1 shows a typical low-N tree at
harvest time.
By the first of June there was a noticeable difference
in condition of the foliage between the trees of the low-N
series receiving high Ca and those receiving medium Ca.
Both groups showed the light yellowish-green foliage char-
acteristic of N deficiency, but the symptoms were more pro-
nounced on those trees receiving high Ca. In addition, the
margins of the leaves in this group were mottled with yellow;
eventually the margins and the tips of these leaves became
brown and paper thin. Many of the leaves dropped and some
of the laterals of the low-N-high-Ca trees were nearly de-
foliated except for a few leaves near the terminals. A fewshoots began to die back from the tips. None of the injury
was shown by the leaves or shoots of the trees receivinglow-N-medium-Ca ( compare Fig. 1 and 2)
.
Because it was impossible to supply all of the Ca in
the low-N-high-Ca series as calcium nitrate and so also
maintain the low-N supply, the Ca in the N-deficient solu-
tions was supplied as calcium chloride. Therefore it was
thought that the injury might be the result of high chlo-
ride concentrations (10, 11, 12). With that in view, one
half of the trees in this series was supplied, beginningon June 17, with solutions in which calcium acetate was used
for the additional Ca needed to raise the level from mediumto high. The #2 trees in the low-N-high-Ca series as listed
in the Appendix Tables 1 to 8 received the acetate. In a-
bout two weeks there were definite indications that the
progress of the injury had been stopped or at least checked
considerably on the trees to which the acetate had been
applied. However, those trees produced only very little
or no new growth, whereas the chloride trees made some ad-
ditional growth later in the season, even though they were
partly defoliated. The differences between the trees were
also indicated in the analyses of the tissues (Appendix
Tables 3 to 8). The trees receiving the acetate were con-

CC
•H
CO
-p
s
60
P
IHft
CD
CD
U to-P
S «)
£ P-H
O
-a
I
i
I3
•HPn
(3 -p
03
• Pto
pq
CO
60
10

<*
<t-l
o
CO
CD
o
en
CD
>Ctj
CDHHcd
Pi
CD
•P
CD
-PO
CD
CD
U-P
do
CD
OrH
to
uCD
(D
iHCO
CD
-Po m
o• ^
t£> CQ
• -PtiD en
•H ©(^ t£
CD
cd
Io
P^•H
11

LO
\9
w
5H
wfr
a•H
<D
muPX!-P•H>
t*© CO
U CD
ort CD
I1
-Poo crto,3 l
() •HPi ^to 1
x) 1
a) 3o Orf HT3CD
CD
>•H-P
CD
f-l
CD
PO
oi
i3
1i
CO
CD
>a)
<t-i
oCD
O
cd
COCD
O^!IPOto
•H
I
CO
•H
12

00W)•H •
fr .to':
•Hrf NP•H ,3J; -P
•H<D 5hcd
sg ert
O &O £3oo
CD
M)
£CO ,
0)
•H CO
Fh CD
0) •HCO (4
CD
a CO
r-j t__^
Q f-\
•H A<d W01 •He .3
hi CD
,2 .3-P PPJ a•H •H
CO CO
CD CD
CD
FH Fhp pFH &CD CD
•P -P-P PCD CD
^ PCD CD
,3 rfP P<*H <MO O
CD ©
<§Pio
tiiH
13

siderably lower in N and P, but not consistently lower in
K, Ca, or Mg. (See Figs. 2 and 3 for comparison of low-N-
high Ca trees with and without calcium acetate as they ap-
peared at harvest time.)
It should be noted that the trees receiving high Ca in
the medium-N series were supplied with almost as much cal-
cium chloride as those which were injured in the low-N series
However, the medium N trees showed no signs of the injury.
Apparently, the injurious effect of the chloride was offset
by medium N.
The low-P series : Symptoms of phosphorus deficiency
developed more slowly than those of N deficiency. Distinct
symptoms of P deficiency were not evident on the trees of
the low-P series until mid-July. The leaves of these trees
were a dull, somewhat purplish green. The terminal leaves
were leathery in texture; their shape was long and narrow;
they were flat and unwrinkled, extending stiffly at right
angles to the axis of the shoot (Fig. 4) . The shoots, which
were stiff and woody, were short and only slightly branched.
Maximum growth was attained in most of the low-P trees by
mid-July.
The low-K series : By the middle of July, the youngest
leaves of the low-K trees were smaller than comparable leaves
on trees receiving more K. A few of the terminal leaves were
slightly rolled. The newer shoot growth was long and slendei
(Fig. 5). The foliage of the low-K-high-Ca trees became
marked in the interveinal areas by small necrotic lesions
which dropped out and gave a shot-hole appearance to the
leaves (Fig. 7). The necrosis did not appear when low K wasaccompanied by medium Ca, low P, or low N. The low-K-medium-
Ca trees made less growth than those receiving low-K-high-Ca (Figs. 5 and 6); the reduced growth of the low-K-medium-Ca trees was especially noticeable in the high-N series.
Maximum growth on those trees was reached by mid-June, where-
as other low-K trees continued growth until harvest. Whenthe P supply as well as K was deficient, the trees showed
only symptoms of P deficiency.
Measurements of Growth
Data for the length and the dry weight of shoots arepresented in the text in Table 2, which is a summary of thedata for the measurements as presented for individual trees
14

in Appendix Table 1.* The sunmary was made by averaging thedata for each of the primary treatments, N, P, K, and Ca, andfor their interactions, HP, NK, PK, NCa, PCa, KCa, NPCa, NKCa,and PKCa. To obtain the averages, the data for the 108 treesin the experiment were arranged in groups, each of which in-cluded the figures for those trees receiving a particular lev-el of one element, or the particular levels of more than oneelement in the case of the interactions. The data for eachgroup were averaged to obtain the summary data for those treesreceiving the treatment common to that group. Thus, to ob-tain the averages for high, medium, and low N the trees weredivided into three groups of 36 trees, one for each of thelevels of N; averages for each of the three levels of P andK were obtained from similar groups of 36 trees. For Ca therewere two groups of 54 trees each, one for each of the twolevels of that element.
The number of trees included in each average for the in-teractions depended upon the number of elements consideredin the interaction and the levels at which each was supplied.Thus, for the NP interaction involving two elements each withthree levels of supply, there were 9 groups of 12 trees each,representing those groups of trees receiving high-N-high-P,high-N-medium-P, high-N-low-P, medium-N-high-P, etc. Sim-ilarly, the averages* for the NK and the PK interactions wereobtained from groups of 12 trees each, with a total of 9
groups for each interaction. For the NCa, PCa, and KCa in-teractions, two elements also were involved, with Ca at twolevels of supply and the others at three, so that there were6 groups of 18 trees from which the averages were obtained.For each of the interactions NPCa, NKCa, and PKCa, there were18 groups of 6 trees each for which averages were obtained.
Table 2 is in effect a series of subtables each of whichis designated by the letter or letters of a primary treat-ment or interaction. The averages for the primary treatmentsindicate the general effects of each element individually.Their interactions indicate the manner in which the individualeffects were modified by the effects of the other elements.If, for example, it is desired to determine the effects of N,
*Data for measurements of trunk diameters, dry weight oftrunks and roots, and dry weight per unit length of shootsalso are presented in Appendix Tables 1 and 2. Only the da-ta for the length and dry weight of shoots are used in thediscussion, since they are, for the most part, representativeof the other measurements of growth.
15

Table 2a. Total Length and Dry Weight of Shoots. Averagesfor Primary Treatments and their Interactions
Treatment Total Dry Trea tment Total DryLength of Weight Length of Weight
• Shoots of Shoot a c • Shoots of Shoots9
g
oCo
cm gm 9§
oco
cm gm
ri o H oM .
W
R H 641 59.5 NCa HH 753 63.7M 957 109.9 MH 1026 113.5L 184 13.7 LHm
MM
194530889
12.955.4
P H 812 79.2 106.3Iff
L742228
79.824.1
LM 174 14.6
PCa HH 918 85.7K" 5 688 77.8 MH 811 79.1
M 667 70.9 LH 243 25.3L 427 34.4 m
MMLM
707674212
72.780.5
Ca HM
657531
63.458.7
23.0
EC's HH 642 66.3TO m 882 77.2 MH 744 75.9
HM 810 75.8 LH 587 48.0HL 232 25.5 HM 734 89.4MS 1388 149.5 MM 591 66.0MMML"TB
1204281168
146.533.710.9
•LM 266 20.8
NPfla HHil 1089 92.4LM 213 17.2 HMH 940 74.4LL 170 13.2 HLH 229 24.4
MHHMMH
14811279
154.8tfK HH 843 85.4 147.2
HMHL
701379
68.224.9
MLH 319 38.7LHH 185 9.9
MH 1031 134.4 LMH 214 15.8MM 1114 120.1 LLH 182 13.0ML"TH-
728190
65.313.7 HHH 675 62.1
US 188 14.5 HMM 680 77.3LL 173 13.1 HLM 234 26.7
MSWMMM
12941129
144.2PR HH 958 102.7 145.8
HMHL
910569
90.744.3
MLM 243 28.8LHM 151 11.9
MH 859 103.8 LMM 213 18.5MMML
852516
95.840.0
LLM 158 13.4
LH 248 25.4LM 240 26.4LL 195 19.0
16

Table 2b. Total Length and Dry Weight of Shoots. Averagesfor Primary Treatments and their Interactions
Treatment•pa
W
oa
TotalLength of
Shootscm
DryWeightof Shoots
gm
Treatment
H
ofl
oo
Total DryLength of Weight
Shoots of Shootscm gm
AKcT "5I3T815630
74.742.0
TKCa"HMHHLH
~558~1045783
"9373"
99.561.3
HMHHLHMHH 912 111.5HMH 1210 138.6MLH 957 90.7tHH 201 13.0LMH 206 14.4LLH 174 11.4
HHW 874 96.3HMH 587 61.9HIM 128 7.8HSU 1150 157.5MMM 1017 121.5MLM 499 39.8LHM 180 14.5IMM 170 14.6LIM 172 14.8
WHH 772 79.9MMH 930 100.7MLH 730 56.8LHH 226 22.7IMH 256 27.4LLH 249 25.9
BHW 988 109.1HMM 776 81 .8HLM 355 27.2HSH 946 127.5MMM 773 90.8MLM 302 23.2IBM 269 31.5LMM 225 25.4LIM 142 12.0
the data designated by N are examined first. Then to de-termine in what manner, if any, P modified the general ef-fects of N, the NP group is considered. By examining theNPCa group it is possible to determine whether or not therelationships of N and P were different at the two Ca levels,
The data for the dry weight and the total length ofshoots from Table 2 are also presented in Graphs 1 and 2,which are composed of a series of subgraphs correspondingto the primary treatments and their interactions with theexception of the higher interactions, NPCa, NKCa, and PKCa.
The Effects of N ; The average effects of N are appar-ent in subgraph N, Graphs 1 and 2. Growth (dry weight andtotal length of shoots) was at a maximum when N was medium;it was least when N was low and intermediate when N was high(see also Figs. 1, 8 and 9). The effects of N were compar-atively the same regardless of the supplies of P, K, or Ca(Graphs 1 and 2, UP, NK, bars 1:4:7, 2:5:8, 3:6:9; NCa, bars1:2:3, 4:5:6); that is, regardless of P, K, or Ca, growthwas always at a maximum when N was medium.
The intermediate amount of growth with high N indicates
17

Graph 1. Total Length of Shoots. Averages forPrimary Treatments and their Interactions
N P K Ca NP NK1400
1200
1000ca
*« n i-i
© ~1 -i ~l
5 r rh n43 oOOc ~l0)
w 40U -i
123 123 123 12 123 456 789 123 456 789N HML HHH MMM LLL HHH MMM LLLP HML HML HML HMLK HML HML HML HMLCa HM
Treatment
1400 PK NCa PCa Kfia
ionn
innn n-i n
*• n-. n43 OL,U
a> _, [~| r
43 ouu -
c n ror-> don
pnn fTl ~1 -i
123 456 789 123 456 123 456 123 456N HML HMLP HHH MMM LLL HML HMLK HML HML HML HML HMLCa HHH MMM HHH MMM HHH MMM
Treatment
18

Graph 2. Dry Weight of Shoots. Averages forPrimary Treatments and their Interactions
N P K Ca NP NK160
l~hJ.4VJ
r-
±<J(J
loo-
s' 80-cd
e> 60-.
40-
20-
ri
-
1
_.
Li |f" rm
NPKCa
123 123 123 12 123 456 789 123 456 789HML HHH MMM LLL HHH MMM LIL
HML HML ML HMLHML HML HML ML
HMTreatment
PK NCa PCa KCa160 -
140-
120-|-i
100
-
—
pir-|
E oO _
r -,
O 60-i-
-i
40-
r-n —
i
cO-
]_ 1NPKOa
123 456
HHH MMMHML HML
789 123 456 123 <
HML HMLLLL HML I
HMLHHH MMM HHH H
Treatment
156 123 456
MLHML HML
IMM HHH MMM
19

that that level of N was excessive. Two other factors, how-
ever, may also have contributed to this result. First, the
concentration of magnesium was higher, and second, the total
concentration of the solutions was greater in the high than
in the medium-N series. If these factors had been of pri-
mary importance in limiting the growth of the high-N trees,
it seems likely that they also should have altered the ef-
fects of variations in the supplies of other elements, so
that the growth within the high and the medium-N series as
affected by other elements would also have differed markedly.
However, the effects of other elements on the growth with-
in the two series were fundamentally similar. Therefore it
seems likely that any limiting effects of the magnesium
supply or of the total concentration of the solutions were
of a secondary nature and, if anything, merely intensified
the limiting effect of the high N.
Nitrogen evidently was the most important of the ele-
ments as a determinant of growth. The others became impor-
tant only as they influenced growth within the limits of
the N supply. As a result, the intensity of balance in the
nutrient-element supplies was dependent first on N. The
solutions with the highest intensity of balance obviously
were among those of the medium-N series, since maximumgrowth resulted under conditions of medium-N.
The Effects of K and Ca ; K and Ca were so markedly in-
terdependent in their effects on growth that they must be
considered together. Consequently their effects are shown
best by the KCa, NKCa, and PKCa interactions in which both
elements are included as variables. Examination of the
averages for those interactions shows that from the stand-
point of maximum growth, two combinations of K and Ca were
of nearly equal effectiveness. Those combinations were
high-K-medium-Ca and medium-K-high-Ca (Graphs 1 and 2, KCa,
HM, and ME; Table 2, NKCa, PKCa).
A more detailed consideration of these relationshipscan be approached in two ways: first, as to the effects of
an increasing K supply when Ca was at a given level, and
second as to the effects of an increasing Ca supply when Kwas at a given level. Thus, using the first approach, whenCa was medium, an increase in the K supply from medium to
high resulted in an increased growth, but when Ca was high,
it resulted in a decreased growth (Graphs 1 and 2, Table 2,
KCa) . On the other hand, an increase in K from low to medi-
um resulted in an increased growth at both levels of Ca;
20

however, the increase was comparatively greater at mediumthan at high Ca. Evidently, any increase in K was most ef-
fective in promoting growth when Ca was medium.
The intensity of the effects of increasing E appear to
have been influenced also by the N supply (Table 2, NECa).
Increase in growth with increasing K was comparatively great-
er at high-N-medium-Ca than at medium-N-medium-Ca. Appar-ently, under the' conditions of medium Ca, the high level
of E was more favorable, relatively, to growth at high than
at medium N. Under conditions of high Ca, also, the highlevel of E was comparatively more favorable to growth at
high N. This effect is indicated by the fact that the de-
pression in growth which resulted with high K at medium-N-high-Ca was not shown at high-N-high-Ca ; under the latterconditions, therefore, high K was less detrimental (compara-tively beneficial) since it did not decrease growth as at
medium-N-high-Ca. It is possible, of course, that E witheither level of Ca was comparatively more favorable to growthat high N because it reduced or offset any deleterious ef-
fects of the higher Mg supply which accompanied high N; per-
haps, if the Mg supply had been the same with high and me-dium N, there would have been no apparent difference in the
intensity of the effects of increasing K. At low N the ef-
fects of K were minimized, since growth was so limited by
the N deficiency; maximum growth within the limits of lowN usually resulted, however, when E was medium.
The relations of E and Ca will now be considered fromthe other point of view, that of the effects of increasingCa when E was at a given level. When E was low, growth in-
creased markedly with an increase in the Ca supply (Graphs1 and 2, Table 2, KCa). A similar though less pronouncedincrease in growth with increasing Ca resulted when E wasmedium. When K was high, however, growth decreased with in-
creasing Ca.
As with the effects of increasing E, the intensity of
the effects of Ca also appear to have been affected by the
N supply (Table 2, NECa) • The increase in growth which re-
sulted with increasing Ca at both low and medium E levelswas more pronounced when N was high than when N was medium.The decrease in growth with increasing Ca at high E was rel-atively less when N was high so that comparatively, high Ca
was less detrimental (relatively more beneficial) to growthat high-N-high-E than at medium-N-high-E. Thus, at allthree levels of E, high Ca tended to be more favorable, rela-
21

tively, to growth when N was high than when N was medium.
It is possible, however, that the intensity of the Ca ef-
fects was modified not so much by the high N level itself
as by the higher Mg supply which accompanied high N. At low
N the effects of Ca were minimized by the marked limiting
effect of the N deficiency.
The effects of both K and Ca and their interrelations
were not altered appreciably by the level of the P supply
(Table 2, PKCa).
As determinants of growth, K and Ca apparently werenext to N in importance. The growth which resulted withinthe limits of any level of N was determined by the relation-ship between K and Ca. The highest intensities of balance
with respect to those two elements occurred with high-K-medium-Ca and mediumr-K-high-Ca, the combinations which re-
sulted in maximum growth. The lowest intensities of balancewith respect to K resulted when K was low; however, the in-
tensity of balance at low-K-high-Ca was greater than at low-
K-medium-Ca.
The Effects of P ; The growth of the trees receivingsolutions deficient in P was much less than that of treessupplied with higher levels of that element (Graphs 1 and 2,
Table 2, P). There was no significant difference in growthbetween the trees receiving medium and high P. Apparently,the medium P supply was sufficient with respect to maximumgrowth.
The effects of P were not altered appreciably by N, K,
or Ca (Graphs 1 and 2, Table 2, MP, PK, PCa, NPCa, PKCa).It is perhaps worthy to note, however, that when both K andCa were high there was an indication that growth was greaterat high than at medium P (Table 2, PKCa, HHH:MHH) ; the dif-
ference is not great enough, however, to be more than in-dicative of a possible trend. It will be shown later thatthe quality of growth at the two higher P levels differedeven though the quantity was practically the same.
As a determinant of growth, P was apparently the leastimportant of the four elements used as variables. The lowestintensities of balance with respect to the P supply resultedwhen P was low. On the other hand, the highest intensitieswith respect to that element resulted when its supply waseither medium or high. No real distinction between mediumand high P as to their influence on the intensity of balance
22

is possible, since there was no significant difference in
growth at those two levels of P. Practically, therefore,
medium and high P could be interchanged without altering
appreciably the intensity of balance with respect to growth.
Balance with respect to N, P, K, and Ca : Because of
the K-Ca effects, there were two combinations of N, P, K,
and Ca which were practically equal as to intensity of bal-
ance. Within the limits of medium N, these combinations
were: mediurQ-^N-medium-P-high-K-medium-Ca and medium-N-me-dium-P-medium-E-high-Ca. These combinations represent the
nutrient-element supplies with the highest intensities of
balance among all the solutions used. Two other combinations
which had a somewhat lower intensity of balance in compar-
ison to the first two were: medium-N-medium-P-medium-K-
medium-Ca and medium-N-medium-P-high-K-high-Ca. The differ-
ences between these four combinations are indicated by the
averages in Table 2, NKCa. Although these averages do not
indicate any effects of P, they can be used for comparing
the effects of the complete nutrient-element combinations
because growth was determined primarily by N, K, and Ca, and,
comparatively at least, the effects of those elements were
not altered significantly by P.
Similar combinations of P, K, and Ca with high N rep-
resent the solutions with the highest intensities of balance
within the high N series. They all were, however, of a com-
paratively lower intensity of balance than those of the me-dium N series. Within the limits of high N, the combinationhigh-N-medium-P-high-K-medium-Ca had the highest intensity
of balance. High-N-medium-P-medium-K-high-Ca and high-N-
medium-P-high-K-high-Ca were practically the same in their
effects on growth. High-N-medium-P-medium-K-medium-Ca had
a definitely lower intensity of balance than the other three
combinations (Table 2, NKCa)
.
It should be noted that since high P did not result in
growth significantly different from that at medium P, the
high P values could be substituted for medium P in the a-
bove combinations (both those at medium and at high N) to
produce nutrient-element supplies practically equal to themas to the intensity of balance, at least in so far as growth
is concerned.
Of all the combinations used, the solutions with the
23
lowest intensities of balance were those in which the sup-
plies of either N, P, or K were low. Growth under these
conditions was so markedly limited by the deficient element
that the potentialities of the supplies of the other ele-
ments could in no way be realized.
From the standpoint of maximum growth it is obvious
that there were a number of the nutrient-element supplies
which were quite high as to their intensities of balance,
even though they varied widely as to their relative and ab-
solute composition. Only when the supply of one or more of
the elements was markedly limiting, as in the case of the
low levels of N, P, or K, or the high level of N, were the
intensities of balance greatly reduced.
Other Considerations Related to Growth ; The relation-
ships between the elements with respect to maximum growth
may also be considered from the viewpoint that one of their
number was deficient when that maximum was not attained.
As long as growth was improved by an increase in the supply
of a given element, that element must have been deficient
relative to the supplies of the others and the growth which
potentially they could support. Thus, when Ca was medium(at either medium or high N), K must have been deficient,
since growth increased when K was raised to the high level.
Similarly, when K was low or medium, Ca also could be con-
sidered as deficient, since an increase in the Ca supply
improved growth. When Ca was high, however, K was not de-
ficient, since the increase in K from medium to high did
not improve growth; and similarly, when K was high, Ca was
not deficient, since an increase in Ca to the high level
did not improve growth.
Apparently there was a variation as to the intensity
or degree of a deficiency. When the supply of an element
was extremely low as at low N, low P, or low K, the inten-
sity of the deficiency was comparatively high, since growthwas markedly limited. However, the intensity of the K de-
ficiency, for example, was comparatively less when K wasmedium (at medium Ca) than when K was low. In this instance,
although growth was not markedly impaired at medium K, it
still was not at a maximum, so that comparatively K was de-ficient even at the medium level.
It is possible, within rough limits at least, to makea distinction between the deficiencies of different intensi-
24

ties. Thus, deficiencies of the highest intensity which re-sult in sharply curtailed growth may be classed as acute.Such deficiencies are the type which are most easily recog- -
nized and which usually are implied by the term "deficiency."In addition to reduced growth, the appearance of the foliageor shoots is characterized by certain symptoms typical ofthe deficiency. In contrast, the deficiencies of lower in-tensity, which comparatively may be classed as mild, arecharacterized only by a growth which is reduced in compari-son with that which potentially could be supported by thesupplies of the elements which are not deficient. Thus, forexample, the deficiency of K at the low level could be class-ed as acute, whereas that at medium K (and medium Ca) wouldbe mild. The line of demarcation between an acute and amild deficiency, of course, is probably not sharp but is rep-resented by a range in the concentration or availability inthe supply of the deficient element.
At the other extreme from a deficiency is the excessof an element. The high N is an example. In such an in-stance the supply of an element is so great that growth isreduced as a result. Under such conditions the maximumgrowth which the supplies of the other elements might sup-port can not be attained unless the element in excess is re-duced.
Theoretically, at least, the milder sort of excess islikely which is the complement of a mild deficiency. Insuch instance the growth is reduced as a result not only ofthe element in excess but also of an element which compara-tively is mildly deficient. Improved growth would be ex-pected either by reducing the element in excess or by in-creasing the element which is deficient. The extent to whichgrowth would be improved by either means would depend onthe degree to which one element was excessive or the otherdeficient. In all likelihood a larger increase in growthwould result from the correction of a mild deficiency thanfrom the reduction in the supply of an element in mild excess.
25

II. COMPOSITION OF THE TREES
Methods
The leaf, shoot, and trunk samples were ground in a
Wiley Mill in preparation for analysis. Aliquots of the
ground samples were reground in a hand-operated mill before
the analyses for nitrogen. The root samples were not ana-
lyzed .
The total, the water-soluble, and the water-insoluble
nitrogen were determined, using the Kjeldahl method as modi-
fied to include nitrates. In order to leach out the soluble
nitrogen, a sample was placed in. a cotton thimble in a glassGooch-crucible holder. The top edges of the cotton werepushed down to cover the sample, which was then leached with200 ml of distilled water. A 1 gm sample was used for the
leaves and a 1-3 gm sample for the shoots and trunks. Pre-
liminary trials showed that this procedure was satisfactoryfor removing the water-soluble nitrogen. Determinationswere made on both the leachate and the leached sample. Totalnitrogen was determined on an unleached sample.
By adding the figures for the soluble N as determined
in the leachate and the insoluble N as determined on the res-
idue, a figure for total N was also determined. Likewise,
additional values for soluble and insoluble N were calculatedby subtraction of the one or the other from the total N asdetermined on an unleached sample. In general, the calcu-lated and the determined values checked closely. Thesevalues were averaged according to the following formulae,which give weight to the values as actually determined:
If T, I, and S repre-sent total, insoluble, and soluble N, respective-ly, as actually determined, and T* , I f
, and S*
represent the corresponding calculated values,then,
Av. T equals ( 2T plus T f)/3,
Av. I equals ( 21 plus I')/3, andAv. S equals (2S plus SM/3.
Determinations of P, K, Ca, and Mg were made accordingto procedures in use in the soils laboratory of the Depart-ment of Agronomy and Genetics at West Virginia University.Phosphorus and magnesium were determined colorimetrically asthe phosphate, calcium titrimetrically as the oxalate, andpotassium as the cobaltinitrite.
26

The results of the analyses, expressed as a percentageof the dry weight, are presented for the individual trees inAppendix Tables 3 to 8. From these data the N, P, K, Ca,and Mg per gram of dry weight in the shoots, trunks, andleaves were calculated in terms of their microgram-hydrogen-equivalents. For each part of each tree the equivalents weresunned and the percentage of each element in that sum wascalculated. This is essentially the procedure used by Thom-as (17) in his calculations of the NPK-unit in foliar diag-nosis. In the present paper the calculation has been modi-fied in that the equivalents are expressed on the elementalbasis, not as the oxides. Also, the equivalents units in-clude all of the elements being considered, rather than onlythree of them at a time. The equivalents are based on theamount of each element equivalent to one hydrogen or itsequivalent in compounds such as HNO3, H3PO4., KN03 , CaUlC^g,and Mg(N03 )2. An explanation of the calculation follows:
For any element Y,
The milligram-H-equivalents of Y per gram of dryweight equals (percent Y x 1000 )/(H-equivalent weight)equals percent Y x Factor.
The microgram-H-equivalent s of Y per gram of dryweight equals percent Y x Factor x 1000.
The Factors for the elements considered are:
Element Atomic Hydrogen FactorWeight Equivalent ( 1000/H.E.
)
N 14.01 14.01 71.38P 31.02 10.34 96.71K 39.10 39.10 25.58Ca 40.08 20.04 49.90Mg 24.32 12.16 82.24
The percentage of insoluble N in the shoots of onetree was 0.469. Therefore its microgram-II-equivalent pergram of dry weight equals 0.00469 x 71.38 x 1000 equals334.8.
By similar calculations, the microgram-H-equiva-lents for the other elements were: soluble N, 259.1; P,272.7; K, 172.4; Ca, 161.2; Mg, 97.0. The total N equalssoluble plus insoluble N equals 593.9.
The sum of the microgram-H-equivalents (N plus Pplus K plus Ca plus Mg) equals 593.9 plus 272.7 plus 172.4plus 161.2 plus 97.0 equals 1297.2.
The percentage of each element in the total was:total K, 45.78; insoluble N, 25.81; soluble N, 19.97; P,
27

21.02; K, 13.29; Ca, 12.43; Mg, 7.48.
The sum of the percentages for N, P, K, Ca, and
Mg, that is 100, constitutes the equivalents unit.
In discussing these data the percentages of a given element
in the microgram-H-equivalents unit will be referred to as
either the amount or the percentage of that element in the
equivalents unit, or simply, in the unit.
The data for the amount of the elements in the unitswere averaged according to the primary treatments and their
interactions; these averages are presented in the text in
Tables 3, 4, and 5 for the shoots, trunks, and leaves, re-
spectively. The data for the primary treatments and theirinteractions, with the exception of NPCa, NECa, and PECa,
are also presented in Graphs 3, 4, and 5.
The Amount of the Elements in the Tops
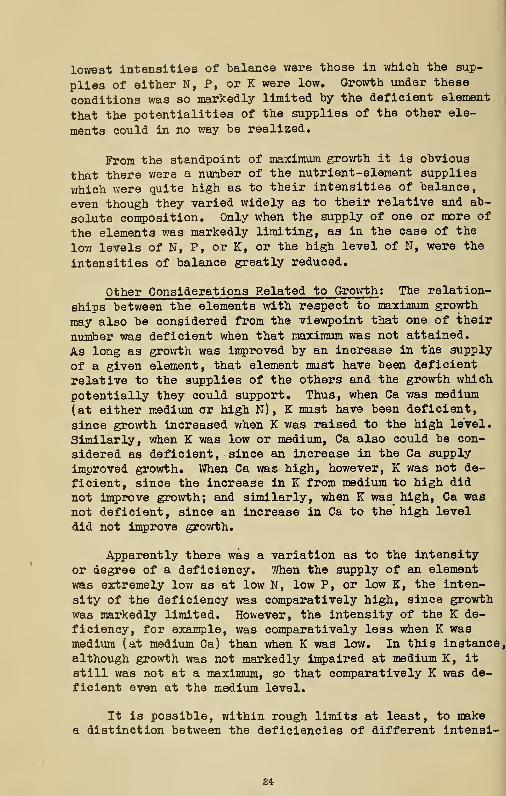
The amount of an element in the equivalents units in
the tops was determined primarily by the supply of that ele-ment. This is indicated by the fact that in the leaves,shoots, and trunks the P, K, and Ca increased as the respec-tive supplies of those elements increased (Graphs 3 to 5,
subgraphs P, K, Ca). Also, the total N in the shoots andtrunks increased as the supply of N increased (Graphs 3, 4,N). In the leaves, however, it increased only with the in-
crease in N from low to medium (Graph 5, N)
.
In all three parts of the trees, insoluble N was at a
maximum when the N supply was medium. The soluble N, how-ever, increased as the N supply increased. Roughly 90 per-cent of the total N in the leaves was insoluble in contrastto about 50 percent in the shoots and trunks * Consequently,variations in the insoluble N were reflected in similar var-iations in total N in the leaves, but not in the shoots andtrunks. This accounts for the failure of total N to increasein the leaves with the increase to the high N supply.
Usually the leaves, shoots, and trunks differed as tothe amounts of the elements within them (Tables 3 to 5),probably as a result of natural differences in their struc-ture and functions. The amount of total N was about thesame in the units for all three parts of the trees. The sol-uble N, however, was much smaller and the insoluble N largerin the leaves than in the shoots and trunks. The level of
28
Table 3a. The N, P, K, Ca and Mg In the Equivalents UnitsIn the Shoots. Averages for Primary Treatments and their
InteractionsTreatment
49C •
8 oH O
TotalN
SolubleN
In-soluble
NP K Ca Mg
tf HHL
59.7651.9537.27
33.6724.1513.46
26.0927.8023.81
11.7011.4312,77
9.0310.6713.21
8.5519.9029.22
10.976.057.52
p'
HML
44.6348.3456.01
19.6222.3529.30
25.0325.9926.71
18.2212.455.23
10.9111.5410.47
18.2519.3920.03
7.988.298.27
K' HML
49.6248,5550.81
23.1122.3125.86
26.5126.2424.95
11.3811.8012.72
15.2710.726.92
16.9020.8519.91
6.838.099.64
ca HM
46.5252.79
22.4425.08
24.0827.72
10.3113.62
9.9511.99
27.5810.86
5.6410.73
»
'
HHHMHL
52.4957.9468.84
27.4731.2442.30
25.0226.7026.53
18.7812.533.79
9.239.738.14
8.488.638.53
11.0311.1810.71
MSMMML
44.7951.5459.53
17.6723.0131.77
27.1128.5327.76
18.4310.944.93
11.5711.329.12
19.3019.9820.41
5.916.236.02
LHLMLL
36.6235.5439.66
13.7312.8113.83
22.8922.7325.82
17.4713.886.97
11.9413.5714.14
26.9629.5531.15
7.027.478.08
NR ehHMHL
59.8059.6959.86
32.9832.9335.10
26.8226.6824.76
11.1511.7412.19
12.809.484.82
7.478.969.21
8.7810.2213.92
MHMMML
51.4949.4454.92
22.5721.8728.02
28.9227.5826.90
10.6510.7112.94
15.1610.586.26
17.6022.7519.35
5.106.536.53
LHLMLL
37.5636.6037.66
13.7712.1414.46
23.7924.4523.20
12.3412.9613.02
17.8512.109.69
25.6530.8431.18
6.607.518.45
PKHMHL
44.2142.7546.95
18.1017.7223.05
26.1125.0323.89
17.4718.3718.83
15.2711.226.24
16.4419.8718.42
6.627.789.56
MMML
47.9747.2449.80
20.9720.9225.17
27.0126,3224.63
11.5911.9313.83
16.3011.376.94
17.2821.0319.86
6.678.449.58
wLMLL
56.6855.6655.69
30.2628.3029.35
26.4127.3626.34
5.095.115.49
14.249.567.60
16.9921.6421.46
7.018.049.77
29

Table 3b. The N, P, K, Ca and Mg in the Equivalents Unitsin the Shoots. Averages for Primary Treatments and their
InteractionsTrea J
pc©
I
w
bment
VCoo
TotalN
SolubleN
In-soluble
NP K Ca Mg
tfCa Htf
MHLH
59.6148.8131.15
34.5422.4010.37
25.0626.4020.78
12.199.679.07
8.219.2412.41
12.8928.1741.68
7.114.115.69
MMIM
59.9055.1043.39
32.7925.9016.54
27.1129.2026.85
11.2113.1916.47
9.8612.0914.02
4.2011.6316.76
14.847.999.36
P<3a HHMHLH
42.3745.6151.59
17.9221.6927.71
24.4423.9223.88
15.6810.924.33
10.1410.279.45
26.0927.5029.15
5.725.705.49
HMMMIM
46.8951.0760.43
21.3223.0130.90
25.5728.0629.53
20.7613.976.13
11.6812.8011.48
10.4011.2710.91
10.2610.8811.05
KCa HHMHLH
46.5844.2148.78
22.4919.7325.10
24.0724.4923.68
9.8610.2310.85
13.4110.076.39
24.8529.5928.31
5.335.905.69
MMDf
52.6652.8852.84
23.7224.9026.62
28.9427.9926.23
12.9113.3714.59
17.1411.377.46
8.9612.1011.52
8.3410.2813.58
HFCa HHHHMHHLH
51.1357.277U.44
25.5232.0746.06
25.6025.2124.38
19.26J.3.823.48
8.738.707.20
13.4912.7812.39
7.397.436.50
MHHMMHMLH
43.1149.6053.71
16.6522.5528.02
26.4727.0525.70
16.138.624.28
10.269.258.22
26.3b28.0230.14
4.164.533.66
LHH"
LWHLLH
32.8929.9530.62
11.6010.4b9.05
21.iJ819.4921.57
11.6610.345.22
11.4312.8712.93
38.4341.7044.92
1 5.605.156.32
HMMHIM
53.8658.6167.24
29.4030.4238.55
24.4528.1928.69
18.2811.244.09
9.7410.769.08
3.464.474.67
14.6714.9314.93
HHMMMMMil!
46.4653.4865.35
18.7023.4635.53
27.7630.0229.82
20.7313.275.57
12.8813.3910.02
12.2611.9410.68
7.677.938.38
LHMIMMLIM
40.3641.1248.70
15.8615.1618.62
24.5025.9630.08
23.2817.428.72
12.4414.2715.34
15.4817.4117.39
8.459.799.85
30

Table 3c. The N, P, K, Ca and Mg in the Equivalents Unitsin the Shoots. Averages for Primary Treatments and their
InteractionsTreatment
" "~
•p Total Soluble In-§ o N N soluble P K Ca Mg
§ N
STEBI HHH 57.62 32. 4S 25.34 11.67—IT75S—TT751 7735"HMH 58.03 31.92 26.11 11.93 9.03 13.43 7.59HLH 62.99 39.25 23.74 12.95 4.04 13.69 6.34
"TO! 50.50 23.73 26.77 5715—12.37 24.36 375TMMH 45.08 19.10 25.99 9.05 9.67 31.88 4.34MLH 50.85 24.59 26.46 10.79 5.69 28.25 4.44~rm 3TTS2" 11.29 20.13
—
6.70 ie.se 36.59—
sttstWE 29.54 8.18 21.36 9.72 11.51 43.48 5.76LLH 32.51 11.65 20.85 8.80 9.43 42.98 6.28
"HHBf 6T775 53738" S573T5 10733—12755 3737
—
16.16HMM 61.19 33.94 27.25 11.56 9.93 4.49 12.84M 56.73 50.95 25.78 11.43 5.59 4.74 21.51"TO 52.46 21.41 31.07 12.11 17.95 10.62 S75TMMM 53.81 24.64 29.17 12.36 11.49 13.62 8.72MLM 59.00 51.65 27.35 15.10 6.84 10.45 8.62~OT 43.71 16.26 27.45 15.96 19.43 12.70 87T9"LMM 43.66 16.11 27.54 16.20 12.68 18.20 9.27LLM 42.81 17.26 25.55 17.23 9.95 19.58 10.63
PkOa ffiffi 42.58 17.66 24.91 14.99 13.61 23.55 572THMH 38.60 14.03 24.57 15.50 11.25 28.96 5.70HLH 45.95 22.09 23.86 16 .56 5.57 25.76 6.18~mm 44.81 19.93
—
&nm—10735—I47T52—257T5 57B1TMMH 42.60 18.25 24.34 10.84 10.91 29.31 6.35MLH 49.41 26.89 22.52 11.58 5.88 28.01 5.13THB 52.34 29.90 22.44 4722" 12.58 25.79 5 .07LMH 51.45 26.91 24.55 4.35 8.05 30.50 5.65LLH 50.97 26.32 24.66 4.41 7.71 31.15 5.76
~HM S57E3—16.53 27.30 19.94 16.94 5733 7756""
HMM 46.90 21.41 25.49 21.24 11.20 10.79 9.87HLM 47.94 24.02 23.92 21.11 6.90 11.09 12.95im 51.13 22.00 29.13 12.63 16.56 5737 87T0~MMM 51.89 23.59 28.30 13.02 11.83 12.74 10.53MLM 50.19 23.45 26.74 16.08 8.01 11.70 14.03
"TBtf 61.01 30.62 30.39 5.96 15.91 57T5 57PFIMM 59 .e7 29.69 30.18 5.86 11.06 12.78 10.43LLM 60.41 32.39 28.02 6.57 7.48 11.77 13.78
31

Table 4a. The N, P, K, Ca and Mg in the Equivalents Unitsin the Trunks. Averages for Primary Treatments and their
InteractionsTresitment
Total Soluble In-co
w
•
oaoo
N H aolubleN
P K Ca Mg
N fl 53.86 26.46 27.40 14.31 ^.23 TS781T 8.8019 47.32 17.80 29.52 13.34 11.29 21.03 7.02L 37.89 8.86 29.03 15.89 13.56 24.37 8.30
P fl 42.11 15.25 26.86 19.34 11.18 19.38 7.99M 45.60 17.30 28.30 15.00 11.63 19.52 8.25L 51.35 20.56 30.80 9.20 11.26 20.32 7.87
K a 47.57 18.82 28.75 13.35 14.35 17.52 T.2^M 46.11 17.54 28.58 14.69 11.27 19.83 8.09I 45.38 16.76 28.62 15.50 8.45 21.86 8.81
Ca H 44.99 17.48 27.51 13.72 10.99 23.33 6.96M 47.72 17.94 29.79 15.30 11.72 16.14 9.11
HP HH 48.30 22.98 25.31 19.96 9.15 13.65 8.94HM 52.57 25.87 26.70 15.15 10.20 13.11 8.97HL 60.70 30.51 30.19 7.80 8.34 14.67 8.48MH 41.33 13.35 27.98 18.00 11.19' 22.12 7.37MM 46.56 17.26 29.30 13.41 12.04 20.57 7.42ML 54.09 22.80 31.29 8.61 10.64 20.40 6.26LH 36.71 9.43 27.25 20.07 13.21 22.36 7.65LM 37.68 8.78 28.90 16.44 12.65 24.87 8.36LL 39.27 8.37 30.91 11.18 14.80 25.87 8.88
NK HH 56.25 28.98 27.27 13.03 11.55 11.51 7.65HM 53.05 25.80 27.25 14.67 9.35 13.89 9.07HLMH"
52.2748.37
24.59 27.68 15.25 6.79 16.02 9.6718.25 30.10 11.77 14.60 18.95 6.33
MM 47.75 17.97 29.77 13.11 11.32 20.57 7.25ML 45.87 17.18 28.69 15.14 7.95 23.57 7.47LH 35.11 9.23 28.56 15.25 16.91 22.07 7.67IM 37.55 8.84 28.71 16.33 13.15 25.03 7.94LL 38.01 8.51 29.50 16.10 10.61 26.00 9.28
PTT HE 42.95 15.72 27.23 17.75 14.41 17.87 7.02HM 41.07 14.15 26.92 20.18 11.27 19.12 8.36HL 42.32 15.89 26.43 20.10 7.87 21.13 8.58MH 45.91 17.29 28.62 13.95 15.43 17.10 7.61MM 46.35 18.26 28.10 14.62 11.80 19.25 7.97ML 44.54 16.36 28.18 16.43 7.66 22.20 9.17LH 53.55 23.44 30.41 8.34 13.22 17.57 7.02LM 50.92 20.21 30.72 9.28 10.74 21.12 7.93LL 49.29 18.02 31.26 9.97 9.83 22.25 8.67
32

Table 4b. The N, P, K, Ca and Mg In the Equivalents UnitsIn the Trunks. Averages for Primary Treatments and their
InteractionsTrea
•pC©
§H
tment
•
oaoo
TotalN
SolubleN
In-soluble
NP K Ca Mg
tiCa HHMHLH
53.2746.0335.67
27.7317.237.48
25.5428.8128.20
14.6811.8614.62
8.4410.8313.71
16.4725.2628.27
7.136.017.73
MMIM
54.4548.6140.11
25.1818.3810.24
29.2630.2429.86
13.9314.8117.17
10.0211.7513.40
11.1416.8020.47
10.468.028.86
Pfla
MHLH
40.8144.4349.74
14.5617.5420.34
26.2526.8929.40
18.3114.238.63
11.1411.1210.73
22.8023.1824.01
6.947.046.90
MMIM
43.4246.7852.97
15.9517.0720.78
27.4629.7152.19
20.3715.779.77
11.2312.1411.80
15.9515.8516.61
9.039.468.85
fcCa HHMHLH
45.4244.2645.30
17.9716.6617.80
27.4427.6027.50
13.2713.8114.09
13.7311.158.10
20.9023.8725.22
6.696.907.29
MMIM
49.7347.9745.47
19.6718.4215.72
30.6629.5529.75
13.4315.5716.91
14.9811.398.80
14.1315.7918.49
7.759.28
10.32
NPCa HHHHMHHLH
46.5851.9561.29
22.5727.7632.86
24.0124.1928.42
20.2916.027.75
8.539.577.22
16.9215.5516.95
7.686.926.80
MfflMMHMLH
40.5145.8451.76
12.7117.4521.52
27.8028.3930.24
16.5311.457.62
11.1610.8210.52
25.7625.3924.62
6.056.505.50
tffii
IMHLLH
35.3535.5036.17
8.397.416.63
26.9628.0929.54
18.1215.2410.51
13.7212.9614.46
25.7228.6030.48
7.097.718.39
HHM"
HMMHIM
50.0253.1960.12
23.4123.9828.17
26.6129.2231.96
19.6414.287.86
9.7810.839.47
10.3810.6712.39
10.1911.0310.16
MhmMMMMLM
42.1547.2856.42
13.9917.0724.08
28.1630.2132.34
19.4715.389.60
11.2213.2510.77
18.4715.7516.19
8.708.357.02
IBMIM'LLM
38.0839.8642.38
10.4710.1610.10
27.6129.7032.28
22.0217.6411.84
12.7012.3515.15
19.0021.1421.26
8.219.019.37
33

Table 4c. The N, P, K, Ca and Mg in the Equivalents Unitsin the Trunks. Averages for Primary Treatments and their
InteractionsTFeatmeht
•pa •
§ o|H OW
TotalN
SolubleN
In-soluble
NP K Ca Mg
Ma HHHHMHHLH
52.8151.9455.06
27.0326.2329.93
25.7825.7025.14
14.2*15.0714.74
11.238.555.53
14.5517.0517.82
7.177.396.84
MHhMMHMLH
47.7445.8044.57
18.9016.4616.32
28.8429.3428.24
11.4411.3912.77
13.5711.097.85
21.8425.5528.38
5.426.176.44
LHHIMHLLH
35.7035.0436.28
7.997.287.16
27.7127.7629.12
14.1314.9814.75
16.3913.8210.92
26.3029.0329.47
7.477.138.59
MMHMMHIM
59.7654.1749.48
30.9325.3719.25
28.7628.8030.23
11.8314.2015.76
11.8810.148.06
8.4810.7414.21
8.1310.7612.49
mhmMMMMill
48.5849.7047.17
17.6119.4918.04
31.3730.2129.13
12.1014.8317.52
15.6311.568.06
16.0615.6018.75
7.248.328.50
ItiM
IMMLLM
40.5140.0639.75
10.4610.409.87
30.0629.6529.88
16.3717.6817.45
17.4312.4810.30
17.8421.0422.52
7.878.769.97
P'fcfla HHHHMHHLH
40.8939.7741.78
14.4112.8416.42
26.4826.9225.35
17.6518.6818.61
14.2711.547.60
20.7623.0424.61
6.446.987.41
MHHMMHMLH
43.9344.0845.28
17.2516.9418.43
26.6827.1426.85
13.8914.2114.61
14.5711.397.39
20.8723.2125.47
6.757.127.26
LHH"
TMHLLH
51.4348.9348.85
22.2720.1918.55
29.1628.7430.30
8.278.569.04
12.3610.539.31
21.0625.3825.60
6.886.617.21
HHWhmmHIM
45.0242.3742.86
17.0415.4615.36
27.9826.9127.50
17.6521.6821.59
14.5611.018.13
14.9815.2117.66
7.619.749.75
MHM"
MMMMLM
47.9048.6343.81
17.3419.5814.29
30.5629.0529.52
14.0215.0318.24
16.2912.217.93
13.3315.3018.93
8.478.8311.09
LMMLIM
56.2752.9249.73
24.6220.2317.50
31.6532.6932.23
5.429.9910.90
14.0510.9610.35
14.0716.8718.89
7.169.2610.13
34

Table 5a. The N, P, K, Ca and Mg in the Equivalents Unitsin the Leaves. Averages for Primary Treatments and their
InteractionsTreatment43 Total Soluble In-
g J N N soluble P K Ca Mg« 6 N
W
N HML
52.9553.4937.54
6.244.953.06
46.7148.5534.49
5.236.079.16
11.1914.6118.58
11.3615.4521.56
19.2710.3713.16
P HML
47.4548.4348.10
4.684.814.76
42.7843.6243.34
10.676.663.12
14.1914.6515.55
14.9215.8117.64
12.7714.4415.60
K HML
47.6348.5147.84
4.604.724.93
43.0343.8042.92
7.016.167.28
22.1214.367.90
12.4816.9818.91
10.7613.9818.06
Ca HM
47.7848.21
4.944.56
42.8443.66
6.187.46
14.7414.85
20.1312.11
11.1717.37
Np HHHMHL
53.2952.8952.66
6.025.726.99
47.2847.1745.67
8.045.092.55
11.2611.4410.86
10.2810.7913.01
17.1219.7820.92
MMML
52.6555.7852.05
4.825.674.35
47.6350.1147.70
10.115.103.01
13.9914.4015.46
14.2014.3217.83
9.0710.4011.65
LHLMLL
36.4236.6339.59
3.20'
3.042.94
33.2233.5836.65
13.879.793.81
17.3218.1120.31
20.2822.3222.07
12.1113.1614.22
,
NK mHMHL
54.0854.4450.32
6.236.605.90
47.8547.8444.43
4.945.235.52
17.7211.464.39
9.3011.0813.71
15.9617.8126.06
MSMMML
53.5252.7954.17
4.474.765.62
49.0648.0348.55
4.875.357.99
22.9514.656.24
11.0316.7518.57
7.6410.4613.03
LHLMLL
35.2838 .3239.04
3.102.803.28
32.1835.5235.76
11.237.908.34
25.6916.9813.08
17.1123.1124.45
10.6913.6915.11
pK mHMHL
46.7447.8847.74
4.344.145.55
42.3943.7542.20
10.939.33
11.77
21.2414.466.84
11.6115.9417.21
9.4912.3816.44
MBMMML
47.5148.5449.24
4.664.445.34
42.8544.1143.90
7.126.066.80
22.3614.397.21
12.3816.6018.46
10.6314.4118.29
LHLMLL
48.5449.1246.55
4.805.583.90
43.8443.5442.64
2.993.093.29
22.7614.229.67
13.4518.4121.05
12.1715.1619.46
35
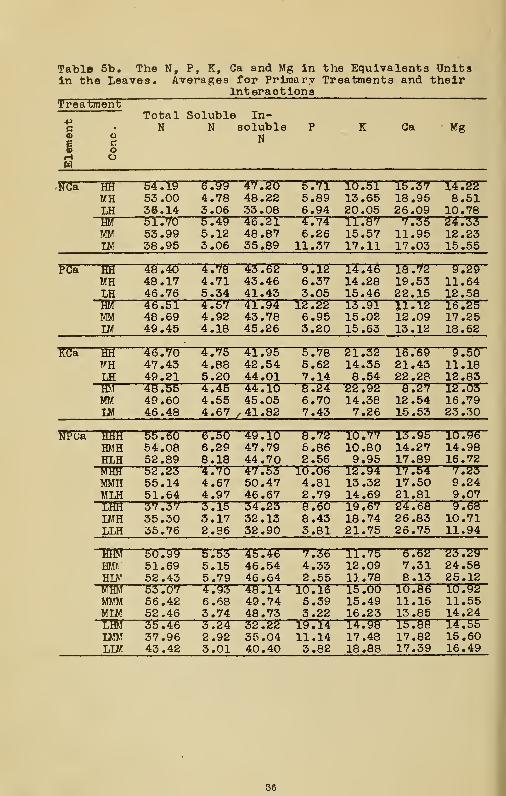
Table 5b. The N, P, K, Ca and Mg in the Equivalents Unitsin the Leaves. Averages for Primary Treatments and their
InteractionsTreatment
c
I §
TotalN
SolubleN
In-soluble
NP K Ca Mg
Hfla hhMHLH
54.1953.0036.14
6.994.783.06
47.2048.2233.08
5.715.896.94
10.5113.6520.05
15.3718.9526.09
14.228.5110.78
HM"
MMLM
51.7053.9938.95
5.495.123.06
46.2148.8735.89
4.7*6.26
11.37
11.8715.5717.11
7.3511.9517.03
24.3312.2315.55
PCa HHMHLH
48.4048.1746.76
4.78^4.715.34
45.^243.4641.43
9.126.373.05
14.4614.2815.46
18.7219.5322.15
9.2911.6412.58
HMMMLM
46.5148.6949.45
4.574.924.18
41.9443.7845.26
12.226.953.20
13.9115.0215.63
il-1212.0913.12
16.2517.2518.62
tfCa HHMHLH
46.7047.4349.21
4.754.885.20
41.9542.5444.01
5.785.627.14
21.3214.358.54
16.6921.4322.28
9.5011.1812.83
AMMMLM
45.5549.6046.48
4.454.554.67
44.1045.05
,41.82
8.246.707.43
22.9214.387.26
8.2712.5415.53
12.0316.7923 .30
flPCa HHHHMHHLH
55.6054.0852.89
6.506.298.18
49.1047.7944.70
8.725.862.56
10.7710.809.95
13.9514.2717.89
10.9614.9816.72
Mffi?
MMHMLH
52 .2355.1451.64
4.704.674.97
47.5350.4746.67
10.064.812.79
12.9413.3214.69
17.5417.5021.81
7.239.249.07
ISALMHLLH
37.3735.3035.76
3.153.172.86
34.2332.1332.90
8.608.433.81
19.6718.7421.75
24.6826.8326.75
9.6S10.7111.94
ririM
HMVHIM
50.9951.6952.43
5.535.155.79
45.4646.5446.64
7.364.332.55
11.7512.0911.78
6.627.318.13
23.2924.5825.12
MHMMMMMIK
53.0756.4252.46
4.936.683.74
48.1449.7448.73
10.165.393.22
15.0015.4916.23
10.S611.1513.85
10.9211.5514.24
LMMLLM
35.4637.9643.42
3.242.923.01
32.2235.0440.40
19.1411.143.82
14.9817.4818.88
15.8817.8217.39
14.5515.6016.49
36

Table 5c. The N, ?, K, Ca and Mg in the Equivalents Unitsin the Leaves. Averages for Primary Treatments and their
InteractionsTreatment-p Total Soluble In-c • N N soluble P K Ca Mg§c N
o«H Ow
!JKCa—mm 52756 5730" 56717 5735 T6735 13756" 12.29HMH 54.07 7.05 47.01 5.53 10.94 15.51 13.97HLH 56.04 7.63 48.42 6.67 3.94 16.95 16.40
TIBH 53753 4.47 49.02 4.61 21.34 13.87 BTB^TMMH 51.61 4.83 46.78 5.16 13.82 20.82 8.59MLH 53.90 5.04 48.87 7.90 5.80 22.16 10.25"THS 357T5 3.49 30.67 7.81 25.98 22.55 9TBTTLMH 36.60 2.77 33.83 6.18 18.29 27.97 10.97LLH 37.67 2.92 34.75 6.84 15.89 27.75 11.85
55.70 6.17 49.53 4.94 18.80 4.93 15.62HMM 54.81 6.14 48.67 4.92 11.97 6.66 21.64HLM 44.60 4.17 40.44 4 .37 4.85 1 .47 35.72-TO 5335 4.47 49.09 5.14 24.55 5713 8T5TMMM 53.96 4.68 49.28 5.55 15.49 12.69 12.32MLM 54.45 6.21 48.24 8.08 6.68 14.99 15.81"THH 36~7*0" 2.72 33.68 14.65 25.40 11.68 11.88LMM 40.04 2.83 37.21 9.62 15.68 18.26 16.41LLM 40.40 3.65 56.77 9.83 10.26 21.15 18.36
Pkda HHH 4'/ .8^ 4.52 43.30 7.79 21.04 15.43 7792-
HMH 46.92 3.80 43.12 8.35 14.90 20.57 9.27HLH 50.47 6.03 44.43 11 .23 7.45 20.17 10.68
"TTHH 56756 4.79 41.77 6.87 21.22 16.12 972TMMH 47.69 4.30 43.40 5.45 14.02 20.69 12.15MLH 50.27 5.05 45.22 6.78 7. 62 21.79 13.54Tm 55775 4.95 40.79 2.76 21.70 18.53 11.33LMH 47.67 6.56 41.11 3.06 14.12 23.03 12.12LLH 46.88 4.50 42.38 3.40 10.57 24.88 14.28
45.66 4.17 41.49 14.07 21.44 7.79 11.05HMM 48.85 4.47 44.37 10.30 14.06 11.31 15.50HLM 45.02 5.06 39.96 12.30 6.24 14.26 22.20im 557*7 4.53 43.93 7.38 23.50 8.64 12.02MMM 49.39 4.58 44.82 6.67 14.75 12.52 16.67MLM 48.22 5.64 42.58 6.81 6.80 15.12 23.05THH 5T753 4.65 46.88 3.29 23.81—8.37 13.01LMM 50.57 4.59 45.97 3.13 14.33 13.78 18.20LLM 46.21 3.30 42.91 3.18 8.75 17.22 24.64
37
Graph 3a. The N, P, K, Ca and Mg in the EquivalentsUnits In the Shoots. Averages for Primary Treatments
and their Interactions
N P K Ca NP HK
tji rj-.
* HL rm rr X rm nT rm rm4C-
Ov n -| r-
—°1C —rm jL
pn
"ic-jffl-n
1
1i-i
i i rr::1.l: 1
-:^:l_::
n-i L _
'"
:TtT:£ AClb ^
r
^-,
r-j_r-
—
+J OCV.
® 1C 1— _n--
-rm-Pi
04 «ro2C-T Vgic- -h tf[
~\m~h
*7P
ou-i
-
j-i
«40
o30Eh
20-
10-
—
_
123 123 123N HMLP HMLK HMLCa
12 123 456 789 123 456 789HHH MMM LLL HHH MMM LLLHML HML HML
HML HML HMLHMTreatment
38

Graph 3b. The N, P, K, Ca and Mg In the EquivalentsUnits in the Shoots, Averages for Primary Treatments
and their Interactions
PK HCa PCa KCa
M 1053
rnJ-.
rf"
IT'
rT run Tl fTh riTl r
40
«3C°20
10
_
p" r-
"
-
pr
r-
20W 10
i
n n r
I-. K- r-i
11 1 r 1
20P-.
10-p
J-,
ntMT
j-i
n~n 1«H
g 40
C»30«HH20
+» O
§w 10
o
r-i
n rr —r-T —r-v
.-
Per
Insol
N
o
o
o
l-i
—
"i
70
60
^50h40d£30^20
10
—-i— —
123 456 789 123 456 123 456 123 456N HML HMLP HHH MMM LLL HML HMLK HML HML HML HML HMLCa HHH MMM HHH MMM HHH MMM
Treatment
39

Graph 4a. The N, P, K, Ca and Mg In the EquivalentsUnits in the Trunks, Averages for Primary Treatments
and their Interactions
If p K Ca NP NK
on.
Tl rm rr r 1 rm rr r rm rr"
5 so-io-"
r~.r~r _^1 1-
-1
-~1—r -
— H"
10
I1
-j-r-_
T-j—ITj~1
I-L1-1
1 I
"i
1 1
ell
43,14 -« r"H io-cs
Tfl_
-."=j— -1— H"
Tl rf—
<H 55 OU
CO 20-"
o 10-
r" _ --1
r" —
r
—1 1 1
1
-320-
—— —
OU
^50-"
H40-"g30-
^ SO-
10
-
n p.
——
-
_
183 183 1S3 IS 1S3 456 789 183 456 789N HML HHH MMM LLL HHH MMM LLLP HML HML HML HMLK HML HML HML HMLCa HM
Treatment
40

Graph 4b. The N f P, K, Ca and Mg In the EquivalentsUnits In the Trunks. Averages for Primary Treatments
and their Interactions
PK NCa PCa KCa
20
saiorrn rr rr
- —
rffl rm rm r
30
«20
10
n i-
p"
^1 ^-i
——r- — r-~
-T~
«80
101 1
Tl -pi
11 "t 1r
20
S*10g
r"--j(-L_n r-""1
-i -T-r-rn rf
-r~
r
So20•>°°10
r~r-i
1
r"'-
*- . .
*H 30
§20•9 io
— —
60
50
*4bH£30o^2010
n_ n _
— - -i
— —
'-I
-
123 456 789 123 456 123 456 123 456N BML EMLP HHH MJIM LLL HML HMLK HML HML HML HML HMLCa HHH MMM HHH MMM HHH MMM
Treatment
41

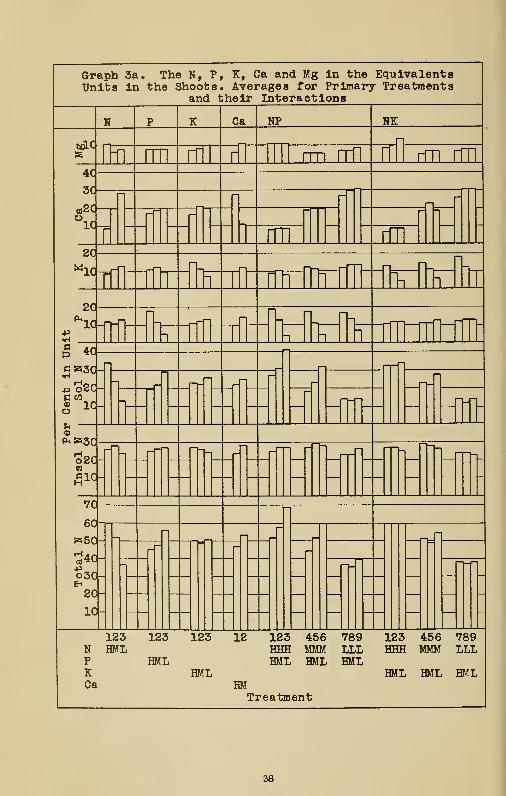
Graph 5a. The N, P, K, Ca and Mg in the EquivalentsUnits in the Leaves. Averages for Primary Treatments
and their Interactions
If p K Ca NP N£
oVi
10- -ri- r-f —rf —J- n rf4-1 i-
1__r
"*,n
a 20—o10
1
ri~\
-fr- n n fl—
r
—
ov_.
-
W 20
101
[-" --— -f~i
i ~L1
S pn
S3 in n5 rff
"
h m1 rfl rhn "h ~T rm nTl T5? f>r>
S « 10O CO p
!>. rm ml m nTl iTh rm rf 1 rffl rmpu, oo
S30-c"20-
10-
_r
—
-
1
—
fio
50 -fS3
H 40-aJP30-o^20-
10-
——
J-1
rf
—
123 123 123 12 123 456 789 123 456 789N HML HHH MMM LLL HHH MMM LLLP HML HML HML HMLK HML HML HML HMLCa HM
Treatment
42

Graph 5b, The N, P, K, Ca and Mg in the EquivalentsUnits in the Leaves, Averages for Primary Treatments
and their Interactions
PK IICa PCa J[Ca
3C
to2C
IC
n _.
fl—rf rf Vn ~r "[— rfl r"
3C
at 2CoIC
r-i
"1r- 1 (-
_I—i-r
-r-1
r-
i-i
30
W 2C
IC
j-l_
1 1
-T rf Tl rf-]
1
3 20C P*t= 10a rm rm rTtl rf ITh In rtti rm»20
1^10O CO n-n rm rTh r"h-. m-t rm rrh rm rmu
Z 50
40rH
«30aH20
10
— —1
r-t.
—
60
50
H 4°
530o^20
10
—— — —
— —n
123 456 789 123 456 123 456 123 456N HML HMLP HHH MMM LLL HML HMLK HML HML HML HML HMLCa HHH MMM HHH MMM HHH MMM
Treatment
43

P in the leaves was also lower than it was in the shoots and
trunks; the amount of P in the trunks was slightly higher
than in the shoots. Both K and Mg were higher in the leaves.
With respect to the amount of Ca, differences between the
parts of the trees were dependent in part on the supplies of
the elements. Thus Ca was usually higher in the trunks than
in the leaves and shoots when the supply of Ca was medium,
but greater in the shoots than in the trunks and leaves whenCa was high (Tables 3 to 5, Ca). Also, it usually was great-
est in the trunks and least in the shoots when the N supply
was high, greatest in the trunks and least in the leaves
when N was medium, and greatest in the shoots and least in
the leaves when N was low (Tables 3 to 5, N)
.
The Relations between Elements
The fundamental nature of the relations between the ele-
ments is indicated by the effects of an increase in the Nsupply on the composition of the shoots. As the supply of Nincreased, the amounts of both K and Ca in the equivalentsunits for the shoots decreased (Graph 3, N). The P, on the
other hand, did not always decrease (Graph 3, N) . In fact,when the P supply was high, the amount of P in the shootstended to increase as the N supply increased (Graph 3, NP,Bars 1:4:7). And when P was medium, it decreased as N in-creased from low to medium but increased when N was raisedfrom medium to high (Graph 3, NP, bars 2:5:8). When P waslow, however, it decreased regularly with increasing N (Graph
3, NP, bars 3:6:9). in addition, when Ca was high, the P inthe units tended to increase as N increased, whereas when Ca
cms medium, it decreased (Graph 3, NCa). The Mg in the shodtsdecreased only with the increase in the N supply from low tomedium; the larger Mg supply which accompanied high N natur-ally resulted in an increased accumlation of Mg in the shootswhen N increased to the high level (Graph 3, N).
The fact that an increase in the supply of N tended todecrease the amounts of P, K, Ca, and Mg suggests that funda-mentally N was antagonistic to their accumulation in the shootsThis antagonism or repressive effect of N for K, Ca, and Mgwas clearly indicated. Even for P, an inverse relation be-tween its accumulation in the shoots and the supply of N wassufficiently evident under some conditions to indicate thefundamental nature of the repressive tendency.
44

On the other hand, the fact that the repressive effect
of N on the bases was expressed more regularly or frequentlythan its effect on P suggests that there was a differencein the effectiveness or strength of the repressive action of
N on different elements. Since it was evident more regular-ly, the repressive effect of N on the bases was apparentlystronger than its effect on P.
The fundamental antagonism which was characteristic of
the effects of N was also characteristic for the other ele-
ments. It was indicated by the effects of variations in theirsupply on the composition of the trunks and leaves as wellas of the shoots (Graphs 3 to 5, Tables 3 to 5). However,
as with N, there were variations in the apparent strength oftheir repressive effects. These variations for the differentelements were evaluated on the basis that the more regularlyor frequently an inverse relation was evident between the
supply of one element and the amount in the tops of a second,
the stronger was the repressive action of the first on thesecond. A summary of this evaluation, which was made froman examination of Tables 3 to 5, NPCa, NXCa, and PKCa, follows,
An inverse relation was evident with marked frequencyfor the following comparisions
:
between the amount of N in the topsand the P supply,
between the K, Ca, and Mg in the topsand the N supply, and
between the N, P, K, and Mg in the topsand the Ca supply.
Consequently, the repressive action of the followingis considered to have been comparatively strong:
the effect of P on N,the effect of N on the bases, K, Ca, and Mg,
and the effect of Ca on N, P, K, and Mg.
In contrast to the above, the effect of N on P evident-ly was only moderately strong. The inverse relation between
the amount of P in the units for the tops and the N supply
was evident frequently only under the conditions of mediumCa (Tables 3 to 5, NPCa, HHM:MIM:LtM, HMM:MMM:LMM, H1M:MM:LLM) . Since it was not as evident/, the repressive actionof N on P apparently was comparatively weaker than the re-
ciprocal effect of P on N, as noted above.
U
45

Also in marked contrast to its action on N, the effect
of P on each of the oases was weak. This weakness is indi-
cated by the fact that the K, Ca, and Mg in the tops de-
creased with the increase in the P supply only in a compar-
atively few instances (Tables 3 to 5, NPCa, PKCa).
The repressive action of K on N and on P was also weak(Tables 3 to 5, NKCa, PKCa). On the other hand, the effect
of K on Ca and on Mg was comparatively strong (Tables 3 to
5, NKCa, PKCa).
It will be noted that, for any two elements, the re-
pressive action of one on a second usually was stronger than
the reciprocal effects of the second on the first. Thus,comparatively,
the repressive effect of P on N was stronger
than that of N on P,
the repressive effect of N on the bases wasstronger than that of the bases on N,
the repressive effect of Ca on P was strongerthan that of P on Ca, and
the repressive effect of Ca on K was strongerthan that of K on Ca.
On the other hand, the repressive actions of P on K and ofK on P were both comparatively weak, and there was no in-
dication that either was dominant consistently.
Fundamentally, for any element the evaluation of the
relative strength of its repressive action is an indicationof the degree to which the expression of its normal antago-nism was influenced or modified by the effects of other ele-ments. Thus evidence of comparative weakness in the effectsof an element indicates that the expression of its antagonismwas dependent on and easily influenced by the concurrenteffects of the other elements. Similarly, evidence of com-paratively 3trong action indicates that the effects of otherelements were generally at a minimum or easily offset; onthe other hand, for such an element the occasional excep-tions to an inverse relation between the supply of that ele-ment and the amount of a second in the tops represent theparticular situations in which its repressive effects weremodified or reduced by the concurrent actions of other ele-ments.
The modifying effect of the elements on the expression
46

of the repressive action of one of their number can be illus-trated by consideration of the effects of an increasing Nsupply on the accumulation of P in the shoots (Table 3, NPCa). Under the conditions of medium Ca, the repressive ef-fect of N on P evidently was strong enough to overcome anyof the concurrent effects of other elements which might havemarkedly modified an expression of that antagonism. As a
result the P in the equivalents units for the shoots de-
creased regularly as the N supply increased (Table 3, NPCa,
LHM:MHM:HHM, LMM:MMM:HMM, LIM:MIM:HIM)
.
Under the conditions of high Ca, however, the resultswere different, the reaction to N varying with the P supply.
Thus the amount of P in the units decreased regularly as theN supply increased only when the supply of P was low (Table
3, NPCa, LLH:MLH:HLH) . At the medium P level it decreasedwhen N increased from low to medium but increased when N wasraised to the high level (Table 3, NPCa, LMH:MMH:HMH). At
high P it increased regularly as N increased (Table 3, NPCa,LHH:MHH:HHH).
Under these various conditions, Ca was a dominant ele-ment because of its high supply. It strongly depressed bothN and P. At low-P-high-Ca the repression of P by Ca wasat a maximum, since any reciprocal effect of P on Ca wasminimized by the low P supply. Likewise the usually strongrepressive action of P on N was at a minimum, whereas thatof N on P was comparatively greater, with the result thatthe P in the shoots decreased as the N supply increased, thedepressing effects of N on P being added to those of thehigh Ca. It will be noted, however that the effectivenessof N on P was reduced by the high Ca; comparatively, thedecrease in P at low-P-medium-Ca was greater than that atlow-P-high-Ca (Table 3, NPCa, LLM:MLM:HLM, LLH:MLH:HLH)
.
At medium-P-high-Ca, the repression of P by Ca was stillcomparatively great, though somewhat less than at low-P-high-Ca, because the reciprocal effect of P on Ca naturallywas stronger at the medium P level. However, the net effec-tiveness of P on both Ca and N was not sufficient to offsetthe effect of the increase in N from low to medium, so that,as a result, the P in the shoots was lower at medium-N-medi-um-P-high-Ca than at low-N-medium-P-high-Ca. On the otherhand, when N increased to the high level, the net result ofthe interactions of the elements was altered so that the Pin the shoots increased. This effect was probably as much
47
the result of the higher Mg supply accompanying high N as
it was of the increase in N itself. Because of its antago-
nism to Ca, the higher Mg reduced the effect of the highCa on P and N. In addition, the high N itself was antago-
nistic to Ca, and its effects were probably added to those
of Mg. Apparently the mutual antagonism of N, Ca, and Mgwas such that their action, both individually and collec-
tively, on P was minimized, with the result that conditions
for the accumulation of P were more favorable at high-N-medium-P-high-Ca than at medium-N-medium-P-high-Ca.
Under conditions of high-P-high-Ca, the high level of
P itself was obviously favorable to a comparatively large
accumulation of P in the shoots. In addition, the funda-mental antagonism of P for both N and Ca was greater than
at lower levels of P; therefore, to begin with, the recip-rocal effects of N on P and of Ca on P were comparativelyminimized because of the high P. At the same time, however,
the mutual antagonism of N and Ca also reduced the repressiveeffect of each of those elements on P. In particular, as
the N supply increased, the increased repression of Ca wasfavorable to the accumulation of P. Therefore under condi-tions of high-P-high-Ca the P in the shoots actually in-
creased as the N supply increased, an effect which was the
end result of the interaction of several factors, especially
the fundamentally favorable P supply and the antagonism ofN and Ca (together with Mg at high N).
In addition to being modified by the effects of otherelements, the expression of the normal antagonism of an ele-ment also varied in some instances in the different partsof the trees, so that the strength of the repressive actionsometimes appeared to be greater in one part than in another.Apparently the variation in the natural level of accumula-tion of the elements was sometimes great enough betweenparts of the trees to modify the expression of the antago-nism. This sort of variation is illustrated by the effectsof P on the accumulation of N in the shoots and trunks ascompared with that in the leaves. In both the shoots andtrunks, the repressive effect of P on N was strong, the a-mount of N in those parts decreasing regularly as the Psupply increased (Tables 3 and 4, NPCa). In the leaves,however, the effect was comparatively weaker, and under someconditions the N actually increased as the P supply increased(e.g., Table 5, NPCa, MIM:MMM).
48

The comparative weakness of the effect of P in theleaves evidently was related to a naturally lower level ofaccumulation of that element and a higher accumulation ofthe bases, especially K and Mg. The lower level of accumu-lation of P weakened the effectiveness of the antagonism ofP for N. In addition, the potential repressive effect ofthe bases on N was greater as a consequence of their higheraccumulation. However, because the increase of K and Mg inthe leaves was greater than that of Ca, the intensity of themutual antagonism between the bases apparently was increasedwith a resultant decrease in their effectiveness on N and P.Consequently, the reciprocal effect of P on the bases wasrelatively strengthened so that an increase in the P supplyresulted in a decrease in one or more of the bases whichfurther reduced the intensity of the repression of N by thosebases. The end result of the interaction of these factorstherefore was a comparatively weak expression of the repres-sive effect of P on N; evidently the favorable effect on Nof the decrease in the bases which resulted with the increasein the supply of P outweighed the unfavorable, direct effectof P on N. Consequently, under some conditions the N in theleaves actually increased as the P supply increased. Evenfor the conditions under which N decreased, the intensity ofthe repressive effect of P on N was comparatively less thanin the shoots and trunks.
49

III. THE RELATION BETWEEN GROWTH AND COMPOSITION
It is evident from the discussion of the analyticaldata that at least three factors were operative in determin-
ing the composition of the tops of the trees: first, thenature of the part of the tree; second, the supply of the
elements individually; and third, the normal antagonism be-tween them. In effect, the first two limited the accumula-tion of an element within a given portion of a tree. Thethird, however, accounted for its variations within those
limits, so that consequently, the composition of the tops
was always dependent in the end on the relationships between
the elements supplied to the tree.
Under the discussion of growth it was pointed out thatthe growth of the shoots also was dependent on the relation-ships between the elements or on the intensity of the nu-trient-element balance. Obviously, therefore, a relationbetween the composition, growth, and balance is to be ex-pected. The following discussion is concerned with the na-ture of that relationship.
The Relations at High N ; In previous discussion it wasconcluded on the basis of the growth data alone that the re-duced shoot growth in the high N series was the result of
excessive N and a consequent lowered intensity of balancein the nutrient-element supply. The effect of the high Non the composition of the shoots in its relation to growthwill now be considered. As expressed in the composition,the excess N resulted in a decreased accumulation of bothK and Ca. Mg, however, increased because of the higher sup-ply of Mg accompanying high N. The P in the shoots was af-fected by the Ca supply as well as by N, so that it was higherat high-N-high-Ca than at medium-N-high-Ca but lower athigh-N-medium-Ca than at medium-N-medium-Ca. The total Nin the shoots increased. However, this increase was entirelyas soluble N, since the insoluble portion decreased (Table
3, NPCa, NKCa).
It is the accumulation of the soluble relative to theinsoluble N which apparently was a primary factor in thereduced growth at high N. Evidently the alterations notedabove in the accumulations of the other elements producedconditions which were less favorable for an adequate syn-thesis of insoluble (protein) N. These conditions werebrought about in the main by the high N supply itself as a
50

result of an increase in the intensity of the antagonism
of N for the other elements, especially the bases. In addi-
tion, the repressive effect of Mg was intensified at high
N because of the accompanying high Mg supply.
The higher Mg, however, was only secondary to N in the
degree to which it influenced the composition and growth
of the shoots in the high N trees. This fact becomes appar-
ent when the trees which received high-N-high-Ca are com-
pared with those at medium-N-medium-Ca (Tables 2 and 3, NCa).
Best growth resulted under the latter conditions. The dif-
ference in the nutrient-element supply for these two groups
of trees involved N, Ca, and Mg, all three being higher in
the high-N-high-Ca solutions. Nevertheless, only N was
present in an increased amount within the shoots of the
trees receiving those solutions; the increase, however, was
entirely as soluble N, the insoluble portion decreasing.
This increase of the soluble relative to the insoluble Nbeing indicative of an inefficient synthesis of protein Naccounts for the reduced growth of those shoots.
The unfavorable relation of the soluble to the insol-
uble N was not, however, a direct consequence of the higher
Mg supply accompanying the high N, as is indicated by the
fact that there was practically no difference in either the
Mg or Ca in the shoots at high-N-high-Ca as compared to
those at medium-N-medium-Ca. Evidently, the mutual antago-
nism of Mg and Ca was such that, when the supplies of both
were increased, there was little change in their relative
accumulation within the shoots. The E in the shoots, on
the other hand, decreased. It is likely that it was this
decrease in K with its consequent effect on the relation
of K to Ca and Mg which resulted in the unfavorable soluble-
insoluble-N relation. The decrease in K was evidently the
result primarily of the repressive effect of the high N,
since the mutual antagonism of Mg and Ca would have reduced
their individual repressive effect on K. Therefore, the
lower intensity of balance in the high-N-high-Ca solutions
was primarily the result of the higher N supply. Because
the effectiveness of N in the other hi^h N series was po-
tentially the same, it can be concluded that the lower in-
tensity of balance of those solutions also was a consequence
of the high N. If anything, the accompanying high Mg supply
merely intensified the effects of N and caused wider varia-
tions in the relative amounts of the bases in the shoots
than might otherwise have resulted.
51

The Relations In the Deficiency Series ; The reduced
growth of the trees in the low-N series is indicative of a Low
intensity of nutrient-element balance and presumably was the
direct effect of the low-N supply* The nature of that effect
is shown by a comparison of the composition of the shoots oftrees at low and at medium N (Table 3, N). In the first place,
the total N in the shoots was greatly reduced at low N. This
reduction was accounted for primarily by a decrease in the
soluble N. The concurrent decrease in the insoluble N, thoughrelatively smaller, indicates that the synthesis of insoluble
(protein) N was inadequate for best growth. Evidently the
supply of N was insufficient to maintain a level of soluble
Jtf in the shoots which was favorable to a continued and rapid
synthesis of the insoluble forms. In addition to the differ-
ence in the N in the shoots, the accumulations of the other
elements were usually higher at low than at medium N. Such
increased accumulations were a natural consequence of a de-
crease in the intensity of the normal antagonism of N under
the conditions of a low N supply.
The low intensity of balance indicated by the reduced
growth when the supply of P was low was a consequence of the
effects of the deficiency of that element. The nature of
those effects is indicated by the composition of the shoots.
The amount of P in the shoots of the low P trees was charac-
teristically low (Table 3, P). In addition, in contrast to
the medium P trees, there was an accumulation of soluble rel-
ative to insoluble N, which indicates that conditions wereunfavorable for a satisfactory synthesis of protein N. Evi-dently, the amount of P in the shoots was insufficient to
favor that synthesis. Besides any direct effects of the low
P on protein synthesis, the concurrent lowered intensity ofits normal antagonism naturally resulted in a greater accumu-lation of N. The amounts of the bases in the shoots werenot greatly different than at medium P. On the other hand,
however, if they are compared to the amounts of P in theshoots, the bases actually were relatively greater at lowthan at medium P. This condition probably intensified the
unfavorable effects of the low P supply.
The low intensity of balance indicated by the reducedgrowth under conditions of low K was a consequence of theeffects of the deficiency of that element. The nature ofthose effects as indicated by the composition of the shoots(Table 3, K) was very similar to that of low P in that anaccumulation of soluble relative to insoluble N was alsocharacteristic. Evidently, the low amount of K in the shoots
52

under the conditions of the deficiency was unfavorable to
the synthesis of the insoluble forms of N. The effects of
the low K also were probably intensified by the relatively
greater accumulations of the other bases and of P.
The Mild Deficiency of K : As presented in the discus-
sion of growth, the intensity of nutrient-element balance
under conditions of medium-K-medium-Ca was shown to be lower
than under high-K-medium-Ca. The lower growth under the
former conditions was considered to be, in part at least,
the result of a mild deficiency of K. The nature of the ef-
fects of that deficiency is indicated by a comparison of the
composition of the shoots under the two sets of conditions
(Table 3, KCa)
.
At medium-K-medium-Ca, the K in the shoots was lower
than at high-K-medium-Ca. The Ca and Mg in the shoots, how-
ever, were both higher, because the intensity of the repres-
sive effect of K was naturally lower with medium K. The ra-
tio of K to Ca and Mg consequently was markedly lower than
at high-K-medium-Ca. It was this narrower interbase rela-
tionship which apparently conditioned the lower growth at
medium-K-medium-Ca. However, it appears to have been a fac-
tor through its effect on the soluble-insoluble-N relation
in the shoots. The insoluble N was lower and the soluble Nwas higher under the conditions of medium-K-medium-Ca. The
greater amount of soluble relative to insoluble N evidently
was less favorable to growth than that at high-K-medium-Ca.
Under the conditions of high Ca, medium K was not mildly
deficient. In fact, the intensity of balance with medium-K-
high-Ca was in general higher than with high-K-high-Ca, and
growth tended to be better under the former conditions. Ap-
parently, under the conditions of high Ca, the increase in Kto the high level did not result in an interbase relation-
ship which was more favorable to growth, even though it did
reduce both the Ca and Mg in the shoots. In fact, by its
antagonism to Ca it apparently reduced the repressive effect
of that element on N so that the soluble N in particular was
higher at high-K-high-Ca than at medium-K-high-Ca. At the
same time, the conditions for the synthesis of the insoluble
forms of N evidently were not improved, with the result that
the soluble N was relatively higher than the insoluble forms.
Consequently growth at high-K-high-Ca tended to be lower than
at medium-K-high-Ca.
53

The Mild Deficiency of Ca t The intensity of the nu-
trient-element balance under the conditions of medium-K-me-
dium-Ca was also lower than under medium-K-high-Ca. The
smaller growth under the former conditions therefore may just
as well be considered as partly the result of a mild defi-
ciency of Ca as the result of the mild deficiency of K dis-
cussed above. The nature of the effects of Ca is indicated
by a comparison of the composition of the shoots under the
two sets of conditions, medium-K-medium-Ca and medium-K-higb-
Ca (Table 3, KCa)
.
Under the first set of conditions, the Ca in the shoots
was much lower than at medium-K-high-Ca. Both the Mg and
the K in the shoots were higher, the Mg being especially so.
Consequently the ratio of Ca to K and Mg was markedly lower
than at medium-K-high-Ca. It was this narrower interbase re-
lationship which apparently conditioned the lower growth at
medium-K-medium-Ca. However, it appears to have been a fac-
tor through its effect on the soluble-insoluble-N relation
in the shoots. Both the soluble and the insoluble N were
higher under the conditions of medium-K-medium-Ca. However,
the difference in the soluble N was comparatively the greater,
so that the soluble portion was actually higher relative to
the insoluble N under those conditions and was less favor-
able to growth than at medium-K-high-Ca.
Under the conditions of high K, the medium Ca was not
mildly deficient. In fact, the intensity of balance with
high-K-medium-Ca was in general higher than with high-K-high-
Ca, and growth tended to be better under the former condi-
tions. The increase in Ca, under the conditions of high K,
resulted in a decrease in the total N in the shoots, because
of the strong repressive effect of the high Ca. This decrease
was accounted for by reduction in both the soluble and the
insoluble N. However, the decrease in the soluble forms was
the smaller. Actually therefore there was an increase in the
soluble relative to the insoluble N, a condition which was
less favorable to growth. This soluble-insoluble-N relationwas conditioned by the effect of the high Ca on the otherbases. Both the K and the Mg in the shoots were lower at
high-K-high-Ca than at high-K-medium-Ca as a result of the
repressive effect of the higher Ca. However, this reduction
in K and Mg naturally lowered the intensity of their repres-sive effect on the N within the shoots, so that conditionswere favorable for an increase in the soluble relative to
the insoluble N.
54

The Effect of Ca at low K : When either the medium or
high N was accompanied by low K, an increase in Ca resulted
in an increased growth. Under the conditions of high-N-low-
K, this increase in Ca was favorable to growth because it
reduced sharply the Mg accumulation in the shoots (Table 3,
NKCa). If the high Mg supply accompanying high N had any
direct "toxic" effect on growth it would have been most ser-
ious under the conditions of low-K-medium-Ca , because theintensity of the repressive effects of both K and Ca on Mgwas at a minimum under those conditions. Consequently, when
the Ca supply was increased and the intensity of its antago-
nism for Mg was heightened, the effect of Mg was reduced,
and growth improved.
That this improvement in growth was a direct result of
the shift in the Ca-Mg relation in the shoots rather than a
consequence of concurrent alterations in the nitrogen econ-
omy is indicated by comparison of the nitrogen data underthe conditions of high-N-low-K-medium-Ca and high-N-low-K-high-Ca (Table 3, NKCa). The total N increased as the Casupply increased. This increase was accounted for solelyby an increase in the soluble N, the insoluble portion be-
ing decreased. Such increase in the soluble relative to the
insoluble N was usually unfavorable to growth. In this in-
stance, however, it evidently was of less importance thanthe shift in the Ca-Mg relation. The situation is especiallynoteworthy since the increase in the soluble N undoubtedlywas a consequence of the increase in Ca; the higher Ca byreducing the accumulation of Mg in the shoots lowered the in-
tensity of the antagonism of that element for N with the re-
sult that the N increased. The increase in the Ca supplyunder conditions of high-N-low-K was favorable to growth de-
spite the fact that it resulted in a normally unfavorablenitrogen relationship.
Under the conditions of medium-N-low-K, in contrast to
the situation at high N, the increase in Ca was favorable to
growth because of its effect on the soluble-insoluble-N re-lation (Table 3, NKCa). The increase in Ca under those con-
ditions resulted in a decrease in total N. This decrease wasaccounted for primarily by a decrease in the soluble fraction
and resulted in a lower accumulation of soluble relative to
insoluble N, a condition which was more favorable to growth.
The decrease in the soluble N was probably a direct result
of the antagonism of Ca for that element. The concurrent
55
decrease in the accumulations of K, Mg, and P in the shoots
evidently was also favorable; presumably their relationship
to N was more satisfactory.
The beneficial effect of an increase in Ca discussed a*
bove is also of especial interest because such a result is
contrary to the effects of Ca as reported by Davidson and
Blake (8) and by Shaw (13, 14). The former, working with
peach trees in sand cultures, reported that the trees receiv-
ing solutions containing 2 ppm of K made more growth when
the accompanying supply of Ca was at a concentration of 180
ppm than when it was 410 ppm. Shaw found that fruit plants
grew better where both lime and potash had been used than
where potash alone had been applied; on the other hand, where
potash had not been used, growth was better on an unlimed
plot. In other words, where K was deficient, Ca additions
were detrimental, but when the E deficiency was corrected,
Ca became limiting, and growth was improved by liming.
Because the data presented by those investigators is in-
sufficient to make possible an evaluation of the nature of
the effects of Ca under their conditions, the difference be-
tween their results and those of this investigation cannot
be accounted for precisely. Presumably, however, it is a
result of differences in the absolute and relative supplies
of other elements in addition to K and Ca. With such differ-
ent supplies, the relations between the bases and between
the forms of nitrogen within the plants might easily have
varied sufficiently to produce the different growth responses
It will be noted, however, that the improvement in growth
with liming after the deficiency of K was corrected as re-
ported by Shaw was similar to the effect of an increase in
Ca under the conditions of medium K in this investigation.This indicates that fundamentally the effects of the rela-
tions between K and Ca in the two investigations were actu-
ally similar. Presumably, therefore, the effects were also
fundamentally similar under the conditions of K deficiency
but were expressed differently because of variations in other
conditioning factors. It seems likely that the divergent
results could be readily reconciled if sufficient informa-
tion, especially as to analytical data, were available to
evaluate the effects of those other factors.
The Effects of P : In the discussion of growth is waspointed out that the increase in the supply of P from medium
56

to high had no significant effect on the growth of the shoots.Consequently, in so far as growth was concerned, the inten-
sity of nutrient-element balance under the conditions of highP was practically the same as that under medium P. On the
other hand, the composition of the shoots differed under the
two conditions (Table 3, P). In the first place, the increasein the supply of P to the high level resulted in a definiteincrease in the P in the shoots. In addition, the N in the
shoots decreased as a result of the strong antagonism of P.
The K, Ca, and Mg, however, were not markedly affected, since
P was only weakly repressive of the bases. Most of the de-
crease in N was accounted for by the soluble forms. As a
consequence, as P increased there was usually a decrease in
the soluble relative to the insoluble N. Under most condi-
tions, such a shift in the soluble-insoluble-N relation wouldhave resulted in increased growth; however, as previouslymentioned, that did not occur to any marked degree with the
increase in the P supply to the high level.
This result appears to have been a consequence of thedifference in the antagonism of P on N and on the bases.
This difference was such that, with the increase in the Psupply, there was very little decrease in the bases as com-
pared with a marked decrease in N. Consequently most of the
increase in the P in the shoots usually was accounted for bya corresponding decrease in N, the soluble portion especially.As a result, the sum of P and the soluble N was approximatelythe same under conditions of the medium and high P supplies.
Therefore the relation of the P-plus-soluble-N to the insol-
uble N was also nearly the same. This suggests that, under
conditions of high P supply, the additional ? in the shoots
substituted, at least partly, for soluble N to maintain with
insoluble N a relationship which was no more favorable to
growth than that under conditions of medium P supply.
In so far as the composition of the shoots is a criter-ion, the increase in the P supply can be considered to havecaused changes in the quality of growth, even though it didnot result in differences in the amount of growth. Thus the
decrease in the total N and the shift in the soluble-insol-uble-N relation with the increasing P supply represent a
change in the quality of growth from the standpoint of thenitrogen economy. Likewise, the increase in the P in theshoots relative to N and to the bases constitutes a differ-ence in quality. Therefore, in so far as the composition of
the shoots was concerned, the intensity of the nutrient-ele-ment balance can be considered to have varied with the in-
57
creased P supply, despite the fact that it was no different
on the basis of growth.
The significance of the quality factor in nutrient-ele-ment balance, however, depends on the purpose for which the
plants are grown. When the volume or amount of growth pro-
duced is of primary importance, quality may be of little
direct significance, and balance may be defined solely onthe basis of growth. On the other hand, when other functions
of the plant are concerned, such as fruiting, the qualityof growth may also have to be considered and balance definedor qualified in terms of the composition as well as the a-
mount of growth. Since this investigation is concerned prin-cipally with the amount of growth, the implications of thequality factor can only be indicated. It should not be con-
strued that the effect of the P supply on the quality ofgrowth is necessarily significant from the standpoint ofother developmental phases of peach trees. The effects of
P have been used merely to illustrate the points that var-iations in the nutrient-element supply may cause differencesin the composition of the plants without significant, con-
current changes in the amount of growth and that, under some
conditions and for some purposes, balance may need to bedefined in terms of the quality as well as the amount ofgrowth.
The Diagnosis of Deficiencies
There were two features of the trees under the acutedeficiency conditions of either low N, low P, or low K whichwere diagnostic. The first was the symptoms which charac-terized the foliage and shoot growth for each of the respec-tive deficiencies. The second was the typically low levelof accumulation of the deficient element in the tops of thetrees. Both of these features have a practical value indiagnosing the deficiencies. The symptoms have frequentlybeen described and used (4, 7, 8, 20). The analyses ofleaves have been found valuable in the diagnosis of K de-ficiency especially (3, 18, 19).
However, these features were not diagnostic of the mild-er deficiencies such as the deficiency of K under the con-ditions of medium-K-medium-Ca. In that particular instancethere were no special symptoms, only the smaller growth ascompared with the trees at high-K-medium-Ca. In addition,the analyses for K did not indicate the deficiency; in fact
58

the K in the shoots as expressed in the equivalents unitswas higher at medium-K-medium-Ca than at medium-E-high-Ca,under which conditions K was not mildly deficient. »
The diagnosis of the mild deficiency was made, however,by reference to the tree making maximum growth. For example,
maximum growth resulted under conditions of medium-N-high-K-medium-Ca. In comparison, growth was smaller under condi-
tions of medium-N-medium-E-medium-Ca. Therefore the smallergrowth must have been a consequence of a mild deficiency of
K, since it was improved by increasing the supply of that
element. Obviously a standard of reference, representingmaximum growth, is needed in diagnosing a mild deficiency.
In addition, the available supplies of the various elementsmust be known. The deficiency can then be diagnosed by con-sidering the difference in the nutrient-element supplieswhich can be related to the difference in growth between thestandard or reference trees and those making comparativelypoorer growth.
A standard of reference is also needed if the plant an-alyses are to be of value in diagnosing the deficiency. Forexample, using again the trees at medium-N-high-E-medium-Caas a standard, the greater amount of soluble relative to in-
soluble N in the shoots of the trees making smaller growthunder the conditions of medium-N-medium-K-medium-Ca was in-
dicative of a mild deficiency that was influencing the qual-ity of nitrogen. The comparatively lower K, together withthe concurrently higher Ca and Mg, in the shoots at medium-N-medium-K-medium-Ca indicates that K was the deficient ele-ment and that better growth under the reference conditionswas the consequence of a more favorable interbase relation-ship which resulted in improvement in the quality of N.
It is to be expected that analyses of the tissues wouldbe of most help in diagnosing a mild deficiency, when the
differences in the nutrient-element supplies which were a-
vailable to the deficient and the reference plants respec-tively involved more than one element. Under such conditionsit might be difficult to assign differences in growth toone of the variable elements in particular, unless compar-isons of the inter-elemental relationships within the plantscould also be made and used to aid in indicating the elementmost likely to be limiting.
59

SUMMARY
1. Elberta peach trees were grown in sand culture, us-
ing 54 different treatments which included all of the possi-
ble combinations of supplies of N, P, and K at three con-
centrations—high, medium, and low—and of Ca at two—high
and medium. The low concentrations were selected as "de-
ficiency" levels, such concentrations being used only for
N, P, and K but not for Ca. The medium concentrations were
considered adequate for good growth. The high concentra-
tions were selected with the possibility in mind that they
might prove to be greatly excessive.
3. The trees were harvested about five months after
planting. Growth was measured in terms of the length and
the dry weight of shoots. Samples of the leaves, shoots,
and trunks were analyzed for P, K, Ca, Mg and for water-
soluble, water-insoluble, and total N. The amounts of these
elements in the samples were expressed in terms of an equiv-
alents unit; i.e . , as the percentage of each in the sum of
their microgram-hydrogen-equivalents per gram of dry weight.
3. Nutrient-element balance was defined and qualified
in terras of the factors limiting growth. Such a procedureprovided for a number of balanced nutrient-element supplies
which were distinguished by the differences in their inten-
sity of balance as determined by the amount of growth pro-
duced. The nutrient-element supply with the highest inten-
sity of balance was defined as that one with which resulted
the maximum amount of growth possible within the limits of
other environmental factors and of the genetic nature of theplant. As any element became limiting, a balanced supply of
a comparatively lower intensity was defined as that onewhich resulted in the maximum growth possible within thelimits of the supply of that element.
4. Nitrogen was the most important of the elements as
a determinant of growth. Considering the experiment as a
whole, maximum growth occurred when the N supply was mediumregardless of the supplies of the other elements. Growthat low N was greatly reduced; that at high N was interme-diate. The supplies with the highest intensities of bal-ance included N at the medium level.
5. K and Ca were closely related and next to N in im-portance in their effects on growth. Within the limits ofeither the high or the medium N supply, there were two com-
60

binations of K and Ca which were nearly equal with respect
to growth. They were high-E-medium-Ca and medium-E-high-Ca.
Within the limits of the N supply, the solutions with the
highest intensities of balance included E and Ca in one or
the other of those two combinations. Growth at low E was
less than at medium or high K.
6. P was the least important of the four elements as
a determinant of growth. There was no significant difference
in growth under the medium and the high P conditions. There-
fore the intensities of balance of supplies including high
P were practically the same as those with the medium level
of that element. Growth at low P, however, was greatly re-
duced.
7. Acute deficiencies resulted under the conditions
of a low supply of N, P, or K. They were characterized by
markedly reduced growth and typical deficiency symptoms.
8. Growth was better with high-K-medium-Ca and medium-
E-high-Ca than with medium-E-medium-Ca. The comparatively
poorer growth under the latter conditions was considered the
result of in part a mild deficiency of K and in part a mild
deficiency of Ca, since in the one instance growth improved
by increasing E and in the other by increasing Ca. The only
evidence of the deficiency was the comparatively lower growth;
no typical foliage symptoms were evident.
9. Under the conditions of low E, growth improved with
an increase in the Ca supply.
10. The amount of an element in the microgram-hydro-
gen-equivalents units for the tops of the trees was deter-
mined primarily by the supply of that element.
11. The leaves, shoots, and trunks differed as to the
amounts of the elements within them, probably as a result
of natural differences in their structure and functions.
Soluble N and P were lower in the leaves than in the shoots
and trunks, while insoluble K, E, and Mg were higher. Dif-
ferences between the parts of the trees with respect to Ca
varied with the Ca and the N supplies.
12. Fundamentally, each element was antagonistic, at
least potentially, to the accumulation of each of the others
within the tons of the trees.
61

13. The apparent strength of the antagonism or repres-
sive effect of the elements varied. A comparatively strong
repressive action was indicated for the following:
the effect of P on N,
the effect of N on K, Ca, and Mg, and
the effect of Ca on N, P, K, and Mg.
The effects of N on P and of K on Ca and Mg were only moder-
ately strong. The effect of P on each of the bases was weak;
that of K on P was also weak.
14. The relative strength of the repressive effect of
an element was an indication of the degree to which an expres-
sion of its normal antagonism was influenced or modified by
the effects of other elements. A comparatively weak action
&*J was ie- indication that the expression of its antagonism was
dependent on and easily influenced by the concurrent effects
of other elements. A comparatively strong repressive action
indicated that the effects of other elements were generally
at a minimum or easily offset.
15. The expression of the normal antagonism of an ele-
ment also varied in some instances in the different parts of
the trees so that the strength of the repressive effect some-
times appeared to be greater in one part than in another.
Variation in the natural level of accumulations of the ele-
ments was sometimes great enough between parts of the trees
to modify the expression of the antagonism.
16. Differences in growth (intensities of nutrient-element balance) were dependent on the relation of the sol-
uble to the insoluble N as affected by the other elements in
the shoots. An increase in growth usually resulted when the
soluble N decreased relative to the insoluble portion.
17. The reduced growth with the low intensities of bal-
ance in the acute deficiency series was related to an in-
adequate synthesis of insoluble (protein) N.
18. The moderately low intensities of balance underconditions of the mild deficiencies of K and Ca resulted in
somewhat reduced growth as a consequence of an unfavorablesoluble-insoluble-N relation which was conditioned by a
narrower inter-base relationship in the shoots.
A/19. Under conditions of highland low K, the beneficial
effect of high Ca was the result or a narrower Ca-Mg relation-
ship without a concurrent favorable shift in the relation of
62

the soluble to the Insoluble N. On the other hand, underconditions of medium N and low K, the beneficial effects of
high Ca were the result of a decrease in the soluble relativeto the insoluble N, a shift which was conditioned by changes
in the inter-base relationship,
20. High P did not alter significantly the intensityof balance resulting with medium P, because apparently at
the higher level the P in the shoots partly substituted forsoluble N to maintain with the insoluble portion a relationwhich was no more favorable to growth than the relation at
the medium level. However, even though it did not alter theamount of growth appreciably, the high P level caused varia-
tions in the quality of growth as indicated by changes in thecomposition of the shoots.
21. The diagnosis of acute and mild deficiencies wasdiscussed.
LITERATURE CITED
1. Batjer, L.P., Baynes, W.C., and Regeimbal, L.O. 1940. The interactionof nitrogen, potassium and phosphorus on the growth of young appletrees in sand culture. Proc. Amer. Soc. Hort. Sci. 37:43.
2. and Degman, E.3. 1940. Effects of various amounts of nitrogen,potassium and phosphorus on the growth and assimilation in youngapple trees. Jour. Agr. Res. 60:101-116.
3, and Magness, J.P. 1939. Potassium content of leaves from com-
mercial apple orchards. Proc. Amer. Soc. Hort. Sci. 36:197-201.
4. Blake, M.A. , Nightingale, G.T. , and Davidson, O.W. 1937. Nutritionof apple trees. N. J. Agr. Expt. Sta. Bulo 626.
5. Cullinan, F.P. Oct. 1940. Personal communication.
6. , Scott, D.H. , and Waugh, J.G. 1939. The effects of varyingamounts of nitrogen, potassium and phosphorus on the growth of youngpeach trees. Proc. Amer. Soc. Hort. Sci. 36:61-68.
7. and Waugh, J.G. 1940. Response of peach trees to potassiumunder field conditions. Proc. Amer. Soc. Hort. Sci. 37:87-94.
8. Davidson, 0.17., and Blake, M.A. 1937. Responses of young peach trees
to nutrient deficiencies. Proc. Amer. Soc. Hort. Sci. 34:247-248.
9. and . 1938. Nutrient deficiency and nutrient balance withthe peach. Proc. Amer. Soc. Hort. Sci. 35:339-346.
10. Eaton, F.M. 1942. Toxicity and accumulation of chloride and sulfatesalts in plants. Jour. Agr. Res. 64:357-399.
63

11. Hayward, H.E., and Long, E.M. 1942. Vegetative responses of the El-berta peach on Lovell and Shalil rootstocks to high chloride andsulfate solutions. Proc. /oner. Soc. Hort. Sci. 41:149-155.
12. Reed, H.S., and Haas, A.R.C. 1923. Effect of sodium chloride and cal-
cium chloride upon the growth and composition of young orange trees.Calif. Agr. Expt. Sta. Tech. Paper 4.
13. Shaw, J.K. 1924. Some unusual results in fertilizing fruit plants.
Proc. Amer. Soc. Hort. Sci. for 1924: 281-286.
14. . 1931. Further evidence of a potash-lime deficiency in a sandyloam soil. Proc. Amer. Soc. Hort. Sci. 27:12-14.
15. Thomas, W. 1932. Composition of current and previous season's branchgrowth in relation to vegetative and reproductive responses in PyrusMalus L. Plant Physiol. 7:391-445.
16. ——• 1933. Absorption, utilization and recovery of nitrogen, phos-phorus and potassium by apple trees grown in cylinders and subjectto differential treatment with nutrient salts. Jour. Agr. Res. 47:565-581.
17. . 1937. Foliar diagnosis: Principles and practice. PlantPhysiol. 12:571-599.
18. V/augh, J.G. , and Cullinan, F.P. 1941. The nitrogen, phosphorus andpotassium content of peach leaves as influenced by soil treatments.Proc. Amer. Soc. Hort. Sci. 38:13-16.
19. ——— , -, and Scott, D.H. 1940. Responses of young peach treesin sand culture to varying amounts of nitrogen, potassium and phos-phorus. Proc. Amer. Soc. Hort. Sci. 37:95-96.
20. Y/einberger , J.H. , and Cullinan, F.P. 1937. Symptoms of some mineraldeficiencies in one-year Elberta peach trees. Proc. Amer. Soc.Hort. Sci. 34:249-254.
64

Appendix Table 1. Growth Measurements for Individual Trees. Length and Dry Weight of
Shoots and Dry Weight per Millimeter of !Length
Treatment Length Weight Weight/Length
NPKCa (millimeters) (grams) (mg/mm)
Tree 1 Tree 2 Tree 1 Tree 2 Tree 1 Tree 2
HHHH 9385 15065 55.4 149.2 9.1 9.9HHHM 11015 12575 106.2 119.3 9.6 9.5HHMH 9625 15130 99.8 120.4 10.4 8.0HBMM 7310 6815 68.8 64.0 9.4 9.4HTTT.H 9385 6765 56.8 42.9 6.1 6.3HHZM 1380 1405 8.8 5.2 6.4 3.7HMHH 8640 12010 61.5 111.1 7.1 9.3HMEM 10530 11450 127.8 142.9 12.1 12.5HMMH 11350 6690 106.1 49.9 9.3 7.5HMMH 9910 6735 108.1 75.3 10.9 11.2HMLH 12865 4815 93.7 23.8 7.3 4.9HMIM 1070 1085 4.3 5.4 4.0 5.0HLHH 1905 1755 18.3 21.5 9.6 12.3ELHM 3530 3315 47.6 34.1 13.5 10.3HIMH 3290 2815 40.0 31.8 12.2 11.3sum 2575 1880 30.7 25.2 11.9 13.4HLLH 2085 1850 16.5 18.0 7.9 9.7HLia 1240 1510 10.0 13.1 8.1 8.7MHHH 11295 16230 104.9 218.2 9.3 13.4MHHM 13775 18720 198.2 209.1 14.4 11.2HHMH 17475 16135 195.4 157.5 11.2 9.8MHMM 14545 15350 143.9 191.6 9.9 12.5MHLH 12920 14805 128.1 124.6 9.9 8.4HEUf 9230 5985 71.9 50.2 7.8 8.4MMHH 11135 10165 171.0 105.7 15.4 10.4MMHM 14385 16325 222.7 238.1 15.5 14.6HMHH 15140 17775 200.5 205.7 13.2 11.6HMMH 9730 15630 123.8 202.1 12.7 12.9MMLH 15710 8770 121.0 79.3 8.8 9.0MMIM 5740 5905 36.1 52.3 6.3 8.8MLHH 2470 3395 27.7 40.4 11.2 11.9MLHM 2475 3285 30.5 46.3 12.3 14.1MIWH 3095 2950 35.1 37.3 11.3 12.6MIMM 3935 1825 47.1 20.7 12.0 11.3MLLH 3160 4075 41.1 50.3 13.0 12.3MLIM 1225 1810 10.4 17.9 8.5 9.9LHHH 2015 1665 12.7 7.2 6.3 4.3LHHM 1525 1670 11.0 10.5 7.2 6.3LHMH 2520 1765 15.7 8.1 6.2 4.6IfflM 1450 1075 13.4 9.2 9.2 8.6LHLH 1745 1340 11.2 4.2 6.4 3.1LHIM 1870 1430 14.4 12.6 7.7 8.8LMHH 2575 1760 20.9 8.9 8.1 5.1IMHM 2105 1955 21.5 12.8 10.2 6.5IMMH 2945 1910 31.2 10.8 10.6 5.7IMMM 2260 2120 21.1 14.5 9.3 6.8IMLH 2080 1540 16.3 6.9 7.8 4.5IMIM 1885 2415 16.7 24.2 8.9 10.0LLHH 2275 1750 19.2 9.1 8.4 5.2LLHM 1575 1925 17.0 13.2 10.8 6.9LLMH 1675 1500 13.1 7.2 7.8 4.8HUM 1860 1405 16.7 12.4 9.0 8.8LLLH 2695 1030 25.3 4.2 9.4 4.1LLIH 1540 1175 13.9 6.9 9.0 5.9
65

Appendix Teibla 2. Ore>wth Measuromenta for Individual Tr<see, Inorea ae in Diamel;er, Dry Weigh t or
Trunks, and Dry Weights of Fine and Coarse Roots
Treatment Diameter Increase Weight
,
Trunks Weight
,
Fine Roots Weight, Coarse Roots
NPKCa (millimeters) (grams) (grams) (grama)
Tree 1 Tree 2 Tree 1 Tree 2 Tree 1 Tree 2 TM0 1 JTree 2
HHHH 2.9 416 " 56.8 58.1 22.3 23.3 67.6 81.2HHHW 4.6 4.1 34.6 35.6 18.5 21.4 58.3 67.7
HTO 3.1 4.0 52.1 47.7 17.3 27.8 56.4 64.5
H9DI 2.6 2.6 51.4 51.4 13.3 14.6 68.2 70.9TTHT.W 1.1 0.9 36.6 31.6 7.5 13.2 63.0 38.4
HHI1I 0.9 0.0 20.6 31.0 8.6 4.6 £9.9 34.9
HHHH 2.2 4.1 42.9 53.3 15.9 18.1 61.2 58.3HMHM 5.1 4.8 40.2 37.3 21.8 14.9 92.6 90.3
HHHH 3.8 1.7 55.9 38.3 25.0 15.5 58.0 50.5
HMMM 4.1 3.8 51.5 47.7 23.1 13.6 74.5 66.6
HMLH 2.2 0.5 37.6 39.4 9.2 7.3 60.7 58.4
HMIM 0.4 0.4 25.0 17.2 4.6 1.5 33.6 43.5
HLHH 0.6 1.2 43.7 46.7 9.3 12.6 64.5 61.1HT.HM 3.0 2.1 55.7 55.9 21.2 28.7 62.4 62.0EHH 1.1 1.4 55.0 40.2 15.8 10.1 71.1 46.1
HIMM 2.1 2.1 50.8 43.2 20.4 13.1 67.0 51.7HLLH 0.7 0.8 36.6 43.7 12.3 8.2 56.6 58.5
HLIM 0.5 0.9 38.4 38.4 10.6 14.1 57.3 47.5
MHHH 3.4 6.6 51.4 85.0 27.3 67.7 59.1 101.7
HHHH 7.2 7.4 52.5 49.0 35.1 40.2 104.9 87.9
HHHH 7.3 4.3 76.5 61.6 31.7 21.3 88.6 97.8
HHHH 5.7 8.3 61.8 68.1 35.1 42.0 70.5 86.9
MHLH 3.9 4.6 45.7 39.3 28.9 18.9 74.3 67.2
HHIH 1.9 1.6 48.0 33.2 19.9 10.0 59.8 46.4
MMHH 7.1 5.2 72.4 65.9 23.9 21.0 103.9 88.6
HHHH 7.6 8.5 99.6 99.1 44.8 92.4 129.5 127.0
MHHH 7.3 9.0 109.4 97.9 65.3 44.4 123.1 125.2
MVWM 4.5 8.2 74.0 ?6 -9 tf4 48.5 96.8 128.8"MBTfl 4.0 3.2 42.4 43.9 13.3 16.7 71.0 61.6MMIM 1.8 1.8 32.9 40.3 9.0 9.1 52.3 68.6MLHH 1.7 2.4 38.9 49.9 12.6 20.9 73.7 64.6MLHM 1.8 3.5 39.9 49.0 34.6 26.7 53.6 74.2MIMH 1.9 3.0 29.8 40.8 17.9 22.8 78.5 64.1MIMM 3.3 1.4 58.1 45.5 24.3 18.2 72.0 63.5MLLH 2.4 3.0 40.5 48.5 20.0 24.9 59.8 89.3MLIM 0.7 1.2 30.7 48.1 5.5 10.9 49.8 69.0T.TTTTH 0.6 0.3 33.1 36.1 9.7 13.6 53.2 59.6T.TTHM 0.8 0.6 34.9 36.2 16.2 28.3 59.2 52.4LHHH 0.3 0.1 38.9 34.8 7.7 11.2 60.6 62.2LHHH 1.0 0.7 30.4 31.5 10.9 6.7 45.0 42.5T.HT.H 0.5 0.0 29.1 37.8 5.5 5.0 34.9 44.1LHIM 0.3 0.5 42.6 43.9 4.9 9.6 61.4 64.4IMHH 1.0 0.2 37.6 45.1 19.7 12.1 45.4 73.9IMHH 1.6 0.8 33.3 36.3 13.8 16.2 69.3 57.6IMMH 1.3 0.6 21.1 26.9 8.9 11.3 62.5 51.5IMMM 1.5 1.4 44.2 33.5 15.5 18.1 59.3 52.9
IMLH 0.8 0.5 44.2 37.8 8.4 5.4 63.4 47.7
IMIM 1.2 1.2 33.3 40.7 5.8 10.9 48.7 61.0
LLHH 0.9 0.5 37.5 34.3 16.1 6.8 50.0 48.1LLHH 1.3 0.6 26.1 46.3 23.2 20.9 47.5 68.1LIMH 0.7 0.4 43.0 29.8 20.5 15.0 60.1 50.4LIMM 1.8 1.2 32.3 36.8 8.9 11.4 63.3 57.1LLLH 1.5 0.2 44.4 31.4 9.1 7.2 79.8 60.3
LLIM 1.6 0.4 33.1 43.9 15.9 5.8 42.2 54.6
66

Appendix Table 3
Treatment Total Nitrogen Soluble Nitrogen Insoluble NitrogenNPKCa (percent) (percent)
( percent
)
Tree 1 Tree 2 Tree 1 Tree 2 Tree 1 Tree 2HHHH .831 1.004 .363 .465 .469 .559HHHM .942 1.109 .474 .599 .468 .509HHMH .925 .904 .439 .382 .485 .521HHMM .988 1.123 .526 .631 .462 .492HHLH 1.460 1.659 .822 1.004 .637 .656HHIM 1.536 1.565 .876 .890 .660 .674HMHH 1.152 1.096 .604 .591 .547 .506HMEM .920 1.046 .449 .566 .470 .481HMMH 1.074 1.549 .542 .917 .533 .632HMMM .906 1.180 .450 .687 .457 .494HMLH 1.331 1.865 .763 1.155 .569 .710mm 1.212 1.144 .601 .575 .612 .570HTJTW 1.897 1.757 1.277 1.153 .621 .605HLHM 1.204 1.530 .684 .910 .520 .619HIMH 1.586 1.304 1.009 .790 .578 .513HIMM 1.089 1.117 .612 .653 .476 .464HLLH 1.856 1.803 1.233 1.239 .623 .565HLIM 1.083 1.196 .585 .702 .497 .493MHHH .792 .727 .331 .276 .460 .451MHHM .596 .549 .205 .156 .391 .394MHMH .645 .596 .218 .167 .428 .430MHMM .715 .615 .308 .208 .407 .407MHLH .818 .879 .346 .393 .473 .487MHEM .774 1.048 .323 .570 .451 .479MMHH .773 .778 .362 .332 .412 .446MMHM .556 .522 .173 .159 .384 .364MWMH .684 .599 .261 .218 .424 .381MMMM .751 .553 .376 .186 .376 .368MMLH .921 1.006 .479 .530 .441 .475MMIM 1.069 .961 .585 .545 .485 .417MLHH 1.266 1.089 .695 .585 .572 .503MLHM 1.106 1.115 .607 .588 .498 .526MIWH 1.134 1.036 .634 .544 .499 .492MIMM .892 1.080 .445 .618 .445 .461MLLH .795 .818 .363 .400 .432 .417MLIM 1.169 1.163 .672 .624 .496 .539LHHH 1.137 .463 .563 .106 .573 .357LHHM .751 .731 .258 .247 .494 .484LHMH .674 .458 .208 .125 .467 .332LHMM .721 .855 .286 .371 .435 .484LHLH 1.003 .533 .479 .123 .525 .411T.HTM .751 .853 .300 .385 .452 .469IMHH .527 .567 .140 .154 .387 .413IMHM .649 .781 .290 .349 .360 .433IMMH .602 .424 .182 .101 .419 .323IMMM .618 .787 .213 .303 .406 .485IMLH .851 .402 .344 .239 .507 .162IMIM .476 .492 .123 .150 .354 .342LLHH .617 .409 .191 .222 .426 .186LLHM .553 .670 .191 .209 .362 .461LIMH < .644 .433 .183 .106 .462 .328LIMM .554 .660 .182 .225 .371 .435LLLH .467 .527 .105 .097 .362 .429LLIM .677 1.188 .257 .669 .420 .520
67

Treatment=
—
* M ^1Phosphorus Potassium Calcium Magnesium
NPKCa(percent
)
( percent
)
(percent) ( percent
)
Tree 1 Tree 2 Tree 1 Tree 2 Tree 1 Tree 2 Tree 1 Tree 21
HBHB .252 .244 .674 .591 .323 .320 .118 .125
HHBM .236 .273 .606 .901 .093 .099 .161 .144HBMH .239 .284 .579 .532 .385 .435 .111 .134
Ban .238 .319 .548 .588 .079 .101 .202 .219TTHT.H .394 .426 .287 .250 .514 .544 .165 .184
HHM .364 .382 .396 .336 .114 .186 .592 .533
BMEH .215 .167 ' .825 .722 .379 .289 .147 .118HMHK .121 .118 .709 .658 .067 .084 .117 .167HMMH .179 .287 .553 .573 .353 .477 .137 .211BMMM .135 .137 .545 .524 .103 .111 .165 .187HMLH .244 .361 .264 .257 .461 .632 .123 .165
mm .207 .206 .406 .278 .214 .148 .393 .476HLHH .068 .060 .671 .643 .462 .390 .186 .147
HLHM .042 ..058 .696 .657 .080 .102 .128 .256
HDJH .060 .052 .500 .390 .433 .322 .128 .115
SIMM .060 .045 .356 .356 .101 .172 .173 .224HLLH .060 .070 .345 .360 .440 .519 .136 .105HLIJI .059 .057 .312 .361 .138 .111 .300 .309MHHH .201 .181 .769 .646 .516 .663 .060 .051MHEM .208 .195 .733 .766 .238 .222 .057 .077MHMH .164 N .212 .522 .509 .759 .667 .065 .058MHMM .235 .204 .534 .453 .280 .277 .090 .132VHLH .257 .213 .238 .253 .648 .616 .071 .067MHU! .347 .217 .327 .330 .297 .287 .156 .102MMHH .090 .092 .455 .582 .483 .575 .052 .059MVBM .091 .102 .676 .626 .206 .189 .066 .082MMMH .082 .089 .409 .508 .629 .835 .056 .081BDM .102 .110 .504 .378 .236 .240 .057 .116WWLB Ills .145 .244 .214 .ess .667 .051 .066HMIM .240 .177 .335 .295 .275 .212 .147 .090MLHH .080 .062 .549 .642 .814 .680 .054 .048MLHM .062 .049 .552 .671 .228 .166 .107 .083MIMH .051 .061 .383 .376 .902 .885 .043 .077MIMM .044 .071 .425 .401 .319 .295 .113 .130MLLH .058 .047 .344 .326 .825 .744 .069 .062KL1M .106 .084 .375 .342 .373 .361 .153 .141LHHH .273 .101 .914 .721 1.204 .889 .095 .073LHHM .281 .292 .854 .847 .304 .348 .142 .134LHKH .251 .105 .741 .530 1.117 1.096 .088 .085LBMM .279 .416 .476 .728 .379 .498 .141 .131T.TTT.H .237 .151 .597 .424 1.271 1.158 .095 .152tEVA .336 .399 .519 .565 .498 .557 .122 .176IMHH .187 .111 .787 .977 1.179 1.039 .086 .091IKHM .169 .233 .889 .874 .274 .307 .080 .106IMMH .207 .097 .648 .634 .989 1.115 .064 .096DOOJ .165 .249 .524 .532 .479 .492 .136 .199IWLH .168 .093 .454 .462 1.231 1.010 .083 .070IMIM .207 .157 .471 .380 .354 .361 .108 .148LLHH .080 .038 .763 .894 1.027 .892 .079 .067T.T.HM .085 .109 .822 .781 .229 .263 .095 .118LIMH .088 .058 .601 .363 1.383 1.005 .091 .106LIMM .060 .093 .536 .550 .309 .353 .069 .113LILH .069 .056 .538 .405 .797 1.443 .070 .140LLIM .076 .142 .367 .456 .450 .586 .157 .212
68

Treatment Total Nitrogen Soluble Nitrogen Insoluble NitrogenNPKCa (percent)
( percent
)
( percent
)
Tree 1 Tree 2 Tree 1 Tree 2 Tree 1 Tree 2Hffiffl .465 .546 .198 .258 ISfflf .287HHHM .556 .665 .267 .360 .289 .306HHMH .511 .520 .237 .235 .274 .284HHMM .451 .453 .211 .206 .241 .246HHLH .543 .620 .283 .344 .259 .275HHZH .432 .376 .190 .153 .242 .224HMHH .578 .611 .300 .319 .278 .291HMHM .499 .570 .245 .301 .255 .269HMMH .558 .665 .267 .382 .292 .284HMMM .522 .615 .215 .333 .307 .283BMLH .626 .528 .344 .298 .282 .231HMIM .325 .309 .107 .109 .218 .200HLHH .618 .631 .345 .339 .273 .292HLHM .632 .669 .336 .354 .296 .314HUTH .546 .510 .290 .263 .256 .246HIMM .514 .498 .241 .229 .273 .270HLLH .645 .569 .359 .292 .285 .277HLIM .339 .462 .118 .206 .221 .256MHHH .413 .395 .138 .126 .276 .269MHHM .283 .385 .073 .124 .209 .261MHMH .406 .311 .138 .068 .268 .243MHMM .385 .383 .137 .124 .247 .259MHLH .394 .393 .128 .133 .267 .261MHIM .300 .392 .089 .164 .212 .228MMHH .424 .381 .181 .128 .242 .254mm .324 .324 .085 .081 .240 .242wwe .392 .397 .129 .144 .263 .252WTfWM .443. .375 .206 .124 .237 .252
' MWLH .412 .413 .173 .170 .240 .244MWIM .392 .367 .159 .161 .233 .207MLHH .483 .545 .213 .260 .270 .285MLHM .559 .569 .274 .267 .286 .301MIMH .422 .469 .184 .199 .238 .271MIMM .444 .446 .192 .188 .253 .259MLLH .375 .381 .139 .126 .235 .256MLIM .389 .394 .140 .145 .248 .248LHHH .377 .182 .142 .020 .236 .162LHHM .336 .312 .102 .078 .235 .234LHMH .274 .195 .058 .031 .215 .164LHMM .289 .312 .074 .089 .214 .222LHLH .374 .191 .127 .030 .248 .161LHIM .272 .303 .071 .088 .202 .216IMHH .292 .221 .072 .039 .220 .182IMHM .297 .342 .064 .109 .234 .234IMMH .336 .222 .099 .033 .237 .188IMMM .284 .393 .072 .136 .212 .256WLR .282 .204 .072 .024 .210 .181IMIM .240 .262 .043 .053 .197 .208LLHH .296 .197 .075 .026 .221 .171LLHM .283 .286 .068 .063 .215 .223LIWH .288 .195 .071 .031 .216 .164LIMM .245 .267 .047 .060 .199 .208LLLH .244 .209 .029 .036 .214 .174LLIW .275 .328 .060 .108 .214 .221
69

Appendix Table 6. P. K. Ca, and Mr In Trunks aa Percentage of Dry Weight for Individual TreesTreatment Phosphorus Potassium Calcium MagnesiumNPKCa (percent) (percent) (percent) (percent)
Tree 1 Tree 2 Tree 1 Tree 2 Tree 1 Tree 2 Tree 1 Tree 2HHHH .167 .163 .398 .342 .288 .237 .670 .076HHHM .156 .133 .330 .376 .136 .115. .087 .063HHMH .170 .181 .296 .252 .295 .245 .080 .076HHMM .133 .166 .296 .276 .124 .143 .094 .101HHLH .160 .187 .165 .171 .288 .309 .083 .073HHIM .119 .132 .174 .166 .165 .160 .089 .073HMHH .137 .128 .410 .452 .220 .207 .070 .067HHHM .079 .083 .339 .330 .081 .113 .075 .075HMMH .131 .156 .316 .322 .215 .322 .064 .089HMMM .107 .100 .302 .308 .136 .126 .090 .094HMLH .124 .135 .181 .165 .279 .284 .060 .064HMIM .086 .089 .182 .154 .171 .141 .082 .078HT.WH .060 .049 .249 .231 .201 .213 .059 .067HLBH .036 .049 »14 .297 .100 .192 .060 .062HIMH .052 ,052 .174 .192 .230 .254 .051 .057HIMM .052 .046 .213 .213 .164 .164 .073 .077HLLH .054 .060 .160 .150 .245 .239 .045 .059HLI* .051 .055 .153 .182 .134 .144 .074 .092MHHH .130 .099 .374 .401 .300 .348 .048 .037MHHM .092 .089 .353 .393 .275 .186 .048 .059MHMH .099 .115 .304 .292 .341 .303 .047 .054MnMM .143 .135 .262 .253 .196 .213 .075 .070MHLH .132 .120 .208 .190 .348 .467 .061 .051MHIM .131 .132 .148 .161 .186 .267 .068 .059MMHH .078 .059 .323 .385 .284 .264 .053 .039MHHH .060 .080 .354 .402 .151 .162 .039 .060MMMH .066 .070 .262 .277 .282 .350 .043 .056HMMM .084 .083 .335 .297 .193 .171 .063 .054IRS .679 .097 .148 .186 .535 .414 .052 .056MMIM .123 .106 .161 .165 .205 .179 .064 .062HLHH .059 .047 .292 .316 .277 .258 .050 .033HLHH .056 .054 .277 .324 .198 .146 .047 .054MIMH .041 .050 .222 .264 .311 .328 .042 .038MIMM .040 .073 .259 .207 .166 .181 .050 .052MLLH .046 .046 .209 .217 .339 .284 .040 .041MLIM .062 .062 .212 .211 .226 .211 .046 .050T.TTTTTT .114 .075 .360 .313 .284 .196 .047 .039
LHHM .122 .132 .354 .380 .175 .230 .050 .057LHMH .120 .073 .312 .228 .277 .254 .046 .032LHMM .123 .152 .246 .297 .218 .242 .060 .054
EHLH .122 .087 .233 .204 .328 .262 .046 .055
LH1M .124 .126 .196 .240 .230 .205 .057 .062IMHH .091 .080 .338 .314 .337 .258 .044 .050IMHM .091 .108 .377 .372 .211 .183 .048 .064IMMH .105 .077 .275 .298 .337 .299 .050 .050IKMM .091 .125 .284 .275 .267 .235 .048 .067
IMLH .075 .065 .254 .120 .339 .220 .049 .044
IMIM .087 .089 .100 .190 .222 .233 .053 .072
I.IHH .054 .041 .302 .310 .312 .234 .048 .046
LLHM .055 .059 .379 .357 .183 .186 .045 .050
LIMH .063 .042 .240 .272 .318 .271 .043 .042
LIMM .060 .052 .238 .210 .190 .187 .060 .047LLLH .058 .047 .228 .212 .312 .262 .045 .058LLIM .056 .065 .237 .165 .243 .218 .057 .064
70

Appendix Table 7. Nitrogen In Leaves as Percentage of Dry Weight for Individual TreesTreatmentNPKCa
BBBTHHHMHHMHHHMMHHLHHELMHMHHHMHMHMMHHHHMHMLHHMIMHLHHHLHMHLMHHIMMHLLHHLIMMHHHMHHMMHMHMHMMKHLHMHIMMMHHmm.MMMHMMWMmrrMMIMWISHMLHMMLMHMIHMMLLHMLLMLHHHLHHMLHMHLHMMLHLHLHIMIMHHIMHMIMMHIMMMLMLHIMIMLLHHLLHMLLMHL1MMLLLHLLLM
Total Nitrogen
( percent
)
Tree 1 Trea 23.742 5.7673.511 3.3173.550 3.4913.388 3.2093.942 3.7782.825 2.5743.386 3.4693.234 3.3183.559 3.4143.231 3.2283.918 3.8612.665 2.5253.578 3.5523.675 3.7283.701 3.5093.348 3.4853.832 3.5842.957 3.0833.611 3.4223.176 3.1133.367 3.4963.310 3.1873.440 3.5623.348 3.4573.374 3.6033.214 3.1973.338 3.2823.287 3.2593.342 3.3343.307 3.3643.357 3.2563.352 3.2753.532 3.2613.307 3.0423.206 2.9762.970 3.0693.003 1.6152.219 2.1763.148 1.5132.557 2.8723.243 1.8502.723 2.5632.211 1.7732.033 2.4162.716 1.9302.253 2.4053.118 1.4482.391 2.5672.464 1.4582.549 2.4322.366 1.7172.677 2.4142.678 1.9042.779 2.707
Soluble Nitrogen
( percent
)
Tree 1 Tree 2"7233 ^ST.284 .455.296 .373.287 .403.651 .545.208 .390.328 .416.285 .402.272 .457.274 .378.588 .461.343 .139.457 .664.357 .520.643 .713.432 .460.416 .448.186 .283.289 .318.214 .292.239 .256.286 .278.476 .302.459 .293.337 .273.320 .303.268 .297.311 .320
-T352 7TTZ-.325 .717.183 .314.209 .271.567 .€64.332 .157.249 .303.174 .210.320 .155.190 .143.185 .137.167 .266.191 .205.333 .287.210 .267.198 .116.161 .184.146 .205.152 .177.212 .199.197 .137.183 .195.195 .131.162 .139.142 .196.200 .202
Insoluble Nitrogen^percent
)
Tret 15.4783.2263.2553.1023.2012.6163.0572.9483.2862.9573.3292.3233.1223.3173.0572.9153.4152.7713.3212.9613.1273.0242.9642.8893.0362.8933.0692.9752.9802.9823.1753.1422.9642.9742.9572.7972.6842.0282.9622.3893.0522.3902.0011.8362.5562.1082.9652.1792.2682.3662.1702.5142.5372.578
Tree 2
3.3002.8633.0572.8053.2322.1833.0522.9152.9572.8493.3992.3862.8883.2072.7963.0243.1362.7993.1042.8223.2402.9083.2593.1653.3292.8942.9842.9383.1602.6472.9433.0052.9962.8842.6732.8581.4592.0321.3752.6051.6462.2751.5052.3001.7462.2011.2722.3671.3222.2371.5852.2761.7072.505
71

Treatment Phosphorus Potassium Calcium J.Sagneslum
WKCa (percent) (percent) (percent) ( percent
)
Tree 1 Tree 2 Tree 1 Tree 2 Tree 1 Tree 2 Tree 1 Tree 2
ffmm .398 ' .366 3.320 3.060 1.122 1.196 .526 .535HHHM .348 .385 3.300 3.000 .428 .374 .776 .629HHMH .384 .386 2.315 1.965 1.358 1.540 .585 .716HHMM .329 .361 2.135 2.070 .516 .456 1.205 1.025TTWT.ff .517 .515 .600 .815 1.458 1.282 .805 .628mrrM .296 .282 .740 .840 .930 .802 1.829 2.020HMHH- .259 .224 3.020 3.180 1.176 1.166 .728 .738
HMHH .205 .173 3.150 3.220 .410 .438 .657 1.025HMME .238 .303 2.010 2.135 1.332 1.368 .840 .864
HMMM .198 .183 2.010 1.960 .474 .502 .864 1.180HMLH .351 .357 .650 .890 1.476 1.647 1.046 .986
HMIM .188 .176 .740 .785 .886 ,994 1.910 1.940HLHH .117 .117 3.355 3.080 1.732 1.652 .859 .997HLHM .110 .119 3.530 3.370 .512 .474 1.037 .966
HIMH .150 .137 1.830 1.695 1.688 1.406 .976 .773
HIMM .121 .122 1.930 2.005 .792 .738 1.283 1.290HLLH .129 .124 .840 .704 2.084 2.000 1.267 1.123HLIM .130 .124 .980 .960 1.004 .956 1.902 1.930MHHH .375 .315 3.975 4.070 1.204 1.260 .331 .341
MHHM .339 .382 4.445 4.045 .712 .720 .452 .434
MHMH .362 .479 2.500 2.635 2.416 1.732 .395 .446
MHMM .422 .388 2.835 2.600 .986 1.040 , .477 .666
MHLH .925 .517 .710 .670 1.806 1.650 .495 .498
MHIM .847 .396 .695 .840 1.022 1.250 .665 .782
MMHH .179 .199 3.520 3.985 1.140 1.036 .368 .318
MMEM .185 .176 4.120 4.260 .684 .728 .396 .505
MMMH .178 .234 2.545 2.215 1.560 2.040 .507 .584
MMMM .205 .202 2.700 2.360 .976 1.158 .495 .773iffl .240 .272 * .705 .905 1.556" 1.834 .585 .575
MMIM .302 .303 1.080 .762 .994 1.032 .753 .568
MLHH .149 .108 3.995 3.450 1.576 1.432 .452 .426
MLHM .153 .142 3.980 3.895 .674 .710 .443 .459
MIMH .130 .134 2.455 2.790 1.942 2.040 .452 .536
MIM>' .126 .140 2.450 2.575 1.186 1.204 .711 .720
MLLH .134 .127 1.665 1.3C0 2.460 2.340 .535 .575
MLIM .158 .144 2.115 1.285 1.742 1.734 1.030 1.160LHHH .520 .310 4.165 4.375 1.880 1.928 .485 .484
LHHM 1.068 1.770 4.300 4.315 1.168' 1.048 .789 .683
LHMH .453 .332 3.650 2.925 2.010 2.216 .384 .547
LHMM .810 .621 2.660 2.655 1.540 1.740 .ei9 .937
LHLH .363 .407 2.770 2.480 2 .384 2.600 .567 .618
UBIM .860 .969 2.170 1.760 2.024 2.170 .946 1.218
IMHH .755 .330 3.990 4.875 2.016 2.260 .358 .567
IMHM .603 .626 4.520 4.315 1.006 1.204 .485 .706
IMMH .427 .172 3.490 2.480 2.380 2.480 .523 .680
IMMM .407 .626 2.895 2.985 1.780 1.732 .907 1.012
IMLH .274 .346 2.300 2.185 2.662 2.200 .652 .578
vm .478 .310 1.615 1.720 1.762 1.968 .870 1.061
LLHH .145 .110 3.730 4.625 2.034 1.506 .574 .473
LLHM .181 .176 4.550 4.880 1.022 .940 .664 .632
LIMH .152 .139 2.865 2.935 2.740 2.376 .549 .657
LIMM .156 .162 2.850 2.515 1.430 1.680 .754 .972
LLLH .175 .263 2.375 4.135 2.716 2.070 .664 .686
LLIM .163 .170 1.920 1.990 1.954 1.938 1.160 .972
72