Biocalcification of Sand through Ureolysis
11
Biocalcification of Sand through Ureolysis Chiung-Wen Chou 1 ; Eric A. Seagren, A.M.ASCE 2 ; Ahmet H. Aydilek, M.ASCE 3 ; and Michael Lai 4 Abstract: Biological processes may provide great and previously unexplored opportunities for cost-effective, in situ improvement of the engineering properties of soil. A laboratory study was conducted to evaluate the changes in geomechanical properties of sand attributable to the formation of calcium precipitates induced through ureolysis catalyzed by Sporosarcina pasteurii (S. pasteurii). Specifically, direct shear and California Bearing Ratio (CBR) tests were conducted on sand specimens subjected to treatment by growing, resting, and dead S. pasteurii cells in completely stirred tank reactors and completely mixed biofilm reactors, respectively. Scanning electron microscopy analyses were also conducted to evaluate microbially induced precipitation. The results of the study show that the bacterial cells effectively improved the geomechanical properties of the sand. Growing cells improved the sand properties owing to microbially induced precipitation and related pore volume changes, whereas dead and resting cells generally caused smaller increases in friction angle and bearing strength. Analysis of the sand from CBR specimens treated with growing cells demonstrated that the microbial and chemical processes both contributed to the clogging of the porous medium. DOI: 10.1061/(ASCE)GT.1943-5606.0000532. © 2011 American Society of Civil Engineers. CE Database subject headings: Soil properties; Bacteria; Calcium carbonate; Soil strength; Sand (soil type). Author keywords: Soil properties; Bacteria; Calcium carbonate; Strength. Introduction Microbial activities are ubiquitous in surface and subsurface soils and have a tremendous effect on the composition, properties, and geomechanical behavior of earth materials [National Research Council (NRC) 2006]. Examples of biomediated processes that have been investigated for their influences on geomechanical prop- erties include mineral precipitation, biofilm formation, use of biopolymers, mineral transformation, and biogenic gas production (Seagren and Aydilek 2009). For example, natural cementation of geological formations through mineral precipitation occurs constantly over time owing to physiochemical and microbiological reactions. These microbially mediated reactions result in relatively insoluble compounds that can contribute to soil cementation. One of these natural processes is microbially induced calcium carbonate (CaCO 3 ) precipitation. Microbially induced CaCO 3 precipitation, or biocalcification, is a ubiquitous process and plays an important cementation role in natural systems including soils, sediments, and minerals (Buczynski and Chafetz 1991; Monger et al. 1991; Defarge et al. 1996). As reviewed by Seagren and Aydilek (2009), examples of heterotrophic processes (i.e., processes in which microbial cells obtain their carbon from organic compounds) associated with bio- calcification include biotransformation of organic nitrogen com- pounds, e.g., urea hydrolysis (Gollapudi et al. 1995; Stocks-Fischer et al. 1999; Urzi et al. 1999; Fujita et al. 2000; Ramachandran et al. 2001; Ross et al. 2001; Bang et al. 2001; DeJong et al. 2006; Whiffin et al. 2007), and oxidation of organic compounds under denitrifying (Abdelouas et al. 1998; Karatas et al. 2008), sulfate- reducing (Abd-El-Malek and Rizk 1963; Van Lith et al. 2003; Aloisi et al. 2006), and methanogenic (Rittmann et al. 2003; VanGulck et al. 2003) conditions. In addition, chemosynthetic and photosynthetic autotrophs (i.e., organisms that use CO 2 as their carbon source) can induce the precipitation of carbonates when they remove CO 2 from bicarbonate-containing solutions in the presence of an adequate supply of Ca 2þ or other appropriate cations (Ehrlich 2002), such as during hydrogenotrophic methanogenesis (i.e., formation of methane and conversion of hydrogen to other compounds) (Castanier et al. 1999), autotrophic denitrification (Lee and Rittmann 2003), and photosynthesis in the open, aerobic environment (Thompson and Ferris 1990). Among the different mechanisms of biocalcification, urea hydrolysis (or ureolysis), as shown in Eq. (1), was the focus of the work reported in this paper: NH 2 CONH 2 þ 3H 2 O ⟶ Urease 2NH þ 4 þ CO 2 þ 2OH HCO 3 þ OH ↔H 2 O þ CO 2 3 · CO 2 3 þ H 2 O↔2OH þ CO 2 ð1Þ The release of NH þ 4 and CO 2 results in an increase in pH and alkalinity, thereby creating an environment in which at least some of the CO 2 produced will be transformed into carbonate. Thus, in unbuffered environments containing adequate amounts of Ca 2þ and other cations, CaCO 3 precipitation can result if the solubility product, K sp , is exceeded (Sawyer et al. 2003): CaCO 3 ðsÞ↔Ca 2þ þ CO 2 3 K sp ¼½Ca 2þ ½CO 2 3 ¼ 5 × 10 9 mole 2 =L 2 at 25°C ð2Þ Biocalcification likely occurs through a combination of homo- geneous and heterogeneous nucleation (Mitchell and Ferris 2006). 1 Graduate Research Assistant, Dept. of Civil and Environmental Engineering, Univ. of Maryland, 1163 Glenn Martin Hall, College Park, MD 20742. 2 Associate Professor, Dept. of Civil and Environmental Engineering, Michigan Technological Univ., 1400 Townsend Dr., Houghton, MI 49931. 3 Associate Professor, Dept. of Civil and Environmental Engineering, Univ. of Maryland, 1163 Glenn Martin Hall, College Park, MD 20742 (corresponding author). E-mail: [email protected] 4 Graduate Research Assistant, Fischell Dept. of Bioengineering, 2334 Jeong H. Kim Engineering Building, Univ. of Maryland, College Park, MD 20742. Note. This manuscript was submitted on July 10, 2009; approved on March 10, 2011; published online on March 12, 2011. Discussion period open until May 1, 2012; separate discussions must be submitted for indi- vidual papers. This paper is part of the Journal of Geotechnical and Geoenvironmental Engineering, Vol. 137, No. 12, December 1, 2011. ©ASCE, ISSN 1090-0241/2011/12-1179–1189/$25.00. JOURNAL OF GEOTECHNICAL AND GEOENVIRONMENTAL ENGINEERING © ASCE / DECEMBER 2011 / 1179 J. Geotech. Geoenviron. Eng. 2011.137:1179-1189. Downloaded from ascelibrary.org by National Institute of Technology - Warangal on 11/05/13. Copyright ASCE. For personal use only; all rights reserved.
-
Upload
independent -
Category
Documents
-
view
0 -
download
0
Transcript of Biocalcification of Sand through Ureolysis
Biocalcification of Sand through UreolysisChiung-Wen Chou1; Eric A. Seagren, A.M.ASCE2; Ahmet H. Aydilek, M.ASCE3; and Michael Lai4
Abstract: Biological processes may provide great and previously unexplored opportunities for cost-effective, in situ improvement of theengineering properties of soil. A laboratory study was conducted to evaluate the changes in geomechanical properties of sand attributable tothe formation of calcium precipitates induced through ureolysis catalyzed by Sporosarcina pasteurii (S. pasteurii). Specifically, direct shearand California Bearing Ratio (CBR) tests were conducted on sand specimens subjected to treatment by growing, resting, and dead S. pasteuriicells in completely stirred tank reactors and completely mixed biofilm reactors, respectively. Scanning electron microscopy analyses werealso conducted to evaluate microbially induced precipitation. The results of the study show that the bacterial cells effectively improved thegeomechanical properties of the sand. Growing cells improved the sand properties owing to microbially induced precipitation and relatedpore volume changes, whereas dead and resting cells generally caused smaller increases in friction angle and bearing strength. Analysis ofthe sand from CBR specimens treated with growing cells demonstrated that the microbial and chemical processes both contributed to theclogging of the porous medium. DOI: 10.1061/(ASCE)GT.1943-5606.0000532. © 2011 American Society of Civil Engineers.
CE Database subject headings: Soil properties; Bacteria; Calcium carbonate; Soil strength; Sand (soil type).
Author keywords: Soil properties; Bacteria; Calcium carbonate; Strength.
Introduction
Microbial activities are ubiquitous in surface and subsurface soilsand have a tremendous effect on the composition, properties, andgeomechanical behavior of earth materials [National ResearchCouncil (NRC) 2006]. Examples of biomediated processes thathave been investigated for their influences on geomechanical prop-erties include mineral precipitation, biofilm formation, use ofbiopolymers, mineral transformation, and biogenic gas production(Seagren and Aydilek 2009). For example, natural cementationof geological formations through mineral precipitation occursconstantly over time owing to physiochemical and microbiologicalreactions. These microbially mediated reactions result in relativelyinsoluble compounds that can contribute to soil cementation. Oneof these natural processes is microbially induced calcium carbonate(CaCO3) precipitation.
Microbially induced CaCO3 precipitation, or biocalcification,is a ubiquitous process and plays an important cementationrole in natural systems including soils, sediments, and minerals(Buczynski and Chafetz 1991; Monger et al. 1991; Defarge et al.1996). As reviewed by Seagren and Aydilek (2009), examples ofheterotrophic processes (i.e., processes in which microbial cells
obtain their carbon from organic compounds) associated with bio-calcification include biotransformation of organic nitrogen com-pounds, e.g., urea hydrolysis (Gollapudi et al. 1995; Stocks-Fischeret al. 1999; Urzi et al. 1999; Fujita et al. 2000; Ramachandran et al.2001; Ross et al. 2001; Bang et al. 2001; DeJong et al. 2006;Whiffin et al. 2007), and oxidation of organic compounds underdenitrifying (Abdelouas et al. 1998; Karatas et al. 2008), sulfate-reducing (Abd-El-Malek and Rizk 1963; Van Lith et al. 2003;Aloisi et al. 2006), and methanogenic (Rittmann et al. 2003;VanGulck et al. 2003) conditions. In addition, chemosyntheticand photosynthetic autotrophs (i.e., organisms that use CO2 as theircarbon source) can induce the precipitation of carbonates whenthey remove CO2 from bicarbonate-containing solutions in thepresence of an adequate supply of Ca2þ or other appropriate cations(Ehrlich 2002), such as during hydrogenotrophic methanogenesis(i.e., formation of methane and conversion of hydrogen to othercompounds) (Castanier et al. 1999), autotrophic denitrification(Lee and Rittmann 2003), and photosynthesis in the open, aerobicenvironment (Thompson and Ferris 1990).
Among the different mechanisms of biocalcification, ureahydrolysis (or ureolysis), as shown in Eq. (1), was the focus ofthe work reported in this paper:
NH2CONH2 þ 3H2O⟶Urease
2NHþ4 þ CO2 þ 2OH�HCO�
3
þ OH�↔H2Oþ CO2�3 · CO2�
3 þ H2O↔2OHþ CO2
ð1Þ
The release of NHþ4 and CO2 results in an increase in pH and
alkalinity, thereby creating an environment in which at least someof the CO2 produced will be transformed into carbonate. Thus, inunbuffered environments containing adequate amounts of Ca2þand other cations, CaCO3 precipitation can result if the solubilityproduct, Ksp, is exceeded (Sawyer et al. 2003):
CaCO3ðsÞ↔Ca2þ þ CO2�3
Ksp ¼ ½Ca2þ�½CO2�3 � ¼ 5 × 10�9 mole2=L2 at 25°C
ð2Þ
Biocalcification likely occurs through a combination of homo-geneous and heterogeneous nucleation (Mitchell and Ferris 2006).
1Graduate Research Assistant, Dept. of Civil and EnvironmentalEngineering, Univ. of Maryland, 1163 Glenn Martin Hall, College Park,MD 20742.
2Associate Professor, Dept. of Civil and Environmental Engineering,Michigan Technological Univ., 1400 Townsend Dr., Houghton, MI 49931.
3Associate Professor, Dept. of Civil and Environmental Engineering,Univ. of Maryland, 1163 Glenn Martin Hall, College Park, MD 20742(corresponding author). E-mail: [email protected]
4Graduate Research Assistant, Fischell Dept. of Bioengineering, 2334Jeong H. Kim Engineering Building, Univ. of Maryland, College Park, MD20742.
Note. This manuscript was submitted on July 10, 2009; approved onMarch 10, 2011; published online on March 12, 2011. Discussion periodopen until May 1, 2012; separate discussions must be submitted for indi-vidual papers. This paper is part of the Journal of Geotechnical andGeoenvironmental Engineering, Vol. 137, No. 12, December 1, 2011.©ASCE, ISSN 1090-0241/2011/12-1179–1189/$25.00.
JOURNAL OF GEOTECHNICAL AND GEOENVIRONMENTAL ENGINEERING © ASCE / DECEMBER 2011 / 1179
J. Geotech. Geoenviron. Eng. 2011.137:1179-1189.
Dow
nloa
ded
from
asc
elib
rary
.org
by
Nat
iona
l Ins
titut
e of
Tec
hnol
ogy
- W
aran
gal o
n 11
/05/
13. C
opyr
ight
ASC
E. F
or p
erso
nal u
se o
nly;
all
righ
ts r
eser
ved.

Homogeneous carbonate nucleation results when the heterotrophicand autotrophic metabolic processes discussed previously causechanges that lead to oversaturation in the bulk solution chemistryand in microenvironments surrounding cells, thereby catalyzingprecipitation (Schultze-Lam et al. 1996). Heterogeneous nucleationoccurs when bacterial cells (living or dead) function as nucleationsites (Schultze-Lam et al. 1996), through the binding of cations tothe wall (Greenfield 1963; Stocks-Fischer et al. 1999; Van Lith et al.2003; Aloisi et al. 2006) and extracellular polymeric substances(EPS) (Braissant et al. 2007; Ercole et al. 2007), both of whichcarry a net negative electric charge. For example, if free Ca2þ isavailable, the conditions are favorable for it to attach to cells be-cause of the attractive force between the cations and the negativelycharged cells (Stocks-Fischer et al. 1999):
Ca2þ þ Cell → Cell� Ca2þ ð3Þ
In the presence of carbonate, CaCO3 precipitates form on thecells according to
Cell-Ca2þ þ CO2�3 → Cell� CaCO3↓ ð4Þ
Under in situ soil and aquifer conditions, the porous mediumprovides additional sites for nucleation on the matrix mineralsurfaces (Ferris et al. 2004).
The biocalcification process, especially with use of urea as amicrobial substrate, has been successfully implemented in the lab-oratory for improvement of sands and plugging of fractured rocks(Gollapudi et al. 1995; Urzi et al. 1999; Ramachandran et al. 2001;Ross et al. 2001; Bang et al. 2001; Day et al. 2003; DeJong et al.2010). Nevertheless, the relationship between ureolysis and soilgeomechanical properties is still not well understood in terms ofthe conditions necessary to stimulate these natural processes in situ,and the magnitude of the effects on soil properties. Therefore, thisstudy investigated biocalcification in sand through ureolysis underbiotic (with growing cells or resting cells, i.e., living cells in theabsence of growth substrates) and abiotic (with dead cells or nocells) conditions. The effects of cell numbers and soil compactionon microbial cementation and the geomechanical properties ofthe sand, including improvements in soil strength and changesin hydraulic conductivity, were also examined. A key aspect of thisstudy was the development of unique, dual-purpose experimentalequipment that could serve as a bioreactor and be used directly inthe testing equipment for determining the geomechanical propertiesof the specimen.
Materials and Methods
Sand
Unground silica sand (99.7% quartz) (U.S. Silica Company, WestVirginia) was used in the experiments. The sand was uniformlygraded (coefficient of uniformity, Cu ¼ 1:1), had a median particlesize (D50) of 0.46 mm, and included no fines. It was classified aspoorly graded sand on the basis of the Unified Soil ClassificationSystem. Microscopic analysis indicated that the sand was subangu-lar in shape (Krumbein 1941). The specific gravity and pH of thesand were 2.65 and 6.5, respectively. The maximum and minimumvoid ratios determined per ASTMD4254 and D4253 were 0.93 and0.68, respectively. Before use, the sand was sequentially washedwith an acidic solution (0.25 N HCl) followed by a basic solution(0.25 N NaOH), each for 12 h with periodic stirring. Subsequently,the sand was rinsed with deionized water until a pH 7 was reached,and it was then autoclaved.
Microorganism
The bacterium used in this study was Sporosarcina pasteurii(S. pasteurii) [American Type Culture Collection (ATCC) 11859].S. pasteurii 11859 was maintained on Bacillus pasteurii urease(BPU) medium (Bang et al. 2001) streak plates and refrigeratedat 4°C. The culture was transferred monthly to fresh plates. To pre-pare the live cell inocula for the geomechanical tests with growingor resting cells, as described subsequently, a colony of S. pasteurii11859 was aseptically transferred to 5 mL of autoclaved Tris-YEmedium (Stocks-Fischer et al. 1999). The culture was incubatedovernight at 30°C with shaking, and the cells were harvested duringthe late exponential phase as determined through absorbance(λ ¼ 600 nm) in a spectrophotometer (Spectronic 21, Bausch &Lomb). This initial culture was then transferred aseptically to1 L of Tris-YE medium, and the process was repeated. Next, thecells were harvested by centrifugation at 4,500 rpm for 10 min,after which the cell pellets were washed twice in 0.13 M Tris-HClbuffer (pH ¼ 9). After washing, the cells were resuspended in thebuffer to create a sufficient volume of cell suspension for the ex-perimental systems described subsequently, at the desired concen-trations of 103 and 107 colony-forming units (cfu)/mL on the basisof a correlation curve between absorbance at 600 nm and cellnumber. Alternatively, for the preparation of dead cells, a 1 L cellsolution containing 108 cfu=mL was autoclaved for 30 min per dayon three consecutive days. Then, this autoclaved cell suspensionwas diluted into the required volume of buffer at the desired cellconcentrations.
Specimen Preparation
Model porous medium specimens were prepared using two experi-mental systems designed to promote uniform calcium carbonateformation within the pore spaces and allow key geotechnical prop-erties (e.g., shear strength and bearing capacity) to be evaluated.Specifically, direct shear and California Bearing Ratio (CBR) testswere conducted on specimens prepared in completely stirred tankreactors (CSTRs) and hydraulically completely mixed biofilmreactors (CMBRs), respectively. In both reactor systems, the exper-imental conditions tested included (1) various cell types (i.e.,growing, resting, and dead cell treatments); (2) different bacterialconcentrations (i.e., 103 and 107 cfu=mL); and (3) two levels ofcompaction, i.e., loose- or dense-sand compaction at relative den-sities of 35% (γd ¼ 14:1 kN=m3) or 85% (γd ¼ 15:2 kN=m3),respectively.
CSTR System and Direct Shear Tests
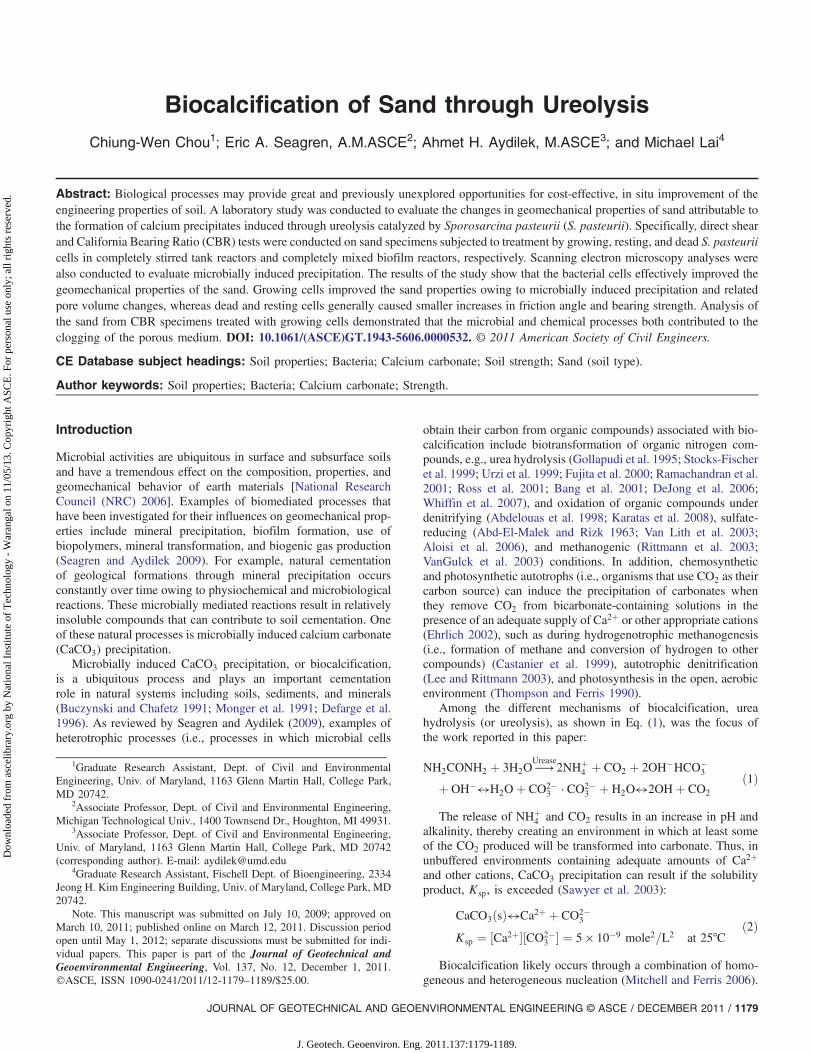
The CSTR was created from a 6-L plastic tub covered with alumi-num foil with silicone tubing for the influent and effluent lines, twoperistaltic pumps to control the flow rates, a magnetic stir bar/mixerto provide mixing, and an air diffuser connected with filtered houseair for aeration [Fig. 1(a)]. All components of the CSTR were steri-lized by placement in a 0.1% HNO3 acid bath for 24 h and rinsedwith deionized water, followed by autoclaving.
To avoid possible reactions (e.g., corrosion) between conven-tional metal shear boxes and the aqueous media, shear boxes(100 × 100 mm) were constructed from polyurethane. These weresterilized before use by following the procedure described previ-ously for the CSTR and were subsequently filled with sterilizedsand. For the loose density, a funnel was used to aseptically plu-viate the sand from 2 mm above the surface. Dense compaction wasobtained by pluviating the sand from 0.3 m above the surface infour layers, with tamping after the introduction of each layer, fol-lowing the procedures outlined in Abdulla (1995).
1180 / JOURNAL OF GEOTECHNICAL AND GEOENVIRONMENTAL ENGINEERING © ASCE / DECEMBER 2011
J. Geotech. Geoenviron. Eng. 2011.137:1179-1189.
Dow
nloa
ded
from
asc
elib
rary
.org
by
Nat
iona
l Ins
titut
e of
Tec
hnol
ogy
- W
aran
gal o
n 11
/05/
13. C
opyr
ight
ASC
E. F
or p
erso
nal u
se o
nly;
all
righ
ts r
eser
ved.
For each growing-cell experiment, triplicate shear boxes withloose or dense compaction were aseptically placed in the CSTRalong with 6 L of live cell suspension (103 or 107 cfu=mL) [seeFig. 1(a)]. To ensure the shear boxes were inoculated, 3 L ofthe inoculum was poured equally through the boxes, which werethen left undisturbed for 24 h to allow bacteria to attach to the sandparticles. Subsequently, an aseptically prepared urea-CaCl2 growthmedium (nutrient broth 3 g, urea 20 g, NH4Cl 10 g, NaHCO3
2.12 g, and CaCl2 2.8 g per liter of solution; final pH ¼ 8:0)(Stocks-Fischer et al. 1999) was fed at flow rates of 9.5 or8:3 mL=min for the specimens with loosely or densely compactedsand, respectively, corresponding to hydraulic retention times(HRTs) of 10.5 and 12 h. Conservative (bromide) tracer studiesconfirmed that complete mixing of the aqueous phase was achievedunder these conditions (Chou 2008). Flow was continued untilthe monitored parameters (pH, urea, calcium, and cell number)approached a steady state. During this time, the direct shear spec-imens were in contact with the urea-CaCl2 medium, but themedium was not forced to flow directly through the boxes. Forthe resting and dead cell treatments, the direct shear specimens withloose or dense compaction were placed in 6 L of the live or deadcell suspension (103 or 107 cfu=mL), respectively, for 24 h withcomplete mixing, but without addition of the urea-CaCl2 medium.
After preparation in the CSTR, the shear strength of the spec-imens was determined using a direct shear apparatus. Multiplesingle-point direct shear tests [ASTM D3080 (ASTM 2005)] wereconducted under normal stresses ranging from 11 to 40 kPa, andthe specimens were kept saturated during the tests. Low normalstresses were applied to simulate conditions in contaminatedmaterial capping and unpaved road applications (e.g., biocalcifica-tion for dust control). A shear rate of 1%/min was utilized, andresidual shear strength was measured when the shear box reachedits displacement limit of 15 mm.
CMBR System and CBR Tests
The CMBR system included a PVC column (152 mm long,152 mm in diameter), with top and bottom plates made of polyure-thane board [see Fig. 1(b)]. All experimental conditions used inthe CSTR system were also adopted for the CMBRs. To simulateloose compaction, the sterilized columns were prepared by asepti-cally pouring the sand from a funnel at a height of 2 mm above thesurface. Dense compaction was achieved by pluviating the steri-lized sand from 0.45 m above the sand surface in four layers, withtamping after introduction of each layer until the target dry densitywas achieved. Head loss across the column was measured by usinga piezometer constructed from 305-mm-long glass tubing, attachedto the system, and placed on a board adjacent to the column. Thehead loss across the column and flow rate were used with Darcy’slaw to determine the hydraulic conductivity. All components of theCMBR system were sterilized by autoclaving before use.
For each experiment with growing cells, the specimen with theselected density was saturated with 0.13 M Tris-HCl buffer at aflow rate of 1.5 mL/min for 24 h, after which the column was in-oculated by pumping in 2 L of a suspension containing 107 cfu=mLlive cells. The column then sat stagnant for 12 h to allow organismsto attach to the sand. Subsequently, the urea-CaCl2 medium, whichwas aerated with filtered house air, was fed into the column. Aperistaltic pump controlled the influent rate, Q, at 1.5–0.1 mL/minto provide an HRT of 12 and 10.5 h for the dense- and loose-compaction conditions, respectively. Another peristaltic pumpwas used to recycle the column effluent back to the influent ata recycle flow, QR, of 20 mL=min, giving a QR=Q ratio of 13.According to nonreactive tracer (bromide) studies, this resultedin approximately hydraulically completely mixed conditions inthe columns (Chou 2008). Key parameters (urea, ammonium,calcium, pH, flow rate, dissolved oxygen, and cell number) weremonitored until flow could no longer be generated through thecolumn by the peristaltic pump. Preparation of the specimens withresting and dead cells followed the same procedure as preparationof the specimens with growing cells; however, live and dead cellinoculum concentrations of 103 and 107 cfu=mL, respectively,were used, and no substrate was supplied to prevent cell washoutand growth of the resting cells.
Immediately after preparation, the CBR column was drained fora few minutes and the CBR tests were carried out at a 1.27 mm/minstrain rate by using the Geotest Instrument S5840 Multi-Loaderloading frame. Applied stress was 12 kPa to simulate low stressesin typical capping and unpaved road applications. All CBR testswere conducted by following the methods outlined in AASHTOT-193 and ASTM D1883.
Volatile and Mineral Film Analysis
Following the approach of Rowe et al. (2002), the material accu-mulated on the surface of the porous media in the CMBR was con-ceptualized as composed of a volatile biofilm containing active andinactive biomass and an inorganic solid film consisting of precipi-tated material. The biofilm thickness and density were estimated by
Influent pump
Air Filter
Medium reservoir(Urea + CaCl2)
Dispersion tube
House air
CSTR
Effluent tubingS. pasteuriisuspension
Magnetic stirrer
Shear box
Riser
(a)
Influent pump
Air Filter
Medium reservoir(Urea + CaCl2)
Dispersion tube
House air
Recycle pump
Piezometer
CBRColumn
(b)
Fig. 1. Schematic drawings of: (a) CSTR/direct (i.e., lowercase) shearboxes system; (b) CMBR/CBR system
JOURNAL OF GEOTECHNICAL AND GEOENVIRONMENTAL ENGINEERING © ASCE / DECEMBER 2011 / 1181
J. Geotech. Geoenviron. Eng. 2011.137:1179-1189.
Dow
nloa
ded
from
asc
elib
rary
.org
by
Nat
iona
l Ins
titut
e of
Tec
hnol
ogy
- W
aran
gal o
n 11
/05/
13. C
opyr
ight
ASC
E. F
or p
erso
nal u
se o
nly;
all
righ
ts r
eser
ved.
following the procedures described in Seagren et al. (2002). First,two samples of the sand, one from the top of the column and theother from the bottom, were aseptically removed from the CMBRwith dense sand (inoculated with growing cells at 107 cells=mL)after deformation in the CBR measurement. The samples werestored in sterilized jars at 4°C until analyzed. The mass of watercontained in the biofilm, W (M), was quantified by determiningthe mass loss attributable to drying (105°C) of the subsamples.Then the biofilm thickness, Lf ;a (L), was estimated by using thefollowing equation:
Lf ;a ¼W
ρnAð0:99Þ ð5Þ
where ρ = water density at 20°C (ML�3); n = number of dry sandparticles in the subsample; A = surface area of a sand particle (L2);and 0.99 = assumed fraction of the biofilm mass that is water. Inthis work, n was estimated by dividing the dry weight of the sand inthe subsample by the mass per sand particle, which was estimatedby multiplying the specific gravity of the sand by the volume of asand particle, assuming that the particle is a sphere with the mediandiameter of a sand particle (D50 ¼ 0:46 mm). Similarly, the surfacearea, A, was also calculated by assuming a spherical sand particlewith a diameter equal to D50 and applying a correction factor of 1.3for angularity per Russell and Taylor (1937) (i.e., the particles weresubangular in shape).
The volatile solids (VS) weight, B (M), of the subsamples wasused to estimate the biomass weight and was determined by meas-uring the mass loss of the dried subsamples attributable to ignition(550°C). Biofilm density, Xf ;a (MxL�3), was then estimated accord-ing to the following equation:
Xf ;a ¼B
nALfð6Þ
Similarly, the thickness of the inorganic solid film, Lf ;i (L), wasestimated by using the following equation adapted from Rowe et al.(2002):
Lf ;i ¼BCaCO3
nAXf ;ið7Þ
where BCaCO3(M) = precipitated mass of Ca on the sand particles
(reported as CaCO3) measured in the subsamples, and Xf ;i =inorganic solid film density (ML�3), which was assumed to be thatof calcite ¼ 2:71 g=cm3 (Roberts et al. 1990).
Scanning Electron Microscopy and Energy DispersiveX-ray Spectroscopy
Scanning electron microscopy (SEM) was used to examine theformation of microbially induced precipitation and biofilms on thesurface of the sand matrix. Untreated sand and specimens preservedafter treatment in the CMBR were first oven-dried at 40°C forthree days. Subsequently, some specimens went through a pretreat-ment procedure, followed by mounting and coating, whereas otherspecimens were directly mounted and coated for SEM analysiswithout pretreatment to avoid dissolution of the authigenic minerals(i.e., minerals formed in situ). The pretreatment, mounting, andcoating procedures are described in Chou et al. (2008). Once thespecimens were coated, they were ready for SEM and semiquanti-tative energy dispersive x-ray spectroscopy (EDS) analyses.
Analytical Methods
Bromide was measured by using a bromide combination electrode(Orion 94-35, Thermo Electron Corp.) and an ion meter (OrionModel 520A). Readings (mV)were converted to Br� concentrations
on the basis of standard curves produced using dilutions of a bromidestandard solution (1 ppm to 1,000 ppm).
The colorimetric method of Jung et al. (1975) was used todetermine the aqueous urea concentration. To perform the test, a50-μL sample was added to a test tube containing 2.5 mL ofo-phthalaldehyde reagent, followed by 2.5 mL of naphthylenedi-amine reagent. The mixture was vortex mixed and incubated at37°C for 30 min for the color development. A blank was preparedby adding 2.5 mL of BRIJ 35 (Ricca Chemical), instead of 50 μL ofsample, and used to zero the spectrophotometer. Additionally, areagent blank was prepared by adding 50 μL of deionized water.The absorbance of each tube was then recorded by using thespectrophotometer at a wavelength of 505 nm. A calibration curveof urea concentration versus absorbance values, which were cor-rected by subtracting the absorbance of the reagent blank, wasprepared following the same procedures.
Calcium concentrations in aqueous samples were measured byusing the ethylenediaminetetraacetic acid (EDTA) titration method,implemented in Method 3500-Ca [American Public Health Asso-ciation (APHA) 1995]. The mass of calcium precipitates accumu-lated on the sand was determined as follows. First, subsamples ofthe porous media samples taken from the CMBR for determinationof the biofilm thickness and density (see previous description) weredried at 105°C for 24 h, cooled, and weighed to get the mass of drysand. The dry samples were rinsed with an acid solution of 0.1 NH2SO4 to allow the precipitates to dissolve into the liquid phase.The sample plus solution was mixed by hand for 10 min and fil-tered through 0.45-μm filter paper, after which the calcium contentwas determined by using the EDTA titration method. This valuewas assumed to represent the content of calcium associated withthe porous media and was converted to the equivalent mass asCaCO3 to give BCaCO3
.Cell enumeration (cfu/mL) was performed by serial dilution in a
0.85% NaCl solution and spread plating on agar plates preparedusing the urea-CaCl2 growth media. The number of cfu on the agarplates was counted after two days of incubation at 30°C.
Results and Discussion
CSTR and Direct Shear Tests
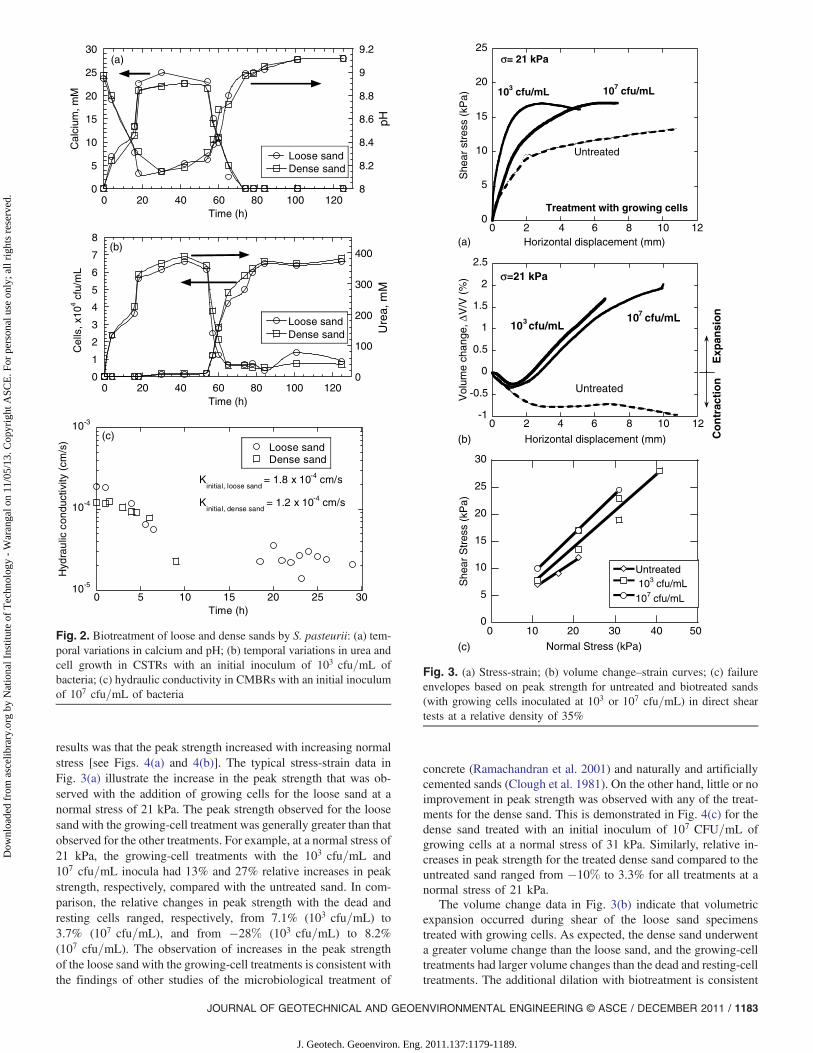
The data presented in Fig. 2 for the CSTR system treated withgrowing cells (initial inoculum of 103 live cfu/mL) show thatthe changes in pH, urea, and calcium correspond well with cellgrowth. For example, an increase in pH and decreases in calciumand urea values can be observed starting at 54 h and correspondingto a sharp change in the cell growth curve. These observations areconsistent with Eqs. (1)–(4) and the findings reported by Fujita et al.(2000) and Bang et al. (2001). Similar trends were observed in thespecimens inoculated with 107 cfu=mL; however, the increases inpH and cell numbers and decreases in calcium and urea values wereobserved earlier, starting at 18 h, probably owing to the greaterinoculum size.
Specimens treated with growing cells were subjected to directshear tests once the utilization rate of urea in the CSTR basinreached steady state (see Fig. 2). However, in the case of restingand dead cells, the cells were inoculated in the sand, and shear testswere performed after one day of curing time. This curing time wasselected to give the cells enough time to attach to the surface ofthe sand particles, while minimizing the decay of the resting cells.Representative data from the direct shear test are presented inFigs. 3 and 4, and the strength parameters for the different speci-mens are summarized in Table 1. A common finding in all of the
1182 / JOURNAL OF GEOTECHNICAL AND GEOENVIRONMENTAL ENGINEERING © ASCE / DECEMBER 2011
J. Geotech. Geoenviron. Eng. 2011.137:1179-1189.
Dow
nloa
ded
from
asc
elib
rary
.org
by
Nat
iona
l Ins
titut
e of
Tec
hnol
ogy
- W
aran
gal o
n 11
/05/
13. C
opyr
ight
ASC
E. F
or p
erso
nal u
se o
nly;
all
righ
ts r
eser
ved.
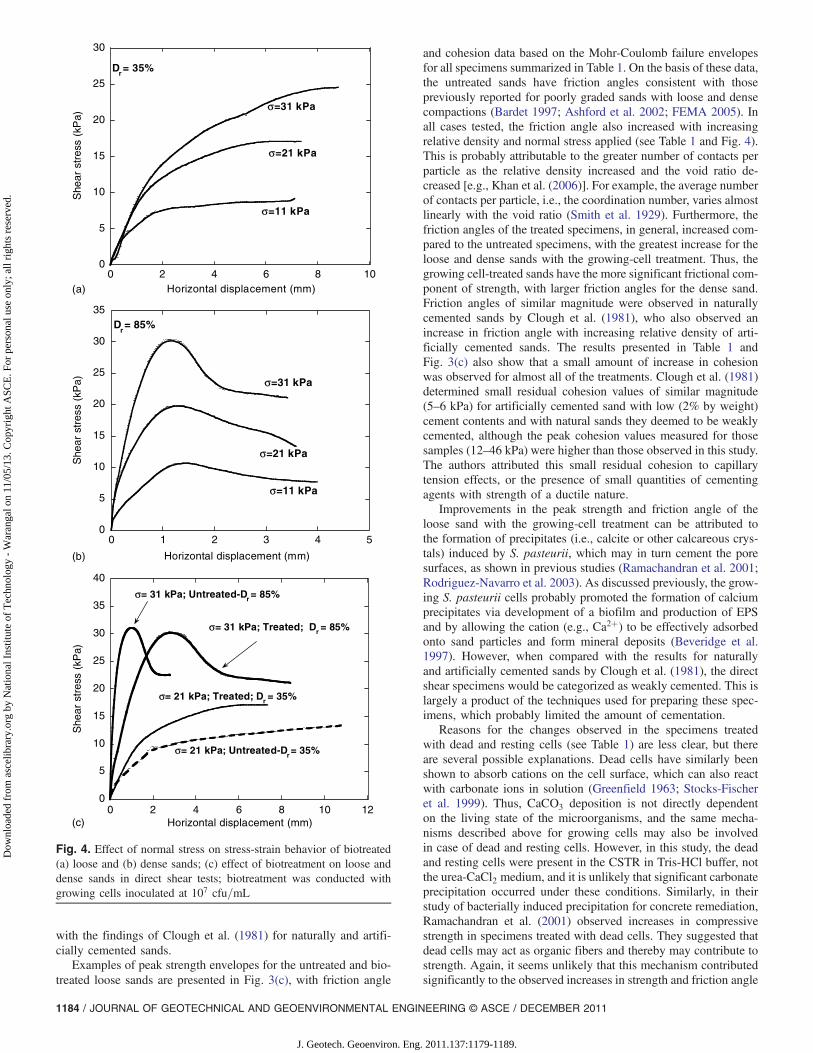
results was that the peak strength increased with increasing normalstress [see Figs. 4(a) and 4(b)]. The typical stress-strain data inFig. 3(a) illustrate the increase in the peak strength that was ob-served with the addition of growing cells for the loose sand at anormal stress of 21 kPa. The peak strength observed for the loosesand with the growing-cell treatment was generally greater than thatobserved for the other treatments. For example, at a normal stress of21 kPa, the growing-cell treatments with the 103 cfu=mL and107 cfu=mL inocula had 13% and 27% relative increases in peakstrength, respectively, compared with the untreated sand. In com-parison, the relative changes in peak strength with the dead andresting cells ranged, respectively, from 7.1% (103 cfu=mL) to3.7% (107 cfu=mL), and from �28% (103 cfu=mL) to 8.2%(107 cfu=mL). The observation of increases in the peak strengthof the loose sand with the growing-cell treatments is consistent withthe findings of other studies of the microbiological treatment of
concrete (Ramachandran et al. 2001) and naturally and artificiallycemented sands (Clough et al. 1981). On the other hand, little or noimprovement in peak strength was observed with any of the treat-ments for the dense sand. This is demonstrated in Fig. 4(c) for thedense sand treated with an initial inoculum of 107 CFU=mL ofgrowing cells at a normal stress of 31 kPa. Similarly, relative in-creases in peak strength for the treated dense sand compared to theuntreated sand ranged from �10% to 3.3% for all treatments at anormal stress of 21 kPa.
The volume change data in Fig. 3(b) indicate that volumetricexpansion occurred during shear of the loose sand specimenstreated with growing cells. As expected, the dense sand underwenta greater volume change than the loose sand, and the growing-celltreatments had larger volume changes than the dead and resting-celltreatments. The additional dilation with biotreatment is consistent
0
5
10
15
20
25
30
8
8.2
8.4
8.6
8.8
9
9.2
0 20 40 60 80 100 120
Loose sandDense sand
Cal
cium
, mM
pH
Time (h)
(a)
0
1
2
3
4
5
6
7
8
0
100
200
300
400
0 20 40 60 80 100 120
Loose sandDense sand
Cel
ls, x
104 c
fu/m
L
Ure
a, m
M
Time (h)
(b)
10-5
10-4
10-3
0 5 10 15 20 25 30
Loose sand Dense sand
Hyd
rau
lic c
ondu
ctiv
ity (
cm/s
)
Time (h)
(c)
Kinitial, loose sand
= 1.8 x 10⁻⁴ cm/s
Kinitial, dense sand
= 1.2 x 10⁻⁴ cm/s
Fig. 2. Biotreatment of loose and dense sands by S. pasteurii: (a) tem-poral variations in calcium and pH; (b) temporal variations in urea andcell growth in CSTRs with an initial inoculum of 103 cfu=mL ofbacteria; (c) hydraulic conductivity in CMBRs with an initial inoculumof 107 cfu=mL of bacteria
0
5
10
15
20
25
She
ar s
tres
s (k
Pa)
Horizontal displacement (mm)
σ= 21 kPa
Untreated
103 cfu/mL 107 cfu/mL
Treatment with growing cells
(a)
-1
-0.5
0
0.5
1
1.5
2
2.5
Vol
ume
chan
ge, ∆
V/V
(%
)
Horizontal displacement (mm)
Untreated
107 cfu/mL103 cfu/mL
Exp
ansi
on
Co
ntr
acti
on
σ=21 kPa
(b)
0
5
10
15
20
25
30
0 2 4 6 8 10 12
0 2 4 6 8 10 12
0 10 20 30 40 50
Untreated 103 cfu/mL107 cfu/mL
She
ar S
tres
s (k
Pa)
Normal Stress (kPa)(c)
Fig. 3. (a) Stress-strain; (b) volume change–strain curves; (c) failureenvelopes based on peak strength for untreated and biotreated sands(with growing cells inoculated at 103 or 107 cfu=mL) in direct sheartests at a relative density of 35%
JOURNAL OF GEOTECHNICAL AND GEOENVIRONMENTAL ENGINEERING © ASCE / DECEMBER 2011 / 1183
J. Geotech. Geoenviron. Eng. 2011.137:1179-1189.
Dow
nloa
ded
from
asc
elib
rary
.org
by
Nat
iona
l Ins
titut
e of
Tec
hnol
ogy
- W
aran
gal o
n 11
/05/
13. C
opyr
ight
ASC
E. F
or p
erso
nal u
se o
nly;
all
righ
ts r
eser
ved.
with the findings of Clough et al. (1981) for naturally and artifi-cially cemented sands.
Examples of peak strength envelopes for the untreated and bio-treated loose sands are presented in Fig. 3(c), with friction angle
and cohesion data based on the Mohr-Coulomb failure envelopesfor all specimens summarized in Table 1. On the basis of these data,the untreated sands have friction angles consistent with thosepreviously reported for poorly graded sands with loose and densecompactions (Bardet 1997; Ashford et al. 2002; FEMA 2005). Inall cases tested, the friction angle also increased with increasingrelative density and normal stress applied (see Table 1 and Fig. 4).This is probably attributable to the greater number of contacts perparticle as the relative density increased and the void ratio de-creased [e.g., Khan et al. (2006)]. For example, the average numberof contacts per particle, i.e., the coordination number, varies almostlinearly with the void ratio (Smith et al. 1929). Furthermore, thefriction angles of the treated specimens, in general, increased com-pared to the untreated specimens, with the greatest increase for theloose and dense sands with the growing-cell treatment. Thus, thegrowing cell-treated sands have the more significant frictional com-ponent of strength, with larger friction angles for the dense sand.Friction angles of similar magnitude were observed in naturallycemented sands by Clough et al. (1981), who also observed anincrease in friction angle with increasing relative density of arti-ficially cemented sands. The results presented in Table 1 andFig. 3(c) also show that a small amount of increase in cohesionwas observed for almost all of the treatments. Clough et al. (1981)determined small residual cohesion values of similar magnitude(5–6 kPa) for artificially cemented sand with low (2% by weight)cement contents and with natural sands they deemed to be weaklycemented, although the peak cohesion values measured for thosesamples (12–46 kPa) were higher than those observed in this study.The authors attributed this small residual cohesion to capillarytension effects, or the presence of small quantities of cementingagents with strength of a ductile nature.
Improvements in the peak strength and friction angle of theloose sand with the growing-cell treatment can be attributed tothe formation of precipitates (i.e., calcite or other calcareous crys-tals) induced by S. pasteurii, which may in turn cement the poresurfaces, as shown in previous studies (Ramachandran et al. 2001;Rodriguez-Navarro et al. 2003). As discussed previously, the grow-ing S. pasteurii cells probably promoted the formation of calciumprecipitates via development of a biofilm and production of EPSand by allowing the cation (e.g., Ca2þ) to be effectively adsorbedonto sand particles and form mineral deposits (Beveridge et al.1997). However, when compared with the results for naturallyand artificially cemented sands by Clough et al. (1981), the directshear specimens would be categorized as weakly cemented. This islargely a product of the techniques used for preparing these spec-imens, which probably limited the amount of cementation.
Reasons for the changes observed in the specimens treatedwith dead and resting cells (see Table 1) are less clear, but thereare several possible explanations. Dead cells have similarly beenshown to absorb cations on the cell surface, which can also reactwith carbonate ions in solution (Greenfield 1963; Stocks-Fischeret al. 1999). Thus, CaCO3 deposition is not directly dependenton the living state of the microorganisms, and the same mecha-nisms described above for growing cells may also be involvedin case of dead and resting cells. However, in this study, the deadand resting cells were present in the CSTR in Tris-HCl buffer, notthe urea-CaCl2 medium, and it is unlikely that significant carbonateprecipitation occurred under these conditions. Similarly, in theirstudy of bacterially induced precipitation for concrete remediation,Ramachandran et al. (2001) observed increases in compressivestrength in specimens treated with dead cells. They suggested thatdead cells may act as organic fibers and thereby may contribute tostrength. Again, it seems unlikely that this mechanism contributedsignificantly to the observed increases in strength and friction angle
0
5
10
15
20
25
30
She
ar s
tres
s (k
Pa)
Horizontal displacement (mm)
σ=11 kPa
σ=21 kPa
Dr= 35%
σ=31 kPa
(a)
0
5
10
15
20
25
30
35
She
ar s
tres
s (k
Pa)
Horizontal displacement (mm)
σ=11 kPa
σ=21 kPa
Dr= 85%
σ=31 kPa
(b)
0
5
10
15
20
25
30
35
40
0 2 4 6 8 10
0 1 2 3 4 5
0 2 4 6 8 10 12
She
ar s
tres
s (k
Pa)
Horizontal displacement (mm)
σ= 21 kPa; Untreated-Dr = 35%
σ= 21 kPa; Treated; Dr = 35%
σ= 31 kPa; Untreated-Dr = 85%
σ= 31 kPa; Treated; Dr = 85%
(c)
Fig. 4. Effect of normal stress on stress-strain behavior of biotreated(a) loose and (b) dense sands; (c) effect of biotreatment on loose anddense sands in direct shear tests; biotreatment was conducted withgrowing cells inoculated at 107 cfu=mL
1184 / JOURNAL OF GEOTECHNICAL AND GEOENVIRONMENTAL ENGINEERING © ASCE / DECEMBER 2011
J. Geotech. Geoenviron. Eng. 2011.137:1179-1189.
Dow
nloa
ded
from
asc
elib
rary
.org
by
Nat
iona
l Ins
titut
e of
Tec
hnol
ogy
- W
aran
gal o
n 11
/05/
13. C
opyr
ight
ASC
E. F
or p
erso
nal u
se o
nly;
all
righ
ts r
eser
ved.
with the resting or dead cells in the current study, given the smallsize of the cells compared to the sand particles. Another possibleexplanation for the strength increase is that the addition of thecells may have increased the dry unit weights of the specimens.Although not physically checked, this also seems unlikely to havea significant effect, given the small mass of dead and resting cellspresent. Thus, none of the possible explanations are expectedto result in significant changes in strength, consistent with theprevious observations.
Whether cells are serving as nucleation sites and inducingprecipitation of calcareous crystals through their metabolic activ-ities or contributing to changes in soil strength through some othermechanism, an increase in effect is expected with increased cellnumbers. Correspondingly, the peak friction angle was observedto increase with increasing cell numbers for all the cell types, assummarized in Table 1.
CMBR and CBR Tests
In the CMBR systems inoculated with growing cells, the effluenttrends in urea, pH, cell number, and calcium concentration weresimilar to those observed in the CSTR system and presented inFig. 2. The calcium and urea concentrations initially increasedas they were diluted into the system, and then decreased after ap-proximately 20 h (data not shown). Therefore, dilution of thosesubstrates was dominant between the first and second HRT, afterwhich urea degradation and carbonate precipitation became dom-inant and the pH level increased. Calcium concentrations in bothcolumns decreased to below the detection limit after 33–35 h, sug-gesting that microbially induced calcification was limited by thecalcium concentration. After 33 h and 44 h in the loosely anddensely compacted sand columns, respectively, the CMBR reactorswere at steady state with respect to urea utilization and cell growth.
The cell growth and biocalcification resulted in increased headloss and decreased flow rate, as expected. Correspondingly, thehydraulic conductivity of the sand in both columns decreasedfrom an initial value of ∼1 × 10�4 cm=s to about 2 × 10�5 cm=s[see Fig. 2(c)]. For the dense and loose compactions, head loss be-came too large to measure with the piezometers after 10 and 30 h,respectively. Flow rate, however, was monitored until the headgenerated by the peristaltic pump controlling the influent rate wasinsufficient to overcome the head loss in the columns (i.e., Q ¼ 0),which occurred after 80 h and 112 h of incubation in the dense- andloose-compaction columns, respectively.
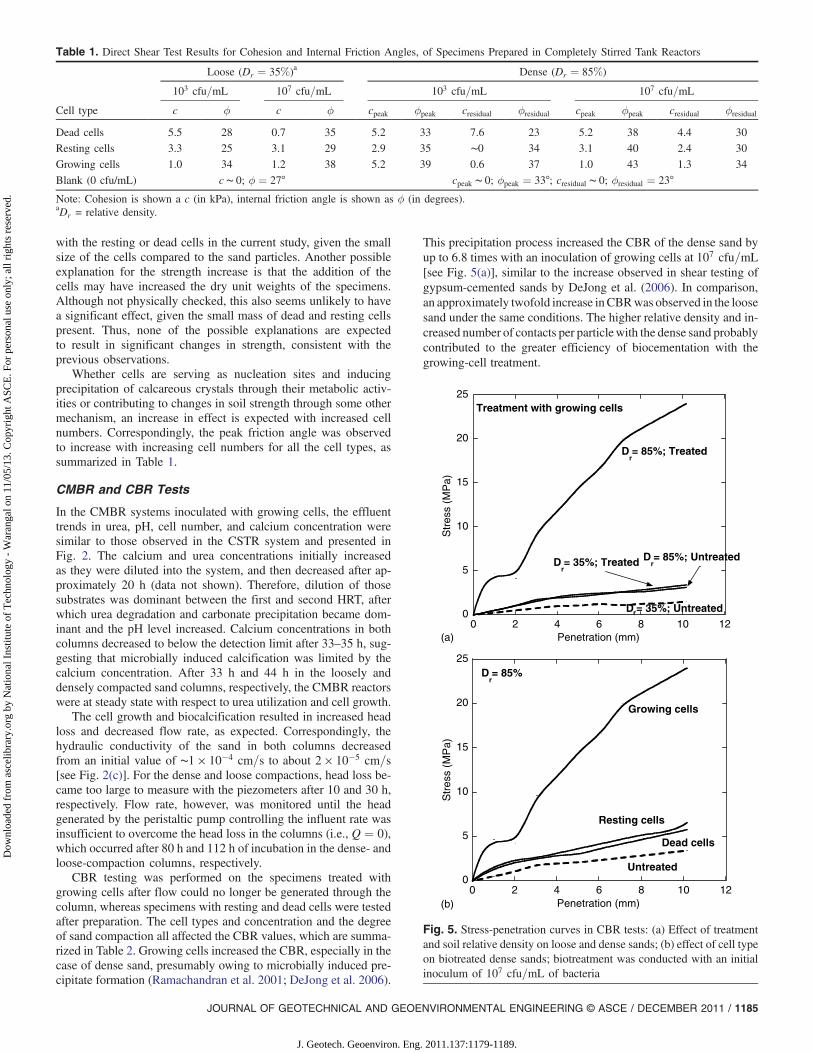
CBR testing was performed on the specimens treated withgrowing cells after flow could no longer be generated through thecolumn, whereas specimens with resting and dead cells were testedafter preparation. The cell types and concentration and the degreeof sand compaction all affected the CBR values, which are summa-rized in Table 2. Growing cells increased the CBR, especially in thecase of dense sand, presumably owing to microbially induced pre-cipitate formation (Ramachandran et al. 2001; DeJong et al. 2006).
This precipitation process increased the CBR of the dense sand byup to 6.8 times with an inoculation of growing cells at 107 cfu=mL[see Fig. 5(a)], similar to the increase observed in shear testing ofgypsum-cemented sands by DeJong et al. (2006). In comparison,an approximately twofold increase inCBRwas observed in the loosesand under the same conditions. The higher relative density and in-creased number of contacts per particlewith the dense sand probablycontributed to the greater efficiency of biocementation with thegrowing-cell treatment.
0
5
10
15
20
25
Str
ess
(MP
a)
Penetration (mm)
Dr= 35%; Untreated
Dr= 85%; Untreated
Treatment with growing cells
Dr= 85%; Treated
(a)
Dr= 35%; Treated
0
5
10
15
20
25
0 2 4 6 8 10 12
0 2 4 6 8 10 12
Str
ess
(MP
a)
Penetration (mm)
Untreated
Dead cells
Dr= 85%
Growing cells
(b)
Resting cells
Fig. 5. Stress-penetration curves in CBR tests: (a) Effect of treatmentand soil relative density on loose and dense sands; (b) effect of cell typeon biotreated dense sands; biotreatment was conducted with an initialinoculum of 107 cfu=mL of bacteria
Table 1. Direct Shear Test Results for Cohesion and Internal Friction Angles, of Specimens Prepared in Completely Stirred Tank Reactors
Cell type
Loose (Dr ¼ 35%)a Dense (Dr ¼ 85%)
103 cfu=mL 107 cfu=mL 103 cfu=mL 107 cfu=mL
c ϕ c ϕ cpeak ϕpeak cresidual ϕresidual cpeak ϕpeak cresidual ϕresidual
Dead cells 5.5 28 0.7 35 5.2 33 7.6 23 5.2 38 4.4 30
Resting cells 3.3 25 3.1 29 2.9 35 ∼0 34 3.1 40 2.4 30
Growing cells 1.0 34 1.2 38 5.2 39 0.6 37 1.0 43 1.3 34
Blank (0 cfu/mL) c ∼ 0; ϕ ¼ 27° cpeak ∼ 0; ϕpeak ¼ 33°; cresidual ∼ 0; ϕresidual ¼ 23°
Note: Cohesion is shown a c (in kPa), internal friction angle is shown as ϕ (in degrees).aDr = relative density.
JOURNAL OF GEOTECHNICAL AND GEOENVIRONMENTAL ENGINEERING © ASCE / DECEMBER 2011 / 1185
J. Geotech. Geoenviron. Eng. 2011.137:1179-1189.
Dow
nloa
ded
from
asc
elib
rary
.org
by
Nat
iona
l Ins
titut
e of
Tec
hnol
ogy
- W
aran
gal o
n 11
/05/
13. C
opyr
ight
ASC
E. F
or p
erso
nal u
se o
nly;
all
righ
ts r
eser
ved.
The dead and resting cells, on the other hand, generally didnot contribute as significantly to the CBR, as shown in Fig. 5(b).In addition, unlike observations with the dense sand treated withgrowing cells, the initial response to loading by the soils treatedwith dead and resting cells was stiff, with the soils exhibiting asoftening behavior after 2.5- to 3-mm penetration of the piston,similar to the untreated soil. Increases in CBR with these treatmentsranged from negligible to three times that of the loose and densesand, with increases in the loose sand generally larger than in thedense sand (see Table 2). As discussed above, these negligible-to-small impacts observed with dead and resting cells may be a resultof cells serving as nucleation sites or acting like organic fibers andthereby contributing to the overall strength of the treated sand; orthe cell additions may have caused an increase in dry unit weightsof the specimens. Again, none of these explanations seem likely tocause significant changes under the given experimental conditions,consistent with the relatively small changes observed.
As with friction angle, the CBR increased when the concentra-tion of dead or resting cells increased, regardless of the relativedensity of the sand (see Table 2). For example, the CBRs of theloose and dense sands treated with 103 dead cfu/mL was about16 and 14, respectively. In comparison, the loose- and dense-sandCBRs increased to about 29 and 39, respectively, when the bacterialconcentration was increased to 107 cfu=mL.
Table 2. California Bearing Ratio (%) of Specimens Prepared inCompletely Mixed Biofilm Reactors
Cell type
Loose (Dr ¼ 35%) Dense (Dr ¼ 85%)
103 cfu=mL 107 cfu=mL 103 cfu=mL 107 cfu=mL
Blank
(0 cfu=mL)
10 21
Dead cells 16 29 14 39
Resting cells 17 18 25 35
Growing cells NAa 21 NAa 143aNA = not analyzed.
Fig. 6. SEMs of: (a) untreated sand with pretreatment before SEManalysis; (b) biocemented sand without pretreatment before SEManalysis; (c) focus on the area within the square boundary in panel(b) (images by authors)
Fig. 7. SEMs of the surface of biotreated sand: (a) without and (b) withpretreatment before SEM analysis (images by authors)
1186 / JOURNAL OF GEOTECHNICAL AND GEOENVIRONMENTAL ENGINEERING © ASCE / DECEMBER 2011
J. Geotech. Geoenviron. Eng. 2011.137:1179-1189.
Dow
nloa
ded
from
asc
elib
rary
.org
by
Nat
iona
l Ins
titut
e of
Tec
hnol
ogy
- W
aran
gal o
n 11
/05/
13. C
opyr
ight
ASC
E. F
or p
erso
nal u
se o
nly;
all
righ
ts r
eser
ved.
Given that the greatest increase in CBR occurred in the CMBRwith dense sand and growing cells inoculated at 107 cfu=mL, it wasthe focus of additional analysis. Porous media samples taken afterthe CBR test were found to have an average (inlet and outlet) of0.40% VS by dry weight (gVS=g sand) (s ¼ 0:0086%) and 68.8%Ca as CaCO3 (g CaCO3=g sand) (s ¼ 0:212%). The inlet and outletmeasurements were very similar, suggesting that these values wererelatively uniform throughout the column as expected with the hy-draulically completely mixed reactor. On the basis of the VS value,the biofilm thickness, Lf ;a, was estimated at 0.056 mm [Eq. (5)],and the density, Xf ;a, at 11.1 mg VS=cm3 [Eq. (6)], whereas thecalcium content was used to estimate an Lf ;i of 0.040 mm [Eq. (7)].The biofilm thickness and inorganic solid film thickness estimatesare similar in magnitude, despite the greater mass of calcium pre-cipitates accumulated in the porous medium compared to the massof VS, because the density of the inorganic solid film is expectedto be much greater than the volatile film density (VanGulck andRowe 2004b).
Although useful, as outlined subsequently, a number of approx-imations have been associated with these film thickness estimates.For example, the estimation of the sand grain surface area affected allthree values. Also, in the biofilm measurements, it is not possibleto distinguish water adhering to mineral precipitate/sand from waterin the biomass (VanGulck and Rowe 2008), which would tend to
overestimate Lf ;a and thereby underestimate Xf ;a. Similarly, theassumed density of calcite for the inorganic precipitate in the calcu-lation of Lf ;i may not be the actual value, which would affect theestimate for Lf ;i. Nonetheless, the estimated film thicknesses do sug-gest that biomass growth and mineral precipitation contributed sig-nificantly to the reduction in the pore space of the porous medium.
To evaluate the loss of porosity attributable to the film ac-cumulation in the CMBR, the total estimated film thickness,Lt (¼ Lf ;a þ Lf ;i) was normalized to the particle diameter, dp (as-sumed to equal the D50), as (2Lt=dp), following the approach ofCooke and Rowe (1999) and resulting in a value of 0.42. On thebasis of the estimated porosity of 0.42 for the densely compactedsand, it was calculated that there were approximately eight contactsper sand particle (Smith et al. 1929) and, therefore, assumed thatthe packing approximated an orthorhombic arrangement. Accord-ing to the analysis of Cooke and Rowe (1999) for orthorhombicpacking, clogging of spherical porous media occurs when theporosity is reduced to 10% of the original value, correspondingto a value of ð2Lt=dpÞ ¼ 0:31, and complete pore occlusion whenð2Lt=dpÞ ¼ 0:5275. The estimated value of 0.42 for this study fallswithin this range, consistent with the observed loss of hydraulicconductivity discussed previously.
Although the biofilm and inorganic solid film estimates are use-ful for comparing the relative contributions of biomass and mineral
0.5 1.0 1.5 2.0 2.5 3.0 3.5 4.0 4.5 keV
Counts
5.3k
4.5k
4.0k
3.3k
2.6k
1.9k
1.2k
0.6kC
O
Si
Au
Pd
PdPd Ca Ca
Counts
2.8k
2.5k
2.2k
1.9k
1.6k
1.2k
1.0k
0.6k
0.4k
0.2k
0 0.6 1.2 1.8 2.4 3.0 3.6 4.2 4.8 5.4 6.0 keV
Si
Au
O
CCl
Cl
Pd
Ca
Ca
(b)
(a)
Fig. 8. Composite profile: (a) untreated sand grains; (b) growing cell-treated sand grains by using EDS
JOURNAL OF GEOTECHNICAL AND GEOENVIRONMENTAL ENGINEERING © ASCE / DECEMBER 2011 / 1187
J. Geotech. Geoenviron. Eng. 2011.137:1179-1189.
Dow
nloa
ded
from
asc
elib
rary
.org
by
Nat
iona
l Ins
titut
e of
Tec
hnol
ogy
- W
aran
gal o
n 11
/05/
13. C
opyr
ight
ASC
E. F
or p
erso
nal u
se o
nly;
all
righ
ts r
eser
ved.
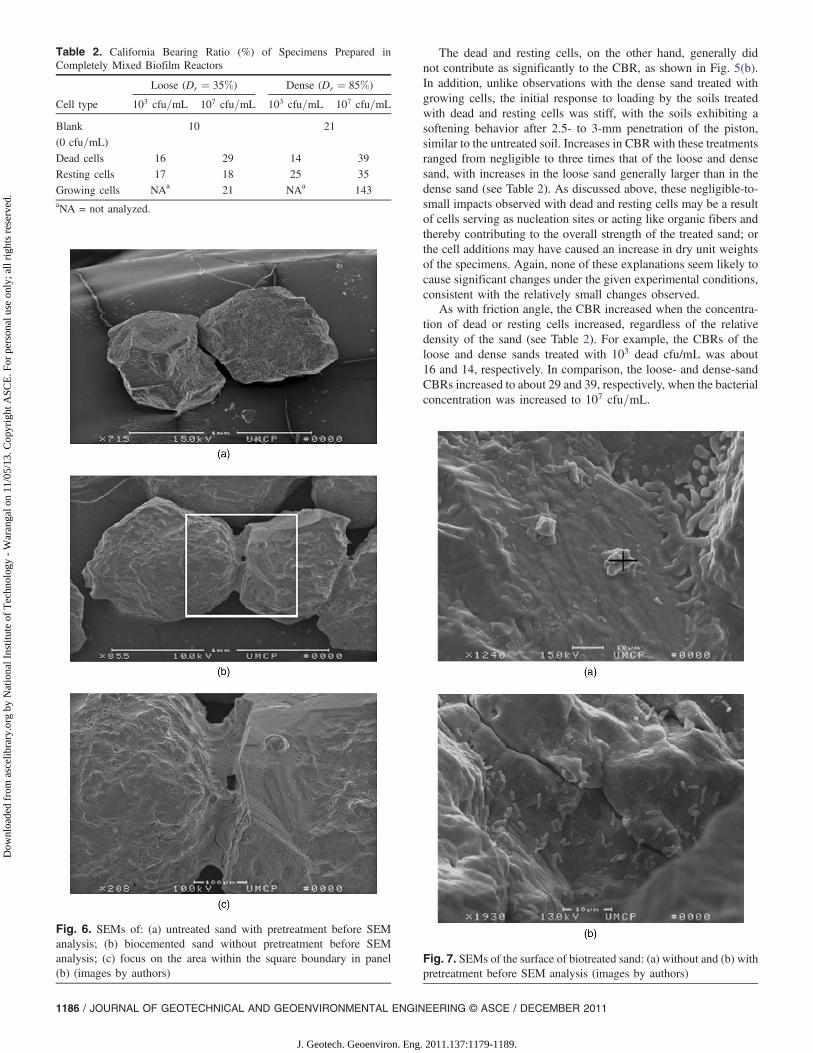
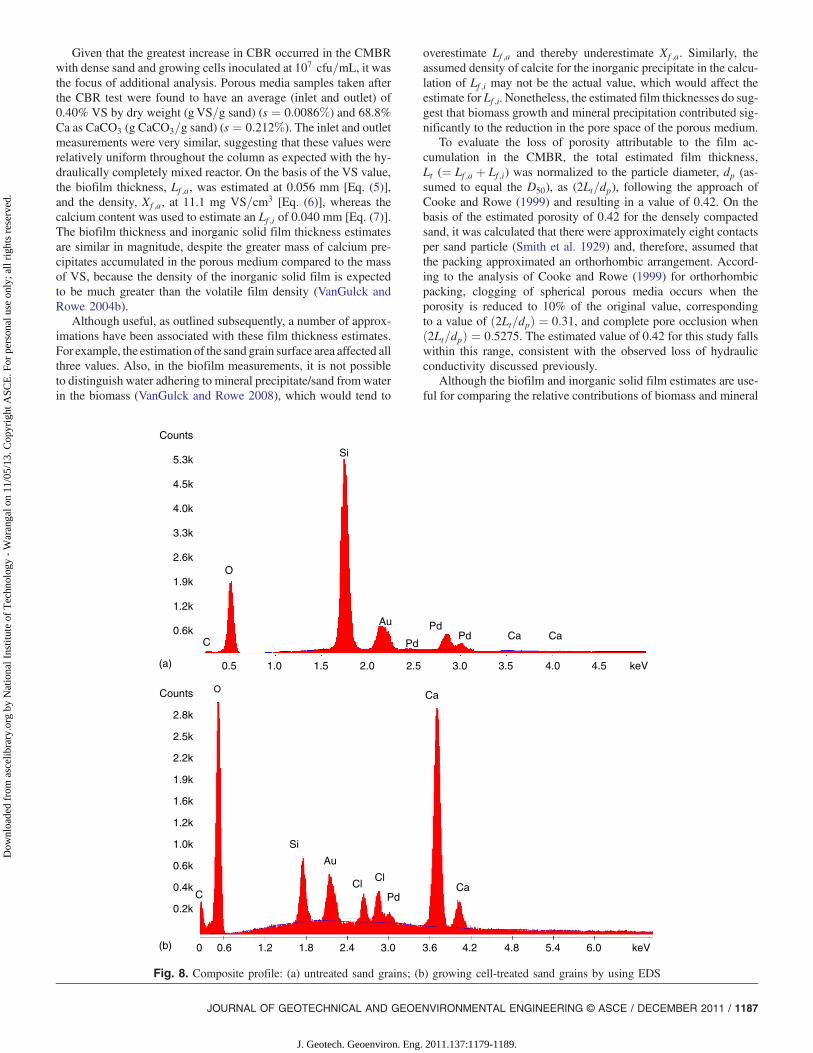
precipitate to clogging, they do not provide any insight into theactual in situ structure of the clog material (VanGulck and Rowe2004a). Therefore, SEM and EDS analyses were performed onuntreated sand and CMBR specimens subjected to microbial treat-ment with growing cells (initial inoculum ¼ 107 cfu=mL) in theCBR columns. In comparison to the untreated sand [see Fig. 6(a)],the microbiologically treated specimens showed evidence of ce-mentation on the particle surface and at particle contacts as shownin Figs. 6(b) and 6(c). The images in Fig. 6 and others available atChou et al. (2008) demonstrate significant bonding at most particlecontact points, comparable to the intermediate cementation levelsdescribed by Chang and Woods (1992). Crystal faces formed asa result of treatment with S. pasteurii are apparent in the highlymagnified images [e.g., Fig. 7(a)], similar to observations madeby DeJong et al. (2006). As shown in Fig. 7(b), pretreatmentbefore the SEM analysis to remove the heavy cementation revealedthe bacterial attachment to the sand particles, consistent with thefindings of Fujita et al. (2000) and Bang et al. (2001).
Further confirmation of the biocalcification was obtained by an-alyzing for the presence of calcium crystals through EDS coupledwith SEM. On the basis of the EDS analysis performed on mag-nified SEM images of untreated and treated (see Fig. 8) specimens,the compositional profile of the crystal on the surface of the treatedsand grains had a high Ca content relative to the profile of the un-treated sand, which had none, further indicating that cementationwas the result of microbially induced precipitation of calciumminerals, presumably calcite (Stocks-Fischer et al. 1999). Thus,the overall results of the SEM and EDS analyses confirm the bio-film and inorganic film evaluations indicating that the clogging ofthe pore space in the sand resulted from a combination of biomassgrowth and calcium precipitates.
It should be acknowledged that the CBR specimens wereallowed to free drain before the tests, and thus the tests were con-ducted on unsaturated specimens. The decrease in porosity associ-ated with clogging of the pore space by a combination of biomassand calcium precipitates may have resulted in an increase in soilsuction (negative pore pressure) in the unsaturated specimens,thereby contributing to the increase in CBR values. However, nodata were collected on this point.
Conclusions
The hydrolysis of urea was promoted in CSTR and CMBR systemscontaining loose- or dense-sand specimens that were inoculatedwith growing S. pasteurii cells. As a result, an increase in pH to9.1 was observed, thereby creating a favorable environment forCaCO3 precipitation. Other specimens were treated with dead andresting S. pasteurii cells. Specimens prepared in the CSTR andCMBR systems were subjected to direct shear and CBR tests,respectively. In the direct shear tests, the peak strength observedfor the loose sand with the growing-cell treatment was generallygreater than for the other treatments. Furthermore, the frictionangles of all of the treated specimens generally increased com-pared to the untreated specimens, with the greatest increase forthe growing-cell treatment, and a small increase in cohesion wasobserved for almost all treatments. Growing cells also increasedthe CBR, especially in case of the dense sand. The dead and restingcells, on the other hand, generally did not contribute as significantlyto the CBR. Treatment with growing cells also resulted in a de-crease in the hydraulic conductivity of loose- and dense-sandcolumns. Evaluation of the VS and calcium associated with thesand particles, coupled with SEM and EDS analyses, suggests thatbiomass growth and calcium mineral precipitation contributed
significantly to clogging of the porous medium. The increase inbiofilm and mineral films in specimens treated with growing cellswas attributable to the microbial activity, which induced conditionsconducive for the precipitation of calcium minerals, presumablycalcium carbonate.
Acknowledgments
This material is based upon work supported by the National ScienceFoundation under Grant No. CMS-05-28171. Any opinions, find-ings, and conclusions or recommendations expressed in this mate-rial are those of the writers and do not necessarily reflect the viewsof the National Science Foundation. The writers acknowledgeProfessor Sookie S. Bang (South Dakota School of Mines andTechnology, Rapid City, SD, USA) for providing the original Spor-osarcina pasteurii strain 11859 culture used in these experiments.
References
Abd-El-Malek, Y., and Rizk, S. G. (1963). “Bacterial sulphate reductionand the development of alkalinity. II. Laboratory experiments withsoils.” J. Appl. Bacteriol., 26(1), 14–19.
Abdelouas, A., Lu, Y. M., Lutze, W., and Nuttall, H. E. (1998). “Reductionof U(VI) to U(IV) by indigenous bacteria in contaminated groundwater.” J. Contam. Hydrol., 35(1–3), 217–233.
Abdulla, W. A. (1995). “Centrifuge modeling of sinkhole development inweakly cemented sand.” Ph.D. dissertation, Univ. of Maryland, CollegePark, MD.
Aloisi, G., Gloter, A., Kroger, M., Wallmann, K., Guyot, F., and Zuddas, P.(2006). “Nucleation of calcium carbonate on bacterial nanoglobules.”Geology : J. Association of Teachers of Geol., 34(12), 1017–1020.
American Public Health Association (APHA), American Water WorksAssociation (AWWA), and Water Environment Federation (WEF).(1995). Standard methods for the examination of water and wastewater.19th Ed., Washington, DC.
Ashford, S. A., Weaver, T. J., and Rollins, K. M. (2002). “Pore pressureresponse of liquefied sand in full-scale lateral pile load tests.” Trans-portation Research Record 1808, Transportation Research Board,Washington, DC, , 21–29.
ASTM. (2005). “Standard test method for direct shear test of soils underconsolidated drained conditions.” D3080, West Conshohocken, PA.
Bang, S. S., Galinat, J. K., and Ramakrishnan, V. (2001). “Calcite precipi-tation induced by polyurethane-immobilized Bacillus pasteurii.”Enzyme and microbial technology, 28(4–5), 404–409.
Bardet, J. P. (1997). Experimental soil mechanics, Prentice-Hall, UpperSaddle River, NJ.
Beveridge, T. J., Makin, S. A., Kadurugamuwa, J. L., and Li, Z. S. (1997).“Interactions between biofilms and the environment.” FEMS Microbiol.Rev., 20(3–4), 291–303.
Braissant, O., Decho, A. W., Dupraz, C., Glunk, C., Przekop, K. M., andVisscher, P. T. (2007). “Exopolymeric substances of sulfate-reducingbacteria: Interactions with calcium at alkaline pH and implication forformation of carbonate minerals.” Geobiology, 5(4), 401–411.
Buczynski, C., and Chafetz, H. S. (1991). “Habit of bacterially inducedprecipitates of calcium-carbonate and the influence of medium viscosityon mineralogy.” J. Sediment. Res., 61(2), 226–233.
Castanier, S., Le Metayer-Levrel, G., and Perthulsot, J. P. (1999).“Ca-carbonates precipitation and limestone genesis: The microbiogeol-ogist point of view.” Sediment. Geol., 126(1–4), 9–23.
Chang, T. S., and Woods, R. D. (1992). “Effect of particle contact bond onshear modulus.” J. Geotech. Eng., 118(8), 1216–1233.
Chou, C.-W. (2008). “Biomodification of geotechnical properties of sand.”M.S. thesis, Univ. of Maryland, College Park, MD.
Chou, C.-W., Seagren, E. A., Aydilek, A. H., and Maugel, T. K. (2008).“Bacterially-induced calcite preciptation via ureolysis.” ASM Microbe-Library, Visual Resource Collection, American Society for Microbiol-ogy, Washington, DC ⟨http://www.microbelibrary.org/⟩.
1188 / JOURNAL OF GEOTECHNICAL AND GEOENVIRONMENTAL ENGINEERING © ASCE / DECEMBER 2011
J. Geotech. Geoenviron. Eng. 2011.137:1179-1189.
Dow
nloa
ded
from
asc
elib
rary
.org
by
Nat
iona
l Ins
titut
e of
Tec
hnol
ogy
- W
aran
gal o
n 11
/05/
13. C
opyr
ight
ASC
E. F
or p
erso
nal u
se o
nly;
all
righ
ts r
eser
ved.
Clough, G. W., Sitar, N., Bachus, R. C., and Rad, N. S. (1981).“Cemented sands under static loading.” J. Geotech. Engrg. Div., 107(6),799–817.
Cooke, A. J., and Rowe, R. K. (1999). “Extension of porosity and surfacearea models for uniform porous media.” J. Environ. Eng., 125(2),126–136.
Day, J. L., Ramakrishnan, V., and Bang, S. S. (2003). “Microbiologicallyinduced sealant for concrete crack remediation.” Proc., 16th Engineer-ing Mechanics Conf., ASCE, Reston, VA.
Defarge, C., Trichet, J., Jaunet, A. M., Robert, M., Tribble, J., and Sansone,F. J. (1996). “Texture of microbial sediments revealed by cryo-scanningelectron microscopy.” J. Sediment. Res., 66(5), 935–947.
DeJong, J. T., Fritzges, M. B., and Nusslein, K. (2006). “Microbiallyinduced cementation to control sand response to undrained shear.”J. Geotech. Geoenviron. Eng., 132(11), 1381–1392.
DeJong, J. T., Mortensen, B. M., Martinez, B. C., and Nelson, D. C. (2010).“Biomediated soil improvement.” Ecol. Eng., 36(2), 197–210.
Ehrlich, H. L. (2002). Geomicrobiology, Marcel Dekker, New York.Ercole, C., Cacchio, P., Botta, A. L., Centi, V., and Lepidi, A. (2007).
“Bacterially induced mineralization of calcium carbonate: The role ofexopolysaccharides and capsular polysaccharides.” Microsc. Micro-anal., 13(1), 42–50.
FEMA. (2005). Coastal construction manual: Principles and practices ofplanning, siting, designing, constructing, and maintaining residentialbuildings in coastal areas, Federal Emergency Management Agency,Washington, DC.
Ferris, F. G., Phoenix, V., Fujita, Y., and Smith, R. W. (2004). “Kineticsof calcite precipitation induced by ureolytic bacteria at 10 to20 degrees C in artificial groundwater.” Geochim. Cosmochim. Acta,68(8), 1701–1710.
Fujita, Y., Ferris, E. G., Lawson, R. D., Colwell, F. S., and Smith, R. W.(2000). “Calcium carbonate precipitation by ureolytic subsurfacebacteria.” Geomicrobiol. J., 17(4), 305–318.
Gollapudi, U., Knutson, C., Bang, S. S., and Islam, M. (1995). “Anew method for controlling leaching through permeable channels.”Chemosphere, 30(4), 695–705.
Greenfield, L. J. (1963). “Metabolism and concentration of calciumand magnesium and precipitation of calcium carbonate by a marinebacterium.” Ann. N.Y. Acad. Sci., 109(1), 23–45.
Jung, D., Biggs, H., Erikson, J., and Ledyard, P. U. (1975). “New colori-metric reaction for endpoint, continuous-flow, and kinetic measurementof urea.” Clin. Chem., 21(8), 1136–1140.
Karatas, I., Kavazanjian, E. Jr., and Rittman, B. E. (2008). “Microbiallyinduced precipitation of calcite using Pseudomonas denitrificans.”1st Int. Conf. on BioGeo Civil Engineering, Deltares and Delft Univ.of Technology, Delft, The Netherlands.
Khan, Z., Majid, A., Cascante, G., Hutchinson, D. J., and Pezeshkpour, P.(2006). “Characterization of a cemented sand with the pulse-velocitymethod.” Can. Geotech. J., 43(3), 294–309.
Krumbein, W. C. (1941). “Measurement and geological significanceof shape and roundness of sedimentary particles.” J. Sediment. Res.,11(2), 64–72.
Lee, K. C., and Rittmann, B. E. (2003). “Effects of pH and precipitation onautohydrogenotrophic denitrification using the hollow-fiber membrane-biofilm reactor.” Water Res., 37(7), 1551–1556.
Mitchell, A. C., and Ferris, F. G. (2006). “The influence of Bacilluspasteurii on the nucleation and growth of calcium carbonate.” Geomi-crobiol. J., 23(3–4), 213–226.
Monger, H. C., Daugherty, L. A., Lindemann, W. C., and Liddell, C. M.(1991). “Microbial precipitation of pedogenic calcite.”Geology, 19(10),997–1000.
National Research Council (NRC). (2006). Geological and geotechnicalengineering in the new millennium, National Academies Press,
Washington, DC.Ramachandran, S. K., Ramakrishnan, V., and Bang, S. S. (2001).
“Remediation of concrete using microorganisms.” ACI Mater. J., 98(1),3–9.
Rittmann, B. E., Banaszak, J. E., Cooke, A., and Rowe, R. K. (2003).“Biogeochemical evaluation of mechanisms controlling CaCO3ðsÞprecipitation in landfill leachate-collection systems.” J. Environ. Eng.,129(8), 723–730.
Roberts, W. L., Campbell, T. J., and Rapp, G. R. Jr. (1990). Encyclopedia ofminerals, 2nd Ed., Van Nostrand Reinhold, New York.
Rodriguez-Navarro, C., Rodriguez-Gallego, M., Ben Chekroun, K., andGonzalez-Munoz, T. (2003). “Conservation of ornamental stone byMyxococcus xanthus-induced carbonate biomineralization.” Appl.Environ. Microbiol., 69(4), 2182–2193.
Ross, N., Villemur, R., Deschênes, L., and Samson, R. (2001). “Cloggingof limestone fracture by stimulating groundwater microbe.”Water Res.,35(8), 2029–2037.
Rowe, R. K., VanGulck, J. F., and Millward, S. C. (2002). “Biologicallyinduced clogging of a granular medium permeated with syntheticleachate.” J. Environ. Eng. Sci., 1(2), 135–156.
Russell, R. D., and Taylor, R. E. (1937). “Roundness and shape ofMississippi River sands.” J. Geol., 45(3), 225–267.
Sawyer, C., McCarty, P. L., and Parkin, G. (2003). Chemistry for environ-mental engineering and science, McGraw-Hill, Boston.
Schultze-Lam, S., Fortin, D., Davis, B. S., and Beveridge, T. J.(1996). “Mineralization of bacterial surfaces.” Chem. Geol., 132(1–4),171–181.
Seagren, E. A., and Aydilek, A. H. (2010). “Biomediated geomechanicalprocesses.” Chapter 24, Environmental microbiology, 2nd Ed.,R. Mitchell, and J.-D. Gu, eds., Wiley, Hoboken, NJ, 319–348.
Seagren, E. A., Rittmann, B. E., and Valocchi, A. J. (2002). “Bioenhance-ment of NAPL pool dissolution: Experimental evaluation.” J. Contam.Hydrol., 55(1–2), 57–85.
Smith, W. O., Foote, P. D., and Busang, P. F. (1929). “Packing ofhomogeneous spheres.” Phys. Rev., 34(9), 1271–1274.
Stocks-Fischer, S., Galinat, J. K., and Bang, S. S. (1999). “Microbiologicalprecipitation of CaCO3.” Soil Biol. Biochem., 31(11), 1563–1571.
Thompson, J. B., and Ferris, F. G. (1990). “Cyanobacterial precipitationof gypsum, calcite, and magnesite from natural alkaline lake water.”Geology, 18(10), 995–998.
Urzi, C., Garcia-Valles, M., Vendrell, M., and Pernice, A. (1999). “Biomi-neralization processes on rock and monument surfaces observed in fieldand in laboratory conditions.” Geomicrobiol. J., 16(1), 39–54.
Van Lith, Y., Warthmann, R., Vasconcelos, C., and McKenzie, J. A. (2003).“Microbial fossilization in carbonate sediments: A result of the bacterialsurface involvement in dolomite precipitation.” Sedimentology, 50(2),237–245.
VanGulck, J. F., and Rowe, R. K. (2004a). “Evolution of clog formationwith time in columns permeated with synthetic landfill leachate.”J. Contam. Hydrol., 75(1–2), 115–139.
VanGulck, J. F., and Rowe, R. K. (2004b). “Influence of landfill leachatesuspended solids on clog (biorock) formation.” Waste Manage., 24(7),723–738.
VanGulck, J. F., and Rowe, R. K. (2008). “Parameter estimation formodelling clogging of granular medium permeated with leachate.”Can. Geotech. J., 45(6), 812–823.
VanGulck, J. F., Rowe, R. K., Rittmann, B. E., and Cooke, A. J. (2003).“Predicting biogeochemical calcium precipitation in landfill leachatecollection systems.” Biodegradation, 14(5), 331–346.
Whiffin, V. S., van Paassen, L. A., and Harkes, M. P. (2007). “Microbialcarbonate precipitation as a soil improvement technique.” Geomicro-biol. J., 24(5), 417–423.
JOURNAL OF GEOTECHNICAL AND GEOENVIRONMENTAL ENGINEERING © ASCE / DECEMBER 2011 / 1189
J. Geotech. Geoenviron. Eng. 2011.137:1179-1189.
Dow
nloa
ded
from
asc
elib
rary
.org
by
Nat
iona
l Ins
titut
e of
Tec
hnol
ogy
- W
aran
gal o
n 11
/05/
13. C
opyr
ight
ASC
E. F
or p
erso
nal u
se o
nly;
all
righ
ts r
eser
ved.