SEX-BASED DIFFERENCES IN THE ADAPTIVE VALUE OF SOCIAL BEHAVIOR CONTRASTED AGAINST MORPHOLOGY AND...
37
-
Upload
usherbrooke -
Category
Documents
-
view
2 -
download
0
Transcript of SEX-BASED DIFFERENCES IN THE ADAPTIVE VALUE OF SOCIAL BEHAVIOR CONTRASTED AGAINST MORPHOLOGY AND...


1
SEX-BASED DIFFERENCES IN THE ADAPTIVE VALUE OF SOCIAL BEHAVIOR 1
CONTRASTED AGAINST MORPHOLOGY AND ENVIRONMENT 2
E. Vander Wal1,2*, M. Festa-Bianchet1, D. Réale3, D.W. Coltman4 and F. Pelletier1,5 3
1 Département de biologie, Université de Sherbrooke, 2500 boul. de l’Université, Sherbrooke, 4
Québec, Canada, J1K 2R1 5
2 Current address: Department of Biology, Memorial University of Newfoundland, St. John’s, 6
Newfoundland and Labrador, Canada, A1B 3X9 7
3 Département des Sciences Biologiques, Université du Québec à Montréal, 8888-Succursale 8
Centre-Ville, Montréal, Québec, Canada, H3C 3P8 9
4 Department of Biological Sciences, University of Alberta, CW 405, Biological Sciences 10
Bldg., Edmonton, Alberta, Canada, T6G 2E9 11
5 Canada Research Chair in Evolutionary Demography and Conservation 12
13
Running Header: Importance of social behavior on fitness 14
Submission type: Article 15
Submission elements: In print includes the Title (14 words); Abstract (187 words); Body (~5100 16
words); Acknowledgments (90 words); Literature Cited (~1700 words); Figure Captions (350 17
words); Tables 1–4 and Figures 1–4. Supplementary online material includes supplementary 18
methods, and results including Tables S1–S2 and Figure S1. 19
*Corresponding author: [email protected]

2
Abstract: The adaptive nature of sociality has long been a central question in ecology and 21
evolution. The relative importance of social behavior for fitness compared to morphology and 22
environment, however, remains largely unknown. We assess the importance of sociality for 23
fitness (lamb production and survival) in a population of marked bighorn sheep (Ovis 24
canadensis) over 16 years (n=1022 sheep-years). We constructed social networks from 25
observations (n=38350) of group membership (n=3150 groups). We then tested whether 26
consistent individual differences in social behavior (centrality) exist and evaluated their relative 27
importance compared to factors known to affect fitness: mass, age, parental effects, and 28
population density. Sheep exhibited consistent individual differences in social centrality. 29
Controlling for maternal carry-over effects and age, the positive effect of centrality in a social 30
network on adult female lamb production and survival was equal or greater than the effect of 31
body mass or population density. Social centrality had less effect on male survival and no effect 32
on adult male lamb production or lamb survival. Through its effect on lamb production and 33
survival, sociality in fission-fusion animal societies may ultimately influence population 34
dynamics equally or more than morphological or environmental effects. 35
Key words: behavioral plasticity, bighorn sheep, lamb production, population dynamics, 36
sociality, survival 37

3
INTRODUCTION 38
Theory predicts that social behaviors, including associations, will evolve if they result in a net 39
lifetime benefit through increased fecundity or survival (Silk 2007a, Ebensperger et al. 2012). 40
Many studies, however, failed to detect fitness benefits of social behaviors. For example, 58% of 41
studies on group living in mammals found no effect (Ebensperger et al. 2012), suggesting that 42
sociality generally has a ‘weak’ effect on fitness (Ebensperger et al. 2012). Furthermore, very 43
few studies compared the fitness consequences of sociality to those of other critical variables, 44
such as population density, body mass, or age. Thus, it is important to both determine if social 45
behavior in the wild is adaptive and rank its importance for explaining differences in fitness. 46
Studies of social behavior directly affecting individual fitness are rare (reviews in Silk 2007a, 47
Ebensperger et al. 2012); and most involved one or two years of monitoring a segment of the 48
population. However, the contribution of social behaviors to fitness has been well studied in 49
cooperative breeders [e.g., Canis spp. (Stahler et al. 2012), Suricata suricatta (Clutton-Brock et 50
al. 2001), Marmota spp. (Armitage and Schwartz 2000)]. In cooperative breeders, groups are 51
often kin-based and fitness benefits are attributed to inclusive fitness (Jennions and Macdonald 52
1994). The benefits of social behavior are less clear for social mammals that are neither plural 53
breeders with communal care nor cooperative breeders. A recent meta-analysis (Ebensperger et 54
al. 2012) found no effect of group living on fitness for these types of social organization. A few 55
notable examples, however, do exist. For instance, social behaviors, such as stable social bonds, 56
improve infant survival (Silk et al. 2003) and adult longevity (Silk et al. 2010) in baboons [Papio 57
cynocephalus, see Silk 2007b for review) and lamb production among unrelated feral mares 58
[Equus callabus (Cameron et al. 2009)]. 59

4
The latter examples involve animal societies with relatively stable social groups. Many social 60
mammals, however, exhibit fission-fusion (Haydon et al. 2008, Aureli et al. 2008), where social 61
bonds often appear ephemeral and are challenging to quantify. Nevertheless, these possibly 62
subtle and dynamic social behaviors can create intricate networks of relationships (Croft et al. 63
2011), similar to a physical landscape. These networks contain complex multi-scale social 64
structure (Couzin 2006). Few studies have tested if individual- or higher-order social network 65
structures are adaptive (but see Lea et al. 2010). None has tested fission-fusion societies, despite 66
their abundance in nature. If social behaviors in fission-fusion societies affect fitness, a signal 67
should be detected within the architecture of the social network. This signal, however, may differ 68
by sex and fitness component. In sexually dimorphic species that exhibit sexual segregation, 69
sociality may have differential costs and benefits. 70
We investigate how variability in social behavior at multiple scales can affect the 71
components of fitness – lamb production and survival – using a 16-year (1996-2011) bighorn 72
sheep (Ovis canadensis) dataset. Specifically, we compared the relative importance of social 73
behavior against morphology and density, two factors known to strongly affect lamb production 74
and survival. The data include complete life-histories for > 99% of the population (Gaillard et al. 75
2000) with observations of individual group memberships. From these data, we construct yearly 76
social networks (Croft et al. 2011) and extract multi-scale indicators of social behavior. We first 77
tested whether individual-based network measures of centrality are repeatable within each 78
individual and whether differences exist among individuals. This is critical for understanding the 79
potential for selection on behavior. For females, we further test whether changes in social 80
centrality are consistent across reproductive states, because lactating females may form nursery 81
groups, increasing centrality. Following this, we treat our two central questions. (Q1) Can 82

5
sociality affect sex-specific lamb production and survival? Most importantly (Q2): if sociality 83
affects fitness, where does its importance rank compared to morphological and environmental 84
factors? 85
METHODS 86
Bighorn sheep and study area 87
Bighorn sheep are social ungulates. Female primiparity is typically at three years (Martin and 88
Festa-Bianchet 2011a). Breeding females produce one offspring/year. Age and body mass are 89
known to increase lamb production, lamb survival and adult survival (Festa-Bianchet et al. 90
1998). Bighorn sheep form fission-fusion groups and there is no evidence groups are kin-based 91
(Festa-Bianchet 1991). Groups can sort by body mass, and young males leave female groups 92
between the ages of two and three to join bachelor groups (Ruckstuhl and Festa-Bianchet 2001). 93
Adults typically segregate sexually outside the rut (Ruckstuhl and Neuhaus 2002). Dominance is 94
generally correlated with age and body mass (Pelletier and Festa-Bianchet 2006, Favre et al. 95
2008). Dominant males exhibit female defense polygyny, subordinate males may adopt a 96
coursing strategy (Hogg 1984). Paternity is skewed toward a few dominant individuals (Coltman 97
et al. 2002). 98
The bighorn sheep of Ram Mountain Alberta, Canada (52ºN, 115ºW) have been 99
continuously monitored since 1972 (Jorgenson et al. 1993). Here we use data collected between 100
1996 and 2011 (n = 38350 observations, 3150 groups, 1022 sheep-years), when group 101
composition was available. During this period the population fluctuated from 188 – 42 102
individuals. Between May and September, animals were baited with salt into a corral trap where 103
they were weighed (kg) and fitted with colored collars or plastic ear tags (Jorgenson et al. 1993). 104

6
Maternity was assigned by visual observations of suckling. Lamb production was scored by 105
observing a mother with a lamb following parturition (Festa-Bianchet 1988). Survival was 106
calculated as survival of marked individuals at time t and resighted in the subsequent capture 107
season (t+1). Paternity was assigned using data from genotyped microsatellite loci (see Coltman 108
et al. 2002 for details). In 1997-2001 there was substantial predation on during the capture 109
season (Réale and Festa-Bianchet 2003); the role of predation outside of the capture season is 110
unknown. 111
Group observations 112
Between mid-May and September 1996-2011, field crews sought out groups of bighorn sheep. 113
Ram Mountain is a small area (≈ 28 km2) where sheep are mostly found in rocky slopes, cliffs 114
and alpine meadows. There is no evidence that the population is structured in space. Mean group 115
size was relatively constant throughout the sampling season [ (± SD): females: 21 (6); males : 116
19 (7)]. Groups were frequently located multiple times per week, often observing multiple 117
groups per day. The identity of each individual in each group was recorded. Unlike many other 118
ungulates, bighorn sheep form discrete and easily quantifiable groups. Groups involved all 119
individuals that could conceivably associate in a pairwise fashion. Typically, individuals at the 120
peripheries of groups were no more than 100 m apart. In the infrequent circumstances when 121
designating a group was unclear, crews continued to observe groups, for at least 1 hour, to 122
ascertain if fusion occurred. Given the restricted range of the sheep population, each animal in 123
was regularly re-sighted, [ (± SD): females 37 (20); males 22 (18) per year]. It is very 124
uncommon for adults in this population to die in the summer, thus individuals were relocated 125
throughout the sampling season. 126

7
Network analyses 127
Networks consisted of all pairwise combinations of animals in a group. For each dyad 128
throughout each field season we calculated a half-weight index [HWI, (Cairns and Schwager 129
1987)], accounting for unequal probability of detection and uneven sampling. We constructed 130
networks weighted by the HWI using the iGraph package (Csardi and Nepusz 2006) in R (R 131
Development Core Team 2011) for each year. Bighorn sheep generally segregate into size- (and 132
therefore sex-) specific groups. Therefore, one networks included all females, yearling and two 133
year old males. At two years of age males may be large enough to transition into male groups 134
and were therefore also included in the second network, which included all males ≥ 2 years old 135
(Ruckstuhl and Neuhaus 2005). Since lambs depend on their mothers until weaning, networks 136
only included individuals that were ≥ 1 year old. 137
We calculated two principle measures on unfiltered networks (Lusseau et al. 2008): 138
eigenvector centrality (individual sociality) and graph density. We chose eigenvector centrality 139
(EC) as our primary measure of centrality because it efficiently approximates centrality in a 140
network by accounting for direct and indirect associations (Costenbader and Valente 2003, 141
Maiya and Berger-Wolf 2010), and has been shown to be effective in other studies (e.g., Stanton 142
and Mann 2012, Aplin et al. 2012). We chose a single metric over principal components of 143
multiple correlated network metrics (Wey and Blumstein 2012) to simplify our hypothesis set. 144
Eigenvector centrality of each individual is proportional to the sum of the centralities of 145
individuals to which it is connected (i.e., observed in the same group). In general, individuals 146
with high eigenvector centralities are connected to many other individuals that are, in turn, 147
connected to many individuals (Csardi and Nepusz 2006). Further details on eigenvector 148
centrality are provided in the Appendix A. 149

8
For comparison, in addition to EC we replicated all analyses using a simpler metric: graph 150
strength. Graph strength is the sum of all weighted edges of a node (Csardi and Nepusz 2006) 151
and does not account for indirect ties among individuals. Graph strength was correlated to 152
eigenvector centrality (R2 = 0.97 and 0.80, females and males respectively) and all model results 153
remained consistent between the two indicators of centrality. All results of replicated analyses 154
for graph strength are in Appendix B Tables S1 and S2. 155
We consider EC an individual- level network metric because it quantifies an individual’s 156
centrality and varies among nodes within the network. Graph density (GD) is the proportion of 157
edges present in a population in relation to the number of possible edges (Csardi and Nepusz 158
2006). Edges are absent in this population-level network metric only when two individuals have 159
never been observed in the same group. As such, GD is invariant across nodes within a network 160
and is therefore a population-level property. 161
Repeatability and behavioral reaction norms 162
To determine whether consistent individual differences in social centrality were present across 163
age classes over time, we calculated repeatability using the interclass correlation coefficient 164
(ICC). The ICC partitions the proportion of among-individual to within-individual variation on a 165
scale of 0 – 1. Highly repeatable behaviors have values near 1; behaviors that are not repeatable 166
are not significantly different from 0. For EC we calculated repeatability using the R package 167
MCMCglmm to ensure reliable estimates of 95% credible intervals (Hadfield 2010). 168
We calculated behavioral reactions norms (Dingemanse et al. 2010) for females, to 169
ascertain centrality was exclusively dependent on reproductive status (with and without lamb) or 170
whether they were selection-based. To calculate reaction norms and test for an interaction 171

9
between individuals and state we used mixed general linear models for females ≥ 3 years old 172
following Martin et al. (Martin et al. 2011). Furthermore, we calculated Kendall’s tau to test the 173
correlation between an individual’s EC in years with and years without offspring-at-heel. 174
General linear models 175
All variables were converted to z-scores and screened for excessive correlations (r > 0.7) and 176
collinearity (VIF > 10, Dormann et al. 2013). All models controlled for two random effects: 177
sheep identity (ID) to account for dyadic autocorrelation of network measures, and year. We 178
used generalized linear mixed models (GLMMs) for binomial response variables for lamb 179
production and survival using the lme4 package (Bates and Maechler 2010) in R. Males were 180
divided into two categories: those that sired at least one offspring and those that did not. As all 181
individuals were marked at birth their age was known. Individual sheep were repeatedly captured 182
each year and weighed. Linear regressions were used to adjust individual mass to September 15 183
each year (Martin and Festa-Bianchet 2011b). Population density was calculated by a census of 184
all individuals within the sample season. The population density in the year of birth of each ewe 185
was used as a proxy for maternal effects in all models except male lamb production. 186
Hypotheses, model selection, and variable rank 187
We employ a multiple competing hypotheses (Johnson and Omland 2004) approach within 188
an information theoretic framework (Burnham and Anderson 2002) to test six hypotheses. The 189
six hypotheses fall into three families: ‘social’, ‘morphological’, and ‘environmental’ (Table 1). 190
We hypothesize (H1a) that being more central in a network will positively affect fitness; that 191
fitness will increase with increased associations among members of a population (H1b) and that 192
both individual (EC)- and population (GD)-level measures of sociality and their interaction will 193

10
positively affect fitness (H1c). These hypotheses compete against alternate models which include 194
measures of mass and age (‘morphological’, H2 and H3); influence of maternal carry-over effects 195
(‘morphological’, H3 and ‘morphological-environmental’, H5); and population density 196
(‘environmental’, H4). Mass, age, and density all affect fitness in general and specifically in this 197
population (Festa-Bianchet et al. 1998). Finally, we test a model including all covariates (H6). 198
We used information criteria to first distinguish between fit and parsimony of candidate 199
models (H1-H6) (Burnham 2002). For GLMMs we used Akaike’s Information Criteria (AIC). We 200
adopted a liberal approach and considered any models with ∆AIC < 3 to be indistinguishable. 201
Furthermore, for GLMMs we ranked variable importance using an all-possible-models approach 202
(Murtaugh 2009). For each GLMM we constructed a model with all variables in the most 203
parsimonious candidate models (H1-H6). We ran models on all-possible combinations of 204
covariates, i.e., for n covariates, 2n possible models were compared. This typically produces a 205
new subset of most parsimonious models. Our approach here was more conservative and we only 206
selected models with ∆AIC < 2. Each model was assigned an Akaike weight (AICw), the 207
probability that each model is the most parsimonious. Subsequently the most parsimonious 208
models were averaged to calculate averaged β coefficients and unconditional standard errors. 209
From here we ranked variable importance. For each independent variable we ∑ for the 210
candidate models in which it occurred with ∆AIC < 2. Thus variables with ∑ = 1.0 211
occurred in all parsimonious candidates; ∑ = 0.5 were those variables that occurred only in 212
a subset of parsimonious models whose AICw sums to 0.5. We used R package MuMIn to run 213
model averages and calculate variable importance (Barton 2010). 214

11
RESULTS 215
The HWI varied among dyads [ (1SD) females = 0.37 (0.18), males = 0.36 (0.22); Figure 1]. 216
Individual differences in eigenvector centrality were consistent and repeatable [ (95%CI) 217
females r = 0.40 (0.32 – 0.50); males r = 0.26 (0.13 – 0.42)]. Although at the population-level 218
there was no difference in mean individual centrality between females with and without 219
offspring (Figure 2a) there was individual plasticity including a significant individual by 220
reproductive state effect (p < 0.001; Figure 2b; Kendall’s tau = 0.31, p < 0.001). 221
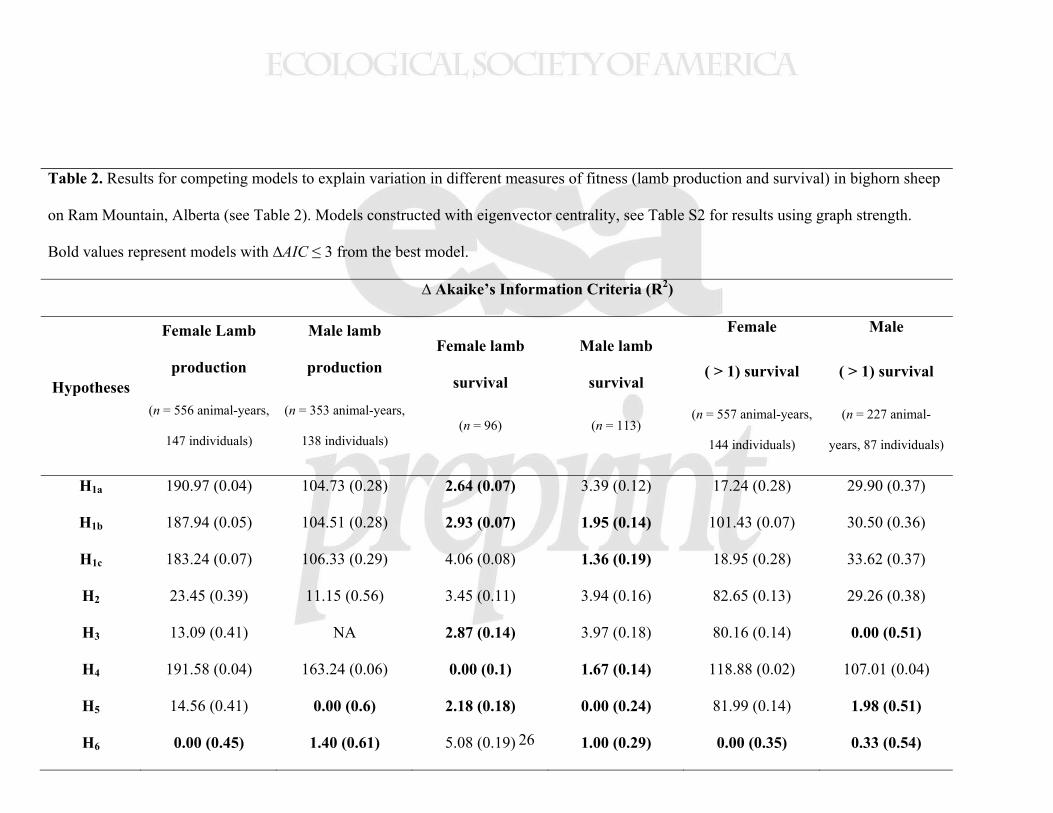
All models of fitness supported the inclusion of individual-level sociality measured by EC; 222
predominantly this was based on its inclusion in the global model (∆AIC < 3, Tables 2; see 223
Appendix B for replicated results for graph strength). For females, global models explained 19% 224
– 45% of the variance (Tables 2 and S1 Appendix B). Being more central in the female networks 225
did not affect lamb survival (p > 0.05, AICw = 0.13). Rather, mass and population density were 226
more important (Figures 3 and 4; p < 0.01, AICw = 1; Tables 3 and S2 Appendix B). However, 227
centrality had a significant (p < 0.05) and important (AICw = 1) positive effecting on adult lamb 228
production (β = 0.32) and adult survival (β = 1.03; Figures 3 and 4; Table 3 and S2 Appendix B). 229
Centrality was as important as mass and population density (p < 0.05, AICw = 1; Table 3 and S2 230
Appendix B). 231
For males, sociality was also retained in global models (Table 2 and S1 Appendix B), that 232
explained 29% – 62% of the variance (Tables 2 and S1 Appendix B). Increased centrality (β = 233
0.12) was equivocal (p > 0.05) and marginally unimportant for male lamb production (AICw = 234
0.44; Figures 3 and 5; Table 4). In contrast, mass (β = 2.60) was significant and important in all 235
male models of lamb production (p < 0.05, AICw = 1; Figure 4 and Table 4). Centrality had no 236

12
effect on the survival of male lambs (p > 0.05, AICw < 0.53; Table 4 and S2 Appendix B); rather 237
population density had the largest effect (β < - 0.70, p < 0.05, AICw = 0.85; Table 4 and S2 238
Appendix B). Conversely, population density did not affect adult male survival (AICw = 0, 239
Tables 4 and S2 Appendix B). Here centrality had an equivocal but positive effect (β > 0.22; 240
Figure 2), more important than mass (AICw = 0.81 and 0.38 respectively) but less important that 241
maternal effects (AICw = 1, Table 4 and S2 Appendix B). 242
The influence of social behaviors at the population-level was largely equivocal (p < 0.05) 243
and unimportant (AICw < 1; Figure 4). The notable exception was female lamb production (β > 244
0.40, p < 0.05, AICw = 1; Figure 4 and Table 3). Years when networks had high graph density 245
(i.e., were more connected, typically at lower densities, Figure S1 Appendix C) had individual-246
level effects on female lamb production. Moreover, a significant and important negative 247
interaction existed between individual centrality and graph strength (β = -.37, p < 0.05, AICw = 1; 248
Table 3). 249
DISCUSSION 250
Using 16 years of detailed behavioral data on an entire population of marked wild bighorn sheep, 251
our study is one of the first to assess the importance of sociality in a fission-fusion society. We 252
illustrated that social centrality is a consistent repeatable behavior. Individuals, however, exhibit 253
some plasticity in social centrality, whose expression can be constrained by reproductive state 254
(Dingemanse et al. 2010). Centrality is therefore a behavior upon which selection can act through 255
differential effects on fitness (Réale et al. 2010). Indeed, measures of fitness co-varied with 256
sociality. Compared to morphology and environment, factors known to affect fitness, centrality 257
unequivocally ranked equally or more important in two of six scenarios: female adult survival 258

13
and female lamb production. The influence of centrality on female lamb production, however, 259
was modified by our population-level index of social connectivity (graph density). Therefore, we 260
argue that female bighorn sheep adopt a social strategy that increases fitness. Social centrality 261
had ranked more important for survival than morphology (H2 and H3) or environment (H4) for 262
both sexes. Conversely, lamb survival was unaffected by maternal centrality. In lambs, 263
environment (density) was the strongest driver of mortality. 264
Unlike plural breeders with communal care or cooperative breeders (Lea et al. 2010, 265
Stahler et al. 2012), bighorn sheep do not form discrete kin-structured groups (Festa-Bianchet 266
1991). Thus, kin selection is unlikely to explain the evolution of sociality in this species. Yet, 267
social behaviors appear to accord direct fitness benefits primarily through adult female survival 268
and lamb production. Sociality has been observed to affect lamb production in species with 269
stable social structures [e.g., feral horses (Cameron et al. 2009)]. Similarly, social bonds may 270
affect offspring survival [e.g., baboons, (Silk et al. 2003), feral horses (Cameron et al. 2009)]. 271
Here, we also observe effects on lamb production, with body mass and maternal effects being 272
equally important. No effect, however, on lamb survival, where population density was more 273
important. Cameron et al. (2009) postulate that fitness benefits in feral horses were accrued 274
through reduced male harassment. This is an unlikely explanation for bighorn sheep, where 275
males do not harass females outside the breeding season (Ruckstuhl and Neuhaus 2002). 276
For both sexes, centrality improved survival. Previous research linked centrality to adult 277
longevity [e.g., baboons, (Silk 2007a, Silk et al. 2010); rock hyrax, Procavia capensis, (Barocas 278
et al. 2011)] and survival or mortality [e.g., humans, Homo sapiens, (Holt-Lunstad et al. 2010)]. 279
In some instances early-life pairwise bonds form network connections that can predict future 280
survival [e.g., manakins, Chiroxiphia linearis,(McDonald 2007); bottlenose dolphins, Tursiops 281

14
sp. (Stanton and Mann 2012)]. In bighorn sheep, however, an individual’s current centrality 282
predicts survival in females and to a lesser extent in males. These results were consistent for 283
centrality as a function of indirect associations (eigenvector centrality) and direct associations 284
(graph strength Tables S1 and S2 Appendix B). 285
Using a network approach we were able to investigate network metrics that represent 286
different scales of social behavior: variable individual centrality, and population-scale graph 287
density. For example, for bighorn ewes we present empirical evidence that population-scale 288
sociality (the cumulative sum of all individual associations) has positive effects on lamb 289
production. Moreover, this effect is most pronounced when social connectivity in the population 290
is low. Variability in graph density was partially explained by population density (Figure S1 291
Appendix C); however, no significant interactive effects between population density and 292
centrality were found (data not shown). Our results from graph density lend some empirical 293
support to the assertion that fitness effects can accrue at the population-level and filter down to 294
the individual (Dunbar and Shultz 2007). Ultimately this behavior is driven by associating with a 295
group; here how other group members associate within population appears to also affect 296
individual fitness. One possibility for this multi-level effect is the role of familiarity, i.e., whether 297
individuals are known to one another. Indeed, when the population was well connected the 298
importance of centrality was lessened. For example familiarity with conspecifics may decrease 299
the time spent being vigilant or reinforcing hierarchies. According to limited attention theory 300
(Dukas 2002) and the time-constraint hypothesis (Dunbar et al. 2009) individuals can only attend 301
to a finite number of relationships at one time (Griffiths et al. 2004). Increased levels of 302
familiarity that accrue at the population-level (i.e., higher graph density) in animal societies may 303
reduce the need for individual-level conspecific vigilance. The result is increased ‘free’ time that 304

15
can be allocated to alternate behavior, some of which may have positive effects on one’s 305
neighbors, e.g., anti-predator vigilance (Roberts 1996). Alternately, increased familiarity may 306
also lead to increased foraging efficiency (Strodl and Schausberger 2012a), social information on 307
feeding sites (Aplin et al. 2012), and ultimately increase fitness (König 1994, Strodl and 308
Schausberger 2012b). 309
Although the mechanism for why social centrality and connectedness accords fitness 310
benefits in bighorn sheep remain unknown, our results support the general understanding of 311
animal societies: individuals that are well integrated in societies [e.g., baboons (Silk et al. 2003, 312
Silk 2007a)], familiar with their neighbors [e.g., great tits, Parus major (Grabowska-Zhang et al. 313
2011)], and nested centrally within the densest substructures of the population reap the highest 314
fitness benefits. Those at the periphery may exhibit marginal gains from social behaviors 315
compared to costs. For example, costs of predation (Beauchamp 2010) may be greater than costs 316
related to acquiring pathogens, which may increase with centrality (Cross et al. 2004). Similarly, 317
costs of competition for resources may be offset by highly social subgroups finding and 318
preferentially accessing prime forage (Rieucau and Giraldeau 2011, Aplin et al. 2012). 319
Here we highlight the importance, repeatability and plasticity of social centrality in fission-320
fusion societies in the wild. However, how one becomes central in a population remains to be 321
tested as a function of gregariousness or variation in pairwise associations. Nevertheless, 322
variation in centrality has implications for fitness, predominantly affecting adult female lamb 323
production and survival. That fitness varies with social behaviors which are consistently 324
expressed throughout life results in the prerequisite variation upon which natural selection acts. 325
As individual sociality has been shown to be heritable in some populations (Frere et al. 2010, 326

16
Lea et al. 2010), social behavioral differences may play a key role in the fundamental processes 327
of birth and death, and ultimately affect population and evolutionary dynamics. 328
ACKNOWLEDGMENTS 329
The Ram Mountain project has been supported for 40 years by the Alberta Department of Fish 330
and Wildlife and for 23 years by the Natural Science and Engineering Research Council of 331
Canada (Discovery Grants to MFB, DR, DWC, and FP; Post-Doctoral Fellowship to EVW). 332
Further financial support was provided by the Alberta Conservation Association and the Canada 333
Research Chair in Evolutionary Demography and Conservation to FP. Research has been 334
strongly supported by Jon Jorgenson. We thank all the students and assistants who trapped, 335
measured, and observed sheep throughout the years. The manuscript was markedly improved 336
thanks to comments from two anonymous reviewers and the associate editor.337

17
LITERATURE CITED
Aplin, L. M., D. R. Farine, J. Morand-Ferron, and B. C. Sheldon. 2012. Social networks predict
patch discovery in a wild population of songbirds. Proceedings of the Royal Society B:
Biological Sciences 279:4199–4205.
Armitage, K. B., and O. A. Schwartz. 2000. Social enhancement of fitness in yellow-bellied
marmots. Proceedings of the National Academy of Sciences 97:12149–12152.
Aureli, F., C. M. Schaffner, C. Boesch, S. K. Bearder, J. Call, C. A. Chapman, R. Connor, A. D.
Fiore, R. I. M. Dunbar, S. P. Henzi, K. Holekamp, A. H. Korstjens, R. Layton, P. Lee, J.
Lehmann, J. H. Manson, G. Ramos‐Fernandez, K. B. Strier, and C. P. van Schaik. 2008.
Fission‐fusion dynamics: new research frameworks. Current Anthropology 49:627–654.
Barocas, A., A. Ilany, L. Koren, M. Kam, and E. Geffen. 2011. Variance in centrality within rock
hyrax social networks predicts adult longevity. PLoS ONE 6:e22375.
Barton, K. 2010. MuMIn:Multi-model Inference. R.
Bates, D., and M. Maechler. 2010. lme4: Linear mixed-effects models using S4 classes. R.
Beauchamp, G. 2010. Relaxed predation risk reduces but does not eliminate sociality in birds.
Biology Letters 6:472 –474.
Burnham, K. P. 2002. Model Selection and Multimodel Inference.
Burnham, K. P., and D. R. Anderson. 2002. Model Selection and Multimodel Inference: A
Practical Information-Theoretic. 2nd edition. Springer, New York, New York, U.S.A.
Cairns, S. J., and S. J. Schwager. 1987. A comparison of association indices. Animal Behaviour
35:1454–1469.

18
Cameron, E. Z., T. H. Setsaas, and W. L. Linklater. 2009. Social bonds between unrelated
females increase reproductive success in feral horses. Proceedings of the National
Academy of Sciences 106:13850–13853.
Chambers, J. M., W. S. Cleveland, B. Kleiner, and P. A. Tukey. 1983. Graphical Methods for
Data Analysis. Chapman and Hall, New York, NY.
Clutton-Brock, T. H., A. F. Russell, L. L. Sharpe, P. N. M. Brotherton, G. M. McIlrath, S. White,
and E. Z. Cameron. 2001. Effects of helpers on juvenile development and survival in
meerkats. Science 293:2446 –2449.
Coltman, D. W., M. Festa-Bianchet, J. T. Jorgenson, and C. Strobeck. 2002. Age-dependent
sexual selection in bighorn rams. Proceedings of the Royal Society B: Biological
Sciences 269:165–172.
Costenbader, E., and T. W. Valente. 2003. The stability of centrality measures when networks
are sampled. Social Networks 25:283–307.
Couzin, I. D. 2006. Behavioral ecology: social organization in fission–fusion societies. Current
Biology 16:R169–R171.
Croft, D. P., J. R. Madden, D. W. Franks, and R. James. 2011. Hypothesis testing in animal
social networks. Trends in Ecology & Evolution 26:502–507.
Cross, P. C., J. O. Lloyd-Smith, J. A. Bowers, C. T. Hay, M. Hofmeyr, and W. M. Getz. 2004.
Integrating association data and disease dynamics in a social ungulate: bovine
tuberculosis in African buffalo in the Kruger National Park. Annales zoologici Fennici
41:879.
Csardi, G., and T. Nepusz. 2006. The igraph software package for complex network research. R.

19
Dingemanse, N. J., A. J. N. Kazem, D. Réale, and J. Wright. 2010. Behavioural reaction norms:
animal personality meets individual plasticity. Trends in Ecology & Evolution 25:81–89.
Dormann, C. F., J. Elith, S. Bacher, C. Buchmann, G. Carl, G. Carré, J. R. G. Marquéz, B.
Gruber, B. Lafourcade, P. J. Leitão, T. Münkemüller, C. McClean, P. E. Osborne, B.
Reineking, B. Schröder, A. K. Skidmore, D. Zurell, and S. Lautenbach. 2013.
Collinearity: a review of methods to deal with it and a simulation study evaluating their
performance. Ecography:27–46.
Dukas, R. 2002. Behavioural and ecological consequences of limited attention. Philosophical
Transactions of the Royal Society B: Biological Sciences 357:1539–1547.
Dunbar, R. I. M., A. H. Korstjens, and J. Lehmann. 2009. Time as an ecological constraint.
Biological Reviews 84:413–429.
Dunbar, R. I. M., and S. Shultz. 2007. Evolution in the social brain. Science 317:1344 –1347.
Ebensperger, L. A., D. S. Rivera, and L. D. Hayes. 2012. Direct fitness of group living mammals
varies with breeding strategy, climate and fitness estimates. Journal of Animal Ecology
81:1013–1023.
Favre, M., J. G. A. Martin, and M. Festa-Bianchet. 2008. Determinants and life-history
consequences of social dominance in bighorn ewes. Animal Behaviour 76:1373–1380.
Festa-Bianchet, M. 1988. Nursing behaviour of bighorn sheep: correlates of ewe age, parasitism,
lamb age, birthdate and sex. Animal Behaviour 36:1445–1454.
Festa-Bianchet, M. 1991. The social system of bighorn sheep: grouping patterns, kinship and
female dominance rank. Animal Behaviour 42:71–82.

20
Festa‐Bianchet, M., J. Gaillard, and J. T. Jorgenson. 1998. Mass‐ and density‐dependent
reproductive success and reproductive costs in a capital breeder. The American Naturalist
152:367–379.
Frere, C. H., M. Krutzen, J. Mann, R. C. Connor, L. Bejder, and W. B. Sherwin. 2010. Social
and genetic interactions drive fitness variation in a free-living dolphin population.
Proceedings of the National Academy of Sciences 107:19949–19954.
Gaillard, J.-M., M. Festa-Bianchet, D. Delorme, and J. Jorgenson. 2000. Body mass and
individual fitness in female ungulates: bigger is not always better. Proceedings of the
Royal Society of London. Series B: Biological Sciences 267:471 –477.
Grabowska-Zhang, A. M., T. A. Wilkin, and B. C. Sheldon. 2011. Effects of neighbor familiarity
on reproductive success in the great tit (Parus major). Behavioral Ecology 23:322–333.
Griffiths, S. W., S. Brockmark, J. Höjesjö, and J. I. Johnsson. 2004. Coping with divided
attention: the advantage of familiarity. Proceedings: Biological Sciences 271:695–699.
Hadfield, J. D. 2010. MCMC methods for multi-response generalized linear mixed models: the
MCMCglmm R package. Journal of Statistical Software 33:1–22.
Haydon, D. T., J. M. Morales, A. Yott, D. A. Jenkins, R. Rosatte, and J. M. Fryxell. 2008.
Socially informed random walks: incorporating group dynamics into models of
population spread and growth. Proceedings of the Royal Society B: Biological Sciences
275:1101 –1109.
Hogg, J. T. 1984. Mating in bighorn sheep: multiple creative male strategies. Science 7:526–529.
Holt-Lunstad, J., T. B. Smith, and J. B. Layton. 2010. Social relationships and mortality risk: a
meta-analytic review. PLoS medicine 7:e1000316.

21
Jennions, M. D., and D. W. Macdonald. 1994. Cooperative breeding in mammals. Trends in
Ecology & Evolution 9:89–93.
Johnson, J. B., and K. S. Omland. 2004. Model selection in ecology and evolution. Trends in
Ecology & Evolution 19:101–108.
Jorgenson, J. T., M. Festa-Bianchet, and W. D. Wishart. 1993. Harvesting bighorn ewes:
consequences for population size and trophy ram production. The Journal of Wildlife
Management 57:429–435.
König, B. 1994. Fitness effects of communal rearing in house mice: The role of relatedness
versus familiarity. Animal Behaviour 48:1449–1457.
Lea, A. J., D. T. Blumstein, T. W. Wey, and J. G. A. Martin. 2010. Heritable victimization and
the benefits of agonistic relationships. Proceedings of the National Academy of Sciences
107:21587 –21592.
Lusseau, D., H. Whitehead, and S. Gero. 2008. Incorporating uncertainty into the study of animal
social networks. Animal Behaviour 75:1809–1815.
Maiya, A. S., and T. Y. Berger-Wolf. 2010. Online sampling of high centrality individuals in
social networks. Pages 91–98 Advances in Knowledge Discovery and Data Mining.
Springer.
Martin, J. G. A., and M. Festa-Bianchet. 2011a. Determinants and consequences of age of
primiparity in bighorn ewes. Oikos 121:752–760.
Martin, J. G. A., and M. Festa-Bianchet. 2011b. Sex ratio bias and reproductive strategies: What
sex to produce when? Ecology 92:441–449.

22
Martin, J. G. A., D. H. Nussey, A. J. Wilson, and D. Réale. 2011. Measuring individual
differences in reaction norms in field and experimental studies: a power analysis of
random regression models. Methods in Ecology and Evolution 2:362–374.
McDonald, D. B. 2007. Predicting fate from early connectivity in a social network. Proceedings
of the National Academy of Sciences 104:10910–10914.
Murtaugh, P. A. 2009. Performance of several variable-selection methods applied to real
ecological data. Ecology Letters 12:1061–1068.
Pelletier, F., and M. Festa-Bianchet. 2006. Sexual selection and social rank in bighorn rams.
Animal Behaviour 71:649–655.
R Development Core Team. 2011. R: A language and environment for statistical computing. R
Foundation for Statistical Computing, Vienna, Austria.
Réale, D., N. J. Dingemanse, A. J. N. Kazem, and J. Wright. 2010. Evolutionary and ecological
approaches to the study of personality. Philosophical Transactions of the Royal Society
B: Biological Sciences 365:3937–3946.
Réale, D., and M. Festa-Bianchet. 2003. Predator-induced natural selection on temperament in
bighorn ewes. Animal Behaviour 65:463–470.
Rieucau, G., and L.-A. Giraldeau. 2011. Exploring the costs and benefits of social information
use: an appraisal of current experimental evidence. Philosophical Transactions of the
Royal Society B: Biological Sciences 366:949 –957.
Roberts, G. 1996. Why individual vigilance declines as group size increases. Animal Behaviour
51:1077–1086.
Ruckstuhl, K. E., and M. Festa-Bianchet. 2001. Group choice by subadult bighorn rams: Trade-
offs between foraging efficiency and predator avoidance. Ethology 107:161–172.

23
Ruckstuhl, K. E., and P. Neuhaus. 2002. Sexual segregation in ungulates: a comparative test of
three hypotheses. Biological Reviews 77:77–96.
Ruckstuhl, K. E., and P. Neuhaus. 2005. Sexual Segregation in Vertebrates: Ecology of Two
Sexes. Cambridge University Press, Cambridge, UK.
Silk, J. B. 2007a. Social components of fitness in primate groups. Science 317:1347 –1351.
Silk, J. B. 2007b. The adaptive value of sociality in mammalian groups. Philosophical
Transactions of the Royal Society B: Biological Sciences 362:539 –559.
Silk, J. B., S. C. Alberts, and J. Altmann. 2003. Social bonds of female baboons enhance infant
survival. Science 302:1231 –1234.
Silk, J. B., J. C. Beehner, T. J. Bergman, C. Crockford, A. L. Engh, L. R. Moscovice, R. M.
Wittig, R. M. Seyfarth, and D. L. Cheney. 2010. Strong and consistent social bonds
enhance the longevity of female baboons. Current Biology 20:1359–1361.
Stahler, D. R., D. R. MacNulty, R. K. Wayne, B. vonHoldt, and D. W. Smith. 2012. The
adaptive value of morphological, behavioural and life-history traits in reproductive
female wolves. Journal of Animal Ecology 82:222–234.
Stanton, M. A., and J. Mann. 2012. Early social networks predict survival in wild bottlenose
dolphins. PloS one 7:e47508.
Strodl, M. A., and P. Schausberger. 2012a. Social familiarity modulates group living and
foraging behaviour of juvenile predatory mites. Naturwissenschaften 99:303–311.
Strodl, M. A., and P. Schausberger. 2012b. Social familiarity reduces reaction times and
enhances survival of group-living predatory mites under the risk of predation. PLoS ONE
7:e43590.

24
Wey, T. W., and D. T. Blumstein. 2012. Social attributes and associated performance measures
in marmots: bigger male bullies and weakly affiliating females have higher annual
reproductive success. Behavioral Ecology and Sociobiology 66:1075–1085.
SUPPLEMENTAL MATERIAL
Appendix A
Supplementary methods pertaining to the choice and measurement of centrality metrics.
Appendix B
Supplementary tables reporting replicated results for graph strength.
Appendix C
Supplementary figure illustrating the relationship between graph density and population size.

25
Table 1: Competing models to explain variation in different measures of fitness (lamb production and survival) in
bighorn sheep on Ram Mountain, Alberta. H1 includes three social models: individual level effects (a), population level
effects (b) and both with their interaction (c). Alternate hypotheses include: morphology (H2); morphology and
maternal effects (H3); population density only (H4); morphology, maternal effects, and density (H5); and the global
model (H6).
Centrality Graph
density (GD) Parent mass
Maternal
effects (ME) Age (+age2)*
Population
density (N)
Hyp
oth
eses
H1a
H1b
H1c
H2
H3
H4
H5
H6
*The spline of age (age2)
26
Table 2. Results for competing models to explain variation in different measures of fitness (lamb production and survival) in bighorn sheep
on Ram Mountain, Alberta (see Table 2). Models constructed with eigenvector centrality, see Table S2 for results using graph strength.
Bold values represent models with ∆AIC ≤ 3 from the best model.
∆ Akaike’s Information Criteria (R2)
Hypotheses
Female Lamb
production
(n = 556 animal-years,
147 individuals)
Male lamb
production
(n = 353 animal-years,
138 individuals)
Female lamb
survival
(n = 96)
Male lamb
survival
(n = 113)
Female
( > 1) survival
(n = 557 animal-years,
144 individuals)
Male
( > 1) survival
(n = 227 animal-
years, 87 individuals)
H1a 190.97 (0.04) 104.73 (0.28) 2.64 (0.07) 3.39 (0.12) 17.24 (0.28) 29.90 (0.37)
H1b 187.94 (0.05) 104.51 (0.28) 2.93 (0.07) 1.95 (0.14) 101.43 (0.07) 30.50 (0.36)
H1c 183.24 (0.07) 106.33 (0.29) 4.06 (0.08) 1.36 (0.19) 18.95 (0.28) 33.62 (0.37)
H2 23.45 (0.39) 11.15 (0.56) 3.45 (0.11) 3.94 (0.16) 82.65 (0.13) 29.26 (0.38)
H3 13.09 (0.41) NA 2.87 (0.14) 3.97 (0.18) 80.16 (0.14) 0.00 (0.51)
H4 191.58 (0.04) 163.24 (0.06) 0.00 (0.1) 1.67 (0.14) 118.88 (0.02) 107.01 (0.04)
H5 14.56 (0.41) 0.00 (0.6) 2.18 (0.18) 0.00 (0.24) 81.99 (0.14) 1.98 (0.51)
H6 0.00 (0.45) 1.40 (0.61) 5.08 (0.19) 1.00 (0.29) 0.00 (0.35) 0.33 (0.54)

27
Table 3. Model averaged results from the global model (Table 3) to explain the variation in
different measures of fitness in female bighorn sheep on Ram Mountain, Alberta. Models
constructed with eigenvector centrality, see Table S3 for results using graph strength. We
standardized all variable to their z-scores prior to analysis. Bold numbers report either p <
0.05 or relative importance values (AICw) = 1.
Fixed Effects β SE z-value p-value AICw L
amb
pro
du
ctio
n
(n =
556
ani
mal
-yea
rs, 1
47 in
divi
dual
s)
Intercept -0.15 0.34 0.46 0.648 NA
Eigenvector centrality 0.32 0.16 2.05 0.040 1.00
Graph density 0.40 0.17 2.30 0.021 1.00
Centrality*Graph density -0.37 0.15 2.50 0.012 1.00
Mass 0.56 0.39 1.43 0.154 0.49
Maternal effect -0.74 0.18 4.20 <0.001 1.00
Age 3.04 0.45 6.71 <0.001 1.00
Age2 -1.23 0.19 6.57 <0.001 1.00
Population density 0.73 0.24 3.10 0.002 1.00
Lam
b
surv
ival
(n =
96)
Intercept -0.41 0.55 0.74 0.458 NA
Eigenvector centrality 0.31 0.32 0.98 0.328 0.13
Graph density1

28
Centrality*Graph density1
Mass 0.68 0.83 0.83 0.409 0.18
Maternal effect -0.45 0.22 2.05 0.040 0.85
Age 0.26 0.34 0.77 0.442 0.13
Age2 0.21 0.18 1.14 0.255 0.23
Population density -0.49 0.3 1.64 0.100 0.50 A
du
lt s
urv
ival
(n =
557
ani
mal
-yea
rs, 1
44 in
divi
dual
s)
Intercept 2.23 0.28 7.97 <0.001 NA
Eigenvector centrality 1.03 0.15 6.92 <0.001 1.00
Graph density 0.03 0.17 0.21 0.836 0.54
Centrality*Graph density -0.20 0.12 1.66 0.097 0.41
Mass 0.82 0.32 2.59 0.010 1.00
Maternal effect -0.28 0.15 1.94 0.053 0.80
Age -0.59 0.17 3.42 0.001 0.41
Age2 -0.22 0.06 3.44 0.001 0.59
Population density 0.58 0.20 2.91 0.004 1.00
1 Variable dropped during ‘all-possible-model’ selection

29
Table 4. Model averaged results from the global model (Table 3) to explain the variation
in different measures of fitness in male bighorn sheep on Ram Mountain, Alberta. Models
constructed with eigenvector centrality, see Table S3 for results using graph strength. We
standardized all variable to their z-scores prior to analysis. Emboldened numbers report
either p < 0.05 or relative variable importance values (AICw) = 1.
Fixed Effects β SE z-value p-value AICw L
amb
pro
du
ctio
n
(n =
353
ani
mal
-yea
rs, 1
38 in
divi
dual
s)
Intercept -3.71 0.73 5.09 <0.001 NA
Eigenvector centrality 0.12 0.23 0.50 0.616 0.44
Graph density 0.27 0.33 0.83 0.409 0.79
Centrality*Graph density 0.28 0.16 1.77 0.076 0.23
Mass 2.60 0.43 5.99 <0.001 1.00
Age -0.11 0.33 0.33 0.744 0.08
Age2 -0.04 0.09 0.43 0.670 0.09
Population density -0.74 0.40 1.82 0.068 0.73
Lam
b s
urv
ival
(n =
113
)
Intercept -1.37 0.51 2.71 0.007 NA
Eigenvector centrality 0.43 0.29 1.49 0.137 0.53
Graph density 0.25 0.33 0.76 0.445 0.10
Centrality*Graph density -0.56 0.35 1.62 0.106 0.10

30
Mass 0.44 0.25 1.78 0.075 0.74
Maternal effect -0.37 0.21 1.76 0.078 0.69
Age -0.18 0.58 0.31 0.753 0.25
Age2 0.31 0.20 1.59 0.113 0.67
Population density -0.70 0.34 2.09 0.037 0.85
Ad
ult
su
rviv
al
(n =
227
ani
mal
-yea
rs, 8
7 in
divi
dual
s)
Intercept 1.87 0.34 5.57 <0.001 NA
Eigenvector centrality 0.22 0.17 1.31 0.189 0.81
Graph density -0.2 0.25 0.77 0.439 0.49
Centrality*Graph density1
Mass 0.81 0.49 1.65 0.100 0.38
Maternal effect -0.27 0.2 1.36 0.174 1.00
Age -0.80 0.44 1.83 0.068 0.67
Age2 -0.20 0.10 2.10 0.036 0.40
Population density1
1 Variable dropped during ‘all-possible-model’ selection

31
FIGURE CAPTIONS
Figure 1. Distribution of pairwise association strengths according to the half-weight index,
derived from gambit-of-the-group data from a fission-fusion society of female (a) and male (b)
bighorn sheep on Ram Mountain, Alberta, Canada, 1996-2011.
Figure 2. Population scale boxplots (a) of median, 25% and 75% quartiles and 95% confidence
intervals of eigenvector centrality for female bighorn sheep with and without lambs. Non-
overlapping notches (‘> <’) indicate groups not significantly (p > 0.05) different (Chambers et
al. 1983). However, individual scale variation does exist; see (b) reaction norms illustrating
individual plasticity in eigenvector centrality (gray lines) and an individual by reproductive state
effect (p < 0.001). Black lines indicate the population mean.
Figure 3. Fitness component curves (a) of bighorn sheep at Ram Mountain, Alberta, depicting
individual-level effects on lamb production, lamb and adult survival derived from global models
(H6, Table 3). Centrality primarily affected adult female lamb production and survival with less
influence on lamb survival. Effects were stronger for females (upper) than males (lower). (b)
Range of the data in boxplots (median, 25% and 75% quartiles and 95% confidence intervals).
Non-overlapping notches (‘> <’) illustrate significant (p > 0.05) differences between groups
(Chambers et al. 1983) that succeed (in reproducing or surviving) and those that failed.
Figure 4. Relative importance of variables (AICw) from three competing families for models:
social (red), morphological (blue), and environmental (green), by sex-specific component of
fitness (female and male, lamb production, lamb and adult survival). For example, values of 1
suggest that the variable was present in all models with ∆AIC < 2, whereas values of 0.5 indicate

32
that the variable was present in 50% of the models with ∆AIC < 2. Variables that are absent were
dropped during AIC model selection due to unimportance.

Figu
re 1
0.0
0.2
0.4
0.6
0.8
1.0
Hal
f-wei
ght-i
ndex
-20
2z-
scor
eFrequencyn = 18157
Females
0.0
0.2
0.4
0.6
0.8
1.0
Hal
f-wei
ght-i
ndex
-1.5
01.
5z-
scor
e
Frequencyn = 1843
Males

Figure 2
-4-3
-2-1
01
Without lamb With lamb(n = 235) (n = 206)
Stan
dard
ized
eig
enve
ctor
cen
tralit
y
Reproductive state
a
-3-2
-10
1 b
Without lamb With lamb
Stan
dard
ized
eig
enve
ctor
cen
tralit
y
Reproductive state(n = 111 individuals)

Figure 3
0.0
0.2
0.4
0.6
0.8
1.0
Prob
abili
ty
Adult lamb productionLamb survivalAdult survival
Females
b
a
No offspringOffspring
DiedSurvived
DiedSurvived
0.0 0.2 0.4 0.6 0.8 1.0
Centrality
Prob
abili
ty
0 0.2 0.4 0.6 0.8 1
0.2
0.4
0.6
0.8
1
Adult lamb productionLamb survivalAdult survival
Males
b
a
No offspringOffspring
DiedSurvived
DiedSurvived
0.0 0.2 0.4 0.6 0.8 1.0

Figure 4.
Male adult survival
Female adult survival
Male lamb survival
Female lamb survival
Male lamb production
Female lamb production
0.0 0.2 0.4 0.6 0.8 1.0
CentralityGraph densityCentrality*Graph densityMassMaternal effectAgePopulation density
0.0 0.2 0.4 0.6 0.8 1.0
Relative variable importance
Male adult survival
Female adult survival
Male lamb survival
Female lamb survival
Male lamb production
Female lamb production