Q1FY17 Performance Summary - Ventura Securities
52
Q1FY17 Performance Summary 1 Monday, 22nd August, 2016 This document is for private circulation, and must be read in conjunction with the disclaimer on the last page. Q1FY17 RESULTS REVIEW Nifty 8,667 Sensex 28,077 The Q1FY17 earnings season continued on a mixed note. SBI’s 1QFY17 asset quality has surprised on the positive side. Lower than expected slippages have helped in reporting better than expected bottom-line. Bank of Baroda’s ratios have increased partly on account of the conscious reduction in the asset base during the year. BOB has reported a drop in net profit on YoY basis, due to higher provisions and lower net interest income. Adani Ports and Special Economic Zone has reported healthy growth in cargo volumes, operational efficiencies and their strategy to increase bulk cargo volumes, other than coal volumes have enabled to report all round growth in financial numbers. For 1QFY2017, Hero Motor Corp posted a good set of numbers. The company has sold 1.74 million units in this quarter. Lupin has reported strong results in Q1FY17. The company’s revenue was high compared to previous year. The company’s net profit also boosted on yearly basis. Bosch Ltd reported good revenue growth for June quarter FY17. Automotive segment grew well, where as non automotive segment had a marginal growth. Power Grid Corporation of India has posted positive topline and bottom-line numbers in Q1FY17. Net revenue had a robust growth. Cipla reported poor numbers for Q1FY17, revenue declined on yearly basis. Grasim Industries’ 1QFY17 EBITDA showed a robust growth, driven by near-peak utilizations, high pricing and lower energy costs. Hindalco has delivered robust operational performance in adverse macroeconomic conditions. Its operational performance was supported by deflationary energy prices. Macroeconomic headwinds will persist and uncertain global macro factors pose challenges. The level of imports continues to impact domestic sales volumes. Sun Pharmaceutical Industries posted growth in net profit for Q1FY17 on a year-on-year basis on the back of growth in its US business. US business accounts for half of Sun Pharma's revenue and the company has reported two successive strong quarters of growth due to 180 day exclusivity in sale of anti leukemia drug Gleevec.
-
Upload
khangminh22 -
Category
Documents
-
view
4 -
download
0
Transcript of Q1FY17 Performance Summary - Ventura Securities

Q1FY17 Performance Summary
1 Monday, 22nd August, 2016
This document is for private circulation, and must be read in conjunction with the disclaimer on the last page.
Q1F
Y1
7 R
ES
UL
TS
RE
VIE
W
Nifty 8,667 Sensex 28,077 The Q1FY17 earnings season continued on a mixed note. SBI’s 1QFY17 asset quality has surprised on the positive side. Lower than expected slippages have helped in reporting better than expected bottom-line. Bank of Baroda’s ratios have increased partly on account of the conscious reduction in the asset base during the year. BOB has reported a drop in net profit on YoY basis, due to higher provisions and lower net interest income. Adani Ports and Special Economic Zone has reported healthy growth in cargo volumes, operational efficiencies and their strategy to increase bulk cargo volumes, other than coal volumes have enabled to report all round growth in financial numbers. For 1QFY2017, Hero Motor Corp posted a good set of numbers. The company has sold 1.74 million units in this quarter. Lupin has reported strong results in Q1FY17. The company’s revenue was high compared to previous year. The company’s net profit also boosted on yearly basis. Bosch Ltd reported good revenue growth for June quarter FY17. Automotive segment grew well, where as non automotive segment had a marginal growth. Power Grid Corporation of India has posted positive topline and bottom-line numbers in Q1FY17. Net revenue had a robust growth. Cipla reported poor numbers for Q1FY17, revenue declined on yearly basis. Grasim Industries’ 1QFY17 EBITDA showed a robust growth, driven by near-peak utilizations, high pricing and lower energy costs. Hindalco has delivered robust operational performance in adverse macroeconomic conditions. Its operational performance was supported by deflationary energy prices. Macroeconomic headwinds will persist and uncertain global macro factors pose challenges. The level of imports continues to impact domestic sales volumes. Sun Pharmaceutical Industries posted growth in net profit for Q1FY17 on a year-on-year basis on the back of growth in its US business. US business accounts for half of Sun Pharma's revenue and the company has reported two successive strong quarters of growth due to 180 day exclusivity in sale of anti leukemia drug Gleevec.
2 Monday, 22nd August, 2016 This document is for private circulation, and must be read in conjunction with the disclaimer on the last page.
Company Synopsis

Quarterly Result Update
State Bank of India Ltd.
Asset quality deteriorates
- 3 - Monday, 22nd
August, 2016
Defying tough operating environment, State Bank of India put up a relatively better show beginning the FY17 on an upbeat note. Moderate increase in NPAs, declining slippage trends, decreasing credit costs and improving credit off-take summarizes the healthy earnings for the quarter. PAT at INR 25.2 bn stood broadly in-line and almost doubled on sequential basis. While NII stayed muted (down 6% Q-o-Q; up mere 4% Y-o-Y) primarily due to NIM compression (20 bps Y-o-Y) on account of base rate cut, the operating metrics looked better for SBI. The operating profits stood well off for the bank on the back of strong other income performance (in the form of treasury gains, forex and dividend income and cross sell income), tax write-backs and controlled opex (216 bps dip Y-o-Y). NIMs witnessed slight moderation at 2.83% (down both YoY, QoQ). Q1 being seasonally soft quarter for SBI; resultantly the advances looked down Q-o-Q by 3%. That said, on Y-o-Y basis, SBI’s loan book acceleration outpaces peers with loans at 11% growth primarily buoyed by healthy 20% retail loans with greater traction in home, auto and personal loans segments during Q1FY17; clocking significant market share gains in home and auto loans. The non-interest income traction (25.6% Y-o-Y growth) led by 18% Y-o-Y growth in treasury gains (up 212% Y-o-Y), forex (22%) and dividend income (388%) and cross sell fee income (39% Y-o-Y). Also, NIMs witnessed slight moderation at 2.83% (down both YoY, Q-o-Q) but on expected lines primarily on account of base rate cut. That said, margins are expected to stabilize at 2.85-2.9% as cited by the Management. Currently, at the CMP of Rs 256, SBI is valued at 1.3 Adj P/BV on 1 yr forward basis. We recommend a BUY on the stock.
Recommendation (Rs)
CMP 256 Rating BUY
Index Details
Sensex 28,077
Nifty 8,667
Industry Banks
Scrip Details
Mkt Cap (Rs cr) 198,960
Eq Shares O/s (Cr) 776.2
Avg Vol (Lakhs) 45.0
52 Week H/L 268/148
Dividend Yield (%) 2.2
Face Value (Rs) 1.0
Latest shareholding pattern (%)
Promoters 61.3 Public 38.7
Total 100.0
Stock performance (%)
1m 3m 6m
SBI 12.5 49.5 57.0 Nifty 1.62 11.35 20.19

Quarterly Result Update
- 4 - Monday, 22
nd August, 2016
Description Q1FY17 Q1FY16 % Chg. Q1FY17 Q4FY16 % Chg.FY201603FY201503 % Chg.
Interest Earned 55915.1 53746.2 4.0 55915.1 57275.4 -2.4 221854.8 207974.3 6.7
Interest on Advances 39989.7 39040.2 2.4 39989.7 39352.0 1.6 157001.8 153144.6 2.5
% of Total Int. Earned 71.5 72.6 -- 71.5 68.7 -- 70.8 73.6 --
Interest on Balances with RBI 315.8 350.1 -9.8 315.8 200.4 57.6 1186.8 1033.6 14.8
% of Total Int. Earned 0.6 0.7 -- 0.6 0.4 -- 0.5 0.5 --
Income From Investments 14626.2 13392.9 9.2 14626.2 15059.1 -2.9 57922.7 48952.3 18.3
% of Total Int. Earned 26.2 24.9 -- 26.2 26.3 -- 26.1 23.5 --
Others 983.3 963.1 2.1 983.3 2664.1 -63.1 5743.6 4843.9 18.6
% of Total Int. Earned 1.8 1.8 -- 1.8 4.7 -- 2.6 2.3 --
Other Income 13499.7 9418.3 43.3 13499.7 18488.4 -27.0 51016.2 49315.2 3.5
Total Income 69414.8 63164.5 9.9 69414.8 75763.8 -8.4 272871.0 257289.5 6.1
Interest Expended 36366.7 34971.9 4.0 36366.7 36425.8 -0.2 143047.4 133178.6 7.4
Operating Expenses 18498.9 15859.9 16.6 18498.9 21787.8 -15.1 73717.1 73224.2 0.7
Payment to provisions for Employee8196.0 7706.6 6.4 8196.0 8888.2 -7.8 32525.6 31117.6 4.5
% of Opt. Expenses 44.3 48.6 -- 44.3 40.8 -- 44.1 42.5 --
Other Opt. Expenses 10302.8 8153.3 26.4 10302.8 12899.6 -20.1 41191.5 42106.6 -2.2
% of Opt. Expenses 55.7 51.4 -- 55.7 59.2 -- 55.9 57.5 --
Total Expenses 18498.9 15859.9 16.6 18498.9 21787.8 -15.1 73717.1 73224.2 0.7
Operating Profit before prov. & cont.14549.2 12332.7 18.0 14549.2 17550.2 -17.1 56106.6 50886.6 10.3
% of Total Int. Earned 26.0 23.0 -- 26.0 30.6 -- 25.3 24.5 --
Provisions and Contigencies 13130.5 5294.5 148.0 13130.5 16393.6 -19.9 37929.8 25032.1 51.5
PBT 1418.7 7038.3 -79.8 1418.7 1156.7 22.7 18176.8 25854.6 -29.7
% of Total Int. Earned 2.5 13.1 -- 2.5 2.0 -- 8.2 12.4 --
Tax 551.4 2184.7 -74.8 551.4 -203.6 LP 5433.5 8337.2 -34.8
PAT 867.3 4853.6 -82.1 867.3 1360.3 -36.2 12743.3 17517.4 -27.3
% of Total Int. Earned 1.6 9.0 -- 1.6 2.4 -- 5.7 8.4 --
Paid up equity share capital 776.3 756.6 2.6 776.3 776.3 0.0 776.3 746.6 4.0
EPS (Rs.) 1.4 6.2 -78.4 1.4 1.6 -16.7 15.8 22.8 -30.8
Capital Adequacy Ratio - 0.0 0.0 -
NII 19548.4 18774.3 4.1 19548.4 20849.6 -6.2 78807.5 74795.7 5.4
NIM
Gross NPA - 0.0 0.0 -
% of Gross NPA - 0.0 0.0 -
Net NPA - 0.0 0.0 -
% of Net NPA - 0.0 0.0 -
ROA(%) - 0.0 0.0 -
CEPS (Rs.) 168.85 123.15 37.11 168.85 159.48 5.88 539.33 434.38 24.16

Quarterly Result Update
- 5 - Monday, 22
nd August, 2016
Deposits-Advance Growth Revenue Growth (%)
40.0
40.5
41.0
41.5
42.0
42.5
43.0
43.5
44.0
44.5
45.0
0.0
200,000.0
400,000.0
600,000.0
800,000.0
1,000,000.0
1,200,000.0
1,400,000.0
1,600,000.0
1,800,000.0
2,000,000.0
Q3 F
Y14
Q4 F
Y14
Q1 F
Y15
Q2F
Y15
Q3F
Y15
Q4F
Y15
Q1F
Y16
Q2F
Y16
Q3F
Y16
Q4F
Y16
Q1F
Y17
Rs.Crore
Advance Deposit CASA RHS(%)
(%)
-10.0
-5.0
0.0
5.0
10.0
15.0
0.0
2,000.0
4,000.0
6,000.0
8,000.0
10,000.0
12,000.0
14,000.0
16,000.0
18,000.0
Q3 F
Y14
Q4 F
Y14
Q1 F
Y15
Q2F
Y15
Q3F
Y15
Q4F
Y15
Q1F
Y16
Q2F
Y16
Q3F
Y16
Q4F
Y16
Q1F
Y17
Rs.Crore
NII QoQ Growth (%)
(%)
Source: SBI, Ventura Research Source: SBI, Ventura Research
LDR (%) Incremental LDR (%)
76.0
78.0
80.0
82.0
84.0
86.0
88.0
90.0
Q3 F
Y14
Q4 F
Y14
Q1 F
Y15
Q2F
Y15
Q3F
Y15
Q4F
Y15
Q1F
Y16
Q2F
Y16
Q3F
Y16
Q4F
Y16
Q1F
Y17
LDR Ratio (%)
(%)
-150.0
-100.0
-50.0
0.0
50.0
100.0
150.0
200.0
250.0
300.0
Q3 F
Y14
Q4 F
Y14
Q1 F
Y15
Q2 F
Y15
Q3 F
Y15
Q4 F
Y15
Q1F
Y16
Q2F
Y16
Q3F
Y16
Q4F
Y16
Q1F
Y17
Incremental LDR Ratio (%)
(%)
Source: SBI, Ventura Research Source: SBI, Ventura Research

Quarterly Result Update
- 6 - Monday, 22
nd August, 2016
Cost to Income Ratio Asset Quality improves QoQ (%)
Error! N ot a valid l ink.
2.8
2.9
3.0
3.1
3.2
3.3
3.4
3.5
3.6
0.0
2.0
4.0
6.0
8.0
10.0
12.0
Q3 F
Y14
Q4 F
Y14
Q1 F
Y15
Q2F
Y15
Q3F
Y15
Q4F
Y15
Q1F
Y16
Q2F
Y16
Q3F
Y16
Q4F
Y16
Q1F
Y17
Yield on Advance Cost of Deposits NIM (RHS)
(%) (%)
Error! N ot a valid l ink.
Source: SBI, Ventura Research Source: SBI, Ventura Research
0.4
10.4
20.4
30.4
40.4
50.4
60.4
Q3 F
Y14
Q4 F
Y14
Q1 F
Y15
Q2 F
Y15
Q3 F
Y15
Q4 F
Y15
Q1 F
Y16
Q2 F
Y16
Q3 F
Y16
Q4F
Y16
Q1F
Y17
Cost to Income …
(%)
Fee income to Advances (%) Yield on Advance , NIM & Cost of Deposits
0.0
0.1
0.2
0.3
0.4
Q1 F
Y14
Q2 F
Y14
Q3 F
Y14
Q4 F
Y14
Q1 F
Y15
Q2F
Y15
Q3F
Y15
Q4F
Y15
Q1F
Y16
Q2F
Y16
Q3F
Y16
Fee Income as % of Advances
(%)
2.8
2.9
3.0
3.1
3.2
3.3
3.4
3.5
3.6
0.0
2.0
4.0
6.0
8.0
10.0
12.0
Q3 F
Y14
Q4 F
Y14
Q1 F
Y15
Q2F
Y15
Q3F
Y15
Q4F
Y15
Q1F
Y16
Q2F
Y16
Q3F
Y16
Q4F
Y16
Q1F
Y17
Yield on Advance Cost of Deposits NIM (RHS)
(%) (%)
Source: SBI, Ventura Research Source: SBI, Ventura Research

Quarterly Result Update
- 7 - Monday, 22
nd August, 2016
ROA vs ROE (%) Capital Adequacy Ratio (%)
0.0
0.1
0.2
0.3
0.4
0.5
0.6
0.7
0.8
3.0
5.0
7.0
9.0
11.0
13.0
15.0
Q3 F
Y14
Q4 F
Y14
Q1 F
Y15
Q2F
Y15
Q3F
Y15
Q4F
Y15
Q1F
Y16
Q2F
Y16
Q3F
Y16
Q4F
Y16
Q1F
Y17
ROE ROA (RHS)
(%) (%)
Source: SBI, Ventura Research Source: SBI, Ventura Research
10.5
11.0
11.5
12.0
12.5
13.0
13.5
14.0
14.5
0.0
2.0
4.0
6.0
8.0
10.0
12.0
14.0
16.0
Q3 F
Y14
Q4 F
Y14
Q1 F
Y15
Q2F
Y15
Q3F
Y15
Q4F
Y15
Q1F
Y16
Q2F
Y16
Q3F
Y16
Q4F
Y16
Q1F
Y17
Tier I Capital Tier II Capital
(%) (%)
1 Yr Forward P/E 1 Yr Forward P/BV
0
50
100
150
200
250
300
350
400
Sep-03 Sep-06 Sep-09 Sep-12 Sep-15
CMP 4.75X 6.93X 9.1X 11.28X 13.46X
0
50
100
150
200
250
300
350
400
450
Sep-03 Sep-06 Sep-09 Sep-12 Sep-15
CMP 0.8X 1.05X 1.3X 1.55X 1.8X
Source: SBI, Ventura Research Source: SBI, Ventura Research
Quarterly Result Update
Bank of Baroda Ltd.
Asset quality remains a concern
- 8 - Monday, 22nd
August, 2016
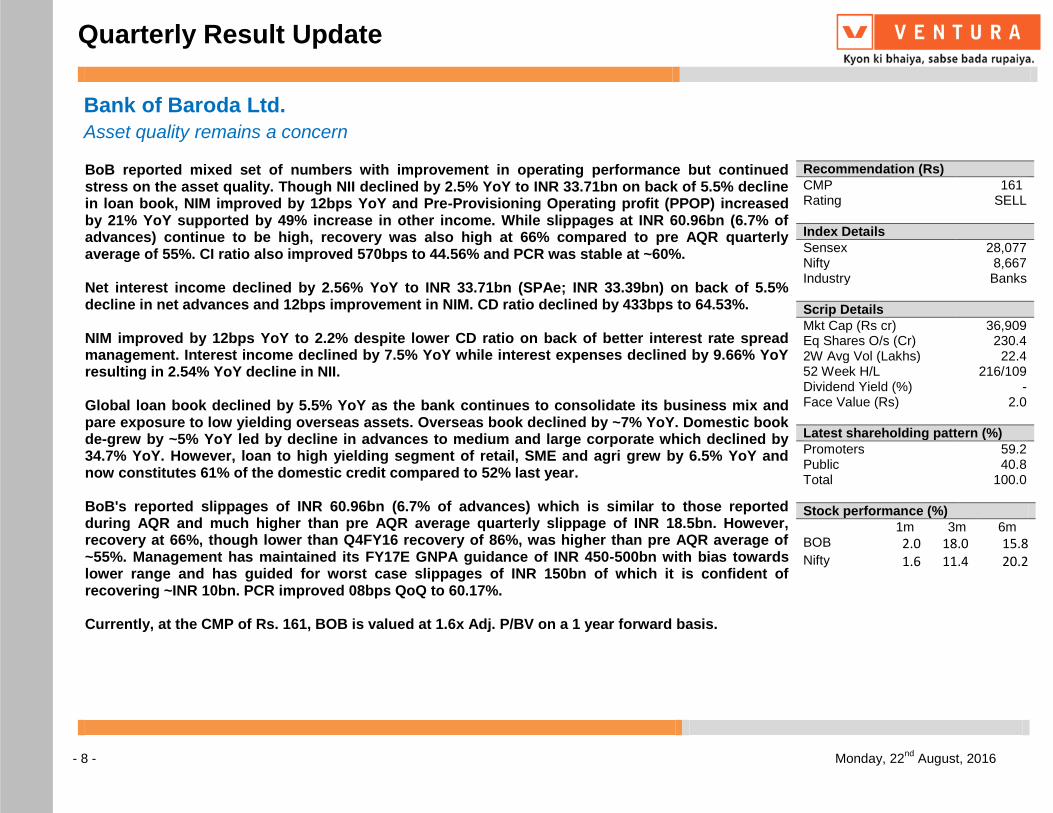
BoB reported mixed set of numbers with improvement in operating performance but continued stress on the asset quality. Though NII declined by 2.5% YoY to INR 33.71bn on back of 5.5% decline in loan book, NIM improved by 12bps YoY and Pre-Provisioning Operating profit (PPOP) increased by 21% YoY supported by 49% increase in other income. While slippages at INR 60.96bn (6.7% of advances) continue to be high, recovery was also high at 66% compared to pre AQR quarterly average of 55%. CI ratio also improved 570bps to 44.56% and PCR was stable at ~60%. Net interest income declined by 2.56% YoY to INR 33.71bn (SPAe; INR 33.39bn) on back of 5.5% decline in net advances and 12bps improvement in NIM. CD ratio declined by 433bps to 64.53%. NIM improved by 12bps YoY to 2.2% despite lower CD ratio on back of better interest rate spread management. Interest income declined by 7.5% YoY while interest expenses declined by 9.66% YoY resulting in 2.54% YoY decline in NII. Global loan book declined by 5.5% YoY as the bank continues to consolidate its business mix and pare exposure to low yielding overseas assets. Overseas book declined by ~7% YoY. Domestic book de-grew by ~5% YoY led by decline in advances to medium and large corporate which declined by 34.7% YoY. However, loan to high yielding segment of retail, SME and agri grew by 6.5% YoY and now constitutes 61% of the domestic credit compared to 52% last year. BoB's reported slippages of INR 60.96bn (6.7% of advances) which is similar to those reported during AQR and much higher than pre AQR average quarterly slippage of INR 18.5bn. However, recovery at 66%, though lower than Q4FY16 recovery of 86%, was higher than pre AQR average of ~55%. Management has maintained its FY17E GNPA guidance of INR 450-500bn with bias towards lower range and has guided for worst case slippages of INR 150bn of which it is confident of recovering ~INR 10bn. PCR improved 08bps QoQ to 60.17%. Currently, at the CMP of Rs. 161, BOB is valued at 1.6x Adj. P/BV on a 1 year forward basis.
Recommendation (Rs)
CMP 161 Rating SELL
Index Details
Sensex 28,077 Nifty 8,667 Industry Banks
Scrip Details
Mkt Cap (Rs cr) 36,909 Eq Shares O/s (Cr) 230.4 2W Avg Vol (Lakhs) 22.4 52 Week H/L 216/109 Dividend Yield (%) - Face Value (Rs) 2.0
Latest shareholding pattern (%)
Promoters 59.2 Public 40.8 Total 100.0
Stock performance (%)
1m 3m 6m BOB 2.0 18.0 15.8 Nifty 1.6 11.4 20.2

Quarterly Result Update
- 9 - Monday, 22
nd August, 2016
Description Q1FY17 Q1FY16 % Chg. Q1FY17 Q4FY16 % Chg. FY201603 FY201503 % Chg.
Interest Earned 10433.5 11276.5 -7.5 10433.5 11014.4 -5.3 44061.3 42963.6 2.6
Interest on Advances 7162.1 8032.7 -10.8 7162.1 6882.3 4.1 29796.2 30802.7 -3.3
% of Total Int. Earned 68.6 71.2 -- 68.6 62.5 -- 67.6 71.7 --
Interest on Balances with RBI 324.9 296.1 9.8 324.9 365.3 -11.1 1305.9 1549.8 -15.7
% of Total Int. Earned 3.1 2.6 -- 3.1 3.3 -- 3.0 3.6 --
Income From Investments 2495.0 2558.7 -2.5 2495.0 2689.4 -7.2 10673.2 9431.0 13.2
% of Total Int. Earned 23.9 22.7 -- 23.9 24.4 -- 24.2 22.0 --
Others 451.6 389.1 16.1 451.6 1077.4 -58.1 2285.9 1180.1 93.7
% of Total Int. Earned 4.3 3.5 -- 4.3 9.8 -- 5.2 2.8 --
Other Income 1444.4 967.2 49.3 1444.4 1774.7 -18.6 4998.9 4402.0 13.6
Total Income 11877.9 12243.7 -3.0 11877.9 12789.1 -7.1 49060.1 47365.6 3.6
Interest Expended 7062.4 7816.9 -9.7 7062.4 7684.0 -8.1 31321.4 29776.3 5.2
Operating Expenses 2146.0 2224.9 -3.6 2146.0 2532.6 -15.3 8923.1 7674.1 16.3
Payment to provisions for Employee 1108.1 1345.1 -17.6 1108.1 1434.2 -22.7 4978.0 4261.4 16.8
% of Opt. Expenses 51.6 60.5 -- 51.6 56.6 -- 55.8 55.5 --
Other Opt. Expenses 1037.9 879.8 18.0 1037.9 1098.5 -5.5 3945.1 3412.8 15.6
% of Opt. Expenses 48.4 39.5 -- 48.4 43.4 -- 44.2 44.5 --
Total Expenses 2146.0 2224.9 -3.6 2146.0 2532.6 -15.3 8923.1 7674.1 16.3
Operating Profit before prov. & cont. 2669.5 2202.0 21.2 2669.5 2572.5 3.8 8815.6 9915.1 -11.1
% of Total Int. Earned 25.6 19.5 -- 25.6 23.4 -- 20.0 23.1 --
Provisions and Contigencies 2004.1 599.7 234.2 2004.1 6857.7 -70.8 15513.7 4494.5 245.2
PBT 665.4 1602.2 -58.5 665.4 -4285.2 LP -6698.1 5420.6 PL
% of Total Int. Earned 6.4 14.2 -- 6.4 -38.9 -- -15.2 12.6 --
Tax 241.8 550.1 -56.0 241.8 -1055.1 LP -1302.5 2022.2 PL
PAT 423.6 1052.2 -59.7 423.6 -3230.1 LP -5395.6 3398.4 PL
% of Total Int. Earned 4.1 9.3 -- 4.1 -29.3 -- -12.3 7.9 --
Paid up equity share capital 462.1 443.6 4.2 462.1 462.1 0.0 462.1 443.6 4.2
EPS (Rs.) 1.8 4.7 -61.4 1.8 -14.0 LP -23.4 15.3 PL
Capital Adequacy Ratio 14.1 12.7 135.0 14.1 14.2 -11.0 14.2 13.3 87.0
NII 3371.1 3459.6 -2.6 3371.1 3330.4 1.2 12739.8 13187.2 -3.4
NIM
Gross NPA 42991.7 17274.0 148.9 42991.7 40521.0 6.1 40521.0 16261.5 149.2
% of Gross NPA 11.2 4.1 702.0 11.2 10.0 116.0 10.0 3.7 627.0
Net NPA 20783.8 8470.0 145.4 20783.8 19406.5 7.1 19406.5 8069.5 140.5
% of Net NPA 5.7 2.1 366.0 5.7 5.1 67.0 5.1 1.9 317.0
ROA(%) 0.3 0.6 -35.0 0.3 -1.9 215.0 -0.8 0.5 PL

Quarterly Result Update
- 10 - Monday, 22
nd August, 2016
Deposits-Advance Growth Incremental LDR (%)
Error
27.0
28.0
29.0
30.0
31.0
32.0
33.0
34.0
35.0
0.0
100,000.0
200,000.0
300,000.0
400,000.0
500,000.0
600,000.0
700,000.0
Q3
FY14
Q4
FY14
Q1
FY15
Q2
FY15
Q3
FY15
Q4
FY15
Q1
FY16
Q2
FY16
Q3
FY16
Q4
FY16
Q1
FY17
Rs.Crore
Advance Deposit CASA RHS(%)
(%)
-400.0
-300.0
-200.0
-100.0
0.0
100.0
200.0
Q3 FY14 Q1 FY15 Q3 FY15 Q1 FY16 Q3 FY16 Q1FY17
Incremental LDR Ratio (%)
(%)
Source: BOB, Ventura Research Source: BOB, Ventura Research
LDR (%)
62.0
63.0
64.0
65.0
66.0
67.0
68.0
69.0
70.0
71.0
72.0
Q3
FY14
Q4
FY14
Q1
FY15
Q2
FY15
Q3
FY15
Q4
FY15
Q1
FY16
Q2
FY16
Q3
FY16
Q4
FY16
Q1
FY17
LDR Ratio (%)
(%)
Source: BOB, Ventura Research

Quarterly Result Update
- 11 - Monday, 22
nd August, 2016
Cost to Income Ratio (%) Asset Quality under pressure Error! N ot a valid l ink.
50.0
55.0
60.0
65.0
70.0
75.0
80.0
85.0
90.0
0.0
2.0
4.0
6.0
8.0
10.0
12.0
14.0
Q3
FY14
Q4
FY14
Q1
FY15
Q2
FY15
Q3
FY15
Q4
FY15
Q1
FY16
Q2
FY16
Q3
FY16
Q4
FY16
Q1
FY17
(%)
Gross NPA Net NPA PCR (RHS)
(%)
Source: BOB, Ventura Research Source: BOB, Ventura Research
30.0
35.0
40.0
45.0
50.0
55.0
60.0
Q3 FY14 Q1 FY15 Q3 FY15 Q1 FY16 Q3 FY16 Q1 FY17
(%)
Cost to Income Ratio …
Fee Income as a % of Advances NIM, Cost of deposit & Yield on Advances
0.0
0.1
0.2
Q2 FY14
Q3 FY14
Q4 FY14
Q1 FY15
Q2 FY15
Q3 FY15
Q4 FY15
Q1 FY16
Q2 FY16
Q3 FY16
Q4 FY16
Fee Income as % of Advances
(%)
Source: BOB, Ventura Research Source: BOB, Ventura Research
0.0
2.0
4.0
6.0
8.0
10.0
12.0
Q3 FY14 Q1 FY15 Q3 FY15 Q1 FY16 Q3 FY16 Q1FY17
NIM Yield on Advance Cost of Deposits
(%)

Quarterly Result Update
- 12 - Monday, 22
nd August, 2016
1 Yr Forward PE 1 Yr Forward P/BV
0
50
100
150
200
250
Sep-03 Sep-05 Sep-07 Sep-09 Sep-11 Sep-13 Sep-15
CMP 4X 5.2X 6.4X 7.6X 8.8X
0
50
100
150
200
250
Sep-03 Sep-05 Sep-07 Sep-09 Sep-11 Sep-13 Sep-15
CMP 0.6X 0.75X 0.9X 1.05X 1.2X
Source: BOB, Ventura Research Source: BOB, Ventura Research
Net Interest Income & Growth (%) Capital Adequacy Ratio (%)
Source: BOB, Ventura Research Source: BOB, Ventura Research
-20.0
-15.0
-10.0
-5.0
0.0
5.0
10.0
15.0
20.0
25.0
30.0
0.0
500.0
1,000.0
1,500.0
2,000.0
2,500.0
3,000.0
3,500.0
4,000.0
Q2 FY14
Q4 FY14
Q2 FY15
Q4 FY15
Q2 FY16
Q4 FY16
Rs.Crore
NII
(
11.0
11.5
12.0
12.5
13.0
13.5
14.0
14.5
0.0
2.0
4.0
6.0
8.0
10.0
12.0
14.0
16.0
Q3 FY14 Q2 FY15 Q1 FY16 Q4 FY16
Tier I Capital Tier II Capital
( (

Quarterly Result Update
Adani Ports and Special Economic Zone Ltd
Strong container volume
- 13 - Monday, 22nd
August, 2016
Q1FY17 consolidated income came at Rs18.2 bn up by 6.3% YoY led by higher volumes at 42.3 mn
MT which increased at 7% YoY with stable realizations, there was no significant SEZ revenue
during the quarter. Port income reported a rise of 10% YOY at Rs16.33 bn, Port EBITDA went up by
10% Rs11.56 bn YoY as Port EBITDA margin came higher at 70.8%. The company continues its
focus on container and other cargo business as well as coastal cargo movement in its strategy to
replace lower coal volumes which is starting to gradually play out as seen by the Q1FY17 volume
growth drivers.
Net profit came at Rs8.36 bn growth of 30.8% YoY on higher operational profitability and other
income which grew by 63% YoY at Rs2.67 bn. Interest cost was Rs2.67 bn decline of 19.5% YoY.
Effective tax rate came lower at 6.6% against 9.1% in same quarter last year.
The management has highlighted that they will be targeting to reduce Loans & Advances to related
parties by as much as Rs10 bn by September, 2016. The company maintains its guidance for
consolidated volume growth of 10-15% for FY17E.
At the CMP of Rs 272, the stock is trading at 17.8x and 15.9x its FY17E and FY18E earnings,
respectively, and we recommend HOLD on the stock.
Recommendation (Rs)
CMP 272
Rating HOLD
Index Details
Sensex 28,077
Nifty 8,667
Industry Port
Scrip Details
Mkt Cap (Rs cr) 56,495
Eq Shares O/s (Cr) 207.1
Avg Vol (Lakhs) 7.0
52 Week H/L 374/169
Dividend Yield (%) 0.4
Face Value (Rs) 2.0
Latest shareholding pattern (%)
Promoters 56.7
Public 43.3
Total 100.0
Stock performance (%)
1m 3m 6m
APSEZ 23.9 58.9 30.8 Nifty 1.6 11.4 20.2

Quarterly Result Update
- 14 - Monday, 22nd
August, 2016
Description Q1FY17 Q1FY16 % Chg. Q1FY17 Q4FY16 % Chg.FY201603FY201503 % Chg.
Net Sales 1817.2 1708.9 6.3 1817.2 1859.7 -2.3 6968.8 5836.2 19.4
Other operational Income 9.4 5.9 58.5 9.4 87.5 -89.3 287.0 315.8 -9.1
Total Oper. Income(TOI) 1826.6 1714.8 6.5 1826.6 1947.2 -6.2 7255.7 6152.0 17.9
Raw Materials Cons.- - - 0.0 0.0 0.0
% to TOI -- -- 0.0 0.0 --
Stock adj. (-)Inc / (+)Dec- - - 0.0 0.0 0.0
% to TOI -- -- 0.0 0.0 --
Net Raw Mat adj. for stock 0.0 0.0 0.0 0.0 0.0 0.0 0.0 0.0 0.0
% to TOI 0.0 0.0 -- 0.0 0.0 -- 0.0 0.0 --
Other expenses 532.2 516.0 3.1 532.2 622.3 -14.5 2218.1 1940.3 14.3
% to TOI 29.1 30.1 -- 29.1 32.0 -- 32.0 32.7 --
Contribution Net_Sales 1247.1 1179.3 5.8 1247.1 1295.5 -3.7 4932.7 4139.5 19.2
Personnel 77.4 62.3 24.1 77.4 70.7 9.5 282.2 237.2 19.0
% to TOI 4.2 3.6 -- 4.2 3.6 -- 3.9 3.9 --
Total expenditure 609.5 578.4 5.4 609.5 692.9 -12.0 2500.3 2177.4 14.8
Operating Profit 1217.1 1136.4 7.1 1217.1 1254.3 -3.0 4755.5 3974.6 19.7
% to TOI 66.6 66.3 -- 66.6 64.4 -- 64.1 63.4 --
Non-Operating Income 257.1 157.6 63.2 257.1 353.2 -27.2 810.0 754.8 7.3
Interest 267.2 332.1 -19.6 267.2 278.1 -3.9 1224.2 1244.2 -1.6
Exceptional Items 47.3 19.5 142.9 47.3 29.4 60.7 104.9 72.3 45.3
Gross Profit 1159.7 942.5 23.1 1159.7 1300.0 -10.8 4236.3 3412.9 24.1
Depreciation 281.0 253.0 11.1 281.0 255.5 10.0 1079.4 911.7 18.4
PBT before Extra-ord 878.7 689.5 27.5 878.7 1044.5 -15.9 3156.9 2501.2 26.2
% to TOI 48.1 40.2 -- 48.1 53.6 -- 43.5 40.7 --
Extraordinary Items - - 0.0 0.0 0.0
PBT 878.7 689.5 27.5 878.7 1044.5 -15.9 3156.9 2501.2 26.2
Tax Rate 6.9 9.3 -25.5 6.9 13.0 -46.6 10.4 7.1 46.6
Prov. for Tax 61.0 64.2 -5.1 61.0 135.8 -55.1 326.9 176.7 85.0
% to TOI 3.3 3.8 -- 3.3 7.0 -- 4.5 2.9 --
Profit after Tax 817.8 625.2 30.8 817.8 908.7 -10.0 2829.9 2324.5 21.7
% to TOI 44.8 36.5 -- 44.8 46.7 -- 39.0 37.8 --
Minority Interest 2.4 9.0 -73.6 2.4 9.3 -74.4 42.1 -10.2 LP
PAT (adj. For MI) 835.7 638.9 30.8 835.7 914.1 -8.6 2867.4 2314.3 23.9
Face Value 2.0 2.0 -- 2.0 2.0 -- 2.0 2.0 --
Equity Share capital 414.2 414.2 -- 414.2 414.2 -- 414.2 414.0 --
EPS (Rs.) 4.0 3.0 30.8 4.0 4.4 -10.0 13.7 11.2 21.7
CEPS (Rs.) 5.3 4.2 25.1 5.3 5.6 -5.5 18.9 15.6 20.8

Quarterly Result Update
- 15 - Monday, 22nd
August, 2016
APSEZ’s Consolidated Cargo Volume Trend Cargo Volume Trend at Mundra Port
-5
0
5
10
15
20
25
30
35
0
5
10
15
20
25
30
35
40
45
Q2F
Y15
Q3F
Y15
Q4F
Y15
Q1F
Y16
Q2F
Y16
Q3F
Y16
Q4F
Y16
Q1F
Y17
Cargo Volume YoY growth (RHS)
MMT (%)
-10
-8
-6
-4
-2
0
2
4
6
8
10
23
24
25
26
27
28
29
30
31
Q2F
Y15
Q3F
Y15
Q4F
Y15
Q1F
Y16
Q2F
Y16
Q3F
Y16
Q4F
Y16
Q1F
Y17
Cargo Volume YoY growth (RHS)
MMT (%)
Source: APSEZ, Ventura Research Source: APSEZ, Ventura Research
1 Yr Forward PE 1 Yr Forward P/BV
0
100
200
300
400
500
600
Sep-09 Sep-11 Sep-13 Sep-15
CMP 22X 27.7X 33.4X 39.1X 44.8X
0
50
100
150
200
250
300
350
400
450
500
Sep-09 Sep-11 Sep-13 Sep-15
CMP 4.5X 5.3X 6.1X 6.9X 7.7X
Source: APSEZ, Ventura Research
Source: APSEZ, Ventura Research

Quarterly Result Update
- 16 - Monday, 22nd
August, 2016
1 Yr Forward EV/EBITDA
0
20000
40000
60000
80000
100000
120000
140000
160000
Sep-09 Sep-11 Sep-13 Sep-15
EV 11X 15.95X 20.9X 25.85X 30.8X
Source: APSEZ, Ventura Research

Quarterly Result Update
Hero MotoCorp Ltd.
Margins impress
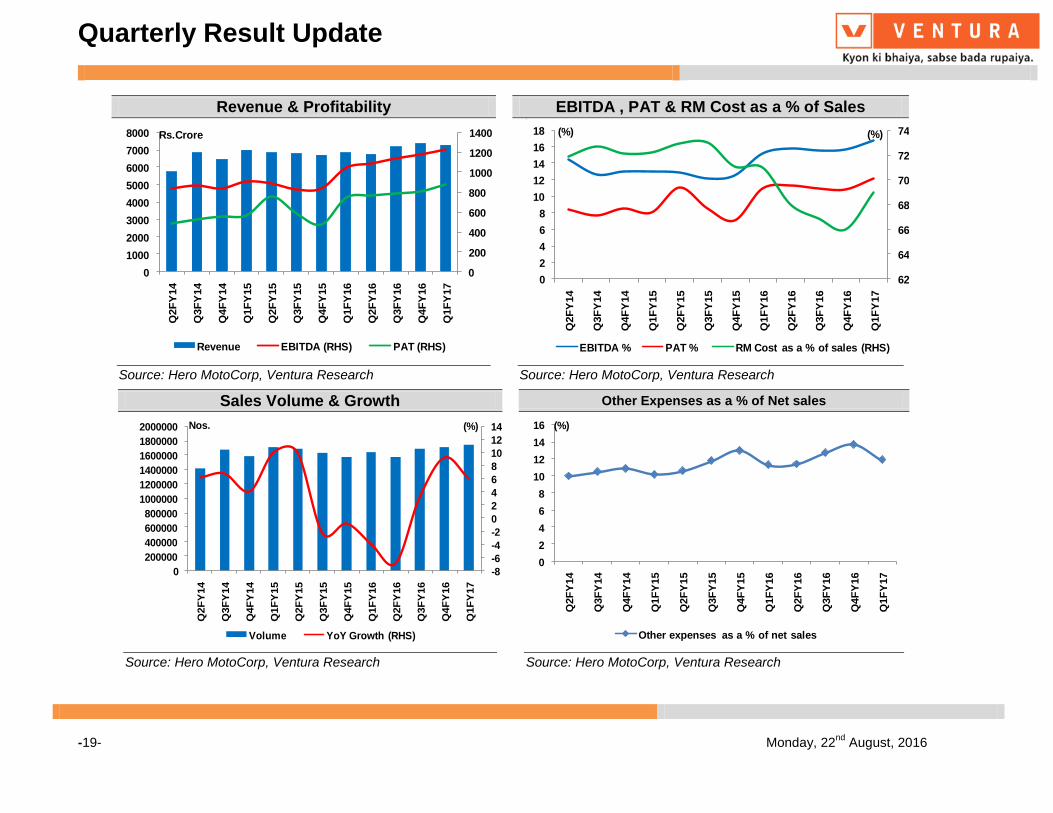
Hero Motocorp Ltd. revenue surged by 7.74% to Rs 8,010 cr from Rs 7,435Cr in the corresponding quarter of previous year, it has achieved highest ever quarterly volumes of 17.45 Lakhs units rising by 6.05% on YoY basis and 1.40% on Q-o-Q basis. Hero’s strong point is the executive segment in the motorcycle market, but this is also the category that is increasingly being cannibalized by scooters, owing to similar price points. Still, the company’s two recent Products—Maestro Edge and Duet—have helped it overtake TVS Motor Co. Ltd in the last quarter, even as it increases capacity. Despite higher cost of materials, Operating EBITDA margins increased by 150 bps to 16.6% on YoY basis which is higher than our expectation and EBITDA for the quarter stood at Rs 1,230 cr, margins improved due to reduction in other expenses and robust volume growth in scooters and motorcycles segments during the quarter. Q1 profit surged by 17.7% to Rs.883 crore on YoY. Due to control on other expenses and higher sales volumes helped Hero Motocorp to post higher profit. The growth trajectory has been the 125cc segment where the company now commands well over 50% market share which is contributed by Glamour and Super Splendor. In Q1FY17, Glamour grew by 32% and Super Splendor grew by 29% over the corresponding quarter in the previous fiscal. Recently launched the all new splendour ismart 110- the first motorcycle to have been completely designed and developed by in -house R&D team at Jaipur, and the initial response from customers have been positive. At the CMP of Rs 3370, Hero is trading at 18.3x and 15.2x its estimated earnings for FY17E and FY18E, respectively, and we recommend a HOLD on the stock.
Recommendation (Rs)
CMP 3370 Rating HOLD
Index Details
Sensex 28,077
Nifty 8,667
Industry Automobile
Scrip Details
Mkt Cap (Rs Cr) 67,276
Eq Shares O/s (Cr) 20.0
Avg Vol (Lakhs) 0.5
52 Week H/L 3556/2257
Dividend Yield (%) 1.7
Face Value (Rs) 2.0
Latest shareholding pattern (%)
Promoters 34.6 Public 65.4
Total 100.0
Stock performance (%)
1m 3m 6m
HeroMoto 4.0 16.2 24.2 Nifty 1.6 11.4 20.2
-17- Monday, 22
nd August, 2016
Quarterly Result Update
Description Q1FY17 Q1FY16 % Chg. Q1FY17 Q4FY16 % Chg. FY201603 FY201503 % Chg.
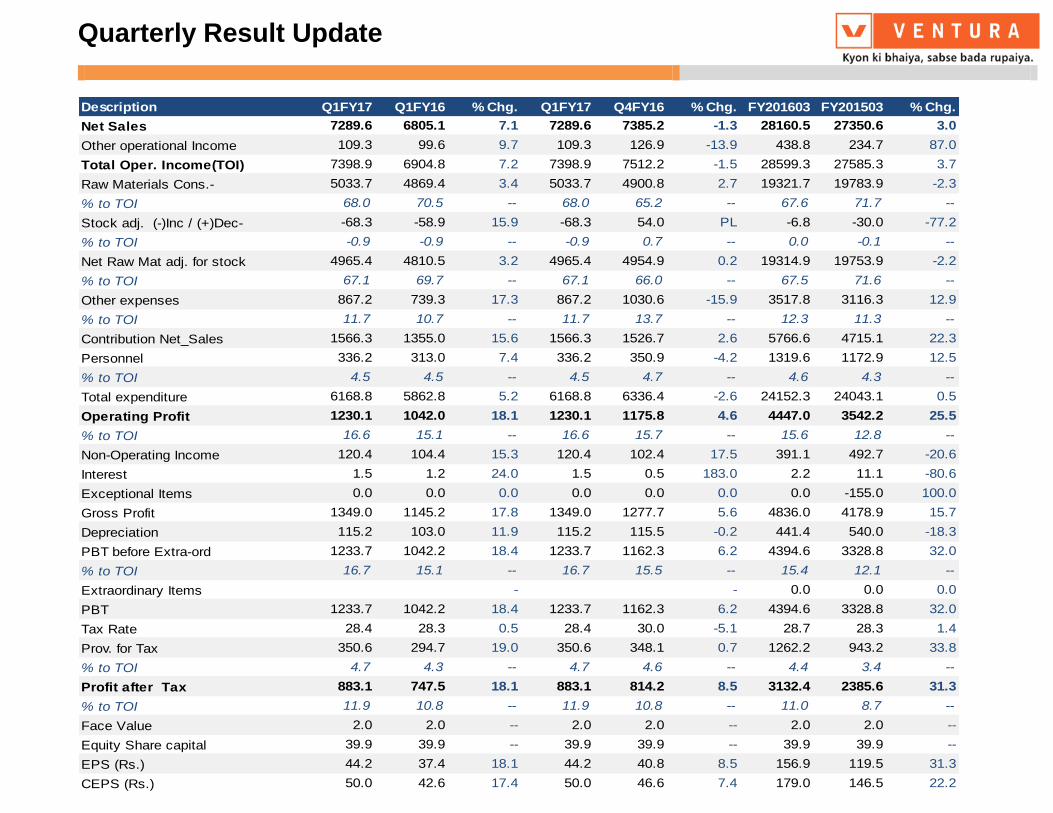
Net Sales 7289.6 6805.1 7.1 7289.6 7385.2 -1.3 28160.5 27350.6 3.0
Other operational Income 109.3 99.6 9.7 109.3 126.9 -13.9 438.8 234.7 87.0
Total Oper. Income(TOI) 7398.9 6904.8 7.2 7398.9 7512.2 -1.5 28599.3 27585.3 3.7
Raw Materials Cons.- 5033.7 4869.4 3.4 5033.7 4900.8 2.7 19321.7 19783.9 -2.3
% to TOI 68.0 70.5 -- 68.0 65.2 -- 67.6 71.7 --
Stock adj. (-)Inc / (+)Dec- -68.3 -58.9 15.9 -68.3 54.0 PL -6.8 -30.0 -77.2
% to TOI -0.9 -0.9 -- -0.9 0.7 -- 0.0 -0.1 --
Net Raw Mat adj. for stock 4965.4 4810.5 3.2 4965.4 4954.9 0.2 19314.9 19753.9 -2.2
% to TOI 67.1 69.7 -- 67.1 66.0 -- 67.5 71.6 --
Other expenses 867.2 739.3 17.3 867.2 1030.6 -15.9 3517.8 3116.3 12.9
% to TOI 11.7 10.7 -- 11.7 13.7 -- 12.3 11.3 --
Contribution Net_Sales 1566.3 1355.0 15.6 1566.3 1526.7 2.6 5766.6 4715.1 22.3
Personnel 336.2 313.0 7.4 336.2 350.9 -4.2 1319.6 1172.9 12.5
% to TOI 4.5 4.5 -- 4.5 4.7 -- 4.6 4.3 --
Total expenditure 6168.8 5862.8 5.2 6168.8 6336.4 -2.6 24152.3 24043.1 0.5
Operating Profit 1230.1 1042.0 18.1 1230.1 1175.8 4.6 4447.0 3542.2 25.5
% to TOI 16.6 15.1 -- 16.6 15.7 -- 15.6 12.8 --
Non-Operating Income 120.4 104.4 15.3 120.4 102.4 17.5 391.1 492.7 -20.6
Interest 1.5 1.2 24.0 1.5 0.5 183.0 2.2 11.1 -80.6
Exceptional Items 0.0 0.0 0.0 0.0 0.0 0.0 0.0 -155.0 100.0
Gross Profit 1349.0 1145.2 17.8 1349.0 1277.7 5.6 4836.0 4178.9 15.7
Depreciation 115.2 103.0 11.9 115.2 115.5 -0.2 441.4 540.0 -18.3
PBT before Extra-ord 1233.7 1042.2 18.4 1233.7 1162.3 6.2 4394.6 3328.8 32.0
% to TOI 16.7 15.1 -- 16.7 15.5 -- 15.4 12.1 --
Extraordinary Items - - 0.0 0.0 0.0
PBT 1233.7 1042.2 18.4 1233.7 1162.3 6.2 4394.6 3328.8 32.0
Tax Rate 28.4 28.3 0.5 28.4 30.0 -5.1 28.7 28.3 1.4
Prov. for Tax 350.6 294.7 19.0 350.6 348.1 0.7 1262.2 943.2 33.8
% to TOI 4.7 4.3 -- 4.7 4.6 -- 4.4 3.4 --
Profit after Tax 883.1 747.5 18.1 883.1 814.2 8.5 3132.4 2385.6 31.3
% to TOI 11.9 10.8 -- 11.9 10.8 -- 11.0 8.7 --
Face Value 2.0 2.0 -- 2.0 2.0 -- 2.0 2.0 --
Equity Share capital 39.9 39.9 -- 39.9 39.9 -- 39.9 39.9 --
EPS (Rs.) 44.2 37.4 18.1 44.2 40.8 8.5 156.9 119.5 31.3
CEPS (Rs.) 50.0 42.6 17.4 50.0 46.6 7.4 179.0 146.5 22.2
Quarterly Result Update
-19- Monday, 22
nd August, 2016
Revenue & Profitability EBITDA , PAT & RM Cost as a % of Sales
0
200
400
600
800
1000
1200
1400
0
1000
2000
3000
4000
5000
6000
7000
8000
Q2F
Y14
Q3F
Y14
Q4F
Y14
Q1F
Y15
Q2F
Y15
Q3F
Y15
Q4F
Y15
Q1F
Y16
Q2F
Y16
Q3F
Y16
Q4F
Y16
Q1F
Y17
Rs.Crore
Revenue EBITDA (RHS) PAT (RHS)
es
62
64
66
68
70
72
74
0
2
4
6
8
10
12
14
16
18
Q2F
Y14
Q3F
Y14
Q4F
Y14
Q1F
Y15
Q2F
Y15
Q3F
Y15
Q4F
Y15
Q1F
Y16
Q2F
Y16
Q3F
Y16
Q4F
Y16
Q1F
Y17
EBITDA % PAT % RM Cost as a % of sales (RHS)
(%) (%)
Source: Hero MotoCorp, Ventura Research
Source: Hero MotoCorp, Ventura Research
Sales Volume & Growth Other Expenses as a % of Net sales
-8
-6
-4
-2
0
2
4
6
8
10
12
14
0
200000
400000
600000
800000
1000000
1200000
1400000
1600000
1800000
2000000
Q2F
Y14
Q3F
Y14
Q4F
Y14
Q1F
Y15
Q2F
Y15
Q3F
Y15
Q4F
Y15
Q1F
Y16
Q2F
Y16
Q3F
Y16
Q4F
Y16
Q1F
Y17
Nos.
Volume YoY Growth (RHS)
(%)
0
2
4
6
8
10
12
14
16
Q2F
Y14
Q3F
Y14
Q4F
Y14
Q1F
Y15
Q2F
Y15
Q3F
Y15
Q4F
Y15
Q1F
Y16
Q2F
Y16
Q3F
Y16
Q4F
Y16
Q1F
Y17
Other expenses as a % of net sales
(%)
Source: Hero MotoCorp, Ventura Research
Source: Hero MotoCorp, Ventura Research

Quarterly Result Update
-20- Monday, 22
nd August, 2016
1 Yr Forward P/E 1 Yr Forward P/BV
0
500
1,000
1,500
2,000
2,500
3,000
3,500
4,000
4,500
Sep-09 Sep-10 Sep-11 Sep-12 Sep-13 Sep-14 Sep-15
CMP 7X 10.1X 13.2X 16.3X 19.4X
0
500
1,000
1,500
2,000
2,500
3,000
3,500
4,000
4,500
5,000
Sep-03 Sep-05 Sep-07 Sep-09 Sep-11 Sep-13 Sep-15
CMP 4X 5.45X 6.9X 8.35X 9.8X
Source: Hero MotoCorp, Ventura Research
Source: Hero MotoCorp, Ventura Research

Quarterly Result Update
Lupin Ltd.
Robust quarter
- 22 - Monday, 22nd
August, 2016
Revenues grew 40.7% YoY to Rs 4439.4 crore mainly due to 83.8% growth in US sales to Rs 2188.6
crore. Strong US sales were due to Gavis consolidation, robust sales in Metformin (anti-diabetic).
Domestic sales grew 5.2% YoY to Rs 931.3 crore. EBITDA margins improved 333 bps YoY to 29.5%
mainly on account of a strong gross margin performance. EBITDA grew 58.6% YoY to Rs 1308.0
crore. Net profit grew 55.1% YoY to Rs 882.0 crore owing to a strong operational performance
Lupin’s US business is witnessing a shift from branded to generics with a slowdown in the
branded space and emergence of generics. Post the acquisition of US based Gavis, the company
now owns one of the strongest ANDA pipeline comprising 336 filed ANDAs and 149 pending
approvals including 45 FTFs. This acquisition will strengthen its position in dermatology,
controlled substance products and other high value niche generics segments besides its maiden
foray into US institutional business.
Lupin ranks fifth in domestic formulations with a market share of 3.7%. The acute: chronic: sub-
chronic ratio for the company is at 27:37:36. In terms of MR productivity, at Rs 61.67 lakh per MR it
has one of the best MR productivity among large cap peers. Recent tie-ups with Eli Lilly and
Boehringer for anti-diabetics and with MSD for pneumonia vaccines are some of the steps to
bolster the domestic franchise.
Lupin is bearing the fruits of geographical diversification for broad based growth. It has
established a significant presence in the US by focusing on limited competition/FTF opportunities,
concentration on niche therapies such as oral contraceptives, dermatology, ophthalmology,
respiratory, etc, and acquiring small but profitable brands at the right price. It is slowly but surely
establishing itself in other geographies such as Japan and Australia. Higher growth on a fairly
consistent basis, a strong balance sheet (despite Gavis acquisition) and high return ratios are
some of the differentiators for Lupin besides management pedigree.
At the CMP of Rs 1,589 Lupin is trading at 24.6x and 21.1x its FY17E and FY18E consensus
earnings, respectively. We recommend a HOLD on the stock.
Recommendation (Rs)
CMP 1,589 Rating HOLD
Index Details
Sensex 28,077
Nifty 8,667
Industry Pharma
Scrip Details
Mkt Cap (Rs cr) 71,737
Eq Shares O/s (Cr) 45.0
Avg Vol (Lakhs) 2.27
52 Week H/L 2129/1280
Dividend Yield (%) 0.5
Face Value (Rs) 2.0
Latest shareholding pattern (%)
Promoters 46.8 Public 53.2
Total 100.0
Stock performance (%)
1m 3m 6m
Lupin -6.7 -4.7 -11.5 Nifty 1.6 11.4 20.2

Quarterly Result Update
- 23 - Monday, 22
nd August, 2016
Description Q1FY17 Q1FY16 % Chg. Q1FY17 Q4FY16 % Chg.FY201603FY201503 % Chg.
Net Sales 4313.6 3080.9 40.0 4313.6 4091.3 5.4 13701.6 12599.7 8.8
Other operational Income 125.9 75.2 67.4 125.9 89.8 40.1 506.9 170.3 197.7
Total Oper. Income(TOI) 4439.4 3156.1 40.7 4439.4 4181.2 6.2 14208.5 12770.0 11.3
Raw Materials Cons.- 772.7 689.4 12.1 772.7 671.3 15.1 2765.6 2519.4 9.8
% to TOI 17.4 21.8 -- 17.4 16.1 -- 19.5 19.7 --
Stock adj. (-)Inc / (+)Dec- -45.1 -200.9 -77.5 -45.1 -91.6 -50.7 -476.0 -145.7 226.7
% to TOI -1.0 -6.4 -- -1.0 -2.2 -- -3.4 -1.1 --
Net Raw Mat adj. for stock 727.6 488.5 49.0 727.6 579.8 25.5 2289.6 2373.7 -3.5
% to TOI 16.4 15.5 -- 16.4 13.9 -- 16.1 18.6 --
Other expenses 1697.9 1345.5 26.2 1697.9 1664.9 2.0 6057.7 5029.4 20.5
% to TOI 38.3 42.6 -- 38.3 39.8 -- 42.6 39.4 --
Contribution Net_Sales 2013.9 1322.1 52.3 2013.9 1936.5 4.0 5861.1 5366.9 9.2
Personnel 705.9 497.3 42.0 705.9 569.1 24.0 2107.7 1747.3 20.6
% to TOI 15.9 15.8 -- 15.9 13.6 -- 14.8 13.7 --
Total expenditure 3131.4 2331.2 34.3 3131.4 2813.8 11.3 10455.0 9150.4 14.3
Operating Profit 1308.0 824.8 58.6 1308.0 1367.4 -4.3 3753.5 3619.6 3.7
% to TOI 29.5 26.1 -- 29.5 32.7 -- 26.4 28.3 --
Non-Operating Income 82.6 75.7 9.2 82.6 25.4 224.9 187.7 239.8 -21.7
Interest 32.0 7.0 355.6 32.0 22.9 39.8 44.6 9.8 354.8
Exceptional Items 0.0 0.0 0.0 0.0 0.0 0.0 0.0 0.0 0.0
Gross Profit 1358.7 893.5 52.1 1358.7 1370.0 -0.8 3896.5 3849.5 1.2
Depreciation 202.7 101.4 100.0 202.7 144.6 40.2 463.5 434.7 6.6
PBT before Extra-ord 1156.0 792.1 45.9 1156.0 1225.4 -5.7 3433.0 3414.8 0.5
% to TOI 26.0 25.1 -- 26.0 29.3 -- 24.2 26.7 --
Extraordinary Items - - 0.0 0.0 0.0
PBT 1156.0 792.1 45.9 1156.0 1225.4 -5.7 3433.0 3414.8 0.5
Tax Rate 23.7 28.5 -17.0 23.7 33.7 -29.9 33.6 28.4 18.3
Prov. for Tax 273.4 225.8 21.1 273.4 413.2 -33.8 1153.6 970.4 18.9
% to TOI 6.2 7.2 -- 6.2 9.9 -- 8.1 7.6 --
Profit after Tax 882.6 566.3 55.8 882.6 812.2 8.7 2279.5 2444.4 -6.8
% to TOI 19.9 17.9 -- 19.9 19.4 -- 16.0 19.1 --
Minority Interest -0.6 0.3 PL -0.6 -5.1 -87.9 -8.8 -41.2 -78.7
PAT (adj. For MI) 882.0 568.6 55.1 882.0 807.1 9.3 2270.7 2403.2 -5.5
Face Value 2.0 2.0 -- 2.0 2.0 -- 2.0 2.0 --
Equity Share capital 90.2 90.0 -- 90.2 90.1 -- 90.1 89.9 --
EPS (Rs.) 19.6 12.6 55.5 19.6 18.0 8.5 50.6 54.4 -7.0
CEPS (Rs.) 24.07 14.84 62.19 24.07 21.23 13.38 60.87 64.05 -4.96

Quarterly Result Update
- 24 - Monday, 22
nd August, 2016
Revenue Mix- Geography wise Revenue & Profitability Trend
0
20
40
60
80
100
120
Q2
FY
14
Q3
FY
14
Q4
FY
14
Q1
FY
15
Q2
FY
15
Q3
FY
15
Q4
FY
15
Q1
FY
16
Q2
FY
16
Q3
FY
16
Q4
FY
16
Q1
FY
17
India US EuropeJapan South Arica Emerging MarketAPI
(%)
0
5
10
15
20
25
30
35
40
0
500
1,000
1,500
2,000
2,500
3,000
3,500
4,000
4,500
5,000
Q2
FY
14
Q3
FY
14
Q4
FY
14
Q1
FY
15
Q2
FY
15
Q3
FY
15
Q4
FY
15
Q1
FY
16
Q2
FY
16
Q3
FY
16
Q4
FY
16
Q1
FY
17
Rs.Crore
Revenue EBITDA Margin (RHS) PAT Margin (RHS)
(%)
Source: Lupin, Ventura Research Source: Lupin, Ventura Research
1 Yr Forward PE 1 Yr Forward P/BV
0
500
1000
1500
2000
2500
Dec-03 Dec-05 Dec-07 Dec-09 Dec-11 Dec-13 Dec-15
CMP 13X 19.5X 26X 32.5X 39X
0
500
1000
1500
2000
2500
Dec-03 Dec-05 Dec-07 Dec-09 Dec-11 Dec-13 Dec-15
CMP 4.2X 5.4X 6.6X 7.8X 9X
Source: Lupin, Ventura Research Source: Lupin, Ventura Research

Quarterly Result Update
- 25 - Monday, 22
nd August, 2016
1 Yr Forward EV/EBITDA
0
10000
20000
30000
40000
50000
60000
70000
80000
90000
100000
Dec-03 Dec-05 Dec-07 Dec-09 Dec-11 Dec-13 Dec-15
EV 10.25X 13X 15.75X 18.5X 21.25X
Source: Lupin, Ventura Research
Quarterly Result Update
Bosch Ltd.
Strong quarter…
- 26 - Monday, 22nd
August, 2016
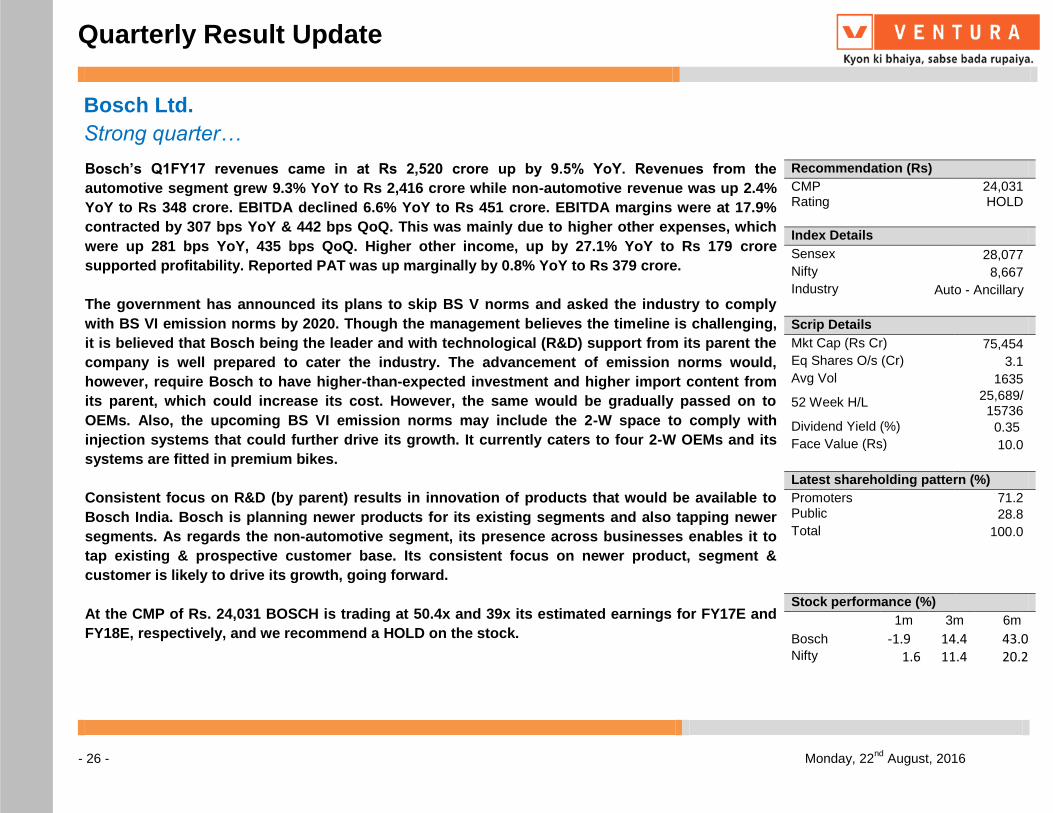
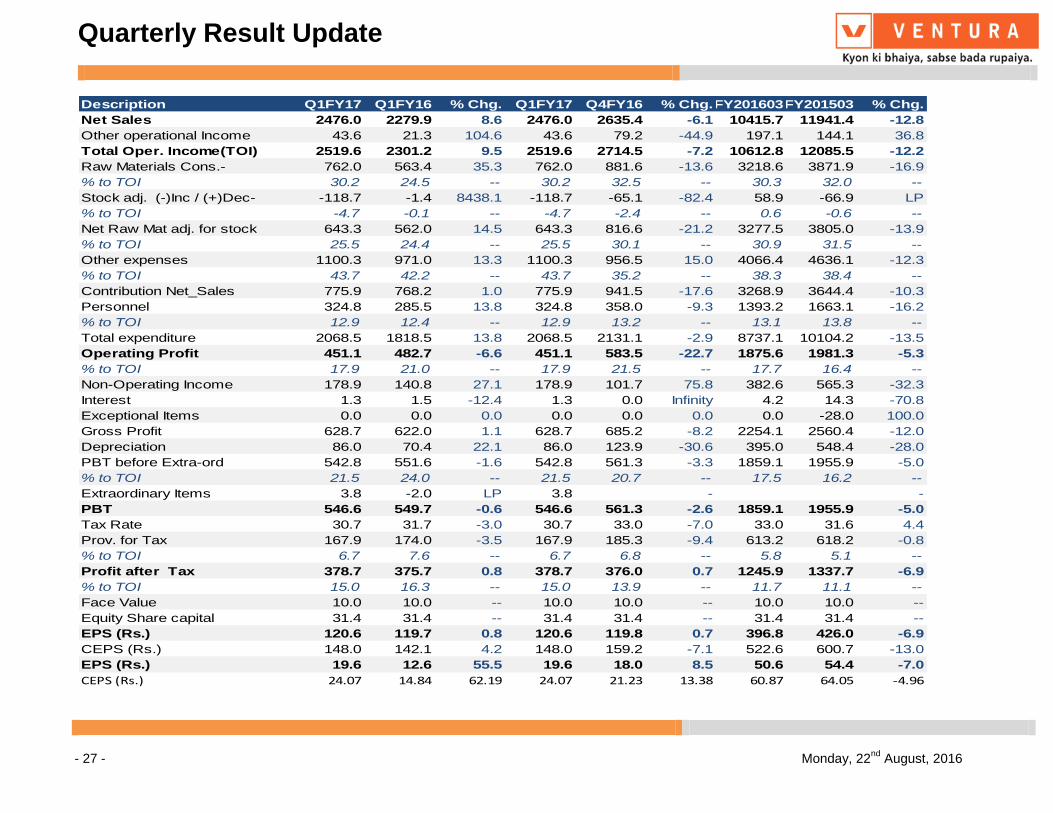
Bosch’s Q1FY17 revenues came in at Rs 2,520 crore up by 9.5% YoY. Revenues from the
automotive segment grew 9.3% YoY to Rs 2,416 crore while non-automotive revenue was up 2.4%
YoY to Rs 348 crore. EBITDA declined 6.6% YoY to Rs 451 crore. EBITDA margins were at 17.9%
contracted by 307 bps YoY & 442 bps QoQ. This was mainly due to higher other expenses, which
were up 281 bps YoY, 435 bps QoQ. Higher other income, up by 27.1% YoY to Rs 179 crore
supported profitability. Reported PAT was up marginally by 0.8% YoY to Rs 379 crore.
The government has announced its plans to skip BS V norms and asked the industry to comply
with BS VI emission norms by 2020. Though the management believes the timeline is challenging,
it is believed that Bosch being the leader and with technological (R&D) support from its parent the
company is well prepared to cater the industry. The advancement of emission norms would,
however, require Bosch to have higher-than-expected investment and higher import content from
its parent, which could increase its cost. However, the same would be gradually passed on to
OEMs. Also, the upcoming BS VI emission norms may include the 2-W space to comply with
injection systems that could further drive its growth. It currently caters to four 2-W OEMs and its
systems are fitted in premium bikes.
Consistent focus on R&D (by parent) results in innovation of products that would be available to
Bosch India. Bosch is planning newer products for its existing segments and also tapping newer
segments. As regards the non-automotive segment, its presence across businesses enables it to
tap existing & prospective customer base. Its consistent focus on newer product, segment &
customer is likely to drive its growth, going forward.
At the CMP of Rs. 24,031 BOSCH is trading at 50.4x and 39x its estimated earnings for FY17E and
FY18E, respectively, and we recommend a HOLD on the stock.
Recommendation (Rs)
CMP 24,031 Rating HOLD
Index Details
Sensex 28,077
Nifty 8,667
Industry Auto - Ancillary
Scrip Details
Mkt Cap (Rs Cr) 75,454
Eq Shares O/s (Cr) 3.1
Avg Vol 1635
52 Week H/L 25,689/ 15736
Dividend Yield (%) 0.35
Face Value (Rs) 10.0
Latest shareholding pattern (%)
Promoters 71.2 Public 28.8
Total 100.0
Stock performance (%)
1m 3m 6m
Bosch -1.9 14.4 43.0 Nifty 1.6 11.4 20.2
Quarterly Result Update
- 27 - Monday, 22
nd August, 2016
Description Q1FY17 Q1FY16 % Chg. Q1FY17 Q4FY16 % Chg.FY201603FY201503 % Chg.
Net Sales 2476.0 2279.9 8.6 2476.0 2635.4 -6.1 10415.7 11941.4 -12.8
Other operational Income 43.6 21.3 104.6 43.6 79.2 -44.9 197.1 144.1 36.8
Total Oper. Income(TOI) 2519.6 2301.2 9.5 2519.6 2714.5 -7.2 10612.8 12085.5 -12.2
Raw Materials Cons.- 762.0 563.4 35.3 762.0 881.6 -13.6 3218.6 3871.9 -16.9
% to TOI 30.2 24.5 -- 30.2 32.5 -- 30.3 32.0 --
Stock adj. (-)Inc / (+)Dec- -118.7 -1.4 8438.1 -118.7 -65.1 -82.4 58.9 -66.9 LP
% to TOI -4.7 -0.1 -- -4.7 -2.4 -- 0.6 -0.6 --
Net Raw Mat adj. for stock 643.3 562.0 14.5 643.3 816.6 -21.2 3277.5 3805.0 -13.9
% to TOI 25.5 24.4 -- 25.5 30.1 -- 30.9 31.5 --
Other expenses 1100.3 971.0 13.3 1100.3 956.5 15.0 4066.4 4636.1 -12.3
% to TOI 43.7 42.2 -- 43.7 35.2 -- 38.3 38.4 --
Contribution Net_Sales 775.9 768.2 1.0 775.9 941.5 -17.6 3268.9 3644.4 -10.3
Personnel 324.8 285.5 13.8 324.8 358.0 -9.3 1393.2 1663.1 -16.2
% to TOI 12.9 12.4 -- 12.9 13.2 -- 13.1 13.8 --
Total expenditure 2068.5 1818.5 13.8 2068.5 2131.1 -2.9 8737.1 10104.2 -13.5
Operating Profit 451.1 482.7 -6.6 451.1 583.5 -22.7 1875.6 1981.3 -5.3
% to TOI 17.9 21.0 -- 17.9 21.5 -- 17.7 16.4 --
Non-Operating Income 178.9 140.8 27.1 178.9 101.7 75.8 382.6 565.3 -32.3
Interest 1.3 1.5 -12.4 1.3 0.0 Infinity 4.2 14.3 -70.8
Exceptional Items 0.0 0.0 0.0 0.0 0.0 0.0 0.0 -28.0 100.0
Gross Profit 628.7 622.0 1.1 628.7 685.2 -8.2 2254.1 2560.4 -12.0
Depreciation 86.0 70.4 22.1 86.0 123.9 -30.6 395.0 548.4 -28.0
PBT before Extra-ord 542.8 551.6 -1.6 542.8 561.3 -3.3 1859.1 1955.9 -5.0
% to TOI 21.5 24.0 -- 21.5 20.7 -- 17.5 16.2 --
Extraordinary Items 3.8 -2.0 LP 3.8 - -
PBT 546.6 549.7 -0.6 546.6 561.3 -2.6 1859.1 1955.9 -5.0
Tax Rate 30.7 31.7 -3.0 30.7 33.0 -7.0 33.0 31.6 4.4
Prov. for Tax 167.9 174.0 -3.5 167.9 185.3 -9.4 613.2 618.2 -0.8
% to TOI 6.7 7.6 -- 6.7 6.8 -- 5.8 5.1 --
Profit after Tax 378.7 375.7 0.8 378.7 376.0 0.7 1245.9 1337.7 -6.9
% to TOI 15.0 16.3 -- 15.0 13.9 -- 11.7 11.1 --
Face Value 10.0 10.0 -- 10.0 10.0 -- 10.0 10.0 --
Equity Share capital 31.4 31.4 -- 31.4 31.4 -- 31.4 31.4 --
EPS (Rs.) 120.6 119.7 0.8 120.6 119.8 0.7 396.8 426.0 -6.9
CEPS (Rs.) 148.0 142.1 4.2 148.0 159.2 -7.1 522.6 600.7 -13.0
EPS (Rs.) 19.6 12.6 55.5 19.6 18.0 8.5 50.6 54.4 -7.0
CEPS (Rs.) 24.07 14.84 62.19 24.07 21.23 13.38 60.87 64.05 -4.96

Quarterly Result Update
- 28 - Monday, 22
nd August, 2016
Revenue Trend Profitability Trend
2,200
2,300
2,400
2,500
2,600
2,700
2,800
Q4
FY
14
Q1
FY
15
Q2
FY
15
Q3
FY
15
Q4
FY
15
Q1
FY
16
Q2
FY
16
Q3
FY
16
Q4
FY
16
Q1
FY
17
Revenue
Rs. Crore
0
5
10
15
20
25
Q4
FY
14
Q1
FY
15
Q2
FY
15
Q3
FY
15
Q4
FY
15
Q1
FY
16
Q2
FY
16
Q3
FY
16
Q4
FY
16
Q1
FY
17
EBITDA Margin PAT Margin
(%)
Source: Bosch, Ventura Research
Source: Bosch, Ventura Research
1 Yr Forward P/E 1 Yr Forward P/BV
0
5000
10000
15000
20000
25000
30000
Sep-11 Sep-12 Sep-13 Sep-14 Sep-15
CMP 20X 26.1X 32.2X 38.3X 44.4X
0
5000
10000
15000
20000
25000
30000
Sep-11 Sep-12 Sep-13 Sep-14 Sep-15
CMP 4X 4.9X 5.8X 6.7X 7.6X
Source: Bosch, Ventura Research
Source: Bosch, Ventura Research

Quarterly Result Update
- 29 - Monday, 22
nd August, 2016
1 Yr Forward EV/EBITDA
0
10,000
20,000
30,000
40,000
50,000
60,000
70,000
80,000
90,000
Sep-11 Sep-12 Sep-13 Sep-14 Sep-15
EV 12X 16.85X 21.7X 26.55X 31.4X
Source: Bosch, Ventura Research

Quarterly Result Update
Power Grid Corporation of India Ltd.
Strong quarter
- 30 - Monday, 22nd
August, 2016
Power Grid’s (PGCIL) Q1FY17 result sprung a positive surprise as net income at Rs 6069 jumped
33% YoY and 12.7% QoQ mainly aided by robust growth in income from telecom and transmission
business. EBIDTA stood at Rs 5368.8, while EBIDAT margin went up by 76 bps YoY to 88.46% and
PAT stood at Rs 2284.
PGCIL reported 33% increase in profit despite capitalising only Rs 25bn worth of projects during the
quarter (capex incurred was Rs 55.9bn). This was partly aided by healthy incentive income of Rs
770mn (Rs 1.27bn for FY16) and higher other operating income owing to interest income booked on
receiving final tariff orders from CERC. The capitalisation pace is set to pick up in ensuing quarters
as some of the larger projects get operational during the year. Management reiterated its
commissioning target of RS280-300bn higher than the planned capex outlay of RS225bn for FY17
At the CMP of Rs 182, the stock is currently trading at a P/E multiple of 12.8x and 10.8x for FY17E
and FY18E on consensus earnings estimates, respectively. We recommend a HOLD on the stock.
Recommendation (Rs)
CMP 182 Rating HOLD
Index Details
Sensex 28,077
Nifty 8,667
Industry Power
Scrip Details
Mkt Cap (Rs cr) 94,377
Eq Shares O/s (Cr) 523.1
Avg Vol (Lakhs) 3.8
52 Week H/L 183/120
Dividend Yield (%) 1.1
Face Value (Rs) 10.0
Latest shareholding pattern (%)
Promoters 57.9 Public 42.1
Total 100.0
Stock performance (%)
1m 3m 6m
Power Grid 8.7 25.7 28.3 Nifty 1.6 11.4 20.2

Quarterly Result Update
- 31 - Monday, 22nd
August, 2016
Description Q1FY17 Q1FY16 % Chg. Q1FY17 Q4FY16 % Chg.FY201603FY201503 % Chg.
Net Sales 6069.1 4689.3 29.4 6069.1 5753.6 5.5 20802.2 17177.2 21.1
Other operational Income 50.8 0.5 9307.4 50.8 6.5 686.4 0.0 0.0 0.0
Total Oper. Income(TOI) 6119.9 4689.9 30.5 6119.9 5760.1 6.3 20802.2 17177.2 21.1
Raw Materials Cons.- - - -
% to TOI -- -- --
Stock adj. (-)Inc / (+)Dec- - - -
% to TOI -- -- --
Net Raw Mat adj. for stock 0.0 0.0 0.0 0.0 0.0 0.0 0.0 0.0 0.0
% to TOI 0.0 0.0 -- 0.0 0.0 -- 0.0 0.0 --
Other expenses 428.8 321.7 33.3 428.8 399.8 7.3 1476.1 1402.3 5.3
% to TOI 7.0 6.9 -- 7.0 6.9 -- 7.1 8.2 --
Contribution Net_Sales 5691.1 4368.2 30.3 5691.1 5360.3 6.2 19326.1 15775.0 22.5
Personnel 271.4 233.6 16.2 271.4 266.5 1.9 980.5 1023.7 -4.2
% to TOI 4.4 5.0 -- 4.4 4.6 -- 4.7 6.0 --
Total expenditure 700.2 555.3 26.1 700.2 666.3 5.1 2456.7 2425.9 1.3
Operating Profit 5419.6 4134.5 31.1 5419.6 5093.8 6.4 18345.6 14751.3 24.4
% to TOI 88.6 88.2 -- 88.6 88.4 -- 88.2 85.9 --
Non-Operating Income 139.4 102.5 36.0 139.4 201.4 -30.8 479.0 602.8 -20.6
Interest 1517.8 1141.6 33.0 1517.8 1477.3 2.7 5023.0 3979.3 26.2
Exceptional Items -0.4 0.0 0.0 -0.4 0.0 #NAME? -0.1 0.0 0.0
Gross Profit 4041.7 3095.4 30.6 4041.7 3817.9 5.9 13801.6 11374.8 21.3
Depreciation 1757.3 1377.9 27.5 1757.3 1784.7 -1.5 6182.8 5085.4 21.6
PBT before Extra-ord 2283.6 1717.5 33.0 2283.6 2033.2 12.3 7618.7 6289.4 21.1
% to TOI 37.3 36.6 -- 37.3 35.3 -- 36.6 36.6 --
Extraordinary Items - - -
PBT 2283.6 1717.5 33.0 2283.6 2033.2 12.3 7618.7 6289.4 21.1
Tax Rate 21.1 21.1 0.1 21.1 21.4 -1.2 20.9 20.8 0.3
Prov. for Tax 481.9 361.9 33.2 481.9 434.1 11.0 1592.0 1310.2 21.5
% to TOI 7.9 7.7 -- 7.9 7.5 -- 7.7 7.6 --
Profit after Tax 1801.8 1355.6 32.9 1801.8 1599.1 12.7 6026.7 4979.2 21.0
% to TOI 29.4 28.9 -- 29.4 27.8 -- 29.0 29.0 --
Face Value 10.0 10.0 -- 10.0 10.0 -- 10.0 10.0 --
Equity Share capital 5231.6 5231.6 -- 5231.6 5231.6 -- 5231.6 5231.6 --
EPS (Rs.) 3.4 2.6 32.9 3.4 3.1 12.4 11.5 9.5 21.0
CEPS (Rs.) 6.8 5.2 30.2 6.8 6.5 5.1 23.3 19.2 21.3
EPS (Rs.) 19.6 12.6 55.5 19.6 18.0 8.5 50.6 54.4 -7.0
CEPS (Rs.) 24.07 14.84 62.19 24.07 21.23 13.38 60.87 64.05 -4.96

Quarterly Result Update
- 32 - Monday, 22nd
August, 2016
Transmission Revenue & Growth (%) Telecom Revenue & Growth (%)
0
5
10
15
20
25
30
35
0
1,000
2,000
3,000
4,000
5,000
6,000
7,000
Q3F
Y14
Q4F
Y14
Q1F
Y15
Q2F
Y15
Q3F
Y15
Q4F
Y15
Q1F
Y16
Q2F
Y16
Q3F
Y16
Q4F
Y16
Q1F
Y17
Rs.Crore
Transmission Y-o-Y Growth (%)
(%)
-20
-10
0
10
20
30
40
50
60
70
0
20
40
60
80
100
120
140
Q3F
Y14
Q4F
Y14
Q1F
Y15
Q2F
Y15
Q3F
Y15
Q4F
Y15
Q1F
Y16
Q2F
Y16
Q3F
Y16
Q4F
Y16
Q1F
Y17
Rs.Crore
Telecom Y-o-Y Growth (%)
(%)
Source: Power Grid Corp, Ventura Research Source: Power Grid Corp, Ventura Research
Consultancy Revenue Growth (%) Revenue Profitability Quarterly Trend
-100
-50
0
50
100
150
0
20
40
60
80
100
120
140
160
180
200
Q3F
Y14
Q4F
Y14
Q1F
Y15
Q2F
Y15
Q3F
Y15
Q4F
Y15
Q1F
Y16
Q2F
Y16
Q3F
Y16
Q4F
Y16
Q1F
Y17
Rs.Crore
Consultancy Y-o-Y Growth (%)
(%)
0
10
20
30
40
50
60
70
80
90
100
0
1000
2000
3000
4000
5000
6000
7000
Q3F
Y14
Q4F
Y14
Q1F
Y15
Q2F
Y15
Q3F
Y15
Q4F
Y15
Q1F
Y16
Q2F
Y16
Q3F
Y16
Q4F
Y16
Q1F
Y17
Rs.Crore
Revenue EBITDA (RHS) PAT (RHS)
(%)
Source: Power Grid Corp, Ventura Research Source: Power Grid Corp, Ventura Research

Quarterly Result Update
- 33 - Monday, 22nd
August, 2016
1 Yr Forward PE 1 Yr Forward P/BV
0
50
100
150
200
250
300
350
400
Dec-09 Dec-11 Dec-13 Dec-15
CMP 10X 14.5X 19X 23.5X 28X
0
50
100
150
200
250
300
Dec-09 Dec-11 Dec-13 Dec-15
CMP 1.5X 1.95X 2.4X 2.85X 3.3X
Source: Power Grid Corp, Ventura Research Source: Power Grid Corp, Ventura Research
1 Yr Forward EV/EBITDA
30000
60000
90000
120000
150000
180000
210000
240000
Dec-09 Dec-11 Dec-13 Dec-15
EV 9X 10X 11X 12X 13X
Source: Power Grid Corp, Ventura Research

Quarterly Result Update
Cipla Ltd.
One-offs impact performance
- 34 - Monday, 22nd
August, 2016
Cipla’s Q1FY17 revenues declining 7% YoY to Rs 35bn, EBITDA declined 42% to Rs 6bn on
account of higher contribution from gNexium in the corresponding quarter of the previous year as
compared to nil revenues booked from gNexium. EBITDA margins for the quarter stood at 17%.
PAT was down 44% YoY to Rs 3.7bn. Domestic formulations sales were up by a moderate 5% YoY
to Rs 14.5bn with a weak export formulations during the quarter which declined by 14% to Rs
20.5bn.
Domestic business demonstrated moderate performance of 5% YoY growth on account of NLEM
and FDC ban resulting in channel disruptions and lower off take. Key therapies of Respiratory and
Anti-Infective posted robust coupled with double digit growth witnessed in Cipla’s Derma &
Urology portfolio.
The company is awaiting approval for gSeretide MDI in UK markets, as the management has
highlighted that they have responded to all the queries raised by UK MHRA. The file is under active
review. The company has ~15% market share in inhaler space in smaller European markets which
can ramp up to 30% in next 18-24 months. Major boost will come when the company will launch in
UK where market size is around ~USD 400mn. Mylan and Sandoz are present in the market. We
believe gAdvair MDI space will be a low competition market with other players Sandoz, Orien,
Chiesi & Mylan. The company has 10 combination inhalers in pipeline targeted for US and EU
launches.
At the CMP of Rs. 557, the stock is currently trading at 25.3x and 19.4x its FY17E and FY18E
earnings. We recommend a HOLD on the stock.
Recommendation (Rs)
CMP 519 Rating HOLD
Index Details
Sensex 28,077
Nifty 8,667
Industry Pharma
Scrip Details
Mkt Cap (Rs cr) 44,801
Eq Shares O/s (Cr) 80.3
Avg Vol (Lakhs) 3.1
52 Week H/L 708/457
Dividend Yield (%) 0.4
Face Value (Rs) 2.0
Latest shareholding pattern (%)
Promoters 37.5 Public 62.5
Total 100.0
Stock performance (%)
1m 3m 6m
Cipla 9.9 8.4 6.2 Nifty 1.6 11.4 20.2

Quarterly Result Update
- 35 - Monday, 22
nd August, 2016
Description Q1FY17 Q1FY16 % Chg. Q1FY17 Q4FY16 % Chg.FY201603FY201503 % Chg.
Net Sales 3499.8 3761.0 -6.9 3499.8 3206.7 9.1 13372.5 10882.4 22.9
Other operational Income 93.9 77.5 21.3 93.9 59.9 56.8 305.8 463.0 -34.0
Total Oper. Income(TOI) 3593.7 3838.5 -6.4 3593.7 3266.5 10.0 13678.3 11345.4 20.6
Raw Materials Cons.- 929.3 1187.7 -21.8 929.3 981.0 -5.3 4178.1 3740.2 11.7
% to TOI 25.9 30.9 -- 25.9 30.0 -- 30.6 33.0 --
Stock adj. (-)Inc / (+)Dec- 179.1 -161.9 LP 179.1 141.9 26.2 63.6 -344.2 LP
% to TOI 5.0 -4.2 -- 5.0 4.3 -- 0.5 -3.0 --
Net Raw Mat adj. for stock 1108.3 1025.8 8.0 1108.3 1122.9 -1.3 4241.7 3396.0 24.9
% to TOI 30.8 26.7 -- 30.8 34.4 -- 31.0 29.9 --
Other expenses 1187.9 1141.9 4.0 1187.9 1265.5 -6.1 4488.5 3820.0 17.5
% to TOI 33.1 29.8 -- 33.1 38.7 -- 32.8 33.7 --
Contribution Net_Sales 1297.5 1670.7 -22.3 1297.5 878.1 47.8 4948.1 4129.4 19.8
Personnel 686.6 616.2 11.4 686.6 659.1 4.2 2447.1 1967.7 24.4
% to TOI 19.1 16.1 -- 19.1 20.2 -- 17.9 17.3 --
Total expenditure 2982.8 2783.9 7.1 2982.8 3047.6 -2.1 11177.2 9183.7 21.7
Operating Profit 611.0 1054.5 -42.1 611.0 219.0 179.0 2501.1 2161.7 15.7
% to TOI 17.0 27.5 -- 17.0 6.7 -- 18.3 19.1 --
Non-Operating Income 25.2 50.5 -50.1 25.2 54.7 -54.0 208.9 165.6 26.2
Interest 31.3 63.9 -50.9 31.3 36.8 -14.7 161.3 168.3 -4.1
Exceptional Items 0.0 0.0 0.0 0.0 0.0 0.0 0.0 0.0 0.0
Gross Profit 604.8 1041.2 -41.9 604.8 236.9 155.3 2548.6 2159.0 18.1
Depreciation 160.8 149.4 7.6 160.8 141.4 13.7 541.7 504.7 7.3
PBT before Extra-ord 444.0 891.7 -50.2 444.0 95.5 364.9 2007.0 1654.3 21.3
% to TOI 12.4 23.2 -- 12.4 2.9 -- 14.7 14.6 --
Extraordinary Items - - 0.0 0.0 0.0
PBT 444.0 891.7 -50.2 444.0 95.5 364.9 2007.0 1654.3 21.3
Tax Rate 16.0 27.1 -41.2 16.0 -4.1 LP 21.9 24.2 -9.4
Prov. for Tax 70.8 241.8 -70.7 70.8 -3.9 LP 439.6 400.0 9.9
% to TOI 2.0 6.3 -- 2.0 -0.1 -- 3.2 3.5 --
Profit after Tax 373.2 650.0 -42.6 373.2 99.4 275.4 1567.4 1254.2 25.0
% to TOI 10.4 16.9 -- 10.4 3.0 -- 11.5 11.1 --
Minority Interest -5.9 -0.5 1200.0 -5.9 -13.2 -55.6 -49.4 -48.2 2.7
PAT (adj. For MI) 365.2 649.2 -43.7 365.2 80.9 351.6 1505.9 1180.8 27.5
Face Value 2.0 2.0 -- 2.0 2.0 -- 2.0 2.0 --
Equity Share capital 160.7 160.6 -- 160.7 160.7 -- 160.7 160.6 --
EPS (Rs.) 4.6 8.1 -42.6 4.6 1.2 274.2 19.5 15.6 24.9
CEPS (Rs.) 6.65 9.95 -33.24 6.65 3 121.67 26.25 21.91 19.84

Quarterly Result Update
- 36 - Monday, 22
nd August, 2016
Domestic Sales improved significantly Formulations continue to contribute 90%+
0
500
1000
1500
2000
2500
Q2F
Y14
Q3F
Y14
Q4F
Y14
Q1F
Y15
Q2F
Y15
Q3F
Y15
Q4F
Y15
Q1F
Y16
Q2F
Y16
Q3F
Y16
Q4F
Y16
Q1F
Y17
Rs.Crore
India Outside India
86
88
90
92
94
96
98
100
102
Q2F
Y14
Q3F
Y14
Q4F
Y14
Q1F
Y15
Q2F
Y15
Q3F
Y15
Q4F
Y15
Q1F
Y16
Q2F
Y16
Q3F
Y16
Q4F
Y16
Q1F
Y17
Formulations APIs
(%)
Source: Cipla, Ventura Research Source: Cipla, Ventura Research
Revenues and Profitability trend (Quarterly)
0
5
10
15
20
25
30
0
500
1,000
1,500
2,000
2,500
3,000
3,500
4,000
4,500
Q2F
Y14
Q3F
Y14
Q4F
Y14
Q1F
Y15
Q2F
Y15
Q3F
Y15
Q4F
Y15
Q1F
Y16
Q2F
Y16
Q3F
Y16
Q4F
Y16
Q1F
Y17
Rs.Crore
Sales EBITDA Margin (%) PAT Margin (%)
(%)
Source: Cipla, Ventura Research

Quarterly Result Update
- 37 - Monday, 22
nd August, 2016
1 Yr Forward EV/EBITDA
0
10000
20000
30000
40000
50000
60000
70000
Sep-03 Sep-05 Sep-07 Sep-09 Sep-11 Sep-13 Sep-15
EV 12X 14.25X 16.5X 18.75X 21X
Source: Cipla, Ventura Research
1 Yr Forward P/E 1 Yr Forward P/BV
Source: Cipla, Ventura Research Source: Cipla, Ventura Research
0
100
200
300
400
500
600
700
800
Sep-03 Sep-05 Sep-07 Sep-09 Sep-11 Sep-13 Sep-15
CMP 13X 18.5X 24X 29.5X 35X
0
200
400
600
800
1000
1200
Sep-03 Sep-05 Sep-07 Sep-09 Sep-11 Sep-13 Sep-15
CMP 2.8X 3.8X 4.8X 5.8X 6.8X

Quarterly Result Update
Grasim Industries Ltd
Robust performance
- 38 - Monday, 22nd
August, 2016
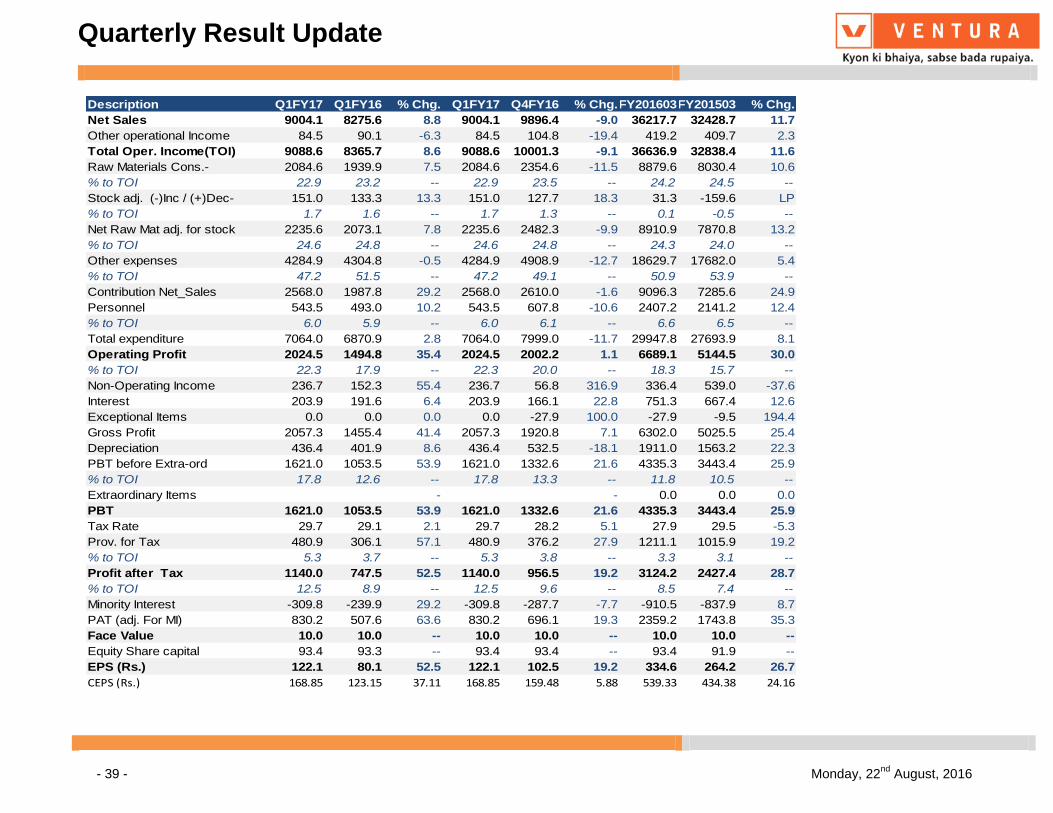
Grasim Industries’ standalone 1QFY17 EBITDA rose 90% YoY (+18% QoQ) to RS 5.1bn, driven by
near-peak utilizations, high pricing and lower energy costs. Revenues grew 25% YoY to RS 24bn,
while PAT stood at RS 3.2bn (2.5x YoY) led by better margins.
VFS revenues grew 32% YoY to RS 16.5bn, led by volume growth of 17% YoY and realizations
boost of 13% YoY, which translated into margins of 19% (v/s 11% in 1QFY16) and RoCE of high-
teens. Realizations boost was attributable to uptrend in prices and depreciation of INR. With
commendable ramp-up at the Vilayat plant, overall utilizations stood at 97%.
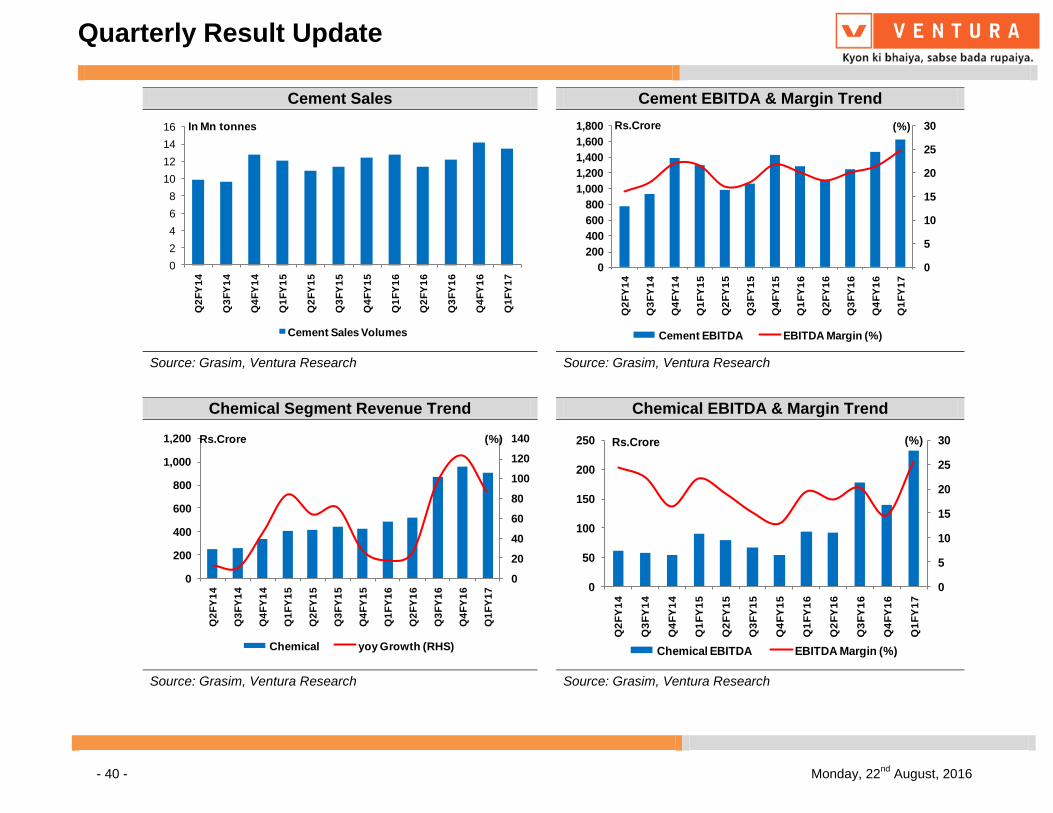
Chemicals revenues stood at Rs 9bn (+18% YoY), with utilization at 100%. Margins improved to
35% from 22% in 1QFY16, led by higher volumes.
The Cement business sales volumes stood at 13.6 mt. Revenue for the quarter stood at Rs. 6,590
crores compared to Rs. 6,432 crores in Q1FY16. EBITDA was up by 4% at Rs. 1,626 crores
At the CMP of Rs 4630, Grasim is trading at a PE multiple of 12.2x and 9.8x its estimated earnings
for FY17E and FY18E. We recommend investors to BUY.
Recommendation (Rs)
CMP 4,630 Rating BUY
Index Details
Sensex 28,077
Nifty 8.667
Industry Diversified
Scrip Details
Mkt Cap (Rs cr) 43,245
Eq Shares O/s (Cr) 9.2
Avg Vol (Lakhs) 0.4
52 Week H/L 5361/3233
Dividend Yield (%) 0.4
Face Value (Rs) 10.0
Latest shareholding pattern (%)
Promoters 31.3 Public 68.7
Total 100.0
Stock performance (%)
1m 3m 6m
Grasim -3.2 8.9 34.8 Nifty 1.6 11.4 20.2
Quarterly Result Update
- 39 - Monday, 22nd
August, 2016
Description Q1FY17 Q1FY16 % Chg. Q1FY17 Q4FY16 % Chg.FY201603FY201503 % Chg.
Net Sales 9004.1 8275.6 8.8 9004.1 9896.4 -9.0 36217.7 32428.7 11.7
Other operational Income 84.5 90.1 -6.3 84.5 104.8 -19.4 419.2 409.7 2.3
Total Oper. Income(TOI) 9088.6 8365.7 8.6 9088.6 10001.3 -9.1 36636.9 32838.4 11.6
Raw Materials Cons.- 2084.6 1939.9 7.5 2084.6 2354.6 -11.5 8879.6 8030.4 10.6
% to TOI 22.9 23.2 -- 22.9 23.5 -- 24.2 24.5 --
Stock adj. (-)Inc / (+)Dec- 151.0 133.3 13.3 151.0 127.7 18.3 31.3 -159.6 LP
% to TOI 1.7 1.6 -- 1.7 1.3 -- 0.1 -0.5 --
Net Raw Mat adj. for stock 2235.6 2073.1 7.8 2235.6 2482.3 -9.9 8910.9 7870.8 13.2
% to TOI 24.6 24.8 -- 24.6 24.8 -- 24.3 24.0 --
Other expenses 4284.9 4304.8 -0.5 4284.9 4908.9 -12.7 18629.7 17682.0 5.4
% to TOI 47.2 51.5 -- 47.2 49.1 -- 50.9 53.9 --
Contribution Net_Sales 2568.0 1987.8 29.2 2568.0 2610.0 -1.6 9096.3 7285.6 24.9
Personnel 543.5 493.0 10.2 543.5 607.8 -10.6 2407.2 2141.2 12.4
% to TOI 6.0 5.9 -- 6.0 6.1 -- 6.6 6.5 --
Total expenditure 7064.0 6870.9 2.8 7064.0 7999.0 -11.7 29947.8 27693.9 8.1
Operating Profit 2024.5 1494.8 35.4 2024.5 2002.2 1.1 6689.1 5144.5 30.0
% to TOI 22.3 17.9 -- 22.3 20.0 -- 18.3 15.7 --
Non-Operating Income 236.7 152.3 55.4 236.7 56.8 316.9 336.4 539.0 -37.6
Interest 203.9 191.6 6.4 203.9 166.1 22.8 751.3 667.4 12.6
Exceptional Items 0.0 0.0 0.0 0.0 -27.9 100.0 -27.9 -9.5 194.4
Gross Profit 2057.3 1455.4 41.4 2057.3 1920.8 7.1 6302.0 5025.5 25.4
Depreciation 436.4 401.9 8.6 436.4 532.5 -18.1 1911.0 1563.2 22.3
PBT before Extra-ord 1621.0 1053.5 53.9 1621.0 1332.6 21.6 4335.3 3443.4 25.9
% to TOI 17.8 12.6 -- 17.8 13.3 -- 11.8 10.5 --
Extraordinary Items - - 0.0 0.0 0.0
PBT 1621.0 1053.5 53.9 1621.0 1332.6 21.6 4335.3 3443.4 25.9
Tax Rate 29.7 29.1 2.1 29.7 28.2 5.1 27.9 29.5 -5.3
Prov. for Tax 480.9 306.1 57.1 480.9 376.2 27.9 1211.1 1015.9 19.2
% to TOI 5.3 3.7 -- 5.3 3.8 -- 3.3 3.1 --
Profit after Tax 1140.0 747.5 52.5 1140.0 956.5 19.2 3124.2 2427.4 28.7
% to TOI 12.5 8.9 -- 12.5 9.6 -- 8.5 7.4 --
Minority Interest -309.8 -239.9 29.2 -309.8 -287.7 -7.7 -910.5 -837.9 8.7
PAT (adj. For MI) 830.2 507.6 63.6 830.2 696.1 19.3 2359.2 1743.8 35.3
Face Value 10.0 10.0 -- 10.0 10.0 -- 10.0 10.0 --
Equity Share capital 93.4 93.3 -- 93.4 93.4 -- 93.4 91.9 --
EPS (Rs.) 122.1 80.1 52.5 122.1 102.5 19.2 334.6 264.2 26.7
CEPS (Rs.) 168.85 123.15 37.11 168.85 159.48 5.88 539.33 434.38 24.16
Quarterly Result Update
- 40 - Monday, 22nd
August, 2016
Cement Sales Cement EBITDA & Margin Trend
0
2
4
6
8
10
12
14
16
Q2
FY
14
Q3
FY
14
Q4
FY
14
Q1
FY
15
Q2
FY
15
Q3
FY
15
Q4
FY
15
Q1
FY
16
Q2
FY
16
Q3
FY
16
Q4
FY
16
Q1
FY
17
Cement Sales Volumes
In Mn tonnes
0
5
10
15
20
25
30
0
200
400
600
800
1,000
1,200
1,400
1,600
1,800
Q2
FY
14
Q3
FY
14
Q4
FY
14
Q1
FY
15
Q2
FY
15
Q3
FY
15
Q4
FY
15
Q1
FY
16
Q2
FY
16
Q3
FY
16
Q4
FY
16
Q1
FY
17
Rs.Crore
Cement EBITDA EBITDA Margin (%)
(%)
Source: Grasim, Ventura Research Source: Grasim, Ventura Research
Chemical Segment Revenue Trend Chemical EBITDA & Margin Trend
0
20
40
60
80
100
120
140
0
200
400
600
800
1,000
1,200
Q2
FY
14
Q3
FY
14
Q4
FY
14
Q1
FY
15
Q2
FY
15
Q3
FY
15
Q4
FY
15
Q1
FY
16
Q2
FY
16
Q3
FY
16
Q4
FY
16
Q1
FY
17
Rs.Crore
Chemical yoy Growth (RHS)
(%)
0
5
10
15
20
25
30
0
50
100
150
200
250
Q2
FY
14
Q3
FY
14
Q4
FY
14
Q1
FY
15
Q2
FY
15
Q3
FY
15
Q4
FY
15
Q1
FY
16
Q2
FY
16
Q3
FY
16
Q4
FY
16
Q1
FY
17
Rs.Crore
Chemical EBITDA EBITDA Margin (%)
(%)
Source: Grasim, Ventura Research Source: Grasim, Ventura Research

Quarterly Result Update
- 41 - Monday, 22nd
August, 2016
1 Yr Forward PE 1 Yr Forward P/BV
0
500
1000
1500
2000
2500
3000
3500
4000
4500
5000
Dec-03 Dec-05 Dec-07 Dec-09 Dec-11 Dec-13 Dec-15
CMP 5X 7X 9X 11X 13X
0
1000
2000
3000
4000
5000
6000
7000
Dec-03 Dec-05 Dec-07 Dec-09 Dec-11 Dec-13 Dec-15
CMP 1X 1.35X 1.7X 2.05X 2.4X
Source: Grasim, Ventura Research Source: Grasim, Ventura Research
1 Yr Forward EV/EBITDA
0
10,000
20,000
30,000
40,000
50,000
60,000
70,000
Dec-03 Dec-05 Dec-07 Dec-09 Dec-11 Dec-13 Dec-15
EV 2X 3.9X 5.8X 7.7X 9.6X
Source: Grasim, Ventura Research

Quarterly Result Update
Hindalco Industries Ltd
Aluminium volume surprises
- 42 - Monday, 22nd
August, 2016
Hindalco reported a good set of Q1FY17 numbers, revenues came in at Rs 7597.3 crore which was
down by 11.4%. Revenues from the aluminum segment grew 7.5% YoY to Rs 4263.3 crore while
revenue from the copper segment declined 27.7% YoY to Rs 3336.3 crore. The decline in copper
revenues was primarily on account of lower volumes. Copper production was lower owing to the
planned annual maintenance shutdown. EBITDA was at Rs 1132.5 crore which grew by 30.4% YoY,
while EBIDTA Margin was at 10.1%. Lower cost of raw materials, especially energy inputs aided
margin expansion during the quarter. Subsequently, reported PAT was up 381.3% YoY to Rs 294.1
crore.
As all the three projects Utkal, Aditya and Mahan are currently operating close to their peak
capacity, domestic aluminum operations have reached closer to optimum capacity utilisation
levels. Consequently CoP has witnessed a declining trend over last couple of years due to
economies of scale and decline prices of key raw materials viz coal and crude oil. However, going
forward, part of the benefit is likely to wind down with the recent firming up of crude oil prices.
Novelis reported a good set of Q1FY17 numbers. While total rolled product shipments came in at
755 KT EBITDA/tonne came in at US$363/tonne. The ensuing EBITDA was at US$274 million.
Currently, at the CMP of Rs 158, Hindalco is trading at 13.4x and 12.3x its estimated earnings for
FY17E and FY18E, respectively. We recommend HOLDING the stock.
Recommendation (Rs)
CMP 158 Rating HOLD
Index Details
Sensex 28,077
Nifty 8.667
Industry Metals
Scrip Details
Mkt Cap (Rs cr) 32,720
Eq Shares O/s (Cr) 190.3
Avg Vol (Lakhs) 15.9
52 Week H/L 159/59
Dividend Yield (%) 0.6
Face Value (Rs) 1.0
Latest shareholding pattern (%)
Promoters 37.7 Public 62.3
Total 100.0
Stock performance (%)
1m 3m 6m
Hindalco 14.9 82.0 129.3 Nifty 1.6 11.4 20.2

Quarterly Result Update
- 43 - Monday, 22
nd August, 2016
Description Q1FY17 Q1FY16 % Chg. Q1FY17 Q4FY16 % Chg. FY201603 FY201503 % Chg.
Net Sales 7501.4 8517.3 -11.9 7501.4 8542.7 -12.2 33922.0 34094.4 -0.5
Other operational Income 96.0 58.0 65.5 96.0 124.9 -23.2 395.6 430.6 -8.1
Total Oper. Income(TOI) 7597.3 8575.3 -11.4 7597.3 8667.5 -12.4 34317.7 34525.0 -0.6
Raw Materials Cons.- 3973.2 5230.9 -24.0 3973.2 4522.4 -12.1 19209.5 21056.3 -8.8
% to TOI 52.3 61.0 -- 52.3 52.2 -- 56.0 61.0 --
Stock adj. (-)Inc / (+)Dec- -408.9 -342.1 19.5 -408.9 160.4 PL 191.7 67.8 182.7
% to TOI -5.4 -4.0 -- -5.4 1.9 -- 0.6 0.2 --
Net Raw Mat adj. for stock 3564.3 4888.8 -27.1 3564.3 4682.8 -23.9 19401.2 21124.1 -8.2
% to TOI 46.9 57.0 -- 46.9 54.0 -- 56.5 61.2 --
Other expenses 2492.9 2439.5 2.2 2492.9 2388.0 4.4 9900.3 8394.9 17.9
% to TOI 32.8 28.5 -- 32.8 27.6 -- 28.9 24.3 --
Contribution Net_Sales 1540.2 1246.9 23.5 1540.2 1596.7 -3.5 5016.2 5006.0 0.2
Personnel 407.7 378.5 7.7 407.7 430.3 -5.3 1698.1 1589.5 6.8
% to TOI 5.4 4.4 -- 5.4 5.0 -- 5.0 4.6 --
Total expenditure 6464.8 7706.8 -16.1 6464.8 7501.1 -13.8 30999.5 31108.5 -0.4
Operating Profit 1132.5 868.5 30.4 1132.5 1166.4 -2.9 3318.2 3416.5 -2.9
% to TOI 14.9 10.1 -- 14.9 13.5 -- 9.7 9.9 --
Non-Operating Income 218.4 136.2 60.3 218.4 204.1 7.0 1066.2 882.2 20.9
Interest 599.6 604.0 -0.7 599.6 574.7 4.3 2374.8 1637.1 45.1
Exceptional Items 0.0 0.0 0.0 0.0 0.0 0.0 0.0 -577.7 100.0
Gross Profit 751.4 400.7 87.5 751.4 795.9 -5.6 2009.6 3239.3 -38.0
Depreciation 338.2 330.7 2.3 338.2 341.2 -0.9 1277.0 837.0 52.6
PBT before Extra-ord 413.1 70.0 490.1 413.1 454.7 -9.1 732.6 1246.9 -41.3
% to TOI 5.4 0.8 -- 5.4 5.3 -- 2.1 3.6 --
Extraordinary Items - - -
PBT 413.1 70.0 490.1 413.1 454.7 -9.1 732.6 1246.9 -41.3
Tax Rate 28.8 12.3 133.7 28.8 21.6 33.0 17.1 25.8 -33.7
Prov. for Tax 118.9 8.6 1279.0 118.9 98.3 20.9 125.4 321.8 -61.0
% to TOI 1.6 0.1 -- 1.6 1.1 -- 0.4 0.9 --
Profit after Tax 294.3 61.4 379.4 294.3 356.3 -17.4 607.3 925.2 -34.4
% to TOI 3.9 0.7 -- 3.9 4.1 -- 1.8 2.7 --
Face Value 1.0 1.0 -- 1.0 1.0 -- 1.0 1.0 --
Equity Share capital 204.9 204.9 -- 204.9 206.5 -- 206.5 206.5 --
EPS (Rs.) 1.4 0.3 379.4 1.4 1.7 -16.8 2.9 4.5 -34.4
CEPS (Rs.) 3.1 1.9 61.3 3.1 3.4 -8.6 9.1 8.5 6.9
EPS (Rs.) 122.1 80.1 52.5 122.1 102.5 19.2 334.6 264.2 26.7
CEPS (Rs.) 168.85 123.15 37.11 168.85 159.48 5.88 539.33 434.38 24.16

Quarterly Result Update
- 44 - Monday, 22
nd August, 2016
Aluminum Revenue Trend Aluminum EBIT & Margin Trend
0.0
5.0
10.0
15.0
20.0
25.0
30.0
35.0
40.0
45.0
50.0
0
500
1,000
1,500
2,000
2,500
3,000
3,500
4,000
4,500
5,000
Q3F
Y14
Q4F
Y14
Q1F
Y15
Q2F
Y15
Q3F
Y15
Q4F
Y15
Q1F
Y16
Q2F
Y16
Q3F
Y16
Q4F
Y16
Q1F
Y17
Rs.Crore
Aluminium yoy Growth (%)
(%)
0.0
5.0
10.0
15.0
20.0
25.0
0
100
200
300
400
500
600
700
800
900
1000
Q3F
Y14
Q4F
Y14
Q1F
Y15
Q2F
Y15
Q3F
Y15
Q4F
Y15
Q1F
Y16
Q2F
Y16
Q3F
Y16
Q4F
Y16
Q1F
Y17
Rs.Crore
Aluminium EBIT EBIT Margin (%)
(%)
Source: Hindalco, Ventura Research Source: Hindalco, Ventura Research
Copper Revenue Trend Copper EBIT & Margin Trend
-40.0
-30.0
-20.0
-10.0
0.0
10.0
20.0
30.0
40.0
50.0
0
1,000
2,000
3,000
4,000
5,000
6,000
Q3F
Y14
Q4F
Y14
Q1F
Y15
Q2F
Y15
Q3F
Y15
Q4F
Y15
Q1F
Y16
Q2F
Y16
Q3F
Y16
Q4F
Y16
Q1F
Y17
Rs.Crore
Copper yoy Growth (%)
(%)
0.0
2.0
4.0
6.0
8.0
10.0
12.0
0
50
100
150
200
250
300
350
400
450
Q3F
Y14
Q4F
Y14
Q1F
Y15
Q2F
Y15
Q3F
Y15
Q4F
Y15
Q1F
Y16
Q2F
Y16
Q3F
Y16
Q4F
Y16
Q1F
Y17
Rs.Crore
Copper EBIT EBIT Margin (%)
(%)
Source: Hindalco, Ventura Research Source: Hindalco, Ventura Research

Quarterly Result Update
- 45 - Monday, 22
nd August, 2016
1 Yr Forward PE 1 Yr Forward P/BV
0
50
100
150
200
250
300
350
Sep-03 Sep-05 Sep-07 Sep-09 Sep-11 Sep-13 Sep-15
CMP 6X 8X 10X 12X 14X
0
50
100
150
200
250
300
350
Sep-03 Sep-05 Sep-07 Sep-09 Sep-11 Sep-13 Sep-15
CMP 0.6X 0.85X 1.1X 1.35X 1.6X
Source: Hindalco, Ventura Research Source: Hindalco, Ventura Research
1 Yr Forward EV/EBITDA
0
20000
40000
60000
80000
100000
120000
Sep-03 Sep-05 Sep-07 Sep-09 Sep-11 Sep-13 Sep-15
EV 3X 4.5X 6X 7.5X 9.5X
Source: Hindalco, Ventura Research

Quarterly Result Update
Sun Pharmaceutical Industries Ltd.
Recovery on track
- 46 - Monday, 22nd
August, 2016
In Q3FY16, revenues increased by 2.2% YoY to Rs. 7,082.1 crores, on the back of better performance in Taro, domestic, EM and ROW formulations. Over the same period, EBITDA margins declined by 60 bps YoY to 30.6%. EBITDA in absolute terms remained flat YoY at Rs. 2,169.1 crores. Other operating income stood at Rs. 35.5 crores in Q3FY16 compared to Rs. 46.9 crores in Q3FY15. PAT for the quarter stood at Rs. 1,416.6 crores compared to Rs. 395.3 crores in Q3FY15, due to lower tax rate. Domestic branded formulations grew by 8.3% YoY to Rs. 1,890 crores and accounted for 27% of
total sales. Withdrawal of bonus offers continues to adversely impact sales in the acute segment.
US revenue was down by 11% YoY to US$ 486 mn due to competitive pressure on some products
and temporary supply constraints arising from remediation efforts at the Halol facility. Taro
recently posted Q3FY16 sales of $ 258.3 mn, up by 8.7% from the corresponding quarter last year.
Taro’s net profit for Q3FY16 was $ 189 mn, up by 33% YoY.
Sales revenue in emerging markets stood at US$ 151 mn, down 7% YoY and accounted for 14% of
total sales. The decline is the result of volatile currency movements in certain emerging markets
and a strategic decision of not participating in low margin businesses. ROW sales reported de-
growth of 6% YoY, led by a conscious effort to reduce the participation in non-remunerative
businesses. API sales rose by 78% YoY to Rs. 441 crores. Q3FY16 reflects the first full quarter
consolidation of the opiates business in Australia which has partly boosted revenue growth.
The company has a comprehensive product offering in the US market with approved ANDAs for 435 products while filings for 156 products await US FDA approval, including 10 tentative approvals. For the quarter, 5 ANDAs were filed and 1 approval was received. R&D expenses stood at Rs. 583 crores (8.3% of sales) compared to Rs. 515 crores (7.5% of sales) for Q3FY15. This increased R&D expenditure includes significant investments on account of funding the clinical development of Tildrakizumab, the IL-23 monoclonal anti-body inlicensed from MSD (US).
At the CMP of Rs. 871, Sun Pharma is trading at 38.5x and 26.1x its estimated earnings for FY17E
and FY18E, respectively. We recommend a HOLD.
Recommendation (Rs)
CMP 782 Rating HOLD
Index Details
Sensex 23,154
Nifty 7,029
Industry Pharma
Scrip Details
Mkt Cap (Rs cr) 188,376
Eq Shares O/s (Cr) 240.7
Avg Vol (Lakhs) 5.1
52 Week H/L 966/704
Dividend Yield (%) 0.4
Face Value (Rs) 1.0
Latest shareholding pattern (%)
Promoters 55.0 Public 45.0
Total 100.0
Stock performance (%)
1m 3m 6m
Sun Pharma 0.1 -1.2 -9.4 Nifty 1.6 11.4 20.2

Quarterly Result Update
- 47 - Monday, 22
nd August, 2016
Description Q1FY17 Q1FY16 % Chg. Q1FY17 Q4FY16 % Chg.FY201603FY201503 % Chg.
Net Sales 8006.7 6526.9 22.7 8006.7 7413.9 8.0 27744.2 27245.1 1.8
Other operational Income 236.3 234.6 0.7 236.3 220.3 7.3 525.6 146.9 257.7
Total Oper. Income(TOI) 8243.0 6761.5 21.9 8243.0 7634.2 8.0 28269.7 27392.0 3.2
Raw Materials Cons.- 1129.1 1024.6 10.2 1129.1 955.5 18.2 4388.1 4158.7 5.5
% to TOI 13.7 15.2 -- 13.7 12.5 -- 15.5 15.2 --
Stock adj. (-)Inc / (+)Dec- -94.4 38.2 PL -94.4 -130.5 -27.7 -447.9 114.5 PL
% to TOI -1.1 0.6 -- -1.1 -1.7 -- -1.6 0.4 --
Net Raw Mat adj. for stock 1034.8 1062.8 -2.6 1034.8 825.1 25.4 3940.3 4273.2 -7.8
% to TOI 12.6 15.7 -- 12.6 10.8 -- 13.9 15.6 --
Other expenses 3048.0 2695.7 13.1 3048.0 3107.6 -1.9 11050.7 10652.7 3.7
% to TOI 37.0 39.9 -- 37.0 40.7 -- 39.1 38.9 --
Contribution Net_Sales 4160.3 3003.1 38.5 4160.3 3666.5 13.5 13278.8 12466.2 6.5
Personnel 1239.3 1235.2 0.3 1239.3 1181.2 4.9 4797.1 4502.6 6.5
% to TOI 15.0 18.3 -- 15.0 15.5 -- 17.0 16.4 --
Total expenditure 5322.0 4993.7 6.6 5322.0 5113.9 4.1 19788.1 19428.5 1.9
Operating Profit 2921.0 1767.8 65.2 2921.0 2520.3 15.9 8481.6 7963.5 6.5
% to TOI 35.4 26.2 -- 35.4 33.0 -- 30.0 29.1 --
Non-Operating Income 157.1 164.1 -4.3 157.1 - 459.2 450.8 1.9
Interest 134.6 134.5 0.1 134.6 88.6 52.0 476.9 579.0 -17.6
Exceptional Items 0.0 -685.2 100.0 0.0 35.0 -100.0 -685.2 -237.8 188.2
Gross Profit 2943.5 2482.6 18.6 2943.5 2396.8 22.8 9149.1 8073.1 13.3
Depreciation 316.0 240.2 31.5 316.0 264.3 19.5 1013.5 1194.7 -15.2
PBT before Extra-ord 2627.5 872.1 201.3 2627.5 2132.5 23.2 6765.3 6402.9 5.7
% to TOI 31.9 12.9 -- 31.9 27.9 -- 23.9 23.4 --
Extraordinary Items - - 0.0 0.0 0.0
PBT 2627.5 872.1 201.3 2627.5 2132.5 23.2 6765.3 6402.9 5.7
Tax Rate 13.4 12.9 3.8 13.4 8.0 67.8 13.8 14.3 -3.3
Prov. for Tax 352.7 112.8 212.8 352.7 170.6 106.8 934.9 914.7 2.2
% to TOI 4.3 1.7 -- 4.3 2.2 -- 3.3 3.3 --
Profit after Tax 2274.8 759.3 199.6 2274.8 1961.9 16.0 5830.4 5488.2 6.2
% to TOI 27.6 11.2 -- 27.6 25.7 -- 20.6 20.0 --
Minority Interest -234.0 -200.7 16.6 -234.0 -246.7 -5.1 -1112.6 -936.3 18.8
PAT (adj. For MI) 2033.7 555.9 265.8 2033.7 1713.7 18.7 4715.9 4539.4 3.9
Face Value 1.0 1.0 -- 1.0 1.0 -- 1.0 1.0 --
Equity Share capital 240.7 240.6 -- 240.7 240.7 -- 240.7 207.1 --
EPS (Rs.) 9.5 3.2 199.5 9.5 8.2 16.0 24.2 26.5 -8.6
CEPS (Rs.) 10.76 4.15 159.14 10.76 9.25 16.32 28.44 32.27 -11.86

Quarterly Result Update
- 48 - Monday, 22
nd August, 2016
Taro Performance API Business Trend
0
10
20
30
40
50
60
70
80
0
50
100
150
200
250
300
Q3F
Y14
Q4F
Y14
Q1F
Y15
Q2F
Y15
Q3F
Y15
Q4F
Y15
Q1F
Y16
Q2F
Y16
Q3F
Y16
Q4F
Y16
Q1F
Y17
$ mn
Sales PAT % (RHS)
(%)
0
20
40
60
80
100
120
Q3F
Y14
Q4F
Y14
Q1F
Y15
Q2F
Y15
Q3F
Y15
Q4F
Y15
Q1F
Y16
Q2F
Y16
Q3F
Y16
Q4F
Y16
Q1F
Y17
India US RoW API
(%)
Source: Sun Pharma, Ventura Research Source: Sun Pharma, Ventura Research
1 Yr Forward P/E 1 Yr Forward P/BV
0
200
400
600
800
1000
1200
1400
Sep-03 Sep-05 Sep-07 Sep-09 Sep-11 Sep-13 Sep-15
CMP 10X 16.85X 23.7X 30.55X 37.4X
0
200
400
600
800
1,000
1,200
1,400
Sep-03 Sep-05 Sep-07 Sep-09 Sep-11 Sep-13 Sep-15
CMP 2X 4X 6X 8X 10X
Source: Sun Pharma, Ventura Research Source: Sun Pharma, Ventura Research

Quarterly Result Update
- 49 - Monday, 22
nd August, 2016
1 Yr Forward EV/EBITDA
0
50000
100000
150000
200000
250000
300000
Sep-03 Sep-05 Sep-07 Sep-09 Sep-11 Sep-13 Sep-15
EV 12X 15.8X 19.6X 23.4X 27.2X
Source: Sun Pharma, Ventura Research
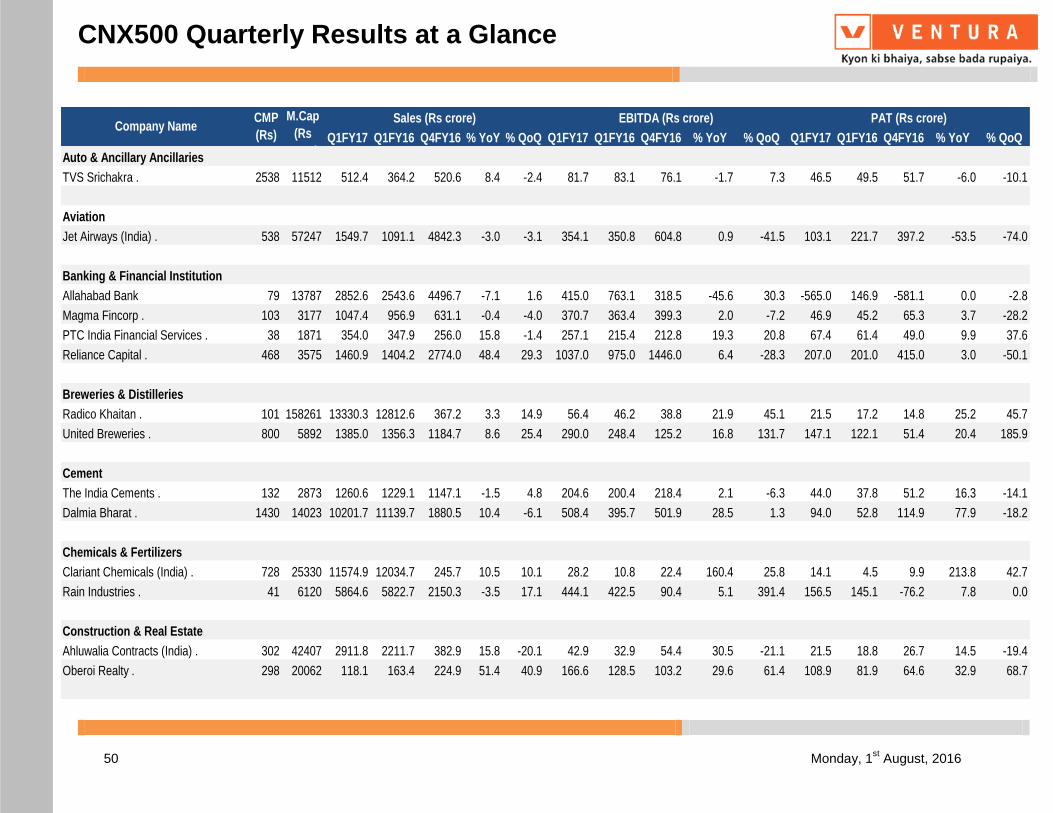
CNX500 Quarterly Results at a Glance
50 Monday, 1st August, 2016
Q1FY17 Q1FY16 Q4FY16 % YoY % QoQ Q1FY17 Q1FY16 Q4FY16 % YoY % QoQ Q1FY17 Q1FY16 Q4FY16 % YoY % QoQ
Auto & Ancillary Ancillaries
TVS Srichakra . 2538 11512 512.4 364.2 520.6 8.4 -2.4 81.7 83.1 76.1 -1.7 7.3 46.5 49.5 51.7 -6.0 -10.1
Aviation
Jet Airways (India) . 538 57247 1549.7 1091.1 4842.3 -3.0 -3.1 354.1 350.8 604.8 0.9 -41.5 103.1 221.7 397.2 -53.5 -74.0
Banking & Financial Institution
Allahabad Bank 79 13787 2852.6 2543.6 4496.7 -7.1 1.6 415.0 763.1 318.5 -45.6 30.3 -565.0 146.9 -581.1 0.0 -2.8
Magma Fincorp . 103 3177 1047.4 956.9 631.1 -0.4 -4.0 370.7 363.4 399.3 2.0 -7.2 46.9 45.2 65.3 3.7 -28.2
PTC India Financial Services . 38 1871 354.0 347.9 256.0 15.8 -1.4 257.1 215.4 212.8 19.3 20.8 67.4 61.4 49.0 9.9 37.6
Reliance Capital . 468 3575 1460.9 1404.2 2774.0 48.4 29.3 1037.0 975.0 1446.0 6.4 -28.3 207.0 201.0 415.0 3.0 -50.1
Breweries & Distilleries
Radico Khaitan . 101 158261 13330.3 12812.6 367.2 3.3 14.9 56.4 46.2 38.8 21.9 45.1 21.5 17.2 14.8 25.2 45.7
United Breweries . 800 5892 1385.0 1356.3 1184.7 8.6 25.4 290.0 248.4 125.2 16.8 131.7 147.1 122.1 51.4 20.4 185.9
Cement
The India Cements . 132 2873 1260.6 1229.1 1147.1 -1.5 4.8 204.6 200.4 218.4 2.1 -6.3 44.0 37.8 51.2 16.3 -14.1
Dalmia Bharat . 1430 14023 10201.7 11139.7 1880.5 10.4 -6.1 508.4 395.7 501.9 28.5 1.3 94.0 52.8 114.9 77.9 -18.2
Chemicals & Fertilizers
Clariant Chemicals (India) . 728 25330 11574.9 12034.7 245.7 10.5 10.1 28.2 10.8 22.4 160.4 25.8 14.1 4.5 9.9 213.8 42.7
Rain Industries . 41 6120 5864.6 5822.7 2150.3 -3.5 17.1 444.1 422.5 90.4 5.1 391.4 156.5 145.1 -76.2 7.8 0.0
Construction & Real Estate
Ahluwalia Contracts (India) . 302 42407 2911.8 2211.7 382.9 15.8 -20.1 42.9 32.9 54.4 30.5 -21.1 21.5 18.8 26.7 14.5 -19.4
Oberoi Realty . 298 20062 118.1 163.4 224.9 51.4 40.9 166.6 128.5 103.2 29.6 61.4 108.9 81.9 64.6 32.9 68.7
PAT (Rs crore)Company Name
CMP
(Rs)
M.Cap
(Rs
crore)
Sales (Rs crore) EBITDA (Rs crore)

CNX500 Quarterly Results at a Glance
- 51 - Monday, 1st August, 2016
Q1FY17 Q1FY16 Q4FY16 % YoY % QoQ Q1FY17 Q1FY16 Q4FY16 % YoY % QoQ Q1FY17 Q1FY16 Q4FY16 % YoY % QoQ
Consumer Durables
Videocon Industries . 104 55614 2165.9 1571.6 2768.1 -10.2 0.9 286.9 594.2 253.3 -51.7 13.3 -286.6 10.6 -189.6 0.0 51.2
Consumer Food
Avanti Feeds . 585 17068 1107.9 986.7 463.7 25.4 61.6 76.4 64.2 47.2 19.0 61.7 50.0 45.4 31.2 10.2 60.2
Engineering
AIA Engineering . 1271 8586 2354.3 2190.3 580.8 -9.5 -16.6 147.0 148.3 171.3 -0.9 -14.2 109.0 110.2 134.6 -1.1 -19.0
Ramkrishna Forgings . 415 12716 1271.2 1125.6 215.4 -7.8 -1.8 41.8 49.0 42.9 -14.7 -2.7 6.2 17.7 11.1 -64.8 -43.9
Glass
La Opala RG . 582 12661 1053.5 912.9 53.2 -1.4 -5.4 18.1 15.0 20.5 20.6 -11.8 10.9 9.2 14.2 18.3 -23.4
IT & ITeS
Oracle Financial Services Software . 3661 27978 2685.4 2351.8 1013.0 12.3 16.2 475.2 426.8 363.6 11.3 30.7 346.2 280.4 224.4 23.5 54.3
Media
Sun TV Network . 482 7924 1026.6 905.8 570.7 10.4 33.3 436.4 406.9 426.6 7.2 2.3 233.1 195.8 218.0 19.0 6.9
Miscellaneous
Just Dial . 477 36786 2027.3 1848.7 179.6 6.2 -1.8 29.3 45.2 45.0 -35.3 -35.0 38.9 36.1 35.3 8.0 10.2
Oil & Gas
NMDC . 109 7142 2001.3 2152.1 1529.9 -4.7 12.5 816.4 1101.9 539.8 -25.9 51.2 711.3 1015.4 552.9 -29.9 28.6
Paints
Akzo Nobel India . 1629 2931 1082.1 1137.3 662.5 9.2 4.3 97.7 73.9 85.9 32.2 13.8 64.3 46.8 52.6 37.5 22.2
PAT (Rs crore)Company Name
CMP
(Rs)
M.Cap
(Rs
crore)
Sales (Rs crore) EBITDA (Rs crore)

CNX500 Quarterly Results at a Glance
- 52 - Monday, 1st August, 2016
Q1FY17 Q1FY16 Q4FY16 % YoY % QoQ Q1FY17 Q1FY16 Q4FY16 % YoY % QoQ Q1FY17 Q1FY16 Q4FY16 % YoY % QoQ
Pharmaceuticals & Drugs
Aarti Drugs . 491 10285 631.7 551.6 314.0 2.9 -7.2 48.1 44.2 45.8 8.8 5.2 19.9 17.4 18.6 14.7 7.3
Divis Laboratories . 1304 26132 3452.0 3205.7 1093.4 24.7 -8.0 403.8 301.8 397.9 33.8 1.5 301.8 245.2 322.2 23.1 -6.3
FDC . 189 1878 88.9 175.0 238.9 -0.9 6.4 68.1 62.7 57.3 8.6 18.8 49.0 47.3 38.2 3.6 28.0
Marksans Pharma . 41 1827 899.3 884.7 210.2 -11.1 -11.2 8.3 52.4 10.8 -84.2 -23.2 1.0 31.5 -5.8 -96.7 0.0
Strides Shasun . 987 3687 1763.0 1858.6 961.2 44.6 -12.1 133.1 71.7 189.6 85.7 -29.8 26.0 10.6 96.2 145.2 -72.9
Wockhardt . 797 3836 309.4 285.8 1013.4 -6.6 5.0 75.3 165.4 68.8 -54.5 9.5 15.9 91.6 42.9 -82.7 -63.0
Plastic Products
Astral Poly Technik . 478 2543 411.4 391.5 532.0 16.7 -21.0 50.9 46.5 65.1 9.6 -21.8 26.6 24.5 42.4 8.7 -37.2
Jain Irrigation Systems . 81 38592 1561.9 1462.2 1989.0 3.2 -18.1 233.3 200.1 287.6 16.6 -18.9 58.5 14.5 89.8 302.8 -34.8
Uflex . 234 8435 152.2 110.5 1440.6 -4.5 2.8 218.7 214.9 190.5 1.8 14.8 86.2 77.2 80.2 11.6 7.4
Power Generation & Distribution
NHPC . 27 1239 289.4 295.4 1585.6 9.4 36.6 1356.5 1258.0 581.3 7.8 133.4 857.8 798.2 104.1 7.5 724.2
Kalpataru Power Transmission . 256 3467 1695.3 1455.4 1367.8 -0.3 -14.1 130.8 115.0 144.3 13.7 -9.3 64.5 43.0 72.0 50.0 -10.3
Shipping
Shipping Corporation Of India . 71 11733 1184.6 1270.3 981.2 -23.2 -15.9 194.3 357.4 134.5 -45.6 44.5 55.9 203.8 -7.2 -72.6 0.0
Textile
Swan Energy . 64 3121 414.9 379.7 76.9 -3.2 -9.5 4.5 3.8 5.7 16.4 -20.9 -1.9 0.1 0.2 0.0 0.0
Trading
Future Consumer Enterprise . 21 14078 621.4 616.9 424.7 35.6 9.0 0.8 -9.7 -0.8 0.0 0.0 -20.7 -29.1 -25.8 -28.6 -19.7
Company NameCMP
(Rs)
M.Cap
(Rs
crore)
Sales (Rs crore) EBITDA (Rs crore) PAT (Rs crore)
CNX500 Quarterly Results at a Glance
- 53 - Monday, 1st August, 2016
Disclosures and Disclaimer
Ventura Securities Limited (VSL) is a SEBI registered intermediary offering broking, depository and portfolio management services to clients. VSL is member of BSE, NSE and MCX-SX. VSL is a depository participant of NSDL. VSL states that no disciplinary action whatsoever has been taken by SEBI against it in last five years except administrative warning issued in connection with technical and venial lapses observed while inspection of books of accounts and records. Ventura Commodities Limited, Ventura Guaranty Limited, Ventura Insurance Brokers Limited and Ventura Allied Services Private Limited are associates of VSL. Research Analyst (RA) involved in the preparation of this research report and VSL disclose that neither RA nor VSL nor its associates (i) have any financial interest in the company which is the subject matter of this research report (ii) holds ownership of one percent or more in the securities of subject company (iii) have any material conflict of interest at the time of publication of this research report (iv) have received any compensation from the subject company in the past twelve months (v) have managed or co-managed public offering of securities for the subject company in past twelve months (vi) have received any compensation for investment banking merchant banking or brokerage services from the subject company in the past twelve months (vii) have received any compensation for product or services from the subject company in the past twelve months (viii) have received any compensation or other benefits from the subject company or third party in connection with the research report. RA involved in the preparation of this research report discloses that he / she has not served as an officer, director or employee of the subject company. RA involved in the preparation of this research report and VSL discloses that they have not been engaged in the market making activity for the subject company. Our sales people, dealers, traders and other professionals may provide oral or written market commentary or trading strategies to our clients that reflect opinions that are contrary to the opinions expressed herein. We may have earlier issued or may issue in future reports on the companies covered herein with recommendations/ information inconsistent or different those made in this report. In reviewing this document, you should be aware that any or all of the foregoing, among other things, may give rise to or potential conflicts of interest. We may rely on information barriers, such as "Chinese Walls" to control the flow of information contained in one or more areas within us, or other areas, units, groups or affiliates of VSL. This report is for information purposes only and this document/material should not be construed as an offer to sell or the solicitation of an offer to buy, purchase or subscribe to any securities, and neither this document nor anything contained herein shall form the basis of or be relied upon in connection with any contract or commitment whatsoever. This document does not solicit any action based on the material contained herein. It is for the general information of the clients / prospective clients of VSL. VSL will not treat recipients as clients by virtue of their receiving this report. It does not constitute a personal recommendation or take into account the particular investment objectives, financial situations, or needs of clients / prospective clients. Similarly, this document does not have regard to the specific investment objectives, financial situation/circumstances and the particular needs of any specific person who may receive this document. The securities discussed in this report may not be suitable for all investors. The appropriateness of a particular investment or strategy will depend on an investor's individual circumstances and objectives. Persons who may receive this document should consider and independently evaluate whether it is suitable for his/ her/their particular circumstances and, if necessary, seek professional/financial advice. And such person shall be responsible for conducting his/her/their own investigation and analysis of the information contained or referred to in this document and of evaluating the merits and risks involved in the securities forming the subject matter of this document. The projections and forecasts described in this report were based upon a number of estimates and assumptions and are inherently subject to significant uncertainties and contingencies. Projections and forecasts are necessarily speculative in nature, and it can be expected that one or more of the estimates on which the projections and forecasts were based will not materialize or will vary significantly from actual results, and such variances will likely increase over time. All projections and forecasts described in this report have been prepared solely by the authors of this report independently of the Company. These projections and forecasts were not prepared with a view toward compliance with published guidelines or generally accepted accounting principles. No independent accountants have expressed an opinion or any other form of assurance on these projections or forecasts. You should not regard the inclusion of the projections and forecasts described herein as a representation or warranty by VSL, its associates, the authors of this report or any other person that these projections or forecasts or their underlying assumptions will be achieved. For these reasons, you should only consider the projections and forecasts described in this report after carefully evaluating all of the information in this report, including the assumptions underlying such projections and forecasts. The price and value of the investments referred to in this document/material and the income from them may go down as well as up, and investors may realize losses on any investments. Past performance is not a guide for future performance. Future returns are not guaranteed and a loss of original capital may occur. Actual results may differ materially from those set forth in projections. Forward-looking statements are not predictions and may be subject to change without notice. We do not provide tax advice to our clients, and all investors are strongly advised to consult regarding any potential investment. VSL, the RA involved in the preparation of this research report and its associates accept no liabilities for any loss or damage of any kind arising out of the use of this report. This report/document has been prepared by VSL, based upon information available to the public and sources, believed to be reliable. No representation or warranty, express or implied is made that it is accurate or complete. VSL has reviewed the report and, in so far as it includes current or historical information, it is believed to be reliable, although its accuracy and completeness cannot be guaranteed. The opinions expressed in this document/material are subject to change without notice and have no obligation to tell you when opinions or information in this report change. This report or recommendations or information contained herein do/does not constitute or purport to constitute investment advice in publicly accessible media and should not be reproduced, transmitted or published by the recipient. The report is for the use and consumption of the recipient only. This publication may not be distributed to the public used by the public media without the express written consent of VSL. This report or any portion hereof may not be printed, sold or distributed without the written consent of VSL. This document does not constitute an offer or invitation to subscribe for or purchase or deal in any securities and neither this document nor anything contained herein shall form the basis of any contract or commitment whatsoever. This document is strictly confidential and is being furnished to you solely for your information, may not be distributed to the press or other media and may not be reproduced or redistributed to any other person. The opinions and projections expressed herein are entirely those of the author and are given as part of the normal research activity of VSL and are given as of this date and are subject to change without notice. Any opinion estimate or projection herein constitutes a view as of the date of this report and there can be no assurance that future results or events will be consistent with any such opinions, estimate or projection. This document has not been prepared by or in conjunction with or on behalf of or at the instigation of, or by arrangement with the company or any of its directors or any other person. Information in this document must not be relied upon as having been authorized or approved by the company or its directors or any other person. Any opinions and projections contained herein are entirely those of the authors. None of the company or its directors or any other person accepts any liability whatsoever for any loss arising from any use of this document or its contents or otherwise arising in connection therewith. The information contained herein is not intended for publication or distribution or circulation in any manner whatsoever and any unauthorized reading, dissemination, distribution or copying of this communication is prohibited unless otherwise expressly authorized. Please ensure that you have read “Risk Disclosure Document for Capital Market and Derivatives Segments” as prescribed by Securities and Exchange Board of India before investing in Securities Market.
Ventura Securities Limited
Corporate Office: I Think Techno Campus, 8th Floor, B Wing, Pokharna Road No. 02, Off Eastern Express Highway, Thane, Maharashtra - 400067