Pyrosequencing and mid-infrared spectroscopy reveal distinct aggregate stratification of soil...
10
Pyrosequencing and mid-infrared spectroscopy reveal distinct aggregate stratification of soil bacterial communities and organic matter composition Marko Davinic a , Lisa M. Fultz a , Veronica Acosta-Martinez b , Francisco J. Calderón c , Stephen B. Cox d , Scot E. Dowd d , Vivien G. Allen a , John C. Zak e , Jennifer Moore-Kucera a, * a Department of Plant & Soil Science, Texas Tech University, Lubbock, TX 79409, USA b USDA-ARS, Plant Stress & Water Conservation Laboratory, Lubbock, TX 79415, USA c USDA-ARS, Central Great Plains Res. Stn., Akron, CO 80720, USA d Molecular Research (MR DNA), Shallowater, TX 79363, USA e Department of Biological Sciences, Texas Tech University, Lubbock, TX 79409, USA article info Article history: Received 23 August 2011 Received in revised form 16 November 2011 Accepted 17 November 2011 Available online 2 December 2011 Keywords: Pyrosequencing Soil bacterial communities Aggregate-size fractions Mid-IR spectroscopy UniFrac abstract This study integrated physical, chemical, and molecular techniques to assess relationships between soil bacterial community structures and the quantity and quality of soil organic carbon (SOC) at the soil microenvironment scale (e.g., within different aggregate size-fractions). To accomplish this goal, soil samples (0e5 cm) were collected from the Texas High Plains region under a variety of dryland and irrigated cropping systems. The soil was separated into macroaggregates, microaggregates, and silt þ clay fractions that were analyzed for (1) bacterial diversity via pyrosequencing of the 16s rRNA gene and (2) SOC quantity and quality using a combustion method and mid-infrared diffuse reflectance spectroscopy (mid-IR), respectively. Results from pyrosequencing showed that each soil microenvironment supported a distinct bacterial community. Similarly, mid-IR data revealed distinct spectral features indicating that these fractions were also distinguished by organic and mineral composition. Macroaggregates showed relatively high abundance of Actinobacteria (excluding order Rubrobacteriales) and a-Proteobacteria and contained the most SOC. Microaggregates showed high relative abundance of Rubrobacteriales and the least amount of SOC. Predominance within the soil microenvironment and correlations along the mid-IR spectra were different between members of the order Rubrobacteriales compared with all other members of the Actinobacteria phyla, suggesting they have different ecological niches. Mid-IR results revealed microaggregates had greater absorbance in the 1370e1450 cm 1 region for phenolic and alkyl groups (possibly recalcitrant C). Silt þ clay fractions were distinguished by Gemmatimonadetes and OP10 phyla, which positively correlated with spectral absorption in the1250e1150 cm 1 range (indicating both degradable and recalcitrant C forms). In contrast to general diversity index measurements, distributions of the more rare bacterial phyla (phyla representing <6% of the identified population) were more important for differentiating between communities in soil microenvironments. To our knowledge, this is the first study to investigate soil bacterial communities among soil aggregates using pyrosequenging and to associate these communities to specific soil C chemistries as indicated by mid-IR absorbance. Ó 2011 Elsevier Ltd. All rights reserved. 1. Introduction The majority of soil microbial analyses are performed on bulk soil samples via methods that tend to standardize variability and result in a loss of information regarding the spatial distribution of microorganisms and soil organic matter (SOM) (Mummey et al., 2006; O’Donnell et al., 1995). Physical separation of the soil into definable aggregate fractions, such as initially proposed by Elliott (1986), and subsequent molecular analysis, allows one to investi- gate, at appropriate scales, the relationships between microbial communities and soil microhabitats. These approaches will enable investigators to link biotic dynamics with physicochemical infor- mation to provide a better understanding of soil functioning (Mummey et al., 2006). An ‘aggregate stratification strategy’ separates soil into at least three distinct microenvironments: macroaggregates (>250 mm), * Corresponding author. Department of Plant & Soil Science, Texas Tech Univer- sity,15th St. and DetroitAve., Room 201, Box 42122, Lubbock, TX 79409-2122, USA. Tel.: þ1 806 742 2838x236; fax: þ1 806 742 0775. E-mail addresses: [email protected] (M. Davinic), [email protected] (L.M. Fultz), [email protected] (V. Acosta-Martinez), Francisco.calderon@ ars.usda.gov (F.J. Calderón), [email protected] (S.B. Cox), [email protected] (S.E. Dowd), [email protected] (V.G. Allen), john.zak@ ttu.edu (J.C. Zak), [email protected] (J. Moore-Kucera). Contents lists available at SciVerse ScienceDirect Soil Biology & Biochemistry journal homepage: www.elsevier.com/locate/soilbio 0038-0717/$ e see front matter Ó 2011 Elsevier Ltd. All rights reserved. doi:10.1016/j.soilbio.2011.11.012 Soil Biology & Biochemistry 46 (2012) 63e72
-
Upload
independent -
Category
Documents
-
view
2 -
download
0
Transcript of Pyrosequencing and mid-infrared spectroscopy reveal distinct aggregate stratification of soil...

at SciVerse ScienceDirect
Soil Biology & Biochemistry 46 (2012) 63e72
Contents lists available
Soil Biology & Biochemistry
journal homepage: www.elsevier .com/locate/soi lb io
Pyrosequencing and mid-infrared spectroscopy reveal distinct aggregatestratification of soil bacterial communities and organic matter composition
Marko Davinic a, Lisa M. Fultz a, Veronica Acosta-Martinez b, Francisco J. Calderón c, Stephen B. Cox d,Scot E. Dowd d, Vivien G. Allen a, John C. Zak e, Jennifer Moore-Kucera a,*
aDepartment of Plant & Soil Science, Texas Tech University, Lubbock, TX 79409, USAbUSDA-ARS, Plant Stress & Water Conservation Laboratory, Lubbock, TX 79415, USAcUSDA-ARS, Central Great Plains Res. Stn., Akron, CO 80720, USAdMolecular Research (MR DNA), Shallowater, TX 79363, USAeDepartment of Biological Sciences, Texas Tech University, Lubbock, TX 79409, USA
a r t i c l e i n f o
Article history:Received 23 August 2011Received in revised form16 November 2011Accepted 17 November 2011Available online 2 December 2011
Keywords:PyrosequencingSoil bacterial communitiesAggregate-size fractionsMid-IR spectroscopyUniFrac
* Corresponding author. Department of Plant & Soisity, 15th St. and Detroit Ave., Room 201, Box 42122, LTel.: þ1 806 742 2838x236; fax: þ1 806 742 0775.
E-mail addresses:[email protected] (M. Davinic),[email protected] (V. Acosta-Mars.usda.gov (F.J. Calderón), Stephen.cox@[email protected] (S.E. Dowd), [email protected] (J.C. Zak), [email protected] (J. M
0038-0717/$ e see front matter � 2011 Elsevier Ltd.doi:10.1016/j.soilbio.2011.11.012
a b s t r a c t
This study integrated physical, chemical, and molecular techniques to assess relationships between soilbacterial community structures and the quantity and quality of soil organic carbon (SOC) at the soilmicroenvironment scale (e.g., within different aggregate size-fractions). To accomplish this goal, soilsamples (0e5 cm) were collected from the Texas High Plains region under a variety of dryland andirrigated cropping systems. The soil was separated into macroaggregates, microaggregates, and silt þ clayfractions that were analyzed for (1) bacterial diversity via pyrosequencing of the 16s rRNA gene and (2)SOC quantity and quality using a combustion method and mid-infrared diffuse reflectance spectroscopy(mid-IR), respectively. Results from pyrosequencing showed that each soil microenvironment supporteda distinct bacterial community. Similarly, mid-IR data revealed distinct spectral features indicating thatthese fractions were also distinguished by organic and mineral composition. Macroaggregates showedrelatively high abundance of Actinobacteria (excluding order Rubrobacteriales) and a-Proteobacteria andcontained the most SOC. Microaggregates showed high relative abundance of Rubrobacteriales and theleast amount of SOC. Predominance within the soil microenvironment and correlations along the mid-IRspectra were different between members of the order Rubrobacteriales compared with all other membersof the Actinobacteria phyla, suggesting they have different ecological niches. Mid-IR results revealedmicroaggregates had greater absorbance in the 1370e1450 cm�1 region for phenolic and alkyl groups(possibly recalcitrant C). Silt þ clay fractions were distinguished by Gemmatimonadetes and OP10 phyla,which positively correlated with spectral absorption in the1250e1150 cm�1 range (indicating bothdegradable and recalcitrant C forms). In contrast to general diversity index measurements, distributionsof the more rare bacterial phyla (phyla representing <6% of the identified population) were moreimportant for differentiating between communities in soil microenvironments. To our knowledge, this isthe first study to investigate soil bacterial communities among soil aggregates using pyrosequenging andto associate these communities to specific soil C chemistries as indicated by mid-IR absorbance.
� 2011 Elsevier Ltd. All rights reserved.
1. Introduction
The majority of soil microbial analyses are performed on bulksoil samples via methods that tend to standardize variability and
l Science, Texas Tech Univer-ubbock, TX 79409-2122, USA.
[email protected] (L.M. Fultz),artinez), [email protected] (S.B. Cox),.edu (V.G. Allen), john.zak@oore-Kucera).
All rights reserved.
result in a loss of information regarding the spatial distribution ofmicroorganisms and soil organic matter (SOM) (Mummey et al.,2006; O’Donnell et al., 1995). Physical separation of the soil intodefinable aggregate fractions, such as initially proposed by Elliott(1986), and subsequent molecular analysis, allows one to investi-gate, at appropriate scales, the relationships between microbialcommunities and soil microhabitats. These approaches will enableinvestigators to link biotic dynamics with physicochemical infor-mation to provide a better understanding of soil functioning(Mummey et al., 2006).
An ‘aggregate stratification strategy’ separates soil into at leastthree distinct microenvironments: macroaggregates (>250 mm),

M. Davinic et al. / Soil Biology & Biochemistry 46 (2012) 63e7264
microaggregates (53e250 mm), and silt þ clay (<53 mm), which aredifferentiated by unique physical, chemical (organic matter andclay content) and structural (stability and size) characteristics(Ranjard et al., 2000). Macroaggregates protect plant-derived andmicrobial-derived SOM, contain high amounts of fungal biomassand are enriched with labile C and N originating predominatelyfrom plant residues. Microaggregates are formed by microbialinduced bonding of clay particles, polyvalent metals and organo-metal complexes. They are characterized by lower concentrationsof new and labile carbon (lower C:N ratio) and increased amountsof physically protected and biochemically more recalcitrant Ccompared to macroaggregates. The silt plus clay fractions arecharacterized by the highest concentration of relatively stableorganic C and N, and they provide a protective environment formicrobial biomass and microbial-derived SOM (Elliott, 1986).Despite the essential role of soil microorganisms in the formationand stabilization of soil aggregates, microbial community structureand composition within and among various soil aggregates is notwell characterized (Mummey et al., 2006).
Once soil aggregates are physically stratified or fractionated, thechallenge is adequately assessing soil biological and chemicalcomponents. Researchers have investigated soil microbialcommunities and activities within aggregates using methods suchas phospholipid fatty acid (PLFA) profiles (Kong et al., 2011), fattyacid methyl ester (FAME) profiles (Schutter and Dick, 2002) andenzymatic assays (Allison and Jastrow, 2006). Differences in thedistribution of bacterial species in different aggregate-size classeshave also been revealed using molecular methods (Blackwoodet al., 2006; Kabir et al., 1994; Ranjard et al., 2000). More recentwork has used cloning and sequence analysis of 16S rRNA genes toelucidate the relationship between inner- and outer-aggregatefractions and microbial community structure (Mummey et al.,2006). Moreover, massive parallel sequencing, such as pyrose-quencing now allows for the investigation of microbial diversity atlevels previously not feasible (Roesch et al., 2007; Acosta-Martinezet al., 2008, 2010).
Quantification of soil organic C (SOC) is a relatively simpleprocess, typically determined by combustion methodologies.However, characterization of the quality or chemical compositionof this material is less straight-forward. A relatively novel techniqueemploys mid-infrared (mid-IR) diffuse reflectance spectroscopy(DRIFTS) to acquire detailed information about the chemicalcomposition of a soil. Calderón et al. (2011b) used such an approachon fractionated fresh and incubated agricultural soils to determinechanges in SOM chemistry. Their results substantiated the impor-tance of chemical changes in soil C and the use of this innovativetool for investigating different C cycling processes.
Soil microenvironments provide unique habitats for distinctmicrobial communities (Kong et al., 2011). Understanding themechanisms that shape and influence soil microbial communitystructure, such as spatial segregation within aggregates, hasimportant implications on the preservation of biodiversity andmanagement of microbial communities for bioremediation,biocontrol of diseases and enhanced soil fertility (Grundmann,2004). The objective of our study was to integrate physical,chemical, and molecular techniques to assess relationshipsbetween soil bacterial community structure and the quantity andquality of SOC at the soil microenvironment scale (e.g., withindifferent aggregate-size fractions). To accomplish this goal, wefractionated soil samples into three aggregate-size fractionsmacroaggregates (>250 mm), microaggregates (53e250 mm), andsilt þ clay (<53 mm) and evaluated bacterial diversity via pyrose-quencing. We also assessed SOC quantity using a combustionmethod and SOC quality using a mid-IR DRIFTS technique. Wehypothesized that each aggregate-size fraction would contain
a distinct bacterial assemblage and that these individual assem-blages would be different in structure and composition from thebacterial community determined on whole soil samples. Wefurther postulated that community composition within aggregatescould be explained in part by soil chemical characterization uniqueto each aggregate-size fraction. We acknowledge that agriculturalmanagement practices are important drivers for soil microbialcommunity dynamics and soil chemical composition, however, forthe purpose of this study, we chose to focus only on the effect ofaggregate-size.
2. Materials and methods
2.1. Agroecosystems description
Soil samples were collected from five agroecosystems repre-senting long-term research and producer operations (>5 years attime of sampling). They included three integrated crop and livestock(ICL) systems and two cotton-cropping (CTN) systems located in theTexas High Plains region (THP). These agroecosystems (i.e., sites) arecomponents of a larger study investigating the impacts of agricul-tural management on soil quality and economics (USDA-SSAREproject numbers L597-82 and LS10-229). The specific managementdetails for the five systems are presented in Table 1. Two of the ICLsystems (#1 and #2) and one of the cotton systems (#3) are oper-ated at the Texas Tech University Experimental Farm (TTEF) in NewDeal, TX. Each system is replicated three times in a randomizedcomplete block design. The other two agroecosystems, #4 and #5,are producer operated and are two of 27 fields, which are part ofa long-termmonitoring project named the Texas Alliance forWaterConservation (TAWC) program (TAWC, 2010).
The THP is characterized by a semi-arid climate, where averagedaily temperatures range from 7.9 to 22.9 �C (coolest in Januarywith average e 4.4 �C, and warmest in July with 33.3 �C), with mildwinters and a mean annual precipitation of 465 mm occurringmostly from April through October. All farming systems wereestablished on Pullman clay loam soils (fine, mixed, superactive,thermic Torrertic Paleustolls) with an average of 38% clay, 28% silt,and 34% sand and a pH of 7.7 in the top 20 cm. Pullman soils, foundon 1.5 million hectares of the Southern Great Plains, are of greatagricultural importance and, thus, are considered a benchmark soilfor this area (Unger and Pringle, 1981).
2.2. Soil sampling
Soil surface samples were collected in summer (JulyeAugust)2010 from the five agroecosystems described in Table 1. From thereplicated study at TTEF, one composite samplewas taken fromeachof three field replicates of each agroecosystem evaluated. For theTAWC systems # 4 and #5, where traditional field replicates do notexist, three transects were established prior to sampling, marked byGPS, and five soil samples were collected along each transect andcombined to create three spatially distinct field samples. Thesamples were sub-divided into 0e5 and 5e20 cm depths, but the0e5 cmdepthwas used in this study.Within 48 h of sampling, field-moist samples were gently and thoroughly mixed and passedthrough an 8-mm sieve, with large aggregates being brokenmanually along planes of weaknesses (Six et al., 1998). Sievedsamples were stored up to one week at 4 �C prior to fractionationand subsequent DNA extraction for pyrosequencing analysis.
2.3. Soil fractionation
Soil was fractionated using a wet-sieving technique based onthat described by Elliott (1986) and Cambardella and Elliott (1993)

Table 1Site descriptions of five agroecosystems in the THP. Values for soil pH and soil organic matter are reported as means for 0e5 cm with standard error in parentheses.
Agroeco-systema
Location GPS coordinates Crops/forages Totalarea(ha)
Age(yrs)b
Cattlegrazing
Irrigationtypec
2010Annualrainfall(mm)
Soil pHH2O Soil organicmatter (%)
1 (ICL) New Deal, TX 33.733579�N, �101.738942�W Native perennial foraged 13.5 6 Yes None 679 7.2 (0.12) 2.4 (0.49)1 (ICL) Cotton (Gosspium hirsutum L.)
(2010)/Millet (Seteria italic) (2009)5.1 6 No None 7.3 (0.09) 1.6 (0.09)
1 (ICL) Millet (2010)/Cotton (2009) 5.1 6 Yes None 7.0 (0.09) 1.7 (0.06)2 (ICL) New Deal, TX 33.733579�N, �101.738942�W Bermudagrass (Cynodon dactylon) 2.7 6 Yes SDI 679 7.6 (0.20) 2.7 (0.31)2 (ICL) OWB-B.Dahl (Bothriochloa bladhii) 6.3 6 Yes SDI 7.6 (0.10) 2.2 (0.12)3 (CTN) New Deal, TX 33.732275�N, �101.736324�W Cotton 0.25 5 No SDI 679 8.0 (0.15) 1.9 (0.09)4 (CTN) Lockney, TX 34.104561�N, �101.447446�W Cotton 41.6 5 No SDI 722 7.5 (0.09) 1.5 (0.12)5 (ICL) Lockney, TX 34.133956�N, �101.480329�W OWB-B.Dahl 11.2 5 Yes CP-MESA 777 7.6 (0.07) 3.2 (0.27)5 (ICL) Corn (Zea mays L.) (2010)/Sunflower
(Helianthus annuus) (2009)/Corn (2008)44.7 5 No CP-MESA 7.7 (0.03) 2.3 (0.06)
a ICL ¼ integrated crop and livestock system; CTN ¼ cotton-cropping system.b Minimum age of site with detailed records.c SDI ¼ Subsurface Drip Irrigated; CP ¼ Center-Pivot; MESA ¼ Mid-Elevation Spray Application.d Species include: blue grama (Bouteloua gracilis), sideoats grama (Bouteloua curtipendula), buffalograss (Buchloe dactyloides), and green sprangletop (Leptochloa dubia).
M. Davinic et al. / Soil Biology & Biochemistry 46 (2012) 63e72 65
with the following modifications: soil was not air-dried beforesieving; resulting fractions were not dried prior to DNA extraction;and the silt plus clay (SIþ CL) fraction (<53 mm in size) was isolatedvia centrifuging (5000 rpm for 10 min) after addition of a weakCaCl2 solution (0.01 ppm). In brief, 80 g of field-moist soil (<8 mm)was placed onto a pre-weighed 250-mm sieve and gently loweredinto a basin filled with ultrapure water fitted with a DNAse/RNAse-free filter (Synergy� UV, Millipore, MA, USA) to allow the aggre-gates to become saturated. The basin was filled so that the waterlevel would reach approximately 1 cm above the 250-mm sieve.After 5 min of soaking, the soil was sieved by moving the sieve upand down 50 times over 2 min (approximately 3 cm amplitude)under a slight angle to ensure that the water and small particleswere able to pass through the sieve. After this 2 min sieving, theoutside of the sieve was rinsed to ensure that no soil remained onthe sides and weight of the wet sieve and soil was recorded. Soilremaining on the 250-mm sieve comprised the macroaggregatefraction (MACRO). This material was transferred to a sterile 50-mlcentrifuge tube. Water and soil that passed through the 250 mmsieve were poured through a pre-weighed 53-mm sieve in a secondbasin, and the sieving procedure was repeated. Soil whichremained on the 53-mm sieve comprised the microaggregate frac-tion (MICRO; 53e250 mm) and was transferred to another sterile50-mL centrifuge tube. Sample remaining in the basin, whichrepresented the SI þ CL fraction (<53 mm), was treated with CaCl2to achieve a 0.01M concentration and transferred into 250-mlcentrifuge bottles, centrifuged at 4 �C and 5000 rpm for 10 min.Free liquid was aspirated and the soil slurry was transferred intoa sterile 50-mL centrifuge tube and stored at 4 �C until DNAextraction.
2.4. Bacterial community assessment: DNA extraction andpyrosequencing
The DNA was extracted from approximately 0.7 g of moist soilusing the Fast DNA Spin Kit for soil (MP Biomedicals, OH, USA)according to manufacturer’s instructions. The extracted DNA (1 mL)was quantified using an Epoch plate spectrophotometer (BiotechInstruments, VT, USA). The ratio of absorbance at 260 and 280 nm(A260/280) was used to assess purity of nucleic acids and pure DNAA260/280 was considered at or above w1.8. All DNA samples werediluted to equivalent 30 ng/mL concentration for a 50-ml PCRreaction.
The 16S universal Eubacterial primers 530F (50- GTG CCA GCMGCN GCG G) and 1100R (50- GGG TTN CGNTCG TTG) were used for
amplifying thew600 bp region of the 16S rRNA genes. Sample DNAwas amplified using a single step reaction (35 cycles) and 1U ofHotStart HiFidelity Polymerase was introduced to each reaction(Qiagen). A two-region 454 sequencing run was performed ona 70� 75 GS PicoTiterPlate (PTP) via Titanium sequencing platform(Roche, Nutley, New Jersey; Research and Testing Laboratory, Lub-bock, TX). Sixty-four processed sequences acquired from the FLXsequencing run were further trimmed via a custom scripted bio-informatics pipeline (Handl et al., 2011; Ishak et al., 2011). Insummary, each individual sequence was trimmed to a Q25 average,short reads <300 bp depleted, sequences with ambiguous basecalls depleted, sequences with homopolymers exceeding 6 bpdepleted, until only quality sequence information remained; tagswere then extracted from the FLX-created multi-FASTA file whilebeing parsed into individual sample specific files based on the tagsequence. Tags with less than 100% homology, compared to theoriginal sample tag designation, were considered questionable inquality and were not considered. Based upon sequence identity,each bacterium was identified to its closest relative and taxonomiclevel. Sequence collections were depleted of chimeras using B2C2software for batch depletion of chimeras from bacterial 16S data-sets. Bacterial taxa were identified using Krakenblast (www.krakenblast.com) and compared to a custom highly curated data-base (Research and Testing Laboratory, Lubbock, TX). After the besthit processing, genus and higher level taxonomic designations werecompiled using a secondary post-processing algorithm and relativepercentages of bacterial taxa were determined for each individualsample.
2.5. Soil chemical composition as determined by mid-IR DRIFTS
Whole soil and soil aggregate fractions were scanned undilutedin mid-IR via Digilab FTS 7000 Fourier transform spectrometer(Varian, Inc., Palo Alto, CA) with a deuterated, Peltier-cooled, tri-glycine sulfate detector and potassium bromide beam splitter. Thespectrometer was fitted with a Pike AutoDIFF diffuse reflectanceaccessory (Pike Technologies, Madison,WI) and potassium bromidewas used as background. Datawere obtained as pseudo-absorbance(log[1/Reflectance]). Spectra were collected at 4-cm�1 resolutionwith 64 co-added scans per spectrum from 4000 to 400 cm�1.
2.6. Data analyses
Despite efforts to ensure high quality DNA for subsequentpyrosequencing analysis (e.g., quantification of DNA using

Table 2Mean relative abundance (%) for soil bacteria found in aggregate-size fractions andwhole soil. Standard error is in parentheses.
Bacteria Aggregate-size fractions WHOLE soil
MACRO MICRO SI þ CL
a -Proteobacteria 13.43 (0.41) 11.84 (0.48) 12.82 (0.48) 13.38 (0.57)d -Proteobacteria 7.85 (0.41) 7.13 (0.49) 9.03 (0.53) 7.38 (0.27)g -Proteobacteria 5.73 (0.37) 3.89 (0.39) 4.88 (0.33) 5.51 (0.54)b -Proteobacteria 5.34 (0.31) 4.73 (0.26) 6.42 (0.26) 5.40 (0.24)Rubrobacteriales 14.95 (0.90) 20.48 (1.58) 13.09 (0.83) 15.65 (0.72)Actinobacteriaa 19.96 (0.66) 19.04 (0.72) 15.15 (0.78) 18.09 (0.64)Bacteriodetes 8.10 (0.45) 5.53 (0.62) 7.60 (0.39) 6.97 (0.31)Chloroflexi 7.61 (0.33) 8.81 (0.50) 7.01 (0.21) 8.41 (0.38)Gemmatimonadetes 4.11 (0.24) 4.76 (0.37) 5.91 (0.47) 4.38 (0.34)Firmicutes 3.53 (0.16) 4.33 (0.37) 5.06 (0.21) 4.05 (0.17)WS3 2.62 (0.15) 2.89 (0.28) 3.63 (0.23) 3.03 (0.15)Acidobacteria 1.66 (0.09) 1.70 (0.15) 2.92 (0.24) 1.96 (0.11)Verrucomicrobia 1.42 (0.09) 1.29 (0.10) 1.80 (0.13) 1.50 (0.08)OP10 0.81 (0.06) 0.82 (0.07) 1.28 (0.09) 1.01 (0.05)Planctomycetes 0.74 (0.06) 0.66 (0.06) 0.94 (0.06) 0.90 (0.06)Nitrospirae 0.71 (0.07) 0.88 (0.10) 0.89 (0.10) 0.81 (0.08)BRC1 0.43 (0.03) 0.52 (0.05) 0.55 (0.04) 0.53 (0.03)TM7 0.44 (0.06) 0.16 (0.04) 0.27 (0.04) 0.37 (0.04)Dictyoglomi 0.14 (0.02) 0.17 (0.03) 0.31 (0.04) 0.24 (0.03)Candidatus Poribacteria 0.16 (0.02) 0.18 (0.02) 0.15 (0.02) 0.15 (0.02)Bacteria incertae sedis 0.10 (0.02) 0.10 (0.02) 0.09 (0.02) 0.08 (0.01)Chlamydiae 0.05 (0.01) 0.03 (0.01) 0.04 (0.01) 0.04 (0.01)OD1 0.03 (0.01) 0.01 (0.01) 0.06 (0.02) 0.03 (0.01)Chlorobi 0.02 (0.00) 0.01 (0.00) 0.03 (0.01) 0.03 (0.01)Deferribacteres 0.01 (0.00) 0.02 (0.01) 0.03 (0.01) 0.03 (0.01)Tenericutes 0.02 (0.01) 0.02 (0.01) 0.01 (0.00) 0.02 (0.01)Deinococcus-Thermus 0.01 (0.003) 0.01 (0.003) 0.01 (0.005) 0.02 (0.007)Spirochaetes 0.006 (0.004) 0.004 (0.004) 0.003 (0.002) 0.002 (0.002)OP11 0.006 (0.003) 0.002 (0.002) 0.003 (0.002) 0.004 (0.002)Thermodesulfobacteria 0.000 (0.000) 0.000 (0.000) 0.002 (0.002) 0.002 (0.002)
a Actinobacteria exclusive of Rubrobacteriales.
Table 3Multi-response permutation procedure results for pairwisecomparison for group differences between soil aggregates andwhole soil.
Comparison Aa p-value
WHOLE vs. MACRO 0.039 0.029WHOLE vs. MICRO 0.068 0.004WHOLE vs. SI þ CL 0.153 <0.0001MACRO vs. MICRO 0.096 0.001MACRO vs. SI þ CL 0.160 <0.0001MICRO vs. SI þ CL 0.127 0.0001
a A ¼ chance-corrected within group agreement. A < 0 withmore heterogeneity within groups than expected by chance.A ¼ 0 when heterogeneity within groups equals expectation bychance.
M. Davinic et al. / Soil Biology & Biochemistry 46 (2012) 63e7266
Nanodrop and 260/280 ratio analysis), only 84 of the 96 submittedsamples were successfully amplified. Nevertheless, whole soil oraggregate fractions were evaluated for pyrosequencing and mid-IRanalyses with at least n ¼ 17 (maximum of 24) with all agro-ecosystems represented. Pyrosequencing data was analyzedaccording to the multiple sequence alignment performed usingMUSCLE (with parameter e maxiters 1, -diags1 and -sv) (Edgar,2004). Based on alignment, a distance matrix was constructedusing DNAdist from PHYLIP version 3.6 with default parametersfrom Felsenstein (1989, 2005). These pairwise distances served asinput to DOTUR (Schloss and Handelsman, 2005) for clustering thesequences into OTUs of defined sequence similarity that rangedfrom 0 to 20% dissimilarity. The OTU clusters were based upona dissimilarity of 3% for generating predictive rarefaction modelsand for making calculations with richness (diversity) indexes (Chaoand Bunge, 2002) in DOTUR.
Differences among microbial communities within fractionswere characterized using UniFrac distances (Lozupone and Knight,2005). UniFrac is a phylogenetic method thatmeasures the distancebetween communities based on the lineages they contain. Non-metric multidimensional scaling (NMDS) then was used to illus-trate UniFrac distances, and it also was used to illustrate the mid-IRspectral data. NMDS is an iterative ordination method thatfrequently is used for species composition data (Peck, 2010). Itallows a choice of distancemeasure and conserves the rank order ofsample dissimilarities in the rank order of NMDS distances. NMDSwas conducted using the PC-ORD software package (MjM Software,Gleneden Beach, OR) in autopilot mode. The Sorensen distancemeasurewas used formid-IR data after square-root transformation.The final stress for each ordination solution (three-dimensional forUniFrac and two-dimensional for mid-IR) was 11.3 and 5.4,respectively, which is considered satisfactory (McCune and Grace,2002).
Finally, the multiple response permutation procedure (MRPP)was used to determine whether aggregate-size treatments signifi-cantly affected bacterial community composition and chemicalcharacterization (via mid-IR spectra). In MRPP, the test statistic Aranges from 0 to 1 and a higher A value indicates within-grouphomogeneity while the P value explains the possibility of theobserved value due to chance (McCune and Grace, 2002).
3. Results
Pyrosequencing yielded a total of 294,913 sequences with anaverage of 3631 sequences, 1689 unique operational taxonomicunits (OTUs) per sample (OTUs defined as having sequences thatare �97% similar), and an average read length of 460 bp. This soilwas associated with 25 phylum-level groups, and, on average, weredominated by the following nine phyla: Proteobacteria (32%), Acti-nobacteria (34%), Bacteroidetes (7%), Chloroflexi (8%), Gemmatimo-nadetes (4%), Firmicutes (4%), WS3 (3%), Acidobacteria (2%) andVerrucomicrobia (2%) (Table 2). Because of the great diversity offorms and functionalities found in Proteobacteria, this phylum wasfurther subdivided into a-, b-, g-, and d-Proteobacteria thatcomprised 13, 5, 6, and 7% of all sequences, respectively. For thesame reason, order Rubrobacteriales (16%) was independentlyinterpreted from the total Actinobacteria phylum. Phyla that wereless abundant but found in most samples included: OP10 (1%),Planctomycetes (0.9%), Nitrospira (0.8%), and BRC1 (0.5%) (Table 2).
3.1. Soil bacterial communities in whole soil and aggregate-sizefractions
Each of the three soil aggregate-size fractions studied (MICRO,MACRO and SI þ CL) supported distinct bacterial assemblages that
were different from those found in WHOLE soil samples (Table 3and Fig. 1). Using a cut-off R2 value of 0.3, eleven phyla/sub-phylahad strong linear associations with the two ordination axes. Therelative abundance of Actinobacteria (excluding order Rubro-bacteriales) was strongly correlated with axis 1, indicating anassociation with the MACRO samples whereas Nitrospira, Gemma-timonadetes, OP10, WS3, and Acidobacteria showed a negativecorrelationwith axis 1, indicating that were associated with SI þ CL(e.g., had higher relative abundances). The relative abundance oforder Rubrobacteriales was positively correlated with axis 2, indi-cating a strong association with MICRO samples. This groupaccounted for 20.5% in MICRO compared to an average of 14.6% inall other fractions plus WHOLE soil (Table 2). In contrast, relativeabundances of Bacteroidetes, d- and b-Proteobacteria, and Verruco-microbia were negatively correlated with axis 2, indicating weakassociation with MICRO but strong associations with SI þ CL and

Fig. 1. Non-metric multi-dimensional scaling (NMDS) ordination plot derived fromweighted pairwise UniFrac distances from WHOLE soil, MACRO (macroaggregates>250 mm), MICRO (microaggregates 53e250 mm) and SI þ CL (silt þ clay fraction;<53 mm). Individual points represent aggregate and whole soil samples and theellipses represent the bidirectional 95% confidence interval of mean soil group scores.Vectors in the bi-plot overlay were constructed from a matrix containing relativeabundances of each microbial phyla/subphyla as well as SOC and TN contents. Onlycorrelations >0.3 were included. The angle and length of the vector indicate thedirection and strength of the variable and the NMDS axis. Abbreviations:d-Proteo ¼ d-Proteobacteria; b-Proteo ¼ b-Proteobacteria.
Fig. 2. Bacterial richness indices of aggregates and whole soil at a genetic distance of3%, expressed as the number of observed unique operational taxonomic units (OTUs),abundance-based coverage estimator (ACE) and Chao1.
M. Davinic et al. / Soil Biology & Biochemistry 46 (2012) 63e72 67
MACRO. The relative abundances of many bacterial phyla in theWHOLE soil samples more closely follow those associated withMACRO than the other two aggregate fractions (SI þ CL or MICRO)(Table 2). This is also evident in the NMDS plot where the twoellipses overlap between MACRO and WHOLE. Although the MRPPanalysis calculated a p-value <0.05, this does not account for errorassociated with multiple comparisons. Using a Bonferroni adjust-ment, our calculated p-value of 0.03 for the comparison betweenWHOLE and MACRO would not be statistically significant. All otherpair-wise comparisons, however, remained significant with thisadjustment. The first eight phyla/subphyla listed in Table 2constitute at least 76% of the community. The greatest relativeabundance of four of these groups (a- and g-Proteobacteria, Acti-nobacteria excluding order Rubrobacteriales, and Bacteroidetes) wasfound in the MACRO fraction. The MICRO fraction had the greatestrelative abundances of only Rubrobacteriales and Chloroflexi andSI þ CL had the greatest relative abundances of d- and b-Proteo-bacteria. In contrast, the next nine phyla, which represented themore rare groups (i.e., those which accounted for 6% or less of thetotal community), were associated with SI þ CL.
Equally high diversity levels (according to rarefaction curves at3% dissimilarity) were found between MACRO and SI þ CL fractions(1781 and 1765, respectively) (Fig. 2). The lowest level using thisindex was found for the MICRO fraction (1406). A similar trend wasshown by the Shannon index. Although the SI þ CL fraction had thegreatest diversity measures according to ACE and Chao1 indexes(3934 and 3247, respectively), the MICRO fraction had the lowestdiversity measures, regardless of the index used (Fig. 2).
3.2. Soil organic C and chemical composition of soil usingmid-IR spectroscopy
Among soil aggregate fractions, the MACRO fraction containedthe greatest quantity of C (4.9 mg C g�1 aggregate) and N (0.36 mgN g�1 aggregate) followed by SI þ CL (3.0 mg C g�1 aggregate and0.27 mg N g�1 aggregate) and MICRO (2.8 mg C g�1 aggregate and0.2 mg N g�1 aggregate) (data not shown). The WHOLE soil and
aggregate fractions differed in their mid-IR spectra and, thus, theirmineral and organic chemical composition (Fig. 3A; MRPP,A value > 0.06, p-value < 0.005 for all comparisons). The WHOLEsoil, with higher scores along axis 1, had higher absorbance in the1750e1550 cm�1 region (Fig. 3B), which has bands associated withseveral organic features such as carboxylic acids, amide bonds,aromatics, methyl groups and phenolics among others (Baes andBloom, 1989; Janik et al., 2007; Calderón et al., 2011b). TheWHOLE soil also showed high correlation with the wide regionbetween 3630 and 2830 cm�1, which includes bands for clays, OH/NH bonds, and aliphatic CH bonds (Nguyen et al., 1991). The MICROfraction was positively correlated with axis 2 in the1780e2000 cm�1 region (Fig. 3A, B), indicating silicate bands(Nguyen et al., 1991). The SI þ CL fraction and WHOLE soil corre-lated with absorbance at 1290e1080 cm�1, which includes bandsfor resistant aromatics and labile fulvic acids, as well as clays (Janiket al., 2007; García-Gil et al., 2008).
3.3. Coupling of pyrosequencing data with mid-IR spectraat the aggregate scale
Different bacterial phyla were associated with particular soilchemistries, and these relationships were unique for each soilaggregate fraction (Fig. 4 AeE). The MACRO fraction was charac-terized by positive correlations between the relative abundances ofBacteroidetes and Verrucomicrobia with the entire spectra whereasAcidobacteria was correlated negatively (Fig. 4A). The MACROfraction was also characterized by a positive correlation (r > 0.4)between d-Proteobacteria and a negative correlation (r < �0.2)between a-Proteobacteriawith the 1370e1450 cm�1 spectra region,corresponding to CH2, CH3, COO, COOH aliphatics and phenolics(Janik et al., 2007). These same bacterial groups displayed differentand more variable responses across the spectra in MICRO (Fig. 4B,C) and SI þ CL (Fig. 4D, E).
The MICRO fraction was associated with the greatest number(10) of phyla/subphyla with strong correlations across the spectraand resulted in two groups with opposing patterns (Fig. 4B, C). Forexample, the patterns associated with Actinobacteria (excludingorder Rubrobacteriales) are opposite to those found for membersbelonging to the order Rubrobacteriales. The 1370e1450 cm�1
region illustrated a large shift in Rubrobacteriales from a negativecorrelation (�0.3) to a positive one (0.3), whereas Actinobacteria
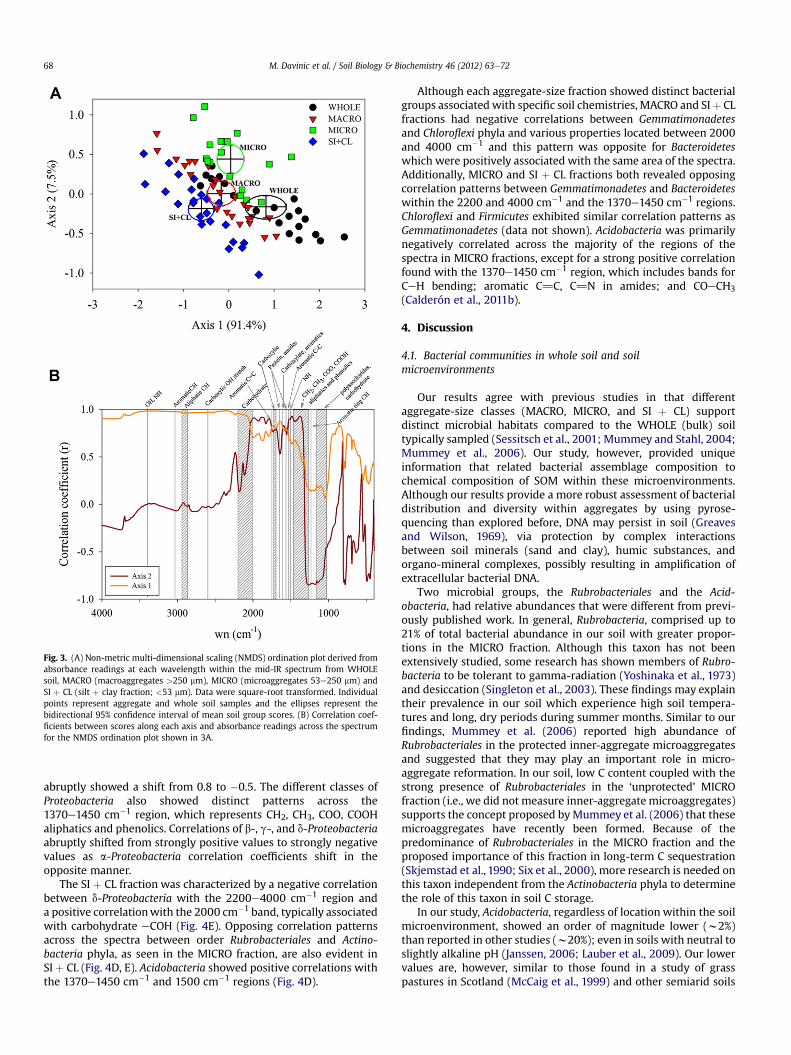
Fig. 3. (A) Non-metric multi-dimensional scaling (NMDS) ordination plot derived fromabsorbance readings at each wavelength within the mid-IR spectrum from WHOLEsoil, MACRO (macroaggregates >250 mm), MICRO (microaggregates 53e250 mm) andSI þ CL (silt þ clay fraction; <53 mm). Data were square-root transformed. Individualpoints represent aggregate and whole soil samples and the ellipses represent thebidirectional 95% confidence interval of mean soil group scores. (B) Correlation coef-ficients between scores along each axis and absorbance readings across the spectrumfor the NMDS ordination plot shown in 3A.
M. Davinic et al. / Soil Biology & Biochemistry 46 (2012) 63e7268
abruptly showed a shift from 0.8 to �0.5. The different classes ofProteobacteria also showed distinct patterns across the1370e1450 cm�1 region, which represents CH2, CH3, COO, COOHaliphatics and phenolics. Correlations of b-, g-, and d-Proteobacteriaabruptly shifted from strongly positive values to strongly negativevalues as a-Proteobacteria correlation coefficients shift in theopposite manner.
The SI þ CL fraction was characterized by a negative correlationbetween d-Proteobacteria with the 2200e4000 cm�1 region anda positive correlationwith the 2000 cm�1 band, typically associatedwith carbohydrate eCOH (Fig. 4E). Opposing correlation patternsacross the spectra between order Rubrobacteriales and Actino-bacteria phyla, as seen in the MICRO fraction, are also evident inSI þ CL (Fig. 4D, E). Acidobacteria showed positive correlations withthe 1370e1450 cm�1 and 1500 cm�1 regions (Fig. 4D).
Although each aggregate-size fraction showed distinct bacterialgroups associatedwith specific soil chemistries, MACRO and SIþ CLfractions had negative correlations between Gemmatimonadetesand Chloroflexi phyla and various properties located between 2000and 4000 cm�1 and this pattern was opposite for Bacteroideteswhich were positively associated with the same area of the spectra.Additionally, MICRO and SI þ CL fractions both revealed opposingcorrelation patterns between Gemmatimonadetes and Bacteroideteswithin the 2200 and 4000 cm�1 and the 1370e1450 cm�1 regions.Chloroflexi and Firmicutes exhibited similar correlation patterns asGemmatimonadetes (data not shown). Acidobacteria was primarilynegatively correlated across the majority of the regions of thespectra in MICRO fractions, except for a strong positive correlationfound with the 1370e1450 cm�1 region, which includes bands forCeH bending; aromatic C]C, C]N in amides; and COeCH3(Calderón et al., 2011b).
4. Discussion
4.1. Bacterial communities in whole soil and soilmicroenvironments
Our results agree with previous studies in that differentaggregate-size classes (MACRO, MICRO, and SI þ CL) supportdistinct microbial habitats compared to the WHOLE (bulk) soiltypically sampled (Sessitsch et al., 2001; Mummey and Stahl, 2004;Mummey et al., 2006). Our study, however, provided uniqueinformation that related bacterial assemblage composition tochemical composition of SOM within these microenvironments.Although our results provide a more robust assessment of bacterialdistribution and diversity within aggregates by using pyrose-quencing than explored before, DNA may persist in soil (Greavesand Wilson, 1969), via protection by complex interactionsbetween soil minerals (sand and clay), humic substances, andorgano-mineral complexes, possibly resulting in amplification ofextracellular bacterial DNA.
Two microbial groups, the Rubrobacteriales and the Acid-obacteria, had relative abundances that were different from previ-ously published work. In general, Rubrobacteria, comprised up to21% of total bacterial abundance in our soil with greater propor-tions in the MICRO fraction. Although this taxon has not beenextensively studied, some research has shown members of Rubro-bacteria to be tolerant to gamma-radiation (Yoshinaka et al., 1973)and desiccation (Singleton et al., 2003). These findings may explaintheir prevalence in our soil which experience high soil tempera-tures and long, dry periods during summer months. Similar to ourfindings, Mummey et al. (2006) reported high abundance ofRubrobacteriales in the protected inner-aggregate microaggregatesand suggested that they may play an important role in micro-aggregate reformation. In our soil, low C content coupled with thestrong presence of Rubrobacteriales in the ‘unprotected’ MICROfraction (i.e., we did not measure inner-aggregate microaggregates)supports the concept proposed byMummey et al. (2006) that thesemicroaggregates have recently been formed. Because of thepredominance of Rubrobacteriales in the MICRO fraction and theproposed importance of this fraction in long-term C sequestration(Skjemstad et al., 1990; Six et al., 2000), more research is needed onthis taxon independent from the Actinobacteria phyla to determinethe role of this taxon in soil C storage.
In our study, Acidobacteria, regardless of location within the soilmicroenvironment, showed an order of magnitude lower (w2%)than reported in other studies (w20%); even in soils with neutral toslightly alkaline pH (Janssen, 2006; Lauber et al., 2009). Our lowervalues are, however, similar to those found in a study of grasspastures in Scotland (McCaig et al., 1999) and other semiarid soils

Fig. 4. Correlation coefficients across the mid-infrared spectrum between the relative abundance of several bacterial phyla/subphyla and absorbance at each mid-IR wavelength forMACRO (A), MICRO (B and C), and SI þ CL (D and E) fractions. Only phyla that had particularly high positive or negative r scores (�0.2 < r > 0.2) were included.
M. Davinic et al. / Soil Biology & Biochemistry 46 (2012) 63e72 69
(Acosta-Martinez et al., 2008). Our results agree in part withSessitsch et al. (2001) who reported that the Acidobacterium groupmainly colonized silt and clay fractions. Mummey et al. (2006) re-ported greater relative abundance of Acidobacteria in the MICROfraction, while we found this group of bacteria was equally abun-dant in MACRO and MICRO fractions. Mummey et al. (2006),however, did not specifically investigate the SI þ CL fraction.Although predominance of Acidobacteria has been associated withlow C soils (Fierer et al., 2007), we found that C quantity differencesbetween aggregates may not solely explain Acidobacteria predom-inance. Both MICRO and SI þ CL fractions contained equally low Ccontent compared to the MACRO fraction, but the SI þ CL fractioncontained 71% greater relative abundance of Acidobacteria than theMICRO fraction.
Bacterial diversity indexes were not sensitive measures todistinguish soil aggregate fractions. In contrast to other studieswhere greater bacterial diversity was observed in small size frac-tions (typically <53 mm) than in larger size particles (Sessitschet al., 2001; Kirchmann et al., 2005), we found equally high
diversity levels in MACRO and SI þ CL fractions than the MICROfraction. This discrepancy may be related to the method used toisolate aggregates. Our method was based on that used by Elliott(1986), which extracts water-stable aggregates and does notextract protected smaller aggregates and mineral fractions existingwithin macroaggregates as described by Six et al. (1998). It ispossible that the greater disruptive forces such as those used in thestudies by Sessitsch et al. (2001) and Kirchmann et al. (2005),resulted in a greater proportion of silt and clay extracted whencompared with our method. The lower bacterial diversity in MICROfor our study may be due in part to dominance by soil fungi asproposed by Kong et al. (2011). Perhaps the bacterial diversityindexes may not be different whereas fungal diversity indexescould have reflected more distinct values, but the fungal compo-nent was not addressed in our study. Other studies have also re-ported that diversity indexes are not necessarily useful inpredicting or understanding important soil processes such as Csequestration (King, 2010; Lauber et al., 2009). Furthermore,Cleveland and Liptzin (2007) proposed that variability within

M. Davinic et al. / Soil Biology & Biochemistry 46 (2012) 63e7270
specific microbial assemblages likely impact C storage irrespectiveof overall diversity. It may be that the distributions of the more rarebacterial phyla (e.g., those representing less than 6% of the identi-fied population) may be more important for differentiatingcommunities in soil aggregate-size fractions, than measures ofoverall bacterial diversity (e.g., richness estimates).
4.2. Mid-IR analysis in whole soil and soil microenvironments
Physical fractionation of soil microenvironments showed cleardifferences on their spectroscopic properties with a predominanteffect from mineral features. All three fractions lost absorbance at3400 cm�1 relative to WHOLE soil, but the effect was morepronounced on the SI þ CL fraction. The 3400 cm�1 band isimportant because this OH or NH stretching feature marks pres-ence of relatively labile SOM (Haberhauer and Gerzabek, 1999;Calderón et al., 2011b). It is possible that this band was lost withsoluble SOM during fractionation, but it also suggests that theMICRO and MACRO fractions contained overall older, more pro-cessed C relative to WHOLE soil. The band at 2930e2870 cm�1
indicated aliphatic CH stretching of methyl and methylene groups,which marks C in the soil light fraction (Calderón et al., 2011b) andis also characteristic of high quality prairie soils (Calderón et al.,2011a). Spectral subtraction (not shown) indicated that absor-bance in this region increased slightly in MICRO andMACRO duringfractionation, but declined in the SI þ CL fraction. However, thisband was not pronounced in WHOLE soil to begin with, which mayhave diminished potential effects of fractionation. The MICROfraction had more absorbance at 2000e1750 cm�1 and at1344 cm�1, indicating strong influence of silicates and, thus, sandenrichment compared to other fractions. Alternatively, MICROspectra may have more silicate signal because of decreased coatingof SOM or other interfering substances. Spectral subtraction alsoindicated that the MICRO fraction does absorb more than theWHOLE soil in the region between 1600 and 1350 cm�1 suggestingthat a variety of resistant and labile organic functional groups likearomatics, phenolics and proteins are enriched in MICRO.
Differences between MACRO and MICRO fractions are alsodominated by increased silicate signal in the MICRO fraction.Nevertheless, the organic makeup of the MICRO fraction does differas indicated by higher absorbance at the carboxylic band at1700e1740 cm�1and bands between 1530 and 1450 cm�1. It ispossible that increased absorbance of MICRO at these frequenciesindicated that they are older andmore stable forms of C. Research asto the resistant or labile character of many of these narrow bands isongoing and future studies will help elucidate their role in soil Csequestration. Caution is necessarywhenassigning spectral featuresto specific chemical characteristics in soil using mid-IR techniques.Peak identification is not exact because spectral bands occur acrossa wide range and there is some degree of overlap between bands.Nevertheless, studies such as this, relating biological attributes tospectral data will help us build a knowledge base and shed light onthe meaning of specific mid-IR absorbance in soil.
4.3. Coupling pyrosequencing data with mid-IRat the aggregate scale
Ourmid-IR results suggested that the relative abundances of soilbacteria within soil aggregate fractions are driven more by shifts inchemical composition of SOM than SOC quantity. The impact ofchanges in SOMchemistry on the bacterial compositionwas specificto each aggregate. However, it is equally possible that these SOMcompounds may be inaccessible and not directly influence thecommunitycomposition. Regardless, ourdata suggest that the effectof changes in SOM chemistry on the bacterial composition may be
defined by aggregate specific patterns. For example, within eachaggregate-size class, the most prevalent bacterial groups were notthose with strong relationships across the mid-IR spectra andsuggest that low abundant bacterial groups responded moredynamically to shifts in SOM composition than the most dominantgroups. The distribution of bacterial populations within and amongthese microenvironments, as well as the chemical composition ofSOM is partially driven by feedback loops between the activities ofsoil microorganisms, which alter SOM chemistry and thus theirenvironment, and the original composition of the organic matteritself. As microbial communities often work as a consortia todegrade complex organic materials such as those found in soil, it isprobable that dominant groups benefit from co-metabolitesproduced by less dominant groups. When C is plentiful and sour-ces include relatively degradable components, such as in theMACROfraction wherefresh residues would be expected, few groupsresponded to shifts in C. In contrast, the MICRO fraction, whichcontained the lowest amount of C and had the lowest diversityindexes, had themost bacterial groupswith strong associationswithspecific SOMchemistries.Rubrobacterialeswasnot one of the groupsstrongly correlated along the spectra, but was the most dominantwithin the MICRO fraction. It is uncertain whether a lack of corre-lation between relative abundances of bacterial phyla with variousSOM chemistries suggests that these groups are less important toprocessing these compounds or whether dominant groups do notneed to be sensitive to minor changes in SOM chemistries. In otherwords, less abundant groups need to compete more strongly tosurvive whereas dominant groups benefit from sheer numbers andthe co-metabolites produced from the entire microbial consortia.
Within a given aggregate fraction such as MICRO, opposingpatterns between Rubrobacteriales, a-Proteobacteria, Gemmati-monadetes, and Acidobacteria taxa and Bacteriodetes, g- andb-Proteobacteria and Actinobacteria (excluding Rubrobacteriales)suggest that these groups occupy different ecological niches.The opposing patterns between order Rubrobacteriales andActinobacteria phyla, seen in MICRO and SI þ CL fractions wasunexpected but supports research reported by Bryan andJohnson (2008), which suggested that Rubrobacteriales mayhave dissimilatory physiological characteristics compared toother members of Actinobacteria. We also found that the relativeabundance of Rubrobacteriales was high when the relativeabundance of Proteobacteria was low (r ¼ 0.85), suggesting thatthese groups directly compete with each other for the sameecological niche. This relationship was also observed in theScottish grassland soils where a-Proteobacteria was more prev-alent and Rubrobacteriales was less abundant in improvedgrasslands (McCaig et al., 1999).
Factors other than the chemical composition of soil, such asmoisture and oxygen gradients, likely influence soil bacterialdistribution and diversity (Hansel et al., 2008). Although thephylum Verrucomicrobia is known to be ubiquitous in most soils(Zhang and Xu, 2008), it is probable that this group is generally lesscommon in arid soils due to their sensitivity to dryness (Sessitschet al., 2001). Members of this phylum were most prevalent inSI þ CL fractions, which is where higher moisture content is mostlikely to exist. However, members from this phylum have beenfound to utilize a narrow range of carbohydrates (Sessitsch et al.,2001; Hedlund et al., 1996) which may explain why they tendedto have strong positive correlations with only narrow regions alongthe mid-IR spectra in MACRO and MICRO fractions.
5. Conclusion
Integration of pyrosequencing, mid-IR spectroscopy, and soilfractionation techniques allowed us to discern relationships

M. Davinic et al. / Soil Biology & Biochemistry 46 (2012) 63e72 71
between bacterial assemblages and soil chemical compositionwithin aggregates at a level previously not achieved. Our studysuggests that the relative abundance of soil bacteria within soilaggregate fractions are driven more by shifts in chemical compo-sition of SOM than C quantity (content). Specific bacterial assem-blages were associated with particular soil chemistries within thesoil microenvironment and these associations differed from thosefound in the whole (non-fractionated) soil samples. The lessdominant bacterial taxa were more important for differentiatingbetween communities in soil microenvironments and revealed theimportance of robust molecular tools in soil ecological studies. Ourfindings that the less dominant bacterial taxa showed strongerrelationships with specific chemical functional groups than themore dominant bacterial taxa should be further explored to revealpotential linkages between specific bacterial assemblages with Csequestration. Our approach can serve as a platform for futurestudies focused on exploring the complex relationships involvingsoil biodiversity and C distribution at the aggregate scale.
References
Acosta-Martinez, V., Dowd, S.E., Sun, Y., Allen, V.G., 2008. Tag-encoded pyrose-quencing analysis of bacterial diversity in a single soil type as affected bymanagement and land use. Soil Biology and Biochemistry 40, 2762e2770.
Acosta-Martinez, V., Dowd, S.E., Sun, Y., Wester, D., Allen, V.G., 2010. Pyrose-quencing analysis for characterization of soil bacterial populations as affectedby an integrated livestock-cotton production system. Applied Soil Ecology 45,13e25.
Allison, S.D., Jastrow, J.D., 2006. Activities of extracellular enzymes in physicallyisolated fractions of restored grassland soils. Soil Biology and Biochemistry 38,3245e3256.
Baes, A.U., Bloom, P.R., 1989. Diffuse reflectance and transmission Fourier transforminfrared (DRIFT) spectroscopy of humic and fulvic acids. Soil Science Society ofAmerica Journal 53, 695e700.
Blackwood, C.B., Dell, C.J., Smucker, A.J.M., Paul, E.A., 2006. Eubacterial communitiesin different soil macroaggregate environments and cropping systems. SoilBiology and Biochemistry 38, 720e728.
Bryan, C.G., Johnson, D.B., 2008. Dissimilatory ferrous iron oxidation at a low pH:a novel trait identified in the bacterial subclass Rubrobacteridae. FEMS Micro-biology Letters 288, 149e155.
Calderón, F.J., Mikha, M.M., Vigil, M.F., Nielsen, D.C., Benjamin, J.G., Reeves II, J.,2011a. Diffuse-reflectance mid-infrared spectral properties of soils underalternative crop rotations in a semi-arid climate. Communications in SoilScience and Plant Analysis 42, 2143e2159.
Calderón, F.J., Reeves III, Collins, H.P., Paul, E.A., 2011b. Chemical differences in soilorganic matter fractions determined by diffuse-reflectance mid-infrared spec-troscopy. Soil Science Society of America Journal 75, 568e579.
Cambardella, C.A., Elliott, E.T., 1993. Methods for physical separation and charac-terization of soil organic matter fractions. Geoderma 56, 449e457.
Chao, A., Bunge, J., 2002. Estimating the number of species in a stochastic abun-dance model. Biometrics 58, 531e539.
Cleveland, C.C., Liptzin, D., 2007. C:N:P stoichiometry in soil: is there a “Redfieldratio” for the microbial biomass? Biogeochemistry 85, 235e252.
Edgar, R.C., 2004. MUSCLE: multiple sequence alignment with high accuracy andhigh throughput. Nucleic Acids Research 32, 792e1797.
Elliott, E.T., 1986. Aggregate structure and carbon, nitrogen, and phosphorus innative and cultivated soils. Soil Science Society of America Journal 50, 627e633.
Felsenstein, J., 1989. PHYLIP-Phylogeny inference package (version 3.2). Cladistics 5,164e166.
Felsenstein, J., 2005. PHYLIP (Phylogeny Inference Package) Version 3.6. Distributedby the author. Department of Genome Sciences, University of Washington,Seattle.
Fierer, N., Bradford, M.A., Jackson, R.B., 2007. Toward an ecological classification ofsoil bacteria. Ecology 88, 1354e1364.
García-Gil, J.C., Plaza, C.J., Fernández, M., Senesi, N., Polo, A., 2008. Soil fulvic acidcharacteristics and proton binding behavior as affected by long-term municipalwaste compost amendment under semi-arid environment. Geoderma 146,363e369.
Greaves, M.P., Wilson, M.J., 1969. The adsorption of nucleic acids by montmoril-lonite. Soil Biology and Biochemistry 1, 317e323.
Grundmann, G.L., 2004. Spatial scales of soil bacterial diversity - the size of a clone.FEMS Microbiology Ecology 48, 119e127.
Haberhauer, G., Gerzabek, M.H., 1999. Drift and transmission FT-IR spectroscopy offorest soils: an approach to determine decomposition processes of forest litter.Vibrational Spectroscopy 19, 413e417.
Handl, S., Dowd, S.E., Garcia-Mazcorro, J.F., Steiner, J.M., Suchodolski, J.S., 2011.Massive parallel 16S rRNA gene pyrosequencing reveals highly diverse fecal
bacterial and fungal communities in healthy dogs and cats. FEMS MicrobiologyEcology 76, 301e310.
Hansel, C.M., Feendorf, S., Jardine, J.M., Francis, C.A., 2008. Changes in bacterialand archaeal community structure and functional diversity along a geochemi-cally variable soil profile. Applied and Environmental Microbiology 74,1620e1633.
Hedlund, B., Gosink, J.J., Staley, J.T., 1996. Phylogeny of Prosthecobacter, the fusiformcaulobacters: members of a recently discovered division of the bacteria. Inter-national Journal of Systematic Bacteriology 46, 960e966.
Ishak, H.D., Plowes, R., Sen, R., Kellner, K., Meyer, E., Estrada, D.A., Dowd, S.E.,Mueller, U.G., 2011. Bacterial diversity in Solenopsis invicta and Solenopsisgeminata Ant Colonies characterized by 16S amplicon 454 pyrosequencing.Microbial Ecolology 61, 821e831.
Janik, L.J., Skjemstad, J., Shepherd, K., Spouncer, L., 2007. The prediction of soilcarbon fractions using mid-infrared-partial least square analysis. AustralianJournal of Soil Research 45, 73e81.
Janssen, P.H., 2006. Identifying the dominant soil bacterial taxa in libraries of 16SrRNA and 16S rRNA genes. Applied and Environmental Microbiology 72,1719e1728.
Kabir, M., Chotte, J.L., Rahman, M., Bally, R., Monrozier, L.J., 1994. Distribution of soilfractions and location of soil bacteria in a vertisol under cultivation andperennial grass. Plant Soil 163, 243e255.
King, M.G., 2010. Enhancing soil carbon storage for carbon remediation: potentialcontributions and constraints by microbes. Trends in Microbiology 19, 75e84.
Kirchmann, D.L., Dittel, A.I., Malmstrom, R.R., Cottrell, M.T., 2005. Biogeography ofmajor bacterial groups in the Delaware Estuary. Limnology and Oceanography50, 1697e1706.
Kong, A.Y.Y., Scow, K.M., Córdova-Kreylos, A.L., Holmes, W.E., Six, J., 2011. Microbialcommunity composition and carbon cycling within soil microenvironments ofconventional, low-input, and organic cropping systems. Soil Biology andBiochemistry 43, 20e30.
Lauber, L.C., Hamady, M., Knight, R., Fierer, N., 2009. Pyrosequencing-basedassessment of soil pH as a predictor of soil bacterial community structure at thecontinental scale. Applied and Environmental Microbiology 75, 5111e5120.
Lozupone, C., Knight, R., 2005. UniFrac: a new phylogenetic method for comparingmicrobial communities. Applied and Environmental Microbiology 71,8228e8235.
McCaig, A.E., Glover, L.A., Prosser, J.I., 1999. Molecular analysis of bacterialcommunity structure and diversity in unimproved and improved upland grasspastures. Applied and Environmental Microbiology 65, 1721e1730.
McCune, B., Grace, J.B., 2002. Analysis of Ecological Communities. MjM Software,Gleneden Beach, OR.
Mummey, D., Stahl, P., 2004. Analysis of soil whole- and inner-microaggregatebacterial community structures. Microbial Ecology 48, 41e50.
Mummey, D., Holben, W., Six, J., Stahl, P., 2006. Spatial stratification of soil bacterialpopulations in aggregates of diverse soils. Microbial Ecology 51, 404e411.
Nguyen, T., Janik, L.J., Raupach, M., 1991. Diffuse reflectance infrared fourier trans-form (DRIFT) spectroscopy in soil studies. Australian Journal of Soil Research 29,49e67.
O’Donnell, A.G., Godfellow, M., Hawksworth, D.L., 1995. Theoretical and practicalaspects of the quantification of biodiversity among microorganisms. In:Hawksworth, D.L. (Ed.), Biodiversity, Measurement and Estimation. The RoyalSociety, pp. 65e73.
Peck, J.E., 2010. Multivariate Analysis for Community Ecologists: Step-by-step UsingPC-ORD. MjM Software, Gleneden Beach, OR.
Ranjard, L., Poly, F., Combrisson, J., Richaume, A., Gourbiere, F., Thioulouse, J.,Nazaret, S., 2000. Heterogeneous cell density and genetic structure of bacterialpools associated with various soil microenvironments as determined byenumeration and DNA fingerprinting approach (RISA). Microbial Ecology 39,263e272.
Roesch, L.F., Fulthrope, R.R., Riva, A., Casella, G., Hadwin, A.K.M., Kent, A.D.,Daroub, S.M., Camargo, F.A.O., Farmerie, W.G., Triplett, E.W., 2007. Pyrose-quencing enumerates and contrasts soil microbial diversity. The InternationalSociety for Microbial Ecology Journal 1, 283e290.
Schloss, P.D., Handelsman, J., 2005. Introducing DOTUR, a computer program fordefining operational taxonomic units and estimating species richness. Appliedand Environmental Microbiology 71, 1501e1506.
Schutter, M.E., Dick, R.P., 2002. Microbial community profiles and activities amongaggregates of winter fallow and cover-cropped soils. Soil Science Society ofAmerica Journal 66, 142e153.
Sessitsch, A., Weilharter, A., Gerzabek, M.H., Kirchmann, H., Kandeler, E., 2001.Microbial population structures in soil particle size fractions of a long-termFertilizer field Experiment. Applied and Environmental Microbiology 69,4215e4224.
Singleton, D.R., Furlong, M.A., Peacock, A.D., White, D.C., Coleman, W.B.,Whitman, W.B., 2003. Solirubrobacter pauli gen. nov., sp. nov., a mesophilicbacterium within the Rubrobacteridae related to common soil clones.International Journal of Systematic and Evolutionary Microbiology 53,485e490.
Six, J., Elliott, E.T., Paustian, K., Doran, J.W., 1998. Aggregation and soil organicmatter storage in cultivated and native grassland soils. Soil Science Society ofAmerica Journal 62, 1367e1377.
Six, J., Elliott, E.T., Paustian, K., 2000. Soil macroaggregate turnover and micro-aggregate formation: a mechanism for C sequestration under no-tillage agri-culture. Applied and Environmental Microbiology 32, 2099e2103.

M. Davinic et al. / Soil Biology & Biochemistry 46 (2012) 63e7272
Skjemstad, J.O., Le Feuvre, R.P., Prebble, R.E., 1990. Turnover of soil organic matterunder pasture as determined by 13C natural abundance. Australian Journal ofSoil Research 28, 267e276.
Texas Alliance for Water Conservation (TAWC), 2010. Report on an integratedapproach to water conservation for agriculture in the Texas southernhigh plains. http://www.twdb.state.tx.us/assistance/conservation/agdemos.asppp. 1-228, (accessed 17.07.11).
Unger, P.W., Pringle, F.B., 1981. Texas Agricultural Experiment Station Bulletin,B-1372. College Station.
Yoshinaka, T., Yano, K., Yamaguchi, H., 1973. Isolation of a highly radioresistantbacterium, Arthrobacter radiotolerans nov. sp. Agricultural and BiologicalChemistry 37, 2269e2275.
Zhang, L., Xu, Z., 2008. Assessing bacterial diversity in soil: a brief review. Journal ofSoils and Sediments 8, 379e388.