Pulse radiolysis of supercritical water. 3. Spectrum and thermodynamics of the hydrated electron
9
Pulse Radiolysis of Supercritical Water. 3. Spectrum and Thermodynamics of the Hydrated Electron David M. Bartels* Notre Dame Radiation Laboratory, Notre Dame, Indiana 46556 Kenji Takahashi, † Jason A. Cline, ‡ Timothy W. Marin, § and Charles D. Jonah Chemistry DiVision, Argonne National Laboratory, Argonne, Illinois 60439 ReceiVed: September 21, 2004; In Final Form: October 29, 2004 Spectra of the hydrated electron in pressurized light and heavy water at temperatures up to and beyond the critical temperature are reported, for wavelengths between 0.4 and 1.7 μm. In agreement with previous work, spectra can be approximately represented by a Gaussian function on the low-energy side, and a Lorentzian function on the high-energy side in subcritical water, but deviations from this form are very clear above 200 °C. The spectrum shifts strongly to the red as temperature rises. At supercritical temperatures, the spectrum shifts slightly to the red as density decreases, and the Gaussian-Lorentzian form is a very poor description. Application of spectral moment theory allows one to make an estimate of the average size of the electron wave function and of its kinetic energy. It appears that for water densities below about 0.6 g/cc, and down to below 0.1 g/cc, the average radius of gyration for the electron remains constant at around 3.4 Å, and its absorption maximum is near 0.9 eV. For higher densities, the electron is squeezed into a smaller cavity and the spectrum is shifted to the blue. The enthalpy and free energy of electron hydration are derived as a function of temperature on the basis of existing equilibrium data and absolute proton hydration energies derived from the cluster-based common point method. In a discussion, we compare the effective “size” of the hydrated electron derived from both methods. Introduction Technological interest continues to be great in the use of supercritical water as an environmentally friendly “green” reaction medium for destruction of hazardous waste and even some synthesis schemes. 1-3 It is little appreciated that super- critical water is already commonly used as the heat transfer medium in modern high-temperature electrical power plants. It has been proposed that this technology should also be extended to new nuclear power plants, but the issue of water radiolysis and radiation-induced corrosion must be addressed. Hydrated electrons are of great importance in the radiation-induced chemistry at all temperatures 4-6 and are also easy to detect because of their intense absorption in the red and near-IR spectral regions. In the first paper of this series we reported the unusual reaction rates of radiation-generated hydrated electrons with hydrophobic solutes O 2 and SF 6 . 7 In a second contribution, the diffusion-limited reaction of electrons with nitrobenzene was reported. 8 In this paper we present our detailed measurements of the hydrated electron spectrum at temperatures up to 400 °C in both light and heavy water, and as a function of density (pressure) in the supercritical heavy water at 375 °C. The spectra can be integrated to infer ground-state energetic properties that can ultimately be correlated with reaction rates. The intense optical absorption spectrum of the hydrated electron has been an object of great theoretical interest since its discovery. 9 The maximum absorption shifts strongly to the red as temperature is raised, from 720 nm at room temperature to ca. 1200 nm at 300 °C. 10 Its shape (plotted in energy units) has been well described by a Gaussian function on the low- energy side, and a Lorentzian function on the high-energy side. 11,12 For many years a debate raged over the bound to bound or bound to continuum nature of the spectrum. Only in recent years, with the advent of large-scale molecular dynamics modeling 13-17 and femtosecond laser probes of the photo- physics, 18-21 has the spectrum been unraveled to some extent. There is now no question that near the 720 nm maximum absorption at room temperature, the transition is primarily from bound state to bound state with an “s-to-p-like” transition character. 20 At 400 nm, recent experiments have demonstrated the transition is from bound state to continuum state. 21 The full wavelength and temperature dependence of this bound to bound vs bound to continuum character remains to be fully explored. In the absence of detailed information of the final state(s) of this transition, the spectrum has nevertheless yielded valuable information about the ground state by way of its moment integrals. 22-26 According to the moment analysis, the M(-1), M(0), and M(1) moments of the spectrum γ(ω) can be characterized with the following relationships (in atomic units): 〈r 2 〉 ) 〈|r av - r| 2 〉 is the thermally averaged dispersion in position * To whom correspondence should be addressed. E-mail: bartels@ hertz.rad.nd.edu. † Present address: Department of Chemistry and Chemical Engineering, Kanazawa University, 2-40-20 Kodatsuno, Kanazawa 920-8667, Japan. ‡ Present address: Spectral Sciences, Inc., 4 Fourth Ave., Burlington, MA 01803. § Present address: Benedictine University, Department of Chemistry, 5700 College Road, Lisle, IL 60532. M(-1) ) n 0 ∫ 0 ∞ ω -1 γ(ω)dω ) 2 3 〈r 2 〉 M(0) ) n 0 ∫ 0 ∞ γ(ω)dω ) 1 M(+1) ) n 0 ∫ 0 ∞ ωγ(ω)dω ) 4 3 〈T〉 (1) 1299 J. Phys. Chem. A 2005, 109, 1299-1307 10.1021/jp0457141 CCC: $30.25 © 2005 American Chemical Society Published on Web 01/27/2005
-
Upload
independent -
Category
Documents
-
view
2 -
download
0
Transcript of Pulse radiolysis of supercritical water. 3. Spectrum and thermodynamics of the hydrated electron

Pulse Radiolysis of Supercritical Water. 3. Spectrum and Thermodynamics of the HydratedElectron
David M. Bartels*Notre Dame Radiation Laboratory, Notre Dame, Indiana 46556
Kenji Takahashi,† Jason A. Cline,‡ Timothy W. Marin,§ and Charles D. JonahChemistry DiVision, Argonne National Laboratory, Argonne, Illinois 60439ReceiVed: September 21, 2004; In Final Form: October 29, 2004
Spectra of the hydrated electron in pressurized light and heavy water at temperatures up to and beyond thecritical temperature are reported, for wavelengths between 0.4 and 1.7 µm. In agreement with previous work,spectra can be approximately represented by a Gaussian function on the low-energy side, and a Lorentzianfunction on the high-energy side in subcritical water, but deviations from this form are very clear above 200°C. The spectrum shifts strongly to the red as temperature rises. At supercritical temperatures, the spectrumshifts slightly to the red as density decreases, and the Gaussian-Lorentzian form is a very poor description.Application of spectral moment theory allows one to make an estimate of the average size of the electronwave function and of its kinetic energy. It appears that for water densities below about 0.6 g/cc, and downto below 0.1 g/cc, the average radius of gyration for the electron remains constant at around 3.4 Å, and itsabsorption maximum is near 0.9 eV. For higher densities, the electron is squeezed into a smaller cavity andthe spectrum is shifted to the blue. The enthalpy and free energy of electron hydration are derived as afunction of temperature on the basis of existing equilibrium data and absolute proton hydration energiesderived from the cluster-based common point method. In a discussion, we compare the effective “size” of thehydrated electron derived from both methods.
IntroductionTechnological interest continues to be great in the use of
supercritical water as an environmentally friendly “green”reaction medium for destruction of hazardous waste and evensome synthesis schemes.1-3 It is little appreciated that super-critical water is already commonly used as the heat transfermedium in modern high-temperature electrical power plants. Ithas been proposed that this technology should also be extendedto new nuclear power plants, but the issue of water radiolysisand radiation-induced corrosion must be addressed. Hydratedelectrons are of great importance in the radiation-inducedchemistry at all temperatures4-6 and are also easy to detectbecause of their intense absorption in the red and near-IRspectral regions. In the first paper of this series we reported theunusual reaction rates of radiation-generated hydrated electronswith hydrophobic solutes O2 and SF6.7 In a second contribution,the diffusion-limited reaction of electrons with nitrobenzene wasreported.8 In this paper we present our detailed measurementsof the hydrated electron spectrum at temperatures up to 400 °Cin both light and heavy water, and as a function of density(pressure) in the supercritical heavy water at 375 °C. The spectracan be integrated to infer ground-state energetic properties thatcan ultimately be correlated with reaction rates.The intense optical absorption spectrum of the hydrated
electron has been an object of great theoretical interest since
its discovery.9 The maximum absorption shifts strongly to thered as temperature is raised, from 720 nm at room temperatureto ca. 1200 nm at 300 °C.10 Its shape (plotted in energy units)has been well described by a Gaussian function on the low-energy side, and a Lorentzian function on the high-energyside.11,12 For many years a debate raged over the bound to boundor bound to continuum nature of the spectrum. Only in recentyears, with the advent of large-scale molecular dynamicsmodeling13-17 and femtosecond laser probes of the photo-physics,18-21 has the spectrum been unraveled to some extent.There is now no question that near the 720 nm maximumabsorption at room temperature, the transition is primarily frombound state to bound state with an “s-to-p-like” transitioncharacter.20 At 400 nm, recent experiments have demonstratedthe transition is from bound state to continuum state.21 The fullwavelength and temperature dependence of this bound to boundvs bound to continuum character remains to be fully explored.In the absence of detailed information of the final state(s) of
this transition, the spectrum has nevertheless yielded valuableinformation about the ground state by way of its momentintegrals.22-26 According to the moment analysis, the M(-1),M(0), and M(1) moments of the spectrum !(") can becharacterized with the following relationships (in atomic units):
〈r2〉) 〈|rav- r|2〉 is the thermally averaged dispersion in position
* To whom correspondence should be addressed. E-mail: [email protected].
† Present address: Department of Chemistry and Chemical Engineering,Kanazawa University, 2-40-20 Kodatsuno, Kanazawa 920-8667, Japan.
‡ Present address: Spectral Sciences, Inc., 4 Fourth Ave., Burlington,MA 01803.
§ Present address: Benedictine University, Department of Chemistry,5700 College Road, Lisle, IL 60532.
M(-1) ) n0!0∞"-1!(") d" ) 23〈r
2〉
M(0) ) n0!0∞!(") d" ) 1
M(+1) ) n0!0∞"!(") d" ) 43〈T〉 (1)
1299J. Phys. Chem. A 2005, 109, 1299-1307
10.1021/jp0457141 CCC: $30.25 © 2005 American Chemical SocietyPublished on Web 01/27/2005
or (squared) radius of gyration for the electron about its averageposition, n0 is the refractive index of the medium, and 〈T〉 isthe corresponding kinetic energy. The formulas are derived fromdispersion relationships (Kramers-Kronig relations, f sum rules)or by analogy to atomic systems using a 1-electron representa-tion. Although the sum rules are rigorous, application of theseformulas to solvated electrons depends on two unprovenassumptions. First, the coupling of the electron to otherelectronic degrees of freedom must be sufficiently weak so thatoscillator strength is not significantly transferred to or from thesolvent spectrum. Second, the corrected local field at the electronis simply the vacuum optical field divided by n0. Bothassumptions seem to work very well for a wide range of solvatedelectron systems.22,26,27
The implication of these formulas is that the spectrum willprovide a direct measurement of the average “size” and energyof the electron, which must be changing substantially as afunction of temperature. This information should be valuablein understanding the structure, thermodynamics, and reactionsof the hydrated electron as a function of temperature. Thermo-chemical information on the conventional enthalpy and freeenergy of electrons in water is available up to 250 °C.28 Thesenumbers are useful in predicting reaction rates, but because theyare based on the proton convention (!Xf° ) 0; X ) H, G, S),they tell us little about the electron solvation structure. Recently,a new method based on water cluster energetics was introducedfor obtaining the absolute hydration thermodynamics for theproton (and all other ions), independent of extrathermodynamicassumptions.12,29,30 This method has now been applied to obtainthermodynamic information for classical ions over a wide rangeof temperatures and pressures.31 In our discussion, the methodis extended to obtain absolute solvation thermodynamics of thehydrated electron and the results are compared with theproperties deduced from the spectra.
Experimental Section
Hydrated electrons were generated by pulse radiolysis with20 MeV electrons in a high temperature/pressure flow cell asreported in our previous work.32,33 Transient absorption signalswere recorded with a pulsed xenon lamp/photodiode/transientdigitizer combination on time scales from nanoseconds tohundreds of microseconds, depending on the experiment.Wavelengths were selected using (nominally) 12 nm band-passfilters, with band centers ranging from 400 to 1700 nm. Thefilters were placed in a selector wheel that was rotated by astepper motor under computer control.Three different diode detectors have been used in recording
spectra, and their properties have been fully described else-where.33 An EG&G FND100 silicon diode was used for someinitial spectra from 400 to 1000 nm. A Germanium PowerDevices GAP520 InGaAs diode was used to record a numberof spectra over the full 400-1700 nm range in heavy water. Itwas subsequently realized that this diode has a severe wavelength-dependent secondary response characteristic, which makes fittingand reconvolution essential for comparison of different wave-lengths. The FND100 diode also suffers from this problem to alesser extent between 850 and 1000 nm. Our procedure forcorrecting data and extracting spectra with these detectors isdescribed in detail elsewhere.33 A third diode used is theGermanium Power Devices GMP566 germanium diode, whichwe now prefer for most applications. Its speed (55 MHz) isslower than the other diodes mentioned above, but we find awavelength-independent biexponential response for wavelengths
shorter than 1600 nm, and very good quantum efficiencythroughout the visible and near-IR. The wavelength-independentresponse makes measurement of the spectrum much moreprecise, even though convolutions are required for kinetic dataanalysis. The response of this diode changes to the red of 1600nm, and special integration techniques are needed for thisspectral region.It is difficult to normalize the kinetics recorded in our high-
temperature/pressure experiments for shot-to-shot variations inthe linac pulse, because the all-metal cell construction andconnection to pumps defeats practical attempts to integrate thecharge/pulse. For most experiments this means that we rely onthe linac pulse amplitude and the flowing sample pressure andintegrity to be stable over many minutes while spectra arecollected, and most often the linac remains stable to the orderof 2-3% and pressure fluctuations are on the order of (0.3bar. The light water spectra reported below were extracted fromexperiments in the presence of ca. 0.1 molal H2 and with pHgreater than 11. Under these conditions, all radicals convert tohydrated electrons and a pure second-order decay can berecorded.34 To confirm the accuracy of the (integrated) spectra,the decay traces at each wavelength were fit from about 2 µsafter the radiolysis pulse to obtain the quantity !L/2k, where Lis the cell path length, k is the second-order reaction rateconstant, and ! is the molar extinction coefficient at the probewavelength. All of these quantities are independent of theapplied dose, and only ! depends on the wavelength, so theleast-squares analysis simultaneously smoothes the data andnormalizes for shot-to-shot variations. It was found possible toapply this analysis in light water up to about 300 °C, abovewhich pure second-order decay no longer applies.To record heavy water spectra, several hundred milliliters of
pure 99.5+% D2O were recirculated with constant argonsparging of the reservoir. The absorption decay near theabsorption maximum was first fit to an arbitrary sum of threeexponential decay functions. Then the decay shape was heldconstant and the amplitude of the fitting function was used todetermine the spectral intensity at each wavelength. Though welooked carefully, there was no indication of any shift in thespectrum over time that might indicate presence of a secondspecies in the kinetics.To account for the changing shape of the decay transients
due to the secondary response of the GMP566 diode beyond1600 nm, the entire absorption trace in D2O was integrated fromzero to several microseconds after the electron pulse. On thebasis of our previous investigation,33 the integrated transmittancemust be conserved independent of the actual impulse responseof the detector. In the limit of small absorbance (optical density< 0.1), the integrated absorbance is also conserved. Conse-quently, to obtain the infrared points beyond 1600 nm wecompared the integrated absorption at those wavelengths withthat of two or more wavelengths near the absorption maximum(to the blue of 1600 nm).A small absorption by the sapphire windows is evident across
the entire visible region of the spectrum, where a decay isobserved with a time constant >100 µs and an intensitygradually increasing toward shorter wavelengths. In most cases,the window absorption is unobservable at wavelengths g800nm, even at the highest radiation doses applied. Because theheavy water hydrated electron absorption decays in <1 µs, thesapphire absorption can be corrected for by adding an additionalbaseline offset to the fit. The magnitude of the sapphireabsorption varied from day to day, depending on the focusingof the linac beam, but typically the hydrated electron absorption
1300 J. Phys. Chem. A, Vol. 109, No. 7, 2005 Bartels et al.
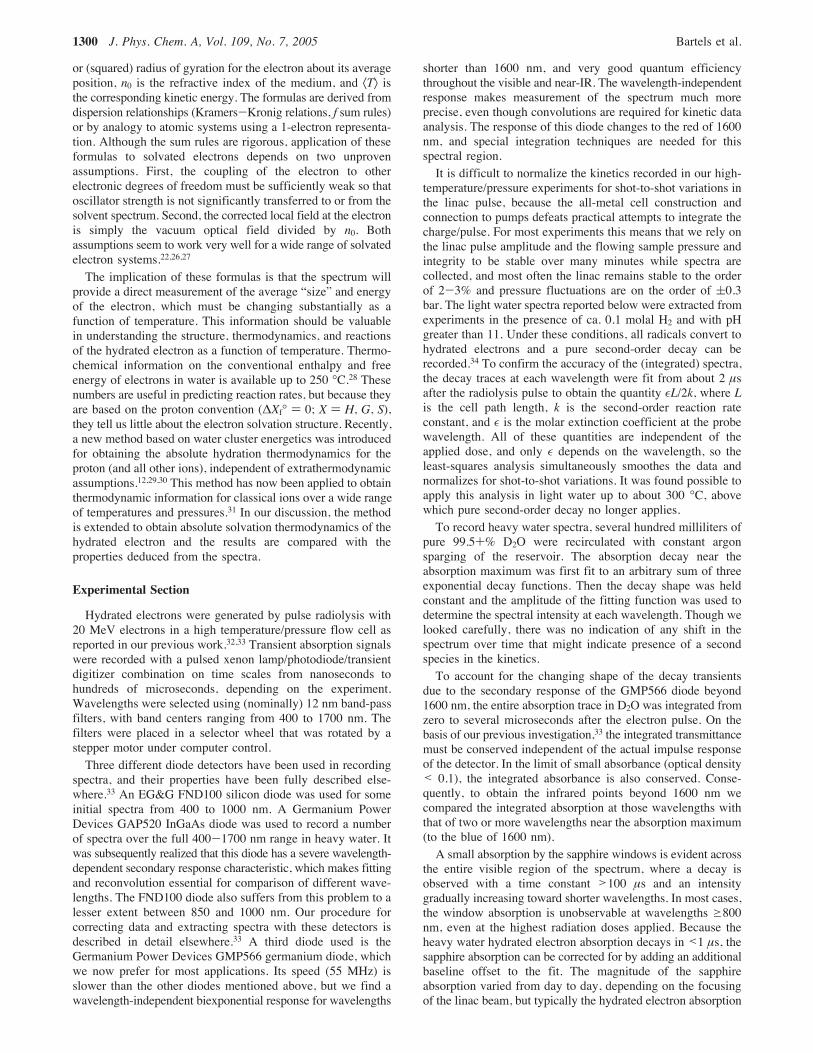
intensity at the absorption maximum was "100 times greaterthan the intensity of the sapphire absorption at the shortestwavelength (400 nm). The effect of the correction becomesincreasingly important for lower water densities, because theintensity of the electron absorption decreases while the sapphireabsorption stays constant. Figure 1 shows the fitted absorptionspectra for the hydrated electron and sapphire absorption at 375°C, 170 bar, and density ) 0.10 g/cm3. This is the lowest waterdensity used in these studies, i.e., the worst case where thesapphire absorption is at its maximum relative intensity. A plotof heavy water density vs temperature at 250 bar is illustratedin Figure 2, as well as a plot of the heavy water density vspressure at 375 °C, just above the critical temperature. Theseplots reflect the density conditions under which all the presenteddata were collected.To calculate densities of light water in this study from the
measured temperature and pressure, we use a set of functionsbased on the IAPWS-IF97 formulation for light water PVTrelations.35 Alternatively, water density is supplied by theSUPCRT92 program.36 The light water dielectric constant istaken from the review by Uematsu and Franck.37 Heavy waterdensities are taken from the tabulation and equation of state ofHill et al.38
Results
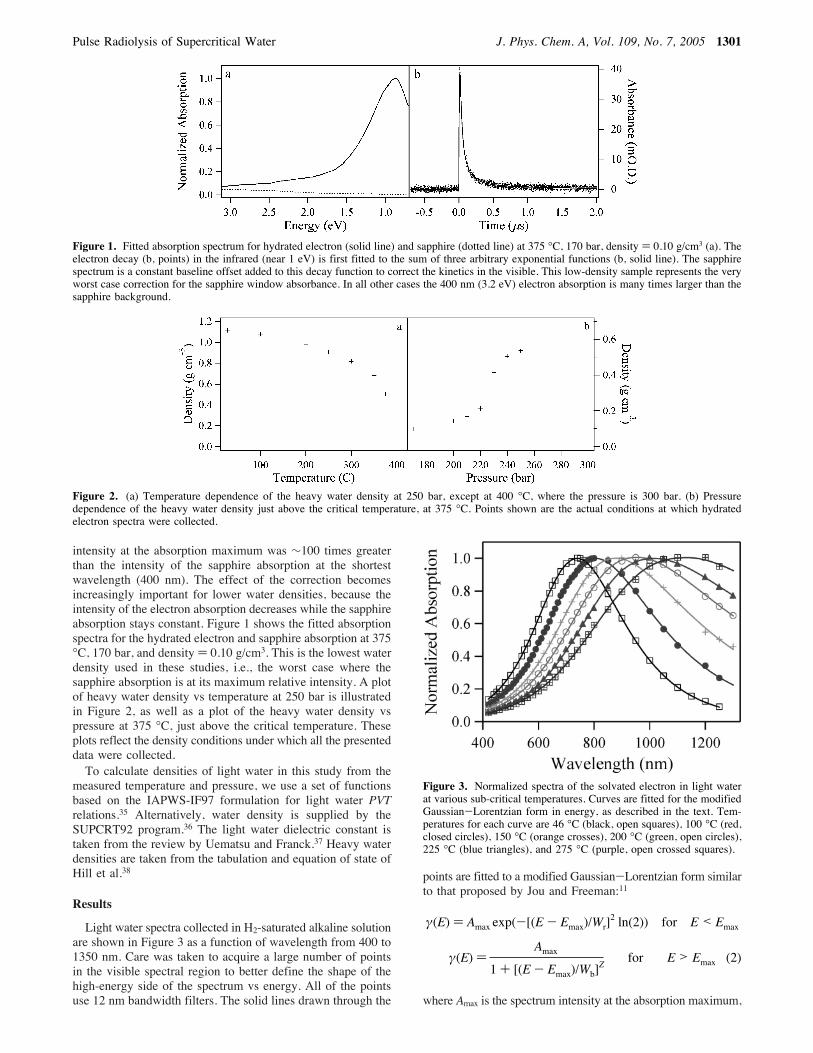
Light water spectra collected in H2-saturated alkaline solutionare shown in Figure 3 as a function of wavelength from 400 to1350 nm. Care was taken to acquire a large number of pointsin the visible spectral region to better define the shape of thehigh-energy side of the spectrum vs energy. All of the pointsuse 12 nm bandwidth filters. The solid lines drawn through the
points are fitted to a modified Gaussian-Lorentzian form similarto that proposed by Jou and Freeman:11
where Amax is the spectrum intensity at the absorption maximum,
Figure 1. Fitted absorption spectrum for hydrated electron (solid line) and sapphire (dotted line) at 375 °C, 170 bar, density ) 0.10 g/cm3 (a). Theelectron decay (b, points) in the infrared (near 1 eV) is first fitted to the sum of three arbitrary exponential functions (b, solid line). The sapphirespectrum is a constant baseline offset added to this decay function to correct the kinetics in the visible. This low-density sample represents the veryworst case correction for the sapphire window absorbance. In all other cases the 400 nm (3.2 eV) electron absorption is many times larger than thesapphire background.
Figure 2. (a) Temperature dependence of the heavy water density at 250 bar, except at 400 °C, where the pressure is 300 bar. (b) Pressuredependence of the heavy water density just above the critical temperature, at 375 °C. Points shown are the actual conditions at which hydratedelectron spectra were collected.
Figure 3. Normalized spectra of the solvated electron in light waterat various sub-critical temperatures. Curves are fitted for the modifiedGaussian-Lorentzian form in energy, as described in the text. Tem-peratures for each curve are 46 °C (black, open squares), 100 °C (red,closed circles), 150 °C (orange crosses), 200 °C (green, open circles),225 °C (blue triangles), and 275 °C (purple, open crossed squares).
!(E) ) Amax exp(-[(E - Emax)/Wr]2 ln(2)) for E < Emax
!(E) )Amax
1 + [(E - Emax)/Wb]Z for E > Emax (2)
Pulse Radiolysis of Supercritical Water J. Phys. Chem. A, Vol. 109, No. 7, 2005 1301

Emax is the energy at the absorption maximum, and Wb and Wrare the half-width at half-maximum of the Lorentzian andGaussian on the blue and red sides, respectively. Spectra forthe hydrated electron in heavy water up to 350 °C are plottedin Figure 4 on an energy scale to illustrate the modifiedGaussian-Lorentzian form. Thanks to the lower vibrationalfrequencies in D2O, spectra could be recorded out to 1700 nmin the IR. The spectrum in liquid up to 350 °C is essentiallyindependent of the applied pressure to 350 bar. The spectrabelow 100 °C can be fit very well using an exponent Z ) 2 onthe blue side, just as found by Jou and Freeman.11 However,above this temperature the empirical fit becomes worse, andwe are forced to use Z > 2 to properly represent the width.Note that with this slight modification to the formula, theparametersWb andWr keep the same meaning as the half-widthat half-maximum on the blue and red sides, respectively. Above300 °C, the spectrum amplitude near 400 nm is no longer well-represented by this modified formula and the blue tail issomewhat underestimated.The following fit parameters of eq 2 reasonably describe the
normalized hydrated electron spectra between 400 nm and the
infrared cutoff in H2O and D2O up to 350 °C:
where T is in °C. In Figure 5 the fitted parameters for lightwater are plotted vs temperature (symbols) as well as thepolynomial fits above (smooth lines). Note that because the lightwater vibrational overtones cut off IR transmission, the Gaussianhalf-width cannot even be estimated in light water above 250°C, so the fit to Wr for heavy water is assumed for both speciesand does give a reasonable fit to the light water data. In Figure6 we plot the fitted parameters for heavy water (symbols) andpolynomial fits to these parameters (smooth lines).We find that the red (Gaussian) half-width Wr is virtually
identical in both H2O and D2O. The values of the parametersare in good agreement with earlier reports of Jou and Freeman11and of Christensen and Sehested.39 Likewise our fitted Emaxvalues agree with earlier work up to 200 °C. Christensen andSehested39 and more recently Wu et al.10 reported a fairly suddenchange in the temperature derivative of Emax above 200 °C, anda limiting value at about 1.2 eV. We also see a slight change inthe slope, but it occurs closer to 300 °C, and the limiting valueappears to be ca. 0.9 eV. We suspect that the spectra of previousworkers were distorted by the photodiode secondary responseproblem.33 However, the position defined as the maximum alsodepends strongly on the quality of the data in the wings andthe functional form assumed for the spectrum shape.The blue (Lorentzian) half-width Wb is virtually independent
of temperature, as also observed by Jou and Freeman11 (to 108°C) and by Christensen and Sehested.39 However, we agree withthe values of Christensen and Sehested, just over 0.5 eV, rather
Figure 4. Relative absorption of the hydrated electron in heavy waterplotted vs photon energy.
Figure 5. Fitting parameters for the spectra of hydrated electron inlight water (symbols) and polynomial fits to the points (smooth lines).Because vibrational overtone absorptions disallow obtaining Wr above250 °C in light water, the fit to Wr for heavy water is superimposed,extending up to 350 °C.
Figure 6. Fitting parameters (symbols) for heavy water solvatedelectron spectra, using the modified Gaussian-Lorentzian form de-scribed in the text. The pressure is 250 bar. The lines represent thesmoothed values for the light water spectra, for comparison. There isno significant difference found in this study in the red side half-widthWr. The heavy water Wb half-width is slightly smaller and the Emax isslightly larger than the corresponding light water parameters.
Z ) 1.95 + 0.00129T
Wr ) 0.281 + 3.65 # 10-3T - 5.14 # 10-5T2 + 3.63 #10-7T3 - 1.18 # 10-9T4 + 1.40 # 10-12T5
Emax ) 1.79 - 0.00250T + 2.54 # 10-17T6 Wb ) 0.51in light water
Emax ) 1.84 - 0.00268T + 4.13 # 10-17T6 Wb ) 0.49in heavy water
1302 J. Phys. Chem. A, Vol. 109, No. 7, 2005 Bartels et al.

than the lower values of Jou and Freeman around 0.45-0.48eV. We suspect that the Jou and Freeman widths are too smallbecause they used a photomultiplier detector with exponentialdrop off in quantum efficiency in the red. This means that thelight actually being detected is heavily weighted toward the blueside of the monochromator band-pass. On the blue slope of thesolvated electron spectrum, this implies the measured absorptionwill be smaller than it ought to be at the nominal centerwavelength. Our photodiode detector does not have a largechange in quantum efficiency with wavelength, and so thisdistortion will not be present.In Figure 7, heavy water spectra are shown for several
densities at 375 °C (reduced temperature of Tr ) 1.01 in heavywater). Intermediate densities (near the critical density of 0.36g/cc) are particularly difficult to obtain with good precisionunder supercritical conditions because of the great sensitivityof the fluid density to temperature and pressure fluctuations. Asmall red shift of the spectrum can be detected, and the relativeamplitude of the blue tail increases as the density decreases.Still, there is relatively little change in the spectrum given theenormous density change in the water, suggesting that the innersolvation shell for the electrons is nearly constant.
Except at the highest density, these spectra cannot be fit withthe modified Gaussian-Lorentzian form described above. Theblue tail is far too large. To describe the spectra, we postulatea bound to bound transition with Gaussian line shape, and abound to continuum tail which is just a power law E-R of theenergy. To “switch on” the bound to continuum transition, wemultiply the power law (exponent -R) by a sigmoidal function(cutoff parameters Ec and Wc). The overall expression is
where B and C are merely empirically fitted amplitudeparameters. This function provides enough flexibility to fit/interpolate all of the spectra we have collected.The spectra in both light and heavy water have been fit with
this function, and the hope is to find a set of parameters thatwill tell us something meaningful about the changes in theelectron solvation environment.Wr is identical to the Gaussian-Lorentizian fits shown above. The cutoff parameter Wc fallsbetween 0.1 and 0.2 eV. Some of the parameters (Emax, Ec, andexponent R) required to fit the heavy water spectra are plottedvs density in Figure 8. The bound-continuum cutoff parameterEc tracks Emax, roughly 0.3-0.4 eV higher in energy. The largestchanges come in the exponent of the power law that describesthe blue tail. Theory suggests that at sufficiently high photonenergy this exponent should be 3.5 for an s-to-p symmetrybound-continuum transition, and the exponent should be largerthan 2.5 for inverse second moments of the spectrum toconverge.25 Spectra for high-density water may all be fit withpower law exponents in the 3-4 range, but the lower-densitywater spectra (below 0.4 g/cm3) require exponents well below2.5.We conclude from this fitting exercise that we have not
obtained line shape parameters any more meaningful than thosefrom the empirical Gaussian-Lorentzian form. This is disap-pointing but is not a great surprise, because quantum moleculardynamics simulations of the hydrated electron suggest thereshould be three nondegenerate “s-to-p like” bound to boundtransitions with different amplitudes,15,17 in addition to thebound-continuum tail which need not look like a simple powerlaw decay near the threshold energy.25 Including all of thesefeatures of the simulation would require too many parametersfor a unique fit. In the absence of a more rigorous description,the fit based on eq 3 is nevertheless useful for interpolationand integration. To avoid biasing any future fitting attempts byother workers, we present all of our normalized spectra in tabularform in Part A of the Supporting Information.Moment Analysis. Once the line shapes are established,
calculation of the moments M(+1) and M(-1) via eq 1 isstraightforward. The absolute extinction coefficients are notneeded because the unnormalized M((1) integrals can bedivided by the unnormalizedM(0) integral, which has the samearbitrary scale factor. The data, interpolated with the equationsgiven above, contain most of the spectral information, but therestill is missing information extending to zero frequency beyondthe infrared and extending to infinite frequency beyond theultraviolet. Assumptions must be made on the behavior of thesewings of the spectrum. On the basis of the behavior of the redside of the heavy water spectrum up to 100 °C, a Gaussianfunction is an excellent representation even though it does nothave the proper limiting value at zero. Therefore we carry outthe integration using eq 3 down to a truncation energy of 0.2
Figure 7. Normalized spectra of solvated electrons in heavy water at375 °C, at different densities of the supercritical fluid. Relativeamplitude of the blue tail increases as the density decreases.
Figure 8. Selected fitting parameters for hydrated electron spectra vsdensity in heavy water, based on eq 3. Points connected by lines areall at 375 °C at various pressures. The other points correspond todifferent temperatures at 250 bar pressure.
!(E) ) B exp(-[(E - Emax)/Wr]2 ln(2)) +
CE-R
1 + exp[(Ec - E)/Wc](3)
Pulse Radiolysis of Supercritical Water J. Phys. Chem. A, Vol. 109, No. 7, 2005 1303
eV. On the blue side of the spectra, we have only collecteddata to 3.2 eV. We have used simple power law extensions ofthe spectra to integrate from 3.2 eV out to infinity. Severaldifferent values of the power law exponent -R were tried toinvestigate the sensitivity of the calculated moments to thisapproximation.Figure 9 illustrates the temperature dependence of the average
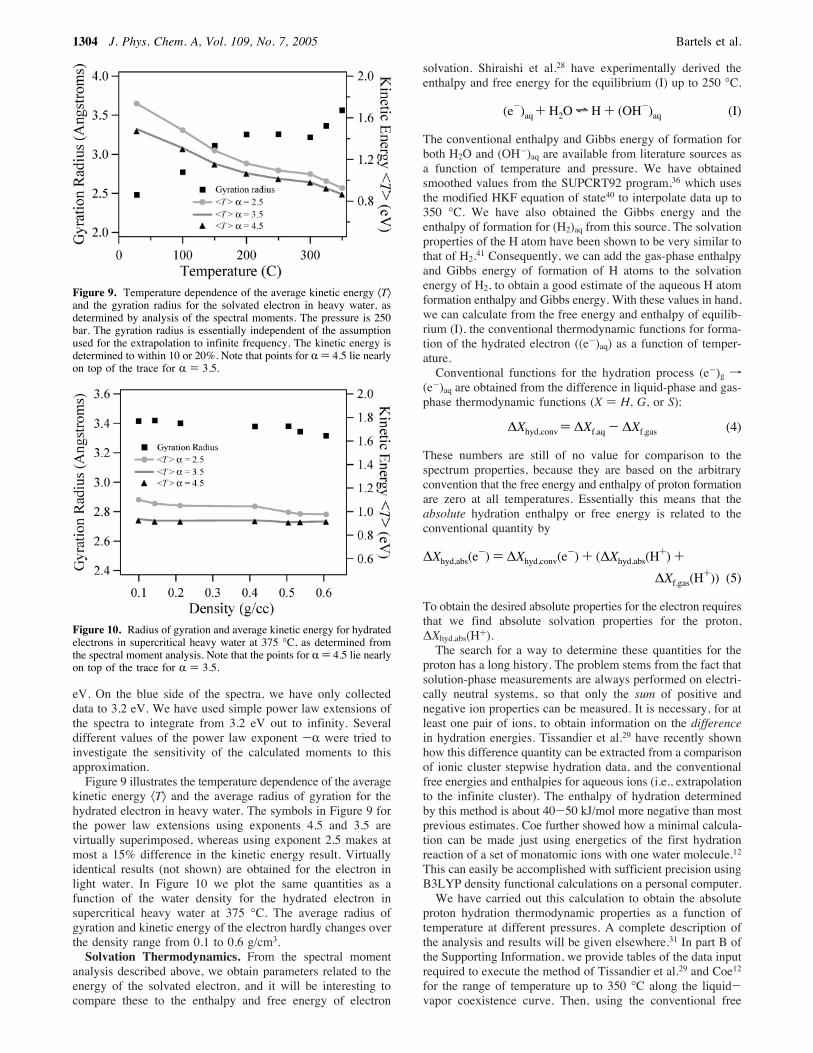
kinetic energy 〈T〉 and the average radius of gyration for thehydrated electron in heavy water. The symbols in Figure 9 forthe power law extensions using exponents 4.5 and 3.5 arevirtually superimposed, whereas using exponent 2.5 makes atmost a 15% difference in the kinetic energy result. Virtuallyidentical results (not shown) are obtained for the electron inlight water. In Figure 10 we plot the same quantities as afunction of the water density for the hydrated electron insupercritical heavy water at 375 °C. The average radius ofgyration and kinetic energy of the electron hardly changes overthe density range from 0.1 to 0.6 g/cm3.Solvation Thermodynamics. From the spectral moment
analysis described above, we obtain parameters related to theenergy of the solvated electron, and it will be interesting tocompare these to the enthalpy and free energy of electron
solvation. Shiraishi et al.28 have experimentally derived theenthalpy and free energy for the equilibrium (I) up to 250 °C.
The conventional enthalpy and Gibbs energy of formation forboth H2O and (OH-)aq are available from literature sources asa function of temperature and pressure. We have obtainedsmoothed values from the SUPCRT92 program,36 which usesthe modified HKF equation of state40 to interpolate data up to350 °C. We have also obtained the Gibbs energy and theenthalpy of formation for (H2)aq from this source. The solvationproperties of the H atom have been shown to be very similar tothat of H2.41 Consequently, we can add the gas-phase enthalpyand Gibbs energy of formation of H atoms to the solvationenergy of H2, to obtain a good estimate of the aqueous H atomformation enthalpy and Gibbs energy. With these values in hand,we can calculate from the free energy and enthalpy of equilib-rium (I), the conventional thermodynamic functions for forma-tion of the hydrated electron ((e-)aq) as a function of temper-ature.Conventional functions for the hydration process (e-)g f
(e-)aq are obtained from the difference in liquid-phase and gas-phase thermodynamic functions (X ) H, G, or S):
These numbers are still of no value for comparison to thespectrum properties, because they are based on the arbitraryconvention that the free energy and enthalpy of proton formationare zero at all temperatures. Essentially this means that theabsolute hydration enthalpy or free energy is related to theconventional quantity by
To obtain the desired absolute properties for the electron requiresthat we find absolute solvation properties for the proton,!Xhyd,abs(H+).The search for a way to determine these quantities for the
proton has a long history. The problem stems from the fact thatsolution-phase measurements are always performed on electri-cally neutral systems, so that only the sum of positive andnegative ion properties can be measured. It is necessary, for atleast one pair of ions, to obtain information on the differencein hydration energies. Tissandier et al.29 have recently shownhow this difference quantity can be extracted from a comparisonof ionic cluster stepwise hydration data, and the conventionalfree energies and enthalpies for aqueous ions (i.e., extrapolationto the infinite cluster). The enthalpy of hydration determinedby this method is about 40-50 kJ/mol more negative than mostprevious estimates. Coe further showed how a minimal calcula-tion can be made just using energetics of the first hydrationreaction of a set of monatomic ions with one water molecule.12This can easily be accomplished with sufficient precision usingB3LYP density functional calculations on a personal computer.We have carried out this calculation to obtain the absolute
proton hydration thermodynamic properties as a function oftemperature at different pressures. A complete description ofthe analysis and results will be given elsewhere.31 In part B ofthe Supporting Information, we provide tables of the data inputrequired to execute the method of Tissandier et al.29 and Coe12for the range of temperature up to 350 °C along the liquid-vapor coexistence curve. Then, using the conventional free
Figure 9. Temperature dependence of the average kinetic energy 〈T〉and the gyration radius for the solvated electron in heavy water, asdetermined by analysis of the spectral moments. The pressure is 250bar. The gyration radius is essentially independent of the assumptionused for the extrapolation to infinite frequency. The kinetic energy isdetermined to within 10 or 20%. Note that points for R ) 4.5 lie nearlyon top of the trace for R ) 3.5.
Figure 10. Radius of gyration and average kinetic energy for hydratedelectrons in supercritical heavy water at 375 °C, as determined fromthe spectral moment analysis. Note that the points for R ) 4.5 lie nearlyon top of the trace for R ) 3.5.
(e-)aq+ H2Oh H + (OH-)aq (I)
!Xhyd,conv) !Xf,aq - !Xf,gas (4)
!Xhyd,abs(e-) ) !Xhyd,conv(e
-) + (!Xhyd,abs(H+) +
!Xf,gas(H+)) (5)
1304 J. Phys. Chem. A, Vol. 109, No. 7, 2005 Bartels et al.

energy of hydration for electrons given by Shiraishi et al.,28 wecan also obtain the absolute Gibbs energy of hydration. To usethis result in the Born theory of ion hydration, we use the samestandard state concentration in both liquid and gas phase, toremove the density dependence of the entropy.42 The resultsfor the electron are plotted up to 350 °C in Figure 11, alongwith absolute solvation free energy of other monatomic anions.43We should caution that in Figure 11 we have extrapolated theformulas provided by Shiraishi to 350 °C, even though datawere only collected to 250 °C. Our preliminary investigationof kinetics at the higher temperature suggests that the extrapola-tion for the critical equilibrium constant is not far off at 300°C. The curves for classical ions in Figure 11 are based oninterpolation of measured data as obtained from SUPCRT92.
DiscussionThe origin of the strong temperature dependence of the
hydrated electron spectrum has gone unexplained for manyyears. Several simulation attempts failed to reproduce theexperimental result. In a recent simulation of the hydratedelectron at temperatures up to the supercritical regime, Nicolaset al.15 claim to explain the temperature effectsnot as atemperature effect, but as a change in density of the water. Theirsimulation showed virtually no change in Emax between 25 and250 °C, when the density was kept at 1 g/cc, or between 250and 375 °C when the density was 0.6 g/cc. But when the densitywas allowed to change, the very large red shift was recovered.A very recent first principles Car-Parrinello MD simulation13compared room-temperature water conditions with supercriticalwater of density 0.73 g/cm3. A red shift was found, but becauseboth density and temperature were changed, no strong statementcan be made. It was found that the average number of watermolecules in the first shell decreased from about six to aboutfour under supercritical conditions.13 Laria and Skaf14 havereported path-integral MD studies of the hydrated electron as afunction of supercritical water density in the range 1.0 to 0.05g/cm3. A large increase in electron gyration radius was foundas a function of decreasing water density, especially below 0.1g/cc where the electron essentially “desolvated.”Our data in supercritical water would seem to be at variance
with most of these simulation results. The Emax of heavy waterspectra in Figure 7 change only slightly between 0.6 and 0.1g/cc, and the corresponding radius of gyration in Figure 9 doesnot change much at all. Thus there is little spectrum shift orchange in radius for a factor of 6 change in density. This directly
contradicts the result of Laria and Skaf.14 Nicolas et al.15 onlyreported simulation results for densities greater or equal to 0.46g/cc. However a very significant spectrum shift of over 0.2 eVwas still reported between 300 °C, 0.63 g/cc and 400 °C, 0.46g/cc and ascribed to the density change.Given the insights from simulation and the results of our
experiments, we suggest the following global picture for theelectron solvation by water: At densities below 0.5 g/cm3 (andabove 0.1 g/cm3) the electron attracts (perhaps four) solvatingwater molecules to an optimum distance, such that the radiusof gyration is about 3.4 Å. The electron absorbs in the infraredwith an Emax value near 1.0 eV. At higher water densities, thewater molecules begin to squeeze the electron wave function,reducing the radius of gyration and forcing a blue shift of thespectrum. However, it is not clear that there is no temperatureeffect on the spectrum or wave function if the density is keptconstant above 0.5 g/cc. A test of this assertion can be obtainedfrom existing experiments on the pressure dependence of Emaxnear room temperature, because it should not matter if thedensity is changed via temperature or pressure. Jou andFreeman44 measured the pressure-dependent blue shift of thespectrum at 27 °C up to 2000 kbar. When converted to a densityderivative, the blue shift amounts to 0.0049 eV/(kg/m3). Whensimilarly converted into a density change, the temperaturederivative of the spectrum near 27 °C amounts to 0.0017 eV/(kg/m3).11 Moreover, the Emax is quite a linear function oftemperature between -4 and +100 °C, but the water density isnot. Michael et al.45 report a spectrum at -4 °C in supercooledwater that is blue shifted relative to higher temperature, eventhough the bulk density is decreased. All of these comparisonsillustrate that although density is a very important componentof the spectral shift, temperature nevertheless plays another roleas well. Perhaps this involves changes to the hydrogen bondingnetwork and the connections to the water of the inner hydrationshell. The strong interactions of the electron with the innerhydration shell are only crudely represented by partial chargesand simple coulomb potentials in most simulations.We do observe a change in the relative amplitude of the blue
tail and the maximum absorption when we go to the low endof our density range in Figure 7. Virtually all simulations ofthe hydrated electron,15-17 supported by recent Raman observa-tions46-49 and ultrafast kinetics experiments,18,20,21 suggest thatthe hydrated electron spectrum consists primarily of threestrongly allowed bound to bound, s-to-p-like subbands. Theasymmetry in the spectrum is attributed primarily to thenondegeneracy of the three subbands, but the highest energysubband is also presumed to overlap with the onset of bound tocontinuum transitions that are responsible for the blue tail. Thechange in spectrum shape in low-density supercritical water sug-gests that the bound to continuum absorption gains more oscil-lator strength in this regime. One can only speculate that thisresults from fewer water molecules in the electron’s solvationshell. It will be interesting to record hydrated electron spectraat even lower densities to examine this trend in the future.The application of the moment analysis to the spectra has
given data on both the size and the kinetic energy of the electron.The classical Born theory for ion solvation also relates the ionradius (r) and the free energy of ionic hydration (!Ghyd), viathe equation (in atomic units):
where ! is the solvent dielectric constant. A comparison of Bornradius and the electron radius of gyration would therefore seem
Figure 11. Absolute Gibbs free energy of hydration of the electronand several other monatomic anions, calculated along the liquid-vaporcoexistence curve.
!Ghyd )12r(1! - 1) (6)
Pulse Radiolysis of Supercritical Water J. Phys. Chem. A, Vol. 109, No. 7, 2005 1305

to be instructive. In fact, one might expect that the free energyor enthalpy of hydration could be extrapolated from thespectrum.Given the large change in electron gyration radius implied
by the spectrum, on the basis of eq 6 we expected a large changein the electron hydration energy. The absolute free energy ofelectron hydration is plotted in Figure 11. It is remarkablyinsensitive to temperature and qualitatively resembles thehydration free energy of the other monatomic ions plotted. Theelectron free energy is least negative of these ions, and so oneexpects it must be the “largest.” The nominal Born radius forthe electron and the nominal Born radius for the iodide ion (forcomparison) are both plotted in Figure 12 as a function oftemperature, along with the radius of gyration from momentanalysis of the spectrum. There is no qualitative resemblanceof the two determinations of the electron radius.At this point we began to reconsider the assumptions of the
Born theory, which is based on classical electrostatics for thecharging of a sphere in a dielectric continuum. Nowhere in theBorn theory is quantum zero point energy considered. In theelectron solvation process, a major part of the work involveslocalizing the electron into a small volume, thereby increasingthe electron kinetic energy. A proper thermodynamic cycle forthe quantum particle could be constructed by first localizingthe particle within the sphere of radius r, and then charging thesphere in the dielectric medium as done in the Born theory.Neglecting the small entropy contribution of electron localiza-tion50 (ca. 6 kJ mol-1 at 300 K), a corrected Born theoryexpression would be
From the spectral moment analysis, we have a measurement ofthe average electron kinetic energy, which is in the range 100-200 kJ/mol and depends on the temperature. A simple correctioncan therefore be made, by subtracting the electron kinetic energyfrom the free energy of hydration. This “classical” free energycan then be used in the Born equation to estimate a “corrected”Born radius. This quantity is also plotted in Figure 12 as theopen circles. With this correction made, we have a qualitativelycorrect behavior of the electron’s radius, showing an increasewith temperature.
At room temperature, the radius of gyration and correctedBorn radius nearly coincide, but at higher temperature the radiusof gyration is larger than the effective Born radius. Severalstudies suggest that the Born radius of a classical ion should beinterpreted essentially as the radius of the first peak in the ion-oxygen radial distribution function g(r).51,52 Several simulationstudies for the hydrated electron find this first (small) peak ing(r) at a somewhat larger value than the radius of gyration,15,17so one might expect that the corrected Born radius in Figure12 should be slightly larger than the radius of gyration.Nevertheless, the overall agreement between the two experi-mental radii is very good, and we can have some confidencethat the assumptions made in both the Born theory analysis andthe spectral moment analysis are reasonable.
SummaryWe have carried out careful measurements of the hydrated
electron absorption spectrum in both light and heavy waterbetween 400 and 1700 nm, and up to 400 °C. At 375 °C inheavy water, the density was changed between 0.6 and 0.1g/cm3. Fitting parameters are reported to allow estimates of thespectrum amplitude under all of these conditions. As reportedin the past, the spectrum appears to be Gaussian on the redside but Lorentzian on the blue side, below 100 °C at 1 atmpressure. At higher temperatures, deviations from this empiricalform become apparent. In supercritical water at 0.5 g/cc andbelow, Gaussian-Lorentzian is a very bad description. Insteadwe fit to a sum of bound-bound Gaussian and bound-continuumpower law functions.The spectrum is integrated to obtain information on the
electron kinetic energy and the radius of gyration. There is littleeffect of water density on these quantities in supercritical water,in contradiction to some recent simulation predictions. We haveused literature data to calculate the free energy of hydration forelectrons as a function of temperature up to 250 °C. Surprisingly,the Gibbs energy of hydration is insensitive to temperature. Weshow that by subtracting the electron kinetic energy from theGibbs energy, we can calculate an effective Born radius that isqualitatively consistent with the spectral moment theory radiusof gyration.
Acknowledgment. We thank Dr. Sergey Chemerisov formaintaining the electron accelerator used in this work. We aregreatly indebted to Prof. James Coe of Ohio State Universityfor consultations and calculations on the absolute protonhydration thermodynamics. Finally, we thank Dr. Peter Rosskyfor discussions on the quantum correction to the Born theoryexpression. Work at Notre Dame Radiation Laboratory and atArgonne National Laboratory (contract number W-31-109-ENG-38) was performed under the auspices of the Office of Science,Division of Chemical Science, US-DOE. Additional fundingfor K. Takahashi, J. A. Cline, and T. W. Marin was providedby US-DOE Nuclear Energy Research Initiative grants M9SF99-0276 and M2SF02-0060. This is document number NDRL-4566from the Notre Dame Radiation Laboratory.
Supporting Information Available: (A) Normalized spectrafor hydrated electrons in both light and heavy water, in tabularform. (B) Tables of the data used to calculate absolute protonand electron hydration free energy, and a brief description ofthe procedure used. This material is available free of chargevia the Internet at http://pubs.acs.org.
References and Notes(1) Savage, P. E.; Gopalan, S.; Mizan, T. I.; Martino, C. J.; Brock, E.
E. AIChE J. 1995, 41, 1723.
Figure 12. Nominal Born radii for the iodide ion and the electroncalculated from the absolute Gibbs energy of hydration and a correctedBorn radius obtained by first subtracting the electron kinetic energy.The corrected Born radius at least qualitatively resembles the gyrationradius obtained from moment analysis of the spectrum.
!Ghyd - 〈T〉 ) 12r(1! - 1) (7)
1306 J. Phys. Chem. A, Vol. 109, No. 7, 2005 Bartels et al.

(2) Savage, P. E. Chem. ReV. 1999, 99, 603.(3) Akiya, N.; Savage, P. E. Chem. ReV. 2002, 102, 2725.(4) Elliot, A. J. Rate Constants and G-Values for the Simulation of
the Radiolysis of Light Water over the Range 0-300 °C. Atomic Energyof Canada, Ltd.: Chalk River, Ontario, Canada, 1994.
(5) Elliot, A. J.; Ouellette, D. C.; Stuart, C. R. The TemperatureDependence of the Rate Constants and Yields for the Simulation of theRadiolysis of Heavy Water. Atomic Energy of Canada, Ltd.: Chalk River,Ontario, Canada, 1996.
(6) McCracken, D. R.; Tsang, K. T.; Laughton, P. J. Aspects of thephysics and chemistry of Water Radiolysis by Fast Neutrons and FastElectrons in Nuclear Reactors. Atomic Energy of Canada, Ltd.: Chalk River,Ontario, Canada, 1998.
(7) Cline, J. A.; Takahashi, K.; Marin, T. W.; Jonah, C. D.; Bartels,D. M. J. Phys. Chem. A 2002, 106, 12260.
(8) Marin, T. W.; Cline, J. A.; Bartels, D. M.; Jonah, C. D.; Takahashi,K. J. Phys. Chem. A 2002, 106, 12280.
(9) Hart, E. J.; Anbar, M. The Hydrated Electron; Wiley-Interscience:New York, 1970.(10) Wu, G.; Katsumura, Y.; Muroya, Y.; Li, X.; Terada, Y. Chem. Phys.
Lett. 2000, 325, 531.(11) Jou, F.-Y.; Freeman, G. R. J. Phys. Chem. 1979, 83, 2383.(12) Coe, J. V. Int. ReV. Phys. Chem. 2001, 20, 33.(13) Boero, M.; Parrinello, M.; Terakura, K.; Ikeshoji, T.; Liew, C. C.
Phys. ReV. Lett. 2003, 90.(14) Laria, D.; Skaf, M. S. J. Phys. Chem. A 2002, 106, 8066.(15) Nicolas, C.; Boutin, A.; Levy, B.; Borgis, D. J. Chem. Phys. 2003,
118, 9689.(16) Romero, C.; Jonah, C. D. J. Chem. Phys. 1989, 90, 1877.(17) Rossky, P. J.; Schnitker, J. J. Phys. Chem. 1988, 92, 4277.(18) Kambhampati, P.; Son, D. H.; Kee, T. W.; Barbara, P. F. J. Phys.
Chem. A 2002, 106, 2374.(19) Kee, T. W.; Son, D. H.; Kambhampati, P.; Barbara, P. F. J. Phys.
Chem. A 2001, 105, 8434.(20) Son, D. H.; Kambhampati, P.; Kee, T. W.; Barbara, P. F. J. Phys.
Chem. A 2001, 105, 8269.(21) Son, D. H.; Kambhampati, P.; Kee, T. W.; Barbara, P. F. Chem.
Phys. Lett. 2001, 342, 571.(22) Bartels, D. M. J. Chem. Phys. 2001, 115, 4404.(23) Brodskii, A. M.; Tsarevskii, A. V. SoV. Phys. JETP 1976, 43, 111.(24) Carmichael, I. J. Phys. Chem. 1980, 84, 1076.(25) Golden, S.; Tuttle, T. R., Jr. J. Chem. Soc., Faraday Trans. 2 1979,
75, 474.(26) Tuttle, T. R., Jr.; Golden, S. J. Phys. Chem. 1991, 95, 5725.(27) Marbach, W.; Asaad, A. N.; Krebs, P. J. Phys. Chem. A 1999, 103,
28.
(28) Shiraishi, H.; Sunaryo, G. R.; Ishigure, K. J. Phys. Chem. 1994,98, 5164.(29) Tissandier, M. D.; Cowen, K. A.; Feng, W. Y.; Gundlach, E.;
Cohen, M. H.; Earhart, A. D.; Tuttle, T. R.; Coe, J. V. J. Phys. Chem. A1998, 102, 9308.(30) Tuttle, T. R.; Malaxos, S.; Coe, J. V. J. Phys. Chem. A 2002, 106,
925.(31) Bartels, D. M.; Coe, J. V. J. Am. Chem. Soc., manuscript in
preparation.(32) Takahashi, K.; Cline, J. A.; Bartels, D. M.; Jonah, C. D. ReV. Sci.
Instrum. 2000, 71, 3345.(33) Cline, J. A.; Jonah, C. D.; Bartels, D. M. ReV. Sci. Instr. 2002, 73,
3908.(34) Sehested, K.; Christensen, H. Rad. Phys. Chem. 1990, 36, 499.(35) Wagner; Kruse. Properties of Water and Steam; Springer, 1997.(36) Johnson, J. W.; Oelkers, E. H.; Helgeson., H. C. Comput. Geosci.
1992, 18, 899.(37) Uematsu, M.; Franck, E. U. J. Phys. Chem. Ref. Data 1980, 9,
1291.(38) Hill, P. G.; MacMillan, R. D.; Lee, V. Tables of Thermodynamic
Properties of Heavy Water in SI Units. Atomic Energy of Canada, Ltd.:Missisauga, Ontario, Canada, 1981.(39) Christensen, H.; Sehested, K. J. Phys. Chem. 1986, 90, 186.(40) J. C. Tanger, I.; Helgeson, H. C. Am. J. Sci. 1988, 288.(41) Roduner, E.; Bartels, D. M. Ber. Bunsen-Ges. Phys. Chem. 1992,
96, 1037.(42) Ben-Naim, A. SolVation Thermodynamics; Plenum Press: New
York, 1987.(43) Asthagiri et al. (Asthagiri, D.; Pratt, L. R.; Ashbaugh, H. S. J. Chem.
Phys. 2003, 119, 2702) contend that the quantity actually measured in thecluster-based work of Tissandier et al. includes the “potential of the phase”that is present due to electroneutrality requirements. They suggest thisquantity is negative and of magnitude over 40 kJ mol-1. If this is correct,the numbers for anions that we report in Figure 11 should be more negativeby this amount.(44) Jou, F.-Y.; Freeman, G. R. J. Phys. Chem. 1977, 81, 909.(45) Michael, B. D.; Hart, E. J.; Schmidt, K. H. J. Phys. Chem. 1971,
75, 2798.(46) Tauber, M. J.; Mathies, R. A. J. Phys. Chem. A 2001, 105, 10952.(47) Tauber, M. J.; Mathies, R. A. J. Am. Chem. Soc. 2003, 125, 1394.(48) Mizuno, M.; Tahara, T. J. Phys. Chem. A 2003, 107, 2411.(49) Tauber, M. J.; Mathies, R. A. Chem. Phys. Lett. 2002, 354, 518.(50) Han, P.; Bartels, D. M. J. Phys. Chem. 1991, 95, 5367.(51) Schmid, R.; Miah, A. M.; Sapunov, V. N. Phys. Chem. Chem. Phys.
2000, 2, 97.(52) Roux, B.; Yu, H.-A.; Karplus, M. J. Phys. Chem. 1990, 94, 4683.
Pulse Radiolysis of Supercritical Water J. Phys. Chem. A, Vol. 109, No. 7, 2005 1307