PubNet: a flexible system for visualizing literature derived networks
10
Genome Biology 2005, 6:R80 comment reviews reports deposited research refereed research interactions information Open Access 2005 Douglas et al. Volume 6, Issue 9, Article R80 Software PubNet: a flexible system for visualizing literature derived networks Shawn M Douglas * , Gaetano T Montelione † and Mark Gerstein *‡ Addresses: * Department of Molecular Biophysics and Biochemistry, Yale University, New Haven, CT 06520, USA. † Department of Molecular Biology and Biochemistry, Center for Advanced Biotechnology and Medicine, Rutgers University and Robert Wood Johnson Medical School, Piscataway, NJ 08854, USA. ‡ Department of Computer Science, Yale University, New Haven, CT 06520, USA. Correspondence: Mark Gerstein. E-mail: [email protected] © 2005 Douglas et al.; licensee BioMed Central Ltd. This is an Open Access article distributed under the terms of the Creative Commons Attribution License (http://creativecommons.org/licenses/by/2.0), which permits unrestricted use, distribution, and reproduction in any medium, provided the original work is properly cited. Visualizing literature derived networks <p>PubNet is a web-based tool to extract several types of relationships returned by PubMed queries and map them into networks.</p> Abstract We have developed PubNet, a web-based tool that extracts several types of relationships returned by PubMed queries and maps them into networks, allowing for graphical visualization, textual navigation, and topological analysis. PubNet supports the creation of complex networks derived from the contents of individual citations, such as genes, proteins, Protein Data Bank (PDB) IDs, Medical Subject Headings (MeSH) terms, and authors. This feature allows one to, for example, examine a literature derived network of genes based on functional similarity. Rationale The amount of widely accessible scientific data has increased dramatically in recent years. There are currently more than 31,000 structures in the Protein Data Bank (PDB) [1], as com- pared with 3,000 structures 10 years ago. Swiss-Prot [2] now contains more than 178,000 sequence entries, which is up from 40,000 in 1994. With continual advances and refine- ments of experimental and computational technologies, data creation promises to accelerate for the foreseeable future. PubMed [3] stands out as a key information resource in the biological sciences in terms of diversity, breadth, and manual curation. PubMed entries comprise an order of magnitude more data than the three billion bases of the human genome. In addition to basic citation and abstract information, PubMed provides rich meta-information including Medical Subject Headings (MeSH) terms, detailed affiliation, and any secondary source databanks and accession numbers of mole- cules discussed in each article. By parsing the XML output of a query and performing a few simple operations, it is possible to uncover many interesting relationships among publications. Previous work has been done to augment or refine the stand- ard PubMed search, including tools to conduct combinatorial searches [4] and to navigate standard search results based on common MeSH terms [5], gene names found in abstracts [6,7], PubMed-assigned 'related articles' [8], and combina- tions thereof [9-12]. In PubNet we present a unique two- pronged approach in which network graphs are dynamically rendered to provide an intuitive and complete view of search results, while hyperlinking to a textual representation to allow detailed exploration of a point of interest. Multiple simultaneous queries are also supported, greatly increasing the number and types of relationships that can be visualized. The PubNet server, source code, and gallery are available on the worldwide web [13]. How PubNet works and interpreting the output Visualizing a publication extracted network is done by enter- ing at least one PubMed query into the provided textbox, selecting node and edge parameters, and clicking 'Submit' (Figure 1a). Each query is relayed to PubMed, and so all standard PubMed syntactical conventions apply. The Published: 16 August 2005 Genome Biology 2005, 6:R80 (doi:10.1186/gb-2005-6-9-r80) Received: 4 April 2005 Revised: 10 June 2005 Accepted: 12 July 2005 The electronic version of this article is the complete one and can be found online at http://genomebiology.com/2005/6/9/R80
Transcript of PubNet: a flexible system for visualizing literature derived networks
com
ment
reviews
reports
deposited research
refereed researchinteractio
nsinfo
rmatio
n
Open Access2005Douglaset al.Volume 6, Issue 9, Article R80SoftwarePubNet: a flexible system for visualizing literature derived networksShawn M Douglas*, Gaetano T Montelione† and Mark Gerstein*‡
Addresses: *Department of Molecular Biophysics and Biochemistry, Yale University, New Haven, CT 06520, USA. †Department of Molecular Biology and Biochemistry, Center for Advanced Biotechnology and Medicine, Rutgers University and Robert Wood Johnson Medical School, Piscataway, NJ 08854, USA. ‡Department of Computer Science, Yale University, New Haven, CT 06520, USA.
Correspondence: Mark Gerstein. E-mail: [email protected]
© 2005 Douglas et al.; licensee BioMed Central Ltd. This is an Open Access article distributed under the terms of the Creative Commons Attribution License (http://creativecommons.org/licenses/by/2.0), which permits unrestricted use, distribution, and reproduction in any medium, provided the original work is properly cited.Visualizing literature derived networks<p>PubNet is a web-based tool to extract several types of relationships returned by PubMed queries and map them into networks.</p>
Abstract
We have developed PubNet, a web-based tool that extracts several types of relationships returnedby PubMed queries and maps them into networks, allowing for graphical visualization, textualnavigation, and topological analysis. PubNet supports the creation of complex networks derivedfrom the contents of individual citations, such as genes, proteins, Protein Data Bank (PDB) IDs,Medical Subject Headings (MeSH) terms, and authors. This feature allows one to, for example,examine a literature derived network of genes based on functional similarity.
RationaleThe amount of widely accessible scientific data has increaseddramatically in recent years. There are currently more than31,000 structures in the Protein Data Bank (PDB) [1], as com-pared with 3,000 structures 10 years ago. Swiss-Prot [2] nowcontains more than 178,000 sequence entries, which is upfrom 40,000 in 1994. With continual advances and refine-ments of experimental and computational technologies, datacreation promises to accelerate for the foreseeable future.
PubMed [3] stands out as a key information resource in thebiological sciences in terms of diversity, breadth, and manualcuration. PubMed entries comprise an order of magnitudemore data than the three billion bases of the human genome.In addition to basic citation and abstract information,PubMed provides rich meta-information including MedicalSubject Headings (MeSH) terms, detailed affiliation, and anysecondary source databanks and accession numbers of mole-cules discussed in each article. By parsing the XML output ofa query and performing a few simple operations, it is possibleto uncover many interesting relationships amongpublications.
Previous work has been done to augment or refine the stand-ard PubMed search, including tools to conduct combinatorialsearches [4] and to navigate standard search results based oncommon MeSH terms [5], gene names found in abstracts[6,7], PubMed-assigned 'related articles' [8], and combina-tions thereof [9-12]. In PubNet we present a unique two-pronged approach in which network graphs are dynamicallyrendered to provide an intuitive and complete view of searchresults, while hyperlinking to a textual representation toallow detailed exploration of a point of interest. Multiplesimultaneous queries are also supported, greatly increasingthe number and types of relationships that can be visualized.The PubNet server, source code, and gallery are available onthe worldwide web [13].
How PubNet works and interpreting the outputVisualizing a publication extracted network is done by enter-ing at least one PubMed query into the provided textbox,selecting node and edge parameters, and clicking 'Submit'(Figure 1a). Each query is relayed to PubMed, and so allstandard PubMed syntactical conventions apply. The
Published: 16 August 2005
Genome Biology 2005, 6:R80 (doi:10.1186/gb-2005-6-9-r80)
Received: 4 April 2005Revised: 10 June 2005Accepted: 12 July 2005
The electronic version of this article is the complete one and can be found online at http://genomebiology.com/2005/6/9/R80
Genome Biology 2005, 6:R80
R80.2 Genome Biology 2005, Volume 6, Issue 9, Article R80 Douglas et al. http://genomebiology.com/2005/6/9/R80
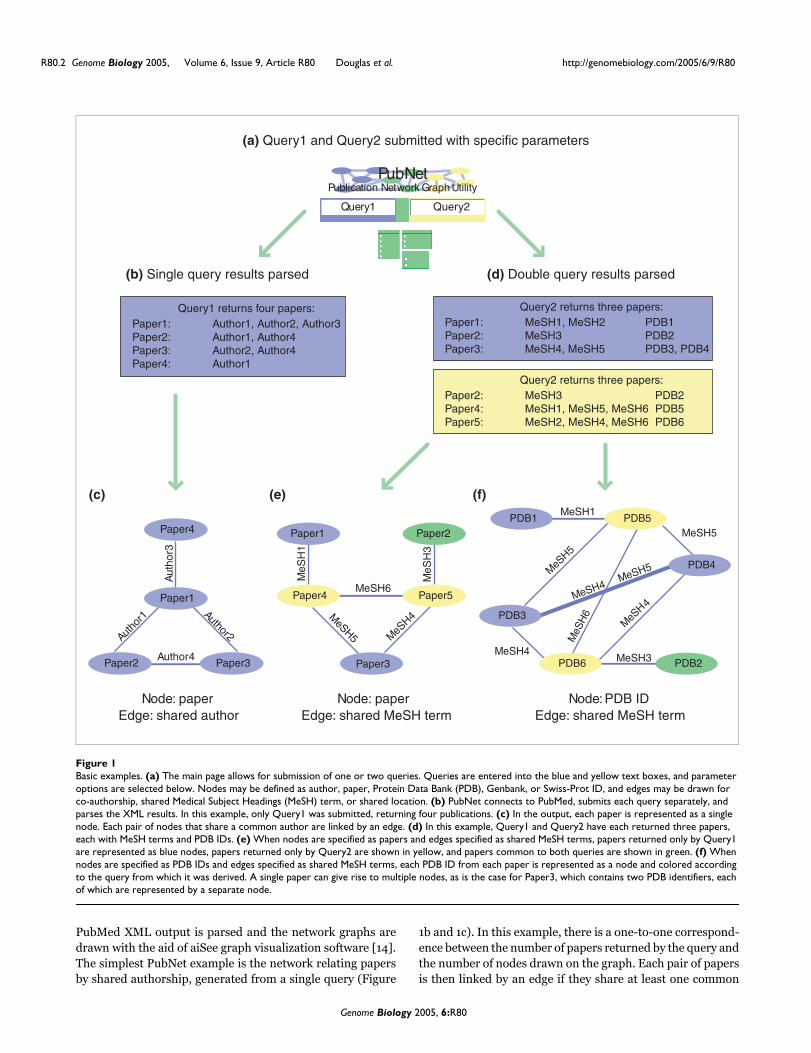
PubMed XML output is parsed and the network graphs aredrawn with the aid of aiSee graph visualization software [14].The simplest PubNet example is the network relating papersby shared authorship, generated from a single query (Figure
1b and 1c). In this example, there is a one-to-one correspond-ence between the number of papers returned by the query andthe number of nodes drawn on the graph. Each pair of papersis then linked by an edge if they share at least one common
Basic examplesFigure 1Basic examples. (a) The main page allows for submission of one or two queries. Queries are entered into the blue and yellow text boxes, and parameter options are selected below. Nodes may be defined as author, paper, Protein Data Bank (PDB), Genbank, or Swiss-Prot ID, and edges may be drawn for co-authorship, shared Medical Subject Headings (MeSH) term, or shared location. (b) PubNet connects to PubMed, submits each query separately, and parses the XML results. In this example, only Query1 was submitted, returning four publications. (c) In the output, each paper is represented as a single node. Each pair of nodes that share a common author are linked by an edge. (d) In this example, Query1 and Query2 have each returned three papers, each with MeSH terms and PDB IDs. (e) When nodes are specified as papers and edges specified as shared MeSH terms, papers returned only by Query1 are represented as blue nodes, papers returned only by Query2 are shown in yellow, and papers common to both queries are shown in green. (f) When nodes are specified as PDB IDs and edges specified as shared MeSH terms, each PDB ID from each paper is represented as a node and colored according to the query from which it was derived. A single paper can give rise to multiple nodes, as is the case for Paper3, which contains two PDB identifiers, each of which are represented by a separate node.
(a) Query1 and Query2 submitted with specific parameters
Paper1: MeSH1, MeSH2 PDB1Paper2: MeSH3 PDB2Paper3: MeSH4, MeSH5 PDB3, PDB4
Query2 returns three papers:
Paper2: MeSH3 PDB2Paper4: MeSH1, MeSH5, MeSH6 PDB5Paper5: MeSH2, MeSH4, MeSH6 PDB6
Query2 returns three papers:
(d) Double query results parsed (b) Single query results parsed
Paper1: Author1, Author2, Author3 Paper2: Author1, Author4Paper3: Author2, Author4Paper4: Author1
Query1 returns four papers:
Paper1
Paper4
Aut
hor3
Paper2 Paper3
Autho
r1Author2
Author4
MeSH6
MeS
H1
MeSH5 MeSH4
MeS
H3
Paper4
Paper3
Paper2
Paper5
Paper1
MeSH1
MeSH3
MeSH4 MeSH5
MeS
H6
MeSH4
MeSH5
MeSH5
PDB2
PDB5
PDB6
PDB1
PDB4
PDB3
(c) (e) (f)
Node: paperEdge: shared MeSH term
Node: paper Edge: shared author
Node: PDB IDEdge: shared MeSH term
Query1 Query2
PubNetPublication Network Graph Utility
MeSH4
Genome Biology 2005, 6:R80
http://genomebiology.com/2005/6/9/R80 Genome Biology 2005, Volume 6, Issue 9, Article R80 Douglas et al. R80.3
com
ment
reviews
reports
refereed researchdepo
sited researchinteractio
nsinfo
rmatio
n
author, and edges are scaled in thickness for multiple com-mon authors. Much more complex networks can be derivedby entering two queries and selecting node parameters forwhich there may be a one-to-many correspondence betweenpapers returned by PubMed and nodes associated with eachpaper (Figure 1d-f). As is often the case when nodes are set toAuthor or Databank ID, each publication returned by eachquery will expand to several nodes in the final network dis-play. Nodes are colored according to the query from whichthey are derived, allowing for greater information contentthan would an otherwise identical monochrome graph. Forexample, the degree to which nodes of different colors segre-gate or overlap can suggest specific relationships between thepublications in the query results.
The graphical representation of a network is meant to providea broad overview of the structure of meta-relationshipsreturned by one or two queries. Each graph is downloadablein a variety of formats, including SVG, PS, PDF, and PNG. Thevector formats permit image rescaling without loss of quality.Depending on the input queries and parameters, the specific
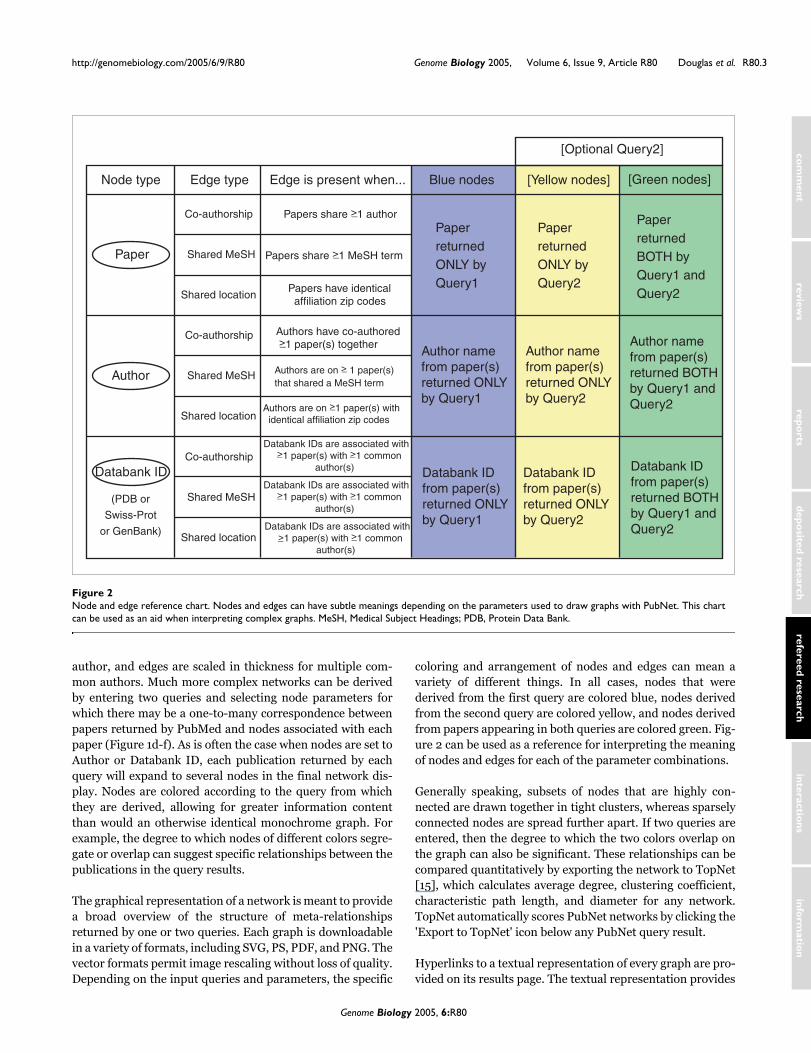
coloring and arrangement of nodes and edges can mean avariety of different things. In all cases, nodes that werederived from the first query are colored blue, nodes derivedfrom the second query are colored yellow, and nodes derivedfrom papers appearing in both queries are colored green. Fig-ure 2 can be used as a reference for interpreting the meaningof nodes and edges for each of the parameter combinations.
Generally speaking, subsets of nodes that are highly con-nected are drawn together in tight clusters, whereas sparselyconnected nodes are spread further apart. If two queries areentered, then the degree to which the two colors overlap onthe graph can also be significant. These relationships can becompared quantitatively by exporting the network to TopNet[15], which calculates average degree, clustering coefficient,characteristic path length, and diameter for any network.TopNet automatically scores PubNet networks by clicking the'Export to TopNet' icon below any PubNet query result.
Hyperlinks to a textual representation of every graph are pro-vided on its results page. The textual representation provides
Node and edge reference chartFigure 2Node and edge reference chart. Nodes and edges can have subtle meanings depending on the parameters used to draw graphs with PubNet. This chart can be used as an aid when interpreting complex graphs. MeSH, Medical Subject Headings; PDB, Protein Data Bank.
Node type Edge type Edge is present when... [Yellow nodes]Blue nodes
Paper
Author
Co-authorship
Shared MeSH
Shared location
Co-authorship
Shared MeSH
Shared location
Co-authorship
Shared MeSH
Shared location
Papers share >1 author
Papers have identical affiliation zip codes
Authors are on > 1 paper(s)that shared a MeSH term
Author namefrom paper(s)returned ONLYby Query1
PaperreturnedBOTH by Query1 andQuery2
Databank IDfrom paper(s)returned ONLYby Query1
Databank ID
(PDB or
Swiss-Prot
or GenBank)
_
Papers share >1 MeSH term_
Authors have co-authored >1 paper(s) together_
_
Authors are on >1 paper(s) with identical affiliation zip codes
_
Databank IDs are associated with >1 paper(s) with >1 common author(s)
Databank IDs are associated with >1 paper(s) with >1 common author(s)
Databank IDs are associated with >1 paper(s) with >1 common author(s)
_
__
_
_ _
PaperreturnedONLY by Query1
PaperreturnedONLY by Query2
Author namefrom paper(s)returned ONLYby Query2
Databank IDfrom paper(s)returned ONLYby Query2
Databank IDfrom paper(s)returned BOTHby Query1 and Query2
Author namefrom paper(s)returned BOTHby Query1 andQuery2
[Green nodes]
[Optional Query2]
Genome Biology 2005, 6:R80
R80.4 Genome Biology 2005, Volume 6, Issue 9, Article R80 Douglas et al. http://genomebiology.com/2005/6/9/R80
a summary list of all nodes and edges that comprise thenetwork. Each entry in the summary is a hyperlink to adetailed description. For nodes, a list of outgoing edges aswell as a list of all connected neighbors and their respectiveedges are shown, with common edges highlighted. Relevantexternal databank links are also provided at the top of thepage. The detailed view of an edge shows a list of all nodesconnected by that edge. Note that in the SVG graphical formateach node is also a hyperlink to its entry in the text version ofthe network, which allows one to navigate quickly from aninteresting region in the graph to a detailed description of itscomponents.
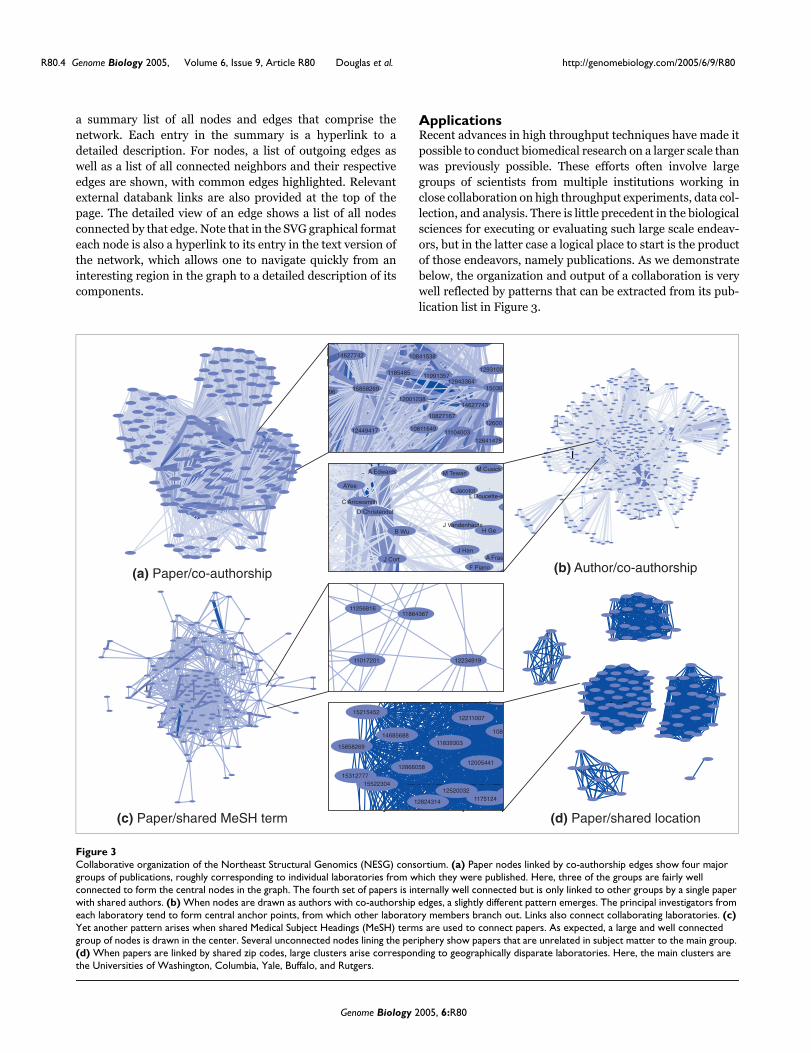
ApplicationsRecent advances in high throughput techniques have made itpossible to conduct biomedical research on a larger scale thanwas previously possible. These efforts often involve largegroups of scientists from multiple institutions working inclose collaboration on high throughput experiments, data col-lection, and analysis. There is little precedent in the biologicalsciences for executing or evaluating such large scale endeav-ors, but in the latter case a logical place to start is the productof those endeavors, namely publications. As we demonstratebelow, the organization and output of a collaboration is verywell reflected by patterns that can be extracted from its pub-lication list in Figure 3.
Collaborative organization of the Northeast Structural Genomics (NESG) consortiumFigure 3Collaborative organization of the Northeast Structural Genomics (NESG) consortium. (a) Paper nodes linked by co-authorship edges show four major groups of publications, roughly corresponding to individual laboratories from which they were published. Here, three of the groups are fairly well connected to form the central nodes in the graph. The fourth set of papers is internally well connected but is only linked to other groups by a single paper with shared authors. (b) When nodes are drawn as authors with co-authorship edges, a slightly different pattern emerges. The principal investigators from each laboratory tend to form central anchor points, from which other laboratory members branch out. Links also connect collaborating laboratories. (c) Yet another pattern arises when shared Medical Subject Headings (MeSH) terms are used to connect papers. As expected, a large and well connected group of nodes is drawn in the center. Several unconnected nodes lining the periphery show papers that are unrelated in subject matter to the main group. (d) When papers are linked by shared zip codes, large clusters arise corresponding to geographically disparate laboratories. Here, the main clusters are the Universities of Washington, Columbia, Yale, Buffalo, and Rutgers.
15215452
14685688
15858269
12866058
1531277715522304
12824314
125200321175124
12005441
11839303
108
12211007
A Edwards
C Arrowsmith
B Wu
J Cort
J Han
F Piano
A Fras
H Ge J Vandenhaute
L JacototL Doucette-s
M Cusick M Tewari
12449417
96
14627742
15858269
1185485
10841538
1199135712943364
12001238
10827167
1081164911104003
12641475
12600
14627743
15036
1293100
D Christendat
AYee
1125681611864367
11017201 12234919
(a) Paper/co-authorship
(c) Paper/shared MeSH term
(b) Author/co-authorship
(d) Paper/shared location
Genome Biology 2005, 6:R80
http://genomebiology.com/2005/6/9/R80 Genome Biology 2005, Volume 6, Issue 9, Article R80 Douglas et al. R80.5
com
ment
reviews
reports
refereed researchdepo
sited researchinteractio
nsinfo
rmatio
n
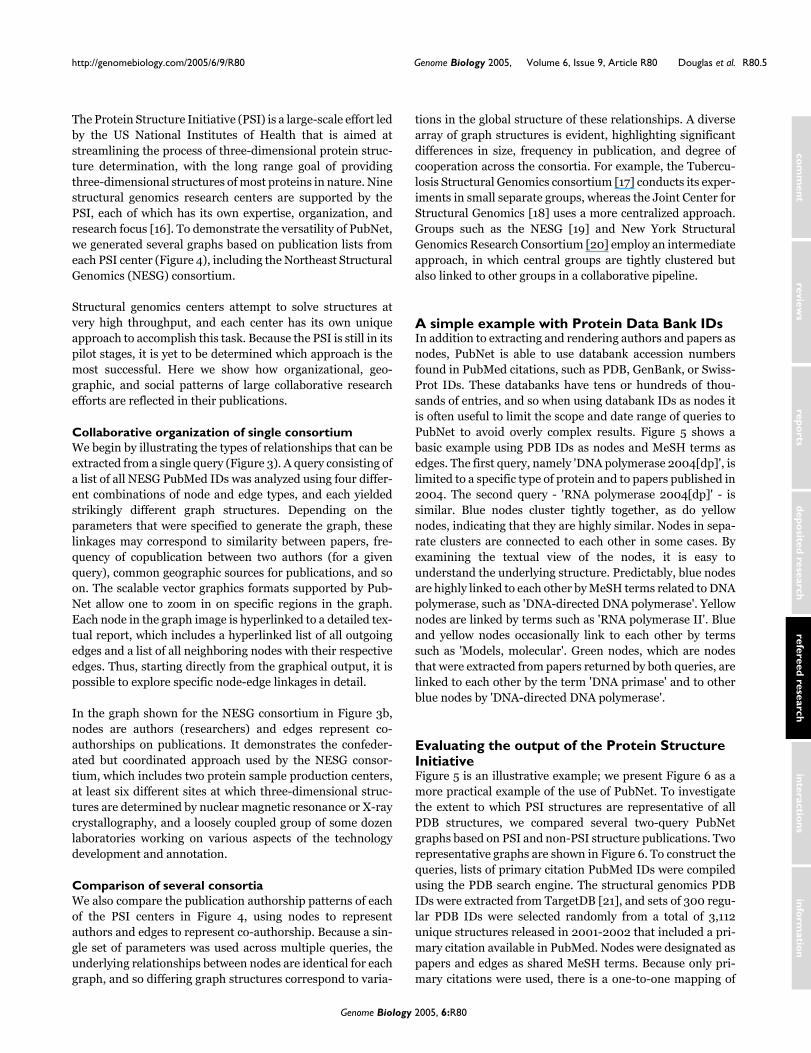
The Protein Structure Initiative (PSI) is a large-scale effort ledby the US National Institutes of Health that is aimed atstreamlining the process of three-dimensional protein struc-ture determination, with the long range goal of providingthree-dimensional structures of most proteins in nature. Ninestructural genomics research centers are supported by thePSI, each of which has its own expertise, organization, andresearch focus [16]. To demonstrate the versatility of PubNet,we generated several graphs based on publication lists fromeach PSI center (Figure 4), including the Northeast StructuralGenomics (NESG) consortium.
Structural genomics centers attempt to solve structures atvery high throughput, and each center has its own uniqueapproach to accomplish this task. Because the PSI is still in itspilot stages, it is yet to be determined which approach is themost successful. Here we show how organizational, geo-graphic, and social patterns of large collaborative researchefforts are reflected in their publications.
Collaborative organization of single consortiumWe begin by illustrating the types of relationships that can beextracted from a single query (Figure 3). A query consisting ofa list of all NESG PubMed IDs was analyzed using four differ-ent combinations of node and edge types, and each yieldedstrikingly different graph structures. Depending on theparameters that were specified to generate the graph, theselinkages may correspond to similarity between papers, fre-quency of copublication between two authors (for a givenquery), common geographic sources for publications, and soon. The scalable vector graphics formats supported by Pub-Net allow one to zoom in on specific regions in the graph.Each node in the graph image is hyperlinked to a detailed tex-tual report, which includes a hyperlinked list of all outgoingedges and a list of all neighboring nodes with their respectiveedges. Thus, starting directly from the graphical output, it ispossible to explore specific node-edge linkages in detail.
In the graph shown for the NESG consortium in Figure 3b,nodes are authors (researchers) and edges represent co-authorships on publications. It demonstrates the confeder-ated but coordinated approach used by the NESG consor-tium, which includes two protein sample production centers,at least six different sites at which three-dimensional struc-tures are determined by nuclear magnetic resonance or X-raycrystallography, and a loosely coupled group of some dozenlaboratories working on various aspects of the technologydevelopment and annotation.
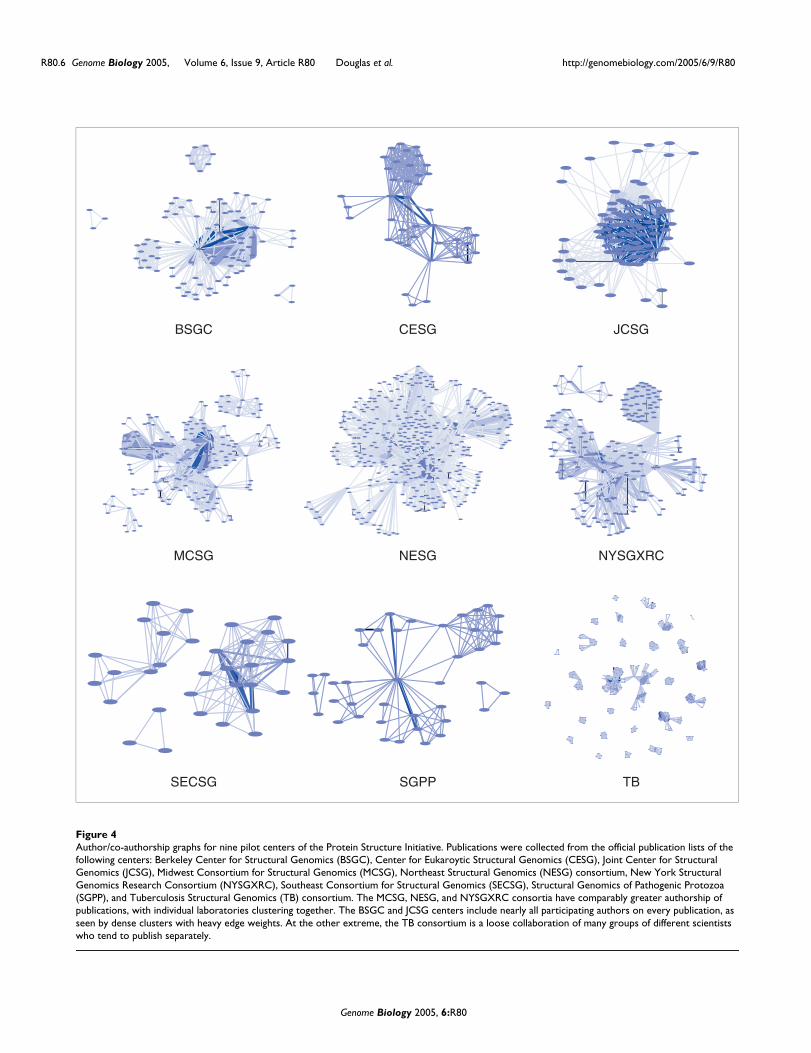
Comparison of several consortiaWe also compare the publication authorship patterns of eachof the PSI centers in Figure 4, using nodes to representauthors and edges to represent co-authorship. Because a sin-gle set of parameters was used across multiple queries, theunderlying relationships between nodes are identical for eachgraph, and so differing graph structures correspond to varia-
tions in the global structure of these relationships. A diversearray of graph structures is evident, highlighting significantdifferences in size, frequency in publication, and degree ofcooperation across the consortia. For example, the Tubercu-losis Structural Genomics consortium [17] conducts its exper-iments in small separate groups, whereas the Joint Center forStructural Genomics [18] uses a more centralized approach.Groups such as the NESG [19] and New York StructuralGenomics Research Consortium [20] employ an intermediateapproach, in which central groups are tightly clustered butalso linked to other groups in a collaborative pipeline.
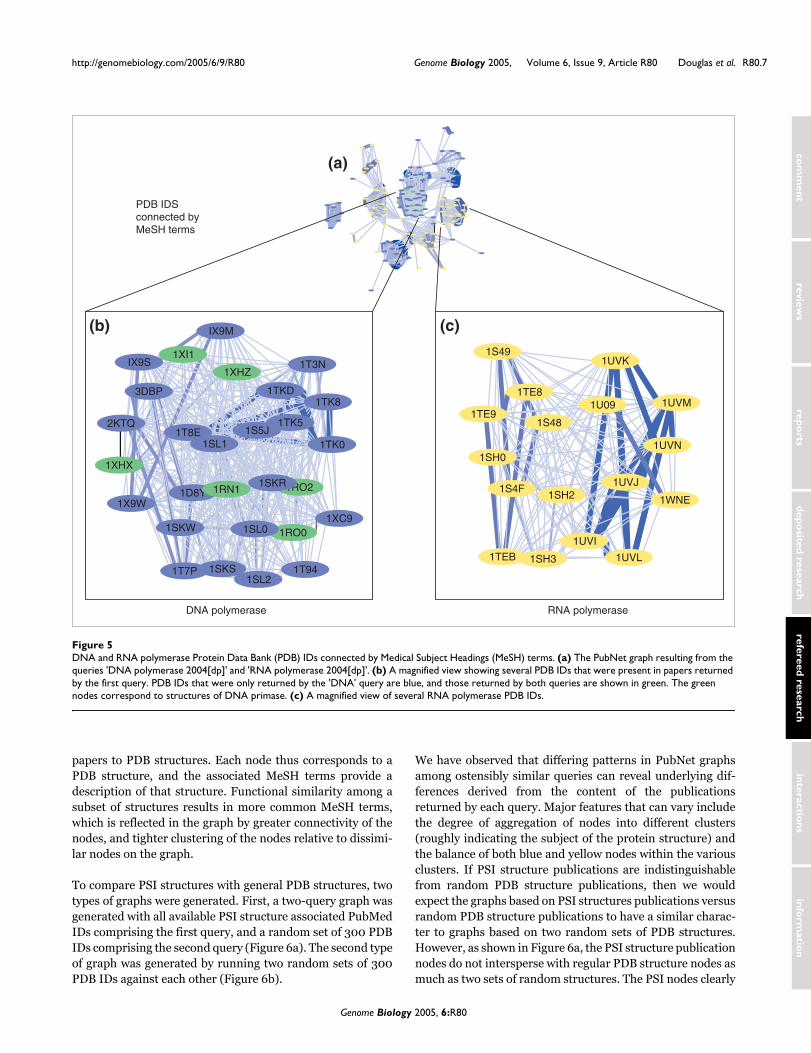
A simple example with Protein Data Bank IDsIn addition to extracting and rendering authors and papers asnodes, PubNet is able to use databank accession numbersfound in PubMed citations, such as PDB, GenBank, or Swiss-Prot IDs. These databanks have tens or hundreds of thou-sands of entries, and so when using databank IDs as nodes itis often useful to limit the scope and date range of queries toPubNet to avoid overly complex results. Figure 5 shows abasic example using PDB IDs as nodes and MeSH terms asedges. The first query, namely 'DNA polymerase 2004[dp]', islimited to a specific type of protein and to papers published in2004. The second query - 'RNA polymerase 2004[dp]' - issimilar. Blue nodes cluster tightly together, as do yellownodes, indicating that they are highly similar. Nodes in sepa-rate clusters are connected to each other in some cases. Byexamining the textual view of the nodes, it is easy tounderstand the underlying structure. Predictably, blue nodesare highly linked to each other by MeSH terms related to DNApolymerase, such as 'DNA-directed DNA polymerase'. Yellownodes are linked by terms such as 'RNA polymerase II'. Blueand yellow nodes occasionally link to each other by termssuch as 'Models, molecular'. Green nodes, which are nodesthat were extracted from papers returned by both queries, arelinked to each other by the term 'DNA primase' and to otherblue nodes by 'DNA-directed DNA polymerase'.
Evaluating the output of the Protein Structure InitiativeFigure 5 is an illustrative example; we present Figure 6 as amore practical example of the use of PubNet. To investigatethe extent to which PSI structures are representative of allPDB structures, we compared several two-query PubNetgraphs based on PSI and non-PSI structure publications. Tworepresentative graphs are shown in Figure 6. To construct thequeries, lists of primary citation PubMed IDs were compiledusing the PDB search engine. The structural genomics PDBIDs were extracted from TargetDB [21], and sets of 300 regu-lar PDB IDs were selected randomly from a total of 3,112unique structures released in 2001-2002 that included a pri-mary citation available in PubMed. Nodes were designated aspapers and edges as shared MeSH terms. Because only pri-mary citations were used, there is a one-to-one mapping of
Genome Biology 2005, 6:R80
R80.6 Genome Biology 2005, Volume 6, Issue 9, Article R80 Douglas et al. http://genomebiology.com/2005/6/9/R80
Author/co-authorship graphs for nine pilot centers of the Protein Structure InitiativeFigure 4Author/co-authorship graphs for nine pilot centers of the Protein Structure Initiative. Publications were collected from the official publication lists of the following centers: Berkeley Center for Structural Genomics (BSGC), Center for Eukaroytic Structural Genomics (CESG), Joint Center for Structural Genomics (JCSG), Midwest Consortium for Structural Genomics (MCSG), Northeast Structural Genomics (NESG) consortium, New York Structural Genomics Research Consortium (NYSGXRC), Southeast Consortium for Structural Genomics (SECSG), Structural Genomics of Pathogenic Protozoa (SGPP), and Tuberculosis Structural Genomics (TB) consortium. The MCSG, NESG, and NYSGXRC consortia have comparably greater authorship of publications, with individual laboratories clustering together. The BSGC and JCSG centers include nearly all participating authors on every publication, as seen by dense clusters with heavy edge weights. At the other extreme, the TB consortium is a loose collaboration of many groups of different scientists who tend to publish separately.
JCSG
TB
NYSGXRC
CESG
SGPP
NESG
BSGC
SECSG
MCSG
Genome Biology 2005, 6:R80
http://genomebiology.com/2005/6/9/R80 Genome Biology 2005, Volume 6, Issue 9, Article R80 Douglas et al. R80.7
com
ment
reviews
reports
refereed researchdepo
sited researchinteractio
nsinfo
rmatio
n
papers to PDB structures. Each node thus corresponds to aPDB structure, and the associated MeSH terms provide adescription of that structure. Functional similarity among asubset of structures results in more common MeSH terms,which is reflected in the graph by greater connectivity of thenodes, and tighter clustering of the nodes relative to dissimi-lar nodes on the graph.
To compare PSI structures with general PDB structures, twotypes of graphs were generated. First, a two-query graph wasgenerated with all available PSI structure associated PubMedIDs comprising the first query, and a random set of 300 PDBIDs comprising the second query (Figure 6a). The second typeof graph was generated by running two random sets of 300PDB IDs against each other (Figure 6b).
We have observed that differing patterns in PubNet graphsamong ostensibly similar queries can reveal underlying dif-ferences derived from the content of the publicationsreturned by each query. Major features that can vary includethe degree of aggregation of nodes into different clusters(roughly indicating the subject of the protein structure) andthe balance of both blue and yellow nodes within the variousclusters. If PSI structure publications are indistinguishablefrom random PDB structure publications, then we wouldexpect the graphs based on PSI structures publications versusrandom PDB structure publications to have a similar charac-ter to graphs based on two random sets of PDB structures.However, as shown in Figure 6a, the PSI structure publicationnodes do not intersperse with regular PDB structure nodes asmuch as two sets of random structures. The PSI nodes clearly
DNA and RNA polymerase Protein Data Bank (PDB) IDs connected by Medical Subject Headings (MeSH) termsFigure 5DNA and RNA polymerase Protein Data Bank (PDB) IDs connected by Medical Subject Headings (MeSH) terms. (a) The PubNet graph resulting from the queries 'DNA polymerase 2004[dp]' and 'RNA polymerase 2004[dp]'. (b) A magnified view showing several PDB IDs that were present in papers returned by the first query. PDB IDs that were only returned by the 'DNA' query are blue, and those returned by both queries are shown in green. The green nodes correspond to structures of DNA primase. (c) A magnified view of several RNA polymerase PDB IDs.
1S48
1S49
1S4F
1SH0
1SH2
1SH3
1TE8
1TE9
1TEB
1U09
1UVI
1UVJ
1UVK
1UVL
1UVM
1UVN
1WNE 1D8Y 1RN1
1RO0
1RO2
1S5J
1SKR
1SKS
1SKW 1SL0
1SL1
1SL2
1T3N
1T7P
1T8E
1T94
1TK0
1TK5
1TK8 1TKD
1X9W 1XC9
1XHX
1XHZ
1XI1
2KTQ
3DBP
IX9M
IX9S
PDB IDSconnected byMeSH terms
DNA polymerase RNA polymerase
(a)
(b) (c)
Genome Biology 2005, 6:R80

R80.8 Genome Biology 2005, Volume 6, Issue 9, Article R80 Douglas et al. http://genomebiology.com/2005/6/9/R80
tend to aggregate in tighter neighborhoods than do the othernodes. Although this is by no means definitive, thedifferential clustering might indicate some underlying differ-ences between the PSI structures and random PDB struc-tures. One obvious source of difference in the structurepublications is the fact that many PSI structures are un-anno-tated 'hypothetical proteins', and so they lack the MeSH termsrequired for greater dispersal. Another factor might be thatsimilar methods are used to determine PSI structures, andthis is reflected in their publications.
Assessing results with TopNetIn addition to examining the textual representation of thegraph, qualitative assessments of the network structure canbe verified by exporting the results of any PubNet query toTopNet. One particularly useful descriptor is the averagedegree of a network, which is the average of the degrees ofeach node. In a PubNet graph, node degrees increase withmore common edge terms between the nodes. A high averagedegree indicates that the nodes are highly connected to eachother. Note that the utility of many topological descriptors
Structure publications linked by Medical Subject Headings (MeSH) termsFigure 6Structure publications linked by Medical Subject Headings (MeSH) terms. (a) All available primary citations for Protein Structure Initiative (PSI) structures (shown in blue) were compared with primary citations from a random set of 300 Protein Data Bank (PDB) structures (shown in yellow). Blue color nodes are segregated into tight clusters, indicating close similarity among PSI structures. Yellow nodes are relatively interspersed because of fewer common edges, indicating greater variability in connecting MeSH terms. Out of a total of 860 MeSH terms associated with PSI structure nodes (435 of which are unique), the term 'Bacterial proteins - chemistry' is the most common, connecting a clique of 52 nodes. (b) As a control, two random sets of 300 PDB structures were chosen from a set of 3,112 structures released in 2001-2002 that included a primary citation available in PubMed. Those sets of citations were then run through PubNet as Query1 and Query2. Nodes of both colors are fairly well interspersed. The PDB structure nodes carry 1,247 MeSH terms (861 unique), the most common of which is also 'Bacterial proteins - chemistry', but it only connects a clique of 16 nodes.
2001 PDB structure
PSI structure PSI versus PDB structures
PDB versus PDB structures(control)
(edges and yellow nodes removed to highlight dispersal)
(a)
(b)
Genome Biology 2005, 6:R80
http://genomebiology.com/2005/6/9/R80 Genome Biology 2005, Volume 6, Issue 9, Article R80 Douglas et al. R80.9
com
ment
reviews
reports
refereed researchdepo
sited researchinteractio
nsinfo
rmatio
n
depends on the connectedness of a graph. For a more detailedexplanation of descriptors, see the report by Yu and cowork-ers [15].
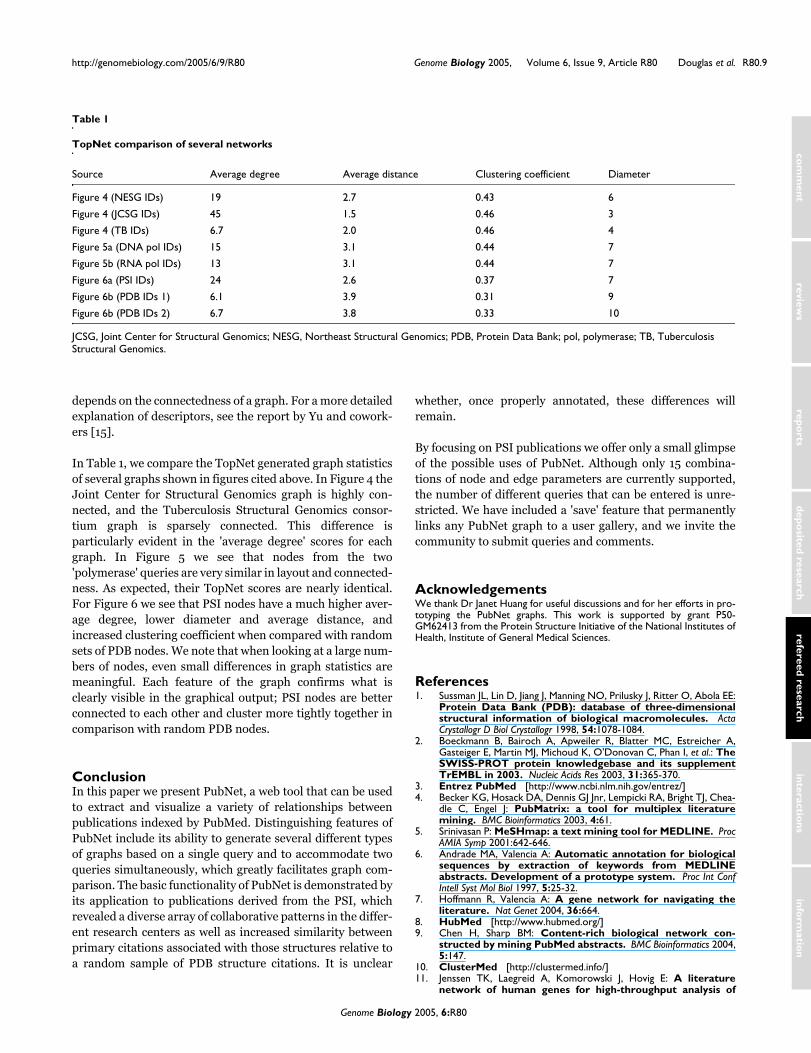
In Table 1, we compare the TopNet generated graph statisticsof several graphs shown in figures cited above. In Figure 4 theJoint Center for Structural Genomics graph is highly con-nected, and the Tuberculosis Structural Genomics consor-tium graph is sparsely connected. This difference isparticularly evident in the 'average degree' scores for eachgraph. In Figure 5 we see that nodes from the two'polymerase' queries are very similar in layout and connected-ness. As expected, their TopNet scores are nearly identical.For Figure 6 we see that PSI nodes have a much higher aver-age degree, lower diameter and average distance, andincreased clustering coefficient when compared with randomsets of PDB nodes. We note that when looking at a large num-bers of nodes, even small differences in graph statistics aremeaningful. Each feature of the graph confirms what isclearly visible in the graphical output; PSI nodes are betterconnected to each other and cluster more tightly together incomparison with random PDB nodes.
ConclusionIn this paper we present PubNet, a web tool that can be usedto extract and visualize a variety of relationships betweenpublications indexed by PubMed. Distinguishing features ofPubNet include its ability to generate several different typesof graphs based on a single query and to accommodate twoqueries simultaneously, which greatly facilitates graph com-parison. The basic functionality of PubNet is demonstrated byits application to publications derived from the PSI, whichrevealed a diverse array of collaborative patterns in the differ-ent research centers as well as increased similarity betweenprimary citations associated with those structures relative toa random sample of PDB structure citations. It is unclear
whether, once properly annotated, these differences willremain.
By focusing on PSI publications we offer only a small glimpseof the possible uses of PubNet. Although only 15 combina-tions of node and edge parameters are currently supported,the number of different queries that can be entered is unre-stricted. We have included a 'save' feature that permanentlylinks any PubNet graph to a user gallery, and we invite thecommunity to submit queries and comments.
AcknowledgementsWe thank Dr Janet Huang for useful discussions and for her efforts in pro-totyping the PubNet graphs. This work is supported by grant P50-GM62413 from the Protein Structure Initiative of the National Institutes ofHealth, Institute of General Medical Sciences.
References1. Sussman JL, Lin D, Jiang J, Manning NO, Prilusky J, Ritter O, Abola EE:
Protein Data Bank (PDB): database of three-dimensionalstructural information of biological macromolecules. ActaCrystallogr D Biol Crystallogr 1998, 54:1078-1084.
2. Boeckmann B, Bairoch A, Apweiler R, Blatter MC, Estreicher A,Gasteiger E, Martin MJ, Michoud K, O'Donovan C, Phan I, et al.: TheSWISS-PROT protein knowledgebase and its supplementTrEMBL in 2003. Nucleic Acids Res 2003, 31:365-370.
3. Entrez PubMed [http://www.ncbi.nlm.nih.gov/entrez/]4. Becker KG, Hosack DA, Dennis GJ Jnr, Lempicki RA, Bright TJ, Chea-
dle C, Engel J: PubMatrix: a tool for multiplex literaturemining. BMC Bioinformatics 2003, 4:61.
5. Srinivasan P: MeSHmap: a text mining tool for MEDLINE. ProcAMIA Symp 2001:642-646.
6. Andrade MA, Valencia A: Automatic annotation for biologicalsequences by extraction of keywords from MEDLINEabstracts. Development of a prototype system. Proc Int ConfIntell Syst Mol Biol 1997, 5:25-32.
7. Hoffmann R, Valencia A: A gene network for navigating theliterature. Nat Genet 2004, 36:664.
8. HubMed [http://www.hubmed.org/]9. Chen H, Sharp BM: Content-rich biological network con-
structed by mining PubMed abstracts. BMC Bioinformatics 2004,5:147.
10. ClusterMed [http://clustermed.info/]11. Jenssen TK, Laegreid A, Komorowski J, Hovig E: A literature
network of human genes for high-throughput analysis of
Table 1
TopNet comparison of several networks
Source Average degree Average distance Clustering coefficient Diameter
Figure 4 (NESG IDs) 19 2.7 0.43 6
Figure 4 (JCSG IDs) 45 1.5 0.46 3
Figure 4 (TB IDs) 6.7 2.0 0.46 4
Figure 5a (DNA pol IDs) 15 3.1 0.44 7
Figure 5b (RNA pol IDs) 13 3.1 0.44 7
Figure 6a (PSI IDs) 24 2.6 0.37 7
Figure 6b (PDB IDs 1) 6.1 3.9 0.31 9
Figure 6b (PDB IDs 2) 6.7 3.8 0.33 10
JCSG, Joint Center for Structural Genomics; NESG, Northeast Structural Genomics; PDB, Protein Data Bank; pol, polymerase; TB, Tuberculosis Structural Genomics.
Genome Biology 2005, 6:R80
http://www.ncbi.nlm.nih.gov/entrez/query.fcgi?cmd=Retrieve&db=PubMed&dopt=Abstract&list_uids=9322011
http://www.ncbi.nlm.nih.gov/entrez/query.fcgi?cmd=Retrieve&db=PubMed&dopt=Abstract&list_uids=9322011
R80.10 Genome Biology 2005, Volume 6, Issue 9, Article R80 Douglas et al. http://genomebiology.com/2005/6/9/R80
gene expression. Nat Genet 2001, 28:21-28.12. Perez-Iratxeta C, Perez AJ, Bork P, Andrade MA: Update on
XplorMed: a web server for exploring scientific literature.Nucleic Acids Res 2003, 31:3866-3868.
13. PubNet [http://pubnet.gersteinlab.org/]14. aiSee [http://www.aisee.com/]15. Yu H, Zhu X, Greenbaum D, Karro J, Gerstein M: TopNet: a tool
for comparing biological sub-networks, correlating proteinproperties with topological statistics. Nucleic Acids Res 2004,32:328-337.
16. Protein Structure Initiative [http://www.nigms.nih.gov/psi/]17. Rupp B, Segelke BW, Krupka HI, Lekin T, Schafer J, Zemla A, Toppani
D, Snell G, Earnest T: The TB structural genomics consortiumcrystallization facility: towards automation from protein toelectron density. Acta Crystallogr D Biol Crystallogr 2002,58:1514-1518.
18. Lesley SA, Kuhn P, Godzik A, Deacon AM, Mathews I, Kreusch A,Spraggon G, Klock HE, McMullan D, Shin T, et al.: Structuralgenomics of the Thermotoga maritima proteome imple-mented in a high-throughput structure determinationpipeline. Proc Natl Acad Sci USA 2002, 99:11664-11669.
19. Acton TB, Gunsalus K, Xiao R, Ma L, Aramini J, Baran MC, Chiang Y,Climent T, Cooper B, Denissova N, et al.: Robotic cloning andProtein Production Platform of the Northeast StructuralGenomics Consortium. Methods Enzymol 2005, 394:210-243.
20. Chance MR, Fiser A, Sali A, Pieper U, Eswar N, Xu G, Fajardo JE, Rad-hakannan T, Marinkovic N: High-throughput computational andexperimental techniques in structural genomics. Genome Res2004, 14:2145-2154.
21. Chen L, Oughtred R, Berman HM, Westbrook J: TargetDB: a tar-get registration database for structural genomics projects.Bioinformatics 2004, 20:2860-2862.
Genome Biology 2005, 6:R80