Publicization versus Privatization: Recent worldwide evidence
32
WORKING PAPER Publicization versus Privatization: Recent worldwide evidence Stefano CLÒ, Chiara F. DEL BÒ, Matteo FERRARIS, Carlo FIORIO, Massimo FLORIO & Daniela VANDONE CIRIEC N° 2014/03
Transcript of Publicization versus Privatization: Recent worldwide evidence
W O RK I N G P A P E R
Publicization versus Privatization: Recent worldwide evidence
Stefano CLÒ, Chiara F. DEL BÒ, Matteo FERRARIS,
Carlo FIORIO, Massimo FLORIO & Daniela VANDONE
CIRIEC N° 2014/03

CIRIEC activities, publications and researches are realised with the support of the Belgian Federal Government - Scientific Policy and with the support of the Belgian French Speaking Community - Scientific Research.
Les activités, publications et recherches du CIRIEC sont réalisées avec le soutien du Gouvernement fédéral belge - Politique scientifique et avec celui de la Communauté française de Belgique - Recherche scientifique.
This working paper is indexed and available in SSRN and RePEC
Ce working paper est indexé et disponible dans SSRN et RePEC
ISSN 2070-8289 © CIRIEC No part of this publication may be reproduced. Toute reproduction même partielle de cette publication est strictement interdite.

3
Publicization versus Privatization: Recent worldwide evidence∗
Stefano Clòa, Chiara F. Del Bo1,a, Matteo Ferrarisa, Carlo Fiorioa,b,c, Massimo Florioa & Daniela Vandonea
aDEMM, Università degli Studi di Milano
bCentro Icona, Università degli Studi di Milano
cEconpubblica, Università Commerciale L. Bocconi
Working paper CIRIEC N° 2014/03
∗ This case study was presented at the Seminar "Public enterprises in the 21st century: Various issues from regulation, pricing, CSR to marketing and others – Reflections and case studies", Université Libre de Bruxelles, Solvay Brussels School of Economics and Management, September 9-10, 2013, Research Project of CIRIEC International Scientific Commission on Public Services/Public Enterprises on "The Future of Public Enterprise - Mission, performance and governance: Learning from success and failures". This Version dates: 28 02 2014. 1 Corresponding author: [email protected].
4
Abstract
This paper analyzes deals involving private and State-owned enterprises (SOEs) worldwide since 2004. We consider four types of deals: privatizations, publicizations, private reorganizations (i.e private firms acquiring a private target) and public reorganizations. (i.e. both acquirers and targets are SOEs). We study whether the pre-deal performance and corporate characteristics of the acquirer and target companies vary across the four types of deals depending on ownership: public or private. Data are taken from Zephyr, which provides information on completed deals worldwide and Orbis, a firm-level dataset. The empirical analysis suggests the following. Some results of previous literature on M&As performed by private firms (‘the inefficiency management hypothesis’) are both confirmed and expanded. Acquirers involved in deals are both larger and better performing than their targets but some qualifications are in order with respect to ownership. The difference in size and performance between acquirers and targets is in fact more pronounced for public with respect to private acquirers. The evidence thus points to an active role of SOEs as acquires, as they significantly out-perform relative to their targets, including private ones, in terms of return on sales. Given these novel findings, further research is needed to examine the motivations behind the different types of deals considered and to verify the role of ownership.
Keywords: Publicization, Privatization, State-owned enterprises, M&As.
JEL-codes: L32, L22, G34.
Acknowledgements: This paper has been written within the context of CIRIEC project “The Future of the Public Enterprises”. The views and opinions expressed in the paper are solely those of the authors.
5
1. Introduction
During the 1990s close to one trillion dollars of public assets have been privatized, more than three-quarters of which in OECD countries (OECD, 2003). After reaching a peak at the end of the 1990s, however, a slowdown of privatizations has been detected over the last decade (Bortolotti et al., 2012). While up to 2005 the decline in the number of privatizations coincided with a slowing trend of stock prices that made public offering disadvantageous for governments, interestingly the trend continued during the stock market boom prior to the 2008 financial crisis (OECD, 2009; Megginson and Bortolotti, 2011).
Moreover, the number of privatizations has been often overstated since many of the reported privatizations have been only partial or formal, and did not bring to any real change in ownership. Bortolotti and Faccio (2009) discuss evidence suggesting that many deals that have been counted as privatizations in fact were hiding just a change in the enterprise’s legal status or a limited divestiture of public ownership, concluding that in OECD countries governments maintain some degree of control in 62% of their privatized companies. According to the World Bank “it has become clear that, for both political and economic reasons, the state will remain a major owner of productive assets in a number of economies for years to come” (World Bank, 2006, p. 1).
Thus, in spite of the long wave of privatization in the last decades, state-owned enterprises (SOEs) continue to persist for political, social and strategic reasons, remaining key players in various countries, particularly, in network industries (Nicoletti and Scarpetta, 2003; Florio, 2013). In 2005 the OECD attempted to map the SOEs which survived the privatization process in Western countries and concluded that, at the beginning of the new Millennium, SOEs were still playing a significant role in various OECD economies, representing “up to 40% of value added, around 10% of employment, and even 50% of market capitalization in different OECD countries, and not only in the former socialist countries” (OECD, 2005, p. 6). In more recent years, the financial crisis and economic recession have further induced state intervention in Western economies. Many OECD countries have injected consistent amounts of liquidity in the market to bail out private banks and strategic enterprises. According to the OECD, just after the crisis, shares of equity holdings owned by some OECD governments increased up to 20% of their GDP, above the OECD average of around 8% (OECD, 2010).
This public intervention has been accompanied by an increasing active role of the government in the management of SOEs. In several occasions governments attempted and succeeded to influence portfolio companies and to pursue goals different from the maximization of the firm value (Kahan and Rock, 2011). According to a survey (OECD, 2011), 2,057 SOEs are active in OECD countries, employing more than 6 million people, with an estimated value close to US$ 1.9 trillion. Focusing on non-OECD countries, other analyses (Hall &

6
Soskice, 2001; Chong and Lopez-de-Silanes, 2003; Redding, 2005; World Bank, 2006) stress the even more active and direct role that SOEs play in promoting economic growth both in market and social democratic economies, particularly in China (Fligstein & Zhang, 2011; Lin, 2011; Redding & Witt, 2009). A recent report (OECD, 2013) documents that several non-OECD countries have consolidated public ownership in enterprises operating in strategic sectors. In fact, in the BRICS,1 the aggregate SOEs’ market value corresponds to 32% of their GDP. In these countries SOEs have increased in number, size, profitability and they have also pursued internationalization strategies through an increasing number of cross-border M&As (OECD, 2013; Karolyi and Liao, 2013).
The main aim of this paper is analyze deals involving SOEs in the last decade to highlight trends and common characteristics and stress similarities and differences with deals performed by private enterprises. Our novel dataset is constructed by matching information from Zephir, a dataset of worldwide deals recorded between 2004 and 2012, with firm-level data from Orbis, a dataset containing financial indicators of dealers, both provided by the Bureau Van Dijk. By matching the ownership of both the acquirer and target companies,2 we first classify deals into four categories: 1) privatization, when a private enterprise acquires a SOE; 2) publicization, when the reverse process occurs, namely an SOE acquirers a private enterprise; 3) private re-organization, when a private acquires another private entity; and 4) public re-organization when both the acquirer and target companies are state-owned. This data set allowed us to investigate three main research questions.
First, we compare the trend of publicizations with the trend of privatizations to assess whether a process reviving SOEs and a reversal of privatization are effectively taking place. We also want to verify the characteristics of such a process: which countries and sectors have been mainly interested, the size of the involved enterprises, and whether the current economic crisis has played a role.
Second, we compare the characteristics of the acquirer and target companies involved in the four types of deals with respect to their size and their performance - measured by different variables - questioning whether their pre-deal characteristics vary depending on ownership. By comparing their financial data, we assess whether private and public acquirers have similar or different economic characteristics and whether they buy similar or different types of target companies. In particular, we assess whether private acquirers are bigger and perform better than their private targets, as widely found in the previous literature on M&As, and we question whether the same result holds when considering SOE acquiring private and public target enterprises. Although the M&As literature on characteristics and determinants of deals is vast, to the best of our knowledge, no study has so far analyzed whether characteristics of 1 BRICS stands for: Russia, India, China and South Africa. 2 Both Zephyr and Orbis databases are provided with a unique enterprise identifying key allowing us to perform exact matching of firms contained in both datasets.
7
acquirers and targets differ when companies involved in a deal are government-owned.
Finally, we compare the four types of deals by looking at the countries and sectors where the transactions mainly take place. We question whether SOEs tend to acquire target companies located in countries and operating in sectors that differ from the ones of the target companies acquired by private enterprises. In particular, we question whether public enterprises have a different attitude, compared to private firms, toward internationalization -though cross-border M&As- and toward business diversification -through cross-sector M&As. We also question whether public enterprises have a higher propensity than private ones to enter in deals in sectors of services of general interest.
The novelty of our work is that, while previous literature has analyzed the pre-deal characteristics of acquirers and targets focusing on M&As among privately-owned enterprises, we extend this approach by also considering deals where at least one enterprise is government-owned. By developing this comparative analysis we are setting the stage for further research aimed at understanding whether, when performing a deal, SOEs behave like profit maximizing private enterprises or whether they might be guided by different, social or political, goals. Indeed, while SOEs have been traditionally used by governments to solve market failures and to achieve social goals (Atkinson and Stiglitz, 1980; Bös, 1994), in the last decade SOEs have been increasingly corporatized and legally re-organized: they have been subjected to general corporate law, in many cases they have been listed on a stock exchange market, where they compete with private firms to attract private equity (OECD, 2005; Pargendler et al., 2013).
The structure of the paper is the following. In the next section we briefly review the related literature, focusing in particular on papers discussing the pre-deal characteristics of acquirers and targets and on the M&As where SOEs are involved. We then describe the data used, explaining the process of building our novel dataset from the deal-level and firm-level databanks, Zephyr and Orbis, respectively. We then describe in more detail the deals, distinguishing between publicization, privatization, and re-organization deals in the last decade. We first document aggregate trends and then briefly describe the cross-border and cross-sector dimensions of deals, focusing on firms operating in the sector of services of general interest and on the most representative sectors. Finally we describe the economic and financial performance of both acquirer and target companies discussing differences by deal types and ownership. The final section discusses and concludes.
2. Literature review
A vast literature has investigated the reasons underlying an enterprise’s decision to acquire another one or to merge with it. A strand of this literature has tried to infer the rationale for a M&A deal by questioning “who buys whom”
8
and comparing the pre-deal characteristics of the acquirer and target companies. Manne’s (1965) seminal article (1965) points out that takeovers provide disciplinary devices to correct firms’ internal inefficiencies. Well-performing enterprises will acquire underperforming and badly managed target companies, whose inefficient management will be substituted with a superior one: a result also known as the “inefficient management hypothesis” (Mandelker, 1974; Walsh and Edwoods, 1991). Several papers have compared the pre-deal performance differences in the acquirer and target characteristics3 finding evidence that in the pre-deal period acquirers are more productive, have a higher asset valuation, and perform better than acquired firms4 (Maksimovic and Phillips, 2001; Jovanovic and Rousseau, 2002; Andrade and Stafford, 2004; Rousseau, 2006; Breinlich, 2008). Using pre-deal accounting-based data and looking at the returns on equity, on assets and on sales (respectively ROE, ROA and ROS), Mueller (1980) finds that acquirers are larger, have grown faster and are more leveraged than both target companies and non-participants industry peers. This result has been confirmed with respect to other performance measures5 (Hasbrouk, 1985; Andrade et al., 2001; Bradley and Sundaram, 2006; Liu and Qiu, 2013). Conversely, other papers comparing the pre-deal stock market or return performance of acquirers, targets and non-merging control group do not find a clear evidence for the inefficient management hypothesis (among others Agrawal and Jaffe, 1995; Franks and Mayer, 1995). Ravenscraft and Scherer (1989), who analyze pre-deal accounting-based data of small and unlisted companies, also find that, before acquisition, target companies are highly profitable and their pre-merger profitability is substantially above that of manufacturing sector peers. Camerlynck et al. (2005) provide some evidence that target and acquiring companies have a complementary financial profile6 and 3 While most of this literature analyses pre-deal stock market data – abnormal returns or share prices, market to book ratio- a smaller strand of literature has focused on accounting data, such as net income, return on equity or assets, leverage, and liquidity of the firm. 4 Various performance measures are used to compare acquirers and targets: market to book ratio; cash flow; excess stock returns, measured as excess returns of the firm’s common stock to the market index. 5 Size (sales, total assets, number of employees, total intangible assets, total capital expenditure, and research and development - R&D - expenditure), technology (asset to labor ratio, capital expenditure to labor ratio, and R&D expenditure to labor ratio), productivity (sales per worker) and profitability (total earning, earning per worker, and earning to asset ratio) Liu and Qiu (2013); Average q-ratio (Hasbrouk, 1985); abnormal operating performance, given by the difference between the combined firm’s operating margin and the corresponding industry median operating margin (Andrade et al., 2001); stock price performance before the acquisition announcement, equity capitalization, cash and equivalents to total assets, capital expenditure to total assets; (Bradley and Sundaram, 2006). 6 They analyze the profitability, liquidity, financial structure, added value and failure risk using statistical analysis of industry-adjusted variables. Among the various variables the firms’ performance is measured by: net return on sales before taxes; net return on total assets before taxes; net return on equity after taxes; cash flow return on equity; gross added value per employee; personnel expenses per employee.

9
that, before a deal, target companies are more profitable than their industrial peers. Rhodes-Kropf et al. (2005) find that firms with a higher market-to-book ratio (M/B) tend to acquire target companies with lower M/B ratio but that acquired firms have a much higher evaluation than their non-acquired industry peers. They suggest that the general statement “high buys low” should be substituted by the proposition “high buy less high (but not low)”.
The mentioned literature entirely focuses on deals performed by private enterprises and, to the best of our knowledge, no study has so far analyzed whether these findings hold when the companies involved in a M&A are ultimately government-owned. Our paper intends to cover this gap by questioning whether the pre-deal characteristics of the acquirer and target companies vary depending on their ownership type.
While the literature on pre-deal characteristics of acquirers and targets has not investigated the case of public ownership, another stand of literature has analyzed the determinants of some publicization episodes. Chernykh (2011) analyzes the wave of renationalization that took place in Russia after 2004. She finds that nationalizations occurred in strategic sectors and were not correlated with the firm’s financial debt. She claims that the State has not limited itself to save firms in financial distress but that nationalizations have been mainly politically driven to ensure public control of strategic assets. Several studies find that Chinese SOEs have undertaken cross-border M&As to: ensure national energy security through direct access to energy resources and raw materials (Luo and Tung, 2007; Chen and Lin, 2009; Jeong and Weiner, 2012); to acquire new capabilities and to exploit intangible assets (Deng, 2009).
Other papers have questioned whether private and SOEs show a different attitude towards internationalization through cross-border M&As, finding that SOEs are less internationalized than privately-owned enterprises (Elstrin et al., 2013; OECD, 2013). Dinc and Erel (2012) find evidence of economic nationalism as a counter-force which opposes cross-border transactions by SOEs. Ramasamy et al. (2012) focus on cross-border M&As performed by Chinese firms and find that acquisitions by private firms are driven by a rent-seeking objective, while SOEs acquisitions are driven mainly by strategic and political reasons. Karolyi and Liao (2013) find small differences between cross-border M&As performed by private and SOEs, but find that SOEs have a higher propensity than private enterprises to acquire firms located in countries that are geographically close and that operate in similar sectors.
These papers focus on public acquirers only while, to the best of our knowledge, no paper has so far considered simultaneously the role of ownership on the acquired companies’ side. Our paper aims at covering this gap by combining evidence on public and private ownership for both acquirer and target companies, i.e. ownership on the two sides of a deal. The importance of adopting our perspective seems evident. As M&A processes are bilateral transactions, evidence about the mutual characteristics of both players, the buyer
10
and the target, is needed either to confirm or to reject the ‘inefficient management hypothesis’. In other words: are SOEs, in their role as acquirers, performing better than their targets? Are private firms acquiring SOEs performing better than their targets? Finally, are there differences in relative terms in privatizations versus publicizations from the angle of relative efficiency of acquirers and targets?
3. The dataset: the construction process and descriptive statistics
Data on deals performed by enterprises, regardless of their ownership structure, are extracted from Zephyr, a database managed by the Bureau Van Dijk with information on completed deals worldwide.7 We narrow the sample selection on those deals for which financial and ownership information are available simultaneously for acquirer, target and vendor companies. By matching available information for these three types of companies, we restrict, out of a much larger potential pool, the sample of data to 45,874 deals over the period 2004 and 2012. There are still a significant number of missing observations which we consider as randomly distributed. This further restricts the sample, but we have preferred to select a relatively small number of deals for which all the key information is available.
Since information about the enterprise’s ultimate owner (UO) provided by Zephyr refers only to the latest available year rather than the year when the deal occurred, when defining the ownership type of the dealers we might wrongly consider as public (private) a firm which is public (private) nowadays but that was not public (private) at the time of the deal. To avoid this potential sampling error we had to further restrict our sample only to those observations where the UO of both the acquirer and vendor have not changed since the time of the deal.8 To this aim, we have developed an algorithm that allows us to extract only those observations where both the vendor and acquiring companies involved in a deal (at time t) do not figure, in turn, as target companies in a subsequent deal (at any time t+j). This strict selection procedure leaves us with our final sample of 13,475 observations. Being sure that the ownership of the dealers has never varied in the considered period (t, t+j), within this smaller sample we can correctly infer the ownership nature of the enterprise when the deal took place by looking at the enterprise’s current UO.
7 https://www.bvdinfo.com/en-gb/products/economic-and-m-a/m-a/zephyr. Sources come from reports, international financial journals, company press release, electronic publications, company websites, stock exchange information. We excluded the rumors about potential and not completed deals. Completed deals include: acquisitions, greenfields, mergers, demergers, buy-backs, minority stakes, buy-outs, share buy-backs, management buy-ins. 8 In order to ascertain the pre-deal ownership nature of the target, we look at the ownership type of the vendor, while we look at the acquirer’s ownership to infer its post-deal ownership. In the rest of the paper we thus report information on the ownership of target and acquirers.

11
Before describing the dataset and performing the empirical analyses, a working definition of SOEs is in order. We consider as state-owned any enterprise whose ultimate owner, defined as the independent shareholder with the highest direct or total percentage of ownership, is a central or local public entity, including public authorities, governments, municipalities and local entities. Further, we consider this independent shareholder to be an ultimate owner of an enterprise if it holds more than 25% of shares. This is certainly less formalistic than considering more than 50% of ownership (Kowalski et al., 2013), as discussed by Florio (2014). See also Florio and Fecher (2011) about the opportunity of considering a broad approach to the understanding of government ownership.
For each enterprise involved in a deal, we extract information, at the time t of the deal, about its ownership, in terms of private or public nature of its UO, its country of origin and its sector of primary activity (NACE Rev.2 code as shown in the Annex II).
We complement this information with accounting variables, taken from the Orbis dataset,9 also managed by the Bureau Van Dijk. In detail, for each enterprise in the dataset, we consider the number of employees, total assets, operating revenues and earnings before interest and taxes (EBIT). We have also computed ratios related to performance: returns on sales (ROS), computed as operating income over revenues, return on assets (ROA), revenues per employee (REE) and assets per employee.
By exploiting the information on the ownership nature -private or public- of both the acquirer and target companies at the year of the deal, we have classified each deal in our sample in one of the following four categories: 1) Private re-organization, when the deal involves both privately-owned
acquirer and target; 2) Public re-organization, when the deal involves both publicly owned
acquirer and target; 3) Privatization, when the deal involves a privately-owned acquirer and a
publicly-owned target; 4) Publicization, when the deal involves a publicly-owned acquirer and a
privately-owned target. Of the 13,475 deals in our sample, the majority falls within the private re-
organization case, representing around 84% of the total (Table 1). Privatizations, instead, represent around 8% of the total while public reorganizations and publicizations account for 5% and above 3%, respectively.
The weight of re-organizations is in general higher, irrespective of the acquirer’s ownership, although private re-organizations represent 92% of deals with a private acquirer, while public re-organizations represent only 61% of
9 http://www.bvdinfo.com/en-gb/products/company-information/international/orbis-(1).

12
deals with a public acquirer. This suggests that the relative weight of publicizations is higher, in deals with public acquirers, than that of privatizations in deals with private acquirers.
Table 1 – Deals by ownership of Acquirer and Target
Target
Public Private Total
Acquirer Public 690 (61%) 1,034 (8%) 1,724 (13%) Private 450 (39%) 11,301 (92%) 11,751 (87%)
Total 1,140 (100%) 12,335 (100%) 13,475 (100%) Source: Own elaboration on Zephyr-Orbis.
Focusing on the size of firms involved in deals, measured in terms of employees,10 more than 60% of deals involve large enterprises as acquirers, while targets are more equally distributed among the different class sizes (Table 2).11
Table 2 – Deals by size of Acquirer and Target Non-missing Obs Acquirer Non-missing Obs Target Small (10 to 49) 749 13% 975 23% Medium (50 to 250) 1,201 19% 1,504 35% Big (>250) 4,348 69% 1,817 42% Total Obs 6,298 100% 4,296 100% Source: Own elaboration on Zephyr-Orbis.
Note: All reported figures are based on non-missing observations.
4. Publicizations, privatizations and re-organizations
In this section, we analyze and compare the four typologies of deals described in Table 1, highlighting trends and main characteristics. Figure 1 plots the number of deals per year, considering public and private acquirers (left and right panel, respectively). Between 2008 and 2010, there has been a sharp increase in the number of deals involving public acquirers (Figure 1, left panel), mainly driven by publicizations. This finding is probably related to “rescue operations” from public bodies due to the ongoing economic crisis. Deals with private acquirers (Figure 1, right panel), also seem to be increasing in the period considered, albeit with a small slump between 2008 and 2009. Focusing on privatization, there seems to have been a slowdown between 2007 and 2009, with a reprise afterwards, with a dynamic behavior that is most likely driven by the ongoing economic crisis.
10 According to article 2 of the EU recommendation 2003/61 “the category of small and medium-sized enterprises (SMEs) is made up of enterprises which employ fewer than 250 persons”. In particular the recommendation identifies a micro-enterprise if it has less than 10 employees. An enterprise is defined to be small if it employees less than 50 persons and more than 10 persons, while a medium enterprise employees between 50 and 250 persons. 11 Data for firms with less than 10 employees have been excluded from the sample.

13
Figure 1 – Number of deals with public and private acquirers
Source: Own elaboration on Zephyr-Orbis.
Notes: The right-hand figure has a double scale on the vertical axis, showing the number of ‘private re-organization’ and ‘total deals with private acquirer’ on the left axis, and the number of ‘privatization’ on the right axis.
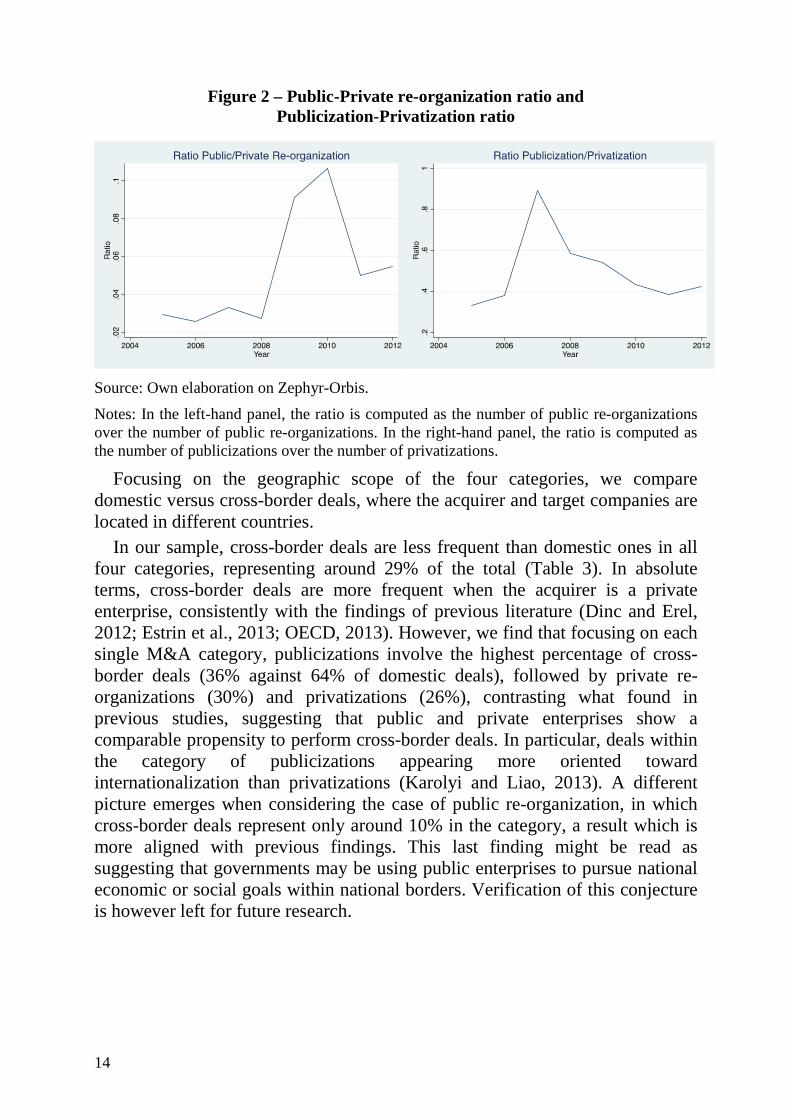
To further examine this issue we have computed two ratios, based on the number of deals, indicating the relative weight of public re-organizations over private re-organizations and of publicizations over privatizations (Figure 2, left and right panel, respectively). The left-hand panel of Figure 2 shows a slight positive trend of the public to private re-organization ratio, which suggests that re-organizations among public enterprises are increasing with respect to private re-organizations, with a peak in 2010. The right-hand panel highlights an increasing trend, suggesting that the weight of publicizations with respect to privatizations has slightly increased over time, with a peak in 2010. A tentative explanation of these trends, especially in the period 2007-2010, points to the response by governments to the Great Recession, which has brought to several episodes of nationalization and bailouts.
14
Figure 2 – Public-Private re-organization ratio and Publicization-Privatization ratio
Source: Own elaboration on Zephyr-Orbis.
Notes: In the left-hand panel, the ratio is computed as the number of public re-organizations over the number of public re-organizations. In the right-hand panel, the ratio is computed as the number of publicizations over the number of privatizations.
Focusing on the geographic scope of the four categories, we compare domestic versus cross-border deals, where the acquirer and target companies are located in different countries.
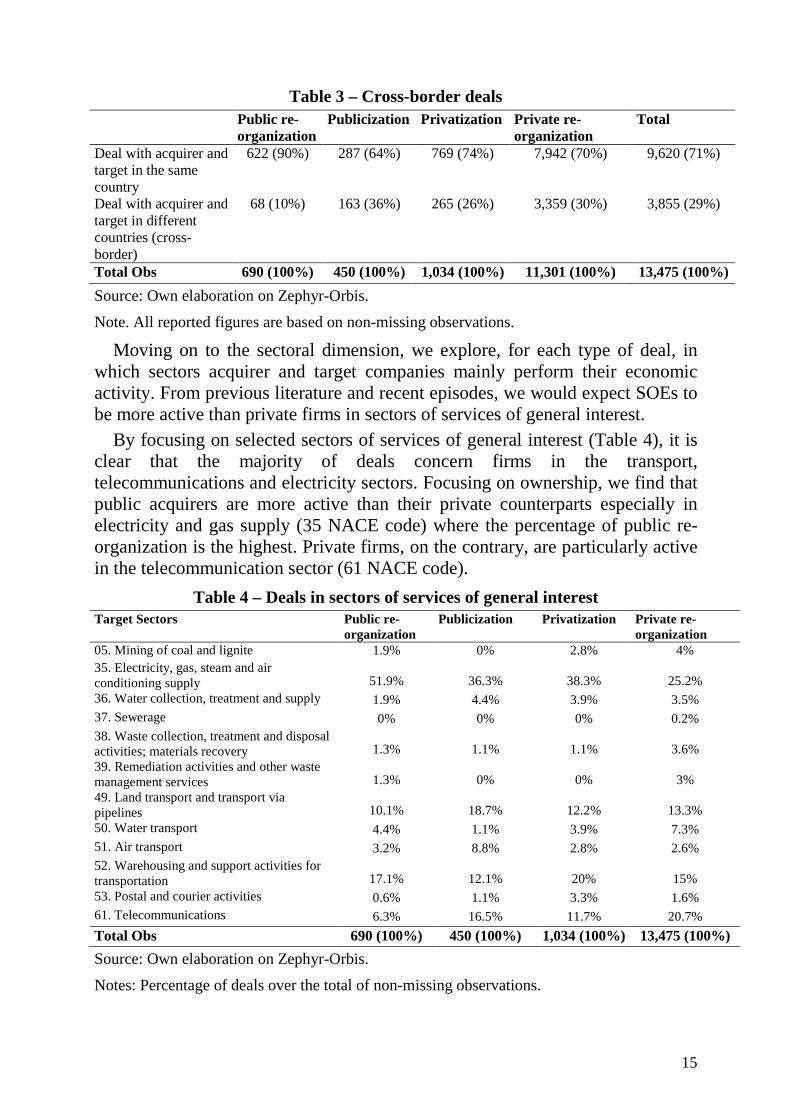
In our sample, cross-border deals are less frequent than domestic ones in all four categories, representing around 29% of the total (Table 3). In absolute terms, cross-border deals are more frequent when the acquirer is a private enterprise, consistently with the findings of previous literature (Dinc and Erel, 2012; Estrin et al., 2013; OECD, 2013). However, we find that focusing on each single M&A category, publicizations involve the highest percentage of cross-border deals (36% against 64% of domestic deals), followed by private re-organizations (30%) and privatizations (26%), contrasting what found in previous studies, suggesting that public and private enterprises show a comparable propensity to perform cross-border deals. In particular, deals within the category of publicizations appearing more oriented toward internationalization than privatizations (Karolyi and Liao, 2013). A different picture emerges when considering the case of public re-organization, in which cross-border deals represent only around 10% in the category, a result which is more aligned with previous findings. This last finding might be read as suggesting that governments may be using public enterprises to pursue national economic or social goals within national borders. Verification of this conjecture is however left for future research.
15
Table 3 – Cross-border deals Public re-
organization Publicization Privatization Private re-
organization Total
Deal with acquirer and target in the same country
622 (90%) 287 (64%) 769 (74%) 7,942 (70%) 9,620 (71%)
Deal with acquirer and target in different countries (cross-border)
68 (10%) 163 (36%) 265 (26%) 3,359 (30%) 3,855 (29%)
Total Obs 690 (100%) 450 (100%) 1,034 (100%) 11,301 (100%) 13,475 (100%)
Source: Own elaboration on Zephyr-Orbis.
Note. All reported figures are based on non-missing observations.
Moving on to the sectoral dimension, we explore, for each type of deal, in which sectors acquirer and target companies mainly perform their economic activity. From previous literature and recent episodes, we would expect SOEs to be more active than private firms in sectors of services of general interest.
By focusing on selected sectors of services of general interest (Table 4), it is clear that the majority of deals concern firms in the transport, telecommunications and electricity sectors. Focusing on ownership, we find that public acquirers are more active than their private counterparts especially in electricity and gas supply (35 NACE code) where the percentage of public re-organization is the highest. Private firms, on the contrary, are particularly active in the telecommunication sector (61 NACE code).
Table 4 – Deals in sectors of services of general interest Target Sectors Public re-
organization Publicization Privatization Private re-
organization 05. Mining of coal and lignite 1.9% 0% 2.8% 4% 35. Electricity, gas, steam and air conditioning supply 51.9% 36.3% 38.3% 25.2% 36. Water collection, treatment and supply 1.9% 4.4% 3.9% 3.5% 37. Sewerage 0% 0% 0% 0.2% 38. Waste collection, treatment and disposal activities; materials recovery 1.3% 1.1% 1.1% 3.6% 39. Remediation activities and other waste management services 1.3% 0% 0% 3% 49. Land transport and transport via pipelines 10.1% 18.7% 12.2% 13.3% 50. Water transport 4.4% 1.1% 3.9% 7.3% 51. Air transport 3.2% 8.8% 2.8% 2.6% 52. Warehousing and support activities for transportation 17.1% 12.1% 20% 15% 53. Postal and courier activities 0.6% 1.1% 3.3% 1.6% 61. Telecommunications 6.3% 16.5% 11.7% 20.7%
Total Obs 690 (100%) 450 (100%) 1,034 (100%) 13,475 (100%)
Source: Own elaboration on Zephyr-Orbis.
Notes: Percentage of deals over the total of non-missing observations.
16
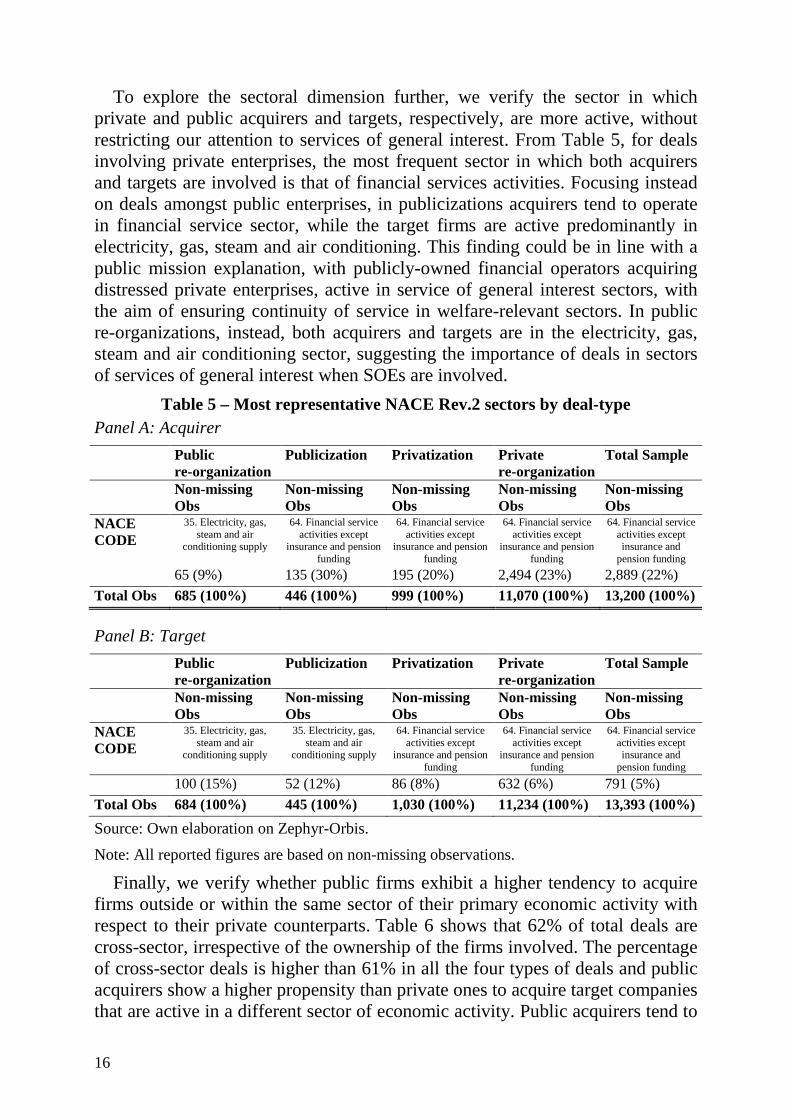
To explore the sectoral dimension further, we verify the sector in which private and public acquirers and targets, respectively, are more active, without restricting our attention to services of general interest. From Table 5, for deals involving private enterprises, the most frequent sector in which both acquirers and targets are involved is that of financial services activities. Focusing instead on deals amongst public enterprises, in publicizations acquirers tend to operate in financial service sector, while the target firms are active predominantly in electricity, gas, steam and air conditioning. This finding could be in line with a public mission explanation, with publicly-owned financial operators acquiring distressed private enterprises, active in service of general interest sectors, with the aim of ensuring continuity of service in welfare-relevant sectors. In public re-organizations, instead, both acquirers and targets are in the electricity, gas, steam and air conditioning sector, suggesting the importance of deals in sectors of services of general interest when SOEs are involved.
Table 5 – Most representative NACE Rev.2 sectors by deal-type Panel A: Acquirer
Public re-organization
Publicization Privatization Private re-organization
Total Sample
Non-missing Obs
Non-missing Obs
Non-missing Obs
Non-missing Obs
Non-missing Obs
NACE CODE
35. Electricity, gas, steam and air
conditioning supply
64. Financial service activities except
insurance and pension funding
64. Financial service activities except
insurance and pension funding
64. Financial service activities except
insurance and pension funding
64. Financial service activities except insurance and
pension funding 65 (9%) 135 (30%) 195 (20%) 2,494 (23%) 2,889 (22%)
Total Obs 685 (100%) 446 (100%) 999 (100%) 11,070 (100%) 13,200 (100%)
Panel B: Target
Public re-organization
Publicization Privatization Private re-organization
Total Sample
Non-missing Obs
Non-missing Obs
Non-missing Obs
Non-missing Obs
Non-missing Obs
NACE CODE
35. Electricity, gas, steam and air
conditioning supply
35. Electricity, gas, steam and air
conditioning supply
64. Financial service activities except
insurance and pension funding
64. Financial service activities except
insurance and pension funding
64. Financial service activities except insurance and
pension funding 100 (15%) 52 (12%) 86 (8%) 632 (6%) 791 (5%)
Total Obs 684 (100%) 445 (100%) 1,030 (100%) 11,234 (100%) 13,393 (100%)
Source: Own elaboration on Zephyr-Orbis.
Note: All reported figures are based on non-missing observations.
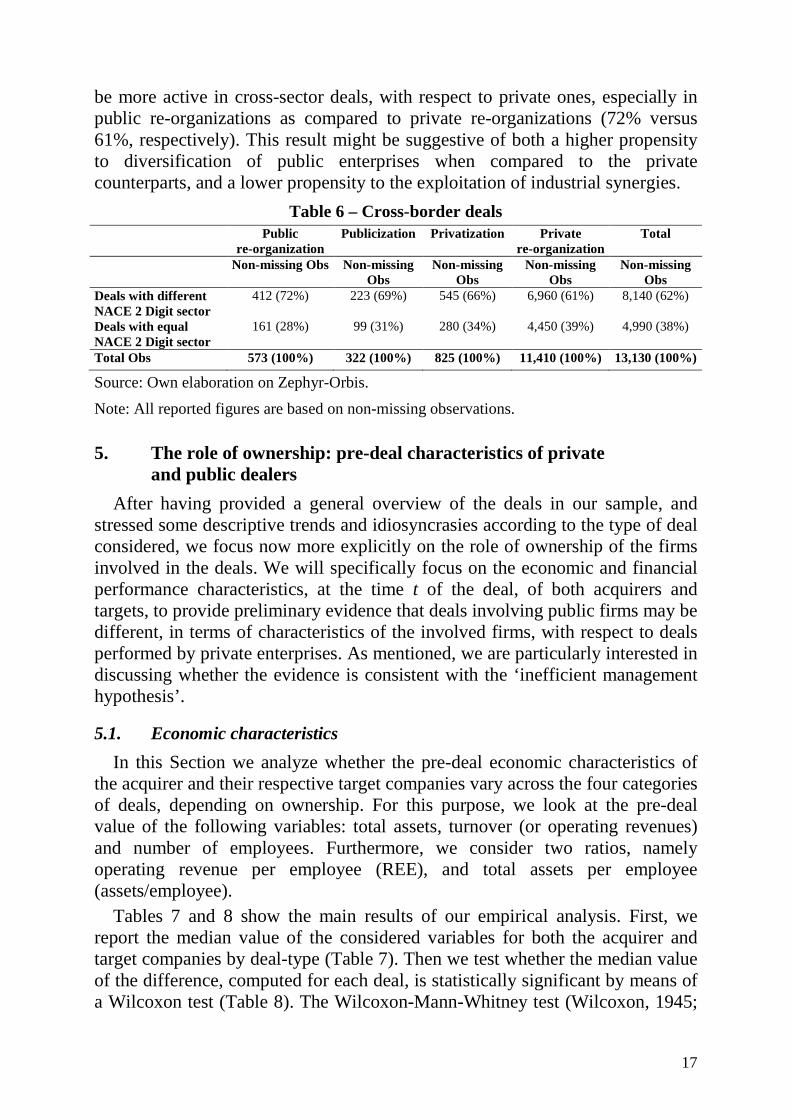
Finally, we verify whether public firms exhibit a higher tendency to acquire firms outside or within the same sector of their primary economic activity with respect to their private counterparts. Table 6 shows that 62% of total deals are cross-sector, irrespective of the ownership of the firms involved. The percentage of cross-sector deals is higher than 61% in all the four types of deals and public acquirers show a higher propensity than private ones to acquire target companies that are active in a different sector of economic activity. Public acquirers tend to
17
be more active in cross-sector deals, with respect to private ones, especially in public re-organizations as compared to private re-organizations (72% versus 61%, respectively). This result might be suggestive of both a higher propensity to diversification of public enterprises when compared to the private counterparts, and a lower propensity to the exploitation of industrial synergies.
Table 6 – Cross-border deals Public
re-organization Publicization Privatization Private
re-organization Total
Non-missing Obs Non-missing Obs
Non-missing Obs
Non-missing Obs
Non-missing Obs
Deals with different NACE 2 Digit sector
412 (72%) 223 (69%) 545 (66%) 6,960 (61%) 8,140 (62%)
Deals with equal NACE 2 Digit sector
161 (28%) 99 (31%) 280 (34%) 4,450 (39%) 4,990 (38%)
Total Obs 573 (100%) 322 (100%) 825 (100%) 11,410 (100%) 13,130 (100%)
Source: Own elaboration on Zephyr-Orbis.
Note: All reported figures are based on non-missing observations.
5. The role of ownership: pre-deal characteristics of private and public dealers
After having provided a general overview of the deals in our sample, and stressed some descriptive trends and idiosyncrasies according to the type of deal considered, we focus now more explicitly on the role of ownership of the firms involved in the deals. We will specifically focus on the economic and financial performance characteristics, at the time t of the deal, of both acquirers and targets, to provide preliminary evidence that deals involving public firms may be different, in terms of characteristics of the involved firms, with respect to deals performed by private enterprises. As mentioned, we are particularly interested in discussing whether the evidence is consistent with the ‘inefficient management hypothesis’.
5.1. Economic characteristics
In this Section we analyze whether the pre-deal economic characteristics of the acquirer and their respective target companies vary across the four categories of deals, depending on ownership. For this purpose, we look at the pre-deal value of the following variables: total assets, turnover (or operating revenues) and number of employees. Furthermore, we consider two ratios, namely operating revenue per employee (REE), and total assets per employee (assets/employee).
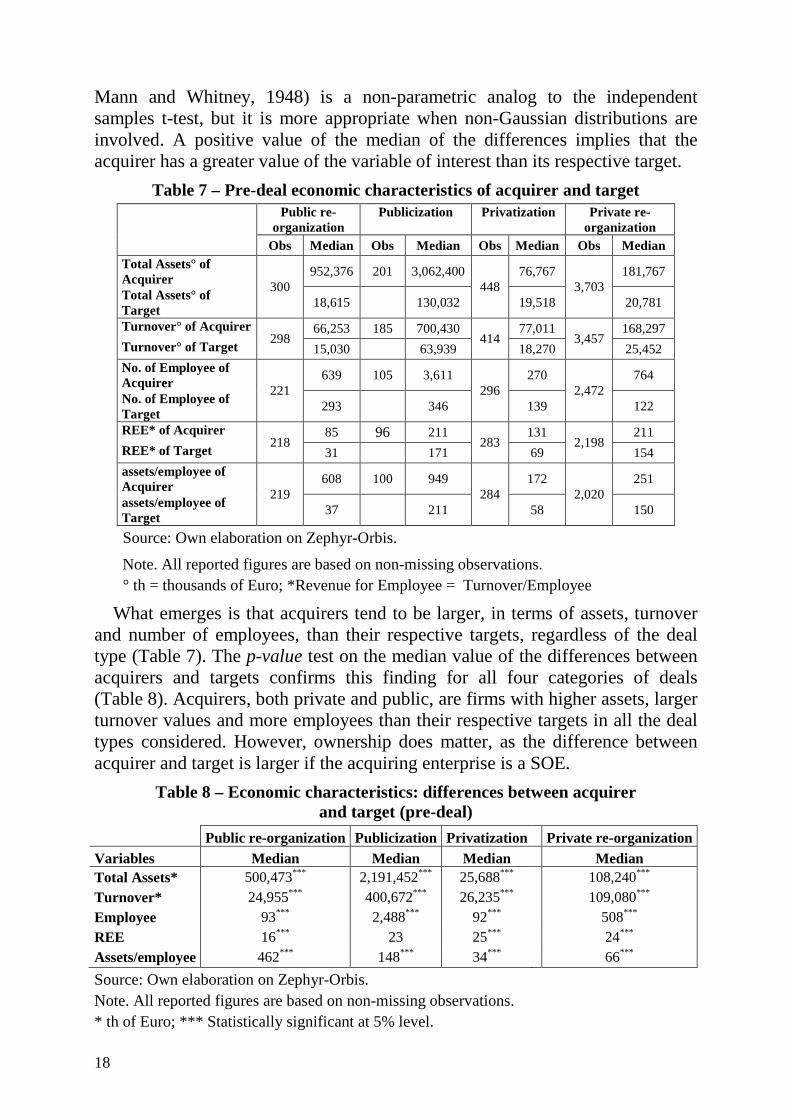
Tables 7 and 8 show the main results of our empirical analysis. First, we report the median value of the considered variables for both the acquirer and target companies by deal-type (Table 7). Then we test whether the median value of the difference, computed for each deal, is statistically significant by means of a Wilcoxon test (Table 8). The Wilcoxon-Mann-Whitney test (Wilcoxon, 1945;
18
Mann and Whitney, 1948) is a non-parametric analog to the independent samples t-test, but it is more appropriate when non-Gaussian distributions are involved. A positive value of the median of the differences implies that the acquirer has a greater value of the variable of interest than its respective target.
Table 7 – Pre-deal economic characteristics of acquirer and target Public re-
organization Publicization Privatization Private re-
organization
Obs Median Obs Median Obs Median Obs Median Total Assets° of Acquirer
300 952,376 201 3,062,400
448 76,767
3,703 181,767
Total Assets° of Target
18,615 130,032 19,518 20,781
Turnover° of Acquirer 298
66,253 185 700,430 414
77,011 3,457
168,297
Turnover° of Target 15,030 63,939 18,270 25,452
No. of Employee of Acquirer
221 639 105 3,611
296 270
2,472 764
No. of Employee of Target
293 346 139 122
REE* of Acquirer 218
85 96 211 283
131 2,198
211
REE* of Target 31 171 69 154
assets/employee of Acquirer
219 608 100 949
284 172
2,020 251
assets/employee of Target
37 211 58 150
Source: Own elaboration on Zephyr-Orbis.
Note. All reported figures are based on non-missing observations. ° th = thousands of Euro; *Revenue for Employee = Turnover/Employee
What emerges is that acquirers tend to be larger, in terms of assets, turnover and number of employees, than their respective targets, regardless of the deal type (Table 7). The p-value test on the median value of the differences between acquirers and targets confirms this finding for all four categories of deals (Table 8). Acquirers, both private and public, are firms with higher assets, larger turnover values and more employees than their respective targets in all the deal types considered. However, ownership does matter, as the difference between acquirer and target is larger if the acquiring enterprise is a SOE.
Table 8 – Economic characteristics: differences between acquirer and target (pre-deal)
Public re-organization Publicization Privatization Private re-organization Variables Median Median Median Median Total Assets* 500,473*** 2,191,452*** 25,688*** 108,240*** Turnover* 24,955*** 400,672*** 26,235*** 109,080*** Employee 93*** 2,488*** 92*** 508*** REE 16*** 23 25*** 24*** Assets/employee 462*** 148*** 34*** 66***
Source: Own elaboration on Zephyr-Orbis. Note. All reported figures are based on non-missing observations. * th of Euro; *** Statistically significant at 5% level.
19
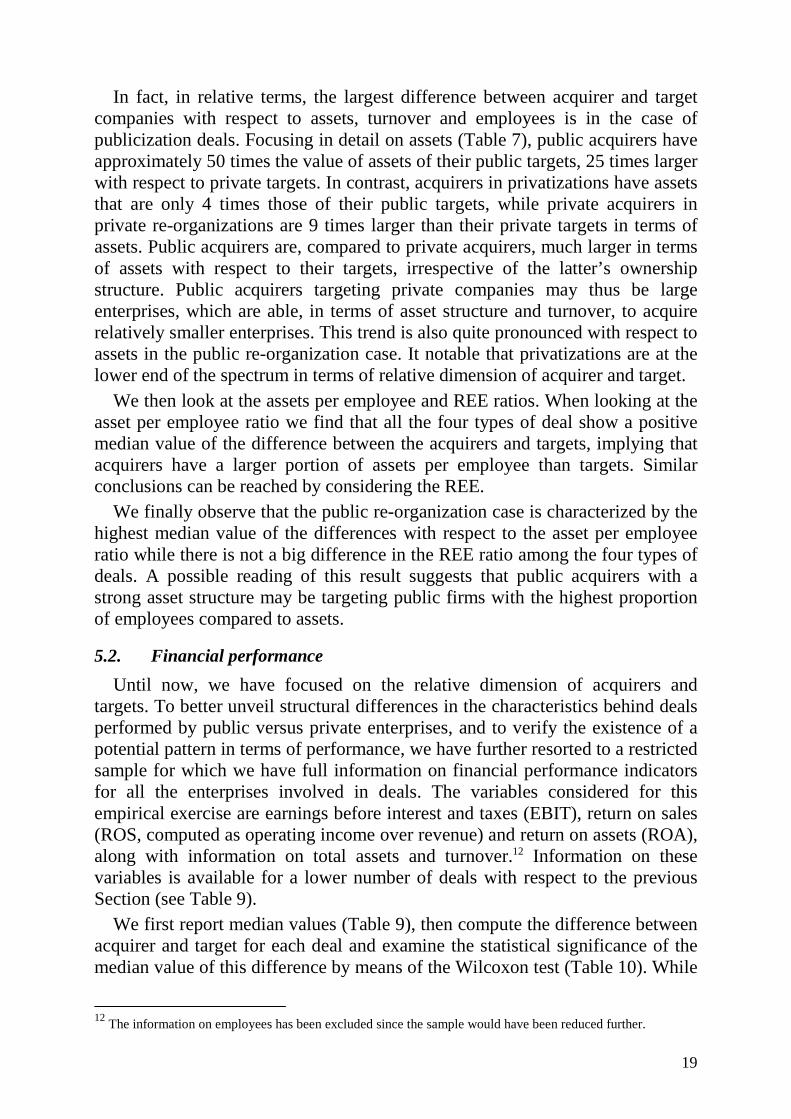
In fact, in relative terms, the largest difference between acquirer and target companies with respect to assets, turnover and employees is in the case of publicization deals. Focusing in detail on assets (Table 7), public acquirers have approximately 50 times the value of assets of their public targets, 25 times larger with respect to private targets. In contrast, acquirers in privatizations have assets that are only 4 times those of their public targets, while private acquirers in private re-organizations are 9 times larger than their private targets in terms of assets. Public acquirers are, compared to private acquirers, much larger in terms of assets with respect to their targets, irrespective of the latter’s ownership structure. Public acquirers targeting private companies may thus be large enterprises, which are able, in terms of asset structure and turnover, to acquire relatively smaller enterprises. This trend is also quite pronounced with respect to assets in the public re-organization case. It notable that privatizations are at the lower end of the spectrum in terms of relative dimension of acquirer and target.
We then look at the assets per employee and REE ratios. When looking at the asset per employee ratio we find that all the four types of deal show a positive median value of the difference between the acquirers and targets, implying that acquirers have a larger portion of assets per employee than targets. Similar conclusions can be reached by considering the REE.
We finally observe that the public re-organization case is characterized by the highest median value of the differences with respect to the asset per employee ratio while there is not a big difference in the REE ratio among the four types of deals. A possible reading of this result suggests that public acquirers with a strong asset structure may be targeting public firms with the highest proportion of employees compared to assets.
5.2. Financial performance
Until now, we have focused on the relative dimension of acquirers and targets. To better unveil structural differences in the characteristics behind deals performed by public versus private enterprises, and to verify the existence of a potential pattern in terms of performance, we have further resorted to a restricted sample for which we have full information on financial performance indicators for all the enterprises involved in deals. The variables considered for this empirical exercise are earnings before interest and taxes (EBIT), return on sales (ROS, computed as operating income over revenue) and return on assets (ROA), along with information on total assets and turnover.12 Information on these variables is available for a lower number of deals with respect to the previous Section (see Table 9).
We first report median values (Table 9), then compute the difference between acquirer and target for each deal and examine the statistical significance of the median value of this difference by means of the Wilcoxon test (Table 10). While
12 The information on employees has been excluded since the sample would have been reduced further.

20
some caution should be taken given the limited number of available observations, some tentative conclusions can be drawn by analyzing these figures which shed light on the differences between the four classes of deals.
Table 9 – Financial indicators - data in levels (acquirer and target) pre-deal
Public re-
organization Publicization Privatization Private re-
organization
Median Median Median Median Total Assets° of Acquiror 619,333 1,637,534 56,844 179,544
Total Assets° of Target 14,913 73,569 14,495 20,734
Turnover° of Acquirer 66,253 719,604 58,041 137,232
Turnover° of Target 14,350 82,899 15,097 24,327
Ebit° of Acquirer 9,512 79,377 3,522 8,326
Ebit° of Target 535 5,504 303 632
ROS* of Acquirer 14 14 8 7
ROS* of Target 6 8 4 4 ROA** of Acquiror 3 7 7 6
ROA** of Target 5 7 5 4
Obs 255 115 319 2,358
Source: Own elaboration on Zephyr-Orbis.
Note. All reported figures are based on non-missing observations.
° th = thousands of Euro; *Return on Sales = Ebit/Turnover; **Return on Asset = Ebit/Total Asset
Table 10 – Financial indicators: differences between acquirer and target (median value) pre-deal
Variables Public re-organization Publicization Privatization Private re-organization Median Median Median Median Total Assets° 276,677*** 1,452,280*** 24,505*** 123,876*** Turnover ° 25,111*** 512,546*** 18,920*** 89,327*** Ebit ° 6,234*** 40,882*** 2,351*** 6,221*** ROS°° 7.2*** 5*** 4.6*** 3.4*** ROA°°° -0.7 -0.9 3.5*** 2.4***
Obs 255 115 319 2,358
Source: Own elaboration on Zephyr-Orbis.
Note. All reported figures are based on non-missing observations.
° th of Euro; °°Ebit/Turnover; °°°Ebit/Turnover; *** Statistically significant at 5% level.
Starting from the private re-organization case, which presents the highest number of observations, we observe that, for both acquirers and targets, the median values (Table 9) of total assets and turnover are comparable to the previously estimated values (Table 7), suggesting that, in spite of being smaller, this sample is quite representative of the previous one.
With respect to performance indicators, and considering the distance between acquirers and targets, private acquirers have higher assets, operating revenues, EBIT, ROS and ROA than their respective privately-owned target companies.
21
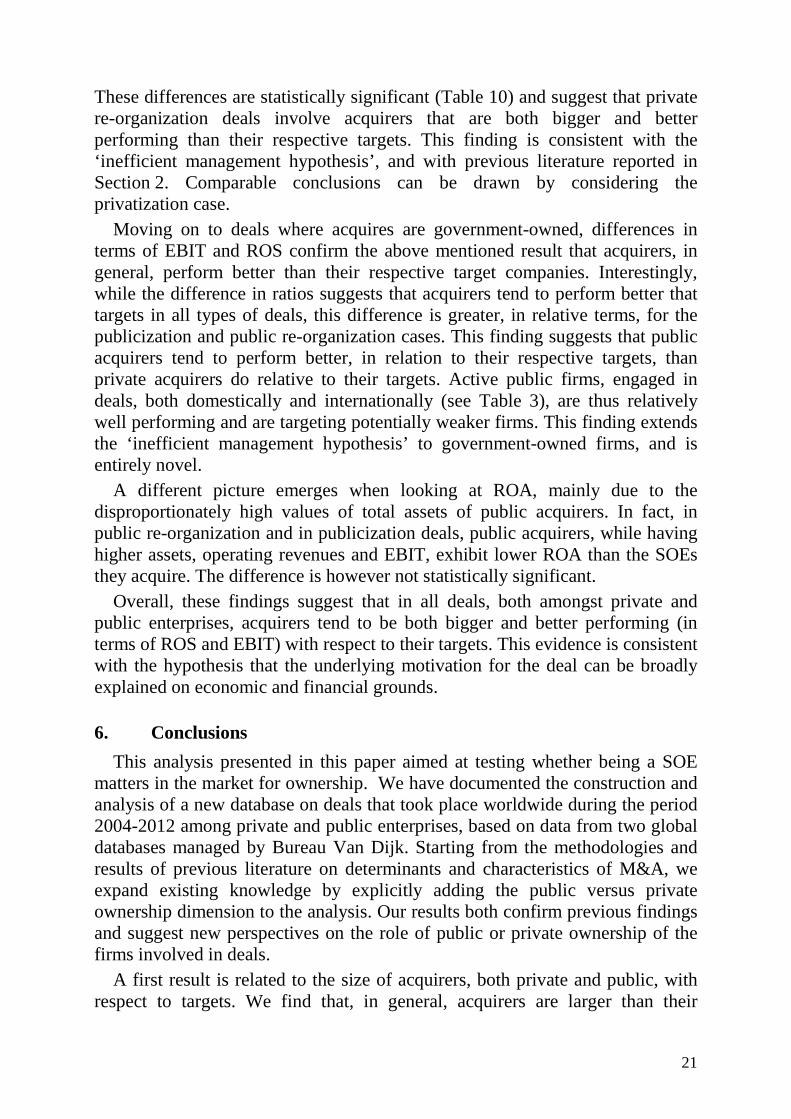
These differences are statistically significant (Table 10) and suggest that private re-organization deals involve acquirers that are both bigger and better performing than their respective targets. This finding is consistent with the ‘inefficient management hypothesis’, and with previous literature reported in Section 2. Comparable conclusions can be drawn by considering the privatization case.
Moving on to deals where acquires are government-owned, differences in terms of EBIT and ROS confirm the above mentioned result that acquirers, in general, perform better than their respective target companies. Interestingly, while the difference in ratios suggests that acquirers tend to perform better that targets in all types of deals, this difference is greater, in relative terms, for the publicization and public re-organization cases. This finding suggests that public acquirers tend to perform better, in relation to their respective targets, than private acquirers do relative to their targets. Active public firms, engaged in deals, both domestically and internationally (see Table 3), are thus relatively well performing and are targeting potentially weaker firms. This finding extends the ‘inefficient management hypothesis’ to government-owned firms, and is entirely novel.
A different picture emerges when looking at ROA, mainly due to the disproportionately high values of total assets of public acquirers. In fact, in public re-organization and in publicization deals, public acquirers, while having higher assets, operating revenues and EBIT, exhibit lower ROA than the SOEs they acquire. The difference is however not statistically significant.
Overall, these findings suggest that in all deals, both amongst private and public enterprises, acquirers tend to be both bigger and better performing (in terms of ROS and EBIT) with respect to their targets. This evidence is consistent with the hypothesis that the underlying motivation for the deal can be broadly explained on economic and financial grounds.
6. Conclusions
This analysis presented in this paper aimed at testing whether being a SOE matters in the market for ownership. We have documented the construction and analysis of a new database on deals that took place worldwide during the period 2004-2012 among private and public enterprises, based on data from two global databases managed by Bureau Van Dijk. Starting from the methodologies and results of previous literature on determinants and characteristics of M&A, we expand existing knowledge by explicitly adding the public versus private ownership dimension to the analysis. Our results both confirm previous findings and suggest new perspectives on the role of public or private ownership of the firms involved in deals.
A first result is related to the size of acquirers, both private and public, with respect to targets. We find that, in general, acquirers are larger than their

22
respective targets, much in line with previous literature (see, among others, Franks and Mayer, 1996; Andrade and Stafford, 2004 and Camerlynck et al., 2005).
Similar conclusions are reached when considering financial performance indicators, suggesting that acquirers out-perform their targets. This second result is in line with previous literature, which has focused on M&As among privately-owned enterprises and has widely found that acquirers perform better than the target companies they buy (see, among others, Maksimovic and Phillips, 2001; Jovanovic and Rousseau, 2002; Andrade and Stafford, 2004). Furthermore, these results are confirmed when focusing on public acquirers, a distinction which is entirely novel to the literature. We confirm that public acquirers are both larger (in terms of assets, employment and turnover) and characterized by higher financial performance indicators (ROS and EBIT) than their private and public targets.
The importance of this finding is that it confirms that government ownership of firms, even in the relatively narrow perspective of financial performance, doesn’t contradict the ‘inefficiency management hypothesis’. Managers of more efficient SOEs target and acquire less efficient private and public firms, similarly to what managers of more efficient private firms do in deals involving private or public firms as targets. In this perspective, SOEs as acquirers are contributing to the efficiency of the market for ownership. This may be considered a surprising result if SOEs were systematically associated with pervasive inefficiency. Our findings thus reject the widely held view that SOEs are always inefficient relative to private firms, or that their acquisitions are mainly politically motivated, i.e. without due consideration of efficiency (see the discussion of previous literature in Section 2).
When considering instead ROA, private acquirers are better performing than their targets, a result which does not hold for public acquirers. This result can be attributed to the fact that public acquirers in our sample own very large total assets. Florio (2014), based on data on the first 2000 Forbes enterprises from Kowalski et al. (2013), reports finding which corroborate our results in terms of relative performance of public acquirers. Approximately 10% of firms in the Forbes 2000 list are public, where a firm is considered public if government bodies own 50% of its shares.13 Computing ROS and ROA for both the subset of public firms and for the total, Florio (2014) reports that public firms belonging to the Forbes 2000 list have higher ROS than all the Forbes 2000 firms (thus are outperforming private firms) while ROA is lower, similarly to what we find here.
Moreover, explicit consideration of ownership allows us to compare the relative difference between acquirers and targets according to whether acquirers
13 The definition of SOEs adopted in the present paper is based on the more restrictive 25% threshold.

23
are private or public, thus further expanding the scope of results with respect to previous literature. What emerges in terms of both size and financial performance is that the difference between acquirers and targets is generally larger when the acquirer is publicly-owned. Further research is needed to explore the underlying drivers of this difference between deals involving public versus private acquirers, and to verify whether it can be related to the existence of different motivations for public enterprises entering in deals, other than purely economic and financial considerations, as suggested, among others, by Chernykh, 2011; Luo and Tung, 2007; Chen and Lin, 2009; Jeong and Weiner, 2012 and Ramasamy et al., 2012). In this perspective, however, our findings do not support the view that SOEs target less efficient companies, i.e, that they aim to ‘too low’. The ROS of public acquirers in our sample is 14%. This is twice the ROS of private acquirers. The ROS of targets in deals when the acquirer is public is between 6 and 8%, while the ROS of the target is 4% when the acquirer is private. While caution is needed in the interpretation of these figures since they are based on a relatively small sample of 3,047 deals, out of the initial sample of 13,475, we have showed, however, that the characteristics of the firms in the smaller and data-richer sample, are quite similar to those of the larger sample. Hence, the large difference in the performance of public acquirer and their targets cannot be attributed to the view that SOEs buy particularly badly managed firms. Certainly, in the media, prominent cases of rescue of bankrupt firms (private and public) are widely covered, but this does not seem to be the most frequent occurrence in our sample. There is a different story suggested by the data: a story of well performing public enterprises that acquire the ownership of less performing, but apparently healthy, target companies. Further research is needed to understand the motivations of these SOEs.
Finally, with respect to the dynamics of deals, we can notice that both publicizations and privatizations seem to have been influenced by the current economic crisis. In detail, publicizations have peaked around 2009-2010, while privatizations, around the same years, have experienced a slump. While we are not able to evaluate the underlying mechanisms, a possible explanation is related to both the governments’ responses to the crisis and the behavior of the stock market.
Taken together these findings suggest that public firms which have entered in deals between 2004 and 2012 are in general of a relevant size and relatively well-performing with respect to their private counterparts. Following previous literature on the characteristics of private acquirers involved in M&A deals, we suggest that public acquirers target firms which they can afford to consider and which are clearly less performing. The difference in performance between public acquirers and their respective public and private targets is larger than the difference between private acquirers and private targets. The overall message is that, by considering firms active in deals in recent years, publicly-owned

24
enterprises are still active players and, contrary to some critics, are well-performing and capitalized.
We believe that these new results deserve some further analyses, which will constitute the focus of our next research, focusing explicitly on the determinants of the differences related to the ownership of firms involved in deals.

25
References
Agrawal, A. and Jaffe, J. (1995), Does section 16b deter insider trading by target managers?, Journal of Financial Economics, 39, 295-321.
Agrawal, A. and Walking, R. (1994), Executive careers and compensation surrounding takeover bids, Journal of Finance, 49, 985-1014.
Andrade, G. and E. Stafford (2004), “Investigating the Economic Role of Mergers,” Journal of Corporate Finance, 10, 1-36.
Andrade, G., M. Mitchell, and E. Stafford (2001), “New Evidence and Perspectives on Mergers,” Journal of Economic Perspectives, 15, 103-20.
Atkinson, A.B. and Stiglitz, J. (1980). “Lectures in Public Economics”, London: McGraw-Hill,
Borraz, F., Pampillon, N.G. and Olarreaga, M. (2013), “Water Nationalization and Service Quality”, World Bank Policy Research Working Paper No. 6318.
Bortolotti, B., Combini, C., Rondi, L. (2012), “Regulatory Independence, Ownership and Firm Value: The Role of Political Institutions”, European University Institute (EUI) Working Paper RSCAS.
Bortolotti, B., Faccio, A. (2009), “Government Control of Privatized Firms”, Society for Financial Studies, vol. 22(8), pp. 2907-2939.
Bös, D., 1994, Pricing and Price Regulation, North-Holland, Amsterdam.
Bradley, M. and Sundaram, A. (2006), “Acquisitions and Performance: A Re-Assessment of the evidence, working paper Duke University.
Breinlich, H. (2008), Trade Liberalization and Industrial Restructuring through Mergers and Acquisitions, Journal of International Economics, Volume 76, Issue 2, pp. 254-266.
Camerlynck, J., Ooghe, H., De Langhe, T. (2005), Pre-Acquisition Profile of Privately Held Companies Involved in Take-Overs: An Empirical Study, Small Business Economics, Volume 24, Issue 2, pp. 169-186.
Chen, Y. and Lin, C. (2009), “Performance of Cross-Border Mergers And Acquisitions (M&A’s) By Chinese Firms”, working paper.
Chernykh, L. (2011), “Profit or politics? Understanding renationalizations in Russia”, Journal of Corporate Finance, 17, 1237-1253.
Chong, A., and Lopez-de-Silanes, F. (2003), “The Truth About Privatisation in Latin America”, Inter-American Development Bank, Washington, DC, October.
Deng, P. (2009), Why do Chinese firms tend to acquire strategic assets in international expansion?, Journal of World Business, 44(1): 74-84.
Estrin, S., Meyer, K., Nielsen, B. and Nielsen, S. (2012), The Internationalization of State Owned Enterprises: The Impact of Political Economy and Institutions, working paper.
Fligstein, N. & Zhang, J.J. (2011), A New Agenda for Research on the Trajectory of Chinese Capitalism, Management and Organization Review, 7(1): 39‐62.
Florio, M. (2004), The Great Divestiture - Evaluating the Welfare Impact of the British Privatizations 1979-1997, The Mit Press.

26
Florio, M. (2013), Network Industries and Social Welfare. The Experiment that Reshuffled European Utilities, Oxford University Press.
Florio, M. (2014), The return of public enterprise, Working Papers 201401, Centre for Industrial Studies (CSIL).
Florio, M. and Fecher, R. (2011), The future of public enterprises: a contribution to a new discourse, Annals of Public and Cooperative Economics, 82(4): 361-373.
Franks, J and Mayer, C. (1996), Hostile takeovers in the UK and the correction of management failure, Journal of Financial Economics, 40, 163-181.
Hall, P.A. & Soskice, D.W., (2001), Varieties of capitalism, Cambridge: Cambridge University Press.
Hall, D., Lobina E. and Terhorst, P. (2013), Re-municipalisation in the early twenty-first century: water in France and energy in Germany, International Review of Applied Economics, Vol. 27, number 2.
Hart, O. (1995), Firms Contracts and Financial Structure, Oxford University Press, Oxford, UK.
Hart O., and Moore J., (1990), Property rights and the nature of the firm, Journal of Political Economy, 98, 1119-1158.
Hasbrouk, J. (1985), The characteristics of takeover targets: q and other measures, Journal of Banking and Finance, 9, 351-362.
Jeong, Y. and Weiner, R. (2012), Energy Security and Foreign Investment, Are Chinese (and other Asian) Companies Buying up the World’s Oil?, working paper.
Jovanovic, B. and P. Rousseau, “The Q-Theory of Mergers,” American Economic Review Papers and Proceedings, 92 (2002): 198-204.
Kahan, M. and Rock, E. (2011), When the Government is the Controlling Shareholder, Texas Law Review, Vol. 89, p. 1293.
Kowalski, P., M. Büge, M. Sztajerowska, and M. Engeland (2013), State-Owned enterprises. Trade effects and policy implications, OECD Trade Policy Papers n. 147, Paris.
Langteig, T. (1978), An application of a three-factor performance index to measure stockholders gains from mergers, Journal of Financial Economics, 6, 365-384.
Lin, N. (2011), Capitalism in China: A Centrally Managed Capitalism (CMC) and Its Future, Management Organization Review, 7(1): 63‐96.
Liu, Q and Qiu, L. (2013), Characteristics of Acquirers and Targets in Domestic and Cross-border Mergers and Acquisitions, Review of Development Economics, 17(3), 474-493.
Luo, Y.D. & Tung, R.L. (2007), International expansion of emerging market enterprises: A springboard perspective. Journal of International Business Studies, 38(4): 481‐498.
Maksimovic, V. and G. Phillips (2001), “The Market for Corporate Assets: Who Engages in Mergers and Asset Sales and Are there Efficiency Gains?”, Journal of Finance, 56: 2019-65.

27
Mandelker, G. (1974), Risk and return: The case of merging firms, Journal of Financial Economics, 1(4), 303-335.
Mann, H.B. and Whitney, D.R. (1947), “On a Test of Whether One of Two Random Variables is Stochastically Larger Than the Other”, Journal of Statistical Computing and Simulation, 13, 41-48.
Manne, H. (1965), Mergers and the market for corporate control, Journal of Political Economy, 73, 110-120.
Megginson, W. and Bortolotti, B. (2011), Privatization Trends and Major Deals in 2011, in “The Privatization Barometer Report 2011”.
Mueller, D., (1980), The Determinants and Effects of Mergers: An International Comparison, Cambridge: Oelgeschlager, Gunn & Hain.
Mussachio, A. and Lazzarini, S. (2012), “Leviathan in Business: Varieties of State Capitalism and their Implications for Economic Performance”, Harvard Business School Working Paper 12-108, June 4.111.
Nicoletti, G. and Scarpetta, S. (2003), “Regulation, productivity and growth: OECD evidence”, Economic Policy, 36.
OECD (2003), Privatising State-Owned Enterprises: An Overview of Policies and Practices in OECD Countries, OECD Publishing, Paris.
OECD (2005), Corporate Governance of State-Owned Enterprises: a Survey of OECD Countries, OECD Publishing, Paris.
OECD (2009), Privatisation in the 21st Century: Recent Experiences of OECD Countries - Report on Good Practices, OECD Publishing, Paris.
OECD (2011), ―The Size and Composition of the SOE Sector in OECD Countries, OECD Corporate Governance Working Papers, No. 5, OECD Publishing.
OECD (2013) - Kowalski, P. Büge M., Sztajerowska M., Egeland M. (2013), “State-Owned Enterprises: Trade Effects and Policy Implications”, OECD Trade Policy Papers, No. 147, OECD Publishing.
Ramasamy, B., Yeung, M. & Laforet, S. (2012), China's outward foreign direct investment: Location choice and firm ownership, Journal of World Business, 47(1) 17‐25.
Ravenscraft, D.J., and F.M. Scherer (1989), The Profitability of Mergers, International Journal of Industrial Organization, 7, 117-131.
Redding, G. (2005), The thick description and comparison of societal systems of capitalism, Journal of International Business studies, 36: 123‐155.
Redding, G. & Witt, M. (2009), China’s business system and its future trajectory, Asia Pacific Journal of Management, 26(3): 381‐399.
Rhodes-Kropf, M., S. Viswanathan, (2004), “Market valuation and merger waves”, Journal of Finance, 59, 2685-2718.
Rousseau P. (2006), The Q-Theory of Mergers: International and Cross-Border Evidence, No 153.
Sappington, D. and Stiglitz, J., (1987), “Privatization, Information, and Incentives”. Journal of Policy Analysis and Management, 6 (4): 567-582.

28
Walsh, J. and Edwood, J. (1991) Mergers, acquisitions, and the pruning of managerial deadwood, Strategic Management Journal, 12(3): 201-217.
Wang, W. (2012), Are Takeovers Really Bad Deals for the Acquirers?, working paper available at SSRN.
Wang, C.Q., Hong, J.J., Kafouros, M. & Wright, M., (2012), Exploring the role of government involvement in outward FDI from emerging economies, Journal of International Business Studies.
Wilcoxon, F. (1945), Individual Comparisons by Ranking Methods, Biometrics, 3, 119-122.
Wollmann, H., Marcou G. (eds.) (2010), “The Provision of Public Services in Europe: Between State, Local Government and Market” Edward Elgar Publishing.
Wollman, H. (2012), “Provision of Public Services in European Countries: From Public/Municipal to Private and Reverse?”, presented to Symposium on Neither Public nor Private: Mixed Forms of Service Delivery around the Globe to be held at the University of Barcelona on May 17-18, 2012.
World Bank (2006), Held by the Visible Hand - The Challenge of State-Owned Enterprise Corporate Governance for Emerging Markets, Washington D.C.

29
Annex
NACE Rev.2 – 1 Digit: all sectors
Description 0. Crop & animal production, Forestry, Mining 1. Manufacture of food, textile, wood, paper, wearing apparel coke and refined petroleum products 2. Manufacture of chemical products, rubber & plastic, metals, machinery & electrical equipment,
motor vehicles 3. Manufacture of furniture, Electricity, gas, sewerage, waste collection treatment & disposal, water
collection 4. Construction of buildings, civil engineering, wholesale and retail trade, land transport via pipelines 5. Water & Air transport, postal activities, Accommodation, Publishing activities, Motion picture,
video and television 6. Programming activities, Computer, Information service activities, Financial services, Insurance,
Real estate activities, legal & accounting services 7. Activities of head office, Architectural & engineering, Scientific research, Advertising & market
research, Veterinary activities, Travel agency, Rental & leasing 8. Security & investigation, Office administrative, Public Administration & defense, Education,
Residential care activities 9. Creative, arts & entertainment, Libraries, museum, Gambling & betting, Sports, Repair of
computers, household as employers of domestic personnel
NACE Rev.2 – 2 Digit: only the main sectors of our statistics
Description 05. Mining of coal and lignite 35. Electricity, gas, steam and air conditioning supply 36. Water collection, treatment and supply 37. Sewerage 38. Waste collection, treatment and disposal activities; materials recovery 39. Remediation activities and other waste management services 46. Wholesale trade, except of motor vehicles and motorcycles 47. Retail trade, except of motor vehicles and motorcycles 49. Land transport and transport via pipelines 50. Water transport 51. Air transport 52. Warehousing and support activities for transportation 53. Postal and courier activities 61. Telecommunications 62. Computer programming, consultancy and related activities 64. Financial service activities, except insurance and pension funding 66. Activities auxiliary to financial services and insurance activities 72. Scientific research and development 84. Public administration and defense; compulsory social security
30
This yearly series of working papers (WP) aims to publish essentially works in English or in French resulting from the scientific network of CIRIEC and more specifically its working groups. The WP are submitted to a review process and are published under the responsibility of the President of the International Scientific Council, the president of the scientific Commissions or the working groups coordinators and of the editor of the CIRIEC international scientific journal, the Annals of Public and Cooperative Economics. These contributions may be published afterwards in a scientific journal or book. The contents of the working papers do not involve CIRIEC's responsibility but solely the author(s') one. The submissions are to be sent to CIRIEC, Université de Liège au Sart Tilman, Bât B33 (bte 6), BE-4000 Liège, Belgique.
Cette collection annuelle de Working Papers (WP) est destinée à accueillir essentiellement des travaux en français ou en anglais issus du réseau scientifique du CIRIEC et en particulier de ses groupes de travail. Les WP font l'objet d'une procédure d'évaluation et sont publiés sous la responsabilité du président du Conseil scientifique international, des présidents des Commissions scientifiques ou des coordinateurs des groupes de travail et de la rédactrice de la revue scientifique internationale du CIRIEC, les Annales de l'économie publique, sociale et coopérative. Ces contributions peuvent faire l'objet d'une publication scientifique ultérieure. Le contenu des WP n'engage en rien la responsabilité du CIRIEC mais uniquement celle du ou des auteurs. Les soumissions sont à envoyer à l'adresse du CIRIEC, Université de Liège au Sart Tilman, Bât B33 (bte 6), BE-4000 Liège, Belgique.

31
Publications
2014/01 Berliner Wasserbetriebe (BWB) – Water and sewage company in Berlin Christina SCHAEFER & Stephanie WARM
2014/02 Berliner Wasserbetriebe (BWB) Christina SCHAEFER & Stephanie WARM
2014/03 Publicization versus Privatization: Recent worldwide evidence Stefano CLÒ, Chiara F. DEL BO, Matteo FERRARIS, Carlo FIORIO, Massimo FLORIO & Daniela VANDONE
CIRIEC (International Centre of Research and Information on the Public, Social and Cooperative Economy) is a non governmental international scientific organization.
Its objectives are to undertake and promote the collection of information, scientific research, and the publication of works on economic sectors and activities oriented towards the service of the general and collective interest: action by the State and the local and regional public authorities in economic fields (economic policy, regulation); public utilities; public and mixed enterprises at the national, regional and municipal levels; the so-called "social economy" (not-for-profit economy, cooperatives, mutuals, and non-profit organizations); etc.
In these fields CIRIEC seeks to offer information and opportunities for mutual enrichment to practitioners and academics and for promoting international action. It develops activities of interest for both managers and researchers.
Le CIRIEC (Centre International de Recherches et d'Information sur l'Economie Publique, Sociale et Coopérative) est une organisation scientifique internationale non gouvernementale.
Ses objectifs sont d'assurer et de promouvoir la collecte d'informations, la recherche scientifique et la publication de travaux concernant les secteurs économiques et les activités orientés vers le service de l'intérêt général et collectif : l'action de l'Etat et des pouvoirs publics régionaux et locaux dans les domaines économiques (politique économique, régulation) ; les services publics ; les entreprises publiques et mixtes aux niveaux national, régional et local ; l'économie sociale : coopératives, mutuelles et associations sans but lucratif ; etc.
Le CIRIEC a pour but de mettre à la disposition des praticiens et des scientifiques des informations concernant ces différents domaines, de leur fournir des occasions d’enrichissement mutuel et de promouvoir une action et une réflexion internationales. Il développe des activités qui intéressent tant les gestionnaires que les chercheurs scientifiques.
International Centre of Research and Information on the Public, Social and Cooperative Economy - aisbl
Centre international de Recherches et d'Information sur l'Economie Publique, Sociale et Coopérative - aisbl
Université de Liège au Sart-Tilman
Bât. B33 - bte 6
BE-4000 Liège (Belgium)
Tel. : +32 (0)4 366 27 46
Fax : +32 (0)4 366 29 58
E-mail : [email protected]
http://www.ciriec.ulg.ac.be