Public H~alth Conf~r~nc~ on R~cords and Statistics - CDC
465
-
Upload
khangminh22 -
Category
Documents
-
view
0 -
download
0
Transcript of Public H~alth Conf~r~nc~ on R~cords and Statistics - CDC


PROCEEDINGS OF THE
Public H~alth Conf~r~nc~on R~cords and Statistics
16th NATIONAL MEETINGJUNE 14-16, 1976
CHASE-PARK PLAZA HOTELST. LOUIS, MISSOURI
DHEW Publication No. (HRA) 77-1214
US. DEPARTMENT OFHEALTH, EDUCATION, AND WELFAREPublic Health ServiceHealth Resources AdministrationNational Center for Health StatisticsRockville, Maryland 20857February 1977

FOREWORD
The Public Health Conference on Records andStatistics (PHCRS) is a planned study program ofthe Public Health Service administered by the Na-tional Center for Health Statistics (NCHS). TheConference fosters the development of improvedtechniques and concepts in vital records and publichealth statistics in the United States. A most impor-tant accomplishment of the biennial conferences isproviding a forum, a means of interchange of ideas,for the several groups and individuals who have aninterest in health statistics and health informationthroughout the country, and who on only a limitednumber of occasions have the opportunity to dis-cuss common problems on a nationwide scale.
The Sixteenth National Meeting of the Confer-ence centered on the relationship between healthstatistics and health planning, particularly as man-dated by Congress under the National Health Plan-
ning and Resources Development Act of 1974 (P.L.93-64 1). We are in- the midst of an era of ever-in-creasing needs and demands for comprehensive,high quality health information upon which tomake serious decisions affecting the health care de-livery system. The proceedings of the meeting ad-dressed some of these needs and their possible solu-tions. Dr. James F. Dickson, III, Deputy AssistantSecretary for Health, enumerated the goals andpriorities of the health care delivery system and theallocation of scarce resources to meet these goals.Dr. Paul M. Densen raised a series of questions~vhich focused on the provision of health services tothe population. He elaborated on the need to devel-op meaningful data, particularly on specific sub-
groups of the population, to address three broad is-sues of health care, i.e., the cost of health care; theequity of arrangements for the distribution of serv-ices among different groups of the population; andthe health status of the population, particularly asregards the preventability of illness and disability.Dr. Harry P. Cain, II, Director of the Bureau ofHealth Planning and Resources Development, and Idiscussed how our respective components within thefederal health establishment can work together andwith State and local partners to meet mutual needsfor the development and use of statistical supportsystems which will allow the best possible planningand resource allocation in the health care deliverysystem.
These needs and problems are not new, andgroups have met oftentimes before to discuss, de-scribe, devise, and implement strategies to deal withthese problems and issues in a manner that is leastcostly and burdensome to all involved. This superbconference should serve to foster continued com-munication and to bring home the realization thatthe time is at hand to put in place as rapidly as pos-sible comprehensive statistical systems and pro-grams to meet these historically well documenteddata needs for health planning. Our thanks to all ofthose participants who helped to make the Confer-ence an informative, well-structured and beneficialinterchange.
DOROTHY P. RICEDirectorNational Center for Health Statistics
...lu
CONTENTS
NOTE: AU speakers at the Sixteenth National Meeting of the Public Health Conference on Records and Statistics wererequested to submit the text of their remarks to be included in the published proceedings of the Conference. Any pa-pers which are not included in the Proceedings were received after the publication deadline or were omitted at the re-quest of the author. For a complete list of speakers and chairpersons, see the index of program participants on page451.
Purposes and Objectives . . . . . . . . . . . . . . . . . . . . . . .Opening Remarks -James F. Dickson, III, M.D. . . . . . . . . . . . . . . . .Planning for Health - The Young Men’s Vision and the Old Men’s Dream -
Paul M, Densen, Scud . . . . . . . . . . . . . . . . . . . . . . . .Director’s Remarks - National Center for Health Statistics - Mrs. Dorothy P. Rice . . . .Director’s Remarks - Bureau of Health Planning and Resources Development -
Harry P. Cain, II, Ph.D . . . . . . . . . . . . . . . . . . . . . . . .Local Estimates of Health Status from National Data Systems - Joel C. Kleinman, Ph.D. . .Measuring Health Status with Local Data - Mr. Thaine H. Allison, Jr. . . . . . . . . .Health Status Indices and Access to Medical Care - Ronald M. Andersen, Ph.D. . . . . .Variations among Organization of Statistical Services for Planning, Management and
Evaluation: The South Carolina Experience - Mr. Walter P. Bafiey . . . . . . . . .Organization of Statistical Services: The Consortium Alternative - James P. Cooney, Jr., Ph.D.Variations among Organization of Statistical Services for Planning, Management, and
Evaluation: The Cooperative Health Information Center of Vermont (CHICV) Experience-Mr. Jonathon B. Stevens . . . . . . . . . . . . . . . . . . . . . .
The Development of a State Center for Health Statistics in the Wisconsin Division of Health -Raymond D. Nashold, Ph.D. . . . . . . . . . . . . . . . . . . . . .
Generalized Software Packages - James J. Palmersheim, Ph.D. , . . . . . . . . . .Computer-Based Statistical Packages - Mr. Charles J. Rothwell . . . . . . . . . . .Practical Computer Graphics - G. E. Man Dever, Ph.D. . . . . . . . . , . . . .The State’s Role in Developing a Multi-Purpose Hospital Care Component in the
Cooperative Health Statistics System - Mr. Kenneth O. Paisley . . . . . . . . . . .Regional Hospital Reporting Systems - Mr. Wfiliam A. O’Nefi . . . . . . . . . . .The Professional Activity Study (PAS): The Principal Program of the Commission, on
Professional and Hospital Activities - Mr. Edwin G, Stephenson . . . . . . . . .The National Hospital Discharge Study - W. Edward Bacon, Ph.D. . . . . . , . . .Hospital Care Data for the Professional Standards Review Organizations - Mr. Kenneth N.
Johnson and Mr. Philip Latessa . . . . . . . . . . . . . . . . . . . .Qualifying Health Resources - Making Numbers More Meaningful - Mr. Carl H. Gerlach . .Health Accounts: Social Indicator, Performance Measure, Policy Tool - Ms. Nora Piore . .The Estimation and Projection of Various Population Groups for Health Planning-
Mrs. Margaret A. Barnes . . . . . . . . . . . . . . . . . . . . . .Statistical Appraisal of Primary Care in Rural Areas -W. Grady Stumbo, M.D. . . . . .Llrnitations of Statistical Methodology in Health Planning - Leon F. Burmeister, Ph.D. . . .Data in Health Planning -An Overview - Dennis B. Gfilings, Ph.D. . . . . . . . . . .Geocoding and Health Statistics - David M. Nitzberg, SC.D. . . . . . . . . . . . .
ix1
48
11141828
3744
53
63727580
8389
9299
105123130
133139145153161
v

Measurement of the Influence of Health Care Environments on PatientPopulations - Mr. Paul E. Ta~ant . . . . . . . . . . . . . . . . . .
Prominent Issues of Confidentiality in the Cooperative Health Statistics SystemMr. Wdt R. Simmons . . . . . . . . . . . . . . . . . . . . . .
principles for Development of a Model State Law providing for Authority toCollect and Transmit CHSS Data and Providing for Confidentiality, Privacyand Security - Mr. John J. Cohrssen and Mr. Steven B. Epstein . . . . . . . .
Issues for the States Arising out of the Densen Committee Report - Mr. Vito M. Logrillo .Current and Needed Legislation Relating to Confidentiality in Statistical Programs -
Joseph W. Duncan, Ph.D . . . . . . . . . . . . . . . . . . . . . . .Approaches to Maintaining Confidentiality in Shared Data Systems - Mr. George D.
Tipp, Jr . . . . . . . . . . . . . . . . . . . . . . . . . . . .validation of Health Manpower Data - Donald E. Yett, Ph.D. . . . . . . . . . .Interface of National and State Manpower Statistics - Ms. Aleda V. Roth . . . . . .Health Facfiities Survey - Mrs. Gloria Kapantais . . . . . . . . . . . . , . ,Manpower and Facfiities Statistics: State Perspectives - Mr. Walter P. Bailey . . . . .Ambulatory Care Utilization - Mr. W. David Helms . . . . . . . , . . , . . .obstetrics, pediatrics, and Medical-Surgical Services Study - Mr. George E. Schwarz . . .Utilization of Community Mental Health Services: An Approach to Measurement
and Factor Identification - Samuel P. Korper, Ph.D. . . . . . . . . , . . . , .Population-Based Measures of Hospital and Ambulatory Care Utilization for Health
Planning -Mrs. Ann Hamilton Walker . . . . . . . . . . . . . . . . . .Implications of the Ninth Revision of the International Classification of Diseases
(ICD) for Mortality Coding - Miss Mice Hetzel . . . . . . . . . . . . . ,Implications of the Ninth Revision of the International Classification of Diseases
(ICD): Updating the ACME System - Mr. Marvin C. Templeton . . . . . . . , ,CONTEXT - A Look at an Automated Scheme using Text Entry - Mr. WiUiam M.
Spillage . . . . . . . . . . . . . . . . . . . . . . . . . . . .A Reason for Visit Classification System for Ambulatory Care - Don Schneider, Ph,D,
and Ms. Linda Appleton.. . . . . . . . . . . . . . . . . . . . .Chairman’s Remarks - Nation;l and State Programs in Abortion Reporting and
Statistics - Melvin S. Schwartz, M.D. . . . . . . . . . . . . . . , . , .NCHS Plans for Abortion Reporting - Mr. John E. Patterson . . . . . . . . . . .The Public Health Need for Abortion Statistics: The View from the Center for Disease
Control (CDC) - Mr. Jack C. Smith and Willard Cates, Jr., M.D. . . . . . . . . .Abortion Reporting - One State’s Experience - Miss Marian M. Martin . . . . . , .Use of Abortion Statistics at the State Level - Alan R. Hinman, M.D. . . . . . . . .Health Expenditures Data: Community Funds Flow - The Concept - James P. Cooney,
Jr., Ph.D . . . . . . . . . . . . . . . . . . . . . . . . . . . ,One State’s Approach to Useful Health Economics Statistics: Methodological Aspects
of Aggregate Health Care Expenditure Estimates - Mr. Harvey Zimmerman . . . . ,The Value of Health Economics Statistics - Mr. John T. Tierney . . . . . . . . .Usefd Health Economics Statistics at the State and Local Level - Ms. Mildred B. Shapiro .A Small Area, Epidemiologic Approach to Health Care Data - John E. Wennberg, M.D. ,Evaluation in the absence of Data: The Experience of the New York State Medicaid
Program -Mrs. Beverlee A. Myers . . . . . . . . . . . .’. . . . . . .Principal Changes in U.S. Standard Certificates -1978 Revision - Mr. George A, Gay . ,NCHS Plans for the Implementation of the 1978 Revision of the U.S. Standard
Certificates - Mr. John E. Patterson . . . . . . . . . . . . . . . . , .A Report of the Technical Consultant Panel on the Model State Vital Statistics Act -
Mr. Donald J. Davids . . . . . . . . . . . . . . . . . . . . . . .
168
171
174179
183
191194203207210213239
245
266
278
281
282
287
304306
309312317
320
322
325330334
352358
371
373
vi

Changes in the Model State Vital Statistics Act - Role of the American Associationfor Vital Records and Public Health Statistics - Mr. Vito M. Logrillo . . . .
Utilization Statistics in Local Areas - Ms. Sandra Hapenney and Carmault B.Jackson, Jr., M.D . . . . . . . . . . . . . . . . . . . . . .
The Development of Uniform Basic Data Sets to Describe the Use of HealthResources - Mrs. Jane H. Murnaghan . . . . . . . . . . . . . . .
State Ambulatory Care Statistics - Richard G. Cornell, Ph.D. . . . . . . . .Nursing Home Statistics: The Development and Future Direction of the National
Survey System of the National Center for Health Statistics - Mrs. Joan F.Van Nostrand . . . . . . . . . . . . . . . . . . . . . . .
Medicare Statistics - Mr. Carl E. Josephson . . . . . . . . , . . . . .Technical Assistance in Developing Data Systems - Mr. Theodore R. Ervin . . .Training Needs of Data Users - Robert E, Mytinger, Dr. P.H. . . . . . . .Research Needs for Data Applications in Health Planning - Jay H. Glasser, Ph.D. .Index of Program Participants . . . . . . . . . . . . . . , . . .Session Program Organizers . . . . . . . . . . . . . . . . . . .Staff of the Conference Management Branch . . . . . . , . . . . . .
,.
. .
. .
. .
. .
. .
. .
. .
. .
. .
. .
376
377
386,.392
398405431435443451456457
6
vii

THE PUBLIC HEALTH CONFERENCERECORDS AND STATISTICS
ON
PURPOSES ANDOBJECTIVES
The Public Health Conference on Records and Statistics (PHCRS), spon-sored by the National Center for Health Statistics (NCHS), fosters the de-velopment of improved techniques and concepts in vital records and publichealth statistics in the United States. The National Center for Health Sta-tistics brings together the registrars and health statisticians from officialhealth agencies, as well as representatives from a variety of private healthorganizations, for biennial meetings of the PHCRS. The Conference ena-bles the participants to discuss current and future problems of major con-cern to them and to consider recommendations for practical solutions, witha view to improved services to health programs, to the public in general,and to the Nation.
The theme of the 16th National Meeting of the PHCRS will focus on therelationships between health statistics and health planning. As has beencustomary, the American Association” for Vital Records and Public HealthStatistics (AAVRPHS) will hold its national meeting in conjunction with thePHCRS and has scheduled its independent sessions on June 17 and 18.
In essence, the PHCRS provides a valuable forum for the delineation anddiscussion of problems in vital records and public health statistics; andeducational medium for all who have responsibility, concern, and interestin such problems; an effective way for interchange of information andideas among all concerned in the field; and a means for unifying the na-tional health statistics system through collaborative efforts.
ix

OPENING REMARKS
James F. Dickson, III, M.D., Deputy Assistant Secretary for Health, Department of Health,Education and Welfare, Washington, D.C.
We all, I believe, recognize three things—first,that the health care apparatus of this country isbeset with a number of problems; second, thatthere is no magic remedy for these problems; andthird, that much can be done by the public and pri-vate sectors, working together, to resolve theseproblems.
It is not surprising then that the Office of theAssistant Secretary for Health and the PublicHealth Service, as they move to work in collabora-tion with the private sector, are increasingly asked,“Just what are you trying to do, what are you driv-ing at, and how do you intend to manipulate your-self to get there?”
Accordingly, in an overview sense, I would liketo address the matter of what we are doing, whatour goals are, what our priorities will be, and howwe will allocate our resources to reach these goals.
Before going directly to this, I would like tocomment on some features of our current nationaleconomic scene that serve as an important backdropto the options and opportunities that are open tothe Public Health Service at this time, and that willbe open to it in the near future.
The basic situation nationally is that our aspira-tions are clearly outdistancing our resources. We seethis quite graphically and painfully in the recentfiscal and services troubles faced by New York Cityand New York State. Coupled with this is the factthat our national, public and private debt now totalssome $2.7 trillion. Further, we have managed via themechanisms of the credit card, pension funds of oneform or another and the like td successfully mortgageour children’s futures.
These three matters—aspirations outdistancingresources, a $2.7 trillion debt, and the mortgagingof our children’s futures—yield the critical issue ofour time, which is: How to set priorties for the allo-cation of the resources that will actually be availableto us—and what will these priorities be?
In the midst of all this it is important to notethat the health industry is now beginning to emergeas the number one industry in in the country. Assuch, it is taking on political, social, and economicconnotations that it has not had in the past. And inhealth, as in the nation at large, the problem of as-pirations outdistancing resources is now full uponus. Similarly, here, the critical issue of our time asfar as health is concerned is how to set priorities forthe allocation of the resources that will actually beavailable to us—and what will these priorities be?
In this general state of affairs the ouestion thatgets posed ~o the Office of the Assista~t Secretaryfor Health and to the Public Health Service is,“What have you been doing to help establish rea-sonable priorities?”
The answer is as follows. Over the past twoyears the Public Health Service has generated aForward Plan for Health. In this, issue; of concernsuch as health costs. manDower. the development of,new knowledge, the pre~ention of disease, and thequality of care are discussed. These critical issueshave been raised so that both in the public and pri-vate sectors it will be clear where the Public HealthService stands with respect to them. However, insubstance, they represent more of a list of concernsthan a specifically explicit plan for action. They donot yield a coherent picture in the sense of a “func-tional” health plan. Nevertheless, the exercise overthe past two years that has yielded two serial vol-umes of this Forward Plan for Health has been veryvaluable because, through it, through the necessityto write it down, and through endless discussions of.it with the pubfic and in the private sector, it hasbeen possible, in the midst of some 170-odd legisla-tive mandates to the Public Health Service, to beginto develop a real-world plan, to begin to develop afunctional health plan that concisely indicates whatwe are trying to do, what we are driving at, what wea;e for instead of what we are against, and how weintend to manipulate ourselves to achieve our goals.
What then is this functional health plan for thePublic Health Service? Its goal is to help improvethe health of the American people. It has-two ‘inter-mediate goals and they are:
1. To assure access to reasonable health care atreasonable costs, and
2. To prevent illness and disease.
We will be approaching these goals through certainoperational objectives. ‘We expect to see the frame-work for reaching these objectives put in place dur-ing the present ‘year. Bu~ we do reco~nize thatmany of ‘the objectives will not be reached until anumber of years have passed.
I would like to comment on these objectives. Atthis time they revolve around two main concerns:
1. The elaboration of a more satisfactory appa-ratus for the development of health policy,the setting of priorities, and the guidance ofimplementation with respect to these policiesand priorities, and
1

2. The elaboration of a meaningful, credibleprogram of action.
The question is then, “What is it that we need thatwe do not have now as far as apparatus and pro-gram are concerned?” For the apparatus, what isneeded is the establishment of a more competentand more credible focus for health. A focus, as Isay, that can deal more adequately with the devel-opment of policy, the setting of priorities, the guid-ance of implementation, and implementation itself.This does not require reorganization per se. What itdoes require is a revitalized Public Health Servicebuilt on competence, responsiveness, stability, andcontinuity. Assistant Secretaries for Health comeand go like Greyhound buses in the night—but theproblems remain and the Public Health Servicemust have an assured stability and continuity suffi-cient to deal with them.
Further, the Public Health Service needs tofunction as a team with a concerted plan in mind—not as six separate agencies, pulling in six differentdirections, with six, separate, narrow missions. Thismeans a Public Health Service that has a sense ofoverall mission and that has credibility. For organi-zations and for groups within organizations there isalways the problem of credibility. Often organiza-tions or groups within them think of themselves asbeing credible. However, in the end, the only thingthat is important is whether they are perceived bytheir constituency or by the public as having credi-bility. This credibility can only be earned by demon-strating competence and demonstrating that theyare in fact trying to do the right thing. Without thiscredible focus for health no program can meananything. Accordingly, as Assistant Secretary forHealth, Dr. Cooper feels that the establishment ofsuch a focus is his number one priority—and he iscommitted to putting it into place.
The question arises from time to time, “Whatabout the establishment of a separate Departmentof Health?” Actually there would be nothing wrongwith this—and it is likely that through political oreconomic considerations such a department willevolve in time. But what good would a separatedepartment be if it was not competent, if it did nothave a meaningful program, and above all, if it hadno credibility? I say this to point out that the realissue here is actually the establishment of a focus ofcompetence, responsiveness, and credibility morethan anything else.
~ur number two priority is our health programitself, and the primary consideration here has to dowith the matter of health costs. Clearly, at this time,rising health costs are driving all health policy deci-sions whether they have to do with the content ofregulations, policy for biomedical research, or what-ever. This is a badly reversed situation, with the
2
cart before the horse, and it strips us of the flexibil-ity we need to get important things done.
Therefore, I feel that there are five specificthings that must be done to contain health costs-andthese have the highest priority.
1.
2.
3.
4.
5.
Primarily,-there- needs to be a reform of ourhealth care financing system. Here incen-tives need to be changed. The system shouldreward what really needs to be done, notwhat a particular insurance policy happensto reward. This wilI require a more appro-priate use of outpatient and home healthservices. Also of significance here, are newmechanisms for the delivery of health carethat promise improved cost containmentthrough competition. Finally, there’s thematter of the specific financing mechanismsthat must be determined before nationalhealth insurance itself materializes,There is a need for a more satisfactory sys-tem for the allocation of capital resources atthe local level. At this time we are con-cerned here with the issues inherent in theHealth Planning Act and the health blockgrant proposal, The tasks mandated in theHealth Planning Act cannot be carried outwell-they probably cannot be done at all—without data that describe for each area itscurrent situation as regards the health statusof the people involved, the available re-sources, and the current utilization of thoseresources.
Later this morning Dr. Harry Cain, Directorof the Public Health Service’s Bureau ofHealth Planning and Resources Develop-ment, will address this matter particularlyfrom the point of view of the need for anadequate statistical data base for action inthis area,The modification of utilization patterns atthe local level is of the utmost importance,Modification of utilization patterns can takeplace through consumer education andthrough professional standards review. Herewe particularly must determine what factorsreally affect utilization,We need to help the States come to grips ina more appropriate fashion with the mal-practice insurance problem.We need to exploit more effectively those
a
existing technologies that can help containcosts.
After health costs we are concerned with themaldistribution of health manpower from a geo-graphic and a specialty point of view. Our interesthere at the moment is focused on upcoming healthmanpower legislation, and expansion of the Nation-al Health Service Corps.

A third area of program importance is theprevention of illness and disease. This has obviousrelevance to the containment of costs in the longhaul, as well as to the improvement of health.Accordingly, we expect to initiate a meaningful newprogram of preventive medicine along the follow-ing five lines this year:
1. In the”senseof the target group that will bethe primary focus for attention, we intendtorevise our program for child health.
2. In terms of the major controllable variablein this situation, we intend to revise thePublic Health Service program on envi~on-mental health from both an occupationaland an ambient point of view.
3. We intend to modernize our program ofhealth education for the public so that thepublic can more adequately take care of it-self and so that the public and the profes-sion can know best how to use the healthservices that are in fact available to them. Itmakes no sense to establish a new treatmentfacility on an Indian Reservation and thento have a mother bring in her child with aninfected, running ear—much too late for themost effective treatment.
4. The Public Health Service apparatus at Stateand local levels needs to be revitalized whereit has atrophied. And,
5. We are undertaking a National InfluenzaImmunization Program designed to antici-pate and ward off a possible swine-like influ-enza epidemic or pandemic next fall or win-ter. The essential intention here, in a pre-vention, sense, is to risk money rather thanlives. This will be massive effort; however,our available technology is judged adequateto the task.
In addition, there are six main functions thathave high priority in the sense of being supportiveto cost containment, to the resolution of the maldis-tribution of manpower, and to the prevention ofillness and disease—and they are:
1. Modernizing our Health Data System. Thisis the cement, as Mrs. Rice well knows, thatis necessary if it is all to hang together.
The past decade has seen a number of de-velopments that have created a tremendousincrease in the need for both general pur-pose and program specific data essential tohealth policymaking and program manage-ment. In order for the Public Health Serviceto make informed decisions for policy devel-
2.
3.
4.
5.
6.
opment, the setting of priorities and theguidance of implementation with respect tothis functional or tactical health plan, and toassess the impact of those decisions andoperate its programs effectively, the devel-opment of an integrated, systematic andresponsive data base is essential.
We have a good start, with the general pur-pose data systems of the National Center forHealth Statistics, the Cooperative HealthStatistics System, the epidemiological surveil-lance systems of the Center for Disease Con-trol, and the various program related sys-tems. However, we are proposing majorexpansions in these systems, as well as themore rapid development of the CooperativeHealth Statistics System which will be ourmajor effort to assist the States in building astronger capacity in health statistics.A more stable program for biomedical andbehavioral research.An improved program of health servicesresearch and evaluation.The generation of an appropriate healthmanpower pool.The development of a more effective andexpanded program of technology for healthcare that will allow for a satisfactory evalua-tion of existing and new instruments, de-vices and systems in terms of their relevanceto improving the cost, access, quality, andproductivity features of health care.Helping assure the integrity and vitality ofacadem-ic medical cente~s and other healthinstitutions whose goals and “pursuits are of-ten in common with those of the PublicHealth Service.
This then is our functional, our tactical healthplan, and it is within this framework that we intendto conduct business. It reflects an explicit set ofpriorities in a period when our aspirations are badlyoutdistancing OUYresources. It will guide the alloca-tion. of the resources available to us and hopefullywill guide them in an purposeful way. Such a state-ment as this has been missing in health for a longtime. This statement will not necessarily prove intime to be the correct statement. However, the sig-nificant thing is that it now exists and that it existsfor comment and for criticism.
As such, and importantly at this particular timein our history, it also constitutes an avenue formore effective participation by the public and theprofessions in the affairs of its government.
3
PLANNING FOR HEALTH—THE YOUNG MEN’S VISION AND THEOLD MEN’S DREAM
Paul M. Densen, SC.D., Director, Center for Community Health and Medical Care,Harvard Medical School, Boston, Massachusetts
this bicen~ennial Year it is mandatory for aInkeynote speaker to take ‘the historical appr~ach tohis subject. I shall not ask you to go back 200 yearswith me, but only to 1850, the “date of the publica-tion of the Shattuck Report.** That Report couldserve as a model for health planning today. Theintroduction to the Report might well have provid-
~ ed the Congress with the rationale for the NationalHealth Planning and Resources Development Act of1974. It reads as follows:
“We believe that the conditions of perfecthealth, either public or personal, are seldomor never attained, though attainable;—thatthe average length of ~uman life may bevery much extended, and its physical power
- greatly augmented;—that in every year, with-in this Commonwealth, thousands of lives arelost which might have “been saved;—that tensof thousands of cases of sickness occur,which might have been prevented;—that avast amount of unnecessarily impairedhealth, and physical debility exists amongthose not actually confined by sickness ;—thatthese preventable evils require an enormousexpenditure and loss of money, and imposeupon the people unnumbered and immea-surable calamities, pecuniary, social, physical,mental, and moral, which might be avoid-ed:—that means exist, wi~ln our reach, forthkr mitigation or removal;—and that mea-sures for prevention will effect infinitelymore, than remedies for the cure of disease.”
It is clear from this introduction that Shattuckwas dealing with the same three broad areas ofhealfi care which concerned the 93rd Congress,namely, the cost of health care, the equity of thearrangements for the distribution of services amongdifferent groups of the population, and the healthstatus of the population, particularly as regards thepreventability of illness and disability. I find it rath-er remarkable that both Shattuck and the 93rdCongress, separated in time by nearly a century anda quarter, felt that the approach to dealing withthese three problems lay along the line of an effec-tive melding of the skills and training of the plan-ners and the statisticians. You will recall that Shat-tuck urged the creation of State and local boa~ds of
**Shattuck, Lemuel, et al: “Report of the sanitary Com-
mission of Massachusetts 1850” Harvard University Press,Cambridge, Massachusetts, 1948.
health and also the taking of regular periodic cen-suses, uniform nomenclature for diseases, periodiclocal surveys, and intensive analyses of sickness invarious localities and among perons of differentclasses, professions, and occupations.
The task of creating an organizational structurefor the purpose of developing plans and programsto improve the health of residents of an area andfor increasing the accessibility, availability, continui.ty and quality of care while at the same time con-straining the cost of such care is enormous and theresources presendy available to accomplish it arelimited. Nevertheless, the similarity of Shattuck’s
approach and that embodied in the National HealthPlanning Act affords me a certain amount of cau-tious optimism that we may look forward tochanges in the patterns of delivery of health serv-ices in the future equal in importance to those thattook place after Shattuck made his report.
During the next few days you will be address-ing the issues of cost, equity and health status indetail, grappling with the problems of measure-ment, financing, organization, privacy and confi-dentiality and the application of modern technologyto these problems. I shall not attempt to anticipateyour discussions. I wish instead to share a few gen-eral thoughts with you which may help to distin-guish the forest from the trees.
The first of these thoughts is that we must fo-cus on the population in the effort to improve thesystem of delivery of heaIth services. What are thehealth problems of the population? What kinds ofservices are needed to deal with these problems?How are these services presently being provided?What are alternative ways of providing these serv-ices?
This sequence of questions based foremost onwhat the- population requires of the health servicesdelivery network serves to remind us that the ulti-mate objective of the planning process is the im-provement of people’s physical, mental, and emo-tional well-being. Such a population-base approachheIps to avoid identifying the problems in terms ofthe existing institutional framework. Were we tomake the primary focus of our attention the uti]iz-ers of specific services, or the providers, or the facil-ities, we might tend to plan solely within the cur-rent structures instead of thinking how the frame-work might be adapted to meet the problems pres-ent in the population.
4
The second thought is more or less a corollaryof the first. As we address the issues of equity, costand health status we shall need to develop data forspecific sub-groups of the population—particularlysocioeconomic subgroups. Aggregate data on thetotal population of a Health Services Area (HSA)will not- serve this purpose, It is not very helpfulfrom the standpoint of either equity or cost toknow that the total per capita expenditure forhealth care in 1975 was $476.40*, any more thanone can base a plan of action on the statement thatthe crude death rate was 9.4 in 1974. We need tobe able to answer such questions as the following:What proportion of the health expenditures of thepoor, of the elderly, of minority groups are met bypublic financing or third party payers under thepresent system of paying for medical care? Whatproportion of total personal income is accountedfor by the health expenditures of these groups? Dothe poor spend proportionately more of their in-come for hospitals or. drugs than other groups ofthe population? What proportion of the income ofthe elderly is spent in nursing home care, and oftils how much is paid for by government pro-grams, by insurance, out-of-pocket?
Once the auestions are Dosed the kind of in for-, 1
mation needed to answer them becomes clear. Forinstance, for these questions dealing largely withexpenditures for health care among different classesof the population, information on per capita ex-penditures classified by such demographic variablesas age, sex; socioeco-nomc status and minority groupstatus will be required. For each of these groups itwill also be essential to have a picture of what themoney is spent for such as hospital care, physicianand other provider services, drugs, appliances,nursing hem; care, etc.
The question of equity, of course, has dimen-sions other than the relative expenditures for healthcare among the various groups of the population.
One definition of eauitv centers on access tohealth care among all ;las;es of the population.Access means not only being able to obtain carewhen it is needed by the availability of the rightkind of care at the right time. As Donabedian putsit “the proof of access is use of service, not simplythe presence of a facility...” It is concerned with thekind of care received (process) as well as theamount of care. It thus contains an element of qual-ity as well as quantity.
Fundamentally the measurement of accessibilityof various kinds of health services reauires knowl-
1
edge of the patterns of utilization among varioussocioeconomic and demographic groups 01 thepopulation. So once again we are back to needing
*HEW Ne\vs May 1’7, 19’76.
distributional as well as aggregate data. This, inturn, leads to a rather general measurement prob-lem.
Whatever the direction from which we ap-proach the problem of equity—cost, access, quality,health status—and the related problems of alloca-tion of available resources, we shall need informa-tion to enable us to characterize the population bysocioeconomic status (SES). Several indicators of SESare available through the census but a basic difficul-ty which will be encountered in using census data isthat is very quickly becomes out-dated, especially ina highly mobile population. Any serious attempt todeal with the problem of equity will, in all probabil-ity, require some systematic kind of population sur-vey at reasonably frequent intervals. This is an ar-gument for quinquennial rather than decennialcensuses and, perhaps, as Shattuck suggested, forlocal household surveys. I hope in your delibera-tions this week you will consider various means bywhich the information on socioeconomic status maybe obtained.
I began this presentation by asking you to jour-ney with me into the past. Now I’d like you to try tolook into the future with me. Suppose all our plansto improve the situation worked beautifully, whatwould we expect to be different? The answer to thisquestion may help us to come to grips with the de-sign of programs to improve the present situationas well as to assess the effectiveness of these pro-
W.ams”Let’s do some hypothesizing. If effective health
planning improves access to care both from thestandpoint of quantity and quality, one might ex-pect to find earlier diagnosis and treatment andthis, in turn, may have an impact on prognosis. Inadults, for example, the frequency of Papanicolaoutests among women in the different SES groups, thestage at which certain forms of cancer are diag-nosed and the frequency of microscopic confirma-tion are additional measures which may provide in-sights—at least in a statistical sense—into whetherthe “right” kind of care is obtained at the “right”point in time.*
Among children one may postulate that anequitable distribution of resources should increasethe proportion of children entering school whohave completed the recommended course of immu-nizations and decrease the variation in this propor-tion among SES groups.
Among pregnant women if good prenatal careis readily available and if resources are specificallyallocated for high risk pregnancies and high riskneonates, then one might expect early identification
*For a discussion of the interpretation of the results ofscreening tests for cervical cancer see Knox, E.G. “Cervi-cal Cancer” in Screening in Medical Care, Nuffield Provin-cial Hospitals Trust, Oxford University Press, 1968.
5

of these high risk groups leading to an improve-ment in continuity of care for both mothers andinfants. Were this to occur, then the differences inthe rate of complications of pregnancy and in peri-natal mortality in whites and non-whites shouldgradually lessen. It is possible that some of the vari-ation may be due to different attitudes towardspregnancy among the different groups of the popu-lation so that more ready access to high qualityprenatal care will not necessarily reduce the varia-tion to zero. Nevertheless, the total variation shoulddecrease.
In the population as a whole it seems reasona-ble in tie light of present knowledge to supposethat, if successful, efforts to influence the style oflife—smoking, drinking, eating—and improved ac-cess to the right kind of health care at the righttime should result in decreased mortality, morbidityand disability from preventable conditions.Rutstein’s* ideas are of interest in this connection.He advocates that the approach taken in the 1933New York Academy of Medicine study of deathsfrom maternal causes which showed that approxi-mately two-thirds of such deaths were preventablebe extended to a review of mortality from othercauses. He suggests that the National Center forHealth Statistics with the aid of experts draw up alist of preventable deaths. The percentage whichsuch deaths represent of all deaths could then serveas an indication of the need for the realigning ofresources to deal with the problems revealed by thisapproach. For example, it is generally agreed thatthe availability of antibiotics makes deaths fromtuberculous meningitis preventable. Their occur-rence, then, would indicate the need to improvecommunity case finding methods and access to pro-per treatment, particularly the timely administrationof antibiotics.
It would seem worthwhile to explore the feasi-bility of extending these ideas to morbidity and dis-ability. Were indices of “preventability” to be devel-oped for particular HSA’S and for specific socio-economic groups within them they might well beused to examine trends before and after the intro-duction of new approaches to the health problemsof the population arising from the planning pro-cess. Of course, special studies would probably berequired to attempt to separate the influence of theplanning process from other factors which mightcontribute to any observed trends.
The process of hypothesis formulation is notjust an academic exercise of little practical utility.This kind of thinking often helps to clarify the par-ticular programmatic elements which will berequired to deal with the problems revealed by the
*Rutstein, D.D. Blueprint for Medical Care, M.I.T.Press, Cambridge, MA. 1974.
6
statistics. Certainly it will suggest the measures ap-propriate to the assessment of the effectiveness ofthe planning process.
Suppose, for instance, we have developed dis-tributional data concerning costs, equity and healthstatus among the various socioeconomic groups of
the population which reveal the problems to bedealt with. It may be desirable to develop a prioritylist among the various problems so that the limitedresources currently made available under the Plan-ning Act can be used most effectively. In establish-ing this priority list it may be wise to enlist the helpof the HSA Boards or Subcommittees of the Boardssince this is just the type of activity in which theyshould be engaged. Perhaps after reviewing theavailable information with the help of the Stateplanning unit they should be asked to indicate theproblem which they consider should receive thegreatest attention in their area. Once the problemsto receive priority have been identified, the nextstep will be to develop a plan to deal with the prob-lem.
,
For example, it may be decided from an analy-sis of the patterns of utilization of the population ofan HSA that the major problem to be dealt with islack of access to good ambulatory care. Suppose,further, that it is decided that neighborhood healthcenters are the way to deal with the problem. It isvitally important that all parties concerned be veryclear before initiating a new program as to the spe-cific objectives of the program. It is at this stagethat one should ask what would one expect to hap-pen if the program is completely successful? Would
a greaterproportion of the target population usethe neighborhood health center as their primarysource of care rather than the emergency room ofthe hospitals? Would there be a redistribution ofproviders to provide care? Would the cost to thecommunity and to the individual members of thetarget population be expected to be more or lessthan in the absence of a neighborhood health cen-ter? What would be appropriate measures of theimpact of the program on the health status of thetarget population? In the light of such questions, isthere any evidence at hand that the proposed ap-proach is likely to be successful or unsuccessful?
Depending, of course, upon the nature of thepriorities assigned, similar questions could be askedabout any other program or set of programs devel-oped to deal with identified problems and this leadsto two additional thoughts. One is that in order toprovide a means of assessing the significance of theplanning process one might consider designatingone or more HSA’S in each State as experimentalHSA’S and using these areas to test out new ideasand new approaches to problems before embarkingon cosdy untried programs on a statewide or nz.tionwide basis.

For instance, one might try out various ways ofdeveloping the information base for planning. Ihave already mentioned the household survey inrelation to the problem of determining the socio-economic status of. the population. Are there otherways of obtaining this information? What might bethe relationship between such local surveys and thedecennial or quinquennial census? What might bethe relationship to the simulated populations devel-oped by the National Center for Health Statistics?I’m sure you will develop a number of other ideasfor exploration in the next few days.
Perhaps, in another experimental HSA onemight try various approaches to the reorganizationof health services for children. The present systemof well-child care in one place, school health pro-grams in another, and sick-child care in still otherswith multiple sources of financing of such services iscertainly not conducive to continuity of care to saynothing about its cost-eff activeness.
Other innovative programmatic and organiza-tional ideas could be tried in other HSA’S, and asthe results of these experiments became known,they might then be translated into policy applicableto the population in general.
The point here is that I would hope that theplanning process would include the development,insofar as possible within the political framework, ofa rational approach to the introduction of changeinto the health system.
The other and final thought I wish to sharewith you is that at the stage of attempting to defineclearly the objectives of any proposed program andof attempting to answer the question of what wouldbe expected to happen if the progiam were success-ful, it is essential that the various experts-the plan-ners, the economists, the statisticians, the epidemiol-ogists, the political scientists, the physician and al-lied health professionals, and the consumer, sharetheir special knowledge and perspectives. The rea-son is that, unless there is agreement on objectives,one cannot weigh alternative methods of achievingthese objectives or develop relevant information toassess any given program. The importance of thishas been stressed by many people (See, for exam-ple, Brotherston* White**), but it is especially rele-vant today because we now have a law on the bookswhich demands this kind of approach. From an
*Brothers ton J.H.F. “Health Planning and Statistics: Anoverview” WHO Expert Committee on Health StatisticsGeneva. Dec. 1970.
**white, K. (1970), Epidemiologic in te]]igence re-quirements for planning personal health services. MaImo.
operational point of view, the best way I know of tobring out divergent points of view on objectives andat the same time to provide a framework aroundwhich consensus may be reached is to try to envi-sion success and then to state what would be differ-ent were one to achieve this happy state of affairs.
To illustrate this point in a specific situation, letus return to the questions about the neighborhoodhealth center. If we say that one objective is to have
a greater proportion of the target population usethe neighborhood health center as their source ofprimary care rather than the emergency room ofthe hospital, then if we wish to see if this objectiveis achieved, the information system of the neighbor-hood health center must be so designed as to notonly define the target population but also be able tocount people using the center. At the present timethis is difficult to do. Most neighborhood healthcenters can only count visits.
Of course, this statement of the objective as-sumes that increased access will result in increasedhealth. Is it an objective of the Center to increasethe proportion of children immunized or theproportion of women seen in the first trimester ofpregancy, to find hypertension in adults and treatit, etc? If so, again it will be necessary to count peo-ple rather than visits, if we wish to evaluate theprogram. And so, for each of the questions whichone might be posed regarding a neighborhoodhealth center, there are programmatic consequencesnot only for the delivery of services, but also for theinformation system. The back and forth discussionamong the representatives of the various disciplinesabout the objectives helps to insure that the imple-mentation of any plan which evolves contains thenecessary elements for its evaluation.
Having begun this discussion with a quotationlet me end in the same way, but this time from thep,oets. T.S. Eliot points out that
“Between the idea and the realityBetween the notion and the actFalls the shadow.”
i“ am enough of an optimist to believe that ifmen and women with diverse backgrounds andexperiences will pool their talents around common-ly defined problems then the dimensions of thatshadow can be altered and we may even look for-ward to that utopia which Dryden describes as
The people’s prayer, the glad diviner’s themeThe young men’s vision, and the old men’s
dream.
229-121 0 -77-2

DIRECTOR’SSTATISTICS
REMARKS—NATIONAL CENTER FOR HEALTH
Mrs. Dorothy P. Rice, Director, Na~onal Center for Health Statistics,Rockville, Maryland
It is indeed a delight for me to be here at the16th Biennial Conference, a meeting I have attend-ed and participated in many times before. It is par-ticularly exciting for me this year as I am attendingfor the first time in my ne~, capacity as Director ofthe National Center for Health Statistics (NCHS).This Conference down through the years has pro-vided a unique forum for the delineation and discus-sion of a wide range of problems associated withthe statistical requirements for the planning, moni-toring and evaluation of health programs at all lev-els of government and the private health sector. Ifeel strongly that this forum has increased immeas-urably in value within the last decade by combiningforces with other major Federal health programs tojointly pursue the interchange of ideas and infor-mation in collaborative efforts designed to achievemutual goals. In continuing that process we havejoined with the Bureau of Health Planning andResource Development (BHPRD) to co-sponsor thisyear’: Conference with the theme of “Health Statis-tics-Health Planning”.
The kind of health planning in which we areplanning to engage in States and in communitiesacross the nation requires a strong statistical sup-port program. Such a program is an essential re-source in health planning, policy making and pro-gram management .at all levels of government.
The heightened need for data is perhaps bestdescribed in the context of where we are as a peo-ple with respect to health and the receipt of healthcare.
There is a continuing increase in life expectan-cy, a continuing decrease in infant death rates, along-term decline in rates of death from heart dis-ease. Our national death rate dropped to a recordlow in 1974-9.2 deaths per 100,000 population,and the provisional data for 1975 indicate a furtherdecline.
To some extent, even the less encouraging datareflect our national progress in health. Today it isthe prevention of accidents, homicides, and suicidesrather than the prevention of specific diseases thatwill contribute most to a reduction in untimelydeaths among our children and young adults. Ourpeople probably have a higher rate of chronic dis-eases than in the past because more of us are livingto the ages when these conditions develop and med-ical advances have postponed premature deathsfrom many of them.
Still, the chronic conditions remain a majorhealth problem. Some 14 percent of our people—
8
29 million—are limited in activity—the ability topursue leisure interests as well as the ability towork-due to chronic illness. The veneral diseasesare epidemic. The cancer death rate continues torise. Illegitimacy rates are high among our teenag-ers, many of whom do not receive good pre- andpostnatal care, to the detriment of mother andbaby. The infant mortality rate for other than whiteinfants remains about two-thirds higher than therate for white infants,
There has been marked progress in openingup health care to ail. In 1964, prior to the enact-ment of the Medicare and Medicaid program$, thepoor of all ages had fewer physician visits per yearthan the nonpoor did, but by 1974 the rate of phy-sician visits among the poor was somewhat higherthan for the rest of the population. The proportionof the poor who have not seen a doctor within twoyears also has decreased, from 33 percent to 19percent. The poor now are hospitalized more fre-quently than persons of higher incomes.
Income differences in the reasons for care per-sist, however. High income persons are more likelyto obtain preventive care, particularly those mea-sures which are initiated by the physician ratherthan the patient, such as routine physical examina-tions and pap smears. There are marked white/black differences in early childhood immunizations,
For the past few years, our rate of physicianvisits has remained relatively stable at about 1 bil-lion a year. Less than 10 percent of these visits aremade for general checkups in the absence of a spe-cific condition.
The national capacity building effort has had “substantial impact. Iri 1973-74 there were some14,000 first year students in schools of medicine,about twice the number of a decade ago.Nationwide we had 192 physicians per 100,000population in 1974, compared with 148 per 100,000in 1960. Geographic distribution of physicians andmany other health professionals, however, isweighed heavily toward the metropolitan areas. InManhattan there are more than 800 patient carephysicians for each 100,000 persons; Mississippiand South Dakota have fewer than 80 per 100,000,We very likely are training more medical specialiststhan we need.
To be sure, there remain groups to whomhealth care is not available for economc or geo-graphic reasons; there are shortages in the productand distribution of health resources; there areproblems in the training and distribution of health

manpower. These and others are the issues withwhich our Health Systems Agencies (HSA’S) mustwrestle as we move ahead on the planning front.
As you will readily recognize, the information Ihave just related to you concerning health in theUnited States has been generated, in large part, byour traditional national heatth statistical activities.The needs today, however, are at the local level andour energies must be expanded in that direction—that is, the building of health statistical capabilitywithin each State to ensure the availability at thelocal level of the same types of data that have beenavailable in the past only at the national level.
Our NCHS response to this challenging newdirection is two-fold. First the further developmentof the Cooperative Health Statistics System (CHSS)and second, the expansion of the National HealthSurvey activities, partictdarly the Health InterviewSurvey to meet local and State data needs.
The Cooperative System is responding to aunique set of needs. During the last ten years,health statisticians have felt the pressures of healthplanners’ requests for timely,data and practicat ana-lytical tools to assist them in their work. Our re-sponse has been slow and difficult. Much of thedata provided has been out of date, inaccurate, in-complete, and difficult to process. At State and locallevels much of the needed data did not exist.Further, when data could be obtained at these lev-els, it often lacked comparability and completenessand had to be converted through costly processingto a form useful to planners.
In contrast, it has been only in the last fewyears that Congress has granted authority and sup-port for federal participation in an effort .to build ahealth data system which can serve as the basis foreffective planning at all levels and for all areas ofthe country. This program, authorized throughPublic Law 93-353, anb administered by the Nation-al Centqr for Health ~Statistics, is the CooperativeHealth Statistics System.
That public law, authorizes the Secretary “toassist States in the design and implementation of acooperative system for producing comparable anduniform health information and statistics at thel?ed~ral, State, and local levels.” ~
The concepts underlying the program haveemerged over the years as producers and users ofhealth data at the Federal, State, and local levelshave jointly considered the requirements for newsystems to meet emerging data needs. The programas currently envisioned calls for the establishmentof continuing cooperative efforts among the variouslevels of government to develop a system which willprovide the data that are needed by partners at allthree levels. The Federal partner, represented bythe National Center for Health Statistics, has beenauthorized to decentralize and expand many of its
data systems to collect and process data closer to thesource. This decentralization of activity typically willbe to the State level, but in some instances may beto the local level also. Maximum decentralization ofcollecting and processing functions, consistent withthe production of timely and accurate data, is beingaccomplished. I want to emphasize that, in everycase as new procedures emerge through coordinat-ed efforts, consideration will be given by the Systemto the needs of the users at the iocal and State level.
In terms of actual implementation, the Systemis designed to foster a coalition of effort among thethree levels of government and provide for thecollection of any particular data element by thatlevel best equipped to collect it. Each component ofthe System has a common core of items - that is, theminimum data set of information which is requiredat all levels. Of course, in many cases, States andlocalities will need more information and. greaterdetail than that specified in these minimum sets ofdata, and these needs can be met by building addi-tional “items onto the core and by conducting per-iodic and ad hoc surveys. The collection of the coreinformation is being conducted under agree~-uponstandards, definitions, and procedures, and the datathus gathered is to be shared with the otherlevels of government. In most instances, collectionand processing occurs at the State level, andelementary units of data will be transmitted to theFederal level under a cost-sharing arrangement.Eventually, a full, coordinated network witl be cre-ated in which statistical operations at the State andlocal levels will be obtaining the data they needabout health status and problems in their own juris-dictions, and will be providing the Federal govern-ment with minimum sets of data which are compa-rable among all reporting areas.
Since the” development of the Cooperative Sys-tem is receiving priority attention within the De-partment of Health, Education, and Welfare andthe National Center for Health Statistics, a programof”support activities is being developed, not only tohasten its implementation, but to build a solid struc-ture of statistical capabilities within the States.
First of all, research and development activitieswill continue, although in a more directed program,to resolve problems relating to the design of theSystem and to methods for collecting data in” theambulatory and long-term health care areas.
Also, NCHS will continue to work ,with produ-cers and consumers at all levels of government to-gether with the U.S. National Committee on Vitaland Health Statistics in the establishment of mini-mum data sets for the various components of theSystem. This is essential to insure that the datagathered is that which actually is needed by all part-ners in the System.
9

There has been an expansion of the role of theCenter in providing technical assistance and servicesfor those participating in the Cooperative System.
The program of the Applied Statistics TrainingInstitute (ASTI) has been extended into areas need-ed to train staff involved in data collection activitiesas well as to assist data users in applying more ef-fective analytical techniques to data resulting fromthe System. This includes uniquely designed train-ing activities for HSA’S, the first of which I believeis being held next week.
A communication system among partners hasbeen established involving, among other things, thepublication of a newsletter.
A Data Use and Analysis Laboratory has beenestablished. This unit serves as a clearinghouse re-garding effective techniques for using health datagenerated by the System. Innovative uses of dataare identified, documented, and disseminatedthrough published materials, meetings, and throughtraining programs. In addition, the unit conductsand supports research efforts in th-is area.
As I indicated the second effort of NCHS relat-ed to the statisbcal support of HSA’S in the long-range is the expansion of the Health Interview Sur-vey (HIS). One recommended strategy in the ex-pansion of this traditional Center activity is to over-simple for several States each year, thereby assur-ing that at least every five years, estimates will beavailable for all States and their constituent HSA’Son the health status of the residents of their com-munities. The extent to which we can respond tothe local needs in our redesign of the Health Inter-view Survey will, or course, be dependent on thelevel of resources available to NCHS each year forsuch purposes.
, As you know we have an official agreement andwork plan between NCHS and BHPRD to developthe data activities to meet the needs of the planningenterprise. You will be hearing more about thisfrom Dr. Cain.
I am delighted to report that we are currentlymaking good progress in our joint efforts to meetsuch needs at least on an interim basis—until theCHSS and our expanded HIS activities are a reality.
First, we have developed a source book on cur-rent national data which will be made availablewithin the next month or so and will be a guide to
staff as to where data on health status, health re-sources, and health utilizations are currently availa-ble from existing national sources.
Second, we have developed and are about todistribute a loose-leaf binder with the first editionof “Statistical Notes for Planners”. This first publi-cation deals with the use of infant mortality mea-sures as an index of health. Additional “notes” willbe developed by the Center and distributed byBHPRD to add to the library of statistical informa-tion in each HSA and State agency.
Third, and I mentioned this briefly earlier, weare expanding the Applied Statistics Training Insti-tute activity of the Cooperative Health Statistics Sys-tem to develop and offer additional courses as oftenand at as many sites across the country as possibleto meet the data utilization training needs of plan-ners. As part of this same effort a mythical “refer-ence” community is being developed under contractto provide a unique instructional tool in the ASTIplanning courses. This will permit students to func-tion in an instructional setting with access to appro-priate population, health, and service data to enableplanning exercises to be conducted and evaluated ina classroom setting.
Fourth, through the Cooperative Health Statis-tics System Data Use and Analysis Laboratory, sev-eral demonstrations are being conducted of applica-tion of selected types of data generated by the CHSSto planning problems in the community. These ac-tivities are currently operational in Vermont, Ha-waii, Tennessee, and Michigan. Our two Bureausare very much interested in pursuing additional ac-tivities of this type in the future,
In conclusion, let me state my firm commit-ment to the shared responsibility of NCHS andBHPRD to combine the best efforts of health statis-tics and health planners toward the developmentand use of a coordinated statistical support capabili-ty which will allow the best possible planning andresource allocation to take place in the health caredelivery system. The achievement of this goal willnot be an easy task but I believe the job can bedone well by people like you in this room workingtogether. I sincerely hope at the next Biennial Con-ference in 1978 we can be reporting on our accom-plishments towards getting this important job done,Thank you.
10

DIRECTOR’S REMARK - BUREAU OF HEALTH PLANNING ANDRESOURCES DEVELOPMENT
Harry P. Cain, II, Ph. D., Director, Bureau of Health Planning and ResourcesDevelopment, Rockville, Maryland
After hearing Jim, Paul, and Dorothy, I couldsubstantially cut short my speech by simply saying,“Here. Here. Bravo!” I have to support what theyhave said and they have said some of the things Iintended to say—and yet I don’t think I will justsit down.
Iwill assume that you all have read the Nation-al Health Planning and Resources DevelopmentAct, so Iwon’t describe that. I will spend sometimeon why we have it. I will try, then, to offer a briefreport on where we stand in trying to put that Actinto place and will conclude with some words onthe tie between health planning and health statis-tics. As I go through this program, I think the ses-sions planned really are exciting and are addressedto the point of what health planning and health sta-tistics have to contribute to each other. Incidentally,I also look forward to the session scheduled fortomorrow afternoon when I and some others fromthe Bureau of Health Planning and Resources De-velopment (B HPRD) can have a chance to answerany specific issues that you would want to raise.
The Planning Act, as you know, charges theGovernors and the Secretary with cutting up thecountry into planning areas and establishing inthose areas health planning agencies called HealthSystems Agencies or HSA’S. They must establishState agencies called SHPDA’S, which are StateHealth Planning and Development Agencies, andStatewide Health Coordinating Councils or SHCC’S.The point is, in every instance, to try to insure thatall the parties in the health industry come togetheraround the same table to try to develop some com-munity-based plans that will do three things. One isto assure access to adequate health care for all.Another is to hold down, as far as possible, the totalexpenditures; and it isn’t clear how those two objec-tives can be handled well at the same time. Thatcomes back to our aspirations outstripping our re-sources, that Dr. Dickson referred to. As if thosetwo weren’t enough, these Health Planning Agen-cies are charged with improving health, which ofcourse, extends well beyond the medical care SYS-
tem,One other way of describing that purpose is to
acknowledge that in the health industry we are onthe regulatory road. I and most people that I knowaren’t very happy, pleased or sanguine about thatroad but it isn’t clear that we have any clear alterna-tive, so we are on it, probably to stay. If that is thecase, then the task of. these Health Planning Agen-
cies is to assure that the regulatory decisions are asreasonable as possible, and in this context “reasona-ble” means based on community planning. As JimDickson said, the centtial issue ahead of us rightnow is how to set priorities in a time of constrainedresources, and that is what the health planningprogram is all about.
As you know, we’ve tried this planning businessbefore without much success. The previous effortwas not very successful in my view for two reasons:One, it was not well informed; and two, its cloutwas weak—at least in part because it was not wellinformed. Parenthetically, for these purposes; “wellinformed” means having the answers to six obviousquestions: One: Who is in our health planningarea? Two: Of those, who is receiving care? Three:What kind of care are they receiving? Four: Whereand from whom are they obtaining it? Five: Whatdoes it cost? Six: So what?
The Health Planning Agencies will have moreclout in the regulatory sense than some of theirpredecessors but to this point, they still won’t bemuch better informed. So, on behalf of all thehealth planners of the country, I can express ourmessage to you in one word... HELP! !~
I should add, again parenthetically, that whenwe say that the previous health planning programsfailed, we are espousing common wisdom, ratherthan the product of careful evaluation, and I in-tend, as do a few others in BHPRD, to try this timeto develop evaluation efforts (which will depend onmuch the same statistics that health planning itselfrequires) which will enable us after about threeyears to say what we have and have not accom-plished. I hope before this conference is concludedwe can spend some more time on that.
Now, where does the planning program stand?We have designated 126 Health Systems Agencies(HSA’S) as of when I was last in the office, whichwas about a week ago. We should have all HSA’S inplace, with perhaps a couple of exceptions, whichwill total about 212 by the end of September. ThePlanning Act, incidentally, required us to havethem in place by the end of June. We will comeclose. The State agency applications are on theirway. We have now received in our regional officesabout 22 or 23 applications ands would hope here,too, to have all the rest underway by the end ofSeptember. We are writing regulations at a greatrate. This Planning Act requires us to write abouteight sets of regulations. We have them all in one
11

or ano@er stage, although only three of them havehit the Federal Register.
The most recent set of proposed rules pertainingto State agencies and certificate of need programs re-ceived over 3,000 reactions in writing from the pub-lic. We are in the process of trying to understandwhat all of those say and make whatever changesseem appropriate. We shodd issue those rules in theirfinal form by about September.
All of that is to suggest that around the coun-try there is extensive work and interest and atten-tion being paid to this planning program. We don’tyet have a national advisory council that the Actcalls for, in substantial part because the competitionto obtain a place on it has become so great. At thistime the Secretary only can RI six slots. The othersix have to come from HSA’S and SHCC’S, and theSecretary has apparently decided to wait until hecan fill out all twelve places, so we should have it inplace probably in October.
Also, work is advanang on the national guide-lines; and within the week we will be issuing pro-posed guidelines on what should constitute thekinds of plans that HSA’S are charged with devel-oping. Also, there is substantial work under way ona range of technical assistance activities in some ofwhich NCHS is playing the key role.
Now on the problem side, we have a few. Theappropriations for this program in the present yearseem to some to be inadequate. The Congress hasrecently tried to help and has passed a supplemen-tal appropriation which the President has signedand that will help some, and the projections forF.Y. ’77 are rather promising according to the ac-tions that we are hearing that the House and the-Senate have taken. What we are shooting for on’that score is trying to assure that these Health Plan-ning Agencies have about fifty cents per capita forplanning and, considering the fact that in 1975 as asociety we spent about $535.00 per capita onhealth, fifty cents doesn’t seem out of the question.
Another problem is that we are, in severalplaces around the country, being sued. There arethree kinds of suits. One asserts that the whole Actis unconstitutional. A second kind asserts that thewrong health planning area was chosen. And thetilrd kind asserts that the wrong health planningagency was chosen. Our Office of General Counsel,however, tells us to relax, so that is what we aretrying to do.
It is also the case that some aspects of this P1an-ning Act were perhaps too tightly written- It is anincredibly complex Act. Its authorities will expire in1977 so the Congress will have to begin next springconsidering in what ways, if any, it ought to bechanged before being extended. There is substan-tial activity now around Capitol Hill on that subject,although I want to emphasize that I have not heardany real challenges to the concept of what the Plan-
12
ning Act is all about. A Planning Act in close to itspresent form is here to stay. I think that is clear.
Now, what does all of this have to do with allof you? In the Act the first required function of anHSA is to assemble and analyze data without creat-ing any new data system, if that is possible. TheHSA’S are to depend upon the Cooperative HealthStatistics System (CHSS) and whatever else is availa-ble and that will often mean the HSA’S will dependon all of you.
What problems are you apt to have in trying tohelp those Health Systems Agencies? I would say
. there are two principal kinds. One is that you maynot always find planners who know what they wantor who know how to employ it once they have it.There is a substantial need here for education andtraining and, as Dorothy said, NCHS and severalother organizations are spending substantial timeon that problem. The second problem is that whenthe HSA’S come to call you may not have the datathey want. The CHSS, of course, is not all here yet.The Planning Bureau is a strong supporter of theCHSS. We are contributing to it, but it will also takesome substantial action by the Congress, on top ofthe current level of appropriations, to get it all to-gether. Even if it were here, you would still bepressed, I think, to provide data on morbidity, onenvironmental and occupational health, on ambula-tory care outside of institutional centers, And per-haps most important, even with what you wouldhave, many of you would not be able, if you hadnot done some advance planning, to produce thekind of population-based utilization rates that willmake the most impact in the future as to whatHealth Planning Agencies do, what PSROS do,even what individual institutions do, What theHSA’S will most require is to haveand to tie togetherthe answers to those questions I raised earlier: Whois out there? And who gets what kinds of serviceswhere, and at what cost?
It is no longer sufficient when a PlanningAgency is reviewing a hospital’s request to add anew service to simply examine the occupancy ratesand the average length of stay, etc,, for that andother hospitals in the community. The issues mustbecome how much of that service is the population “of the HSA already receiving and how does thatcompare with what such populations actually oughtto have? Of course, that second question is judg-mental, but we are getting better able to providedefensible answers with comparative statistics tothose kinds of questions.
Now, of course, if we have the answers to thosequestions of who is out there, and who is receivingwhat kind of services where, and at what cost, we willhave the kind of utilization rates that press’harder onthe ultimate questiofi of so what? Of course, that is a

health status question, and we have only a partial the kinds of help the Health Systems Agencies willhandle on that. seek; and if you and we can develop the statistical
systems that will provide the answers, we as a coun-To conclude, I would repeat the cry for help. try will be on the road to a significantly improved
And I hope I have indicated the kinds of questions, health care system. Thank you.
!
13
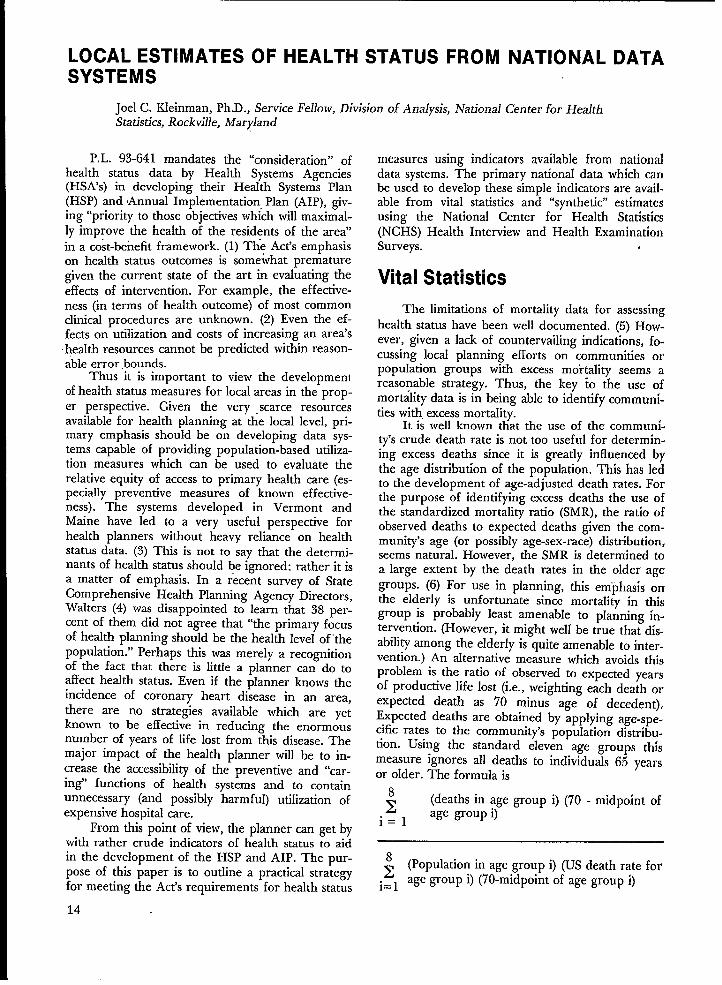
LOCAL ESTIMATES OF HEALTH STATUS FROM NATIONAL DATASYSTEMS
Joel C. Kleinman, Ph.D., Service Fello~v, Division of Analysis, National Center for HeahhStatistics, Rockville, Maryland
P.L. 93-641 mandates the “consideration” ofhealth status data by Health Systems Agencies(HSA’S) in developing their Health Systems Plan(HSP) and Annual Implementation Plan (AIP), giv-ing “priority to those objectives which will maximal-ly improve the health of the residents of the area”
in a cost-benefit framework. (1) Th”e Act’s emphasison health status outcomes is somewhat prematuregiven the current state of the art in evaluating theeffects of intervention. For example, the effective-ness (in terms of health outcome) of most commondlnical procedures are unknown. (2) Even the ef-fects on utilization and costs of increasing an area’s
health resources cannot be predicted within reason-able error bounds.
Thus it is important to view the developmentof health status measures for local areas in the prop-er perspective. Given the very scarce resourcesavailable for health planning at the local level, pri-mary emphasis should be on developing data sys-tems capable of providing population-based utiliza-tion measures which can be used to evaluate therelative equity of access to primary health care (es-pecially preventive measures of known effective-ness). The systems developed in Vermont andMaine have led to a very useful perspective forhealth planners without heavy reliance on healthstatus data. (3) This is not to say that the determi-nants of health status should be ignored: rather it isa matter of emphasis. In a recent survey of StateComprehensive Health Planning Agency Directors,Walters (4) was disappointed to learn that 38 per-cent of them did not agree that “the primary focusof health planning should be the health level of “thepopulation.” Perhaps this was merely a recognitionof the fact that there is little a planner can do toaffect health status. Even if the planner knows theincidence of coronary heart disease in an area,there are no strategies available which are yetknown to be effective in reducing the enormousnumber of years of life lost from this disease. Themajor impact of the health planner will be to in-crease the accessibility of the preventive and “car-ing” functions of health systems and to containunnecessary (and possibly harmful) utilization ofexpensive hospital care.
From this point of view, the planner can get bywith rather crude indicators of health status to aidin the development of the HSP and AIP. The pur-pose of this paper is to outline a practical strategyfor meeting the Act’s requirements for health status
14
measures using indicators available from nationaldata systems. The primary national data which canbe used to develop these simple indicators are avail-able from vital statistics and “synthetic” estimatesusing the National Center for Health Statistics(NCHS) Health Interview and Health ExaminationSurveys. .
Vital Statistics
The limitations of mortality data for assessinghealth status have been well documented. (5) How-ever, given a lack of countervailing indications, fo-cussing local planning efforts on communities orpopulation groups with excess moitality seems areasonable strategy. Thus, the key io the use ofmortality data is in being able to identify communi-ties with, excess mortality.
It IS well known that the use of the communi-ty’s crude death rate is not too useful for determin-ing excess deaths since it is greatly influenced bythe age distribution of the population. This has ledto the development of age-adjusted death rates, Forthe purpose of identifying excess deaths the use ofthe standardized mortality ratio (SMR), the ratio ofobserved deaths to expected deaths given the com-munity’s age (or possibly age-sex-race) distribution,seems natural. However, the SMR is determined toa large extent by the death rates in the older age
groups. (6) For use in planning, this emphasis onthe elderly is unfortunate since mortality in thisgroup is probably least amenable to planning in-tervention. (However, it might well be true that dis-ability among the elderly is quite amenable to inter-vention.) An alternative measure which avoids thisproblem is the ratio of observed to expected yearsof productive life lost (i.e,, weighting each death orexpected death as 70 minus age of decedent),Expected deaths are obtained by applying age-spe-cific rates to the community’s poptdation distribu-tion. Using the standard eleven age groups thismeasure ignores all deaths to individuals 65 yearsor older. The formula is
;(deaths in age group i) (70 - midpoint ofage group i)
i=l
~ (population in age group i) (US death rate fori= ~ agegroup i) (70-midpoint of age group i)

The difference between the SMR and years of lifelost index can be substantial: the correlation be-tween these indexes over a sample of 131 U.S.counties was only .68 for white males. This methodwill be presented in more detail in a future issue ofNCHS’S Statistical Notes for Health Planners seriesand at the 1976 American Statistical Associationmeeting.
For those who feel that death r;tes are not sen-sitive to variations in local conditions (environment,life style, health resources, etc.), consider the factthat in 1969-’71 one-quarter of a sample of 131 U.S.counties had at least 5070 more productive years oflife lost than would have been expected assumingU.S. age-race-sex specific death rates applied.
The use of these summary” indexes is merely afirst step in identifying problem areas. It is a usefuland often necessary step for at least two reasons.One is that a. single index (or a small number ofrace and sex specific indexes) is more easily under-stood and compared among communities than alarge number of age-specific rates. Of course, it isimportant to keep in mind that any summary losessome essential detail, but as a first step this loss ofdetail may be more helpful than harmful.
The second reason for using an index is thatthe direct computation and ranking of age-specificrates will involve a great deal of random error inthe younger age groups. For example, among whitemales, less than 10 percent of U.S. counties hadmore than 20 deaths in the 1-4 age group for 1969-‘71. The percentage increases to only 40 percent inthe 35-44 group and 70 percent in the 45-54 group.The coefficient of variation for a rate based on 20deaths is approximately 22 percen~ which results invery wide confidence limits. Thus the combinationof the age-specific rates into a “years of life lost”index involves the sacrifice of only rather impreciseinformation. Since the index is more stable than theindividual age-specific rates, focussing on communi-ties with high indexes will minimize the probabilityof “false positives.” (Of course there is a price topay in terms of false negatives but the strategy ofinvestigating definite high-risk areas first seems tobe a reasonable one.)
Going beyond the simple index to search forthe particular causes of death which are responsiblefor a high index involves disaggregating the indexinto cause-specific components. The problems ofrandom error are somewhat mitigated by restrictingattention to those communities which have signifi-cantly high total (or race-specific) mortality indexes.
Another approach is to aggregate mortalitydata over a long period. For example, the NationalCancer Institute recently produced an atlas of 20-year cancer mortality for U.S. counties (7). ~]s hasbeen the basis of subsequent epidemiological studiesof particular areas with unusually high death rates
from certain types of cancer. While there are anumber of conceptual problems with mortality ratesover such a long period (e.g., changing populationcharacteristics, cause-of-death identification, etc.),these data are extremely useful as a first step inmore detailed investigation of local health problemsand strategies for dealing with them.
It is also possible to adjust death rates for fac-tors other than age, race, and sex. For example,socioeconomic gradients in mortality have been in-vestigated by Kitagawa and HaUser (8). Combiningthis information with the detailed local Census datacan lead to mortality indexes which adjust for thesesocioeconomic differentials. In this way communitymortality can be rated in comparison to what mightbe expected given the community’s demographicand socioeconomic composition. Investigation ofthis approach ii currently under way in the Divisionof Analysis, NCHS.
The use of mortality data for specific causeswhich are theoretically preventable has been ad-vanced most recently by Rutstein, et al (9). Due tothe small number of deaths involved in the suggesi-ed causes, the usefulness of their approach is pri-marily in a case-by-case surveillance mechanismwhich involves rapid feedback at time of death.However, we are now investigating the possibility ofaggregating some of these causes to determine(based on multivariate analysis of geographic varia-tions in death rates) whether health resources havean effect on mortality from these causes. If this
aPProach is successful> it maY be Possible to usedeath rates from these causes as an indicator of theeffects of the health system.
In the area of maternal and infant health, dataavailable on the birth and death certificates providea valuable planning tool. Information about prena-tal care, age of mother, and birth order all haverather immediate implications for family planningservices, health education, and prenatal care.Outcomes in terms of low birth weight ratios andinfant mortality can be used. Geographic variationin these indicators seems to imply that further pro-gress is possible (10). In States where birth and in-fant death records are linked the potential for iden-tifying high-risk groups and evaluating interventionstrategies even greater.
Synthetic Estimates
Indicators of the health status of the U.S. pop-tilation are available from the Survey program ofthe NCHS in terms of measures such as disability,prevalence of selected chronic conditions (causinglimitation of activity), incidence of acute conditions,etc. Although the implications of these indicatorsfor health planning or assessing the effects of the
15

health system are not always clear (11, p. 152-156,239-241), they can be used to make some rough es-timates of the need for health services, manpower(12), or other types of programs.
The fact that these indicators are estimates forthe entire U.S. population means that they cannot beused directly by the local health planner. However,the notion of synthetic estimation may prove useful intranslating the national estimates to local areas. Inthis context, a syntietic estimate of, say, prevalence ofhypertension, is obtained by applying the U.S. preval-ence of hypertension for specific population groups(e.g., white males, aged 45-64 with family incomeunder $3,000), to the local area’s population composi-tion. By adding these estimates an overall prevalenceis obtained. There are a number of sophisticated ad-justments to that basic procedure but ‘the idea is thesame. The problem is that these synthetic estimatesmay be biased since they assume that nationa~ ratesapply to all local areas and are dependent only uponthe individud characteristics used (e.g., age, race, sex,income). Previous research (13, 14) indicates that thebiases can be large but if we remember that the syn-thetic estimates are onlv crude indicators of the needfor various types of se~lces, the biases should be tol-erable. Further research on synthetic estimation isnow being carried out at NCHS.
One important point with respect to syntheticestimators should be noted. Since they involve onlythe demographic and socioeconomic characteristicsof the local area, thev cannot be used to assess the,effect of the health system. Synthetic estimates aremerely a guide for resource and program planning.This is not a serious limitation if we take the view(outlined previously) that medical care interventionwill not have much impact on decreasing the prev-alence of chronic conditions (indeed it is possiblethat prevalence will increase with increased access).
What might be possible in a few cases, however,is synthetic estimation of the effects of specific pro-grams on health status. To take a rather controver-sial example, consider the use of oral hypoglycemicdrugs in the treatment of adult-onset diabetes. TheUniversity Group Diabetes Program (UGDP) hasdemonstrated an increased risk of cardiovascularmortality for diabetics using oral drugs when com-pared to diabetics controlled by insulin or diet alone(15). In a local area with high prevalence (or syn-thetically estimated prevalence) of diabetes, theHSA might have as a- priority program the educa-tion of patients and physicians (through the localMedical Society) about the dangers of oral hypogly-cemic agents and the treatment alternatives. Processevaluation of the program could be done by patientor physician interviews or even by sampling localpharmacies to monitor trends in prescriptions beingfilled. Using the results of the UGDP, synthetic esti-mates of the reduction in mortality could be ob-
tained by applying death rates from the UGDP tothe numbers of diabetics switching from oral agentsto other therapies.
Another example is water fluoridation.Previous controlled studies have shown that artifi-cial fluoridation is a safe and cost-effective methodof reducing the incidence of dental caries amongchildren. The local health planner can use this in-formation to promote the fluoridation of the area’swater supply. Evaluation of this intervention neednot directly measure the incidence of dental caries,What is needed is structure and process measuresof whether the goal is being achieved: Is the watersupply fluoridated? Is the level of fluoridation with-in acceptable limits? Is water consumption by thepopulation holding steady (as measured by the localwater companies)? Has the use of bottled water in-creased (based on supermarket sales)? The effect onincidence of dental caries can be estimated by usingthe results of the earlier studies (e.g., 16).
Conclusions
Although the use of heahh status data areemphasized in P.L. 93-641, the constraints imposedupon the HSA in terms of funding and primarydata collection necessitate a rather broad interpreta-tion of health status indicators, Some crude mea-sures and approaches have been outlined and cur-rent research may show some of these to be useful,
My own point of view is that local health plan-ners should focus on implementation with structureand process evaluation. Outcome evaluation interms of health status should be mainly limited tothe crude health status indicators discussed pre-ciously. However, in order to do this effectively,planners must work closely with those whose pri-mary concern is developing and evaluating the out-come effectiveness of intervention strategies:epidemiologists, clinical researchers, behavioral sci-entists, environmental toxicologists, health servicesresearchers, These scientists should also becomemore involved in working with planners to moveprograms from the “laboratory” to the operationalsetting.
References
1.
2.
3.
93rd Congress: National Health Planning and Re-sources Development Act of 1974 (Public Law 93-641),U.S. Government Printing Office, Washington, D.C,1974.A. L. Cochrane, Effectiveness and Efficiency, NuffieldProvincial Hospitals Trust, London, 1972.J. E. Wennberg, et al: Health Care Delivery in MaineIII: Evaluating the Level of Hospital Performance, J,Maine Med. Assn. 66:298-306, November 1975,
16

4.
5.
6.
7.
8.
9.
10.
W. J. Walters: State Level Comprehensive HealthPlanning, Am J Pub Health 66(2): 139-144, Feb 1976.I. M, Moriyama: Problems in the Measurement ofHealth Status in E. B. Sheldon and W. E. Moore (eds)Indicators of Social Change, Russell Sage Foundation,~.y>, 1968.
J. Yersuhalmy: A Mortality Index for Use in Place ofthe Age-Adjusted Death Rate, Am J. Pub Health41:907-922, 1951.
T. J. Mason, et al, Atias of Cancer Mortality for U.S.Counties: 1950-1969, DHEW Pub No. (NIH) 75-780,1975.E. M. Kitaga\va and P.M. Hauser: Differential Mortalityin the United States: A Study in Socioeconomic Epide-miology. Harvard Univ Press, Cambridge, 1973.D. D. Rutstein, et al: Measuring the Quality of MedicalCare. N EngJ. Med 294:582-588, 1976.J. C. Kleinman, et. aL, Geographic Variations in Infant
Mortality, Public Health Reports (to appear 1976).
11.
12.
13.
14.
15.
16.
National Center for Health Statistics. Health: UnitedStates, 1975, DHEW Publication No. (HRA) 76-1232,1976.H. K. Schonfeld, et al, Numbers of Physicians Re-quired for Primary Medical Care. N. Eng J. Med.286:571-576, 1972.T. Namekata, et al: Synthetic Estimates of Work LossDisability for Each State and the District of Columbia,Pub Health Report 90:532-538, 1975.
P. S. Levy: The Use of Mortality Data in EvaluatingSynthetic Estimates in Proceedings of the Amer StatAssn 1971, Social Statistics Section, 328-331, AmerStat Assn, Washington, D. C. 1971.The University Group Diabetes Program. Diabetes19:Supple 2, Nov. 2, 1970.J. W. Knutson, An Evaluation of the Grand RapidsWater Fluoridation Project, in F. J. McClure (cd)
.Fluride Drinking Waters, National Institute of DentalResearch, 1962.
17

MEASURING HEALTH STATUS WITH LOCAL DATA*
Mr. Thaine H. Allison, it-., Economist, Inland Counties Comprehensive Health PlanninuCound, San Bernardino, California
Introduction
A primary responsibility of ComprehensiveHealth Planning Councils, and their replacementHealth Systems Agencies, is to affect decisions in-volved with the allocation of. health care resources.This problem is complicated by the fact that theseresources are a mix of private and public fundswhich are not necessarily responsive to traditionalmarket forces. If these agencies are to make -re-source allocation decisions that are effective in theeyes of providers and consumers of health careservices, the results of these decisions must impactthe health status of the target population.
The basic hypothesis of this paper is that var-ious social and economic variables can be used toestimate a relative health status index for the resi-dent population within a contiguous area. Thesesocial and economic factors are statistically relatedto the demands placed on the health care deliverysystem by people who are at risk. A major source ofunexplained variation in the development of theindex is the transient or visitor population into thearea measured by the variables used in the index.This index does not establish the absolute level ofhealth of the population at risk but is a relative in-dex for comparison of two, or more, groups whoinhabit different geographical areas.
This paper contains seven additional sections:(1) an analysis of the nature of health status index-es, (2) {he responsibili& of Health Systems Agencies(HSA’S) to cletermine health status, (3) the problemsfaced by staffs of HSA’S, (4) the approach of InlandCounties Comprehensive Health Planning Council(IC/CHPC) to this problem, (5) problems associatedwith this approach, (6) advantages of this approachand (7) summary and conclusions.
Nature of Health StatusIndexes
This paper is the third in a series of four. Theprevious papers present an indepth analysis of thephilosophical and theoretical problems of HealthStatus Indexes. At this point, ‘it “is necessary to re-iterate several points which are recognized as limita-
*The methodology utilized in this study was devel-oped by staff and volunteers of this Agency during the ]astfour years.
18
... 0
tions on this approach. The specific limitations ofthis index are discussed below.
First, it is noted that this index does not at-tempt to measure the degree of healthiness ofpeople who live in San Bernardino County. Sinceno one seems to know exactly what is meant by ahealthy person or cohort group, it is not within thescope of IC/CHPC to provide this definition.
Fundamental and critical weaknesses of indexesare the lack of definitions of the concepts to bemeasured. Frequently it is impossible to distinguishbetween availability, accessibility of service, healthstatus and utilization of existing services. Healthstatus is not defined in the Act (P.L. 93-641), onlythat it will be measured.
Frequently agencies turn to the World HealthOrganization definition of health which viewshealthiness as a state of maximum human potential,Operationally this approach is not a viable means toevaluate current status. In most areas data indicat-ing morbidity is unavailable and mortality data islate and only reflects the failure of the system toprevent death. With a fairly high degree of statisti-cal assurance it is possible for planners to concludethat life is a fatal disease. The problem is what kindof life is lived? What is a healthy life status?
It is clear that the problem at hand is one ofmeasuring levels of well being, with a limited budg-et and little viable data or agreement of interpreta-tion. In the IC/CHPC model, the approach is oneof utilizing several surrogate measures of factorsthat are related to heavy utilization of services dueto what is believed to be ill heahh or low healthstatus. Experience in the agency by staff and volun-teer observation has been substituted for dificultand sophisticated statistical techniques. The staff isfully cognizant of the problems and the ramifica-tions of these issues on any conclusions drawn fromthe analysis. Anyone who utilizes this approachshould examine closely these issues and the impactof the ,assumptions on the outcome.
The Health Systems Agenciesand Health Status
Two cogent statements contained in the finalregulations for HSA’S are of particular concern toparticipants of this symposium:
“In establishing the Annual ImplementationPlan (AIP), the Agency shall give priority tothose objectives which will maximally improve

I
the health of the residents of the area as deter-mined on the basis of the relation of the cost ofrattaining such objectives to their benefits and
$ which are fitted to the special needs of thearea.”1
Further:
“The Agency shall assemble and analyze dataConcerning: the status (and its determinants)of the health of the residents of the area.”z
Potentially, these two activities are the mostdifficult that any agency will have to undertakewithin the confines of this important new legisla-tion. Similar -requirements in Federal legislationconcerning water resources development has fos-tered the creation of a whole new discipline of ap-plied economics and natural resource developmentpolicies.
Problems of EstablishingHealth Status
There are several potential problems faced by
HSA’S trying to establish the health status of thepopulation at risk. Indications from HEW are thatthese agencies will be required to carry out a com-manding list of activities and responsibilities with avery limited budget. (As of this date, no firm fund-ing level commitments have been made by HEW,but it is clear that for California’s Area 12, the totalHSA budget will be significantly lower than thecombined budgets of the predecessor agencies.)Closely related to the budgetary constraint is theavailability of appropriate data which would indi-cate the degree of healthiness of people.
While numerous health status indexes havebeen developed, most of these require extensiveprimary data collection on a regular and continuingbasis.s In reviewing several survey instruments cur-rently utilized for health status indexes, it was esti-mated that the cost per surveyed individual wouldapproach $25.00 before the data were tabulated oranalyzed and this cost would be repeated annuallyto give comparisons over time.
Even if a sampling procedure is used, the costsof primary data collection are prohibitive to most
}Federal Register, Department of Health, Educationand Welfare, PHS “Health Systems Agencies, Designation
and Funding”, Section 122.107 C, 3, P. 12828 Friday,March 26, 1976, Vol. 41, No. 60.
aIbid Section 122.107 C, 1, p. 12828.3Borg, Robert L. ed, Health Status Indexes. Proceedings
of a Conference conducted by Health Services Research,,Hospital Research and Educational Trust, Chicago, 1973.
agencies and the law requires specific authorityfrom the Secretary of HEW.4
Concomitantly, while data, budget and authorityconstrain the activities of the Agency to performthis function, the Agency is required to determinethe health status of the residents of the HealthService Area. Not only does P.L. 93-641 requiredecisisions based on the ability to achieve improvedhealth status, but other related laws (i.e., P.L. 93-222, the Health Maintenance Organization Act of1973), require decisions that are tied to estimates ofhealth status.
Even if the problems associated with datacollection authority and budget constraints weresolved, there remains a host of statistical and theo-retical issues associated with the development of ahealth status index. A fundamental weakness ofhealth status indexes is the lack of clear definitionsof the concepts of healthiness and health status.The directive is to measure health status without adefinition of status or its determinants. Too fre-quently there is a failure to distinguish betweenhealth status and other issues such as availabilityand accessibility of health services which are closelyrelated to health status.
Recent proposals have been made to reformu-late health status indexes and to change the ap-proach of measuring health status. Professor Elin-son states, “Perhaps the traditional measures ofhealth status should be changed to reflect more sen-sitively the services provided by the health deliverysystem.”G This approach implicitly assumes thatthere is a cause and effect relationship between thephysical availability of facilities, services, and man-power agents and the ability of people in need ofthese services to command control or effective de-mand for their use.
This is an interesting paradigm and given afree enterprise philosophy offers a major methodo-logical trap for investigators and health planners.Suppose that the charge of this section was to esti-mate a gasoline need status index (GNSI). A verylogical hypothesis would be that suppliers of gaso-.line have successfully found through a process of,trial and error, those locations where people need-ing gasoline will purchase it. If these filling stationsare identified and the quantities of gasoline stt~-plied to customers, then an appropriate measure ofGNSI could be determined by dividing each sta-tion’s delivery rate by the mean delivery amountand a simple relative index of need for this productcould be determined. Stations in areas with a GNSIof less than 100 would show areas with relatively lit-tle need and those with a GNSI greater than 100
4opcit p. 12828, Section 122.107, 1, (vi).5,4s quoted in Satin, Maurice S. “Feedback: Health Serv-
ices and Health Status”, Health Services Re5earch,Summer 1975, p. 209, Vol. 10, Number 2.
19
. .

would show a relatively high need for gasoline.Policies could then be adopted to increase or de-
-crease the availability of the product or service ateach geographical location. This approach to devel-oping a health status index has some theoreticaland empirical problems. ~le the supply side ofthe petroleum business has come under heavy criti-cism in recent years, there is fairly clear- evidencethat those who have a “need” for petroleum are theones who purchase it. Where need is expressed aseconomic demand and ability and willingness to payact as key variables, one would not be surprised todiscover large numbers of gasoline stations adjacentto freeways, major thoroughfares and areas wherethere is a high density of automobiles among resi-dents.
Unfortunately, for estimates of health statusindexes there is not this clear-cut tie between the“need” for health services and ability and willing-ness to pay. In fact, to a limited degree, there is aconverse relationship, i.e., people with low incomes,living in substandard housing and lacking educationtend to have a greater “need” for health servicesthan do those who have the ability to express theirdemands in the market place for health care serv-ices.s Recognizing these factors, staff of IC/CHPCset out to develop a health status index that: wouldutilize existing and available data, preferably on acensus tract basis; was easy to calculate, generally asmall electronic calculator is considered a luxury inhealth planning agencies; and was statistically relat-ed to the’ status of health of residents, and cog-nizant of weighting and indexing problems thatabound in the literature.7 As you are aware, this isno mean task and it is recognized that the InlandCounties index is amenable to a variety of valid sta-tistical, theoretical and philosophical criticisms,some of which have been anticipated and will bediscussed below.
The Problem to be Indexed
Recognizing these problems, consider the area,the people, and the factors involved in the InlandCounties Health Status Index. The Area:California’s Area 12 represents approximately 26percent of the State’s land area and 6 percent of
‘Grossman, Michael T. The Demand for Health Serv-
;ces: A Theoretical & Empirical Investigation, NationalBureau of Economic Research, N.Y. 1972.
Tpatrick, D. L., J. W. Bush, and M. M. Chen, “Methodsfor Measuring Levels of Well Being for a Health StatusIndex” Health Services Research, 8:228, Fall 1973, andKaplon, R. M. and J. W. Bush, “A Multitrait MultimethodStudy of Value Ratings for a Health Status Index”.Western Psychological Association, San Francisco, CA1975.
20
the popdation. It is a contrast between the denselypopulated valley portion, mountain regions and thevast Mojave desert. Resident population of the areais only about 1.2 million, but this number can dou-ble or triple with recreational and other visitors atvarious times throughout the year. Data for thenothern counties are not readily available and Rfv-erside County is not within the current jurisdictionof IC/CHPC (but will be within IC/HSA).
San Bernardino County is often viewed as amicrocosm of national geography. The county isfirst of all large, approximately 20,160 square miles,The area is characterized by large expansive desertregions sparsely populated but heavily traveled withmajor north-south and east-west highway linkages,These areas are heavily utilized for recreational ac-tivities by Southern California’s urban population,mere is a mountainous backbone of the countyseparating the desert from the valley with a majori-ty of residents living along a corridor from 20 to 60miles from the Los Angeles metropolitan area,Residents live at elevations ranging from 1,000 to6,000 feet. The higher elevation areas offer year-round recreational opportunities and rural livingfor many people as well as concentrations of secondhomes for temporary weekend residents. The valleyportion of the ~ounty is relatively small, approxi-mately 40 miles long and 20 miles wide with all ofthe problems associated with heavy industry, tran-sient population and commuter suburbs.
The People
Examination of age/sex characteristics of thepopulation shows a wide variation between andwithin communities. Further, the area is rich incross-cultural contrasts with approximately 16 per-cent of the population Chicano and 4 percentBlack. Socioeconomic characteristics are varied andprovide a major challenge to solve the area’s prob-lems. These contrasts are illustrated in a recentgrant proposal received by IC/CHPC which con-tained the following description of the area to beserved by the proponent:
According to the 1970 census, there are a totalof 116,320 individuals living within this catch-ment area. There are approximately 20 per-cent Spanish-speaking or Spanish-surnamedindividuals, approximately 3 percent Black in-dividuals, and 77 percent White or other. Thecatchment area, then, consists of a higher per-centage of Spanish-speaking or Spanish-sur-named individuals and a slightly lower percent-ageof Blacks and Whites than the total county.population. The distribution of ethnic groupswithin each census tract, however, is quite var-iant. For example, in Census Tract 23 there

are approximately 12 percent Spanish back-ground, 49 percent Black and 39 percentWhite or other individuals.
Socioeconomic conditions, such as the amountof education, were examined for this catch-ment area. The overall county percentage ofindividuals over 25 years of age having aneighth grade, or less, education is 23 percent.In these Census Tracts the proportion rangedfrom 13 to 35 percent.
The data also show that a majority of the cen-sus tracts have higher than the county per-centage of over-crowded units and homes hav-ing a median value of less than $17,600 as in-dicated by the 1970 census.
Census Tract 69 has a high percentage ofyoung people. Census Tract 68, on the otherhand, which has the next lowest value ofhomes, has little over-crowding, but many ofthe people living in that tract are older. In fact,32 percent of the people living in Census Tract68 are over 65 years of age. It appears thatCensus Tract 68 is comprised of a high geria-tric population, and attention should be givento these individuals. In census Tract 30, more-over, there are 25 percent of the individualswho are over 65. The older ages of these indi-viduals appear to be correlated with th e lowpercentage of over-crowded units.Interestingly, there are almost 8 percent of the116,320 individuals iwthin the catchment areaover 65 years of age, whereas 5 percent of thepopulation in the entire country is over 65years of ages
Clearly the contrasts between census tract exac-erbate the health problems and the problem of des-igning a delivery system which meets the broadneeds of the area. A health status index must distin-guish these differences for evaluation.
Factors in the Index
Ten factors or data elements are used in theInland Counties Index; five of these are associatedwith health and five are socioeconomic variables.Each variable has the same weight in the index.These variables were selected because various stud-ies have shown that they are related to the need forhealth services, however, San Bernardino County
8Bu~l~arel]a, R., Application for Freestanding com-
mttnity Mental Health Center, San Bernardino CountyMental Health Unit, 1976, p. 9.
data were not statistically evaluated utilizing variousanalysis of variance techniques. The health variablesare: (1) age specific, death rate 65+, (2) fertilityrate, (3) communicable disease rate, (4) venerealdisease rate, and (5) infant death rate. The socio-economic variables are: (6) median family income,(7) median years of school completed, (8) percentof homes with greater than 1.5 persons per roomand (10) Dercent of homes without an automobile.
,1
Broader definitions and source of data are listed inAppendix I.
Data are collected for each of the 112 censustracts in the county and for the county as a wholefor each of the ten variables. Manipulation of theseitems is relatively sim~le and Inland Counties hasthe luxury of a progr~mmable calculator which al-lows fairly rapid calculation of the index values.(Appendix II illustrates the calculations of the in-dex-values).
Empirical evidence supports the argument thatcensus tracts with high incidence of eight of thesecharacteristics (two factors are inversely related,education and income with low health status) have ahigh utilization of various health care services.
The following assessment of use of CountyMental Health Services for the population describedon page 9 (see footnote 8) is typical:
“Examining each program separately, it can beseen that although the catchment area compris-es only 1‘7 percent of the total county’ popula-tion, individuals from the catchment area make .up over 17 percent of the patients within mostprograms. For example, in the Outpatient Pro-gram during the month of March, nearly 24percent of the patients came from the Colton-Fontana catchment area. In July through Sep-tember 19’75, 34.4 percent of the patients inthe Outpatient Program came from the Colton-Fontana catchment area. This means that pro-portionately there were over twice as manycatchment area patients taking advantage okthe Outpatient Program as would be expectedbased on county experience. The Day Treat-ment Program had ~pproximately 22.6 percentof their patients from the catchment area dur-ing March 1974. The Inpatient Program showsduring March 19’74, approximately 31 percentof the patients were from the Colton-Fontanacatchment area. The Alcoholism Programshows an increase from March 1974, to July-September 1975.9
Similaf analysis of other health services utilizationare available for the area. A logical empirical exten-tion of this analysis would be to test relationshipsbetween these variables and the utilization of var-ious health care services.
‘op cit 12
21

Methodology Category Priority Color
The method of calculation is relatively straightforward as can be noted from the simple algebraicstatement of the approach noted below. An indexvalue is calculated for each census track (k) by di-viding the census tract value (for eight of the varia-bles) by the county value for that variable. Theremaining two variables are divided into the countyvalues and all ten quotients are summed and multi-plied by 100. In equation form:
k=l,2, . . . 112
Where:
Ik index value for the kth census tractXi~ ith (socioeconomic or health) variable
for the kth census tractCi ith (socioeconomic or health) variable
for the county as a wholeG ith (socioeconomic variable) median
income and median years of schoolcompleted for the county
Xi~ jth (socioeconomic - variable) - medianincome and median years of schoolcompleted for the kfi census tract.
If a census tract had exactly the same charac-teristics as the county as a whole, then the indexvalue of that census tract would be 1000. The prob-ability of any one census tract having exactly thesame characteristics as the county approaches zero.
Once the index values are calculated for eachcensus tract they are ranked highest to lowest (high-est health status to lowest health status) and themedian, mean, variance and standard deviation arecalculated. The average of the index for each cen-sus tract will approach 1000 but since the average isnot a weighted average it will not equal 1000.
Priorities are assigned on the following basis:
Category Priority color
Less than 2 standard devia-tions below the mean 1 Red
One standard deviation totwo standard deviations Yellowbelow the” mean 2
One standard deviation be-low to one standard de- Lightviation above the mean 3 Green
One standard deviation aboveto two standard deviations Darkabove the mean 4 Green
Greater than two standarddeviations above the mean 5 Blue
These priority classes are transposed in coloronto large maps for use in public meetings andworkshop meetings and onto cross-hatched mapsincluded in the Annual Health Systems Plan. Thesemaps can be viewed in sequence to identify changeswhich occur on a year-to-year basis,
Other studies of the data are undertaken todetermine what variables caused a census tract toshift from a higher priority to a lower priority be-tween two years. In some cases, several variableswill change by a small amount forcing the total ht-dex up or down while in others, o,ne variable willhave a drastic change which shifts the total value ofthe index. To date, the experience with the indexhas shown a relatively constant mean value for thecounty over time (three years calculations are avail-able) but variable standard deviations.
Problems With the Index
The statisticians and theoreticians in attendanceat this symposium can probably give a long list ofproblems” with this approach to health status index-es. One criticism frequently heard is that it is sexist,
‘Female heads of households, more than likely justi-fied, are resentful that they are singled out to beincluded in the index, while single male heads ofhouseholds are not. Further, it can be argued thatif data are income and education adjusted for sexdifferences, that there is probably no difference inhealth status of families whether they are headed bymales or females. Empirical and theoretical evi-dence would probably support the argument butagain, practical limitation, budgetary and staff tal-ents in some cases prevent age-sex adjustments ofmost data sets.lo
Probably the most obvious criticism is that theindex does not measure health status, but only sur-rogate measures of human needs for health serv-ices. This criticism is reinforced by the fact that nostatistical evidence has been presented establishing a
locational centerfor Health stati~tic~.‘$SeIectedVitaland Health Statisticsin Poverty and Non-Poverty Areas of19 Large Cities, 1969-71”. DHEW Pub. No. 76-1904, Se-ries. 21, :F26.
22

demonstrated, much ‘less a cause and effect, rela-tionship between these variables for people living inSan Bernardino County and their actual healthstatus,
One fact noted above was a suggestion to utilizeavailability of existing facilities and services. In SanBernardino the majority of physicians’ offices arelocated within a block of the major hospitals. If thehealth status index map and a map of existing facil-ities are superimposed, the highest priority censustracts are most closely associated with existing facili-ties. What interpretations can be made from thisapparent correspondence? One hypothesis could bethat hospitals (and physicians) have recognizedwhere the people with the greatest problems liveand have chosen to locate in close proximity. If thiswas true, then why would these areas have a lowhealth status index? Perhaps the answer is that theindex does not measure health status. A secondhypothesis could be that high risk patients havemoved close to hospitals to get care. Neither ofthese hypotheses appear to offer adequate explana-tions of the problem.
Hospitals have generally been in the same loca-tion for a number of years, 15 to 74 in most in-stances, and residential areas around them have
.deteriorated as people have moved to the suburbsto establish different life styles. As this deteriorationhas occurred, lower income, less healthy, largerfamilies have moved into adjacent housing, not be-cause hospitals and physician services are available,but because income constraints dictated utilizationof these areas by lower-income people.
No weighting scheme was utilized to give great-er emphasis on one variable over another:Technically it can be argued that “the income andeducational variables are given a different weight inthe index since they are treated differently than theother eight variables. The explicit weights assignedare such that if each variable for a given censustract were equal to the same variable for the countyas a whole the quotient of the two values would beequal to one.
The weighting problem is further complicatedby the fact that the estimates for variance of eachXlk variable are not equal. This results in an implic-it weighting of each variable based on the varianceassociated with that variable. In order to deal withthis criticism of the index it would be possible tostandardize each observation and its associated vari-ance. This approach would make the weights exact-ly equal for each variable in the index. The theoret-
. ical and statistical problems of assigning alternativeweights at this time are beyond the agency’s re-sources.
The question might be asked, why not use 15or 18 variables instead of the 10 used? Once again,the primary criteria were the availability of readily
accessible data and a method that was applicable toutilization of simple calculators.
It is also noted that the index is relative in thesense that it compares each census tract against thecounty average. Do residents of San BernardinoCounty experience a higher, lower, or equal level ofhealthiness with the U. S. population as a whole orcompared to some ideal definition of healthiness?To date, there is no way of knowing. All that can besaid is that for census tracts 48, 49 and 50, thepriorities show people are relatively worse off thanthe index shows the priority identified for censustract 34.
The most damaging criticism of the index isthat as an evaluative technique a poor index may be.worse than no information at all. Every student ofintroductory statistics has heard this argument andmost have at least a passing acquaintance with theramification of this situation. Clearly, there is aneed to continue to develop better analytical tech-niques and definitions of health status. The prob-lem is, what can be done to evaluate needs for serv-ices in the interim?
Since the five socioeconomic variable are onlyavailable from census records, there is the implicitassumption that the relationships identified in 1970have not changed over the five years. This cancause serious problems, but in a county with a sta-ble population, the errors do not appear to be ofmajor consequence. With the advent of the censusevery five years, some of this criticism is mitigated.
Advantages of This Approach
Given the budget constraint and the limitationsof data, this approach has the advantage that it islow cost. The experience of the staff and volunteersof IC/CHPC has been that this index, and the mapsdeveloped from the information summarized by theindex, is a useful tool for augmenting the healthplanning process and project review function of theagency.
Like many tools of analysis, the index is usedonly as a guide in these difficult tasks and not anautomatic means to solve problems. It is useful foralerting staff, volunteers, and public officials whereproblems may be and how the factors are changingover time.
To date, after extensive revie; of the litera-ture, no one has provided an alternative methodfor estimating health status that is within the budgetand data availability criteria imposed on the agen-cy. Given the demands of volunteers, and Federalmandates for action, the method used by IC/CHPCto estimate health status has provided a basis forevaluating recent changes in the variables as theyrelate to the health planning process.
23229-121 0 -77-3

The ‘;ndex is used in conjunction with severalotier tools. For each facility in the area, an iso-chronic map has been developed to show the areawitiln an actual one-half hour driving time of thefacility along the principal driving arteries. Theseare accomplished by actually driving these routesand noting the termination point on a map. Publictransportation routes are also noted to identify al-ternative means for patients to gain access to thefacilities. In San Bernardino County, public trans-portation is very limited.
Closely associated with facilities and services isthe availabdity of health services manpower. At thispoint in time the agency has identified all licensedphysicians by census tract and speciality. Based onthe information included in this inventory file, asimulation model of physician manpower deficitsthrough 1989 by specialty and locality was devel-oped. Similar efforts will be undertaken in the fu-ture to identify other types of manpower needs.These techniques of analysis along with the healthstatus index augment a community based healthplanning process developed by the agency.
Summary and ConclusionsThis paper was billed as a practical approach to
the problems of developing a health status indexwith locally available data. The nature of healthstatus indexes was examined and the various statisti-cal and theoretical problems were explored at acursory level. It was recognized that Health SystemsAgencies have a responsibility to determine healthstatus and that most agencies are faced with limitedresources and data. Any approach to the issue isfraught with problems. In San Bernardino County,given its area and human resources, ten factorshave been used to develop a health status index as abasis for establishing priorities. The methodology isa simple summation of quotients of local censustract estimates of variables divided by the countyvalue for each variable. The index is a relative mea-sure of the human condition. It does not explicitlyspeak to the question of what is health status andhow healthy are people, but it provides a usefulsummary tool for analyzing health related prob-lems.
This ap~roach has several inherent Droblemsdue to the ~;ct that it uses 1970 census da{a, it maybe sexist, there are problems in weighting the varia-bles and it may provide wrong information. Themajor advantages of the index are its low cost, itsusefulness as a guide, and it provides anothermeans to help staff and volunteers identify prob-lpms. This agency, like many others, will continueto examine alternatives and review new methodolo-gies as they become available. Further efforts at giv-ing appropriate statistical validity to this and otherindexes will be attempted as resources becomeavailable. Until such time, the Board of Directors ofIC/CHPC will continue to judiciously develophealth systems plans and make decisions utilizingthis tool, along with others, to affect the health caredelivery system and resource allocation problems ofthe Inland Counties area.
BIBLIOGRAPHY
Borg, Robert, ed Health Status Indexes, Proceedings of aConference conducted by Health Services Research,Hospital Research and Educational Trust, Chicago,1973.
Buglgarella, R., Application for Freestanding CommunityMental Health Center, San Bernardino County MentalHealth Unit, 1976, p. 9.
Grossman, Michael, The Demand for Health Services: ATheoretical and Empirical Investigation, National Bu-reau of Economic Research, New York, 1972.
Kaplon, R.M., and J. W. Bush, “A Multitrait MultimethodStudy of Value Ratings for a Health Status Index”,Western Psychological Association, San Francisco, CA,1975-
National Center for Health Statistics, “Selected Vital andHealth Statistics in Poverty and Non-Poverty Areas of19 Large Cities, 1969-71”, DHEW Pub, No’ 76-1904,Series 21 #26.
Patrick, D.L., J.W. Bush, and M. M, Chen, “Methods forMeasuring Levels of Well Being for a Health StatusIndex”, Health Services Research, 8:228 FalI 1973,
Satin, Maurice S., “Feedback: Health Services and HealthStatus”, Health Services Research, summer 1975, p. 209,vol. 10, #2.
U. S. Government, Federal Register, “Health SystemsAgencies, Designation and Funding”, Department ofHEW, PHS, Friday, March 26, 1976, Vol. 41, No, 60,pp. 12812-12834.
24

Appendix 1
HEALTH, SOCIAL AND ECONOMIC FACTORSSAN BERNARDINO COUNTY
This study distinguishes health and social andeconomic variables separately by census tract in SanBernardino County. Items 1-5 identify specifichealth factors, items 6-9 identify specific social andeconomic factors.
No.
1.
2.
3.
COMPONENT DESCRIPTION
Age specific death rate: number of deaths topersons 65 years and over divided by the totalpopulation 65 years and over.Fertility rate: number of births by women ofchild bearing age (15-44) divided by the num-ber of women of child bearing age.Communicable disease rate: number of report-ed communicable diseases (not including vene-real disease) divided by the total population.
4.
5.
6.
7.
8.
9.
10.
Veneral disease rate: number of reported casesof veneral disease divided by the total popula-tion.Infant death rate: number of deaths to infants(less than 1 year) divided by the number ofbirths.Median Income: 1970 Census, fourth countdata.Median year of school completed: 1970 Cen-sus, fourth count data.Percent families with children, female headed,in poverty: 1970 Census, fourth count data.Percent of families living in over-crowdedhousing units: 1970 Census, fourth countdata.Occupied housing units that do not have anautomobile available: 1970 Census, fourthcount data.
25
I
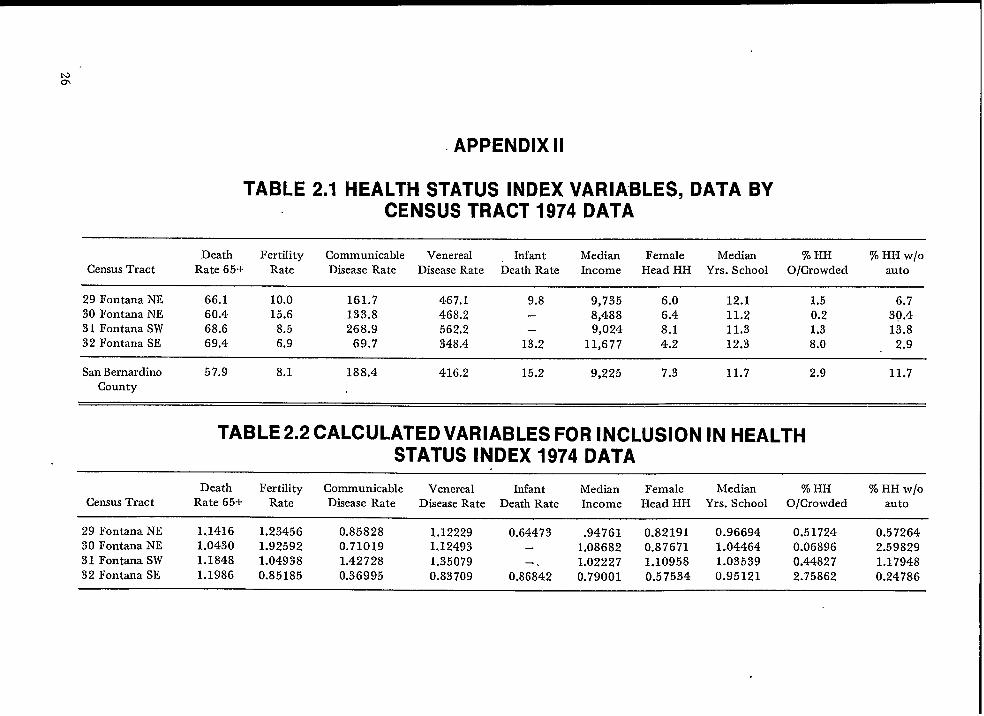
APPENDIX II
TABLE 2.1 HEALTH STATUS INDEX VARIABLES, DATA BYCENSUS TRACT 1974 DATA
Death Fertility Communicable Venereal Infant Median Female Median % HH % HH W/O
Census Tract Rate 65+ Rate Disease Rate Disease Rate Death Rate Income Head HH Yrs. SchooI O/Crowded auto
29 Fontana NE 66.1 10.0 161.7 467.1 9.8 9,735 6.0 12.1 1,5 6.730 Fontana NE 60.4 15.6 133.8 468.2 — 8,488 6.4 11.2 0.2 30.431 Fontana SW 68.6 8.5 268.9 562.2 — 9,024 8.1 11.3 1,3 13.832 Fontana SE 69.4 6.9 69.7 348.4 13.2 11,677 4.2 12.3 8.0 2.9
San Bernardino 57.9 8.1 188.4 416.2 15.2 9,225 7.3 11.7 2,9 11.7County
TABLE 2.2 CALCULATED VARIABLES FOR INCLUSION IN HEALTHSTATUS INDEX 1974 DATA
Death Fertility Communicable Venereal Infant Median Female Median % HH % HH W/O
Census Tract Rate 65+ Rate Disease Rate Disease Rate Death Rate Income Head HH Yrs. School O/Crowded auto
29 Fontana NE 1.1416 1.23456 0.85828 1.12229 0.64473 .94761 0.82191 0.96694 0.5172430 Fontana NE
0.572641.0430 1.92592 0.71019 1.12493 – 1.08682 0.87671 1.04464 0.06896
31 Fontana SW 1.18482.59829
1.04938 1.42728 1,35079 1.02227 1.10958 1.03539 0.44827 1.1794832 Fontana SE 1.1986 0.85185 0.36995 0.83709 0.8;842 0.79001 0.57534 0.95121 2.75862 0.24786

TABLE 2.3 HEALTH STATUS INDEX BY CENSUS TRACT 1974DATA
Census Tract Index Value Priority Rank Color
29 Fontana NE 882.779 4 62 Dark Green30 Fontana NE 1047.946 3 40 Light Green31 Fontana SW 980.724 4 52 Dark Green32 Fontana SE 944.895 4 55 Dark Green
TABLE 2.4 SUMMARY INDEX VALUES 1974 DATA
Example Census Tracts WithSummary Statistic Value Values Approaching Statistical
Estimate
Mean 984.0 31Standard Deviation 335.0 —
.Median 896.0 84Upper Limit 2211.0 59Lower Limit 348.0 5
.
.27

HEALTH STATUS INDICES AND ACCESS TO MEDICAL CARE*
Ronald M. Andersen, Ph. D., Associate Professor, Center for Health AdministrationStudies, University of Chicago, Chicago, Illinois
The thesis of this paper is that the most policyrelevant measures of access to medical care aredependent on development of health status indices.This idea wif.1be developed by a discussion of var-ious definitions of access and the relationship ofhealth status to them. Access measures incorporat-ing health status components are described in moredetail. Using comparative data from national social
“surveys, empirical examples are given of how thesemeasures might be used to monitor change in apopulation’s access to medical care according toincome level. Consideration of the policy relevanceof the’se access measures at the State and local aswell as national level concludes the paper.
Concepts of Access
Two main themes regarding the access conceptappear in the literature. Some researchers tend toequate access with characteristics of the population(family income, insurance coverage, attitudes to-ward medical care) or of the delivery system (num-ber of physicians and hospital beds per populationunit and appointment and office waiting times fordoctor visits).] These characteristics which arethought to influence whether entry to the system isgained and how satisfied consumers are with it aretermed “process indicators.”
Other researchers argue that access can best beevaluated through the use of “outcome indicators,”i.e., measures of health services utilization and lev-els of satisfaction with services received.z Thesemeasures, they argue, permit “external validation ofthe importance of the process indicators.” Measuresof utilization might include specification of the typeof service used (e.g. hospital, physician, dentist,emergency care, home care), the site at which thecare was rendered (home, office, dlnic, inpatienthospital, etc.) the purpose of the care received(preventive, curative, stabilizing, custodial) andsome indication of the continuity of care provided.Outcome measures of consumer satisfaction would
*This research was supported by a grant from theRobert Wood Johnson Foundation and Contract HRA230-76-0096 with the National Center for Health ServicesResearch to develop a framework and indices of access tomedical care.
lLU Ann Aday, and Ronald Andersen, “A Frame-work for the Study of Access to Medical Care,” Health
Services Research 9, Fall 1974, 208-220.21bid.
28
require data on ~uch variables as the percentage ofthe study population who were satisfied or dissatis-fied with convenience, cost, coordination, courtesy,medical information and overall quality of care andthe percentage who wanted medical care and didnot get it.
If the major concern is how and why a pro-gram influences access, then measures of processare appropriate. However, if one wishes to actuallyassess the effect of a program or examine differ-ences in level of access among subgroups in thepopulation, then outcome measures are preferable.Even the outcome measures described above willnot be sufficient if the primary issue is equity ofaccess to medical care. Some researchers emphasizethat the access concept is best considered in thecontext of whether people actually in need of medi-cal care recsive it or not. It is in defining and as-
sessing this “need” that health status indicators be-come essential to access measurements
Health Status Indices’Traditional population measures of health
status were various mortality rates, These measureswere appropriate when the major causes of deathwere acute, infectious diseases, With the decline ofthe importance of infectious disease and the rise ofchronic debilitating conditions which might afflict apatient for years without causing death, the value ofmortality rates as measures of health status wasreduced. Consequently, other measures of morbidi-ty and disability were sought out as well, However,attaining reliable and valid measures of these alter-natives has been a difficult task, Further, efforts toinclude indicators of social and psychological healthand complete “well-being” complicate the task evenmore. Despite these difficulties a number of encour-aging health measurement efforts are being made,s
3LU Ann AdaY, llE~onomic and Noneconomic Barriers
to the Use of Needed Medical Servicesfl Medical Care 13,June 1975,448-450.
lwhile the term index is often used to describe com-binations of independent measures, the term will be usedhere for single measures as well.
5See for example, Warren Balinsky and Rene Ber&
ner, “A Review of the Research on General Health StatusIndexes; Medical Care 13, March-April 1975, 181-193;and John Ware, “Conceptualization and Measurement ofHealth for Policy-Relevant Research in Medical Care De-livery: Research Report, Santa Monica, California. TheRand Corporation 1976.

When it is suggested that health status indicesshould be used to judge equity in distributing medi-cal care, there is an implicit assumption that medi-cal care is related to health status. Concern withmeasuring health status often stems from an inter-est in showing the impact of medical care and/orother factors on health status. However, healthstatus indices can be considered as input measuresas well, in that differential health levels may be usedto judge how health services should be distributed.The value judgment made in this paper is thatthose subgroups’ with the lowest health status scores(i.e., have the greatest need) should receive themost medical care.
One might question whether this approachmust be justified by assuming that medical caremakes a difference, i.e., improves health level.However, even in the absence of definitive evidencethat medical care improves health status, the use ofdifferential health status as a criterion for distribut-ing services might be justified by the widely heldvalue that all should have medical care regardless oftheir ability to pay for that care. Thus, the mea-sures described in the following section are basedon the assumption that appropriate access resultswhen higher levels of need (i.e., lower health status)elicit higher levels of health service use.
Data Sources
The data sets emphasized in this analysis comefrom national surveys of the noninstitutionalizedpopulation of the United States conducted by theCenter for Health Administration Studies (CHAS)and the National Opinion Research Center (NORC)of the University of Chicago in 1964, 1971 and1975-76. In 1964 the interview response rate was 83percent with interviews completed of 2,367 familiesincluding 7,803 individuals. In 1971 the populationwas stratified and differentially sampled accordingto age, income and residence. The weighted inter-view response rate was 82 percent. The final sampleconsisted of 3,765 families including 11,619 individ-uals,b
“The most recent study differed from the earlierones in several respects. The earlier samples werehousehold samples. The interviewer was instructedto interview the most knowledgeable family memberabout the family’s health care. Although additionalinformation from other family members – wassought, there was considerable proxy reporting inthese studies. In the most recent study, randomadults and children were selected from each house-
GThese s,tudie~are described in de~ai] in Rona]d An-
dersen, et al., TIVODecades of Health Services: Social Sur-vey Trends in Use and Expenditure, Cambridge, Mass.:Ballinger Publishing Co., 1976.
hold for detailed interview. Each adult was inter-viewed personally and proxies were accepted onlyfor children 17 and under. In addition to the prob-ability sample of the noninstitutionalized popula-tion, special additional samples of persons experi-encing episodes of illness, rural southern blacks,and Spanish heritage persons living in the South-west were drawn. The analysis will be limited to thegeneral sample of the noninstitutionalized popula-tion and the rural southern black populationweighted in such a way that these two merged sam-ples provide estimates for the total U.S. population.The analysis are restricted to these samples becausethe data is still in preliminary form and weightswhich would allow the merging of all samples arenot available. For the samples used the total num-ber of completed interviews is 6481. Another differ-ence between the earlier samples and the most re-cent one is that the earlier ones emphasized healthexpenditure and health insurance information whilethe most recent one is oriented more toward pro-cess and outcome measures of access to medicalcare and detailed accounts of recent episodes of ill-ness. Despite these differences many identical ques-tions were asked in all samples which allow compari-sons over time.
Comparative estimates based on informationcollected in the Health Interview Survey by the Na-tional Center for Health Statistics (NCHS) are alsopresented. These estimates for time periods ascomparable as possible to those covered in theCHAS studies come from household interviewsconducted in a probability sample of the civilian,noninstitutionalized population of the UnitedStates. The sample is designed so that interviewsare conducted each week by interviewers of theBureau of the Census. In the 1963-64 and 1970periods the cumulative weekly samples includedabout 42,000 households containing about 134,000persons. In the 19’74 study the sample consisted of41,000 households and 120,000 persons.T While theCHAS and NCHS samples differ in some respectsof sample design and execution, these two series ofnational studies are judged sufficiently similar toallow the comparisons made in this papers The useof the NCHS data allows some assessment of thereliability of the CHAS estimates of changes in ac-cess over time and between income groups.
In addition to CHAS-NORC and NCHS, athird source of data is a national probability surveyof the Swedish noninstitutionalized population con-
TDetai]sconcerning the NCHS sample design for eachof the years under consideration are found in the NCHSSeries 10 publications, “Current Estimates,” Numbers 13,,72 and 100.
8For a discussion. of differences and similarities of theNCHS and CHAS studies see Andersen et. al., op cit.,Appendix I.
29 .

ducted by the Department of Social Medicine of theUniversity of Uppsala covering calendar year 1963.This social survey sample of 1,961 persons drawnfrom social insurance records was designed to havesome comparable measure of access to those collect-ed in CHAS-NORC studies. This additional inde-pendent source allows the comparison of access pat-terns between systems with quite different methodsof organization ,and finance. Of particular interestfor the analysis of access patterns by income groupis tie higher level of third party payment for physi-cian ambulatory care in Sweden.g
Empirical Measures of Access
A simple measure of access which focuses onlyon use of services is mean physician visits per per-son per year. More complex measures of accesswhich indicate use of services relative to the needfor care are the use-disability ratio and tie symp-toms-response ratio.
Mean Physician Visits
One relatively straight-forward measure of ac-cess which does not directly take into account needis the mean number of physician visits per personper year. Chart 1 shows the mean number of visitsby income level in the United States. The CHASestimates are for 1963, 19’70, and 1976. The NCHSestimates are for similar periods except that themost recent available data are for 1974. Incomelevel in each instance is based on family income. Itis calculated so that roughly similar proportions ofthe population are represented by income group foreach year (low income ~ one fourth of the popula-tion; middle income ~“ one third; and high income ~two fifths). 10 The main differences between theCHAS and NCHS measures of physician visits arethat the CHAS definitions exclude telephone callswhich are included in the NCHS definitions. Also,the NCHS estimates are based on a two week recallperiod while the CHAS recall period is one year.Both of fiese differences would tend to increase theNCHS estimates relative to those of CHAS.
9The Swedish study and the comparative efforts re-sulting from it are described in Ronald Andersen, BjornSmedby and Odin W. Anderson, Medical Care Use inSweden and the United States: A Comparative AnaJysis ofSystems Behavior. Research Series No. 27, Chicago: Cen-ter for Health Administration Studies, University of Chica-go, 1970.
1Whe ranges of family incomes represented by low,middle and high income levels for CHAS, NCHS, andSwedish estimates are presented in Table 1.
30
The CHAS findings in Chart 1 show that by1963 the low income population was averagingalmost as many visits per person as the rest of thepopulation (in earlier periods they had lagged be-hind considerably).11 By 1970 the low income groupaveraged considerably more visits than the higherincome populations. In the interim between 1963and 1970 it should be remembered that the Medi-care and Medicaid programs went into effect, bothof which might be expected to increase the relativeaccess of the low income population. The findingsfrom CHAS for 1976 show the low income popula-tion maintaining the higher level of visits shown inthe previous period.
The NCHS findings in Chart 1 generally sub-stantiate the patterns shown by CHAS, The lowincome population had slightly fewer visits in 1963,had surpassed the rest of the population by 1970and maintained a higher use rate in the most recenttime period. The NCHS data differ from the CHASdata in the following respects: the total number ofvisits reported tends to be higher for NCHS; thetrend over time in mean visits is up for NCHS butdown for CHAS, and the relative excess in visits bythe poor in the later periods is smaller according tothe NCHS findings.
Despite some differences, however, both sets ofdata on physician visits suggest a picture of improv-ing access for the poor over time with the low in-come population actually enjoying an advantagecurrently. However, this picture does not take intoaccount possible differences in need according toincome level,
Use-Disability Ratio
The use-disability ratio is one attempt to devel-op an index of access to medical care that integratesthe rates of use of physicians and an indicator ofneed. The indicator of need is based on the num-ber of days within a year which, because of illnessor injury, respondents report being kept in bed,indoors or away from usual activities. The CHASand NCHS approaches to collecting disability daydata differ in the recall period (one year for CHASand two weeks for NCHS). Also, days spent in thehospital are excluded from the totaI disability daysfor CHAS but not NCHS. Finally, only one ques-tion asking for disability days is used in the CHASstudy while separate questions are asked about beddays and other restricted activities days in theNCHS interview. All of these differences wouldseem, as was the case for physician visits, to makethe estimates of disability days from NCHS relative-ly larger than th’ose from CHAS. However, theunderlying concepts in the two studies are similar,
llAndersen, et. d., Op Cit.

Physician visitsper person peryear
NCHS
Income level
Physician visitsper person peryear
CHAS-NORC
Income level
Chart 1. Physician Visitsa
6
5
4
3
2
1
0
5
4
3
2
1
0
Income level
by Income Level (U. S.)
5.4
1963b
4.8
1970C
5.0
1974C
1963 1970 1974
aNCHS and CHAS-NORC estimates exclude inpatient visits. NCHS data includes talephone calls to physicians asvisits.
bNCHS, Series 10, No. 18, p. 13.
cNCHS, unpublished data.
31

Also, the main purpose of this exercise is to com-pare income groups over time and there is no ob-vious reason income groups should be effected dif-ferentially by the differences between the CHASand NCHS approaches.
me use-disability ratio computational formulaused in this paper is:lp
n mean MD;(loo) = (loo),
mean DDi; DDi
i=.1
where. MDi = number of physician visits in aspecified time period made byindividual i in a group of n per-sons
where DDi = number of disability days in aspecified time period by an indi-vidual i in a group of n persons
Chart 2 presents the use-disability ratios by in-come as calculated using both CHAS and NCHSdata. The issue of relative access according to in-come level looks quite different than it did in Chart1, where need was not take-n into account. TheCHAS results show the low income group to.havemany fewer visits given the disability they experi-enced in 1963 than did the higher income groups.By 1976 the gap had narrowed somewhat, but thehigher income groups still enjoy an advantage.These results indicate that while the poor now re-ceive more physia”an visits than the rest of thepopulation, they- also report much more disability,so that their ratio of visits to disability days is stilllower than the ratio for the rest of the population.
Again the comparative findings for NCHS inChart 2 show a pattern similar to that for CHAS.In each period the ratio is considerably lower forthe low income group than for the rest of the pop-ulation. While the shapes of the distribution aresimilar, as with Chart 1, there are differences be-tween the CHAS and NCHS results displayed inChart 2. The ratio values are generally of a lowermagnitude for NCHS than for CHAS because thereporting of disability days is considerably higher in
lzThis formula differs from that previously used inour Access Project, which included only people with disa-bility days in the calculations. See Lu Ann Aday op a-t.
The earlier formula was not used here because peoplewith disability days and physician visits could not be sepa-rated from those with no disability days and physician vis-its given the tables used for the NCHS calculations.
the NCHS study, presumably for the reasons givenabove. For example, in 1970 the average number ofdays per person was 15 according to NCHS and tenaccording to CHAS. Another general difference isthat the CHAS data suggest an overall lowering ofthe ratio over time for the country as a whole (i.e., areduction in access) not reflected in the NCHS data,Finally, the CHAS data suggest that the poor arebecoming more like the rest of the population overtime while the NCHS data suggest the differencehas remained relatively constant.
In sum, the inference from both sets of data isthat the low-income population has more thanachieved equity if physician visits alone are consid-ered. However, including a measure of healthstatus, disability days, suggests the poor are still re-ceiving fewer physician visits relative to their needthan the rest of the population.
Symptoms-Response Ratio
A limitation of the use-disability ratio is that,although it does provide us with information onhow the use of services relative to perceived needvaries in the population, it does not in itself permitnormative judgments of whether the level of accessto the sysiem is medically appropriate or not. Ifprofessional judgments are built into empirical indi-cators of the access concept then the indices them-selves can serve as yardsticks to chart the progressof the system toward improving access for thosemost in need of the services the system provides,The symptoms-response ratio is one attempt to con-struct such a need-based access index,
me symptoms-response ratio makes use of achecklist of 15 symptoms administered to all theCHAS samples and also to the Swedish sample of1963.1s For each of the 15 symptoms, people wereasked whether or not they experienced the symp-toms during the survey year and, if the symptomwas reported, whether or not a doctor was seenabout it. In addition, a panel of 40 doctors from theteaching faculty of the University of Chicago Schoolof Medicine was asked in 1972 to estimate, based ontheir training and experience, what percentage ofthe people in age groups 1-5, 6-15, 16-44, 45-64and 65 and over should see a physician for a givensymptom. T’he symptom-response ratio is based onthe difference between the actual number of symp-toms for which a visit to the doctor was made andthe physician estimates of the number of peoplewith the symptom who should have seen the decor
lsFor a ]ist of the specific symptoms included seeRonald Andersen and Bjorn Smedby, “Changes in Re-sponse to Symptoms of Illness in the United States andSweden: Inquiry 12, June 1975, pp. 116-127,
32

Chart 2. PHYSICIAN VISITSa/l OO DISABILITY DAYS BY INCOME LEVEL (U.S.)
Physician visits
per 100 disabilitydays per year
INCOME LEVEL
_ Low “
~~~ Middle
~-j High
m Total
4236
39
NCHS
Income level
1963b’c 1970d 1974d
Physician visitsper 100 disabilitydays per year
CHAS-NORC
Income level
78
60
47
.
1963 1970 1976
aNCHS and CHAS-NORC estimates exclude inpatient visits. NCHS data includes telephone callsto hysicians as visits.
ENCHS, Series 10, No. 18, p. 13.CNCHS, Series 10, No. 24, pp. 28-29.
‘NCHS, unpublished data.

TABLE 1. INCOME LEVEL
The income level variable for CHAS-NORC, NCHS and Sweden data shown in Charts 1, 2, and 3 was con-structed as follows:
YEAR LOW MIDDLE HIGH
Family Family Family
Income % Income % Income %
CHAS-NORC
1963 $0-3999 (25’%) $4000-6999 (32%) $ 7000+ (42%)1970a o-5999 (25%) 6000-10999 (33%) 11000+ (42%)1976 0-7999 (26%) 8000-14999 (34%) 15000+ (40%)
mb
1963 %$0-3999 (25%) - ~$4000- 6999 (33%) %$ 7000+ (42%)1970 ~ o-5499 (25%) ~ 5500- 9999 (33%) & lt)ooo+” (42%)1974 ~ O-6499 (25%) @ 6500-12999 (33%) ~ 13000+ (42%)
SWEDEN
1963 0-4999 kr (24%) 5000-19999 kr (44%) 20000+ kr (31%)
aIncome levels for the 1970 CHAS-NORCf igurea in-Cbsrt 3 (Symptoms-Response Ratio) differ from the distribution givenhere. The appropriate distribution for those estimates is:
(CHART 3)
LOW MIDDLE HIGHCHAS-NORC1970 $0-4999 (20%) $5000-12499 (47%) $12500 (33%)
~he population in NCHS income categories was combined into groups proportional to CHAS-NORC low, middle and highincome levels.
for that symptom.1~ The computational formulathen is,
symptoms-respoiise ratio = & (loo),
where
A = actual number of visits for symptomsE = M.D. estimates of number of visits there
“should be” for symptoms
Chart 3 shows the ratios by age group for thethree CHAS studies and the Swedish study. Chil-dren under 16 are omitted from the analysis be-cause the symptoms checklist was not included forSwedish children.
14DetaiIs concerning the development of the symp-toms-response ratio are found in D. Garth Taylor et aL,“A Social Indicator of Access to Medical Care: Journal ofHeaIti and Social Behavior 16, Spring 1975, pp. 39-49.
34
Chart 3 shows that in 1963 the poor of all agesin the U.S. had lower response ratios than other in-come groups (i.e., the actual number of visits werelower than the expected number of visits given the
SYmPtOmS experienced), In Sweden, with a morecomprehensive financing scheme, people were alsoseeing a doctor less often than judged appropriatein 1963; but, for those under 65, there was not theclear-cut relationship to income level found in theU. S.. However, for Swedes over 65 the highest in-come group was clearly more likely to see a doctorand, in fact, exceeded physician norms of appropri-ate response.
Chart 3 suggests that by 1970 the general re-sponse of the population was closer to that judgedappropriate by the physician panel. Further, therelationship between income and response was nolonger as clearly defined for those under 65,
By 1976 the lowest income group actually ap-peared to have the highest symptoms-response ratio

Chart 3. Actual Physician Contacts as a Percent of “Appropriate” Physician Contacts iii Response to Symptomsof Illness (The Symptom-Response Ratio) by Age and Income Level
Actual contactsas a percentof “appropriate”contacts
SWEDEN1963a
Income Level
U.S. 1963(CHAS-NORC)
Income Level
Us. 1970a(CHAS-NORC)
Income Level
U.S. 1976(CHAS-NORC)
AGE 16-44
%20
10
Fot——— ——— ——— —-.
-7
-20 ~LM H
20
10 [
AGE 45-64
— ——.—— .—— —
:E-k-L M H L MH
20 r r *13
AGE OVER 65
+15
-1-—————-Is - /0
I I I
L MH
F———————--~M H
I/ +IA+2
——— ——— .-
— -7
I I I I
L MH
I +7
——— —.— — ———
tI I 1 I
L M HIncome Level
aAndersen, Ronald and Smedby, Bjom, “Changes in Response to Symptoms of Illness in the United Statesand Sweden,” INQUIRY, Vol. XII, No. 2, pp. 116-127.
35

in the 45-64 age group. For those 65 and over, allincome groups exceeded the appropriate response,but, as in the previous surveys, the response ratioincreased with increasing income.
In sum, Chart 3 suggests that the poor and theaged in the U.S. have become more responsive tosymptoms of illness over time and have improvedtheir position relative to the rest “of the populationwith regard to access. In fact, the aged, particularlythe high income aged, were seeing the M.D. moreoften than judged appropriate by our panel of phy-sicians in 19’76. The current access of the poor thenappears to be somewhat better according to thesymptom-response ratio than was indicated by theuse-disability ratio. Of course, both suggest the poorare in a less favorable-position than does the simplephysician-use measure. These variations suggest theimportance of using multiple indicators when possi-ble rather than relying on a single measure.
Conclusion
I have suggested that healti status indices arenecessary to refine our measure of access to medicalcare. Using data from a series of national studies,examples are provided of how health status mightbe incorporated to monitor and analyze change inaccess according to income level. A simple indicator,mean number of physician visits, suggests that be-tween 1963 and 1976 the poor improved their posi-tion relative to the rest of the population and, in-deed, currently enjoy the highest level of access.However, a second measure which incorporatesamount of disability experienced, the use-disability
ratio, suggests that the poor may still receive lesscare relative to their need than the rest of thepopulation. A third measure of access, the symp-toms-response ratio, suggests how norms of appro-priate behavior might be incorporated into an ac-cess measure. This measure enjoys the advantage ofsuggesting which groups in the population might beoverutilizers of service as well as those that lackappropriate access.
While the data presented in this paper camefrom national surveys, the results have relevancefor planning and analysis at the State and local levelas well. The kind of information collected here canbe collected at the local level using social surveytechniques in a short period of time and withoutexcessive expense once the appropriate technologyis implemented.ls It is also possible to make infer-ences for local communities from data collected onlarger areas.lG Certainly at both the local and re-gional as well as national levels it appears that in-formed planning for improved access to medicalcare will necessarily involve a health status compo-nent.
15For examples of such approaches see: Health Serv-ices Research and Training Program, HeaJth Services DataSystem: The Family Health Survey, Lafayette, Indiana:Health Services Research and Training Program, PurdueUniversity 1972.
160din w. Anderson and Joanna ~~o~, Hea~~~ Serv-
icesin the Chicago Area, Research Series #26. Cetster forHealth Administration Studies, University of Chicago,1968, and National Center for Health Statistics, SyntheticState Estimates of Disability, PHS Publication No. 1759,Washington, D. C.: U.S. Government Printing Office, 1968.
36

VARIATIONS AMONG ORGANIZATION OF STATISTICALCCDVICES FOR PLANNING, MANAGEMENT AND EVALUATION:
SOUTH CAROLINA
Mr. Walter P. Bailey, Director,Columbia, South Carolina
Introduction
EXPERIENCE
Management Information Systems, Office of the Governor,
The Office of the Governor, Division of Healthand Social Development, serves as staff to the SouthCarolina’ Health and Social Development Council,The State Health Coordinating Council, and theTitle XX Human Services Advisory Council. ThisCouncil approach to coordinating the health andsocial services delivery system has not always beenthe case in South Carolina.
In 1973, the Human Service Delivery Systemhad grown to include 665 State and Substate com-ponents. Each of these programs had been de-signed to respond to a specific need; and as a resulteach program was competing in the budgetary pro-cess for available funds, both Federal and State.Further, citizens, as is their right, expected electedofficials to be accountable for both services andfunds even though these officials often lacked suffi-cient information, practical authority, and themeans to:
1) Assess current needs2) Plan for the future3) Establish priorities4) Evaluate the effectiveness of programs5) Implement sound management practices,
and6) Combine similar programs to achieve better
quality at reduced costsIn 19’73, Former Governor John West created,
by Executive Order, the Health Policy Council andthe Social Development Council to fill these voidsthat existed among the numerous State agenciesoffering or administering health and social servicesin the State. By July of 19’74 the separation ofHealth and Social Services planning was recognizedas unfeasible, since a majority of health planningissues involve social services alternatives. F?r exam-ple, nursing home bed expansion is related to theavailability of meals on-wheels programs, or adultday care centers. Thus the merging of the twocouncils represented recognition of the premise thathealth and social developmental services must” becoordinated to insure the maximum benefit fromthe same funds or fewer, inflated dollars.
The existing South Carolina Health and SocialCouncil has proved to be a viable alternative to thecreation of a human resources agency, in that, thecouncil concept promotes accountability coupledwith coordination,
The Division of Health and Social Develop-ment, as staff to the South Carolina Health and So-cial Development Council has established a mechan-ism through which human resources data is gath-ered, utilized, and disseminated through SouthCarolina. The Management Support Systems Sec-tion of the Division provides the Council with a staffof professionals in information systems planningand evaluation, systems development, and statistics.The major functions of the MSS Section have beensupported by Federal funds. The National Centerfor Health Statistics has funded four informationcomponents in the State. These components includehealth facilities, health manpower, vital statistics,and hospital care information. In addition to theseinformation systems, a health manpower education-al component, being built in conjunction with theCommission on Higher Education, and a smalllong-term care information system are also in-place.
The basic philosophy that has been employed inthe design and implementation of these systems isthat where quality information systems exist, theDivision will coordinate with and build upon thesesystems. Where no systems exist, the Division willeither build the system directly or subcontract itsdevelopment to the most appropriate agency, asso-ciation, or group. This philosophypromotes:
1) The development of quality information s~s-tems, responsive to the needs of multiple users
2) Feelings of cooperation among the numer-ous agencies or associations involved, without incit-ing fear of “takeover” or of “control” by govern-ment. The systems remain “in-house systems,” butare modified or supplemented to make them morecompatible with existing systems in other agenciesor groups.
3) This philosophy also promotes the develop-ment of a quality data system with a broad perspec-tive that can be augmented at a fraction of the costof duplicating or replacing “in-house systems,” intoto.
The Management Support System Section isengaged in securing hospital in-patient data, nurs-ing home financial and patient statistics, vital statis-tics, health manpower and health manpower train-ing statistics, and coordinating these systems so as toprovide a sound information base upon which cur-rent needs can be assessed, plans for the future canbe made, priorities can be established, programeffectiveness can be evaluated, sound management
37
practices can be implemented, and similar programscan be evaluated within agencies to determinewhether or not better programs could be offered bycombining or designing those currently being of-fered.
From this overview of the Division of Healthand Social Development, you can determine that weare stressing a decentralized approach to data-collection, but a centralized approach to the evalua-tion, interpretation, analysis, and dissemination ofintegrated data, necessary for health planning.” TheExecutive Branch of governmental structure inSouth Carolina is not particularly strong. This posi-tion is further complicated by having the first Re-publican Governor in office since the Reconstruc-tion Period. Any efforts to centralized health andsocial services information systems would have beenand will be met with strong opposition from legisla-tively controlled State agencies. Any successes thatwe have achieved in the development and imple-mentation of health information systems have beenthe result of recognizing the strengths and weak-nesses of the position from which we were operat-ing and attempting to benefit from both.
With this information as background, I wouldlike to discuss briefly the organizational structure ofthe Management Support Systems section and thecurrent areas of activity within the Section. TheMSS Systems is divided into four major sections:
1) Health and social manpower and facilities2) Health and social services3) Problem identification - needs assessment4) Funds flowThe Health Manpower and Facilities Division is
working on the implementation of information sys-tems for:
1) Health manpower, licensed and unlicensed2) Health facilities, inpatient, and eventually
outpatient, and3) Health educational training programs.In Health Manpower, as well as in the other
Divisions of the Office, the emphasis of these infor-mation systems development has been cooperativesystems - systems that are responsive vertically atthe Federal, State, and local levels, and systems thatare responsive horizontally among agencies, associa-tions, and groups at the Federal, State and locallevels. An example of this vertical and horizontalcooperation model is the pharmacy and physicianinformation systems being implemented in SouthCarolina.
The pharmacy information system is beingimplemented using the survey form as the reregis-tration application. The division performs the ad-ministrative services associated with the reregistra-tion (ie., forms design, printing, staffing, and mailingthe reregistration applications). The Board of Phar-maceutical Examiners, in return, allows the Division
38
to collect certain basic, comparable data on all of itslicensees and perform statistical analyses on thedata. Any publication of the data collected throughthe reregistration process bears the names of theBoard of Pharmaceutical Examiners and theDivision. Any release of statistical information iscleared through the board. We believe this sharedsystems approach to be most effective for all of thesystems that we are developing in South Carolina.
Further, the cooperation extends both horizon-tally and vertically. This form designed for the1976 reregistration of pharmacists includes thedata elements of the 1977 National Survey of Phar-macists. Not only is this system being built to meetthe needs of the State, but it is being built to meetnational association as well as governmental needs.A similar approach is being used in the develop-ment of the relicensure application for nurses,
The cooperative base of our manpower infor-mation systems development is approached from adifferent perspective in the physician informationsystem. Our philosophy has been that we shouldstrive to build information systems responsive to theneeds of multiple users. This concept is being sup-ported in a unique cooperative effort in South Car-olina between the Employment Security Commis-sion and the Division. We are experimenting withthe idea of using the reregistration of the physicianas a method to collect information on auxiliarymanpower employed within the office of the pri-vate practitioner. The last page of the physician li-censure form has been designed to conform withthe survey instrument used by the EmploymentSecurity Commission to gather auxiliary manpowerinformation from the private practitioner. The phy-sician reregistration was begun two weeks ago andthe results of the project will not be known untilmid-September.
I have mentioned these two examples to rein-force the observations that I made earlier and thoseare:
That we, in South Carolina, have experienced amargin of success in developing effective informa-tion systems in health manpower by utilizing a de-centralized method of data collection and a central-ized method of evaluation, interpretation and dis-semination, with essentially no legal mandate forthe collection of data, but an overwhelming amountof mutual confidence and respect;
That, in our position as (1) The agency to bedesignated the State Health Planning Agency and(2) being politically located within the Office of theGovernor, we have had the “prestige” of being con-sidered equal to a State Agency, but also have hadthe flexibility to be able to function in a coordina-tive, facilitative role without creating problems of“turf.” Our Division sponsors no programs, ownsno computer, keeps no tapes, has no data files, ter-

minals, or even keypunch machines. We are sur-
prisingly and admittedly a small staff. Our entireDivision, with six major areas of thrust, has only 62employees, and the Management Support SystemsSection has only eight full-time employees. Yet, weeither directly implement or supervise the imple-mentation of information systems whose collectiveexpenditures exceed one-half million dollars. TheMSS Section staff ‘is heavily oriented toward integra-tive systems analysis and theory. We are researcherslooking for new and better ways to design and im-plement quality information systems.
I would be foolish to give you the impressionthat in every information system that we have de-signed and implemented, we have met with greatsuccess, We have not, and we expect that some ofthe problems facing us will be difficult to solve be-cause we do not operate from a sector that can easi-ly mandate those things which are difficult to per-form through cooperative channels.
We are encouraged by the role that we see forourselves in the implementation of Public Law !33-641 in South Carolina. To insure tha~ the informa-tion needs of local planners in the four Health Sys-tems Agencies in South Carolina are being met tothe best of our abilities, the Management Support
Systems Section has established an Advisory Com-mittee on Data Use and Analysis. Each Health Sys-tems Agency will be represented along with thosepersons who are responsible for the designs of theinformation systems being developed and those al-ready in implementation. We believe that this “part-nership in the system” will encourage local plannersto utilize the systems as a basis for their health plan-ning responsibilities.
From this discussion, I have tried to give you aperspective of developing and implementing ahealth statistical organization in a small, southernState with an agricultural/textile economic orienta-tion, and a strong legislative branch of government.The routes taken in South Carolina to arrive atgoals which I am sure we all share are those whichwe believe were the best alternatives available to usin our political environment. This approach wouldnot necessarily be effective in other States with oth-er structural considerations.
I hope that these general remarks and thisoverview of the Division of Health and Social De-velopment has provided some ideas that you may
be able to explore within the constraints of yourown governmental structures.
39229-121 0 -77-4

CHART 1GOVERNOR
x
I/ LEGISLATURE
/ 1
BUDGETANDCONTROL BOARD STATE AGENCYLEGISLATIVE MEMBERSHIP BUDGETAPPROVALCHAIREDBY GOVERNOR**
t \ ‘\$%.
HI
DIVISION OF HEALTHAND
SOCIAL DEVELOPMENT
RESPONSIBILITIES:
BROAD PLANNING AND COORDINATIONIN THE HEALTH AND SOCIAL SERVICESFIELD.
* STATE AGENCY BOARD MEMBERSHIPRECOMMENDED BY THE GOVERNOR UPONTHE ADVISE AND CONSENT OF THELEGISLATURE
● ☛ DEVELOPS THE STATE BUDGET ANDPRESENTS TO THE STATE LEGISLATURE .
40

CHART II
ml/“~//
SOUTH CAROLINAHEALTH AND SOCIAL
DEVELOPMENTCOUNCIL
DIVISION OF HEALTH
TITLE XX IADVISORY IuCOUNCIL
i:
P
ilHSAS
i
i
i
i
1,
OFFICE OF HEALTHPLANNING ANDDEVELOPMENT
OFFICE OF MGMT.SUPPORT SYSTEMS
I
LEGEND ADMINISTRATIVE
● — STAFF SUPPORT
‘— ‘— — – - ADVISORY
41
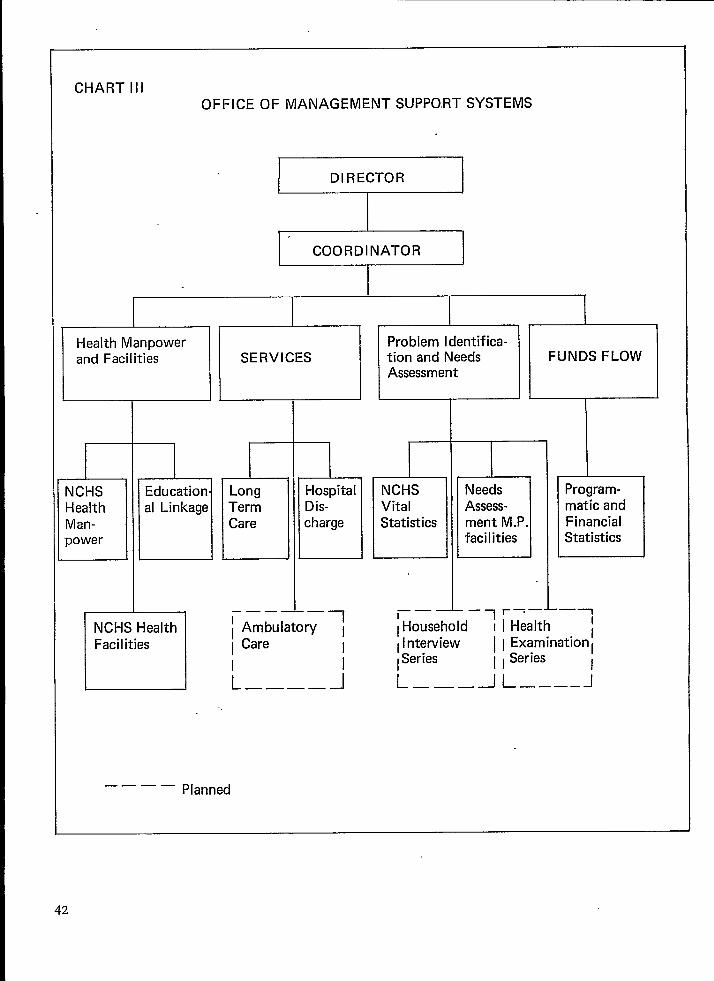
CHART IllOFFICE OF MANAGEMENT SUPPO.RT SYSTEMS
DIRECTOR
COORDINATOR
I
—— —.Planned
42

AUXILIARY PERSONNEL EMPLOYEO WITHIN THE PRIVATE OFFICE OF A PHYSICIANTHE FOLLOWING QUESTIONS ARE TO BE ANSWEREO~ IF:
CHART IV
1) YOUR PROFESSIONAL PRACTICE 1S CONOUCTEO FROM A PRIVATE OFFICE WHERE YOU OR YOUR PARTNERS EMPLOY AUXILIARY PERSONNEL TO ASSISTYOU IN THE PRACTICE OF MEOICINE, ANO
2) THE PERSONNEL YOU ARE REPORTING WERE INCLUOEO ON YOUR OFFICE PAYROLL FOR THE WEEK OF APRIL 12, 1976.
RECOGNIZING THE NUMEROUS sURVEYS, QUESTIONNAIRES, ANO QUERIES AOORESSEO TO THE PHYSICIAN EACH YEAR, THE OFFICE OF THE GOVERNOR, THE MEOI-CAL EXAMINING BOARO, ANO THE EMPLOYMENT SECURITY CO~ISSION ARE WORKING TOGETHER TO COLLECT OATA THROUGH ONE SYSTEM ON THE NUMBER ANOTYPES OF AUXILIARY MANPOMER EMPLOYEO WITHIN THE HEALTH PRACTITIONER’S OFFICE. YOUR ASSISTANCE IN THE COMPLETION OF THIS SECTION OF THESURVEY QUESTIONNAIRE WILL PROVIDE VALUABLE TRAINING INFORMATION TO OUR SCHOOLS, COLLEGES, UNIVERSITIES, AS WELL AS IMPROVE THE OATA BASEUTILIZEO BY THE DEPARTMENT OF LABOR FOR PROJECTING MNPOWER NEEOS.
1. lNOICATE THE TOTAL EMPLOYMENT OF YOUR OFFICE. THIS NUMBER SHOULO INCLUOE ALL FULL-TIME, PART-TIME, ANO APPRENTICE EMPLOYEES ONYOUR PAYROLL ~APRIL 12, 1976 ANO SHOULO REPRESENT THE SUM OF ALL TYPES OF EMPLOYMENT LISTEO IN QUESTIONS 2 ANO 3.
TOTAL UNIT EMPLOYMENT
‘2, ENTER THE TOTAL NUMBER OF WORKERS YOU EMPLOY IN EACH OF THE FOLLOWING LISTEO OCCUPATIONS. SEE THE ACCOMPANYING SHEET FOR OEFINI-TIONS OF THESE OCCUPATIONS. 00 NOT INCLUOE YOURSELF, YOUR PARTNER(S), OR ANY UNPAIO FAMILY MEMBERS. PLACE A ZERO IN THE APPR13-PRIATE BOX IF YOU 00 NOT EMPLOY A WORKER IN THAT OCCUPATION.
FOR COOING FOR COOINGUSE ONLY OCCUPATIONS TOTAL NUPBER USE ONLY
(06/11) 10000 ~NAGERS ANO OFFICERS----------- 55069
OCCUPATIONS TOTAL NUMBER
i
O~TICIAN------------------------
CASHIER.........................
lNSURANCE CLERK-----------------
SWITCHBOARD OPERATOR------------
RECEPTIONIST--------------------
SWITCHBOARD OPERATOR-RECEPTIONIST
SECRETARY------------------------
TYPIST---------------------------
FILE CLERK-----------------------
BOOKKEEPER, HANO-----------------
BOOKKEEPING AND BILLINGWACHINE OPEMTOR ---------------
Moo-----------------------------
JANITOR--------------------------
PHYsICIAW ANOIOR SURGEON--------
PHYSICIANIS Assistant -----------
MEOICAL ASSISTANT---------------
REGISTERED NURSE----------------
LICENSEO PRACTICAL NURSE--------
PHYsICAL THEWPIST.----..-------
CORRECTIVE THERAPIST------------
INHALATI~N Therapist------------
MEOICAL LABORATORY TECHNOLOGIST-
~OICAL LAROWTORY ASSISTANT----
X-RAY TECHNICIAN----------------
ELECTROCARDIOGRAPHTECHNICIAN.-. I
61314
6134B34016
44081
25457
34013
2546B
25541
25S42
35002
35010
34036
35011
61376
61361
61377
61368
61392
61330
61307
61103
41003
41900
3, PLEASE LIST THE OCCUPATION(S) ANO NUMBER OF ANY EMPLOYEE(S) NOT 0ESCR18E0 IN THE PRECEOING LIST.
OCCUPATION TOTAL NUMBER OCCUPATION TOTAL NUMBER
m
m m
4, IN OROERTO PREVENT DUPLICATION OF THE NUMBERS OF WORKERS EMPLOYEO IN PARTNERSHIP OFFICES, PLEASE IHOICATE THE NAWE(S) OF YOURPARTNER(S), IF APPROPRIATE.
(09/11)LIST OF OESIGNATEO SPECIALTY COOES
Ail ~e;ce Medicine
IN AnesthesiologyBE Broncho-EsophagologyCO Cardiovascular Oiseaseso OerinatologyOIA DiabetesOPV Oiseases, Peripheral vascular*EM Emergency MedicineENO Endocrinology
NTR08SOBGOMONOPHOTOTLOTOPTHACC
NutritionObstetricsObstetrics and GynecologyOccupational MedicineOncologyOphthalmologyOtolOgyOtoTargyngologyOtorhinol.sryngologyPathologyPathology, Anatomic, Clinicaland Cytopathology*Pathology, ClinicalPathology, ForensicPediatricsPediatrics, AllergyPediatrics, CardiologyPharmacology, ClinicalPhysical Medicine and RehabilitationPrOctOlog~Psychiatry
RHIROESCLABsCosCRSGS
[:sNS
ORSPosPvsPsTSTRSuUR
RhinologyRoentgenology*Sclerotherapy*Surgery, AbdominalSurgery, CardiovascularSurgery, Colon and Rectal -Surgery, GeneralSurgery, HandSurgery, Head and NeckSurgery, Neurological
FPGE
:;MGERGYNHEMHYP[G10
Family PracticeGastroenterologyGeneral PracticeGeneral Preventive MedicineGeriatricsGynecologyHmatology
Surgery,Surgery,Surgery,Surgery,Surgery,Surgery,Surgery,Urology+
OrthopedicPediatricPeripheralPlasticThoracicTraumaticUrological
CLPFOPPoPoAPocPAPMPRCP
CHPPYAPYMPHPuoRORPORTRRHU
vascular*
Hypnosis--ImnunologyInfectious Oiseases * Osteopathic Specialties
In addition to the above specialtiesthe following designations are also used::!R
LMNONEPN
Internal MedicineLaryngologyLegal MedicineNeoplastic OiseasesNephrologyNeurologyNeurology, ChildNeuropathologyNeuropsychiatry*Nuclear Medicine
Psychiatry, ChildPsychoanalysisPsychosomatic MedicinePublic HealthPulmonary OiseasesRadiologyRadiology, DiagnosticRadiology, PediatricRadiology, TherapeuticRheumatology
OS Other, i.e., physician designated aspecialty other than those appearingabove.
iliN
NANPNM
US Unspecified, i.e., physician did notspecify a specialty
43

ORGANIZATION OF STATISTICAL SERVICES: THECONSORTIUM ALTERNATIVE
James P. Cooney,’ Jr., Ph.D., Chief Executive Officer, Rhode Island Health ServicesResearch, Inc., Providence, Rhode Island
- The straw I’ve drawn for this session is a dis-cussion of the statistical organizational form classi-fied as private, not-for-profit consortium.
A consortium has been termed the most fragileorganizational form invented by man, and it is. It isa continuing mariagement challenge. But I discov-ered, in preparing for this session, it is easier todirect the organization than to describe it. As a con-sequence we probably will tell you more about cer-tain aspects of the consortium than you really wantto know and notilng about certain aspects that youreally wanted to know.
Basically, the following points will be men-tioned:
1. Consortium as an optional response to dataneeds
2. Overview of the Rhode Island corporation:Organization/Purpose/Functions .
3. The consortium membership: some observa-tions
4. The corporation’s data bases and their uses5. Financing6. Data Use
1. Introduction
I would suspect many of us who frequently at-tend the blennuaf conferences use their occurrenceas benchmarks for measuring progress in the areaof health statistics and, if not progress, at least someother type of change.
The subject of this session is viewed as some-what of a benchmark as the substance “organizationof statistical services” we will be individually andcollectively discussing is not new to the biennualconference. As example, the 1968 conference of-fered the first formal discussion of the cooperativeorganization of statistical services among geopoliti-cal areas. The 1974 meeting basically devoted itsentire program to the cooperative organization wenow term the Cooperative Health Statistics System.Given the vagaries of appropriations and increasing“other” statistical program demands at all geopoliti-cal levels, six years from discussion to at least em-bryonic operation is a remarkably short period oftime. Today, two years later, we have an active, ifsomewhat youthful state of operation, and are tak-ing another step: organization of statistical servicesto meet emerging operational needs of the planningprogram. Given the newness and somewhat tenuous
stage of some of our statistical program organiza-tions, broadening inter-program relationships couldbe viewed as rearranging the deck chairs on theTitanic. However, the emerging cooperation be-tween statistical organizations and programs reqttir-ing statistics for their operational needs is bothpractical and mutually beneficial in that it promoteseconomies of scale and activates a concept of reci-procity that has too long been absent, if not ig-nored, in our circles.
A concept, if not the concept, of cooperativehealth statistics system evolved around the theme ofconsortia. The system can be a mechanism for de-fining and meeting informational needs, both intra-and inter-geopolitical levels. Multiple health carerelated organizations share common data needs,Comparing across geopolitical levels, the same typesof organizations are always present (although theirnumbers vary) and the data needs are usually thesame. However, there is variation, comparing acrossgeopolitical levels, in terms of the multiple organi-zations’ perception of and responsiveness to com-mon informational needs, the quality of availabletechnical resources to meet the needs, the quantityof fiscal resources, and the organizations’ willing-ness to consort with each other about the “neutral”subject of data.
In our opinion, it is these variations in geopolh-ical area resources and attitudes rather than “al-leged” differences in data needs and organizationsthat have produced that spectrum of organizationalresponses to statistical services we see today, Theorganizational response I will be discussing is, inour view, a product of local chemistry as are theother organizational forms discussed today. It isnot, therefore, totally reproducible automatically inother settings without variation, It is one way toorganize statistical services—it is by no means theonly viable way. In fact, it is occasionally viewed bythe staff as no way to organize statistical services.
In the ensuing comments, two factors shouldbe kept in mind:
1. While the discussion uses as a frame of ref-erence one organization, certain comments havebeen qualified by observation of, other similar orevolving organizations.
2. The organization described is now enteringits seventh year of operation. It did not emerge inits present state fully organized from the head ofZeus/Board of Trustees. A process, and probably a
44
very necessary process, of evolution has occurred tobring us to today’s stage of operation. The bench-marks in this process are somewhat similar in timeto those previously cited in reference to the bien-nual conference. The data foundation around\vhich the consortium corporation was built beganin 1966 and gradually led with informational ex-pansion to formal incorporation in 1970. .The orga-nizational structure has remained lar~elv un-changed until this present year when a me”m~ershipexpansion occured and staff/Board relationshipswere slightly altered. The data bases and uses of thecorporation have been developed at various pointsacross the last decade and new bases and uses areon the drawing board for our next years (76-77)program.
Il. Overview: Organization/Purpose/Functions
In overview, Rhode Island Health Services Re-search, Inc. (SEARCH) is organizationally a private,not-for-profit corporation formed by a consortiumof eight State-based governmental and nongovern-mental health-related organizations and agencies.Membership in the corporation, as defined by theArticles of Association, is limited to: “Institutionalmembership from among the following: agencies ofthe United States Government, agencies of the gov-ernment of the State of Rhode Island, and nonbusi-ness corporations organized for educational, scien-tific, or charitable purposes including non-profitprofessional societies and associations.”
The purpose of the corporation as defined by~he Articles is: “operating the State Center forHealth Statistics, the conduct of studies, surveys,research or demonstration projects and other relat-ed activities designed to explore, encourage andevaluate various means of effecting improvementsand changes in the delivery of personal health serv-ices within Rhode Island which are professionallyand publicly acceptable; which result in the equita-ble and effective access to and distribution and pro-per utilization of public and private health services;and which lead to the increased effectiveness there-of ,“
Briefly stated the functions of the corporationare five:
1.
2.
3.
4.
To maintain the Rhode Island State Centerfor Health Statistics;To meet informational needs of health-re-lated organizations (including organizationswho are not corporation members and/orState-based); -Provide technical assistance to organizationsin health data collection and use;Conduct research and evaluation studies inapplied health delivery problems;
5. Serve as an ex~erimental laboratory for1
methodological studies.The preceding was intended to provide a gen-
eral reference framework on the total organization.Now we will examine selected pieces in detail.
Ill. The ConsortiumMembership
Shortly after the establishment of SEARCH, an ~editorial in a local paper lauded the organization’sformation as a “constructive and welcome develop-ment not only for its potential service to the com-munity but also as a mechanism for bringing to-gether diverse interests (represented by the found-ing consortium) for the public good.” The firstpoint—service—is relatively straightforward. Thesecond point—unifying mechanism—is somewhat asubtle but everpresent role of the organization.
The original consortium consisted of eightgroups:
1. From ,State Government- Rhode Island Department of Health- Rhode Island Department of Mental
Health, Retardation and Hospitals2. From Education
- Brown University (including its MedicalSchool and Department of Community.Medicine)
- Board of Regents for Education3. From the Nongovernmental Sector .
- Rhode Island Medical Society- Blue Cross/Blue Shield of Rhode Island- Hospital Association of Rhode Island- Health Planning Council
Several months ago a ninth group was namedto corporate membership (Rhode Island Profession-al Standards Review Organization). There is noHSA per se in the State. The Rhode Island Depart-ment of Health will perform the HSA-like funct]onsand, therefore, these programmatic responsibilitiesare represented in the consortium.
In terms of organizational governance (detailedthrough Articles of Association and corporate By-laws) each organizational member names annuallytwo representatives to the corporation’s Board ofTrustees. From this 18-person Board, officers andan Executive Committee are annually elected. TheBoard meets four times a year, and the ExecutiveCommittee meets as often as required in the inter-im between Board sessions, normally four times ayear.
In addition to the Executive Committee, twoBoard Committees are currently in operation: Per-sonnel and Finance, and Data Policy. An external(nonBoard member organization), the Professional
45

and Scientific Advisory Board is also in operationand maintains liaison with the Board.
Apart from structure and function, certain as-pects of the governing consortium should be noted:
1.
2.
3.
every organization represented in the con-sortium shares a common interest throughSEARCH: the need for data and technicalassistance in its use;it can be inferred from the organizationaldevelopment of SEARCH ‘that each consor-tium organization depends upon SEARCHfor a needed service or spectrum of services;through the mechanism of the consortium.the m-ember organizations both govern anduse the services of SEARCH.
By virtue of these characteristics, SEARCHprovides a neutral ground to all member organiza-tions for the purpose of data collection and uni-formity of analysis. Each organization throughSEARCH has access to a uniform fact base, al-though the interpretation of the fact base (not afunction of SEARCH) may vary among the organi-zations.
SEARCH provides to each organization of theconsortium technical assistance that might otherwisenot be available, such as collection methods, dataorganization for analytic purposes, and specialproblem analysis related to health care research andevaluation.
The smooth operation of the total consortiumdoes result in economy of scale by producing a sin-gle specialized technical resource rather than dupli-cative effort(s), providing an economy to both dataprovider and user; finally, and not necessarily face-tiously, an economy of debate focusing on interpre-tation of trends and patterns rather than debate
‘ over who has the “right” information.
SEARCH assists the members of the consor-tium both unilaterally and multilaterally. SEARCHis, at least in concept, part of each organization ofthe consortium and an extension of each organiza-tion. Consequently, the concept of reciprocity is theonly factor that makes the organization work.
Each member organization must give SEARCHa reason for function and SEARCH in return prov-ides to that organization: access to information andtechnical resources for use that didn’t exist beforethe development of SEARCH or access to improvedinformation and expanded technical resources;and equal and uniform data access among the organi-zations, economy of effort to the providers of infor-mation, and appropriate and controlled use of theinformation.
46
IV. The Data Bases/TheInformational Inputs
The SEARCH purpose and functions notwith-standing, the overall organizational objective is: tomaintain an informational resource relevant to thehealth status of the Rhode Island population. Inorder to accomplish the overall objective, the fol-Iowing subobjectives must be accomplished:
1. to identify, obtain, and maintain data ele-ments measuring the health status of thepopulation;
2. to develop and maintain the technical re-sources, including manpower, to collect anduse the data elements;
3. to develop and maintain an interface of bothnational and State data elements and techni-cal resources to preclude duplication ofeffort and to maximize information use ofeconomies of scale.
The types of raw data elements, their methodof collection and dissemination are central to anunderstanding of how (and why) SEARCH operatesand, therefore, these informational components andcertain characteristics will be briefly reviewed:
Data Sets
1. General Population - SociodemographicDescriptors/The Denominators● Data Source - U.S, Bureau of Census
and selected State-based organizationsand SEARCH-developed socioecon-omic status for each census tract
● Collection Period - Every ten years withan option for State-financed five-yearinterim collection
● SEARCH Collection Method - Second-ary, U.S. Bureau of the Census
● cost - a) collection - not currently
applicableb) storage and maintenance -
muItiple sourcesc) use - multiple sources
● Current Status - 1970 Data on SEARCHcomputer system
2. Vital Statistics● Data Source - Rhode Island Department
of Health. Collection Period - As the individual “vi-
tal” event occurs● Collection Method - Secondary, Depart-
ment of Health birth, death, marriage,and divorce certificates
● cost - a) collection - Depa~tment ofHealth

b) storage and maintenance -Department of Health andNational Center for HealthStatistics
c) use - multiple sources● SEARCHS access to and use of vital sta-
tistics data is made possible as a by-product of contractual service. Wemaintain the compu”ter dedicated vitalstatistics records and prepare fromthese files reports required by theDepartment of Health and the Na-tional Center for Health Statistics.This is a particularly effective relation-ship for many reasons and one that is,used as a model for SEARCH datainterfaces with other organizations.
Reasons:
a)
b)
c)
the” use of the data has alreadybeen demonstratedSEARCH is providing a neededservice and receives data as a by-productthe required outputs are defined inadvance and, ~herefore, can bescheduled over a long period oftime and economically produced
3. Noninstitutionalized General Population—Health Behavior, Costs, and Problems● Data Source - Sample of Rhode Island
households● Collection Period - Every three years● Collection Method - Primary, household
interviews● cost - a) collection (1975 survey) -
Department of Healthb) storage and maintenance -
Department of Healthc) use - multiple sources
● Current Status - 1975 survey completedand on computer files; initial analysiscompleted
● Long-range Plans - While the nexthousehold survey will not be fieldeduntil January of 1978, development ofthat survey instrument and fundingare beginning. Survey content areasand fund sources should be completedby the end of 1976. In 1977 surveydesign, sample selection and method-ology will be designed.
The household survey is an extremely valuableset of data to the consortium in that it contains the“only source of consumer health behavior needs andcosts information.
It is planned that the 1978 survey instrumentcontent and funding will be a cooperative effortamong a spectrum of State governmental and non-governmental health agencies and organizations,especially involving those of”special disease and spe-cial population focus.
4. Institutionalized General Population—Health Problems, Cost and TreatmentA. Community Hospital Inpatients
● Data Source - Commission for Pro-fessional and Hospital Activities(CPHA) discharge abstracts
● Collection Period - Month of indi-vidual discharge (For general ana-lytic purposes, grouped data arenot available until three monthsafter month of discharge)
● SEARCH Collection Method - Sec-ondary from CPHA on the basisof contractual agreement withparticipating hospitals and Regi-onal Service Center. SEARCH isunder contract to CPHA to serveas the New England RegionalService Center for CPHA hospi-tals.
● cost - a) collection - participatinghospitals
b) storage and mainte-nance - SEARCH
c) analysis - multiplesources
B. Other Inpatient Population(1) General Hospital (Long-term care/
acute care component)● Date Source - SEARCH Admis-
sion Discharge Abstract Sys-tem
● Collection Period - Month ofindividual admission and dis-charge
● SEARCH Collection Method -Primary, hospital patient re-cords. Data are processedback to hospital in quarterlyreports. Data are a by-productof service
● Cost - All elements funded byservice contract with theDepartment of MentalHealth, Retardation andHospitals
Plans under way to expand serv-ice to other long-term care units/noncommunity hospitals
47

5.
6.
(2) Nursing Homes● Data Source - Case abstract of
nursing home patients● Collection Period - Annual re-
view of individual nursinghomes
● SEARCH Collection Method -Primary, hospital patient re-cords and interviews conduct-ed by RIDH professionalteam. Data are processedback to RIDH and SRS onon ongoing basis. Data are aby-product of service
● Cost - All elements funded byservice contract witi RIDH
Healti Manpower● Data Source - Individual health profes-
sionals. ,Collection Period - Annual.“ SEARCH Collection Method - Mailed
survey with Department of Health li-censure application. The data, there-fore, are produced as a by-product ofan ongoing State program
● Cost -a) collection - contract with theNationaJ Center for Health Sta-tistics and subcontract to RhodeIsland Department of Health
b) s~orage and maintenance -same as a)
c) analysis - Department ofHealth supplemented bymultiple other sources
Healti Facilities .● Data Source - Individual health institu-
tions● Collection Period - Annual● SEARCH Collection Method -
(1) Community Hospitals
(2)
48
a) 1975 -’ Prim~ry, mailed surveywith Department of Health li-censure application
b) 1976 - Secondary, AHA’s an-nual survey of hospitals sup-plemented with Department ofHealth licensure application
c) 1977 - Interagency monthlyreports (Hospital Associationof Rhode Island, Blue Cross,Health Planning Council andRhode Island Department ofHealth)
Nursing Homes1975 and 1976- Primary, mailedsurvey with Department of Healthlicensure application -
(3) All Other1975 and 1976 - Primary, mailedsurvey
For (1) and (2) data are produced as aby-product of an ongoing State pro-gram
● cost - a) collection - National Centerfor Health Statistics
7. Heal& Expenditures●
●
●
●
D’ata Source - Multiple sources.
Collection Period - AnnualSEARCH Collection Method - Second-
ary, multiple sourcesCost - All categories - Department of
Health supp~emented ~y multiplesources
The preceding are the major systematic rawdata inputs to the organization. There are otherdata resources produced through special researchand evaluation studies, but not systematically availa-ble. There is one major gap area: ambulatory care,and this will be the major data development in thecoming year. The sets are separately collected butare linked through processing into communityhealth profiles.
In summary, in developing the informationalresources, existing systems and secondary sourceswere used as much as possible (e.g., CPHA), supple-mented when necessary (e.g., State facilities andmanpower licensure), directly developed only in theabsence of other alternatives (e.g., General Hospi-tal). Service contracts were the preferred method offunding since data use had already been defined;direct collection in the absence of defined use wasused only as a last resort.
V. The Staff
In addition to the objective of maintaining aninformation set, a supplemental objective requiresthe maintenance of the technical resources to collectand use/promote the use of the information,
A sufficient core professional staff is maintainedto accomplish the basic data collection and use ser-vices. The full-time component is supplemented asrequired by special projects through consultants,part-time assistance, or staff sharing with consortiumorganizations. The basic core full-time staff is ap-proximately 23 people: three senior management,six professional associates, four project support,four programmers, and six administrative support.
While the individual projects comprising theSEARCH program vary in subject, the methodolog-ical skills tend to be similar and, therefore, the pro-fessional associates are recruited for generalist skillsin methodology (collection, analysis, interpretation,

and dissemination). Full-time specialists are the ex-ception and when such skills are required, consul-tants normally are retained.
While there is a line organization, the smallstaff size, their generalist orientation, and the rangeand timing of projects require a matrix operationfor maximum effectiveness, team effort, variation inproject roles, and continual communication.
V1. Financing
Up to this point an organization, informationalinputs, and a staff’ have generally been described.The critical point remaining is how is the operationfinanced and can it remain viable.
The work of SEARCH covers a broad spectrumof activity and for the purpose of discussing financ-i~g, the activity has been subclassified into fourgenerally mutually exclusive areas:
1. Research or Evaluation
A contract to perform a specified task in a lim-ited period of time with no renewal or continuousfunding possibility. The contracts generally drawupon the technical assistance expertise of SEARCHstaff and the comprehensive information base of theorganization. However, they obviously do not pro-vide a service of a continual nature and are not sys-tematically available. They cannot be planned. far inadvance and, therefore, cannot be relied upon forcontinuous support of the organization.
2. Data Use
A request to provide varying amounts of infor-mation or technical assistance in a short period oftime and for little or no funding. These are actuallymore contacts than contracts, and come randomlyfrom a large number of organizations via phoneand letter. These data use requests are essential tothe nature of SEARCH, but cannot be relied uponto finance the organization over time.
3. Data Base Development
A contract to develop a portion of theSEARCH data base over a period of time. However,once the original task is accomplished, no renewal ispossible and funds are not provided for mainte-nance and use of the data base. While these con-tracts can be relied upon at least for “short-termfinancing, and are necessary to expand organiza-tional service capacity, once they end the organiza-tion has the problem of continuous funding formaintenance and use since the data are not pro-duced as a by-product of a service.
4.
A
Service Contracts
contract to provide a continuous service to.an organization. The provision of the service gener-ally expands and maintains components of theSEARCH data base as a by-product (e.g., Vital Sta-tistics, Medical Review, Governor’s Report onHealth, data support for PL 93-641). Contracts ofthis nature are the best and most logical long-termfinancial support for the organization since they arecontinuous, known in advance and can be sched-uled, have a defined data use application, and ex-,pand SEARCH information capacity. The majordisadvantage to these services is that while they arecontinuous, they are renewable annually, on a rela-tively short notice for long-range and financial plan-ning purposes.
Each of the four types has program and fiscaladvantages and disadvantages. In addition, they allhave problems of timing. As example, during thecurrent fiscal year we had 22 contracts: eleven < sixmonths, eleven 7-12 months, and one of 12 >months. . . an obvious personnel management and .fiscal problem. In addition, SEARCH operated on afee-for-service basis and had no core support mon-ies’ other than that generated through contractualoverhead. The source of funds was diversified: 24percent Federal, 61 percent State government and15 percent nongovernmental, but the nature of thecontracts were dangerously skewed towards re-search and evaluation with a minimal of fundingfor data base maintenance and use. Research andevaluation projects are necessary and keep a profes-sional core staff viable, but they do not necessarilykeep a SEARCH-like organization viable. In addi-tion to all of the above, cash flow problems areendemic. In fact, financing of these types of organi-zations is almost continuously problematic. Howev-er, there are solutions, at least temporary, and thebenefits accruing from the organization outweighthe problems of its management.
What Are the Solutions:
1. Core Funding - necessary to assure a bal-anced program, fund seed efforts, reduce/eliminatecash flow problem, provide a modest degree of in-dependence, incentive to staff.
Solution: 6% Research and DevelopmentFee added to every contract of$20,000 or more ‘
2. General Purpose Funding -permit data maintenance and systems(e.g., computer) and increase data
necessary todevelopmentuse services.
49

Aggressive marketing of services and need for sup-port. Nondedicated dollars inexchange for generaltechnical assistance/dollars for general systems de-velopment. General purpose funds for first timefrom Blue Cross and Hospital Association with anannual renewal, and system development supportfrom State. The amount of funding is adequate butnot lavish; it is not charity, and the psychologicalvalue is enormous.
3. Services in Lieu of Dollars
Services provided to corporation at a reducedrate/no cost. E.g., computer time, printing-espec-ially relevant to Universi~. members of consortium.
4. Aggressive development of a standard dataprogram balanced in time and areas of activity andminimal funding levels. Appears relatively simpleand logical, but requires considerable advance plan-ning and a long-range and sustained “sell” to poten-tial contractor(s).
Basically, the corporatiori’s support needs/pro-gram are identified for a several-year period andfunding is sought to meet those needs. This meth-od, as opposed to waiting for the vagaries of theRFP lottery, has proved in the short-run more suc-cessful. Basically, this is probably the result of fo-cusing on a forest rather than particular trees. Thetechnique of long-range planning appears for themoment to have worked. As example, at this timethe projected contractual revenue for the next fiscalyear will exceed $1,500,000, more than three timesthe income for this current year. The sources offunding are healthily distributed among multiple
organizations both within and outside the State.The time periods are well distributed: out of 21potential contracts, only two are less than sixmonths, 14 are for 7-12 months (eight renewabIeannually) and five are for 12+ months. In terms ofcontract types, the balance is again better-eight ofthe contracts are for research and evaluation, nineare service contracts, two are for data base develop-ment and hvo are dedicated to data use.
5. Sharing of Technical Resources/Services
Compared to many other States, the “healthdata producing and using population of Rhode Is-land is small. The consortium corporation is by andlarge economical. However, with no major changein present program normal inflationary increases inthe next five years will place the cost of the corpo-
ration’s base core and services over $1,000,000-this is a large amount for a small State’s data eitherfor local or national users. The most effective devel-opmental move, therefore, would be cooperativeefforts with other State-based data organizations-cooperation not in the formal macro-organizationalsense, but at the technical services level, Basically,what one cannot alone sustain, several together maysustain. We have begun exploratory efforts in thisdirection.
The problems of funding a consortium for sta-tistical services will never totally disappear, Despitealternative funding mechanisms, constant mainte-nance is required as it is with any type of organiza-tion for statistical services. The absolute precondi-tion for continuance of program and necessaryfunding is useful service. The only reason our orga-nization exists, and will continue to exist, is to pro-vide a service. If a useful program of service is de-veloped, a concept of reciprocity will be createdamong provider and user that significantly increasesthe organization’s odds for survival.
Data Use
Data use, like funding, requires strong positiveefforts both to educate users as to availability andusability of data and to provide analyzed, if not in-terpreted, data. Because of funding problems, ourprogram has been conducted at a lower key thanrequired. However, the future activity will (andmust) increase.
Currently data use services (as previously de-fined, noncontractud) fall into three areas:
1. Providing special data analyses2. Providing technical assistance in methodol-
ogical/systems development3. Publications
In terms of activity level during the currentyear, we received approximately 170 requests fordata. Two-thirds of these were from within theState, the remainder from out of State, In terms oftype of requesting organizations, 43 percent werefrom State and local government; 26 percent werefrom nongovernmental health groups (associations,hospitals, clinics); 16 percent were from UniversityDepartments, faculty, students; 8 percent from theFederaI government; and 7 percent from otherrequesters. In terms of requests for technical assist-ance, well over 100 were received, almost three-fourths of these were from other State, regional,and national groups.
50
By policy of the Board and to preserve the in-tegrity of the State Center for Health Statistics, wedo not routinely release raw data either in lists ormachine readable form. Therefore, publications area systematic method through which analyzed dataare routinely placed in user hands. The corporationpublications fall into four areas:
1. SEARCH Report*Interpretative docu-ments produced from both special stud-ies and routine activities;
2. Profiles From the Health Statistics Center—Rapid dissemination of analyzed dataseries; a mechanism for the release ofbaseline statistics on facilities, manpower,long-term care, health expenditures,acute care, health interview survey data,and community health profiles;
3. SEARCH Abstract+Capsule view of organi-
zation’s products, projects, and publica-tions; designed for a general public anda subset of readers who may not be in-clined to read in detail;
4. Special Studies/Papers
In summary, a consortium can be a logical andeffective option for statistical services. It has bothadvantages and disadvantages as do all other orga-nizational” forms. The choice is which form is themost cost-beneficial, not of whether to provide ser-vice or not. That option fortunately no longer exists.
Whatever form is selected, the basis of exist-ence to serve must never be forgotten and the con-cept of reciprocal relationships must be pursuedand defended at all costs. Our problem in the endis a simple one: motivating the person to do his/herjob in the most effective/economical/imaginativemanner. That’s all there is to it.
51

Figure 1. FUNDS FLOW PATTERN OF RHODE ISLAND HEALTH EXPENDITURES
PublicHospitalsandHealthPrograms n ~‘
PublicInsurance Out-of-pocketPrograms Expenditures
I I 1
I I I I I1
philanthropyandIn-plantHealthPrograms
1 . . +Personal Health Services: mode Island
PrivateNonprofitandCommercialInsurance
J
I Hospital Servicest-
Dentist Services’
I Drugs and Sundriest-
Nursing Home Services
I Government Public Health
t
-1 physician Services
Eyeglasses and Appliances
I
-i
Third-party Administration I
iOther Health Services
52,

II , VARIATIONS AMONG ORGANIZATION OF STATISTICAL
SERVICES FOR PLANNING, MANAGEMENT AND EVALUATION:THE COOPERATIVE HEALTH INFORMATION CENTER OFVERMONT EXPERIENCE
Mr. Jonathan B. Stevens, Assistant Director. Cooperative Health Information Center ofVermont, Inc., Burlington, Vermont - ‘
My purpose is to provide some backgroundinformation on the Cooperative Health InformationCenter of Vermont (CHICV), then to deal withwhat is unique about the arrangement in Vermont,and also to address the questions: Can CHICV
work elsewhere, and is it worth it?
“LThe Cooperative Health Information Center isa private, non-profit health statistics center serving aState of approximately half a million people, a rela-tively homogeneous State, wholly rural, with what willprobably be a single health systems agency servingthe whole Sfate. CHICV is primarily a processor of’hospital discharge abstract information, merging it
‘with popdation data and manpower and facilitiesdata to provide population-based rates for utilizationof hospitals and other indices. We cover all hospitalsin Vermont, and record about 70,000 discharges peryear, It is important to remember that CHICV is nota provider or consumer, or a regulator, legislator,planner; nor, for that matter, a profit-maker!
The concept of the Center sprang from theminds of Kerr White and others in the mid to latesixties. It was realized bv the Retional Medical Pro-gram in the State, and ~fter quiz a number of pol-itical battles and Indian raids, it was decided thatthe Center should be established inde~endent ofany particular agency. Thus, the cooperativeHealth Information Center of Vermont was born,with initial funding from a three-year grant fromthe National Center for Health Statistics under theCooperative Health Statistics System. The firstdirector at CHICV was Tack Wennber~, who isspeaking elsewhere at the conference, anti” who val-iantly fought many of’ the pitched battles inCHICV’S formation. Our second director “was AlanGlttelsohn, who is also here this week in St. Louis,who was at CHICV on leave from Johns Hopkinsfor a year or so and who wrote CHICV’S peculiarstatistical program, CHOMPS, among other accom-plishments. I would refer you to Dr. Gittelsohn forfurther elucidation on that ~ro~ram. We are work-
.“
ing now on expanding our data base to include costinformation, ambulatory care data and, ~erha~s,long-term care data, none of which is ava{la~le ye;.
CHICV is governed by a Board of Directors,reference Exhibit 1. You will note that the State iswell represented by both providers and consumerson the Board, including the Hon. Deane C. Davis, aformer governor of the State, responsible forstreamlining State administration into “superagen-ties.” William Gilbert, formerly chairrpan of thePublic Service Board, is a prominefit local attorn;yspecializing in energy. Another notable is BetsySamuelson, a former aide to Vermont’s SenatorAiken. You will note, furthermore, that this is not aconsortium board, it is rather a representativeboard, with a certain number of seats allotted torepresentatives of the public. On the other hand, asyou know, a consortium board comprises only thoseagencies which are directly involved in the consor-tium. I would refer to the Board of the Rhode Is-land Health Services Research, as an example of aconsortium board.
Exhibit 2 presents the staffing pattern atCHICV. You’ll note we have a very small staff anda very technical staff, although the technicalities aremore computer-oriented than health resear$h spe-cialty-oriented, for which we count heavily on ourconsultants. Our data is also ‘used for special pro-jects elsewhere, such as at Harvard, Dartmouth andother sites. Students have” access to the data by spe-cial permission. The Burlington, Vermont area isvery rich in health-related resources upon whichCHICV can draw, including, but not limited to, thefollowing: the University of Vermont MedicalSchool and Departments of Sociology, Economicsand Education, and the University’s Xerox Sigma 6computer, on which we share time. The HealthDepartment’s vital statistics component is located inBurlington. The Vermont PSRO is not far away, asis the Vermont Nursing Association. The VermontHospital Association is just down the road in Mont-pelier, the State capitol. There are numerous otherresources in the area upon which CHICV can anddoes draw for assistance. In addition, CHICV isadvised by a standing committee of the Boardcalled the Standing Committee on Data Use. (Exhib-it 3) This group is mandated in the CHICV By-Laws; you will note that this committee has repre-sentation from most of the larger users of CHICVdata. This structure differs widely from the consor-
.
53

Exhibit 1
COOPEWTIVE HEALTH INFORMATION CENTER OF VERMONT, INC.
Board of Directors
Robert Aiken, M.D.Professional StandardsShelburne, Vermont
The Honorable Deane C.Montpelier, Vermont
William Gilbert
ProviderReview Organization
Davis Public
PublicGilbert, Laundon, and MelloBurlington, Vermont
Beverly O’Neill, R.N. ProviderWestford, Vermont
Betsy Samuelson PublicWashington, D.C.
Hiram S. Hunn PublicPlainfield, Vermont
John C. Lantman, M.D. “ ProviderThomas Chittenden Health Care CenterWilliston, Vermont
Sam Shapiro PublicHealth Sezvices Research and Development CenterJohns Hopkins Medical InstituteBaltimore, Maryland
Paul BetzEssex Junction, Vermont
Thomas DavisAgency of Human ServicesMontpelier, Vermont
William FrenchStowe, Vermont
.Douglas KitchelPassumpsic, Vermont
Richards ManuelKerbs Memorial HospitalSt. Albans, Vermont 05478
Public
Provider
Public
Public
Provider
54

Exhibit 2
COOPERATIVE HEALTH INFORMATION CENTER OF VERMONT, INC.
Table of Organization
[ Board of Directors
IFrank C. Dorseyr Ph. D., Technical Director
1
I——— ——— ——.— - —,,
Jonathan B. Stevens, M.P.H.Business Manager
Rita O. Zablocki,Office Manager
Patricia A. WinotSecretary
John H. Senning,Mar. for Technical Operations
Roger Gillim,Systems Programmer
David E. Herr,Research Associate
Patricia K. Hickcox,Technical Coordinator,Data Services
Vaughn Petraglia,Computer Programmer
Nancy T. Post, M.A.Statistical Analyst(On Leave of Absence)
Until 3/76
Daniel Sullivan, Ph.D.Statistical Analyst
Floyd J. Flowler, Ph.D.Consultant
Alan M. Gittelsohn, Ph.D.Consu Itant
Jennifer Robbins,Consultant
Frederick Schmidt, Ph.D.Consultant
John E. Wennbergr M.D.Consultant
229-121 0 - 77 - 5
55

EXHIBIT 3
COOPEWTIVE HEALTH INFORMATION CENTER OF VERMONT, INC.
Standing Committee on Data Use
Members
Robert Aiken, M.D.Executive DirectorProfessional Standards Review
Organization
Roy Buttles, M.D.Central Vermont Medical Center
Walter Cooley, DirectorPublic Health StatisticsVermont Department of Health
Aaron Fuchs, DirectorComprehensive Health Planning
Gwen GoldbergRehabilitation Research & Plan-
ning Specialist.Alcohol and Drug Abuse Division
J. Churchill HindesAssociate DirectorVermont Lung Center
John Lantman, M.D.Thomas Chittenden Health Care
Center
The Reverend John NuttingVermont Ecumenical Council
Thomas Rees, AdministratorPorter Hospital
Frederick C. Schmidt, Ph.D.Department of SociologyUniversity of Vermont
Rep’res“enting
CHICV Board
State Medical Society
State Health Department
Comprehensive Health Planning
Vermont Alcohol & Drug AbuseDivision
Vermont ‘Lung Center
CHICV Board
Vermont Ecumenical Council
Vermont Hospital Association
University of Vermont
56
tium structure in that, here the users and the gov-ernors at CHICV are clearly differentiated.
I would also briefly describe the data base avail-able at CHICV. (Exhibit 4) You will see that thedata come from various sources, and are mergedtogether in various ways by CHICV. Some exam-ples are apparent at the bottom of Exhibit 4. Thesemerges are what really makes CHICV unique anduseful. I would refer you to Drs. Ghtelsohn andWennberg at this Conference for detailed technicalinformation on these files.
The next exhibit describes the CHICV publica-tions available. (Exhibh 5) These are self-explana~tory, although you will note that we have shiftedfrom large tomes to smaller, more manageable pre-. .sensations, and from tabular to graphic representa-tions. I would urge you to review the up-comingCHIGV Fact Sheet on influenza hospitalizationsover the past five years. And, parenthetically, if youare not on our mailing list, you should request to beincluded.
The next etilbit describes our funding sources.(Exhibit 6) You will note that we are very heavily de-pendent upon Federal sources for funds, somewherein the 85 to 95 percent range. This would contrast,perhaps, with the SEARCH funding profile, whichhas a greater share of State funds than does CHICV.Basically, Vermont is a poor State and really shouldnot be expected to offer much support to such a spe-cialized center as CHICV.
And, finally, Exhibit 7 gives a partial list ofusers of CHICV data. You will note that they comefrom all walks of life within the State, the regionand the country, and yet we still feel that, as far asusers are concerned, we are only on the surface—that this is only the tip of the iceberg. We are work-ing now-in fact, one of our contracts expresslyencourages us—to promote the use of CHICV datain new applications. We are convinced that graphicshold the key—that a picture is worti a thousandtables,
II. Secondly, I would like to discuss what isunique structurally about CHICV. It is basically thefact that CHICV is a private, nonprofit corporationthat does not have legislated authority. There ,arefour specific factors in this uniqueness:
1) Its dependence on outside funding. As Imentioned before, Vermont simply can’t beexpected to support CHICV to any greatextent.
2) The vohzntaristic atmosphere in Vermont,whereby the hospitals, the vital statisticiansand practically all of the providers and usersof data cooperate fully in both the provisionand use of the data. This we view as a veryimportant factor, for reasons explained be-low.
3)
4)
111.
The small size of the State and the numberof players—which is both an asset and a lia-bility, as I will review further on.The very credibility of the Center as insuredby its nonprofit status and non-govern-mental status. We feel we are nonpartisan,or multipartisan, and can provide data tosupport all angles of an issue—in fact, wemust provide data to all parties. Actually,our policy is to provide what we consider isthe best argument for each of the partiesconcerned.
Thirdly, I want to discuss the question ofwhether CHICV can work elsewhere.- CHICV’Sunanimous view is emphatically, YES. This is basedon all four of the factors previously mentioned.The first reason is that funding is continuing and
“expanding from the Feds, given that Federal spend-ing is increasing, not only on Federal cases but .~nmonitoring Federal cases. Secondly, the voluntarls-tic approach is the best local response, we feel, tothe creeping bureaucratic oversight from the Feder-al level or from the State level, and in Vermont; atany rate, the voluntarism is expanding just as thebureaucratic red tape expands. One thinks of thetheory of common enemies creating strange bedfel-10WS.Well, it works in Vermont.,
The size of the State and the number of play-”ers would encourage the exportability of theCHICV model, in that there are economies of scaleto such an operation and larger areas would indeedshow better economies, and larger-scale operationsin larger areas would presumably provide more andbetter vehicles for effective data use, as well.
The credibility of the agency is crucial to effec-tive data use. The voluntar~tic, no-nprofit model isseen to encourage and assure credibility of the data.One can envision a continuum between the State-mandated, statutorily sanctioned agency which en-sures the on-going provision of data, but on theother hand, is absolutely suspect in every user’s eyesin that it is a governmental arm. And, at the otherend of the spectrum is the CHICV model with noassurance of continued provision of data except bycommon. consent and voluntarism, but also withassured credib~lty due to its nonpartisan pr multi-partisan nature.
Finally, we would point out that, in fact, theCHICV exportability is already being demonstratedto some extent, in that Maine has developed a <atagroup which is actively considering the CHICVmodel.
IV. Fourthly, I would raise the question (andanswer it) of whether the CHICV experience is
worth it. Again, we all state emphatically, YES, It isworth it, according to various criteria. One, of
57.

EXHIBIT 4
HOSPITAL FILES CENSUS DATA
Xray Citizen/
. Laboratory InterviewerNurse/ /
Paw [ Jl Census Bureau
Medical Record Magnetic .Tape
+ +(Small Cells Eliminated)
l\Hospital Persomiel CHIVC Personnel
l\Mary Hitchcock Hosp.
Abstract Abstract ComDuter FileI
Y
CPHA
$Keypunch
i
.
/\
Optical Scanner Magnetic tape Magnetic tape of /\
PHYSICIAN DATA
MD-AMA Registry MD LicenseJ
Vt. Health Dept.$
Lists
‘aperLQ’c /
Tape
CHICVKeypunch
Magnetic Tape
PAS Error Check
-/ \
Vermont Residentsand correction
~!/
Magnetic TapeSingle Year Files
Magnetic Tape
“Raw” Patient Data I(Inc~ding Identifiers)
I “Time Dots” Files
1 *Subsets
5-Year File without ID’s
Disease SpecificSubsets /
‘m
\ 1968-1975
VITAL RECORDS r.—. .—,(not currently used):
Parents/Physician Physician/Family
4
Birth certificates Death Certtiicate
‘/Health Dept.Edit-Keypunch
‘ Divorces/Marriages 1
I
I II I
: I
II II II___ ——–J
3MD’sperCapita
MISCELLANEOUS
RN, LPN, Medtech,Labtech, ad otherHealth personpower
$—Magnetic tape
Hospitals,Clinics,Pharmacies,Labs., Etc,
-Magnetic tape
58
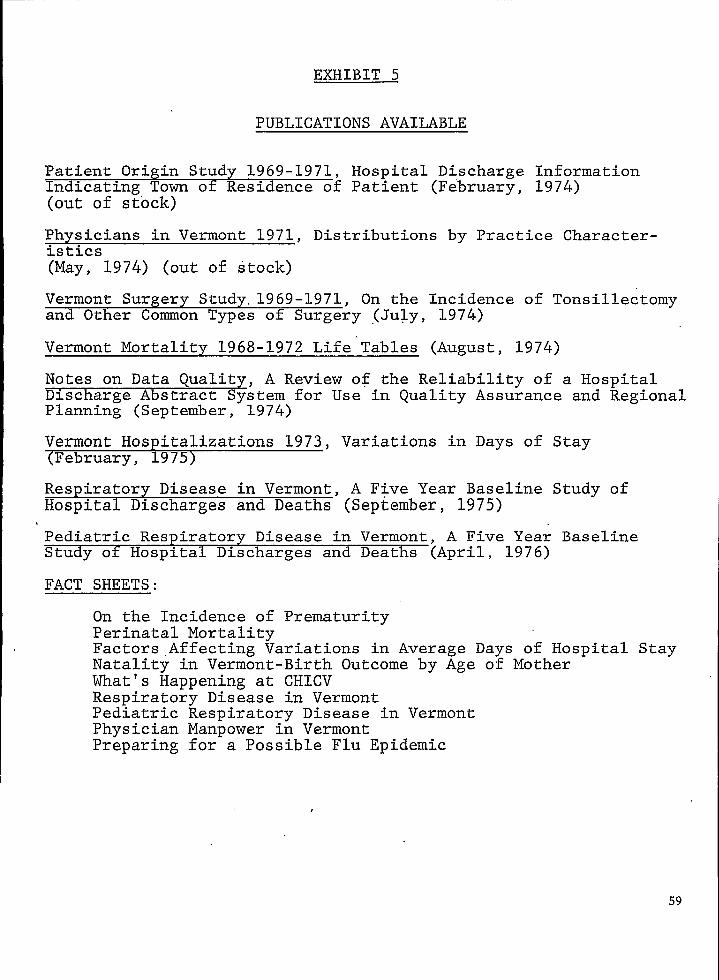
EXHIBIT 5
PUBLICATIONS AVAILABLE
Patient Origin Study 1969-1971, Hospital Discharge InformationIndicating Town ot Residence of Patient (February, 1974)(out of stock)
Physicians in Vermont 1971, Distributions by Practice Character-istics(May, 1974) (out of stock)
Vermont Surgery Study.1969-1971, On the Incidence of Tonsillectomyand Other Common Types of Surgery (July, 1974)
Vermont Mortality 1968-1972 Life”Tables (August, 1974)
Notes on Data Quality, A Review of the Reliability of a HospitalDischarge Abstract System for Use in Quality Assurance and RegionalPlanning (September, 1974)
Vermont Hospitalizations 1973, Variations in Days of Stay(February, 1975)
Respiratory Disease in Vermont, A Five Year Baseline Study ofHospital Discharges and Deaths (September, 1975)
Pediatric Respiratory Disease in Vermont, A Five Year BaselineStudy of Hospital Discharges and Deaths (April, 1976)
FACT SHEETS:
On the Incidence of PrematurityPerinatal MortalityFactors Affecting Variations in Average Days of Hospital StayNatality in Vermont-Birth Outcome by Age of MotherWhat’s Happening at CHICVRespiratory Disease in VermontPed~atricPhysicianPreparing
Respiratory Disease in VermontManpower in Vermontfor a Possible Flu Epidemic
59

EXHIBIT 6
COOPERATIVE HEALTH INFORMATION CENTER
SOURCES OF FUNDING
OF VERMONT, INC.
National Center for Health Ser’vicesResearch
National Center for Health Statistics
Vermont Lung-Center
University of Vermont-College of Medicine
Medical Center Hospital of Vermont
Vermont State Department of Health
Cooperative Health Information Center of Vermont
Vermont Lung Association
Maine Health Data Service
Comprehensive Health Planning
Vermont Professional Standards Review Organization
Miscellaneous
60
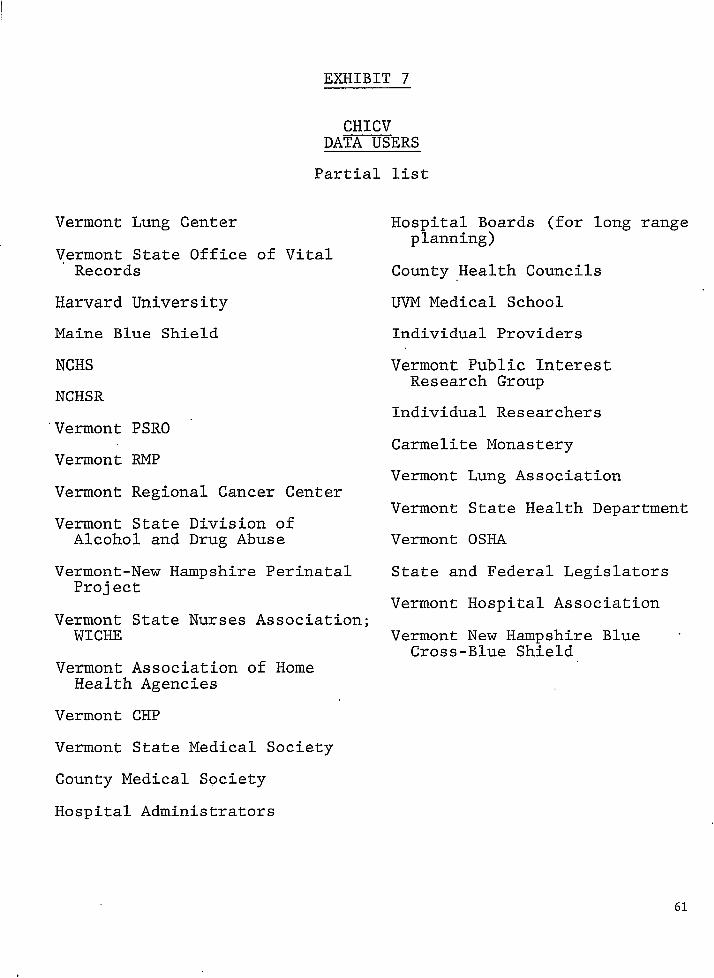
EXHIBIT 7
CHICVDATA USERS
Partial list
VermontI
I Vermont
Lung Center
State OfficeRecords
Harvard University
Maine Blue Shield
NCHS
NCHSR
“Vermont PSRO
Vermont RMP
of Vital
Vermont Regional Cancer Center
Vermont State Division ofAlcohol and Drug Abuse
Vermont-New Hampshire PerinatalProject
Vermont State Nurses Association;WICHE
Vermont Association of HomeHealth Agencies
Vermont CHP
Vermont State Medical Society
County Medical Society
Hospital Administrators
Hospital Boards (for long rangeplanning)
County Health Councils
UVM Medical School
Individual Providers
Vermont Public InterestResearch Group
Individual Researchers
Carmelite Monastery
Vermont Lung Association
Vermont State Health Department
Vermont OSHA
State and Federal Legislators
Vermont Hospital Association
Vermont New Hampshire Blue -Cross-Blue Shield
61
course, is cost. I won’t digress very far here intocost-benefit analysis, especially as that discipline is inan infant stage. In any event, we do estimate a 75cper capita cost per year to maintain the Center,which, oddly enough, is the PSRO per-abstract esti-mate, and furthermore, we can hypothesize, ofcourse, that reduced utilization and better medicalcare as a result of the use of CHICV data can save“megabucks.”
More importantly, the CHICV model is worthit, according to the value judgments of all of ushere at this Conference. Namely, that we can andmust promote ‘decision-making in data-rich environ-ments; data must be made available to the decisionmakers, so as to enhance the process. I wodd empha-size that CHICV never advocates specific policies orpractices, but ordy attempts to ensure that policy-making is cognizant of the appropriate data, as well asthe limitations of that data.
The CHICV experience is worth it, given themultitude of possible ways to use CHICV data, onlysome of which have been realized so far. One is themonitoring of medical care, as we have, seen. An-other is the ability to perform basic research and, infact, a paper is in publication from CHICV corre-
lating CHICV population-based data with physio-logic data. CHICV data is available for public andprofessional education of all kinds, and, also, andperhaps most importantly, CHICV data is availableto planners at the institutional and/or political unitlevels.
The CHICV model is particularly worth it, giv-en that the escalation of health care costs has got tostop. As Dr. Dickson said earlier at ths Conference,there may well be a ceiling of ten percent of the grossnational product for health, which would militate infavor of increased efforts to allocate resources, whichare finite, among infinite cost centers. We feel thatone can best evaluate the impact of programs by thestudy of health and health-related experiences ofsmall area populations, and, as Paul Densen said thismorning, only local centers can effectively study thehealth of small areas.
In summary, I would state categorically that thehealth care or sick care decisions of the late 1970’sand the 1980’s must be made in an environmentrich in data, which is credible and creditable to allparties, and which is provided by nonregulatory,nonprovider agencies.
THE DEVELOPMENT OF A STATE CENTERSTATISTICS IN THE WISCONSIN DIVISION
FOR HEALTHOF HEALTH
Raymond D. Nashold, Ph.D., Director, Bureau of Health Statistics, Wisconsin Departmentof Health and Social Services, Madison, Wisconsin
Background, Structure, andFunction
To provide a setting for the change which hasoccurred in Wisconsin, I shall briefly review the his-tory of the Division of Health and the Bureau ofHealth Statistics. To spare you lengthy detail I haveprovided a very brief outline (below) along with afist of activity a~eas of the Bureau and a di~~ram ofour organization chart (Attachments A and B). Inreviewing the history of the Bureau it is not surpris-ing to find that it parallels public health in generalin Wisconsin with the following periods:
I. The period of Communicable Disease Con-trol and Vital Statistics Reporting
II. ‘The period of Categorical Program Grantsand the Hill Burton Program
III. The period of Comprehensive HealthPlanning (P.L. 89-749)
IV. The period of the Health Planning andResource Development Act (P.L. 93-641)and the Cooperative Health Statistics Sys-tem (P,L. 93-353)
During a period of fragmentation of somepublic health activities, how was Health Statisticsable to consolidate and expand its activities whileremaining within the traditional administrativestructure of heahh? Again at the risk of oversimpli-fication, I shall list a few important decisions ordevelopments that maintained and encouraged con-solidation,
1. Decision to keep Statistical Services and Vi-tal Records together
IL Functioning of Statistical Services as a serv-ice unit for the Division
III. Expansion of service beyond Division pro-gram boundariesA. Demographic Data—including projec-
tions, general estimates and estimatesof special population subgroups
B. Hospital Discharge DataC. Health Status and Indicator DataD. Health Facilities DataE. Health Occupations Data
IV. Continuity of Administration
The expansion of Statistical Services needs tobe looked at closely because it both allowed success
and is also a measure of success. Why would a bu-reaucratic agency allow one of its services to reachwell beyond its usual and traditional areas of activi-ty? It should be remembered that in public healththe goal statements are generally so broad that it isdifficult to reach beyond them. It might be arguedthat in allowing health statistics to extend beyondimmediate program operations of the Division, atleast one area was coming closer to the broadly stat-ed goals of that Division: Furthermore, the areas ofstatistics outside of immediate public health pro-gram areas may be of major importance to a healthcare delivery system whose growth in other areashas been exceedingly rapid. Any statistical job welldone in one of these areas ii a credit to the Divisionfrom whence it came.
Health statistics entered a substantial growthperiod in Wisconsin with the passage of the Part-nership for Health Act in 1966. The A-Agency waslocated within the Division of Health; therefore, theBureau of Health Statistics, being a service unit Yothe entire Division, had the responsibility to servethe statistical needs of health planners. This thrustthe Bureau into health facility, health occupations,hospital discharge, and health status data to anunprecedented degree, It also resulted in many di-rect data requests from the eight Areawide HealthPlanning Agencies in the State.
Political change occurred and Health Planningwas removed from the Division of Health. Howev-er, the Bureau of Health Statistics has continued toserve data needs of health planning. It is muchmore difficult to relate to multiple agencies than toone, but the alternative of dividing the functions ofthe Bureau of Health Statistics between agenciesseems highly undesirable in terms of efficiency andpracticality. Reorganization, the perennial self-ab-sorption within bureaucracy, is very much with us,and may always be with us, so haste in scatteringhealth statistics functions would be very unwise. Itseems reasonable for the same statistics operation toserve health program managers, health planners,and policymakers.
The Bureau’s service to multiple agencies hasan incremental and evolutionary development thatis linked both to subject matter and to the largerevents in public health. Undoubtedly it begins withthe nature of vital statistics and the many agenciesthat are interested in birth, death, marriage, anddivorce data. The logical extension of vital data is
63

the development of the capability to produce post-censal estimates in order to obtain the appropriatepopulation base for calculating rates for vital eventsand disease case data. Appropriate population basedata may also solve basic problems of program eval-uation and planning. Obviously, this cannot bedone without methods for deriving valid postcensalestimates.
The Bureau of Health Statistics was fortunateenough to become a participating member in theState Cooperative Population Estimating Programwith the Bureau of Census. This activity becamealmost a classic example of the mutual benefits de-rived from close cooperation with a highly profes-sional Federal agency. Population estimation metho-dology is. mutually explored and agreed upon. Thework is clone and the results are then published inthe P-26 series of the Current Population Report asthe official county estimates; ending once and for allthe self-serving population estimates of the past.Naively at the time or fortuitously as we look back,the State shortly thereafter passed legislation forrevenue sharing to local units of government basedon current population estimates of Minor Civil Divi-sions (MCD’S). Perhaps State Legislators could notbe expected to know that no adequate methodologyexisted for deriving postcensal estimates for MCD’S.With the mandate of legislation, an informal re-search group was organized and staffed from ourBureau, the Department of Administration, andseveral discipline; from the University of Wisconsin.In about on; year this group accomplished the taskand the results have stood the test of courts, costlyspecial censuses, and the scrutiny of professionaldemographers and statisticians in papers beforetheir res~ective bodies. I have dwelt on this exam-ple to sh’ow that professionalism can win even in amorass of political pressure. The net result wasmeater util~ation of ‘this Bureau bv a much broad-“ .
er spectrum of public and private agencies.When the concept of the Cooperative .Health
Statistics System (CHSS) was first introduced by theNational Center for Health Statistics (NCHS), itimmediately sounded a note of reality to us becauseof our previous experiences. No matter how weapproached the problem of almost run-away datacollection, this proposal struck the right chord. Weapproached it with enthusiasm and by the secondyear of the program’s existence had three imple-mentation contracts and a three-vear research anddevelopment contract. The contr~cts have resultedin bot~ innovation and stabilization of operations invital statistics, health occupations, and health facilitydata to a degree previously considered only in therealm of speculation. Under a three-vear CHSSResearch aid Development Project significant re-sults have also been achieved in areas of long-termcare and emergency care data: With these activities
and others the Bureau clearly functions as a StateCenter for Health Statistics.*
Operations and Organization
Health data operations may be classified bysource of data, use of data, or type of data, but if acategorization scheme becomes the focal point forseparating health data into different organizationalstructures it could easily result in dysfunctionalfragmentation. A common distinction is made be-tween health program data and baseline data. Whilethis may be useful conceptually it may also create aserious probIem where one should not exist. Pro-gram data, when it is fixed in time, such as by anannual summary report, may in effect become base-line data for other purposes. Most programs thatare currently funded, whether categorically or un-der a broader rubric, now require program evalua-tion. If evaluation is to advance beyond activitycounts (often self-serving) and program budget data(frequently based on differing accounting proce-dures and definitions) the program must be placedin a broader context. fiis is precisely where so-called baseline data is of strategic importance. WithbaseIine data a given program can more nearly beplaced in context, not only in terms of availablehealth services, but also in respect to the populationsbeing served. This frequently removes programevaluation from a vacuum or a ritualistic existenceand places it in the real world,
One operational factor that has allowed us flex-ibility, quick response, and economical growth de-serves mention. This was the Bureau’s lack of de-pendence on applications programming and tradi-tional management information systems. More posi-tively stated, the Bureau used package or utilityprograms and the survey research approach asmuch as possible. The Bureau uses summary datafrom large management information systems and iswilling to offer consultation services on data contentbut does not expect to be involved with their opera-tion. Management information systems are current-ly undergoing slow and rather painful developmentin Wisconsin.
Legal Base
The Bureau has a statutory base for maintain-ing the vital statistics system (Wisconsin Statute 69),additional statutes which pertain to marriage and’divorce records (245 and 247), a statute governing
*The designation of Center is not used in defininglevels of government structure in Wisconsin’
64

I
I
name changes (29”6.36), and miscellaneous otherstatutes that affect the vital statistics system. The
vital statistics, health facilities, and health occupa-tion data activities are under contract with NCHS aspart of the Cooperative Health Statistics Systemwhich was established under P.L. 93-353 and is man-dated to serve Health Systems Agencies under P.L.93-641.
CoordinationTo avoid duplication and to facilitate service to
Health Systems Agencies and the State health plan-ning agency, which is the Division of Health Policyand Planning (DHPP), a data coordination commit-tee has been formed with staff-support from DHPP.This committee is the primary vehicle for workingout the technical aspects of data collection and useunder P.L. 93-641. Voting membership is limited tothose agencies mentioned in P.L. 93-641 but broadinput is sought from both providers and users ofdata through special subcommittees. The committeeis not part of the structure of any of its memberagencies nor does it set policy. It has been describedas using an interactive approach rather than a dataavailability or data needs approach (Attachment C).
Coordination has al~~ taken”formal and informal agreementsagencies (Attachment D).
place throughwith numerous
ConfidentialityTo maintain confidentiality the Bureau oper-
ates under specific requirements incorporated in
the Vital Statistics Statute, Chapter 69, and alsounder Statute 49.45, which protects client records.There is also an administrative code which makesthese statutes more specific. In addition to statuteand code the Bureau uses written agreements thatspecify at the time of collection how data will beused. Underlying all of this is a trust relationshipand objective approach that has been carefullymaintained through the years, It applies to bothdata providers and users. Any party to a controver-sy can be sure of getting identical data. If eitherproviders or users of data suspect the integrity ofan operation, its days are likely to be numbered.One of the best statements I have seen on the over-all responsibilities of a central statistical servicesoperation appeared in the May issue of TheAmerican Statistician. This statement applies to theGovernment Statistical Service for the United King-dom but is also largely applicable to a State Centerfor Health Statistics (Attachment E).
Conclusion
Whatever progress has been achieved in healthstatistics in Wisconsin to date has not been withoutstrain and nervous moments. Development hasbeen pragmatic, and this may be the best way to go.The Wisconsin experience may be partially applica-ble to other states; however, the particular circum-stances that allowed this reasonable growth andchange in Wisconsin are not likely to be completelytransferable. Evolution is always specific to an envi-ronment.
65

1.
2.
3.
4.
5.
6.
, 7.
8.
Attachment A
ACTIVITY AREAS WITHIN THEBUREAU OF HEALTH STATISTICS
Vital Data
Births, deaths, fetal death, marriage, and divorce including about 160,000 records annually.
Demographic Data
For population estimates and projections, fertility analysis, etc.
Health Program Data
Multiphasic screening, early periodic screening diagnosis and treatment, venereal disease, cancer, tuber-culosis, rheumatic fever, blood alcohol, accident prevention, family planning, etc.
Health Manpower Data
For approximately eighteen licensed and unlicensed health occupations involving about 65,000 to ‘70,-000 records annually.
Health Facility Data
One hundred and forty-six hospitals; 498 nursing homes.
Long Term Care Patient Data
Sample of public pay and private pay patients to represent approximately 40,000 nursing home resi-dents.
Hospital Inpatient Data
Sample of 128,000 records to represent 808,000 patients hospitalized annually.
Emergency Medid Service Data
a.
b.
c.
d.
Emergency Department Patient Reports
A sample of 30,000 cases to represent approximately 1,000,000 cases annually.
Emergency Department Categorization
One hundred and forty emergency departments.
Ambulance Reports
Sample to represent approximately 180,000 reports for 440 ambulance services.
Manpower Data
For approximately 8,000 emergency medical technicians.
Special research projects may also exist in conjunction with one or more of the activity areas listed above,
66

ATTACHMENT B
Governor
Department of Health and Social Services
Secretary
4
Division of Health
Administrator
Bureau of Health Statistics
Director
Section of VitalStatistics
Chief
Section of StatisticalServices
Chief
iSection of Projects
Chief
ATTACHMENT C
GUIDE TO AN INTERACTIVE APPROACH FORHEALTH DATA COORDINATION
I What are the Agencies’ Responsibilities? \
I What Activities Must They Perform?: I
v
~ – -DATA NEEDS+,I I
RecommendationsI 1~DATA AVAILABILITY
I I
IWhat Affects the Collecting, Processing,and Reporting of Data?
Who Collects, Processes, and Reports Data?
How are Facts About People, Resources,and the Environment Obtained?
67

Attachment C
APPROACHES TO DATA COORDINATIONBy Gina Eisenberg
I. A Data Availability Approach. This is the approach where data users seek to become aware of al]health data and its availability status. This approach might lead to the production of a “Data Dictionary” ora “Data Source Book.”
The problem with such an approach is that it ;S theoretically uninformed as to data needs. (And it is anawful lot of work!) While it is Yery important to know the kinds of data available from different sources,there is a pressing need for judgement and discrimination about data. For example, if a mosaic of infor-mation were presented in a dictionary, how would the planner know it contained all health information?What might be missing? What’s important? What is not important?
Another problem with an “av~ability approach” is that by itself it is not concerned with modifying andexpanding the availability of data.
II. A Data Needs Approach. This approach is the one taken by planners who specify “ideal data sys~ems”and comprehensive lists of “needed data” in isolation from real world considerations. Data coordinationrequires an appreciation for the possibilities and constraints that affect the availability of data as well as aconcern for “data needs.”
III. An Interactive Approach. This approach recognizes that although data needs are more obviously de- “rived from the activities the data must support, data needs are also affected by the availability of data, Like-wise, data availability most clearly derives from considerations like data requirements of operating pro-grams, cost, time, ease of enumerating, and expected accuracy. But “data availability,” too, can be mod-ified by “data needs.” The attached diagram shows the derivations and interrelations of data needs anddata availability. Sound data recommendations (that is, the ideal grounded by the possible) are most likelyto result when planners and analysts have considered most of the questions indicated on the followingpage.
68

I Attachment
FORMAL AND INFORMAL RELATIONSHIPS THAT THE BUREAUOF HEALTH STATISTICS HAS WITH OTHER AGENCIES
Formal (Contract, Designated, or Agreement)
Division of Health Policy & Planning:
Subcontract for manpower linkage workSubcontract for specialized acute intensive care services survey of hospitals
Wisconsin Clinical Cancer Center:
Joint contract for data processing for population based cancer“subcontract” in contract budget).
Division of Family Services and Wisconsin Blue Cross/Blue Shield:
reporting system in HSA 2. (Stated as
Joint contract to obtain descriptive and evaluation data for EPSDT Screening in Wisconsin
Na’tional Center for Health Statistics:
Implementation cost-sharing contracts in the areas of Vital Records, Facilities, Health Occupations -
Provide microfilm copy of sample’ of death certificates
Center for Disease Control:
Provide statewide abortion reporting data on annual basis.
U.S. Consumer Products Safety Commission:
Copies of death certificates provided where death is product related.
National Safety Council:
Tabulations of accidental deaths provided.
U.S. Bureau of the Census:
Bureau of Health Statistics designated as State’s cooperating agency in the preparation of populationestimates by county; published as official Federal current estimates by U. S.C.B.
Wisconsin Population Council:
Designated membership on ~ouncil
Department of Administration:
Bureau of Health Statistics written in as participant in contract to do research in methodology andtrends in population change.
Wisconsin Survey Research Lab (UW):
They are under subcontract with the Bureau of Health Statistics to develop samples and samplingmethodology for research and development project.
69
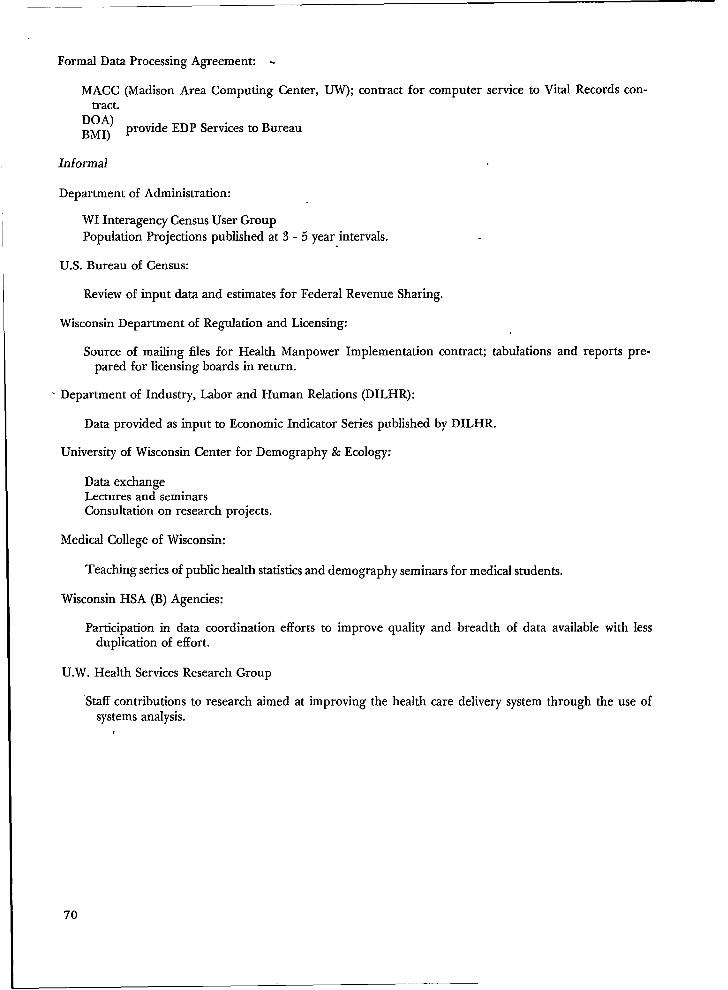
Formal Data Processing Agreement: -
MACC (Madison Area Computing Center, UW); contract for computer service to Vital Records con-tract.
DOA)~M1) provide EDP Services to Bureau
Informal
Department of Administration:
WI Interagency Census User Group
Population Projections published at 3-5 year intervals.
U.S. Bureau of Census:
Review of input data and estimates for Federal Revenue Sharing.
Wisconsin Department of Regulation and Licensing:
Source of mailing files for Health Manpower Implementation contract; tabulations and reports pre-pared for licensing boards in return.
- Department of Industry, Labor and Human Relations (DILHR):
Data provided as input to Economic Indicator Series published by DILHR.
University of Wisconsin Center for Demography & Ecology:
Data exchangeLectures and seminarsConsultation on research projects.
Medical College of Wisconsin:
Teaching series of public health statistics and demography seminars for medical students.
Wisconsin HSA (B) Agencies:
Participation in data coordination efforts to improve quality and breadthduplication of effort.
U.W. Health Services Research Group
“Staff contributions to research aimed at improving the health care deliverysystems analysis.
of data available with less
system through the use of
70

E
We have diverse responsibilities towards the public or rather towards a number of publics:
To the form-filling public, particularly the business community in ensuring that the burden of statis-tical form-filling imposed upon them is not greater than it need be, that their wish for privacy isrespected and that the confidentiality of information provided by them will be scrupulously pre-served.
To the statistics-using public in providing a service of rapid and comprehensive dissemination ofinformation and, beyond this, guiding and helping in the application of this information.
To the communications media in meeting their particular needs in the most helpful way and assist-ing them in the interpretation of the data to their audience.
To the academic community in doing all we can to give them access to data for bona fide researchand encouraging the closest possible cooperation in development, application of new techniques tonew problems and so on.
And finally to the public at large to ensure that the information we produce—at their expense—isused in the most efficient and relevant way to contribute to the nation’s well being; is seen to reflectthe highest standards of professional integrity; and is, with little exception,, made public and publi-cized so that it can contribute to informed debate in a mature democracy.
Excerpted from “The Role of the Central Statistical Office in Assisting Public Policy Makers,” by Claus Moser, Direc-tor, Central Statistical Office, Great George St., London SWIP 3AQ, England, and presented at the 135th Annual Meet-ing of the American Statistical Association, Atlanta, Georgia, August 25, 1975, as a General Methodology Lecture.
71229-121 0- 77 -6

GENERALIZED SOFTWARE PACKAGES
James J. Palmersheim, Ph.D., Director, Illinois Cooperative Healti Information SystemProject, IJlinois Department of Public Health, Sprin~eld, Illinois
Definition of GeneralizedSoftware Package
A generalized software package is a collectionof computer instructions, consisting of one or morecomputer programs and subroutines, written insuch a way that the user’s data organization orstructure is not as important to making use of thefunctions of the program package as is the user’sability to specify the parameters of the particularproblem. A package is characterized by the fact thatit requires no computer programming expertise inorder to use it. A package is accompanied by in-structions to the user in how to prepare data foruse by the package, including how to specify para-meters for various optional inputs, outputs, andprocesses.
The term “generalized” is used in order to dis-tinguish the kinds of packaged software to be dis-cussed today from “packages” which are tailoredfor use in a particular installation or application. A“package” which does not feature generalized inputformats does not meet the definition given; such a“package” is limited in respect to the number, ofusers who may immediately make use of it. Al-though such a package may possibly be more effi:cient in a particular setting, the assistance of acomputer programmer, and perhaps others, wouldbe necessary before it may profitably be used.
Another note on the definition may be helpful.One may prefer to think of a generalized softwarepackage as being independent of tie user’s dataorganization or structure. Whh the recent wide-spread use of data management systems however,we find that data storage organization has becomemore complex than the simple N x P matrix repre-sentation, where N represents the number of rows(observations or cases) and P represents the numberof columns (variables or data items). One may haveto reorganize the data in a data base managementsystem structure to bring it into matrix form forstatistical processing. The degree to which such areorganization becomes transparent to the userwould reflect the degree of independence of dataorganization or structure possessed by a generalizedsoftware package.
Reasons for Widespread Useof Generalized SoftwarePackages
“Packages” have become widely used for sever-al reasons. Among the most important are the fol-lowing.
1. Computations can be generalized. The gen- .eral form of an equation may be programmed interms of parameters whose values for a particularapplication may be fed to the computer as data. Asan example, consider the computations of the arith-metic mean of a sample of observations on a givenvariable. The sample size, N, is the input parameter-for the general equation to compute the mean, Theonly other feature of the problem to reIate to a par-ticular sample is where the values (observations) arerecorded; generalized processes are available to al-low the user to specify the format and location ofthe N observed values.
Many processes in business and governmentare. being analyzed to determine the general modelwhich describes a particular process. This is truefrom statistical processes to management systems,such as Management By Objectives (MBO), andadministrative systems, such as mailing.
2. “Packages” save money by allowing the userto avoid “in-house” computer programming, sys-tems analysis, and statistical analysis,
3. Reliability, efficiency, and speed and ease ofexecution of computer applications are often bene-fits derived from the use of a packaged program.There are good reasons for this. Packages areusually tested thoroughly by their developers, Be-cause many users apply the package in a variety ofsettings, “bugs” become more readily known andcorrected. The developers receive widespread feed-back as to the advantages and disadvantages of thepackage and make appropriate adjustments, Fre-quen~ of use of a package lends credence to itsaccuracy.
4. The need to reanalyze the same set of dataover and over again, making modifications in thesample size, variables selected, or other features ofthe problem, but nonetheless invoking the same sta-tistical method or process, has given rise to the de-velopment of statistical packages with generalized
72

input and output features and the ability to selectoptions.
5. “Packages” aIlow even a small statistical staffto perform with the resources of an apparentlylarge statistical organization. The prime example ofthis principle is the use of the Biomedical Comput-er Programs (BMD) throughout the world by largeand small organizations alike. Developed by Profes-sor Wilfrid J. Dixon at U. C. L.A.’S Health SciencesComputing Facility, this package brings to the indi-vidual user the power of biomedical and statisticalcomputation represented by its developers.
Features of GeneralizedSoftware Packages
1. User’s manual. By definition, a generalizedsoftware package must be accompanied by a set ofinstructions in how to use the programs (software)of the package. The user’s manual is part of thepackage. The manual should be easy to read anduse by the individual for whom it was intended. Itshould explain the computational methods andprocedures employed in the programs and citeappropriate references. It should clearly delineateall of the options available to the user in seeking toemploy the programs of the” package.
The organization which developed the packageshould maintain and update the package. Thisshould include regular communication with usersadvising on the latest version of the programs andmaking available to users notes or new pages forthe user’s manual.
2. The output from the “package” should bereadable. A key feature of a package should be theoption to allow the user to provide labels for theoutput variables, for tables, and for pages of theoutput. The option should allow as much flexibilityas is feasible.
3. The package should deal clearly with theproblem of how to treat missing values. What hap-pens when a missing value is ,encountered? A pack-age should have optional methods for treating miss-ing values which the user may select.
4. Easily understood error messages should beprinted when. the occasion calls for it. When at-tempting to divide by zero or take the square rootof a negative number, for example, it is not suffi-cient to me that the package has a method for han-dling the situation without warning me-about whatis going on in an explicit fashion.
5. Options for printing the input data, includ-ing the parameter cards, are features which help toovercome the perennial documentation problemwhich seems to plague analysts everywhere.
6. ‘A package should allow for transformingthe original data. One should easily be able to cre-
ate a new variable derived through functions per-formed on the original variables. Such functionscould include logical checks of the values of originalvariables and could even represent ways to edit thedata and handle missing values.
7. It is helpful to have estimates of the costs ofoperating the programs of the package under var-ious circumstances. If these estimates can be ex-pressed in terms of parameters of the problem,such as sample size, number of variables, optionsused, etc., so much the better. The BMD packageprovides expressions for estimating cost in its user’smanual.
8. Suitable check outputs, descriptive statistics,and graphics should be among the options availablein a package. A generalized program for multipleregression, for example, might allow. for the print-ing of the determinant of the matrix which must beinverted; it may print the means of all variables inthe regression equation; it might allow for plottingthe data.
9. It is often desirable to make multiple passeson the same data, where at each successive pass adifferent program option is selected, without havingto submit each pass as a separate application of thepackage.
10. Intermediate output from the packagedprogram is desirable as an optional feature. Theability to store intermediate results for later use orfor checking may be a cost saving feature worth thecost of initial programming. Storing transformeddata after the initial pass would save the transfor-mation step in subsequent passes on the same dataset.
11. A generalized software package should pro-vide flexible input options. There should be ways toread the data from various input storage media”such as punched cards, magnetic tape, or diskpacks. Where valid, all standard characters (the fullset of alphanumeric characters) should be acceptedas values for a variable (or data item). Truly flexibleinput options would include various methods forhandling missing values.
Review of Packages in Use inVarious States
The features mentioned above, and other fea-tures, are in evidence throughout the country. -Ofparticular interest at this Conference is the use ofpackages among State Government agencies partici-pating in the Cooperative Health Statistics System. Ihave recently talked to the health statistics execu-tives in Missouri, New York, North Carolina, andIllinois to determine the extent to which general-ized software packages have come to be utilized intheir States’ health statistics operations. The follow-ing summary gives one an idea of the variety ofpackages in use in these States.
73

The health statistics operation in Missouri hasaccess to a large university-based computer and to asmaller computer in-house. Missouri employs database management systems. In-house programmingis performed in COBOL for the most part. Primari-ly through the research analysts on the staff, thefollowing packages are in use: SAS (Statistical Anal-ysis System); BMD; SPSS (Statistical Package for theSocial Sciences); CENTSAID-II; and CULPRIT.They also use the CaIform software for graphics.
New York uses a different computer but alsohas experience with a data base management sys-tem. In addition to COBOL, FORTRAN, and PL/1,which Missouri also uses, the New York health sta-tistics operation employs the BASIC language. TheBMD and SPSS packages are in use there as well asa package called Choropleth for digital plotting.New York has developed he ARIES system for aportion of its vital statistics system, an interestingdevelopment from the standpoint of this discussionbecause one has to wonder if generalized softwarepackages may be written so that many more Statesmay accrue the benefits of that technology.
In both Dlinois and North Carolina, largecomputers are available to the health statistics oper-ations. Both States have experience with data basemanagement systems, several years in the case ofIllino~, and ~boutBoth States employ
one year’ inthe following
North Carolina.packages: BMD;
SPSS; WISTAB; EASYTRIEVE; SYMAP. In Illi-nois, MARK IV and PSG are also used, as well as afew packages developed locally such as the IDD (11-Iinois Data Directory). North Carolina uses SASfrequently, similar to Missouri’s experience, NorthCarolina also makes use of a localIy developed editpackage and uses certain software developed forthe CalComp plotter.
Conclusion
In conclusion, I should like to suggest thatgeneralized software packages can help your opera-tions immensely. By having staff who know how touse selected packages and have access to them, ahealthy independence can be gained, One need notrely so heavily on the computer programming andsystems analysis staff of the large central computingfacilities in order to get the work out,
Finally, a word of caution. Because packagesare easy to use, they are easy to misuse. One needsto assure that persons with the proper educationand experience are available to use packaged soft-ware, particularly in the interpretation of the out-put. It is not enough to know that you have a per-son who can set UD and run an aDD]ication of apackage to an appa~entlyform of printed output.
.,successful outcome in the
74

COMPUTER-BASEDMr. Charles ]. Rothwell,
STATISTICAL PACKAGESHead, Public Health Statistics Branch, Division of Health Services.
North Carol;na Department of Human Resources, Raleigh, North Carolina
Public Health Statistics Branchand Its Functions
Before I get into the text of my talk, I feel Ishould explain the makeup and functions of theunit in which I work. In this way you may be ableto better judge my biases. My unit, the PublicHealth Statistics Branch, contains statisticians anddata processors of various professional persuasions.Our basic function is to meet all data processingand statistical analysis needs ‘for the State HealthAgency. We are responsible for all statistical publi-cations and all computerized management informa-tion reports for all State sponsored health pro-grams, as well as giving data processing assistanceto selected county health departments.
The Expanding Role of StateStatistical Services
Over the years the unit has gone through anevolution of perception as to its role as the datamanager for health. At first the unit was a reposito-ry of vital statistics whose only output was the usualvital statistics publications. As the unit developedmore data processing and statistical analysis skillsand supported more health programs, internalmanagement reports and wider range of publica-tion! were forthcoming.
The feeling now is that with the build-up ofrather strong historical data bases in such broadareas as chronic disease, family planning, commun-icable disease, developmental disabilities and mater-nal and child health, we can no longer assume thatthe proper analysis will be done elsewhere or besatisfied with merely tabulating the data. We nowview publications as vehicles to advertise the kindsof data available ... an appetizer to data users as wellas a source of baseline statistics. We are now encou-raging users to ask for data and associated analysistailored to fit their specific needs. Inherent with thisencouragement is the problem of meeting a widerange of user needs within a responsive time-frame.With this view in mind, it is obvious why packagedstatistical systems are pivotal in serving our users.f’m quite sure that the concept of total data serviceto users is not peculiar to North Carolina and thusthe proper selection, understanding, and use of sta-tistical packages should be of interest to all of us.
Definition of a StatisticalPackage
All talks are supposed to contain at least onedefinition and thus I feel obliged to make my quotaand define the title of my talk. A standard defini-tion of a statistical package is a set of prepro-grammed routines ‘that will perform a specified setof statistical operations under the control of an in-struction set called the “control language.” The con-trol language is the string that holds the packagetogether and may also bind the user. Therefore inthe judgmental process of selecting a package, boththe statistical routines and the utility of the controllanguage should be carefully examined.
STATISTICAL PACKAGES
How to Judge/Select the Pro-per Statistical Package
First and foremost, no package is all things toall people or all situations. No single criterion canbe used to judge which package is best for yourneeds. You may want a package that is versatile androbust in its statistical routines, or you may be inter-ested in one that prints tables suitable for publica-tion, or one that has an easily understood mnemon-ic command structure for the casual user. A pri-mary requisite to any piece of software is the availa-bility of indepth user documentation, and statisticalpackages are no exception, since many users arenot oriented towards data processing. The docu-mentation sliould include, but not necessarily belimited to
● a primer for the casual user on how to usethe basic components of the system
● a detailed reference manual that wouldinclude adequate development of the algo-rithms that are employed so that a rationaljudgment can be made on their applicabil-ity.
Another important criterion for judgment isthe control language governing the software pack-age. In this case, it should be logical and easy toimplement for someone with knowledge of statisticsand not the vagaries/eccentricities of the software.It should not discourage statistical inventiveness
75
I

due to difficult syntax. ne control language shouldallow for descriptive variable labeling so that theoutput is readable and suitable for reporting orpublishing purposes.
The algorithms within the, package should notbe considered independently but should form a log-ical whole. It is quite usual that a user will employthe results from one component of the package asinput to another component. Can this be donewithout fear of violating the assumptions of one ofthe statistical routines? For example, in the compu-tation of correlations, if missing values are sur-pressed/excluded then hopefully the regression al-gorithm using such a correlation matrix is valid forincomplete data.
Ano@er feature to be examined is the supportgiven by the proprietor of the software package.Such questions as the following should be asked ir,the judgment process:
●
●
●
●
●
●
Is there a centralized user service? .
How frequently is the package updated?
What is the procedure for updating? Is itpossible to secure the new version via atape or is a rekeying of source code re-quired?
How detailed is the documentation sup-porting the update?
Are the problems that caused the new ver-sion adequately discussed?
Are newsletters sent out to notify users ofunsolved problems encountered when us-ing various routines?
And, of course, the determination should bemade whether the statistical package can be sup-ported by your equipment configuration. Mostpackages are, of course, compatible with IBM cen-tral processors. Some packages require plotterequipment, while others require that line printersbe able to overprint (which may be a problem withcertain drum printers).
Remember, the acquisition of statistical pack-ages is important. Statisticians are no different thanprogrammers in that once they learn to use onepiece of software they will seldom voluntarilychange. Thus, the most appropriate package(s)should be purchased.
Types of Statistical Packages
There are two basic types of statistical pack-ages. The type we usually come in contact with are
76
the generalized, all-encompassing packages such asBMD (UCLA), SPSS (Stanford University and Uni-versity of Chicago), SAS (NCSU) and TSAR (DukeUniversity). Their arsenal of statistical proceduresfall into two broad categories:
simple statistical routines and tabulatiortswhich may include single variable descriptivestatistics (point estimates, one-way frequen-cies, measures of dispersion, standardizationof data), t-tests and table generating routinessuitable for publishing or for managementreports.more involved algorithms pertaining to suchareas as correlation, regression, time series,and multivariate analysis,
BMD, SPSS and SAS are representative oflarge statistical systems with differing characteristicsthat require careful scrutiny in the selection of aproper statistical package. SPSS and SAS are pack-ages in which a single computer run can processdata through any number of statistical procedures,while BMD consists of mutually exclusive programswhich have to be run independently. BMD is muchmore robust in its statistical offerings than SPSS andSAS, but SPSS offers ‘much more labeling capabilityand SAS’S control card preparation is quite simple(free format). Each package handles missing valuesdifferently and in BMD’ this may vary from proce-dure to procedure. For some procedures in BMDthe handling of missing data is a mystery (How areblanks handled?). We found SAS to be considerablyslower than SPSS in generating one and two wayfrequencies on large data sets such as birth anddeath fdes; however, SPSS places a more stringentlimit on the number of variables analyzed. SAS canbe interfaced with BMD, whereby a SAS procedurecan convert a SAS data set to a BMD file and theninvoke the required BMD routine. SAS also has aprocedure that can convert SPSS and BMD datasets into a SAS data set—and so it goes . . . .
The other type of statistical package concen-trates its procedures in either simple tabulation/ta-ble routines (CROSSTABS, TPL) or the more in-volved statistical algorithms such as
● IBM’s RANDU● IBM’s 1130 Statistical System - Factor Ana]y-
sis, stepwise regression● University of Michigan AID - Automatic In-
teraction Detector - Stepwise regression withno linearity or additive assumptions
● University of North Caroliria MANOVA -multivariate analysis - much simplier to usethan BMD
The list of specialized packages grows witheach new graduate thesis sponsored by Computer

!Science departments. Each have their own advan-.tages. Some o~the table generating packages allowfor over printing for column and row headings;some other packages offer specific algorithms whoseassumptions are looser than those found in SPSS,SAS or BMD. Some wags have stated that for everydata analysis technique there exists at least twocomputerized routines. I believe such a statementmay be conservative.
By the way, I have purposely not discussedmapping, bar charts, scatter graphs and othergraphical display routines since this subject is close-ly associated with Dr. Dever’s talk.
SOME USES OF STATISTICALPACKAGES BY NORTHCAROLINA’S DIVISIONOF HEALTH SERVICES
One-time Statistical Requests
This is the most frequent use of statistical pack-ages in our agency. These statistical requests usuallycome from
● health program managers● researchers● public
We have a policy to answer all applicable statisticalrequests made by North Carolina citizens that willnot generate a computer bill in excess of $25.00.These requests from the public range from gradeschool children needing information for a report toa citizen action committee wanting information tosupport new legislation. The majority of requestsfrom the public require only cross tabula~ions orsingle variable descriptive analysis; the requestsfrom the other two sectors usually require a morerigorous presentation. As I stated earlier, we en-courage such requests and these packages allow usto respond quickly. Of course, this whole process ispredicated on having clean and well documenteddata files.
Quality Control for Publications
All of our publications are computer generat-ed; some use packaged statistical routines and someuse routines developed in-house. This may give theimpression that we have gotten around the publica-tion crunch. Actually, it does help, but it also shifts
the main work to the preprocessing stage. Strictquality control measures on the data files must beinstituted before the publication is run. Normal ed-its found in most data processing systems are notenough. In relation to publications, we never as-sume that the data is clean until we look at it. The“values” of each variable reported on must be validor feasible. For example:
●
●
●
resident codes may be correctly structured(numeric and proper size) yet be invalidnosologists or ACME may assign invalidICDA codes for the underlying causeyour State may decide to assign ages to miss-. .mg values in the death file for publicationpurpose. These assigned values could bebased on the distribution of known ages forthat particular underlying cause.
We use one-way frequencies on all reported varia-bles to insure that we are not collecting any “un-usual” occurrences. These one-way frequencies arefrom either SPSS or SAS.
Publications
Some of our publications are generated com-pletely from a statistical package. This publication iscalled the Basic Automated Birth Yearbook orBABY book and gives cross tabulations of variablessurrounding birth. This publication contains Statespecific tables; however, we also publish supportingtables for HSA’S and all 100 counties.
The procedure used is CROSSTABS underSPSS. By the way, we also have all our publicationson microfiche since our computation center has aCOM capability. We have found that the crosstabu-lation procedure under SPSS is extremely legible onmicrofiche. To date it is the best we’ve found.
Intermediate Management .Report Generators
Another use of the statistical packages, specifi-cally the simple tabulation routines, is the produc-tion of interim management reports. We initiatedthis technique about eight months ago and havefound it quite useful in handling evolving data pro-cessing systems for new health programs. I believethe appro?ch has some original facets to it. Mostdeveloping information system’s data collectionforms are designed before strong consideration hasbeen given as to the outputs via management re-ports and evaluation mechanisms desired by pro- -gram managers. This may lead to data being col-lected in the field, coded, and entered into machine
77

readable form that is either inappropriate, incom-plete or never used. It also brings about a witheringarray of changes to management report formatswith their ensuing reprogramming requirements.Our agency has tried to attack this problem in twoways:
1.
2.
to require specific output needs from pro-gram managers before designing a datacollection vehicleonce the data set is firm, to use packagedstatistical programs for all managementreports. This is done for the following rea-sons:a.
b.
c.
to make it easier for the programmingstaff to go through the inevitable changesin the reportto show by cross tabs.dations and one-wayfrequencies very “fine” cell counts for allcollected variables so that a meanin~ulsummarization level for variables can befound
to show bv one-way frequencies those var-.iables whose responses $ve little informa-tion, e.g., “no response,” “I don’tknow’’:... These data can be used to ascer-tain whether the collection process for acertain variable shotid be strengthened orthat the variable shos.dd no longer be coi-lected. Once the proper variables have beenchosen and their most appropriate sum-marization level determined, then a moreefficient report generator can be written forthat specific management reporting system.
CRITICISM OF STATISTICALPACKAGES
Background
Most of the problems encountered when usingstatistical packages are in the use of the more so-phisticated data analysis routines. The table gener-ating routines are ~uite good and with patience you..-_can find one that fits your” particular needs. It isinteresting to note that with the ever increasing bat-tery of statistical packages available to users, therehas not been a corresponding growth in the litera-ture concerning evaluation of the accuracy and ease
, of use of these packages. For this reason the Ameri-can Statistical Association’s Section on Computinghas initiated a Committee on Evaluation of Statisti-cal Program Packages. The Committee has alreadydefined the criteria upon which the evaluation willbe based and is currently in the process of evaluat-ing individual packages.
78
Appropriateness of theAlgorithm to the Problem
Data analysis unlike mathematical statistics isan art. For any given data set a group of appliedstatisticians might approach the analysis using quitedifferent techniques, based on their individual “bagof statistical tools.” There is good and bad art,whether modern or romantic, just as there is goodand bad data analysis. One can apply the conceptsof cubism to a landscape scene and come away witha disaster. One can also use a beautiful and rigor-ous al~orithm to a data set and come away with asmootfi looking but bogus result due to the “assump-tions of the algorithm not reflecting the realities ofthe data.
Advocates of statistical packages claim that be-fore the advent of these computerized routines, lit-tle analysis was done on large data files or on therelationships between several variables. Thesecomments may be valid, but the development ofthese routines to ease the use of multivariate analy-sis and other such techniques places a large respon-sibility on administrators of statistical units and firstline statistical supervisors. Basically the existence ofthese packages can place a sophisticated statisticaltool within reach of the statistically naive, My areais not multivariate analysis, yet in a day or two Icould give you the impression, through the use ofthese statistical routines, that I was professionallycomfortable in this area. The inappropriate use ofthese algorithms could have catastrophic consequen-ces. It is absolutely essential that adequate profes-sional review take place on the selection of the typeof analysis techniaue to be emDloved and then onthe cho;ce of com~uterized alog;rit’hm to be used, Ifyou’re not sure of the mathematical underpinningsof the routine, then don ‘t use it! I strongl~ recofi-mend that your “expert” for the use of these so-phisticated routines not come from the program-ming staff but from the statistical staff.
Let me give an example of a problem in rela-tion to the appropriateness of a packaged statisticalroutine. More and more, health statisticians arerequired to directly or implicitly contrast one geo-graphical area from another. I believe the next twospeakers will be discussing small area statistics andhow to graphically display them through computer-ized mapping routines. Suppose we want to mapNorth Carolina’s 100 counties for age/race/sex ad-justed mortality rates for lung cancer. Suppose wewill place the counties in one of five categories de-pending on their mortality rates. Thus; we have an
immediate problem of grouping data. There aremany methods to achieve this
● we could adjust the groupings so that about20 counties would fall in each of the five

groups. This would make a balanced map
and one that would be easy to read.● ;ve could standardize the variable, assume
the central limit theorem applies and thenuse the usual statistical tests
● we could use the cluster analysis routine inBMD (P2M) where the variable is standard-ized and then the standardized rates withthe closest “distances” are grouped together.The distance in this case is the sum of thesquare of the differences
● we could apply some other clustering routinefound in another package.
The danger is that whether we meant it or not,by graphically depicting counties in groupings, poli-cymake.rs may interpret these maps as showingsore-e significant difference between the counties indifferent groupings. The selection of a statisticalpackage that does standardization routines or chls-tering routines should be a careful process and justbecause packages exist to accomplish such routinesdoes not mean that they should be used. It may justbe that the most appropriate route would be amanual analysis of the distribution of the mortalityrates.
The Programmer Syndrome
The “programmer syndrome” is what I call theconcept that
●
or●
I do best what I know best and I know bestwhat I’ve done the longest
don’t confuse me with another computer.“language” even though, it may be moreefficient for the project at hand—for some-how, someway I’ll get this COBOL pro-gram to do matrix manipulation.
Statisticians are not different from program-mers when it comes to the use of computerized sta-tistical packages. Once they learn the “control lan-guage” of one package they are apt to stick withthat package. Again, just because’ BMD offers acluster analysis routine does not mean that it offersthe most appropriate cluster routine for the prob-lem at hand,
The Removing of the ‘ “Statistician from the Data
The intent in having “clean” data files and sta-tistical packages to examine them has always beento encourage the exploration of the statistical prop-erties of the files by researchers. Yet with the in-creased usage of such files we are faced with thedanger that the statistician may be more removedfrom the nuances of the data. The preparationstages in creating these “clean” files must play asignificant part in the analysis. The statisticianshould be made aware of the collection process aswell as any transformations to the raw data thattook place during the editing stage.
CONCLUDING REMARKSThe use of statistical packages are as varied as
the number of packages that are available. I hopeI’ve given you the feeling of their growing value tous in the health statistics field. I believe that theiruse will quickly become a standard tool in our day-to-day operating procedures. .
If you are not now or just starting to make useof statistical packages, you may .be at a 10SS as towhere to seek guidance on the availability and selec-tion of these software systems. Good places to beginare
● your local universities● other “sister” agencies in your State● NCHS● other State health statistics agencies.
Finally, it is my feeling that NCHS should sponsora colloquim with all interested States on the sharingof information about software packages that. arerelevant to health statistics.
REFERENCES
Francis, Ivor; Heiberger, Richard M. and Velleman, PaulF. (February 1975) “Criteria and Considerations in theEvaluation of Statistical Program Packages,” The Ameri-can Statistician, 29, 52-56.
Hoaglin, David C. and Andrews, David F. (August 1975)“The Reporting of Computation - Based Results in Sta-tistics: The American Statistician, 29, 122-126.
79

PRACTICAL COMPUTER GRAPHICS
G.E. Alan Dever, Ph.D., Director, and Mr. Michael R. Lavoie, Research Associate, Office ofHealth Services Research and Statistics, Geormb De~artment of Human Resources, Divisionof Physical Health, Atlanta, Georgia
The practical utilization of computer graphicswas predominantly pioneered and employedthrough avant-garde engineering technology, nota-bly by those persons associated with the aerospaceindustry.1 More recently, some humanistic applica-tions of computer graphics output have surfaced invarious publications of the social sciences.2 Howev-er, heahh-oriented, computer-generated graphicsare just beginning to be employed for practicalprogram planning by health directors.
Specifically, the integration of health planningwith health statistics may be accomplished by com-puter graphics as a communication format to dem-onstrate basic patterns and trends to aid in deci-sion-making and policy formulation. It is importantthat data relative to health variables be translatedinto visual information for more effective healthplanning. Computer graphics is one approach var-ious levels of management may take to translatehealth planning and health statistics into an effec-tive format for determining appropriate policy deciisions.
Several trends related to health planning,health statistics, and health policy are emerging thatrequire brief elaboration. These trends include:
1.
2.
3.
4.
5.
The development of Health System Agen-cies (HSA)The apparent shift from medical to socialepidemiologyThe emergence of Schools of Public Healthwhich focus on community health withemphasis on population groups in commu-nities, rather than individuals in clinicsThe shift from infectious to chronic diseasepatterns, reflecting need for a health policypromoting prevention in addition to cura-tive and restorative needsThe development of morbiditv monitoringsystems; e.~., Professional Ac~ivities Stud;(PAS), Computerized Health InformationProgram (CHIP), and hospital dischargedata set of Center for Health Service Statis-tics (CHSS).
These trends are mentioned because computergraphics can play a very important role by demon-strating similarities and differences of the measuredvariables. Moreover, the personnel associated withthese events may employ computer graphics to fa-cilitate decision-making.
80
Computer Graphics—Advantages andDisadvantages
As health problems and the information gener-ated to understand and to deal with such problemsmultiply in scale, variety, intensity, and complexity,better means are needed to analyze, display, andcommunicate health information. Computer graph-ics have distinct advantages which allow a user todeal with the problems of scale, variety, intensity,and complexity through a better means of visualcommunication. Some advantages of computergraphics to the users and, certainly, managers ofhealth information are:
1.
2.
3.
4.
5.
6.
7.
8.
The method is fast, efficient, simple, andeconomical.It can provide a clearer view of informationthan do most tables or charts,Data changing with time may be followedwith a series of maps.Several variables that are spatially contig-uous may be analyzed simultaneously.It is relatively easy to select and display var-ious sample data sets.The scale and range levels of the computergraphics may be selected according to theuser’s need.Computer graphics can be interactive so atial product may be viewed before it is fi-nally printed, thus avoiding costly produc-tion errors.The user is able to visualize large volumes ofdata rapidly by mapping. “
The advantages listed previously indicate sever-al merits of the application of computer graphics,but the major merit of this method is the viableapplication to health planning, health statistics, andhealth policy. This aspect of computer graphics isdetailed in a subsequent section of this paper,
As with most techniques, there are drawbacksor disadvantages. It is our belief, however, the ad-vantages far outweigh the disadvantages. The pri-mary disadvantages are:
1. The majority of time in computer graphicsis spent coding the data geographically (al-though this has potential to be automated,

2.
3.
4.
5.
6.
‘?.
8.
9.
It
and once the base is established it need notbe done again).Considerable time may be initially spent toreduce the data to fit available equipmentand software programs.There is difficulty in avoiding the pitfall ofattempting to map everything.
A user must have basic knowledge of thetechniques of map-making and graphic illus-tration, or many problems will surface rela-tive to scale of the map, choice of symbols,’type of map, selection of the legend, andnature of data to be mapped; i.e., continu-ous versus discrete data.The user may not know the usefulness ofthe output or, for that matter, may not beaware of the quality of the input.It is difficult to select the most appropriatemap or graphic for the best presentation ofthe data.Interpretation of d~ta is critical, and cautionis warranted.“Visual noise” must be avoided at all costs.Many times the map may be so clutteredwith information that it conveys little ornothing to the reader.Hardware and software selection must betailored to the user’s needs.
must be stressed, however, in view of thesedisadvantages, that computer-generated maps andgraphics are no better than the quality of the datathat is put into them. Although there are definitelimitations to the use of computer graphics, it isproposed that most of these disadvantages wouldnot be crucial if appropriate personnel were re-cruited for the production of computer graphics.
Use of Computer Graphics
As pointed out previously, practical involve-ment with computer-generated graphics in healthcare management is not presently widespread.However, a prime example—HSA development—indicates a clear potential for the application ofcomputer-generated displays, for HSA’S are re-quired to assemble, analyze, communicate, and dis-play data concerning:
1.
2.
3.
4.
The health status (and its determinants) ofthe service area residents.The status of the health care delivery systemand the use of that system by area residents.The effect of the health care delivery systemon the health of the area residents.The number, type, and location of the area’shealth resources, including services, man-power, and facilities.
5. The pattern of utilizationof the area’s healthresources.
6. The factors of environmenttal and occupa-tional exposure affecting immediate andlong-term health conditions.
Some further opportunities for applied com-puter graphics in HSA’S and health departmentsmay include more sophisticated analysis, such as:
7.
8.
9.
10.
HosDital accessibility mav be viewed as afun~tion of time, ~ost, ~r distance. Thesebasic, functional aspects may be mapped toshow areas of high or low accessibility. Thisapproach may be valid for emergency roomvisits, neighborhood health clinics, countydepartments of public health, patient-physi-cian visits, and nursing homes.Medical trade areas or hospital service areasmay be delineated via computer graphicsthrough the use of patient-origin studies.Such studies may identify patients aspoints or line flows indicating volume, or asareas utilizing circles with variable radii or
“
ellipses based on the standard deviation of aareal distribution.Manpower data may be mapped to illustrate -areas of underservice, scarcity, and oversup-ply. In these instances, the map would showmanpower to population ratios, thus aidingin the decision-making process for the de-velopment and location of satellite clinicsand mobile health vans. In addition, strate-gies can be developed based on locationalneeds for recruitment processes. of medicaland paramedical professionals.Another potential benefit is the mapping ofdisease Datterns in relationship to facilitiesand m~npower. If appropri~te expertiseexists in the health planning organization;epidemiological studies may be initiated thatwould relate to the measurement and assess-ment of health status, showing areas of con-trast.
The trend in health planning toward focusingon population groups in communities rather thanon individuals in clinics-and the shift from infec-tious to chronic disease patterns—also presentsmany interesting applications for computer graph-ics. Utilizing either mortality or morbidity data,computer-generated graphics may illustrate:
1. High or low risk areas for specified or se-lected diseases. Critical for this aspect is theneed to reduce the potential of random var-iability in the data by either expanding the
81

2.
3.
4.
5.
6.
time period of study or aggregating theareal uni~ being investigated.The health status of a population throughcommunity diagnosis, pursuant to P.L. 93-641, by conducting periodic communityepidemiological investigations.Priorities in health programs for the alloca-tion of resources by developing policy forState and district health programs.Planning aspects of health and social pro-grams.Reports or presentations of information toState legislators, special governor’s councils,boards of directors, concerned consumergroups, and news media.Evaluation measures, epidemiolo~d orother health data which may be pe~iodicallyupdated to indicate changes from one timeframe to another.
The final emerging trend, however, is toward anew epidemiological mode for health policy analysiscomprised of four major elements: human biology,life style, environment, and health care organiza-tion.t Typically, much of our data analysis-and theresultant graphics-has emphasized relationshipsconcerning the system of health care organizationdealing with restorative and curative approaches ofhealth care, while the preventive aspects have beenneglected. This trend is mentioned because there isa major need to expand the concept of health to aholistic view that promotes the reduction of illnessand disability and the prolongation of a healthy life.Thus, computer graphics and health planning ingeneral should move with considerable rigor intothese othe; areas of epidemiology to understand,analyze, and display the interrelations of life style,environment, and human biology. For this reason,an untapp6d use of computer graphics will be todisplay information not traditionally thought of asbeing health related.
SUMMARY
Computer-generated maps, charts, and graphshave potential as tools to present health informa-tion with visual impact, clarity, and timeliness.Once front-end hardware and software are in-stalled, computer graphics are relatively inexpensiveto produce; they are repetitively accurate, versatile,
and can produce production-ready copies in min-utes. The technology of resource persons and com-puter hardware and software can be available todifferent levels of management to utilize in display-ing health information for planning, monitoringand conducting epidemiological investigations,Technological advances continue; i.e., ink jet plot-ters, color graphics, and high increment speedsaccompanied by fine resolution.4 Yet the burden ofadvancement does not lie with manufacturers ordevelopers of hardware and software but with thehealth field profession (“peopleware”), By our owninterpretation, therefore, the question of the contri-bution of computer graphics to health care—suchas planning, community epidemiological investiga-tions, policy decisions, and morbidity monitoring—lies specifically with health program managers anddecision-makers. We have said that the flow of in-formation can be overwhelming and difficult tocomprehend. We think adequate computer graphics(hardware, software, and peopleware) could help toalleviate this condition.
Social needs, especially the health aspects of asocial environment, must be assessed rapidly andaccurately to produce adequate information formaking correct decisions. Therefore, we stronglycounsel health managers to make use of computer-generated graphics so they may wisely assess thepossible solutions to health problems.
REFERENCES
1. R. Eliot Greene and R.D. Parslow, Computer Graphicsin Management (Princeton: Auerbach Pub., Inc,, 1970),
pp. 97-140.
2. Robert A. Greens and Victor W. Sidel: “The Use ofComputer Mapping in Health Research; Health Serv-ices Research (Fail-Winter 1967), pp. 243-258; RobertLewis and Lawrence Chadzynski, “EvolutionaryChanges in the Environment, Population, and HealthAffairs in Detroit, 1968-71 ~ Environmental Changes,Vol. 64 (1974), pp. 557-567; Howard Fisher, The Useof Computer Graphics in Planning (1970), paper pre-sented at the 1970 National Planning Conference of
the American Societv of Planning Officials,
3. G.E.A. Dever, “An Epidemiolog~cal Model for Health
Policy Analysis,” Soc;al Indica~ors Research, VOI. 2,No. 4 (1976), pp. 453-466.
4. C.H. Hertz and T. Orhaug, “The Ink Jet Plotter: AComputer Peripheral for Producing Hard Copy Color
Imagery: Computer Graphics and Image Processing:An International journal, Vol. 5 (1976), p, 1.
82

THE STATE’S ROLE IN DEVELOPING A MULTIPURPOSEHOSPITAL CARE COMPONENT IN THE COOPERATIVEHEALTH STATISTICS SYSTEM
Mr. Kenneth O. Paisley, Director, Health Plan Development Services, New [ersey State ‘Department of Health: ”Trenton, ”New Jersey -
It may sound paradoxical, but, to increase thenumber of purposes for which hospital care datacan be used—to “fragment” the data yield, in asense—it is first necessary to reduce the degree offragmentation that seems inherent in the develop-ment of the component. All the stray end! need tobe tucked in and the rough edges rubbed off theorganizational pieces that need to fit together.
In New Jersey some of the pieces blended nice-ly and we like to think we planned it that way,however, luck played a role. Some pieces haveedges still in need of sanding, but we don’t knowhow fine a grain of sandpaper we need.
Let’s start with the things we can be pleasedabout.
‘ In attachment A are a set of arrows and itemson the left that delineate State Department of ‘Health activities and entities. Those on the right areFederal.
Last July, largely in response to P.L. 93-641, theNational Health Planning and Resources Develop-ment Act of 197’4, the Department of Health cre-ated a new Division, the Division of Health Plan-ning and Resources Development. Four units com-prise the Division: Health Res?ttrces DevelopmentServices, which includes the Hill-Burton and Certif-icate of Need functions; Health Plan DevelopmentServices, the planning unit; Health Economics Serv-ices, the rate-setting unit; and Health Data Re-search and Analysis Services, known to everyoneboth inside and outside the Department of Healthas, iimply, “the data unit”. Last week the Depart-ment of Health submitted a proposal tb the Federalgovernment to have the entire Division designatedas the State Health Planning and DevelopmentAgency under P.L. 93-641.
Meanwhile, over on the Federal side, the Bu-reau of Health Planning and Resources Develop-ment (BHPRD) and the National Center for HealthStatistics (NCHS) developed a formal agreement,called a Memorandum of Understanding, and a 3-year work program. The Bureau of Health Planningand Resources Development is charged with over-seeing the implementation of P.L. 93-641, andsome agreement has been reached that NCHS datawill be the primary source for the planning data thelaw requires. We can’t take credit for that linkage.That’s just one of the events we applaud.
As you know, P.L. 93-641 mandates the use ofrather specific categories of data for health plan-ning. The Federal policy now appears to advocate
the use of existing or secondary data wherever pos-sible, providing technical assistance in locating andusing such data. Primary data collection efforts willbe focused on the National Center for Health Sta-tistics’ Cooperative Health Statistics System.
So the Federal government united their plan-ning and data units (BHPRf) and NCHS) function-ally for P.L. 93-641, and we found to our good for-tune our State data unit situated both structurallyand functionally within the proposed State planningagency. The Federal government decreed that theCooperative Health Statistics System (CHSS) will bethe primary data source for P.L. 93-641 and ourdata unit’s mission statement already stated that oneof our primary goals was to become part of theCooperative Health Statistics System.
~rtother fortunate occur~ence was that therate-setting unit in the Department, for its ownpurposes—and oblivious of the Cooperative HealthStatistics System—promulgated a State regulationrequiring every acute general hospital to submit tothe Department of Health hospital abstract (or dis-charge ‘summary) data on ever~ inpatient.
Last December the New Jersey Department ofHealth received a CHSS contract for Hospital CareStatistics. At present there are only 10 States with aCHSS Hosp~al Care component” contract and weare ‘one of the few that has assurance of receivingabstracted information on virtually every inpatientin every general acute hospital in the State.
So we had a well-planned reorganization thatproved to be providential, and a fortuitous regula-tion passed for another purpose. The next step wasto take an old. hand-me-down committee, alreadyin existence, trim it, and add some new material soit could match our new data needs and Dlans.
The committee was the Interagen~y AdvisoryCommittee on Health Manpower and it was advi-sory to the Office of Health Manpower in the De-partment of Higher Education when that office wasconducting surveys of health manpower. When ourdata unit was created those manpower surveys werepassed over to it and the Interagency Committeethen became advisory to the Department of Health.We decided to broaden the committee by making itan Interagency Advisory Committee on HealthData with four subcommittees, one for each of thefour CHSS components on which we are focusing:Vital Statistics, Manpower, Facilities, and HospitalCare. Thus, the core of the old Interagency AdYi-sory Committee on Health Manpower became the
83

Attachment A
P.L. 93-641 Health Planning and Resources Development Act of 1974
led to the creation of led to the
IN.J. Dept. of Health’s Division of Health agreement between federal Bureau of HealthPlanning and Resources Development Planning and Resources Development and
1National Center for Health Statistics (NCHS)
which consists of “ I
requirementsled to
In particular,
1
the NCHS 7-com~onent Coo~erative
1
Health Statistics System (CH’SS),
1one component of which is
1
Hospital Care Statistics (dischargesummaries)
\
regulation contract
‘\
% “%+Q.~
regarding for Ot e~ehospital
d,> \$/ $!
discharge ~h v
summaries
\
\ “+”’’””
r
> New Jersey Department of Health’s Hospital CareComponent in the NCHS Cooperative Health Statistics
84

new Manpower Subcommittee, and we soonchanged the new committee’s name to “Technical,Advisory Committee on Health Data” or“TACHD”, although persons from a variety ofhealth care data providers and users continue tocomprise it.
We had learned over the, years that one of thechief complaints from the people who are asked toprovide raw data is that the tabulated and analyzedresults are often not adequately disseminated. Asone person in a local agency in a neighboring Stateput it, in complaining about a State agency, “Datadefies the law of gravity, we send the stuff up,. . . and it never comes back down.” We had atsolearned that frequently not enough input is soughtfrom potential users of data regarding items thatmight be added to a data collection instrument,useful levels of aggregation, and valuable kinds ofanalysis that would yield optimal benefits toeveryone.
So we created the TACHD. The purpose ofthis committee, as stated in its guidelines, is to ad-vise the director of the data unit regarding thatunit’s objectives, which are: (a) to respond to theCHSS requirements; (b) to address the require-ments of major health data providers and users,and th”e impact of the Cooperative Health StatisticsSystem on them; and (c) to integrate and coordi-nate the. requirements of these other data providersand users with CHSS requirements.
Some of the members of TACHD come from,for example: the State’s health manpower licensingagency; the Office of Health Manpower in the De-partment of Higher Education; the Medical Societyand the State Nurses Association; Blue Cr”oss, Pru-dential (representing Medicare) and Medicaid;PSRO’S; Health Systems Agency (HSA) data people;the Hospital Association and the Hospital Researchand Educational Trust.
The Hospital Care Statistics Subcommittee toTACHD also includes persons from some of thesesame organizations and, in addition, has two Regis-tered Record Administrators, a hospital administra-tor, and persons from the Department of Health’splanning and rate-setting units.
The primary function of the Hospital Care Sta-tistics Subcommittee is to advise, review and makerecommendations to the director of the data unit.regarding compliance with our CHSS contract spec-ifications and adaption to the needs of potentialusers of hospital care data. We specified in our con-tract with NCHS that we would determine, via theTACHD and the Hospital Care Subcommittee, andI quote, “the detailed needs of users of hospitalcare data, including but not exclusively: the Nation-al Center for Health Statistics; PSRO’S; HSA’S; oth-er State and local planners; other State agenciesand the certificate-of-need process; hospitals; and
third-party payers.” Our CHSS contract, which isfor one year, is for the development of the compo-nent. Rate-setting is, of course, already collectingthe data for their own needs. But our goal duringthis year is to find out how we can adapt the hospi-tal discharge data system of rate-setting to the re-quirements of CHSS and other data users.
The chart labeled “Preliminary Comparison ofHospital Discharge Data Items in New Jersey Utili-zation Program and those required by PotentialData Users,” is attachment B. This is, quite literally,a “preliminary” comparison since it was done be-fore we wrote our proposal for the Hospital Carecomponent. So please regard it as, in some sense,conjectural.
We do know that 18 items presently containedin the New Jersey Utilization Program (NJUP) formare required by the Cooperative Health StatisticsSystem, and another eight are optional to CHSS butalready appear on the NJUP form.
Attachment C is an illustration of our proposedsystem for coordinating the needs of several datausers.
Under the recently adopted State regulation,data from the medical abstracts of all of the NewJersey hospitals will come into the Department ofHealth on a regular basis. Nearly half the hospitalsare on Professional Activities Study (PAS); half areon NJUP, an abstracting system that is a variant ofthe Hospital Utilization Program of Pennsylvania,and under the aegis of New Jersey’s Hospital Re-search and Education Trust; and five hospitals havetheir own or subcontract out for this service.
From the abstracts, relevant data items can beextracted and decoded, to meet the needs of thevarious data users, CHSS, rate-setting, health plan-ners, PSROS and the like, onto one New JerseyState Master Tape. The described process could beperformed by the Department of Health or an in-dependent subcontractor.
In order to avoid duplicative costs, data userscould share the cost of overlapping data items andbear the cost themselves for the nonintersectingdata items. Since rate-setting will need data itemsfrom the rehabilitation hospitals (CHSS will notneed data from these hospitals) an independentarrangement to receive the data, extracted anddecoded, could be made.
Future implementation of the CHSS -hospitalcare component will result in at least the tapes andoutput indicated in the broken-line box, center-right, on the flow chart. However, given the imme-diate data needs of rate-setting (Rate Review or“RR’ in the flow chart), a New Jersey State MasterTape (NJSMT) will have to provide data for gener-ating reports as a rate-setting function this year.
Among other things, the rate-setting unit willbe looking at diagnosis-related groupings of pa-
85

.Attachment B
PRELIMINARY COMPARISON OF HOSPITAL DISCHARGE DATA ITEMS INNJUP AND THOSE REQUIRED BY POTENTIAL DATA USERS
Data Items in NJUP Data items Required by Potential Data UsersNJUP MedicareItemNo.
(SSA formCHSS Rate-setting PSRO 2784) HSA
1
2456789
10f 11
12
13141516171819202122232427282930313435
Hospital IDPatient ID (Med. Rec. No.)Admission Class.Admission HourAdmission DateDate of Principal procedureDischarge DateBirthdateSex and RaceReferral SourceExpected Principal source of
PaymentDischarge StatusPost-Op DeathTime of DeathTransfer DestinationAccom. at DischargeSpecial Units and DaysPrimary ServiceSecondary Service “Consultations by ServiceAttending ,PhysicianOperating PhysicianOther Physician or SurgeonPrimary DiagnosisOther DiagnosesPrincipal ProcedureOther ProceduresResidence Code (Optional)Living ArrangementTotal Charges
xx
xxx x
xxxxxxx
xxx
xxxxxx
x x
xxx
xxx
xxxx’
xx
xx
xx
xx
xx
x x x x xxxx
xx
xx
xx
xxxxx*’
xxxxx
xxxxx
xxxx
x
x
xx
x.
In addition, there are a number of other data items required by PSRO and Medicare which the NJUPsystem does not presently incorporate.
*Zip Code Required
86 ,

Attachment C
FOR COORDINATING THE HOSPITAL DISCHARGE DATA NEEDS OF SEVERALDATA USERS (prepared by HRET) /-
/ Go:p? .\
I Systems\ ~’s;;:mbPAS f
{ORMAT 1
\ NJUP ~
‘r ‘O”+
XQ
PAS
Q
NJUPHospital Hospital*(47) *(GO)
gtr ct an
-~ljPing.
~PSRO
T~ code~
.mmI
“PNJUP
Rehab LHosp.(5)
----- ----- ----I DOK/HRET
Extract_RR***
-Ping. I--------+---;
Q*Q~ARTE~ IDOETAPE I
I
+I
‘lLQ+------------
Qu~f~‘TAPE
229-121 0 -77 -787
tients (AUTOGRP), in analyzing a hospital’s costs.The whole concept of rate-setting is based ongrouping together hospitals of similar relevantcharacteristics, in order to find normative ranges incosts for specific “cost centers”. When these group-ings incorporate the data from the discharge sum-maries, the rate-setting process will be further im-proved, and we will be able to get a clearer pictureof where they stand in relationship to other hospi-tals.
The tape would also be expected to providedata for reports for State health planning activities(Ping.), partictiarly patient origin studies (PAT.ORG). At present, our patient origin studies arehand-tabdated, rather’ than computerized and wedo them on the basis of one- to two-week sample ofhospital inpatients, never knowing if that weekspatients are atypical or representative of the wholeyear’s patients. ‘
It is intended that the data from the mastertape will also help to meet some of the data needsof the five HSA’S.
bowing, for example, the age of inpatients,the source of payment, the kind of facility to whichthey are discharged, their diagnoses and the kindsof procedures that were part of their treatment,HSA planners can be more responsive to localhealth needs. These latter uses—rate-setting, Stateplanning and HSA functions-are demarcated inthe broken-line box, lower left, on the flow chart.
Given the fact that New Jersey’s eight PSRO’Sare in various stages of development, coordinationwith the data needs of the PSRO’S and the Bureauof Quality Assurance involves much more discus-sion and collaborative effort than coordination withthe other data users mentioned above. That’s partof our bundle of loose ends.
And, adequate dissemination will probably be aloose and elusive end perennially fluttering in thebreeze.
By law, any data in the Department of Healthis in the public domain (with, of course, the neces-sary built-in confidentiality protection to assureanonymity of individuals in a data file). So anyonecan come into the Department and look at whateverwe have, even when we can’t afford to distributeeverything to everyone. I’m hoping a good systemof disseminating information can be developed onwhat data is available, even when we can’t dissemi-nate the data itself, and potential data users willthen be able to come in and acces,swhat they need.
To sum up, we have barely begun and have along way to go in optimizing the functioning of ourdata unit. Time is needed to go from the planningand development stage through the implementationstage to become fully operational in meeting theneeds of actual and potential health data users inNew Jersey. It will take a-lot of effort and coopera-tion on the part of all concerned to achieve ourgoal—an optimally functioning State health datasystem.
.
88’ ‘

REGIONAL HOSPITAL REPORTING SYSTEMS
Mr. William A. ONeil, Associate Director, Systems and Research, Hospital UtilizationProject, Pittsburgh, Pennsylvania
How does a regional hospital reporting systemdiffer from a State or national reporting system? Itdoes cover a larger area as you may suspect, but inthe case of the Hospital-Utilization Project (HUP) -the area is not necessarily contiguous or regional.Perhaps the best way to describe the regional sys-tem that has been developed by HUP is to walkthrough the stages as the development has takenplace.a
A littte backpound on the founding of theHospital Utilizati~n Project, that is, HUP~ may behelpful before we get into how we have expandedfrom a Statewide data system into the country’slargest regional system.
HUP was founded by a county medical societyin Western Pennsylvania in 1963. The originalpurpose was to gather data to refute a zealous in-surance commissioner who claimed over and/ormisutilization of hospital beds and services as wellas to provide hospitals with the reports necessary todo utilization review, establish length of stay andpatterns of care. As the saying goes, “It’s an ill windthat doesn’t blow some good” and in 1966, the en-actment of Medicare gave added impetus to hospi-tals for joining health data systems. This, plus, thestimulus of a Title 19 monitoring system in Penn-sylvania, was one of the chief factors for HUP’Sgrowth to a Statewide data sy~tem in the late 60’s.Hospitals in the neighboring States, principally NewJersey, also expressed interest in the program.
In 1973 the Blue Cross Plan of Kentucky ap-proached HUP with an interest in setting up a simi-lar Statewide system. They were pleased with theHUP abstract, reports and the staff support whichcould be provided. That was the initial step towardthe HUP regional program.
System Installation
Now, let’s investigate how and why a State goesabout setting up a Statewide data system buildingon an already established and proven system.
HUP recommends to the interested agency thatit first gain endorsement of the State medical socie-ty, hospital association and other major healthagencies. It should also keep the appropriate Stateagencies advised. HUP believes this is a good policythat helps a State from having to support morethan one health. data system. By obtaining appro-priate official endorsements in the beginning astronger foundation is laid and the chancesof dualsystems lessened.
With regard to staffing, HUP recommends amedical director, full or part-time, a program direc-tor, personnel trained in medical record administra-tion and necessary support staff for the quality con-trol function and clerical duties.
Training begins with key personnel of the newprogram spending several days with the profession-al staff at HUP learning the basic program andbecoming familiar with the system and operation.This orientation includes a detailed review of workflow beginning with the completion of the abstractin the hospital; abstract batching and submission;data receipt and quality control; data conversion;
data processing; report generation; and data stor-age. A detailed review of the procedure manualtakes place including use of the miscellaneous trans-mittals required by’ the system. These training ses-sions are fairly comprehensive and require a greatdeal to be absorbed in a short period of time. Tosupplement the training, HUP also provides a re-gional health data system manual that covers everyaspect of the system including new hospital enroll-ment, physician coding and use of the many formsemployed in the operation of the system.
System Support
HUP supports its affiliated programs in manyways. The abstract used by HUP is the same oneused by the out-of-State programs. Their hospitalsalso receive the same basic reports as HUP directmember hospitals receive. In ~act, just about every-thing is the same, except each hospital has the op-tion to select up to 24 special reports a year from aprogram library containing over 300 programmedreports. These reports have been developed overthe years and were custom made to meet the specialneeds of participating hospitals. Additionally, HUPhas a Medical Care Appraisal Program that is avail-able to all participating hospitals. This program,based on a methodology developed by the JointCommission on Accreditation of Hospitals, takesmuch of the drudgery and legwork out of manualaudit, and provides clear and concise summaries ofthe data from which the hospital medical and/ornursing staff can take appropriate action.
Needless to say, the staff at HUP is’ alwaysavailable via wats line for consultation to assist theaffiliated programs in answering any question orclarifying any points or procedures that are un-ctear.
89

Affiliated Program Size
HUP has affiliated programs in the States ofAlabama, Arkansas, Georgia, Kansas, Kentucky,New Jersey and Tennessee. All of these programsat the present time are marketed through a BlueCross Plan with one exception. In New Jersey thesystem works through the Hospital Research andEducational Trust of the New Jersey Hospital Asso-ciation. The total HUP system represents 10 per-cent of the Nation’s short-term acute hospitals, re~-
1-
presenting approximately 3 million dischargesnually.
Advantages
Where lie the advantages of the approachdescribed? Some of the major advantages are:
1.2.
3.
4.
5.
The backup of experienced personnelUtilization of a nationally recognizedstract form
.an-
just
ab-
Availabfity of an already well-documentedprocedure manual
Availability of a set of tested routine andspecial reports“Instant data processing” using computerprograms that are already written, testedand proven, with a 3 to 5 day turnaroundtime service.
1. To expand on these advantages in reversesequence let us look at the data processingfeature. How many of you have “experienced”the installation of a computer or a data sys-tem. It has grayed (or balded, as the case may ~be) the head of many. Everyone knows thatjust about any program of any complexity has“bugs” in it. These are the gremlins that some-times give programmers reverse results andcause anxieties.
The cost of the HUP programming effortmight conservatively be estimated to bearound a quarter of a million dollars. Even intoday’s inflated economy - that still is a lot ofmoney, and quite an investment. By joiningwith an established data system, a duplicativehigh cost can not only be avoided, but moreimportantly the new affiliated program hasavailable a complete battery of routine andspecial reports evolved from many years ofstable background and experience.
2. This leads to still another major advantage.Report development is an extremely time-consuming task, especially when one tries toinitiate it through a committee mechanism. Ifa set of reports have been developed throughmany years of experience and are available,
90
3,
4.
why not use them? Hospitals across the coun-try are not singularly unique in their dataneeds.
Over the years HUP has developed a setof monthly, semi-annual and annual reportsthat meet the hospital data reporting require-ments of the Joint Commission on Accredita-tion of Hospitals. These reports aid the hospi-tals in determining their patterns of care incomparison to similar hospitals in the samegeographic area, and provide meaningfulanalysis for improving utilization review. Ad-ditionally, the data can be used for more effi-cient administration, medically oriented activi-ty, and health care planning. HSA’S will un-doubtedly look to such data in their delibera-tions, not to speak of PSRO’S.Two of the other major advantages of linkingup with an established health data system area proven abstract and a well-documented pro-cedure manual. Neither one of these thingscome easy, and, HUP’S experience has proventhat years are required from inception to truedevelopment and maturity. Additions andmodifications to the data elements are re-quired on a regular basis to meet the changingneeds of the hospitals.Last, but certainlv not least, is the advantageof being trained’ by expe~enced personn;liEstablishing health data systems is no easy task,but with the support that experienced person-nel can give, the job is made much easier.
HUP supports its affiliated programs in manyways. On an annual basis we invite the personnelfrom these programs to participate in meetings inPittsburgh. At these meetings the latest programdevelopments and revisions are reviewed, It alsoprovides an opportunity for the participants tomake suggestions and comments based on theirexperience, and resolve problem areas.
HUP also supports these State programs byproviding assistance at regional hospital conferenceswith displays and printed materials, This year, forthe first time, HUP published “Length of Stay forthe Mid-South Region: in addition to its 3rdbiennial publication of “Length of Stay for the Mid-Atlantic Region,”
Our affiliated members not only share in theimprovements to our basic hospital program, butalso have available to them all of our special pro-grams. HUP has the only nationwide data programsfor Rehabilitation Facilities and Skilled Nursing Fa-cilities. We also have a Cancer Registry Programand a Pathology Program. We are piloting anAmbulatory Care Program and developing a similarprogram for the Emergency Department. As thesenew programs are developed they become availableto the affiliated membership. This method is not

only economical because of the savings in dollarsand manpower, but it is extremely advantageous tohave data collected for each of these programs us-ing a uniform data set. This uniformity not onlyprovides a common data base but also covers largegeographic areas. These types of data bases havemany uses to health facility administrators, medicaland nursing staffs, utilization review personnel,epidemiologists, researchers, health planners andgovernmental agencies.
Let me conclude by suggesting that this type ofan approach should be taken more often ratherthan having States rely on Federal funds to developtheir o~vn program. The cost for developing these
types of programs are not only enormous but it’shorrible wask of time and money to “reinvent thewheel” in each State. Additionally, some States havetoo few hospital discharges to support an independ-ent program that requi;es a com-puter and associat-ed equipment and personnel. All of which repre-sents a sizable and ongoing cash outlay.
As the need for data ~rows in the health carefield to meet the ever-;ncreasing demands ofPSROS, HSA’S, fiscal intermediaries, and govern-mental agencies, it is incumbent upon all of us tosee that ~he major portion of the- funds availablefor the health care industry are spent, not on col-lecting medical data, but on curing the sick.
THE PROFESSIONAL ACTIVITY STUDY: THE PRINCIPALPROGRAM OF THE COMMISSION ON PROFESSIONAL ANDHOSPITAL ACTIVITIES*
Mr. Edwin G. Stephenson, Senior Vice-President, Commission on Professional andHospital Activities, Ann Arbor, Michigan
The Professional Activity Study, can only beunderstood properly in the light of its historicalcontext and its sponsorship. Its history actually be-gan in 1950 when the W.K. Kellogg Foundationmade Ia small grant to the Southwestern MichiganHospital Council to permit the study of professionalactivities in hospitals by making interhospital com-parisons of the hospitals’ routine, traditional, medi-cal statistical reports. This project was called theProfessional Activity Study (PAS). The Commissionon Professional and Hospital Activities (CPHA) wasoriginally established to take over PAS. PAS re-mains the largest single program of CPHA.
In the early fifties, the first three years of PAS,it became apparent that simply making interhospitalcomparisons from statistical reports compiled ineach hospital was unsatisfactory. So the “modern”PAS was conceived and put in operation of 1 Janu-ary, 1953 when 13 small hospitals began completing“case summary code sheets” (now cded case ab-stracts), one for each patient discharged. ”Thesewere sent to the Southwestern Michigan HospitalCouncil, where with the assistance of the Universityof Mi&lgan, punchcards were prepared from themand tabdating machines were used 1) to preparesimple irtterhospital comparative studies, e.g., fre-quency of blood transfusions in maternity patients,2). to prepare for each hospital its own routinemonthly medical statistics reports, and 3) to index
*This statement was first presented by Vergil N. Slee,M. D., President of CPHA at a meeting of the AmericanHospital Association’s Committee on Physicians, 17 Febru-ary 1975, Chicago, Illinois.
The Commission on Professional and Hospital Activi-ties (CPHA) was established in 1955 by the joint action ofthe American College of Physicians, the American Collegeof Surgeons, the American Hospital Association, and theSouthwestern Michigan Hospital Cound. It is a not-for-profit Michigan corporation exempt from Federal ir,cometaxes under paragraph 501 (c)(3) of the Internal RevenueCode as a scientific, educational, and charitable organiza-,tion.
CPHA has the same sponsorship as in 1955, and onits Board of Trustees each of the national sponsors sup-plies two members, the Southwestern Michigan HospitalCouncil one. Five members-at-large are elected by theBoard itself, making a total of 12. CPHA is housed in itsown 84,000 squate foot building on its 36 acre “campus”in Ann Arbor, Michigan. Total staff numbers over 400employees and the annual budget is over ten million dol-lars.
92
each hospital’s medical records by diagnoses, opera-tions, and physicians. This is still the modus oper-andi of PAS.
It took less labor in the medical record depart-ment to fill out the code sheet on each patient thatrit did manually to maintain the record departmentindexes and compile the montfdy statistics, Thisturned out to be the economic base for PAS (mak-ing CPHA self-supporting by 1958) because thehospitals later were able to pay for PAS withoutincreasing their record department budgets. This isstill true.
In .1953 it appeared that hospital administra-tors would support PAS because it would providetheir medical record department statistics and in-dexes economically and accurately. In fact, in 1954McEachern publicly endorsed PAS as “work simpli-fication”.
But in 1953 a little of the Kellogg Foundationgrant money was spent for dinners every 3 or 4months for the chiefs of the medical staffs of thepilot study hospitals. At each meeting the projectstaff presented a study comparing clinical dataacross the group of hospitals. The intense physicianinterest was surprising and pleasing, and decisionswere made immediately which permanently estab-lished the focus and priorities of PAS, PAS would:
1. give emphasis to helping the medical staff in
2.3.
4.
5.
‘=rrying out its staff” fu;ctions, primarily forquality control (not the individual physicianin his practice),assist the administrator,“automate” certain record department func-tions,provide a national (and regional) data sys-tem, andestablish a source of information on hospitalpatient care.
By 1955, the executives of the arnerican Col-lege of Physicians, the American College of Sur-geons, and the American Hospital Association were,persuaded of the potential of PAS, and the leader-ship of these executives led to their organizationssponsoring the establishment of CPHA.
PAS has grown over the years until today about2,200 hospitals participate, These hospitals dis-charge about 17,000,000 patients per year and ac-

count for about 42 percent of the short-term dis-charges in the United States and 28 percent inCanada.
PAS should be seen primarily as two things:
1. PAS is a collaborative study in which thehospitals are truly participants.
2. PAS is an extension of each hospital’s medi-cal record department.
To elaborate on these aspects of PAS:
First the collaborative studies. Some of theseencompass all 2,200 hospitals, some the hospitals ina local region (e.g., a single State or metropolitanarea), others a particular class of hospitals (e.g.,metropolitan nonteaching). The collaborative stud-ies are possible because, under the contract of parti-cipation, the hospitals expect CPHA to keep theabstracts of their medical records on magnetic tapeand to use the data for study purposes. Studies in-clude spontaneous publications by CPHA, thosedone at hospital request, and those done for otherresearch organizations. The identity of the hospitalis kept strictly confidential unless the hospital itselfspecifies otherwise. (Patient and physician identityare never known to CPHA).
Then in its role as an extension of the hosptal’srecord department, PAS first provides the indexesof the hospital’s medical records according to diag-nosis, operation, and physician, and the hospital’sroutine medical and administrative statistics.
But PAS also puts at the end of, the telephoneline (calls are taken on an “800” number) a liaisonrepresentative who links the hospital record depart-ment (or any authorized hospital spokesman) withCPHA’S entire professional staff, technical facility,data library, and education system.
In the professional group CPHA now has 6physicians, 3 hospital a~ministrators, 4 educators, 4RN’s, 10 medical record practitioners, 5 statisticians,about 60 health record analysts (experts in data re-trieval and display), and about 70 people involvedin computer systems and programming.
The technical resources include the Commis-sion’s 2 large computers, a Honeywell dual 6000and an IBM of the 370 series.
The data resources include. well over 130,-000,000 hospital medical record abstracts goingback over 20 years, and 17,000,000 more are addedeach year.
The education resources include professionaleducators, experienced instructors, integrated edu-cation programs ranging from 1 or 2 hours to 5days, audio-visual materials (produced in-housefrom design through graphic arts and printing),and a well equipped and attractive conference cen-ter within the CPHA headquarters.
THE PAS SYSTEM
We speak of the PAS System in order to intro-duce the idea that once a hospital is in PAS, it hasaccess to a family of options.
A case abstract (for every patient discharged) isthe building block of the system. Originally a singlePAS Case Abstract, revised every two or threeyears, was adequate. In 1971 an alternate, abbrevi-ated form called pre-PAS, was introduced. Theseare now called “Type 1“ abstracts. Then in responseto external demands on the hospital, “Type 2“ ab-stracts were made available with specific accommo-dation for the PSRO and UR needs, making a totalof 4 input documents.
From data captured on one of the abstracts thehospital not only participates in the ProfessionalActivity Study (PAS) itself, and gets the standard setof PAS reports (which are tailored to the hospital’sown requirements) but it also can obtain an optionalarray of reports through various extensions to PAS.These extensions or programs include:
1.23.4.
5.6.7.8.
the Quality Assurance Monitor (QAM)the Length of Stay Study (LSS)the Study of Patient Charges (SPC)the PAS Perinatal Study (here a supplemen-tary abstract is needed)PAS Profilesthe Concurrent Review Study (CRS)the Medical Audit Program (MAP)Special, studies done for the hospital on re-quest
The hospital’s data are displayed in statisticaltabulations, in printouts of the abstracts of individu-al patients, and in graphic displays. There arestandard displays monthly, quarterly, and semian-nually. The special studies are custom-tailored stud-ies of the hospital’s own data and also of its owndata compared with other, “control”, (anonymous)hospitals.
Hospitals may also capture special data of theirown choosing, “targeted data” or “exception data”for example, and can have speciaI tabulations madeof those data. And the hospital’s data contribute tothe publications from PAS.
Certain features and components of the systemare discussed in more detail below.
Quality Assurance Monitor. It is now technicallypossible to monitor (screen) the quality of some ofthe care of all of the patients in a hospital all of thetime. This is done by periodic, (usually quarterly)statistical review of medical record data with respectto appropriate parameters.
It seems clear that comprehensive monitoringshould be done for two reasons:
93

1.
2.
The hospital is responsible for exercisingreasonable diligence with regard to the quali-ty of care for all patients, andMedical audit studies, medical care evalua-tion studies, should be carried out with dis-crimination, i.e., priorities for specific stud-ies should be determined .by facts ratherthan personal interests. This is the only wayto maximize their educational potential aswell as to achieve their purpose in quality
. control. The monitor points out the areasfor specific studies.
CPHA’S “tool for this comprehensive, continu-ous, monitoring is the Quality Assurance Monitor(QAM) which first appeared in June 1974 as theQAM Report Book, a volume to be completed inany hospital, whether in PAS or not, by the healthrecord analyst. This report book, now in its secondedition, includes norms showing the actual - per-formance of PAS hospitals in the United States as awhole, in each of its four census regions, and inCanada, and urges that individual hospital medicalstaffs go one step farther and set up their ownstandards or thresholds for further investigation.
The QAM Report Book, 2nd Edition, is in par-allel with the computerized version of this secondgeneration of QAM known as QAM-2. QAM-2 wasintroduced in April 1975 for hospitals in the PASSystem. This is a co-mputer-printed report whichgraphically compares the hospital against regionalnorms, provides hospital-wide screening of basicinvestigation and management of patients, carryingthis type of screening down to the major clinicaldepartment level, and then inspects the care of pa-tients with the most frequent diagnoses and opera-tions.
The third generation of QAM, QAM-3, will beavailable by October 1976. The most significantimprovement in QAM-3 will be the addition of onemore column which is being contributed by specialcommittees set up by the American College of Ob-stetricians and Gynecologists, the American Collegeof Physicians, and the American College of Sur-geons. This will be alongside the column now la-beled “Pattern Standard” and will contain the per-centage proposed by these medical specialty organi-zations as the desired performance with regard toparameters within their areas of concern. (In addi-tion the parameters and groups are being reviewedby these advisory committees and changes will ap-pear there also). This will for the first time give themedical staff, administrator, and trustee of thehospital an authoritative national statement as toperformance goals. The column for carrying thehospital’s own goals of course will be retained.
PAS Profiles were introduced in 1973. Theyare now available for over 40 diagnoses, operations,and other patient groups, e.g.,
94
Abdominal hysterectomyAcute bronchitisAcute myocardial infarctionAppendectomyCesarean sectionCholecystectomyDisplacement and derangement of discFracture of upper end of femurHyperplasia of prostateHypertension “Intestinal infectious diseaseMalignant neoplasm of breastMetrorrhagiaPneumoniaSenile CataractSpontaneous abortionTonsillectomy with adenoidectomyTransfused patients (excludes newborns)
The Profiles pertain to QAM groups, i.e., eachone covers the same group of patients as does agroup in QAM, and the parameters in QAM ;re asubset of those in a PAS Profile, Thus a Profile cor-relates directly with the monitor itself.
Utilization Review. Beginning in 1975 PAS allo-cated specific input areas of the case abstract forinformation on admission certification and contindued or extended stay review so that PAS couldprovide the individual hospital with accounting forits concurrent review activities for reporting toMedicare, Medicaid, and PSRO, and could alsomaintain internal control. With the advent of Type2 Case Abstracts, hospitals can elect to record eachextension of stay if they wish. This permits produc-tion of the report series called the Hospital ReviewReports. A special length of stay analysis then pro-vides one measure of the effect of the concurrentreview.
Publications from PAS. The best known of theCPHA publications are the annual length of stayvolumes which date back to 1963. 1975 data (to beavailable in September 1976) will be found in a setof 6 volumes, one for the United States, one foreach of its 4 census regions, and one for Canada. Alength of stay volume for California was publishedin 1975 as an exact counterpart of the CPHAlength of stay series mentioned above. This was thefirst publication for a single State and the first onewhich merged data from two sources, CaliforniaHealth Data Corporation’s “MR-l” and PAS,
In February 1976 a volume, Hospital Mortality,PAS Hospitals, United States, 1972-73, beginning anew series, was published.
CPHA also publishes the PAS Reporter whichcarries studies done by CPHA staff using PAS data.
The preceding discussion has concerned thePAS System. CPHA is involved with other mattersthat are not parts of PAS, but spring from the

problems, experience, and opportunities of devel-oping and operating PAS. Some of these of specialimportance and current interest will be discussedbelow:
Education ProgramsResearchProfessional Standards Review Organization
(PSRO)Classification of Diseases ‘and OperationsMedical Record DataData QualityRegional Data
CPHA EDUCATION PROGRAMS
CPHA’S continuing medical education meetsthe criteria for hour-for-hour credit in Category Ifor the Physician’s Recognition Award of the Amer-ican Medical Association. Similar certification hasbeen- provided by the American Academy of FamilyPractice, the American Osteopathic Association, theCollege of Family Physicians of Canada, the Ameri-can College of General Practitioners of OsteopathicMedicine and Surgery, and more recently by theAmerican Medical Record Association. “
A series of five interrelated courses is routinelyconducted regionally throughout the United Statesand Canada. The courses are offered in a plannedsequence which allows the health care professionalto progress through the series according to hls ownrequirements.
The five complementary courses are:
1.
2.
Quality Assurance Workshops. These arethe core of CPHA’S education programs.They are intensive two-day sessions for phy-sicians and other health care professionals.Ideally physicians, the administrator, medi-cal record practitioner, and health recordanalyst attend as a team. The principles ofquality assurance, delivery control, and qual-ity control are discussed, and practice is giv-en in using PAS data in quality control.Workshops are open to both PAS and non-PAS hospitals and to health related organi-zations.Quality Assurance Tutorials. Tutorials aremore detailed than workshops. They areheld specifically for PAS member hospitals.The attending hospital team—physicians,administrator, health record analyst, andmedical record practitioner—reviews theentire hospital’s medical care as shown by aQAM computer display and then completes,to the extent possible, one medical auditstudy. Trustees and administrators also have
3.
4.
5.
the opportunity to review their own datafrom the perspective of management oftheir hospital.Coding and Abstracting Institutes. Theseone-day sessions concentrate on teaching theinput to the PAS System. They offer inten-sive instruction in the concepts and applica-tions of coding with H-ICDA and in theprinciples and techniques of abstracting forPAS.Introduction to Data Retrieval and Display.The health record analyst is a specialist indata retrieval and display. This three-daycourse is designed for the beginning healthrecord analyst. PAS System reports are usedto present and discuss techniques of effec-tive use of computerized patient care data.Advanced Techniques for the Health Re-cord Analyst. Designed for the practicinghealth record anal~st, this five-day tours;emphasizes techniques for the in-depthanalysis of patient care data. Registrants de-sign and complete independent studies us-ing PAS system reports (the hospital’s ownreports when the student is from a PAShospital) and other resources. Principles. andmethods of medical care evaluation arestudied and discussed. Prerequisites for thiscourse include a working knowledge of PASreports and basic data display skills.
In addition to the five routine courses, CPHAconducts (and participates in) special programs spe-cifically designed to meet additional needs identi-fied by the health care field.
CPHA RESEARCH
A great deal of research is constantly underway, some representing 1) special uses of the dataavailable through PAS, some 2) innovations in hos-pital statistics, and others 3) the development of newand improved information systems. An illustrationof each:
1) The Birth Defects monitoring Project, oper-ated in conjunction with the Center for DiseaseControl, the National Institute of Child Health andHuman Development, and the National Founda-tion, calls for periodic analysis of PAS data in orderto detect epidemics of birth defects so that epidemi-ological field work can search for possible causes.This, of course, covers about 40 percent of U.S.birth~ about 1,000,000 per year. This project re-quires the explicit permission of each hospital.
2) The relative value principle has been ap-plied to hospital charges with development of theResource Need Unit (RNU) and the Resource Need
95

Index (RNI) which offer a way of quantifying thecomplexity of a hospital’s case mix. Study is beinggiven by AHA and CPHAstaff to adding this newdmension to the hospitaPs finanaal statement andusing it in conjunction with administrative statistics.The RNI method (available in 1974) would haveassisted ~e hospital in petitioning the Cost of Liv-ing Council for price increases under Phase 4 ofthe Economic Stabdization Program, had the analy-sis shown a more complicated case mix. The meth-od should also prove useful in justifying exceptionsunder par. 223 of P.L. 92-603.
3) Emergency Department Study. In 1975CPHA received a two-year grant of $250,000 fromthe W.K. Kellogg Foundation to further developand market the Emergency Department Study (de-veloped with Kellogg assistance) which was intro-duced by CPHA on 1 July 1975. The monies fromKellogg help CPHA work with participating hospi-tals in establishing techniques for using the Study’sdata. This program, like PAS, allows hospitals toexamine their performance and compare it withothers with respect to quality of care, patient mix,and resources required. Twenty five hospitals withover 412,500 emergency visits annually are current-ly enrolled and paying a po;tion of the costs. Mar-tin L. Waldman, M. D., F.A.C.S. is Project Director.
PSRO
CPHA is a strong advocate of delegated review,taking the position that the hospital was already ob-ligated to exercise quality control under case lawand statutory law (some States): PSRO legislation(P.L. 92-603) reinforces that responsibility- The re-lationship is elaborated in a special articIe in theAnnals of Internal Medicine, July 1974 (Slee).
First attention in PSRO’S is being given to ac-counting for concurrent review activities, as men-tioned earlier. CPHA is working with planning and
condition PSROS to provide for individual hospi-tals and for the PSRO the netessary data. A basicreport set, called Hospital Review Reports, is usedto summarize admission certification and continuedstay review activity by diagnosis, physician, paymentsource, and reviewer.
For some PSRO’S, not desiring great detail onconcurrent review, the preferred approach willamount to a special report from PAS, with PAShospitals under delegated review entering theirsummary data on the Type I Case Abstracts. Forothers, the newly available Type 2 abstract willpermit the delegated PAS hospital to use a singleabstract to carry the full PHDDS (PSRO hospitaldischarge. data set) and concurrent review detail inaddition to the qudlty of care data in PAS. In otherinstances, one of the types of PAS Case Abstracts
96
may be used by the PSRO itself in nondelegatedhospitals. With ‘regard to Medical Care Evaluation(MCE) studies, much of the necessary data formany studies is already compiled in PAS Systemreports, and these will be modified as necessary inthe future, as thinking in this area is clarified byhospitals and review agencies.
CPHA provided to the American Medical Asso-ciation, for its project to develop screening criteriafor PSRO review, tables of frequencies of diagnosesfor the various specialties so they could determinethose diagnoses for which criteria would be neededunder the terms of the AMA contract with DHEW.A discussion of the screening concept appeared inthe June 1975 Bulletin of the American College ofSurgeons (Slee).
CPHA published a booklet in 1975, ConcurrentReview Screening—Criteria for Hospital Admissionand Assignment of Length of Stay, to assist hospi-tals in developing and implementing concurrentreview. Admitting diagnoses for about 90 percentof patients are covered.
CLASSIFICATIONOF DISEASES AND
OPERATIONS
Because the first purpose for PAS was to pro-~de interhospital comparisons, and this demandsuniform data, it has been necessary to becomedeeply involved in classification of diagnoses andoperations. In 1953 the Standard Nomenclature(AMA) was found unsuitable and PAS began usingthe 6th revision of the International Statistical Clas-sification, modified for hospital use by PAS, basedon the experience of the USP’HS and ColumbiaPresbyterian Hospital, New York City. PAS experi-ence then was drawn upon by USPHS in writingthe first ICDA (the adaptation being for hospitaluse) in 1959, and CPHA staff were deeply involved,In 1962 CPHA revised ICDA under a contractfrom USPHS.
When the 8th revision of the InternationalClassification of Diseases (formerly InternationalStatistical Classification) appeared from Geneva in1967, USPHS decided to make its own modification(ICDA-8) for all uses in the United States. A carefulstudy by CPHA staff found ICDA-8 had so manyproblems that PAS would be unable to maintaincomparable diagnostic and operative data acrosshospitals. A protest in person to the Surgeon Gen-eral was to no avail, and after an agonizing consid-eration of the problem, CPHA decided to print itsown volume, H-ICDA, for clinical use (details ofthe problems and issues are available upon request),

CPHA’S position was in effect ratified by Advi-sory Committees on Classification set up at CPHA’Srequest by the American Academy of Pediatrics, theAmerican College of Obstetricians and Gynecolo-gists, the American College of Physicians, theAmerican College of Surgeons, the American Os-teopathic Association, and the Society of Teachersof Family Medicine. These committees, provided atthe expense of their parent organizations, studiedall of the issues in-depth, and met with CPHA staffin the, drawing up of H-ICDA-2 (published in 1973)and in reviewing WHO efforts toward the construc-tion of ICD-9, due in 1978. The latter advice was~rovided at the request of Vertil N. Slee, M.D.,~resident of CPHA, ‘who was one-of the group of 4consultants to USPHS @th regard to ICD-9, andwho was a member of the U.S. delegation to thefinal WHO conference on ICD-9 in Geneva in Oc-tober 19’75. It is of interest that the largest block ofsubstantive proposals for ICD-9 from the U.S. hadbeen from CPHA and its advisors.
H-ICDA-2 is now the dominant classification ingeneral hospital use, has been recommended by theNational Professional Standards Review Council,and is the only classification in print with accommo-dation for the Problem Oriented Medical Recordand for outpatient and ambulatory needs.
Several of the organizations above who helpedwith H-ICDA-2, ACOG, AAP, ACP, and ACS,joined with CPHA in 1976 to form the Council onClinical Classifications, which will be administered asa division of CPHA. The Council has notified theSecretary of HEW of its concern that ICD-Q (WHO,Geneva) will not meet North American clinicalneeds, and of its desire to work with DHEW to cre-ate the necessary adaptation or to find some othersolution.
MEDICAL RECORD DATA
It is important for physicians and hospitals tobe concerned with hospital medical record data andwith the handling of that data by computer. Untilthe last few years, PAS and hospital discharge ab-stract systems have been of interes~ primarily toindividual hospitals. Hospitals in the discharge ab-stract systems found them useful for indexing med-ical records and for providing some assistance inutilization review. Hospitals in PAS had, in addi-tion, information directly useful to their medicalstaff committees and to researchers as describedabove. Now, as the Nation begins to get down tobusiness with regard to quality review, utilizationreview, Health Service Area planning, and the es-tablishment of PSROS, the medical record informa-tion issue has a new position of prominence.
There is a sudden interest in control of thedata on the theory that “who controls the data con-
trols medicine and hospitals”. There is a suddenrealization that here is a market for data systems,and hospitals and PSRO’S are hounded by dozensof “vendors” of computers and of computer serv-ices, some now operating hospital discharge systemsand others wanting to. Some of these vendors arecommercial institutions out to make a profit, someare able to offer services below cost through subsi-dies, and some are offering “free” services. In thelatter group are some of the Blue Cross plans andgovernment agencies.
There is a growing national sentiment to theeffect that all hospitals should be involved in whatare called hospital discharge abstract systems (PASnot only meets but exceeds specifications for suchsystems). This is being pushed through the PSROchannels and also through the Federal Govern-ment’s program for the Cooperative Health Statis-tics System, one component of which consists ofhospital discharge data.
Every viable medical care evaluation systemdepends upon abstracting of medical records. Insome systems, e.g., PAS, there is reliance on ab-stracting” of all medical records, a procedure inwhich the hospital develops professional abstracterswho are expected to attain and maintain high profi-ciency. Such systems provide multipurpose data,solving certain hospital administrative and house-keeping problems while at the same time permittingcomprehensive monitoring of the quality of careand providing a significant segment of the dataneeded for in-depth review. Others rely on ad hocabstracting for specific studies. These, of course,provide data for the individual studies only.
Hospitals must be concerned that not only aretheir own internal needs met, but that an optimalapproach is made to meeting the increasing varietyof needs for medical care data. Optimal may wellmean separate streams of data for medical, man-agement, planning, and fiscal matters.
DATA QUALITY
The accuracy of data is important. Thereseems to be a rising swell of concern on this issue.The current challenges are usually addressed at thehospital discharge abstract systems (not at claimsdata or death certificate data, which are also ab-stracted data). Sometimes charges come out veryspecifically: “You can’t believe PAS data”. But oftenit is hard to tell whether the challenger means PASspecifically, or abstracted data generically, verymuch as some people call all cameras Kodaks. PASis certainly no more error prone than any otherabstract system.
Some of the accusations, upon pursuit, turnout to be really that medical records themselves
97

don’t tell the truti about the patients. Othersamount to concern about the traditional process ofcoding diagnoses and operations. Others refer tothe accuracy with ~vhich abstracters transfer infor-mation from medical records. The handling of thedata at the computer center is generally accepted asthe most reliable link in the chain.
There is sometimes a contention that the ab-stracter who routinely abstracts all medical recordsnaturally does careless and perfunctory work. Thisis countered by the proposition that such abstract-ers become highly skilled and professional. Againstthe argument that abstracting for ad hoc studieswill give high quality data because of incentive canbe raised the suggestion that high proficiency wouldonly occur with more practice. There are no dataon these points.
The entire issue of data quality is an importantand complex one that should be investigated acrossall steps in all systems which require abstracts fromclinical records. CPHA has established an Office ofData Quality Control with an experienced Ph.D.statistician in charge. The office is responsible forevaluating the PAS data qtiality and monitoring thecontrols exercised throughout the PAS System fromthe moment of abstracting to the filing of complet-kd reports back in the hospital.
REGIONAL DATAThere is a strong demand and a valid need for
regional data, statewide, for PSRO’S, for metropoli-tan area, for Health Service Areas, and the like,Sometimes this is expressed as the need for a (sin-gle) regional health data system.
A system is defined as a collection of operationsand procedures, men and machines, united to ac-complish a specific objective. A system amounts toan assemblage of integrated subsystems. The hospi-tal discharge abstract data would be the content ofone subsystem of a health data system, and in manyareas more than one hospital discharge abstract sys-tem will work together as (sub) subsystems.
Note that the term “system” does not necessari-ly include a computer. Some regional health datasystems will have their own computer centers, Oth-ers will not. All will have the same problem—toobtain data from a variety of existing sources (exist-ing subsystems) and make a coherent picture fortheir own regions.
A problem arises when the term a regionaJ datasystem is mistakenly taken to mean that, by defini-tion, it includes the operation of all the componentsubsystems.
PAS is already used as the hospital dischargeabstract subsystem for regional data systems in Mi-chigan, Rhode Island, Alberta, Vermont, and otherareas. These are several arguments for PAS as notonly a national system but also as the local subsys-tem:
1. Data for quality of care review are inherentin PAS.
2. There are economies of scale in operating
3.
4.
5.
6.
7.
and continually refining PAS. - -Original design and development costs havealready been paid by grants and would nothave to be duplicated. Periodic system revi-sion costs are an accepted obligation of PASwithin its price structure.Interregional comparisons can be madewith standardized data, and they are easywith the data in one spot,Far more research using the data is feasibleat a single center than through a number ofcenters, even if they presumably are stand-ardized as to data content, computer pro-grams, computer hardware, and the like,For example, the Birth Defects MonitoringProject is feasible only within PAS,PAS enjoys the official backing of CPHA’Snational sponsors, representing medicineand hospitals at the highest level.CPHA can and does merge data from othersources with PAS data to create a total datapicture of an area,
98

THE NATIONAL HOSPITAL DISCHARGE SURVEY
W. Edward Bacon. Ph.D. Chief, HosDital Care Statistics Branch, NationA Center forHealth Statistics, ~ockville, Maryland
The National Center for Health Statistics con-ducts a family of surveys that provide morbidity sta-~isticson the civilian noninstitutionalized populationof the United States. However, only two surveys,the Hospital Discharge Survey (HDS) and theHealth Interview’ Survey (HIS), are capable of mea-suring morbidity associated with hospitalization inshort-stay hospitals. The HIS, because it relies onthe memory of a patient after discharge, does notprovide detailed information related to diagnosesand surgical procedures nor does it obtain any in-
1 formation about patients that died prior to or shor-tly after discharge from the hospital. The HDS isdesigned to obt~in information ~rom the medicalrecord of the patient regardless of discharge status,including diagnoses and surgical procedures as re-corded by a physician. The HDS also differs fromdischarge data systems of other organizations inthat HDS is specifically designed to provide scientif-ically valid estimates of uttlzation representative ofall short-stay hospitals in the U.S.
Planning for the Survey began in 1962. In1963, a feasibility study was conducted by theSchool of Public Health at the University of Pitts-
1 burgh. In 1964, a pilot test was carried out by theCen~er in cooperation with the Bureau of the “Cen-sus. Finally, with the “blessing” of the AmericanHospital Association, the American Medical Associa-tion, and other professional groups, the collectionphase of the Survey began in 1965 and has contin-ued every year to date.
The scope of the Survey is limited to all dis-charges from nonfederal short-stay hospitals in the50 States and District of Columbia. A facility is con-sidered a short-stay hospital if:
1.
2.
3.
4.
5.
6.
A
at least six beds are maintained for use byinpatients;it is licensed as a hospital in States with li-censure laws;inpatient medical care is provided under thesupervision of a licensed doctor of medicineor osteopathy;nursing service is provided 24 hours a dayunder supervision of a registered nurse;’separate medical records are maintained foreach patient admitted; andthe average length of stay for all patients isless than 30 days.
component of a health-care institution such.as an acute-care unit within a large medical center
is considered an in-scope hospital if these six criter-ia are met.
The Survey currently collects a subset of the, -Uniform Hospital Discharge Data Set or UHDDSon each sample discharge as shown on the MedicalAbstract Form (Figure 1). This data set includes themedical record number, admission and dischargedata (from which we calculate length of stay), birth-date, sex, race, marital status, discharge status, prin-cipal diagnosis, all other final diagnoses, principaloperation and all other operations or procedures.This information is abstracted from the face sheetof the medical record. All medical information iscopied verbatim on to the Form. When the princi-pal diagnosis or operation is not identified on theface sheet, the first-listed diagnosis or operation isrecorded as principal. We estimate this occurs forless than 10 percent of our sample discharges.
From 1968 through 1970, information pertain-ing to patient charges was collected on a supple-mental form from the billing office of a subsampleof hospitals. The charge data included type of”charges (e.g., room and board, laboratory, etc.) andsource of payment (e.g., Blue Cross, Medicare, etc.).Appropriate identifiers were also collected to allowlinkage to the Medical Abstract Form.
The Center publishes HDS data in the Vitaland Health Statistics Report, Series 13, and in theMonthly Vital Statistics Report Supplements. Thesereports present utilization measures by diagnosticcategories, by type of surgery, by characteristics ofthe patient, and by characteristics of the hospital(e.g., bed size, ownership, and geographical loca-tion). Special reports on average length of stay, pa-tient charges and methodology are also publishedeither in the Series 13 or Series 2 reports. This yearwe are initiating a new Series 13 report which willcombine and summarize demographic and medicaldata under one cover. ~ls report is being givenspecial publication priority and we anticipate thatour usual publication lag will be reduced at least inhalf. Data are also available on magnetic tape anddetailed information not contained in publishedreports can be obtained upon request.
DesignThe Survey design is a two-stage highly strati-
fied sampling plan using the hospital discharge asthe basic unit of enumeration. The first stage of theplan is to select a sample of 10 percent of the hospi-tals, excluding Federal hospitals, as listed in the
99

FORM HDS-1FORMERLY HSM-88- I(1- 14-75)
tForm Approved
O.M.B. No. 66-R0620
CONFIDENTIAL - All information which would permit identification of am individual or of an establishment will be held confidential, will be usedonly by persons engaged in and for the purposes of the survey and will not be disclosed or released to other persons or used for any other putpose.
DEPARTMEi4T OF HEALTH, EDUCATION, AND WELFAREPublic HeaIth Service
Health Resources Administration
National Center for Health Statistics
MEDICAL ABSTRACT - HOSPITAL DISCHARGE SURVEY
1. Patient Identification
1. Hospital number . . . . . . . . . . . . . 4. ‘ Date of admission
2. HDS number . . . . . . . . . . . . . . . . . .Month Day Year
5. Date of discharge
3. Medical record number . . . . . Month Day Year
i 1. Patient Characteristics
1. Date of birth: 2. Age (complete ONLYMonth
{
1 ❑ years
Day Year if date of birth not given):Units
2 ❑ months
3 ❑ days
3. sex 1❑ Male 2 ❑ Female
% Race or colon 1 ❑ White 2 ❑ Negro 3 ❑ Other nonwhite 4 ❑ “Nonwhite” 5 H Not stated
5. Marital status: 1 ❑ Married 2 IJ Single 3 a Widowed 4 ❑ Divorced 5 ❑ Separated 6 ❑ Not stated
6. Discharge status: 1 ❑ Alive 2 ❑ Dead
I Il. Diagnoses and Operations
1.
2.
Final diagnoses
a. Principal diagnosis:
b. Other diagnoses:
❑ see reverse side
Operations:
❑ see reverse side
Completed by Date
FOR NCHS USE ONLY
Diagnoses
Operations
100/

Center’s Master Facility Inventory (MF1). Primarystratification is by seven categories of hospital bednumber or bed size classes as ;hown in Table 1 andby the four Census regions. Wifiln the primarystrata there is further classification by four types ofownership and by geographical divisions. In addi-tion to selection by primary and secondary strata,there is systematic sampling by type of service andbv State and countv. Selection of hosDitals for bed, .size strata is in direct proportion to ;ize such thatthe largest hospitals (1,000 or more beds) are sam-pled w;th cert~nty and the smallest hospitals (lessthan 50 beds) are sampled with a probability ofselection as low as 1 chance in 40 (Table 1).
The second sta~e of the plan is a systematicsample of discharges from the sampled hospitals.The sample frame in nearly all hospitals is the dailylisting of discharges. Sample discharges are selectedon the basis of the terminal digit of the medicalrecord. The size of the discharge sample within ahospital varies inversely with the bed size of thehos~ital. One out of every 100 discharges is sam-ple~ in the largest hospital; and as many”as 4 out ofevery 10 discharges in the smallest hospitals. Thesampling scheme is such that a discharge within anygiven bed size category has the same probability ofselection as a discharge within any other bed sizecategory, i.e., the overall sampling rates for eachbed size group are the same, 1 per 100 (Table 1).
Anotier feature of the sampling plan is thearrangement of hospitals into 11 groups called pa-nels, fie first or certainty panel consists of all hos-pitals with 1,000 or more beds. Panels 2 through 10each contain approximately 75 hospitals. Each panelis a stratified probability sample of hospitals withless than 1,000 beds. Panel 11 or the birth panelcontains a sample of hospitals from the subuniverseof newly-open~d hospitals. New hospitals are peri-odically selected from the most recent MFI availa-ble and added to this panel. .~us, Panel 1 and 11 incombination with any-panel or pa”nels from Panels 2through 10 constitute a representative sample ofshort-stay hospitals within the U.S. This particularfeature allows us to gradually add hospitals to theSurvey as resources permit, to rotate hospitals inand out of the Survev, and to DeriodicallY collect,- . .special information from a subsample of hospitals.For example, the Survey began data collection withPanels 1 and 2. In 1966, Panels 3 through 5 wereadded and, in 1968, the Survey was again expandedto include Panels 6 and 7. The patient charge infor-mation’ was collected only from hospitals withinPanels 1, 6 and 7. The Survey currently collectsdata from hospitals in Panels 1 through 7 and Panel11.
The total number of hospitals in our sample is511. Thirty-four are currently out-of-scope, i.e.,these hospitals either do not meet our definition of
a short-stay hospital or have gone out of businesssubsequent to the collection of data for the MFI.Ninety percent of the remaining hospitals voluntari-ly participate in the Survey. Table 2 shows thenumber of sample hospitals and participation ratesby bed size category and by geographic region. Par-ticipation rates are 90 percent or better for everybed size category except for the 200-299 bed hospi-tals. We are not certain why the participation rate islow for this category. Also, participation rates aresomewhat lower in the South “and West than in theNortheast and NorthCentral Regions.
From our sample of hospitals, we collect infor-mation on approximately 230,000 discharges an-nually or 7/1 Oths of 1 percent of the estimated 33million discharges. The small size of the sampleemphasizes the fact that the Survey was designed to ‘provide national estimates and will not yield reliableinformation for small geographical divisions.
Collection ProceduresThe Bureau of the Census through an intera-,
gency agreement with Ihe Center is delegated theresponsibility for field activities associated with theinduction of hospitals into the Survey, data collec-tion and the quality control program related to datacollection.
Data are collected throughout the year by oneof two procedures. With the primary or preferredmethod, a staff member of the hospital’s medicalrecord department (after appropriate” instruction bya Census representative) selects sample dischargesfrom the discharge list, pulls appropriate recordsfrom the files, and abstracts information from theface sheet of the record on to the Medical AbstractForm. After completion, Abstract Forms arebatched and forwarded to the Census RegionalOffice.
Hospitals that are reluctant to participate be-cause of the added burden on the medical recorddepartment are offered the option where a Censusenumerator will select the sample and abstract theinformation from the record. About 35 percent ofhospitals elect to use this alternative procedure.With this procedure, the Census enumerator visitsthe hospital bimonthly. During a visit the enumera-tor identifies the medical records that are to be ab-stracted on the subsequent visit and abstracts infor-mation from the records that were identified duringthe previous visit. This procedure maximizes theprobability that the records will be available and willcontain final diagnoses. Further, this allows medicalrecord staff to pull the records from the files priorto a visit.
All hospitals are paid so much an abstract forparticipating in the Survey but in proportion to
their involvement in the data collection process. In
101

.
Table 1
Sampling Rates for Hospitals and Discharges by Bed Sizeof Hospital
S&e of Hospital =(First Stage)
Discharge(Second Stage)
Overall
1,000 Beds or More 1/1 1/100 1/100 ‘500-999 Beds 1/2 2/100 1/100300-499 Beds 1/3 3/100 1/100200:299 Beds 1/5 5/100 1/100100-199 Beds 1/10 1/10 ‘ 1/100
50-99 Beds 1/20 2/10 1/100Under 50 Beds l/20-l/40* 2/10-4/10* 1/100
*Samp%g Rate Varies by Geographic Region.
Table 2
Distribution of Short-Stay Hospitals in Hospital Discharge Survey Sample andParticipation Rate (Percent) By Size of Hospital and By Geographic Region, 1975
Size of Hospital Number Rate Geographic Region - Number Rate
All Sizes 511 90 All Regions . 511 906-49 Beds 66 90 Northeast 131 9450-99 Beds 75 90 North Central 148 92100-199 Beds 109 91 South 156 87200-299 Beds 91 83 West 76 87300-499 Beds 94 94500-999 Beds 58 911,000 Beds or More 18 100
Table 3
Error Rates For Selection of Sample, Abstracting Nonmedical Data,and Abstracting Medical Data in 1973, 1974 and 1975
PhaseYear
1973 m 1975
Selection of Sample 2.2 1.7 1,6Abstracting Nonmedical Data 0.5 0.4 0.4Abstracting Medic? Data 3.2 2.7 2.5

other words, the alternate procedure hospitals arepaid less per abstract than the primary procedurehospitals.
All abstract forms are reviewed for complete-ness, accuracy, and legibllityat the Census RegionalOffice. If necessary, further information is obtainedfrom the hospitals. The forms are then forwardedto the Center’s data processing facility in NorthCarolina. Forms are again checked for obvious er-rors and batched into groups of about 1,000 ab-stracts. The information each Form is concurrentlycoded and keyed on to disc. Up to 5 diagnoses and3 operations are coded according to the 8th revi-sion of the ICDA. Codes are checked for vflldhyand consistency through an edit program. Errorsthat are detected are immediately corrected. Thecoded information is then transferred from disc totape and, if it passes our quality control programfor coding (described below), becomes part of ourpermanent file. The data undergo a find edit, animputation procedure to eliminate sex and age notstated, and a weighting procedure to produce finalestimates. Output reports are sent to Rockville an-nually for analysis and for the dissemination of in-formation.
Quality Control -
The Center conducts two ‘quality control pro-grams as part of the Survey: one to minimize cod-ing errors and the other to minimize abstractingerrors. The quality control program for coding is aproduct control design, i.e., incorrect codes are cor-rected. The program insures, at a 95 percent prob-ability level, that the average outgoing quality of thedata does not exceed a 6 percent error rate formedical coding or a 1 percent rate for nonmedicalcoding. The quality control program for abstractingis a process control design. Poor quality work is notredone but an effort is made to identify and correct‘causes of error so that future work will be of betterquality. The Center has established, as acceptablequality levels for abstracting, error rates of 1 per-cent or less for sample selection and for abstractingnonmedical data and an error rate of 5 percent orless for abstracting medical data.
Let me describe the two programs in more de-tail. The quality control program for coding isbased on three-way independent coding. For everybatch of 1,000 abstracts that are coded by a produc-tion coder, a 10 percent sample is selected and inde-pendently coded by two other coders. The correctcode is determined by majority rule, i.e., if two ormore coders agree on a code, that code is acceptedas “correct” and the coder disagreeing is charged
~th an error. If there is no agreement dl threecoders are charged with an error. The production
coders work, i.e., the batch of 1,000 abstracts is ac-cepted if the error rates for coding the nonmedicaland medical items on the 10 percent sample are lowenough to meet our criteria for average outgoingquality of the batch. If the error rates for either thenonmedical or medical items are too high, the batchis rejected. A fourth coder verifies and corrects ei-ther the nonmedical or medical items, whichevercaused the rejection, for the complete batch. Therecoded work is again matched with the work of thetwo independent coders until the batch meets anacceptable level of quality. Error rates for nonmedi-cal items in the 10 percent sample have consistentlybeen less than one item, in error per 200 items orless than 1/2, of 1 percent. Error rates for medical
‘.Items are generally about 3 to 3-1/2 percent.
The second quality control- program, the pro-gram for abstracting, is based on the reabstractionof an 8 percent sample of records. The reabstract-ing is carried out in conjunction with a Census rep-representative’s annual visit to each hospital. Priorto that visit, information related to sample selectionand a sample of about 40 abstracts from the mostrecent 12-month period are selected and sent to theCensus representative in a sealed envelope. At thetime of the visit the Census representative followsthe same procedure used by the original abstracter,.i.e., he identifies the appropriate sample dischargesfrom the discharge listings for the selected monthand abstracts information from the records thathave selected in the sample. Comparisons are madewith the work of the original abstracter and differ-ences are adjudicated by tising the discharge listingsand the face sheet of the medical record as stand-ards. All errors are reviewed with the original ab-stracter. If the hospital fails to meet the quality cri-teria for either sample selection, abstracting ofnonmedical data or abstracting of medical data, asecond visist is scheduled as soon as sufficient dataare available and the procedure is repeated.
Table 3 shows the actual error rates on sampleselection, abstraction of nonmedical data and ab-straction of medical data based on our 8 percentsample of records in 197’3 (the first year of the pro-gram), 1974 and 1975. Note that the error rates aredeclining suggesting that the quality of the abstract-ed data is being affected by our quality control pro-gram.
Hospital Care StatisticsComponent of CHSS -
I note in the Conference p;ogram that thisconcurrent session should address the relationshipof the Hospital Care Statistics Component of theCooperative Health Statistics System (CHSS) to var-ious reporting systems. So far I have discussed a
103229-121 0-77 -8

national reporting system but not its relationship tothe Hospital Care Component. Let me concludewith a few brief remarks on the relationship as I seeit.
The Center, as you are aware, is responsiblefor the development of the Hospital Care Compo-nent. When fully developed, the Component willreplace our current data collection mechanism fordischarge data. In fact, with the ever-increasingdemands that are being made for hospital data, thismechanism may be the only collection method forvoluntary surveys stich as HDS. As a data user, theCenter would purchase data from the States on acost-sharing basis rather than pay the hospitals orthe Census Bureau for data collection.
104
The changeover to State systems will occurgradually. As a Statewide discharge data systemdevelops to the point that the data collected arecomparable to the Survey data in definition, quality,timeliness, etc., that system will provide data for thesample hospitals in the State. We are also exploringa redesign of the Survey for that time when all ormost States have a viable Hospital Care Component.By redesigning the Survey, we can make more effi-cient use of the State systems and obtain a largersample of discharges. The Survey will then be ableto provide more complete and precise informationon the utilization of the Nation’s hospitals, hopeful-ly at a reduced cost to you—the tax payer,

HOSPITAL CARE DATA FOR THE PROFESSIONAL STANDARDSREVIEW ORGANIZATIONS
Mr. Kenneth N. Johnson, Vice President, and Mr. Philip Latessa, Director of Research andEvacuation, Iowa HospitaJ Association, Des Moines, Iowa
Preface
Before defining what data is required for Pro-fessional Standards Review Organizations (PSRO)and showing what we’re doing in Iowa, I would toprovide you with a brief historical perspective whichbrought about PSROS and then describe the var-ious functions required of them.
Historical Perspective
In a sentence, Professional Standards Review isthe ongoing monitoring and evaluation of the qttali-ty of medical care and the appropriateness of theuse of hospital facilities. The law which createdPSRO’S was not a startlingly new development inthe health care field. For years, the Joint Commis-sion on Accreditation of Hospitals (JCAH), Medi-care, health departments and other organizationshave placed requirements on hospitals to review theutilization of services and to evaluate the quality ofmedical care. The performance record, or impactof these efforts, however, was rather poor. Whilesome hospitals and medical staffs did establish and
Imaintain productive quality assurance programs,most went through the motions, merely to be surethat something was in the committee meeting rec-ords for the surveyors to look at when they camearound. Nobody was very concerned, until healthcare costs started to skyrocket and the Federal shareof the bill increased. Then the public started put-ting pressure on the government to do somethingabout it. For the first time, questions were beingposed about the necessity of some care. It was ob-vious that some controls on cost were necessary, butat the same dme the quality of care should be main-tained.
The result was the passage of P. L. 92-603,which created Professional Standards Review Orga-
nizations, or PSROS. (see Figure 1) This law re-quires that providers of health care, namely hospi-tals and physicians, develop monitoring mechanismswhich assure that health care is provided in an effi-cient manner, meeting standards of quality. Themechanisms include examinations of the medicalnecessity of care upon a patient’s admission to thehospital, throughout his stay, and retrospective lookat the quality of the care delivered. To assure more
uniformity of activity and results, P.L. 92-603placed the overall’ responsibility of assuring econo-my and quality with the PSRO, charging it withmaking sure that the hospital and medical staff per-form acceptably. If hospitals and physicians fail inthis regard, the PSRO, itself, must perform thefunctions.
PSRO Functions
To fulfill these functions, a wealth of hospitalcare data must be collected and used by the hospitaland the PSRO. To gain a better understanding ofwhat data is required, let’s look at each of the de-tailed elements of professional standards review:
There are five distinct, but overlapping func-tions of PSR:
1. Development of Norms, Standards andCriteria.
2. Admission Review.
3. Continued Stay Review.4. Retrospective Review.5. Profile Analysis.
Development of Norms, Stan-dards and Criteria
At the outset, let me indicate that the defini-tions here are from Webster’s Dictionary. While Ihave taken slight liberties with Noah’s precise defi-nitions, I still stand on his authority. Norms are pat-terns which show what usually happens to a largegroup. They are usually obtained from large datasources, such as the National Health Survey.Another example of normative data with which youmay be familiar is the Professional Activity Study(PAS) Length-of-Stay Book. Norms, or normativepatterns, are used in the subjective development ofstandards, although standards can be developedwithout the use of normative data. In this case thenorm is that 90 per cent of Acute Myocardial In-farctions (AMI’s) have a chest X-ray upon atimis-sion to the hospital.
A standard is an expectation or desired level ofaccomplishment. In other words, it is a guidepost
105

Figure 1
DERIVATION OF PSRO’S
COSTCONTAINMENT
QUALITYASSURANCE
.Figure 2
PSRO FUNCTION 4–RETROSPECTIVE REVIEW
(Medical Care Evaluation, Medical Audit, etc.)
- [Medical Records Department
1
2. Analyze Patterns and Determine ~ I. Collect tid Produce Summary Data
t
Problem Areas
3. Select Topic for Study
?. Establish Criteria and Standards Z 5. Collect Data
f7. Analyze Resdts and Make Conclusions ~ 6. ,Process Data
t8. Take Corrective Action
t9. Set Date for Re-evaluation .-10. Repeat Cycle from Step 5
106

for depicting what ought to be. Here the standardis that all AMI patients should receive an X-ray.
A criterion relates to whether or not the stand-ard was achieved. Did something which was desiredor undesired occur in the delivery of care to a pa-tient? In the illustration, did each AMI admissionreceive an X-ray?
The responsibility then of the PSRO is to ac-quire a broad range of normative data and expertopinion, from which reasonable standards can beestablished. Generally, the PSRO will provide thesestandards as guidelines for medical staffs to use andmodify, if needed, to be appropriate to a given in-stitution. Once established, patients are measuredagainst these standards (in the form of criteria) todetermine whether the care provided was appropri-ate. So much for standards and criteria for themoment. I’ll refer back to them in discussion of thenext four functions of PSR, since they require theuse of standards and criteria.
Admission Review
The second function is Admission Review andCertification. This is an effort to determine whetherhospitalization is medically necessary or not.Admission standards and criteria need to be devel-oped for each diagnosis or symptom in order tomake a determination of medical necessity. Judgingwhether or not a patient presented for admissionmeets the criteria established by the medical staff isa function of a person usually called a Utilization.Review Coordinator. Ideally, if the condition of thepatient does not warrant hospitalization, then thepatient is not admitted—saving unnecessary utiliza:tion. The UR Coordinator, however, cannot pre-vent admission of a patient. A decision not to admita patient is only made by the physician advisor. Ifthe patient needs to be admitted, however, the caseis certified and the UR Coordinator assigns lengthof stay at the end of which the case should be re-viewed again. The usual practice is for the UR Co-ordinator to use a Length-of-Stay Book, which de-picts normative patterns for usual length of stay forpersons, by diagnosis, whether or not the patienthas surgery, broken down by age group. The dateassigned is usually the 50th percentile, or the num-ber of days one-half of all patients with certaincharacteristics stay in hospitals. For example, one-half of all AMI patients in Iowa stay 19 days or less,while the other half stay longer.
Obviously, a large set of normative data andpatient data is used in this entire process. SomePSRO’S have chosen to computerize this process,loading everything into the big black box.Parenthetically, I think that this is not only unneces-sary, but terribly expensive. Besides having this datain printed form or in the computer, the PSRO also
needs a documentation of “who did what”. In otherwords, did the UR Coordinator or Physician Re-viewer make the decision, how many days of staywere assigned, etc. This must be done to documentthat review actually took place and the admissionwas medically necessary. Periodically then, thePSRO can review how well this function is beingperformed in a given hospital or group of hospitals,by comparing the results of care against the reviewactivity.
Continued Stay Review
The third function is Continued Stay Review, ‘or review on the previously assigned date, to see ifthe patient should be discharged or whether condi-tions are such that he ought to stay hospitalizedlonger. Again, criteria and standards for makingthese determinations need to be developed. Theprocess of continued stay review is virtually identi-cal to admission review. A UR Coordinator looks atinformation in the medical record to see if there isa reason why the patient should stay any longer. Ifthere is adequate justification, the Coordinator as-signs another review data (usually the 75th percent-ile). If not, the case is referred to a physician ad-visor. Again, this process must be documented and
later analyzed.Both the admission and continued stay review
activities should be periodically analyzed, by pay-ment category (Medicare, Medicaid, Title V) to de-termine whether the process is, ~n fact, being car-ried out in an effective, nondiscriminatory manner,and to see what effect it may have on diagnosis cate-gories, services, and various providers.
Retrospective ReviewThe fourth function is Retrospective Review (or
Medical Care Evaluation, Medical Audit, etc.). (seeFigure 2) This is essentially the review of a groupof patients (after discharge) to identify problemareas (if any) and to improve the practice of medi-cine by solving these problems through educationalmeans.
“ In other words, it is an audit or review of simi-lar cases to see if there are any deviant patterns ofcare, to try and understand why, and to interjectsolutions so that the result is improved care in thefuture. The required procedures for retrospectivereview are not as specifically defined as they are foradmission and continued stay review. Retrospectivereview should, however, be directed toward a de-tailed. study of a selected group of patients whichrepresent a problem, such that a solution to the
problem can be determined and implemented; re-sulting in improved care. In determining a problemarea, the medical staff (or PSRO) must analyze pat-
107

terns of care within the facility and most likelycompare their patterns with regional norms orstandards. If deviant patterns are detected for agroup of patients, say a diagnostic category, thenthis group can be studied in detail to determinewhy there is a problem and what can be done aboutit. If standards and criteria haven’t been previouslydeveloped for such a group of patients, then themedical ‘staff must first make the determinations asto what kind of care ought to be provided to thisgroup. Data can be collected on patients who fallwithin this group to see what care is actually deliv-ered. The actual delivery pattern can be comDared. .to the standards resulting in conclusions and recom-mendations for solving the problem. An effectivemedical care evaluation program will not stop there,but must include a mechanism for assuring that ac-tion is taken toward solving the problem and thatWls problem area will be reevaluated at some laterdate to see what progress has been made. The in-formation required for retrospective review, bynature of the activity, is highly detailed and selec-tive, including data which will allow the medicalstaff to evaluate the actual process against their cri-teria.
Profile Analysis
The fifth and last function of PSRO is analysisof profdes of the hospital and of each physician.These profiles should display a. longitudinal analysisof the performance of the institution, each of itsservices, and the performance of the individualpractitioner. Thus, hospitals or doctors who do notconform to predefine standards of quality can beidentified and any problems can be corrected. In asense, analysis of profiles is analogous to retrospec-tive review conducted by providers on groups ofpatients, only being conducted by the PSRO on theproviders themselves. The information used forprofile analysis is generally quite broad: death rates,readmission rates, unnecessary surgery rates, andthe like.
Iowa
Now that the PSRO functions have been de-scribed, let’s look to see how hospital care data isbeing used for the PSRO in Iowa. I must admit thatthe PSRO data system is not fully operational at thisdate, as we are awaiting final decisions from theBureau of Quality Assurance so that a contract canbe signed between the Iowa Hospital Association(IHA) and the State PSRO. However, some partsare ongoing and the total system has been designed.
Overall System
Figure 3 shows the overall PSRO Data Ab-stracting, Processing and Routing Sytem in Iowa, Itis composed of two subsystems. I won’t discuss sub-system “B” other than to say that it collects somemanagement data on Medicare and Medicare pa-tients ordy, and in only those hospitals in which thePSRO is working. Furthermore, this subsystem mayordy be implemented on a trial basis and is not es-sential to the operational functions of the PSRO,
Subsystem “A”, on the other hand, assists hos-
pitals, their medical staffs, and the PSRO by provid-ing information for all five PSRO functions de-scribed earlier. Each hospital completes a medicalrecord abstract for each patient discharged andsends the form to the hospital discharge abstractprocessor of its choice. In Iowa, there are three ba-sic choices: our Health Services Data System(HSDS), PAS, or use of an internal computerizedsystem. Regardless of the mode, certain reqttire-ments must be met, however. First, the processormust collect the minimum basic data set requiredfor PSRO purposes. Secondly, the processor mustproduce a set of institutional reports as specified bythe PSRO. And third, the processor must supply acomputer tape to the Iowa Hospital Associationaccording to PSRO specifications. Once IHA hasreceived all the data from the various data proces-sors, the data are merged for the production of aseries of statewide, area and other comparative re-ports, some of which I’ll show later. These reportsare then provided to the hospitals and to the PSRO.IHA also produces a quarterly tape for the PSRO,according to Bureau of Quality Assurance specifica-tions.
Standards
To assist the PSRO in the establishment ofstandards, IHA routinely produces several reportsshowing normative data.
Figure 4 shows a page out of an annualLength-of-Stay report for the State. It shows thatthere were 483 AM I cases in 19’73 where the pa-tients also had at least one other diagnosis, theywere not operated on, and were between 50 and 64years of age. One-half of these patients stayed 19days or less. For the 21 patients in the same agegroup but which were operated on, the 50th per-centile was 20 days. This information is disseminat-ed to all Iowa hospitals for use in assigning lengths-of-stay upon admission and for extending the stay.
Figure 5 shows summary statistics on the aver-age length of stay and death rates for diagnostic
groups. Again, referring to AMI’s, the average
108

o2+HOSPITALDISCHARGE DATA
PROcEssOR
MED “(HSDS,PAS,HOSPoCOMP)
IOWA PSRO
DATA ABSTRACTING,PROCESSING & ROUTING
SYSTEM
+ ‘:+{.o3
‘o1INSTIT. I HA o6
REPORTS
0(5“ TAPE
STATE,AREA REPORTS
rw f
.W(l)\ wCLAIMS
3
wCLAIMS
$4“ TAPE
PROCESSOR
(BC-DM, BC-SC)

lJIE MYGCAKI)lAL ll!FARcTILIN
-. . . . ..- -------- . . . . . . . . . . . . . . . . . ------- . . . . . . . . -------- . . . . . . . . . . . . . . . . . -------- -------- -------- . . . . . . . . ---1 1 1 ExcLl~s:bD
140DAL ~C(l Ufd TS
i ::::: IT:!&
PERC lLES I AVG. 1 OVER tl;T’~; T~Ul;Lb’l AY 1 b% 25% box
I I/S% 95% ~PRE-OP~ i)t A[HS Al)VICE 99 DAYS ;
i. . . . . . . . -------- . . . . . . . . . . . . . . . . . . ----- ~-----------”------------”~ -.. -.. I- -------- -------- -------- . . ------ --v
IUIALS
IuIALs
Ylo
1“1.91-/.617.518.7
18.lJ
26.029.5
27.9
::. :
20:119.3?U-b
20.1
26.821.02s.3
24.2
14 18 22
:$ 24 .5224 31
22. 24 s-i
lb 15 24 3b i111
42 i31 142 1
42 ;1
1
196
7b
13
1
2
3
7
2;14
52
1
19
l:i
251
7b
13
1
1:2455
597
5
k:
51
-------- ------- --- i--------------------- i------------------------l------I -------- -------- -------- -------- ---

length of stay was 14.4 days, while the death ratewas 23.9 per cent of tot~ admissions. This sameinformation is produced for each area of the Stateand by type of hospital, so each hospital and thePSRO can see how it compares with a like group offacilities.
Another report produced for the State andeach hospital is a frequency distribution of diagnos-es and procedures. (See Figure 6) This informationis most useful in analyzing differences in deliverypatterns among facilities, as well as in establishingpriorities for conducting medical care evaluationstudies.
These are only a few examples of data whichare useful for the PSRO’S and hospitals in establish-ing standards. For brevity’s sake, however, let’smove on to the other PSRO functions.
Concurrent Review
IHA assists the PSRO by documenting the ac-tivity of admission and continued stay reviews. Aroutine report will be supplied to each ‘hospitalshowjng a summary of its review activity for themonth. We will use the same format for aggregat-ing hospitals to show statewide, area and group sta-tistics on review activity. Eacli hospital also receivesanother report with more statistical and detaileddata which allows it to analyze the review processwith more specificity.
Retrospective Review
As indicated previously, the first problem inconducting a medical care evaluation study is selec-tion of a topic.
We produce a series of reports which show pat-terns of care, from which certain problem areasmight be determined. Figure 7 shows our DiagnosisGroup Analysis. Going down the left hand columnto AMI’s again, we find the aver~ge Ieqgth-of-stayfor AMI’s in this hospital is 16.1. The number ofdeaths is 5 or 20 pe~ cent of all admissions.
Once a topic is selected, various standards andcriteria must be developed by the medical staff. Wecontinually assist hospitals in this process. Uponrequest, we critique and make suggestions about cri-teria they have selected. Once developed, the medi-cal staff gives instructions to the medical recorddepartment, telling them what data to collect onwhich set of patients. This data is recorded on themedical record abstract and we then produce a Pa-tient Care Evaluation Report which lists all patientsin the study.
For! each patient listed, the report shows rou-tine information collected (e.g., Length-of-Stay,Diagnoses, Procedures, etc.) plus the answers to
each criterion established by the medical staff. (SeeFigure 8) In essence, a number is displayed “if thecriterion was not met, and it is left blank if the cri-terion was met. For example, the answer to the firstcriterion of the first patient listed was yes. Theanswer to the fourth criterion was no. The result isa matrix, allowing the medicd staff to review theresults of any criterion by going down a column, orby reviewing the care given to a patient by lookingat the whole row.
At the end of the listing, the PCE Report showssome summary information about the ~rou~ of ~a-,.tients being studied-death rate, comp~lcations, av-erage length of stay, etc. (See Figure 9) Followingthisj each ‘criterion is listed, showing how many pa-.tients met this criterion, percentage of total patientsin the study, number of patients not meeting thecriterion; leaving space fo~ the medical record de-partment to add in the hospital’s standards for eachcriterion; such that the medical staff can fill in theremainder—identifying and specifying any problemareas, making conclusions and recommendationsand providing instructions as to when the problemsshould be solved and when it should be re-studied.
Obviously, this is not the only way to conduct aretrospective study of medical care. In fact, forsmall studies it may be easier for the medical recorddepartment to pull a few charts and compile theinformation by hand. We like the PCE program ofHSDS, however, because of its inherent flexibility—allowing the hospital to collect virtually any infor-mation it needs, on any group of patients, for anylength of time.
Profile Analysis
Let’s move on to Profile Analysis. This is Prob-.ably the most troublesome area insofar as trying todefine what is needed by the PSRO. Admittedly, weare not very far along in this regard. Two previousreports, Concurrent Review Activity Summary andDiagnosis Group &alysis, are both partial hospitalprofiles. When an ‘individual facility’s experience iscompared to a like group (or all hospitals) it canshow if their patterns compare favorably or not.
We also produce a monthly Summary StatisticalReport for each facility, which shows how the latestperiod compares with previous periods. (See Figure10)
Also produced are reports showing the deliverypatterns by source of payment, service and gee-’graphic area. (See Figure 11-”14) W]le all thesemake up a hospital profile, we are working on areport which is specifically designed to display criti-cal factors; ranking facilhies, such that the PSRO
111

GROU!
1.
::
4.5.
!:8.
1::11.
12.13.14.15.16.
1::
;::
- ;;:
;;:25.26.27.
28.29.30.
31.
:$:34.35.
36.37.38.
::;”
41.42.43.
:::46
112
Figure 5
IOWA HOSPITAL ASSOCIATIONDIAGNOSIS SURVEY
January-June, 1974
D~AGNosIs GROUP
8y Principal Diagnosis*Explaining Admission
TOTALInfective and parasitic diseasesNeoplasms
Malignant “8enign and unspecified
Endocrine, nutritional & metabolic diseaseDiabetes men itusOther EndocrineNutritional, metabolic
Diseases of blood & blood forming ~rgans.Mental disordersDiseases of nervous system & sense organs
Other nervous systemEyeEar
Diseases of circulatorv s~stem.-Hcute myocardial infarction
Cerebrovascul arOther vascular
Diseases of respiratory systemAcute URIPneumonia and bronchitisHypertrophy of T & AOther respiratory
Disea;~;t~~ digestive system
Peptic tilcerOther upper G.1.AppendixHerniaCholecystitis/CalCU1us
‘Other G.I. -Diseases of genitourinary system
Genitourinary8reastFemale genital
Comp. of preg., childbirth & puerperiumComplications of pregnancyAbortionsNormal deliveryComplications of deliveryComplications of puerperium
Dtseases of skin and subcutaneous tissueDiseases of musculoskeletal systemCongenital anomaliesCertain causes of.perinatal morb. & mort.Symptoms and i11-defined conditionsAccidents, poisonings and violence
FracturesOther $raumaAdverse effects
Special conditions & exams without i11nessNewbornOther specfal conditions
DISINUMBER
?AT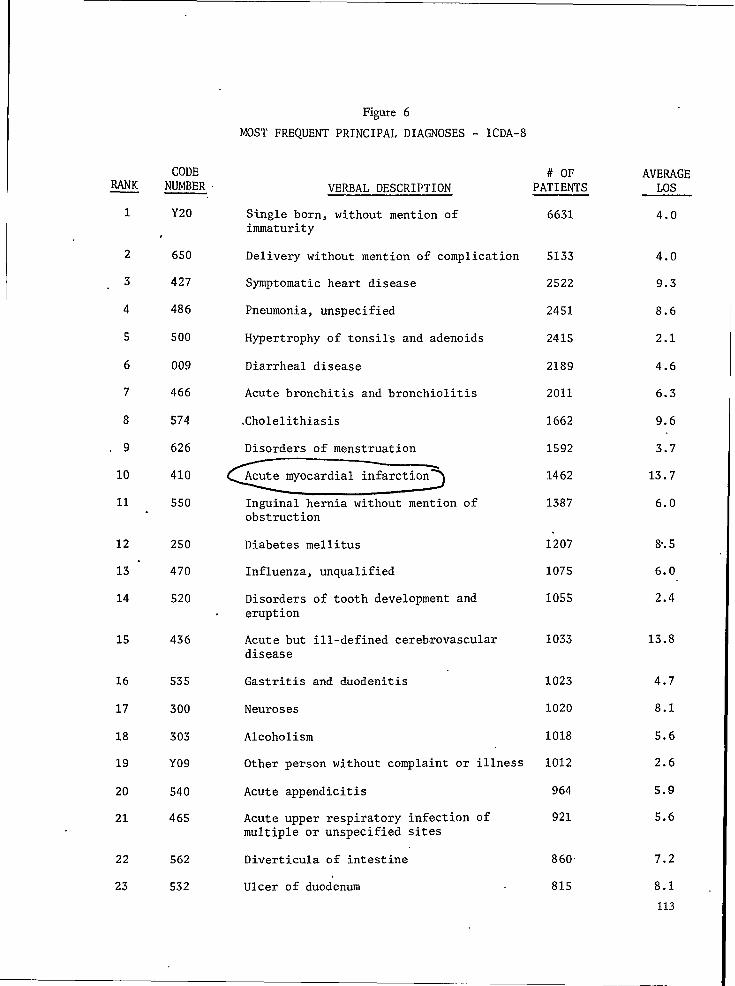
RANK
1
2
3
4
5
6
7
8
9
10
11
12
13 -
14
15
16
17
18
19
20
21
22
23
CODENUMBER
Y20
650
427
486
500
009
466
574
626
410
550
250
470
520
436
535
300
303
Y09
540
465
562
532
Figure6
MOST FREQUENT PRINCIPAL DIAGNOSES - lCDA-8
# OFVERBAL DESCRIPTION PATIENTS
Single born, without mention ofimmaturity
Delivery without mention of complication
Symptomatic heart disease
Pneumonia, unspecified
Hypertrophy of tonsils and adenoids
Diarrheal disease
Acute bronchitis and bronchiolitis
.Cholelithiasis
Disorders of menstruation
Acute myocardial infarction
Inguinal hernia without mentionobstruction
Diabetes mellitus
Influenza, unqualified
of
Disorders of tooth development anderuption
Acute but ill-defined cerebrovasculardisease
Gastritis and duodenitis
Neuroses
Alcoholism
Other person without complaint or illness
Acute appendicitis
Acute upper respiratory infection ofmultiple or unspecified sites
Diverticula of intestine
Ulcer of duodenum
6631
5133
2522
2451
2415
2189
2011
1662
1592
1462
1387
.1207
1075
1055
1033
1023
1020
1018
1012
964
921
860
815
AVERAGELOS
4.0
4.0
9.3
8.6
2.1
4.6
6.3
9.6
3.7
13.7
6.0
%.5
6.0
2.4
13.8
4.7
8.1
5.6
2.6
5.9
5.6
7.2
8.1
113
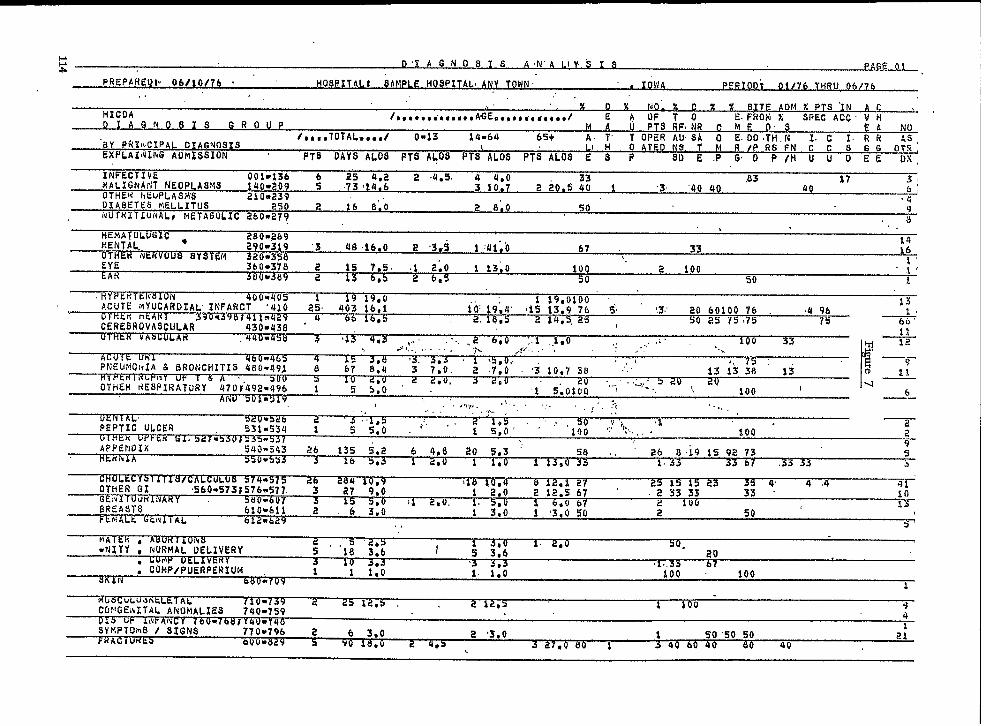
ws D ‘1 A GNO $ I S AN” A LiY.,“g I s AG 01
PREPAfiEQP 06/10/76 HosP17AL: SAMpLE HOSPITALI ANY TOWN” # IO\ Av pc~x OD; 0!1 76 TliRu 06/?6,. ,, .
.. % II % NO. % c x % SITE AO M % PTS ‘IN AHICOA /,,,*,,*,~,,e,A~Ee*~*o,a d~dti,l
A G N 0.S 1 9 G ROE AOFTO E.FROM x SPEC ACC V ; -
UP M A u P7S RF,NR c ME .t.~,,TOTAl.me,,/ omf3 14*64 6S+ ‘f OPER ~;S$ O E. DO!H,;
No_
Y PfiX!I,CIPA~DIAGNOSISA. 1’ I.c I.RR ‘-,
;XPLAI(4JNGADMISSION .\ L O ATEtl
PT6 OAYS ALOS FTS ALOS PTS ALOS PTi ALOS E’ ; PR /P RS FN C C S GG 0;:,
SD E .P G,D P/H U U O EE OS
INFECTIVE 001=136 .2s 4,2 2 4.5. 4 4,0MALIGhIAflT NEOPI.ASVS 1409D~09 ; 73!14,6 0.s ::
,853 10,7 2i
L7 .C,1 40
UTHEK I!EuPLASMS 2io*239‘3 ‘ko 40 f>J
D14BETE$ MELLITuS 250 2 16 6;0 2 8;0.4
50i$UTRIT$UIVALl NETAt3ULIC .?60@279 :
HEMATOLUGZC . 280-.289. \ ,.
MENTAL, 290-319 ‘3 48.16,0 E ‘3qi 1 :Jl;’ot4
OTHEN NEKVO67 33
us SYSTgM 320*35$16
EYE 3bO*3’78 2 15 ?.5. i 2:0 1 13;0 100 ‘ 2 100t’
LAN 380W589 z‘s’
605 2 6,5 50 50 i
HYPE TEI Sli) 4clo*qo5ACUT; M~UCA#l)3AL’ INFARCT
19 19,0 1 19,0100 ‘,‘4io 2;. 403 i6,1 10’.19;4’
13
~tkx HtANT 0-s98 )4iLn429ti5 13.9 ’76 i, 8.3; 20 60100 76 . S4 96 x
2. L6,5CERGBROVASCIJLAR 430-438 ‘
605 2 14,5, 25 , so 2s 75175 75-
Lil
71:
,- 3 a3 4*3 ,., ... a 600 :,1 .$.0 .,. !. 100 33.>,!,.,.,.,... -:h
460 465 4 15 3 8 5 5 i’ 75
H7Fktil’ Ut r & A 00 3 10 d u 2 z u s 20 , 20 “P
q 12
~.-olt UN1~$i~..,. , ; ,.~.:’ ..+
PliELItiGItIA S BRONCHITIS 4SO:49J‘.
e 67 a:4‘*.,
—.
3 7:0. 2 7,0~tbrlly
‘i 10,7 3a ‘::’” 13 ii 38 13 0 2:
OTHER RESPIRATORY 470’7’492.;96 1., . .
5 5:0 .0 ‘eou “i..
‘1 5:0100 ‘ ““-”’”.3 ‘~+—
100 ‘Ar$u ~m9~9
6., ..,1,,. ,~!,..., .~~r
—.$..,., .:.,, ,, .,.., ,, .;. . ..,,
PEPTIC ULCER 531:534 1~ 1 5:0’ ““’’’loo,? ‘i:., ‘ T
.. .~mb~lJ
100 “ 2
APPENOIX ‘ 549:543 26 135 5,2 6 4.89
20 5,3 ‘ s% ..HE lfhAA ‘a095>3
zb 8i* IS Q2 73 3s 50s 2*O 1 1*O 1 13 0 33a 1$33 67 .33 53 3
c~st CALCULUS 574 b75 26 2134 to 9 0 s 35OTHER GI ‘560*573;57b:577. ~ 27 9:0
18 toi 2::
12 i ’27 25 15 23 0’ al ‘2 12:S 67 ‘
4 .4
~lv iivARY 5dOm6072 ;3 33 33 “
3 >$10
~RE:3:; 2 0610*61i 2 , 6 3:0 9 ‘ t’ 3:0
6s0 67 2 lU(I 13
FE P:ALk tikI’IIIAL b12m&2’3i ‘3.0 50 2 50 ‘
., 5’

IOWA HOSPITALASSOCIATION HEALTH SERVICESDATA SYSTEM
~ SIUUY: 41U PA[lEIU~ CAKE EVA LIJArl(Ji\
560 931
600952...
1“;0
urJo
600
6u0
lUO
500
100316
, .. -
,.,‘-.
“ m
D882 P1 lla4tDY62 F1 ,11248
-.....0973 P1 1119’)
RIO c IJ
4. “7,;::.*;.45:.’.;;w;w’‘:.:,-.””
54567,, -.f...:j$ ;s,
,,. .;<, -, ,’ ...
1 4s’”.
. ... :, --,, ..9’
!. ”.,
4h7,,
n 4512324
2 45
,: .’,. ,,. . .
.::. ..,, ..’..:
H(ISP : 03331 JAIvc /6 JUNk 7fI RAGE 0001

w+m
T...AI IENI C
,,“, ,ctlAli
-1’”.,, ,.
,.’:, ,.-
[’ IUIAI. P,. ...
—
lOWA HOSPITAL ASSOCIATION
~
m:,25
ATcc
.,
3OLI
,
bM
—
Tuu Y: QIU PA TltNr CANE kkALuATIUl\ 06/10/76
HEALTH SERVICES DATA SYSTEM
t
t
i
J)I
;#
I
: ’403: 20.0 xINSULTATI[
T(lT/TOTJloTi
COMPLICAlUNIT$;.
‘ATIFNT$ I
lJcl. usl(llvs/:OMMENDA71
.
# AUIUPSIES$ odATE: 20.0 %. ,“) AYS:) AYS: 12: ’’,:,.’ ,J Ay$: (ji s RECORC)Eli: 15u Ak(l, GliANGL$: ., 0
. ,’ .,,#,
Lxc~t’i~{Jl’JS ~ = ‘ 4.() z,, .. !’.,,. ,. .’
I.)ATESCO~RECTION,-RECHECI
,. . .. -: .. .,,.,,
: .,, ,,..!, ,,
. . .
.- .,
,.,.
.:’ f.’, .“ m
a
. ,. ..
,.
.-
tlosp: 03531 JAN* 76 JU[iE 76 PAGE 0002
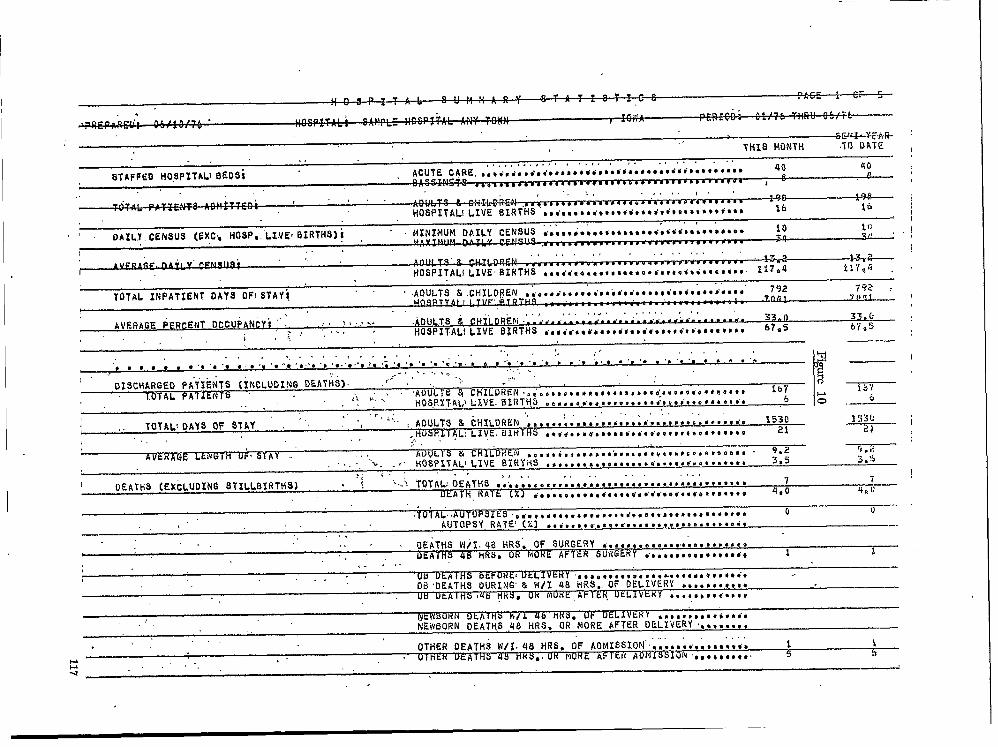
1.
. . . . - —.
, ,,,, . . . .. . . . ,..!, ,!
AVERAGE PERcENT Occupancy’. ,,.. ,,.,%. .ADIJLTS ~ CHSLDR~~I .=m..4.a.a . . ..J . . . . ..~aa,,..mc,.. . . . 33.0 33.k
.,. ,... -, HOSP17ALI LIVE BIRTHS dosio.c*J*ctQdtsc*’rot* c{<t’t**o*@@* 67*5 67.5i.;:
. .
,,.’ i!AcWbORWDLATMS w/1 46 HK3 UP OELI Vtxy ...l.8*.9V6***’*NEWBORN OEAT!IS 46 HRS. OR”fiORE AFTER DELIVCRY ‘..,..s,.

TOTAL OEATHS (SUBCATEGORIES SHOW PCT. OFTOTAL OEATliS) ,7 “1OO,O 74 10,6 ,~lt&
. . .1. . - . . . . . . .- .
B suRG~:. . . . 1 lb.3,,
46 a~.n
ELIVERY . . . . . . ..J . . . ..JC..Jc ., “o ....,,,*
0EATH9 W/IN 48 HR9,. OF, SURGERY ..*.:....X. <.,...’ 0 . . . ,,
MME
. . . . . . . . . . . -----OF oELIVER’
OB OEA1’HS 48 H~S, OR MORE AFTER DELIVINEWEJORN OEATHS !J/IN 46 HRS. OFNEWBORN OEATtfS 48 HRS.:OR NORE’ AFTER DEL
Y . . n ..‘ERY.,.$d.. o ,’; : : .‘RY .... ..
-IVERY. O .. , I .. !, ,
‘,
—.—.
OPTIONAL * 7., .. .... ....... ......... ● ., o.. ,,., . -,, ..
OPTIONAL - 6,,,,...*,,,,,..*., .e*,*~~*,07HER/ROIJTINE, .. ....................... ;6: 96:0 1434 8:6 b“ 21
JiITERNAL _ EKERGEPJCY DEPA~TMENTo~.o.oo.,s. ......{s a2 , 47.4 806 “?*8 :OUTPATIENT oEPARTKENT..i.,.J, ....... .,, ,6OPTIONAL w 3,,,..a.,,#,osocJti/Qs’s st$tdc :OPTIONAL = 4.,..:..,.., .......... ~..... 0OPTIONAL * 5,,s.,*s..e**e~$an.eo..:. ,*OCOPTIONAL. W 6,.......,,...<..,*. ~,c . .... :
,(
UP TIOPIAL’* 7 *0e***8,9****.* B**..*..* ●,**,OPTIONAL w 8,,,,..., .........*....!.*. .
0 .,-
TZtqk/OTHERee..,,*,e.eqde ~~wm..vw.,.e 9: S?io 744 6*3 6 21..A
TYFk OF AOMISYION ‘.EMERGENCY.,.O.+.,, .. ..Q ..e**,*o.,*..drd.ds..*, ●.* 59 34.1 62; iO;6 .
EAT;...,.,,,*,...*, ,,*.,..*.6.***.*.**,V, ,,.,,. 21 12,1 220 1;,;. 3EMI=URGENT.***,4.. ●,so,,a***a*,.***.** .a*e.***.*** 20 *
riEY13011.b 1?9
Rtim*.e**#*.**..~ ● *m**.**m.s**9ds *..*.*.*.*.** 6 3.s . 21 3,5 6 21OPTIONAL _ 5 .....s ... ....... ... ,.,,,., ..........+. otLECTIVE/NOUTZNE., .,,,.,,o...s,,,~.Jo.Jo .,,,a...,, , 66 36*2 499 7,6

..,., . . . . . . !.
PATIENTS. .
WITH COMP~Z .. .. .. .. . Zh Pn,s $09 ilA.1IL. . . . ..., .,. . .
TOTAL! PA+lENTS TRANSF41SED ....@. .. ...~. . . .. ...ti....,. . . . la P,l 1Q5 13.Q
.,,’
‘TISSUES DISEASEO Atocoostsui>sicton”d.. ●O”ioios 56 32.4 488 8*7DISEASED B,,~,,..,,.,,, ,., .8*.** ●*.*.*, 14’ 8.1 4,6,NO OISEASE,,,.,8.,,.,,,,, ~.,.,~~,~,.., ‘3 1,7 :; 6,7NOT CODE,..,,.. .*’*o*.**e..*... .,**.** o1% REPD8T.,eei.a.,e., ,os,ae,,...,e, s,.’*. z 1.2 8. 4.6 2 6NO;kE REhOVEDQ.,*,~,@,S.~.. d:,...e,d*a.“ lls 26.0 520 1!.6 —
a

.~ H @ 9 P 1 ,’, SUM M A R Y s T A ‘r 1 9 T I c s PA U+L
PtiEPA’i?EfJl. . .
,’.06/10/76 HCJSPI~ALi SAMPLE H
,’OSPIT’AI, ANY TOWN
.. .,A PFRIODt 01/76 7h
.CATEGORIES:
.,NU M13ER PE R~T QA’i9 STAY AVG. 10s TOTAL ,fl~ .TOTAI” N3 O*
ACCOtihODATIOii ~ .. . .
&ORMAL. w 1 8R...,,$,,,,,,.,., ,~,,.,,;,,,~,.,,.~,,ti,.,2 BR,.~,,, .....m ............. .....
1 .,6 27’. 27,0—
143 82.7 137?3 8R,,,,.,,,,,,,,,.,<,,F, ,,,,.dd.,<,,$,~.
,.
4+BR,, ...........W ....._d,.,..,ti.m.16 9,2 64 4,0 I
,.-
‘iUUN9ERY,,,c~,o,o,. •*e**,,~,.m.v,,d,*o+n<90,9* 6 3,5 .21 3,S . 6 21NOT USED..,.,,,a ......Uti*. •**.~u..****~,.,, ., ,,, 3*5 .
DAY OF ADMISSION,,
. . .SUNOAY1..,..BP,~m*,,b,, b~~~.g.,*~d~~~6q,d,,d~m. *vtidu. 28MONDAY ................... . . . . . . . . . ..u . . . . . . . ..m...
1:,2 :236 ,.8,5,. 1
TUESDAY...****..,..** *,*,*,.,,,,*,T*d,.6!. ,.,,,,8,. 2: 13*9 2;9 9,X ;’NEDHESDAY..,,.,.,..,,.,. ,,...mm***ti*i****** 9a**b*,... 24 13.9 143 ‘;THUR8UAY ....**.,,,,,, #**9*.,..****,.a86*,,.. d**8##
6.0 731 17.9
t FRIDAY...,.,, ... .....323 1;,: 1 3
****.”,...,6*,, .*#.,****. ● .,@,* 22 12.7 15fiSATUROAYti,,,,,,v.,@ ,,.~,,,.,,,,,,,,,”,,d~a ,b.d.,,.d,
.. 29 16.s .~~~ li.3, ,.
IIUUR UP. ADMISSION w, !3EG$1’JNJNG, AT;. . .,., , , ,—-
AM a 12..,,., ● **8******8****** ● **,****d***a** ,**O. . . . . ., ‘5’ 2:9’ ‘“ . .38 ~ ?. 6i.*#,”8:e**e.9**m*#* ● *986*d*e*a$*J*#****#6 *M”*2.,.+,,,.., . . . . . . . . .
3 1,7 : 14 4,7—...
..,,***,*.,*.;*.* ** ** 5 2.9 6.6 ‘3,..,,;**@,.,..,*,., ●.i*D8,e9.***.***:d$: :“*4 5,.-. Z,9 :;
q ~—.
4.,.***’.*..”,*,**,* **.,,,,*.AD,,;**,**,,* ,<**20,0
‘3,5” :0(1 7,3 ~ :5*Q*o****e8***9 *4**%.,,*..*,,,,. ,****#,a@*”*,, “e” .:
$. 4-06 ; ,.,,.4 4,0 ,,
6.,.,.,..,,,,.e.e,. “.....,*~.e*e***w***w*’* O*DO $ z(D
1.2 ““, ‘!!@ 4,0 , i7*m*****9***a*,# e4a*b,**,,e,;b’***. ,*,,,*e*,*~
4:. C4
8.,*...,...*.,,.*.* ● . . . ..*.*..#d**id.*i. ,.9$..
,.:
“i:k : ‘ii:o1
9*,.**,.,*******.** e*b*db*e8***#9**e#*. *****, ;: 2,9 ::10*.*.*...,*,*.**,. .,,.***,.**,”**.**be ● *s**s.
6*2. . . . . .
2,9 4tIi*,’,,,*.**,**,***. “.**,**,*,**,*.,,,,** ,,,, ,
E*2 ,: 2,$)
PM m 12..,,,,, ... ......... .. ....,,,*”*=***,*,,-,*,*).,,.;: ‘13*%
— -.—
8 4.6 ~***a*a*,,*sae* vb***s**”**’*** ****aB*m*as*** ● 8
2*..*,,4,6 l~:;
::.+ o *** e3.,*,0,:.*.*.,,,.9.: .:#:*.,:”.**#*D:e;::. :.:
● ***,**,,** ****,,* * Q 4 g:;” . .14 261 1;,:
-.
4,,*..,**9**** 9* ● **bad.*,, d..,.w,,...,...,. ,*5*,**.,.**..,,:*,.*. ..*e**,*****~*,,**.*.,a ● **
10,4 1~36 ●
“:: S.&‘ .6..+..a*q,,,,
9*R***,,**.****** .$.,..,?..,,,. 2::* ● * ●
7,,**.,***,,*,***,*..* *9**.**e@*sq.4#*::.*:*26 13.9 6.7
a..,,,,12 i08 9,0
● * . ,**P* ,*******BP** -.. ●*** ● **.. 12 ::; 123 io,39.*,.,,:..*,.990:.** . ..9e0.e.*:;a94:s***m**e a 2,9 33
10**,.,**,..*..,,** ,...*,*,.6*.*******. ● *$*** : 3.51 s—’—
63 1:::* isnw-**a*mm**’* 9*e9**”**.*Ode***O **.*Da98*9.***e 39’3 42 7,0 1 3
u&Y Ur DZ SCHAkGEsu:4DkY .. ...*....*,.,**,.,*. ,..***.*.*,*,*,.*d*a**.
,,24 i3*9 263
~tui*oAY*9,*..*ee. ● ,,,O”#b,****,*b *.o*se***.**m**9 ● *-11,0 2 ~
12,1TUESDAY ... ....... ............=...........,,,.,., ,.
ibb 8,92: 15.0 2t8
klEO?4t$OAY.a,..,,,., ,,,,,,,...,,o,oo,i,i. ..,,,..,., 22a ;4
12,7TKURSDAY*..**,O . ... .,,,,**..,,*,,****,***,* ,,,.,,,
285 13,0-—
13.9 1s1FliIOAY.,.,,,,,...~*,S~ ●*sstim*wedn*,,*w.*#so* ● m**a* ‘::
6,3
8ATU3DAY.17,9 2s1 8,3 z
.—
●***********S** ●********.*d*”.* .“***.’***.** 2s7
14.5 191 7.6 2 ?

@cpAREoj,. Ohltol?h HOSPTT AL: SAP ,Pl F HO SPITAL At’JY7nHN 70 Y;A PFRTOO: 01!76 r $~ .ti~,
. .~~ NUMBFR PFRCFNT nbys STAY AVG. I 0s TOTAL Nu T~ti&DA&--...
A\,k. .
kEh BotiN,*,*.***.,*,., .,, , *,, ,. ,6* *..,.,.** ● **9*9 *,.*”0 6 3.5 21 :3,5 zr-~ -.,3 u-—=~*~...-*.. .~..~.~~ ?—-*.=-.* t14 w 64*8..*.**a**eb**0,.**i*. ●*eOO.****8a#0Bao***e. 97 56.i
-—-----817 “--”..-6,4
65 +. ..” .. . .. ..— ... . ... ..~ .. . . ..ti ....’...- . 25.4 —.,
OPTI.ONAI.’ .:b 9 1*,,*,****.*,,,,., ,*~,,*#*,,**,.,*** ***,,..9’..***. 4 i4 4. 14
2 ....”. .0 .. ...... ...4.... .*..**4*..W*.*.*.... :% _3.,**O**,,,E***;.****9 9m9****0*99*0”a*6*#**”* ●**e*9 o4*”**,*”*..”,*,...** *.,* “**,,,,,*.*,<....*....**5,**89.se9**e9**0**9 eo9p9@*i**m*9m#u***8# ****#do o6.,,,,
.,94*9Q4*m*4,** O**@* 9*n*n”llb**.O.*ll’**DO 6***n . 0
7.o,a,ao;soa0,e3ees$:a aoo,;*,o’eeeQooe,*deoa ee,i.e o——
B.9,0..Q+, ***P**+***! aee ●? +*** .****.*”C’**00 ** o90,,a.d...:*8b909 *i*i *:..@”;e.:***.<e.**e*. ●**69* o
—-
B w l**,a,ti.,*.*,,.~a** @*,*...*b*,s4,**s*s o*e@*#*#OOs——.-.
o
—.-.
—-— .

and hospital can more readily identify problemareas.
In the area of Physician Profiles, we produce areport for each physician, which lists all his patientsaccording to Xs status as an att;nding physiaan,surgeon, consultant, referring physician, resident,intern, or other status. While we show some statis-tics for the doctor, we need to greatly expand thiscapability such that the medical staff and PSROagain can readily identify problem areas.
122
SUMMARY
While this presentation has only touched thehighlights of PSRO data requirements, I hope theyhave stimulated your thoughts in this area. MostPSRO’S and hospital care data systems are in thethroes of working out the specific designs and Iexpect it will be several years before all the bugs areworked out and efforts toward achieving overalluniformity can be started.
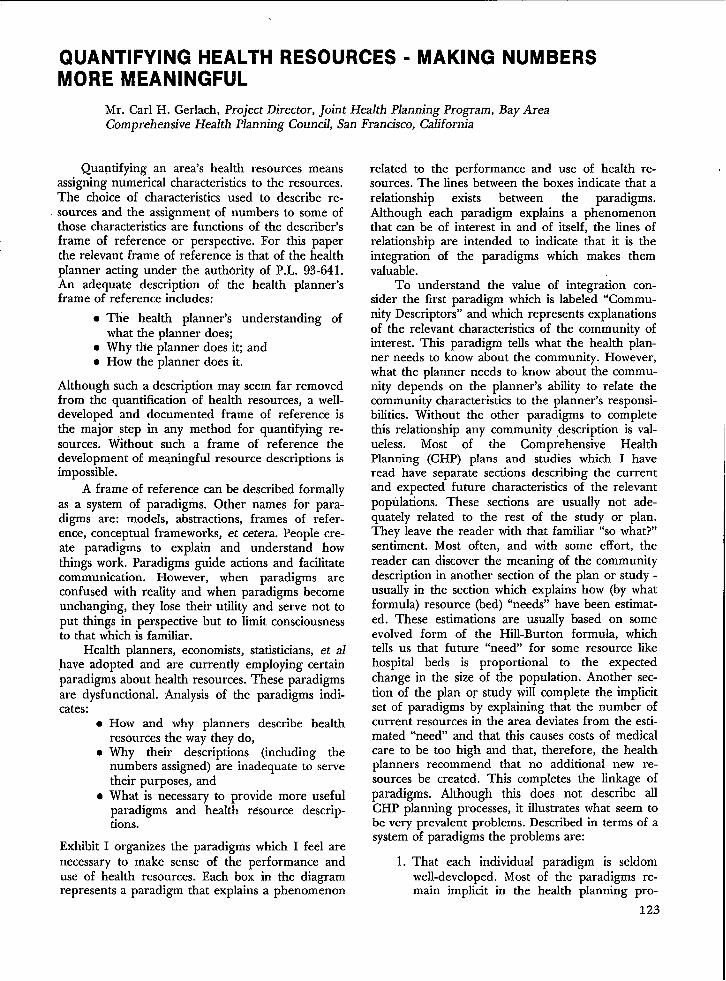
QUANTIFYING HEALTH RESOURCES - MAKING NUMBERSMORE MEANINGFUL
Mr. Carl H. Gerlach, Project Director, Joint Healti Planning Program, Bay AreaComprehensive Health Planning Council, San Francisco, California
Quantifying an area’s health resources meansassigning numerical characteristics to the resources.The choice of characteristics used to describe re-sources and the assignment of numbers to some ofthose characteristics are functions of the describer’sframe of reference or perspective. For this paperthe relevant frame of reference is that of the healthplanner acting under the authority of P.L. 93-641.An adequate description of the health planner’sframe of reference includes:
● The health planner’s understanding ofwhat the planner does;
. Why the planner does it; and● How the planner does it.
Although such a description may seem far removedfrom the quantification of health resources, a well-developed and documented frame of reference isthe major step in any method for quantifying re-sources. Without such a frame of reference thedevelopment of meaningful resource descriptions isimpossible.
A frame of reference can be described formallyas a system of paradigms. Other names for para-digms are: models, abstractions, frames of refer-ence, conceptual frameworks, et cetera. People cre-ate paradigms to explain and understand howthings work, Paradigms guide actions and facilitatecommunication. However, when paradigms areconfused with reality and when paradigms becomeunchanging, they lose their utility and serve not toput things in perspective but to limit consciousnessto that which is familiar.
Health planners, economists, statisticians, et alhave adopted and are currently employing certainparadigms about health resources. These paradigmsare dysfunctional. Analysis of the paradigms indi-cates:
● How and why planners describe healthresources the way they do,
● Why their descriptions (including thenumbers assigned) are inadequate to servetheir purposes, and
● What is necessary to provide more usefulparadigms and health re’source descrip-tions.
Exhibit I organizes the paradigms which I feel arenecessary to make sense of the performance anduse of health resources. Each box in the diagramrepresents a paradigm that explains a phenomenon
related to the performance and use of health re-sources. The lines between the boxes indicate that arelationship exists between the paradigms.Although each paradigm explains a phenomenonthat can be of interest in and of itself, the lines ofrelationship are intended to indicate that it is theintegration of the paradigms which makes themvaluable.
To understand the value of integra~on con-sider the first paradigm which is labeled “Commu-nity Descriptors” and which represents explanationsof the relevant characteristics of the community ofinterest. This paradigm tells what the health plan-ner needs to know about the community. However,what the planner needs to know about the commu-nity depends on the planner’s ability to relate thecommunity characteristics to the planner’s responsi-bilities. Without the other paradigms to completethis relationship any community description is val-ueless. Most of the Comprehensive HealthPlanning (CHP) plans and studies which I haveread have separate sections describing the currentand expected future characteristics of the relevantpopulations. These sections are usually not ade-quately related to the rest of the study or plan.They leave the reader with that familiar “so what?”sentiment. Most often, and with some effort, thereader can discover the meaning of the communitydescription in another section of the plan or study -usually in the section which explains how (by whatformula) resource (bed) “needs” have been estimat-ed. These estimations are usually based on someevolved form of the Hill-Burton formula, whichtells us that future “need” for some resource likehospital beds is proportional to the expectedchange in the size of the population. Another sec-tion of the plan or study will complete the implicitset of paradigms by explaining that the number ofcurrent resources in the area deviates from the esti-mated “need” and that this causes costs of medicalcare to be too high and that, therefore, the healthplanners recommend that no additional new re-sources be created. This completes the linkage ofparadigms. Although this does not describe allCHP planning processes, it illustrates what seem tobe very prevalent problems. Described in terms of asystem of paradigms the problems are:
1. That each individual paradigm is seldomwell-developed. Most of the paradigms re-main implicit in the health planning pro-
123

Exhibit 1
PARADIGMS FOR HEALTHPLANNING
CommuniW Descriptor: I
Describes community interms relevant for ex-plaining health servicephenomena
IHealth States Descriptor
1
Relates communitycharacteristics to inci-dence of health status
I
Reimbursement Provider Finance “
Describe; sources Transforms resourcesand amounts paid required and servicesfor services provided into cash
flows
# Y
I pays for what I
124 ‘

cess; seldom become formalized verbally sothat they can be communicated; and sel-dom, if ever, are’translated intoquantifiableforms. For example:●
●
I●
●
Small area de~ographic projections havenot been adequately developed as a toolfor any planning process, much lesshealth planning.There currently ~exist only very limitedmodels which can enable us to translatepopulation data into estimates of morbidi-ty. Question: Are the epidemiologists iso-lated in their own paradigm?Very little work exists describing currentalternative medical service productionfunctions. Question: What services andrelated resources are required to treatspecific illnesses?No one seems to know exactlv what caus-es health care costs to increas~ so rapidly.Part of the problem is that we really havenot explained what a hospital or a physi-cian does and what they produce. Youcannot measure something if you cannotname it,
2. Those paradigms which do exist are con-fused with reality and clung to with an un-willingness to share their limitations. I havenever seen a CHP plan that discusses theuncertainty associated with its numbers orwhich discusses the assumptions implicit inits action recommendations. For example:health planners often behave as if econom-ies of scale exist for hospital services andtherefore, costs can be reduced byconsolidation. However, as Berki concludesin Hospital Economics:
“The answer from the literature is clear. . .economies of scale exist, may exist, andmay not exist, or do not exist, but in anycase, according to theory, they ought toexist.”
Question: How can a planner justify actions on thebasis of “economies of-scale?” -
3.
4.
Paradigms are seldom integrated in a waythat relates information gathered to rea-sons for choosing a course of action.Readers of plans frequently experience“so what.”The set of paradigms used by planners isnot comprehensive. For example, notablymissing from most health planning effortsare:
● Explanations of the illnesses experiencedby a community;
● Explanations of financial impacts on insti-tutions and taxpayers;
● Explanations of cost impacts on users ofhealth care services;
● Explanations of the strategies by which theplanners will act - or how they Can/willaffect desired chance.
5. One of the primaryw reasons tiven for the
6.
preceding p~oblem’ is “not e~ough data.”My personal experience suggests that thepopularity of this argument is a function ofthe paradigm failures described previously.Specifically, without an understanding ofthe use of information, the motivation toobtain it quickly decreases, and without anunderstanding of the mechanics of existingdata systems and methods for tapping thesesystems, data truly does become too costly.In those cases - for example, the lack ofphysician utilization data - where data isinadequate to operationalize or paradigmbeyond a simple level, the lack of under-standing weakens arguments needed to ac-quire the data.In many cases the planners do not have theanalytical capability to operationalize a para-digm. This inability is due to three primaryfactors - listed in order of importance:● Lack of analytical training and experi-
enced for most health planners.● Lack of research-developed and tested
analytical tools.● Limited budgets.
These problems have directly affected pastapproaches to characterizing and quantifying he~lthresources. Their resolution would result in majorchanges in the way health planners describe healthresources- in the way they “quantify” the resources.
Adequately quantifying an area’s health re-sources integrates three classes of characteristics:
1.
2.
3.
Intrinsic characteristics, which describe thehealth resources in terms unrelated to theirperformance or to other entities. For exam-ple, the number of beds of a hospital is anintrinsic characteristic.Performance characteristics, which describethe ,functi,oning of the health resource. Forexample, hospital occupancy rates are per-formance characteristics.Relational characteristics, which describe therelationships between the health resourcesand other entities. For example, a hospitalmay be described in terms of its physiciansupport base.
Although intrinsic characteristics are most oftenused in health planning, they tell us little, very lit-de, about health resources. Research to date hasproduced little to’ convince me that we can general-
.
125

ize from an intrinsic set of characteristics such as“300beda cutegeneral, teaching hospital, operatedby County A“ to standards such as maximum costper case or optimal occupancy. If we expect to beable to make such generalizations, we will need todevelop better methods for making sense of intrin-sic characteristics. “Making sense” of intrinsic char-acteristics necessitates the full development of theintegrated paradigm set.
There seem to be three ways of meeting thisneed:
.. -1. Determine the expected relationship be-.~een intrinsic char~cteristics and the ‘obiec-
2.
3.
tives of health planning and use these ‘ex-pectations as guidelines for actions. Forexample, one approach to rate re@ation inhospitals is to group hospitals into “peer”classifications defined by certain intrinsiccharacteristics and to assign an allowablecost range for each class.Develop more efficient methods of describ-ing the performance and relational charac-teristics of health resources.Do both, since neither approach alone is sat-. .isfactory. The first approach is overly sim-plistic, and the second approach is not al-ways feasible.
I have been working on the second approach in aproject in California. This project is attempting todevelop a complete description of the hospital re-sources in one urban county. To develop this des-cription we are pursuing these objectives:
1.
2.
3.
To describe the functions of the hospitals interms which can be used to understand theimpact of the hospitals on the objectives ofhealth planners, namely:● Accessibfity of health services;● Improved health conditions;● Efficiency of health services; and● Compliance with P.L. 93-641To describe the functions and resources ofthe hospitals in terms which are congruentwith the perceptions of hospital decision-makers.To identify and evaluate alternative sourcesof data required for the descriptions.
The approach we have taken is illustrated inExhibit 2, which portrays the general structure ofthe information which we are obtaining for eachhospital in the area. The sources of this informa-tion are:
● Discharge abstract records;● Billing records; and● Accounting data. -
The core information comes from the dis-charge records which summarize the major func-tion of the hospitals - the treatment of sickness in
126
the inpatient setting. Other hospital functions, suchas outpatient services, teaching, research, andcommunity services are described via the billing andaccounting data. Information on individual hospi-tals is aggregated to provide the information por-trayed in Exhibit 3.
The most relevant criticism of this approach isthat it is not feasible for most health planning agen-cies. The
●
●
●
reasons given are:Agencies do not have rights to this kindof data and, given pervasive planner/hos-pital adversity, obtaining these rights isoften impossible.Even if the data rights were obtained, thecost of data purchase and analysis wouldbe prohibitive.Even if the data were acquired and ana-lyzed, health planning ag~ncies could notuse it.
Point-by-point:On Data Rights: Acquisition of this kind of
data necessitates action at two levels:1.
2.
LegislationMany states already require hospitals to pro-vide discharge data and accounting data.Many others are considering these require-ments. I suggest that an HSA, as a form oftax-supported public advocate, has the re-sponsibility to foster such legislation, Thearguments needed to support such datasharing legislation relate to the public’s rightto know where its taxes are being spent andto the importance of the data in providingthe relevant information.Proactive DlanninKWe obtai~ed our”data because we are parti-cipating in a joint planning endeavor withthe hospitals. We have advocated an opensharing of the information and were suc-cessful in convincing the hospitals that bene-fits would accrue to them’ from the process,
On Cost of Data and Analysis: We have esti-mated that the cost to ps for the comprehensivedescription which we are developing amounts to theequivalent of the costs which our local planningagencies incurred for one man year of a low level“data person.” Several changes could reduce thecosts even further:
1.
2.
3.
State collection and maintenance of the data,California currently collects only accounti~data, but the legislators are considering re-quiring discharge data,.Better sampling. We have taken a “sample”of an entire year’s discharge.Prior existence of the software which wehave developed to edit and analyze the data.

Exhibit 2. TO DESCRIBE A GIVEN HEALTH SERVICE PROVfDER OR CLASS OF PROVIDER
CasetypeThe pnm~ access points to the $ I j \ . T~o~omy of factors related to theprovider. Includes other providers nature and complexity of illness, orand treatment sites: Physicians, 1 health state. IncludesER’s, Hospital OPD’S. ~ Source
“Age
L “Sex
Relevant strati- “Primary diagnosis1-
.—— .—.fications of a Source
ICasetype 1 “Other diagnoses
community.
‘ HI
“Surgery
Includes </ ~ , / I
“Age ~ Community I“Sex
ICommunity [Strata
J I
“RaceStrata I
“Payment L i I
sourcesI I
Medical“Place of Casetype Resources + The types of manpower,residence
Ip’o’ed”eb ‘ m
kf i I X/hequipment, buildingspace, and supplies
I allocated for certainMaster medical procedures —> Procedures proceduresperformed by each department I
K——— _— —. -1
Casetype
% 1 J
End\
Gross outcome indicators~ Status
THE CORPStratifies attended morbidityby casetype, community strata,and medical procedures
Casetype
x / j
Future cme site —> EndDestination
MedicalCasetype Resources
.x [ j
@
A/”@
Total allocated costs ~ cost cost
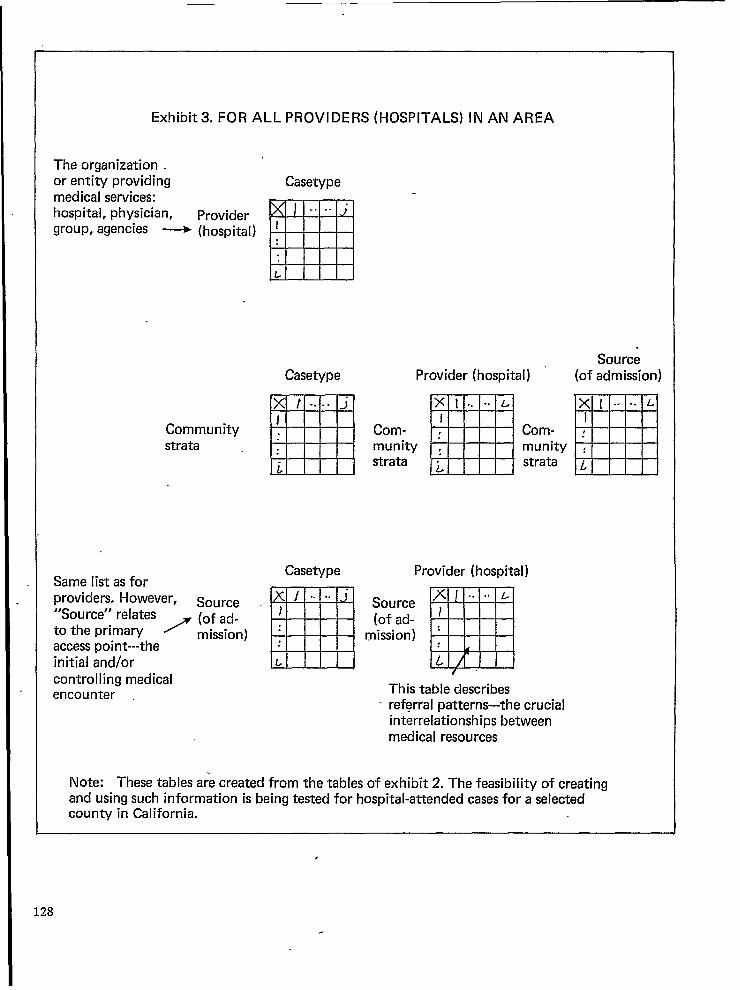
Exhibit3. FOR ALL PROVIDERS (HOSPITALS) IN AN AREA
The organization .or entity providing Casetypemedical services:hospital, physician, Provider
❑. . . .
group, agencies ~ (hospital) J
L
Communitystrata
Casetype
EXl -.-jI
i
SourceProvider (hospital) (of admission)
Com-munitystrata mXI.. .*L
I,
.
L
Com-munitystrata
Casetype Provider (hospital)Same list as forproviders. However,
M
Source ~ j ‘. ‘. Source“Source” relates ~ (of ad- (of ad-to the primary mission) : mission)access point---theinitial and/or L
controlling medicalencounter
This table describes- referral patterns---the crucial
interrelationships betweenmedical resources
Note: These tables a;e created from the tables of exhibit 2. The feasibility of creatingand using such inform-ation is being tested for hospital-attended cases for a selectedcounty in California.
,
128

4. Improvements in the systems providing our In sum, a little poetry which appeared in the AJPH.data. Given these changes I see no financial (1973, VO1, 63, No. 10) as the introduction to thereason why most urban HSA’S could not Report of the Committee to Evaluate the Nationalduplicate our efforts. Center for Health Statistics:
On HSA Ability to Use tie Information: Thismay be the fatal flaw, and we have come back toour paradigm problem. To propose a detailed solu-tion at this time would be impossible; however, anysolution must have as its core these three elements:
1. Research which provides planners wifi acomprehensive and integrated set of well-developed paradigms.
2. An infusion into health planning of the tal-
.3.
.ent required to use the paradigms.Legislation at the State and Federal Ieveis toprovide the data systems and controls neces-sary to operationalize the paradigms.
Upon this gifted age, in its dark hour,rains form the sky a meteoric showerOf Facts. . they lie unquestioned,
uncombined.Wisdom enough to leech us of our illIs daily spun, but there exists no loomTo weave it into fabric...
“Huntsman, What Quarry?”Edna St. Vincent Millay
129

HEALTH ACCOUNTS: SOCIAL INDICATOR, PERFORMANCEMEASURE, POLICY TOOL*
Ms. Nora Piore, Professor HeAth Admininstration-Economics, Columbia University SchooJof Public Health, and Asticiate Director, Center for Community Health Systems, NewYork, New York
Probably the most widely quoted set of statisticsin the United States today are the figures that theUnited States now spends $118 billion and 7.7 per-cent of the Gross National’ Product on heath andmedical care, and that expenditures for these pur-poses have been rising faster than the consumerprice index, at an annual rate of more than 10 per-cent over the last 20 years. Os-dy the current unem-ployment rate seems to be more frequently referredto in the media and in public discussions than thesenumbers, as the fiscal crisis in the cities deepensand as tax payers and patients are confronted withthe visibly mounting costs of medical care.
One is tempted to remark parenthetically thatit seems only yesterday that we were being scoldedby Kenneth Galbraith and Michael Barrington forspending more on chewing gum and liquor than. onhealth and medical care.
These health expenditure figures for the Nationare the product of a statistical series developed andrefined over the years by the Social Security Admin-istration, published annually in the Social SecurityBulletin. The series provides a comprehensive over-view of total public and private, aggregate and percapita spending for health and medical care, bysource of funds, for hospi~als, nursing homes, phy-sician and dental services, drugs and related compo-nents of personal health services, as well as a mea-sure of expenditures for health-related constructionand for medical research.
Supplementary series prepared by the SocialSecurity Administration also provide informationon differences in health care spending for the aged,for children, and for adults under 65; on changesin benefits and beneficiaries covered by privatehealth insurance, and, occasionally, on expendituresby type of illness. Together, these statistics comprisethe Natio~s central measure of the amount andmix of resources devoted to health and medical care.
Like so much else in health services research,the first efforts to collect and systematize informa-tion on expenditures, utilization and financing ofhealth services, and to relate these data to thehealth needs of the Nation, go back to 1929 andthe work of the Committee on the Cost of MedicalCare. After 1935 the task of carrying on this statis-tical monitoring was taken over by the Social Secu-
*The author wishes to ackno~vledge the assistance ofcolleagues Purlaine Lieberman’and James Linnane.
130
rity Administration. Much of the early work in ex-panding factual information on the economics ofhealth care must be credited to the inclusion of Ti-tle VII of the 1935 Act which mandated the SocialSecurity Board to make a full report to the Con-gress at the beginning of each regular session, rec-ommending the most effective methods of provid-ing economic security through social insurance.
Honed and sharpened over the years, thesedata now serve as the chief indicator of changes inthe role of public and private funds in paying forhealth services, and in the shift from State and localto Federal tax revenue in underwriting the publicshare. Moreover, when the national health expendi-ture data is viewed in the context of the annual se-ries on social welfare expenditures, it is possible tocompare resources currently devoted to health withthe Nation’s allocations for housing, education, in-come maintenance and other human services andsocial investments.
Thus a most important framework for p]an-ning and for decisions about policy is available forthe Nation as a whole.
However, national legislation to deal with cur-rent health care issues, at the same time that it mustset a common course for the Nation, must also beable to fit the diverse characteristics of this vastcountry. Alternative proposals to close the gap ofinsurance coverage and control of escalating costsmust be considered in terms of how well local andregion~ medical care systems will be able to sustaina health insurance plan and equipped to implementa cost containment policy.
Accordingly, increasing attention has been giv-en to development of systematic methodologies forreplicating the national health expenditure series toprovide comparable measures for the use of plan-
ners and policymakers at the regional, State andlocal levels.
A second dimension of expansion of this im-portant indicator would extend the existing matrixof expenditures by source of funds and componentsof care, IO provide a more sophisticated framework
for examining what the Nation is getting for thedollar spent-disaggregating total expenditures andtranslating dollars into inputs-days of care, visitsto physicians and other units of service,-and intooutcomes, measured by changes in health statusand the impact on disease, disability, discomfortand so forth. It is this expanded analytical frame-

work to which the term health accounts is now fre-quently applied. The purpose .of this latter analysisis to provide a better measure of efficiency, equityand access, and to be able to better monitor theimpact of new policies, new knowledge, new tech-nologies and changing demographic profies on theproduction and cost of health services.
In its report “Health Statistics Today andTomorrow,” the United States National Committeeon Vital and Health Statistics defines the mission ofhealth accounts systems as follows:
1. to provide a comprehensive picture of thenature and magnitude of health problems,and
2. to assess how well health services aremeeting these problems, at what cost andwith what gain.
A brief review of the origin and experiencewith local and State analyses will acquaint you withthe purposes, uses and common problems in obtain-ing, analysing and integrating utilization and ex-penditure data in these levels, [and will suggestsome modification in current procedures for yourconsideration.]
In the early 1960s the Division of Public HealthMethods awarded a small contract to the New YorkCity Department of Health to develop informationon the scope of public expenditures for urban med-ical care. From that modest start came the first ef-fort to set up a health accounts analysis for a singlelocal community that \vould parallel the Social Secu-rity health expenditure data for the United States.Here, too, the Committee on the Cost of MedicalCare can claim a scoop. Shortly after our first publi-cation on health expendhures in New York City,Dr. I. S. Falk wrote to congratulate us on callingattention to these issues, but he also referred us tothe 1929 CCMC report #9, “Health Expendituresin Philadelphia,” by Nathan Sinai.
The New York study found that in 1961, fiveyears before Medicare and Medicaid, one out ofevery eight city dollars was appropriated for healthand medical care. These funds, plus direct Federaland State expenditures for veterans, State mentalhospitals, etc., were found to pay for half the hospi-tal care and nearly one-tilrd of all the medical carereceived by New Yorkers. It was clear that the issuewas not, should government pay for medical care,but rather how and at what level of tax capacity.Those data sent the Health Commissioner and theMayor to Washington armed with new argumentsin favor of Federal action on health insurance forthe aged, It also laid the groundwork for proposalsto integrate the municipal and voluntary hospitals.
In 1966 a single session of Congress enactedmore than 20 pieces of legislation affecting theprovision, planning and financing of health careservices. In addition to Medicare and Medicaid, cat-
egorical programs were coming down the line fromWashington, requiring local communities to re-spdnd to the unmet needs of mothers and chil-dren, the mentally ill, victims of heart disease, can-cer and stroke, migrant workers and other popula-tion groups with special health care needs. Coupledwith the requirements of the newly constitutedcomprehensive planning agencies in the localities,there was now a clear need to develop a systematicdata base to measure these needs, to identify stepsthat could be taken to approve access, and to estab-lish a baseline against which the impact of thesenew programs could be assessed.
In order to provide settings for the simultane-ous testing of innovative categorical programs onthe one hand, and of an overall systematic structurefor integrating these programs and maximizingtheir impact, the Federal government developed aprogram called Experimental Health Service Deliv-ery Systems (EHSDS). Nineteen sites were selectedfor a program that wodd establish “communitylaboratories”, nonprofit corporations whose purposewould be to set up voluntary, local managementpanels to bring about improvements in local healthservices delivery. The pilot site selected to test thefeasibility of this concept was the State of RhodeIsland. The mission of the organization establishedthere, which has come to be known by the acronymSEARCH, was to demonstrate that it could effec-tively innovate revision in health delivery thatwould materially improve access, contain unit costsand assure’ quality within the existing delivery sys-tem.
The development of a health related data sys-tem was an important part of the entire EHSDSprogram, and it was in connection with these re-gional field experiments that the next generation oflocal and regional health expenditure profiles wereborn. The National Center for Health Services Re-search contracted with die consulting firm of Ar-thur Young and Company to develop a method ofestablishing a data base including an expenditureprofile in all 19 sites.
While most other aspects of th~se experimentalsystems have subsequently lost their identity, sub-stantial progress in the development of health serv-ice data systems is one of the important heritages ofthis endeavor. Arthur Young Company’s final re-port entitled “The Community Funds Flow Data~ystem” contains information on all aspects of therationale, methodology and applicability of localflow of funds studies. The Rhode Island initiativeespecially has been able to establish deep and ap-parently permanent roots and has flourished. Thecontinuity of this expenditure analysis over a periodof time provides the important opportunity to mea-sure changes in the volume, source and characteris-tics of health care expenditures.
131

In 1973 SEARCH, in cooperation with theHarvard Center for Community Health and Medi-cal Care undertook” to carry out exploratory work ina micro analytical approach to health accounts in-put-output techniques. ~Is approach envisions atwostep process: a fund flow analysis to trace thesources and uses of funds within a small, well de-fined service area for an identifiable segment of thepopulation, followed by evaluation of identifiablespecific public programs geared to the target of thatpopulation segment. The assumption was that dol-lars would serve as a surrogate for other resourceinputs, and that programs geared to a child popula-tion of zero to four years could be expected to havethe most clearly identified and measurable programgoals. A preliminary report entitled “Developing aModel for the Expenditure, Utilization and Financ-ing Components of a Health Accounts System: ACase Study in Rhode Island, 1972”, has just beencompleted by Suzanne Martin, Cynthia Clay andPaul Densen. The current study is unique in its at-tempt to link the input and output side of a healthaccounts equation, and is fresh in its frank, modestand forthright presentation of the material. Oneawaits further reports with great interest.
We now come to a new chapter in the evolutionof health expenditure methodology as the era ofexpansion that characterizes the 1960s gives waybefore the pressures of depression of diminishedFederal, State and local revenue resources. Withoverwhelming concern with escalating health ex-penditures and the need for cost constraints, theinterest in local health services data systems contin-ues, but in a new context.” At the present time itwould be fair to say that interest in the develop-ment of local health expenditure profiles stemsfrom three different and .somehmes conflicting so-cial policy preoccupations: the search for cost con-straint and improved management tools; the needfor a data base in anticipation of the enactment ofnational health insurance; and the need of thehealth planners and the new health systems agen-cies established under Public Law 93-641 for sys-temwide data overviews, for new and improvedplanning tools, ~d for improved tectilcal skills inthe use of new tools.
The inclusion on this agenda of a discussion offlow of funds techniques, along with methods of.developing inventories of resources, and a discus-sion of the general role of planning and its relationto health information systems, exemplifies the part-nership between data systems and planning appara-’tus at the regional and local level:. What the pIan-
132
ners can ex~ect to learn from a flow of funds pro-file can be sit forth in most simple terms: -
L.
2.
3.
4.
5.
6.
How much is spen~ fo~ health and medicalcare? How does this compare with formeryears, what of the future?Where does the money come from? Howmuch is public, how much private, howmuch is out-of-pocket, how much thirdparty? What part of the public fundscomes from what level of government?What are health funds spent for? How isit distributed among components of care:hospitals, physicians, nursing homes, den-tists, drugs? How much goes for preven-tion, diagnosis, treatment, rehabilitation,custodial service? How much goes forprimary, secondary, tertiary care? Howmuch is ambulatory, how much institu-tional? How much for mental health andillness, how much for addiction?Who is the money spent for? How are thefunds distributed? By age groups? By in-come? By ethnic, educational and familycomposition characteristics? By geographicorigin?How much is spent for personal healthcare rendered to individual patients, howmuch for environmental protection, re-search, construction, manpower trainingand education?How do expenditures for health comparewith dollars allocated for other humanservices? And finally, what does informa-tion of this kind tell us about what are thelevers and where are they located, bywhich society, whether at the local level orin Washington, can undertake to controland direct the amount and purposes towhich these expenditures are allocated,and the ways in which the benefits ofthese expenditures are distributed in thepopulation.
This is the basis for the current generation offlow of funds studies at the IocaI level. It is the Ievelat which my colleagues, PurIaine Lieberman andJames L1nnane, are now working to update theNew York City data, comparing 1975 with thebenchmark 1961 and 1966 data to see what hasbeen the impact of the Medicare and Medicaid, andwhat we can learn from looking at the experienceof that decade.
We wiII be reporting that study in October,
I THE ESTIMATION AND PROJECTION OF VARIOUS POPULATIONGROUPS FOR HEALTH PLANNING*
Mrs. Margaret A Barnes, Mathematical StatisticianPlanning and Resources Development, HealthMaryland
INTRODUCTION
Effective health planning is an ongoing processof managing change in the health care delivery sys-tem—such that positive changes are made in thehealth of the people. The meaning of health as ac-cepted for this paper is as follows:
Health is a state of physical, men-tal and social well-being and abili-ty”to function, and not-merely theabsence of illness or infirmity.1
In ,a theoretical sense, effective planning is ac-complished within the context of both the conceptof health planning and the given definition ofhealth, if the following conditions are met: (1)health needs of the Nation, a State or local area areidentified and relevant resources therein are as-sessed, (2) health goals and objectives are estab-lished with assigned priorities; and finally (3) healthneeds are met such that the health of the people ism_ade better.
These principles of effective health planninghave gained impetus and acceptance in recentyears. One contributing factor to their acceptance isthe broadly based recognition of the need to under-stand, strengthen and ‘control some aspects of theexisting frag-mented health care delivery system.
Further, when followed, the principles of effec-tive health planning lead to rationaf health plan-ning which has bee; the implicit, if not explic~, in-ters{ of our various planning public laws, b>ginningwith the Hill-Burton Act of 1946 and culminatingin the National Health Planning and ResourcesDevelo~ment Act of 1974. The resDonse to theselaws, a: health planning agencies ~ave sought tocarry out the mandates of planning, has come fromvarious levels of ~overnment. The Federal resDonsehas focused on t~e development and dissemi~ation
L
of knowledge about health resources—with some,but lesser attention to the diffusion of such knowl-edge. The State levels have tended to be sensitive to
*The views expressed in this paper are those of theauthor and .do not necessarily reflect the views of the Bu-reau of Health Planning and “Resources Development.
lMilton Terrjs, M. D., “Approaches to an Epidemiologyof Health,” American Journal of Public Health, Vol. 65,No. IO (October 1975), p. 1038.
and Project Officer, Bureau of HealthResources Administration, Rockville,
the need for coordination for the purpose of min-1
imizing duplication of resource and se~vice compo-nents of the health delivery system; thereby leavingthe local levels to struggle with the nightmares re-sulting from ineffective planning or perhaps, noplanning. This has caused the local levels to be in areactive posture—responding to the day-to-daypressures of getting services to the people that aremaking demands on the system.
Throughout this Federal, State and local rela-tionship the scenario that occurs and recurs is thateven with the increasing emphasis on rational plan-ning, we have focused more and more of our re-sources, energies and efforts on ‘knowing moreabout WHAT TO PLAN FOR; rather than splittingthat focus to include WHO TO PLAN FOR.
Ideally we should plan for the individual; notbeing able to do that, we should plan for the nexthomogeneous unit which could possibly be the fam-ily, and so on. It is, of course, impossible to planfor an individual, a family or even groups of similarfamilies who might have basically the same healthservice needs. Then the question arises, what canwe do better in the way of sensitizing ourselves todifferences in the utilization of health services sothat we might, in better ways, satisfy and meet theperceived health needs of the people we are plan-ning for? The answer that is offered is two-fold:First, we must perform better analyses from availa-ble data and use the surfacing information in thedecision making process by making it both compre-hensive and comprehensible for all persons in-volved in the decision-making process.
Second, in order to perform better analyses, wemust begin to give attention to the very people forwhom the planning is done. In particular, we mustexamine the differences in subgroups of the popu-lation that cause differential utilization patterns inthe demand for various health services, resolve thedifferences analytically, then estimate and projectthese subgroups.
If the ultimate goal of health planning is toproduce positive changes in the health of the peo-ple, then clearly our definition of health must en-compass the “value input” from various populationgroups. The more disparate their “value input” isfrom their “health needs”, the more crucial it is tomake estimates and projections of these groups foreffective health planning.
133

The importance of estimating and projectingfor subgroups of the population can further bedefended through identification of subgroups as,defined by various laws within the Public HealthService domain. Some of those subgroups are:
Low incomeElderlyMigrantsMentally illDevelopmentally disabledHandicappedAlcoholics, andNarcotics Addictsep
Given the facts as stated, the following assertion ismade: Effective health planning will not begin, untilrefined methods for making estimates and projec-tions of subgroups of the population are developedand used. Therefore, the purpose of this paper isthree-fold: first, to give the current state of the artof methods development for population estimatesand projections; second, to give the correspondingstate of the art of practice in applying those meth-ods; and finally, to show the need for more specific-ity in demographic analysis for both the presentand future populations.
CURRENT STATE OF THEARTS
There are two major considerations in address-ing the state of arts at tils time. They are: themethods developments which are strictly technical,and the availability and application of methodologi-cal developments for health planners:
1. Methods
It is important to differentiate between projec-tions and current estimates. Current estimatesmake use of actual post-censal data from therecent past in the form of vital statistics, tabula-tions from population registers, or statistics thatare merely correlated with population change.Where there are no such data, the current esti-mate reduces methodologically to a short-rangeprojection; but even here one should considersuch qualitative information as a natural disas-ter, war, famine, epidemic, or mass migration.Conventionally, projections into the future makeno attempt to speculate about such possibilities,because they are essentially unforeseeable.
Projections also differ from Forecasts. When aprojection is described as indicating the mostlikely population at a given date, then the datumis regarded as a forecast. On the other hand, amodel worked out to illustrate certain analyticalrelationships, with underlining assumptions that
134
are highly urdikely, would not be termed as aforecast of future population growth. Therefore,deductively, all forecasts are projections, but notall projections are forecasts. Because of themethodological dependence of estimates onprojections and because of the difficulties inforecasting events of any kind especially num-bers of people, a more indepth discussion onprojection methodologies follows.
Various Methodologies
Aside from the simulated models which wouldbe impractical to address, the methods for mak-ing projections may be classified in a number ofdifferent ways. One possible way is to differen-tiate between those that can be applied inde-pendently to any type of area from those thatare dependent on or require antecedent projec-tions for other areas. The latter class of methodsincludes summing of projections, as in the caseof adding projected figures to secure regional ornational population totals; or obtaining a projec-tion for one area on the basis of changes insome other similar area or more inclusive areafor which a projection is already available. De-pendent methods cover a wide range of tech-niques—one of which is the ratio method—dis-tributing the projected population of an areaamong its subdivisions, taking account of theproportional distribution.
Most typically, the independent methods areapplied in the case of national populations, butcould be employed to project the population ofany type of area, including small areas such aslocalities or counties. These methods includemathematical and component methods and areaapplied at any geographic level. They allow foradjusting a number of small areas’ populationsto population figures for a parent area, In fact,it is a principle of population projections to ex-tend the degree of interdependence where pos-sible to assume consistency of assumptions,which are basic considerations in projections, Atypical example would be the projections forcounties or some other localities smaller than theState Ievel for which the State would be the par-ent area.
Although both the mathematical and componentmethods have the characteristic of independ-ence, the component method is preferred, Itinvolves the separate projection for mortality,fertility, and net migration. It uses methodswhich indicate population changes that embracea variety of procedures, some estimating totalpopulation directly, others estimating net migra-tion onIy, which is thereafter combined with

some other information. Consequentty, varioussources of information are applicable, therebyallowing for the flexibility tha~ ‘is needed in us-ing source materials. This is particularly impor-tant since different local areas have varyingsources of information; some more reliable thanothers.
Cohort-Component
The Cohort-component method of projectionrequires that computations be carried out sepa-rately for age-sex groups on the basis of sepa-rate allowances for components. The initialpopulation is distributed by age-sex-specific-fer-tility rates or birth probabilities, and makes allow-ances for net migration by age and sex, if de-sired, The utility of this general method seemsobvious in view of the following attributes: theschedules of fertility and mortality rates can beutilized in several ways.
They may be either held constant through all,or part, of the projection period or are allowedto change according to specific form’ulas. Theformulas may vary from the very simple to thequite complex, depending on the amount of in-formation and knowledge about the parametersassociated with the components being projected.
2. Practice
Estimates
In general, the Nation has been engaged fordecades in estimating and projecting populationfor the Nation as a whole; more recently, theBureau of the Census entered into a systematicprogram with States to provide guidance in de-veloping current estimates for States. The sys-tem is called the Federal-State Cooperative Pro-gram for Population Estimates. It provides for“total population estimates for those States in thecooperative program. The organizations that aremembers of the cooperative system give assist-ance in’ the preparation of various kinds of esti-mates. Most recently, the Bureau of the Censusbegan research toward improving its methodsfor determining total estimates so as to includeboth age and sex breakdowns for State and coun-ty levels. This, however does not mean that im-proved estimates \vill be available within the nearfuture; it means that research for such has be-gun.
Projections
In the early part ofwork was advanced by
1974, much exploratorythe Health Planning Unit
of the Health Resources Administration, to de-termine the extent and availability of, and thelevel of detail existing in projection figures. Theexploratory efforts included research at the Bu-reau of the Census, the Department of Housingand Urban Development, the Department ofTransportation and other Federal agencies en-gaged in population projection activities. In ad-dition, local governments, and State and localhealth planning agencies were surveyed to deter-mine how population projections figures wereobtained. The findings were that the Bureau ofEconomic Analysis has a regional projectionprogram, and that the Bureau of the Census hasan elaborate projection program for the Nationas a whole with several levels of details for yearsup to the year of 2000; none of which are usefulfor health planning at the State and local levels.More specifically, the research revealed that:
1. At the Federal level, there was no pro-gram which had a small area or asubgroup methodology in place andready for use for health planners.
2. Although health Planners were en-
3.
gaged ‘in projecting population forhealth planning purposes, the level ofdetail did not go beyond breakdownsof age, sex and race. Most of the plan-ners wanted some assistance in project-ing population, and
There were projection methodolo~esdeveloped and in use for projec~rtgtotal population and for such subgroupsas school population, etc., but none ofthem had the demographic and eco-nomic dimensions for health planning.
In summary, the’ research clearly revealed twobroad areas of need: (1) Population projectionmethodologies suitable for health planners, and(2) Demographic, social and behavioral analysesfor subgroups of the population.
To address those needs, efforts had to be initiat-ed to fill the gaps in the population projectionarena for health planners. Most critical is theneed for managers engaged in planning for thehealth delivery system than perhaps for any oth-er group of professionals. One obvious reason isthe length of time needed for actual acquisitionof health service components—as an example,the time required for various mixes of healthmanpower to be inducted for training throughthe total process of training on up to aciual pro-fessional practicing.
Therefore, in- the early part of 1974 after ourresearch was completed, yet prior to the enact-
135
I
229-121 0-77- 10

ment of Public Law 93-641 and even before thebill itself was crystalizing into aclear-cut piece oflegislation, it became clear that if health plan-ning was to be rational, and if local health plan-ning agencies were to be responsive to the man-dates of the emerging Public Law 93-641, thensupport was needed to further the state of theart in small area and subgroup populationprojection methodologies. In turn a technicalassistance program within our Bureau had to bedeveloped in order to address the needs ofhealth planners, not planners in general.
In developing that program, one key questionarose: Should the output tools be geared towardhelping health planners to solve tactical prob-lems, or strategical problems or both? The ques-tion was critical because the need for projectingfor various population groups becomes impor-tant to the specificity of the particular problemarea. The principle characteristics for. whichprojections need to be made are age and sex.Projections may also be prepared for urban andrural populations, various social and economicsubgroups of the population as well as othermeaningful demographic aggregates.
This paper has highlighted the need to estimateand project for all subgroups. In our PopulationProjection Program for Health Planners, we areproviding tools that address &e simple—age, sexand race projections to the more complex—so-cial and economic subgroups; thereby helpingplanners to solve all population-base problems.
Current Status of the Poptdation ProjectionProgram for Health Planning
There are three major efforts underway-all ofwhich use the cohort-component or survivalmethod of projection and analysis. They are:
1. A manual for Local Area Population Projec-tioriq with step-by-step illustrations.
●
●
●
136
S~rnmarize population projection meth-ods currently in use and therefore pro-vides planners with a general knowledgebase about advantages and disadvantagesof existing methods.Provide as a tool for planners to use inthe evaluation of projection figures fromindependent sources so as to determinethe suitability of the projections for theirown planning needs.Give, in the absence of available and suit-able projections, a step-by-step illustra-
~,
2.
3.
tion on how planners might develop theirown projections.
A manual* for Population Projection forSub-County Areas. This part of the Pro-gram will focus on bringing together undoc-umented knowledge about indicators ofpopulation changes and growth patterns insmall areas below the county levels. Its pur-pose is two-fold: to provide a complete de-scription of existing methodologies in useby health planners in projecting populationfor small sub-county areas; and to present afull step-wise procedure for carrying out adeveloped or recommended methodologyfor such. In order to achieve the latter por-tion of the purpose, it will be necessary toexplore the possibilities of developing a sys-tematic procedure that identifies and quan- ‘tifies the special conditions that distort long-term growth patterns. Of significance andconcern will be sub-areas whose growthrates have varied widely from the norm oftheir respective larger parent areas; andthose that are vastly different from onedecade to the next. The methodology willbe suitable for health system agencies to usein projecting population characteristics forareas not following jurisdictional lines, areassmaller than counties; may be as small asgroups of census tracts.
In general then, the sub-area manual willcontain concepts and procedures on smallarea population projections never beforeaddressed in any systematic way. Therefore,these ideas and procedures are expected tobe the frontiers of knowledge in the field ofdemography.
Both manuals assume minimum technicalskills and minimum technology.
A software computer package for two DoDu-Iation ,projectioh mo~els, r~gional and ~ub-area, which are tailored for use with amodel to project the need for and accessi-bdity to health services and facilities forspecific groups of regional population. Thetwo population projection models are de-signed to project regional population and tobe used in detecting stability, of and project-ing population for sub-areas within regionsfor community health planning. Planningagencies will need access to computer facili-ties and related resources in order to utilizethese technologies.
*To be developed in phases.

What are the characteristics of the Regionaland Sub-area Population Projection Mo-dels?
(a) The Regional Model is an Area Popula-tion Projection Labor Force Estimator(APPLE): It is basically independent ofthe sub-area; however, the sub-areamodel is not itself an independent mo-del. If the retional. model is to be work-able, it is m~ndatory that an area be“closed;’ that is there should exist amagnetic field of social and economicactivities which allows residents to func-tion independently of other geographi-cal areas. An example of such a “closed”area is a Bureau of Economic Area(BEA) or a Standard. Metropolitan Sta-tistical Area (SMSA). By using this ap-proach the patterns of migration andmigration rates between sub-areas be-come more homogeneous and also morestable.
The regional model accounts for age,sex, race, commuting patterns and laborforce participation, and is most useful,and therefore, recommendedfor “closed” urban areas of 250,000 orgreater population or “closed” ruralareas which might be less than 250,000population size.
In developing the model and the soft-ware package, the projection modeland system developed jointly by theAssociation of Bay Area Governments(ABAG) and the Metropolitan Trans-portation Commission (MTC) was used.The ABAGMTC system requires amassive set of data elements which can,of course, be replaced by a regressionequation. The loss in information byusing a regression relationship will betested and measured before making itan integral part of the model. APPLE,the regional model is a system of sixprograms; five of which are independ-ent programs that transform demo-graphic parameters into data inputs forthe principal program, cohort-survivalmodel.
The regional software package is com-pleted except for sensitivity testing.
The Sub-Area Projection Model is anArea Demographic Allocation Model(ADAM): It assumes that the larger area
In
of which the sub-area is a part, is in fact“closed” and 250,000 population size orgreater. Therefore, to use the sub-areamodel, there must exist a social-eco-nomic clustering effect.
When such conditions hold, then themodel will permit a social area analysis.That is, using various sets of variablesor one set of variables, sub-areas can beanalyzed and clustered using scores onthree descriptors which are:
1. Socioeconomic status2. State-in-life cycle3. Race
Normalized scores for each descriptorcan be assigned to census tracts or someother sub-area for the purpose of iden-tifying homogeneous communities.These communities can thereafter beranked, compared, and in general, cate-gorically looked at for health planningpurposes.
the development of the general modelfor the social ~rea analysis, many variables,taken from the decennial census, are beingtested and evaluated to determine those thathave the greatest independence from eachother, in defining and standardizing the so-aoeconomic status, stage-in-life cycle, andrace descriptors.
As a general rule, products developed forhealth planners, such as the ones discussed,undergo an extensive review for technicalsoundness and completeness. In addition,field testing is conducted when appropriateand/or when an increase in precision andreliability can be gained for the prescribedapplications. Consequently, health plannerswill be able to use such products and tech-nology with high confidence.
CONCLUSIONThere is supportive evidence that more re-
sources should be directed toward technology andmethods development which will allow for betteranalyses of WHO WE ARE PLANNING FOR. It issafe to say that even though the state of me.tiodsdevelopment for estimating and projecting sub-groups and sub-area of the population for healthplanning has been born, further development, re-finement and testing of that technology need to bedone.
137

Effective heahh planning is a difficult art; ‘not askill. It requires the skills of many people to becomesingle-minded in order to meet the health needs ofall. This would infer that. effective health planningis an unachievable goal; but h CHALLENGE tohealth planners and to those who provide technicalassistance to them is:
● TO gather qualitative information and collectneeded data that will disclose “differences” inservice utilization.
● TO analytically and factually resolve those
“differences” such that definitive health goalsand plans can be established and carried out.
● To analyze social, cultural and economic var-iables and their interrelationships for sub-
groups in order to improve the health of all
the people; and finally● To estimate and project subgroups of the
population so that their differential needs
are better planned for and met.If the CHALLENGE is accepted, then effective
health planning will have begun, and the estimationand projection of various population groups will begiven high priority-its proper place.
REFERENCESBarnes, Margaret A., “The Bureau of Health PlanningResources and Development’s Population Projection andDemographic Analysis Program,” Paper prepared for theConference on the Cooperative Health Statistics Systemand Methods for Making Population Projections and Esti-mates, New York, New York, December 12, 1975.
Blum, H.L. and Sufly, E. K., “What is ComprehensivePlanning for Health” Inquiry, 6, 2, 1969, p.3.
Brown, D.R., “Evaluation of Health Planning; SelectedPapers on Health Planning, Health AdministrationPerspectives.
Ensminger, Barry, me $8 Billion Hospital Bed Overrun:A Consumer’s Guide to Stopping Wasteful Construction,Public Chizen’s Health Research Group, Washington,D.C., 1975.
Godschalk, David, Partia”pation, Planning, and Exchangein Old and New Communities: A Collaborative Parodigm,Center for Urban and Regional Studies, University ofNorth Carolina, Chapel HIII, 1972.
H]lleboe, H.E., “Health Planning on a Community Basis”Medical Care, 6, May-June 1968, p. 212,
Horwitz, Abraham, “The 10-Year Health Plan for theAmericas: American journal of Public Health, Vol. 65,No. 10, (October 1975), pp. 1057-1059.
Irwin, Richard, “Methods and Sources of Data for Poptt]a-tion Projections of Small Areas: Paper prepared for theConference on Population Forecasting for Small Areas,Oak Ridge, Tennessee, May 5-6, 1975,
Kahn, A. J., Theory and Practice of Social Planning, NewYork: Russell Sage Foundation, 1969, p. 102,
Lankford, Philip M., “Physician Location Factors and
Public Policy; Economic Geography, Vol. 50, No, 3, (July1974), pp. 244-255,
Litsios, S., “The Principles and Methods of Evaluation ofNational Health Plans< International Journal of HealthServices, 1, 1, 1971, p. 85.
N?varro, Vicente, “Methods of Planning the Distributionof Personal Health Services,” Health Planns’ng QualitativeAspects and Quantitative Techniques, Edited by Reinkeand Williams, K., Johns Hopkins School of Hygiene andPublic Health, 1972.
Terris, Milton, “Approaches to an Epidemiology ofHealth,” American Journal of Pufdic Health, Vol, 65, No.10, (October 1975), pp. 1037-1045.
U.S. Congress, The Comprehensive Health Planning andPublic Health Services Amendments of 1966, S-3.008, 89thCongress, November 3,1966.
U.S. Congress, The NationaI Health Planning and Re-sources Development Act of 1974, S-2993, 93rd Congress,January 4, 1975.
Waters, W.J., A Process Appraisal of ComprehensiveHealth Planning at the State Level, Ph,D. Dissertation,Ann Arbor: University Microfilms, #75-1 1,443, 1974,
Waters, William J., “State Level Comprehensive HeahhPlanning: A Retrospect: American Journal of Public
Health, Vo. 66, No. 2, (February 1976), pp, 139-144.
Zehner, R.B. and Chapin, F.S., &ross the City L!ne: AWhite Community in Transition, Lexington, Mass,, D.C,Health and Company, 1974.
138

STATISTICAL APPRAISAL OF PRIMARY CARE IN RURAL AREASOR
(Some Data + Experts = Different Conclusions)
W. Grady Stumbo, M.D., President and Primary Care Physician, East Kentucky HealthServices Center, Inc., Hindman, Kentucky
In conceptualizing the idea of primary carecenters, I am convinced that, in the past, attentionwas predominately focused on elements of the ma-cro-system — organizational patterns, governmentaland administrative issues, financing and manpowerprograms. Much less concern seemed to be shownabout how services were actually delivered. Whoactually delivers what services to whom? What ii thebest way to increase production of physicians with-out sacrificing the “quality” of patient care? It israpidly becoming apparent that no one person candeliver all care to all people. If such a person didexist, then he would be a “self-contained patientcare team”..
In designing a primary care model, the mainidea is to develop a program that is organized forthe delivery of health services. This design mustutilize new concepts in organizing health manpow-er, as well as instituting management practices thatwill insure quality, quantity and economic viability.
Rural areas are becoming focal points for newmodels for the delivery of health services, largelybecause as consumer demand for services increased,the greatest stress on health manpower was felt inrural areas. Because of this external force. there
~has been a surge of support in rural areas for newmodels that demonstrate principles of efficiency andproductivity within a framework of economic viabil-ity through new management techniques.
One such model is the development of thephysician into a “monitor of health care” ratherthan the sole provider. The point to be made is thatmany functions can be transferred and that onedoes not have to be a physician or nurse to performthem - a development which necessitates an altera-tion in the traditional role of physicians.
The physician is confronted by problems, basi-cally ones of quantity: the number of hours hemust work, the number of patients to be seen, andthe amount of paper work to be done.
The turn-of-the-century physician functionedas an individual unattached to an institution. Hewas not a p,art of a health care system; rather, hisisolation made him alone the system. With progressin biomedical technology and the increased com-plexity of technical equipment and facilities, frag-mentation resulted. To further strain the manpow-er pool, specialization has markedly redirected theprimary manpower available.
As the demands for services rapidly exceededthe ability of the old system to provide them, and asnew concepts of progressive patient care developed,rural areas were forced to look for new means ofhealth care delivery. One such methbd is the pri-mary health care team — those multidisciplinaryhealth providers who can function ininterchangeable roles to assist or solve the majorityof problems encountered in primary care.
This concept of the primary health care teamrepresents a modification of the original role of thephysician. The development of primary health careteams is enhanced when one notes that a character-istic of the health system is that it is a service indus-try and tends to delegate tasks downward. Againstthis background of unmet needs, inadequate num-bers, and rising costs, the value of the physicianextender cannot be disputed.
Today in rural community practice models, theprimary health care team concept in health deliveryis being developed. These primary care healthteams’ functions consist of four basic components:the process of diagnosis, the problem diagnosis, theprocess Of therapeutics, and therapeutics.
The role of the physician on a team is to de-sign the process of diagnosis (data base), to developprotocols for patient care, and to conduct trainingefforts to insure reliable and accurate recordings ofthe findings. As the system develops and knowledgeexpands, the physician must redesign the system.He must have a broad-based knowledge to allowhim Ito determine the need for the process of thera-peutics. He must be able to carefully exercise theoptions of intervention as to the time and degree ofintervention. The physician must become a contin-ual critic of himself and the team. He must reconsi-der all acts, reevaluate all decisions — both his andthe team’s — in light of the standing protocols andpredetermined set of norms. In other words, thephysician becomes the monitor for an entirely newhealth care delivery system and the unifying forceof the team.
First let us review the problems or disease pat-terns of patients in an actual clinic setting:
Table 1- Patient contacts per month2- Hospitalization Rate3- Prescriptions Filled4- Lab Procedures
139

Table 5- Other Diagnostic andTherapeutic Procedures
6- Illness Encounters7- Illness Encounters
Physician Extenders8- Summary9- Retional Differences in
~ertain Health Care Statistics
Patient Contacts per Monthat
East Kentucky Healti Services Center, Inc.
1973 – 1974 – 1975
MONTH 1973 1974 1975
JanuaryFebruaryMarchAprilMayJuneJr.dyAugust~eptemberOctoberNovemberDecember
266535557694924918
1,2701,27.51,2011,2811,2771,239
1,7051,8541,9022,1022,0021,8091,8541,8332,0862,2761,9131,651
2,0171,9542,2212,0942,2042,2962,3762,3872,5612,3272,0831,984
Number of Prescriptions Filled, %erage Number ofPrescriptions Filled per Day, and Average
Prescriptions Filled per Patientat
East Kentucky HeaIth Services Center, Inc.1974
Prescriptions Average AverageMonth Filled Per Day Per Patient
JanuaryFebruaryMarchAprilMayJuneJdyAugustSeptemberOctoberNovember*December*
2,0282,1062,5112,5032,4982,3882,3872,4382,1992,697
8596102104104102108111110117
1.191.171.321.191.251.321.311.331.071,18
TOTALS 23,755 103.9 1.233
*Pharmacywasclosed duringNovemberandDecember,1974.
TOTALS 11,437 22,987 25,272East Kentucky Health Services Center, Inc.
Laboratory Procedures
Hospitalization Rateof
East Kentucky Health Services Center, Inc.1974
Hospitalized Hospitalization Rate –Month Patients* Non-Dental Patient Contact
January 30 .022February 24 .015March 40 .026 -April 20 .012May 27 .015June 48 .033July 38 .029August 47 .023September 68 .050October 47 .024November 27 .017December - 32 .023
TOTAL 448 .024
*Includes OB patientsand newborn infants; informationobtained from the release forms furnished to EKHSCbyhospital.
UrinalysisHematocritSmear for OrganismsPap SmearGIucoseSMA 12Complete Blood CountUrine CultureSerum PotassiumBeta Strep ScreenBUNT4Sugar/Acetone (urine)VDRLSed RatePregnancy TestRubella TiterBlood Type with RhOral Qucose Tolerance TestMiscellaneous Lab Tests
716476172163141132128109
89816249473534272625
922
Total Lab Procedures – 2543Lab Procedure Per Patient Encounter -1.84
Period 7/1/74 - 9/30/74
140

East Kentucky HeaIth Services Center, Inc.Other Diagnostic and Therapeutic Procedures
PPD and HiatoElectrocardiograms with 9 Stress TestsPdmonary Function TestsAthrocentesisBlood Gas AnalysisSigmoidoscopy and ProctoscopyGastroscopyLaryngoscopyNewborn Circumcision (Office)IPPBVasectomyAmniocentesis
120116403630111010
6632
Total Number Proceduresof Procedures -390 per Patient -.081
Period 7/1/74-9/30/74
Illness Encounter Cliartfllness Encounter Physician Extender ChartEast Kentucky Health Services Center, Inc.
Total Number of Clinic Visits 4690Total Number of Walk-In Patients 1778 (37.9%)Total Number of Patients with .
Appointments 2912 (62.1%)Total Number of After Hours Visits 158 (3.04%)
Total Number of Visits DuringClinic Hours
Diagnostic/Therapeutic Proceduresper Patient
X-rays per PatientLaboratory Tests per PatientTotal Problem EncountersTotal Problem Encounters by
Physician ExtenderTotal Patient EncountersTotal Patient Encounters by
Physician ExtenderTotal Problems/Patient EncounterProblems/Patient Encounter by
Physician ExtenderTotal Patient Encounters
After HoursPatient Encounters After Hours
by Physician ExtenderTotal Problem Encounters
After HunrsProblem Encounters After Hours
by Physician ExtenderTotal Problems/Patient Encounter
After HoursProblems/Patient Encounter After
Hours by Physician Extender
4532 (96.06%)
.081
.101.848168
1875 (22.96%)4690
1076 (22.94%)1.74
1.74
158
108 (68.35%)
179
121 (67.60%)
1.13
1.12
Period 7/1/74 - 9/30/74
Regional Differences in Certain Health-CareStatistics, United States
Census Divisions
New East-North East-South EKHSCEngland Central Central
1. Number of active M.D.s involved in patient care as 161 115their primary activity, per 100,000 poptiation (1.00) (0.71) (0.;;) (0.:;)
2. Average annual number of patient visits per M.D.(a) total patient visits 4808 6611 8408 9282
(b) office visits ordy (1.00) (1.38) (1.75) (1.93)
3384 4799 6052 9024(1.00). (1.42) (1.79) (2.67)
3. Total visits per practice hour 1.92 2.65 3.27 2.35
4. Average number of auxillary personnel employed 1.3 1.8 2.1 3.0per physician (non-administrative)
5. Average fee for a routine followup office visit in $6.79 $6.29 $5.21 $4.40a general practice
(Figuresin parenthesesareindicesbaaedon NewEnglandas 1.00) ,
141

In attempting to define services offered in pri-mary care, one can begin by defining the health ornon-health patterns of the public and relating tothose patterns, the procedures or drugs necessaryfor a satisfactory solution. To illustrate this in moredepth:
Related
Category Problem Drugs/Procedures
1. Infectious Otitis Media AntibioticsDisease Decongestants ~
Myringotomy
Pharyngitis Bacterial CulturesGram StainMono SpotAntibiotics
2. Pulmonary Emphysema Ability to inter-Coal Workers’ pret X-rays
Pneumoconiosis Pulmonary Func-Bronchitis tion Tests
SpirometryBlood Gas “
AnalysisIPPBGram Stain of
SputumBronchodilators/
ExpectorantInstruction in Per-
cussion andPostural Drain-age
Antibiotics andCdtures
Related
Category Problem Drugs/Procedures
3. Gyne- Vaginitis Pap Smear
Cology MicroscopeKOH and Saline
SmearsCultures
4. General Procedures Training of StaffOffice Community Patient Education
Work FitnessEducation
PreventativeMedicine
Health Care Referral Mecha-
System nismConsultation
MechanismRecords Problem Type
AccountingProcedures
This approach in defining primary care serv-ices is valid because the inputs to primary care aresymptoms and complaints. The above examples re-lating either category or problem to the procedureor drug can be expanded in great detail, as hasbeen done at East Kentucky Health Services Center,Inc. EKSHC staff believes primary care requiresspecial training. With this training comes a need todevelop audit techniques to differentiate degrees ofquality in primary care. When viewing primary carein this fashion, it becomes possible to evaluate thebreadth of training and skills necessary for primarycare and to incorporate all health professionals indelivering medical services in a stratified manner,
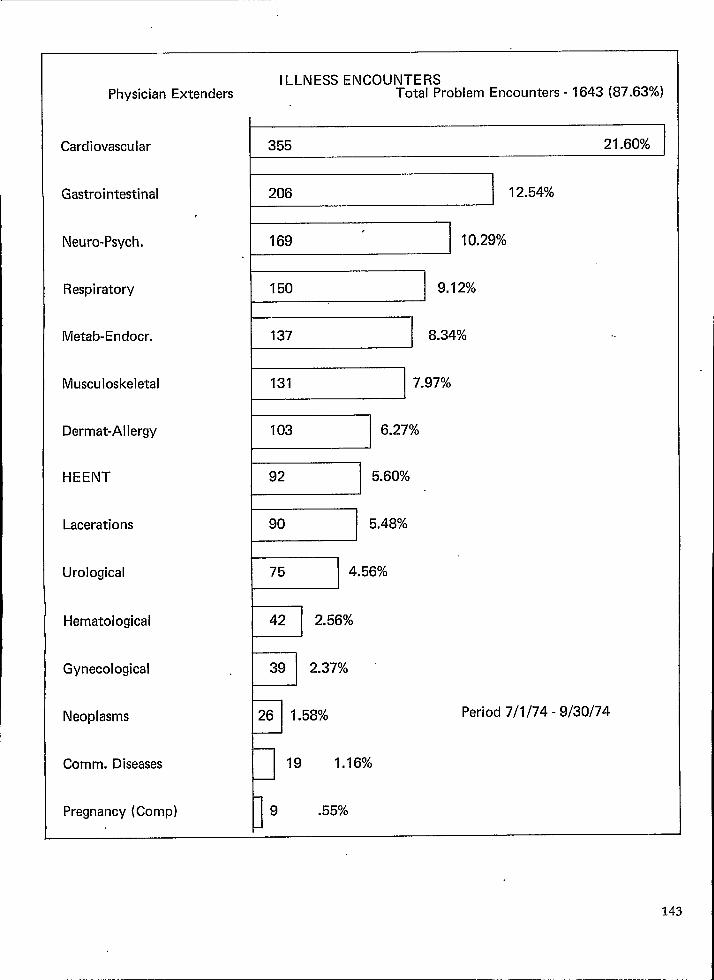
ILLNESS ENCOUNTERSPhysician Extenders Total Problem Encounters -1643 (87.63%)
Cardiovascular 355 21 .60%
Gastrointestinal 206 12,54%
Neuro-Psych.
~ 10”2’%
Respiratory~ ‘“12%
Metab-Endocr. I 137 I 8.34%
Musculoskeletal I 131 7.97%
Dermat-Allergy I 103 I 6.27%
HEENT
w 5“60% ~
Lacerations
95“48%
Urological I 75 I 4.56%
Hematological I 42 I 2.56%
I I
Gynecological
“v
39 2.37%
Neoplasms
P
26 1.58% Period 7/1/74 - 9/30/74
Comm. Diseases
P
19 1.16%
Pregnancy (Comp)D
9 .55%

ILLNESS ENCOUNTERS .
Total Problem Encounters -7584 (92.85%)
I
Cardiovascular 1787 23.56%
Musculoskeltal 849 11.19%
Metab.-Endocr. 778 10,28%
Respiratory~ “0-13%
Neuro-Psych. 709 I 9.35%
Gastrointest. I 682 I 8.99%
Dermat.-Aller. I 483 I 6.37%
HEENT ~ 6.18%
Urological
w 4“02’
Lacerations I 225 I 2.97%
Gynecological
Hematological
D196 2.58%
t-1 130 1.71%Period 7/1/74 - 9/30/74
Neoplasms
Comm. Diseases
Pregnancy (Compl.)
I 123 1.62%
1 54 .71%
1“26 .34%
144
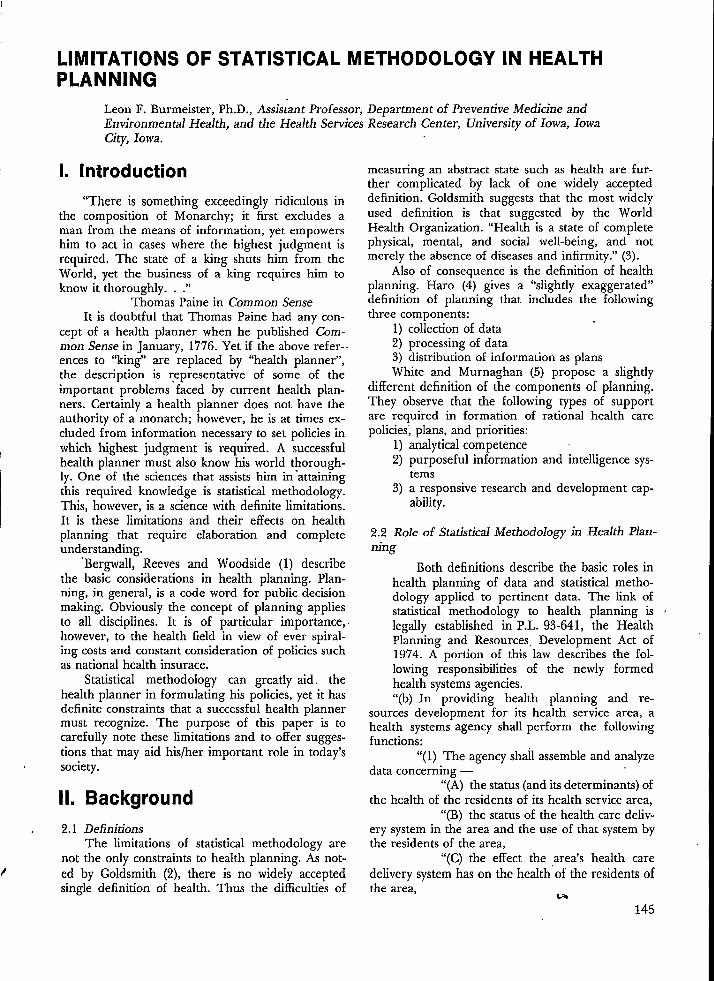
)
LIMITATIONSPLANNING
OF STATISTICAL METHODOLOGY IN HEALTH
Leon F. Burmeister, Ph.D., Assis;ant Professor, Department of Preventive Medicine andEnvironmental Health, and the Health Services Re;earch Center, University of Iowa, IowaCity, Iowa.
1. Introduction
“There is something exceedingly ridiculous inthe composition of Monarchy; it first excludes aman from the means of information. vet emDowershim to act in cases where the highes~ judg~ent isrequired, The state of a king shuts him from theWorld, yet the business of a king requires him toknow it thoroughly. . .“
Thomas Paine in Common SenseIt is doubtful that Thomas Paine had any con-
cept of a health planner when he published Com-mon Sense in January, 1776. Yet if the above refer-.ences to “king” are replaced by “health planner”,the description is representative of some of theimportant problems faced by current health plan-ners. Certainly a health planner does not have theauthority of a“monarch; however, he is at times ex-cluded from information necessary to set policies inwhich highest judgment is required. A successfulhealth planner must also know his world thorough-ly. One of the sciences that assists him in attainingthis required knowledge is statistical methodology.This, however, is a science with definite limitations.It is these limitations and their effects on healthplanning that require elaboration and completeunderstanding.
‘Bergwall, Reeves and Woodside (1) describethe basic considerations in health planning. Plan-ning, in general, is a code word for public decisionmaking. Obviously the concept of planning appliesto all disciplines. It is of particular importance,however. to the health field in view of ever sDiral-,ing costs and constant consideration of policies suchas national health insurace.
Statistical methodology can greatly aid, thehealth planner in formulating his policies, yet it hasdefinite constraints that a successful health plannermust recognize. The purpose of this paper is tocarefully note these limitations and to offer sugges-tions that may aid his/her important role in today’ssociety.
Il. Background
2.1 DefinitionsThe limitations of statistical methodoloW are
not the only constraints to health planning. As not-! ed by Goldsmith (2), there is no- widely- accepted
single definition of health. Thus the difficulties of
measuring an abstract state such as health are fur-ther complicated by lack of one widely accepteddefinition. Goldsmith suggests that the most widelyused definition is that suggested by the WorldHealth Organization. “Health is a state of completephysical, mental, and social well-being, and notmerely the absence of diseases and infirmity.” (3).
Also of consequence is the definition of healthplanning. Haro (4) gives a “slightly exaggerated”definition of planning that includes the followingthree components:
1) collection of data2) processing of data3) distribution of information as plansWhite and Murnaghan (5) propose a slightly
different definition of the components of planning.They observe that the following types of supportare required in formation of rational health carepolicies; plans, and priorities:
1) analytical competence2) purposeful information and intelligence sys-
tems3) a responsive research and development cap-
ability.
2.2 Role of Statistical Methodology in Health Plan-ning
Both definitions describe the basic roles inhealth planning of data and statistical metho-dology applied to pertinent data. The fink ofstatistical methodology to health planning islegally established in P.L. 93-641, the HealthPlanning and Resources. Development Act of1974. A portion of tfis law describes the fol-lowing responsibilities of the newly formedhealth systems agencies.“(b) In providing health planning and re-
sources development for its health service area, ahealth systems agency shall perform the followingfunctions:
“(l) The agency shail assemble and analyzedata concerning —
“(A) the status (and its determinants) ofthe health of the residents of its health service area,
“(B) the status of the health care deliv-ery system in the area and the use of that system bythe residents of the area,
“(C) the effect the area’s health caredelivery system has on the health of the residents ofthe area,
-145

“(D) me number, type and location ofthe area’s health resources including health services,manpower, and facilities,
“(E) the patterns of utilization of thearea’s health resources, and
‘ “(F) the environmental and occupa-tional exposure factors affecting immediate andlong-term health conditions.
In carrying out this paragraph, the agency shall tothe maximum extent practicable use existing data(including data developed under Federal healthprograms) and coordinate its activities with thecooperative system provided for under section306(e).
The stiptiations of this portion of P.L. 93-641are indeed stringent. Zemach (6) suggests that theexpectations of statistical analysis “are unrealistic inthe new Federal planning legislation mandated byP.L. 93-641. To analyze data relevant to the six tasksdescribed above is indeed formidable since several ofthe different states and effects are very difficdt toquantify. To do so utilizing existing data causes thestatistical problems of the health systems agencies tobe even more complex.
2.3 Major Statistical Problems in Health PlanningSome of the major problems are defined in the
recently published health statistics plan for fiscalyears 1976-77 (7). Critical gaps are cited in usableinformation in manpower resources, utilization ofservices and costs, and expenditures related tohealth care. Note that manpo~~er and utilization sta-tistics are specifically addressed in P.L. 93-641. It isalso noted that data necessary for planning describ-ing accessibility to health services, provision of serv-ices and nature of facilities used are not very “cur-rent”.
Additional problems are faced by health plan-ners. White and Murnaghan (5) note that reliabledata needed by health planners are in short supply.Perrin (8) observes that the large nationaf studiesoffer little of current value to States and communi-ties., Ashley (9) notes that in the Hospital In-PatientEnquiry the data by the time published are twoyears out-of-date.
It is certainly difficult to expect effective healthplanning based on currently available data. Howev-er, the first step in improvement of any process isrecognition of existing weaknesses. Then attemptscan be made to improve the current situation. Cer-tainly such attempts are being considered in thelarge arena of health planning. Before evaluatingcurrent efforts, a closer consideration of the stepsinvolved in hea~h planning is necessary.
146
Ill. The Planning Process
Bergwall, Reeves and Woodside (1) identify thefollowing seven steps in the planning process.
1. To identify the desired state (set our objec-tives).
2. To determine the discrepancy between thedesired state and those conditions that would belikely to occur if no action were taken (this involvesforecasting).
3. To identify the resources that will probablybe available to effect changes toward the desiredstate.
4. To develop feasible alternative methods forusing those resources to effect the necessarychanges.
5. To evaluate those alternatives and select theone that seems most likely to achieve the desiredresults at a reasonable cost.
6. To implement the chosen alternative,7. To appraise the performance of this alterna-
tive and then make the necessary adjustments tobring it closer toward achieving the desired objec-tives.
With the exceptions of step 6 and possibly step1, statistical methodology can assist the health plan-ner in the completion of each step. Just as ThomasPaine noted for the monarch, the health plannermust maximize his knowledge of his world to beeffective. This is reflected particularly in steps 2 and.3. Statistical methods such as the design of samplesurveys, construction of health status indicators anddesign of health information systems can be helpfulin completing steps 2 through 5 and 7. Yet each ofthese methods has limitations that can severelyhamper the unwary health planner,
The problem of forecasting as described in step2 is a severe problem in all types of planning and isof particular difficulty in the constantly changingworld of health care. The fourth step of developingalternative methods often involves the constructionof arbitrary models that include proper economicconstraints. The evaluation of the resulting alterna-tives is very much dependent on the appropriate-ness of the original model. The final step of pro-gram evaluation is very dependent on the problemof what type of outcome is to be measured, theproblems in quantifying the outcome and the possi-bility that statistics may be manipulated to attain“evidence” that a desired outcome may have beenrealized.
Before studying carefully the relation of statis-tical methodologies to the various steps in the plan-ning process, it is important to emphasize that thehealth planner must be fully aware of the currentinformation that is available to him, The impor-tance of this awareness is illustrated in P.L, 93-641,the law establishing Health Systems Agencies.

The statistical methodologies that are most re-lated to the steps in planning are as follows: samplesurvey design, health information systems andhealth status indexes in describing the existing situ-ation and resources; model building in forecastingand evaluation of alternative methods; and modelbuilding and outcome measurement in evaluation.The emphasis of this paper is on the statisticalmethods used in describing the health planner’sexisting world and resources. This awareness is ba-sic to establishment of “careful coordination, coop-eration, and communication - in a word, planning.”(l).
IV. Major StatisticalLimitations in Health Planning
4.1 Health Status IndexesBergwall, Reeves and Woodside (1) state “Per-
haps of greatest importance to the health plannerare data which concern those characteristics thatrelate to the health status of the community.”Health status indexes consequently are of greatpotential use to the health planner. In his review ofhealth status indicators, Goldsmith (2) addresses thebasic problem that health has many different defini-tions. He notes that even if one definition of healthwere to be universally accepted, the measures to beincluded in the construction of a health status indexwould be difficult to determine.
4.1.1 General ProblemsThere exist many problems in the construction
of health indexes that accurately measure thehealth status of a community. A very basic and rela-tively simple problem is illustrated by Chiang (10).Assume that a child had chickenpox from February1 to February 14. On February 11 he contacted acold that lasted until February 18. How many sickdays did this child suffer? Cases could be made forboth 18 days and 21 days.
This problem is relatively simple, yet it illus-trates a difficulty in assessing the health limitationsof a single individual. Many additional problemsquickly become apparent when the concept is ap-plied to the health status of an entire community.The number of potential variables that could beincluded in an index is large and results in a verycomplex formula, This is just one of several impor-tant problems. Balinsky and Berger (11) list the fol-lowing four major obstacles in the development ofa health status index:
1. Definition of health2. Measurement3. Statistical reliability and validity4. Sensitivity/applicability
The basic problem of definition of health isthoroughly discussed by Goldsmith (2). Althoughmortality is easily measured, a complete health in-dex should include some measure of morbidity.The difficulty of measuring morbidity is well knownand described in many references (2,12). The statis-tical problems of reliability and validity are includedin many areas of statistical application. Reliability isthe repeatability of results from one occasion toanother. Validity is the accuracy of measurement.Both concepts are limited by the fact that most (ifnot all) health status indexes are subject to theproblems of including conceptualizations and valuejudgments as noted by Goldsmith (2). Thus theproblem of measuring validity, which is by naturevery difficult because some knowledge of what istrue or accurate is necessary to provide the basis ofcomparison, is even further complicated. The lastobstacle of sensitivity/applicability similarly is diffi-cult to address because of the measurement prob-lems inherent in the construction of a health statusindex. In addition, if an existing index fails to de-tect a change in the health of a community, thatindex may be unreliable, invalid, insensitive, notapplicable or any combination of these and othershortcomings.
Perhaps even more of a hindrance to the devel-opment of health status indexes is the necessity ofthe index to represent a community or small area.Only if the index describes a community will it beof use to a health planner at a local or area-widelevel. In addition to the obstacles noted by Balinskyand Berger (11), an additional problem presentingsevere limitations is that most often there is a lackof appropriate data at the local level (13). Manyhealth status indexes are based on national statisticsand, due to variations in community characteristics,are of limited value to a local health planner (14).
4.1.2 Problems of Specific Health Indexes
Wallace, Eisner and Dooley (15) studied theavailability of health and social indexes in San Fran-cisco. The health indexes considered for potentialuse were one-dimensional as opposed to functionsof several indicators and included fetal mortality,childhood mortality and tuberculosis incidence.Only eight of twenty health indexes were available.These others were either not available, not availableby census tract or were based on insufficient num-bers. Of the eight that were available, no descrip-tion of attempts to assess the reliability, validity,sensitivity or applicability of indexes were included.These eight indexes were merely those that wereavailable.
Another problem of specific health indexes isthe variation in results from one area to another.The importance of such variation is described by
147

Wennberg and Gittlesohn (16) in a study of thir-teen relatively small areas in Vermont. This studyillustrates great variation in areas with respect tomeasures of health care delivery. The study is ofextreme importance for at least two reasons. Asnoted by Wennberg and Gittlesohn, the measuresused lose their sensitivity when the areas are com-bined into larger areas. The second important illus-tration is the confirmation of the necessity of localcommunity data for successful health planning.
An additional important planning strategy thatnecessitates community data is the Hill-Burtonplanning method. As Wennberg and Gittlesohn (16)note, the Hill-Burton planning method in Vermontdoes not consider admissions of residents in an areato hospitals outside the area. The method also doesnot include services delivered to nonresident pa-tients. It would seem necessary to gain insight as tothe reasons that certain residents go outside theirareas to obtain hospital services. Obtaining suchinformation could result in improved coordinationof Hill-Burton decisions from one area to another.In addition, there is the problem of nonusers ofhospital services. Are these the area residents thattruly do not need hospital services? Or are thereimpediments to their use, and are there strategiesthat could be implemented through Hill-Burtonthat could impiove the health of a community?.
4.2 Community- Wide Sample Surveys
Most health planners are concerned with a‘defined and often relatively small area. Basic demo-graphic data describing this community are impera-tive. Since many health needs are age related, sexrelated or culturally related, the planner must havecurrent demographic information describing hiscommunity. Much pertinent information is availablefrom the Bureau of the Census data; however, cen-sus data may be out of date and may not includethe exact measures needed by the health planner.After carefully evaluating existing and availabledata, the health planner may undertake a samplesurvey of the community.
Bergwall, Reeves and Woodside (1) state “Sam-ple surveys give a truly representative picture ofwhat is happening in the community.” Althoughsample surveys do have the advantages of economy,timeliness and (sometimes) quality, they are alsosubject to many disadvantages, including samplingerror. Deming (17) describes 19 errors to whichsample surveys are subject. The health plannermust be very aware of the problems caused by hap-hazard samples, nonrepresentative samples, inter-viewer biases and bias resulting from nonresponse.
In spite of these limitations common to samplesurveys in all areas of application, the prudent useof sample surveys can greatly assist the health plan-
148
ner. White and Murnaghan (5) place great empha-sis on the need for sample surveys in the healthfield since necessary data are often not available,White (18) notes that sample surveys are often theonly way to compare users and nonusers or enroll-ees and nonenrollees. Densen (19) agrees that de-scriptions of patients seen simply are not adequate,’The characteristics of those not currently participat-ing in a system are extremely important if thehealth planner is to improve the health status of theentire community for which he is responsible, Her-shey and Moore (20) note that sample surveys areuseful to describe unserved needs, barriers, out-reach programs and acceptance of programs andcurrent situations. Haas (21) notes that sample sur-veys can be less costly than other methods of col-lecting information describing a population. Hesuggests that since the information provided by theCensus,. although essential, is often outdated, theindividual States conduct annual sample surveys,Although potentially expensive, the concept of Statesample surveys is not inconsistent with the Coopera-tive Health Statistics System (8). Cordle and Tyroler(22) describe the utility provided by a sample sur-vey to detect inequities in one community’s healthcare delivery system. From such evidence, programscan be initiated to improve the health status in thecommunity.
The potential utility of sample surveys to thehealth planner thus is established and is generallyaccepted. However, the sample survey must beemployed only after extremely careful considera-tion of its necessity and even then with utmost cau-tion. As Ludwig and Collette (23) warn, the mostobvious error is the use of a biased or nonrepresen-tative sample. In addition they note the effects onreliability and validity of asking questions that areimpossible to answer either because of lack of h-sfor-mation or confidentiality of response, An exampleof the first situation is the forced response of “yes”or “no” by respondents to the United States Immu-nization Survey when the actual answer concerningthe immunization status of a child is “don’t know”(24). An example of the second problem is the useof a question describing drug usage, The hesitationof a respondent to answer a controversial questioncan be greatly reduced by use of the randomizedresponse (25).
The use of properly randomized and efficientlydesigned sample surveys greatly improves the quali-ty of the results. There exist many alternative sam-ple designs and, consequently, questions concerningthe appropriateness of design for each sample sur-vey proposed and completed. For example, Mur-naghan (26) describes the National Disease andTherapeutic Index, which results from a quotasample, The quota sampling technique is not a ran-domized sample and consequently must be inter-

preted with caution, Cochran (27). Tht quota sam-pling technique allows the interviewer some lati-tude in choosing respondents. It may be thoug~tof as a ‘stratified sampling scheme employing pro-portional allocation of respondents to strata. Such adesign can be optimal, but the health plannershould be aware of the fact that it may be a lessthan optimal sample design in evaluating the resultsfrom such a sample survey.
Additional limitations of the sample surveyapproach should be considered by the health plan-ner. Great care must be taken to insure that the listof persons (sampling frame) represents the popula-tion to be studied. This may be especially difficultwhen studying the population that includes nonu-sers OYnonparticipants, and consequently nonregis-trants, in an established system.
The limitation resulting from nonresponsecannot be overemphasized. There is no “safe” re-sponse level. Cochran (27) shows that the bias re-sulting from nonresponse is
u 2 (*1 - 92)
where W2 is the proportion not responding and @1and 6 z are the characteristics of interest for theresponders and nonresponders respectively. Even ifW2 is small,. great concern must be given to the pos-sible resulting b]as if 8 z differs greatly from O 1. Ifsuch a difference ‘is anticipated, efforts must bemade to include a subsample of the nonrespon-dents. Of course, if the nonrespondents are “hard’core”, such efforts may prove fruitless.
Of more importance than the statistical consid-eration of selecting the optimal sample design andprocedure is the imperative that thorough establish-ment of the need for an additional sample survey isnecessary. As noted by Zemach (6) and Haro (4),sample surveys can be costly and time consuming.This coupled with the fact that correct informationmay not result should cause the health planner toassess very carefully the data that are currentlyavailabIe.
4.3 HeaJti Information Systems
Considerable emphasis has. been given to theuse of existing data both by the structure of theHealth Planning and Resources Development Act of1974, P.L. 93-641, and by those who caution healthplanners not to conduct unnecessary sample sur-veys. The health planner can be greatly assisted inhis/her evaluation of existing data by establishmentand use of a health information system.
Murnaghan (26) gives the following definitionof health information systems: “A system whoseprimary purpose is to select data pertaining to
health services and transform them into the infor-mation needed for decision-making by organiza-
tions and individuals who plan, finance, administer,provide, monitor and evaluate health services. Thehealth information system provides the necessarylink between three components of Hare’s (4) “exag-gerated” definition of health planning. It enablesinformation to be compiled from the collection andprocessing of data. The fact that information isneeded for effective planning and evaluation isunquestioned. As Haro (4) observes, information isthe prerequisite to systematic planning. There canbe no planning without information. Crystal (28)also links the need for information to health plan-ning. However, he emphasizes that the informationsystem is only supportive to health planning andshould not become the overriding consideration inthe health planning process. Another importantconsideration is that given by White (18). He em-phasizes the difference between data, informationand intelligence. It is the intelligence that resultsfrom an effective information system that enablesmeaningful health planning.
Health information systems have several impli-cations. As noted by Knox, Morris and Holland(29), health information systems may imply “statis-tics”, which is basically information, or it may implymanipulation of data, which hopefully results inintelligence. They conclude that “engineering” and“intelligence” must be manipulated together for aneffective system to result.
Although health information systems can bevery effective in reducing the number of unneces-sary and duplicated sample surveys (30), very defi-nite problems exist in the structure of effective sys-tems. The basic problems of confidentiality (31,32)and standardization of data formats (33) are knownto health planners. However, there exist severaladdition~ important problems. As White and Mur-naghan (5) note, the primary data for the systemare sometimes simply not available. Alderson (34)notes that even appropriate and useful data quicklybecome out of date. Even when all necessary dataare available and timely, the system must be able tomeasure hard-to-quantify outcome variables. Fein-stein (35) notes the dubious quality of many medicalrecords. Obviously planning decisions resultingfrom such questionable data are of limited value atbest. Murnaghan (26) notes the even more seriousproblem that most managers lack ihe experience,funds, trained specialists or cooperation from amedical staff to cope with complex data systems.
In addition to these basic problems, considera-ble question exists with respect to the structure ofthe health information system. Crystal (28) com-pares the advantages of centralized and decentral-ized systems. Knox, Morris and Holland (29) prefera regional development over a local development
149

because of costs, staffing, confidentiality and need toconcentrate skills. Of course, many different typesof regional development are possible. Haas (21) andLindberg (36) prefer statewide systems. Davis (37)expresses the opinion that a modular basis is import-ant and Chang and Linders (38) recommend anetwork of minicomputers as opposed to a largedata base.
Regardless of the degree of centralization inthe health information system, an effective system isimperative to successful health planning. We sys-tem must be more than a repository of data. Itmust have the capability of generating intelligencefrom bits of data. To do so requires the successfulinteraction of competent computer scientists, statis-ticians and health- planners. - Whatever degree ofcentralization is selected for any individual system,it must be large enough to support the interactionof skilled ~ersonnel.
Of c;urse, the intelligence resulting from anysvstem can be no better than aualitv of the data col-l;cted by the system. The resu~ts ar~ necessarily lim-ited by the shortcomings of sample surveys, thedifficulties in measuring abstract quantities and thelimitations of medical records. These are difficultproblems that will continue to undergo researchand improvement. In the meantime, the managerof a health information system can justify his/heiexistence by thorough awareness and complete cat-aloging of existing studies and data. The removalof unnecessary duplicated effort must be accom-plished by cornpete;t health information systems.
V. The Future of Statistics inHealth Planning
One of the most frustrating problems that facesthe health planner surely must be the great amountof data describing the entire Nation that has no appli-cability to his/her community. The Nationaf Centerfor Health Statistics has recognized this problem
and attacked it with the formation of the Coopera-tive Health Statistics System (8). However, the im-plementation of the CHSS is far from complete (6)...
Many sources of national data exist that offerlittle assistance to the health planner in his localcommunity. A good example of this is the UnitedStates Immunization Survey, a nationwide studythat offers at best limited assistance to the healthplanner (24).
Other national data is of limited use because ofreporting problems. For example, it is estimatedthat the Morbidity and Mortality Weekly Reportsissued by the Center for Disease Control may in-clude only 10 percent of the cases of particular dis-eases due to the incomplete reporting by local agen-cies.
150
The solution to the problem of more data-being necessary at the local level does not appear tobe easy nor forthcoming. As Brotherston (39) notes,mounting costs are of the greatest current concernto health planners. This fact alone nearly eliminatesthe possibility of extensive community data. So se-vere is this effect of costs that the Household Inter-view Survey component of the Cooperative HealthStatistics System has apparently been abandoned(7). The Health Statistics Plan for fiscal years 1976and 1977 (7) indicates that the Health InterviewSurvey will be redesigned and its size quadrupled to160,000 households. One of the purposes is theprovision of smaller area estimates. Whether theresults will be of greatly increased utility remains tobe seen. However, the strategy appears to be one ofgreat potential. The initial concept of each Statecompleting its own household surveys as one of theseven components of the CHSS may have reachedsevere limitations in that individual States may nothave readily accessible personnel experienced andtrained to conduct a household survey on a state-wide basis.
Although its concept offers future improve-ment, the Cooperative Health Statistics System iscertainly not without problems. The basic problemis financing of the system. There exist differentopinions on how best to finance the system (40).The total amount of funding is limited. As noted byZemach and Ervin (30) more funding has been allo-cated to Medicare recordkeeping than for imple-mentation of the CHSS. Additional problems aredescribed by Zemach (6).
Other hopes for improvement in the futuredepend largely on the roles of National Health In-surance and the Professional Standards ReviewOrganizations. Berkanovic (41) notes the followingthree inadequacies in Medicaid statistics as well as inall insurance data:
1) inaccuracy2) missing dat~3) lack of standard reporting conventions
If National Health Insurance becomes a reality,it is important and perhaps likely that standardreporting conventions will be utilized. If so, theproblems of inaccuracy and missing data may be-come less acute.
Similar improvements in data procedures mayresult as the PSRO’S become experienced. Goran et,al. (42) note that PSRO’S will likely provide the lo-cus for a community-wide system of peer review forall services provided under National Health Insur-
. ante. Thus the PSRO’S have the potential of greatinfluence in the area of evaluation of care. PSRO’Sare coping with many important problems-one of
which is the fact that they are organizations of physi-cians, although various activities may be delegated.It is important to include by some mechanism de-

tailed statistical input. For instance, many decisionsin the PSRO process are based on norms. How arethe norms estimated? Are the data used of goodquality? How much consideration is given to varia-tion from community to community? It seems im-perative that given the potential impact of PSRO’Sthat great concern be given during these relativelyearly stages to the statistical decisions being madeand to the effects these decisions could have on theentire health system.
The fact that great concern is being given tomethods of improving the contribution of statisticsto health planning is illustrated by the committeeevaluating the National Center for Health Statistics.The committee addresses the problem of “HealthStatistics Tomorrow” in its report (40). It is recom-mended that a system of health accounts, consistingof inputs of resources, measured in dollars, man-power, facilities, and services, and outputs of healthstatus, measured by mortality, morbidity, disabilityand ability to function, is a necessary tool for thehealth planner. The concept seems logical; howev-er, the ever-present problem of measuring healthstatus persists.
Other important problems are enumerated thatmust be solved. One Example is the content ofdeath certificates. The reporting of cause of deathincluding secondary causes is of questionable con-sistency from State to State and even from time totime within a State. The same is true of the occupa-tional information included on the death certifi-cates.
The problems of confidentiality (43) and stand-ardization will continue to receive attention.
VI, Summary and ConclusionsThe health planner must have readily available
information describing the population for whomhe/she has responsibility. The necessary informationincludes data describing the population’s healthstatus, health care utilization patterns, health careneeds, facilities, manpower and other communityresources. Much of such information is statistical innature and is consequently subject to several limita-tions.
The data accumulated primarily originate fromrecords and sample surveys. Even complete recordsearches are subject to inaccuracies in reporting,incomplete information and problems resultingfrom lack of standardized reporting forms. In addi-tion, confidentiality considerations may limit theutility and availability of the necessary data.
The necessity to employ sample surveys intro-duces even more limitations into the informationneeded by the health planner. They too are subjectto inaccurate and incomplete reporting, nontian-dard report forms and confidentiality questions. In
addition are the problems peculiar to sample sur-veys, including sampling error, nonrepresentativeor biased samples, interviewer b]as and nonre-sponse bias.
Due to the great and increasing costs of accu-mulating necessary data, extreme care must be util-ized to make maximum use of existing data. One of
the methods of organizing existing data is a healthinformation system. Not only should such a systemprovide a cataloging of available data, it should becapable of accumulating data into information andof converting the information into intelligence.
One problem in health planning’s relation tostatistics results from the fact that many healthcharacteristics such as health status are extremelydifficult to quantify. This is due in part to the diffi-culty that health workers have in accepting a uni-form definition of health.
In spite of the many problems that abound inhealth planning, there is definite hope for improve-ment in the future since the problems are recog-nized and since involved organizations and talentedindividuals are attacking the problems. The Nation-al Center for Health Statistics is implementing theCooperative Health Statistics System to provide lo-cal and State planners with usable information. Inaddition, the Center plans to quadruple the size ofthe Health Interview survey wtilch will increaselocal and State use of resulting information. TheProfessional Standards Review Organizations andthe possibility of Nationaf Health Insurance bothprovide impetus to improve the current state ofconcern. It is likely that the statistical methodologylimitations to health planning will become less se-vere in the near future.
REFERENCES1.
2.
“ 3.
4.
5.
6.
Bergwall, David F., Reeves, Philip N. and Woodside,Nina B., Introduction to Health Planning; Informa-tion Resources Press, Washington, D. C., 1974. ~Goldsmith, Seth B., “The Status of Health Status Indi-cators,” Health Services Reports, Vol, 87, No. 3, 1972,pages 212-20.World Health Organization, The First Ten Years ofthe World Health Organization, WHO, Geneva, 1958,page 459.Hare, A. S., “Planning an Information System forHealth Services; Methods of Information in Medi-cine, Vol. 11, No. I, 1972, pages 1-8.White, K. L. and Murnaghan, J. H., “Health Care Pol-icy Formation: Analysis, Information and Research,”International Journal of Health’ Services, Vol. 3, No.1, 1973, pages 81-91.Zemach, R., “Development of Data Sources: StatisticalProblems and Potentials: presented at the jointSpring meeting of the American Statistical Association
and the Biometric Society, College Station, Texas,1976.
151229-121 0-77 -11
7.
8.
9.
10.
11.
12.
13.
14.
15.
16.
17.
18.
19.
Public Health Service, “Health Statistics Plan: FiscalYears 1976-77, HE 20.16; 976-77, 1975.Perrin, Edward B., “The Cooperative Health StatisticsSystem: Health Services Reports, Vol. 89, No. 1,1974, pages 13-15.Ashley, J. S.A., “Present State of Statistics from Hospi-tal In-Patient Data and Their Uses,” British Journal ofPreventive and Social Medicine, Vol. 26,.1972, pages135-47.National Center for Health Statistics, An Index of
Health: Mathematical Models, PHS Publication No.1000, Ser. 2, No. 5, U.S. Government Printing Office,Washington, D.C., 1965.Balinsky, Warren and Berger, Renee, “A Review ofthe Research on General Health Status Indexes,”Medicd Cme, Vol. 13, No. 4, 1975, pages 283-93-Cunningham, Margery, “Highlights of the 15th Na-tional Meeting of The Public Health Conference onRecords and Statistics Public Health Reports, Vol 89,
No. 6, 1974, page 579.National Center for Health Statistics, Conceptss4Problems in Developing an Index of Health, PHSPublication No. 1000, Ser. 2, No. 17, U.S. Govern-ment Printing Office, Washington, D. C., 1966.National Center for Health Statistics, Disability Cofi-ponents for an Index of Health, PHS Publication No.1000, Ser. 2, No. 42, U.S. Government Printing Off-ice, Washington, D.C., 1971.Wallace, Helen M., Eisner, Victor and Dooley, Samu-el, “Availability and Usefulness of Selected Health andSocioeconomic Data for Community Planning: Amer-ican Journal of Public Health, Vol. 57, No. 5, 1967,pages 762-71.Wennberg, John and Ghtlesohn, Alan, “Small AreaVariations in Health Care Delivery: Sa.cnce, Vol.182, 1973, pages 1102-7.Deming, Willaim Edwards, Some Theory of Sampling,
Dover Publications Inc., New York, 1966, pages 26-30.White, Kerr L., “Priorities. for Health Services Infor-mation,” Health Services Reports, VO1- 88, No. 2,1973, pages 106-12.Densen, Paul M., “The Measurement of Utilization inHealth “Care Pro”grams,~ Health Services Reports, Vol87, No. 10, 1972, pages 958-68.
20 Hershey, John C. and Moore, John R., “The Use of anInformation System for Community Health ServicesPlanning and Management: Medical Care, Vol- 13,No. 2, 1975, pages 114-25.
21. Haas, Arl;n, “Design Considerations for a State HealthDepartment Information System: American Journal
of Public Heahh, V01364, No. 5, 1974, pages 481-95.22. Cordle, Frank and Tyroler, H.A., “The Use of Hospi-
23.
24.
tal Medical Records for Epidemiologic Research.I. Differences in Hospital Utilization and In-HospitalMortality by Age-Race-Sex-Place of Residence and
Socioeconomic Status in a Defined Community Popu-lation; Medical Care, Vol. 12, No. 7, 1974, pages596-610.Ludwig, Edward G. and Collette, John C., “SomeMisuses of Health Statistics: Journal of the AmericanMecfid Association, Vol. 216, No. 3, 1971, pages 493-99.Bean, J.A. and Burmeister, L.F., “Evaluation of theUnited States I.rnmunization Survey I. Design, Sur-
152
25.
26.
27.
28.
29.
30.
31.
32.
33.
34.
35.
36.
37.
38.
39.
40.
41.
42.
43.
v~y Operations and Uses: Submitted to the Journalof Preventive Medicine.Folsom, Ralph E., Greenberg, Bernard G., Horvitz,Daniel B. and Abernathy, James R., “The Two A1ter-nate Questions Randomized Response Model forHuman Surveys: Journal of the American StatisticalAssociation, Vol. 68, No. 343, 1973, pages 525-530.Murnaghan, Jane H., “Health-Services InformationSystems in the United States Today;” The New Eng-land Journal of Medicine, Vol, 290, No. 11, 1974,pages 603-10.Cochran, William G., Sampling Techniques, John Wil-
ey and sons} Inc.) New York, 1963) pages 136-7,Crystal, Royal A., “Planning Data Requirements andCommunity Based Health Information Systems: pre-sented at Charleston, South Carolina, April 22, 19’70.Knox, E. G., Morris, J.N. and Holland, W,W., “Plan-ning Medical Information System in a Unified HealthService; The Lancet, 1972, pages 696-9.Zemach R. and Ervin, T. R., “Records and Statistics:Health Services Reports, Vol. 83, No. 5, 1973, pages436-41.Beggs-Baker, S., Nick, W.V., Chase, R.C., Keller, M.D.and Vallbona, C., “Individual Privacy Considerationsfor Computerized Health Information Systems: Med-ical Care, Vol. 12, No- 1, 1974, pages 75-84,Curran, J.D., Stearns, B. and Kaplan, H., “Privacy,Confidentiality and other Legal Considerations in theEstablishment of a Centralized Health-Data SystemflThe New England Journal of Medicine, Vol. 281, No.5, 1969, pages 241-7.National Center for Health Statistics, Uniform Hospf-
tal Abstract: Minim urn Basic Data Set, PHS Publica-tion No. 1000, Series 4, No, 14, U.S, GovernmentPrinting Office, Washington, D.C., 1972.Alderson, J.R., “Health Information Systems: WHOChronicle, Vol. 28, 1974, pages 52-54,Feinstein, Alvan R., “Quality of Data in the MedicalRecord; Computers and Biomedical Research, Vol. 3,1970, pages 426-35.Lindberg, Donald A.B., “A Statewide Medical Infor-mation System,” Conference on MIS, San Francisco,1970.Davis, Lou S., “A System Approach to Medical Infor-mation; Mkthods of Information in Medicine, Vol,12, No. 1, 1973, pages 1-5.Chang, E. and ,Linders, J., “A Distributed MedicalData Base: Methods of Information in Mediu’ne, Vol.13, No, 4, 1974, pages 221-5.Brotherston, J. H.F., “Health Planning and Statistics:An Overview from Scotland: International Journai of
Health Services, Vol. 3, No. 1, 1973, pages 35-44,National Center for Health Statistics, Health Statistics
Today and Tomorrow, PHS Publication No, 1000,Ser. 4, No. 15, U.S. Government Printing Office,Washington, D.C., 1973, page 16.Berkanovic, Emil, “An Appraisal of Medicaid Recordsas a Data Source; Medical Carej Vol. 12, No, 7, 1974,pages 590-5.Goran, M.J., Roberts, J.S., Kellogg, M.A., Fielding, J,and lessee. W.. “The PSRO HosDital Review Svstem.”Med;cal Care, Vol. 13, No. 4, 19;5, pages 1-33;Duncan, Joseph W., “Confidentiality and the Futureof the U.S. Statistical System,” The American Statisti-
a.an, Vol. 30, No. 2, 1976, pages 54-9,

DATA IN HEALTH PLANNING—AN OVERVIEW
Dennis B. Gillings, Ph.D., Assistant Professor, Department of Biostatistics, School of PublicI Health, University of North Carolina, .Chapel Hill, North Carolina
1. Introduction
Comprehensive Health Planning (CHP) becamea legal reality in 1966 with the passing of P.L. 89-749, the “Partnership in Health Act.” This legisla-tion precipitated a flurry of activity among healthplanners and, in particular, among health statisticiansand other data specialists interested in health plan-ning. Just over eight years after the landmark CHPmandate, much more specific legislation was passedin the form of the “National Health Planning andResources Development Act of 1974” (P.L. 93-641).This gave “clout” to health planners by vesting inthem some control over the spending of Federaffunds, and an obligation to inform the public aboutunwise expenditure of any funds, be they public orprivate. However, this act also made the U.S. healthscene more complicated than before, as now eveninvqlved professionals often need a guide to aidthem in its comprehension.
Perhaps the best overall description of the cur-rent situation in health care in the United Statesand the directions that may be taken are presentedin the Forward Plan for Health FY 1977-81 (l).The data needs for health planning are succinctlysummarized in that report:
“We need reliable, timely, pertinent andcomparable health data and their analysis at alllevels which will describe the health status of thepopulation, the availability of resources, the acces-sibility of services, the costs of services and re-sources, the sources of funding, the utilization ofpresent services, and the, quality of care. The lackof such statistics severely limits the capacity of thehealth industry to plan, manage, and evaluate ourtremendous investment in health resources anddefivery system.”
The objective of this presentation is to reviewselectively the current state of the art as regardsfulfilling these needs. Time did not allow a compre-hensive literature review and so as an alternative,the author decided to purge his office of relevantmaterials and work with these. A sobering discoverywas that the single most comprehensive data-basedhealth planning study ever undertaken in the Unit-ed States was probably conducted by the Committeeon the Costs of Medical Care from 1928-1932 (2),approximately 45 years ago! Many of the recom-mendations of that Committee are still not fullyimplemented. However, before talking directlyabout the data aspect of health care, it is useful to
define the planning process as far as this presenta-.,.tion is -concerned, and clarify those activities inwhich data play a role. First, then, let us considerplanning and the data needs implied by implement-ing that process.
Il. The Planning Process
The view is taken that planning is part of acontinuum that also involves both evaluation anddecision-making. It is difficult, and probably mis-leading, to differentiate between activities that relatesolely to planning, and so a framework is given thatincludes ;hese other activities. Thii framework maybe termed the Planning-Evaluation-Decision-MakingCycle (PED Cycle). Whenever the notion of plan-ning is used, it will be taken to imply the activitiesdefined in the PED Cycle. ~ thorough discussion ofplanning and evaluation and their relationship todecision-making is given in Schaefer (3).
In .Figure 1, a conceptual scheme of the PEDCycle is presented which specifies 16 distinct stepswithin four broad stages. The four stages used hereare well known, ,namely Problem, Objectives, Meth-ods, Evaluation (POME). In practice, while severalof the activities in Figure 1 may be underway at anyone time, it is heipf;l to specify the planning pro-cess as a sequence of steps in order to summarizemore clearly what is involved. A variety of feedbackloops within groups of steps will take” place contin-ually. However, the diagram does specify at whichpoints in the cycle firm decisions about one stepmust be made” before completion of subsequentsteps.
A problem has been recognized (step 1), butnot defined in a precise manner. A general ap-proach to the planning process is designed (step 2),and data gathered (step 3) to help with problemdefinition (step 4). In turn, broad goals (step 5) andspecific objectives (step 6) ~re delineated that, iffulfilled, would be expected to alleviate the prob-lem. The objectives should be measurable. Thev area series of s~ecific items that contribute to goa~ ful-fillment. They will clarify the processes and out-comes that must take ~lace if th-e ~roblem is to beresolved. If Dossible, ;esources sh~uld be allocatedto” each obje;tive (step 7) to indicate the costs in-volved. Resources mav be s~ecified as dollaramounts or in terms of ;onvenie~t units of availablemanpower, facilities, and equipment. Estimates ofrequired resources will make priority setting (step
153
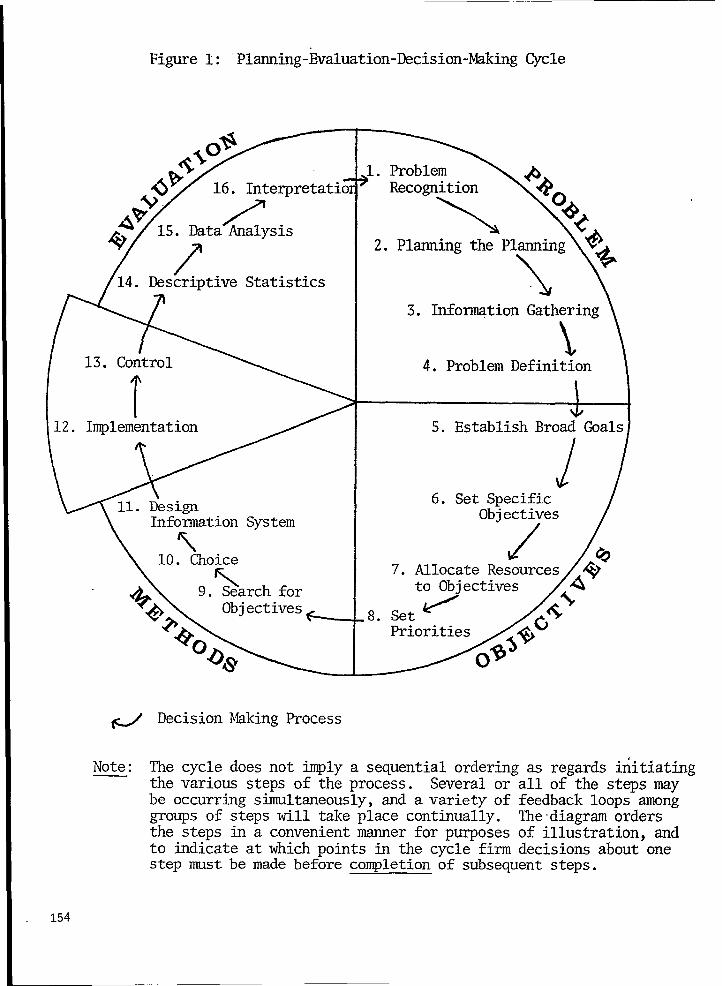
Figure1: “Planning-Evaluation-Decision-MkingCycle
+
14. DescriptiveStatistics
I2. Implementation
InformationSystem
10. Choice
A.\ 9. S~archfor
)l.ProblemRecognition
\2. Plming the Planning
\3. Info~tion Gathering\
‘\4. ProblemDefinition
*5. EstablishBroadGoals1
6. Set SpecificObjectives
/7. AllocateResources
to Objectives
,8.Set /
Priorities
# DecisionJhkingProcess
Note: The cycledoesnot @ly a sequentialorderingas regardsinitiatingthe variousstepsof the process. Severalor all of the stepsmaybe occurringstiltaneously,and avariety of feedbackloopsamonggroupsof stepswill takeplace continually.The’diagramordersthe stepsin a convenientmer for purposesof illustration,andto indicateat whichpointsin the cyclefirm decisionsaboutonestepmust be made beforecompletionof subsequentsteps.
154

8) easier. At a minimum, high and low priorityobjectives should be identified. A more refinedpriority classification might be desirable but difficultto make operational. Once priorities aie established,alternative methods (step 9) to achieve the moreurgent objectives are outlined and a choice (step10) is made among the competing alternatives. Aninformation system (step 11) that will allow a rele-vant description must be designed before a pro-gram can be considered to be fully implemented(step 12). Next, control mechanisms (step 13) toensure program execution are established. Howev-er, implementation and control are not the directresponsibility of planners, as indicated in Figure 1by the section that is set out from the remainder ofthe circle, although cooperation is desirable so thatplanners may keep in touch with operational devel-opments.
The planner plays an integral role in designingthe evaluation, which includes routine reporting ofservice statistics (step 14), data analysis (step 15),and interpretation (step 16). In turn, completion ofthese steps allows feedback to the recognition of~q~~roblems and the cycle begins again.. .. ---- . .-.
Health Service Areas (HSA’S) have recentlybeen established throughout the Nation under P.L.93-641. The corresponding Health System Agenciesare being called upon to emphasize “data-based”health planning along the lines described in Figure1. Each Health Systems Agency is mandated toproduce its own local plan and the local plans willbe amalgamated into an overall State plan. Isolatedexamples of State (4) and Iocal plans (5) do existalthough there are no agreed-upon models for theproduction of such plans. However, the Depart-ment of Health, Education, and Welfare (DHEW) isabout to clarify the situation by publishing regula-tions about the health plans that States and HSA’Smust produce.
Ill. Types of Data
The PED Cycle illustrates that local plannersshouldering:
1.
distinguish between two types of d;ta gath-
Initial data collection to be used for problemdefinition (i.e., step 3) and other subsequentsupplementary data collection exercises thatprovide input to the first eight steps. Rele-vant data must be collected in order to pro-ceed with the essential steps of the planningprocess itself, although this type of informa-tion gathering is usually restricted to datathat already exist. P.L. 93-641 is being im-plemented with the view of specifically re-stricting planners to existing data. It should
2.
be remembered, though, that surveys maybe carried out so as to define the problemmore precisely and provide baseline data forfuture comparisons. Such baseline surveysare often recommended if a serious pro-gram evaluation effort is to be undertaken.Ongoing data collection necessary to evalu-ate-pla;ned programs that are subsequentlyimplemented (i.e., steps 11 and 12). In con-trast to type 1, the job of the planner here isto aid with the design of an information sys-tem for the program being planned but notto implement such a system. This type ofdata collection may not rely heavily on exist-ing data or data that is already being collectedon an ongoing basis. Instead, new collectionmechanisms may need to be designed andappropriate procedures implemented to pro-cess and analyze the data.
Each of these phases of data gathering may inturn be clarified by defining some simple conceptsrelevant to the delivery of health services. Considerthe following seven aspects of service delivery thatrepresent major inputs necessary for a system to beable to deliver a complex array of health services:
1. Providers - actual members of the healthcare industry.
2. Consumers - members of society who re-ceive services but who are notproviders.
3. Services - the totality of services deliv-ered.
4. Planning - the set of decision-making ac-tivities defined in the PEDCycle.
5. Organization-a collective of people workingtogether to deliver or helpdeliver health care.
6. Facilities - buildings, land, equipmentneeded for the delivery ofhealth care.
7. Finances - economic and accounting as-pects of the health servicesdelivery system.
These aspects of the service delivery system canbe used to define two useful concepts, service trans-actions and administrative mechanisms (6).
A SERVICE TRANSACTION occurs when aprovider and consumer come together and a serviceis delivered. This allows a convenient summary ofthe first three aspects of services, that is, the compo-nents of the act of delivering care.
An ADMINISTRATIVE MECHANISM is theimplementation of a plan to provide an organiza-tion and facilities to support service transactionsunder suitable financial arrangements. The term
155
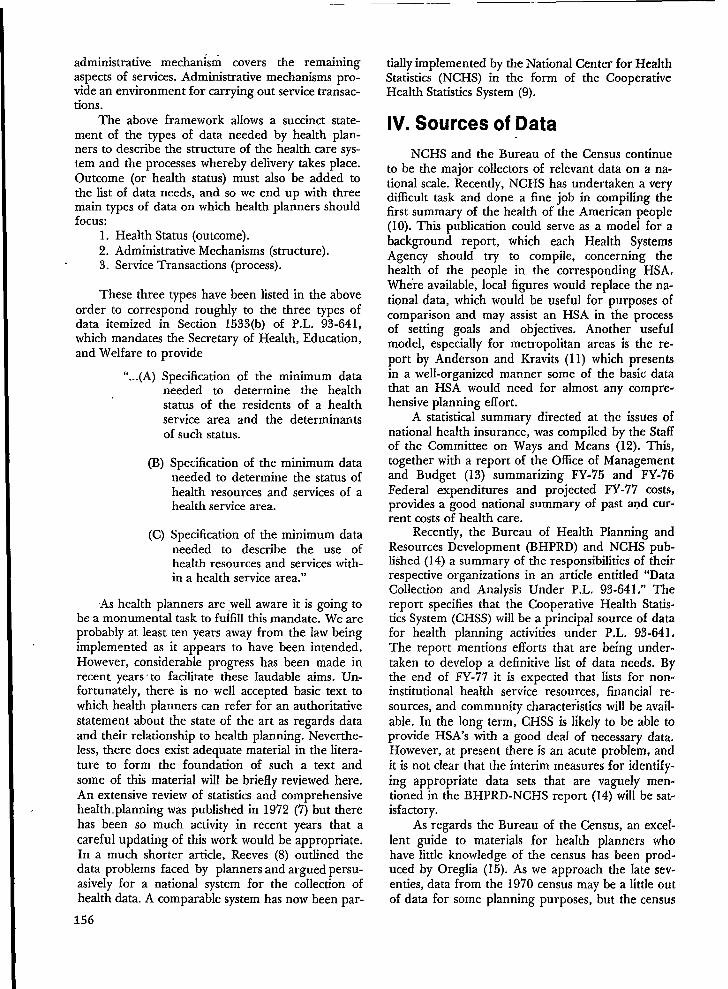
administrative mechanism covers the remainingaspects of services. Administrative mechanisms pro-vide an environment for carrying out service transac-tions.
The above framework allows a succinct state-ment of the types of data needed by health plan-ners to describe the structure of the health care sys-tem and the processes whereby delivery takes place.Outcome (or health status) must also be added tothe list of data needs, and so we end up with threemain types of data on which health planners shouldfocus:
1. Health Status (outcome).2. Administrative Mechanisms (structure).3. Service Transactions (process).
These three types have been listed in the aboveorder to correspond roughly to the three types ofdata itemized in Section 1533(b) of P.L. 93-641,which mandates the Secretary of Health, Education,and Welfare to provide
“...(A) Specification of the minimum dataneeded to determine the healthstatus of the residents of a healthservice area and the determinantsof such status.
(B) Specification of the minimum dataneeded to determine the status ofhealth resources and services of aheahh service area.
(C) Specification of the minimum dataneeded to describe the use ofhealth resources and services with-in a health service area.”
As health planners are -well aware it is going tobe a monumental task to ftifill this mandate. We areprobably at least ten years away from the law beingimplemented as it appears to have been intended.However, considerable progress has been made inrecent years” to facilitate these laudable aims. Un-fortunately, there is no well accepted basic text towhich health planners can refer for an authoritativestatement about the state of the art as regards dataand their relationship to health planning. Neverthe-less, there does exist adequate material in the litera-ture to form the foundation of such a text andsome of this material will be briefly reviewed here.An extensive review of statistics and comprehensivehealth. planning was published in 1972 (7) but therehas been so much activity in recent years that acareful updating of this work would be appropriate.In a much shorter article, Reeves (8) outlined thedata problems faced by planners and argued persu-asively for a national system for the collection ofhealth data. A comparable system has now been par-
156
tially implemented by the National Center for HealthStatistics (NCHS) in the form of the CooperativeHealth Statistics System (9).
IV. Sources of Data
NCHS and the Bureau of the Census continueto be the major collectors of relevant data on a na-tional scale. Recently, NCHS has undertaken a verydifficult task and done a fine job in compiling thefirst summary of the health of the American people(10). This publication could serve as a model for abackground report, which each Health SystemsAgency should try to compile, concerning thehealth of the people in the corresponding HSA,Where available, local figures would replace the na-tional data, which would be useful for purposes ofcomparison and may assist an HSA in the processof setting goals and objectives, Another usefulmodel, especially for metropolitan areas is the re-port by Anderson and Kravits (11) which presentsin a well-organized manner some of the basic datathat an HSA would need for almost any compre-hensive planning effort.
A statistical summary directed at the issues ofnational health insurance, was compiled by the Staffof the Committee on Ways and Means (12), This,together with a report of the Office of Managementand Budget (13) summarizing FY-75 and FY-’76Federal expenditures and projected FY-77 costs,provides a good national summary of past aod cur-rent costs of health care.
Recently, the Bureau of Health Planning andResources Development (BHPRD) and NCHS pub-lished (14) a summary of the responsibilities of theirrespective organizations in an article entitled “DataCollection and Analysis Under P.L, 93-641 ,“ Thereport specifies that the Cooperative Health Statis-tics System (CHSS) will be a principal source of datafor health planning activities under P.L, 93-641.The report mentions efforts that are being under-taken to develop a definitive list of data needs, Bythe end of FY-77 it is expected that lists for non-institutional health service resources, financial re-sources, and community characteristics will be avail-able. In the long term, CHSS is likely to be able toprovide HSA’S with a good deaI of necessary data,However, at present there is an acute problem, andit is not clear that the interim measures for identify-ing appropriate data sets that are vaguely men-tioned in the BHPRD-NCHS report (14) will be sat-isfactory-
As regards the Bureau of the Census, an excel-lent guide to materials for heaIth planners whohave little knowledge of the census has been prod-uced by Oreglia (15). As we approach the late sev-enties, data from the 1970 census may be a little outof data for some planning purposes, but the census

remains the only source for a variety of relevantitems. Recently, legislation has been passed whichmandates a five-yearly census and this will almosteliminate the problem of data being severely out ofdate. The first mid-decade count will take place in1985.
Oreglia (15) also describes some specific uses ofcensus materials in health planning and manage-ment, but the Census Use Study (16) has made themajor effort to determine ways in which census dathwill be useful to planners in general, and healthplanners (17’,18) in particular. A Family HealthSurvey (19) was designed and tested for the CensusUse Study and used to provide some of the data fora Health Information System (20,21) that concen-trated on maternal and child health for New Ha-ven, Connecticut. The objective of this informationsystem was to determine the neighborhoods in NewHaven where there was a significant health risk.
Other Census Use Study publications of consi-derable interest to health planners are the Socialand Health Indicators System of Los Angeles (22)which developed and maintained a system of indica-tors for study over space and time, and Social Sta-tistics for the Elderly (23), a review of potential datasources for describing aged populations. Through-out its work, the Census Use Study emphasizes fourprinciples:
“-The use of secondary (existing) data;—The pse of small-area data;—The use of data in time-series; and—The distillation of data into summary
statistics.”
DHEW has published an extensive list of datasets (24) that may be useful to health planners.NCHS has recently prepared a compilation of mi-cro-data tapes (25) available to users. Personal iden-tification numbers are excluded so that there is noinfringement on confidentiality. These tapes prov-ide details not available in the usual NCHS publica-tions.
A convenient summary of health services infor-mation systems that are currently operating in theU.S. has been prepared by Murnaghan (26), andthe information needs of PSRO’S reviewed. As pre-viously mentioned, an extensive review of dataneeds, data availability, and data analysis require-ments for Comprehensive Health Planning waspublished in 19’72 (27). Five major areas of dataneeds were addressed, namely demographic andsocioeconomic, health manpower, health facilities,health services, and environment. It is easy to con-tinue to list a variety of data sources. Enormousnumbers of statistical reports are pro,duced on al-most every conceivable health topic. However, thereseems to be a ,general consensus that the problem is
one of coordination rather than insufficient effortor an overall lack of data being produced.
Some encouraging steps have been taken in thelast few years to begin to overcome the problem ofcoordination. In April 1974, a Health Data PolicyCommittee was established within DHEW. Thiscommittee comprised representatives from a varietyof relevant agencies in DHEW as well as the Officeof Management and Budget (OMB) and advises theAssistant Secretary for Health on matters related to
‘coordinating current data efforts and future datapolicy. A comparable external committee was estab-lished under P.L. 93-353, the U.S. National Com-mittee on Vital and Health Statistcs.
V. Uniformity of Data
Considerable attention has been given to design-ing uniform data sets over the last few years. Presti-gious committees have agreed on a Uniform Hospi-tal Discharge Data Set—UHDDS (27), a UniformMinimum Basic Data Set for Ambulatory MedicalCare Records (28), and Uniform Data for HealthCare Plans (29). Agreement alone on these mini-‘mum basic data sets is a great stride forward butthe greater challenge of implementation still liesahead. There are no immediate plans to implementuniform minimum basic data sets for ambulatorycare or health care plans but UHDDS is likely to beoperational in the near future. The current plan isthat each hospital is to be responsible for UHDDSon Medicare, Medicaid, and Title V patients.PSROS that anticipate starting review proceduresare required to arrange for collection of theUHDDS on each case. A standard format forUHDDS, acceptable to the majority of users, is tobe implemented. It will be termed the UniformHospital Discharge Abstract (UHDA).
This is an important milestone for health plan-ners. Hospital discharge data is an essential compo-nent of a comprehensive information system de-scribing the health of the population of each HSA,but population-based estimates of hospital dis-charges for areas the size of HSA’S are, at present,not easy to generate. At the national level it isstraightforward, since NCHS conducts the NationalHospital Discharge Survey, the main source of na-tional hospital statistics. Unfortunately, sample sizedoes not permit local or State breakdowns. OnceUHDDS is widely implemented, State and local esti-mates may be more easily compiled.
Several nonprofit organizations have devel-oped systems which provide statistical summariesfor participating hospitals and in some cases, wherecoverage is high, reasonable regional estimates maybe obtained. The Professional Activity Study (PAS)and the Medical Audit Program (MAP), initiated by
157
the Commission on Professional and Hospital Activ-ities, is the only national organization which pro-cesses discharge data, but coverage within a region isusually too small to allow for accurate estimates.Several regional systems, such as the Hospital Utili-zation -Project, have been implemented in recentyears, and, if local coverage is adequate, providegood regional estimates. For an overalI picture,Murnaghan and White (30) give a fine summary ofthe problems of hospital patient statistics, as well asa brief description of the major hospital informa-tion systems in operation.
Returning to ambulatory care, a report by theDepartment of Sociolo~ at Purdue University dis-cusses (31) the Uniform Minimum Basic Data Setfor Ambulatory Medical Care Records and presentsseveral uses of ambtiatory care data as well as astrategy for implementing the minimum basic dataset. The Report of the Conference on AmbulatoryMedical Care Records (32) gives a comprehensivereview of most of the problems and issues of amu-Iatory care data. This Conference recommendedthat the U.S. National Committee on Vital andHealth Statistics sponsor the development of a min-imum basic data set. The Uniform Minimum BasicData Set for Ambulatory Medical Care Records (24)grew directly from this recommendation as didUHDDS from the Conference on Hospital Dis-charge Abstracts Systems in 1969 (33). In fact thedevelopment of UHDDS stimulated the develop-ment of the Uniform Minimum Basic Data Set forAmbtiatory Medical Care Records. Hopefully, thesuccessful implementation of UHDDS will stimulatethe implementation of the Uniform Minimum BasicData Set in the area of ambulatory care.
V1. Methods Available toPlanners
A considerable number of skills will be re-quired by health planners if they are to use data ef-fectively, even under the assumption that they have
access to appropriate information. It is not reasona-ble to expect Health Systems Agencies to be able tosupply all the necessary skills, and so technical as-sistance is being made available through a new Na-tional Health Planning Information Center andrecently established regional Health Planning Cen-ters. A contract for the Development of Operation-al Measures for Health Systems Characteristics foruse by Health Systems Agencies is about to be’awarded. In addition, the Applied Statistics Train-ing Institute (ASTI), which is administered by theDivision of the Cooperative Health Statistics Sys-tem, NCHS, is about to implement a trial healthdata training program for Health Systems Agencystaff. Four one-week courses are being developed.
158
The first covers basic information methods forhealth planning, and the other three develop as-pects of the core course in more detail. One fo]low-up course is being given on evaluation techniques,another on health indices, and a final one on dataquality. The trial runs of these courses will extendfrom June to September 1976 and, in response todemand by Health Systems Agencies, revised ver-sions will be given in the year following, subject tothe availability of funds.
It will not be possible to teach all the tech-niques that health planners might need ~ as a curso-ry glance at a summary of relevant methods (seeTable 1) will show. An adequate course of instruc-tion in methods and modeIs above might span sev-eral years. Instead, the ASTI courses will coversome basic, easily applied techniques which shouldensure that Health Systems Agencies are at leastable to proceed with fulfilling their mandate.
A useful supplement to ASTI courses might bethe development of reports or a monograph seriesthat are circulated to Health Systems Agencies. Forexample, a quantitative guidebook for the projec-tion and assessment of areawide inpatient and relat-ed health services (34) was deveIoped by the NorthCarolina State Planning Division. Health SystemsAgencies would easily be able to apply the metho-dology by carefully working through the manual.Other reports of this nature may already exist. Rel-evant ones should be collected and circulated toHealth Systems Agencies, Further articles might besponsored and used to fill the gaps that the ASTIcourses and technical assistance efforts are unableto fill.
V1l. Comment
The ever recurrent data Droblems of aua]itv., ,timeliness, uniformity, and comparability still exis~;They are unlikely to go away in the foreseeable fu-ture, especially as more and more data cross-tabu-lated in all possible ways are being demanded.
Available data often do not relate to the sametime period, and geographic boundaries for thepopulations referred to, differ. Also, these popula-tions change with time in a variety of ways.
When real data is not available, synthetic esti-mates are often resorted to but these usually have adegree of disbelief about them, So, although muchhas been achieved in recent years and the founda-tions are being laid for even more important ac-complishments, there is a good deal of frustrationat the present time as regards the problems of us-ing data for health plans. From within a HealthSystems Agency, the way to proceed may look farfrom clear. However, the strategies to be imple-mented are slowly being worked out and as CHSS. .

I
develops, the situation will be much more satisfacto-ry.
Hopefully, Health Systems Agencies will in-clude at least one data specialist on their staff pro-vided the limited funds available permit, and recog-nizing that trained individuals are not easy to find.Partly as a response to this lack of trained manpow-
er, the Department of Biostatistcs at the University
of North Carolina, Chapel Hill, has recently starteda new training program with emphasis on DataManagement. If the response to this program andthe demand for its graduates is encouraging, per-haps more persons with relevant training will be-come available to planning agencies. Attendance ata few one week courses is not really sufficient totrain persons for the complex tasks that really needto be performed, However, given the constraints ofthe current situation, the approaches being takenseem to be the only sensible possibilities. So weshould support the present policy and try to workin a step-by-step fashion towards an ideal which is,as yet, vague and ill-defined but something we feelwe “can dream about.
REFERENCES1, U.S. Department of Health, Education, and Welfare,
Public Health Service, Forward Plan for Health FY1977-81. DHEW Publication No. (OS) 76-50024,Washington, D. C., 1975.
2. Committee on the Costs of Medical Care. Reports 1-
28.910 Seventeenth St., N.W., Washington, D.C. andThe University of Chicago Press, Chicago, Illinois,
1928-1932.
3. Schaefer, M. (1973) Evaluation/Decision-Making in
4.
5.
6.
‘7.
8.
Health Planning and Administration. HADM Mono-
graph S6ries No. 3, Department of Health Adminis-
tration, School of Pubfic Health, University of NorthCarolina, Chapel Hill, N.C. 27514.
Wisconsin Governor’s Health Planning and Policy
Task Force, The Final Report, Department of Admin-istration, Document Sales Unit, 1 West Wilson Street,
Room B-237, Madison, Wisconsin 53702.
Health Planning Council for Central North Carolina.
Durham, Health Care for the 70’s, A Report on the
Health Care Needs of Durham. May 1973.
Gillings, D. B., and Douglass, C.W. (1972). The Struc-
ture of Health Services Research. Health Services Re-
search Center, UNC, Chapel Hill, N.C. 27514.Lubin, J.W., Knee, J. K., Crystal, R. A., Slade, V. (Edi-
tors) (1972). Statistics for Comprehensive Health Plan-
ning. National Center for Health Statistics: The Public
Health Conference on Records and Statistics and
Community Profile Data Center, Community HealthService, Health Services and Mental Health Adminis-
tration, DHEW, June 1972.
Reeves, P.N. (1972). “Data for Health Planning:
American Journal of Public Health, Vol. 62, No. 6,
pp. 874-876, 1972.
9. Perrin, E.B. (1974). “The Cooperative Health Statistics
System ~’Health Services Reports, 89, 1, pp: 13-15.
10. National Center for Health Statistics (1975). Health1
11.
12.
13.
14.
15.
16.
17.
18.
19.
20.
21.
22.
23.
24.
25.
26.
27.
i
1
t
~nited States 1975—First Annual Report to Congress.
inderson, O.W. and Kravits, J. (1968). Health Serv-
ces in the Chicago Area, A Framework for Use of
Oata. Research Series 26, Center for Health Adminis-
tration Studies, University of Chicago, Chicago, Illi-
lois 60637.
Staff of the Committee on Ways and Means (1974).National Health Insurance Resource Book. U.S. Gov-
ernment Printing Office, Washington, D.C. 20402,Stock Number 5270-02284.
Office of Management and Budget, Special Analysis KFederal Health Programs, Reprint of Pages 192through 218 from Special Analysis, Budget of the
United States Government, 1977. Washington, D. C.,
1976.
U.S. Department of Health, Education, and Welfare(1975). Data Collection and Analysis Under P.L. 93-
641. DHEW Publication No (HRA) 76-637.
Oreglia, A. (1973). The Uses of Census Data forHealth Services Planning and Management. Health
Services Research and Training Program, Departmentof Sociology, Purdue University, West Lafayette, Indi-
ana 47907. “
U.S. Bureau of the Census, Census Use Study: GeneralDescription, Report No. 1, Washington, D.C. 1970.
Gabrielson, I.W.; Siker, E.; Salber, K. B.; and Stock-
well, E.G. (1969). Relating Health and Census Infor-
mation for Health Planning. American Journal ofPublic HeaJth, Vol. 59, No.7, pp.1169-1 176, 1969.U.S. Bureau of the Census, Census Use Study: Data
Uses in Health Planning, Report No. 8, Washington,
D. C., 1970.U.S. Bureau of the Census, Census Use Study: Family
Health Survey, Report No. 6, Washington, D.C. 1969.
U.S. Bureau of the Census, Census Use Study: Health
Information System, Report No. 7, Washington, D.C.
1969.
U.S. Bureau of the Census, Census Use Study: HealthInformation System II, Report No. 12, Washington,
D.C. 1971.
U.S. Bureau of the Census, Census Use Study: Social
and Health Indicators System of Los Angeles, Wash-ington, D.C.
U.S. Bureau of the Census, Census Use Study: SocialStatistics for the Elderly Area Level System, Stage 1,
Omaha; Washington, D. C., 1975.
U.S. Department of Health, Education, and Welfare(1974). Selected Data Sets for Health Planners, Vol. 1.
DHEW, Pubfic Health Service, Health ResourcesAdministration, Bureau of Health Resources Develop-ment, Division of Comprehensive Health Planning,July 1974.
U.S. Department of Health, Education, and Welfare,
National Center for Health Statistics (1976). Standard-
ized Micro-Data Tape Transcripts. DHEW Publication
No. (HRA) 76-1213, Washington, D.C. 20402.
Murnaghan, J.H. (1974). Health Services Information
Systems in the United States Today. N. Engl. j. Med.
290:603-610, 1974.
LaPerle, E. S., and McNulty, E.G. (1974). Data Set
Provides Uniformity, Flexibility. Hospital, 48, pp. 115-
120, June 16, 1974. -
159

.
28.
29.
30.
31.
United States National Committee on Vital andHealth Statistics (1974). Ambulatory Medical CareRecords: Uniform Minimum Basic Data Set. DHEWPublication No. (HRA) 75-1453, August 1974.Ad Hoc Working Group, Chairman, Paul M. Densen(1972). Guidelines for Producing Uniform Data forHealth Care Plans. DHEW Pub. No. (HSM) 73-3005,July 1972.Murnaghan, J. H. and White, K.L. (1971)- HospitalPatient Statistics. The New England Journal of Medi-
cine, April 15, 1971, pp. 822-828.Health Services Research and Training Program,Department of Sociology, Purdue University. HealthServices Data System, Ambulatory Care Data. Lafay-ette, Indiana 47907.
32.
33.
34.
Murnaghan, J. H. (Ed;). Ambulatory Medical CareData, Report of the Conference on Ambtdatory Medi.cal Care Record> 1972, Medical Care, Vol. H, No. 2(Supplement).Murnaghan, J.H. and White, K.L, (Editors). HospitalDischarge Data, Report of the Conference on Hospi.tal Discharge Abstracts Systems, 1969. Medical Care,
Vol. 8, No.4 (Supplement).North Carolina Department of Administration, Stateplanning Division. Areawide Planning Method forHealth Services and Facilities. Office of Comprehen-sive Health Planning, State Planning Division, NorthCarolina ‘Department of Administration, 116 WestJones Street, Raleigh, North Carolina 27603, June1971.
160

I
GEOCODING AND HEALTH STATISTICS*
David M. Nitzberg, SC.D., Vice President, Health Systems Division, Systemedics, Inc.,Burlington, Mass;chusetfs.
The topic of geocoding and health statisticsdeals with the spatial analyses of health data. Assuch, the ability to record locational information onhealth records and to code such information geo-graphically is at the core of the topic. Its impor-tance is directly related to the importance of thelocation variable, place, to the modern disciplines ofepidemiology, biostatistics, and public health.
Traditfinally, health statisics have been aggre-gated and analyzed by age, sex, time and location,but the recording and coding manually of locationalinformation is so time-consuming and tedious(hence, costly) that it is usually done only on a grossgeographical level, such as by region of the countryor by State. The introduction of automated geopro-cessing techniques, however, has facilitated the abili-ty to do the following at speeds and with accuraciesthat cannot be surpassed by manual techniques:first, the geocoding of locational information suchas addresses into quantifiable X-Y coordinates (suchas latitude and longitude) or into various geograph-ical area codes (such as ZIP codes or census tractnumbers); and, second, the production of comput-er-generated graphic displays (such as statisticallycoded maps) and areal analyses (such as utilizationof services by distances to the providers of the serv-ices). These capabilities are, of course, criticallyimportant for small-area health data analyses, andwill increase in importance as data generated by theCooperative Health Statistics System (CHSS) areused by the new Health Systems Agencies (HSA’S)to cariy out their health planning, research, andevaluation functions at the local level, under P.L.93-641 (the National Health Planning and Re-sources Development Act of 1974).
The purpose of this paper is to review the pre-sent status of the geocoding technology in the U.S~as it pertains to health statistics: applications of geo-coding in the health field are described; the currentstatus of geoprocessing techniques is reviewed; and,some of the problems that must be confronted andresolved before there can be widespread use of thisnewly emerging technology are discussed. Timedoes not permit detailed discussion here of the fol-lowing technical aspects of geocoding, which havebeen documented well and extensively elsewhere, ascited: national geocoding schemes 1JZ, geographicbased information systemss, the Bureau of the Cen-sus DIME SystemA-S, and computer cartographyand mappinglo.
*Research conducted under Contract No. HRA 230-
75-0210, National Center for Health Statistics, DHEW
Applications of geocoding in the health field. A ,classic example of the use of geocoded data isSnow’s investigation of the outbreak of cholera inLondon in 1848. By marking on a map where eachvictim became ill, Snow was able to focus his atten-tion on the water from the Broad Street pump asthe cause of the outbreak. Other historical examplesinclude: endemic goiter has been shown to be asso-ciated with iodine lack in the soil; the geographicvariation in the frequency of dental caries has beenshown to be related to the fluoride content ofdrinking water; and the differences between urbanand rural morbidity and mortality rates (e.g., muchhigher death rates from arteriosclerotic heart dis-ease, tuberculosis, and cirrhosis of the liver in ur-ban areas of the U.S., as compared to rural).
A recent HEW publication by Adayl 1 listed thefollowing correlation findings between geographicregion and utilization of health services, therebydemonstrating the variation of such services be-tween different ,parts of the country:
● The West has the highest volume of physi-cian visits per person.
● The annual hospital discharge rate is highestfor persons residing in the South.
● The average length of stay is lowest in theSouth.
● Persons living in the Northeast have moredentist visits than any other region, while theSouth has the lowest rate of dentist use.
Researchers have long sought to relate atmos.pheric pollution and background radioactivity, bothof which vary geographically, to a host of humanills, most notably various forms of cancer, heart andlung diseases, and congenital malformations. It ispossible that more precise geocoding on much larg-er amounts of health data is required to show suchcorrelations if they exist.
For decades, health agencies have manuallycoded street address data with statistical area codesthrough the use of street indexes or street maps.Many cities code such vital events as births and
-deaths by health districts so that vital rates for theseareas can be computed. The following are someadditional manual applications of geocoding thathave been reported in the literature:
a. “Use of a Demographic B;se Map for thePresentation of Area Data in Epidemiology”by Forster12 deals with developing the demo-graphic map for relating disease rates both
161
b.
c.
to local populations at risk and to geowaph-. . ---ic position. These maps show areas propor-tional to populations, while maintaining con-tiguity and relative positions of the areas,thereby adjusting a~eas by the populations atrisk.“Availability and Usefulness of SelectedHealth and Socioeconomic Data For Com-munity Planning” by Wallace et al13 dealswith the use of census tract areas and themeasurement of health and socioeconomicidexes (such as fetal mortality, incidence .oftuberculosis, and unemployment rate) forthese urban areas to identify those areasmost in need of health and social services.“A Geographer’s Approach in the EPide-
-A . .
miology of Psychiatric Disorder” by B>in14deals with an investigation of the geographicvariation of psychiatric disorders at both aregional and city level to uncover spatial
, patterns and to elucidate possible etiologicalfactors.
As automated geoprocessing systems have be-come available, applications of this new technologyin the health field have bqen reported in the l~tera-ture. The following selected applications provide arepresentative sample of what has been done todatx
a.
b.
c.
“The Application of Computer Graphics toPatient Origin Study Techniques” by Dros-ness et ails deals with analyzing the geo-graphic area as it relates to die hospital-pa-tient service relationship. The study wasconducted by members of the CaliforniaDepartment of Public Health in connectionwith health facility planning, and involvedpatient origin analyses by the use of comput-er graphics.“The Use of Computer Mapping in HealthResearch” by Greenes and Sidel16 deals withthe use of computer mapping to assess pat-terns of inpatient utilization of services overtime and by the geographic areas served bya hospital.By using geographic location as the linkingvariable, census and health statistics can bebrought together for the calculation of im-portant health planning rates for the popu-lation groupings that are needed. Therehave been a number of census and healthdata applications by local communities usingthe Census Bureau’s ADMATCH* program,**
*ADMATCH (Address Matching) is a package ofcomputer programs for geographically coding computer-ized data records containing street addresses. A Geo-
162
d.
e.
such as: birth and infant fetal death records,hospital obstetrical records (Census UseStudy, New Haven, Connecticut, using aDIME GBF**); death records, immunizationrecords (Community Improvement Program,Tucson, Arizona, using and ACG GBF***);and hospital discharge abstracts (Public Sys-tems Division, Kansas City, Missouri, usingan ACG GBF).The Census Use Study4~10>17,18,a small-areadata research study “sponsored by the Bu-reau of the Census, was established to ex-plore the current, uses and future needs ofsmall-area data and data handling in local,State, and Federal agencies. In addition tothe development of ADMATCH and DIME,this project made contributions to computermapping (GRIDS—Grid Referenced Infor-mation Display System) and developed a so-cial and health indicators system 19. TheStudy concentrated on data at the block levelin metropolitan areas, computer mappingtechniques to display spatial data and analys-es, and the development of a computer sys-tem to assist in interrelating census datawith local and State data (at the individualperson level and at the geographic area lev-el, despite varying area definitions used bydifferent agencies). This Study led directlyto the present Censuq GBF/DIME system,the major geocoding system in the U,S, to-day. Additional applications in the healthfield involved a family health surveyzo to testthe feasibility of combining survey resultswith census data and a health informationsystem 18 linking census data, vital records,and other health data for New Haven, Con-necticut, in order to pinpoint high healthrisk neighborhoods for health planningpurposes.The “Atlas of Cancer Mortality for U.S.Counties: 1950-1969” by Mason et alzl,which has recently been released by HEW,
graphic Base File (GBF) contains local address informa-tion—street names, intersections, and ZIP codes, as well asthe identification of geographic and political areas in whichthe local address falls (such as census blocks and tracts, town-ships, cities, and counties). Other geographic identifiers canbe added by users to include Iocal statistical areas such aspolice precincts, schocd districts, transportation zones, andhealth areas.**DIME (Dual Independent Map Encoding) is a system forrepresenting map features numerically for processing bycomputer.*** The GBF/Dime system replaces the olderAddress Coding Guide (ACG) system, which was more suit-ed to manual geocoding procedures. References 4,5, and 7contain more technically specific details concerning these.

deals with the geo~aphic patterns of cancerin an attempt ~o ~ev-elop -and test etiologichypotheses, especially with reference to envi-ronmental hazards and genetic determi-nants. This study of cancers by counties inthe U.S. made use of an automated cartog-raphy system developed at the National In-stitutes of Health, based on similar work atthe Bureau of the Census on automatedmicrographics.
f. A recently released report in the HEW Datafrom the National Vital Statistics Systemsserieszz entitled, “Selected Vital and HealthStatistics in Poverty and Nonpoverty Areasof 19 Large Cities: U. S., 1969-197 1,“ docu-ments the relati~ely unfavorable health statusof persons living in urban poverty areascompared to those residing in nonpovertyareas. Using a system of weighted socioecon-omic factors, yoverty tracts within the citieswere identified so that the relationships be-tween poverty, race, and health could bestudied. Computer census and vital statisticstapes were used, as well as automated tabula-tion techniques to aggregate the data bypoverty and nonpoverty areas.
The above are selected examples of what hasalready been done and. reported. There are doubt-less many other geocoding applications of healthstatistics which have been performed but neverpublished and, of course, the manual examples cit-ed earlier could be performed more efficiently us-ing automated geocoding techniques. These exam-ples not only illustrate the utility of geocoded healthdata but also show the increased effectiveness ofdata if they can be aggregated by small areas,linked to other related data sources, and matchedto the appropriate denominator data. The introduc-tion of automated techniques offers the capability ofperforming rapid-response spatial analyses in great-er detail, more frequently, and more often as hy-pothesis testing and resource allocation maximizingprocedures than manual techniques permit. Insummary, automated geocoding as an analytical toolis essential if we are to perform the following func-tions on a local level using quantitative data:
●
●
●
●
The identification for health services plan-ning, research, and evaluation of high healthrisk populationsThe use of geocoded location and healthdata for conducting surveys and assessingthe impact of ongoing_. health servicesThe determination of accessibility to healthservices for target populationsThe measurement of impact of site and serv-
ice setting on effective utilization of healthservices
The relationship between frequency of pa-tient contact and service facility locationThe relevance of geocoding information formeasuring retention rates of family planningpatients as a function of patient mobilityThe location of health care facilitiesThe development of community health pro-files for planning, management, and evalua-tion of health services deliveryThe availability of adequate manpower re-sources within an area to serve the healthneeds of the areaThe relationships between the levels of pol-lution and the morbidity patterns within lo-cal areas and changes in mortality ratesThe epidemiological surveillance and moni-toring’ of diseas~s and hazards on a small-area basis within a region and between re-gions
In addition to these geocoding uses, operation-al geoprocessing systems are needed to fulfill thelegislative mandates of the CHSS and the HSA’Sand to meet the needs of health statistics users, es-pecially at the State and local levels. The CHSS wasstarted not only to reduce the duplication of healthdata collection and processing activities and to bringabout greater uniformity and completeness of cov-erage, but also to overcome the lack of comprehen-sive health data in sufficiently fine-grained geo-graphical detail to meet the needs for such data atlocal levels within the States. The newly createdHSA’S will, in turn, be relying on data from theCHSS so they can analyse, plan, and evaluatehealth data for local small areas within their juris-dictions.
At the local level, surveys of health data usershave revealed the need for fine-grained geographi-cal detail. A 1968-69 survey of National Center forHealth Statistics data usersza disclosed that 88 per-cent of State and local government respondents in-dicated a need for small-area geographic detail(State, SMSA, county, city, town, or census tract) intheir work, while 12 percent needed only large-areadata. (The corresponding percentages for Federalgovernment respondents were 48 percent, small-area, and 52 percent, large-area; planning groupsand non-profits: 60 percent, 40 percent; universitiesand hospitals: 50 percent, 50 percenC private enter-prise: 38 percent, 62 percent). Not surprisingly—when one considers the importance of the age, sex,time, and place variables (in that order) in health—the importance of geographic detail was rankedthird, after demographic, social, and economic de-tail (first) and comparisons of change over time(second); it ranked higher than the other two.choices: diagnostic detail and longitudinal data.
Census Use Study surveys during 196’7 in NewHavenzq indicated that the census tract was the
163

planningand thenbased on
area of greatest use, followed by town,redevelopment area. Although dated andselected groups of data users, these results
are still useful since they reflect the fact that healthcare in the U.S. is actually provided at the local,community level. Therefore, health data, to be mostuseful, should be available in a timely and meaning-ful manner (e.g., graphs, maps) on at least thecounty or, perferably, a lower level such as censustract or neighborhood. The recent Federal empha-sis on decentralization should increase the need forand use of local data.
Current status of geoprocessing technology.The term geoprocessing system, as herein used,refers to an automated geocoding system consistingof: source records to be geocoded, such as a tape ofvital records; a GBF, such as a DIME file of thearea involved, including the maps, digitizers, andcomputer programs needed to create, maintain,update, and correct the GBF; geocoding programs,such as ADMATCH, to assign geocodes to the loca-tional data on the source records using the GBF;and, applications programs and output devices(printers, plotters, CRT’s) to manipulate areal data,calculate distances and geometric relationships, andproduce spatial maps, tables, graphs, and analyses.
The development of these systems has paral-leled the growth of computer utilization in the U.S.and was spurred on by those Federaf Agencies(Transportation, Census, HUD) having responsibili-ties for aggregating data for numerous and differ-ent geopolitical and statisud areas. These areasare user-specific, generally not compatible one withthe other, and subject to change as legal boundarieschange and as the needs of the users for differentarea-specific data aggregations change. The com-puter obviously offers the ability to re-aggregatedata if those data contain generic-type locationalinformation, such as addresses or coordinates, thatpermit reclassification. Equally obvious is the factthat not aIl source data contain such generic loca-tional data; and that various geocoding schemes arenot always compatible with one another. For exam-ple, one of the most commonly available codes, theZIP code, respects neither State, county, nor MinorCivil Div}ion boundaries in all cases.zs The realityof differing and changing areal definitions is basicto societal arrangements—geoprocessing can copewith it, not eliminate it._.—
Between roughly the mid-1960’s and now, anumber of geoprocessing solutions to these prob-lems have been proposed, tested, and evaluated.Most deal with applications in the municipal andurban information systems areas, especially as relat-ed to transportation, land use, and marketing ana-lyses. Although there were health applications, not-ably those by the Census Use Study, there were nospecifically designated health initiatives in geocod-ing. The geocoding literature is replete with numer-
164
ous plans, applications, and systems—most of whicheither never went beyond the planning stages orfunctioned for a short time period under specialgrants or Federaf funding before discontinuingoperations.zG A number of systems did survive andone, the Bureau of the Census GBF/DIME system,seems to be clearly the major system in the U,S,today.
It is fair to say that geoprocessing technology ispresently greater than are the agency and person-nel capabilities and support needed to apply its po-tential. This is due not only to the newness of thetechnology, with the inevitable start-up problems,poor diffusion of information, and lack of aware-ness of practical applications such newness involves,but also JO two salient obstacles: (1) geocoding is notthe highest priority item, being at best fourth afterage, sex, and time with regard to health statistics,and so suffers accordingly when funds are scarce;and (2) geoprocessing technology is quite complexoperationally; a) because street addresses are non-standard (and nonlogical) and; b) because a numberof streets and boundaries within an area changeperiodically. The GBF’s therefore require continu-ous maintenance and updating, and this is best
‘done by setting up a locaI or regional utility formany users who are willing to share costs.
The support by the Census Bureau of localcapability through the development and dissemina-tion of geoprocessing tools throughout the U,S.means that geocoding for health statistics can tieinto an already existing technology at both the na-tional and local levels. Since the technology is need-ed for the decennial censuses it will be supportedand developed over time and, because health statis-tics are so dependent on population data for de-nominators, a degree of compatibility otherwiseunobtainable can occur by maintaining the sameareal standards and definitions in health geocodingas those that are used in developing Census popula-tion figures. In view of the close relationship thathas always existed between demography and healthstatistics, it is not surprising that a geocoding systemdeveloped by the Census Bureau should meet theneeds for geocoded health information more closelythan geocoding systems developed for transporta-tion, municipaI planning, or land parcel use.
The Census GBF/DIME geoprocessing system’ssuitability to health statistics can be summarized asfollows:
1. It is nationwide and available at local levels,This is important from the point of view ofcomparability and standardization. It alsomeans that multiuser can use the devel-oped base of resources and share the costsand specialist personnel needed to apply thetechnology to their specific application areas.

2.
3.
4,
It is compatible with U.S. Census figures andproducts. In health statistics this is especiallyimportant because of the need for demo-graphic data.It must be maintained for the decennial cen-suses by the Census Bureau and should bemaintained by local agen~”es between t~osetimes. This assures not only continuoussupport but also implies steady developmentand improvement of the technology by theBureau of he Census. Since the 1970 cen-sus, however, a number of the local GBF’shave not been updated regularly and, insome cases, original inadequacies have notbeen corrected. This is a serious problem,since the continuous maintenance of up-to-date local GBF’s is essential but generallytoo costly for any one user to undertakealone. Optimism is necessary here since, af-ter all, MIS is a new technology and start-upproblems should not recur after the 1980census. In preparation for the upcomingcensus, GBF’s are being updated and it isreasonable to hope that there will be enoughusers after 1980 so that the GBF’s will bemaintained out of need for them by localusers. In this regard, the timing seems ap-propriate for the health community throughthe CHSS and HSA’S to initiate utilizationof the technology.It is based on a sound topological (mathe-matical graph theory) approach (DIME) toautomated GBF construction and is welJsupported by a full range of compu te~ sof-tware. In this regard, the Census Bureauhas led the way in developing, improving,and disseminating a number of computerpackages to support the entire range ofgeoprocessing functions.* It should continueto do this, thereby freeing users of the needto fund costly software development.
*This is not to imply that Census did it all. As Barb26points out, there were numerous groups, organizations,and individuals who made the present system possible. Atthis point in time, however, .Census seems to be the majororganization contributing to the field and, in the pasi itseems not only to have developed its own innovations(e.g., the DIME concept) but also to have integrated othersuccessful concepts (e.g., those contained in the SACS -Street Address Conversion System - developed at theUniversity of Washington Urban Data Center). There isevery reason to believe it will continue to do so.
However, a number of these are out-ofdate. To
correct this situation and to extend all of the files tocover as much of the SMSA’S as possible (i.e., thenon-urbanized portions not now covered), the CensusBureau has undertaken a Correction, Update, and Ex-tension (CUE) program. If successful it would mean
5. It will be extended eventually to geographi-cally cover most, if not the entire, UnitedStates. Currently, GBF/DIME files exist forthe urbanized portions of some 200 Stand-ard Metropolitan Statistical Areas (SMSA’S),with the 70 additional SMSA’S expected toestablish GBF’s within the next severalyears.2’7 Since those households in urban
areas contain about 60 percent of the Na-tion’s population, the current 200 GBF’sapply to about 45 percent of the Nation’spopulation.
6. It permits the use of the most commonlyavailable locational information, addresses, asa basis for geocoding source records. Since
addresses, unlike other locational data such
as county codes or census tracts, are more
likely to appear on almost all health records,
this broadens the applicability of the geo-
coding that can. be performed using the
GBF/DIME system. This capability, howev-er, can be negated if addresses are not key-punched in~o machine-readable form fromthe original paper record. This, unfortun-ately, is often the case in the health field.For example, although address appears in apatient’s hospital record, it is not requiredby the Uniform Hospital Abstract MinimumBasic Data Setzs, only residence ZIP code isrequired. Thus, automated geocoding ofuniform hospital discharge abstracts belowthe ZIP code level is not possible withoutgoing back to source documents to recordaddresses. It should be noted, however, thataddress information, although generallyavailable, is not without problems. First, mis-spellings are common. Second, there is thequestion of which address has been record-ed; aside from a patient’s giving a fraudu-lent or non-existent address, there are sever-al addresses each person can have: currentor usual residence address, mailing/billingaddress, legal address, or address of place ofemployment. Third, some addresses such aspost office box numbers are not directly re-lated to a person’s location. In addition tothese, many records contain addresses for
that some 7’5 percent of the Nation’s populationwould be covered by GBF/DIME files for the 1980census. This would still leave about 25 percent of thepopulation, living in rural areas, uncovered by thecurrent DIME system. The problem of automated
geocoding in rural areas in the U.S. today is largelyunresolved, and will require either t ethnical innova-.—-----tions to extend a geocodmg system based on urbanaddresses and city block; -to rural areas where” thesedo not apply, or else an entirely different approach.
165

.
7.
place of occurrence (e.g., accident), place ofbirth, and previous residences. The metho-dology for how these are to be handled andhow to standardize the recording of ad-dresses will probably be developed in conso-nance with the geocoding applications fiatare undertaken. Such methodology andstandardization do not exist today.It is flexible with respect to the geocodesand areal aggregations that are possibIe.Because GBF/DIME files contain X-Y coor-dinates for both ends of each street segmentand address ranges for the left and rightsides of each segment, it is possible to geo-code down to the level of city block-sides, anareal unit small enough for almost any sta-tistical application of large scale data sets inthe health field. From this level, larger arealunits can be aggregated, disaggregated, andreaggregated as boundaries or areal defini-tions change; larger area geocodes (censustract, health district, county, etc.) can be as-signed; maps can be plotted; and, distances,geometries relationships between points andareas, and spatial relationships can be calcu-lated and analyzed. This has an extremelyimportant implication for the recording oflocational information of health records: aprecise locational datum, such as address,can be recorded without regard to how suchinformation may eventually be aggregatedgeographically for analyzing results andwithout regard to whether geopoliticalboundaries or administrative districts are re-aligned in the future. The GBF will providethe cross-relationship between the addressand the areas it belongs in, on an as up-to-date basis as the GBF is maintained.
The price we must pay for all of th]s consistsof:
●
●
●
●
●
166
supporting conceptually and financially thecreation and maintenance of local areaGBF’s throughout the U.S.,coordinating all geocoding activities throughthe, Bureau of the Census and its relatedgeoprocessing agencies at the local level,cost-sharing not only for the use of the geo-processing facilities that are available but alsofor the future development of geoprocessingproducts and improvements,paying for the maintenance of accurate ad-dress information in machine-readable formon those healti records which will go intoour health statistics for research, planning,and evaluation,training personnel to use this new technolo-gy properly and in the broader context of
quantitative data analyses for health policyand decision-making.
● and, above all, using the resulting area] ana-lyses so that there will be benefits to justifythe price.
Conclusion. Very few of us in the health fieldfeel comfortable with health statistics that are notage and sex adjusted. Likewise, we are constantlyon the lookout for variations over time and awareof seasonal variations that can occur. Although werealize that geographic variations exist and we try toaccount for them, very rarely do we have the re-sources to perform adequate geographic analyses orinstitute suitable geographic statistical controls,Geocoding on a routinely automated level would, ofcourse, provide us with this capability.
We are at that point in the history of healthstatistics when we can truly add the location variableas a prime ingredient on a routine basis in our ana-lyses, after age, sex, and time. I submit that thequestions are not “should we” or “can we;’ but rath-er: How fast can we get there? How can we over-come the impediments? What are the technologicaland methodoli~”cal problems that still exist andmust be overcome? And, how can we use quantifiedspatial analyses properly to influence health plan-
ning and policymaking?
REFERENCES
1.
2.
3.
4.
.
Werner, Pamela A.: Final Report by the Urban Sys.terns Laboratory, MIT, A Survey of National Geocod-ing Systems. U.S. DOT, Washington, D.C, Report No,DOT-TSC-OST-74-26, November 1974.LaTores, Santo (ed.): Final Report, National GeocodingConverter File 1: Volume I, Structure and Content.U.S. DOT, Washington, D.C. Report No. DOT-TSC-OST-73-44, L February 1974.GIassman, N.; Neigut, E.G.; and Quigleyj D,F,: ABroad Perspective of the Geographic Based Informa-tion System (GBIS) in the Urban Environment, NBSReport No. 10-681, HUD/USAC, Washington, D.C.January 12, 1972-Bureau of the Census: Census Use Study Report No,4: The DIME Geocoding System. DOC, Washington,D.C. July 1970.Bureau of the Census: DIME Workshops: An Interim5.Report. DOC, Washington, D.C. May 1973,
6. Oreglia, Antony: ADMATCH and Its Uses in HealthServices Planning and Management, Purdue Universi-ty, Lafayette, Indiana, July 1974,
7. Bureau of the Census: GBF Correction - Update -Extension (CUE), Documentation for the GeographicBase (DIME) File, (Revised Record Format), Geogra.phy Division, GEO-202. Issued January 1, 1973, Re-vised October 1, 1973, Revised August 1, 1974. DOC,Washington, D.C., 1974.

8. Bureau of the Census: The Census Bureau, A Numer-
ator and Denominator for Measuring Change. Tech-nical Paper 37, U.S. GPO, Washington, D.C. June1975.
9. Peucker, Thomas K.: Computer Cartography. Commis-sion on College Geography, Resource Paper No. 17,Association of American Geographers, Washington,D. C., 19’72.
10. Bureau of the Census: Census Use Study Report No.2: Computer Mapping: DOC, Washington, D.C. Au-gust 1969.
11. Aday, Lu Ann and Eichhorn, Robert: A Research Bib-
124
13,
14.
15.
16.
17.
18.
19.
Iiography, The Utilization of Health Services: Indicesand Correlates. National Center for Health ServicesResearch and Development, HSMHA, DHEW Pub.No. (HSM) 73-3003, December 1972.Forster, F.: “Use of a Demographic Base Map for thePresentation of Areal Data in Epidemiology.” BritishJournal of Preventive and Social Medicine 20: 165-1’71. October 1966.Wallace, Helen M., M. D., F.A. P.H. A.; Eisner, Victor,M. D., F.A.P.H.A.; Dooley, Samuel, M. D., F.A.P.H.A.:“Availability and Usefulness of Selected Health andSocioeconomic Data for Community Planning.” Amer-ican Journal of Public Health 57(5): 762-771. May1967.Bain, Sheila M.: “A Geographer’s Approach in theEpidemiology of Psychiatric Disorder.” Journal of
Biosocial Science 6:195-220, April 1974.Drosness, Daniel L.; Reed, Irene, M.; and Lubin, Jer-ome W.: “The Application of Computer Graphics toPatient Origin Study Techniques.” Public HealthReports 80(1): 33-40, January 1965.Greenes, Robert A. and Sidel, Victor W.: “The Use ofComputer Mapping in Health Research.” HealthServices RESEARCH: Fall-Winter 1967, 243-258,from the Community Medicine Unit and the Labora-tory of Computer Science, Medical Service, MGH,Boston, 1967.Bureau of the Census: Census Use Study Report No.
1: General Description. DOC, Washington, D.C.March 1970.Bureau of the Census: Census Use Study Report No.
7: Health Information System. DOC, Washington,D.C. October 1969.Bureau of the Census: Social and Health Indicators
20.
21.
22.
23.
24.
25.
26.
27.
28.
System - Los Angeles. CUS, SESA/DOC, OEO, Wash-ington, D.C. , 1973.Bureau of the Census: Census Use Study Report No.
6; Family Health Survey. DOC, Washington, D.C.September 1969.Mason, Thomas J., Ph.D.; McKay, Frank W.; Hoover,Robert, M. D.; Blot, William J., Ph.D.; Fraumeni, Jo-seph F., Jr., M. D.: Atlas of Cancer Mortality for U.S.Counties: 1950-1969. PHS, NIH, DHEW Pub. No.(NIH) 75-780.Public Health Service, National Center for Health Sta-tistics: Selected Vital and Health Statistics in Povertyand Non-Poverty Areas of 19 Large Cities - United
States, 1969-71. NCHS series 21, no. 26, DHEW Pub.No. (HRA) 76-1904. Rockville, Md. November 1975.Booz, Allen and Hamilton, Inc.: Final Report toNCHS, The Identification of National Center forHealth Statistics Data Users and the Uses Made of theData. Contract No. PH-43-67-752, Washington, D.C.April 30, 1969.Bureau of the Census: Census Use Study Report No.
5: Data Interests of Local Agencies. DOC, Washing-ton, D.C. April 1970.Werner, Pamela A.: A report prepared for TSC, U.S.DOT, The DOT National County Component Con-
verter File: Prospects, Problems, Feasibility. UrbanSystems Laboratory, MIT, Cambridge, Mass. ReportNo. DOT-TSC-OST-74-17. August 1974.Barb, Charles E., Jr.: Automated Street Address Geo-coding Systems, Their Local Adaptation and Institu-
tionalziation. Urban and Regional PlanningDept., University of Washington, May 29, 1974. Univ-ersity Microfilms, Xerox University Microfilms, AnnArbor, Michigan, published on demand.Cagle, M., Public Information Office, Bureau of theCensus: A Nation’s Cities Special Report, GBF/DIME,Dollars, and Sense. Reprinted from NATIONS CI-TIES, the magazine of the National League of Cities,Washington, D.C. pp. 22-36. November 1975.Public Health Service, National Center for Health Sta-tistics: Uniform Hospital Abstract: Minim urn BasicData Set—A Report of the United States NationalCommittee on Vital and Health Statistics. Documentsand Committee Reports, NCHS series 4, no. 14,DHEW Pub. No. (HSM) 73-1451. Rockville, Md. De-cember 1972.
229-121 0-77-12
167

MEASUREMENT OF THE INFLUENCE OF HEALTH CAREENVIRONMENTS ON PATlENT POPULATIONS
Mr. Paul E. Tallant, Project Leader, Healti Resources Statistics, Colorado Department ofHealh, Denver, Colorado
Evaluation of the quality of health care a pa-tient receives in a health care facility is ,a goal that ispressed by various interests. It is a very worthy goalfrom at. least two points of reference. First, its at-tainment would allow establishment of meaningfulqualhy of care benchmarks. Second, it would allowa cost of care benchmark to be established. Thepath to fulfillment of tils goal at times seems to bebarely discernible. At best, it appears with manyforks and branches that lead to wildernesses offrustration. We are on the path as it is visible to us.I feel that we are walking on fertile ground. Thispaper provides an “over the shoulder” view of afundamental portion of our work toward achievingthe goal of objective and realistic evaluation of thequality of health care in terms of the patient.
Assessment of patient care in general involvesdealing with the dynamics of the interaction of twouniverses, the patient universe and the universe ofhealth care providers. As in any study of dynamics,there are parameters or characteristics which de-scribe the interaction. Some general characteristicsof tils interaction on a universe scale might be an-swers to the following questions. What is the fiscal“energy” budget needed to maintain the health careuniverse? Or, how many dollars are required by thehealth care universe to maintain the capacity to acton or hopefully change the state of the patientuniverse? What is the fiscal “energy” budget of thepatient universe? What part of this budget can beused to support the dollar-’’energy” requirements ofthe health care universe? Perhaps the most impor-tant characteristic of the interaction of these twouniverses is the answer to the question, “how welldoes the patient universe fare in its interaction withthe health care universe?” The tools needed to an-swer especially this question do not,- to my knowl-edge, exist. However, there is a great need for thesetools.
The- universe is probably not the appropriatelevel to start development of he tools of observa-tion and analysis. The force of precedent, instead,pushes us rapidly to the laboratory where, hopeful-ly, general methods of observation and analysis canbe developed. The laboratory, in this sense, is theindividual health care facility with its correspondingpatient population. It is here that concepts of gen-eral extent and broad use can be developed.
There are some concepts from physics that canbe adapted for use in analysis of observations in thislaboratory. These concepts in fact tell us what to
’168 ‘-
look for in the laboratory. Consider the concepts ofenergy and work. Energy may be defined as thecapacity to produce a change of state. Work is therate at which energy is used or the rate at whichstate changes occur. For’ example, if I lift a bookfrom a table and place it on a shelf above the table,I do work on the book and thereby change its ener-gy state. I in~--se its potential energy. This in-crease is equal to the average rate at ‘which Ichanged the energy sta~e of the book multiplied bythe time I took to move the book from the table tothe shelf. To affect this change of state, I had tohave the energy or capacity to do the work.
Another point to note here is that if an inde-pendent observer had first seen the book on thetable and later saw the book on the shelf, he wouldbe able to deduce that its state had changed, ItwouId not have been necessary for this observer towatch me move the book from table to shelf.
In our laboratory consisting of a health carefacility and its patient population, we Iook forchanges of state in the patient population+ Observa-tion of these changes with time provides the infor-mation needed to answer the important question,“how well does the patient fare in this facility?” Italso provides the information needed to measurethe capacity of the facility to cause a change in thestate of the patient population.
The application of energy and state concepts toour laboratory system could perhaps be carried fur-ther to include measures of efficiency of the facilityin changing the state of the patient population,However, that is a topic for a different time. Now his sufficient to recognize that: 1) to determine theinfluence of the facility on the patients, the patientstate must be observed, and 2) to characterize thefacility which acts on the patients, the facility mustbe observed. This requires two survey instruments,one instrument by which the patient state can bedetermined and one by which the characteristics ofthe facility can be determined. At the ColoradoDepartment of Health we are producing both in-struments and developing a measurement methodwhich we feel has considerable promise in answer-ing the question, “in a given health facility environ-ment, how well does the patient fare?” I will discussthe measurement method.
Consider the fundamentals of the measurementmethod. Assume for the discussion that the obser-vational tools, the survey instruments exist and infact provide the required information. What as-

sum~tions are needed bv our measurement meth-.od?~irst, it is assumed that a population of patientsmay be described in part by physically observableand mutuallv exclusive states. For an exam~le of a, ,
“ state descriptor consider patient ambulation. Thenoun “ambulation” may be modified by adjectivesto provide a hierarchy of mutually exclusive levelsof state variables. A set of these adjectives may be“independent,” “supervised,” “assisted,” and “no.”“Assisted” connotes mechanical assistance while “su-pervised” connotes the presence of and direction bya facility staff member. Given that I have the luxuryof not belaboring these definitions further, eachpatient in our population would either amb+ateindependently, ambulate with supervision, ambulatewith assistance or not ambulate.
Second, it is necessary that the state variables orlevels be chosen such that changes in the state ofthe patient population may be expected with time.For example, some patients may at one time beobserved to be ambulating independently, while atanother time be ambulating with assistance. Thischange in ambulation abfity would be a change of.state. In other words, while the descriptive patientstates themselves are independent of time, theymust be chosen so that they describe time depend-ent characteristics of the patient population.
Third, it is assumed that the number of pa-tients who transit states or levels is proportional to aproduct of the form “nv” where “n” is the numberof patients occupying a level at a given time and “v”is a directional rate coefficient intrinsically charac-teristic of the interaction between the patient popu-lation and the facility care environment. This rela-tionship is illustrated in figure 1 which shows athree level system.
Level
1
2
3
) ),nl
V1,2 V2;1 V1,3
n2 \
‘2,3 V3,2 V3,1Y v
Figure 1
In this system, patients may theoretically transitfrom any level to any level. The rate at which spe-cific transitions occur is vij and the number at anylevel at any time is ni. Therefore, the change in thepopulation of level i due to patients going from lev-el i to level j is equal to number occupying level i
multiplied by the rate at which they leave level i forlevel j or ni Vij.
Fourth, it is assumed that the transition rates ~jare independent of patient history. All patientsoccupying a given level are assumed to have thesame probabilhy of transiting to another level. Thisassumption may at first seem heroic if not a bitbrash. However, the worrisome nature of this as-sumption tends to disappear when the patient po-pulation occupying the various levels is well chosen.For example, it probably would not be wise to in-clude 20-30 year old people with 70-80 year oldpeople when considering transition rates betweenlevels of ambulation. Instead, it would be necessaryto independently determine the transition rates foreach age group.
Fifth, it is assumed that the transition ratesVljmay be time dependent. If so, the time depend-ency is assumed to be an observable characteristicof tie interaction of the patient population and thefacility health care environment.
This system of levels and transition rates be-tween levels is a structural formalism which makesit possible to calculate the population of these levelsas a function of time. ”The calculation begins withwriting the differential equations that govern therate of change of the population at level ni. Theseequations are a set of coupled linear first order or-dinary differential equations. These equations maybe conceptualized in the following manner. Let A%be the change in number ~ populating the ith levelduring the interval At = tk+ ~ - tk. Let ~j lie in therange zero to one and have a magnitude that is anintrinsic characteristic of the patients-facility interac-tion at level i. The vi~s represent a special case.These are the “pop-up” or source rates Sfiat whichnew population members appear at level i. The sys-’tern for Ani/ At can now be written as
where ~
Ani/At =Sn+Z @j vi –nivij), j# ij
is the actual number of new patients ap-pearing at level i. This equation says simply that thechange in n, is proportional to the sum of all entriesinto level i minus the sum of all exits from level i.
In order to solve this set of equations it is nec-essary to either know the relationships between thevarious transition rates or empirically determineeach rate. Fortunately, these rates may be deter-mined by observation in the health care facility. Forexample, assume we want to know how a 70-80 yearold population will be distributed across the fou~levels of ambulation described previously. We gointo the facility and find the following distributionas shown in Figure 2.
169

ILevel Number Ambulation
1 30 Independent2 10 Supervised3 15 Assisted4 18 No
Figure 2
This observation establishes a reference which willbe used later to estimate the ~~s. On return to thefacility some time At later, we need to know howmany patients from each of the levels have, sinceour first visit, moved ‘to other levels. We also nieato know. how many new patients entered each” level.On our second visit we obtain this information andsubsequently compute the following transition ratematrix shown in Figure 3.
To Level
1 2 3 42/30 3130 1/30
From : 2/:0 o 1/10 1/10= 3 2/15 1/15 o 1/15
4 1/18 3/18 2/18 O
Figure 3
This matrix shpws that no new patients were addedto any level during the time between our first andsecond visits. This is a convenience for illustrationof how an equilibrium distribution; can be c~mput-ed. If diagonal or source terms were nonzero, thetotal population would continue to grow unless exitlevels were included. A complete system would ofcourse, contain exit levels that would include trans-fers to home, hospital, another facility, or death.
Using this four by four matrix it is now possi-ble to calculate the distribution expected to be ob-served after m time periods. The results of this cal-culation, using the population values observed on
‘our first visit as the initial values, are shown in Fig-ure 4. The net change is shown in the parentheses.This distribution was achieved in four time periodsand did not appear to change thereafter.
Level Number Ambulation
1 29 (-1) Independent2 13 (+3) Supervised3 20 (+5) Assisted4 11 (-7) No
Figure 4
These results provide the information neces-sary to answer the question “in terms of ambula-tion, how well does the patient fare in this facility?”For example, if one of my ~andparents needed
care in a Iong-term care health facility I would wantto look at the transition rates to see what thechances are of change in their present state duringthe time interval over which the transition matrixwas calculated. If my grandparent was not ambu-lating, I might look favorably at the rates in theexample at which transitions were made from theno ambulation level, However, ,if my grandparentwas ambulating independently, I might well want toconsider the implications of the transition rates tolower levels of ambulation ability. In essence, thetransition matrix provides a profile across patientstate descriptors of how well patients fare in a givenfacility.
The calculation of the expected equilibriumdistribution provides information needed to deter-mine if the observed patient distribution is stable,In the example, the distribution initially observedwas not equal to that predicted by the calculation,This would indicate that the patient population wasinitially observed during metamorphosis to a stabledistribution. Information of this kind is very usefulfor the planning and administration of health carefacilities.
The measurement method outlined by this il-lustration has the potential of providing informa-tion needed to describe important characteristics ofthe ongoing interaction between a patient popula-tion and a health care environment, The method isgeneral in nature. It maybe used for measurementson a universe scale as well as a laboratory scale, Inconcept, it provides the information needed to an-swer the question “how well do patients fare in thisfacility?” It also provides information needed toplan for future expected patient populatiorts, Itmay even be used to estimate total populations andmortality rates within a given region. For example,I used this method to estimate the Colorado popu-lation size and mortality over a fifteen year periodbeginning in 1960. The calculated results for eachyear were within about three percent of those pub.lished by the Colorado Department of Health forthe same time interval.
It is evident that the success o; this method inproviding a tool to assess the quality of care re-ceived by a patient population is dependent uponthe quality of the transition rates. It is importantthat these rate coefficients accurately reflect the in-teraction between the patient population and thehealth care facility. This requirement places theburden for obtaining accurate rate coefficients onobservations of patients within a health care facility,
This measurement method has not been labo-ratory tested. I anticipate testing ‘this method soortin the largest long-term care facilities in Colorado.Determiniation of ultimate validity and usefulnessof this method for assessment of the quality of pa-tient care in terms of patients must await at leastthe results of the test program.
1-170

PROMINENT ISSUES OF CONFIDENTIALITY IN THECOOPERATIVE HEALTH STATISTICS SYSTEM
Mr. Walt R. Simmons, Statistical Consultant, Alexandria, Virginia .
Introductory Remarks
Recently I heard a remark that I wish to pla-garize and paraphrase: Before I speak, I want tosay something. In fact I want to say two things.
First. The issues of confidentiality, invasion ofprivacy, access to data sources, use of recorded in-formation, and related topics have grown in the lastfew years from important, but secondary, facets ofstatistical enterprises to prominence as certainly oneof the half-dozen most vital features of statisticalpolicy and practice. And in increasing numbers ofsituations these issues are the dominant force inshaping a program or project. Every statistical ad-ministrator must give substantial attention to thesubject; most’ organizations that have any connec-tion at all with statistical matters have establishedcommittees or task forces to grapple with the prob-lem; many statistical conferences include sessions onconfidentiality on their agendas. Like it or not, con-fidentiality and associated” matters are most signifi-cant elements today in the social statistician’s life.
Second. As many in this audience know, I havewritten and talked a great deal, as well as listened toand read what others have to say on the subject. Inparticular, I have just delivered a twenty thousandword report to the National Center for Health Sta-tistics (NCHS), and two months ago gave a talk atthe Cooperative Health Statistics System (CHSS)Workshop on Confidentiality in Atlanta. In thosetwo efforts I tried to do what the program suggestsI should do here: give an overview of confidentiali-ty issues as they relate to the CHSS. Some of ~oudon’t wish to hear me say the same things ag%in,and I for one am getting weary of doing that. Stillthe occasion calls for some repetition, but I’m goingto proceed in a little different way.
My report to NCHS deals with a wide range ofissues, including ethical, political, economic, legal,administrative, jurisdictional, procedural, technicaland technological considerations—and still is notentirely comprehensive. Any of you who wish to seemy view of the overall picture are invited to consultthat report, which I presume can be made availableby NCHS. Today I’m going to restrict my remarksto just five matters or issues. These may or may notbe the five most important aspects of the total prob-lem, but each is in my judgment critical to the suc-cess of the CHSS. I think “critical” is not too stronga word, for the CHSS is not likely to prosper unless
it evolves acceptable, workable solutions to leadingconfidentiality problems.
1. Distinction betweenStatistical Purposes andAdministrative Uses
It is essential that the distinction between statis-tical purposes and uses on the one hand, and ad-ministrative uses and objectives on the other, beestablished and made widely understood. The diffi-culties and hurdles that the statistician faces todayare due almost entirely to the fact that legislationand public opinion do not in many situations recog-nize this distinction. Administrative data are collect-ed and used for the purpose of dealing with specificpersons or other entities. “Dealing with” encompas-ses such actions as licensing, registration, inspection,insuring, training, regulating, servicing, diagnosing,treating, charging, paying, or conveying other bene-fits or penalties. When they are fully understood, allthe fears that people have with respect to confiden-tiality of information have their roots in potentialadministrative uses. Jane Doe, or John worries thatsomeone will discover something about him that hewould rather they don’t know, and more particular-ly take some action with respect to him that he doesnot want taken. Often he does not have a specificaction in mind, but only a vague concern that“something” may be done to him. Always it isuneasiness about “what may happen to me”through use of data that specifically identify him.
The purposes and uses of statistical data arefundamentally and totally different from those ofadministrative data. Statistical purpose is to aug-ment general knowledge: to learn the dimensions,trends, and relationships of collectives of persons,other entities, and their attributes. The objective isto promote understanding of these matters in orderto benefit society through better legislation, plan-ning and conduct of affairs. It is never for the pur-pose of taking direct action with respect to a parti-cular individual. The very essence of the statisticaldiscipline is that identity of the individual units withwhich it deals is immaterial. Individuals are notidentifiable in the output of a statistical system.
When a person fully understands this basic dis-tinction between administrative and statistical pur-
171

poses, he cannot have much concern over confiden-tiality from data that are used for statistical purpos-es only.
2.. Access to AdministrativeData “
In the CHSS and elsewhere there are many in-stances in which administrative data, recorded forsome case-action purpose, have potential utility forstatistical purposes. The administrative data may bein the public domain, or they may be in some de-gree privileged. The question is, may the statisticalsystem have access to the administrative data, and ifthe answer is yes, should the statistical system beauthorized to further transfer the data to third par-ties? I do not wish to explore here the considerablevariety of situations that can occur. But I shall out-line a recommended stance for the CHSS. Assumethat “statistical system” embraces an activity thatuses data for statistical purposes only, as just de-scribed, and is under legal and policy restraints sim-ilar to those of the U.S. Census Bureau or the N&a-tional Center for Health Statistics. Given this, a wayshould b.e found to give the statistical system accessto the administrative data if there is a needed anduseful objective in so doing, for the added risk tothe individual is so trivial as to be inconsequential.And the informational cost to society is less than itwould otherwise be.
But the statistical system should not be author-ized to further ~ansfer individually identifiable datato third parties without the written consent of thecustodian of the administrative data.
With the consent of the original writer, Ishould like to read (slightly modified) extracts froman argument about use of records of the InternalRevenue Service by the Census Bureau, because thestatement makes the case so well: The only conceiv-able loss to an individual from the statistical use ofrecords by the Bureau of the Census is the poten-tial, if there is any, for violation of confidentiality.However, the protection provided by Census is themaximum that can be conceived. IRS data in thehands of the Census Bureau are protected againstsubpoena by any jurisdiction or for any possibleuse. This is a far stronger kind of protection thanthe data have in the hands of IRS. IRS data utilizedby the Census Bureau will be for statistical use only,not allowing revelation of individually identifiableinformation. No detriment can occur to the individ-ual because of Census handling. Census employeesare subject to fine and imprisonment for any viola-tion. The alternative of not providing access wouldbe not to have available much-needed summaryinformation, or to go back to the respondent a sec-ond time at increased cost and inconvenience to therespondent. ~e latter course would be stupid, and
172
the public would not and should not understand orapprove such an approach.
3. Legislative Action
A degree of recognition of the distinction be-tween statistical and other uses of data, and consi-derable attention to the handling of confidential orprivileged data exist in Federal law. Some tidyingup, both in statutory provisions and in regulations,is needed. Much more is desirable in State law. Ishall not attempt here to specify in any detail whatthose changes should be. In my NCHS report thereare some suggestions. Others on this program todaywill deal in part with the matter. I’ll say only thatgood will and sound policy are necessary, but theyare not sufficient protection in a system that intendsto give assurances of confidentiality in handlingmany of the data for which it is collector and cus-todian. Policy needs to be buttressed throughoutthe CHSS by statute and regulation that put theforce of law—coupled with penalties for violation—behind the system’s promises.
4. Operating Guidelines
Beyond the laws and regulations, each agencyshould establish a written set of Operating Guide-lines as a checklist for day to day decisions and ac-tions. Among others, the guideline list should in-clude such items as: ‘
a.—”-.. . .-. ,
b.
c.
d-
e.
1he rule 01 responsible constraint: Uon’t col-lect an item at all unless the need is clear-cutand the value of the information outweighsthe risk of privacy infringement,Separate the key to individual identificationfrom substantive data at as early a stage asprocessing requirements permit, Place thekey under custody of separate authority ifcircumstances allow. .
Restrict to the necessary minimum the num-ber of persons in the system who have orcan gain access to specific. identifiers.Indicate to suppliers of data the authorityunder which the collection is made, and atleast one specific objective to be served, (Besure that there is a cogent reason for thecollection!)Do not promise confidentiality, unless faiIureto do so entails new risks to the supplier ofinformation or to the image of the collector,or invites the reporting of lower quality re-plies.
The guidelines should be well-known to allemployees, and available to the public.

1 5. Training and PublicRelations
I There are two bodies of people, in addition toprogram managers, who mus; understand and ac-cept the CHSS stance on confidentiality. One ofthese is the employees of the sytem. Perhaps thegreatest single safeguard the system can have is aknowledgeable work force that fully understandsand is dedicated to conduct of a program that isnicely balanced between assembly and disseminationof useful statistical information, and appropriateprotection of the privacy and confidence of thosewho supply the information. The obvious enabling
requirement is a training program that brings thisabout.
The second body that needs special attention isthe suppliers of information, including all thosepersons to whom the data relate. Policy and practiceneed be guided almost as much by what peoplethink the situation is with respect to confidentialityas by what the facts may be. This means that theCHSS must give never-ending effort to its publicrelations. If the system( develops as I hope it will, itshould be damaged rarely by improper handling ofprivileged data, but it could be severely damaged bywhat the public believes or fears it is doing withinformation in its custody. Let’s do our best to pre-vent that from happening.

PRINCIPLES FOR DEVELOPMENT OF-A M“ODELSTATE LAWPROVIDING FOR AUTHORITY TO COLLECT AND TRANSMITCHSS DATA AND PROVIDING FOR CONFIDENTIALITY, PRIVACYAND SECURITY
Mr. Steven B. Epstein, Esquire, Attorney-at-Law, and Mr. John J. Cohrssen, Esquire,Attorney-at-Law, Washington, D.C.
1.Purpose of the Principles
The intent of the Principles is to enable healthcare data to be acquired by a Cooperative HealthStatistics System (CHSS) FocaI Point and to betransmitted to National Center for Health Statistics(NCHS) and to other sovereign States while provid-ing for the confidentiality, securi~ and privacy ofsuch data in the hands of the CHSS Focal Point.
11..Assumptions Relating to thePrinciples
A. The primary focus in the development ofthe Principles has been the consideration of threeminimum data sets - Manpower, Health Facilities,and Hospital Care Statistics. Vital Statistics has beenexcluded from consideration because of the pres-ence of an already existing Model State Vital Statis-tics Act which is in the process of being updated.The Long Term Care and Ambulatory Care mini-mum data sets have also been excluded from con-siderations because of the preliminary nature of the
implementation of SUeh data sets,.
B. In accordance with the Purpose stated in Iabove, the Principles relate to the collection and dis-semination of health data from the CHSS FocalPoint to NCHS and to the interstate distribution ofsuch data. The principles also relate to the confi-dentiality, privacy and security of health data onceacquired by the CHSS Focal Point.
Although the significance of developingprinciples and practices for the coordination ofacquisition and distribution of health data on anintrastate basis is recognized, it is felt that sufficientinformation has not yet been collected to presentprinciples for a model State law which could effec-tively handle such internal State problems. (Attach-ment A represents in graphic form the collectioncomponents of a CHSS system. The principles pre-sented represent an attempt to identify and solveproblems relating primarily to that portion of thediagram placed above the dotted horizontal line.)
C. Health data in the hands of the CHSS FocalPoint,whether acquired directly or through otherprimary data sources, will include data used forboth statistical and regulatory purposes.
174
Ill. Procedural Principles
Format for development ‘of a model Stateact:
A. Creation of a national panel for each com-ponent to develop a Recommended Minimum DataSej to meet State and Federal purposes regardingthe collection of health data., Such national panelshould consist of both State and national experts inthe fields of statistics, regulation, confidentiality andsecurity of health data.
B. Creation of a committee in each State toreview the Recommended Minimum Data Set todetermine which items (1) shall be collected by theState and (2) which items shall be considered Pro-tected Data. Such State committee may also consi-der the coordination of data collection and distribu-tion among the various State agencies and organiza-tions which are presently gathering health data,
IV. Definitions
A. Recommended Minimum Data Set meansthe minimum data set recommended by a panel ofState and national experts in accordance with theProcedural Principles outlined in 111A. above.
B. Minimum Data set means those elements ofthe Recommended Minimum Data Set and suchother dat; elements which the individual State choos-es to collect as essential to its needs in light of totalState circumstances, The Minimum Data Set mayinclude information already being collected forregulatory or administrative purposes as well asadditional information for CHSS purposes,
C. Protected Data means those elements of theMinimum Data Set which the individual State deter-mines should not be disclosed to the public in indi-vidually identifiable form.
D. Non-Protected Data means all other datawhether in indivually identifiable form or aggregateform.
V. Substantive Principles
A. Establishment of a CHSS Focal Point fordata acquisition.

rNCHS
Ar I t
——— .— —— —— — —— .
State AgenciesCollecting Health Data
Respondent
\\
—— —
\
OrganizationsCollecting
Health Data(PSROS, HSAS,Associations,
etc.)
——
\bRespondent
175

State Options:1. Creation of an independent State
office v. designation of an existing Stateagency. ”
2. Creation of a single central focalpoint for all CHSS components v. creationof a separate focal point for each compo-nent(or combinations of components). (SuchCHSS Focal Point or focal points will hereinbe referred to as the “CHSS Focaf Point”.)
B. Authorization for acquisition of the dataitems represented in the Minimum Data Set.
1.
2.
Types of acquisition:a. Direct collection (through use of
surveys, interviews, etc.) of health databy the CHSS Focal Point must be author-ized.
b. Authority to contract with anoth-er agency or organization for collectionof health data directly from respondentsmust be provided. (In this situation, thepresumption exists that such agency ororganization has no independent author-ity of its own to collect such data.)Mandated nature of acquisition of theMinimum Data Set items.
State Options:The items represented in the Mini-
mum Data Set may be collected on amandatory basis (i.e., with the provisionof penalties for failure to comply) orthey may be collected on a voluntary ba-sis.
Our recommendation is for the vol-untary collection of all items representedin the Minimum Data Sets on an experi-mental basis. Our recommendation isbased on the following reasoning:1. Mandating the necessity of a re-sponse, with penalties attached for non-compliance, should be a measure of lastresort.2. The experiment has a reasonablechance to succeed since adequate provi-sion will be made on a statutory basis forthe confidentiality of the informationreceived.
C. Authorization to contract with other Stateagencies or organizations (e.g., PSROS, HSA’S,State associations, etc.) already collecting data itemsincluded in the Minurnum Data Set. (In this situa-tion, the prestunption exists that such other agencyor organization has independent authority of itsown to collect such data.)
176
1. Types of acquisitions:a. Purchase of health data from an
of the Minimum Data Set. Such purchasepresents no major problem provided theauthorizing statute or other conditions ofcollection for such agency or organizationallow transmittal of such information to theCHSS Focal Point.
b. Contract with agency or organizationfor such agency or organization to collectdata it~ms required by the Minimum DataSet in. addition to those items it is alreadycollecting (i.e., piggybacking through theuse of additional questionnaires, etc.)
1.
2.
Advantages and Disadvantages ofPiggybacking:Advantages may include theavoidance of duplication of effort,cost savings, and a single ques-tionnaire for the respondent tocomplete.Disadvantages may include thefact that a regulatory agency ororganization may have access tononregulatory information inidentifiable form, Problems withquality controls may also arise.It may be possible to constructmechanisms- to allow for non-duplication of effort while prev-enting access by a regulatoryagency or organization to non-regulatory information (e,g, adetachable form sent to a neutralcollection source),
c. Contract with agency or organizationfor the CHSS Focal Point to colIect dataitems included in the Minimum Data Set forwhich such agency or organization requirescollection for its own regulatory or adminis-trative purpose. (Such a contract wouldrequire the transmittal of some ProtectedData to the agency involved and must beconsidered an exception to the con fidentiali-
-ty of such information see E.2.)
D. Authorization to transmit Non-ProtectedData and Protected Data where appropriate (seeE. 1. Confidentiafity).
Limitations on disclosure of Non-ProtectedData:
State Options:1. All Non-Protected Data is availa-
ble to the public upon request. (A me-chanism must be adopted to providereasonable access to this information at areasonable cost.)

2. Some limitation on access to un-published Non-Protected Data may beappropriate if standards are adopted asto who may obtain data and under whatconditions. (Must the requestor have alegitimate reason to seek the informa-tion or is idle curiosity sufficient? Fur-thermore, the criteria adopted must becareful not to exclude the nonsophisti-cated requestor. Such limitations mustalso be coordinated or excluded fromState public record disclosure laws.)
3. Right of Comment by personaffected (to be attached to distributeddata) should be considered for disclosureof individually identifiable data not con-sidered Protected Data.
E. Confidentiality of Protected Data
No Protected Data may be disclosed tothe public by any person or agency. (Theprimary data collector and subsequent usersmust agree to maintain the appropriateconfidentiality protections. In addition, Pro-tected Data may need to be specifically ex-cluded from State public record disclosure”laws.)
1, Disclosure to the public does notinclude disclosure to NCHS or interstatedisclosure to participants in the CHSSsystem provided, however, that NCHSand such outside State participants guar-antee the continued nondisclosure ofsuch Protected Data by appropriate Fed-eral and State law or regulations. (In thisconnection, consideration should be giv-en to the proportion that NCHS andother States may not need individuallyidentifiable data for may data items.)
2. The transmittal of Protected Datawhich has been collected by the CHSSFocal Point on behrdf of another agencyis not an unauthorized disclosure provid-ed, however, that State law or regula-tions authorize access by such agency tosuch Protected Data.
3. Protected Data should not beused as evidence in any court, adminis-trative or other proceeding. Such protec-tion should include oral testimony aswell as any written document which mayresult in the disclosure of ProtectedData.
4. Disclosure of aggregate datawhich may result in the inadvertent dis-closure of individually identifiable infor-mation must be prohibited. (See the
Task Force on Confidentiality recom-mendations to the CHS Advisory Com-mittee concerning Procedures for Safe-guarding against inadvertent disclosure,
e.g., Rule of Three.)5. State Option Regarding Confi-
dentialitya. Should access to Protected
Data for research purposes beconsidered a disclosure to thepublic? (If disclosure for researchpurposes is allowed in principle,then criteria must be establishedto determine the definition of alegitimate research interest, e.g.definitions contained in medicalresearch study laws.)
b. Should the CHSS FocalPoint be required to disclose datawhich it receives from a Stateagency or organization eventhough such data is public in theforwarding agency or organiza-tion ?
F. Privacy Principles
The following principles should be in-corporated into a model State law:
1. The right of the public to know thatthe CHSS data system exists. The CHSSFocal Point should establish and implementprocedures to inform the public of the ex-istence, scope and purpose of the CHSS Sys,tern.
2. The right of an individual to knowthat the CHSS data system is collecting in-formation about him. The primary data col-lector should inform the individual aboutwhom data is being collected, of, at a mini-mum, the
a.
b.
c.
d.
e.
followin~:
The authority under which collec-tion is being pursued.The nature of the system (i.e.,voluntary v. mandatory) and thepurpose of the system.The name and address of theperson responsible for the sys-tem.Those persons and agencieswhich have access to the system.The conditions under which dis-closure will be permitted.
*See further Task Force on Confidentiality Report to CHSAdvisory Committee and PSRO Transmittal 16, Specifica-tions for Confidentiality Policy on PSRO Data and Infor-
mation.
177
G.
3. ne right of an individual to haveaccess upon request, to the informationmaintained on him in the CHSS System forpurposes of ascertaining the accuracy ofsuch data and information.
4. The right of an individual to chal-lenge the quality and accuracy of the infor-mation maintained on him in the CHSS Sys-tem. The CHSS Focal Point must establishand implement procedures to varify theaccuracy of such information when chal-lenged.
5. Coordination with State Privacy Actsmust be accomplished.
Security Principles
The following principles should be in-corporated into a model State law*:
1. Identification of individuals on anyCHSS reports, forms or documents must bein coded form. Files containing cross refer-ences to personal identification must bemaintained in a secure manner.
2. The CHSS Focal Point must purgeall personal identifiers as soon as such iden-tifiers are no longer considered necessary.The CHSS Focal Point must purge all otherreports, forms and documents when such
*See further PSRO transmittal16, Specifications for Con-fidentiality Policy on PSRO Data and Information andThe Younger Committees Principles.
information has served its purpose. Periodsshotid be specified beyond which informa-tion shodd not be retained.
3. Responsibility for maintaining theconfidentiality of the CHSS System must beassigned to a specific, single individual, Allpersonnel who participate in the CHSS Sys-tem must be informed of their responsibilityto maintain the confidentiality of the Sys-tem.
4. Legal penalties should be imposedon personnel responsible for the unauthor-ized disclosure of any data or information,Civil remedies should be available to thoseindividuals damaged through unauthorizeddisclosure-
5. Access to information in the CHSSSystem must be limited to those personsauthorized to have such access for the ac-complishment of a specific purpose, A mon-itoring system must be maintained to facili-tate the detection of any violation of thesecurity system.
6. Personnel who participate in theCHSS System may not have access to Pro-tected Data unless such individual has re-ceived proper training in the handling ofsuch data and has been adequately in-formed of any legal penalties imposed forthe unauthorized disclosure of such data,
‘7. An ongoing training program mustbe established to effectively train personnelin the proper handling of Protected Data,
178

ISSUES FOR THE STATES ARISING OUT OF THE DENSENCOMMlnEE REPORT,
Mr. Vito M. Logrillo, Director of Health Statistics,New York State Department of Health,Albany, New York
The presentations of the previous speakershave pointed up the many concerns, needs, and, tosome degree the legislative environment that existsin the States relating to the multiple aspects ofhealth data systems and associated issues of confi-dentiality and privacy. These issues, with respect tothe many cooperative State programs conducted inassociation with the National Center for Health Sta-tistics (NCHS), and the Cooperative Health StatisticsSystem (CHSS) in particular, form the basis for theDensen Report. Since this report has not been gen-erally distributed, I would like to briefly describesome of the major recommendations and raisesome of the potential implications for States in theirimplementation. Though the report is not currentlyimplemented, many of the principles and proce-dures described are being followed to varying de-grees at the NCHS and in State health data systems.In implementation, the principles and guidelinesare intended to provide direction for incorporatinguniform safeguards throughout the system.
As many of you know, the Nakonal Center es-tablished the Cooperative Health Statistics AdvisoryCommittee several years ago in conjunction withthe expansion of the CHSS program. Early in itsdiscussions, the Advisory Committee felt that issuesrelated to the confidentiality and privacy of datacollected through the Cooperative System were ofsignificant importance and relevant to the Commit-tee’s activities. With this concern, the AdvisoryCommittee established a subcommittee on confiden-tiality to review existing procedures related to confi-dentiality and privacy in the NCHS and at the Statelevel as these might impact on the CHSS.
The subcommittee began its activities in Sep-tember 19’74. Dr. Paul Densen of the Harvard Med-ical School was named Chairman and Mr. JackCarmichael of the Texas Department of HealthResources, Mr. George Tipp of the McDonnellDouglas Co., and I served as members of the sub-committee. In addition, Mr. Walt Simmons alongwith several members of the NCHS staff served asconsultants and as resource staff for the subcommit-tee, The NCHS staff were instrumental in compil-ing into one document the various policies, proce-dures and practices under which NCHS now oper-ates with respect to confidentiality and privacy. Thisdocument proved invaluable to the subcommittee’sefforts. The report of the subcommittee was complet-ed in October 1975. It was subsequently approvedby the Advisory Committee and transmitted to the
NCHS entitled the “Report of the Task Force onConfidentiality of the Cooperative Health StatisticsAdvisory Committee”, with a recommendation foradoption and implementation.
The specific charge to the subcommittee was to:
“A,
B.
c.
Develop a set of principles which willassure confidential protection to re-spondents, yet enable an open collec-tion, exchange, and use of health data;Develop, based on these principles,guidelines that would enable NCHS/CHSS to carry out its designated activ-ity in a consistent manner;Develop a mechanism by which excep-tions, which may occur7 can be easilyand rapidly handled.”
. Given this rather broadly defined, and whatappeared to be somewhat contradictory set of objec-tives, the subcommittee proceeded on two levels.First, an assessment was made from a sample ofStates of current practices regarding informationdisclosure based on existing statutes or regulationsand second, a review was made of existing practicesand procedures at the NCHS. This “first level” ac-tivity was not an attempt to evaluate existing Statelaws as described earlier by Mr. Steven Epstein;rather, it was an attempt at a general orientationfor the subcommittee as to what the existing situa-tion was in the States. State laws and procedures ofmembers of the subcommittee were reviewed aspart of this activity in addition to several otherStates. These included New York, Texas, Washing-ton, Massachusetts, and California. The StatisticsAct of Canada was also reviewed and the final re-port encompasses many aspects of the Texas andStatistics Canada procedures regarding release ofinformation. One of the major concerns for thesubcommittee at the outset was related to the trans-mittal of data. The operational structure of theCHSS and NCHS generally, provides for data to betransmitted in several ways; 1) from a respondentdirectly to NCHS; 2) from a respondent to NCHSthrough the State CHSS agency or 3) to NCHSthrough one or more intermediaries such as Stateoffices or other public or private data collection ordata processing ag’encies. The subcommittee felt itwas essential that any confidentiality or privacy con-siderations given at the primary data collectionphase should be continued and maintained at all
179
subsequent levels of data transmission. Other .con-,terns which were considered by the subcommitteeincluded the release of data in published or ma-chine-readable form, the disclosure of individually ,identifiable or aggregated records, and considera-tions related to use of the data in terms of statisticalor administrative DurDoses. Each is addressed indetail in the repor; wi~ the subcommittee’s recom-mendations for dealing with them. For this presen-tation I will attempt to highlight only those which Ifeel may be of concern or represent potential legalor policy issues if implemented for some States.
I would like to emphasize at this time that theserecommendations were develoDed as DrinciDles andoperational guidelines for im~lement;tion ;ot onlyby the NCHS, but for adoption by the State CHSSor any intermediary data processing or data collec-tion agencies as well. The recommendations weremade \ith the intention of providing the respond-ent every consideration with respect to con fiden-tiality ‘and privacy and, simultan~ously, to providefor a viable health data :ystem. It was recognizedthat a balance between these two aspects had to beachieved to the extent possible in order to obtainacceptance and secure ‘confidence in the system.Coiricident with these considerations the subcom-mittee recognized the need for communication toall involved in the system, i.e., the producer, collec-tor, processor and user, of any decisions impactingon the assurances given with respect to confidential-ity, privacy or use of data. .
The need to fulIy inform a respondent wasconsidered an integral part of maintaining such abalance in the system. The guidelines provide thatthe respondent be advised of the authority underwhich &e data is collected. whether or not responsez
is mandatory, how the data is to be used, and assur-ance that tie data collecting entity have the legalauthority to refuse to provide such data to others ifit deems there is a potantial for violation of theconfidentiality considerations given in the collectionstage.
These latter points, i.e., that “data be used onlyfor the purposes collected” and, “refusal to providedata wh;re “a potential for violation of con fidentiali-ty may exist” ‘are two which I feel represent issues;equi~ng careful consideration by S~tes. Many ofus would be hard put to restrict a particular datacollection effort to the specific purpose originallyintended. Oftentimes the availability of such data initself generates additional uses. For example, thecollection of data to assess available health manPow-.er resources may subsequently be deemed useful inan evaluation study of quality of care. This type ofevaluation might be based on a specialty-nonspe-cialty comparison of particular health care itemsrelated to services provided by physicians, nurses,or other professionals. In this instance, use of the
180
information in such a study would result in a con-flict with the operational guidelines proposed. Onthe other hand, it would be difficult to justify a sec-ond data collection effort when, in fact, the neces-sary information was available.
In the second case, a careful review of existingstatutes, rules and regulations would be necessary todetermine whether the State CHSS agency, or otherCHSS intermediary agency, could refuse to providecertain data collected through the system. Many ofthe States have recently enacted “Sunshine Laws”which could preclude incorporating this guidelinein an operational sense. Again a possible conflictcould exist between the operational guidelines pro-vided in the report and any mandatory disclosurewhich may exist in that State. Legislation providingfor, or allowing exceptions to such provisions maybe required in many States prior to implementation.In this instance, the report suggests interim proce-dures be employed prior to obtaining a legal basisfor them. It is emphasized, however, that legislativeauthority must eventually be obtained to insure thatthe principles established are not jeopardized atsome later time.
The concept of informed consent is carriedover from the 197’4 Federal Privacy Act with therecommendation that the respondent be fully in-formed of any use, transmittal or disclosure intend-ed with respect to the information collected, This isan area where to inform each respondent couldprove extremely difficult for a State to undertake,both from a fiscal and logistic standpoint. Here theproblem surfaces after data collection occurs.
For example, all of the conditions regardinguse and disclosure could be cited at the initialcollection stage without too much difficulty. Thesecould appear on the collection form, in an introduc-tory letter, or as part of an established clearanceprotocol. However, to follow back to the originalrespondent to obtain clearances in the event an“unanticipated” use of the original information wasto be made could prove prohibitive, Such a situa-tion might arise where a population is surveyed andsubsequently it is determined that information froma previous, unrelated survey was available whichwould provide supplementary data to the currentstudy. Release of such data in an identifiable formatfor linking or matching purposes or for additionalfollowup would violate the principles of the report,Consent of the original respondent prior to suchrelease is the guideline established.
The report further provides prohibitionsagainst the examination of individually identifiablerecords by anyone other than those employed bythe agency or for disclosure of any informationwhich may be related back to an identifiable record.This includes records for an individual person,business or organization, I would like to make spe-
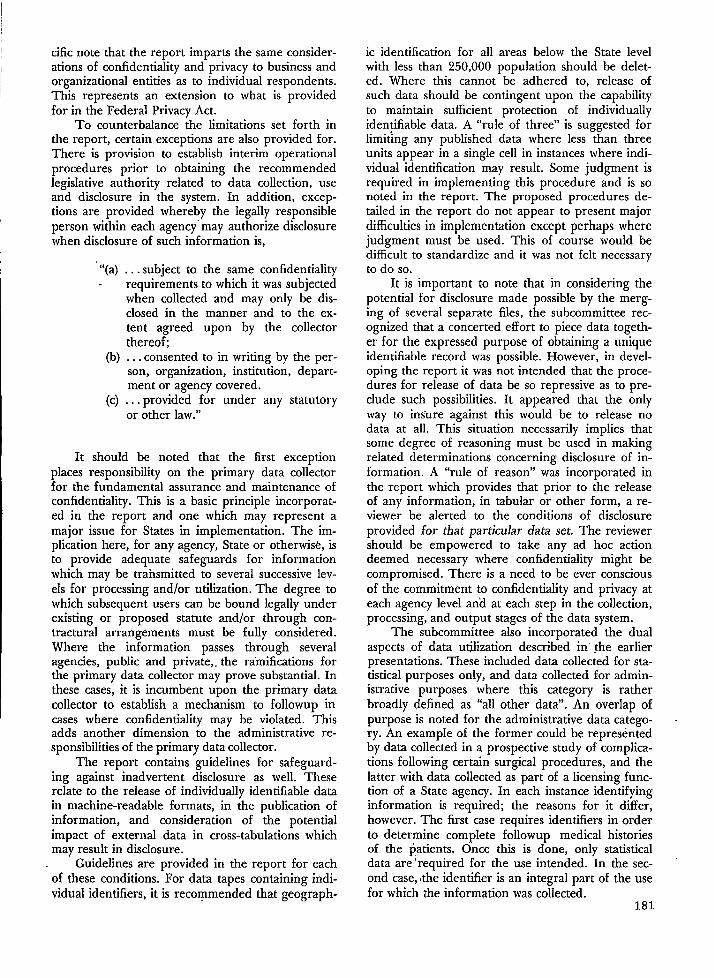
cific note that the report imparts the same consider-ations of confidentiality and privacy to business andorganizational entities as to individual respondents.This represents an extension to what is providedfor in the Federal Privacy Act.
To counterbalance the limitations set forth inthe report, certain exceptions are also provided for.There is provision to establish interim operationalprocedures prior to obtaining the recommendedlegislative authority related to data collection, useand disclosure in the system. In addition, excep-tions are provided whereby the legally responsibleperson within each agency” may authorize disclosurewhen disclosure of such information is,
“(a)
(b)
(c)
. . . subject to the same confidentialityrequirements to which it was subjectedwhen collected and may only be dis-closed in the manner and to the ex-tent agreed upon by the collectorthereof;. . . consented to in writing by the per-son, organization, institution, depart-ment or agency covered.. . . provided for under any statutoryor other law.”
It should be noted that the first exceptionplaces responsibility on the primary data collectorfor the fundamental assurance and maintenance ofconfidentiality. This is a basic principle incorporat-ed in the report and one which may represent amajor issue for States in implementation. The im-plication here, for any agency, State or otherwisk, isto provide adequate safeguards for informationwhich may be transmitted to several successive lev-els for processing and/or utilization. The degree towhich subsequent users can be bound legally underexisting or proposed statute andlor through con-tractual arrangements must be fully considered.Where the information passes through severalagencies, public and private,. the ramifications forthe primary data collector may prove substantial. Inthese cases, it is incumbent upon the primary datacollector to establish a mechanism to followup incases where confidentiality may be violated. Thisadds another dimension to the administrative re-sponsibilities of the primary data collector.
The report contains ‘guidelines for safeguard-ing against inadvertent disclosure as well. Theserelate to the release of individually identifiable datain machine-readable formats, in the publication ofinformation, and consideration of the potentialimpact of external data in cross-tabulations whichmay result in disclosure.
Guidelines are provided in the report for eachof these conditions. For data tapes containing indi-vidual identifiers, it is recommended that geograph-
ic identification for all areas below the State levelwith less than 250,000 population should be delet-ed. Where this cannot be adhered to, release ofsuch data should be contingent upon the capabilityto maintain sufficient protection of individuallyidentifiable data. A “rule of three” is suggested forlimifing any published data where less than threeunits appear in a single cell in instances where indi-vidual identification may result. Some judgment isrequired in implementing this procedure and is sonoted in the report. The proposed procedures de-tailed in the report do not appear to present majordifficulties in implementation except perhaps wherejudgment must be used. This of course would bedifficult to standardize and it was not felt necessaryto do SO.
It is important to note that in considering thepotential for disclosure made possible by the merg-ing of several separate files, the subcommittee rec-ognized that a concerted effort to piece data togeth-er for the expressed purpose of obtaining a uniqueidentifiable record was possible. However, in devel-oping the report it was not intended that the proce-dures for release of data be so repressive as to pre-clude such possibilities. It appeared that the onlyway to insure against this would be to release nodata at all. This situation necessarily implies thatsome degree of reasoning must be used in makingrelated determinations concerning disclosure of in-formation. A “rule of reason” was incorporated inthe report which provides that prior to the releaseof any information, in tabular or other form, a re-viewer be alerted to the conditions of disclosureprovided for fiat particular data set. The reviewershould be empowered to take any ad hoc actiondeemed necessary where confidentiality might becompromised. There is a need to be ever consciousof the commitment to confidentiality and privacy ateach agency level an’d at each step in the collection,processing, and output stages of tie data system.
The subcommittee also incorporated the dualaspects of data utilization described in’ the earlierpresentations. These included data collected for sta-tistical purposes only, and data collected for admin-istrative purposes where this category is ratherbroadly defined as “all other data”. An overlap ofpurpose is noted for the administrative data catego-ry. An example of the former could be representedby data collected in a prospective study of complica-tions following certain surgical procedures, and thelatter with data collected as part of a licensing func-tion of a State agency. In each instance identifyinginformation is required; the reasons for it differ,however. The first case requires identifiers in orderto determine complete followup medical historiesof the patients. Once this is done, only statisticaldata are ‘required for the use intended. In the see-ond case, lthe identifier is an integral part of the usefor which the information was collected.
181

T~ is a fundamental difference between thetwo in terms of confidentiality as addressed in thereport. For the former, it is recommended that dis-closure of any associated identifiable data be prohib-ited by law and that any use be restricted to statis-tical purposes, with such data presented only in sta-tistical format. In the latter case, it is recommendedthat the conditions for disclosure and the specificusers be established by legislation or regulation.Thus, identifiable data associated with that collectedfor statistical purposes would have, by statute, blan-ket restriction on disclosure, whereas administrativedata could be routinely provided to previously iden-tified users.
In summary, the solutions to the types of issuesdescribed as these relate to the principles andguidelines contained in the Densen Report arecomplex and far-reaching. In some cases decisions
will be reauired which address questions such as“how mucfi time, money, and resources can weafford in order to maintain the principles estab-lished for confidentiality and privacy?” or, “shouldthis particular activity be undertaken, consideringthe possible compromises which may result withrespect to confidentiality and privacy?”. Obviously,there is a need and there will continue to be a needfor a constant weighing of these issues which, I feel,are not insurmountable. We are not doing such abad job now and the track records of th~ CensusBureau and the National Center as well, attest tothis. The main concern, I feel, is for the assurancethat there is continuous attention paid to these is-sues and that those involved have willingness toaddress them. The record to data, as evidenced inpart by this panel presentation and the preparationof the Densen Report, show this to be the case,
182

CURRENT AND NEEDED LEGISLATION RELATING TO CONFI-DENTIALITY IN STATISTICAL PROGRAMS
Joseph W. Duncan, Ph.D., Deputy Associate Director for Statistical Policy, Offi,ce of Manage-ment and Budget, and Mr. David Hulett, Chief, Economic Statistics Branch, Statistical PolicyDivision, Office of Managment and Budget, Washington, D.C.
Introduction
Issues of privacy, confidentiality and freedomof information are of growing importance. Duringthe past four years there has been considerable leg-islative attention to these issues, yet much remainsto be done. Currently, for example, the Privacy
, Protection Study Commission is charged with devel-oping recommendations to the Congress on legisla-tion affecting individual. privacy.
In this paper I will briefly outline legislationwhich is now in effect at the Federal level concern-ing the confidentiality of statistical information.Then I will discuss several principles which I be-lieve should be considered” in the development offuture legislation directed, to the protection of sta-tistical information, The specific legislation which Iwill cover includes:
;:3,4.
5.
6.
7.8.9.
The Federal Reports Act of 1942.Bureau of Census protection.Grime Control Act of 1973.The “research privilege” as provided in thePublic Health Services Act and the Con-trolled Substances Act.Alcohol and Drug Abuse Laws, specificallythe Drug Abuse Office and Treatment Actof 19’72 and the Comprehensive ,AlcoholAbuie~ ~nd Alcoholism Prevention, Treat-ment and Rehabilitation Act AmendmentsAct of 1974.National Center for Health Statistics as cov-ered in the Health Services Research,Health Statistics, and Medical Libraries Actof 1974.Privacy Act of 19’74.Freedom of Information Act.Bureau of Economic Analysis (15 USC 176aand 22 USC 286f(c)).
10. Ceneral rule on disclosure of confidentialinformation applicable to all agencies (18Usc 1905).
Federal Reports Act
The Federal statistical system has long beensensitive to the importance of confidential treat-ment of statistical informa~iog. For example in 1942the Federal Reports Act (44 USC 3501-12) specifi-
229-121 ‘o -77- 13
tally” addressed the importance of confidentiality indata sharing for statistical purposes.
The purpose of the Federal Reports Act is toreduce the Federal reporting burden on the publicby eliminating unnecessary duplication of Federalrequests for information from the public and coor-dinating Federal data collection efforts whereverpossible. In this connection, the sharing of databetween Federal agencies has been viewed as a wayto reduce the need for agencies to collect the sameinformation more than once.
The circumstances specified in the Act forsharing of data between agencies are limited, how-ever, since information can only be released to an-other agency if (a) tie information is released innon-identifiable summary or tabular form; (b) theinformation has not, at the time of collection, beendeclared by the collecting agency or a superior au-thority as being confidential; (c) the respondent hasconsented to the release; or (d) the recipient agencyhas a mandatory authority, with criminal penaltiesfor nonresponse, to collect the same data.
Bureau of the Census
Nearly all observers of statistical systems usethe U.S. Bureau of Census as the outstanding ex-ample of confidential treatment of statistical data,
Title 13 (13 USC 9) includes one of the tightestand well-known confidentiality laws in existence. Itprovides for penalties for inappropriate disclosureof information or use for other than statistical pur-poses. Following the St. Regis Paper Co. case in1961, in which the FTC succeeded in getting filecopies of Census reports directly from the Compa-ny by subpoena, Congress amended the law to pro-tect copies of the documents in company or person-al files from subpoena. The law states:
“Sec. 9. Information as confidential; exception(a) Neither the Secretary, nor any other
officer or employee of the Department ofCommerce or bureau or agency thereof, may,except as provided in section 81 of this title
(1) use the information furnishedunder the provisions of tils title for any pur-
lTl~e 8 provides for individuals’ access to their OWfi
records and is used largely for proof of age when birth cer-tificates or other records are not available.
183 1

pose other than the statistical purposes forwhich it is supplied; or
(2) rn-~e any publication whereby thedata furnished by ~y ‘particular establish-meritor individual under tils title can be identified;or
(3) permit anyone other than thesworn officers and employees of the Depart-ment or bureau or agency thereof to examinethe individual reports:
No department, bureau, agency, officer, oremployee of the Government, except the Secre-tary in carrying out the purposes of this title,shall require, for any rea~on~ copies of censusreports which have been retained by any suchestablishment or individual. Copies of censusreports which have been so retained shall beimmune from legal process, and shall not, with-out the consent of the individual or establish-ment concerned, be admitted as evidence orused for any purpose in any action, suit, orother judicid or administrative proceeding.
(b) The provisions of subsection (a) of thissection relatifi~ to the confidential treatment ofdata for par~dar individuals and establish-ments, shall not apply to the censuses of gov-ernments provided for by subchapter III ofchapter 5 of this title, nor to ;nterim currentdata Drovided for bv subchapter IV of chaDter5 of ~his title as to ~e subje~ts covered by ~en-suses of govermnents, with respect to any in-formation obtained there for &at is compiledfrom or customarily provided in, public re-cords?Today &ere ii ‘genera pubic acceptance and
trust of the Bureau of Census as a truly confidentid’repository of statistical information.
Ctime Controi Actof1973Du~ng the last &ree years .sever~ fi5ws “have-
been Dassed to assure the confidenhd treatment of*information collected for statistid purposes. For.examplel the Crime, Cori~ol Act of 1973, 524(a) of.P:L. ‘93-83, ‘ii% a ,pfotilon tit {titistid and re-search information- collected by he Law Enforce-ment Assistance Administration” ma~ not k used or,!reve~ed in ‘identifiable form, even pursuant to ,sub-~poena. Such ..information * ~.well ti copies, are;mmune for subpoena. The specific’lan~age is:
“Sec. 524. (a) Except as provided by Federal lawother than MIS title, no officer or employee of theFederal Government, nor an~ reciDient of assist-.ante under the provisions of this ti~e shall use or
~reveal any ,resear&. or .statisdd :information fur-?riiihed ,un~~ ,M idde Iby any peison and identil-
,:~84
able to any specific private person for any purposeother than the purpose for which it was obtainedin accordance with this title, Gpies of such infor-mation shall be immune from legal process, andshall not, without the consent of the person fur-nishing such information, be admitted as evidenceor used for any purpose in ‘any action, suit, or oth-er judicial or administrative .proceedings~
LEAA has not developed final regulations asyet. Their proposed regulations (Federal RegisterSeptember 24, 1975, Part II) addresses the ethicalquestion of whether a researcher has a responsibili-ty to disclose information pertaining to unlawfulbehavior if he observes or hears about during theresearch. Similarly, the definition of research (“todevelop, measure, evaluate, or otherwise advancethe state of knowledge in a particular area”) is notspecific enough to be operative, although it m-includes “investigation” per se. Provision is made inthe proposed regulations for the possible transferof data, under controlled conditions, to other re-searchers.
“Research Privilege”
The Secretary of the Department of Health,Education and Welfare and the Attorney Genmalhave been given specific authority to assure protec-tion of data collected in the conduct of research onhealth, drugs, criminal justice and related matters,These “research privilege” provisions are found in:
PubJic Health Sem”ces Act (42 USC 24a(a))commonly referred to as Section 303 (a) ofthe Public Health Services Act, and
Gntrolled Substances Act (21 USC 872(c))commonly referred to as Section 502(c) of theControlled Substances Act.
These Acts confer on the Secretary of HEW .~dddIon the /Attorn~ General respectively the powerto ‘authorize IreSearchers to withhold from all per-soni not connected with the research the namesand other identifying information concerning indi.viduals who are the subject of research, Personswho obtain this “research privilege” “may not becompelled in any Federal, State, or local civil, crimi-nal, administrative, legislative or other proceedingto identify” the subjects of research for which theprivilege was obtained. This authority is discretion-ary and must be exercised specifically by the Secre-tary or Attorney General before it may be applied.
This is the provision which finally protected thephotographs and other research data in the recentNew York methadone maintenance case, People v.Newman.
,4.

Alcohol and Drug Abuse Laws
The Public Health Service is also involved indata collection associated with research into thecauses and treatment of abuse of alcohol and drugs.In addition to the “research privilege” laws citedabove, two recent and nearly identical laws dealwith this subject. They are the Comprehensive Al-cohol Abuse and Alcoholism Prevention, Treatmentand Rehabilitation Act of 1970 (42 USC 4582), asamended by section 122(a) of P.L. 93-282, theComprehensive Alcohol Abuse and AlcoholismPrevention, Treatment, and Rehabilitation ActAmendments Act of 1974 (88 Stat. 131), and theDrug Abuse Office and Treatment Act of 1972 (21USC 11’75), as amended by section 303 of P.L. 93-282 (88 Stat. 13’7). The purpose of these laws andthe regulations issued thereunder is to strike a bal-ance between two conflicting goals: (1) to facilitatethe search for truth through research, scientificinvestigation, or evaluation on the one hand, and(2) to safeguard the personal privacy of the individ-uals who are the intended beneficiaries of the pro-gram under investigation on the other hand.
The regulations (Federal Register, Vol. 40, No.127, July 1, 1975, Part IV) provide for access toprogram data without unnecessary bureaucraticimpediments for research and evaluation withoutsecuring the patient’s consent, but only under con-trolled conditions designed to protect the data frommisuse and disclosure. They also contain a gooddiscussion of the conceptual basis for requiring in-formed consent for certain disclosures. The Actsprovide that original program records may be sub-poenaed—but only after the courts have evaluatedthe need for the disclosure against the potentialinjury to the patient, the physician-patient relation-ship; and the effectiveness of the treatment services.However, secondary users of identifiable recordsincluding researchers and evaluators, may not berequired to disclose the identity of patients evenunder subpoena.
The important parts of the laws for our pur-poses state that:
“3408 Confidentiality of Patient Records
(a)records of the identity, diagno-sis,prognosis or treatment of any patient whichare maintained in connection with the perform-ance of any drug abuse prevention function(alcoholism or alcohol abuse education, train-ing, treatment, rehabtiltation, or research)which is conducted, regulated, or directly orindirectly assisted by any department or agencyof the United States shall, except as providedin subsection c, be confidential, and be dis-closed only for the purposes and under the cir-
cumstances expressly authorized under subsec-tion (b) of this section.
(b)(l) the content of any record re-ferred to in subsection (a) may be disclosed inaccordance with the prior written consent ofthe patient...
(2) whether or not the patient ... giveshis written consent, the content of such a re-cord may be disclosed as follows:
A. To medical personnel to theextent necessary to meet a bona fide medicalemergency
B. To qualified personnel for thepurpose of conducting scientific research, man-agement audits, financial audits, or programevaluation, but such personnel may not identi-fy, directly or indirectly, any individual patientin any report of such research, audit, or evalu-ation, or otherwise disclose patient identities, inany manner.
C. If authorized by an appropri-ate order of a court of competent jurisdic-tion .... In assessing good cause the court shallweigh the public interest and the need for dis-closure against the injury to the patient, to thephysician-patient relationship, and to the treat-ment services. ... The court shall impose appro-priate safeguards against unauthorized disclo-sure. Except as authorized by a court order ...no record may be used to initiate or substanti-ate any criminal charges against a patient or toconduct any investigation of a patient.
(c) except as authorized by a court ordergranted under subsection (b)(2)(C) of this sec-tion, no record referred to in subsection (a)may be used to initiate or substantiate anycriminal charges against a patient or to conductany investigation of a patient.”
National Center for HealthStatistics
Nearly all in attendance at the Conference arefamiliar with the functions and procedures ofthe National Center for Health Statistics.Recently, the Health Services Research, HealthStatistics, and Medical Libraries Act of 1974(section 308 (d) of P.L. 93-353), specificallyaddressed the confidential protection of NCHSdata. The confidentiality of the informationcollected or obtained by the National Centerfor Health Statistics is protected by this Actfrom use other than that for which it was sup-plied “unless- authorized under regulations ofthe Secretary” of HEW. The HEW lawyers in-terpret the law as providing immunity fromsubpoena without consent of the data subject.
185

I
The specific wording is:“(d) No information obtained in the course ofactivities undertaken or supported under sec-tion 304, 305, 306, or 307 may be used for anypurpose other than the purpose for which itwas supplied urdess authorized under regula-tions of the Secretary; and (1) in the case ofinformation obtained in the course of healthstatistical activities under section 304 or 306,such information may not be published or re-leased in other form if the particular establish-ment or person supplying the information ordescribed in it is identifiable unless such estab-lishment or person has consented (as deter-mined under regulations of the Secretary) to itspublication or release in other form, and (2) inthe case of information obtained in the courseof health services research, evaluations, ordemonstrations under section 304 or 305, suchinformation may not be published or releasedin other form if the person who supplied theinformation or who is described in it is identifi-able urdess such person has consented (as de-termined under regulations of tie Secretary) toits publication or release in other form.”There are as yet no regulations or proposed
regulations under this law.
The Privacy Act of 1974
Recent attention on the protection of recordswas broadly codified in the Privacy Act of 1974 (5USC 552a).
The Privacy Act requires agencies: (a) to collectonly that information necessary to performagency functions; (b) to publish descriptions ofexisting data systems so the public can learnwhat records are maintained by the agency; (c)to inform individuals at the time of data collec-tion whether the request is mandatory or vol-untary, the legal penalties for nonresponse,
and the uses of the data; (d) in most cases topermit individuals to examine their recordsand to challenge the accuracy thereofi (e) toinsure that the records are sufficiently accuratefor agency purposes; and (f) to observe certainminimal standards of disclosure of the records.The general rule on disclosure of identifiable
records about individuals is that the agency mustobtain informed consent from the data subject foreach disclosure. However, eleven exemptions to thisrule permit disclosure without informed consent.The exemptions include, among others: (a) to offi-cers of the agency to perform their proper func-tions; (b) when required by the Freedom of Infor-mation Act; (c) as a “routine use” described as a usewhich is compatible with the p“urpose for which theinformation was collected; (d) to law enforcement
agencies; (e) to the GAO and to committees ofCongress; (f) pursuant to a court order (subpoena);and (g) to the Census Bureau for statistical purpos-es. These disclosures are permissive and do notoverride more restrictive laws forbidding such dis-closures.
The Freedom of InformationAct (FOIA)
Statistical agencies concerned with the protec-tion of data must also consider the impact of theFreedom of Information Act (5 USC 552).
The purposes of this Act are basically to fosterdisclosure of agencies’ records to the public upon’request. Even within this environment, however,Congress recognized the wisdom of maintainingsome information confidential. For our purposes,the relevant passages which appear in subsection (b)permit agencies to withhold matters which are—
“(3) specifically exempted fromdisclosure by statute;(4) trade secrets and commercial orfinancial information obtained from aperson and privileged or confiden-tial; ...(6) personnel and medical files andsimilar files the disclosure of whichwould constitute a clearly unwarrantedinvasion of personal privacy,”
Exemption (3) recognizes that certain informs.tion (e.g., ‘Census information collected under TitIe13) has- received specific Congressional exemptionbecause it is especially sensitive or because confiden-tiality is required in order to obtain public cooDera-,tion: This information may not be released by anagency under FOIA.
Exemption (4) deals primarily with businessrecords. Case law has developed to bring under thisexemption that information which would result insignificant competitive injury to the company orthe disclosure of which would impair the Govern-ment’s ability to obtain the necessary information inthe future. “
Exemption (6) deals with information aboutindividuals. Recent interpretations differ as towhether, on balance, a significant public use of theinformation would warrant a significant invasion ofprivacy under the Act. -
Bureau of Economic Analysis
Statistical data collected by the Bureau of Eco-nomic Analysis of the Department of Commerce isprotected by two provisions, section 176a of Title
186

15, United States Code, and section 286f(c) of Title22, of the Code.
The former, which is very broad, pertains to“any statistical information furnished in confidenceto the Bureau: and provides that it “shall be heldto be confidential, and shall be used only for thestatistical purposes for which it is sttpplied.” It isinterpreted as protecting the individud companydata collected by BEA from subpoena. The specificlanguage is:
“Any statistical information furnished in con-fidence to the Bureau of Foreign and DomesticCommerce (now covers BEA) by individuals,corporations, and firms shall be held to beconfidential, and shall be used only for the sta-tistical purposes for which it is supplied. TheDirector of the Bureau of Foreign and Domes-tic Commerce shall not permit anyone otherthan the sworn employees of the Bureau to
“ examine such individual reports, nor shalI hepermit any statistics of domestic commerce tobe published in such manner as to reveal theidentity of the individual, corporation, or firmfurnishing such data.”
The confidentiality of certain information oninternational transactions collected to satisfy a datarequest by the International Monetary Fund is pro-tected by subsection 286f(c) of Th.le 22, UnitedStates Code (Bretton Woods Agreements Act). Thatportion of the Code gives the President the authori-ty for mandatory collection of such data and pro-tects the data from disclosure (except in the courseof official duty), and from its use to the personalbenefit of an official, As stated, the law applies toany agency designated by the Director of the Officeof Management and Budget under Executive Order10033 to collect the data. Both the Treasury andCommerce Departments use the mandatory author-ity and confidentiality provisions of this law to gath-er data on international investment, financial trans-actions, and other activities which comprise our bal-ance of payments and international investment po-sition accounts.
The specific language is:
“It shall be unlawful for any officer or employ-ee of the Government, or for any advisor orconsultant to the Government, to disclose, oth-erwise than in the course of official duty, anyinformation obtained under this section, or touse any such information for his personal ben-
. efit. Whoever violates any of the provisions ofthis subsection shall, upon conviction, be finednot more than $5,000, or imprisoned for’ notmore than five years, or both.”
General Rule on Disclosure ofConfidential InformationApplicable to All Agencies
This law (18 USC 1905) imposes penalties on,and removal from office of, any Federal official oremployee who “publishes, divulges, discloses ormakes known in any manner or to any extent notauthorized by law... confidential statistical data.” Itprovides insufficient protection for statistical infer-.mation. For example, many disclosures to otherswithin an agency performing regulatory, investiga-tive, or substantive program administration func-tions are “authorized by law.” In addition, informa-tion which is discoverable in civil suits under Feder-al Rules of Civil Procedure may not be withheldunder this provision. It does not prevent disclosurerequired or permitted under the Freedom of Infor-mation Act. It does, however, apply to unauthor-ized disclosures of information, and forms a basicminimum standard to be met. The specific wordingof the law is as follows:
“Whoever, being an officer or employee ofthe United States or of any department oragency thereof, publishes, divulges, disclos-es, or makes known in any manner or toany extent not authorized by law any in-formation coming to him in the course ofhis employment or official duties or by rea-son of any examination or investigationmade by, or return, report or record madeto or filed with, such department or agen-cy or officer or employee thereof, whichinformation concerns or relates to thetrade secrets, processes, operations, styleof work, or apparatus, or to the identity,confidential statistical data, amount orsource of any income, profit:, losses, orexpenditures of any person, firm, partner-ship, corporation, or association; or per-mits any income return or copy thereof orany book containing any abstract or parti-culars thereof to be seen or examined byany person except as provided by law;shall be fined not more than $1,000, orimprisoned not more than one year, orboth; and shall be removed from officeor em-ployment.”
This is not intended to be an exhaustive list ofFederal confidentiality statutes, but will provide thereader with examples of many of the importantones. Several other agencies have such laws inplace, and additional statistical and research agen-cies are in the process of developing their own laws.
For example, the Export Administration Act
(Export Statistics - 50 App. USC 2406) providesthat identifiable export data shall be treated as con-
187

fidential except as the head of a department oragency determines that withholding the data is con-trary to thF national interest. Thus, under this Actthe Secretary of Commerce could release exportdocuments held by Census irrespective of the provi-sion of confidenti~ty contained in 13 USC 9. Thelanguage is as follows:
“Disclosure of confidential information
(c) No department, agency, or official exer-cising any functions under this Act (sections2401 to 2413 of this Appendix) shall publish ordisclose information obtained hereunder whichis deemed confidential or with reference towhich a request for confidential treatment ismade by the person furnishing such informa-tion, unless the head of such department oragen,cy determines that the withholding thereofis contrary to the national interest.”Hence, there are a variety of specific statutes
which are designed to assure the confidential treat-ment of data and related information.
A Look to the-Future
Finally, I would like to conclude by settingforfi some principles which I believe are importantfor the statistical system in the years ahead.
This is a brief summary of material which Idiscussed at greater length at the luncheon meetingof the Social Statistics Section of the American Sta-tistical Association at the 19’75 Annual Meeting intils same city in August of last year.z While I knowthat some of you are familiar with that paper in itsentirety, let me highlight a few of the basic princi-ples which were presented at that time since theymay be useful as you address various issues duringthe balance of this Conference. I believe there areseveral principles which should be pursued in the
future development of the U.S. Statistical System.
These are:1. Statistical agencies should have mandated
legislative protection for the confidentiality of infor-mation collected solely for statistid purposes. Thisshould apply to both corporate and personal data.The element of trust which is involved in voluntarysubmission of data should be backed up by clearlymandated protections so there is no uncertaintyconcerning the confidential nature of the data sub-mission, and so that voluntary data collection pro-grams are effective. Even in mandated data collec-tion efforts, is is essential to have cooperation of
ZThe full paper “confidentiality and the Future of
the U.S. Statistical System” was published in American Sta-tistical, Vol. 30, Number 2, May 1976, pp. 54-59.
respondents if the data submission is to be accurateand comprehensive. Protection from disclosureshelps assure that the quality of submission is of thehighest possible order.
The HEW report suggests the following fea-tures for protection against compulsory disclosure:
“The data to be protected should be limb-ed to those used exclusively for statisticalreporting or research. Thus, the protec-tion would apply to statistical reportingand research data derived from adminis-trative records, and kept apart from them,but not to the administrative records them-selves.
“The protection should be limited to dataidentifiable with, or traceable to, specificindividuals. When data are released in sta-tistical form, reasonable precautions toprotect against ‘statistical disclosure’ shouldbe considered to fulfill the obligation notto disclose data that can be traced to spe-cific individuals.
“The protection should be specific enoughto qualify for nondisclosure under theFreedom of Information Act exemptionfor matters ‘specifically exempted fromdisclosure by statute.’5 USC 552(b) (3).
“The protection should be available fordata in the custody of all statistical report-ing and research systems whether support-ed by Federal funds or not.
“Either the data custodian or the individu-al about whom data are sought by legalprocess should be able to invoke the pro-tection, but only the individual should beable to waive it.
“The Federal law should be controlling; noState statute should be taken to interferewith the protection it provides.”s
2. The uses of statistical data must be restrictedto prevent their use in identifiab~e form for makingdeterminations which affect a particular respon-dent. While this is partially covered in the first prin-ciple, it should be explicit that the confidentiality ofthe statistical data means that these data sets are notavailable for other regulatory, administrative, orjudiciaI purposes within the same agency or depart-ment collecting the data. Hence, environmental
sR~pOrt of the secretary’s Advisory Committee on
Automated Personal Data Systems, U.S. Department ofHealth, Education, and Welfare, U.S. Government Print-ing Office, July 1973 (Stock Number 1700-001 16),
188

data collected for statistical purposes should not beused for regulatory purposes. The distinction be-tween regulatory and statistical uses must be madeclear at the outset, and there must be no possibilityof divergence in these uses. In effect, statistical datain statistical agencies would be placed in a “protect-ed enclave.”
3. Exchange of data among the “protected en-claves” should be feasible under controlled condi-tions. Comprehensive data systems concerning theinterrelationships among various aspects of socialand economic patterns requires that various datasets be combined and studied jointly. Once theprinciple is set forth that the data will only be usedfor statistical purposes, there should be no concernabout the exchange of information among statisticalagencies which have “protective enclave” status inlaw and position to assure confidentiality to providefor data enrichment and correlation analyses.
This principle for statistical data systems is byfar the most controversial, especially among thoseindividuals who wish complete knowledge and con-trol of uses of data pertaining to them held by Fed-eral agencies. For the long-range development t ofsound statistical information or social processes,however, I believe it is essential.
The first step in achieving this situation is thedevelopment of a clear legal status for “protectedenclaves” for selected statistical agencies in themajor departments. The statistical agency must befree of intervention in terms of unauthorized accessto. data. Employees should be subject to strict ethi-cal standards established with respect to data han-dling. Once the individual, has agreed to provideinformation for statistical purposes, there should bea mechanism for transferring identifiable dataamong such agencies under controlled conditions.At a minimum ti]s requires:
a.. A statement at the time of data collec-tion about the general character of potentiaf statisti-cal uses;
b. A review agency that has power to au-thorize transfer;
c. A clear set of criteria that specify whentransfer of identifiable data would qualify as beingof sufficient public interest to justify the transfer;and
d. A set of procedures to provide for re-moval of identifiers or destruction of tie basic datafiles after the basic purposes of the transfer havebeen achieved.
David Hulett has identified some uses whichmight tend to demonstrate a sufficient public inter-est to justify a transfer. These are:
“To avoid an increase in the burden on thepublic in reporting duplicate information totwo different agencies. This principle under-
lies the Federal Reports Act. In addition, a
Federal Paperwork Commission will soon beestablished to study ways to reduce the bur-den on the public of Federal request forinformation. In its deliberations, the Com-mission will consider the guarantee ofappropriate standards of confidentiality aswell as the need of the Government for in-formation. The sharing of data betweenagencies may well be an important item onthe Commission’s agenda since, in some cas-es, the transfer of identifiable informationamong agencies largely eliminates the needto collect further data.
“To ensure the accuracy, timeliness, andconsistency of major statistical or researchreports. In some cases, several agencies col-lect data which are logically related (e.g.,production and prices or income and occu-pation) and must use consistent samplesdrawn from the same universe for their datato be related. In most cases, the data whichare finally published are collected directlyfrom the respondents.
“To utilize data not obtainable from othersources. In retrospective studies of health or .work history, for instance, a given set ofdata maintained by another agency is simplythe only source of information.”4
4. Administrative data sets should be ac-cessible to statisticians in “protected enclaves” forsome statistical uses unrelated to the original datacollection. In certain cases statistical agencies needto use administrative records for establishing sam-ple frames for verifying the total universe charac-teristics. Identifiable data extracted from adminis-trative records for statistical purposes should beheld confidential by the statistical agency which re-ceives them in the same manner that data collecteddirectly from the respondent are held confidential.In essence, this suggests the creation of a “protect-ed data set” composed of those items derived fromadministrative sources for use in the “protected en-clave.” Thus, subpoena and other access to the orig-inal identifiable data would “be through the originaladministrative submission, not through the statisti-cal agency. At the same time, the controlled ex-change of data extracted from administrative re-cords among statistical agencies would not be re-stricted further than the process defined in 3 above,would imply.
qDavid T. Hulett, “Confidentiality of Statistical andResearch Data and the Privacy Act of 1974; StatisticalReporter, June 1975, p. 203.
189
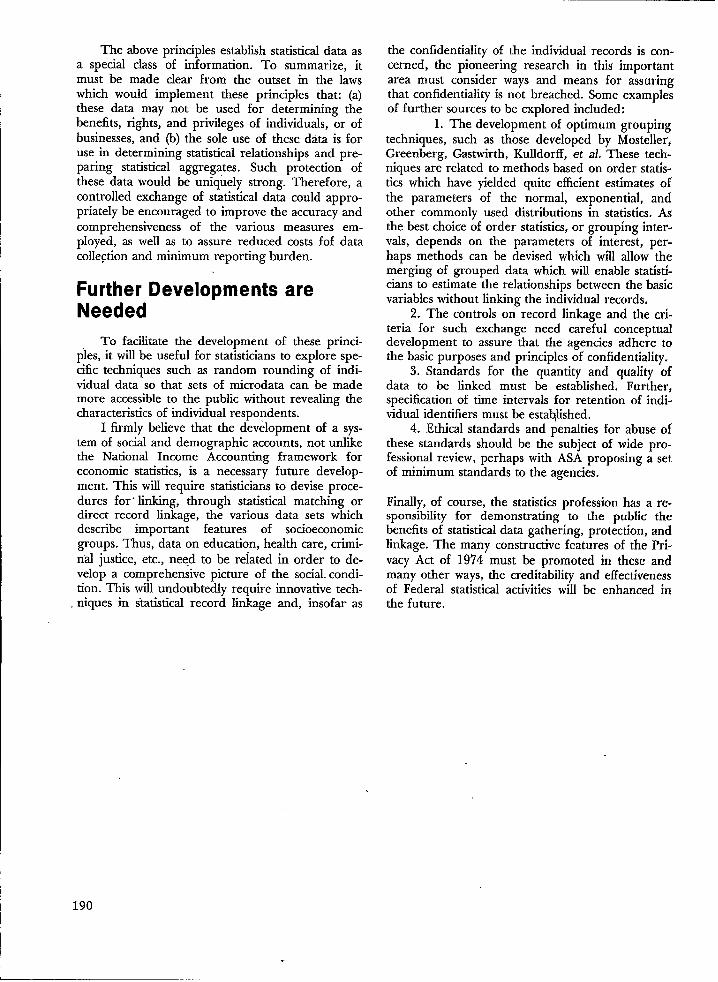
The above principles establish statistical data asa special class of information. To summarize, itmust be made clear from the outset in the lawswhich would implement these principles that: (a)these data may not be used for determining thebenefits, rights, and privileges of individuals, or ofbusinesses, and (b) the sole use of these data is foruse in determining statistical relationships and pre-paring statistical aggregates. Such protection ofthese data would be uniquely strong. Therefore, acontrolled exchange of statistical data could appro-priately be encouraged to improve the accuracy andcomprehensiveness of the various measures em-ployed, as well as to assure reduced costs fof datacolle~tion and minimum reporting burden.
Further Developments areNeeded
To facilitate the development of these princi-ples, it will be useful for statisticians to explore spe-cific techniques such as random rounding of indi-vidual data so that sets of microdata can be mademore accessible to the public without revealing thecharacteristics of individual respondents.
I firmly believe that the development of a sys-tem of social and demographic accounts, not unlikefie National Income Accounting framework foreconomic statistics, is a necessary future develop-ment. This will require statisticians to devise proce-dures for’ linking, through statistical matching ordirect record linkage, the various data sets whichdescribe important features of socioeconomicgroups. Thus, data on education, health care, crimi-n’al justice, etc., need to be related in order to de-velop a comprehen;lve picture of the social. condi-tion. ~ls. will undoubtedly require innovative tech-
, niques in statistical record linkage and, insofar as
the confidentiality of the individual records is con-cerned, the pioneering research in this importantarea must consider ways and means for assuringthat confidentiality is not breached. Some examplesof further sources to be explored included:
1. The development of optimum groupingtechniques, such as those developed by Mosteller,Greenberg, Gastwirth, Kulldorff, et al. These tecl-t-niques are related to methods based on order statis-tics which have yielded quite efficient estimates ofthe parameters of the normal, exponential, andother commonly used distributions in statistics, Asthe best choice of order statistics, or grouping inter-vals, depends on the parameters of interest, per-haps methods can be devised which will allow themerging of grouped data which will enable statisti-cians to estimate the relationships between the basicvariables without linking the individual records,
2. The controls on record linkage and the cri-teria for such exchange need careful conceptualdevelopment to assure that the agencies adhere tothe basic purposes and principles of confidentiality.
3. Standards for the quantity and quality ofdata to be linked must be established. Further,specification of time intervals for retention of indi-vidual identifiers must be established.
4. Ethical standards and penalties for abuse ofthese standards should be the subject of wide pro-fessional review, perhaps with ASA proposing a setof minimum standards to the agencies.
Finally, of course, the statistics profession has a re-sponsibility for demonstrating to the public thebenefits of statistical data gathering, protection, andlinkage. The many constructive features of the Pri-vacy Act of 1974 must be promoted in these andmany other ways, the creditability and effectivenessof Federal statistical activities will be enhanced inthe future.
190

APPROACHES TO MAINTAINING CONFIDENTIALITY IN SHAREDDATA SYSTEMS
Mr. George D. Tipp, Jr., Hospital ServiceDayton, Ohio.
Large quantities of private information are pre-sently being accumulated in computer files. Concur-rent with this accumulation is the steady growth ofinterest and the development of data sharing. It isgenerally recognized that the benefits of such pool-ing, or banking of data (accuracy and timeliness)can be best accomplished through the pooling ofcomputer processing resources. There is thereforean increasing momentum toward the use of highlyspecialized computer centers, (or service bureaus) toprovide this service. These computer centers, bothprivately owned or public agencies, provide the re:sources for the accumulation of data from severalsources, processing of the data, (encoding, editing,correcting and reporting) and the capability tocombine the data into a common pool (or databank). This pool of data is then made available forvarious authorized purposes.
As these shared data systems grow and the ac-curacy and reliability of the data increases, the initia-tive to penetrate the traditional safeguards of com-puter centers will likewise increase. Shared comput-er systems constantly adapt new procedures to keeppace }vith the value of the information processed.We must always be alert to those situatons wherethe reward to breach existing security of a systemwill be greater than the deterrant.
We have found over the years that the existinglegal protections have proven to be inadequate toprotect even noncomputerized information. It isvery unlikely that they will be much better with tra-ditional computerized systems, much less shareddata systems. Computer centers approach confiden-tiality of information as the responsibility of theholder of the data (i.e. the computer center) andconsider that it is their responsibility to providenecessary security measures.
Since no real identifiable legal controls existthat will prdvide total protection of data in sharedsystems, we can only adapt those procedures whichwill meet the requirements of sound business prac-tice, those which have proven effective in similarenvironments and those that are specifically re-quired by the individuals and entities to whom weare ultimately responsible. Shared data systemsmust be extremely careful that they do not inadver-tently or accidentally give away confidential infor-mation,
It is also important to operate in such a way asto assure the integrity of the data obtained in theperformance of its activity, that is, to provide those
Representative, McDonnell-Douglas Company,
protections to assure that the data has not changed,through accidental or intentional but unauthorizedmodification. Further, a shared data system mustassure that authorized persons are the only oneshaving access to and receiving data or information.
A shared data system, although it may be oper-ated by a service bureau, is unique in that it pro-vides for the pooling of data supplied by severalclients or sources. It is this distinction which re-quires the organization to undertake additionalefforts to assure confidentiality. The amount ofprotection undertaken in this direction is of specialconcern, for it is the potential abuse to which thesevast amounts of data can be put that are frighten-ing. Careful attention and concern is directed tothose required and necessary procedures to insurethat data collected does not become available topersons not specifically authorized. How do shareddata systems protect privacy and confidentiality?
SECURITY FOR COMPUTERSYSTEMS -
The shared data system, as any computer cen-ter, must develop and carry out a basic computersecurity program: This prog;am includes -
(1)
(2)
(3)
the careful selection of an appropriatecomputer site.
controlled access to the physical facilitiesand to the computer, and
internal operating procedures to be fol-lowed in the processing, handling, storageand retrieval of data.
SITE SELECTION
Some of the key factors in such a selectionevolve around the need to avoid natural and physi-cal disasters and civil disturbances. (Natural forces,such as flooding, earthquakes, hurricanes or storms,hazards from external explosions and aircraft, andpotential damage from environmental and electro-magnetic interference) “
191
.

ACCESS CONTROLS
A. Entrances and Em”sts to the BuildingThe exterior of the building and parking lots
should be well lighted. There should be well lightedoutside exists and entrances. There should be con-trol over the entry and exit of employees and visi-tors to the building.
B. Access to the Computer DepartmentThere should be an ID system for departmen-
tal employees and for other employees of the com-puter center. A visitor log and visitor escort shouldbe standard procedure.
PROGRAMMING CONTROLSAND OPERATING
PROCEDURE
Internal operating procedures for the process-ing, handling, storage and retrieval of data providethe required controls and audit detection features.These procedures include the separation of EDPduties and the use of programming controls to as-sure complete documentation of program revisionsand of data correction, addition andlor deletion.The computer operating, processing and documen-tation controls are intended to:
A. Detect and prevent accidentd errors fromhappening during processing.
Established control procedures insure dat% iscomplete, accurate and authorized when receivedfor processing. Uniform procedures should be usedfor ‘dl oDera~ons and should be reviewed ~eriodi-, ,tally to assure that ordy approved procedures are-being followed. Established procedures are used to
- insure that the correct files are mounted, switchesare set correctly and output files are properly allo-cated.
B. Detect fraudulent manipulation of data dur-ing processing and pre;ent misuse of classi-fied information.
The separation of the data source, the data use,and data processing sections of the data centershould be maintained. Controls likewise should bemaintained over the individual functions within thecomputer department.
C. Provide security against accidental destruc-tion of records and for continous oDeration.
Standard procedures to detect acciden’ml errorscaused by operator error, machine failure, or pro-mam malfunction should be well established. Amethod for reconstructing files after processingerrors or the destruction of records must be provid-ed. The comuuter taDes and disk files should bephysically saf;guarde~ and a plan should exist toensure continuity of operation after major destruc-tion of files or hardware breakdown.
D. Ensure the accuracy of data processed.There should be procedures ‘to ensure that
data is transmitted accurately to the computer cen-ter, that the computer equipment is functioningcorrectly, and that all malfunctions and resultingdata errors are detected and corrected before fur-ther processing. Procedures must assure that onlyvalid files are used, and balancing controls must beused to ensure that the accuracy of data is main-tained during processing. There should be a systemof control over the physical operation of the com-puter system - procedures to ensure that all signifi-cant errors have been identified at various stages inthe system have been corrected, reentered, an> areproperly reflected in the output. There should beprocedures to ensure that all required output re-~orts are delivered only to the autfiorized pe;son.
E- Develop and maintain adequate audit trails.There must be a method of identifying and
locating the component file records of each user ofthe shared data system and the related input/outputdocuments involved in the processing o~ the indi-vidual transaction and in the accumulation of thetotal file.
F. All instructions to all data processing and aJluser personnel should be completely andclearJy documented.
There must be a method bv which com~uter,operators have available to them all information.required to perform their responsibilities, Thereshould be a procedure ensuring that all informationnecessary for a complete understanding of filemaintenance and file protection is available. All in-formation required by persons responsible for con-trolling input to output from a computer must beavailable.
These basic procedures for computer securityare by no means all-inclusive. They only scratch thesurface of a very intricate subject on which bookshave been written. I must point out that these coveronly the physical aspects of a computer center oper-ation and as such deal with structure. These proce-dures unless followed by loyal, dedicated, dependa-ble employees will be just that, procedures. It hasbeen often stated that: no set of operational prac-tices and procedures has been developed that cannot be subverted or betrayed by key andlor trustedemployees, regardless of the number of safeguardsthat may be installed, be they the utilization of themost up-to-date electronic devices, control of accessto restricted areas, dosed circuit television cameras,a disciplined ground force, or other means. Thebasic security of a computer center and the confi-dentiality of the data files is no better than the in-tegrity of the employees who work there, In ashared data system there must be a basic relianceon -@e integrity of the employeps. Appropriate .steps are required to protect the computer center
192
,

and the data files from employee misuse. This startswith the careful recruitment and hiring of employ-ees.
The basic aims of personnel policy of computercenters are:
● to recruit dependable and stable employees● to ensure that the employees continue to be
persons of integrity and;● to keep before these employees the knowledge
that management relies on them to preservethe integrity of the computer center.
Employees are asked to sign a statement that ad-vises them that “they will have access to confidentialinformation and that they are expected to keep itthat way.” When an employee leaves and takes anew job, he is likewise requested to sign a pledgethat he has no company property such as computerfiles, programs or any other type of company pro-perty.
The personnel policies of computer centers in-clude procedures designed to deal with such situa-tions as: problem employees, employees with per-sonal problems, employees with indications of insta-bility and appropriate termination procedures.
PROCEDURES FOR ACCESSAND USE OF SHARED DATA
As has already been pointed out, the uniqueaspect of a shared data system, not normal for oth-er computer operations, is the responsibility to safe-guard and protect the confidentiality and integrityof the combined data pool. Separate policies andprocedures are required for this purpose to re-spond to such questions as:
● What data will be made available?. Who shall have access to the data?● What special conditions must be met before
data ars available? .● How are requests for data to be processed?● Who has authority to release data?
Uncontrolled and decentralized handling offiles will expose the shared data system to the riskof accidental or intentional disclosure of data, andthe potential for a loss of confidentiality and]or in-tegrity of the data file.
The basic underlying authority and responsibil-ity for the use and release of data or informationshould be clearly set forth in the agreements whichresulted in the formation of the common data files.These agreements or contracts should contain prov-isions for the assignment of authority and/or anyrestrictions on the subsequent use of the data, its
destruction, its retention, its reproducibility andreleasability, if applicable. -
The following are samples of such provisionsfor formation of a shared data file:
(Data Provider) authorizes incorporation of thedata furnished by (Data Provider) as a result of thisagreement in the (Shared) data bank. This data fileis to be used by (Shared) and others for statisticalresearch concerning subject to the confi-dentiality provisions of this agreement. (Shared)agrees that, unless specifically directed by (DataProvider), itwill not “divulge the name of (DataProvider) nor in any other way cause the identity of(Data Provider) to be disclosed in any reports orpublications or other manner.
The shared data system policies should containexplicit procedures for the internal and externaluse and release of the data in accordance with thecontractual agreements. These procedures shouldcontain provisions for:
● Data Classification● Accountability● Releasability● Destruction● Reproduction
The wording and content of these policies mustbe such that they can be uniformly and consistentlyapplied to the many requests for data.
Of concern to those who operate shared datasystems is the ever present need to use or furnish toothers data that can be considered private or confi-dentially sensitive. These data may be vital to thesuccess or failure of a specific study and thereforetheir presence is critical. Cryptographic techniquesare being used successfully to permit the use ofsuch data. These techniques can also be used forsensitive data stored for in-house files. Crypto-graphic techniques result in disguising standarddata with codes which do not resemble the initial‘data. Through this method, a high degree of secre-cy can be obtained for the protection of con fiden-.tiality at a very low cost. The main advantage is thatthe original identity is lost and can not be regainedwithout the expenditure of considerable resources.The keys to the codes are retained by the origina-tor, for future reference.
SUMMARY
In the final analysis, the shared data system haslittle choice but to employ whatever means seemreasonable to protect the computer facilities, thecomputer, the data files and the confidentiality ofits clients, limited only by practical application andcost. To do otherwise would be to jeopardize thevery existence of the system and those who havefurnished the information.
193

VALIDATION .OF HEALTH MANPOWER DATAI
Donald E. Yett, Ph.D., Director, Human Resources Research Center and Professor of Eco-nomics and of Community Medicine and Public Health, University of Southern California,Los Angeles, California .
lntroduction2
I The involvement of the National Center forHealth Statistics (NCHS) in health man~ower data
A
collection, analysis, and dissemination is a relativelyrecent development. As was explained by GarrieLosee:
The res~onsibiliti for health man~ower‘ , .
supply inventories was transferred fromthe Bureau of Health Manpower (BHM) toNCHS over a year ago, but as yet, we havenot completed a national data collectionfor any health profession. (The one excep-tion to that was an inventory of podiatristsconducted in 1974, for which there was noreliable comparative data.) Also. we arejust beginnin~ to get data ;apes f;om Statehealth manpower inventories in the Coop-erative Health Statistics System (CHSS). Todate, the only quality checking we aredoing is to obtain item response rates andthe percent of responses which are accept-able from a computer edit run . . . . Weplan to verify and cross-clfeck the CHSSinventory against other lists and sources ofmanpower data.
In view of “these plans, it should be of interestto review the efforts &at have been made to ascer-tain the accuracy of existing health manpower data.In all likelihood, some of the existing series will beabsorbed into the CHSS system, while other willserve as checks on’ the accuracy of the data collectedvia the CHSS system. Accordingly, I propose tosummarize and review the established systems forcollecting basic manpower data on the three majorskilled health professions—physicians, dentists, andregistered nurses. Due to time limitations, only theprocedures used to establish and verify the total;umber of such professionals in different areas willbe discussed. Th;s, the focus here is on the meth-ods of conducting and verifying the accuracy ofwhat are supposed to be as nearly as possible com-plete counts. A similar review of the sample surveys
I*The author ~ou]d tike to thank Kathryn LangWe]*
for her assistance in assembling the material reportedhere. Dr. Leonard Drabek reviewed the material andmade helpful suggestions.
qThe material summarized in this section was provicf-ed by Garrie J. Losee, Division of the Cooperative HeaIthStatistics System, National Center for Health Statistics, andwas taken from his letter to me of June 1, 1976.
194
commonly employed to obtain information onhours of work, incomes, and related demographicand socioeconomic data would also be valuable.t
Physicians
The American Medical Association (AMA)opens a file on each physician at the time of his orher entry into medical school. This file contains:medical school, year of graduation, sex, birth date,birth place, citizenship and visa data, geographiclocation, specialty, type of practice, professionalemployment, specialty societies, board certification,Iicensure data, place of postgraduate medical train-ing (past and present), government service (pastand present), and various membership data, Filesare opened on foreign medial school graduates(FMG’s) at the time they enter the U.S. medical caredelivery system. Information on the status of FMG’sis obtained from teaching hospitals, ECFMG results,and State Iicensure boards. Any discrepanciesamong these three sources are resolved by conduct-ing followups. Any FMG who is in the U,S, but notin a hospital training program, not State licensed,andlor who has not been assigned an ECFMG Cer-tificate number ‘is excluded from the AMA Master-file.5
As the physician’s training and career develops,additional data on his or her internship and resi-dency training, licensure, board certification, pro-fessional affiliation and other characteristics are ob-tained from medical schools, hospitals, licensingboards, medical societies, specialty societies and
3For a detailed summary and critical review Of suchdata on nurses for the period 1929-1970, see: Donald E,Yett, Data Source Book for an Economic Analysis ofNurse Supply and Demand (Springfield, Virginia: Nation-al Technical Information Service, 1974).
lThe material for this section was supplied by Barry
S. Eis~nberg and Louis J. Goodman, Center for HealthServices Research and Development, American MedicalAssociation.
51ndividua]s who fal] in this category have been said
to constitute a “medical underground.” (For a discussionof this problem see: Robert J, Weiss, et. al,, “Foreign Med-ical Graduates and the Medical Underground ,“) New Eng-land Journal of Medicine, CCXC (June 20, 1974), pp,1408-1413; and American Medical Association, Center forHealth Services Research and Development, “ProposedArticles and Tabulations on Foreign Medical Graduates byRobert Weiss, M.D., et al.—A Reviewfl May 16, 1974,(Processed.)
1

boards, ECFMG, National Board, and the SurgeonGenerals of the Armed Forces, VA, and the U.S.Public Health Service. After being checked, in mostcases, against at least two separate sources, this in-formation is added to the Masterfile. The currentportion of each physicians entry in the Masterfile(address, specialty, professional activity and employ-ment status) involves variables which may changeand, therefore, should be closely monitored andupdated. The means for doing this is provided bythe Physicians’ Professional Activity (PPA) question-naire, which is utilized to conduct censuses of thephysician population.
The PPA questionnaire was first tised in 1968in a survey of approximately 325,000 physicians.Eighty-seven percent of those surveyed respondedafter five mailings. The returned questionnaireswere examined through a series of clerical editingprocedures and quality control checkpoints beforedata were entered onto the individual physicianrecords. In order to verify the information gath-ered in 1968, another PPA census was conducted in1969. Comparisons of the two sets of data revealedthat they were consistent, indicating that the surveyinstrument and the processes used are reliable.G
Between the PPA surveys a weekly updatingsystem is used to keep the Masterfile current. Infor-mation from AMA ma~ings, correspondence, hospi-tals and other sources which suggests that a physi-cian has changed his or her address automaticallycauses an update questionnaire to be sent to theM.D. In 19’75, approximately 3,500 PPA updatequestionnaires were sent out each week. These arevigorously followed up both by correspondence withnonrespondents and other sources (e.g., medicalsocieties, hospitals, the postal system, etc.). Thesame procedure is followed for both AMA membersand nonmembers.
Evidence of the success of the AMA’s proce-dure for identifying and updating information onall physicians was provided by a comparison of the19’72 year-end updated Masterfile data with the19’73 PPA census.y This comparison showed thesame level of consistency as did the comparison ofthe 1968 and 1969 PPA censuses.
In 1971, a Health Services and Mental HealthAdministration (HSMHA) committee established toevaluate NCHS recommended that the accuracy of
GCOmPariSonof the 1969 PPA survey results with
data on numbers of physicians from the 1970 Decennial’Census of the U.S. would not have been a useful reliabilitytest because the Censu”s occupational data are estimatesbased on a 20 percent sample of the population, and in-clude persons who are not counted as physicians accord-ing to the AMA criteria described above.
7The response rate to the 1973 ppA survey was 76.8
percent after five mailings.
the data in the AMA Masterfile be checked. Subse-quently, the committee contracted with a privateconsulting firm (Moshman Associates, Inc.) to con-duct an independent evaluation. Four counties wereselected for the study on the basis of the followingcriteria: (i) geographical distribution, (ii) representa-tive physicianlpopulation ratios, (iii) having between200 and 1,000 physicians in the county, and (iv) thepresence of a large public hospital facility in thecounty. The counties selected were: New Castle,Delaware; Montgomery, Alabama; Boone, Missouri;and Washoe County, Nevada. The survey was con-ducted in March and April, 1972.
The physicians in each county were identifiedthrough State and county medical society member-ship lists, personal interviews with local authorities,hospital and medical, school lists, and telephonedirectories. Of the 1,596 physicians in the fourcounties who were on the AMA Master file, 1,546were identified by this procedure (96.9 percent vali-dation).
Ninety-one physicians were identified who werenot listed on the AMA Masterfile as being in thesurvey counties. However, 36 of these physicianswere found to be listed on the Masterfile as being inadjacent counties. Thirty-seven were listed in theMasterfile in a different location; and one could notbe identified on the Masterfile. Thus, the overallerror rate comparing all physicians located in thefour sample counties with their Masterfile entrieswas approximately 6.6 percents
8This error rate was calculated by adding the number
of physicians on the Masterfile list but not present in thefour counties or adjacent counties, to the number of phy-sicians not listed on the Masterfile as being in that countyor an adjacent county who were found to be practicing inthe county. The total number of errors was then dividedby the total number of physicians (1,596) who were on theAMA Masterfile for the four counties to arrive at an over-all percentage error (6.57 percent).
A breakdown of these figures by county is presentedbelow.
NumberTotal Identified
Physicians Withinon AMA County Percent
List proximity Identified
New Castle, Delaware 652 630 96.6
Montgomery, Alabama 273 271 99.3
Boone, Missouri 424 403 95.0
Washoe, Nevada 247 241 97.6
Total 1,596 \ 1,545 96.8
Source: American Medical Association, “Data Base of theAMA Center for Health Services Research andDevelopment” (Chicago: The Association, 1972),p. 15C.
195

In 1972 the Ohio Board of Regents commis-sioned a study of the accuracy of the AMA Master-file data. The approach taken was to compare infor-mation in the alumni files of Case-Western ReserveI
Medical School with corresponding entries in theMasterfile> The two source; were ‘found to agreewithin four percent with respect to the current loca-tion of physicians who graduated from CWRU be-tween 1925 and 1965.9
Another study of the accuracy of the AMAMasterfile was conducted by Medical Marketing &Media in 1975.10 Data contained on the Master-filefor the entire M.D. population of four adjacentcounties in @nnecticut were compared with areahospital rosters, ;ounty medical society membershiplists, and telephone directories. There were 329physicians listed on the Masterfile as being office-based in the four county area. Of these, all but sev-en were verified as currently practicing in this area.The data on the remaining 322 physicians wereexamined - for accuracy of specialty classification.Seven M.D.s (2.1 percent) were found to have spe-cialties other than those listed in the Masterfile.Thus, the study concluded that the Masterfile was96 percent accurate.11
The AMA itself has made consistency checksbetween responses to its Periodic Survey of Physi-
9The following data summarize the findings of theOhio Board of Regents study described in the texti
Year ofGraduation
1925-401941-451946-501951-55 -1956-601961-65
Total
Number inCWRIJ
~aterfi,e ~,~e;enceAlumni Number inData
.“
670 669 <1389 383 2377 376 <1396 393 1379 374 1379 375 1
2,590 2,570 1
cians (PSP) ;nd information in the Master-file, ThePSP is an annual survey of 7,500 to 10,000 random-ly selected physicians, It collects information ontheir specialty and current practice arrangements,Comparison of the 1966 PSP with the correspond-ing Masterfile information showed that 88.1 percentof the respondents reported that they were in thesame specialty as was listed for them in the Master-file. (The AMA plans to make a similar comparisonbetween the Masterfile and the next PSP responses.)
Thus, although further tests of the accuracy ofthe AMA’s Masterfile should—and undoubtedlywill—be made,lz it is reasonable to conclude on thebasis of the evidence at hand that Masterfile is high-ly accurate. Indeed, as the following sections de-scribe, the data on physicians collected and updatedby the AMA are undoubtedly the most accuratefigures available on the supply of a major skilledhealth profession.
Dentists13r
The Bureau of Membership Records and DataProcessing of the American Dental Association(ADA) maintains a current list of all dentists in theU.S. This list, which is updated twice a month, in-cludes members and nonmembers, practicing andnonpracticing, and licensed and nonlicensed hold-ers of D.D.S. or D.M.D. degrees.
Each year, the names and addresses of dentalstudents are sent to the ADA by every dental schoolin the U.S. These persons are listed as students un-til their status is converted to dentist when notifica-tion of graduation is received from the schools,Changes of address and membership status are alsomade at that time.
Until 1969, technically speaking, there were nograduates of foreign dental schools practicing in theUnited States. Immigrant dentists were required toattend a U.S. dental school for a minimum of twoyears before being licensed in the U.S. Only since
AlumniAlumni LocatedLocated Outside of %in Ohio Ohio in Ohio
CWRU Alumni Fde 1,020 1,570 39AMA Masterfile 1,059 1,511 41Difference 39 59 2Error 4% 4%
Source: Lee Edgar, et A., Physia-an Demography inOhio-1971 (Cohtmbus, Ohio: Board of Regents,1973).
10See; “How Good is the American Medical Associa-tion Masterfile of Physicians,” Medical Marketing& Media(December 12, 1975), pp. 15-17.
1lThis figure was calculated by dividing 14 errors bythe 329 M.D.s in the population studied.
196
Izrn addition to the types of accuracy checks de-scribed above, two other approaches wilI be possible in thefuture. (1) Data are now being collected in “log’diary”form by the NCHS Ambulatory Care Survey and re-searchers at tbe USC Medical SchooI. It should be possibleto make use of these data to verify the accuracy of thespecialty designation on the PPA. (2) Still another possiti]-ity would be to compare PPA data with that contained ininsurance files (e.g., Blue Shield claims history files), Al.though these data are collected in a different mannerfrom the PPA, it should still be possible to make consisten-cy checks using them.
13The material summarized in this section was providedby Dr. Helen C. Gift, Director, the Bureau of EconomicResearch and Statistics, American Dental Association, andby James N. Ake, Chief, Basic Studies Section, ManpowerAnalysis Branch, Division of Dentistry, U.S. Public HealthService.

!I
I
1969 have foreign dental school graduates beenpermitted to apply in some States for, licenses di-rectly upon entering the U.S., and estimates of thenumber now practidng in the U.S. suggest that lessthan 600 have succeeded in obtaining licenses.These dentists are added to the ADA list when theyapply for membership in the Association (approxi-mately 80-90 percent) and when they apply for anADA number in order to treat public-aid patients,
Approximately 10-15 percent of all new gradu-ates do not become members of the ADA. Thus, itis difficult for the ADA to locate these dentists oncethey have changed the residence indicated on theirschool records, ;lnce change of address correctionsfrom the U.S. Postal Seryice are the only routineu~date conducted for nonmembers.
A U~datin~ of ADA members’ records occursthrou~hout tie year, primarily through contact withthe member and via membership renewal forms.Constituent societies and the Post ‘Office records areother sources of updates.
The Distribution of Dentists, a triennial publi-cation, is prepared by the ADA Bureau of Econom-ic Research and Statistics with assistance from theBureau of Membership Records. Records from thecurrent ADA list are g;ouped according to counties.
Because of doubts about the accuracy of thesedata, the ADA established new data collection meth-ods. The data collection for the 197’6 Distributionof Dentists began with a mailed survey form to alldentists currently on record at the ADA. Thosequestionnaires returned by the Post Office with;ddresses unknown and not forwardable, as well asthose sent to nonrespondents, will be sought viaState agencies and telephone directories and inter-viewed by telephone. The results of this intensivedata collection ‘process are expected to improve theaccuracy of the ADA list of dentists.
The other current source of dental manDowerdata is State licensure records. Although the; pro-vide an accurate count of the number of licenseddentists in each State, they do not necessarily pro-vide practice location data or information on- thecharacteristics of a dentist’s practice (e.g., retired,teachi~g, hours of work pe; week, pa~ient load,etc.), The usefulness of a State’s list of licensed den-tists depends greatly on the manner in which StateBoards of Dentistry compile such lists. There aremany differences among the States in the keepingof records of their dental manpower. For example,,many States indicate only th; dentists “in-stale,”“out-of-state,” and in military service, whereas otherStates also indicate dentists who are retired or tem-porarily inactive. Most States do not make it clear;vhethe’r the address in the list is that of the den-tist’s practice or his or her residence. Finally, one ofthe biggest problems with respect to using licensuredata is the widespread practice of multiple licen-
sure. To date no effective method has been devel-oped to readily eliminate duplications. Because ofthese and other variations in State Iicensure prac-tices, the data presented are not directly compara-ble.
One method of testing the accuracy of dentalmanpower data is to estimate the total number oflivin~ dentists in the U.S. and compare the esti-mates to current licensure and Directory figures.Since virtually all U.S. dentists were graduated fromdental schools in this country, and losses of U.S.dental graduates through migration to other coun-tries is minimal (i.e., approximately 600 of the pre-sent total), such estimates can be made by summingthe number of dental school graduates since ap-proximately 1900 and subtracting the number lostdue to mortalitylq.
Estimates of the total number of living dentistshave been made by James Ake starting ‘with thegraduating classes from U.S. dental schools in 1900and applying the relevant mortality rates for whitemales by age cohort. His estimates are summarizedfor selected years and compared with the corre-sponding number reported by the ADA in Table 1below. As the table shows, this particular test indi-cates that the ADA figures are probably quite accur-ate, at least in terms of total numbers of traineddentists.
TABLE 1 TOTAL NUMBER OFLIVING DENTISTS
Year Ake Estimate ADA Figure
1952 92,330 > 92,2261955 96,320 98,4091960 103,320 105,542
1965 109,970 112,9531970 116,890 . 121,558
Source: Information provided directly by JamesAke, Division of Dentistry, U. S. PublicHealth Service.
Accurate figures on the total number of den-tists in the U.S. constitute the most basic sort ofminimum data base needed with respect to dentalmanpower. Data on geographic location, specialty,and type and size of practice are also of major im- .portance for most research and policy purposes.The major source of such data is, of course, theDirectory file and special studies conducted by theADA. It is the accuracy of the ADA Directory file
14For a discussion of this methodology in a differentcontext see: Hugh Folk and Donald Yett, “Methods of Esti-mating Occupational Attrition,” Western Economic JournaI,
VI (September, 1968), pp. 297-302.
197
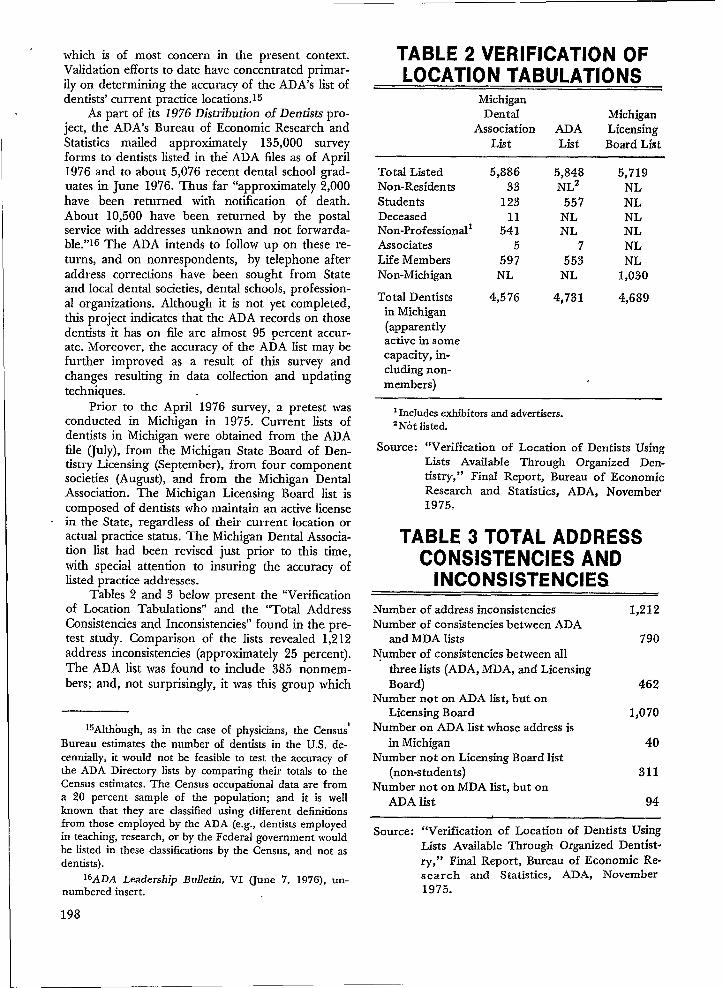
which is of most concern in the present context.Validation efforts to date have concentrated primar-ily on determining the accuracy of the ADA’s list ofdentists’ current practice Iocations.ls
As part of its 1976 Distribution of Dentists pro-ject, the ADA’s Bureau of Economic Research andStatistics mailed approximately 135,000 surveyforms to dentists listed in the ADA fdes as of April1976 and to about 5,076 recent dental school grad-uates in June 1976. Thus far “approximately 2,000have been returned with notification of death.About 10,500 have been returned by the postalservice with addresses unknown and not forwarda-ble.”16 The ADA intends to follow up on these re-turns, and on nonrespondents, by telephone afteraddress corrections have been sought from Stateand local dental societies, dental schools, profession-al organizations. Although it is not yet completed,this project indicates that the ADA records on thosedentists it has on file are almost 95 percent accur-ate. Moreover, the accuracy of tie ADA list may befurther improved as a result of this survey andchanges resulting in data collection and updatingtechniques.
Prior to the April 1976 survey, a pretest wasconducted in Michigan in 1975. Current lists ofdentists in Michigan were obtained from the ADAfile (July), from the Michigan State Board of Den-tistry Licensing (September), from four componentsocieties (August), and from the Michigan DentalAssociation. The Michigan Licensing Board list iscomposed of dentists who maintain an active licensein the State, regardless of their current location oractual practice status. The Michigan Dental Associa-tion list had been revised just prior to this time,with special attention to insuring the accuracy oflisted practice addresses.
Tables 2 and 3 below present the “Verificationof Location Tabulations” and the “Total AddressConsistencies and Inconsistencies” found in the pre-test study. Comparison of the lists revealed 1,212address inconsistencies (approximately 25 percent).The ADA list was found to include 385 nonmem-bers; and, not surprisingly, it was this group which
15A]thOugh,as in the case of physicians, the Census’Bureau estimates the number of dentists in the U.S. de-cennially, it would not be feasible to test the accuracy ofthe ADA Directory lists by comparing their totals to theCensus estimates. The Census occupational data are froma 20 percent sample of the population; and it is wellknown that they are classified using different definitionsfrom those employed by the ADA (e.g., dentists employedin teaching, research, or by the Federal government wouldbe listed in these classifications by the Census, and not asdentists).
16ADA Leadership Bulletin, VI (June 7, 1976), un-numbered insert.
198
TABLE 2 VERIFICATION OFLOCATION TABULATIONS
MichiganDental Michigan
Association ADA LicensingList List Board List
Total ListedNon-ResidentsStudentsDeceasedNon-ProfessionallAssociatesLife MembersNon-Michigan
Total Dentistsin Michigan(apparentlyactive in somecapacity, in-cluding non-members)
5,886 5,848 5,71933 NL2 NL
123 557 NL11 NL NL
541 NL NL5 7 NL
597 553 NLNL NL 1,030
4,576 4,731 4,689
1Includes exhibitors and advertisers.2N6t listed.
Source: “Verification of Lccation of Dentists UsingLists Available Through Organized Den-tistry,” Final Report, Bureau of EconomicResearch and Statistics, ADA, November19750
TABLE 3 TOTAL ADDRESSCONSISTENCIES AND
Number of address inconsistencies 1,212Number of consistencies between ADA
and MDA lists 790Number of consistencies between all
three lists (ADA, MDA, and LicensingBoard) 462
Number not on ADA IiSt, but onLicensing Board 1,070
Number on ADA list whose address isin Michigan 40
Number not on Licensing Board list(non-students) 311
Number not on MDA list, but onADA Iist 94
Source: “Verification of Location of Dentists UsingLists Available Through Organized Dentist-ry,” Final Report, Bureau of Economic Re-search and Statistics, ADA, November1975.

had the highest level of address inaccuracy on theADA list.
The major conclusion of the 1975 Michiganstudy was that merely comparing various lists ofdentists is not an efficient method of validating den-tal man~ower data. Rather. the authors recom-mended ‘that verification attempts be made throughdirect contact with dentists.
Still an earlier verification project was conduct-ed in the Boston Standard Metropolitan StatisticalArea (SMSA) in 1968. Listings in the ADA Directorywere compared to the “Certified List of Dentistsand Hygienists in Massachusetts in 1968” providedbv the Massachusetts Board of Dental Examiners. Aq~estionnaire was mailed to all dentists in the area,~vith followup phone calls to nonrespondents. More-over, a special effort was made to locate thosedentists li~ted in the ADA Directory who were noton the consolidated study roster. It was found thatthe ADA Directory contained 33.7 percent morepracticing dentists that could actually-be located inthe area. Furthermore, the apparent inaccuracy ofthe ADA Directory was found to be greatest in thecases of the youngest and oldest age categories ofdentists. Neither finding is, of course, particularlysurprising. It is known that as many as a quarter ofall dentists change their addresses annually; and,consequently, the ADA updates its file every twoweeks. If the updated file had been used, ratherthan the annual ‘Directory, the apparent error ratewould probably have been lower. Also, the highererror ~ate on’ the addresses of the youngest ‘andoldest dentists undoubtedly reflects, to some extent.the delays that are typical’ in changing the recordsto reflect new addresses after graduation, retire-ment, and death.
To summarize, it appears that the updatedADA Directory tape is a far superior source of den-tal manpower statistics than is the annual publishedDirectory. Because of substantial mobility and de-lays in changing addresses (especially in the cases ofrecently graduated or retired dentists), the annualDirectory is known to have a fairly high percentageof address inaccuracies. This is compounded by thefact that many dentists may use home addresses incommunicating with the ADA.
The Dental PIanning Information System P;o-ject begun by the ADA in February 19’74 is alreadymaking a substantial contribution to improving theaccuracy and quality of available dental manpowerdata. In addition to’ the usual basic background in-formation, the April, 1976 survey being conductedas part of this project is also collecting data onnumber of hours worked by each category of dentalmanpower, number of chairs in the dentist’s prac-tice, and an extensive log-diary record of patienttreatments (listing personnel ‘who gave it and theamounts of time involved). This survey has been
pre-tested in five States, and is now in the field in20 additional States. The results will be of greatvalue in their own right. Additionally, they willprovide a basis—as do all of the five to six ADAsurveys each year—to further verify the accuracy ofthe Directory tape information.
Given the high percentage of who belong tothe ADA (approximately 97 percent of all practi-tioners and 85 percent of all dentists, includingthose who are retired and those who teach and doresearch), the bimonthly updated Directory file isundoubtedly a highly accurate source of dentalmanpower data. However, users of the annual pub-lished directory should be cautioned that, due tohigh mobility and delays in receiving changes ofaddress, as many as one-quarter to one-third ofthese entries may be in error with respect to thedentist’s location. Thus, although the ADA’s dentalmanpower data are perhaps not quite as strong asthe AMA’s physician data, they constitute an excel-lent base upon which to build further efforts toexpand and improve dental manpower statistics.
Professional Nurses’7
The main source of data on the total numberof Registered Nurses is the American Nurses’ Asso-ciation’s inventory (conducted periodically). Esti-mates of the total number of employed nurses areproduced by the Interagency Conference on Nurs-ing Statistics (ICONS) on the basis of nursing datacollected by numerous national agencies.
The ANA Inventory consists of data collectedthrough the State licensure mechanisms, and,hence, covers only nurses holding a current licenseto practice at the time of the study. Funds are notavailable to allow followup of nonrespondents.However, since 35 to 40 States have, in the past,printed the Inventory questionnaires on the licenserenewal application, a high response is achieved.Only one State, Illinois, restricts the use of its licen-sure list for use in collecting Inventory data. Thus,names and addresses of persons not responding tothe questionnaire, but who are currently licensed inIllinois, are not included in the study unless theyare licensed in another State. Followups would bepossible in 49 States and the District of Columbia iffunds were available.
Graduates of foreign nursing schools (FNG’s)are automatically included in the ANA Inventorywhen they pass a State licensing examination. Littleinformation is presently available on FNG’s, al-
17The material summarized in this section was pro-vided by Mrs. Aleda V. Roth, Director, Statistics Depart-ment, American Nurses’ Association, and by Dr. EugeneLevine, Chief, Manpower Analysis Branch, Division ofNursing, U.S. Public Health Service.
199229-121 0-77- 14

though it does appear to be the case that their fail-ure rate on State licensing exams is high.
Licenses issued to FNG’s in 1973 totaled 6;758.Of these, 2,491 were by endorsement and 4,267were by examination. Licensures by endorsement, .are most often due to an FNG moving to a differentState after having been licensed by examination” inanother State.
The ANA is including a question on the 1977Inventorv about the school an RN attended. Res-ponses t: this question should provide valuable in-formation on the composition of the FNG popula-tion.
Data collection for the ANA Inventory is stag-gered according to the licensing periods-annual orbiennial-and the cut-off dates vary according toState over a two-year period. Since many nurses.maintain licenses in mo;e than one State. “the data~rocessin~ includes Drovision for elimination of&uplicate; Employed’ nurses are counted in theState and County of their employment other nurs-es are counted in the State and County where theylive.
Item nonresponse has been a problem. Ap-proximately 3 to 4 percent of respondents to recentinventory questionnaires have not -indicated theircurrent emblovment status, Since the Inventorv islimited to ;cti;e and inactive RN’s who maintai’n acurrent license to practice in some State, little infor-mation is available about the location of individualstrained as nurses who are not currently licensed.
The strengths and weaknesses of the ANA In-ventory data have been investigated by comparing itwith Census data, 1s inde~end>nt em”uloye; cou;ts.,. ,,and special followup studies.
On the basis of a sample of self-enumeratedquestionnaires, the Census Bureau estimated that841,000 RNs were the labor force in 1970. Subse-quently, the Division of Nursing of the U.S. PublicHealth Service contracted with the Census Bureauto conduct a followup study. The followup study,involving a sample of 1,948 questionnaires (with aneffective 11.3 percent nonresponse), led the CensusBureau to revise its 1970 estimate to 655,000 indi-viduals who had licenses to ~ractice in that vear.Four percent of the improperly classified pe;sons
18The same problems which lead the AMA and ADA
to reject occupational data from the decennial Censuses asa possible ch$ck on the accuracy of their data apply hereas well—namely, the fact it is based upon a populationsample, involves self-enumeration, and is definitionallyinconsistent with the ANA Inventory data (e.g., not relat-ed to Iicensure). Nonetheless, the paucity of nurse data,until recent years, forced researchers and even policymak-ers to place more reliance on Census data regarding nurs-es than those on physiaans and dentists. Thus, more at-tention has been given to “explaining” the differences inthe Census, Inventory, and other figures on RN’s.
actually had graduated from educational programsfor RNs but were not licensed. Another four per-cent were students currentiy enrolled in trainingprograms. Fifty-two percent were graduates of oth-er types of health occupational programs, predomi-nantly practical nursing and 39 percent had non-health-related occupational educational back-grounds. Once these facts were taken into account,the followup study counts of RNs were found to beconsistent with the 1972 ANA Inventory estimatesof nurse supply.lg
Inventory data has also been compared withcounts obtained from employer survey;. The pri-mary surveys used for this yurpose are: (i) theMaster Facilities Inventories (MFI’s) conducted byNCHS on nursing homes, (ii) the Nationai Leaguefor Nursing’s Nurse Faculty Census, (iii) the PublicHealth Nursing Surveys, and (iY) the AmericanHospital Association’s Survey of Nursing Personnelin Hospitals. In making comparisons, allowancemust be made for the fact that these surveys areconducted at different dates,
The Interagency Conference on Nursing Statis-tics (ICONS) uses these data to produce an estimateof the number of professional nurses by field ofemployment, and f;om this endeavor a number ofadditional insights have emerged. For example, onthe basis of examination of prior surveys, it was es-timated that the MFI contains about a 5 percentduplication factor, the discovery of which ledICONS to adjust downward its estimate of RN’semployed in nursing homes. With respect to NurseEducator figures, the ANA Inventory and the NLNNurse Faculty Census were found to be verv close.,and the minor differences which were observed
aPPear tO be attributable. to different dates of thetwo surveys.
The largest discrepancy found was between theANA Inventory and the Division of Nursing esti-mate of the number of RN’s employed in publichealth or school nurse positions, Specifically, 71,600nurses reported their field of employment as publichealth (including school nurses) in the 197’2 ANAInventory, whereas 58,241 nurses were reported aspublic health or school nurses by 11,455 publichealth/community health agencies” responding tothe Division of Nursing survey. There are numer-ous likely explanations for this discrepancy, inch.td-ing: (i) differences in the timing and in the defini-tions employed in the two surveys, and (ii) the fact
19M~~h of the misenumeration found in the census
figures appears to have been the result of the manner inwhich the questions dealing with occupational status wereframed. The ICONS has suggested that a que8tion ontypes of valid State licenses or certificates an individualholds be added to future Census questionnaires in orderto correct this problem
200

I
that the Inventory is based on self-enumerationwhereas the Public Health Nursing Survey obtainscounts from employment records.
By matching of Social Security numbers on the1966 and 1972 Inventory tapes, the ANA was ableto check on the accuracy of highest educational at-tainment data for those RNs on both lists. An errorrate of less than 1 percent was found in this check.
In an effort to examine the biases in the ANAInventory due to item nonresponse and to validatethe Inventory data itself, the Division of Nursingsuggested a followup study “on the 1972 RN Inven-tory. A sample of those included in the Inventory\vere sent questions regarding their racial/ethnicbackground, educational attainment, field of em-ployment and type of position. There was a 25 per-ceht nonresponse due to bad addresses (perhapsbecause the Inventory data are collected over a per-iod of two years, and many names and addressesmay change in that time). The results of this studyare still being processed. When they are available,they should provide valuable additional informationregarding the accuracy of ANA Inventory data.
Finally, an interesting comparison can be madebetween the results of several of the earlier ANAInventories and estimatqs that have been made ofthe total number of living nurses (using the samemethodology described in the previous section onDentists). Table 4 shows the result of this exercise.
TABLE 4 NUMBER OF LIVING
YearReport in ANA Yett
Inventory Estimate
1951 552,618 841,0001956-1958 731,389 964,000 to 1,014,000
1962 843,825 1,111,0001966 909,195 1,215,000
Source: Donald E. Yett, Data Source Book for anEconomic Analysis of Nurse Supply and De-mand (Springfield, Virginia: National Tech-nical Information Service, 1974), p. 15.
The discrepancies in the figures shown in Ta-ble 4 are due to a number of factors. Specifically,the early Inventories (pre-1956/58) were not tieddirectly to he State licensing process in all Statesand had very high nonresponse rates (especially onthe part of “inactive”), Nonetheless, they can prob-ably be taken as an indicator of the rough differ-ence between a full count of all living graduates ofnursing schools and the number with current licen-ses. Since relicensure is not generally difficult, theInventory data constitute an underestimate of thetotal “inactive” pool of professional nurses;
One way of improving the data on nurse man-power would be to assign ‘each nurse a unique IDnumber at time of graduation or time of first licen-sure, and then update masterfile based on theseID numbers in much the same manner as is donefor physicians and dentists by the AMA and theADA. Indeed, this approach is being considered bythe ANA. It is to be hoped that in the not-too-dis-tant future it will he practical to institute such a sys-tem.
In summary, on the “basis of the evidence avail-able it appears that the ANA Inventory is a reliablesource of data on currently licensed RNs, but notof the pool of trained but unlicensed RN’s who mayeventually seek employment or reemployment inthe field.
The Interagency Conference on Nursing Statis-tics performs a useful role by reviewing and at-tempting to reconcile all nursing data collected bynational agencies. Its comparisons of the results ofindependent employer studies with ANA Ipventorydata provide a basis for greater confidence in theavailable statistics on RN’s by field of employment.
It is not necessary to belabor the obvious diffi-culties with respect to the Census Bureau data onprofessional nurses. Nonetheless, the decennial cen-sus could play a useful validation role vis-a-vis theother sources of RN data if the occupational ques-tionnaire were modified to obtain specific informa-tion on licensure status.
I At this point in time, special followup studies
appear to be the most useful method of checkingthe accuracy of the available RN manpower statis-tics.zo However, followup mailings or telephonecontacts to nonrespondents, plus attempts to locatethose who have moved or undergone name changesare essential to the success of this approach sincemost RNs are women and are more likely to workintermittently and change their names during thecourse of their working lives.
The assignment of a unique code number toeach nurse at an early point in her career (e.g.,graduation from nursing school, first Iicensure ap-plication) would constitute a major improvementover the current methods used to collect data onprofessional nurse manpower.
Conclusion
Review of the present methods of measuring orestimating physician, dentist, and nurse manpower
20A fairly recent example is the Survey of NursesEmployed in Physicians’ Offices, conducted by the Divisionof Nursing, which showed a high degree of agreementwith the 1972 Inventory figures on “Office Nurses.”
201

has revealed’ that current practices have yielded the supply of skilled health professionals, and tofairly reliable figures. Certain improvements have those involved in the development and implementa-been recommended—especially that a procedure tion of NCHS’S CHSS program. It would be mostsimilar to that used for physicians and dentists be unfortunate indeed if CHSS officials failed to gaindevised for nurses. It is hoped that this review will the fullest possible benefits from the experience ofbe of value to both me professional associations, the major ongoing health manpower data collec-which have been the traditional source of data on tion, processing, and analysis efforts.
202

INTERFACE OF NATIONAL AND STATE MANPOWER STATISTICS
Ms. Aleda V. Roth, Director, Statistics Department, American Nurses’ Association, KansasCity, Missouri
There is an evergrowing need for integratingdata on all health manpower. Only through moni-toring emerging developments in health manpowercan better policy decisions be made. What is neededis relevant and current data on their supply, de-mand, and utilization.
At a conference on Health Manpower Informa-tion for Policy Guidance, Dale Hiestand pointed outseveral distinguishing characteristics of the healthmanpower labor market. Among these characteris-tics are 1) the length of time required to develophealth manpower resources; 2) the rapid shifts inthe demand for health manpower; 3) the rapidchanges in the supply such as those due to permis.sive or restrictive immigration policies with respectto foreign trained personnel, or to increases in theproportion of women health workers retained inthe labok force; 4) the influence of short and longrange factors on the decision to establish, expand orcontract health related institutions; 5) recent in-creases in the supply which have effected sporadicreporting of factors related to unemployment suchas difficulty in placing new graduates, underutilize:tion and displacement of lesser skilled personnel; 6)shifts in concern with general shortage to selectiveimbalances of shortage and surplus among differentoccupations, different geographic locations, andamong workers within the same occupation havingdifferent levels of educational preparation; 7) publicaction to increase the supply of highly trainedhealth personnel has often been taken without fore-casting the long range employment opportunitiesfor these professionals; and 8) upward spiraling ofthe supply based upon higher and higher perceivedneeds, qualitatively and quantitatively. The data onhealth manpower are needed to reflect the charac-teristics of the market and to enhance our under-standing of the health care delivery system. A widevariety of public and private agencies currently areinvolved in the collection and analysis of data onhealth manpower. It is this last point upon whichmy paper is to focus.
Now, I will proceed to briefly summarize thevarious types of health manpower data collected inthe past for the 13 licensed occupations and then”proceed to discuss the current situation.
Data on health manpower stemmed from var-ious organizations. Essentially, data originated fromthe operating needs of the respective organizationsand evolved as institutions and ‘organizations grewand changed. Additional questions were generatedand methodologies advanced, as technology and
resources became available, and as new kinds ofprivate and public interests developed.
In the past, most national data on health man-power were collected through professional associa-tion efforts, with or without government support.For example, the American Chiropractic Associa-tion conducts’ an Annual Licentiate Survey andmaintains a data base on chiropractors.
The American Medical Association (AMA)maintains the ordy national repository of compre-hensive data on M.D.’s in the U.S. Master recordscontaining information on employment status, pro-fessional activities and various other data are updat-ed every three years with a master survey. There isprobably more information on individual M.D.’s thanon any other profession. In early 1960’s, the AMAtried to improve their data base by making changesin definitions, reference dates, and coverage; and in1968, AMA made several classification changes.
“rhrough the American Association of DentalExaminers, basic information on licensed dentistsand dental hygienists were obtained periodicallysince 1967. The data were collected from the filesof the individual Boards of Dentistry and not di-rectly from the professionals. In 19’71, a biennialregister of licensed dental manpower was estab-lished by the American ‘Association of Dental Exam-iners tinder a contract with tie Bureau of HealthManpower in order to obtain improved data. Thecurrent register is updated annually.
Since 1897, the American Osteopathic Associa-tion has maintained a file updated annually on os-teopathic physicians. The basic methodology was tosurvey every osteopathic physician with a knownaddress and to combine this information with avail-able records of nonrespondents. While it is believedthat this file covers most D.O.’S in the U.S.A., it isdifficult to measure its completeness.
Initially, with support from the Bureau of”Health. Manpower, the American Optometric Asso-ciation established an information system. An inven-tory based upon a s’urvey of all licensed optometr-ists was developed using the licensure renewal me-chanisms with cooperation of the State OptometryBoards. The overall response rate for the 19’72-73study was 93 percent of all licensed optometrists.
With support of the Bureau of Health Man-power, the American Association of the Colleges ofPharmacy developed a detailed and comprehensiveinventory of all licensed pharmacists. Questionnaireswere distributed through the various State Boardslicensing pharmacists from 1972 through 1974, the ~
203
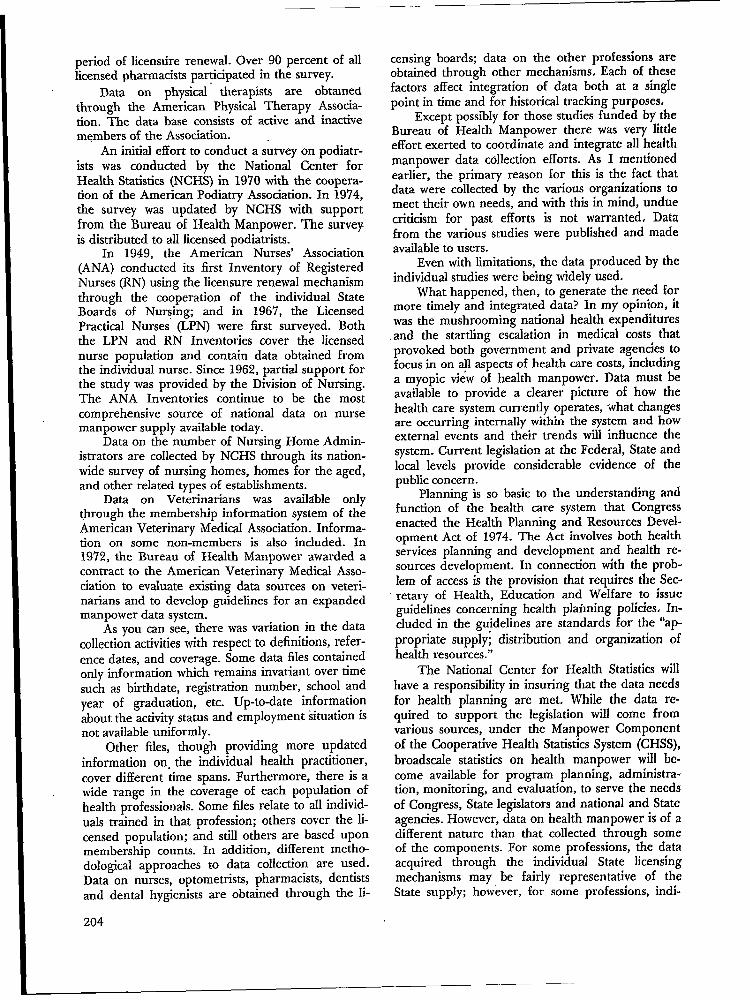
period of Iicenstire renewal. Over 90 percent of alllicensed pharmacists parucipated in the survey.
Data on physical therapists are obtainedthrough the American Physical Therapy Associa-tion. The data base consists of active and inactivemembers of the Association.
An initial effort to conduct a survey on podiatr-ists was conducted by the National Center forHealth Statistics (NCHS) in 1970 with the coopera-tion of the American Podiatry Association. In 1974,the survey was updated by NCHS with supportfrom the Bureau of Health Manpower. The surveyis distributed to all licensed podiatrists.
In 1949, the American Nurses’ Association(ANA) conducted its first Inventory of RegisteredNurses (RN) using the Iicensure renewal mechanismthrough the cooperation of the individual StateBoards of Nur:in& and in 1967, the LicensedPractical Nurses (LPN) were first surveyed. Boththe LPN and RN Inventories cover the licensednurse population and contain data obtained fromthe individual nurse. Since 1962, partial support forthe study was provided by the Division of Nursing.The ANA Inventories continue to be the mostcomprehensive source of national data on nursemanpower supply available today.
Data on the number of Nursing Home Admin-istrators are collected by NCHS through its nation-wide survey of nursing homes, homes for the aged,and other related types of establishments.
Data on Veterinarians was available only@rough the membership information system of theAmerican Veterinary Medical Association. Informa-tion on some non-members is also included. In1972, the Bureau of Health Manpower awarded acontract to the American Veterinary Medical Asso-ciation to evaluate existing data sources on veteri-narians and to develop guidelines for an expandedmanpower data system.
As you can see, there was variation in the datacollection activities with respect to definitions, refer-ence dates, and coverage. Some data files containedonly information which remains invariant over timesuch as birthdate, registration number, school andyear of graduation, etc. Up-to-date informationabout the activity status and employment situation isnot available uniformly.
Other files, though providing more updatedinformation on. the individual health practitioner,cover different time spans. Furthermore, there is awide range in the coverage of each population ofhealth professionals. Some files relate to all individ-uals trained in that profession; others cover the li-censed population; and still others are based uponmembership counts. In addition, different metho-dological approaches to data collection are used.Data on nurses, optometrists, pharmacists, dentistsand dental hygienists are obtained through the li-
204
tensing boards; data on the other professions areobtained through other mechanisms, Each of thesefactors affect integration of data both at a singlepoint in time and for historical tracking purposes,
Except possibly for those studies funded by theBureau of Health Manpower there was very littleeffort exerted to coordinate and integrate all healthmanpower data collection efforts. As I mentionedearlier, the primary reason for this is the fact thatdata were collected by the various organizations tomeet their own needs, and with this in mind, unduecriticism for past efforts is not warranted. Datafrom the various studies were published and madeavailable to users.
Even with limitations, the data produced by theindividual studies were being widely used.
What happened, then, to generate the need formore timely and integrated data? In my opinion, hwas the mushrooming national health expendituresand the startling escalation in medical costs thatprovoked both government and private agencies tofocus in on +1 aspects of health care costs, includinga myopic view of health manpower. Data must beavailable to provide a clearer picture of how thehealth care system currently operates, what changesare occurring internally within the system and howexternal events and their trends will influence thesystem. Current legislation at the Federal, State andlocal levels provide considerable evidence of thepublic concern.
Planning is so basic to the understanding andfunction of the health care system that Congressenacted the Health Planning and Resources Devel-opm-ent Act of 1974. The Act involves both healthservices planning and development and health re-sources development. In connection with the prob-lem of access is the provision that requires the Sec-retary of Health, Education and Welfare to issueguidelines concerning health plafining policies. In-cluded in the guidelines are standards for the “ap-propriate supply; distribution and organization ofhealth resources.”
The National Center for Health Statistics willhave a responsibility in insuring that the data needsfor health planning are met. While the data re-quired to support the legislation will come fromvarious sources, under the Manpower Componentof the Cooperative Health Statistics System (CHSS),broadscale statistics on health manpower will be-come available for program planning, administra-tion, monitoring, and evaluation, to serve the needsof Congress, State legislators and national and Stateagencies. However, data on health manpower is of adifferent nature than that collected through someof the components. For some professions, the dataacquired through the individual State licensingmechanisms may be fairly representative of theState supply; however, for some professions, indi-

vidual State licensure statistics alone are insufficient.For example in nursing, the count of all licensesissued to nurses throughout the United States is notequivalent to a count of registered nurses’ in theUnited States because nurses can, and a sizeablenumber do, hold licenses in more than one State.This duplication of licensure from State to Statemeans that there are more licenses issued in thecountry-” than there are re$stered nurses. Thenumber of licenses issued within a State does notadd up to that State’s actual registered nurse sup-ply. Nurses may not always be licensed in the Statein which they are located, although they may hold alicense in at least one other State. Certain nurses,such as those employed by the Federal governmentand those in quasi-nursing positions, are exemp~from the requirements to obtain a license in theparticular State in which they are practicing. Largeproportions of inactive nurses maintain licenses topractice. Very frequently, the license is held in aState other than the one in which the nurse is resid-ing. Nurses, then, are in States where they are notactually licensed and States issue licenses to nurseswho are not within their borders.
Thus, it is necessary to have a coordinated ap-proach to the handling of licensure data and con,verting the data into meaningful statistics on healthmanpower supply. These figures can only be mean-ingful if they reflect the true count of health pro-fessionals and each State’s actual complement.
At the Federal level, many of the data collec-tion activities of the Bureau of Health Manpowerhave been transferred JO NCHS. . NCHS is nowworking with several of the professional associationsand State CHSS contractors to collect accurate na-tional data on health manpower with a minimumamount of duplication and effort; and to insure acoordinated approach toward an integrated healthmanpower system. Interim policies and proceduresare being worked out within NCHS. These policiesand procedures are being used during the transi-tional phases as CHSS develops and existing sys-tems adapt. Thus, resources which provide morehealth data at State and local levels can evolve with-out jeopardizing national data collection efforts.
Since the goal of CHSS is to place the responsi-bility of primary data collection and processing ac-tivities within the States, the interim practices fornational data collection are in accord with this de-centralized approach. Operationally, then, theNCHS is making arrangements with several profes-sional associations for the collection of Inventorydata on their profession. Under current worldngagreements, data on health professionals will begathered and collected by the CHSS contractorshaving manpower implementation contracts and
who are desirous of carrying out the data activitieslocally. ‘Data will be collected by the” professional
association in the remaining States utilizing the li-censure mechanism. Data from non-CHSS Stateswill be coded, keyed and processed centrally by therespective association. Tapes from CHSS States willbe ~ent to the Association so that a master file canbe created, in which duplicate records are purged.
While on the surface. these Procedures seem,simple enough, months of negotiations and plan-ning preceded their development. While I cannotspeak for the other associations personally, I willreview the ANA - NCHS efforts as an example.
One of the first concerns of ANA was that theinitial minimum data set develoDed under CHSS,was insufficient to account for real differencesamong the professions and to adequately meet theneeds of the nursing profession. The ANA staff, incoordination with man-y of the State-Boa~d~ of Nurs-ing, worked together to update the data” set fornursing based upon the 1972 Inventory. It was feltthat it would be unwise to completely change defini-tions and categories without much pretesting of theform. Secondly, we wanted to preserve basic trendinformation established from earlier studies. NCHSreviewed and approved the data set and permittedCHSS contractors to use it in fulfillment of theircontracts. When that policy was released, all CHSScontractors except one agreed to incorporate theitems into their forms. The only State which was anexception was unable to change due to a timing fac-tor. Special procedures are being worked out with~his State to procure most of the Inventory data.
Through a - workshop sponsored by NCHS,CHSS State s~aff and ANA staff had the o~~ortuni-. .ty to review together uniform coding and process-ing procedures for the 1977 Inventory. State inputwas incorporated into the final coding manual.
To date, ANA has established many positiveworking relationships with most CHSS State con-tractors.
For example, in the conduct of the 1974 LPNInventory, the ANA worked with the MichiganCooperative Health Statistics System to collect thenecessary statistics. Licensure renewal forms werecollected’, coded and keyed in Michigan and a tapewas sent to ANA, ANA and Michigan CooperativeHealth Statistics System staff worked collaborativelyand both State and national data needs were met.Various other States called ANA periodically forspecial coding instructions and we provided inter-pretation wherever we could. In several instances,ANA has supported the CHSS contractors in theirnegotiations with the Boards of Nursing.
In any type of venture, where there are so
many individuals with whom to coordinate effortsand so many varying State needs, there will be somevery difficult problems in putting together thepieces of uniform national statistics; however, past
efforts to resolve problems have continued to pavethe way for future success.
205
,

Before closing my address today, I would liketo present several thoughts, as I see it, based upon’my experience to date which may affect the futureintegration of national and State data collectionefforts and analysis of statistics.
First, I foresee some real problems ahead incollecting a uniform minimum data set which isoccupation sDecific. of which a subset contains a, .central core of auestions consistent across GccuPa-.tions, among the 51 jurisdictions. There are rest~c-tive policies in some States with respect to whatauestions can be asked. For examDle. the racial or~thnic backaound of the health Professional cannotbe collecte~ through the licens~re mechanisms insome States. In some States it is beginning to be-come exceedingly difficult to collect basic data such
“,
as sex and marital status—two pieces of informationwhich are crucial for understanding the labor forceparticipation rates of occupations which are primar-ilv com~rised of women. Most States will first com-p~y ‘wit~ local data needs and then national needs indesigning its questions. Often questions which ap-uear to be similar will elicit different res~onses be-, ,cause of tie wording of the items of the responsecategories from which to choose, making integra-tion of data across States difIicult. Even in prepara-tion for the 1977’ RN Inventory, there were somequestions which appeared in categories which couldeasily be recoded into the Inventory categories butafter careful review they were determined not to beequivalent. With respect to a uniform minimumd~ta set, I believe th~re will continue to be a tend-ency to try to make all professions “fit” into a spe-“cific set of categories; however, what does it ‘mean?
‘As statisticians ;e are told to find the statistics thatfit the situation and not to force the situation intothe statistics. Many professionals are assuming newand expanded roles- witiln the health care d~liverysystem. These professionals are increasing in num-ber faster than d~ctors and their roles are expand-ing almost as rapidly as their numbers. Why forcethem to choose- res”ponse categories that are not. “
meaningful? There will alwavs need to be a core ofdata ite~s which are occupahon specific to monitortrends within the respective professions.
Secondly, I think we’ve got to look at the man-power data “we’re collecting-through the licensingmechanism for what they are—broadscale statisticson the profession. This type of data is essential in
“describ~g the numerical “c~unt of health manpow-er, and p;ovides a basis for projecting the numberof persons required to meet ‘the- future health careneeds of the Nation. This is esDeciallv true of the,unduplicated statistics of the heal~h manpower with-in the State. The national statistics when fed back toState agencies have several advantages over Statelicensure statistics alone. The health manpowerpopulation is clearly defined as relating to alr those
professionals who hold a current license to practicein at least one State.
For-this reason, the unduplicated data files con-sisting of the State’s resources, will play an over-growing role in small area data analysis because itdescribes the State’s entire manpower complementand potential supply. National statistics produced ina uniform manner provide county data on thehealth manpower supply to local and State plan-ners. Furthermore, individual data can be aggregat-ed to reflect the health manpower supply in areaswithin Standard Metropolitan Statistical Area(SMSAS). The Inventories or national data collec-tion efforts coordinated through States then, contin-ue to be the basic source of data on the healthmanpower supply: They provide general statistics onthe characteristics of the supply, including demo-
ma~hic data and other information related to em.~lo~ment and educational preparation. For moredetailed statistics on health Professionals. other,mechanisms, such as specialized sample surveys,. . ,.need to be used to collect such data, Inventory sta-tistics cannot be all things to all men!
Finally, there is still much to be accomplishedin order to integrate State and national manpowerstatistics. The providers of health services repre-sented by thei~ professional associations mus~ bepermitted to play an integral part in the Coopera-tive Health Statistics System. They should have arole in establishing the data items specific to theiroccupation; in establishing uniform coding andprocessing procedures, in centralizing coordinationof activities, and in unduplicating data as well asvarious other roles, such as conducting specializedresearch on the professions. 1 believe inclhdin~ theprofessional ass~ciations in the decision m~kingprocesses along with the States will only strengthenthe svstem.
What we are seeing recently in the entirehealth arena are changes in the needs and capaci-ties of various organizations and professionals whodeliver health ser~ices. As these ;hanges occur, sodo the locus and responsibility for data gatheringand analysis. In shaping the future of data collec-tion for health manpower, it is essential to have acoordinated approach including a continuing role forthe professional associations, ‘States and local agen-cies, and FederaI government.
REFERENCES1. W-estand, Dale L., and Miriam Ostow, editors, Health
Manpower Information for Policy Guidance, BallingerPublishing Company, Cambridge, Mass., 1976.
2. Cambridge Research Instituie, Trends Affecting theU.S. Health Care System, Health Planning Informa-tion Series, Department of Health, Education, andWelfare Publication No. HRA 76-14503, January1976.
206

I
HEALTH FACILITIES SURVEYMrs. Gloria Kapantais, Director, Division of Health Manpower and Facilities Statistics,National Center for Health Statistics, RockviJle, Maryland
I would like to begin with a cautionary note, tothe effect that the title given -my presentation issomewhat misleading. My remarks wiB be devotedin general to health manpower data and mecha-nisms for gathering such data, such as throughhealth facilities surveys.
I am sure that you are all aware that informa-tion on health manpower supply has, in the past,been collected or estimated by a wide variety oforganizations, such as professional associations, oth-er private organizations and institutions, and publicagencies. The resulting data represented a hetero-geneous assortment of survey findings, actualcounts, and estimates based upon professional judg-ment, which led to numerous problems of noncom-parability among the statistics, due to the differ-ences in definitions, coverage, and timing, not tomention data collection methods.
What has been lacking has been a comprehen-sive, comparable health manpower data system thatis a cooperative effort between both the users andproducers of such data. Such an effort would in-volve the States, the national health professionalassociations, and the Federal Government workingtogether to provide the best health manpower in-
I formation that can be obtained to serve a wide vari-ety of purposes.
Until recently, the National Center for HealthStatistics (NCHS) did not have a continuing healthmanpower data collection program. Instead, various“ad hoc” surveys were conducted, as limited re-sources permitted. However, the situation haschanged greatly during the past several years, as aresult of the development of the CooperativeHealth Statistics System (CHSS).
The goal of the CHSS, which was legislated byCongress in 1970 and which is being developedunder the leadership of the Natioqal ‘Center forHealth Statistics, is to build a health data systemthrough a coalition of data users and producers atthe national, State, and local levels to serve as thebasis for effective health planning. Two of the com-ponents of this system are the Health Manpowerand Health Facilities Components, which are de-signed to provide inventory data on the numbers,characteristics, and distribution of health facilitiesand health personnel in thirteen health professions.
Although many of the Health, Resources Ad-ministration’s (HRA’s) data needs are expected tobe met in the long run by the Cooperative HealthStatistics System, the Manpower and Facilities Com-ponents will not be funded in all States until fiscal
Year 1978, at the earliest, and it is expected thatthe national data from all 50 States will not be avail- ,able for several additional Years. Therefore, a strat-.egy for collection of health manpower data hasbeen developed for this interim period while theHealth Manpower and Facility components of theCooperative Health Statistics System expand fromthe present 25-odd States to all 50 States and theDistrict of Columbia. This effort calls for the select-ed development of other survey mechanisms andone-time contracts and other agreements to gatherneeded data and fill in data gaps in States not yetoperational with these two components of theCHSS.
One of the major components of this short-term strategy is the data collection activities for anumber of health professions recently transferredfrom the Bureau of Health Manpower (BHM) toNCHS. These inventory activities, formerly sup-ported by BHM with the cooperation of the healthprofession associations concerned, are now beingdirectly coordinated with the CHSS activities duringthe CHSS implementation phase, through a merg-ing of the CHSS activities with the existing invento-ries. Since about 26 States will, by the end of thismonth, hold contracts for the manpower compo-nent of CHSS, the most reasonable, economical,and quickly operational data collection mechanismare surveys with association cooperation to fill thegaps left by the incomplete coverage of the CHSS.
As, of now, HRA is planning to utilize associa-tion and licensing board cooperation and efforts tocomplete State coverage and to fill gaps left by theCHSS. Use of the same questionnaires, coding andediting instructions, and other survey techniques ofthe CHSS will be used in orde~ to provide maxi-mum compatibility.
In this interim period, we are attempting toproduce a comprehensive health resources data sys-tem that not only involves both the users and pro-ducers of the data, but that builds on the strength ofall three involved parties - the States, the NCHSand the professional associations. Representativesfrom all three of these groups are here this morn-ing at this session, with Jim Cooney and Pete Baileyrepresenting two of our CHSS contract States, andAleda Roth and Bob Llnde representing two of theprofessional associations with whom the” Center hascontractual arrangements for data collection.
One of the major difficulties. encountered todate in regards to availability of health manpowerdata is the fact that data available -on allied health
207

manpower is incredibly sparse, yet the need for reli-able statistical information on health manpower isnowhere more urgent than in occupations in the al-lied health field. The process of building and main-taining a reliable data base on allied health man-power is extraordintiy difficult and has beengreatly hampered by numerous problems, includingthe following:
1.
2.
3.
4.
5.
6.
Lack of consensus on the parameters of theallied health field and on definitions of alliedhealth professions and occupations.Lack of reliable estimates of current andpast supply for allied health professions andoccupations.Limited information on the characteristics ofworkers.Limited knowledge about the impact of taskdelegation on current and future supply es-timates.Extensive use of crude estimates and profes-sional judgment in assessing the past andpresent situation.The proliferation of occupations that hasresulted in a multitude of ‘titles and defini-tions utilized- to describe the allied healthmanpower pool.
Traditionally a number of sources have bee,nutilized to obtain some of the data needed, includ-ing State. licensing boards, registry by certifyingboards, professional organizations, national samplereports and surveys, and State surveys. Althoughthese sources have been helpful in generating somestatistics on allied health manpower, numerous limi-tations and problems have been encountered in allof them, (particularly the problem of obtaining esti-mates of the total active supply vs. the total poten-tial supply). Licensure records have historically beenutilized as a major mechanism for the collection ofmanpower dam, but for only a very limited number
of allied occupations is it possible to obtain the totalnumber of potential workers through State licen-sure, and data are generally unavailable on’ thenumber active or on their detailed characteristics.
Another source of available data is the recordsmaintained by certifying or re~-stry boards. Howev-er, the nature of the certification or registry mech-anism results in the exclusion of a proportion ofthe active pool. Problems in coverage also occur inthe use of profession-d organizations and theirmembership. And, double counting may occur.Membership totals in professional organizationscover a widely varying percent of all workers andoften include both active and inactive workers.
Owing to the large number of employers of al-lied workers, the Iiited Iicensure in the field, thelarge and rapidly growing numbers and types of al-lied workers, and the inadequate historical data
208
base, data collection largeIy has to be approachedon an employer-by-employer basis. Since the largestemployer is hospitals, the HRA is planning to con-duct in the near future a Hospital Manpower Sur-vey. This universe survey is to collect current infor-mation on the types of health and nonhealth man-power employed by hospitals, and to determine theneed for additional personnel based upon databeing secured on the number and types of person-nel currently being recruited (vacancies), Data willbe collected on approximately 80 allied health occu-pations working in the hospital setting.
Upon the successful completion of the HospitalManpower Survey, the Center is planning to con-duct a detailed followup survey among a sample ofthe responding hospitals that employ certain speci-fied types of allied health manpower. This Surveyof the Characteristics of Allied Health Manpower inHospitals is designed to provide an educational andemployment profile of persons employed in 10 to15 allied health occupations, none of which are cur-rently licensed in more than 20 States.
The Center also uses another facility survey toobtain staff data; this vehicle is the biennial NationalNursing Home Survey. ~Is sample survey collectsdetailed information on: (1) the services and charac-teristics of the facility, including financial data; (2) asubsample of patients in the sample homes; and (3)the education, training, and salary of a subsampleof staff employed by the homes. Data from the1973/74 survey are now being analyzed and predpared for publication, and the next survey in thisseries is scheduled for 1977,
Gathering health manpower data through sucha facility, or employer, mechanism has several ad-vantages. First, it is an’ efficient means of gatheringdata on many occupations at once, thus resulting ina substantial savings of both money and time rather(than separate surveys being done, for separate oc-cupations. In addition, such a mechanism greatlyincreases the analytical potential of the resultingdata, as it permits examinations of patterns of
-health care and study of the interrelationships ofthese occupations within the settings in whichheal}h care is provided.
In addition to such “as hoc” surveys as the twoaforementioned hospital surveys, the Health Facili-ties Component will, in itself, be an importantsource of at least limited health manpower data, asnational headcount data will be available, on anannual basis, from all inpatient health facilities,
Two limitations, however, currently exist withthe health manpower data generated by the Facili-ties Component. First is the very limited nature ofthe data-headcounts only. Second is the fact thatonly inpatient facilities are currently included.Thus, data on those occupations employed solely-ormairdy-in outpatient facilities, are dependent upon

the addition of these types of facilities to the FacilityComponent. In the future, we hope to have suffi-cient resources available to permit funding selectedresearch and demonstration projects on the addi-tion of outpatient facilities to the Fac~lties Compo-nent.
Beginning in Fiscal Year 19’78, we plan t,o be-gin exploring ways to obtain health manpower datathrough Stage III of the Manpower Component.Stage III has only been tentatively defined to dateand may be subdivided later into additional stages,as required. Only broad guidelines have been estab-lished so far. Details will be worked out only aftermore experience has been gained through the im-plementation of the inventories (Stage I) and thelicensure surveys (Stage III). However, at t~s pointin time, Stage III of the Manpower Component isenvisaged as special, perhaps sample surveys togather either: (1) detailed data on the occupationsalready included in Stage II of the ManpowerComponent; or (2) information on those allied oc-cupations not part of Stage II.
In Fiscal Year 1978, therefore, we plan to con-duct demonstration projects in several CHSS Statesthat involve the States collecting unlicensed healthmanpower data, through facilities surveys as part ofStage III of the Manpower Component.
In addition to these future demonstration proj-ects in the Facilities and Manpower Components,we also plan to: (1) decentralize the Hospital Man-power Survey in future years, and have the datacollection be a State responsibility; and (2) explorethe possibility of using the National AmbulatoryMedical Care Survey (NAMCS) to provide estimatesof the number of persons, such as physician assist-ants, that are employed in office-based practices.
From my remarks this morning, I hope you .will agree that we have begun to develop throughthe CHSS and the interim systems I have described,a data collection system that has as one of its majorgoals the provision to health planners at the Nation-al, State, and local levels of timely and reliablehealth resources data.
209

MANPOWER AND FACILITIESPERSPECTIVES
STATISTICS: STATE
Mr. Walter P. Bailey, Director, Management Information Systems, Office of the Governor,Columbia, South C&olina
I would like to discuss with you several cooper-ative efforts that have been established in South Car-olina that provide health planners at the National,State, and local levels with timely, reliable healthresources statistics, while reducing the burden onrespondents caused by unnecessary duplication ofdata collection.
In 1973 representatives of the South CarolinaDepartment of Health and Environmental Control,the South Carolina Hospital Association, the Em-ployment Security Commission, the South CarolinaHealth Care Association, and the division of Healthand Social Development Reviewed the Joint AnnualReport (JAR) of Hospitals and Nursing homes andarrived at a consensus on the use of the JAR as adata-collection instrument for the three-year hospi-tal and nursing home manpower survey of theEmployment Security Gmmission. The manpowersection of the reFort had been limited to surveyinghealth manpower categories as to whether theywere employed full-time or part-time. In additionto requesting actual employment, the hospital ad-ministrator was requested to report his budgetedvacancies by manpower category as of the data ofthe report’s completion. Very few revisions werenecessary to make this instrument suitable for gath-ering information on all the manpower employedwithin South Carolina’s Hospitals and nursinghomes. (The expansion of the list and the use ofDOT (Dictionary of Occupational Titles) numbersfor the respective categories were the major altera-tions.) This survey was made in 19’73 and repre-sented the first effort of the Division of Health andSocial Development to review existing informationsystems within the State with an eye toward howeffective the systems were and how the quality oftheir outputs could be enhanced by combining withor adding to existing systems.
In 1974, the Division of Health and Social De-velopment applied for and received three contractsfrom the National Center for Health Statistics. In1975, a fourth component was added. As you areaware, the philosophy of the Cooperative HealthStatistics System has been to establish informationsystems that are responsive to the needs of multipleusers. In South Carolina, we have expanded thisphilosophy to try to develop health and social serv-ices information systems that are:
1) Established on mandatory processes wherepossible (ie, licensure)
210
2) Responsive to a wide range of users includinggovernmental and private sector users
3) Built in that agency, association, nonprofitorganization, or other group that is best ableto build and implement the system
4) Build onto existing systems where those sys-tems do meet the data needs of legitimateusers and
5) Producing data that can be integrated, evalu-ated, and disseminated for health and socialservices planning purposes.
The Health Manpower, Health Facilities, VitalStatistics and hospital care information systems inSouth Carolina have been built with these conceptsin mind.
For the remainder of this discussion, I wouldlike to describe several approaches to shared infor-mation systems that have been and are being testedin South Carolina.
In late 1974, the Division of Health and SocialDevelopment and the Commission on Higher Edu-cation began the cooperative development of ashared information system on health manpowertraining programs being offered in South CaroIina,A review of the seven NCHS components will re-veaI that one gap in the Cooperative Health Statis-tics System is the Health Educational Component,By July 1975, Health Educational training surveyshad been mailed and returned for over 95% of thehealth manpower training programs being offeredin South Carolina. By linking our Health Manpow-er and Health Educational Training informationsystems we have been able to provide a valuableinformation base for such organizations as:
1) The Statewide Master Planning Committeefor Nursing Education
2) The Health Education Authority of the- Commission on Higher Education
3) The South Carolina Area Health EducationCenters, and
4) tie Health Systems Agency and the StateHealth Planning Agency
The strength of this cooperative effort betweenhealth planning and health education training is theInteragency Agreement on Health Manpower Plan-ning and Training. This agreement, endorsed byseven State agencies with health planning and train-ing responsibilities, assigns roles and responsibilities
to the division and to the educational sector withregard to the planning and training for healthmanpower in the State.
It assigns the responsibility to determine theneed for health manpower to the State health plan-ning agency and the responsibility to insure theadequacy of the training and the place of trainingto the educational community. In South Carolinawe are trying to develop health planning methodol-ogies that are comprehensive, in that they addressthe issues of need and supply, provide for the de-velopment of plans to respond to determinedneeds, and, most importantly, provide for means bywhich the plans can and will be implemented.
Speaking from a background in health plan-ning, I can say that in the past, health plannershave placed more emphasis on the development ofplans and less emphasis on how the plans could beimplemented. This interagency agreement com-pletes the health manpower planning circle inSouth Carolina by encompassing both health man-power planning and the development of healthmanpower resources. The agreement has been buihupon the concept of a single shared source ofhealth information responsive to the data needs ofmultiple users.
From our experience in the development of theInteragency Agreement, we became aware of themagnitude of the responsibilities that had been as-signed to the State Health Planning Agency in thearea of needs assessment. As a result of this aware-ness, we began to work with the Employment Secu-rity Commission in another area, to review themethods they employ to estimate and project man-power needs and to determine whether or not suchmeasures could be applied to one segment of thetotal labor market—the health manpower portion.
The results of the review have been exciting tous. The bases for determining replacement ratescan be broadly categorized as:
Mortality ratesDisability ratesRetirement rates andMobility rates.
By utilizing the Cooperative Health StatisticsSystem and adding to it, in South Carolina we havebeen able to develop a “tracking” system for li-censed health professionals. From questionnairessuch as those completed on all licensed health man-power in the State, we have the ability to establishoccupation-specific, age-race-sex-specific, separationrates due to:
disability,mortality,retirement, andmobility.
The rates can be determined by noting changein activity status due to the disability, retirement,and mobility. Where no such information is availa-ble, we will engage in followup studies to deter-mine why health professionals have altered theiractivity status. This concept of using separationrates is one of the components of the EmploymentSecurity Commission model for estimating and pro-jecting manpower needs. One limitation of theEmployment Security Commission model has beenthe inability to accurately forecast mobility and itseffects on the available work force in an area. The“tracking” system that we are building can detectmobility patterns by professions. Because we havebeen impressed with the expertise and cooperationexhibited by both the South Carolina EmploymentSecurity Commission and the Department of Laborat the National level, we requested a meeting at thenational level to bring ~ogether the National Centerfor Health Statistics, the Bureau of Health Manpow-er, and the Department of Labor to discuss how wemight be able to work together cooperatively tobuild a quality data system for health manpower,recognizing that health manpower is only a subsetof the comprehensive employment arena in whichthe Department of Labor and the EmploymentSecurity Commission must work. The results of thatmeeting and subsequent meetings have been thatwe would modify the physician and chiropractic re-licensure forms to meet the data needs of the Em-ployment Security Commission, and assess the feasi-bility of utilizing the NCHS Health ManpowerComponent to gather Employment Security Com-mission data elements for all licensed health man-power and the NCHS Health Facilities Componentto gather Employment Security Commission dataelements on those persons employed in inpatienthealth facilities. The initial format for the collection’of the unlicensed Health Manpower data for theEmployment Security Commission will not differsubstantially from that used in 1973 for hospitalsand nursing homes.
We believe that efforts to cooperate in systemsdevelopment such as those cited above create infor-mation systems that are “partnerships.” From theperspective of the Division, our information systemhas been expanded to cover health manpower cate-gories that previously would not have been coveredin our original systems design. From the viewpointof the Employment Security Commission, their database has been expanded from one based on surveyto one that covers in excess of 90% of the healthmanpower universe. Further, additional informa-tion such as mobility rates not available from theexisting Employment Security Commission systemcan now be put into their estimation and projectionmodels.
For the future, we have submitted an unsolicit-ed proposal to the National Center for Health Sta-
211

tistics and the Bureau of Health Manpower thatdescribes efforts that we would like to pursue withthe Employment Security Commission and others inthe development of health planning models. In thedevelopment of these models, we will draw heavilyupon the cooperative systems that we have designedand implemented.
In the development of the Health Facilities Sta-tistics Component, we are looking beyond simplyhealth facilities statistics, to total information sys-tems within the Departments of Mental Health,Mental Retardation, and the Commission on Alco-holism and Drug Abuse.
When fund;ng for the Health Facilities Compo-nent was originally sought, the idea of a Consor-tium on Human Services, Facilities, Licensing, andCertification seemed emminent. As time passed, cer-tain issues related to organizational structure andprimary responsibility proved difficult to resolveand we were forced to deal individually with fivemajor health and social agencies in an attempt toorganize an inpatient health fac~lty system for theState. What at first appeared to be unfortunateeventually proved to be quite fortiutous. In workingwith each agency we realized that agencies such asthe Department of Mental Health, the Departmentof Mental Retardation, and the Commission onAlcoholism and D~g Abuse had not only devel-oped facilities information systems, but also man-power, dlent data, and in some cases cost-account-ing systems and many of these systems were linkedto national systems (e.g. Ment~ Hedih.) “From ourperspective we asked why simply coordinate healthfacilities information across agency lines when coor-dination can and should occur in manpower, clientdata, and financial data also.
This comprehensive approach to coordinatingthese information systems is our immediate goal.These agencies have CHSS - like components andthese components can and should be coordinatedwith the State CHSS to provide a total informationbase from which health and social planning can beaccomplished.
One point that I would like to make in closingis that it is imperative in the design of health infor-mation systems that the users of these systems havesubstantial input. The best laid plans can be ren-dered useless, without the guidance, direction andsupport of health systems agencies’ personnel andother health planners at the local and State levels. Itis incumbent upon the designer of any system toevaluate the market and its response to and needfor the project. As the agency to be designated theState Health Planning Agency in South Carolina,we are especially cognizant of the importance ofseeking local and State planning expertise in thedesign of these systems. To this end, we have estab-lished a Committee on Data Use and Analysis,.composed of HSA representatives and systems de-sign personnel. ~ls Committee provides the Man-agement Support Systems Section with the localplanning perspective that is essential to the successof the information systems we are designing,
I sincerely hope that this description of cooper-ative efforts in health manpower and facilities infor-mation systems design has given you some ideas asto how you might be able to approach similar situa-tions within vour own State. If we have achieved,any margin of success, it is becausestrived to develop the best system,ized manner with shared control.
we have alwaysin a decentral-
212
AMBULATORY CARE UTILIZATION
Mr. W. David Helms, Executive Director, Alpha Center for Health Planning, Syracuse,New York
INTRODUCTION
Given the lower than expected funding levelfor Health Systems Agencies (HSA’S) and the falseconfidence many lay. Board members have that theFederal and State Governments will provide thedata they need, there is some concern that HSA’Swill not be able to acquire sufficient staff to performthe data management and analysis function. Thusdespite the tremendous emphasis P.L. 93-641 placeson data, HSA’S will not, in my opinion, have ade-quate staff and money to provide the data and anal-ysis needed to perform effectively their mandatedfunctions of plan development, project r~view andresource development. By effectively performing-these functions, HSA’S are expected to have mea-surable impact on achieving what appears to be thefive major goals of the Federal government:
● Cutting health care costs;● Reducing financial barriers to health care;● Putting greater emphasis on primary care
and increasing its availability;● Providing better preventive care; and● Improving the quality of care.
If health ,planning agencies are to ‘understandthe nature of these problems and have an impacton improving the availabdity of ambulatory alterna-tives, they will need data on how current sources of”ambulatory care are being utilized. This paper will(1) briefly review the problems HSA’S will have inmeasuring the utilization of ambulatory care, (2)describe the approach used by a comprehensivehealth planning agency to collect data on how var~ious sources of ambulatory care were being utilizedin its area and (3) suggest interim measures thatwould enable HSA’S to ‘obtain local utilization data.
.
Problem’s “inMeasuringAmbulatory Care Utilization
In a recent publication entitled Gttide to ‘Datafor Health Systems PJanners, the Bureau of Health.Planning and Resources Development recognizedboth the need for ambulatory care data and prob-lemsagencies will face in get~ng it:
In order to tvaluate the current :stdt~s of :am-bulatory care and to plan ‘for future ‘ambulato-ry care services, the health systems agencyneed ambtdatory care data.
However, a major problem remains: the healthsystems agency is forced to dl al with issues forwhich little or no useful data may be available.The uniform minimum basic ambulatory caredata set . . . cannot yet be considered a data sys-tem. Most ambulatory services rendered byagencies are not yet subject to common datamaintenance and reportage requirements.While the data that will be made available fromthe National Ambulatory Medical Care Survey(NAMCS) conform to a large extent to the ba-sic data set, they will be in the form of nationaland regional estimates, rather than estimates atthe local level.
Considering the scarcity of data available onambulatory care, the health systems agency mayneed to conduct its own survey to obtain ambu-latory care data. This would be especiaJJy neces-sary with regard to private physicians. Withrespect to outpatient setvices (including mentalhealth centers), it may be possible to assembleand analyze extant data . . . .
In spite of this recognized need, the Guide goes ontotsay:
.
Untfi ‘the evolving Federally ,mandated datacollection activities ,provide for more -and :hlgh-,er quality data at levels that are most useful tothe health ,planner (i.e. ambulatory care utilizat-ion data disaggregate at least ‘by medical spe-ciaJiy and geographic area), the health systemsagency will have to implement its plann’ing andproject review functions using existing data.
resources, The data themselves will limit *the:scope and detail df ‘the health ,pJanning /pro=<cess.*
‘Given that the data require’d for arnbulatok$@t-e planning cannot now be provided by the Fed-eral Government, HSA’S w~ inevitably look to State.
government for sources of this needed data. .SomeStates do generate inventory data on ambulatory
*Dep’artine”ntof Health~ Edu&tion and Welfare, Pub-‘fic Health Service, Health Resources Administration, Bu-reau of Health Planning and Resources Development, Di-vision of Planning Methods and Technology, National “Health Planning Information Center, Guide to Data forHealth Systems Planners, Health Planning InformationSeries No. ‘2, Aprif 1976, HEW Document No. HRA. 76-14502, p. 119. <f
,..? ’213,,
$,” .-./
.{”.. .
care providers through the licensure and registra-tion of health manpower. States do collect summarystatistics on outpatient and emergency room visits asa part of their hospital data facilities and servicesinventory. However, it is doubtful that the Stateswill be able to provide ufllzation data on physicianoffices which account for 83 percent of all visits tophysicians. Visits to hospital outpatient clinics,emergency rooms, and other clinics account forslightly more than 15 percent of the total, andhome visits for less than two percent.** Thus whileHSA’S will probably be able to obtain inventory dataon physicians and summary data on hospital outpa-
- tient clinics and emergency rooms, they will not beprovided data on how these and other ambulatorycare resources are utilized.
Before suggesting several interim approachesthat would either reduce the need for original datacollection or would minimize the expense and effortof collecting the data required for specific purposes(e.g., the data needed to estimate need or demand),I will first describe the approach used by a compre-hensive health planning agency to collect ambulato-ry care utilization data. This data collection effortwas undertaken as a part of a rather ambitious plandevelopment program- conducted by Areawide andLocal Planning for Health Action, Inc. (ALPHA), acomprehensive health planning agency in CentralNew York.
ALPHA’s Ambulatory CarePlanning Program
ALPHA’s Ambtiatory Care Planning Programbegan in the spring of 1972 when the ALPHABoard directed that ambulatory care planningshould become ALPHA’s most important concern.This program had the following three basic objec-tives:
1.
2.
Provide the necessary tools a planning agen-cy needs to conduct its plan development,resource allocation, and project review re-sponsibility.Inform the public on the strengths andweaknesses of existing ambulatory care serv-ices.
**National Center for Health Statistics, ph ysia-an viS-
. its, Volume and Interval Since Last Visit: United States,1971. Vital and Health Statistics, series 10, Data from theNational Health Survey, No. 97. Public Health Service,Health Resources Administration, Rockville, Maryland,March 1975, p. 9. Physician visits are defined in the Na-tional Health Survey to include afl consultations in personor by telephone with physicians a’nd health personnelunder their supervision. Office visits themselves accountfor about 70 percent of all visits and telephone consulta-tions for another 13 percent.
214
3. Encourage system intervention by involvingcommunity groups, health providers, andothers responsible for health planning anddevelopment.
The five major research components of thisProgram are briefly described below:*
1. GOALS AND STANDARDS
A. Set minimum goal levels for physicianmanpower and ambulatory care services
B, Set standards for how primary careshould be organized and provided
2. INVENTORIES
A. Inventoried active physicians by locationand specialty
B. Inventoried vast array of clinics and sup-port services that range from the moreformal clinic services provided by hospi-tals and public health departments tocounseling and screening services provid-ed by voluntary organizations on an ir-regular basis
3. UTILIZATION STUDIES IN PROVIDERSETTINGS**
A. Physician Offices. This survey, based onthe National Center for Health Statistics’pioneering National Ambulatory MedicalCare Survey (NAMCS) of physician utili-zation, was designed to provide basic in-formation on the characteristics of pa-tients’ problems and utilization of serv-ices, the characteristics of office-basedpractices and care, and the current andpotential use of allied health personnel inthe provision of care. The survey method-ology uses a physician background formand a patient encounter form whichsamples patient visits during a one weekperiod.
B. ~mergency Rooms. This survey used astandardized encounter form to collectdata on all emergency visits to the 12area hospitals during a one week period.
*Appendix 1 fists the reports produced to describethe results of these five research components togetherwith information on how to obtain copies either throughALPHA or NHPIC (National Health Planning Informa-tion Center).
**See Appendix2 for a detailed description of the
methodologies used in the studies of emergency roomsand physician offices.

4. HOUSEHOLD SURVEYS
A. Case Study Approach. This survey moni-tored a small number of randomly select-ed families over a two month period, col-lecting information on how these familiesresponded to health and health relatedproblems.
B. Household Survey. This survey describesand analyzes the use of ambulatory careservices by individuals and families resid-ing in rural and semi-rural areas. A mul-tistage area sample was used.
5. EVALUATION OF SIX INNOVATIVEAMBULATORY CARE PROJECTS
The evaluation of alternative approach-es to the traditional private practice modelof delivering ambulatory and primary carefocused on issues related to the organizationand operation of the projects and on lessonslearned from these initial developmentalefforts.
ALPHA carefully documented its Program toinsure that other health planning agencies would beable to take advantage of this developmental effortand to learn from the problems we encountered.*Of the research components, the following provid-ed data on utilization:
1.
2.
INVENTORIES
Inventories generally can only collecttotal utilization for a given period. Becauseof the limited capacity of many ambulatorycare services to collect data, these datausually are not disaggregated by servicerendered, age, sex, or other patient charac-teristic. For the same reason the reliability ofthese data may also be questionable.
UTILIZATION STUDIES IN PROVIDER “SE~INGS
Surveys conducted in provider settingsare probably the -most accurate source forcollecting data on patient origin, the natureof the problem, and the treatment provided.
*See ALPHA, Ambulatory Care Planning Program:Documentation of Program and Research Components,
April, 1976. For each of the research components this
report describes the purpose, process for securing approv-al, methodology, andproblems encountered and lessonslearned. The project schedule is listed to give some idea of
the time frame involved and the survey forms and classifi-cation codes are reproduced.
It is difficult to use utilization studies to ob-tain data on patient’s income, education andsociodemographic characteristics. It is alsodifficult to use this source to get informationon the characteristics of an individual orfamily’s total use (e.g., number of visitsmade for the same problem, use of multiplesources of care, etc.).
3. HOUSEHOLD SURVEYS
Household surveys are the best sourcefor collecting data that relate use to individ-ual and family characteristics. They are alsothe only source for collecting data on wheth-er or not the system is used and how an in-dividual uses the various sources of careavailable. This is especially important sincethe percent who make contact may be thebest indicator of need. Many studies arenow showing that once contact is made, theamount of subsequent care a person receivesis determined by the medical system andvaries primarily by age, sex and diagnosis.
The problems with household surveysare well known. They include:
a.
b.
c.
ALPHA used
respondents’ ability to recall theirutilization experiencerespondents’ lack of understandingof problem and treatmentthe costs and skills necessary to con-duct and analyze household surveys.
the data obtained from these sourcesto:
1.
2.
3.
4.
5.
Delineate service areas and determine howfar people travel for careMake disaggreagated estimates of utilization
a. for age/sex groupsb. for various medical specialties
Identify major users of different sources ofcare and the health problems seen by thesesourcesDescribe patterns of patient care (i.e. treat-ment, followup and referral)Estimate resource productivity and capacity*
But this program was expensive. Table 1 belowprovides a breakdown of the direct costs ALPHAincurred for its Ambulatory Care Planning Pro-
*The results of our research on physician productivity
will be presented at the upcoming APHA Convention inMiami; Florida, October 17-21, 1976. The paper by Ger-
ald M. Richmond, Jr. and W. David Helms, is entitled,
“Factors Affecting the Productivity of Office Based Ambu-
latory Care Physicians.”
215229-121 0-77-15

gram. It should be emphasized that the expenditureestimates represent the direct staff costs to design,supervise, and complete the program components.For the research components this includes bothcosts of data collection, an~ysis and preparation ofa series of technical reports. The time devoted byother ALPHA staff to maintaining the ALPHA andcounty unit planning process and to developingspecific ambulatory care projects is not included inthese cost estimates. In addition, the time contt-ibu-ted by volunteers on the Ambulatory Care Commit-tee, he ALPHA Board of Directors, and countyhealth planning units is also not included in thecost figures.
TABLE 1ALPHA AMBULATORY CARE
PLANNING PROGRAMTOTAL EXPENDITURES -1972-
1975
2.
3.
physician assistants or nurie clinicians andare located in rural areas,Increased the credibility of the health plan-ning agency as a source of information tohelp communities document the extent oftheir need for ambulatory care and assessvarious alternative modes of organizing anddelivering ambtdatory care,Provided an extensive data base which isnow being used to develop the Central NewYork HSAS’ initial Health Systems Plan.
Given the high costs associated with researchdesign, we believe it would be possible to replicateparts of this Program at a considerably redttcedcost. But given my pessimistic view of the ability ofthe Federal and State Governments to provideHSA’S with ambulatory care utilization data theyneed and of the HSA’S limited resources, it seemsapparent that many HSA’S may have to limit, as theGuide to Data forHealth Systems Planners itself indi-cates, “the scope and detail” of its ambulatory careplanning effort unless some interim solutions can befound.
Progam ComponentsExpenditures
1972-1975Some Interim Approaches
Program Design and Administration $ 65,000Research Components
1. Goals and Standards 5,8002. Inventories of Physicians
and CMCS 14,2003. Utilization Studies
a. Physician Offices 41,000b. Emergency Rooms 17,500
4. Household Surveysa. Case Studies 6,200b. Rural Household Survey 21,100
5. Evaluation of Innovative Projects 22,000Plan Preparation 10,000Other Activities (e.g., film, bibliography) 7,200
Total $210,000
Was ALPHA’s effort worth the cost? I believethat those involved in health planning in CentralNew York believe that the Program and its datadevelopment effort was worthwhile. Specifically thisProgram has:
1.
216
Stimulated substantial community interestand commitment to the development ofambulatory care alternatives. Approximately16 organized ambulatory care centers havebeen developed during the course of thisprogram. Many are satellite centers using
If the National Center for Health Statistics(NCHS) and Bureau of Health Planning and Re-source Development (BHPRD) are to be responsiveto H~A need for ambulatory care utilization data,interim solutions are essential. The long term objec-tives of the Cooperative Health Statistics System(CHSS) may eventually satisfy the need for thesedata at the Iocal level. That remains an open ques-tion- It is also incumbent on those who have theresponsibtiity to assist the HSA’S in meeting theirresponsibilities, to see that planning approaches andmethodologies be developed which use readily avail-able data or data which could be collected at a rela-tively low cost by the HSA itself,
ALPHA’s current research to compare the re-sults obtained from using a variety of methods toestimate need or demand for ambtiatory care usi-ng a common data base should provide HSA’S witha basis for determining which method(s) could beused given the availability of different datasources.* A major objective of this research was todetermine whether or not it was necessary for anHSA to collect physician utilization data. It was ourhope that one of the methods which used data that
*The results of this research are to be presented atthe upcoming APHA Annual Meeting in Miami, Florida,October 17-21, 1976. The paper by W, David Helms andGerald M. Richmond, Jr. is entitled, “A Comparison ofMethods for Determining Ambulatory Care Need Using aCommon Data Base.”
could be obtained without too much cost wouldyield estimates about as, reliable as those developedfrom physician utilization studies conducted at thelocal level. This research appears to indicate that:
1.
2.
3.
4.
Given
Planning techniques which apply rates devel-oped from national surveys to estimate localutilization do not produce estimates whichreflect the considerable variation in demandwhich exists among local areas. This is com-pounded since there is also considerable var-iation in the per capita utilization measuredby the two major national sources: NationalAmbulatory Medical Care Survey and Na-tional Health Survey. These sources alsovary considerably from the utilization ratesderived from ALPHA’s Physician UtilizationSurvey. See Table 2.
The considerable variation that exists inphysician productivity due to age, specialty,and number of support personnel employedmakes it difficult to assess resource capacityat the local level using national or even re-gional norms. This is especially true whenthe assessment of capacity is for a small areawith a limited number of physicians.
If agencies are going to be expected to usemultivariate techniques to predict resourceneed or capacity, “then they will need utiliza-tion data for local areas or resources.
Thus, as, you might have guessed, it is ourconclusion that HSA’S will need some utiliza-~ion data specific to their local area.
that HSA’S will need helD in ~ettin~ thesedata, we propose the following i~terimvmeas;res beconsidered.
1. Add an additional question on the volumeof patients physicians see during an averageweek to the minimtim data set for healthmanpower. This question could be added tothose professions which see patients in of-fice-based settings (e.g. physicians, dentists,optometrists, etc.)
2.
3.
4.
For those States collecting less than the mini-mum data set on physician manpower data,but which do have an ongoing data collec-tion function as a part of the registrationand licensure process, develop a long formwhich includes some of the questions fromthe NAMCS physician background question-naire. The long form could be administeredon a sample basis as part of the regularmanpower registration process.
Develop a short version of the NAMCSwhich could be conducted by an HSA withextensive technical assistance provided bythe NCHS and its CHSS. Perhaps the Stateagency responsible for implementing theCHSS” within a State could also assist theHSA in conducting and analyzing the sur-vey. The Applied Statistics Training Insti-tute (ASTI) and the Regional Centers forHealth Planning could assist in the provisionof training and technical assistance.
Through the CHSS system, provide induce-.ments for State government to standardizethe data elements used by hospitals on theiremergency room encounter forms. Hospitalscould add additional data elements andcould arrange them on the form as theywish. With standardized data elements andclassification codes, HSA’S would be able tosample emergency room forms and transferthe standard data elements to a commoncoding form.
CONCLUSIONWe must find interim measures to assist HSA’S
in performing their rather awesome assignment. Ibelieve that HSA’S can have an impact on reducingcosts and promoting ambulatory care alternatives.But we must give them a chance. And that meanssufficient resources, better technical methods, andan adequate data base. It would indeed be ironicalif the HSA’S were not able to achieve the desiredsystem intervention through increasing ambulatorycare alternatives because they weren’t provided theresources necessary to acquire the adequate staffand data.
217

TABLE 2
PER CAPITA UTILIZATION RATES TO OFFICEBASED PHYSICIANS BY SPECIALTY IN
THE UNITED STATES AND ALPHA AREA
! Ambulator Care Physicians
Primary Care Physicians
General and Family PracticeInternal MedicineObstetrics-GynecologyPediatrics
Second~ Care Physicians
I General SurgeryOther Secondary Care
United States
NationalAmbulatory NationalMedical Care Health
Survey* Survey* *
3.0 3.3
2.2 I 2.8
“ 1.3 2.0.4 .3.2 .2.3 .3
.8 ~ .5
.2 .1
.6 .4
ALPHA Area
ALPHAPhysician
UtilizationStudy
3.8
2.8
1.8.3.4.3
1.0
.2
.8
*Computed from data presented in: National Center for Health Statistics, Preliminary Data From the Nat[onal A mbula.
tow Medical Care Survey, unedited draft, July 15.1975.**office visits computed from data presented in: National Center for Health Statistics, Physician visits, volume and
Interval Since Last Visit: United States, 1971. Vital and Hedfi Statistics, Series 10, Data from the National Health Survey,No. 97. Public Health Service, Health Resources Administration, Rockville, Maryland, March 1975, p. 30,
218

Appendix I
ALPHAAMBULATORY CARE PLANNING PROGRAM
Planning Report and Technical Reports
The following documents derive from AL-PHA’s three-year Ambulatory Care Planning Pro-gram, conducted under grants from the PublicHealth Service of the Department of Health, Edu-cation, and Welfare and from the Appalachian Re-gional Commission.
Several of the documents are still availablefrom ALPHA, Inc. (1010 James Street, Syracuse,New York 13203), and are so indicated. Those nolonger in print from ALPHA may be obtained di-rectly from the National Technical InformationService (5285 Port Royal Road, Springfield, Virginia22151). NTIS identification numbers are suppliedfor these documents.
. Planning for Ambulatory Care: Guidelinesd
for Future Development. November, 1974.(Available from ALPHA, $5.00) (NTIS HRPooo3’739/oww, $5.50)
This ‘major report summarizes the re-sults and findings of ALPHA’s AmbulatoryCare Planning Program. It describes existingambulatory care services, recommends whatshould be available, and identifies gaps be-tween the goal and the current system. Mod-els and strategies are presented for the
‘ consideration of those involved in healthplanning to meet the identified needs for thedevelopment of an appropriate ambulatorycare system for Central New York.
. Technical Report No. 1, Ambulatory CareResources in the ALPHA Area, September1974. (NTIS: HRP 0002704, $4.75]
This report compares the relative availa-bility of physicians, clinics and other organ-ized sources of. care at different levels in theambulatory care system throughout AL-PHA’s six county area.
● Technical Report No. 3, The use of Ambu-latory Care Physicians in Central New York,March 1976. (Available from ALPHA,$5.00) (NTIS: To Be Announced)
This report will assess the utilization ofthe major source of ambulatory care: thephysician’s office. It will examine the distri-
bution of medical problems treated in physi-cian offices and the services rendered byphysicians and allied health personnel.
●
●
●
●
Technical Report No. 4, Emergency RoomUtilization in Central New York, October1974. (NTIS: HRP 0004569, $4.50)
The document presents the findings ofan emergency room study covering a oneweek period of observation in the 12 hospitalemergency rooms in the ALPHA area.
Technical Report No. 5, RuraJ Health Needsin Central New York, July. 1974. (NTIS:HRP 0003769/7WW, $4.00)
This report presents the results of ahousehold survey conducted in the southernportions of Cortland and Tompkins Coun-ties. It describes and analyzes the use ofambulatory care services by individuals andfamilies residing in the underserved ruraland semi-rural areas. Medical utilization pat-terns, consumer attitudes toward presentconditions, and planning alternatives arepresented.
Technical Report No. 6, An Evaluation ofSix Innovative Ambtiatory Care Projects inCentral New York, September 1974. (Avail-able from ALPHA, $5.00) (NTIS: HRP0003692, $3.75)
This report summarizes findings con- ‘cerning the effectiveness of innovative ap-proaches employed by six ambulatory careprojects. Issues related to the developmentand operation of ambulatory care servicesand three models of medical manpower utili-zation are proposed.
Ambulatory Care Planning Program: Docu-mention of Program and Research Compo-nents, April 1975. (NTIS: To Be An-nounced)
This report documents the process andresearch activities of ALPHA’s AmbulatoryCare Planning Program. It reviews method-ologies used in the research component,personnel required, problems encountered,and observations on ,the utility and effective-ness of each activity.
219
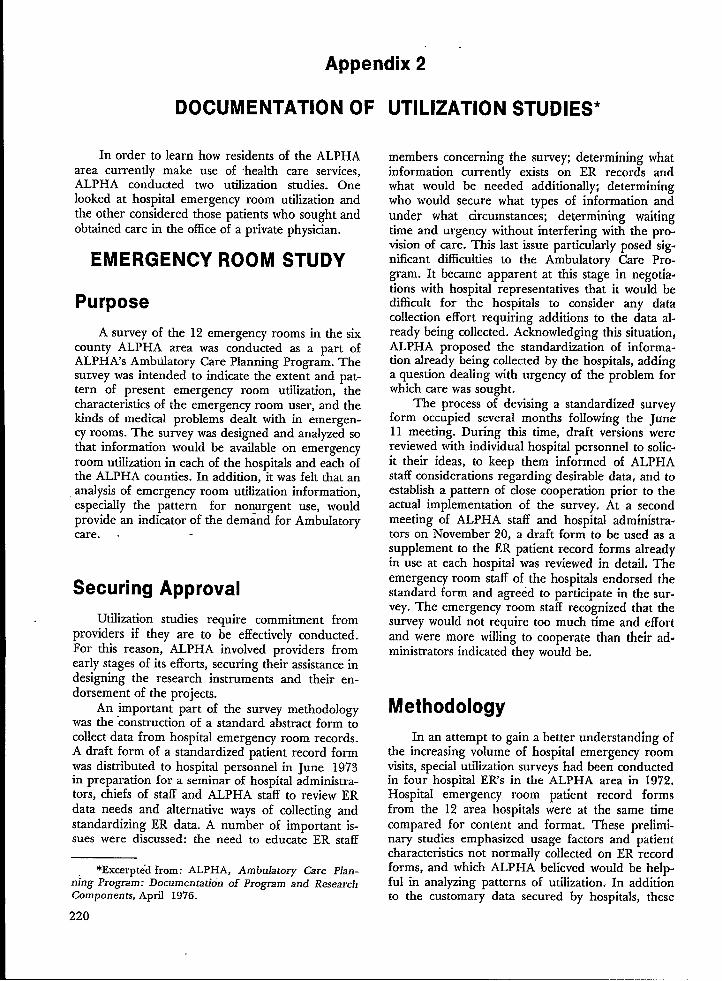
Appendix 2 “
DOCUMENTATION OF UTILIZATION STUDIES*
In order to learn how residents of the ALPHAarea currently make use of “health care services,ALPHA conducted two utilization studies. Onelooked at hospital emergency room utilization andthe other considered those patients who sought andobtained care in the office of a private physician.
EMERGENCY ROOM STUDY
Purpose
A survey of the 12 emergency rooms in the sixcounty ALPHA area was conducted as a part ofALPHA’s Ambulatory Care Planning Program. Thesu~vey was intended to indicate the extent and pat-tern of present emergency room utilization, thecharacteristics of the emergency room user, and thekinds of medical problems dealt with in emergen-cy rooms. The survey was designed and analyzed sothat information would be available on emergencyroom utilization in each of the hospitals and each ofthe ALPHA counties. In addition, it was felt that ananalysis of emergency room utilization information,especially the pattern for nonurgent use, wouldprovide an indicator of the dem~nd for Ambulatorycare. .
Securing Approval
Utilization studies require commitment fromproviders if they are to be effectively conducted.For this reason, ALPHA involved providers fromearly stages of its efforts, securing their assistance indesigning the research instruments and their en-dorsement of the projects.
An important part of the survey methodologywas the ‘construction of a standard abstract form tocollect data from hospital emergency room records-A draft form of a standardized patient record formwas distributed to hospital personnel in June 1973in preparation for a seminar of hospital administra-tors, chiefs of staff and ALPHA staff to review ERdata needs and alternative ways of collecting andstandardizing ER data. A number of important is-sues were discussed: the need to educate ER staff
*Excerptid from: ALPHA, Ambulatory Care PJa.n-ning Program: Documen tatio”n of Program and ResearchComponents, April 1976.
members concerning the survey; determining whatinformation currently exists on ER records andwhat would be needed additionally; determiningwho would secure what types of information andunder what circumstances; determining waitingtime and urgency without interfering with the pro-vision of care. This last issue particularly posed sig-nificant difficulties to the Ambulatory Care Pro-gram. It became apparent at this stage in negotia-tions with hospital representatives that it would bedifficult for the hospitals to consider any datacollection effort requiring additions to the data al-ready being collected. Acknowledging this situation,ALPHA proposed the standardization of informa-tion already being collected by the hospitals, addinga question dealing with urgency of the problem forwhich care was sought,
The process of devising a standardized surveyform occupied several months following the June11 meeting. During this time, draft versions werereviewed with individual hospital personnel to solic-it their ideas, to keep them informed of ALPHAstaff considerations regarding desirable data, and toestablish a pattern of close cooperation prior to theactual implementation of the survey. At a secondmeeting of ALPHA staff and hospital administra-tors on November 20, a draft form to be used as asupplement to the ER patient record forms alreadyin use at each hospital was reviewed in detail, Theemergency room staff of the hospitals endorsed thestandard form and agreed to participate in the sur-vey. The emergency room staff recognized that thesurvey would not require too much time and effortand were more willing to cooperate than their ad.ministrators indicated they would be,
Methodology
In an attempt to gain a better understanding ofthe increasing volume of hospital emergency roomvisits, special utilization surveys had been conductedin four hospital ERs in the ALPHA area in 1972,Hospital emergency room patient record formsfrom the 12 area hospitals were at the same timecompared for content and format, These prelimi-nary studies emphasized usage factors and patientcharacteristics not normally collected on ER recordforms, and which ALPHA believed would be help-ful in analyzing patterns of utilization. In additionto the customary data secured by hospitals,. these
220
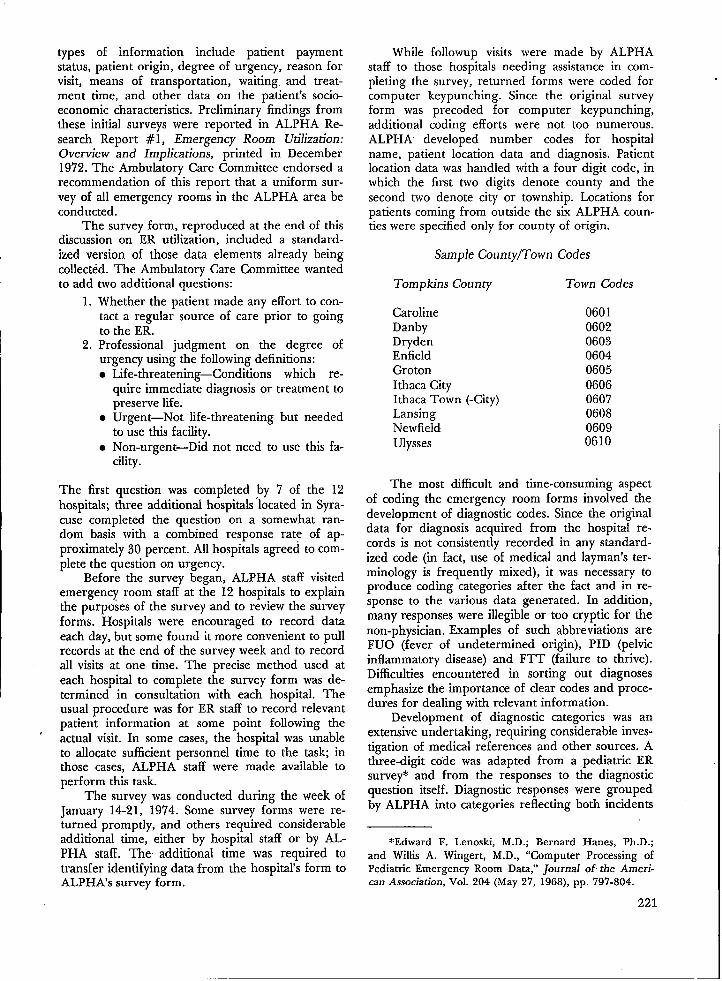
types of information include patient paymentstatus, patient origin, degree of urgency, reason forvisit, means of transportation, waiting. and treat-ment time, and other data on the patient’s socio-economic characteristics. Preliminary findings fromthese initial surveys were reported in ALPHA Re-search Report #1, Emergency Room Utilization:Overview and Implications, printed in December1972. The Ambs.datory Care Committee endorsed arecommendation of this report that a uniform sur-vey of all emergency rooms in the ALPHA area beconducted.
The survey form, reproduced at the end of thisdiscussion on ER utilization, included a standard-ized version of those data elements already beingcollected. The Ambulatory Care Committee wantedto add two additional questions:
1. Whether the patient made any effort to con-tact a regular source of care prior to goingto the ER.
2. Professional judgment on the degree ofurgency using the following definitions:● Life-threatening—Conditions which re-
quire immediate diagnosis or treatment topreserve life.
● Urgent—Not life-threatening but neededto use this facility.
● Non-urgent—Did not need to use this fa-cility.
The first question was completed by 7 of the 12hospitals; three additional hospitals ‘located in Syra-cuse completed the question on a somewhat ran-dom basis with a combined response rate of ap-proximately 30 percent. All hospitals agreed to com-plete the question on urgency.
Before the survey began, ALPHA staff visitedemergency room staff at the 12 hospitals to explainthe purposes of the survey and to review the surveyforms. Hospitals were encouraged to record dataeach day, but some found it more convenient to pullrecords at the end of the survey week and to recordall visits at one time. The precise method used ateach hospital to complete the survey form was de-termined in consultation with each hospital. Theusual procedure was for ER staff to record relevantpatient information at some point following the
,actual visit. In some cases, the hospital was unableto allocate sufficient personnel time to the task; inthose cases, ALPHA staff were made available toperform this task.
The survey was conducted during the week ofJanuary 14-21, 1974. Some survey forms were re-turned promptly, and others required considerableadditional time, either by hospital staff or by AL-PHA staff. The additional time was required totransfer identifying data from the hospital’s form toALPHA’s survey form.
While followup visits were made by ALPHAstaff to those hospitals needing assistance in com-pleting the survey; returned fo~ms were coded forcomputer keypunching. Since the original surveyform was preceded for computer keypunching,additional coding efforts were not too numerous.ALPHA developed number codes for hospitalname, patient location data and diagnosis. Patientlocation data was handled with a four digit code, inwhich the first two digits denote county and thesecond two denote city or township. Locations forpatients coming from outside the six ALPHA coun-ties were specified only for county of origin.
Sample County/Town Codes
Tompkins County Town Codes
CarolineDanbyDrydenEn fieldGrotonIthaca CityIthaca Town (-City)LansingNewfieklUlysses
0601060206030604060506060607060806090610
The most difficult and time-consuming aspectof coding the emergency room forms involved thedevelopment of diagnostic codes. Since the originaldata for diagnosis acquired from the hospital re-cords is not consistently recorded in any standard-ized code (in fact, use of medical and layman’s ter-minology is frequently mixed), it was necessary toproduce coding categories after the fact and in re-sponse to the various data generated. In addition,many responses were illegible or too cryptic for thenon-physician. Examples of such abbreviations areFUO (fever of undetermined origin), PID (pelvicinflammatory disease) and FTT (failure to thrive).Difficulties encountered in sorting out diagnosesemphasize the importance of clear codes and proce-dures for dealing with relevant information.
Development of diagnostic categories was anextensive undertaking, requiring considerable inves-tigation of medical references and other sources. Athree-digit co”de was adapted from a pediatric ERsurvey* and from the responses to the diagnosticquestion itself. Diagnostic responses were groupedby ALPHA into categories reflecting both incidents
*Edward F. Lenoskl, M.D.; Bernard Hanes, Ph.D.;and Willis A. Wingert, M.D., “Computer Processing ofPediatric Emergency Room Data: Journal of tie Ameri-can Association, Vol. 204 (May 27, 1968), pp. 797-804.
221

and procedures (accident, minor surgery) and sys-temic problems (gastrointestinal system disorders orcomplaints). Physicians on the staff of the UpstateMedical Center were consulted regarding appropri-ate grouping of diagnostic data. The followingmajor diagnostic categories were established.
Accidents and Trau-ma
AllergiesCardiovascularCentral Nervous
SystemEar, Eye, NoseHematologicDermatologicEndocrineGastrointestinalGenitourinary
Communicable Dis-eases
NutritiveMusculoskeletalUpper Respiratory
InfectionLower Respiratory
InfectionMentalMinor ProceduresWell, Physical ExamDead On Arrival
All data were keypunched, transferred to mag-netic tape, and processed at the Syracuse UniversityComputing Center using the “Statistical Package forthe Social Sciences” (SPSS). Tables and Contingencytables were constructed from the computer print-outs where appropriate. Chi square and other rele-vant statistical tests were applied for determinationof statistical association.
The preliminary analysis involved a comparisonof frequencies by hospital. As soon as tils analysiswas completed, the results were distributed inMarch to hospital administrators and staff. Theirreactions and comments were solicited on this andsubsequent drafts.
In the subsequent analysis additional variableswere created from the existing data set:
1.
2.
3.4.
An income proxy variable was created fromthe Medicaid-Non-Medicaid dichotomy.A variable on whether the visit occurredduring the hours physicians’ offices weregenerally open was created from the dateand time of visit. This was termed the con-venient-inconvenient variable.Weekend vs. weekdayThe hospitals were mou~ed by size (number,of ER ~sits) and by loc~tion (urban vs. ru-ral).
The mapping and analysis of the patient origindata assisted in ALPHA’s effort to delineate ERservice areas. Preliminary findings of the surveywere presented to the Ambulatory Care Committeein May 1974. Additional analysis of the survey datawas conducted over the summer. The final versionof the survey report was completed during Septem-
222
ber 19’74. Preparation for printing was accom-plished during the remainder of the year.
Problems Encountered andLessons Learned
1. There was some delay in the return of sur-vey forms from the hospitals, ostensibly as aresult of time pressure on ER personnel,Several weeks were spent by ALPHA staff ingoing to these hospitals, making arrange-ments to use ER files to retrieve the desireddata, and recording data. A time-consuming
2.
3.
4.
aspect of this process was the frequent ne-cessity to consult ER staff regarding diag-nostic and treatmentdata recorded cryptical-ly-or incompletely— on patient recordforms. It was also necessary to consult withER personnel regarding the urgency ques-tion.
Another problem occurred when a majorarea hospital failed to record data complete-ly or consistently. This required that AL-PHA staff redo the survey, working fromthe hospital’s patient record files after-the-fact; to access these files it was necessary towork through ER log records for the files. Agreat deal of time was thus required for atask that could have been completely avoid-ed had the hospital correctly supervised itspart of the survey initially, or informedALPHA that it could not provide staff forthis task.
To make full use of emergency room infor-mation obtained by hospitals, data should beavailable on a consistent and comparativebasis for hospitals in a defined area, Limita-tions encountered in this study primarilyinvolve the lack of uniform categories anddefinitions among hospitals, and the mannerin which the data are collected and man-aged. Moreover, without a standard defini-tion of urgency, it is difficult to comparemuch more than absolute numbers of visits.The standardization of the urgency determi-nation is a necessary prerequisite for usingemergency room data to project ambulatorycare demand.
On the basis of its experience in conductingthe ER survey, ALPHA suggested that astandard set of minimum data elements andappropriate standard definitions for thesedata items be developed for use by all hospi-

tal emergency rooms in the ALPHA area.Hospitals could use a standard form or theycould use a form which would include thestandard data items plus any additionalquestions they feel would be appropriate totheir needs. Special surveys could be admin-istered periodically or for special purposesby the planning agency in cooperation witharea hospitals when deemed appropriate bythe hospitals and planning agency.
Project Schedule
From inception of the planning stages of theareawide ER survey to the conclusion of the writtenproject report, a total of 20 months elapsed. Theschedule of activities follows:February 6, 1973 Ambulator Care Committee
June 11,19’73
November 20, 1973
January 14-21,1974
May 1, 1974
October 1, 19’74
/authorizes areawide ER sur-vey
Proposals for standardizedER form discussed with areahospital administrators andER personnel
Draft of standardized ERform discussed with hospitaladministrators and ER per-sonnel; survey week sched-uled for January 14-21, 1974
Survey conducted
Preliminary results reportedto Ambulatory Care Commit-tee
Final report, EmergencyRoom Utilization in CentralNew York, completed
Survey Forms
1. ALPHA Emergency Room Form2. ER Survey Diagnostic Codes
PHYSICIAN UTILIZATIONSTUDY
Purpose
A survey of the ambulatory care delivered in
private physicians’ offices was conducted to obtaininformation on characteristics of ambtdatory carepatients (e.g., socioeconomic status and geographic
location), their medical problems, and the corre-sponding treatment and services. Although esti-mates of current usage of medical care suggest that80 percent of all ambulatory care is provided inphysicians’ offices, very little utilization data is avail-able on this major source of ambulatory care. Apioneer effort in overcoming this lack of informa-tion was recently undertaken by the national Centerfor Health Statistics through its National Ambulato-ry Medical Care Survey (NAMCS) conducted dur-ing the calendar year, 1974. NAMCS requests phy-sicians to complete a patient record form on a sam-ple of patients seen during a seven day period. Itcollects data relating to symptoms, diagnosis, treat-ment/setvices, and disposition for each patient visit.ALPHA’s study adopted the NAMCS methodologyadding questions on patient origin and the use ofallied health personnel.
Securing Approval
The Physician Utilization Study required theparticipation of a sample of physicians in the AL-.PHA area. The Physician Utilization Subcommitteeof the Ambulatory Care Committee was responsiblefor securing medical society endorsement; this wasin some cases a lengthy and tedious task. Physicians’cooperation was sought by approaching the CountyMedical Societies to acquaint them with the scopeand purposes of the survey, to familiarize themwith the survey instruments to be used, and to as-sure them that only a reasonably small amount oftime would be required of participating physicians.The endorsement of five of ALPHA’s six countieswas obtained and the survey was subsequently con-ducted in the five counties.
When medical societies agreed to lend supportto the study in their respective counties, joint letterssigned by the President of the county medical socie-ty and that county’s representative on the PhysicianUtilization Subcommittee were sent to the physi-cians selected for the survey sample. This letter,reproduced below, briefly announced the study andindicated that an ALPHA representative would sub-sequently contact the physician to provide addition-al information on the survey and to set up an ap-pointment for an interview.
Areawide and Local Planning for Health
Action, Inc. (ALPHA), as part of its ambulatorycare program, is conducting a survey of physi-
cians.The purpose of the survey is to learn the
characteristics of ambulatory patients, the kinds
of health problems they have and the personnel
used in treating them. The information gener-ated from this survey will benefit all of us by pro-viding a basis for improving ambulatory care. For
223
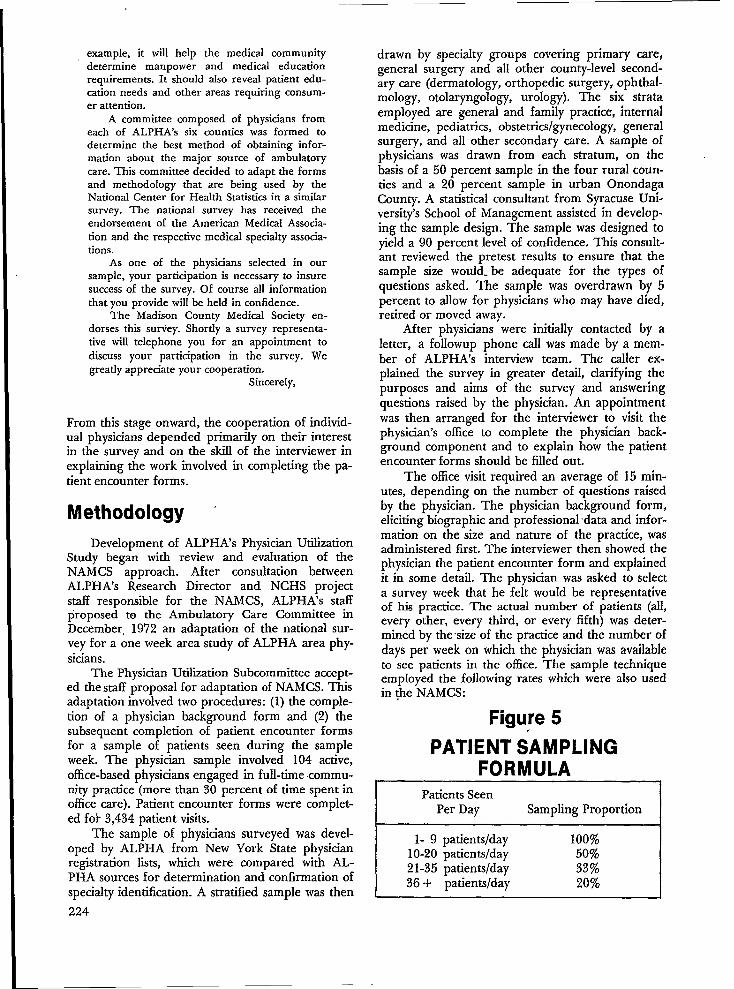
example, itwill help the medical communitydetermine manpower and medical educationrequirements. It should also reveal patient edu-cation needs and other areas requiring consum-er attention.
A committee composed of physicians fromeach of ALPHA’s six counties was formed todetermine the best method of obtaining infor-mation about the major source of ambulatorycare. This committee decided to adapt the formsand methodology that are being used by theNational Center for Health Statistics in a similarsurvey. The national survey has received theendorsement of the American Medical Associa-tion and the respective medical specialty associa-tions.
As one of the physicians selected in oursample, your participation is necessary to insuresuccess of the survey. Of course all informationthat you provide will be held in confidence.
The Madison County Medical Society en-dorses this sutiey. Shortly a survey representa-tive will telephone you for an appointment todiscuss your participation in the survey. Wegreatly appreciate your cooperation.
Sincerely,
From this stage onward, the cooperation of individ-ual physicians depended primarily on their interestin the survey and on the skill of the interviewer inexplaining the work involved in completing the pa-tient encounter forms.
Methodology
Development of ALPHA’s Physician UtilizationStudy began with review and evahtati~n of theNAMCS approach. After consultation betweenALPHA’s Research Director and NCHS projectstaff responsible for the NAMCS, ALPHA’s staffproposed to the Ambulatory Care Committee in
December, 1972 an adaptation of the national sur-vey for a one week area study of ALPHA area phy-sicians.
The Physiaan Utilization Subcommittee accept-ed the staff proposal for adaptation of NAMCS. Thisadaptation involved two procedures: (1) the comple-tion of a physician background form and (2) thesubsequent completion of patient encounter formsfor a sample of patients seen during the sampleweek. The physician sample involved 104 active,office-based physicians engaged in ftdl-time commun-ity practice (more than 30 percent of time spent inoffice care). Patient encounter forms were complet-ed fok 3,434 patient visits.
The sample of physicians surveyed was devel-oped by ALPHA from New York State physicianregistration lists, which were compared with AL-PHA sources for determination and confirmation ofspecialty identification. A stratified sample was then
224
drawn by specialty groups covering primary care,general surgery and alI other county-level second-ary care (dermatology, orthopedic surgery, ophthal-mology, otolaryngology, urology). The six strataemployed are general and family practice, internalmedicine, pediatrics, obstetncslgynecologyj generalsurgery, and all other secondary care. A sample ofphysicians was drawn from each stratum, on thebasis of a 50 percent sample in the four rural coun-ties and a 20 percent sample in urban OnondagaCounty. A statistical consultant from Syracuse Uni-versity’s School of Management assisted in develop-ing the sample design. The sample was designed toyield a 90 percent level of confidence, This consult-ant reviewed the pretest results to ensure that thesample size would. be adequate for the types ofquestions asked. The sample was overdrawn by 5percent to allow for physicians who may have died,retired or moved away.
After physicians were initially contacted by aletter, a followup phone call was made by a mem-ber of ALPHA’s interview team. The caller ex-plained the survey in greater detail, clarifying thepurposes and aims of the survey and answeringquestions raised by the physician, An appointmentwas then arranged for the interviewer to visit thephysician’s office to complete the physician back-ground component and to explain how the patientencounter forms should be filled out.
The office visit required an average of 15min-utes, depending on the number of questions raisedby the physician. The physician background form,eliciting biographic and professional ‘data and infor-mation on the size and nature of the practice, wasadministered first. The interviewer then showed thephysician the patient encounter form and explainedit in some detail. The physician was asked to selecta survey week that he felt would be representativeof his practice. The actual number of patients (all,every other, every third, or every fifth) was deter-mined by the size of the practice and the number ofdays per week on which the physician was availableto see patients in the office. The sample techniqueemployed the following rates which were also usedin (he ‘NAMCS: -
Figure 5.PATlENT SAMPLING
FORMULAPatients Seen
Per Day Sampling Proportion
1-9 patientslday 100’%10-20 patients/day 50%21-35 patientslday 33%36+ patients/day 20%

It was pointed out to the physician that a significantportion of the encounter form could be preparedby other office personnel, thereby reducing his timeburden. In most cases the physician was required toprovide data for 8-10 patients a day. Since the sur-vey covered a period of seven consecutive days, itwas expected that there would be some days onwhich no patients would be seen. It was suggested tothe physician that for convenience the records bekept as patients were seen, rather than retroactively.
, After the first few physicians returned their forms,it was possible for ALPHA interviewers to informphysicians that each form requires approximately90 seconds to complete. Interviewers left the physi-cian a reminder calendar page indicating the surveyperiod he selected, and a numbered log formstarred to indicate which “numbered patients heshould prepare an encounter form for. For exam-ple, if a physician’s practice size indicated he shouldsupply forms for every third patient, he was given alog’ form with every third number starred. Thisform was not collected to ensure patient confiden-tiality. It was offered as a device to expedite therecordkeeping process; however, we do not knowhow often this log form was actually used.
Since the NAMCS had conducted a number ofpretests of various versions of its encounter form,ALPHA was primarily interested in pretesting thephysician background form and the questionsALPHA added to the encounter form on patientorigin and use of allied health personnel. A smallpretest of six physicians was conducted in October1973.
The survey itself began in Cortland and Tomp-kins Counties in March 1974; interviews with physi-cians in Madison, Onondaga, and Oswego Countiesbegan in May. All surveys were scheduled to becompleted by September 1, and only a few actuallyextended beyond that date.
When the patient encounter forms were re-turned to ALPHA, the information was transferredto a coding form designed for computer keypunch-ing. Much information was simply transferred in itsoriginal form. Codes were developed for severalopen-ended questions. A code was developed forservices provided by allied health personnel, for thepatients own description of his problem or present-ing complaint, and for the physician’s diagnosis.The symptom or patient complaint codes use asimple, nontechnical phrase or. word and weregrouped for analysis using a classification schemeadapted from a NAMCS publication that came outafter the survey had already been coded and key-punched.* The diagnostic codes for this study were
*National Center for Health Statistics, The NationalAmbulatory Medical Care Survey: Symptom Classification,
Vital and Health Statistics, Series 2, No. 63, Washington:May 1974.
adacsted from those that had been developed for,the emergency room survey. Since this su~ey in-cluded ophthalmologists, it was necessary to developan additional diagnostic group for ocular problems.This new group included specific diagnoses thathad previously been included in the Ear, Eye, andNose category used in the Emergency Room Surveyas well as new codes for specific diagnoses. Themajor diagnostic groupings used in the PhysicianUtilization Study are listed below:
Diagnostic Groups
01 Accidents andTrauma
03 Allergies04 Cardiovascular05 CNS - Central
Nervous Sys-tem
06 Ear, Nose08 Hematologic09 Dermatologic11 Endocrine12 Gastrointestinal14 Genitourinary
16 CommunicableDiseases
18 Nutritive19 Musculoskeletal21 URI22 LRI23 Mental24 Minor Proce-
dures25 Well Child,
Physical Exam26 DOA27 Ocular
The codes for services provided by allied healthpersonnel, patient complaint and complaint groups,and the codes developed for ocular problems arereproduced at the end of this section. The remain-der of the full diagnostic code is reproduced in thesection on the Emergency Room Survey. ‘
For analysis, several diagnostic categories andcodes were collapsed and regrouped into “MedicalProblem Groups.” This was done to make the diag-nostic codes correspond more closely to the patientcomplaint codes and the categories used in the in-ventories of services and manpower. The majorcategories of the problem groups are listed below:
Problem Groups
(1) Trauma (9) Respiratory(2) Birth related (10) Digestive, Uri-(3) Well Exams nary, and Re-(4) Neoplasms productive(5) Nutrition, Endo- System
crine, and (11) MusculoskeletalMetabolism
(6) Allergy andInfectious Dis-ease
(7) Skin(8) Heart and Blood
Related
(12) Nervous Sys-tem
(13) Ear and Nose(14) Eye(15) Mental Health(16) Minor Proce-
dures
225

Initial computer processing of the coded infor-mation yielded frequencies and some basic crosstabulations to provide a preliminary picture of utili-zation of office-based physicians in the ALPHAarea.’ Cleaning up of data, additional analysis, andformulation of service area boundaries occurred inOctober and November. The analysis concerned thefollowing subjects:
●
●
●
●
●
●
●
The range and dis~”bution of heafth prob-lems presented by patients for treatment inambulatory care service settingsA comparison of patient complaints withdiagnoses to evaluate how patients perceivetheir health problemsDelineation of primary care service areasOrganization and staffing arrangements ofphysicians’ practicesThe types of services rendered in treatingspecific medical problemsThe use of allied health manpower in differ-ent organizational contexts (solo practice vs.group practice, large scale practice vs. smallscale practice, general practice vs. specialtypractice, etc.)The developments of a data base for com-paring innovative projects in the region withtraditional health care delivery models.
The analysis and report writing phase contin-ued through May 1975. The results of this surveywere “reported in the Ambulatory Care PlanningProgram Technical Report No. 3, Physician Utiliza-tion in CentrA New York.
Problems Encountered andLessons Learned
1.
2.
3.
County Medid Society endorsement wasvery important to the success of the surveyendorsement should be sought from theearliest stages of the project, Changes inlocal medical Society offices can be detri-mental to efforts to obtain suppor~ changesin the presidency of ALPHA area societiesdid cause difficulties.The response rate among physicians ineach county varied from 48 percent to 78percent, and seemed to be a direct functionof the level of commitment of the localmedical society.The response rate was better among sec-ondary physicians than among pr;maryphysicians; this reflects practice size, sinceprimary physicians tend to see larger num-bers of patients in their offices.
226
4.
5.
6.
7.
8.
9.
10.
Physicians’ time is valuable and they tend tobe vigilant against outside demands on it,Heavy schedules also made it difficult tosecure their participation in surveys. Inplanning the time needed for a survey,account must be taken of potential delays;vacations, heavy schedules, office staffingproblems, and general procrastination.Random selection of physicians in a countydoes not foreclose the possibility that part-ners will be included; it may be quite diffi-cult to convince such persons that the sam-ple is indeed random and that their re-ponses are valid and therefore needed.The physician background survey was short.and took only a few minutes to administer;it could have been longer without ill effect,and could have solicited additional infor-mation on physicians’ opinions and atti-tudes regarding allocation of time, use ofallied health personnel, health servicesavailable in the area, possible measures toalleviate shortage and alternative modelsfor providing medical care.Physicians and staff did not aIways followinstructions in completing survey forms;some responses were omitted, made partial-ly, or made incorrectly. Special effortsshould be taken to communicate instruc-tions fully to the physician and to the officestaff - who will probably complete mostportions of the survey forms,Physicians also had trouble providing cor-rect responses to questions on the back-ground form on the types of staff theyemploy. An effort to validate these respon-ses showed that 30 percent of the physi-cians provided incorrect information, Phy-sicians were especially prone to confusemedical assistants and physician’s assistantsand different types of nurses,There is a need for consistent coding ofcomplaint and diagnostic information. Ifmajor categories are developed before theactual survey commences, codes might besupplied to the physician for use in com-pleting forms although this might be resist-ed. Even if the physician’s responses mustbe subsequently recorded by survey staff,the existence of codes would simplify theresearch task of the health planning agen-
cy.ALPHA felt that its ~atient encounter form,could have sought’ greater specificity inresponses concerning the category of well-care treatments, such as exams, historyand so forth; most patients receive suchattention, so an affirmative response does

11,
not indicate too much. Questions concern-ing these areas could be elaborated; itmight also be helpful to include a questionto indicate whether the patient’s problemoriginates in any type of accident, as in theEmergency Room Survey.Conducting a ~hvsician survev requires ahigh level “of c~rnmitment “from a ~umberof persons (physicians, county medical so-cieties, office personnel); in view of thisinvolvement, it is important to allocate
appropriate levels of well-trained surveYstaff to the project, both to guarantee ef-fective results, and to assure participantsthat the survey is thoroughly conceivedand administered.
Project Schedule
June 1973 Ambulatory Care Com-mittee appoints Physi-cian Utilization Subcom-mittee to evaluate anALPHA staff proposalto adopt NAMCS sur-vey.
January 1974 Physician UtilizationSubcommittee issuedreport; initial contactsmade to secure countymedical society endorse-ment.
February 1974 Pretest conducted inCortland County; sam-ple constructed for fivecounties.
March 1974
May 1974
September 1974
October-November 1974
January-February 1975
March-April 1975
May 1975
Physician interviews andsurveys begun in Cort-land and TompkinsCounties.
Surveys begun in Madi-son, Onondaga, andOswego Counties.
Survey phase completedin all counties; datacoded and initial com-puter processing begun.
Cleaning up data, initialanalysis and formulationof service areas conduct-ed.
Review of initial analysis “and writing of computerprograms “for furtheranalysis.
A~a!ysis and reportwrltmg.
Final report printed.
Survey Forms
1. Physician Background Survey2. Patient Encounter Form3. Codes for Services Provided by Allied
Health Personnel4. Codes for Ocular Diagnoses5. Codes for Patient Complaints and Complaint
Groups
227
—

I“IIcpatient encounter form is i-o a large degree self -explana-fiorye Le.~l ~
review one to see if you have any questions about the form.
It is essential to record the name of every patient visiting the officefor medical care on form A. The patient encounter form must be completed foreve ry patient. By adhering to ‘the procedure set forth on form this
sampling plan will be easy to follow.
In the national studies, it has beerr determined that completing the formimmedia-te!y after the patient’ encounier, requires the least amount of work andprovides the most reliable information. We would appreciate your following therecommended procedure.
If you or your staff has any questions about the form, please do not hesi-tate to call me.
I will pick up the forms on
228

Da-l-e: ——.—. —
T itrle13egarl: .—.
T ime Comp Ie-ted: ——
interviewer:
Physicians Iiame: —
Physicians Address:
ID ——_ —______
Doctor, before we begin, Ie-t me take a rnornent to explain the
importance of the survey.
The primary purpose of ‘i-hissurvey is i-o collect i’~formationmedical care provided by pilysicians in their offices. While more
al I amb(~latory care is rendered in this setting, there is vir’i-ualmation about this type of ambultory care.
purpose and
about thethan 83$ ofy no infer
This information is needed by medical educators, health planners and allothe!- c~ncerned wi-tllh(+~ll-h care.
*
The survey is designed to minimize your task while maximizing the infor-mation collected.
I would like to begin by asking you some questions about your practice.The answers will be used for classificai-ion and analysis. Of co~rsej ail iiifar-mati on yOLI provide will be held in strict confidence.
1, \~hat is your rnsdical specia
9G. What is your age? ——— —
+y ? —.- ——
3, What percent of your practice is devoted to offcare? —
4. Are you engagedphysicians iri a
in a solo practice, or ?Ire you
ce based primary
ssociated with,c~ther})ar+nership} or in a group prac-tice? .—.— . ..-——. .
229

Eo
~. How m~iny people are employad ful I time (J55 hours or more per week) in your;praci’ice? [10 n(>t il~clude physicians. (NOTE: IF DOCTOR PRACTICES IN LARGEGROiJ[3, THE [’OLLO!{lh!G lNFOR1’tAT!!ll{ CAN BE OBTA!NED FI?O!4 SOMEONE ELSE.)
A. How many of these full time employees are... (Read list of employees and
record ;Iumber O:f each in cc>lurnn A;)
.
AFull Time
Employees (35 or more hours/week)
TOTAL :.,●
(1) Registered Nurse(s) #
(2) Licensed PracticalNurse(s) # —.—.
(3) Nursing Aide(s) #
(4) Physician Assistant(s) #
(5) Technician(s) .#
(6) Secretaries orReceptionist(s) #
(7) Other (Specify)
#

6. \lnat is the total number of pari. time employc;cs (less i-llan 35 hours a week)of ycu.r practice?
ticIw many of” fheseand record number
Approximately how
part time employees are. . . (Read list of employeesof each in column B.)
many
for each part time emp
hours a week is/are the employed? (Readeyed category.)
B
Par-f- Time ‘Employees (Less than j—-. -,.,.-
:1)
:2)
:3)
(4)
(5)
(61
(-7)
Registe~d Nurse s
Licensed PracticalNurse(s)
Nursing Aide(s)
Physician Assistant(s)
Technician(s)
Secrefarie~ or
Receptionist(s)
Other (Specify)
TOTAL :
#
#
#
#
#
#
#
i hours/week)—._ ..,_.,irs.
-+
Hrs. Hrs.
— _L-.-—. — —.
t7. Are you accepting any new palients? ‘(es No—. —

E14TER TOTAI- Ul\!OZF{ llP,” BE&OVi Aid: CIF?C;\l; 0/4 APPROf’RIATE LIE.—.——. —————..
9. During that week IIOW many days will you see patien”ts at your office?
A--Patient Record is to be
completed for ALLpatients listed an Log.
SECOND patient listed,on Log.
C--Patielit Record is to becompleted for everyTIIIRD patient listedon Log.
*D --]~aticllc Record is to be
completed for everyl:IIJT1l patient listedon Log.
ENTER TOTAL FROII FR021Q. 5-B. DAYSQ. 5-A.
1 2 3 4 5 617
1-1- 10 PATIENTS AAAAAAA
I il- 20 i iEAAAAA7
31- [+() CBBAA AA
41- 50 DC BBA AA
51- 60 DC BB BAA
]61- 70 I ID DC BBBA
I 71-80 I ID DC BBBB
]81- 90
‘- Im
91-100
101-110.-——. —___111-1.20
— -—.—232

AREAWIDE & LOCAL PLANNING FOR HEALTH ACTION, INC.
~SURANCE OF CONFIDENTIALITY - All information which would permit iden!ificotlon of on individml, o practice, or on establishment will ~ held confideotio],wdl be used only by persons engaged in and for the purposes of the survey and WIII not be dlsclmed or released to other persons or used for any other PLIPOW.
2. PATlENT ENCOUNTER FORM
Address / /street Cify, Town or W1l.ge zip
Age Sex M— F_ Date.
1. Did this patient see any allied health persannel? —Yes —Nc
2. If yes, which of the following allied health persannel did this patient see?(Check all that apply)
1 ❑ Registered Nurse 4 ❑ Nurse Practitioner
2 ❑ L.P.N. 5 ❑ Lab Technician
3 ❑ Physician Assaciate 6 ❑ Other (pleaseSpeci/y)
3. What type of service did the allied health personnel provide?
*4. PATIENT’S PRINCIPAL PROBLEM(S),COMPLAINT(S), OR SYMPTOM(S) THIS
VISIT
(In _ own words)
0. mostimportant. —
b. other
*6. SERIOUSNESS OF PROBLEM
IN X4 (Check one)
I ❑ Very Serious
2 ❑ Serious
3 ❑ Slightly Serious
4 ❑ Not Serious
5. DID THIS PATlENT SEE THE
PHYSICIAN THIS VISIT?
1 ❑ Yes 2nNo
7. HAS THIS PATIENT EVER RECEIVED
MEDICAL CARE HERE BEFORE?
1 ❑ Yes 20N0
(If yes, for the problem indicated in item 4).
1 ❑ Yes 2cIN0
~ * Adopted from National Ambulatory Medical Cure Study34
●8. MAJOR REASON (S) FOR THIS VISIT (Check all major reasons)01 ❑ Acute P,.ablem 06 ❑ Pren. tOI Care 10 ❑ Co.nsefing/Advice
02 ❑ Acute Problem, Follow.up 07 ❑ Postnatal Care 11 ❑ Immunization
03 ❑ Chr.”1. P,.blem, Routine 08 ❑ Well Adult/Child EX.m 12 fJ Referred by other Phys/Agency
04 ❑ Chronic P,.ablem, Flare..p 09 ❑ Family Planning 13 ❑ Administrative P.rPos6
05 ❑ P.,toperative car. “ 14 ❑ a!h,, (specify)
*9. PRINCIPAL DIAGNOSIS ~ VISIT
o, Diognosis .Assccioted with ~m 4 entry
b. Other Significant Current Diagnoses(In order o} importance)
*1O. TREATMENT/SERVICES ORDERED OR PROVIDED THIS VISIT (Check al that apply)—
01 ❑ None Ordered/P,.vided02 ❑ H;slory/Physl,.l Ex.m
W ❑ L.b Procedure Test04 fJ X.,ays05 ❑ l“ietlion/lmmuniz.lion06 ❑ Office S.rgic.l Tre.tment
07 ❑ Pres.riptio” Drug08 ❑ N.”-Pres.,ipti.. Drug09 ❑ Psy<hothor.PY/Ther. Pe.ti~ Listening
10 ❑ Medical Co..seli.g/Advi.e
11 ❑ alher (.SPeC~)y)
(Spcci\y)
*11. DISPOSITION THIS VISIT (Check @ that apply)—
1 ❑ No FoII.w.uP P1.n”ed 5 ❑ Referred To Other 7 ❑ Admit To Hospital2 ❑ Returned .1 Specified 7ime 9hy~iCio./Agenw 8 ❑ ather3 ❑ Return if Needed4 n Tele.h.”e Follow... 6 m Rel.rued To Refe,ri”g (Speci/y)— -.
P1.ri”ed Physi.ion
12. Do you think that some of the treotment rendered by the physician could hove been performcd by other health personnel?
1 ❑ Yes 2oNo By whom?
(Check all that apply)1 •t Registered Nurse2 ❑ Li.ensod Pr.<ti<.l Nurse3 •l Physi,i.ns Ass..i.!e or Assist..!4 ❑ Nurse Pr.~titioner5 ❑ Lab Te,hni, i..6 ❑ Other (specijY)
13. Approximately whet perc~nt of this treatment?
—----%
. Approximately how much time was spent with
this patient by the (Contplete only for employ.ed categories).
Phy.i,i.. (s) ~n.tes
Registered Nurse(s) -“”t.,
L. P. N.(s) ~n.tes
Physi.i.n Assoei.te -“”t,,
Nurse Pr.<titio”e, _n.tes
Lab Te<h”i~i.n ~nules
Other ~“”tes
(Spec:fy)

ERSURVEY DtAGN@STlt CODES
01
010
01 I
012
0130140[5016017018019029
03
03 I
032033034039
04
04004 I042043
044045
046047
040049
Acc Idnnts and Trauma
Unspoc I f I od Injury to Jo I nt$ andextre~tles
Suporf Iclal Skin Wound: AbrasionEcchymos I S, Homatofno, Soft TI 5SU~
InJury, CantuslonLacerat Ion, Puncture Wounds, Foreign
LbdynltosDurnsFracture, Dlslecatlon$~)roll!, StrainPot sofllng, Orug I ngestlon, Orug Abuse}{ead Injuries (concuss Ion, aubdura I )Avulslon, Minor AmputationOther (f rostb Its, exposure, gunshotwound, assisult)
Al Ierqies
Allorglc Ffhlnltls, Allorglc, ConJunc-tlvltls, Hay Favor
Urtlcar la, Hives, PrurltlsAnglonourotlc EdemDrug React {onOther
Card lovascu 1ar
Hypertens lve OlsoaseCongen I ta I Heart 01 soa!ieFunct Ions I MurmurHeart Fal Iuro (Pulmnary Edema,
Congest I VO Hoart Fa I I ure, VontrlcularFal Iuro, Rhaumatlc Heart OlseaseFalluro)
M. 1. lMyocardlal Infarct Ion)Porlphoral Vascular Olsease (embol lsm,
clotted shunt, thrombosis, phlabltls,thrombophlebltls, stasis ulcer,venous sta515 ulcer
Chest Pa in, AnginaFlbrl I Iatlon, Flutter, Tachycardla,
Arrhyl hmlaArterlosclcrotlc Haart DiseaseOthar (anaurIsm)
05
050
05 I053054055056057
058059
06
061062063064065066067068069079
08
08 I002083084085089
09
09 I092093094095096
097098099
109
Central Nervous SVstem (CNS)
Congonltal Abnormal Ity [cmunlcatl nghydrocepha I us)
Headaches (undof I nod cause)Sol zuro Olsordar, Epl I epsyFabrl 10, ConvulsionCerabral Pa I svFalntlng, Syncopa, Dizzy, VertigoCVA (Corobral Voscu tar Accl dent),
Subarachnold HomrrhageParl phoral Narve SVmptomsOther, Sonl I Ity
Ear, Eva, Nose
Forolgn BadVOtltls MadlaMastoldltl$Ot I t Is ExternaIncluslon, Blenorrhaa, Conjunctlvltls
}brdoelum, Sty, ChalazlonCorneal Abras IonEplstaxls (Noso Bleed)Scleral HeMrrhaga, SubconJunctlval HemorrhageOther
Hematologlc
He~phl I laLoukcmlaSickle Call AnemiaIron Oeflclancy Anmla
Other AnemlosOther
Oermatologlc
Abscess, UlcerCellulltlsContact Oermat 1’Eczema
Is, Poison Ivy
Funga I Infect Ions, TlneaSkin In faction, Impat[go. Pyoderma,
ScabiesRashSoborrholc Oe-tltlsTlssuo Abnormllty (Ax!l Iary Node,
Breast Luaus. Cvst. Cvst Ic Mastlt Is.F1broedan&. inguln; l Wale, Neck -Lump, Dccluslon Cyst), Cancer
.
Other (Erythema, Warts, PltyrlaslsRosca ), Acne
II
Ill119
12
121
I 22123124I 25126127128129I 30131
132I 33I 34136I 37
I 39
14
141
142143144145146
I 47148
I 49
151
152I 53154155156I 59
Endecrlne
01 abetes No I I ItusOthar
Gastro-lntestlna I (G I )
Abdominal Pain of Unknown EtlologV(@llc, Colltls, Cramps)
Constlpat IonVomltlng, OlarrheaGastroenterltls, GastrltlsHernia, Umbl I Ical, Hiatus, IngulnalGall Bladder (Cholangltls)Acute Abdomon, Acuta Appendlc I t IsForeign ~dy Ingest IonOantaiStomet It Is, Canker SoroAnal Fissure. F}stula. Haroorrholds.
PI Ionldal Cyst, Pro&tltls, RoctaiGrowths
Bloody Stools, BloodlngI ncarceratod Ham la
UlcerParasltosL1 ver Olsease (Cl rrhos Is, Hepat Ic
Failure)Other, Olvartlcul ltls
Genlto-Urlnfsry (GU)
Premenstrual Cramps, Mlttl asctimerz,Amonorrhoa, k!enorrhag I a, Dysmenorrhea
Pregnancy, Post-PregnancyVaglnltls, Vulvltls, Salplngltls, CarvtcltlsAbort Ion, Mlscarr I agoVO (Vonoroal DI soase)Test Ic Ie Prob Ioms (Undescondod,
Epldldymltls, Hydrocolo, Orchltls)Congon Ital Abnorme I I tyKldneV, Glomerulonephrl tls, Nephrosls,
Nophrltls, Chronic Renal. OlsoaseIfematurla, MIsc.
Pyalonephrltls, Cystltls, UTI (UrlnarVTract InfectIon) He~rrhaglcCystltls, Oysurla, Stricture
PIO tPelvlc Inflamtory Olsoaso)Urinary Retent Ion, StrainEn*otrloslstinopausaProstatlt Is, Prostate ProblemOther
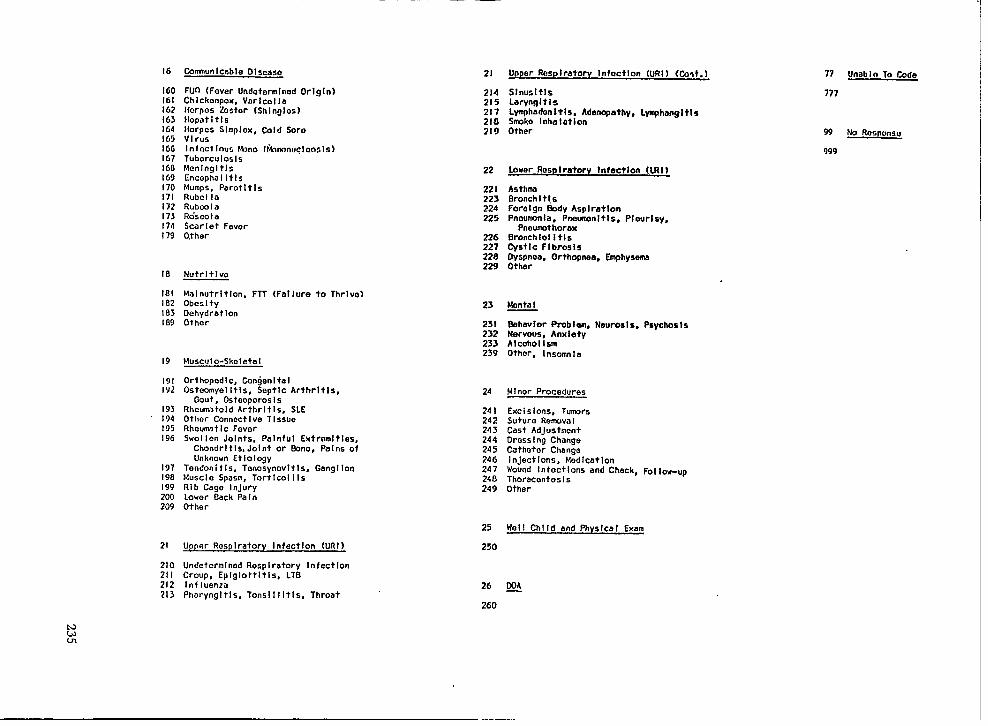
16
160161162163164165166167160169I 70171I 72I 73I 74I 79
Cemnunlcable OISmSO
FUn (Fever Undetcrmlned Or!g!n)Chlckenpox, Varlcol laI{orpos Zostor (Shlnglos]NcpatitlsHorpcs Slmplox, Cold SoroVirusInfect IOU5 f4iIno (i*mnwc10051s)TubcrculoslsMcnlngltlsCncophaI ItlsMumps, ParotltlsRubcl laRubmlaRo”sco I aScar let FeverOther
18 Nutrltlvo
181 Malnutrltlon, FTT (Fal lure to Thrive)182 Obcslty183 Oehydratlon189 Oth@r
19 Musc,Jlo-Skeletal
191 Orthopedl c, Congenital192 Osteomyel It Is, Septic Arthritis,
Gout, Osteoporos Is193 Rhcum>told Arthrltls, SLE194 Other Connoct Ive T Issue195 Rheumlt Ic Favor196 Swol Ien Joints, P81nful Extramltlas,
Chondrltl$, Joint or E!One, Pa Ins ofUnknown Etiology
197 Tendoni t Is. Tenosynovlt Is, Gangl Ion190 Muscle Spasm, Tortlcol I Is199 Rib Cage Injury200 Lower Back PaI n209 Other
21 Upper Rasplratory InfectIon (URI)
210 Undetcrmlnod Respiratory Infect Ion21 I Croup, Eplglottltls, LTB212 In flienzti -213 Pharyngltls, Tonslllltls, Throat
21
2142152172182!9
22
22 J223224225
226227228229
23
25 I232233239
24
24 I242243244245246247240249
25
250
Upper Resp Iratorv Infoctlon (URI ) (tint. )
SlnusltlsLaryngltlsL~hadon It Is, Adenopathy, L~hanglt!shko InhalationOther
Lower RasDIraterv infect Ion (LRl }
AsthmaGronchI t IsForalgn Body AsplratlonPnavmonla. Pnavmanltls. Plaurlsv.
PneumothoraxBronchlo! Itls~st Ic Flbrosls:~;~, Orthopnaa,
-,.
Emphysema
Nanta I
%havlor Probl~,Nervous, AnxietyAlcoholismOther, I nsom” I a
Neuros Is, Psychos Is
Ml nor Procedures
Excl slons, TumrriSuture Remva ICast AdJustmcntOross I ng ChangeCatheter ChangoI nJectlons, Modlcat IonWound Infect Ions and Check, FoI 10w-up
ThoracenteslsOther
Wol 1 Chl Id and Physical Exam
26 MA—
260
77 UnabI o To Code
177
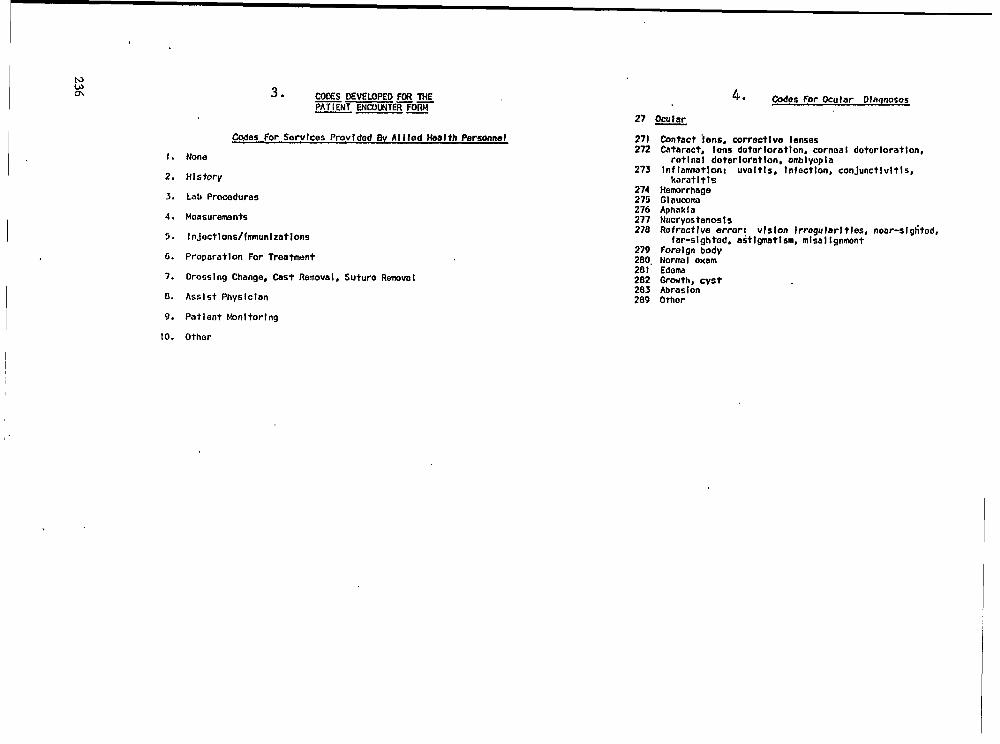
I
I
-es For Sorvlces Provf dad BV Al I led Health Personnel
1. None
2. HIs tory
3. Lab Procedures
4. Moasuremants
5. I nJectlons/fmunl zatlons
6. Proparat Ion For Treatmant
7. Dross I ng Change, Cast Remova1, Suture RemovoI
8. Assist Physlclan
9. Patient Wnltorlng
10. Other
4. Codes For Ocular Dlnqnoses
27 -
271272
273
274275276277278
279280.281282283289
Contact i ens, corrective lensesCataract, Ions datorloratlon, cornoa I dotorloratlon,
ret 1na I deter Iornt Ion, amb1yop I aInf Iamtlon: uvoltls, InfectIon, conJunctlvltls,
karatltlsHemorrhageGlaummaAphaklaN~cryostenos IsRefractive error: VIS Ion Irrogu Iarl ties, near-slglited,
far-slghtod. aitl~tlsm, mlsal IgnmentForeign ~odyNormaI examEdemaOr-th, cystAbrasionOther
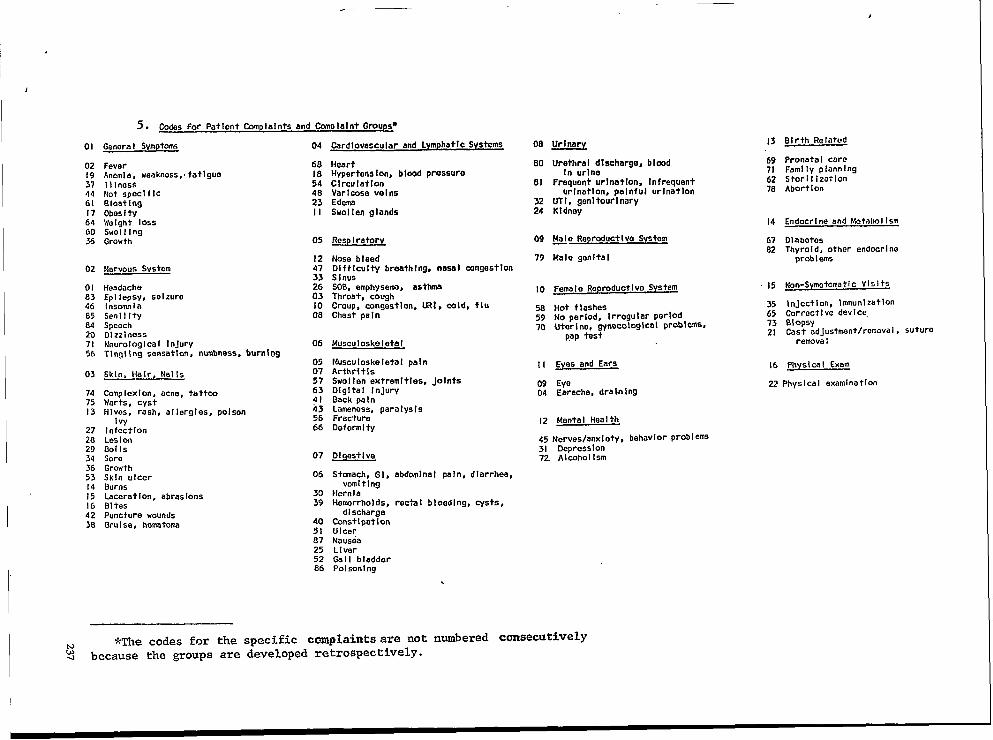
,
1
s. Codes For Patient tiplalnts and ~P Ialnt Groups*
13 Birth RelatedGenera I Svmptoms 04
6818544823II
05
1247
;203
:
06
0507
::
fi5666
07
06
3039
405187
Card Iovascu Iar and Lymphatl c Svstems 08
80
81
3224
09
79
10
585970
II
0904
0169 Pronata I care71 Family plannlng62 Stori I Ization78 AbortIon
Ur~:h:ran:lecharge, b Imd
Frequent urlna+lon, Infrequenturlnotlon, painful urlnatlon
UTl, genltourlnaryKidney
0219
FeverAncml a, weakness,. fatlguo11 InossNot Spccl f IcBloat IngObos I tyWeight 10SSSwolllngGrowth
HeartHypertens Ion, blood pressure
CIrculatlOnVaricose vol nsEdemaSwol ten glands
37446(17646036
14 Endocrl no and Vs?tabol Ism
Resp I ratory MO Reorduct I va System
Malo genital
61 Dlabotos82 Thyroid, other endecrl no
problemsNose b I eedD} f f Icu I ty breath I ng, nasal congest IonSinusSOB. emphysema, asthma
02 Narwus System
15 Non-Symptomatic Vl$ I ts01.s3468584
HeadacheEpl Iepsv, seizureInsownfaSenllltySpeechOlzzinessNr?urologlca I InjuryTlngl Ing sensation, nutinoss, burning
Fema I e Ropreduct Ive SystemThroat, ” coughCroup, congestion, URl, cold, fluChest pa I n
35 lnjectlon, Imnunizatlon65 Corroctl Ve device,73 alopsy21 Cast adjustment/removal , suturo
Hot flashesNO period, Irregular perIOdUter 1ne, gyneco{aglca I probl ares,
pap test207156
Musculoskeletal remova I
Muscu[oskeletal painArthr{ t IsSwol I en extremltles, JointsDlgltal InJurySack pelnLameness, paralys!sFractureDeformity
Eyes and Ears
EyeEarache, dra In ing
16 Physics I Exam
Z2 Physlca I examination03
747513
27282934
2
;;lb4239
Skin, Hair, Nails
COmpIexlon, acne, tatteoWarts, cystHives, rash, allergles, poison
1VyIn fcctlonLes I on001 IsSoroGrowthSkin ulcerBurnsLaceration, abrasions01 tesPuncture woundsBru I se, hemtom
IZ Mental Health
45 Nerves/anxl ety, behavlOr prob I ems31 Depress 10n72. AI cohol I sm01 gest I ve
Stmach, G], abdoinlnal pain, diarrhea,vomiting
HerniaHemrrhol ds, recta I b I eed [ ng, cysts,
dischargeConst I pet 1onUlcerNausea
255286
L 1virGal I bladderPolsonlng
*The codes for the spec~fic cmplaints are not numbered consecutivelyR- because the groups are developed retrospectively.

no
00
c1
•1,
ALPHA EMERGENCYROON FORM
Hospital Code
Address sStreet
?City or Town State
county ❑ 0 Town Cccm zip code
Date of Vi.sit:[~] [~1 ~] Time: mm ‘~’”.m
Fb . Day Yr.mm porn-
Hr. Min.
BroughT By: •1 Financial Coverage: ❑ Regular Source of Care:
I Private Auto 1 Medicaid I Private Doctor2 Ambulance 2 Medicare 2 Hospital ClirIIc3 Wlice 3 Blue Cross-Blue Shield 3 Health Center4 Other (Specify) 4 Other comme~cial 4 Hospital E.R.
5 Compensation 5 Of’her9 No Response 6 SeIf 6 No Source
7,0ther (Specify) 7 Other (Specify)
9 No Response 9 No Response
Did patient attempt to contact this regular source before coming to the E.R.?.
I Yes2 No9 No Response
❑ lclclcl Primary Diagnosis
il ‘Urgency: •1 Type of Incident:
1 Life-threatening - Conditions” I Auto Acc’identwhich require immediate diag- 2 industrial Accidentnosis or trea+ment to preserve 3 Home Accidentlife. 4 Recreational Accident
2 Urgent - Not life-threatening 5 Otherbut needed to use this facility.
3 Non-urgen$ - Did no? need to usethis facility. c1 Referral (After Treatment):
— IU Disposition: 2
34
5
6
3Discharged After TreatmentAdmittedDied/DOA 4Left E.R~ No+ Treated(walk-out) :Transferred To Other 7
HospitalReferred Ifithout Treatment
8
Private DoctorMental Health CenterLong Term Care Facility
(nursing home, HRF,domiciliary home)
Health CenterHospital CIInicHospital Emergency Room
Community Resource (RescueNission, Salvation Army,D-Tox, etc.)Not Applicable
00 Age
❑ Sex
238

OBSTETRICS, PEDIATRICS, AND MEDICAL-SURGICALSERVICES STUDY
Mr. George E. Schwarz, SeniorBinghamton, New York
I would like to thank Alan Boissv
Planner, NY-Penn Health Planning Council, Inc.,
for invitingme to speak to you today and for his’ continual in;terest in the efforts undertaken at the NY-PennHealth Planning Council in solving the problems ofplanning for acute hospital beds. I hope that theexperience I share with you will be helpful. Howev-er, I must warn you that this is very much a casestudy and, therefore, generalization ‘should be un-dertaken only with extreme caution.
This presentation . of “Acute Care HospitalNeeds for Broome County: Obstetrics, Pediatrics,and Medical-Surgical Services, Present and Future,”is designed to move logically through the study, in-cluding descriptions of the environment, the hospi-tals, and other factors involved. A discussion of theplanning methodology and the required data fol-lows, with some comments on the approach to thestudy. Problems will also be addressed. The resultsof the study, in terms of findings and impact, willalso be discussed. Finally, to keep this presentationshort enough to allow time set aside for discussion,there are some aspects on which I will touch lightly,or delete.
The Environment
Broome County is part of the Binghamton,New York Standard Metropolitan Statistical Area(SMSA), and includes Broome and Tioga Countiesin New York, and Susquehanna County in Pennsyl-vania. The 19’70 SMSA population was 302,672, ofwhich 221,815 ~eo”ple were in Broome Countv:46,513 were in ?io~a; and 34,344 were in SusQu;~hanna. The land aria of the combined three c~un-ties is 2,0’74 square miles, with the average popula-tion density of 146 people per square mile. Thepopulation density in Broome- County in 1970 was310 peo’ple per square mile, about six times thedensity of the other two counties. The urban coreconsists bf the city of Binghamton, and the Villagesof Johnson City and Endicott, with considerablesuburban and exurban population spreading alongthe north-south and east-west axes of the TripleCities.
The focus of tils study, however, was onBroome and Tioga Counties. These two countiesare served by a splendid highway network, and be-cause of a variety of economic and demographicfactors, form a well unified business and medicaltrade area. There are four acute “care hospitals in
the area. Hospital A is a nonprofit, voluntary Cath-olic institution, with a considerable devotion of re-sources to the care and treatment of oncology pa-tients and the terminally ill. It consists of 328 beds,and has just completed a major expansion and ren-ovation program, the main purpose of which was toupgrade particular oncology, ancillary, and profes-sional services capabilities. Only a few new and re-placement beds were built. Hospital B is a munici-pal hospital of 420 beds, which has also just com-pleted a major construction program. Althoughmunicipal, the hospital functions as a typical com-munity general hospital, and makes no claim to par-ticular specializations. It is operating well below itslicensed capacity. Hospitals A and B, in Bingham-ton, are across the Susquehanna River from eachother, about three miles apart. Hospital C, locatedin Johnson City, is licensed at 4’76 beds, fifty-two ofwhich are psychiatric. The hospital, a nonprofit,voluntary, is located about six miles west of, the twohospitals in Binghamton. It has a large, committedmedical staff and was originally part of the Endi-cott-Johnson Shoe Company medical program, asearly as the 1930’s, clearly an HMO. It is a teachinghospital, offering a variety of residency programs inaffiliation with the Upstate Medical Center in Syra-cuse. Hospital D, located h the Village of Endicott,is a 140 bed municipal hospital about four mileswest of Hospital C. It, too,” functions as a typicalcommunity hospital; however, the majority’ of itsadmissions are from a select few physicians on thestaff. Hospitals A and B share the same medicalstaffs, even to the extent of having the same Medi-cal Staff Bylaws. Hospitals C and D have similarmedical staffs, but without the level of integrationseen at Hospitals A and B. It is important to notethat the four hospitals are very competitive, whichis either the cause or the effect of each offering thethree basic clinical services of Obstetrics, Pediatrics,and Medical-Surgical services.
A most important factor, however, relates tothe proposal for an additional building” program inthe community. Even as the two, hbspitals in Bing-hamton were: completing their expansion-renovationprojects, an application was pending for. the re-placement of Hospital D: .The application> had re-ceived its original Cer6ficate of Need from NewYork State in early 1972, and was developing, in1973, the second part of that application, a financialfeasibility study as required under State law, The
239

1“new hospital was proposed as a result of HospitalD’s inabfity to conform to Fire and Life SafetyCodes and the general deterioration of its physicalplant. The proposed new hospitallwas programmed tobe a “full-service” hospital of over 200 beds, toserve an area which, at the time of application, wasviewed as an area of population growth. There wasa concomitant plan to close Hospital D when theconstruction of the new facility was complete.
One further point has to do with the fact thatthere had been numerous studies in the area, un-dertaken during the past decade, and all by reputa-ble consultants, each of which suggested the consoli-dation of Obstetric and Pediatrics between HospitalsA and B. The release of one such study resulted ina request by the four hospitals that the BroomeCounty Comprehensive Health Planning Commit-tee, a component of the Planning Council, under-take a study of hospital services. Their request as-siduously avoided the idea that this was to be anoth-er consolidation study. A Hospital Services StudyCommittee, a subcommittee of the Broome Countygroup, was established and asked to assess whichhospital services should be addressed first.
The Approach and theMethodology
The first step in the study addressed the issue”of where the subcommittee should” concentratewithin such a broad mandate. The subcommitteesurveyed a wide range of people in the healthcommunity, including physicians, selected hospitaladministrative staff, and hospital trustees. The re-sults of the survey were not entirely surprising, witha majority of respondents requesting a review ofthe Obstetric and Pediatic services. This phase ofthe study ended in the summer of 1973, at whichpoint the substance of the study began. In January1974, it was decided that the study was incompletewithout addressing overall bed needs, and the sub-committee moved to the study, of Medical-Surgicalbed needs.
With that background, an overview of the studycan be ou~lned in eleven steps: (1) the definition ofeach hospital’s service area; (2) the development ofan overall poptiation base; (3) an estimate of area-wide fertility rates; (4) an estimate of utilizationrates for each service area and for the overall area;(5) the computation of historical trends for fertilhy;(6) the calculation of historical trends for utilization;(7) the choice of “reasonable” planning rates forfuture utilization and fertilhy; (8) the projection offuture need as a function of projected populationand chosen rates for fertilhy and utilization; (9) theuse of criteria and standards; (10) the balandng of
240
bed needs with bed complements; and (11) thefindings and recommendations.
I will now briefly present the details of thesesteps.
Service Area Definition and Population BaseDevelopment—While itwas recognized that therewere basically two counties involved in this study,the subcommittee and staff also recognized thateach of these hospitals had its own service area, andin combination, served an area which reflectedmedical trade patterns not circumscribed by politi-cal boundaries. A Patient Origin Study conductedin 1970, was used for this definition (6). The datafrom that study permitted the allocation of theproportion of people from each of the five countiesin the planning region who used specific facilities.These proportions, expressed as the percentage ofpopulation from each of the five counties, whoseresidents used a Broome County hospitalf weremultiplied by each county’s population to derive ashare of the population ascribed to the hospital’sservice area or population base. These populationswere aggregated for each of the four hospitals inorder to form an overall service area attributable tothe four institutions. The result was a series of sta-tistically mutually exclusive service areas, whichwere viewed as shared.
Statistically, this was a defensible approach, It isslightly conservative, especially if some of the hospi-tal utilization coming from outside the region wasnot attributed to a specific population base. Therewas no significant magnitude of this nature; never-theless, the ramifications of this approach will bediscussed shortly. Another advantage of this pro-portional approach should be noted, however. Al-though 1970 population data are available at lessthan county levels, the key population projections,which the New York State Department of Healthrequires local planning agencies to use (4), are thecohort-survival technique projections published bythe now defunct State Office of Planning Services,and are available only at the county level. The dis-aggregation so often necessary in small area analysishas to be undertaken by the best proxy techniqueavailable, and the one described here comparedfavorably to others which were tried.
The Development of Rates and Trend Re-view-To review the various trends, the develop-ment of rates was required. Therefore, this discussion wi~ apply to both fertility and utilization rates.
The population base development, as describedabove, provides the denominator data for the calcu-lation of rates. The population data were age-spe-cific. For Obstetrics, the fertile female populationwas used. For Pediatrics, the population age 0-14was used. For the Medical-Surgical services compo-nent, the population age 15-64, and age 65 andover were used as separate sources of need. The
I,

numerator data required for establishing rates werebirths and utilization. The fertility data were com-puted using births supplied by the hospitals, al-though birth data were available from a variety ofsources. me utilization data for the Pediatric andMedical-Surgical components were also supplied bythe hospitals. Since the birth data are fairly straight-forward, the discussion will now focus on the ufll-zation data.
The data required were patients (expressed asadmissions or discharges) and patient days, by agegroup. The collection of these data was surprisinglyeasy. Three of the four hospitals subscribed to (orhad its own) the Uniform Hospital Discharge Ab-stracting (UHDA) System. Hospital D had no sys-tem, and refused to cooperate in the study, in anyevent. It did agree to the use of secondary data, towhich were applied adjustments based on the datafrom the other hospitals. The collection of the datawas accomplished by simply photocopying the Dis-charge Summaries, by Service, and the DischargeSummaries, by Diagnostic Category. The data, nomatter how supplied, were aggregated to an annualbasis. This technique permitted an economical ac-cession of the data required. The report formatspermitted the data to be used in an age-specificfashion, which was the basis for the trends in utili-zation rates. In addition, it permitted factoring outcertain diagnostic categories for special considera-tion. For example, therapeutic abortion patients,which in some hospitals were placed on the Obste-tric service, were factored out completely.
The rates were Calculated for each year forwhich data were available. Without going in-to de-tail, the restit was a series of rates for fertility, pa-tients, and patient days utilization. In addition, age-specific average lengths of stay were computed foreach year.
“Reasonable Planning Rates’’—In order to pro-ject beds, some view of the future, as manifested byrates for planning, is required. Simply, the questionwas: What is a reasonable utilization and birth ratefor the future? A review of the data permitted thefollowing trends to be discerned: (1) The averagelength of stay had been dropping for all of theservices under study, although for Pediatrics, thetrends were not as clear as for Obstetrics and Medi-c~-Surgical services. The effect of the length of stayon patient days was to decrease the latter measureof utilization. (2) In Medical-Surgical, it was notedthat the decrease in length of stay was sufficientthat, despite slightly increased admissions, overallutilization measured in patient days, dropped. (3)The subcommittee reviewed the trends in fertility.Here the trend was clear. As in other parts of thecountry, the area was experiencing a steep declinein births, and there was no reason to surmise thatthis trend would reverse itself. (4) Certain trends in
patterns of services in the community were re-viewed. For example, the pediatricians have shown
a Weater reluctance to hospitalize children, andtogether with otorhinolaryngologists, are more re-luctant to recommend the removal of tonsils andadenoids. The growth of “day surgery” was alsoseen as a concept which would sooner rather thanlater be part of the mainstream. (5) Finally, some ofthe national trends were reviewed, including theRand Study of the impact of various NationalHealth Insurance schemes. (8) Although these arenot the totality of the Study Committee’s considera-tions, they represent the salient ones.
With the trend data in hand, the committeereviewed the results to arrive at’ a planning rate, a .rate to use for projections. Not surprisingly, theStudy Committee decided to choose the five-yearaverage. With respect to fertility, however, thecommittee chose the most recent rate available, withthe caveat that the rate would probably not returneven to the 1972 level. The Committee’s behavior inthis regard was interesting. While it recognized thetrends in utilization, and most of the Committeemembers felt that the days of Elgh hospital utiliza-tion were numbered, they nevertheless remainedconservative and cautious, opting for the averagerates. They took this position despite the recogni-tion by some of the providers on the Study Com-mittee that the hospitals in Broome County evi-,lence some of the highest utilization in New YorkState, and despite the acceptance of the hypothesisthat a supply of beds creates its own demand.
The Computation of Future Need—Beforedealing with the specific formulae by which needwas computed, a few words about philosophy andapproach are appropriate.
The projection of bed need is an imprecise artat best. In attempting to be as precise as possible,
an inordinate amount of time and resources can beexpended on data gathering. However, going toextremes can also be analogous to pacing off thediameter of a circle, and then calculating the cir-cumference to th; fifth decimal place: So it is withprojecting beds. The myriad data are themselvesimprecise. The population projections can be sus-pect. The utilization variables are subject to thevagaries of a multitude of fac~ors. The choice of aplanning rate forthe future is a tenuous judgmentalbest. Therefor&, the important point here is to ap-proach these, problems in a time and cost effectiveway, so duplication of the study is possible as amonitor for the system.
The use of highly sophisticated planning meth-ods and complex formulae are govertied not onlyby the type of data available, but also by the qualityof the data. In the case. of this study, it is submittedthat the data and techniques balance cost effectively.The study provided no magic answers, but did offer
241

some thoughtful guidance to a community of deci-sion-makers. This is what community health plan-ning is about.
The projection of bed needs used two different
approaches one for pediatrics and Medi=l-surw--cal, and another for Obstetrics. Before discussingeach approach, it should be noted that the commonpoint of departure for the projections was futurepatient days. These patient days were basically theproduct of the future population and the utilizationrate chosen to serve as the planning rate. This wascomputed two ways. The first used the product ofchosen admission rate, the projected population,and the projected average length of stay, therebyarriving at projected patient days. The other tech-nique used the planning rate, expressed in patientdays, and multiplied that by the projected popula-tion.
For Obstetrics, the approach concentrated onthe admission rate and the length of stay. Theproduct of projected fertile female population andfertility rate resulted in projected admissions- Theseadmissions were adjusted upward to account foradditional appropriate admissions to the maternityservice (e.g., toxemia, ectopic pregnancy). Thesetotal admissions were then multiplied by a projectedlength of stay. The product, future patient days,was divided by 365 to provide the projected aver-age daily census.
It is known that births are random arrivals to ahospital, and that admission or services cannot bedelayed. It followed, therefore, that average dailycensus is also a random variable, which when plot-ted for the year, is seen as a Poisson distribution ofsuch magnitude that it approached a normal distri-bution. This was empirically confirmed. With theseassumptions, it was de~ded that a standard devia-tion formula published in Hospitals was appropriate(5)., This formula postdated that 2.33 standard de-viations from the average daiiy census would ac-count for peak loads at the 99 percent confidencelevel. Therefore, the risk of being unable to place arandomly arriving patient without resorting to ad-ministrative or selective early discharges would oc-cur on only one percent of the days of each year.This formula was also helpful because it permittedthe calculation of bed needs for any number ofservice units in the system, and the consequence forany number of hospitals providing these servicescould be seen. The simulation, which was the deci-sion-making model for the committee, computedthe bed need for as few as one and as many as fourhospitals comprising the system. This model permit-ted the demonstration that larger units were moreefficient and allowed for easier absorption of arriv-~s; that is, larger units were shown to be better ableto handle peaks in service load.
242
Pediatric and Medical-Surgical bed need werecomputed with a modified Hill-Burton formula (4).The future patient days were either the product ofthe projected population and the chosen patientday rate, or the product of the projected popula-tion, admission rate, and projected length of stay.The resultant patient days, divided by 365, providesthe projected average daily census, When dividedby a chosen target occupancy rate, the result is bedneed. The Hill-Burton formula is somewhat crude,and suffers from various problems, one of which isthe inabihy to accommodate fluctuations in demand.Furthermore, despite that fact that much of the lit-erature cites an “optimal” target occupacy rate, sucha rate does not exist. The planner who insists onconfusing target occupancy with the concept of op-timal only maintains a self-deception; the plannersat the New York State Health Department continueto labor under this confusion.
There are some valid criticisms of the approachtaken to this study. First, there was no empiricaIconsideration of inappropriate utilization; that is,no consideration of patients using a level of acutecare when a less intensive level would do. Thisproblem was documented in Broome County in1968 (9), however, the committee did no more thanrecognize this problem. Next, it is understood that,particularly in Pediatrics and Medical-Surgical, thepatterns of service, appropriate or not, are perpet-uated by the use Qf the Hill-Burton formula. Thisrelates, for example, to community or hospital poli-cies on elective admission or waiting lists, Again,this problem was not specifically addressed. Finally,more age-specificity would have given the image ofa more precise approach.
Use of Criteria and’ the Balance of Bed Com-plements-While a statistical approach to theseproblems may be interesting, the injection of valuesinevitably occurs. If these values can be document-ed. or agreed on as criteria or standards for care,then the statistics not only take on real meaning,but also guide the decisions without actually makingthem. So it was with the use of standards from theAmerican ColIege of Obstetricians and Gynecolo-gists (ACOG) (2,3). The thrust of these standardsc-died for the regionalization of Obstetrical services.The minimum standard for a hospital retaining amaternity service in communities of 100,000 ormore was 1,500 to 2,000 births per year, per unit;one labor room per 250 births; and 500 births perdelivery room. The ratio increases for larger serv-ices. In addition, the ACOG standards outline clear-ly the appropriate policies for mixing gynecologypatients on maternity units, and specific criteria forthe complement of laboratory services required tosupport a maternity service, Finally, the standardsclearly indicate that there should be enough volume

on unit to support a speci~lzed and capable Obste-trics staff.
The American Academy of Pediatrics (AAP)published standards for hospitalizing childrenwhich were useful for this study (l). However, thesestandards were not as definitive as those of ACOG.There were no overall standards available for Medi-cal-Surgical services, except as applicable to specificproblems or diagnoses.
Byintergrating the standards with the statistics,the Study Committee concluded that there will notbe sufficient future births to support four, or in-deed, three maternity services, if the hospitals wereto comply with ACOG standards. The Study Com-mittee felt strongly that the standards were impor--.tantfor fostering high quality Obstetrical servicesinthe community, and not only endorsed the ACOGStandards, but also attempted to implement thestandards by recommending the development of atwo-hospital maternity care system by asking HospitalA and Hospital D to discontinue maternity services. Itasked Hospital B and Hospital C, with its PerinatatCare Center designation from the State, to maintainObstetrics. The Committee then reviewed the Pedia-tric services and concluded that there were economiesof scale and a greater abflity to deliver higher qualhycare as a result of larger Pediatric units. The StudyCommittee asked Hospital D to divest itself of Pedia-trics.
By this time it was clear to the Committee hatthe projected bed needs were well below the exist-ing bed supply, with or without the programmedreplacement facility. It concluded that Hospital Dwould be a poor shell for maintaining only Medical-Surgical beds, and asked it to close by the end of1975. Further, the Committee recommended thatthe plans for the construction of a replacementhospital be abandoned.
In reaching these conclusions the Committeereviewed the existing bed complements and thecapabilities of the three other hospitals to absorb thepatient load projected for Hospital D or a new hos-pital. There was considerable capacity at Hospital B,with licensed but unstaffed beds in an older portionof the plant and in a newly constructed but emptyshell. Hospital A, if they cooperated in the Obstet~rics and Pediatrics consolidations, would also havethe capacity to enlarge the Medical-Surgical capabil-ities with little or no capital expenses.
The Impact of the Study andSubsequent Results
These conclusions of the Hospital Services StudyCommittee exploded on the community in earlyautumn of 1974. The County was moving apacewith the development of the new hospital, contract-
ing for a financial feasibility study with accountingconsultants. A special committee from the commu-nity, independent of the Planning Council, hadbeen jointly appointed by the Broome County Leg-islature and Executive to supervise the financialstudy, departing from the hypothesis that the re-placement hospital was required on the basis ofneed as well as physical plant considerations atHospital D. I
There was an outpouring of emotion, and noconstructive dialogue for months. The State HealthDepartment was caught in a difficult position, for itsupported the need for a new hospital, and theplanners at the ‘State level seemed neither capablenor desirous of understanding the Committee’sfindings. By awarding a Certificate of Need, with nostatute of limitations, the Department was also onthe horns of a legal dilemma. After about fivemonths of emotional debate, the Planning CouncilBoard of Directors adopted the essence of the re-port, and has maintained that posture since.
During the debate several other studies wereundertaken, one of which was conducted by theEconomic Growth Institute at SUNY-Binghamton,under contract to Broome County. The Institutewas critical of the NY-Penn study for being too con-servative in estimating future bed needs. In all thedebate backed by data, the only report which repu-diated the NY-Penn study was that of the specialcommittee conducting the financial feasibility study.As recently as January 1976, with the issues sur-rounding the replacement and closing of the Hospi-tal D still under debate, Blue Cross of Central NewYork undertook a study which concluded that Hos-pital D should be closed and not be replaced.
Since tils is not a conference on the politics ofplanning, further discussion of these problems mustawait anoher forum. Suffice it to say, communitystudies of bed need and community decisions canbe undertaken with relatively simple data, usingrelatively unsophisticated methodologies. Thesemethodologies permit the planner to oudine thesystem quantitatively. The result is added objective-ly in the planning process. Indeed, the key to theplanning process is to avoid being enmeshed in thenumbers, but rather to become involved with theissues. While anti-sophistication and anti-intellec-tualism are the last things I would advocate, Iwould simply note that if the choice is between asophisticated, thesis-level study which providesnothing to the community, and one which may notbe perfect but can result in dialogue and decisions,I advocate the latter.
Bibliography
1. American Academy of Pediatrics, The Care of Childreni? Hospitals (Evanston: AAP, 1971).
243

‘2.
3.
4.
5.
6.
American College of Obstetricians and Gynecologists, 7.Standards for Obstetn”c-Gynecologic Hospital Services(Chicago: ACOG, 1969).American “College of Obstetriaans and Gynecologists,“1971 White Paper.” 8.New York State Department of Health, Bureau ofHealth Facilities Planning, “Policy and ProceduresManual: Determination of Need and Project Review;n.d. 9.Normile, F.R. and H.A. Zeil, “Too Many OB Beds?”Hospitals, JAHA, Vol. 44 (July 16, 1970), p. 61.NY-Penn Health Planning Council, “Hospital ServiceArea Componentfl Health Data Series, March 1974.
NY-Penn Health Planning Council, “Acute HosphalNeeds for Broome County Obstetric, Pediatric, andMedical-Surgical Services, Present and Future,” Ju]y1974.
.
Newhouse,, Joseph P., et al., “Policy Options and theImpact of National Health Insurancefl The New Eng.land Journal of Medicine, Vol. 290 (June 13, 1974), p.1345.Williams, W.J. and R. Sullivan, “Broome County Hospi-@l Bed Utilization and Patient Origin Study; BroomeCountry Social Planning Council, September 1968.
244

UTILIZATION OF COMMUNITY MENTAL HEALTH SERVICES: ANAPPROACH TO MEASUREMENT AND FACTOR IDENTIFICATION*
Samuel P. Korper, Ph.D. Assistant Dean and Lecturer in Psychiatry, YAe University Schoolof Medicine, New Haven, Connecticut
A. Introduction
That a major goal of the community mentalhealth centers movement is the provision of servicesthat are relevant to the needs of the populationserved is obvious. However, the determination ofthe extent to which this aim is realized is not aneasy task.
While the best combination of strategies for theevaluation of community mental health programshas yet to be achieved, there is general agreementthat an essential component of evaluation is that of“diagnosis” of the community.1 One can neitherplan nor evaluate programs or services without adetermination of the communitv’s “need for serv-,ices”, and some measure or estimate of the patternsof utilization of existing services. To this end, some-thing has to be known about the population at risk(the potential consumers of services), as well as thecharacteristics of those currently being served byexisting agencies (the current consumers of serv-ices), as indicators of demand.
Mental health research to date, especially thattied to an interest in predicting case outcome, hasevidenced a broad focus (e.g. the illness itself, thepractitioner, the family, etc.), and a number ofstudies focusing on the determination of success (orfailure) of patients have been generally equivocal.Most studies in this area have shown that while suchvariables as hospital policy, medical diagnosis, andso on, are important for internal operation, thecluster of variables associated generally with socio-economic class are among the best available predic-tors of utilization.z While few reliable, definitiveconclusions may be drawn from the literature, thestudies suggest a number of analytic areas and fac-tors which either directly, or by implication, empha-size at least a dual role for socioeconomic class: notonly as a predictor of who receives care, but the;ource, type, duration,-diagnosis, and also prognosisof the patient upon discharge. TKIS has led to con-clusions regarding the importance of socioeco-nomic class not only as an intervening factor in thecare-recipient role of the potential patient but alsoas an important input to the development of serv-ices and programs adequate to patient needs.
*This research was supported, in part, by the Centerfor Census Use Studies, U.S. Bureau of the Census.
To this end, an emphasis of this study was theassessment of total first utilizations of communitymental health services and facilities by defined pop-ulation groups from small areas and the relation-ship of their help-seeking behavior to the utilizationof other services which call for or reflect need ofpsychiatric intervention. It was hoped that thisstudy would provide additional information con-cerning the utility of the socioeconomiclsociode-mographic approach in an examination of utiliza-tion of mental health services for an area smallenough to be practical for mental health servicesplanning and delivery purposes, while retaining avolume of utilization requisite to statistical analysis.Further, an attempt was made to accomplish thistask with information which, with but few excep-tions, is generally available in most communities fora reasonable effort.
B. Aims of the Study
One general objective of the study was to de-velop a comprehensive profile of the populationserved by community psychiatric services. The pro-file affords quantitative (and, of course, descriptive)statements regarding characteristics of the popula-tion at risk. These in turn serve as part of the basisfor evaluation of the impact of services and subse-quent planning or redirection of services which maybe shown to be needed. This portion of the studypointed up many problems in current modes ofdata collection and utilization. It was found thatneeded data are not gathered, or exist in forms oflimited utility, and that much data are unused evenwhen potentially available.
While there is a fairly large body of literaturedirected to the conceptualization of “community”and socioeconomic class levels, attempts to developquantitative indicators have often fallen short ofadequately reflecting the breadth of the elementsembodied in such conceptualizations. To this point,several authors have argued for the development ofindices of socioeconomic status against which anumber of dependent variables may be examined.ATherefore the preliminary analytical component ofthe study was the delineation of areas of the city
245
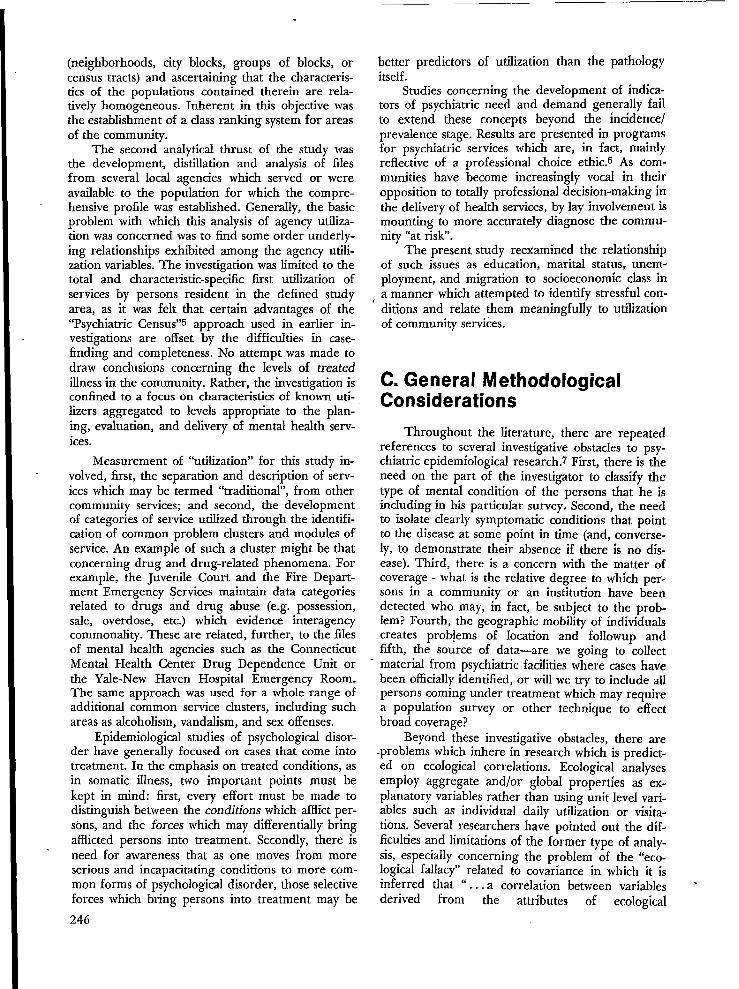
[ .
(neighborhoods, city blocks, groups of blocks, orcensus tracts) and ascertaining that the characteris-tics of tie populations contained therein are rela-tively homogeneous. Inherent in this objective wasthe establishment of a class ranking system for areasof the community.
The second analytical thrust of the study wasthe development, distillation and analysis of filesfrom several local agencies which served or wereavailable to the population for which the compre-hensive profile was established. Generally, the basicproblem with which this analysis of agency utiliza-tion was concerned was to find some order underly-ing relationships exhibited among the agency utili-zation variables. The investigation was limited to thetotal and characteristic-specific first utilization of
1“services by persons resident in the defined studyarea, as it was felt that certain advantages of the“Psychiatric Census”5 approach used in earlier in-vestigations are offset by the difficulties in case-finding and completeness. No attempt was made todraw conclusions concerning the Ievels of treatedillness in the community. Rather, the investigation isconfined to a focus on characteristics of known uti-
1 lizers aggregated to levels appropriate to the plan-ing, evaluation, and delivery of mental health serv-ices.
Measurement of “utilization” for this study in-volved, first, the separation and description of serv-ices which may be termed “traditional”, from othercommunity services; and second, the developmentof categories of service utilized through the identifi-cation of common problem clusters and modules ofservice. An example of such a cluster might be thatconcerning drug and drug-related phenomena. Forexample, the Juvenile Court and the Fire Depart-ment Emergency Services maintain data categoriesrelated to drugs and drug abuse (e.g. possession,sale, overdose, etc.) which evidence interagencycommonality. These are related, further, to the filesof mental health agencies such as the ConnecticutMental Health Center Drug Dependence Unit orthe Yale-New Haven Hospital Emergency Room.The same approach was used for a whole range ofadditional common service clusters, including suchareas as alcoholism, vandalism, and sex offenses.
Epidemiological studies of psychological disor-der have generally focused on cases that come intotreatment. In the emphasis on treated conditions, asin somatic illness, two important points must bekept in mind: first, every effort must be made todistinguish between the conditions which afflict per-sons, and the forces which may differentially bringafflicted persons into treatment. Secondly, there isneed for awareness that as one moves from moreserious and incapacitating conditions to more com-mon forms of psychological disorder, those selectiveforces which bring persons into treatment may be
better predictors of utilization than the pathologyitself.
Studies concerning the development of indica-tors of psychiatric need and demand generally failto extend these concepts beyond the incidenceprevalence stage. Results are presented in programsfor psychiatric services which are, in fact, mainlyreflective of a professional choice ethic.G As com-munities have become increasingly vocal in theiropposition to totally professional decision-making inthe delivery of heaIth services, by lay involvement ismounting to more accurately diagnose the commu-nity “at risk”.
The present study reexamined the relationshipof such issues as education, marital status, unem-ployment, and migration to socioeconomic class ina manner which attempted to identify stressful con-ditions and relate them meaningfully to utilizationof community services.
C. General MethodologicalConsiderations
Throughout the literature, there are repeatedreferences to several investigative obstacles to psy-chiatric epidemiological research.7 First, there is theneed on the part of the investigator to classify thetype of mental condition of the persons that he isincluding in his particular survey. Second, the needto isolate clearly symptomatic conditions that pointto the disease at some point in time (and, converse-ly, to demonstrate their absence if there is no dis-ease). Third, there is a concern with the matter ofcoverage - what is the relative degree to which per-sons in a community or an institution have beendetected who may, in fact, be subject to the prob-lem? Fourth, the geographic mobility of individualscreates pro~ems of location and followup andfifth, the source of data—are we going to collectmaterial from psychiatric facilities where cases havebeen officially identified, or will we try to include allpersons coming under treatment which may require
a population survey or other techniqueto effectbroad coverage?
Beyond these investigative obstacles, there are-problems which inhere in research which is predict-ed on ecological correlations. Ecologicalanalyses
employ aggregate and/or global properties as ex-planatory variables rather than using unit level vari-ables such as individual daily utilization or visita-tions. Several researchers have pointed out the dif-ficulties and limitations of the former type of analy-sis, especially concerning the problem of the “eco-logical fallacy” related to covariance in which it isinferred tiat “ . . . a correlation between variablesderived from the attributes of ecological
I246

units . . . will also hold between variables derivedfrom the attributes of individual units . . .“S NO
conclusions of this research are related to the be-havior of individuals in order to avoid many of thedifficulties which have been raised.
In an effort to offset many of the methodologi-cal pitfalls commonly cited concerning ecologicalresearch, the present study specifically incorporatedthe following approaches to the research problem:
In an attempt to reduce, insofar as practic-able, the complexity of the results, every efforthad been made to reduce the “clusters” of eco-logical dimensions to more isolated concepts(e.g. “young marrieds” was reduced to the sev-eral separate marital status indicators).
Utilization of only the “least risky” diagnos-tic categories, in an attempt to increase the reli-ability and validity of such data.
Examined the relative heterogeneity/ho-mogeneity of the small areas chosen for analy-sis such that they are as representative as possi-ble of the individual values for the area.
Examined utilization in as many settings aspracticable, to reflect the variety of settings andservices available to the population studied.
Attempted to retain utility of the analysisfor suggesting possible modification of extantservices by presenting information concerningpopulations which evidence remarkable utiliza-tion patterns.
Incorporated data concerning the move-ment of the population into and out of the areastudied by employing migration indicators.
Employed statistical techniques which as-sisted in explication of relationships betweenmultiple variables, in an effort to reduce thenumber of independent variables to a morecomprehensive, readily interpretable composite,and examine the linearity of relationships andassociations observed.
Beyond the requirements for guarding againstspecific difficulties discussed earlier, several othermethodological problems were confronted:
Temporal. Since the Census Data, which formthe core of the socioeconomic class composite, weregenerated for the period of the spring of 1970, allother sources of data have been isolated for compa-rable periods.
Area of Study. In order to make the files ascomparable as possible as well as to limit the num-ber of independent variables in the study, the “Cityof New Haven” (1970 population = 13’7,707) was
selected as the area to be considered the “servicearea”. Further, restricting the study area to the corecity has provided for comparability with earlierstudies of the same geographic area.
Differential Utilization Due To Access. Muchpreliminary work had shown incomparability ofutilization for reasons which would constitute majoranalytical obstacl;s upon aggregation. This prob-lem has several facets, and concerns issues such asthe socioeconomic constituency of the suburbanareas and racial imbalances, both of which affectutilization patterns. Perhaps the most obvious utili-zation factor which may be advanced is, simply, abasic component of access, namely distance. Manystudies have considered distance as a surrogate for“availability” of services but neglect to control forthe “distance-reducing” factors commdn to highersocioeconomic class (SEC) levels (such as privatetransportation, etc.) which may, when compared toinner-city means of transportation, reduce the bar-riers once felt to be imposed by physical distance.At any rate, limitation to the core city seemed toplace an effective limit on distance within parame-ters which this study could evaluate. Financial andlinguistic problems often impose barriers whichsurpass physical distance in terms of access to andutilization of services. The impact of these and sev-eral other factors are currently difficult, if not im-possible, to measure.
Census Data Constraints. The Census, whichprovided the essential core of data constituting theindependent variables of the study, also imposedseveral constraints on areal data comparability. Suchconstraints included the availability of census tractand block group data for the First Count and onlycensus tract level data for the Fourth Count, mak-ing fine-grained analysis more difficult and creatingconcern over the weighting of the suburban contri-bution to the data.
Within the 28 Census Tracts comprising theChy of New Haven, block groups were chosen asthe final areas or levels of aggregation. The arealunit called the block group, which consists generallyof an average of ten blocks, was found to be highlysuitable for the purposes of this investigation. Theblock group represents the smallest geographic unitwhich could be reliably summarized in terms of theavailable data, from both the census and from themental health service agencies. Single blocks do notusually contain a sufficiently large population baseto afford reasonably reliable analysis of data. This isparticularly true of those data available from thecensus because, at the block level, they are subjectto distortion due to the level of sampling that wasoriginally employed (i.e., 20 percent to 5 percentfor some census items), and the subsequent alloca-tion which is necessary to provide data at the blocklevel.g
247229-121 0-77-17

Generally, a block group contains between 200and 600 households (approximately 500 to 1,600persons) and, in comparison to the traditional cen-sus tract, of which they are a sub-division (there arebetween one and eight block groups to a censustract), they evidence an even greater degree ofhomogeneity of population characteristics.lo Theadvantage of, undertaking this inquiry at the blockgroup level included:
1.
2.
3.
4.
The lowest level from which agency utiliza-tion data could reliably and practicably beobtained and summarized. Further, withincertain limits, the smaller the geographicunit examined, the greater the homogeneityof those area.Pre-existing census delineation with the ad-vantage of proven statistical summarizationvalue, standardization, and recurrent use forcensus purposes.The great breadth and versatility of the so-ciodemographic/socioe~onomic census database at the block group level, and the availa-bility of census data tapes for both censustracts (Counts 1, 4) and block groups(Counts 2, 3, 5).The existence, in New Haven, of a previouslydeveloped data base (196’7) for th~ potentialconduit of trend analyses.
For these reasons, then, analyses were per-formed with an “N of 110,. corresponding to thefinal number of block groups determined to offer
. sufficient observations for statistical analyses.
D. The Data Sources1.Independent Variables (See Table I for ad-
ditional detail).a. Socioeconomic Class (SEC) and Socio-
economic ChangeFive variables were utilized to arrive
at a socioeconomic class composite suita-ble for ranking the block groups of NewHaven on a socioeconomic continuumfrom low to high SEC.
248
i.
ii.
Median family income—defined asthat income level in each block groupbelow and above which half of thefamilies fall, expressed in raw dol-lars.Percent of the population in theblock groups over 25 years of agewith less than 12th grade school at-tendance. Chapter IV B presents ananalysis of the relationship betweenthe relative level of education of
...111.
iv.
v.
block groups and utilizers of mentalhealth services from those blockgroups.Percent of employed males in theblock group in unskilled, semi-skilled, and service occupations,Overcrowding Index-percent of occu-pied housing units having 1.01 ormore persons per room in the blockgroup.Normal Family Life Index-percent ofchildren under 18 years o~ age wholive with both parents in a givenblock grOUp.
These five facets of socioeconomic classwere derived from correlatio~ and factoranalyses utilizing census data from theNew Haven, Connecticut dress rehearsalcensus conducted by the Bureau of theCensus in the spring of 1967’. The proce-dures used and the. application of theanalysis to maternal and child health is-sues are presented in detail in publica-tions of the Bureau of the Census, 11
A second group of five variables,which focused on change in median fami-ly income, education, employment, over-crowding or normal family life were de-veloped by subtracting 1967 levels fromthose of 1970 for all five variables.
The socioeconomic class variableseither singly or in composite, representthe use of sociodemographic data in thisstudy in two principal ways. First, forclassification and reduction of the data, todistill and structure a massive data filewith something that is certainly moremanageable, and hopefully more mean-ingful. The second use of the data wasfor analysis, in order to describe the char-acteristics of small geographic areas (e.g.,block groups or census tracts), chosen forstudy; and to afford an opportunity toexamine change in socioeconomic classover time (1967 to 1970) for small areas,which might yield a measure of “socialchange” andJor stress.
It was felt that the five variables rea-sonably reflected and summarized theseveral dimensions of socioeconomicclass found in the literature. In going”beyond one or two factors, interactionbetween social and economic factors weremore successfully addressed than in manyprevious studies.
In order to proceed with an analysisand interpretation of patterns of commu-nity mental health services utilization by

socioeconomic class levels, there was es-tablished a “profile” of the community,upon which the various indicators poten-tially predictive of utilization might beoverlayed. For each block group, the fiveSEC variables were extracted, and all ofthe City’s block groups were ranked ontheir composite score. The block groups,ranked from low to high, were furtherdivided into quartiles ranging from ‘UpperSEC’ (N=30) for the top 25 percentthrough ‘Upper Middle SEC’ (N= 25) and‘Lower Middle SEC’ (N=29) to ‘Low SEC’(N=29) for the bottom 25 percent.
Sociodemographic Variables
The remaining independent variablesstudied were of an essentially sociode-mographic nature. All were developedfrom 1970 census sources, such as the lst,4th and 5th Counts, or were derivedfrom intermediate tapes made availablefrom the Bureau of the Census for thosevariables not generally available at lowlevels of aggregation, such as the blockgroup. These sociodemographic indica-tors were grouped as follows:
i. Ageii. Sex
iii. Raceiv. Marital Status of the population over
14 years of agev. Migration status for- five years pre-
ceding the enumerationvi. Employment Status of labor force
eligible populationvii. Distance from the center of the city
E. Services Studied
The data from services studied included (SeeTable II): ,
a. Specifically mental health service files, in-cluding data from:
i. Connecticut Mental Health Centerii. Connecticut Valley Hospitaliii. Yale-New Haven Hospital Emergen-
cy Room (psychiatric diagnosis orreferral)
iv. Dana Psychiatric Clinic of the Yale-New Haven Hospital
b. Data Files from other agencies, not gen-erally considered traditional mentalhealth services providers:
i. Fire Department Emergency Services(mental health related calls)
ii. Circuit Court (selected offense cate-gories)
iii. Juvenile Court (selected offense cate-gories)
In an effort to provide essential comparabilityacross the files constituting the utilization (depe-nd-ent) variable, every effort was made to limit, insofaras possible, the health service data to that availablefrom basically community outpatient services.
The Emergency Services of the Yale-New Ha-ven Hospital and the Connecticut Mental HealthCenter are included in this definition, as well as cer-tain short duration inpatient services (EmergencyTreatment Unit of the Connecticut Mental HealthCenter). The rationale for this limitation was simplythat the other community services data, such as thatfrom courts and fire department emergency serv-ices, basically correspond to “outpatient” servicesfrom health agencies (or crisis-oriented care), atleast in the initial stages of the encounter. The oneexception to this rule was the Connecticut ValleyHospital. It was felt that these data would provideadditional information concerning patients of NewHaven origin, utilizing services in several mentalhealth problem (or diagnostic) categories generallyassociated with those in the ambulatory settings.
Upon receipt from the various agencies, all fileswere placed on tape and subjected to a basic addressmatching procedure, developed for the distillationof these files as follows:
a.
b.
This
Geocoding or address matching to obtainareal comparability with demographic(census) data.Refinements of the data as necessarywithin and between files (e.g,, derivationof rates by specific population groups,etc.).
process, developed by the Bureau of theCensus’ C;nsus Use Study, automates the processwhich matches the local agency records which con-tained street addresses, to a- geographic base filecontaining street address ranges for each geograph-ic unit (in this case the block group). 12
Following the geocoding of the eight agencyfiles for which mental health service utilization datawere available, several procedures were employedto distill and st~cture the rather massive data basewhich resulted. From the individual files, a mastertape containing the dependent (utilization) variablesmerged with the twenty-five independent variables(SEC and sociodemog;aphic) obtained from censussources was created from which all subsequent anal-yses were performed (Steps in data preparationand analysis are presented in Figure I).
249

Figurel. FLOW CHART FOR DATA PREPARATION AND ANALYSIS
INPUT FILES A
I. Connoclicut MonlolHcallh Contor
1. Connscticu! VolleyHospitol
III. Yolo - Naw Hov@nHospilol Dons Clitic
~. YOIQ - Ntw HovonHospitol’ EmcrgancyRoom
X N*w Hovon Fir@DepartmanlEmergency Sarviccs
~ N*w Hovcn Vitol
Reccfds~ New Hoven Circuit
Cour4
= Now Haw@n JuvcnilsCourl
IX t967 Census,1970 Ccn8ua
[C@n$us Tfoct / B.G. Doto
——— ——— ——-I RAW DATA
I f 1
—.— —.— ——
I 1 Cord Filo———— .
ilndividuolCos# 00!0 Ootorminc
I * I
fi19a
condition J
I
of filo
I
II Moka
I
Add ~
I IIl———— ——-— 41
1 ——— ——— —— II
——— ——— ——— ——— .PROCESS SUMMARY DATA FILE$
iBuild cotrospondonc$
I● fllt with
C.T and E.G.D1
Dot4rmin9 IIovsl I
Summery
08!0I I
II
I II II1- —-’1——— ——— ——— ——.
———— ———— ——~
[ PREPARE CENSUS DATA TAPES
I r Solcct ond buildnoodod vorioblot,
●census IfocttC9nsut Oalol
I 1ond 9.6.
I1II ——— ———— ———
I
1- 1———-
———— ——.\ BUILD CENSUS TRACT
I .—— — ——
I —————————— ---; I PRE PROCESS CENSUS DATA
I 1 _—— ——— -
1J
250

FLOW CHART FOR DATA PREPARATION AND ANALYSIS–Con.
——.— —=——— ——— —, 1. OATA ANA~S~ ,
.—— — ———DATA FOR I
III
CLEANSE DATAI
II
II
I
II-— 0Final
Gcocfiti
Filo
— ——
II
I–1
I INDEX CONSTRUCTION I ; ,
IIIiIII
I 8’I
Conotruct Indcxos,socIOl indlcolors I
.
AccumulotaI
ctnsuc tract, I6.0. 00!0
I
I ‘–––47L——— ——— ——— .—— — II
! B.G. FILE ‘1
I——— ——— ——— —
T———
-—— —
I*
———
If
bGrophico
DI:;:yOC
1,.—— — —
i
II
b Dlscu$$lorr
III
II
wFinol I
Ctnsu8C.T,/B G. I
Filo I NOTES I
J A All Inwl fltoo !970 dolo cncopt 1967 conou$ fllc,—— —0 cc. SOCio#conOmic Claso Comoogit*o
C F~f 1967 dale, DIME filo; 10; 1970 dofo, ACG omploycd fOC OCOCOdifIO
o From OIfICJ sorwlct orcao (Co. Proclficl)
c SYMAP, PLOTTER, OIC.
251
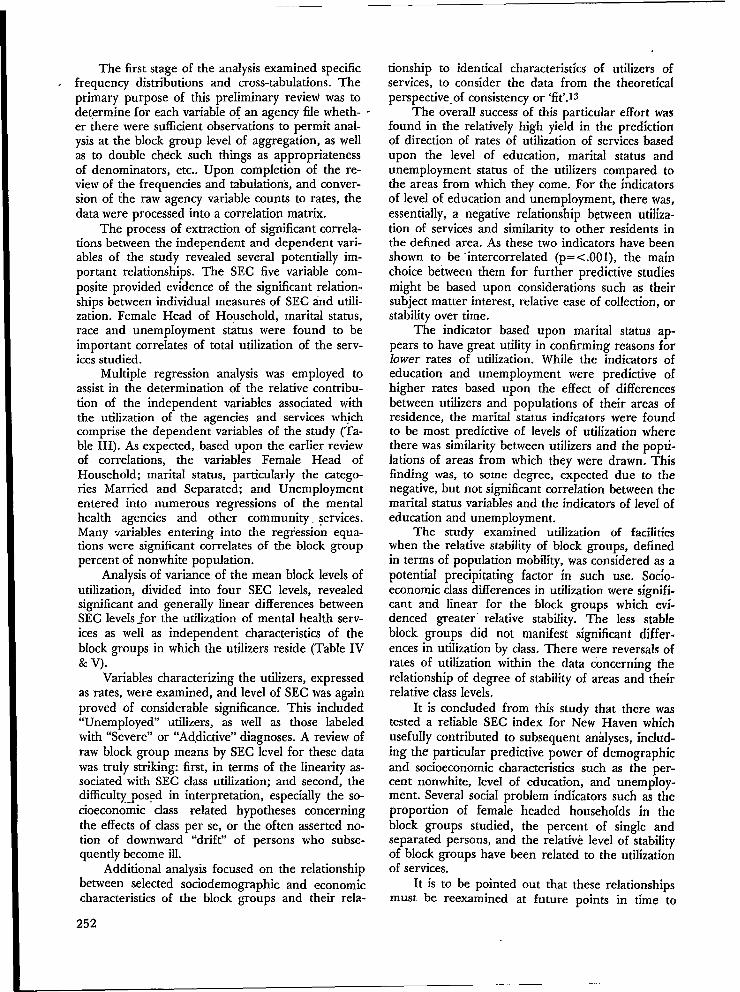
The first stage of the analysis examined specificfrequency distributions and cross-tabulations. Theprimary purpose of this preliminary review was todetermine for each variable of an agency file wheth-er there were sufficient observations to permit anal-ysis at the block group level of aggregation, as wellas to double check such tings as appropriatenessof denominators, etc.. Upon completion of the re-view of the frequencies and tabulations, and conver-sion of &e raw agency variable counts to rates, thedata were processed into a correlation matrix.
The process of extraction of significant correla-tions between the independent and dependent vari-ables of the study revealed several potentially im-portant relationships. The SEC five variable com-posite provided evidence of the significant relation-ships between individual measures of SEC and utili-zation. Female Head of Household, marital status,race and unemployment status were found to beimportant correlates of total utilization of the serv-ices studied.
Multiple regression analysis was employed toassist in the determination of the relative contribu-tion of the independent variables associated withthe utilization of the agenaes and services whjchcomprise the dependent variables of the study (Ta-ble III). As expected, based upon the earlier reviewof correlations, the variables Female Head ofHousehold; marital status, particularly the catego-ries Married and Separated; and Unemploymententered into numerous regressions of the mentalhealth agencies and other community. services.Many -zariables entering into the re~ession equa-tions were significant correlates of the block grouppercent of nonwhite population.
Analysis of variance of the mean block levels ofutilization, divided into four SEC levels, revealedsignificant and generally linear differences betweenSEC levels for the utilization of mental health serv-ices as well as independent characteristics of theblock groups in which the utilizers reside (Table IV& v).
Variables characterizing the utilizers, expressedas rates, were examined, and level of SEC was againproved of considerable significance. This included“Unemployed” utilizers, as well as those labeledwith “Severe” or “Addictive” diagnoses. A review ofraw block group means by SEC level for these datawas truly striking first, in terms of the linearity as-sociated with SEC class utilization; and second, thedifficulty-posed in interpretation, especially the so-cioeconomic class related hypotheses concerningthe effects of class per se, or the often asserted no-tion of downward “drift” of persons who subse-quently become ill.
Additional analysis focused on the relationshipbetween selected sociodemographic and economiccharacteristics of the block groups and their rela-
252
tionship to identical characteristics of utilizers ofservices, to consider the data from the theoreticalperspective-of consistency or ‘fit’.ls
The overall success of this particular effort wasfound in the relatively high yield in the predictionof direction of rates of utilization of services basedupon the level of education, marital status andunemployment status of the utilizers compared tothe areas from which they come, For the indicatorsof level of education and unemployment, there was,essentially, a negative relationship between utiliza-tion of services and similarity to other residents inthe defined area. As these two indicators have beenshown to be intercorrelated (p= <.001), the mainchoice between them for further predictive studiesmight be based upon considerations such as theirsubject matter interest, relative ease of collection, orstability over time.
The indicator based upon marital status ap-pears to have great utility in confirming reasons forlower rates of utilization. While the indicators ofeducation and unemployment were predictive ofhigher rates based upon the effect of differencesbetween utilizers and populations of their areas ofresidence, the marital status indicators were foundto be most predictive of levels of utilization wherethere was similarity between utilizers and the popu-lations of areas from which they were drawn, Thisfinding was, to some degree, expected due to thenegative, but not significant correlation between themarital status variables and the indicators of level ofeducation and unemployment.
The study examined utilization of facilitieswhen the relative stability of block groups, definedin terms of population mobility, was considered as apotential precipitating factor in such use. Socio-economic class differences in utilization were signifi-cant and linear for the block groups which evi-denced greater” relative stability. The less stableblock groups did not manifest significant differ-ences in utilization by class, There were reversals ofrates of utilization within the data concerning therelationship of degree of stability of areas and theirrelative class levels.
It is concluded from this study that there wastested a reliable SEC index for New Haven whichusefully contributed to subsequent analyses, includ-ing the particular predictive power of demographicand socioeconomic characteristics such as the per-cent nonwhite, level of education, and unemploy-ment. Several social problem indicators such as theproportion of female headed households in theblock groups studied, the percent of single andseparated persons, and the relativ~ level of stabilityof block groups have been related to the utilizationof services.
It is to be pointed out that these relationshipsmust be reexamined at future points in time to

permit estimations of the reliability of the findings.The difficulty encountered concerning variabilityover time is, of course, in attribution: is it the envi-ronment, the particular characteristics of the resi-dents, the impact of services, or a combination ofall of these which is responsible?
Beyond *e confirmation of much previousresearch on the relationship of class an”d utilizationof mental health services, the original findings ofthis study would offer support to those who areunwilling to disregard the impact of environmentalfactors on such use.
There is considerable evidence that much ofwhat we consider to be mental disorder is both so-cially determined and defined; thus, social problemswill most likely be solved by correcting causes, notsymptoms. Findings of study suggest that communi-ties must find ways of responding to the conditionsof unemployment, separation, female head ofhousehold and the like, without necessarily Iabellingresultant related difficulty in individual coping asillness. It is apparent that, despite the considerableadvancement toward a public health model incommunity mental health programs, the words ofSigerist still apply:
Steady employment under the best hygieneconditions, the correct balance between work,rest, and recreation, and wages that permit adecent standard of living - these are basic andsignificant factors in public health. 14
Footnotes and References
1. David F. Musto, “Whatever Happened to CommunityMental Health?”, The Public Interest, No 39, Spring,1975, pp. 53-79; Franklyn N. Arnh~ff, “Social Conse-quences of Policy Toward Mental Issues”, Science,
June 27, 1975, pp. 1277-1281; Lawrence S. Kubie,“Pitfalls of Community Psychiatry”, Archives of Gen-eral Psychiatry, Vol. 18, March, 1968, pp. 257-266.
2. See for example: Morris Schwartz and CharlotteSchwartz, Social Approaches to Mental Patient Care,
(New York: Columbia University Press, 1964); WalterR. Cusky, Pre-Hospital Social and Cultural Factors asPredictors of Post-Mental Hospital Experience, (un-published Ph.D. dissertation, Brandeis University,Waltham, MA, 1968); Edward Zigler and L. Phillips,“Social Competence and Outcome in Psychiatric Disor-der”, journal of Abnormal Social Psychology, Vol. 63,1961, pp. 264-271. ‘
3. Total First Utilization (the first admission rate’ of manyother studies) may suffer from under-reportage, whichvaries with diagnosis, age, socioeconomic and other char-acteristics which may be correlates of incidence.Generally, the first admission rate (Ry) is a function ofthe true incidence rate (Iy) multiplied by the factor whichrelates the total number of newly developed cases (Cy) tothe number of cases who were ned admissions (Ay) andthe number of cases who were first admissions (Ax); i.e.:
admissions (Ay) and the number of cases who werefirst admissions (Ax); i.e.:
AYRY = (IY)
+ Ax
Cy
See M. Kramer, discussion in Causes of Mental disor-
4.
5.
6.
7.
8.
9.
iers: A Review of Epidemiological Knowledge, J959,New York: Milbank Memorial Fund, 1961), pp. 271-!73.$ee for example: Sol Fanshel and J.W. Bush, “AHealth Status Index and Its Application to HealthServices Outcomes”, Operations Research, Vol. XVIII,No. 6, November-December, 1970, pp. 1021-1066.4ugust B. Hollinshead and Frederick C. Redlich, So-cial Class and Mental Illness, A Community Study,(New York: John Wiley and Sons, 1958)Donald L. Miller, Community Mental Heafth: A Studyof Services and Clients, I(Lexington, MA: LexingtonBooks, 1974), pp. 37ff; Bruce P. Dohrenwend andBarbara S. Dohrenwend, “The Problem of Vflldity inField Studies of Psychological Disorder”, ~ournd of
Abnormal Psychology, Vol. 70, No. 1, 1965, pp. 52-69; Herzl R. Spiro, Iradj Slassi, and Guido Crocetti,“What Gets Surveyed in a Psychiatric Survey? A CaseStudy of the MacMillan Index”, joumd of Nervous
and Mentaf Disease, Vol. 152, February, 1972, pp.105-1 14; Carol C. Schwartz, Jerome K. Myers, andBoris M. Astrachan, “Comparing Three Measures ofMentaf Status: A Note on the Vafidity of Estimates ofPsychological Disorder in the Community”, journal ofHealth and Social Behavior, Vol. 14, September,1973; Stanislav V. Kasl and Ernest Harburg, “MentalHealth and$the Urban Environment: Some Doubts andSecond Thoughts”, journaJ of Health and Social Be-
havior, Vol. 16, No. 3, September, 1975, pp. 268-282.
H. Warren Dunham, “Current Status of EcologicalResearch in Mental Disorder”, in A.M. Rose cd., Men-tal Health and Mental Disorder, (New York: W.W.Norton, 1955), pp. 168-179; Anita K. Bahn, “SomeMethodologic Issues in Psychiatric Epidemiology”, inRussell R. Monroe, Gerald D. Klee, and Eugene B.Brody, Psychiatric Epidemiology and Mental HealthPlanning, Psychiatric Research Report No. 22, (Wash-ington, D. C.: American Psychiatric Association, 1967),pp. 69-83; Stainslav V. Kasl, “Effects of Housing onMental and Physical Health”, Man-Environment SyS-tems, 4 July, 1974, pp. 207-226.Mervyn Susser, C!ausal Thinking in the Health Serv-ices: Concepts and Strategies in Epidemiology, (NewYork: Oxford University Press, 1972), pp. 59ff W.S.Robinson, “Ecological Correlations and the Behaviorof Individuals”, American Sociological Review, Voi.15, 1950, pp. 351-357.For a discussion of this issue and sampling variability,the reader is referred to: U.S. Bureau of the Census,1970 Census User’s Guide, (Washington, D. C.: Gov-ernment Printin”g Office, 1970), pp. 26-28; U.S. Bu-reau of the Census, Census of Population and Hous-
ing: 1970, Census Tracts, Final Report PHC (l), Ap-pendix C: “Accuracy of the Data”, (Washington, D.C.:Government Printing Office, 1972), pp. Appendix 40.
253

The independent variables and statistics employedin the study and presented in this table are census es-timates de~lved f~om a sample survey. The statistics,based on 1970 census sample data, are estimates madethrough the use of ratio estimation procedures whichwere applied separately for the 5, 15, and 20 percentcensus samples. All variables examined in this studywere derived from a 20 percent sample, with the ex-ception of the Migration Index which was derivedfrom a 15 percent sample. The sampling proceduresemployed and the sampling variability to which allvariables are subject are discussed in the referencedcensus materials above. It is imuortant to remember,that the accuracy of a survey result depends uponboth the sampling and non-sampling errors, measuredby the standard error, andthe bias and other types ofnon-sampling error, not measured by the samplingerror.
10. Chapter IV, “Comparative Analysis of Census Tractsand Block Groups”, in U.S. Bureau of the Census,Census Use Study: Healtfs Information System 11,Report No. 12, (Washington, D.C.: Government Print-ing Office, 1971), pp. 51-82.
11.
12.
13.
14.
See for example: U.S. Bureau of the Census, CensusUse Study: Health Information System 11, Report No.12, Ibid.U.S, Bureau of the Census, Census Use Study: TheDIME Geocoding System, (Washington, D.C.: Goverss-ment Printing Office, 1970); U.S. Bureau of the Cen-sus, Census Use Study: ADMA TCH Users Manual,(Washington, D.C.: Government Printing Office,1970); U.S. Bureau of the Census, Census Use Study:Geocoding witi ADMATCH - A Los Angeles Experi-ence, ,~ashington, D.C.: Government Printing Office,1972).Richard L. Meile and Philip N, Haese, “Social Status,Status Incongruence, and Symptoms of Stress”, Jour-nal of Health and SociaJ Behavior, Vol. 10, No. 3,September, 1969, pp. 237-244; Henry Wechsfer andThomas F. Pugh, “Fit of Individual and CommunityCharacteristics and Rates of Psychiatric Hospitalize.tion”, American journal of Sociology, Vol. 73, Nov-ember, 1967, pp. 331-338.Henry Sigerist, Civilization and Disease, (Phoenix Ed,1942), (Chicago: University of Chicago Press, 1962),p. 55.
254

APPENDICES
Table 1DEFINITIONS OF THE VARIABLES EMPLOYED IN THE STUDY3
Tariable Nme Meanland Number Description Definitionz Value3
1. MFI Median Family Income That income level in a block group below and above which half of the families, unrelated 10,579.81of a Block Group individuals, and persons 14 years and over fall, expressed in raw dollars.
2. ED Indicator of the relative The population in a block group over 25 years of age with less than 12th grade school 51.87Educational achievement attendance, expressed as a percent of population over 25 years of age.of a Block Group.
3. EMPL Indicator of the relative Employed males in a block group in unskilled, semi-skilled, and service occupations, expressed 18.68Employment status of as a percent of the employed male population in the labor force of the block group.a Block Group.
4. NFLI Indicator of the relative The number of children less than 18 years of age living with 2 parents in a block group, 74.14completeness of families, expressed as a percent of the population less than 18 years of age in the same block group.or Normal Family Lifeof a Block Group.
5. OCI Indicator of the relative The percent of occupie~ h~using units of a block group having 1.01 or more persons per room, 6.90Overcrowding of oc- calculated by dividing the number of persons by the number of rooms in each unit of occupiedcupied housing units of housing in the block group.a Block Group.
6. % LE 18 Percent of population The percent of population of a block group less than 18 years of age, determined in completed 26.98less than 18 years of age years as of the time of enumeration.in a Block Group.
7. % GE 65 Percent of population The percent of population of a block group greater than’ 65 years of age, or older, determined 8.67greater fian 65 years of in completed years as of the time of enumeration.age in a Block Group.
8. DEPRAT Indicator of the relative The ratio of the poptiation of a block group less than 18 years of age and greater than 65 yeas 0.36burden of Dependent of age as determined in completed years as of the time of enumeration, to the total populationpoptiation to the total in the block group.population, in a BlockGroup.

,,
I Rm Table 1 (Cent’d)
DEFINITIONS OF THE VARIABLES EMPLOYED IN THE STUDY3
Variable Name Meanl
and Number Description Definitionz / Value3
9, SEXRAT Sex Ratio of males to Calculated as the number of males per 100 females in the population of a block group. 0.88
females in a Block \Group.
10. % NW Non. White population Includes all persons in a block group who did not indicate their race as white, or did not 25.31
of a Block Goup. have their entry classified as white, expressed as a percentage of total population.
11. % FEMHEAD Relative percent of fam- The number of families where the head is female and there is no spouse of head present, 11,72ilies in a Block Group expressed as a percent of the primary families in a block group.where the Female is theHead.
12. % CHANGE The Change in the Non- The difference in the percentage of persons in a block group who dld not indicate their race 3.14
NW White percent of popu- as white for the years 1967 and 1970 (see Variable 10 above.)lation of a Block Group.
13. DISTANCE The Dktance from the The distance from the center of each block group in the city of New Haven to the Connecticut 1.86central city to the farth- Mental Health Center as demarcated in 1/2 mile increments.est Block Groups in thecity of New Haven as apotential measure ofaccess to services,
14. CHANGE The Change in Medkn The difference in the median family income of a block group for the years 1967 and 1970, 4,253.35MFI Family Income of a expressed in raw dollars (see V=iable 1, above).
Block Group over time.
15. CHANGE The Change in the Em- The difference in the employment status of employed males in a block group in unskilled, -6.56EMPL ployment status indica- semi-skilled, and service occupations, expressed as a percent of the employed male population
tor of a Block Group. in the labor force, of a block group for the years 1967 and 1970 (see Variable 3, above).over time.
16. CHANGE The Change in the Edu- The difference in the educational achievement of the popdation in a block group over 25 years 3.94ED cational achievement of of age, with less than 12th grade school attendance, expressed as a percent of the population
a Block Group over over 25 years of age in the block groups, for the years 1967 and 1970 (see Variable 2 above).time.
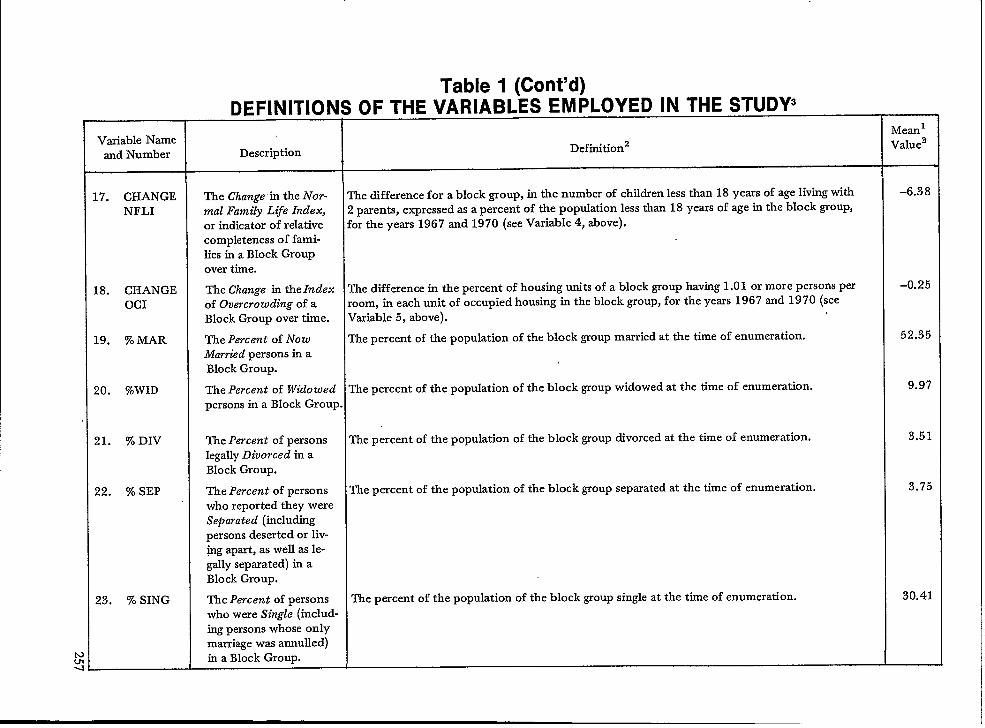
—.
Table 1 (Cent’d)DEFINITIONS OF THE VARIABLES EMPLOYED IN THE STUDY3—— --- ——-——-———
Variable NameMeanl
and Number Description Definition Value3
17. CHANGE The Change in the iVor- The difference for a block group, in the number of children less than 18 years of age living with -6.38
NFLI mal Family Life Index, 2 parents, expressed as a percent of the population less than 18 years of age in the block group,or indicator of relative for the years 1967 and 1970 (see Variable 4, above).completeness of fami-lies in a Block Groupover time.
18. CHANGE The Change in the Index The difference in the percent of housing units of a block group haviug 1,01 or more persons per –0.25
OCI of Overcrowding of a room, in each unit of occupied housing in the block group, for the years 1967 and 1970 (seeBlock Group over time. Variable 5, above).
19. % MAR The Percent of Now The percent of the population of the block group married at the time of enumeration. 52.35
Married persons in aBlock Group.
20. %WID The Percent of Widowed The percent of the population of the block group widowed at the time of enumeration. 9.9?
persons in a Block Group .
21. % DIV The Percent of persons The percent of the population of tie block group divorced at the time of enumeration. 3.51
legally Divorced in aBlock Group.
22. % SEP The Percent of persons The percent of the popuktion of the block group separated at the time of enumeration. 3.75
who reported they wereSeparated (includingpersons deserted or liv-@g apart, as well as le-gally separated) in aBlock Group.
23. % SING The Percent of persons The percent of the population of the block group single at the time of enumeration. 30.41who were Single (includ-ing persons whose onlymarriage was annulled)in a Block Group.
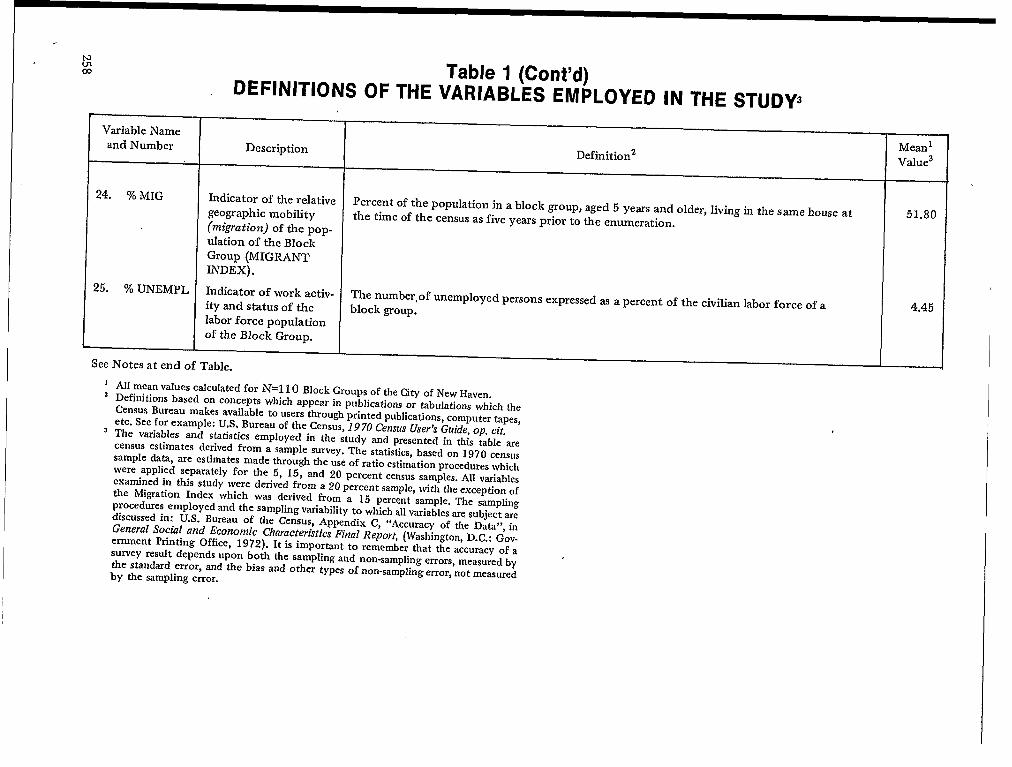
Variable Nameand Number
24, % MIG
25, % UNEMPL
Table 1 (Cent’d)DEFINITIONS OF THE VARIABLES EMPLOYED IN THE STUDY3
Description
Indicator of the relativegeographic mobility(ms’~ation) of tile pop.
ulation of the BlockGroup (MIGRANTINDEx).
Indicator of work activ-ity and status of thelabor force populationof the Block Group.
See Notes at end of Table.
Definitionz
Percent of the population in a block group, aged 5 years and older, living in the same house atthe time of the census as five years prior to the enumeration.
The number,of unemployed persons expressed as a percent of the civilian labor force of ablock grOUp.
1
2
3
AI1 mean values calculated for ~=110 Block Groups of the City of New Haven,Definitions based on concepts which appear in publications or tabulations which theCensus Bureau makes available to users through printed publications, computer tapes,etc. See for example: U.S. Bureau of tie Census, 1970 Census User’s Guide, op. cit.The variables and statistics employed in the study and presented in this table arecensus estimates derived from a sample survey. The statistics, based on 1970 censussample data, are estimates made through the use of ratio estimation procedures whichwere appIied separately for the 5, 15, and 20 percent census samples. All variablesexamined in this study were derived from a 20 percent sample, with the exception ofthe Migration Index which was derived from a 15 percent sample. The samplingprocedures employed and the sampling variability to which all variables are subject arediscussed in: U.S. Bureau of the Census, Appendix C, “Accuracy of tie Data”, inGeneral Social and Economic CharacteristicsFinal Report, (Washington,D. C.: Gov-ernment Printing Office, 1972). It is important to remember that the accuracy of asurvey result depends upon both the sampling and non-sampling errors, measured bythe standard error, and the bias and other types of non-sampling error, not measuredby the sampling error.
MeanlValue3
51.80
4.45

Table IINUMBERS OF OBSERVATIONS AND TOTAL UTILIZATION
Agency
Comecticut Mental Health CenterConnecticut Valley HospitalYale-New Haven Hospital Emergency RoomDana Psychiatric ClinicFire Department Emergency Services
(3 Selected Categories)Vital Records
(5 Selected Categories of Death)
Circuit Court(9 Selected Offense Categories)
Juvenile Court(7 Selected Offense Categories)
See footnotes attached!
***
PopdationBase
Number ofObservations
RATES
Agency First IUtilization Rate
Per 1000 Popdation* *
FOR SPECIFIC AGENCIES (1969-1970)*
~ 16 Years~16 Years
All=16 Years
All
(Exce~Fetal_Deaths)>16 Years
=16 Years
189713392115
1561878
305
542
2521
20.1415,3716.65
1.5914.50
2.49
5.46
58.71
These observations snd rates reflect the overall experience of 110 New Haven block ~oups entered into the final analysis.Reflects First Utilization, rather than Total Admissions or Contacts for the period, to reduce double counting and clericalproblems associated with multiple utilization. See Footnote 3.
259
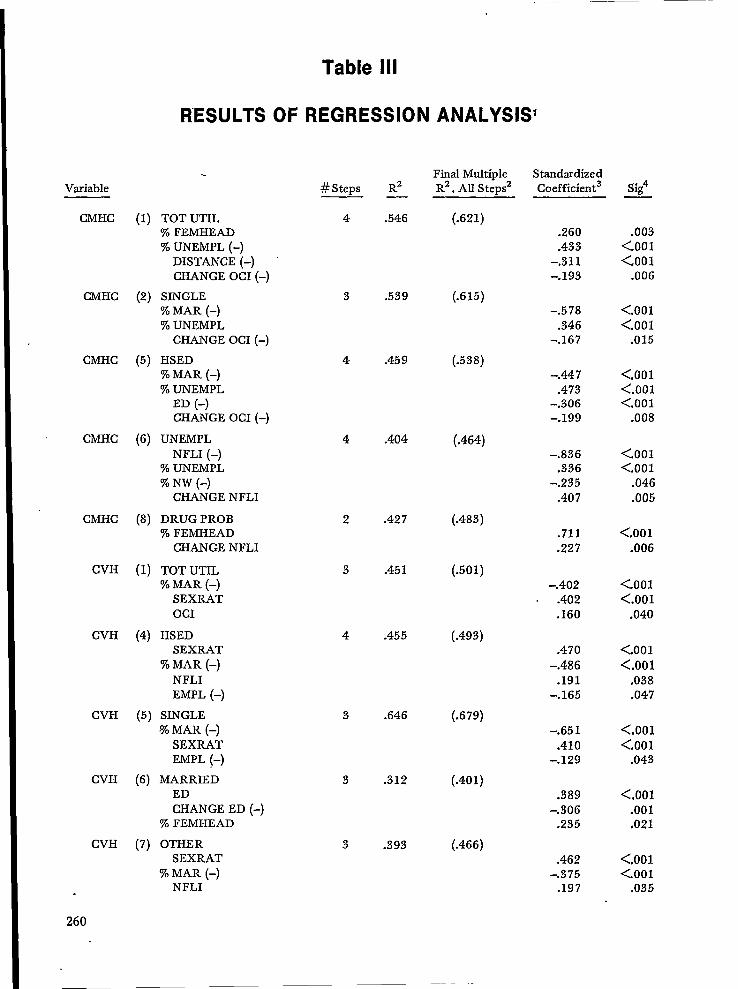
Variable
Table Ill
RESULTS OF REGRESSION ANALYSISI
CMHC
CMHC
CMHC
CMHC
CMHC
CVH
CVH
CVH
CVH
CVH
260
(1) TOT UTIL% FEMHEAD% UNEMPL (-)
DISTANCE (-)CHANGE OCI (-)
(2) SINGLE% MAR (-)% UNEMPL
CHANGE OCI (-)
(5) HSED% MAR (-)% UNEMPL
ED (-)CHANGE OCI (-)
(6) UNEMPLNFLI (–)
% UNEMPL% NW (-)
CHANGE NFLI
(8) DRUG PROB% FEMHEAD
CHANGE NFLI
(1) TOT UTIL% MAR (–)
SEXRATOCI
(4) HSEDSEXRAT
% MAR (-)NFLIEMPL (–)
(5) SINGLE% MAR (-)
SEXRATEMPL (–)
(6) MARRIEDEDCHANGE ED (-)
% FEMHEAD
(7) OTHERSEXRAT
% MAR (–)NFLI
3 .539
4 .459
4 .404
2 .427
3 .451
4 .455
3 .646
3 .312
3 .393
(.615)
(.538)
(.464)
(.483)
(.501)
(.493)
(.679)
(.401)
(.466)
Final Multiple Standardized#Steps R2 R2. AU Steps2 Coefficient— —
4 .546 (.621).260.433
-.311-.193
-.578.346
-.167
-.447.473
-.306-.199
–.836.336
-.235.407
.711
.227
-.402.402.160
.470-.486
.191-.165
-.651.410
-.129
.389-.306
.235
.462-.375
.197
Sig4
.003<.001<.001
.006
<.001<.001
.015
<,001<.001<.001
.008
<.001<.001
.046
.005
<.001.006
<.001<.001
.040
<.001<.001
.038
.047
<.001<.001
.043
<.001.001.021
<.001<.001
.035
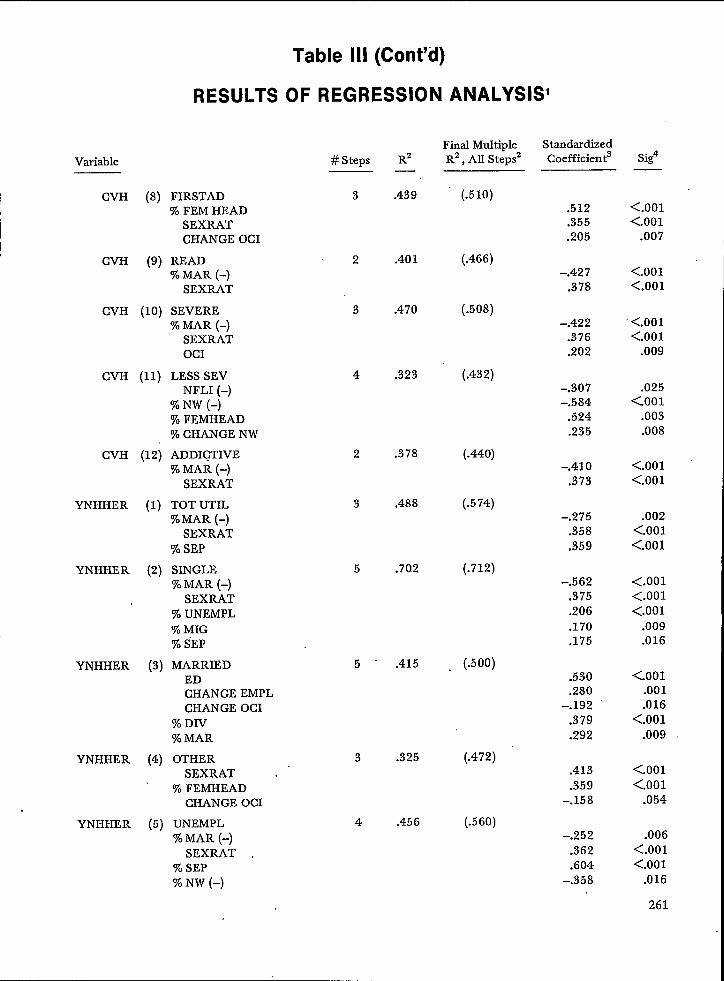
Table Ill (Cent’d)
RESULTS OF REGRESSION ANALYSIS1
Variable
CVH (8) FIRSTAD% FEM HEAD
SEXRATCHANGE OCI
CVH (9) READ% MAR (-)
SEXRAT
CVH (10) SEVERE
CVH
CVH
YNHHER
YNHHER
YNHHER
YNHHER
YNHHER
% MAR (-)SEXRATOCI
(11) LESS SEVNFLI (-)
% NW (-)% FEMHEAD% CHANGE NW
(12) ADDICTIVE% MAR (-)
SEXRAT
(1) TOT UTIL%MAR (-)
SEXRAT% SEP
(2) SINGLE% MAR (-)
SEXRAT% UNEMPL% MIG% iEP
(3) MARRIEDEDCHANGE EMPLCHANGE OCI
% DIV% MAR
(4) OTHERSEXRAT .
% FEMHEADCHANGE OCI
(5) UNEMPL% MAR (-)
SEXRAT% SEP% NW (-)
#Steps
3
2
3
4
2
3
5
5
3
4
R2—
.439
.401
.470
.323
.378
.488
.70.2
.415
.325
.456
Final MultipleR2, All Stepsz
StandardizedCoefficient
(.510)
(.466)
(.508)
(.432)
(.440)
(.574)
(.712)
. (.500)
(.472)
(.560)
Sig4
.512
.355
.205
-.427.378
–.422.376.202
–.307-.584
.524
.235
–.410,373
-.275.358.359
-.562.375.206.170.175
.530
.280-.192
.379
.292
.413
.359-.158
-.252.362.604
-.358
<.001<.001
.007
<.001<.001
‘ <.001<.001
.009
.025<.001
.003
.008
<.001<.001
.002<.001<.001
<.001<.001<.001
.009
.016
<001.001.016
<.001.009
<.001<.001
.054
.006<.001<.001
.016
261
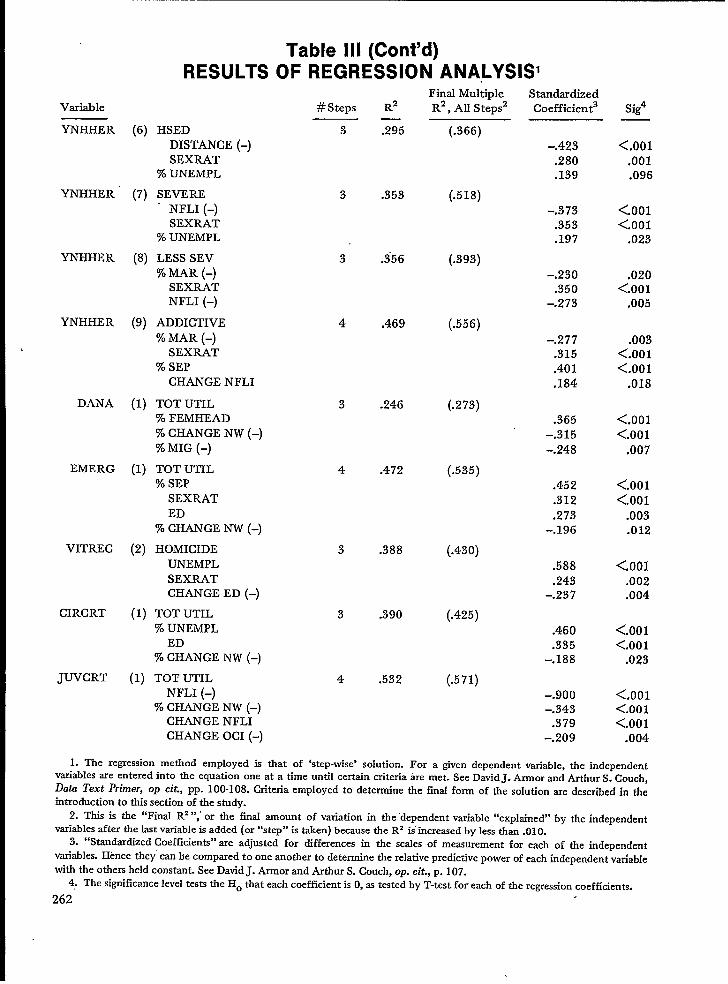
Variable
YNHHER (6)
YNHHER (7)
YNHHER (8)
YNHHER (9)
DANA (1)
EMERG (1)
VITREC (2)
CIRCRT (1)
JUVCRT (1)
Table Ill (Cent’d)RESULTS OF REGRESSION ANALYSISI
HSEDDISTANCE (-)SEXRAT
% UNEMPL
SEVERE“ NFLI (–)
SEXRAT% UNEMPL
LESS SEV
% MAR (-)SEXRATNFLI (-)
ADDICTIVE
% MAR (-)SEXRAT
% SEPCHANGE NFLI
TOT UTIL% FEMHEAD% CHANGE NW (-)% MIG (-)
TOT UTIL% SEP
SEXRATED
% CHANGE NW (-)
HOMICIDEUNEMPLSEXRATCHANGE ED (–)
TOT UTIL
% UNEMPLED
% CHANGE NW (-)
TOT UTILNFLI (–)
% CHANGE NW (–)CHANGE NFLICHANGE OCI (-)
#Steps R2
Final MultipleR2, All Steps2
3
3
3
4
3
4
.295
.353
.356
.469
.246
.472
(.366)
(.518)
(.393)
(.556)
(.273)
(.535)
3 .388 (.430)
3 .390 (.425)
4 .532 (.571)
StandardizedCoefficient
-.423
.280
.139
-.373.353.197
-.230.350
-.273
-.277.315.401.184
.365-.315
-.248
.452
.312
.273-.196
.588
.243-.237
.460
.335-.188
-.900–.343
.379-.209
Sig4
<.001.001.096
<001<.001
.023
.020<.001
.005
.003<.001<.001
.018
<.001<.001
.007
<.001<.001
.003.012
<.001.002.004
<,001<.001
.023
<,001<.001<.001
.004
1. The regression method employed is that of ‘step-wise’ solution. For a given dependent variabIe, the independentvariables are entered into tbe equation one at a time untiI certain criteria tie met. See David J. Armor and Arthur S. Couch,Data Text Primer, op cit., pp. 100-108. Criteria employed to determine the final form of the solution are described in theintroduction to tlds section of the studv.
2. This is the “Final R* “,” or the final amount of variation in the “dependent variable “explained” by the independentvariables after the last variable is added (or “step” is taken) because the R2 is’ increased by less than .010.
3. “Standardized Coefficients” are adjusted for differences in the scales of measurement for each of the independentvariables. Hence they” can be compared to one another to determine the relative predictive power of each independent vatiablewith the others held constant. See David J. Annor and Arthur S. Couch, op. cit., p. 107.
4: The significance level tests the Ho that each coefficient is O, as tested by T-test for each of the regression coefficients.
262.

Table IVSOCIOECONOMIC CLASS LEVEL BLOCK GROUP MEANS FOR
o25 INDEPENDENT VARIABLES N=IIO:
=VARIABLE LOWER SEC LOWER MIDDLE SEC UPPER MIDDLE SEC UPPER SEC
DESCRIPTION N=29 N=26 N=25 N=30
~ MFI 7,781.72 8,868.84 10,155.99 15,120.66
c.J~ gpL 67.76 60.41 51.10 29.74
~A 26.99 19.99g NFLI
16.89 10.9855.62 65.99 82.69 91.96
u OCI 4.9 4.37 2.74 2.63
%LE 18%GE65DEPRAT2
SEXRAT
%NW%FEMHEAD
%CHANGE NWDISTANCECHANGE MFICHANGE EMPL2CHANGE ED~HANGE NFLICHANGE OC12
%MAR%WID2%DIV%SEP%SING2%MIG%UNEMPL
35.4013.33
.49
.8549.36
22.705.881.50
2,982.59-4.55
5.04-12,04
1.2146.97
9.594.267.15
32.0145.77
7.19
27.9110.83
.39
.9433.15
13.943.851.61
3,365.57-9.54
5.18-11.58
–0.8250.43
10.194.044.40
30.9350.02
3.92
22.946.73
.30
.8714.38
6.491.10
2.283,597.39
-9.185,06
–2.82–1.4654.9710.35
3.10
2.2729.3154.54
4.15
21.403.89
.25
.874.383.531.58
2.076,797.83
–3.720.880.63
-0.1557.05
9.832.671.13
29.3156.90
2.52
ANALYSIS OF VARIANCE
F-TEST SIG. ETA1
m29.23028.30538.988
0.93923.16557.490
3.0735,286
21.6642.6572.646
10.576
2.2646.4570.3277.950
52.5210.9143.6629.414
<.001 0.453<.001 0.445<.001 0.525
,425 0.026<.001 0.396
<.001 0.619
.031 0.080
.002 0.130<.001 0.380
.053 0.070
.053 0.070<.001 0.230
.086 0.060
<.001 0.155
>.500 0,009<.001 0.184<.001 0.598
.437 0.025.015 0.210
<.001 0.210
1
“a(’)- ‘“”=& 2w Variables not exhibiting statistically si~ificant linear trend.

,
Table VSOCIOECONOMIC CLASS LEVEL BLOCK GROUP MEANS FOR
33 DEPENDENT VARIABLES N=I1O
VARIABLE LOWER SEC ‘ LOWER MIDDLE SEC UPPER MIDDLE SEC UPPER SECDESCRIPTION N=29 N=26 N=25 N=30
CMHC (1) TOTUTIL
CMHC (2) SINGLECMHC (3) MARRIEDCMHC (4) OTHERCMHC (5) HS ED2CMHC (6) UNEMPLCMHC (7) ALCPROBCMHC (8) DRUGPROB
CVH (I) TOTUTIL‘ CVH (4) HS ED2
CVH (5) SINGLE
CVH (6) MARRIEDCVH (7) 0THER2CVH (8) FIRST ADCVH (9) RE AD2CVH (10) SEVERECVH (11) LESS SEVCVH (12) ADDICTIVE2YNHHER (1) TOTUTILYNHHER (2) SINGLEYNHHEi (3) MARRIED
YNHHER (4) OTHERYNHHER (5) UNEMPLYNHHER (6) HS ED2YNHHER (7) SEVEREYNHHER (8) LESS SEVYNHHER (9) ADDICTIVEDANA (1) TOTUTIL
29.7530.14
21.1631.8911.476.751.675.67
22.784.90
20.5714.6335.29
5.2517.53
5.391.55
14.71
25.7831.2534.9649.15
5.28
2.9511.13
4.936.922.45
21.4921.7018.46
26.269.834.531,313.63
16.824.63
17,44
11,9330,51
3.9912.83
3.810,78
11.5518.3123.4423.1935.51
3.252,776.804.015.131.67
16.05
15.3316.8119.46
8.483.090.731.64
10.894.03
10.68’4.19
23.342.228.671.880.408.14
13.2715.0716.1325.28
2.252.885.273.133.331.12
13.0814.0611.0514.19
9.33
2.640.301.33
10.685.30
9.233.24
32.29
1.758.93
2.380.487.49.19
10.547.34
19.331.681.743.851.942.341.09
ANALYSIS OF VARIANCE
F-TEST SIG. ETAI
10.4164.8795.003
6.0051.1607.7823.9409.943
2.1130,075
1.729
10.9700.1128.3871.3395,0415.9261.0559.6925.014
16.2853.3575.4492.014
10.0754.5544.9563.537
<.001 0.228.004 0.121.003 0.124
<.001 0.145.329 0.032
<.001 0,180
.011 0.100<.001 0.220
.103 0.056
>.500 0.002.166 0.047
<.001 0.237
>.500 0.003<.001 0.192
.266 0.037
.003 0.125<.001 0.144
.372 0.029<.001 0.215
.003 0.124<.001 0.315
.022 0.087
.002 0.134
.117 0.054<.001 0.222
,005 0.114.003 0.123.018 0,091

Table VSOCIOECONOMIC CLASS LEVEL BLOCK GROUP MEANS FOR
33 DEPENDENT VARIABLE N = 110
“VARIABLE LOWER SEC LOWER MIDDLE SEC UPPER MIDDLE SEC UPPER SECDESCRIPTION N=29 N=26 N=25 N=30
1~
E~~RG (1) TOTUTIL 21.80 15.18 13.41 7.76VITREC (1) SUICIDE2 0.18 0.34 0.25 0.32VITREC (2) HOMICIDE 0.40 0.12 0.19 0.11CIRCRT (1) TOTUTIL 7.80 5.39 5.12 1.66JUVCRT (1) TOTUTIL 105.20 59.50 55.35 15.87
i
‘t’’’”)=‘“”E2 Variables not exhibiting statistically sif!nificant linear trend.
.
;13.519 <.001 0.2770.422 >.500 0.0122,455 ,068 0.0658.533 <.001 0.1957.318 <.001 0.172

POPULATION-BASED MEASURES OF HOSPITAL ANDAMBULATORY CARE UTILIZATION FOR HEALTH PLANNING
Mrs. Ann Hamilton Walker, Research Associate, Rhode Island Health Services Research,Inc., Providence, Rhode Island
There are two general approaches to the mea-surement and analysis of data on health care utiliza-tion”. They include the program-based and popula-tion-based methods. With the first, a particular serv-ice program or institution is selected and character-istics of its users are studied. The second approachinvolves first defining the population, rather thanthe service, and then analyzing the utilization ofspecific types of health care services by that popula-tion. Both these approaches have different meritsand deficiencies and both tend to serve differentplanning needs.
The program-based data allow study of how aparticular service is being utilized. For example,composition of the patient caseload can be analyzedand occupancy rates can be determined. Patientlength of stay, disposition, source of referral, andother variables which provide information specificto the particular operation of that services programcan be studied. However, nothing can be said abouthow widely used that service is among the popula-tion in its catchment area or how the characteristicsof its patients compare to nonusers of the service.
Such questions can be resolved when popula-tion-based, rather than program-based data areused. In general there are two basic methods ofobtaining population-based data. The most -directmethod is by means of a health interview survey.From a survey several sociodemographlc variablescan be directly linked to individuals’ utilization pat-terns. Users of specific types of health services canbe compared to users of other types of health serv-ices during a specified time period. The proportionof the total population of risk that are users of dif-ferent types of services can be determined. Finally,characteristics of nonusers of any or all types ofhealth services can be identified.
However, while conceptually the survey methodis the best way to obtain population-based data,there are some drawbacks to the technique whichshould be noted. The first problem involves mea-surement error. For example, respondents may notremember or report accurately their utilization ex-perience. This problem can be minimized by well-tested questionnaires and highly trained interview-ers. Because a survey is based on a sample of thepopulation and does not include the universe, itsresults are also subject to sampling error. Thisproblem can be minimized by larger sample sizesand high response rates. Test of statistical signifi-
266
cance can also be used to determine if differences inresults could be due to chance alone,
A ti]rd problem however, is not so easy to re-solve. This involves the costliness and large amountof effort and expertise required to conduct a Klghqualhy survey in State or local areas, Regional in-formation from the National Health Interview Sur-vey conducted by the National Center for HealthStatistics (NCHS) is available, but generally speak-ing, data specific to most health planning areas donot exist.
Due to the lack of availability of survey dataand also due to specialized planning needs, anoth-er method of obtaining population-based estimatesof utilization of certain health services is often em-ployed. With this technique program data are relat-ed to data on the population that is assumed to beat risk. For example, when data from all providersof a particular type of health care service are availa-ble on a State or regionwide basis, the population atrisk is generally assumed to be the population resid-ing in that area. If residential information is direct-ly available from the patient records, then the exactcatchment area can be defined more precisely.Rates of utilization are then obtained by using thepatient data as the numerator and information onthe population of the area as the denominator.Rates derived in this manner, however, become in-creasingly difficult to obtain during intercensal yearswhen population estimates, rather than actualcounts, must be relied on. ~ls is particularly truewhen age, sex, or race specific rates are needed,Also, multiple use of a service by one individualusually cannot be ascertained from the patientrecords and thus the rates reflect incidence ofuse, rather than prevalence.
In this paper, I will discuss results of directlypopulation-based measures of utilization of hospitaland ambulatory care obtained from health interviewsurveys conducted by Rhode Island Health ServicesResearch, Inc. (known as SEARCH) in 1972 and1975. I will also provide more detailed informationon hospital utilization using the second population-based method. Rhode Island is fortunate in that allof the community hospitals in the State are on thesame discharge abstracting system, Thus we haveStatewide hospital utilization data which we can re-late to the total population.
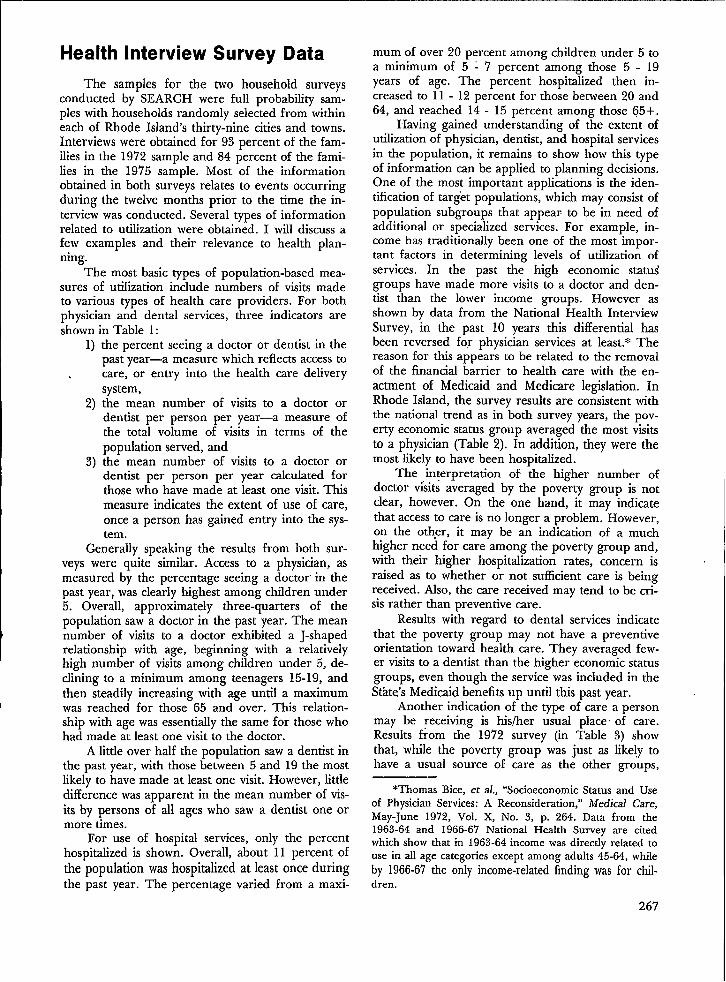
Health Interview Survey Data
The samples for the two household surveysconducted by SEARCH were full probability sam-ples with households randomly selected from withineach of Rhode Island’s thirty-nine cities and towns.Interviews were obtained for 93 percent of the fam-ilies in the 1972 sample and 84 percent of the fami-lies in the 19’75 sample. Most of the informationobtained in both surveys relates to events occurringduring the twelve months prior to the time the in-terview was conducted. Several types of informationrelated to utilization were obtained. I will discuss afew examples and their relevance to health plan-ning.
The most basic types of population-based mea-sures of utilization include numbers of visits madeto various types of health care providers. For bothphysician and dental services, three indicators areshown in Table 1:
1)
2)
3)
the percent seeing a doctor or dentist in thepast year—a measure which reflects access tocare, or entry into the health care deliverysystem,the mean number of visits to a doctor ordentist per person per year—a measure ofthe total volume of visits in terms of thepopulation served, andthe mean number of visits to a doctor ordentist per person per year calculated forthose who have made at least one visit. Thismeasure indicates the extent of use of care,once a person has gained entry into the sys-tem.
Generally speaking the results from both sur-veys were quite similar. Access to a physician, asmeasured by the percentage seeing a doctor in thepast year, was clearly highest among children under5. Overall, approximately three-quarters of thepopulation saw a doctor in the past year. The meannumber of visits to a doctor exhibited a J-shapedrelationship with age, beginning with a relativelyhigh number of visits among children under 5, de-clining to a minimum among teenagers 15-19, andthen steadily increasing with age until a maximumwas reached for those 65 and over. This relation-ship with age was essentially the same for those whohad made at least one visit to the doctor.
A little over half the population saw a dentist inthe past year, with those between 5 and 19 the mostlikely to have made at least one visit. However, littledifference was apparent in the mean number of vis-its by persons of all ages who saw a dentist one ormore times.
For use of hospital services, only the percenthospitalized is shown. Overall, about 11 percent ofthe population was hospitalized at least once duringthe past year. The percentage varied from a maxi-
mum of over 20 percent among children under 5 toa minimum of 5 ~ 7 percent among those 5 - 19years of age. The percent hospitalized then in-creased to 11 - 12 percent for those between 20 and64, and reached 14- 15 percent among those 65+.
Having gained understanding of the extent ofutilization of physician, dentist, and hospital servicesin the population, it remains to show how this typeof information can be applied to planning decisions.One of the most important applications is the iden-tification of target populations, which may consist ofpopulation subgroups that appear to be in need ofadditional or specialized services. For example, in-come has traditionally been one of the most impor-tant factors in determining levels of utilization ofservices. In the past the high economic statu~groups have made more visits to a doctor and den-tist than the lower income groups. However asshown by data from the National Health InterviewSurvey, in the past 10 years this differential hasbeen reversed for physician services at least.* Thereason for this appears to be related to the removalof the financial barrier to health care with the en-actment of Medicaid and Medicare legislation. InRhode Island, the survey results are consistent withthe national trend as in both survey years, the pov-erty economic status group averaged the most visitsto a physician (Table 2), In addition, they were themost likely to have been hospitalized.
The in~erpretation of the higher number ofdoctor visits averaged by the poverty group is notclear, however. On the one hand, it may indicatethat access to care is no longer a problem. However,on the other, it may be an indication of a muchhigher need for care among the poverty group and,with their higher hospitalization rates, concern israised as to whether or not sufficient care is beingreceived. Also, the care received may tend to be cri-sis rather than preventive care.
Results with regard to dental services indicatethat the poverty group may not have a preventiveorientation toward health care. They averaged few-er visits to a dentist than the higher economic statusgroups, even though the service was included in theStkte’s Medicaid benefits up until this past year.
Another indication of the type of care a personmay be receiving is his/her usual place. of care.Results from the 1972 survey (in Table 3) showthat, while the poverty group was just as likely tohave a usual source of care as the other groups,
—*Thomas Bite, et al., “Socioeconomic Status and Use
of Physician Services: A Reconsideration,” Medical Care,May-June 1972, Vol. X, No. 3, p. 264. Data from the1963-64 and 1966-67 National Health Survey are citedwhich show that in 1963-64 income was directly related touse in all age categories except among adults 45-64, while
by 1966-67 the only income-related finding was for chil-dren.
267
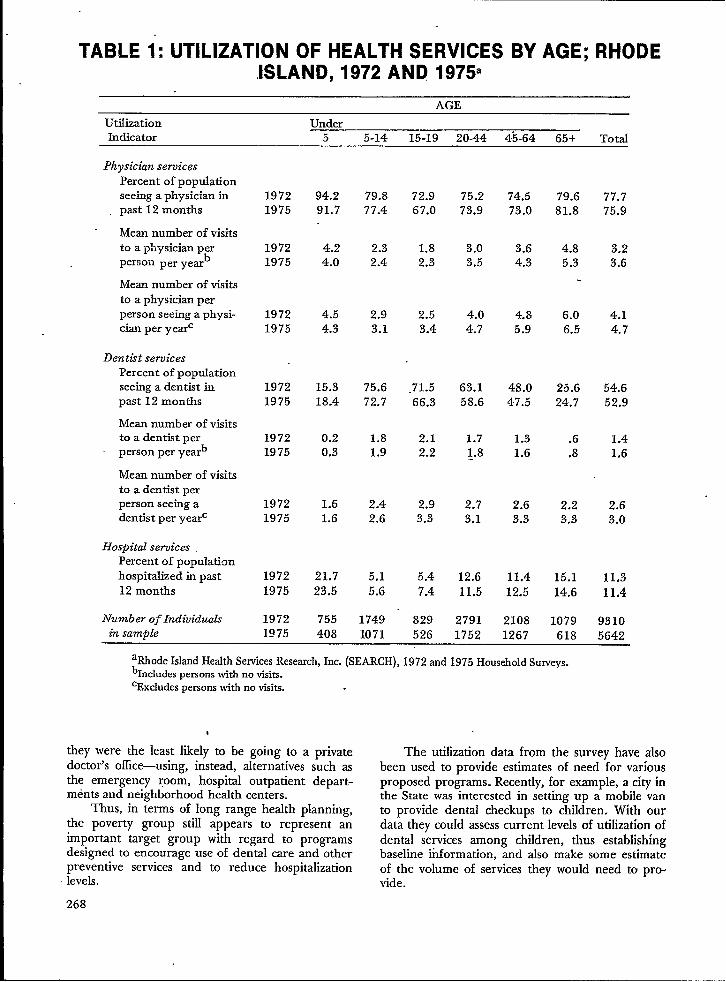
TABLE 1: UTILIZATION OF HEALTH SERVICES BY AGE; RHODEISLAND, 1972 AND 1975
AGE
Utilization Under ~Indicator 5 5-14 15-19 20-44 4’5-64 65+ Total
Phys[cian servicesPercent of pops.dationseeing a physician inpast 12 months
Mean number of visitsto a physician perperson per yeah
Mean number of visitsto a physician perperson seeing a physi-cian per yearc
Dentht servicesPercent of poptiationseeing a dentist inpast 12 months
Mean number of visitsto a dentist per
- person per yearb
Mean number of visitsto a dentist perperson seeing adentist per year=
Hospital servicesPercent of populationhospitalized in past12 months
Number of Individualsin samole
19721975
19721975
19721975
19721975
19721975
19721975
19721975
19721975
94.291.7
4.24.0
4.54.3
15.318.4
0.20.3
1.61.6
21.723.5
755408
79.8 72.977.4 67.0
2.3 1.82.4 2.3
2.9 2.53.1 3.4
75.6 .71.572.7 66.3
1.8 2.11.9 2.2
2.4 2.92.6 3.3
5.1 5.45.6 7.4
1749 8291071 526
75.273.9
3.03.5
4.04.7
63.158.6
1.71.8
2.73.1
12.611.5
27911752
74.573.0
3.64.3
4.85.9
48.047.5
1.31.6
2.63.3
11.412.5
21081267
79.681.8
4.85.3
6.06.5
25.624.7
.6
.8
2.23.3
15.114.6
1079618
a~ode Islmd HealthservicesResearch,Inc. (SEARCH), 1972 and 1975 HouseholdSu~eYs.b~c]udes persons with no visits.‘Excludes personswith no visits.
t
they were the least likely to be going to a privatedoctor’s office-using, instead, alternatives such asthe emergency room, hospital outpatient depart-ments and neighborhood health centers.
Thus, in terms of long range health planning,the poverty group still appears to represent animportant target group with regard to programsdesigned to encourage use of dental care and otherpreventive services and to reduce hospitalizationlevels.
77.775.9
3.23.6
4.14,7
54.652.9
1.41.6
2.63.0
11.311.4
93105642
The utilization data from the survey have alsobeen used to provide estimates of need ‘for variousproposed programs. Recently, for example, a city inthe State was interested in setting up a mobile vanto provide dental checkups to children. With ourda~athev couId assesscur;ent levels of utilization ofdental s’ervices among children. thus establishingbaseline information, ;nd also make some estimat;of the volume of services they would need to pro-vide.
268
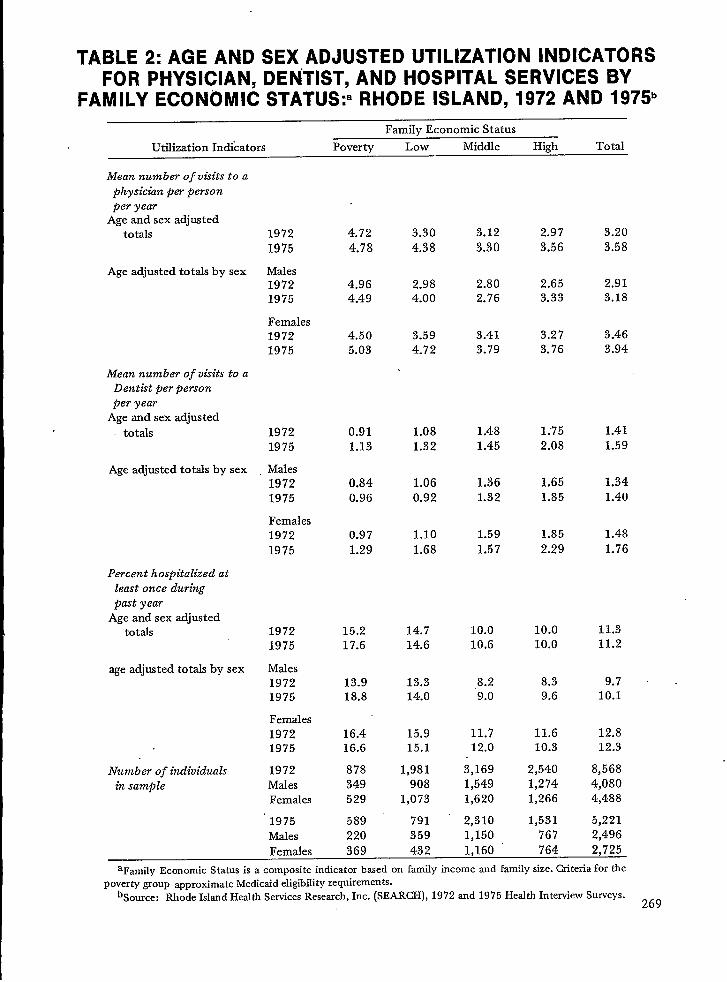
TABLE 2: AGE AND SEX ADJUSTED UTILIZATION INDICATORSFOR PHYSICIAN, DENTIST, AND HOSPITAL SERVICES BY
FAMILY ECON~MIC STATUS:a RHODE ISLAND, 1972 AND 1975’
Family Economic Status
Utilization Indicators Poverty Low Middle High Total
Mean number of visits to aphysickn per personper year
Age and sex adjustedtotals
Age adjusted totals by sex
Mean number of visits to aDentkt per personper year
Age and sex adjustedtotals
Age adjusted totals by sex
Percent hospitalized atleast once duringpast year
Age and sex adjustedtotals
age adjusted totals by sex
Number of individualsin sample
19721975
Males19721975
Females19721975
19721975
Males19721975
Females19721975
19721975
Males19721975
Females19721975
1972MalesFemales
1975MalesFemales
4.724.78
4.964.49
4.505.03
0.911.13
0.840.96
0.971.29
15.217.6
13.918.8
16.416.6
878349529
589220
3.304.38
2.984.00
3.594.72
1.081.32
1.060.92
1.101.68
14.714.6
13.314.0
15.915.1
1,981908
1,073
791359432
3.123.30
2.802.76
3.413.79
1.481.45
1.361.32
1.591.57
10.010.6
.8.29.0
11.712.0
3,1691,5491,620
2,3101,150
2.973.56
2.653.33
3.273.76
1;752.08
1.651.85
1.852.29
10.010.0
8.39.6
11.610.3
2,5401,2741,266
1,531767
3.203.58
2.913.18
3.463.94
1.411.59
1.341.40
1.481.76
11.311.2
9.7 ,10.1
12.812.3
8,5684,0804,488
5,2212,496
369 1,160 764 2,725
aFamily Economic Status is a composite indicator bfied on family income and family size. Criteria for thepoverty group approximate Medicaid eligibility requirements.
bSource: Rhode Island Health Services Research, Inc. (SEARCH), 1972 and 1975 Health Interview Surveys.269

Table 3: PERCENTAGE DISTRIBUTION OF SOCIODEMOGRAPHICCHARACTERISTICS BY USUAL PLACE OF CARE:
RHODE ISLAND. 1972Usual Place of Care
Dr’s Hosp Hosp Total
Characteristic None Off.a ER OPD Otherb NHC % (N)
Sex
MaleFemale
Ageo-56-17
18-3435-4445-6465+
RaceWhiteNonwhite
FEs(age-adjusted)PovertyLowMiddleHigh
9.86.2
.63.213.49.210.28.2
7.97.1
7.07.88.46.6
TOTAL 7.9
84,3
87.9
91.790.7
79.885.685.686.7
87.351.8
74.183.388.690.0
86.2
1.6.8
1.31.21.81.2
.5.6
.98.9
2.91.6
.81.0
1.2
2.02.3
2.12.71.92.31.91.6
1.813.9
5.93.31.21.0
2.1
1.2 1.11.1 1.6
.6 3.8
.2 1.9
2.2 1.0.8 1.0
1.1 .72.1 .8
1.1 .92.1 16.1
2.0 8.11.5 2.4.5 .5
1.4 –
1.1 1.4
100.0100.0
100.0100.0100.0100.0100.0100.0
100.0100.0
100.0100.0100.0100.0
100.0
(4236)(4741)
( 871)
(2041)(1999)(2072)( 912)(1071)
(8664)( 280)
( 863)~;:;:;
(2443)
(8978)
aIncludes groups ofpnvate doctors.bIncludes users of other CIWICSand bedridden persons. S& N/A=l; Age N/A=12; Race N/A=34; FES N/A=729;
Usual Place N/A–+4; Military=361.
Figure 1 shows an application of the 1972 sur-vey data that was made for Blue Cross/Blue Shieldof Rhode Island. They were interested in assessingexisting arnbtiatory service areas for possible devel-opment of Health Maintenance Organizations(HMO’s) in the State. Since we had obtained namesof regular physicians, we could use the physician’slicense number to link the survey data to the pri-mary place of practice of the physician from ourphysician manpower file. Thus we could comparewhere people lived with where their re@ar physi-.cian’s office was located. We are planning to do thiswith our 19i’5 data also.
Still another type of utilization data obtainedfrom our 19’75 survey is shown in Table 4. In aneffort to obtain some indication of how residentsviewed the care they had received from doctorsover the past few years, we asked questions on satis-faction or dissatisfaction with various aspects of careincluding:
A. Quality of careB. Availability of care from private physicians
on nights or weekends270
.
C. Amounts charged for careD. Information given about what was wrongE. Time the doctor spent at an appointmentF. Waiting time in doctor’s ofices
In general, younger families (i.e., with heads ofhousehold under 45 years of age) were more likelyto express dissatisfaction on all these issues thanwere families with older heads of household.
Overall, the highest levels of dissatisfactionwere expressed on those issues relating to accessiKll-ity of care. Over a third of the families were dissat-isfied with waiting time in doctor’s offices; 25 per-cent expressed dissatisfaction with the amountscharged for care; and 22 percent were dissatisfiedwith the availability of a private physician on nightsor weekends.
In contrast, very little dissatisfaction was ex-pressed with the three aspects of care which relatedmost strongly to confidence in physicians’ abilitiesand practice of medicine. Only seven percent ex-pressed any dissatisfaction with the quality of carereceived, while 13 and 14 percent respectively were

-.. --..” -------. . . . . . . . . .
271

TABLE 4: PERCENTAGE OF FAMILIES IN WHICH RESPONDENTEXPRESSED DISSATISFACTION WITH SELECTED ASPECTS OF
MEDICAL CARE RECEIVED, BY AGE OF HOUSEHOLD HEAD:RHODE ISLAND, 1975.
Percent Dissatisfied
Aspects of Age of Household Head
Medical Care Under 45 45-64 65+ Total
A.
B.
c.D.
E.
F.
Quality of care 8.6% 6.0% 6.7% 7.3%
Availability of care from private 25.6 23.0 13.7 22.2physicians on nights or weekends
Amounts charged for care 27.1 23.8 16.9 23.9
Information given about what was 16.7 10.7 9.7 13.0wrong
Time doctor spent with patient at 16.9 11.8 - 10.7 13.7an appointment
Waiting time in doctor’s office 37.2 35.6 22.9 33.7
Number of families 807 728 402 1937
aRhode IslandHealthServicesResearch, Inc. (SEARCH), 1975 HouseholdSurvey.
dissatisfied with the information given on what waswrong and the time the doctor spent with them atan appointment.
These results have several implications forplanning. First of all, the relatively high levels ofdissatisfaction expressed regarding amountscharged for care and availability of care on nightsor weekends may indicate that there exists a sub-stantial number of persons who might be interestedin alternative forms of care delivery such as theHMO. The problem of waiting time in doctor’soffices may be a univei-sal one that is symptomaticof the way doctors schedule appointments.However, an investigation should be made of theavailability of physicians providing primary care indifferent areas of the State.
Hospital Discharge Data
Despite the flexibfity of the survey methodolo-gy and its applicabtity to the total population, itdoes not provide detailed and standardized infor-mation on the fllnical reasons why care was needed.The National Ambulatory Care Medical Survey(NAMCS) is the best way to obtain tils type of in-formation for care provided in physicians’ offices.For hospital ufllzation the hospital discharge recordis the best source of this type of information.
272
In Rhode Island, all of the community hospitals(meaning acute care, nonfederal) are on the Profes-sional Activity Study (PAS) discharge abstractingsystem. SEARCH currently has available tapes ofthe discharge data from 1968 through the first sixmonths of 1975. Hospitalization rates can be de-rived by applying the total number of discharges toan estimate of the population.
Table 5 shows the percent change in the rateand number of discharges for selected diagnosticcategories between 1970 and 1974. Excluding ob-stetric related conditions, the rate of discharges per10,000 population increased by 10.5 percent overthe five year period. The actual number of dis-charges increased by 12.4 percent. The rate of in-crease varied considerably among the diagnosticgroups. Higher than average increases were indicat-ed for malignant neoplasms (17.2 percent), diseasesof the circulatory system (22.2 percent particularlycerebrovascular disease which increased by 30.1percent), and diseases of the musculoskeletal systemand connective tissue (17.7 percent). Since theseconditions are particularly related to old age, theirlarger than average rate increases are related, in
part, to the increasing proportion of persons 65and over in the Rhode Island population. Accord-ing to population estimates, the 65 and over popu-lation increased by 14 percent between 1970 and1975, compared to a less than 2 percentage pointincrease in the total civilian population.
,
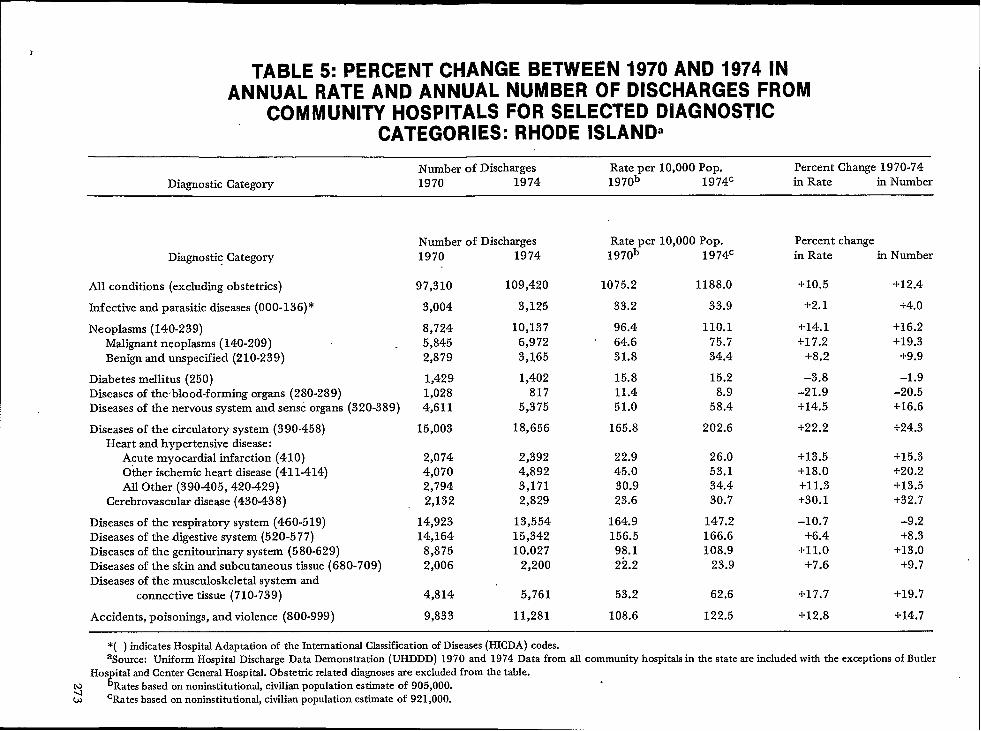
}
TABLE 5: PERCENT CHANGE BETWEEN 1970 AND 1974 INANNUAL RATE AND ANNUAL NUMBER OF DISCHARGES FROM
COMMUNITY HOSPITALS FOR SELECTED DIAGNOSTICCATEGORIES: RHODE ISLAND’
Number of Discharges Rate per 10,000 Pop. Percent Change 1970-74Diagnostic Category 1970 1974 1970b 1974C in Rate in Number
Number of Discharges Rate per 10,000 Pop.1970 1974 1970b 1974C
Percent changein Rate in NumberDiagnostic Category
97,310 109,420 1075.2 1188.0 +10.5 +12.4Ml conditions (excluding obstetrics)
+2. 1 +4.0Infective and parasitic diseases (000-136)* 3,004 3,125 33.2 33.9
Neoplasms (140-239)Malignant neoplasms (140-209)Benign and unspecified (210-239)
8,7245,8452,879
10,137 96.46,972 64.63,165 31.8
110.175.734.4
+14.1 +16.2+17.2 +19.3
+8.2 +9.9
Diabetes mellitus (250)Diseases of theblood-forming organs (280-289)Diseases of the nervous system and sense organs (320-389)
1,4291,0284,611
1,402 15.8817 11.4
5,375 51.0
15.28.9
58.4
–3.8 -1.9-21.9 -20.5+14.5 +16.6
Diseases of the circtiatory system (390-458)Heart and hypertensive disease:
Acute myocardial infarction (410)Other ischemic heart disease (411-414)All Other (390-405, 420-429)
Cerebrovascular disease (430-438)
18,656 165.8 202.6 +22.2 +24.315,003
2,0744,0702,7942,132
2,3924,8923,1712,829
22.945.030.923.6
26.053.134.430.7
+13.5+18.0+1 1.3+30.1
-10.7+6,4
+11.0+7.6
+15.3+20.2+13.5+32.7
Diseases of the respiratory system (460-519)Diseases of the digestive system (520-577)Diseases of the genitourinary system (580-629)Diseases of the skin and subcutaneous tissue (680-709)Diseases of the musculoskeletal system and
connective tissue (710-739)
14,92314,164
8,8752,006
13,55415,34210.027
2,200
164.9156.598.122.2
147.2166.6108.9
23.9
-9.2+8.3
+13.0+9.7
4,814 5,761 53.2 62.6
9,833 11,281 108.6 122.5
+17.7 +19.7
+12.8 +14.7Accidents, poisonings, and violence (800-999)
*( ) indicatesHospitalAdaptation of the InternationalClassificationof Diseases(HICDA) codes.aSource: Uniform HospitalDischargeData Demonstration(UHDDD) 1970 and 1974 Data from all community hospitalsin tie stateareincludedwith the exceptionsof Butler
Hos ital andCenterGeneralHospital.Obstetricrelateddiagnosesare excludedfrom the table.t Ratesbased on noninstitutional,civilianpopulation estimateof 905,000. .
sw cRates based on noninstitutional, civilian population estimate of 921,000.

Three diagnostic categories experienced a de-dlne in their discharge rates. The most notable wasdiseases of the blood-forming organs (such as ane-mia) which dropped by nearly 22 percent. This de-cline, as well as the smaller one shown for diabetesmellitus (-3.8 percent), can largely be attributed tochanges in reporting procedures on tie dischargeabstract. These conditions are now more likely to bereported as secondary diagnoses rather than pri-mary diagnoses, which are shown in the table.Diseases of the respiratory ~ystem was the third cat-egory to show a decline (-10.7 percent). Th& rea-son for this is related largely to a drop in thenumber of T+A’s being performed in the State.
This type of information can provide plannerswith the ability to predict future demand on hospi-tal services and also to predict levels of increase in
, certain types of diagnostic categories. In addition,effects of changes in medical practice, such as thedecline in elective procedures such as T+A’s as wellas increases in specialized testing procedures, can bemonitored.
The data can also be related to populationsubgroups. Table 6 shows 1973 discharge rates andaverage length of stay for leading diagnostic catego-ries by age group. Similar rates and lengths of stayare shown for the U.S. to provide comparison. TheRhode Island discharge rates are lower than theU.S. for all age groups over 14. Part, but not all, ofthis difference is due to exclusion of patients fromone State-operated and one private hospital in theState.
Clearly, discharge rates increase with age andare highest for those 65 years and over, with diseas-es of the circulatory system accounting for nearly athird of the discharges in this oldest age group. Itmight be recalled that the data from the householdsurvey showed the rate for the 45-64 year olds (12percent vs 15 percent). Part of the explanation forthis is fiat institutionalized persons are not includedin the household survey sample. Thus hospitaliza-tions of persons from nursing homes or other insti-tutions would not be recorded. Also the dischargedata show the total number of hospitalizations dur-ing the year, with repeat hospitalization for the sameperson being counted as separate episodes; whereasthe survey information indicates the percent whohad been hospitalized one or more times. Since el-derly persons would be more likely than youngerpersons to require multiple hospitalization over theyear’s period, their discharge rate would be higherthan tie survey percentage for this reason alone.
For planning purposes it should be emphasizedthat the discharge data are measuring incidence oftreatment for various conditions, rather than inci-dence of illness. For instance, it is clear that RhodeIsland has higher discharge rates than the U.S. foracute myocardial infarctions among the 45-64 and
274 “
65 and over age groups. This type of illness is sus-ceptible to reduction tirough health education pro-grams designed to acquaint residents with symp-toms of heart disease, awareness of high blood pres-sure, need to control weight and the importance ofexercise- In Rhode Island a telemetry ambulancesystem has also been implemented to salvage thesmall percentage of heart attack victims who mighthave otherwise died en route to the hospital.However, it should be recognized that an immedi-ate result of special attention paid to one particulartype of disease is likely to be an increase in utiliza-tion of health services for that condition. In short,planners looking to evaluate the success of certaintargeted programs, may find a short-term increasein the very disease they sought to reduce, due tothe new awareness provided by their programs.
In Table 7, the hospital discharge data havebeen related to socioeconomic status (SES), The dis-charge abstract contains no individual SES indica-tor, other than mode of payment, but census tractof residence is included. Rhode Island is fortunatein that all of the State is census tracted. Using fac-tor analysis scores of Rhode Island census tractsbased on several sociodemographic variables,SEARCH has grouped the State’s tracts into fourmain SES groups. This ecological designation ofSES can be used with all of our data sets which donot contain individual information of this type, Asfound with the survey data, the poverty group hadthe highest discharge rate, Discharges for somediagnoses, however, showed relatively Iitde variationacross socioeconomic status groups. For instance,rates for benign neoplasms, diseases of the blood-forming organs, and acute myocradial infarctionsvaried by less than five per 10,000. On the otherhand, the poverty group’s rates for infective andparasitic diseases, diabetes mellitus, other ischemicheart disease, and diseases of the respiratory systemwere almost twice as high as rates in the high so-cioeconomic status group. These findings indicatethat the poverty group may benefit partidarlyfrom screening programs to detect such latent dis-eases as diabetes and high blood pressure.
Summary and Implications
To sum up, population-based utilization dataare critically important for health planning because@ey provide the planner with a wide rangingperspective on the use of different types of healthservices by the population as a whole. In addition,when differentials in use by population subgroupscan be assessed, target populations can be identifiedfor specialized programs. The planner also has ameans of assessing changes in utilization over timeand, when placed in the perspective of other typesof knowledge about the health care system and
,

TABLE 6:
ANNUAL RATE OF DISCHARGE FROM COMMUNITYHOSPITALS PER 10,000 POPULATION AND AVERAGE LENGTHOF STAY FOR FIVE LEADING DIAGNOSTIC CATEGORIES BY
AGE: RHODE ISLAND AND UNITED STATES, 1973.
Rhode Islanda United StatesbDiagnostic Discharge Average Discharge Average
Categories and Age Rate LOS (Days) Rate LOS (Days)
Under 15 years
All conditions (excl. OB)Diseases of respiratory system
Accidents, poisoning, violence
Infective and parasitic diseaseDiseases of the digestive system
Diseases of the nervous system and sense organs
15-44 years
All conditions (excl. OB)
Diseases of the genitourinary systemDiseases of the digestive system
Accidents, poisonings, violence
Diseases of the respiratory systemDiseases of the musculoskeletal system and
connective tissue
45-64 years
All conditions (excl. OB)
Diseases of the circtiatory system
(Acute myocardial infarction)
Diseases of the digestive system
Diseases of the genitourinary system
Malignant neoplasms
- Diseases of the musculoskeletal system and
connective tissue
65 years and over
All conditions (excl. OB)
Diseases of the circulatory system
(Acute myocardial infarction)
(Other ischemic heart disease) “
(Al other heart and hypertensive disease)
(Cerebrovasctiar disease)
Diseases of the digestive systemMalignant neoplasms
Accidents, poisonings, and violence
Diseases of the respiratory system
737.5312.3
84.7
65.161.3
45.7
870.3
145.0
126.7
120.4
73.861.9
1,455.2
306.5
(55.6)
233.8
171.2
130.1
104.4
2,652.2
871.7
(111.4)
(254.9)(191.2)
(176.0)
311.6
299.2
201.2185.7
4.63.0
5.8
5.53.9
4.2
6.7
5.0
7.1
7.7
4.69.6
703.9256.0100.051.869.5
51.7
1,092.7
188.8160.3179.8
92.867.6
10.4 1,820.412.9 340.8
(18.2) (34.4)9.8 301.36.4 225.1
15.0 126.111.5 134.7
13.8 ‘ 3,418.414.8 1,022,2
(17.3) (87.1)(13.2) (369.0)(13.5) (197.3)(16.4) (213.8)13.3 457.216.3 315.616.7 291.9,13.2 308.8
4.63.65.14.74.23.9
6.55.26.46.54.87.9
9.110.7
(16.0)8.66.3
13.29.8
12.112,8
(15.3)(12.3)(11.0)(13.8)10.715.414.110.9
aSource: Uniform Hospital Discharge Data Demonstration (UHDDD), 1973. Gta from all community hospitals in the Stateare included, \vith tie exception of Butler Hospiti and Center General Hospital. Obstetric related diagnoses are excluded fromthe table.
bSource: National Center for Health Statistics, “Utilization of Short-Stay Hospitals, by Diagnosis: United States, 1973,”Monthly Vitil StatisticsReport, (HRA) 75-1120, Vol. 24, No. 3, Supplement (2), June 10, 1975.
., 275

TABLE 7: ANNUAL RATE OF DISCHARGE FROM COMMUNITYHOSPITALS PER 10,000 POPULATION BY SOCIOECONOMIC
STATUSa FOR SELECTED DIAGNOSTIC CATEGORIES: RHODEISLAND 1973’.
Socioeconomic Status GroupaAll
Diagnostic Category ‘ discharges= High Midclle Low Poverty
All conditions (excluding obstetrics) 1,173.4 963.7 1,035.9
Infective and parasitic diseases (000-136)* 34.4 26.7 27.0
Neoplasms (140-239) 113.9 103.3 99.4Malignant neoplasms (140-209) 72.7 63.8 62.9Benign and unspecified (210-239) 41,1 39.6 36.5
Diabetes mellitus (250) 15.4 10.3 13.9Diseases of the blood-forming organs (280-289) 11.8 8.6 10.4Diseases of the nervous system and sense
organs (320-389) 56.8 49.3 48.1
Diseases of the circtiatory system (390-458) 191.2 152.5 “ 172.9Heart and hypertensive disease:
Acute myocardial infarction (410) 26..9 23,6 25.4Other ischemic heart disease (411414) 51.1 37.1 44.7All other (390-405, 420429) 39.6 33.6 35.6
Cerebrovasctir disease (430438) 27.8 21.3 25.3
Diseases of the respiratory system (460-519) 148.8 111.3 127.8Diseases of the digestive system (520-577) 155.3 128.2 142.3Diseases of the genitourinary system (580-629) 122.3 104.5 113.1Diseases of the skin and subcutaneous
tissue (680-709) 23.9 19.1 20.7Diseases of tie muscr.doskeletal system and
connective tissue (710-739) 61.6 51;4 54.9
Accidents, poisonings, and violence (800-999) 113.7 91.0 97.0
1,173.4
38.0
112.074.437.6
16.513.5
58.0
197.7
25.955.140.628.5
158.7150.0115.2
24.6
60.5
105.5
1,426.6
49.6
129.484.444,9
23.913.5
65.3
223.8
26.564.847.735.9
203.9183.0130.8
33.5
67.3
151.6
*( ) indicatesHospitalAdaptation of tke InternationalClassificationof Diseases (HICDA) codes.aThe socioeconomic status groups were derived from a factor analysis of all census tracts in Rhode Island.bSource: Uniform Hospital Discharge Data Demonstration (UHDDD), 1973. Data from all community hospitsds in the State
are included with the exceptions of Butler Hospital and Center General Hospital. Obstetric related diagnoses are excluded fromthe table.
‘All discharges include nonresidents and residents with unknown census tracts.
characteristics of the population, these changes canbegin to be explained.
The two methods of obtaining populationbased data which have been discussed both servedifferent needs and purposes. The household sur-vey, while requiring an initial investment of timeand money, provides data not obtainable by anyother method. It provides data on use of multipletypes of services for the noninstitutional populationand enables the planner to link patterns of ufllza-tion to a variety of individual characteristics.SEARCH has found its investment in the survey tobe extremely worthwhde, because in addition to the
276
u~;zation information discussed in this paper, dataon health conditions and disabdity (as well as sever-al other variables) were also obtained, The ability torelate these characteristics to utilization behavior iscritical to gaining an understanding of the relation-ship between need for care and use of health serv-ices.
The second method of obtaining populationbased estimates involved the relationship of pro-gram data, in this case hospital discharge data, to adefinable population at risk. Although problemsrelated to population estimation must be dealt with,this method enables detailed utilization data from a

. particular type” health service to be analyzed. It has tion, and, when regularly collected over time, ittheadvantage over the survey method of using clin- provides a means of closely monitoring changes inical rather man self-reported utilization informa- medical practice.
277

IMPLICATIONS OF THE NINTH REVISION OF THE INTERNA- ●
TIONAL CLASSIFICATION OF DISEASES (lCD) FOR MORTALIWCODING
Miss Alice Hetzel, Deputy Director, Divi>ion of Vital Statistics, National Center for HealthStatistics, Rockville, Maryland
The Ninth Revision of the International Classi-fication of Diseases (ICD) is the most extensive ofany since the Sixth Revision. In general, the changesincorporated in the Ninti Revision are directedtoward providing a detailed classification that ismore suitable for medical care purposes than pre-vious revisions. Much of this added detail is notavailable from the death certificates and conse- (3)quently will not be used for mortJlty classification.In tils brief summary of the major changes institut-ed by the Ninth Revision, emphasis is on those thataffect mortality classification. My comments arebased on material presented in the Report of theInternational Conference for the Ninth Revision ofthe International Classification of Diseases held inGeneva, September 30- October 6, 1975, and in-clude excerpts from analytic material prepared byMrs. Alice Dolman, a senior nosologist on the staffof the Associate Director for Data Systems in theNational Center for Health Statistics (NCHS).
Chapter Title
The general arrangement of the Ninth Revi-sion is much the same as that of the Eighth Revi- (4)
sion. There are still 17 chapters, an external causesof injury and poisoning code, still referred to as the“E Code”, and, though revised, there is still a sup-plementary classification of other reasons for contactwith the health care system, referrred to as the YCode in the Eighth Revision and as the V Code inthe Ninth.
Changes have been made in the titles of 5 ofthe 17 chapters: (5)
(1)
(2)
278
Chapter I. The title was changed from “In-fective and Parasitic Diseases” to “Infectiousand Parasitic Diseases.”
There seems to be little significance to thischange other than consideration of theappropriateness of the terms.
Chapter III. “Endocrine, Nutritional andMetabolic Diseases” in the Eighth, becomes“Endocrine, Nutritional and Metabolic Dis-eases and Immunity Disorders” in theNinth. .
This change in title reflects the addition ofa category for disorders involving the im-mune mechanism, formerly scatteredthrough the classification, primarily in thechapter on Diseases of the Blood and BloodForming Organs.
Chapter XV. “Certain Causes of PerinatalMorbidity and Mortality” becomes “CertainConditions Originating in the Perinatal Per-iod” in the Ninth.
This change is to emphasize the inclusionof conditions that have their origin in theperinatal period even though death ormorbidity occurs later. New categories havebeen established for certain conditions spe-cific to the perinatal period, e.g., infections,which in the Eighth Revision were classifiedoutside the perinatd chapter. As a result,there will probably be some increase in thenumber of deaths classified to this chapterunder the Ninth Revision.
Chapter XVI. “Symptoms and Ill-DefinedConditions” becomes “Symptoms, Signs andIll-Defined Conditions”
The insertion of the word “signs” is in ref-erence to inclusion of a new and ratherextensive section on abnormal findings ofexaminations and tests, a section that doesnot pertain to mortality coding,
Chapter XVII. “Accidents, Poisonings, andViolence (Nature of Injury)” becomes “In-jury and Poisoning” and E XVII “Acci-dents, Poisonings, and Violence (ExternalCause)” becomes “Supplementary Classifica-tion of External Causes of Injury and Poi-soning (E Code).”
This change was made because in the NinthRevision, Chapter XVII is restricted to “na-ture of injury.” Consequently, the word“Accident” is no longer appropriate in thetitle. The code for external causes of injuryand poisoning (E Code) is now a supple-mentary classification.
In other words, the role of the E Code forexternal causes has changed. In the Sixth,Seventh and Eighth Revisions, ChapterXVII consisted of two alternative classifica-tions, one according to the nature of theinjury (the N Code) and one according toexternal cause (the E Code). The E Codewas not used in connection with codes fromany part of the classification except ChapterXVII. In the Ninth Revision the N prefixhas been dropped and the nature of injurybecomes the main classification. The ECode is a supplementary classification andmay be used, where relevant, in conjunc-tion with codes from any part of the classi-fication.
For mortality statistics, we will continue touse an E Code for the underlying cause ofdeath for conditions classifiable to ChapterXVII “Injury and Poisoning” but when acode from Chapters I through XVI is ap-plicable, it, rather than the E Code, will beused for the underlying cause of death.
Specialist Codes and OptionalFifth Digits
Three adaptations of the ICD have been de-signed for the use of specialists: an adaptation for (1)oncology (ICD-0), indicating topography, morphol-ogy and behaviour of tumors, (2) dentistry andstomatology, and (3) ophthalmology. Each of thesecontains condhions of interest to the specialist, se-Jected from aIi chapters of the ICD, and providesadditional detail by means of a fifth digit. They willnot be applicable to our mortality coding.
The Ninth Revision provides for optional fifthdigits in certain places: for example, for the modeof diagnosis in tuberculosis, for method of delivery(Chapter XI), for anatomical site in musculoskeletaldisorders, and for place of occurrence of accidentin the E Code. For our mortality classification, it islikely that we will use fifth digits only with the ECodes for place of occurrence of the accident.
An independent 4-digit coding system is pro-vided to classify histological varieties of neoplasm,prefixed by the letter M (for morphology) and fol-lowed by a fifth digit indicating behaviour. Thiscode is for optional use in addition to the normalcode indicating topography. It will not be used formortality classification, as information from thedeath certificates would not support the classifica-tion system.
Dual ClassificationThe Ninth Revision includes a dual classifica-
tion of certain diagnostic statements. In these in-
stances, the traditional etiology codes, marked witha dagger (~), are considered primary, to be used forunderlying cause of death. ,The new codes, posi-tioned in the classification according to manifesta-tion are marked with an asterisk (*) and are second-ary, for use in applications concerned with the plan-ning and evaluation of medical care. This dual sys-tem applies only to diagnostic statements that con-tain information about both etiology and manifesta-tion and when the latter is important in its ownright and warrants an additional code. Those ofyou who have used it know that under the EighthRevision specificity of the manifestation was fre-quently lost.
The asterisk codes provided by this dual systemof classification probably will be used selectively byNCHS in multiple condition coding to provide ad-ditional information. They appear frequently in thechapters for diseases of the nervous system, genito-urinary and musculoskeletal systems, and somewhatless frequently in other chapters. In many instancesthe dual classification applies to diagnostic state-ments which for classification purposes are regard-ed as single disease entities in the Eighth Revision,e.g., viral hepatitis, tuberculous pyelitis, syphiliticaneurysm of aorta, polio-encephalitis, etc. It alsoapplies to a number of combinations of conditionswhich are, according to the Eighth Revision and/orthe coding procedures currently in use in NCHS,regarded as multiple causes, e.g., esophageal varicesdue to cirrhosis of liver, arthritis associated withinfections, nephritis due to diabetes. It is obvious,therefore, that the decision made with respect tousing the dual classification will have a decided ef-fect upon multiple cause statistics.
Additional Codes
Similarly, for a number of categories scatteredthroughout the classification, notes have been add-ed which indicate that the use of additional codesfor conditions classifiable to these categories areoptional. These, too, are likely to be used selectivelyfor multiple cause statistics.
Modification Rule 12
The most far-reaching and perhaps the mostcontroversial change in the Ninth Revision is a newmodification rule, Rule 12, which was added to theexisting rules for selection of cause of death forprimary mortality tabulation. The expected effect ofthe application of this rule is to preclude the cur-rent practice of coding the condition being treatedas the underlying cause of death in instances whenthe treatment itself or an adverse effect of the treat-ment was responsible for death. The exact wordingof this rule and its interpretation are still under dis-
279229-121 0- 7? - 19

cussion by members of the World Health Organiza-tion (WHO).
We have encountered difficulties in our practiceattempts at applying this rule to our mortality cod-ing and are hoping that current discussions andrecommendations that we have forwarded to WHOwill produce a modification of the modification.
Other Areas of Change
Another area of the classification that has un-dergone substantialchange is the chapter on Diseas-es of the Circulatory System. There have been anumber of shifts both in and out of various catego-ries in this chapter.
(1)
(2)
The Ischemic Heart Disease category is like-ly to have fewer deaths under the NinthRevision than under the Eighth because ofthe transfer out of cardiovascular diseaseand myocardial disease with mention ofarteriosclerosis.
The number of deaths classified to hyper-tensive heart disease will probably increasebecause of the shift of cardiovascular dis-ease due to hypertension from IschemicHeart Disease to hypertensive heart disease.
The impact of such changes is difficult to assessat this time because of other changes in both direc-tions. It appears, however, that the hypertensiveheart disease category in the Ninth Revision will bemore comparable to this category as it was underthe Seventh Revision than as it was under theEighth.
Some additional late effects categories havebeen established in certain areas of the classifica-tion, separating from current conditions those con-ditions specified as late effects or indicated as beingthe result of a condition that occurred a year ormore before death. For example, paralysis due tocerebral hemmorhage, formerly classified to “intra-cerebral hemorrhage” will now go to a category“late effects of cerebrovascular disease” for underly-ing cause. We will continue to identify paralysis asthe late effect for multiple cause.
The chapter on Neoplasms now has sectionsfor “Carcinoma in Situ” that is, preinvasive carcino-mas in the very early stages, and “Neoplasms ofUncertain Behavior”, in addition to the traditionalsections for benign, malignant, and unspecifiedneoplasms.
The classifications of maternal causes are muchmore detailed in the Ninth Revision than formerlybut much of the detail is not feasible for mortalityclassification. The Ninth Revision also provides forindirect as well as direct obstetric deaths by includ-ing conditions that complicate the pregnancy, areaggravated by the pregnancy, or are a main reasonfor obstetric care. This brings into the maternaldeath classification deaths formerly classified else-where in categories such as syphilis, tuberculosis,malaria, diabetes, anemia, and drug dependence.
There are many other changes, some which thenosologists at NCHS know about and, I suspect,some which will come as great surprises as moreintensive work gets underway on the implementa-tion of the Ninth Revision.
Effective Date ofImplementation
Plans call for using the Ninth Revision for mor-tality classification effective with 1979 mortalitydata. Our expert nosologists have been working onrestating the international rules and examples forpublication in the front of Volume I of the NinthRevision and on preparing notes to be included inthe categories published in the body of Volume 1.Volume I is expected to go to press shortly and beavailable around the first of next year. Volume II,the Index, is expected to be ready for distributionby mid or late 1977.
At NCHS work groups have been formed todevelop coding instructions. Preliminary group dis-cussions have been held, and as soon as the inter-pretation of the Ninth Revision has been clarified,coding specifications will be completed and theNCHS coding manuals and training manuals forunderlying and multiple cause coding under theNinth Revision should be in draft form by early1978.
Training of coders in underlying and multiplecause coding for the Ninth Revision will start inmid 1978 for State and local coders and in late1978 for NCHS coders. The ongoing research inCONTEXT is expected to be completed and thefeasibility for its implementation determined in timefor implementation with the Ninth Revision, if thesystem is judged feasible. Development of specifica-tions for modification of die ACME computer pro-grams and decision tables are in the discussion stageand will be completed in late 197’7.
-280

IMPLICATIONS OF THE NINTH REVISION OF THE iNTERNA-TIONAL CLASSIFICATION OF DISEASES (lCD): UPDATING THEACME SYSTEM
Mr. Marvin C. Templeton, Chief, Data Control Branch, Division of Vital Statistics, Nation-al Center for Health Statistics, Research Triangle Park, North Carolina
The Automated Classification of Medical Enti-ties (ACME) is a total system encompassing bothmanual coding of all individual entries on deathcertificates as the input data and a computer pro-gram for selecting the underlying cause of death. Itwas developed for the purpose of achieving two dis-tinct objectives.
1.
2.
To place in a machine-retrievable form allmedical information reflected in medicalcertifications of causes of death in codedform in accordance with the InternationalClassification of Diseases (ICD), facilitatingthe production of cause-of-death data inaddition to the underlying cause—frequent-ly referred to as multiple causes of death.
To achieve selection or assi~nment of the“
underlying cause of death” through utiliza-tion of the computer’s capability to exercisepredefine decisions rapidly and consistent-ly—thereby improving the underlying cause-of-death data.
Development and testing of the system sup-porting both initial objectives was completed in timefor NCHS to implement the system beginning withthe data year 1968 with its continuation throughoutthe period during which the 8th Revision ICD willremain in effect.
In addition to the NCHS’ utilization of the sys-tem, it has been adopted for use in seven States,Los Angeles County, and Canada.
The ACME system applies the same rules forselecting the underlying cause as applied by a no-sologist. The only difference being that all of thedisease and condition relationships are consistentlyapplied by the computer system through referenceto stored tables containing the relationship betweenICD codes as they relate to application of a specificrule. For this reason, any changes in the code num-bers, expansion or contraction of the disease orconditions for which code numbers are assigned inthe impending 9th Revision of the ICD will requireadjustment to the entries in the stored tables towhatever extent the 9th Revision differs from the8th Revision.
Fortunately, the basic definition of the underly-ing cause will remain essentially unchanged, an in-dication that the ACME computer program maynot require extensive revision. However, it is appar-ent that the content of the existing decision tableswill require considerable adjustment to convertthem to the 9th Revision requirements. Also, theremay be a need to introduce additional decision ta-bles to the extent that new international rules areincorporated if the function of the rule differs fromthe existing rules.
The specific degree to which the tables and/orthe computer program will require modification isstill an unknown. Miss Hetzel’s presentation reflect-ed the fact that establishment and definition of thespecific requirements for revision of the system isunderway. This must be completed before actualrevision can begin.
Obviously, the greatest and most complicatedtask is conversion of the content of the decision ta-bles and related testing to assure beyond a doubtthat the underlying causes generated by the systemare consistent with the rules and definitions. Inaddition, known deficiencies in the 8th Revision sys-tem recognized through its past and present usewill be corrected as part of the revision process thatwill render the system more effective. One example .is the reduction of the number of cases rejected formanual processing. Under the 8th Revision version,this amounted to approximately 5 percent of thecases. Hopefully, the rejected rate will be substan-tially reduced or possibly eliminated.
To whatever extent the system is revised, ade-quate testing will be necessary to assure accuracyand consistency. The entire process must be com-pleted early enough to permit installation and test-ing of the system in State offices in preparation forutilizing the system beginning with 1979 events.First priority should be given to those currentlyu~lzing the system. However, other States desiringto utilize the system should be accommodated at theearliest possible date. There are a sizeable numberof such States because many of them have consid-ered implementation of the system in the past fewmonths but were encouraged to delay until availa-bility of the 9th Revision system.
281,
.
—

CONTEXT–A LOOK AT AN AUTOMATED SCHEME USING TEXTENTRY
Mr. William M. Spillane, Chief, ADP Research Branch, Division of Operations, NationalCenter for Health Statistics, Research Triangle Park, North Carolina
The subject of this presentation is CONTEXT,a computerized system for all condition cause-of-death coding. CONTEXT, which stands for conver-sion of text, has been under development at theNational Center for Health Statistics for sometime-in fact, it was started in the Division of DataProcessing under Mr. Dan McGann. This presenta-tion is actually an update to a report given by DanMcGann at a previous conference.
Medical coding represents a major effort forthe National Center for Health Statistics. It requiresan extended period of t~aining, perhaps as long asfour months, before a coder becomes productive.
An examination of tabulations of the leadingcauses of death would show that a high percentageof all mortality occurs in a relatively few causes.This repetition suggests that it is possible to use thecomputer .to assign at least these repeating codes,because that is the type of work a computer doesbest.
The purpose of the CONTEXT system, then, isto convert the medical text found on a death certifi-cate into machine readable format, which in turn istranslated by a computer system into appropriatenumeric cause-of-death codes.
The basic concepts of the CONTEXT systemare as follows:
1.
2.
3.
4.
282
There is a high incidence of mortality in arelatively few causes of death. Heart diseasesand cancers are prime examples. Sincecomputers perform repetitive tasks at greatspeed and with a high degree of accuracy,they can be used effectively for this purpose.Many medical ,terms have a standard abbre-viation that can be learned quickly and easi-ly. For this reason we chose to use abbrevia-tions instead of fufl medical text to repre-sent the conditions specified by the physi-cian on the death certificate. In addition, theuse of abbreviations would reduce the num-ber of keystrokes required and lessen thepossibility of misspellings and transpositionof letters.For cases where no standard abbreviationwas commonly known, a set of rules, easy toremember and to ap’ply, was devised forcreating unique abbreviations.Typists who are familiar with keyboardingalphabetic information but unfamiliar withmedical coding would be used after a shorttraining period.
These concepts led us to define some objectivesfor “the first phase of research. Rather than “bite offmore than we could chew” we decided that coding70+ % of the mortality file was a realistic and attain-able goal. We felt that 70+% could be achieved bycoding the repetitive causes of death. We electednot to attempt coding accidents or traumatic deathssince they appear to be more difficult to code, Thetraining period would be approximately threeweeks. The final objective was that the output fromCONTEXT would be compatible with ACME anddirect input to ACME.
These concepts resulted in a system design withfour maior components.
1.
2.3.
4.
I
~ set of-coding rules - which are really ab-breviating rules.A short training program for typists.A dictionary which contains “CONTEXTtype” abbreviations along with the propernumeric cause-of-death code.A system of computer programs to “lookup” and translate the CONTEXT abbrevia-tions into numeric codes and create a recordacceptable to ACME.
will discuss each component briefly. Thereare four basic coding or ab~reviating nd’es. Theycan be applied as best suits the individual, but weencourage the use of Rule 1, or the standard abbre-viation whereever possible. This is because thestandard abbreviations tend to be short and areeasy to remember.
Rule l—Standard Abbreviations are used byphysicians and medical coders and are found onmany death certificates. The typists are trained inthe use of standard abbreviations and seem to learnthem quickly. For example, the abbreviation forarteriosclerotic heart disease is ASHD.
Rule 2—One word medical entity: When amedical entity appears as a single word, the com-plete word is used. Example: Hypertension; Usethe entire word: Hypertension.
Rule 3-Multiple word entity: This rule is applied when the first two ruIes can’t be used. It wasdesigned for both ease of entry and for providinguniqueness. The rule states: For the first word of amultiple woid medical entity, use the first letterplus the first four consonants, If four consonantsare not available use the ones that are. For the sec-ond word, use the first 4 letters; for the third word,

use the first 3 letters; for the fourth word, use thefirst 2 letters; and for the fifth word, use the firstletter. For example, the abbreviation for pulmonaryedema is PLMNR EDEM.
Rule 4-Combination medical words:
Sometimes the medical entity being abbreviated willnot be unique if Rule 3 is applied. In this case theword in doubt is broken up into its medicd compo-nents and the first two letters of each part are usedto form the abbreviation. For example, pericarditisis broken up into peri - card - itis, with the resul-tant abbreviation PECAIT.
The training was designed for typists who have nofamiliarity with medical terminology. The first or-der of business was to teach them how to recognizea medical enti~. This included some anatomy andmedical terminology, and it required about oneday. The CONTEXT abbreviating rules and how toapply them were learned in about one and a halfdays. Special rules covering such topics as newbornsand durations of certain diseases took about half aday. The trainees then worked examples using pen-cil and paper for about one and a half days.Practical training at the keyboard using all the in-formation learned to that point required one weekor five working days, The total time for the CON-TEXT training, then, was ordy two weeks and notthe predicted three weeks.
The present dictionary is on magnetic tape andcontains less than 20,000 terms or entries. Eachterm has the CONTEXT type abbreviation plus theproper numeric cause-of-death code. Every diction-ary entry also has a counter which is incrementedwhen the entry is used. This gives us an accuratecount of the usage of terms. The dictionary hasbeen designed to be easy to update and can, in fact,be updated with each batch of work processed ifdesired.
There are three main programs in the system -Explode, Match, and Reassemble. The Explodeprogram takes each CONTEXT coded mortalityrecord, which may have multiple abbreviated terms,and creates a separate record for each term. Thesesingle term records are then sorted alphabeticallyby abbreviation for input to the Match program.The Match program compares the abbreviation onthe dictionary with these one term records and as-signs the numeric cause-of-death code when amatch is found. The one term records are thenreassembled back into the original records main-taining the integrity of the death certificate. That is,each code is on its original line and in the properposition for ACME. As in any system a variety ofauxiliary programs support the main system.
Let’s recap by illustrating the entire flow of thesystem (Figure 1). The typist reads the microfilmeddeath certificates, applies the CONTEXT abbrevia-tions and keyboards the data. We have been enter-
ing CONTEXT on a key-to-disk system which
works very well because the operators can see theentire record on the cathode ray tube as it is beingentered into the mini-computer. me CONTEXTformat records are written to a magnetic tape whichis then processed on the computer. During thisphase the records are exploded, matched, and reas-sembled for ACME. Since we do not presently codetraumas and since some abbreviations are not foundon the dictionary, reject records are separated fromthe completed records. They are coded manuallyand merged back into the CONTEXT coded re-cords for processing by ACME. At the same timethe dictionary is updated. -
We are presently in the process of a completesystem test. We are building the dictionary by usingCONTEXT to code about 40,000 mortality recordsthat were previously manually coded. In Cycle 1 .with a dictionary of 12,171 terms we entered 9,297records into the system. Of these 9,297 records,4,839 or 52 percent were completely coded by thesystem —that is, all of the abbreviations in the certif-icates were found on the dictionary and assigned acode. We dld not even attempt the accidents andtraumatic deaths and they represetn about 13-15percent of the total. There were 4,120 records or44 percent of the totalthat matched perfectly withthe manual coding. The accuracy rate applies to thecompleted records—that is, 4,120/4,839 whichequals 85 percent.
In the second cycle, the dictionary was updatedwith the rejects from Cycle 1 to make a total of14,957 terms. There were 7,852 records in the testand 4,983 were completely coded for a conversionrate of 63 percent. There were 4,333 records codedexacdy as the manual coder for an accuracy rate of87 percent.
Figure 2 shows the average production ratesfor the three typists used in the test. Week one rep-resents their first week after training. The rateclimbs sharply except for week five-which we can’texplain. Although the rate was still going upthrough week seven, when we ran out of data, weexpect the curve to level off eventually. ~]s is thegross rate which includes records intent.ionaliy re-jected and also records which contained errors. The817 records per day compares to a Productionstandard of 575 records per day and an actual-aver-age manual coding rate of 656 per day by our med-ical coders.
We are trying “to compile cost figures and man-power requirements based on our system test. Itisn’t, possible to give any concrete answers right now‘because the entire test is not completed. However,one fact is evident, even at this point—CONTEXTcan greatly reduce the amount of training needed.
We will continue our dictionary building untilit reaches optimal size. In the process we wjll not
283

FIGURE I. SYSTEM FLOW
MICRO-FILM
TYPIST ENTERSABBREVIATION
CONTEXTFORMAT
CONTEXT DICTIONARY
ABBREVIATIONSv
AND+
ComputerREJECTS
USE-:~;EsATH Processing
C::;:;T
RECORD
TO ACME
284

Figure 2. Average Coder Production Rate
850 r
750
650
550
450
350
1 2 3 4 5 6 7
“WEEK
285

only increase the percentage of records coded andthe accuracy, but will also learn more about costand manpower requirements. We plan on improv-ing the programs within the system with an eyetoward increased efficiency throughout. We wouldespecially like to smooth reject processing.
We also feel that we are ready to tackle some ofthe more common accidents, such as motor vehicleaccidents, gunshot wounds, etc. Our plan for acci-
dents uses the versatile prompting capability of thekey-to-disk where each group of accidents wouldhave its own set of prompts.
In summary, we are very encouraged with theresults of this test. The performance of the systemis approaching predicted levels and it appears thatCONTEXT can, indeed, become a viable means ofautomated medical coding.
286
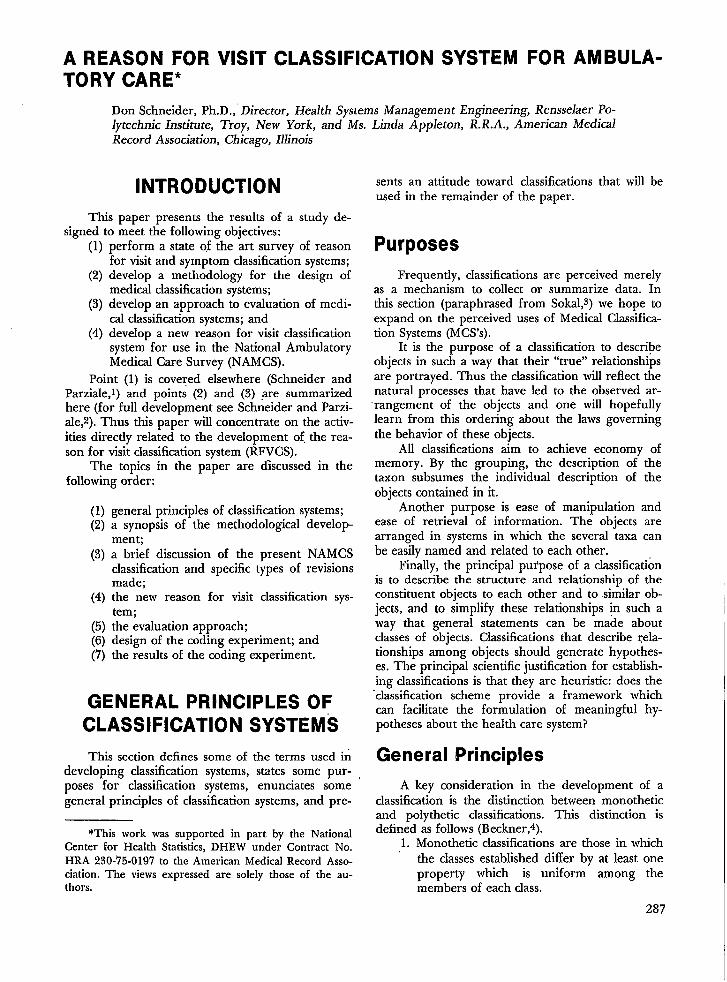
A REASON FOR VISIT CLASSIFICATION SYSTEM FOR AMBULA-TORY CARE*
Don Schneider, Ph. D., Director, Health Systems Management Engineering, Rensselaer Po-lytechnic Institute, Troy, New York, and Ms. Linda Appleton, R.R.A., American MedicalRecord Association, Chicago, Illinois
INTRODUCTION
This paper presents the results of a study de-signed to meet the following objectives:
(1) perform a state of the art survey of reasonfor visit and symptom classification systems;
(2) develop a methodology for the design ofmedical classification systems;
(3) develop an approach to evaluation of medi-cal classification systems; and
(4) develop a new reason for visit classificationsystem for use in the National AmbulatoryMedical Care Survey (NAMCS).
Point (1) is covered elsewhere (Schneider andParziale,l) and points (2) and (3) are summarizedhere (for full development see Schneider and Parzi-ale,z). Thus this paper will concentrate on the activ-ities directly related to the development of. the rea-son for visit classification system (RFVCS).
The topics in the paper are discussed in thefollowing order:
(1)(2)
(3)
(4)
(5)(6)(7)
general principles of classification systems;a synopsis of the methodological develop-ment;a brief discussion of *e present NAMCSclassification and specific types of revisionsmade;the new reason for visit classification sys-tem;the evaluation approach;design of the coding experiment; andthe results of the coding experiment.
GENERAL PRINCIPLES OFCLASSIFICATION SYSTEMS
This section defines some of the terms used indeveloping classification systems, states some pur-poses for classification systems, enunciates somegeneral principles of classification systems, and pre-
*This work was supported in part by the NationalCenter for Health Statistics, DHEW under Contract No.HRA 230-75-0197 to the American Medical Record Asso-ciation. The views expressed are solely those of the au-thors.
sents an attitude toward classifications that will beused in the remainder of the paper.
Purposes
Frequently, classifications are perceived merelyas a mechanism to collect or summarize data. Inthis section (paraphrased from Sokal,s) we hope toexpand on the perceived uses of Medical Classifica-tion Systems (MCS’S).
It is the purpose of a classification to describeobjects in such a way that their “true” relationshipsare portrayed. Thus the classification will reflect thenatural processes that have led to the observed ar-rangement of the objects and one will hopefullylearn from this ordering about the laws governingthe behavior of these objects.
All classifications aim to achieve economy ofmemory. By the grouping, the description of thetaxon subsumes the individual description of theobjects contained in it.
Another purpose is ease of manipulation andease of retrieval of information. The objects arearranged in systems in which the several taxa canbe easily named and related to each other.
Finally, the principal purpose of a classificationis to describe the structure and relationship of theconstituent objects to each other and to similar ob-jects, and to simplify these relationships in such away that general statements can be made aboutclasses of objects. Classifications that describe rela-tionships among objects should generate hypothes-es. The principal scientific justification for establish-ing classifications is that they are heuristic: does the‘classification scheme provide a framework whichcan facilitate the formulation of meaningful hy-potheses about the health care system?
General Principles
A key consideration in the development of aclassification is the distinction between monotheticand polythetic classifications. This distinction isdefined as follows (Beckner,A).
1. Monothetic classifications are those in whichthe classes established differ by at least oneproperty which is uniform among themembers of each class.
287

2. In polythetic classifications, taxa are groupsof individuals or objects that share a largeproportion of their properties but do notnecessar~y agree in any one property.Polythetic classifications require that manyproperties be used to classify objects. Once aclassification is established, few propertiesare generally needed to place objects in theproper rubric, but it is urdikely that fewproperties will suffice to establish the fibricin the first place.
It should be noted that MCS’S are often designed tobe monothetic classifications (i.e. mutually exclusive,homogeneous groiipings), but there are reasons toconsider polythetic classifications as stated bySokals:
No single uniform property is required for thedefinition of a given group nor will any combi-nation of characteristics necessarily define it.This somewhat disturbing concept is readilyapparent when almost any class of objects isexamined. Thus it is extremely difficult todefine class attributes for such taxa as cows.Although cows can be described as animalswith four legs that give milk, a cow that hasonly three legs and does not give milk will stillbe recognized as a cow. Conversely there areother animals witi four legs that give milk thatare not cows.
The most commonly used method of polytheticclassification is through the use of cluster analysis.Variations of this technique have been successfullyused in the development of MCS’S (e.g. Fetter,Thompson and Mtis} and Over and SmithG).
METHODOLOGY
This section discusses a methodology for devel-opment and revision of MCSS. A methodology is abody of rules, principles and procedures of inquiryin a particular field. A methodolo~ is a frameworkfor applying past experience in the future. In ourreview of the literature, we found over a hundredpapers dealing with various classification systems,but virtually all seem to have been developed on anad hoc basis. In order to systematize the results andexperience from the MCSS already developed andto aid in revisions of MCSS, we developed a con-ceptual framework for MCSS,
Due to the multifaceted nature of the medicalcare process there are a wide variety of approachesto its classification. The particular axis of classifica-tion will be determined by the use to be made ofthe statisticsto be compiled. In addition, a statistical
288
classification must be confined to a limited numberof categories which will encompass the entire rangeof data to be categorized. The construction of apractical scheme of classification for general statisti-cal use involves various compromises (Eighth Revi-sion of ICDA,7).
The above paragraph points to a number ofissues involved in the development of a classifica-tion svstem.
1:
2.
3.
4.
5.
We first have to decide exactly what we wantthe output of the classification to represent.We must decide exactly what elements ofthe medical care process we are going tocategorize to meet our output needs,We must try to iimit the number of catego-ries but still be comprehensive.All the patient visits that are to be includedin a category must be homogeneous withrespect to the axis of classification.In order to more fully characterize the med-ical care process, the classification shouldinclude more than one axis of classificationor be capable of interface.
The following subsections will discuss these is-sues involved in the development of a classificationsystem and will suggest some particular methodsfor meeting these objectives. For excellent back-ground references see Tyroler8 and Bohrod9.
Output of the MCS
There are two kinds of people in the world—those who divide everything in the world intotwo kinds of things and those who don’t,
BouldingloBy the way of example of the two kinds of
people in the world consider the following:1. There are two kinds of systems large and
small.2. Within each category, there are two kinds of
systems, centralized and decentralized.3. These categories further break down into
public and private...
The pattern is clear and the technique is guaran-teed to make a true partition, but of what use is it?What difference does it make if the system is largeor small? Centralized or decentralized? Public orprivate? It must be demonstrated that these areuseful categories (example from Weinberg,l 1).
Thus in designing an MCS we should alwaysgive primary attention to the questions to be an-swered by the MCS. The principle of looking at theoutput of the MCS is always acknowledged as thekey to the classification. For example, “A statisticalclassification of disease and injury will depend,
therefore, upon the use to be made of the statisticsto be compiled’ (p. XIII, Eighth Revision, ICDA7).But it appears evident that the evolution of systemssuch as the ICDA was dictated by the input side—on new categories of disease and patient visits tocategorize. The output side is only implicitlyviewed-that people who use these statisticswoddwant an up-to-date, detailed listing of disease andother types of patient visits.
A counter argument to the above states that itis not possible to determine in advance all the ‘usesfor data resulting from an MCS and that in anyevent general purpose classification systems arenecessary for baseline data. ~ls argument hasmany backers and also has much validity. There areat least two potential dangers from carrying thisargument too far:
1. that a single view of the medical care pro-cess may dominate; and
2. that the limited resources for health caredata may not be applied in the most usefulfashion.
In order to evaluate an information system onebasically wants to know if you are getting accuratedata that helps make decisions. The use and devel-opment of MCS’S is characterized with explicit eval-uation of the way input data is collected and theinternal evaluation of the MCS. As a result mostsystems are quite good in these areas. If the outputside were equally explicitly treated, the end resultwould be more useful data for the resources invest-ed. We suggest that although all the data needsmay not be known, at least some prospective dataneeds should be explicitly recognized in the devel-opment process.
A caveat: since the health mre system is pres-ently without a well defined conceptual structure,it is very difficult to decide what the output needsfor an MCS are. The value of information is relatedto its decision-making value and, as yet, not enoughis known about the decision-mak]ng process (eitherideal or actual) to fu~y know what information isvaluable.
Other Conceptual Issues
This section will address the following issues:
1. Limit the categories but be comprehensive;2. All patient visits within a category must be
homogeneous with respect to the axis ofclassification; and
3. The classification should include more thanone dimension of thepatient visit or be capa-ble of interface with other MCS’S.
In trying to limit the number of categories onehas to consider several conflicting criteria:
1. very detailed data can be used in more ap-plications
2. detailed data can be aggregated upwardsinto fewer, broader categories; and
3. detailed classifications are harder to collectdata for and are harder to code.
In some cases the level of detail of the input maybe directed by external constraints and the abovebecome moot issues. However, if one has a choiceas to level of detail of the MCS the methodologyfor making the choice could include some of thefollowing:
1. cost and/or time analysis for collection andcategorization of the data;
2. analysis of the detail required to meet thearticulated output needs;
3. a more detailed system can more easily meshwith other MCS data bases; and
4. analysis of the variance of patient visits thatfall within a classification.
The last two points are discussed more fully below.A basic problem in the use of data from an
MCS is that it is usually not complete—it eitherrepresents a smaller sample than we want or itdoesn’t include all the dimensions. If the MCS canbe linked to other MCS the dimensions or samplecan be expanded. A basic problem though is estab-lishing how MCS’S can be linked together (Rennerand Bauman,lz calls this articulation). We suggestthere are two items to consider:
1, if many MCS’S used the same aggregationthen data could at least be compared on anaggregated level (it may also be possible toagwegate categories in several fashions tofacilitate links with other MCS’S);
2. a detailed MCS may mesh more easily withother MCS’S.
It is usually not a very easy task to mesh differ-ent MCS’S together to achieve desired end results.Figure 1 is an example of a diagrammaticmethod forexamining the data flow between MCSS. The threeMCSS used were linked together to form the TriLevel Classification System which is a multidimens-ional, hierarchical system (Schneider and Kilpa-trick,13). The diagram shows how information flowsfrom one system to another and incorporates:
1. age and sex distribution,2. diagnosis,3. medical tasks and procedures,4. follow up visits,
289

5. severity, and6. manpower used.
The next point involves the homogeneity with-in a classification. Patient visits within a categoryshould be homogeneous when compared only on thefollowing basis:
1. low variance with respect to axis of classifica-tion; and
2. low variance with respect to usage of outputdata.
As an example of point (2) consider the followingcase. Suppose for argument, that all followup visitsfor chronic diseases are handled by a physician as-sistant in a fifteen minute appointment block. Ifone wants to examine physician assistant require-ments for the above type of visits then one can usethe category-chronic disease, followup and byknowing the number of visits falling in that catego-ry the output needs are met. Patient visits in tiscategory have no variance with respect to the usemade of the data. The visits of course have Klghvariance with respect to demographic characteris-tics, diagnosis, procedures performed, etc. ManyMCS’S are frequently disparaged because they lumptogether patient visits with a high variance in cer-tain dimensions - this high variance may be irrele-vant. On the other hand, the more dimensions forwhich the category displays low variance, the great-er the potential use of the data.
The last point to be discussed involves aggrega-tion strategies. Output from a very detailed MCS isdiffictit to draw conclusions from or make policydecisions with. An aggregation of the data is usuallynecessary so that fewer categories of data are beingexamined. We feel the aggregation used is extreme-ly important for two reasons:
1.
2.
common aggregations allow MCS’S to belinked; andthe aggregations should be based on theoutput needs so that the data are moremeaningful.
As an example, consider the frequent policy of ag-gregating based on body system. This practice isappealing mainly from &e input, coding, and dlni-cal standpoint. However what are the most commonuses made of the data? Some prevalent examplesare:
1. cost analysis,2. utilization behavior,3. manpower usage,4. ancillary services,5. patient management,6. quality of care.
290
and
It would appear that body system is not the bestaggregation strategy for any of the above uses ofthe data. We believe that the aggregation strategy isextremely important and consideration should begiven to multiple forms of aggregation with anMCS. ~ls will increase the possibilities of data useand the possibilities of linkage with other MCS’S.(The possibility of multiple aggregation strategiesprobably implies a detailed MCS.)
DEVELOPMENT OF A REASONFOR VISIT CLASSIFICATION
SYSTEM
Present NAMCS ClassificationSystem
When the NAMCS was being field tested from1970-1973, it was perceived that an adequate symp-tom/complaint classification system was not availableto code the data. Consequently a new classificationwas developed based largely on classifications devel- .oped by Bain and Spauldinglq and Rennerls. TheNAMCS symptom coding scheme consists of 197rubrics grouped into 13 classes around an anatomi-cal axis. The groups were chosen largely because oftheir relation to ICDA. The new classification’s hi-erarchy is shown in Fi@re 2, some examples of thecode are shown in Figure 3 (for a complete listingsee Meads and McLemore, 16. The classification wasdeveloped to code the symptom or complaint in the ‘patient’s own words - thus many lay terms are in-cluded as synonyms.
Modular Structure
In general the methodological concepts pre-sented in the last section were used to guide therevision of the NAMCS classification system,Briefly, it was noted that the aggregation strategyor hierarchical structure plays a key role in utiliza-tion of the output from “&e’system’ and the abilityto relate one data set to another. In addition, dis-cussions with DHEW personnel and other healthresearchers pointed to the folIowing problems withthe use
(1)
(2)
(3)
of th”e NAMCS data or class~fi~ation system:
the summarized data was grouped alongcategories inconsistent with data needs;the classification system was not detailedenough;the data collected in other studies could notbe easily related to the NAMCS data.
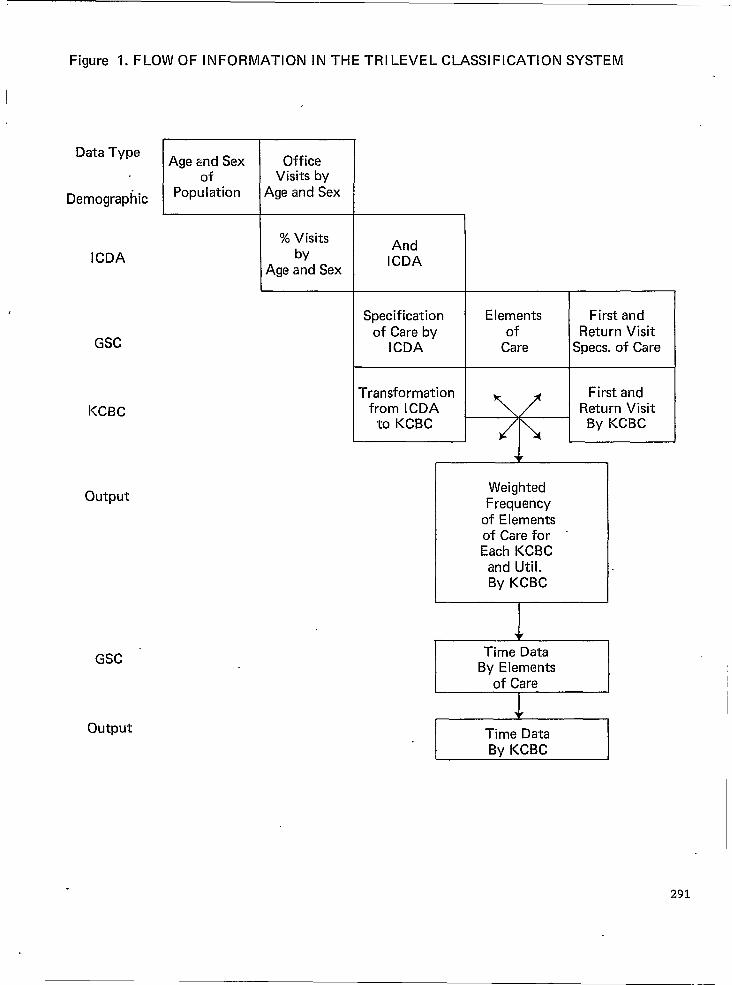
Figure 1. FLOW OF INFORMATION IN THE TR
Data Type
Demographic
ICDA
KCBC
GSC
output
EAge and Sexof
Population
OfficeVisits by
Age and Sex
% Visitsby
Age and Sex
LEVEL CLASSIFICATION SYSTEM
AndICDA
Specificationof Care by
ICDA
Transformationfrom ICDA
to KCBC
Elements First andof Return Visit
Care Specs. of Care
First andReturn Visit
By KCBC
WeightedFrequency
of E Iementsof Care for “Each KCBC
and Util.By KCBC
Time DataBy Elements
of Care
Time DataBy KCBC
291

FIGURE 2.
HIERARCHY FOR NAMCS SYMPTOM CLASSIFICATIONSYSTEM
List of classes Classification code
I.II.III.Iv.v.VI.VII.VIII,IX.x.XI.XII.XIII.
General Symptoms . . . . . . . . . . . . . . . . . . . . . . . . . . . . . . . . . . . . . . . . . . . .Nervous System . . . . . . . . . . . . . . . . . . . . . . . . . . . . . . . . . . . . . . . . . . . . . .Skin, Na.il, and Hair . . . . . . . . . . . . . . . . . . . . . . . . . . . . . . . . . . . . . . . . . . . .Cardiovascdar and Lymphatic Systems . . . . . . . . . . . . . . . . . . . . . . . . . . . .Respiratory System . . . . . . . . . . . . . . . . . . . . . . . . . . . . . . . . . . . . . . . . . . .Musculoskeletal System . . . . . . . . . . . . . . . . . . . . . . . . . . . . . . . . . . . . . . . .Digestive System . . . . . . . . . . . . . . . . . . . . . . . . . . . . . . . . . . . . . . . . . . . . .Urinary System . . . . . . . . . . . . . . . . . . . . . . . . . . . . . . . . . . . . . . . . . . . . . .Male Reproductive System . . . . . . . . . . . . . . . . . . . . . . . . . . . . . . . . . . . . . .Female Reproductive System, Including Breast . . . . . . . . . . . . . . . . . . . . . .Eyes and Ears . . . . . . . . . . . . . . . . . . . . . . . . . . . . . . . . . . . . . . . . . . . . . . . .Mental Health . . . . . . . . . . . . . . . . . . . . . . . . . . . . . . . . . . . . . . . . . . . . . . . .Nonsymptomatic Visits Acording to Patient’s Purpose. . . . . . . . . . . . . . . . .
000.0:049.0050.0-099.0100.0-199.0200.0-299.0300.0-399.0400.0-499.0500.0-599.0600.0-629.0630.0-649.0650.0-699.0700.0-799.0800.0-899.0900.0-999.0
FIGURE 3. SELECTED SAMPLE OF RUBRICS FROM NAMCSSYMPTOM CLASSIFICATION
Symptoms Referable to Cardiovascular and Lymphatic(200.0-299.0)200.0 Irregular pulsations and palpitations
Includes:FlutteringDecreasedIncreasedPulse too fastPulse too slowOther irregular heart beatsRapid heartSkipped beatUnequal
201.0 Heart Murmur205.0 Abnormally high blood pressure
Includes:Elevated B/PHigh B/PHypertension
206.0 Abnormally low blood pressureIncludes:
Decreased B/PHypotensionLow B/P
210.0 Symptoms referable to bloodIncludes:
PoorThinTiredWeak
292
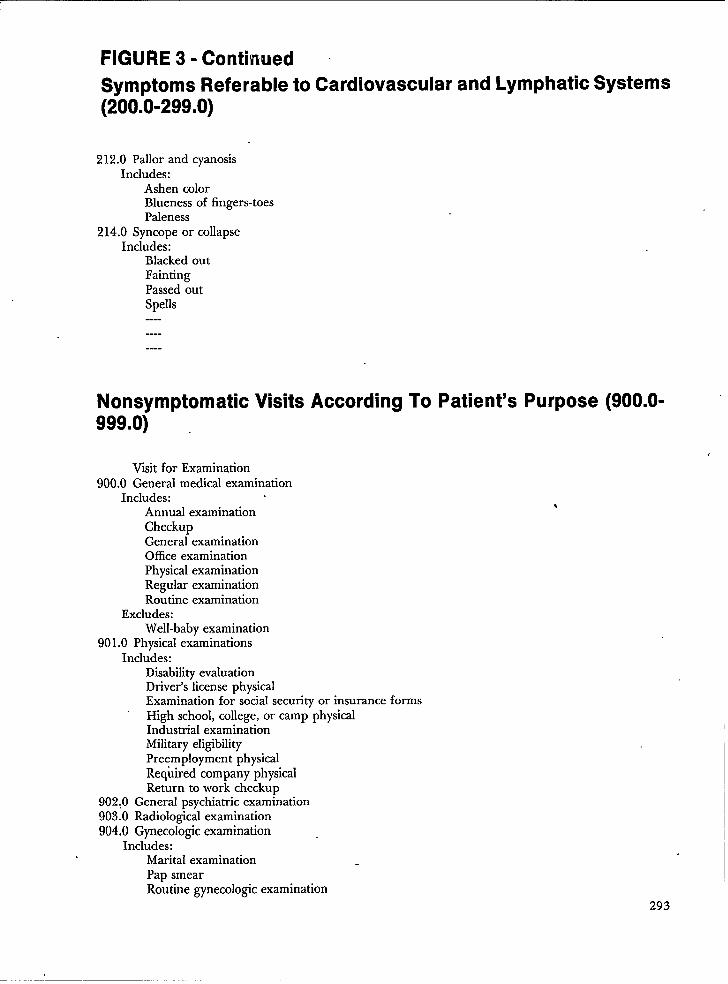
FIGURE 3- Continued ~
Symptoms Referable to Cardiovascular and Lymphatic Systems(200.0-299.0)
212.0 Pallor and cyanosisIncludes:
Ashen colorBlueness of fingers-toesPaleness
214.0 Syncope or collapseIncludes:
Blacked outFaintingPassed outSpells
Nonsymptomatic Visits According To Patient’s Purpose (900.0-999.0)
Visit for Examination900.0 General medical examination
Includes:Annual examinationCheckupGeneral examinationOffice examinationPhysical examinationRegular examinationRoutine examination
Excludes:Well-baby examination
901.0 Physical examinationsIncludes:
Disability evaluationDriver’s license physicalExamination for social security or insurance forms
“ High school, college, or camp physicalIndustrial examinationMilitary eligibilityPreemployment physicalRequired company physicalReturn to work checkup
902,0 General psychiatric examination903.0 Radiological examination904.0 Gynecologic examination
Includes:Marital examinationPap smearRoutine gynecologic examination
293

FIGURE 3.—continued
Nonsymptomatic Visits999.0)
905.0 Pregnancy examination, routineIncludes:
PostnatalPregnancy confirmedPregnancy unconfirmedPrenatalRoutine check
According To Patient’s Purpose (900.0-
Using the methodology developed, the infor-mation from the data users, and the literature re-view and preliminary evaluation of coding systems,it was decided to restructure the code into a modu-lar structure with the following modules:
(1) symptoms;(2) diseases;(3) diagnostic, screening, and preventive proce-
dures;(4) therapeutic procedures, process problems
and counselin~(5) injuries and adverse effects;(6) followup for test results; and(7) administrative reasons for visit.
,
These modules represent a basic categorizationof patient’s reason for visit. It is believed thatthrough use of this basic structure other datasources and codes can be more easily related to theNAMCS data. This structure should also relate tomany different types of data use since the two pri-mary characteristics of the patient visit were used toestablish the modules:
(1) the patient’s motivation or reason for visit;and
(2) the physician’s response to that reason forvisit.
This does not imply that all or nearly all the patientvisits falling in a particular module are uniformwith respect to the two characteristics listed above.Instead, using the principles of polythetic classifica-tions the following is implied: a randomly selectedpatient visit coded into a particular module is ex-pected (in the statistical sense) to be more highlycorrelated (with respect to characterisitcs (1) and (2)above) with other patient visits in the same modulethan it is with patient visits coded into other mod-ules.
A general characterization of the types of pa-tient visits falling into each of the modules is listedbelow:
(1)
(2)
(3)
(4)
(5)
(6)
(7)
Symptom—probably a first visit; patient vis-iys a physician because of a symptom that isbothering him; physician responds by col-lecting data through history, exam, lab. Atleast a tentative diagnosis is the probableoutcome;Disease—either a common disease namethat the patient thinks of as a description ofa symptom or a return visit with diagnosispreviously supplied by physician. Manychronic diseases will be coded here.Physician response is probably a check-upor observation of condition;Diagnostic, Screening and Preventive proce-dures—Largely consists of patients who arenot ill and are receiving preventive care,are in a high risk group, or are involved infamily planning or pregnancy. The physi-cian’s response is to directly carry out thepatient’s request and is procedurally orient-ed.Therapeutic Procedures, Process problemsand Counseling—usually a return visit initi-ated by the doctor; physician response is todirectly carry out the reason for visit and isprocedurally oriented.Injuries and Adverse Effects-usually anemergency visit which needs immediatecare. Physician’s response is to alleviate theimmediate problem, procedures are quitedifferent than for (3) or (4).Abnormal Test Results-a return visit; pa-tient is told to return by the physician, di-agnosis may not yet be established; Physi-cian response may be to do further diag-nostic tests or he may initiate a therapeuticregimen.Administrative Reasons for Visit—The visitis motivated by someone other than the pa-
294

tient or the physician; physician response isto carry out the exam requested.
When the modules were designed, the primaryemphasis on the exact selection of the modules andthe codes to be placed in the modules was that theydiscriminate well with regard to the two points list-ed above. To ensure this discrimination an analysis(which we’ll call a resolution analysis) was per-formed with regard to five attributes of a patientvisit (shown on Figure 4). The design process pro-ceeded along two levels
(1) select the rubrics and hierarchical structureof each module in such a way that a fairlydefinitive resolution of the most probablecharacterization is possible; and
(2) select the module definitions in such a waythat the modules are distinctly differentfrom each other (as measured by their dif-ferences in atrnbutes).
The final results of this analysis is shown inFigure 4. Note that an “X” does riot mean that allpatient visits in a module have a partictiar attributeand a “blank” does not indicate that none have thatattribute.
One way to examine whether the modules areessentially distinct from each other (point 2 in thedesign process) is to compare their attributes on apair-wise basis. For example, in comparing module(1) to module (2) the first and fourth attributes aredifferent. In comparing module (3) to module (4)the first, second and fourth attributes are different.The mean number of attributes that differ fromone module to the next is (on a pair-wise compari-son):
(1) module 1-2.8(2) module 2-2.5(3) module 3-2.8(4) module 4-2.4(5) module 5-3.2(6) module 6-2.5(7) module’7 -3.2
Out of 21 pair-wise comparisons there are no scoresof zero and two comparisons gave only 1 attributedifference.
It is interesting to compare this resolution to themathematically optimal resolution. It is evident thatin comparing any two modules they could be differ-ent in as many as five attributes, but it is not mathe-matically possible for the mean difference in attrib-utes to be five. It should be noted at this point that themodules were designed specifically to have only onemodule characterize the “I. Other initiated” row andthe “III. Emergency” row. With these constraints themathematical optima to the results shown on Figure 4show that 43 out of 45 assignments were made opti-mally. Thus the resolution of the system with respectto the five attributes shown is nearly optimal.
Figure 4 also points out another interesting fea-ture. The information content of a module is relatedto how uniquely or easily one can assign attributes tothat module. On this basis it can be noted that the dis-ease module is the least informative module. If a dis-ease is listed, it is very difficult to tell who or why thevisit was initiated, what point in the history of the ill-ness has been reached, and what the M.D.’s re-sponse will be.
In summary, using the modular approach hasthe following advantages:
(1)
(2)
(3)(4)
(5)
(6)
On-an aggregated level, these 7 are very des-criptive of types of reasons for visit;They provide a framework into which othercodes can fit (for example, a researcher inter-ested in therapeutic procedures can expandthat module in any depth desired, but stillhave his data set compatible with theNAMCS baseline data);The modular format is extremely flexible;Codes for each module can be expanded orrevised as needed, separately from the othermodules;Codes for the” modules can be abstractedfrom other coding systems that specialize in aparticular module (e.g. ICDA for diagnosis);andThey represent a logical grouping of codeswhich will reduce coding e;ror;. -
RevisionIn addition to the structural change of a modu-
lar system the revision of the NAMCS code pro-ceeded as follows:
(1) codes were added to decrease the use ofcatch all codes;
(2) the most prevalent codes were expanded inspecificity;
. (3) infrequent codes were collapsed together;(4) codes for use in the emergency room and
hospital outpatient clinics were added;(5) the symptom codes were expanded and
made more specific;(6) procedure and diagnosis codes were added;
and(7) the method of coding followup visits was
revised.
New RFV Classification
Although the final revision won’t be completeduntil late summer the preliminary hierarchy of the .RFV classification is shown in Figure 5. Severalexamples of the code are shown in Figure 6.
The code is currently under revision, The revi-sions are being based on the following:
295229-121 0-77-20

FIGURE 4.
ATTRIBUTES OF THE CLASSIFICATION MODULES
- I. - Patient initiated I x
MD initiated x x
Other initiated x
II. - Illnessx. x x x
xNon illness x
x
x x x x x
xW. - Check-up
Diagnostic x
x
xTherapeutic x x
x x x, x
xx
X - most probable characterization
d- secondary characterization

Figure 5.—RFV CLASSIFICATION SYSTEM HIERARCHY (NOTFINALIZED)SYMPTOMS
General SymptomsMental HealthNervous SystemEyes and EarsCardiovascular and Lymphatic SystemsRespiratory SystemDigestive SystemUrinary SystemMale Reproductive SystemFemale Reproductive System, including BreastSkirt, Nails, HairMusculoskeletal System
DISEASESInfective and ParasiticNeoplasmEndocrine, Nutritional and MetabolicBlood and Blood-formingMental DisordersCentral Nervous SystemEyeEarCirculatory SystemRespiratory System .Digestive SystemGenitourinary SystemSkinMusculoskeletalCongenital Anomalies “
DIAGNOSTIC SCREENING AND PREVENTIVEGeneral ExaminationsSpecial ExaminationsDiagnostic TestsOther PreventiveFamily Planning
THERAPEUTIC PROCEDURES, PROCESS PROBLEMS AND COUNSELINGMedicationsPre-operative and Post-operative CareContinuing Treatment :f InjuriesSpecific Types of TherapySpecific Therapeutic ProceduresMedical CounselingSocial ProblemsProgress Visit, NEC
INJURIES AND ADVERSE EFFECTSInjury by Type and LocationInjury by CausePoisoning and Adverse Effects
ABNORMAL TEST RESULTS
ADMINISTRATIVE REASONS FOR VISIT
Uncodeable Entries
SOO1-S099S1OO-S199S200-S299S300-S399S400-S499S500-S599S600-S699S700-S729S730-S749S750-S799S800-S899S900-S999
DO09-D136D154-D218D242-D279D280-D289D295-D315D340-D359D360-D378D380-D387D390-D459D462-D519D530-D578D590-D679D680-D709D715-D739D752-D759
X1OO-X199X200-X299X300-X399X400-X499X500-X599
TIOO-T199T200-T299T300-T399T400-T499T500-T599T600-T699T700-T799T800-T899
EOO1-E700E800-E840E900-E999
R1OO-R6OO,
A1OO-A13O
U990-U999
297

Figure 6.-SELECTED EXAMPLES OF RUBRIC IN RFVCLASSIFICATION SYSTEM (NOT FINALIZED)
SCREENING, DIAGNOSTIC AND PREVENTIVE
EXAMINATIONS
GENERAL EXAMINATIONS
X1OO.OGeneral Medid ExaminationIncludes:
Annual examinationGeneral ExaminationOffice examPhysical examinationRoutine examinationRegular examination
Excludes:Follow-up visit (T800.0)Progress visit (See T800.0)Administrative examination (A1OO.O-A13O.O)
X105.O Well baby examination (Age O-1)
X1O’7.OWell child examination (Age 1-5)
Xl 10.0 General psychiatricexamination -Excludes:
Court or school-ordered examination (See A600.0)
SPECIAL EXAMINATIONSX200.O Pregnancy, unconfirmed
Includes:Might be pregnantFor pregnancy testPossible pregnancy
X205.O Pre-natal examination, routineIncludes:
. Routine obstetrical carePregnancy, NOS
X20’7.O Pre-natal examination, non-routine “”Includes:
High blood pressure in pregnancyPrenatal visits for high-risk pregnanciesDiabetes during pregnancyAbnormal position of fetus .Previous C-sectionEdema of pregnancy
X210.0 Post-partum examination
X215.0 Gynecological examinationIncludes:
Pelvic examPremarital exam
298

Figure 6- Continued
Routine gynecological examinationPap smear
Excludes:Repeat or abnormal pap smear (See Z300.0)Examination involving IUD or other contraceptive (See X500’S)
----------
TREATMENT MODULE: Therapeutic procedures, process problems and medical counseling
MEDICATIONS
TIOO.O MedicationIncludes:
Renew prescriptionFor medicationRequest prescriptionPrescribe medicationCheck medication
Excludes:Birth control medication (See X550.0)Eyeglass prescription (See X220.0 and T517’.0)
T105.O Allergy medicationIncludes: ,
Allergy shotsAllergy treatments
T1 10.0 InjectionsIncludes:
HormonesVitaminsEstrogenAntibioticsIron
Excludes:Immunizations (X400.0)Vaccinations (X400.0)Inoculations (See X400.0)-----
POISONING AND ADVERSE EFFECTS
E900.O Accidental poisoningIncludes:
Food poisoning, ingestion ?f potentially poisonous food products ‘Accidental ingestion of:Household productsChemicalsDrugs
299

Figure 6- Continued
E905.O Adverse effect of medicationIncludes:
AllerW to medicationPenicillin allergyAnaphylactic shockBad reaction to prescribed medication
E91O.O Adverse effect of drug abuseIncludes: .
Overdose, intentional or unintentionalCombinations of drugs and alcoholIngestion of drugs for non-medicinal purposes
E915.O Adverse effect of alcoholIncludes:
IntoxicationDrunkAcute intoxication
E920.O Adverse effects of environmentIncludes:
AIr pollutionWater pollutionNoise pollutionRadiation exposure
E925.O Produce hazards
E930.O Adverse effects, other and unspecified.
(1)
(2)(3)
review and comments by 13 professionalassociations;review by a panel of 10 M.D.’s; ,andresults of a major coding experiment.
Copies of the code and an alphabetical index will beavailable from the American Medid Record Asso-ciation (send requests to Linda Appleton) in latesummer.
EXPERIMENTAL VALIDATION
Evaluation Approach
An evaluation approach and criteria for evalua-tion are covered in Schneider and Parzialez. Verybriefly, the approach is to develop a classificationsystem profile similar to a personality profile usedby psychologists. Thus the outcome of the evalua-tion is a profile that will enable potential users todecide if the classification has the characteristicsdesired based on their particular coding needs.
The profile is established through the use of 45internal evaluation criteria in a coding test (in addi-tion to the new RFV classification 6 other systemswere evaluated). The profile also includes directquantitative measures such as efficiency, specificityand consistency which are calculated from the re-sults of the coding test.
Selection of Sample for CodingTest
There were two principal issues in the selectionof the sample: 1) the sample size and 2) the charac-ter of the sample. The answer to these two ques-tions was based on the following criteria:
(1) the sample had to be large enough so thatthe coders could respond fully and knowl-edgeably to our evaluation questionnaire;
(2) the sample had to be large enough to testthe codes for consistency;
300

= .01 represents a heavily used code, ~= .001 amedium use code and ~ = .0001 a very infrequentcode. Thus fix the sample size at various feasiblelevels to examine the effect on the confidence inter-val using
(3) the sample had to be large enough to give areliable frequency distribution; and
(4) the sample had to be representative of thetotal population of NAMCS abstracts.
Statistical Concepts
The major question which arises in the selec-tion of a sample size is how large does the samplehave to be for the statistical estimates to be reliableindicators of the entire population. In addition toestimating the sample mean one must also estimatethe sample variance so that confidence intervals canbe placed on the sample mean.
To estimate the probability p of an abstractbeing coded into some particular code, proceed as
- follows:
Prob (x abstracts coded in a particular code outof n samples) =
Percentage error (~= .05) -
$.= .01 p= .001
T
O= .0001
200 625143 446100 312
82 25562 195
n
100020004000600010000
6244’31.2520
Note that the above table lists relative errors—theabsolute errors are quite small as ~ decreases. Thistable shows that we have to accept relatively large re-lative errors in the coding test.f n)
(x) p“ (1-p)”-’
where
()
n .‘x
~!
x! (n-x) !
Sample SizeThere were two different factors in selecting
the sample size: the consistency check and the fre-quency distribution.
The coding pretest indicated that two or threehundred abstracts were sufficient to give the codersadequate background to fill out the evaluationforms. As is shown below, this number is less thanwas needed for any other sample size criteria—thusit was not a formative factor in the sample sizeselection.
For the consistency check, it was felt that about
500 abstracts were needed to get an adequate crosssection of medical s ecialties, areas of die country
&and time of year. If p represents the prop-ortion oftime 3 coders come to the same coding decision onan abstract, then the equation for E can be used(for n = 500) to calculate the confidence intervals:
and x is a random variable that can only assumeinteger values. Here we are considering n inde-pendent repetitions of a simple success-failure expe-riment. The probability of success, p, is given by thebinomial distribution as noted above. The probabili-ty of failure is (l-p).
The expected value of x, E(x), can be shown to beE(x) = np and the variance of x, V(x), can beshown to be V(x) = np(l-p). When is very largewe can use approximations for the distribution ofp, the estimate of p. (Note: although a large n al-lows this approximation, the fact that p maybe veryclose to zero causes this to be somewhat inaccurate,However all that is desired here is a “ballpark” esti-mate.) Note that (for the present NAMCS code) p
FIGURE 7 - PERCENT VISITS CODED IN EACH MODULE AS AFUNCTION OF SPECIALTY.
M(
x
ULES
TSPECIALTY s D E R A u
GP/FPIMPED.OTHER MED.GEN. SURG.OB/GYNOTHER SURG.PSYCHOTHEROUTPATIENTER
60.859.854;472.3
.52.235.654.681.159.630.443.6
11.018.54.0
13.810.14.410.94.234.031.82.1
11.710.625.26.29.4
49.69.41.42.1
22.01.4
5.43.87.34.8
19.35.9
14.010.5
2.111.4
1.7
5.3.5
4.51.05.7
.46.02.8.01.2
48.0
.2
.5
.0
.7
.2
.4
.0
.0“ .02.1.14
2.81.32.2.01.1.0.4.0.0.0.0
2.84.92.4
1.02.03.64.7.0.0
3.12.6
301

1) if~= .95 then e= .02
2) if fi=.8 then ~ = .04
Thus a sample size of 500 will give very accuratepredictive results for the consistency check.
The coding test for the revised NAMCS wasused to eliminate codes that are infrequently used.Thus a good estimate of the frequency of infre-quent codes is required. Reference to the prior ta-ble of relative errors shows that even at 10,000 ab-stracts the relative errors are high for infrequentcodes.
The table also shows that dropping down to6,000 abstracts would lead to little loss of informa-tion (this is because the relative error is inverselyproportional to the square ro~t of n). Thus the de-cision was made to code 6,000 abstracts. This quan-tity is sufficient to drop out the most infrequentcodes with a high degree of confidence, and repre-sents a trade off between practicality and informa-tion loss.
Sample Character
The sample of 6,000 abstracts was chosen bystratifying the sample on three levels: by medicalspeciality, time of year, and region of country. Wedecided to use approximately 10 abstracts per phy-sician which led to sampling about 600 physicianfiles.
The proportion of physicians by medical spe-cialty and region of the country selected for thesample was the same as the 1974 NAMCS survey.Each of these physician sample sizes was then splitinto 4 parts (with rounding to nearest integer) tofind the sample size by season of the year.
In summary, the sample of 6,000 was not cho-sen randomly from all NAMCS abstracts but wasinstead chosen proportionately to the entire surveybased on M.D. specialty, region of country and sea-son of the year.
In addition data was obtained from othersources for visits to emergency rooms and hospitaloutpatient clinics. Approximately 1000 patient visitshave been coded thus far and this part of the testisstill in progress.
RESULTS FROM CODING TEST
Consistency Check
The consistency check was run by having threeR. R.A.’s code 500 abstracts independently and thencounting the number of disagreements (if all disa-greed it was counted as 2 errors - which assumesone of the. three is correct). Accuracy was lower302
than would normally be expected since in all casesthe coders had never used the classification systembefore (except for a 4 hour training session), Theresults showed that the new RFVCS was 50 percentto 300 percent more consistent than the other sys-tems tested. It should also be noted that the coderscoded at a rate of about 120 abstracts per hour inthe new system versus 40-60 per hour in the othersystems. Both of these factors are somewhat relatedto clarity of the rubrics and index, but are probablymore highly related to the modular structure of thecode.
Frequency Distribution
All of the data from the coding test were com-puterized and many different frequency distribu-tions were computed. The major questions to beanswered by the frequency distributions and theresults are summarized below.
Infrequent Codes.—Out of 433 codes, 47 wereeither dropped or combined as a result of hav-ing a projected frequency of less than one in10,000 visits.Catch all plus uncodable.—The percentagedropped from 15.1 percent in the originalNAMCS symptom classification to 7.5 percentin the new RFVCS. The computer program isbeing used to print out all data falling in thecatch all codes - this will be used to add codesor add inclusions to codes. The targeted resultsare to decrease these categories to 3-5 percent.Most frequent codes.—The computer programis being used to print out all the data coded inthe 35 most prevalent codes. This analysis willshow whether the data is specific enough toallow these codes to be expanded and hencegive more specific output.Specialties.— Frequency distribution by medicalspecialty has also been tabulated. Two keypoints were monitored:(1) how many codes are used by data from that
specialty; and(2) how many codes are represented in the top
50 percent of data.
This information partially demonstrates whether ornot the code adequately covers a given specialty, Asa result of this analysis codes in all specialties ex-cept OB/GYN and psychiatry were found to be spe-cific enough.
Emergency room/Outpatient.—In the samefashion as the specialties, an analysis showedthat the new RFVS adequately covered theemergency room and outpatient data,Modules.—An analysis of percentage of patientvisits by module and specialty is listed in Figure

~
‘7.This figure shows that the modules do showdistinct differences in the types of patient visitsto the various medical specialties.
,Grouping data by body system frequently fails topoint out these differences. The major differencesindicated by the modular approach can be summa-rized as
(1)
(2)
(3)
(4)
(5)
(6)
(’7)
. .foliotvs:
OB/GYN and outpatient have very lowsymptom reporting while psychiatry is quitehigh;Internal medicine reports high use of diag-nostic terms while pediatrics, OB/GYN,psychiatry and ER are very low;pediatrics, OB/GYN and outpatient reportheavy use of diagnostic, screening andpreventive procedures;surgery reports heavy use of therapeuticprocedures;all areas report low use of injuries and ad-verse effects except the ER which shows 48percent;adequate data to test the R module was notincluded in the sample; andadministrative reasons for visit were underreported due to data collection procedures.
CONCLUSIONS
A methodology has been developed for the de-sign of medical classification systems. In addition,an evaluation approach and evaluation criteria havebeen formulated. The methodology and evaluation
approach have been successfully used in the devel-opment of a new reason for visit classification sys-tem, This classification was developed to replace thepresent NAMCS symptom classification, but it canbe used in any ambulatory care setting.
The major features of the new classificationsystem are (in relation to the present NAMCScode):
(1)(2)(3)(4)(5)(6)
(7)
(8)
ER and outpatient is covered in the code;higher consistencyhigher specificity and accuracy;output more related to data needs;output is more relatable to other data sets;classification will probably be more widelyused;catch all plus uncodable entries have beenreduced by 50 Percent; andspecialties are more fully covered.
In addition the speed of coding in the new systemwas two to three times as fast as any other systemtested (120 asbtracts per hour).
REFERENCES
1.
2.
3.
4.
5.
6.
7.
8,
9.
10.
11.
12.
13.
14.
15.
16.
Schneider, D. and Parziale, A., 1976. A Survey andAnalysis of General Purpose Medical ClassificationSystems. In preparation.Schneider, D. and Parziale, A., 1976. Development ofMedical Classification Systems for Productivity Analy-sis. Proceedings, Seventh National Conference of theHospital and Health Services Division of A. I. I.E., Col-orado Sp,rings. Colorado Springs, Colorado, Feb.1976.Sokal, R. B., 1974. Classification: Purposes, Principles,Progress, Prospects. Science 185, (Sept.), pp. 1115-1123.Beckner, M., The Biological Way of Thought, Colum-bia University Press, New York City, 1959.Feter, R. B. Thompson, J. D., and Mills, R. E., 1975.A System for Cost and Reimbursement Control inHospitals. Unpublished paper at Yale University.Over, A. M. and Smith, K. R., 1975. The Estimationof the Ambulatory Medical Care Production FunctionWhere Output is an Unobservable Variable. Presentedat the Econometric Society World Congress, August1975, Toronto, Canada.Eighth Revision International Classification of Diseas-es, Adapted For Use in the United States, 1968. Public”Printing Office.Tyroler, H. A., 1969. The Classification of Disea=e inthe Proceedings of Conference on Conceptual Issuesin The Analysis of Medical Care Utilization Behavior,M. R. Greenlick, Ed. Oct. 1969, Portland, Oregon.Bohrod, M., 1971. What Is a Pathologic Diagnosis? APrelude to Computer Diagnosis. Pathology Annals 6pp. 197-208.
Boulding, K., 1964. General Systems As a Point ofView, In Views of General Systems Theory, MihajloD. Mesarovic, Ed. New York: Wiley.Weinberg, G. M., 1975. An Introduction to GeneralSystems Thinking. New York: Wiley.Renner, J. H. and Bauman, Ea.. 1975. Problem Spe-cific Coding Systems. The Journal of Family Practice2, pp. 279-281.Schneider, D. P. and Kilpatrick, K. E., 1974. A Medi-cal Classification System for Ambulatory Care Man-power Planning. Health Services Research 9, Fall, pp.221-233.Bain, S. T. and Spaulding, W. B., 1967. The Impor-tance of Coding Presenting Symptoms. CanadianMedical Association Jour~al, 97.Renner, J. H. and Piernot, R. W., 1973. Modificationand Extension of the Hurtado and Greenlick Symp-tom Classification System. Health Services Research 8:pp. 151-153.
Meads, S. and McLemore, T., 1974. The NationalAmbulatory Medical Care Survey: Symptom Classifi-cation. DHEW Publication Number (HRA) 75-1337.
303

CHAIRMAN’S REMARKS-NATIONAL AND STATE PROGRAMS INABORTION REPORTING AND STATISTICS
Melvin S. Schwartz, M. D., Assistant Commissioner for Biostatistics, New York City
Department of Healti, New“York, New York
We are here today to discuss NationaJ andState Programs in Abortion Reporting and Statis-tics. Whatever views are held about abortions, therehas been in the 197’0’s a steady increase in thenumber of abortions legally performed in the Unit-ed States and this makes urgent a reporting systemwhich will allow nationwide figures to be accumulat-ed, collated, and analyzed. We have a distinguishedpanel with us to discuss various aspects of abortionreporting and statistics; they are: Mr. John E. Pat-terson, Mr. Jack C. Smith, Miss Marian Martin, andDr. Alan R. Hinman.
Before turning the session over to them, Ishould like to trace a blt of abortion-reporting his-tory from the standpoint of the New York CityHealth Department from which I come.
On April 10, 1970, the New York State legisla-ture passed a law which made abortion legal if thewoman consented and if the abortion was per-formed by a licensed physician widtin 24 weeks ofcommencement of pregnancy. The law made nostipulation concerning residency. It went into effecton July 1, 1970.
Between the date of passage and the date ofeffect, the City Health Department designed andhad ready a certificate for the Confidential Reportof Termination of Pregnancy (Top) for 24 weeks orunder. The certificate contained 16 items of infor-mation and was supposed to be filed within 48hours after termination. It provided informationregarding the number of abortions, weeks of gesta-tion, reason for termination, age and parity of thepatient, and whether a previous termination, eitherspontaneous or induced, had occurred and the dataof same. The mode of termination, the facilitywhere termination took place, and the legal resi-dence of the patient were also recorded. Due inpart to the great haste with which this certificatewas prepared, and in part to the expressed needfor a compact form to secure full cooperation, in-formation on complications was omitted from itsformat. A separate weekly reporting system wastherefore initiated to obtain data on the methods oftermination and types of complications, if any,under a special report form which was forwardedto the Department of Health by each facility per-forming abortions. In addition to these forms, anduntil July 1, 1973, the municipal hospitals provideda daily telephone report on abortions performed.
In January 1972, the Certificate of Termina-tion of Pregnancy 24 weeks or less was revised to304
include the necessary data on complications. as well, 1
as information on psychiatric, social, and ethnicstatus; indications for termination and stipulation oflength of stay were also included, This form contin-ues in use to the present time and now contains 21items. me separate weekly reporting system forcomplications has also been continued and serves asa check on the accuracy of reporting and filing ofthe TOP certificates. In general, these ancillaryweekly reports provide a certain amount of currentinformation compared to that derived from thedetailed certificates which must be revised periodi-cally due to occasional problems of late filing. Thenumber of estimated abortions reported by the Citynaturally does not include those abortions neverreported at any time - for example, those whichmight be performed at a private physician’s officeor “other facility” which is unknown to the HealthDepartment. The estimates published by the CityHeal.fi Department are thus generally conservativefigures.
Shortly after the New York State legislation waspassed, the Obstetrics Advisory Committee to theCommissioner of Health for the City, a group ofleading obstetricians and gynecologists in New YorkCity, formulated a set of starrdards for the perform-ance of abortions. Subsequently, these recommen-dations formed the basis for the development ofArticle 42 of the New York City Health Code, ThisArticle defined where abortions could be per-formed. If over 12 weeks gestion, abortions must beperformed in hospitals; abortions in cases of 12weeks or less gestation could be done in clinics ofthe hospitals or in special non-hospital (free-stand-ing) clinics, provided these were located and affiliat-ed with a nearby hospital, and met all other re-quirements. It should be noted that according tothe Health Code, the Certificate of Termination isclassified as a Confidential Medical Report and isnot open to inspection or subject to subpoena - aposition which has been successfully established inthe Courts by the legal division of the Departmentof Health.
With the implementation of this data collectionsystem, regular reporting on the abortion experi-ence of New York City has come from the CityDepartment of Health: there are routine weeklytabulations and routine six-month tabulations, thelatter leading to special bulletins on complications,mortality rates, and so on. From these, in turn,formal publications have resulted, Some of the

,
,.
papers which have been written based on this sys-tem of data collection and analysis have reportedon the first year’s experience, July 1, 1970 to June30, 1971 with abortion reporting in New York City,and subsequently on the 18-month, the 24-month,the three-year, and most recently, on the half-de-cade of experience. Prominent among the investiga-tors who have analyzed and reported on these dataare Jean Pakter, Frieda Nelson, Martin Svigir,Donna O’Hare, and David Harris. A study of “Re-peaters of Abortion” has also been published.
Aborkon procedures which dispose to complicationsand mortality have been uncovered; at least onehospital in the City has been closed, partially in
Iresponse to the complication and mort;lity fig”uresrevealed in the abortion reporting system. Inciden-tally, it is estimated that in the whole of New YorkState, approximately ’75percent of the abortions per-formed are carried out in the City as compared to 25percent for the rest of the State. ‘ ‘
Finally, a few summary figures may be in or-der: In the first year of the new legislation, therewas a total of 139,042 reported terminations in theCity, of which 37 percent were performed on resi-dents and 63 percent on non-residents. In fiscalyear 1974, a total of 125,175 terminations was re-ported of which 82,096 or 66 percent were report-ed for residents and 34 percent were reported fornon-residents. These figures reflect the fact thatsince the 19’73 Supreme Court decisions, the num-ber of non-resident abortions has declined in theChy, while the number of resident abortions hassteadily increased; it is estimated that at the present. .
time almost one in five female City residents ofreproductive age has obtained’ one legal abortion inthe last five years. The figure of 82,096 residentabortions cited above for 1974 may be compared tothe figures, also for 1974, of 110,642 live births,2,848 spontaneous fetal deaths, and 79,846 totaldeaths reported in the City. As of May 1976, an es-timated grand total of 950,067 terminations havebeen performed since the legislation went into ef-fect July 1, 1970.
References1,
2.
3.
4.
Legal Abortion 1970-1971- The New York Chy Expe-rience, Harris, D.; OHare, D.; Pakter, J.; and Nelson,F.G. AJPH 63 (1973); 409-418.An 18 Month Experience in New York Chy with theLiberalized Abortion Law. Fakter, J. New York Medi-cine - September, 1972Impact of the Liberalized Abortion Law in New YorkChy On Pregnancy Associated Deaths - A Two YearExperience, Pakter, J.; OHare, D.; Helpern, M.; Nel-son, F. - Bull. N.Y. Academy Med. 49 (1973): 804-818.Two Years Experience in New York City with the Lib-eralized Abortion Law - Progress and P~oblems - Pak-ter, J.; OHare, D.; Nelson, F.; and Svigir, M. AJPH 63(1973): 524-535.
5. A Review of Three Years’ Experience With LegalizedAbortions in New York Chy (from Inception to SixMonths after the Supreme Court Decision) Pakter, J.Excerpts Medics 9 (1974); 8-20.
6. Legal Abortion: A Half Decade of Experience, Pakter,J.; Nelson, F.; and Svigir, M. - Family PlanningPerspective 7 (1975): 248-255.
305

NCHS PLANS FOR ABORTION REPORTING
Mr. ]ohn E. Patterson, Director, Division of VitA Statistics, National Center for HealthStatistics, Rockville, Maryland
Before I describe the National Center fo,rHealth Statistics’ plans for establishing an abortionreporting system, it might be useful for me to re-view as briefly as possible the legal status of abor-tion and abortion reporting in the United States.
Until Colorado liberalized its abortion law in1967, all State laws were essentially the same, per-mitting abortion only to save the life of the preg-nant woman. From 1967 through 1972, however, asubstantial number (16) of othdr States modifiedtheir laws to permit the induced “termination ofpregnancy for reasons other than the preservationof the life or health of the woman. In most cases,these laws followed the American Law Institute’sModel Abortion Law and required the reporting ofthese terminations of pregnancy.
In 1969, the Center for Disease Control (CDC)began its abortion reporting program by collectingdata on legally induced abortions from four Statesthat had liberalized their abortion laws and, on thebasis of these data, CDC compiled its first annualAbortion Surveillance Report. This reporting sys-tem graduaRy expanded and developed rathersmoothly until January 1973, when the U.S. Su-preme Court declared that the States could not in-terfere with induced terminations of pregnancyduring the first two trimesters; in other words, thedecision to terminate a pregnancy was to be madeby the pregnant woman and her physician. Thisdecision, however, did not require or even mentionthe reporting of induced abortions.
Following the Supreme Court’s decision, therewas a very rapid increase in the nuniber of legallyinduced abortions throughout the United States,but the response in terms of reporting was muchslower and varied greatly among those States thatdid establish new reporting requirements. It soonbecame very clear that there was an urgent needfor improved reporting of abortions, and in parti-ctiar, there was a need for the development of na-tional standards for such reporting. This need wasrecognized by a number of organizations, such asthe American Public Health Association, the U.S.National Committee on Vital and Health Statistics,and the Hauser Committee to Evaluate the NationalCenter for Heahh Statistics.
Early in 1974, CDC and NCHS agreed to a di-vision of responsibility in an effort to improve thequality of abortion reporting in the United States.Under the terms of this agreemei~t, States wouldbegin reporting base-line statistics on legal abortionsto NCHS rather than to CDC as soon as they could
meet NCHS reporting standards similar to thosefor o’&er vital events. Until States met NCHS stand-ards, however, they would continue to report datato CDC on an interim basis.
In 1972, NCHS established two very importantTechnical Consultant Panels with responsibilitiesrelating to abortion reporting: one to recommendrevisions in the Model State Vital Statistics Act andanother to recommend revisions in the U.S. Stand-ard Certificates.
The Technical Consultant Panel (TCP) on theModel State Vital Statistics Act is chaired by DonaldJ. Davids of the Colorado State Health Departmentand is now completing the last draft of its recom-mendations. Section 16 of the TCP’S draft of theModel Act indicates their thinking with regard toabortion reporting:
(a) Each induced termination of pregnancywhich occurs in this State shall be reported to the(Office of Vital Statistics) within five days by theperson in charge of the institution in which theinduced termination of pregnancy was performed.If the induced termination of pregnancy was per-formed outside an institution, the attending physi-cian shall prepare and file the report.
(b) The reports required under this section arestatistical reports to be used only for medical andhealth purposes and shall not be incorporated intothe permanent official records of the system of vitalstatistics. A schedule for the disposition of thesereports shall be provided for by regulation.
The Technical Consultant Panel (TCP) on the Revi-sion of the U.S. Standard Certificates included aSubcommittee on Fetal Death Certificates which waschaired by Robert G. Webster who was formerlyChief Deputy Director of the California StateHealth Department. It also included Marian Martinof Oregon, Vito Logrillo of New York, Robert L.Liljegren of Colorado, Donald J. Davids of Colora-do, and Dr. Ralph A. Franciosi of the Children’sHealth Center, Minneapolis, Minnesota. In addi-tion, major contributions were made to the work ofthe Subcommittee by Dr. R.T.F, Schmidt of theGood Samaritan Hospital, Cincinnati, Ohio, whowas Chairman of the Maternal and Child CareCommittee of the American MedicaI Association,and Jack Smith of CDC.
Because of differences in the types of dataneeded for spontaneous fetal deaths, on the onehand, and induced terminations of pregnancy, onthe other, the TCP recommended two separate
,
306

forms for spontaneous fetal deaths and inducedterminations. They also recommended that both ofthese forms be legally required confidential statisti-cal reports rather than certificates. The U.S. Stand-ard Report of Induced Termination of Pregnancy(Figure 1) which the TCP recommended wascleared by the Office of Management and Budgetlast week, so we will be recommending the adoptionof this form to the States effective January 1, 1978.
The form includes items on the age, race, mar-ital status, educational attainment, and place of resi-dence of the patient as well as the number and typeof terminations of previous pregnancies. It dsoprovides information on the place of the pregnancytermination, the type of facility, the type of proce-dures, complicatio~s (if any), and the length of ges-tation. . .
We hope that these items will provide consider-able data needed to:
1. Assess the health implications of abortions;2. Plan for, provide, and improve facilities,
services, and training in relevant maternalhealth and family planning areas;
3. Determine the impact of abortion upon thebirth rate;
4. Evaluate the effectiveness of family planningprograms; and
5. Identify groups of women who may needalternative means of family planning.
We plan to establish our new Abortion ReportingArea by collecting 1977 data “from five States, work-ing through the Cooperative Health Statistics Sys-tem. We will be receiving the data from the Statesin the form of magnetic data tapes with quality con-trol standards similar to those for other vital events.The five States are Kansas, Nebraska, Upstate NewYork, Oregon, and Vermont. In 1974, these fiveStates reported a total of 65,000 legal abortions,
accounting for about 9 percent of the total reportedto CDC. This may seem like a very small propor-tion, but it is a start, and we hope to expand thereporting area rapidly in subsequent data years.
The five States that we are starting with wereselected on the basis of two criteria:
1.
2.
Each of these States has already successfully im-plemented the Vital Statistics Component of theCooperative Health Statistics System in the areaof births and deaths; andThese States currentlv seem to come closest tomeeting the reporting requirements of NCHSboth in terms of reporting completeness and interms of the data items that are included on thenew standard reporting form.
We know that we will not be collecting data on eachof the items on the new form from all of the fiveStates during the 1977 data year. None of the fiveStates has all of these ‘items on its current reportingform. However, beginning with the 1978 data year,we hope that each of these five States as well as allnew States entering the Abortion Reporting Areawill adopt all of the items on the form. Beginningwith the 1978 data year, this recommended Stand-ard Reporting Form will constitute the minimumbasic data set on abortions for the CooperativeHealth Statistics System.
Finally, let me briefly mention the ways inwhich we will release the data we collect. The basicdata will be published regularly in special supple-mental issues of our Monthly Vital Statistics Report,and more detailed descriptive or analytical reportswill be published in our rainbow series. Within twoor three years, we would also expect to develop anannual public-use data tape similar to those forother vital events.
307

uoco
;
TYrEon ::!NT
rEfly.4:s NT
St EKANry/OK
INSTRUCTIONS
r 7U. S, STANDAIID
REPORT OF INDUCED TERM:-NATION OF PREGNANCY STAIC VILC Nuwncn
‘FACILITY-NAME 111.s1 A.,,1(.I . . rlkk. ,lw tidw”j CITY. TO&VN on LOCATION or P8Ecr4ANcv 7Enh~tMA780N COUNTY OF PnEGNANCY T< IIMINATION
1A lb. le.PA?lS,kT ILSLNTIFICATION AGE 0$ PATIENT MAnnl.sor Ich,fkt DATE OF ?IIEGNANCY TEIEMINAIION
lM..lh. ~,, V.*N
❑ YES ❑ NO11, 2b. 2C. 3.
nESIDLNC:-STATE COUNTY CITY. TOiVN Ofl LOCATION
7“’’’”’”
s, I8. Ila. ?iOw •1 ! lb. N
8A PROCEDURE THAT TYPE OF TERhllNATION P170CEOLN7ESTEllMlNA7E0 P17EGNANCY
8b, A0Di710NAL pnOcEounEs USEDFOn THIS TC6MINATION, IF ANY
ICttxcxONLY ONK) (C!tXCKALL TIIAT A??LY)
•1,.--”--- ------- -- SUCTION CURET’TAGE ----------------c1
•1-----------------SHAR? CURETTAGE ----: ------------
•1
D .0----------- +NTRA-LITEoINE SALINE ,NST, k~’l,oN -----------,
❑ --------- lNTllA-ulg RINE pnosTAGMrlOIN IN$TILUTlON ---------
a
•1--.----- -------- --Hy$~~”oT~” ---------------- -. ❑
•1----------------- HYCTEn ECT0A4Y -------- q--------
•1
•1 ---------4THER,,,,,,&, -------- -- •1In ------------------- UNKNOWN -------------------- l-l
Iu u
DATE L*ST NO flMAL MEySES LIEGAN (Mo”,h. D9v. Y,ej PUVSICIAN’S ESTIMATyOF GESTATION
NAME OF ATTEMOINO PHYSICI
I
c1 7c. Nom oII Id. NOM n
8, COMPLICATIONS Of PllEGNANCYTEflMIN&TION
(C##SCK4LL TIIA7 ArtLY)
•1
•1
c1
•1
‘cl
❑
•1
NONS
liEM~llISHAOC
INFECTION
UtEfllNE ?ERFOIIATION
CfaVICAL LACERATION
flETAINEO PnOWCT8
OTNCR (S,,clrsl
10. I 11. W“k, 12.NAME OF PEnSON COMPLETING flEPORT mm .,,H.u

THE PUBLIC HEALTH NEED FOR ABORTION STATISTICS: THEVIEW FROM THE CENTER FOR DISEASE CONTROL
Mr. Jack C. Smith, Chief, Statistical Services Branch, and Willard Cates, Jr., M.D., ActingChief, Abortion Surveillance Branch, Family Planning Evaluation Division, Bureau of Epi-demiology, Center for Disease Control, Atlanta, Georgia
The Department of Health, Education, andWelfare’s Health Statistics Plan of November 1975states that the Center for Disease Control (CDC)has the responsibility for collecting statistics andconducting surveillance on preventable diseases andconditions; Under the p’urv;ew of this mission, pre-venting morbidity and mortality associated with le-gally induced abortion is an objective of CDC. Our-.abortion surveillance ~ro~ram has three activities:1) compiling medicaf arvd demographic data onwomen having induced abortion in the UnitedStates, 2) coordinating a multicenter study to deter-mine morbidity risks associated with abo’rtion, and3) conducting epidemiologic surveillance on abor-tion related deaths to assess their preventability.
Before describing each of these components ofour abortion activities and how it relates to the~ublic health need for abortion’ statistics. a few1
statements about health statistics in general are inorder. The question has been raised as to why abor-tion statistics should be comDiled. The answer lies.not so much in justifying why abortion statistics areneeded, but rather in determining why statistics areneeded on any condition which- mi~ht affect thepublic’s health,’be it anthrax or accide;ts, asthma orabortion. We feel that health statistics are essentialfor 1) identifying healfi problems, 2) assessing themagnitude of these problems, and 3) making- rec-ommendations for eliminating them. In. the absenceof accurate, complete, and timely health statistics,there is little basis for rational decision-making onthe effectiveness and efficiency of either preventiveor therapeutic health care.
CDC collects many health statistics throughepidemiologic surveillance. In recent years the ter-mepidemiologic surveillance has been broadened toinclude the collection, analysis, and dissemination ofinformation related not onlv to “infectious diseases,but also to diverse public health concerns such asair pollution, cancer, birth defects, and abortionmorbidity and mortality. Surveillance at CDC usual-ly includ’es two modes’ of gathering data: case re-porting and case investigation. The abortion-re-porting activities conducted by CDC help to identifyabortion-related morbidity and mortality and todescribe the Modulation at risk of this morbiditv.and mortality: base investigations provide epide-miologists with data to make judgments about thepreventability of abortion-re~ted morbidity and
mortality. This abortion surveillance frameworkprovides the basis for monitoring and controllinghealth problems related to abortion.
Historically, there has been a paucity of data onabortion in the United States. In” 1955 experts couldprovide only a “best estimate” that between 200,000and 1.2 million illegal abortions a year were per-formed in the United States. For almost 15 yearsthis wide range remained the most reliable figureon the magnitude of abortion. In 1967 a survey inNorth Carolina corroborated the 1955 estimate byindicating that if abortion practices in that Statewere extrapolated to the entire country, approxi-mately 800,000 induced abortions were performedeach year. While most abortions were performedillegally, collecting accurate health statistics on thisclandestine procedure was virtually impossible. In1967, however, with the first liberalization of aState’s abortion law, induced abortion became anacceptable and legal medical procedure, carryinghealth risks that needed to be assessed. At this timeCDC initiated its first abortion activity: compilingmedical and demographic data on women havinglegally induced abortion.
In 1969 with the cooperation of the Statehealth departments in 4 states that had liberalizedabortion laws, CDC published its first annual Abor-tion Surveillance Report. Fewer than 25,000 legallyinduced abortions were reported for 1969. The lat-est annual report (for 1974) shows that more than750,000 abortions were reported to CDC from 50States and the District of Columbia. ~ls numberplaces legally induced abortions among the mostcommon medical procedures performed in theUnited States.
In general CDC relies on the central healthagency in each State to collect data on abortions or-curring in that State. For the 10 States that current-ly do not collect statewide data, CDC receiyes vol-untarily reported abortion data directly from hospi-tals and facilhies.
As John Patterson has indicated in his presen-tation, CDC and the National Center for HealthStatistics (NCHS) are working toward having abor-tion data collected as a part of- the vital statisticscomponent of the Cooperative Health Statistics Sys-tem (CHSS). If this is accomplished, CDC will re-ceive statistical information from NCHS” rather thandirectly from States.
309

The second activity of CDC’S abortion surveil-lance program is coordinating a multicenter studyto determine morbidity risks associated with abor-tion. The purpose of this study, referred to as theJoint Program for the Study of Abortion/CDC(JPSA/CDC), is to study prospectively the earlymedical complications of abortion. The predecessorof this study, the Joint Program for the Study ofAbortion (JPSA), was conducted in 1970 and 1971by the Population Council under the direction ofDr. Christopher Tietze. In 19’71 the study wastransferred to CDC to continue the initial research.Since September 1971, when data collection beganat CDC, CDC has collected detailed clinical data onmore than 80,000 induced abortions performed inmore than 30 institutions throughout the UnitedStates, using a variety of abortion procedures andpatient management protocols. Analysis of thesedata is in progress.
Some of the initial findings currently being dis-cussed by CDC and the medical community maysignificantly alter the performance of abortion. Forexample, one finding published in the 1974 Abor-tion Surveillance Report shows that through the20th week of pregnancy dilatation and evacuationmethods had lower complication rates than alterna-tive instillation procedures. Traditional medicalpractices have called for using suction curettageonly during the first 12 weeks of pregnancy, salineinstillation only after the 15th week of pregnancy,and neither suction curettage nor saline instillationduring the 13th, 14th, or 15th weeks. The JPSA/CDC findings suggest that morbidity would be re-duced if mechanical methods were used not onlyduring the first 12 ‘weeks, but also as an alternativeto saline instillation through the 20th week of preg-nancy.
The third activity of our abortion surveillanceprogram is concerned with abortion-related mortali-ty. Again, the central health agency in each Statenotifies CDC of abortion-related deaths reported tothe Vital Statistics or Maternal and Child Healthsections. Additional abortion-related deaths havecome to the attention of CDC from such sources asState medical or hospital associations, publishedcase histories, State maternal mortality committees,and reports from other Federal agencies. CDC thencontacts State health agencies and/or the attendingphysician to verify and expand clinical details ofeach death.
Abortion-related deaths are classified at CDCaccording to the-type of abortion: spontaneous, le-gally induced, illegally induced, or classificationunknown. The 1974 abortion mortality data pub-lished in the annual Abortion Surveillance Reportshows that 48 women died of complications of abor-tion in 1974 as compared with 56 in 19’73. Legalabortions accounted for 24 of the 48 deaths in
1974, illegal abortions 5 deaths, and spontaneousabortions 18 deaths, One death was classified astype of abortion unknown. The death-to-case ratefor legal abortions is approximately 3 deaths per100,000 abortions.
There are other broad areas of public healththat are affected by legally induced abortion. Thetrue effects of abortion on health can be quantifiedonly if there are adequate statistics for anaiysis.
me most important public health area affectedby abortion is maternal mortality. Abortion-relateddeaths historically have been a major cause of ma-ternal mortality in the United States. From 1950until mid-1960 no decline in abortion-related deathsoccurred even though maternal mortality from oth-er causes decreased substantially. After 1965, as thenumber of legal abortions increased each year, ma-ternal mortality due to abortion declined faster thanmaternal mortality due to all other causes; the de-cline was greatest for deaths from illegal abortions.Furthermore, national data have helped define thePreventable factors associated with abortion mortali-&. Data show, for example, that the risk of deathassociated with abortion increases with the length ofgestation. ,
Com~lications from abortion have been studiedbv manv’different facilities as a means of assessing.the quaiity of medical care. Because definitions o~abortion complications are not uniform. it is oftendifficult to ~btain comparable mor~dity data.Moreover, because the degree of followup of post-abortion patients varies, only the immediate effectsof the procedure are usually known, While thelong-term effects of abortion in the United Statesare lar~elv unknown, studies from other countriessugges~ tfiat premature childbirth may occur morefrequently to women who have undergone abortionthan to women who have not. Because of the wide-spread use of abortion in the United States, thedelayed and long-term effects of abortion should beassessed.
Infant mortality and the incidence of congeni-tal malformations may be favorably affected byabortion because of the characteristics of the Do~u-
‘
lation receiving abortions. National data sho~ thatthe abortion-to-live-birth ratios are highest forwomen in the oldest and youngest age groups.These are the women most likely to have pregnan-cies that result in infant deaths and/or congenitalanomalies- Also, by reducing the number of un-wanted pregnancies, abortion< probably reduce theincidence of child abuse and abandonment.
That legal abortions have affected birth pat-terns throughout the country has been inferred
from changing trends in the Nation’s fertility overthe past decade. The number and characteristics ofwomen undergoing abortion can be compared withlive-birth data to assess the influence of abortion on
310

various parameters associated with fertility. Theimpact of abortion on childbearing patterns has hadan immediate effect on he~th-care delivery in thespecialties of obstetrics and pediatrics, and over thelong term may affect other medical specialists aswell.
By using abortion statistics as an indicator ofthe number of unwanted pregnancies, State andlocal health agencies should be able to plan betterfor the delivery of family-planning services.Although effective contraception can prevent un-wanted pregnancies and reduce the need for wom-en to seek abortion, contraceptive failures still oc-cur. Thus, it is not reasonable to assume that prov-iding family-planning services will completely elimi-nate the need for abortion.
With wider acceptance of abortion by theAmerican public, statistical data are needed morethan ever in planning for and delivering abortionsas a health service. Abortion statistics have alreadyplayed a major role in defining the quantity ofservices that will be required in this country and thecharacteristics of the women who will be requestingthese services. One of the most important effects ofthe 1973 Supreme Court decision on abortions wasto redistribute abortion services into many Statesthat previously had few or no abortion services.Between 19’72 and 1974 the percentage of out-of-State abortions declined nationally from 40 percentto 10 percent. National data allowed prediction ofwhich States would be faced with the greatest de-mand for abortion services.
In 1973 the hospital facilities in this countrywere inadequately prepared to cope with the in-creased demand for abortion. In response to thisdemand a large number of private outpatient abor-tion clinics were formed, predominantly in urbanareas, to perform first-trimester abortion proce-dures, However, the quality of care delivered bythese new outpatient facilities is variable. Statisticson abortions performed by these different facilitiesare needed for health agencies to evaluate the qual-ity of abortion services being provided.
Abortion statistics have served as the basis forimportant legislative and judicial decisions that havehad national and local impact. One example was thedecision of the Georgia Legislature not to overturnthe reform abortion legislation passed in that Stateafter the Supreme Court decision. Two of the mainfacts made available to the legislators in their delib-erations were that thousands of Georgia residentshad received abortions outside the State before lib-eralization of the Georgia law in 1973 and that thepercentage of Georgia residents receiving abortions -out of State dropped from 70 percent in 1972 to 10percent in 1973. Data on geographic distributionhave been presented to legislators in other States toemphasize the health risks to residents who mustleave the State to receive abortion services.
The importance of abortion statistics was alsostressed in the 1973 Supreme Court decisions ofRoe vs. Wade and Doe vs. Bolton, and in a subse-quent Supreme Court decision in November 1975, ‘which ruled that non-physician abortions are unlaw-ful. In these decisions the court based its verdict onthe relative safety of first-trimester abortions, sec-ond-trimester abortions, and normal term births.Without adequate documentation of the compara-tive risks facing a woman with an unwanted preg-nancy, the Supreme Court could not have preparedan informed decision.
Another example of the use of abortion statis-tics in the judicial process was the July 1976 case ofPlanned Parenthood of Central Missouri vs. Dan-forth. In that case one of the central issues was therelative safety of saline abortions after the 12thweek of pregnancy as compared with other second-trimester procedures. national data on abortionmorbidity and mortality were used by the SupremeCourt to decide the case.
In summary, public health is very much a partof the abortion issue. Moral and constitutional ques-tions related to abortion may be argued philosophi-cally; however, health questions related to abortionshould be answered by sound epidemiologic reason-ing based on adequate abortion statistics.
,
311229-121 0-77-21

ABORTION REPORTING—ONE STATE’S EXPERIENCE
Miss Marian M. Martin, State Rep>trar, Oregon State Health Ditision, Portland, Oregon
It has been estimated that there are a millionlegal abortions a year in the United States. Oregonwith slightly over one percent of the populationrecorded more than 10,000 induced abortions in1975 for a ratio of about 320 induced abortions per1,000 live births or just short of one abortion forevery three live births. National 1974 figures fromthe Center for Disease Control (CDC) indicated anabortion ratio of about one legal abortion for every4 live births.
While I’m not suggesting that as Oregongoes—so goes the Nation, there are several factorsin the Oregon experience with reporting abortionthat I believe are of some general interest. Oregonliberalized its abortion law in 1969 and was at thattime one of nine States with a liberalized law. Wenow have six complete years of reports.
Prior to 1969 the Oregon Vital Records Officereceived reports of therapeutic abortion on thestandard fetal death certificate. At that time theOregon definition of fetal death required reportson all pregnancy loss irrespective of the period ofgestation—so technically all abortions were reporta-ble. However, completeness of reporting theseevents was rather questionable to say the least. Fetaldeath reporting was obviously incomplete, particu-larly for early fetal loss, and few therapeutic abor-tions were reported prior to the 1969 change inlaw.
In 1969 the legislature approved a liberalizedabortion law based on the 1968 recommendationsof the American College of Obstetricians and Gyne-cologists which allows abortion when the pregnancyresulted from felonious intercourse, and whenthere is risk that continuance of the pregnancywould impair the physical or mental health “of themother. “In determining whether or not there issubstantial risk, account may be taken of the moth-er’s total environment, actual or reasonably foresee-able.”
The Oregon abortion law had a couple of rath-er unique features that forced an immediate changein our reporting procedures. First the law providedfor reports of abortion to be made by hospitals to acentral health agency for the purpose of evaluatingthe effects of the law and it further specified thatthe” patient not be identified in this report. Oneother feature of the 1969 law that has some interestfrom the reporting standpoint was a provision lim-iting abortion to residents of Oregon. Although thisrequirement was later invalidated by the SupremeCourt decision of 1973, the Oregon reports havepretty well reflected tie abortion experience of theresident popdation.
312
Clearly the new law required modification ofour existing reporting procedures using the fetaldeath certificate, however there were few models orrecommendations on which to build our reportingsystem. Consideration was given to three approach-es. First, modify the fetal death certificate for abor-tion procedures in some manner to comply withrequirements under the law. This was an attractiveidea and several modified or short form fetal deathreports were propo;ed. However, by the time weeliminated all identification and items that obviouslywere not appropriate to the abortion procedure,there was little left. Further, and more important,the items that were remaining did not seem applica-ble to our charge to develop information to evalu-ate and monitor the effects of the law, Secondly, weconsidered having each abortion facility submit amonthly statistical summary of abortions per-formed. From a statistical standpoint this is an in-flexible system with little opportunity to explorespecific problems and changing patterns or tomodify analysisand this idea was rather quickly dis-carded,
‘The third alternative was to develop a statisticalreport form for each abortion performed thatwould protect patient identity and still provide in-formation necessary to monitor the law. This wasthe approach selected and a brief form was de-signed with limited information about the abortionprocedure, some demographic characteristics of thepatient and some administrative data relating tocertain requirements under the statute (i.e, con-sents, basis for termination). The form could becompleted in the record department and did notrequire signatures of the physician or other author-ity-there was no statement of certification,
In November of 1969 the Board of Healthadopted rules relating to hospital reporting of h-t-duced abortion and approved the report form. Theform was placed in use in January 1970 and withminor modification was used ‘until after the Su-preme Court decision of 19’73 made certain provi-sions under the Oregon law invalid. At the sametime the regulation defining fetal death was revisedto exclude induced termination of pregnancy, Be-ginning with events for 1974 the report form wasrevised somewhat, however the reporting proce-dures remained pretty much unchanged—that is, asimpIe statistical report that does not identify thepatient. .
Some items relating to administration of the1969 law that were subsequently invalidated weredropped (Basis for termination, consents, names of

consulting physicians). A few items were added tomeet recommendations of the CDC reporting pro-
~ gram or items that appeared to have some analyticvalue. These were race or ethnic group (not on theoriginal report form), items about other living chil-dren, number of previous induced abortions andwhether this pregnancy was the result of a contra-ceptive failure. In format, rather extensive use ofcheck boxes was made. This form is still in use.
From the beginning of the abortion reportingsystem excellent cooperation was received fromhospitals—initially all abortions were performed in
general community hospitals. In the first full yearof reporting (1970) 7,196 abortions were reportedto the Health Division for a ratio of 200 abortionsper 1,000 live births. Through 1973 annual figuresremained remarkably stable at around 7,000 abor-tions per year with a ratio varying only between 200and 250 per 1,000 live births.
I mentioned that the 1969 law limited ab;rtionto Oregon residents. While there were some excep-tions we believe that these were quite minor in theoverall analysis. In addition to the fact that Oregonpresumably limited abortions to residents of theState there was little reason for interstate movementinto Oregon to obtain abortion—California, Wash-ington, Hawaii and Alaska had early abortion laws.On the other hand there was little need for anOregon resident to travel to another State. In 1972prior to the Supreme Court decision striking downresidence limitations only 0.2 of one percent ofabortions performed in Oregon were to non-resi-”dents and only 0.’7 of one percent of Oregon resi-dents obtained an abortion in another State.
The impact of the 1973 Supreme Court deci-sion on abortion in Oregon was initially small-andthe slight increase in abortions that year was likelyaccounted for by the removal of residence require-ment. In 1973 there were 394 abortions reported toout-of-State residents—239 of these were from theState of Washington and probably were primarilymembers of one health plan that serves a fairlylarge number of persons in southwest Washingtonbut has its hospital facility in Oregon. In otherwords this is part of the normal movement acrossState lines to obtain general health services.
After four years of comparative stability thenumber of reported abortions rose rather sharplyin 1974—up 18 percent and again in 1975—up 21
-percent. The abortion ratio increased from 234 in1973 to 320 per 1,000 live births in 1975. It is ap-parent that 19’76 will show another significant gain.While out-of-State residents are reported in some-what larger ,numbers (in 19’74 6 percent of the to-
tal) with few Oregonians leaving the State for abor-tion (0.4 percent in 1974), this does not account forrecent increases. There may be some improvementin completeness of reporting, particularly for abor-tions occurring outside of general hospitals. In1975, 63 percent of all abortions in the State werereported from three specialized facilities. An ‘inde-pendent evaluation of completeness of abortion re-porting made in 1974 by the Alan Guttmacher In-stitute (the Research and Development Division ofthe Planned Parenthood Federation) showed an 8percent difference in figures from their indepen-dent survey and those reported to the Health Divi-sion.
Finally, just a few words about the new itemson our report—the use of contraceptives, numberof living children and previous abortions. The ques-tion regarding contraceptive use was answered on87 percent of the reports. Of those answering thequestion, nearly two-thirds stated that no contracep-tive method was being used at the time pregnancyoccurred. Practically none of the girls under theage of 15 used contraceptives of any type—’7’7 per-cent of girls in the 15-19 age groups were using nopreventive measures. The highest proportion ofcontraceptive use was in the 25-29 year-old patient,but even here only half of the respondents usedany type of birth control method.
Questions relating to living children and pre-vious abortions were not well answered with re-sponse rates of 40 percent and 24 percent respec-tively. Even so, for 18 percent of all women receiv-ing abortions in 1975 this was not the first. Forty-six percent of the women with previous abortionexperiences had used no contraceptive to preventthis pregnancy. These figures raise some very inter-esting questions.
In a significant part of the sexually active po-pulation it seems that abortion has replaced othercontrol methods to prevent pregnancy. Incidentally,these items will be far more complete in 1976 -probably in the 90 percent completeness area sincewe are doing more followback to reporting sources.
On the whole we believe our system hasworked well for us. From the beginning we havehad excellent cooperation from all our reportingsources. I am confident that both the simplicity ofthe report form and the complete protection of pa-tient identity have led to a high level of acceptance.I would also like to point out that it is far easier toask questions of considerable sensitivity (such ascontraceptive use and previous abortion) with goodresults when it is obvious that the individual privacywill not be involved.
.
313
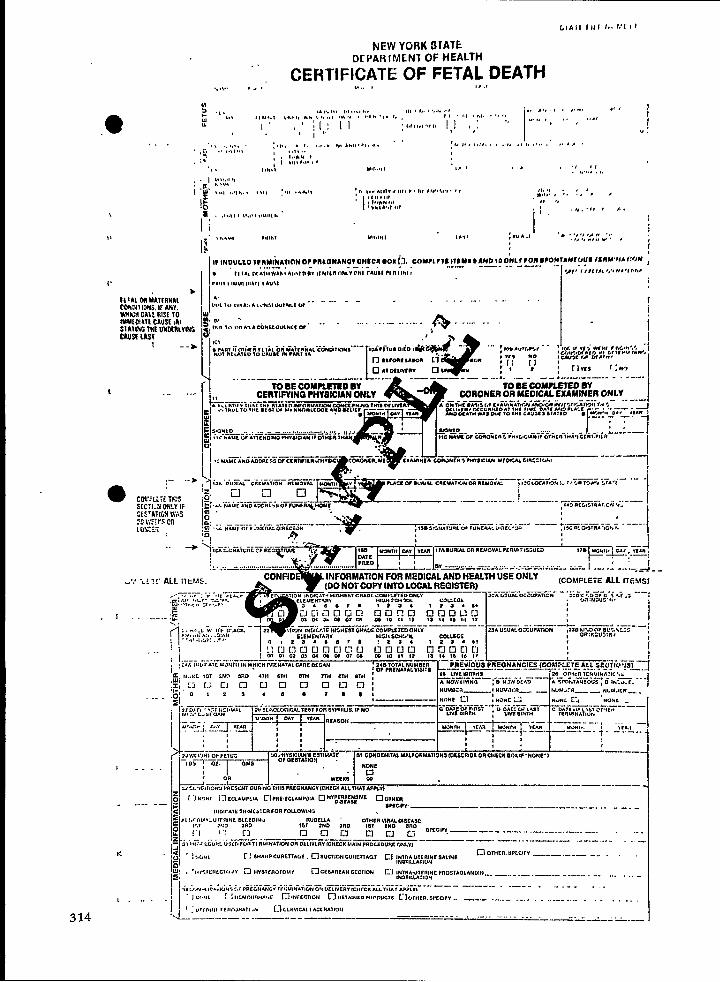
ZIA II 1111 1.. I.t[tf
NEW YORK 51A1EDCPAH fMENl OF HEA1.TH. .
CERTIFICATE OF FETAL DEATH,.,,,,. , .. , “.. ! ,,,,
I ~~~,1,,.4: ,=, .,.s,I y ,.., ..!,.., !,,, :., ! ,.,. h!,
1~
I j ““’’” “’’’’’’’’’’’” “
,:.9..”, *,,,,1
,,,.,,*,,,., “r, !, ‘. /,, 1,
41 .##, .#, * /..
;:.” ... ,* ... .,,,,, .,.
.,, ,, ”,,,&. .,
1
\
1:
.i1~INDULLO‘FSYiUA!IONOEPRLONAN9~9Y~CROOX!~.. ---- -—...’....... .-,,,:,;,,,,,,,,,,,,,,,,,,,JCOMPLVl# llESIB#AND IO ONLt VOn #PON7hMf OUS lZ#M, NbfifJM
I:,,,,,,vu,,,,,,, ta..,,
II 14, Pt4110wa>t 41<,SIII*V 4tuttnf*htvoN8 chuht mnlthf t I*, O,,Ll,%,>,,A:.6,.3N!.10“8 M<% *
-------- . ..- . . . .
I
. rant iic>ti4tK *I tit *6 C&trniaL”66nti710Ua----N..,, “t,,,’p ,0 CA”*L ,N ●A”, ,* “am::.:...-..........l
CERTIFYiN@PHYSICIANONLY70 EE-COMMETED W
CORONEROR MEDICALEXAMINER GNLY——. - .—-— — .-----— ------ .. ... ...- --. I., “,,!, ,,,., r., sTA,L,l,”ron”Arm
- -----A ON 1)+1 SA1O% <.8 C .A140wAT86W ●NO,GR UU,r%f l<. l,W, ?“ %
EOWA7”**SWC 101.I C.U3C%S1.I*D ● CI<>T.:;l.* ‘,,”, ”, Wc””t,, o., ,Mc rl”l C.f, 4?4s P, A&c
[;1*“L0, A,,C?19N0Fn.*K,ul ,rol”!a!w *,CMu w mOicnT&.clcffii;’:li[ n’YHi.,zcir71i%L---——
I
1 .- --
fl . –. -..--._______ - “’” .--Ll---&y’””w!.NAMC AND ADORL SS W CCmlWILn,WYSICl ——-”-4,[8 AUlMCh C0fIJ91tM3 WSKIW Ul=. UII:C1OI.I
., ... ---.. -— ..- 44 >c;:.Gi.iLcF 11,.qm: . .:;- - :,
~ WVJ “ ‘
[
U%I” M, m I VAWJUULOn Mcti=v.t *C.U,r ISZWCO 178 “..,,, i Z,7C-*. ,-.,.—:
F,LCO ,. . . . .. ...... ... ...... .... ..--., —,:..1 .:’.:. . .. ...... .— A- p-.-.-..=:= . . . . . ..— —.— -... . .. . . 1 .-.: -.-L, -J--
--., ‘L! ?t’ ALL ilttJS.CONFID MTN USE ONLY
U LW-AL VICUI>ICW) (COMFLETE ALL ITEMS$
~E~mL’,
1
-—— ~—- --- , ;, t-K;O-,-,-c- ,: ,..C.-+ .._faEOk ‘CA ‘s”ALx””’A’’o” ; tin:Wouz,fl”
a4, t34s+20 ;::~g::
,
,, ,, i.— -- ——— .- :;A-”me:.tiJiA-,-mx.->. ———. ____ ;rEDONLv ,230K!..an?BL,3,,::S ,H,.(W caLiEGE 0a:K:u;16,
I ..-..
.
k’”-hUW.?Fl____rlLU.lSIi _
““N’ [-. ‘NIJNt .- —-.. .-&-----
C DA7, *L.&, C,,, E”,CRM).A,,U.
.—- —-- . . .“w,?,
r-—- . + . _J~.~,L
..
.—I..IF:=r=F”w+::w--?.3LGOLWICALTE5TIOREVPI11U6,1$NO
:-.
..... -—Ig’,, :,.,,,>.,”r,fa,., ,:::0(..
~.? : c1 C! k “Tv!:m’u“mc’m-------- --------------- -. . .. -— .——- .%.,::,L.”*Lu3Lr, FOR 11 RM1tlA710N OR O&LIVLnV~C~cA~O~Eziw ‘--—— ‘---—” ‘- . ‘ ““”.—- ‘--”121
. .... ...- . ...... :,,’,,L t:S.AtlPCURCnAGE. n 8UCTIONCU11ET1AIJ.? ~] I.In& U7EIIIHE SALINC
U O,HCR.8vccIFv _-__,---- -.
~,N81,uA1 ,0,&
. ‘,i,=.lEl!Eclt)#v ~J HYS1fnJfO14ffzi .
mCE6AIIEAN6CC110N ~] tNTHA.dlCRINC PR0S1AQLANDlt4 .-. _..- ._. _____ ----- _ -. . . -,N318CLAT,0M
. . . . . . .. —-. ..-- .-. — .—-, -—---- .. -.--— .. -- ...___,_ ------- ,. ____ --, - . . . .I .“ ,.,,f.-k #c.,nJt4?c.F PIIELN411C* *P.: MIWAIION G,, UCLIVEM UC,lrcx aLL7,fAT APPLVb
i - I ,:,..J. : : oIcMoftR$lA,.F El I141CC11GN mIIETAZ.eO P,IODUC7S ~lorHER, nPEcm6Y. ___ ..-_ . . . . . . ,,.- . . . . . . . .,
!.L:?:T.::?::’L?.?:?: -—. ______ . -————— . ,--- . . .. . .._-_ A--- -- .-—
1:
L. . . . .
314

The fact that over 40 percent of patients ob-taining abortions have at least one living child alsoindicates that there was at least one obvious oppor-tunity to provide family planning services whichwas not capitalized on - the immediate post-partumperiod in the hospital.
The age distribution of those seeking abortion(SLIDE 4) indicates that those at the extremes of thefertile years are more likely to have an abortion ifthey become pregnant. Those who live in less popu-lous counties (SLIDE 5) are less likely to have abor-tions than those who live in more populous counties -the ratio of abortions per 1,000 live births is 3-Yztimes higher for women living in counties with popu-
SLIDE 4. LEGAL ABORTIONSPER 1,000 LIVE BIRTHSACCORDING TO AGE
TENNESSEE 1975 AND USA(SELECTED STATES) 1974
PROVISIONAL DATA
Abortions/ l,OOO Live Births
Age Tennessee USA*
<15 518 1,156
15-19 275 491
20-24 174 263
25-29 115 184
30-34 140 244
35-39 223 389
>40 253 585—
Overall 185 292
*32 States
Iations over 100,000 than it is for those living incounties with less than 25,000. That this is at leastpartly related to availability of services can be in-ferred from SLIDE 6 which shows the location of the13 abortion clinics currently operating in Tennessee.There are only four counties having abortion clinics;all have greater than 100,000 population.
SLIDE 6 also shows the ratio of abortions per1,000 live births for the 9 planning regions in Ten-nessee; there is greater than a five-fold differencebetween the adjacent Northwest and Mid-Cumber-land regions. This difference may be partly due tosubstantial racial, cultural and economic differencesbetween the population of Western Tennessee andthe middle part of the State. However, one majorreason for this apparent discrepancy is a problemthat plagues. all abortion surveillance activitiesunderreporting.
To give you an idea of the magnitude of thisproblem, let me explain that of the four abortionclinics shown in Memphis, one had never reportedto us until 1976. In 1975 about 2,000 abortions .were performed on women living west of the Ten-nessee River, giving rise to the low ratio shown onthe slide. “However, in the first three months of1976, the previously silent clinic reported 969 abor-tions, an annual rate of nearly twice that of the restof the western part of the State.
Another indication of the degree of underre-porting comes from the Alan Guttmacher Institute,which actively surveys clinics and physicians per-forming abortions to determine the number per-formed. For 1974 the Institute reported 14,200abortions performed in Tennessee.q TennesseeDepartment of Public Health records indicate only~,406, just over half that number. This degree ofincompleteness severely hampers the best use ofreporting data but does not preclude using the dataprofitably.
SLIDE 5. LEGAL ABORTIONS, LIVE BIRTHS, AND LEGALABORTIONS PER 1,000 LIVE BIRTHS BY COUNTY ACCORDINGTO POPULATION TENNESSEE 1975 (PROVISIONAL
No. 1975 Legal LivePopulation Counties Est. pop. Abortions* Births
<25,000 50 661,198 577 9,25425,000-49,999 31 1,037,59450,000-99,999
1,313 14,0749 604,198 1,240 8,316
>100,000 5 1,885,010 6,118 28,246
TOTAL 95 4,188,000 9,248 59,890
*Only includes patients in whom county of residence is known.
DATA)
Abortions per
1,000 Live Births
6293
149
216
154
315

LOCATIONOFABORTIONCLINICSA!JDLEGALABORTIONSPER1,000LIVEBIRTHS
ACCORDINGTO PLANNINGREGIONTEtJNESSEE‘1975(PROVISIONALDATA)
SLIDE 6
49 92 164
● ABORTIONCLINIC

USE OF ABORTION STATISTICS AT THE STATE LEVEL
Alan R. Hinman, M.D., Assistant Commissioner and Director, Bureau of Preventive andMedical Services, Tennessee Department of Public Health, Nashville, Tennessee
Introduction
Since passage of “liberalized” abortion laws insome States in the late 1960’s, considerable atten-tion has focused on the desirability of abortion re-porting, the mechanics of a reporting system, andfinally, the use of the information once obtained.This discussion intensified following the 1973 Su-preme Court decision affirming the individual’sright to obtain an abortion. I have worked in thehealth departments of two States with differentapproaches to abortion reporting: New York and
, Tennessee. In New York State outside of New York“City (Ups;ate New York), abortion reporting is apart of the fetal death reporting mechanism which-.requires reporting of fetal death at any stage of gesta-tion and identifies the patient, physician, stage of ges-tation, marital status, number of previous- concep-tions, and number of previous abortions. (SLIDE 1)
{ The form additionally calls for notation of any com-plications resulting from the abortion procedure. InTennessee, by contrast, fetal death reporting is onlyrequired after the twentieth week of gestation and aseparate reporting mechanism for abortion was esta-b lishe d following the Supreme Court decision.(SLIDE 2) This system does not identify the patientnor the person performing the abortion. However, itdoes provide information regarding county of resi-dence, age, marital status, stage of gestation, numberof previous pregnancies, and number of previousabortions. It does not provide information aboutcomplications associated with the abortion.
The ~urt)ose of this ~resentation will be to des-cribe som’e u;es, at the S;ate level, of data collectedthrough these different reporting systems.ExamD1es will use data from UDstate New York andTenn;ssee.1,2 It should becom; a~~arent that abor-,.tion reporting provides important data with practi-cal applications. The utility of these data is en-
hanc;d by a more complete reporting!system such asthat of New York. Some of the major uses of abor-tion data are: assessing needs for service, planningand implementing programs, monitoring currentpractice and the quality of care, and recommendingor regulating specific practices.
1. Assessing Needs andPlanning Services
Performance of an abortion indicates severalthings about the individual: an unwanted pregnan-
cy, a failure of contraception, a need for counsel-ing, and frequently, a need for other social services.Abortion statistics also indicate needs of groups ofindividuals.
A tradition means of assessing fertility hasbeen to examine the number of children born. Insome sub-groups of the population, this results in aconsiderable underestimation of the number ofconceptions that occur. For example, in UpstateNew York in 1972, there were 1,014 live births re-corded to resident girls under the age of 16.Although this number is alarming enough, abortionreporting indicated that there were also 1,259 abor-tio-ns performed to Upstate New York residents lessthan 16 years old. Thus, the total number of knownconceptions in girls under 16 was 2,273, more thandouble the number suggested by the live birthdata.3
Just as one abortion represents a completelyunwanted pregnancy, the performance of ;epeatabortions in the same individual clearly indicates aneed for services, either contraceptive or social, asfew people voluntarily use aborhon as their pre-ferred mode of contraception. In Tennessee in1975, 1 out of every 9 abortions was performed ona woman who had previously had at least one in-duced abortion. (SLIDE 3) Further “analysis of char-acteristics of those obtaining repeat abortions canmore precisely pinpoint areas of need. Knowledgeof individual patient identification might potentiallylead to specifically targeted outreach efforts.
SLIDE 3. SELECTEDCHARACTERISTICS
OF LEGAL ABORTIONSTENNESSEE 1975 and USA1974 PROVISIONAL DATA
TENN. USA*
Less than 20 years oid ‘37.5% 32.3%Currently Married 23.1% 26.7%Less than 13 weeks gestation 94.3% 86.1%Suction curettage 94.4% 85.1%1+ living children 41.9% 50.4%1+ previous abortions 11.2’% 15.2%
*Selectedstates
317

Knowledge of the stage of pregnancy at whichabortion was performed is also important to assessneeds and how they are being met. For example; ahigh proportion of abortions performed in the sec-ond trimester might indicate a need for better pub-licizing the availability of abortion services, makingcounseling services more readily available so pa-tients can make decisions earlier, making pregnancytesting more widely available, educating the publicas to the increasing risks associated with abortionsin the later stages of gestation, etc. In Tennessee, asin the U.S. as a whole, more ~an 85 percent ofabortions are performed in the first trimesters
Having identified and localized needs for serv-ices in terms of location and clients, programs andservices can be established appropriately. Althoughmost States do not themselves provide abortionservices, they may well be involved in the planningof abortion facilities or at least the assessment ofneed for abortion facilities, and it is apparent thatabortion reporting data are crucial in this step. AllStates are in the business of providing or arrangingfor the provision of family planning services andthe information provided through abortion report-ing clearly enables them to focus on this group withobvious needs.
2. Monitoring Current Practiceand the Quality of Care
It is widely agreed currently that suction curet-tage is the simplest and safest means of inducingabortion in the first trimester. Acceptance of this isreflected in the fact that 97 percent of first trimes-ters in Tennessee are performed using suction cur-ettage. That avoidance of abortion during the thir-teenth through the fifteenth weeks is also widelyaccepted, is demonstrated by the fact that in Ten-nessee, as in the rest of the Nation, less than 5 per-cent of all abortions are performed during this per-iod. It is generally held that suction and sharp cur-ettage are relatively contraindicated with increas-ing gestational duration; nonetheless, over 40 per-cent of Tennessee abortions performed after 20weeks of gestation are performed by suction curet-tage. This suggests the need for some physicianeducation.
It is doubtful that reporting of complications atthe time of reporting an abortion gives an accurateview of the actual occurrence of complications sincemany complications will not become apparent untilsome time after the abortion is performed. Cou-pling this fact with the tendency for underreportingsuggests that indications of complications on abor-tion reports are of little utility. Even so, they doindicate trends: in Upstate New York, complicationrates calculated from fetal death certificates indicat-
318
ed that the complication rate for second trimesterabortions was about eight times higher than thefirst trimester complication rate,6 This ratio is sig-nificantly higher than was determined by the JointProgram for the Study of Abortion (JPSA) whichused data directly obtained from hospitals perform-ing abortions.7 The JPSA data indicated that secondtrimester complication rates were approximatelythree times higher than first trimester complicationrates.
Data on deaths related to abortion obviouslyarise from death certificates in which induced abor-tion is listed as an immediate or underlying causeof death. Identification of deaths related to abor-tion is important in terms of evaluating the qualityof service performed but, in order to meaningfullyevaluate these deaths, it is obvious that denomina-tor data are necessary. Data from Upstate NewYork, for example, indicated that maternal mortali-ty rates related to induced abortions were nearlyfour times higher in second trimester abortionsthan in first trimester abortions. They also demon-strated that for both first and second trimesterabortions, the maternal mortality rate for abortionsperformed out of hospital was substantially higherthan that for abortions performed in the hospital(approximately five times as great during the sec-ond tnmester)6
Study of abortion reports and other data relat-ing to abortion may also indicate deficiencies intechnique. In Upstate New York, a special studywas conducted of live births in which the means ofdelivery was listed as induced abortion.g This studyrevealed 38 live births following induced abortionin a 2~’ year period. Thirty-seven of the 38 livebirths also had a death certificate on file indicatingnon-survival; one survived. One of the most fasci-nating features of the study was that 2’7 of the livebirths were reported following saline amniocentesis,with 12 occurring at a single hospital, Eight of thesewere performed by a single physician, More de-tailed investigation revealed that the physician inquestion rarely aspirated significant quantities ofamniotic fluid prior to instilling hypertonic salineand that he often injected quantities of hypertonic.saline insufficient to arrive at a fetucidal concentra-tion. Identification of this procedural inadequacyled to its correction.
3. Making Recommendationsand Enacting Regulations
The information obtained on complication andmortality rates associated with second trimesterabortions in New York was very heavily used inconsidering the institution of requirements for per-forming all abortions after the twelfth week of ges-

tation on an inpatient basis. The State legislaturedid enact such a requirement. Thus, the abortionreporting information was used directly in arrivingat a change in regulations affecting the practice ofabortions. In similar fashion, though not in a regu-latory way, the use of abortion and abortion relateddata led to changes in the technique of performingsaline abortions.
Mandatory reporting of abortions can alsoserve to identify individuals and facilities ‘whichshould be subject to other regulations. For exam-ple, Tennessee has recently passed a law regulatingambulatory surgical facilities. This law defines asan ambulatory surgical center any center, which isnot a part of a hospital, which performs “substan-tial” numbers of outpatient surgical procedures, in-cludlng abortions. ~ls law will clearly affect abor-tion clinics which were not previously regulated atall under Tennessee law. This change in law willprobably also make it mandatory that Tennesseeadopt an abortion reporting mechanism whichidentifies the physician performing abortions sincethe only way of determining who performs a “sub-stantial” number of abortions will be a listing ofabortions performed by physicians. Identification offacilities performing significant numbers of abor-tions will lead to their being covered by regulationswhich are presently being developed .-
From the foregoing, it should be apparent thatabortion reporting is an integral part of the public
health apparatus. Abortion statistics can be, havebeen, and must continue to be, used at the Statelevel to try to assure maximum possible health lev-els.
REFERENCE
1.
2.
3.
4.
5.
6.
7.
8.
New York State Department of Health. Report of se-lected characteristics of induced terminations of preg-nancy recorded in New York State. January - Decem-ber, 1974. Issued October 1975.Unpublished data. Tennessee Department of PublicHealth.Hinman, A.R., Stroh, G., Gesche, M. C., Whitaker, K.F.Medical consequences of teenage sexuality. N.Y. S. J.Med. 75:1439-1442, August 1975.Weinstock, E., Teitze, C., Jaffe, F.S., Dryfoos, J.G.Abortion need and services in the United States, 1974-1975. Fare. PL Perspectives 8:58-69. Mar./Apr. .1976.Center for Disease Control. Abortion Surveillance1974. Issued April 1976.Stroh, G., Katz, S.H., Hinm.an, A.R. “Performing sec-ond-trimester abortions; rationale for inpatient basis.N.Y. St. J. Med. 75:2168-2171. October 1975. ‘Tietze, C., Lewitt, S. Joint program for the study ofabortion (JPSA): Early medical complications of legalabortion. Stud. Fare. Plann. 3:97, 1972.Stroh, G., Hinman, A.R. Reported live births followinginduced abortions: Two and one-half years experiencein Upstate New York. Amer. J. Ob-Gyn, in press.
319

HEALTH EXPENDITURES DATA: COMMUNITY FUNDS FLOW—‘THE CONCEPT
My
James P. Cooney, Jr., Ph.D., Chief Executive Officer,search, Inc. (SEARCH), Providence, Rhode Island
function this afternoon is to set the stagefor a discussion of funds flow by providing a fra~eof reference for SEARCHS PARTICULAR AP-PROACH TO THE FUNDS FLOW DATA SYS-TEM. There are obviously- other methods than oursof approaching the development problem of afunds flow system and there certainly are more usesof the data products of tie system than we will bediscussing tils afternoon.
We offer an Applied Statistical Training Insti-tute (ASTI) course on the funds flow data system.This afternoon we will be giving a very abbreviatedversion of the five day program. During the fullcourse we describe a more expanded methodologyand data use application than you will be hearingtoday. In addition we use alternative methodologiesfor other States’ data in a workshop exercise.
In order to understand our particular conceptof funds flow two aspects of SEARCH will be de-scribed as a necessary frame of reference: 1.SEARCHS organization and. function, and 2.SEARCHS data basis.
1. Organization and Function
SEARCH is a private, not-for-profit corpora-tion fo’rmed by a consortium of eight State-basedgovernmental and nongovernmental health relatedorganizations and agencies. The organizationalfunctions include: -to maintain the Rhode IslandState Center for Health Statistics, -to meet the in-formational needs of health related organizationsincluding both nonmember and nonstate groups, -to provide technical assistance to organizations inboth health data collection and use, -to conduct re-search and evaluation studies in applied health de-livery problems, and -to serve as an experimentallaboratory for methodological studies. Basically theorganization services the health data needs of amultitude of organizations in addition to function-ing as a State center for heahh statistics.
2. Data Bases
Health expenditures data is only one of thecontinuous data sources available to SEARCH. Eachof these data bases are interrelated and focusedtowards community health profiles. As a conse-quence expenditures data are rarely viewed by us in avacuum, but are generally used in conjunction with
320 ,
several
Rhode Island Health Services Re-
other data bases for analytic and inter~re-tive purposes. A mutual dependency among-thedata bases has been created.
In addition to the health expenditures data theother data “sets” available include: vital statistics,health manpower, health facilities, (these first threedata sets are all CHSS components and have theinformational configurations of that system), pa-tient utilization abstract information from all com-munity hospitals, all “nursing care” institutions, anda majority of other long-term care institutions, ahealth survey conducted every three years throughan interview of a sample of households and mo-deled after the NCHS Health Interview Survey,complete census “like” data on the total populationincluding socioeconomic status, and a variety ofother descriptive data on health services and useobtained through research and evaluation studiesconducted by SEARCH.*
In brief, our methodological approach and useof health expenditures data result from the nature0$ our organization (multiple users) and the availa-b]hty of other interrelated data resources, Westrongly feel that our organization and its data bas-es are a product of local chemistry. They are nottherefore totally reproducible automatically in oth-er settings without variation. We see them as oneway to 6rganize statistical services and data bases,but they are by no means the only viable way. Inaddition, the organization and data bases describedare now entering the seventh year of operation.They did not emerge in their present state fullyorganized from “the head of Zeus”, A process andprobably a very necessary process of evolution hasoccurred to bring us to today’s stage of operation,
The Concept of Funds FlowA very basic informational demand gave impe-
tus to the development and maintenance of ourfunds flow system: the need to monitor and evalu-ate the cost benefits of health programs and serv-
*The sections of this paper dealing with organization
and data bases have been summarized from the actualpresentation, For a more comprehensive description of
both the organization and data bases, the reader is refer-enced to a paper by the same author elsewhere in theseProceedings on the consortium as a method for organizing
statistical services.

ices within the State. For such cost benefit analysisone major component of information must focuson dollar to effectively weigh the outcomes of careversus the resource inputs to care services.
The funds flow sysem is an analysis of thesources and uses of health expenditures in the Stateconducted on an annual basis. Modeled after na-tional studies conducted by the Social SecurityAdministration, these SEARCH analyses show theamount and “flow” of health dollars by source offunds, vendor, and kinds of goods and services
purchased. The health expenditures system is nowan integral part of the State’s program planning,monitoring and evaluation activities as specifiedunder the State’s Catastrophic Health InsuranceProgram legislation.
The following chart illustrates the structureand definition of the system. Subsequent presenta-tions this afternoon will focus on the funds flow sys-tem methodology, and examples of how the sys-tem’s informational products have and are beingused.
.
.
321

ONE STATE’S APPROACH TO USEFUL HEALTH ECONOMICSSTATISTICS: METHODOLOGICAL ASPECTS OF AGGREGATEHEALTH CARE EXPENDITURE ESTIMATES ‘
Mr. Harvey Zimmerman, Senior Research Associate, Rhode Island Health Services Re-search, Inc., Providence, Rhode Island
1. Introduction
Compiling estimates of health expendituresrequires a great deal of patience and persistenceand little inventive genius. Thus, a discussion of themethods used will reveal few, if any, novel ideas. Infact, we will be well advised to parallel the scientificmethod suggested by Descartes more than threehundred years ago. We take the general problem ofestimating health expenditure and divide it intospecific components defined by type of providerand source of payment. We estimate each compo-nent, then build our total estimate from the compo-nents. Finally, we present our estimates in sufficientdetail to afford a perspective on the overall healthcare delivery system.
Conceptually, tils approach is straightforward.It involves identifying appropriate alternative typesof care and sources of funds; collecting and analyz-ing the pertinent data; making the required esti-mates; and summarizing the results. In theory, thisapproach provides an internal check on the esti-mates. Expenditure is estimated independently bysources of funds and by types of care. The statisti-cal discrepancy between the independent estimatesprovides an overall measure of the accuracy of theestimates, provided that they are unbiased. In prac-tice, the major source of funds—direct consumerexpenditure—is usually unknown. In this case, theresidual expenditure, after all other identifiablesources of funds have been accounted for, is attrib-uted to the consumer. Thus, estimates of consumerexpenditure include any statisticaldiscrepancy thatis introduced in the process of estimating othercomponents of the matrix.
Il. Definitions of categories
A judicious selection of an expenditure classi-fication system expedites the estimation process.Conceptually, there are several different ap-proaches to classifying expenditures by type. Oneapproach would identify payments to specific inputsinto the health care delivery system such as physi-cians, nurses, hospital routine inpatient room costs,specified ancillaries, and so forth. A second optionis to identify costs associated with different stages in322
the treatment of health problems such as preventivecare, emergent care, acute care, chronic care, andso forth. A third approach is to identify costs by thesetting in which care is provided such as hospitals,physicians’ offices, nursing homes, and so forth. Itis this approach, with supplemental categories tocover those costs which are not specific to any parti-cular setting such ‘as prepayment and administrativeexpenses, that is used here. The choice of this ap-proach is based on the existence of available~datasources well-suited for use in this classification sys-tem.
- Within this system, two categories of currentexpenditure may be distinguished. Most currentexpenditure goes to purchase current flows of serv-ices and supplies. This is commonly called personalhealth care expenditure. In addition, some currentexpenditure is associated with future care, This in-cludes outlays for research, construction, and train-ing.
It is convenient to define the following catego-ries of personal health care expenditure,
Expenditures for hospital care is defined asfunds spent for services and supplies provided bypublic and private facilities licensed as hospitals.This includes physician and ancillary services pro-vided (and billed for) by hospitals but excludes ex-penditures for training.
Outlays for physician services are funds spentfor care provided by private practice qedical physi-cians, surgeons, and doctors of osteopathy,Similarly, expenditure for dental care representsthe total payments to self-employed dentists anddental surgeons for the care and appliances, such asdentures, that they provide.
Drugs and sundries expenditure includes totalretail sales of prescription drugs, proprietary medi-cines, and first aid products.
Outlays for eyeglasses and appliances includetotal spending for corrective lenses and opticalproducts as well as surgical and medical appliancessuch as prosthetic appliances: wheelchairs, andbraces.
Nursing home care includes both skilled nurs-ing homes and intermediate care facilities.
Other professional services include payments tochiropractors, podiatrists, and visiting nurses notemployed by hospitals. Medical laboratories andprivate ambulance companies are included as well

as those professions characterized by the InternalRevenue Service as other medical services.
Expenses for prepayment and administrationinclude the indirect costs of operating third partypayment programs. This includes the differencebetween private insurance benefits paid and earnedpremiums as well as within State administrativecosts of major public insurance programs. Costsincurred at the national level are not imputed tothe State.
Government public health activities result inexpenditures on the State and local level for func-tions perhaps best characterized as those normallyfound in health departments. This includes licen-sing, regulatory, and planning functions and theprovision of some community services.
Expenditures for other health services are thesum of the costs of those services not included inother categories. Public sector programs includemedical vocational rehabilitation, veterans’ homes,school health services, neighborhood health centers,and special commissions to investigate medical mat-ters. The private sector includes inplant health serv-ices, private college health services, and expendi-tures through voluntary agencies financed by non-governmental sources. Undistributed residual thirdparty benefit payments are also included. It shouldbe noted that these payments do not belong here.Unfortunately, data which are needed to distributethis residual among other categories are unavaila-ble.
Sources of health care funds are usually divid-ed into governmental (or public) and nongovern-mental (or private) sources. Public sources are fur-ther subdivided according to the level of govern-ment which collects the revenue to support theprogram. Private sources are separated into insur-ance and direct consumer expenditure. Other pri-vate sources such as industrial inplant health serv-ices can also be identified, but these expendituresare relatively small.
Two potential uses of the estimates of sourcesof funds are measuring the “market power” of eachsource and assessing the exten: of income redistri-bution effected through pubhc health care pro-grams. The general division of sources by level ofgovernment and means of private payments pro-vides a crude indication of potential power of thirdparty payers to dictate acceptable price, quantity, orquality of services in the market.
Additional distinctions must be made to allowassessment of the extent of income redistribution. Itis useful to distinguish between voluntary andmandatory payments to third parties. Under volun-tary plans such as private insurance with group rat-ing, the consumer may reasonably expect to receiveservices proportional to the premiums that he paysover a period of time. There is a redistribution of
income within the group for any particular year,but over a longer period this is averaged out. Thischaracteristic is shared by some government-spon-sored prepayment plans such as the Federal Em-ployees Program, the Civilian Health and” MedicalProgram of the Uniformed Services (CHAMPUS),and the portion of Medicare Part B that is financedby consumer premiums.
On the other hand, other governmental pro-grams such as Medicare Part A and Medicaid in-volve extensive income redistribution. The revenuewhich finances the plans comes from one groupwhile the benefits go to a different group. For gen-eral programs such as licensing and regulation, theredistribution is less dramatic. However, these pro-grams share the characteristic that the benefits re-ceived are not proportional to the taxes paid fortheir support.
Beyond these broad divisions of sources offunds, more detailed disaggregation among agegroups, socioeconomic groups, or health problemswould also be interesting. In general, existing datamake this a difficult, if not impossible, task at thepresent time.
Ill. Sources of Data
While the enumeration of all of the existingand potential sources of data is beyond the scope ofthis paper, it is useful to review the general sourcesof data that are available.
One family of government sources of informa-tion is the result of programs to finance health caredelivery. Examples of this are Medicare Cost Re-ports, Medicaid statistics and mental health pro-grams. In addition, some services are provideddirectly such as Veterans Administration, State, andlocal hospital services.
Another group of data stems from governmentplanning and regulation. Rate review commissions,Hill-Burton survey, and licensing agencies are ex-amples.
The Department of Health, Education andWelfare collects a broad assortment of statistics.Besides these sources, other government agenciesdevelop useful statistics in the course of the per-formance of their unrelated functions. IRS BusinessIncome Tax Returns, the Bureau of Labor StatisticsConsumer Price Index, government budgets, andthe Department of Commerce National IncomeAccounts are examples.
A wide range of data sources also abound in theprivate sector. Blue Cross/Blue Shield, commercialhealth insurance companies, and health mainte-nance organizations are sources of finanical infor-mation. Voluntary organizations’ such as charities
concerned with health problems or voluntary visit-
323

ing nurse associations have data. National umbrellagroups such as the Health Insurance Institute, BlueCross of America, and the National Council onWorkmen’s Compensation also collect data.
Professional associations such as the AmericanHospital Association, the American Medid Asso-ciation, and the American Dental Association, toname a few, collect valuable data.
This doesn’t exhaust all the possibdities. Manyindependent researchers and research groups alsocollect and compile statistics which are relevantfrom surveys and special studies.
IV. Choi6e of sources
It shodd be apparent from this summary ofdata sources that, with few exceptions, alternativeestimates are available for the desired statistics.Since these alternatives will vary to some extent, theproblem i:. to select the “best” estimate.
A review of some aspects of the data will sug-gest the array of fact~rs on which this decision isbased.
Some data such as cost reports to financial in-termediaries or income reported for tax purposesare audited or subject to audit. This is preferred tounaudited data.
Estimates may be based on a census of pro-viders or on a sample. Census data is preferable.When a choice is made between estimates based onsamples, the method of sampling and characteristicsof the sample provide a basis for selection.
Lags between the time that the expendituresare made and when the data are available are im-
portant. At times this necessitates the use of lessdesirable sources for current estimates and revisionsat later dates.
The periods of time which are covered is alsoimportant. The fiscal years for which income isreported varies. When data from “stocks” of facili-ties or manpower are related to “flows” of expendi-ture, it is especially important to be sure that thedata are compatible.
Other aspects to be considered include the costof the data, the detail, the ability to disaggregate,compatibility with other data sources and so forth,
V. ‘Conclusions
In summary, the guiding principle in estimat-ing aggregate health expenditures is to count every-tilng once and nothing twice. Doing this not onlyprovides information that is interesting and usefulin its own right, but also. results in a catalog ofsources of financial data which is useful in the anal-ysis of many other areas of research on the deliveryof health =re services.
Although estimates of this type are a logicalstarting point in the development of a systematicanalysis of health economics statistics, much morework is needed in this area. When the data can berefined to the point that changes in expenditurecan be correctly attributed to changes in quantity,quality, and prices, the usefulness of these data forthe evaluation of the efficiency and effentiveness ofthe health care delivery system will be increased byat least an order of magnitude.
324

THE VALUE OF HEALTH ECONOMICS STATISTICS
Mr. John T. Tierney, Deputy Director, Rhode Island Department of Health, Providence,Rhode Island
I am happy to be with you to discuss the “Val-ue of Health Economic Statistics.” I would like tomake an informal presentation through the med-ium of slides.
The acceleration of health expenditures ischanging the emotional state of many knowledgea-ble people from CONCERN to ALARM. For oth-ers, the reaction is one of crisis, bordering on panic.A historical perspective of the national health ex-penditure provides some insight into this concern.
In 1950, the national health expenditure .was$12.0 bdlion, by 1960, it had more than doubIed to$26 billion, and by 1970, had more than doubledagain, to $69 billion. In 1975, the national healthbill was $118.5 billion.
The health share of the gross national product(GNP) - The value of all goods and services prod-uced in the United States-reached an all-time highof 8.3 percent in 19’75. For that year, the growthrate of the GNP was slow because of the effect ofrecession on the economy. Had the GNP increasedat the 1974 rate, the health share would have beenabout 8 percent. The health share of the GNP forthe preceding three years was a stable 7.8 percent.This increasing health share of the gross nationalproduct is of concern, since there must be an upperlimit. While there is no general agreement on whatthe upper limit might be, there is a feeling that theUnited States has reached or is fast approachingthat limit.
international health expenditures
percent of GNP
United Statesj75 8.3 %Germany73 7.1Canada~4 7.05weden16g 7.0Netherlands’66 7.3France’70 5.8United Kinqdom,,, 5.3
Here, for the latest years available, the UnitedStates is compared witi other industrialized nations.
With the exception of the United States, theother countries of the world are spending approxi-mately between 5 and 7 percent of their gross na-tional product for health services, The health shareof the GNP in the United States is higher than inany other country in the world.
Another way of looking at national health ex-penditures is in terms of per capita figures whichaccommodate the growth in population. In 1950,the per capita health expenditure was $78.35; in1960, $141.63; in 1970, $333.5’7; and in 19’75,$547.031 In short, allowing for population growth,per capita healtk costs have increased sevenfold in a25-year period.
itional health expenditures
975by type in million~TYPE - -- AltlOUNT
!COTAII $l;~::$HOSPITAL CAREPHYSICIAN’SS7SRVICES 22:100DENTIST>S SERVICES 7,500OTHER PROFESSIONAL SERVICES 2,100DRUGS & DRUG SUNDRIES ~0,600EYEGLASSES & APPLIANCES 2,300NURSING HO~ CARE 9,000EXPENSES forPREP~@HTand”~NXmS!I!RATXON 4,59s
GOV?TPUBLIC ~~E AC~TIES 3,457 -RNSEARCH ~i’5Q ‘FACILIT~S CONSkRIYCTION 4,860OTHER HEALTH SERVJ.CES 8,000
_100.0,39.318.76.31.89.01.9?.6
8.92.92.33.82.s
You will note that of the $118.5 billion spent inhealth services in the United States, hospit~l careaccounted for $46.6 billion, or ‘39.3 percen~ physi-cians’ services represented $22.1 billion, or 18.7percent; drugs and drug sundries amounted to$10.6 billion, or 9.0 percent of the health care dol-lar.
325
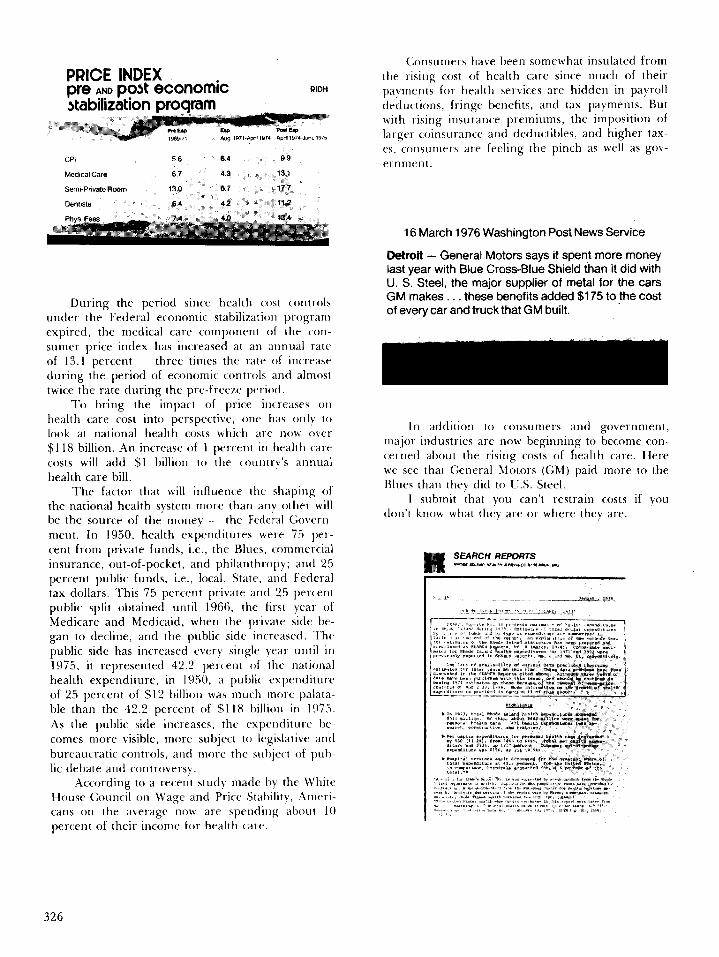
PRICE INDEXPf’e AND p~~k economic RIDH
stabilizationproqram,’ M7%77W ?974 mm 197*..!””. 1975
CPI 5.6 6.4 9.9
Medical Care 6.7 4.3 18.1
Semi-Private Rwm 13’0 s.? IF.?
*ntlsr% 6.4 4,2 11.2
During the period since health cost controls
under the Federal economic stabilization programexpired, the medical care component of the cor]-surner price index has increased at an annual rateof 13.1 percent — three times the ra[c of increaseduring the period of economic c(mtr-ols and almos(twice the rate doring the pre-free~e pcriorl.
10 bring the impact of price in(reases or)health care cost into perspective, one has only I{)look at national health costs which are now over$118 billion. .kn increase of 1 pe]-cent in health care
costs will add $1 billion to the country’s annualhealth care bill.
The factor that will influence the shaping ofthe national health system more than any other willbe the source of the money — the Federal C70vern -
ment. In 1950, health expenditures were 75 per-cent from private funds, i.e., the Blues, commercialinsurance, out-of-pocket, and philanthropy; and 25
percent public funds, i.e., local, State, and Federal
tax dollars. This 75 percent private anti 25 percentpublic split obtained ontil 1966, the hrst year ofMedicare and Medicaid, when the priva[e side be-gan to decline, and the public side increasecf. ‘1’he
public side has increased every single ~Cill’ until in
1975, it represented 42.2 percent of the nationa]health expenditure, in 1950, a pub]ic expenditureof 25 percent of $12 billion was much more palata-ble than the 42.2 percent of $118 billion in 1!175.
AS the public side increases, the expenditure be-comes more visible, more subject to legislative and
bureaucratic controls, and more the subject of pul>-lic debate and controversy.
.According to a recent study made by the PtrhiteHouse Council on tVage and Price Stability, Ameri-cans on the average now are spendirl~ about 10
percent of their income for health care.
(;onsumers have been somewhat insulated fromthe rising cost of health care since much of theirpayments for health services are hidden in payrollcfeductio]]s, fringe benefits, and tax payments. Butwith rising insurance premiums, {he imposition oflarger coinsurance and deductibles, and higher tax-es, cor]surners are feeling the pinch as well as gov-ernment.
16 March 1976 Washington Post News Service
Detroit – General Motors says it spent more moneylast year with f31ueCross-Blue Shield than it did withU. S. St-1, the major supplier of metal for the carsGM makes. . . Wese benefits added$175 to fhe costof every car and truck that GM built.
In addition to consumers and government,major industries arc now beginning to become con-cerned about the rising costs of health care. Herewe see that C,eneral hiotors (C,M) paid more to theBlues than they did to U.S. Steel,
I submit that you can’t restrain costs if youdon’t know what they are or where they are.
326

The next few slides have been prepared toshow the value of producing a local area funds flowanalysis, The Social Security Administration hasbeen making national estimates of health expendi-tures for many years. Rhode Island was the firstState to complete a statewide funds flow report. Wehave done it now for three years. A few otherStates and some metropolitan areas have done afunds flow study, but most of their data are basedon SSA national estimates. Here in Rhode Island,by actually doing it from scratch, we have shownthat local areas can vary quite significantly fromnational norms.
Percentage Distribution of
Health Care Expenditurea,
by~, United Statea,
State of Washington and
Rhode Island, 1973
U** St.,” W.stiw$.m Rbco, ,,!.W
402% 312% 450%198 24.4 15965 101 6044 42 4s
10.1 11.6 12,77,7 S,4 662.1 1.9 2.3
62 4,7 424.0 3.s 26
100 o% 1m.o% 100,0%
This table compares the ~ercenta~e distribution. .of health care exp~nditures by type of service for19’73 for Rhode Island, the State of Washingtonand United States. Note the percentages for hospi-
tal care and physicians’ services.— The nationalfigures are about in the middle. Rhode Island ishigh for hospitals and low for doctors, while Wash-ington is low for hospitals and high for doctors.Washington is significantly higher for dentists’ serv-ices.
There are a number of possible explanationsfor the large differences ,between the two States.For example, Washington has fewer hospital bedsper 1,000 population than Rhode ‘Island, while italso has a much larger percent of its populationenrolled in HMO programs than most any otherState.
Additionally, Washington has one of the high-est ratios of dentists per 100,000 population of thefifty states,
Per Capita Health Expenditures
by Type, United $tafes,
Washington and
Rhode Island 1973..= ~,. ,- :~v , ,,.
,, ,, ,, , ,,44, \
WM*1*1”W.,mnal,n Mlm& e%u
“.”. * . ,*’w,.
1-
—.., b,-.,.aa . .
Hc5pllal care 6%7645 $t4357 WssProw’ WC3s 60W 11242 78@
2842 46 Nl?4m *928 3E442s %23 &m6r4.87 9s 82 $2$s
907 891 F$*
This slide, using per capita figures, shows asimilar picture. Note the wide range in hospital,physician, and dental services among the threeareas.
-taga CoaiparfsonofHaalth Cam ~Suras,BYSoumof Funds.F& SalaotazfAreas;1972 and 1973
stat.* Pd.!. c—T** I FOdull *I w! 1.,-- ● *, lust
U.!tad slates 1W0% 252% !2,5% ~7,7% 8$,4% 389S w a%
Rlw& 1*NM IWO% 258% 11.6% 37A% 26.$%
Waheon
$&?% 02.4%
10DO% — — so% =8% 42.s% W.7%
h,1*12
GIMI” Phillm@hl& AM* . Imti mo% *372 8s7% *7%
ml.w,r,
mm ,86.s%
lW 0% ?96% 162% W,m 27.8%
Rho- I’lIm
w 44a%
SWo% at% 1*$% 878% ma% * ~
Another way of looking at the differences be-tween various areas of the country is to’ examinethe source of funds. Note here that Rhode Island isreceiving a relatively higher percentage of fundsfrom the Federal Government, while the State ofWashington is funding its health expenditures morefrom private sources.
Now I would like to move to the essence of mypresentation; that is, how we have used economicstatistics in health policy decision-making in RhodeIsland. One of the most interesting illustrations ofhow health economic data can be used to assist inthe decision-making process was the involvement ofRhode Island Health Services Research Inc.
I
327229-121 0-77-22

(SEARCH) with the desire of the State’s Cata-~trophic Health Insurance”Program (CHIP), whichbegan 1 January 1975.
In 1973 Governor Noel appointed a task force,composed of leaders in the health field in the State.The task force was formed to advise the Governoron the scope of a bill which would protect RhodeIslanders against financial catastrophe due to seri-ous illness or injury. A working. committee of thetask force met weekly for 3-4 hours over a periodof many months. Its functions were to collect andanalyze information on the extent of existing in-surance coverage and available programs such asMedicaid and Vocational Rehabilitation; determinewhat the unmet needs were, that is, who sufferedbecause they dld not meet eligib~lty cut-offs; sug-gest ways to meet those needs and lay out the impli-cations of each alternative.
s
1,2,3,
4,
5,
JReAo D15EA5E G)VERA6E
CATASTROPHIC COST COVERASE
tlINIMUMBENEFITS PACKAGE
FRANCHISE HZALTH BENEFITS bRPORAT!ON
Do R0THIN6
Many weeks were spent going through eligibili-ty requirements and numbers — all of which sug-geste~ that the people of Rhode Island were, ~nthe whole, well-served. However, only SEARCHhad population-based” data sets which could help toquantify the extent of the problem of gaps in serv-ice programs or coverage.
After some ideas mostly based on nationalmodels were considered, five optional plans weredelineated as worth investigating in detail. Theseranged from a “DREAD DISEASE” packagethrough a complete program of comprehensivehealth ,services and financing to “do notilng”. Con-comitantly, SEARCH staff began to collect informa-tion which would help in the deliberations. Themain questions were:
l.- What was really needed;2.3.
328
How many citizens were affected; andWhat would various programs cost the State?
At the outset it became evident that few peopleknew how much money in total was being spent forhealth care in the State. The SEARCH funds flowstudy showed that over 440 million dollars wasspent in 19’72. The data, for the first time, summa-rized the financial aspects of the entire health sys-tem. They also provided a context and referencesource for subsequent discussions.
The funds flow data made it possible to see inthe aggregate what might be the total bill, for in-stance, if a new program covered services such asnursing home care, much of which was now paidfor out of pocket . . . Just looking at the totalnumbers was helpful when someone suggested thatnursing homes should be one of the benefits includ-ed.
To the people considering major expansions ofbenefits and universal coverage, I think that h ~ssafe to say that seeing the numbers, and speculating
about shifting those expenditures in a number ofareas to the public sector, were quite sobering ex-periences.
One of the options reviewed was the coverageof dread diseases. In order to find out what mi~ht.=.-be considered a “dread disease”, in regard to aninsurance program, the Task Force needed to knowhow such a program might be structured and howmany it would help — that is, what were the highcost illnesses and how many people suffered fromthem?
Through SEARCHS hospital care statistics, wehad patient data by diagnostic categories, totalcharges, and anticipated mode of payment,
AS expected, we found that there were certaindiseases which had greater proportions of costlyinpatient stays, but that any program which justcovered dread diseases would not help a largenumber of individuals who had high cost illnesses,indeed, all disease groups contained some hospitalepisodes with charges in excess of $5,000. Since oneof the purposes of the Governor’s new programwas to eliminate some of the gaps — that is, thoseinstances in which someone who has great needdoes not qualify for help because of a technical eli-gibility requirement—it was generally felt that thisoption was one of the least appealing.
A second question was: How many had costlyhospitalizations with no apparent method of papment? We found that of the over 100,000 patientsin the study, approximately 5 per cent were self-paying patients. Theoretically, a bill beyond $1,000for someone without resources or insurance couldbe devastating, we also found that over 1 per centof the 5,000 without insurance had charges greaterthan $5,000. The numbers were small, but the cost

of a single hospital stay was seen as a marker ofother health care costs such as doctor’s fees, nurs-ing home expense, drugs, appliances, etc.
Early in the deliberations, it was agreed thatthe greatest gap in health coverage for Rhode Is-landers was among the un-employed, the underem-ployed, and those who had been laid off temporari-ly. The Governor wanted to protect those who hadtoo many resources for welfare. He did not wantsomeone who had worked for years to be forced todeplete his assets to qualify for welfare because ofillness or injury. But knowing the extent of theproblems was important for several reasons. If theState paid for their coverage, the Governor wouldhave to know what ‘the total bill might be. If, on theother hand, employers were to pay for it (such asthrough increased unemployment compensationtaxes), both employers in business and industry,labor unions, and other employee groups wouldwant to know the impact, since any additional taxesfor employees would be likely to be “traded offagainst other employee benefits.
There” was much speculation on the part of theinsurance industry concerning the number of per-sons without any health insurance or very inade-quate coverage. The task force needed to knowhow much potential need there was and what thecost implications of various sorts of entitlementmight be. The hospital statistics had shown the inci-dence of illnesses resulting in an inpatient stay forthose without any insurance. The data also showedhow many had insurance but had high cost illnesses.
The household Health Interview Survey re-vealed that the percentage of persons under 65without any kind of third party coverage was ap-proximately 7-8 percent. It was estimated that thiswas approximately 60,000-65,000 individuals. Thenumbers of individuals who would have to be en-rolled in a State program gave considerable causefor questioning the ability of the State to absorbthese potential costs.
The extent of any new program is determinedby the availability of resources and the willingnessof those in authority to deploy the resources. Thefinal decision hinged on a complex mix of political
, factors. In Rhode Island, a large scale health pro-gram, attractive to many in theory, was simply notfeasible, primarily for economic reasons.
Various data. items were regularly referred toduring the debates on what was affordable andwhat was feasible, but the statistics were also useful
once the mode of financing and dollar limits whichthe State could commit had been decided. At thatpoint, the data assisted in spelling out the financialimplications of several benefit packages. These al-ternatives themselves represented a much narrowerrange of options than originally considered.
As a result of the detailed information provid-ed, actuaries and State officials were able to estimatecosts of the final alternatives for the Governor’sdecision. For once, projections could be made on
local data, a distinction which is particularly impor-tant when one is considering programs in the mil-lions of dollars.
The program was intentionally designed to beone which “would not cost a great deal of money. Itwas structured to take advantage of the fact thatmost people in Rhode Island do have insurance,since it covers costs which are truly catastrophicbeyond insurance or represent very high out-of-pocket costs. By its design, it offers incentives to getpeople into a qualified health insurance program.Although it is a limited financial commitment, mostof the people of the State have for the first time theassurance that the consequences of major illness orinjury will not lead to financial destitution..
This case study illustrates how data can be usedin a local situation. Naturally, we in Rhode Islandtend to be biased and feel that our work is impor-tant, but the fact that the State of Rhode Island,subsequent to this experience, agreed to fund an-other large survey of households in the State to col-lect more information of the distribution of theburden of out-of-pocket expenditures and inci-dence of health problems suggests that those re-sponsible for health policy and decision making in*e State agree that carefully collected and analyzedhealth economic data can be of substantial benefit.
We are required annually to report to the Gov-ernor and the Legislature on the State’s progress incontaining health costs. Another section of theCHIP Act requires us to produce an annual reportwith respect to Rhode Island’s Health status. Espe-cially note that tils section of the Act mandates usto do a? annual funds flow analysis.
We have been at this game only a short time,and do recognize shortcomings and needs for re-finement. However, one thing that we have learnedis that national health expenditure data cannot beused for health policy decisions at the State andlocal Level.
329
USEFUL HEALTH ECONOMICS STATISTICSLOCAL LEVEL
AT THE STATE AND
Ms. Mildred B. Shapiro, Associate Director, New York State Healti Planning Commission,Albany, ~ew York “
Economics, you may recall from your under-graduate days, is defined as the allocation of scarceresources. As a representative of New York Stategovernment, and as a native of New York Gity, Ifeel particularly qualiied in this year of our finan-cial drought to talk about scarce resources.
Why was an economist invited here at all?Economist Robert Lekachmanl, has noted thateconomists are slightly more entertaining thanbankers, but a trifle duller than lawyers. Theyspeak in tongues as difficult to comprehend as thedialect of nuclear physicists, molecular biologists, orrespectable literary critics. Despite the fact thatmost economists are individuals of good will, theynevertheless “make the oddest statements and pro-mulgate undue quantities of faulty prophecy and
. policy prescriptions.”That modest introduction on the deeds of
economists in other fields is a fitting tribute to theirsuccess in controlling health costs. And how areeconomic data to be effective in the fight againstpersistent inflation?
Competing demands for health services arenow pursuing scarce dollars. And more and more,the sounds are heard of cost effectiveness and costbenefit analysis, and marginal costs and marginalbenefits. In any competition for limited resourcessomeone gains and someone else loses. If consum-ers and tilrd-party payers restrain spending andthereby effect a gain, providers will receive less.And it is precisely because tils game is so well un-derstood by providers that there has emergedstrong lobbying forces which pursue those scarcedollars in the name of “qualhy of care” while obfus-cating the facts and blurring the issues.
Because of our failure to develop and dissemi-nate meaningful data, we believe in such myths as
. the existence of a shortage of physicians in theUnited States. And for the most part, we do not be-lieve in such truths as “surgical intervention maybehazardous to your health.” Yet the death ratedropped twenty percent in Israel when the physicianswere on strike. One wonders what happened to thedeath rate in California when the physicians were onstrike over the malpractice insurance issue. No wordhas been heard from the biostatisticians in that State,nor do I expect that we will hear from the MedicalSociety of the State of California.
Aside from the very basic problem in thehealth field that the data is either unavailable, inad-
equate, or invalid when it is provided, we have noteven defined our terms. Ask any business economistto define the unit of production at the Buick Divi-sion of General Motors and he will have no difficul-ty in identifying a Buick automobile. Ask any agrar-ian economist the unit of production in the field ofagricdture and he will produce data on crop pro-duction. But ask a, health economist for a unit ofproduction in the field of health or medical care,and you will be met by either silence, mumblings,flim-flammery, or a response which reveals thatmany health economists do not know their inputsfrom their outputs. For instance macroeconomicstudies of hospitals often analyze the pounds oflaundry processed, the number of x-ray tests andlaboratory studies performed, or the number ofprescriptions filled. bnsidering such items units ofproduction would be comparable to a General Mo-tors’ report to stockholders which enumerated thetons of steel, miles of hose, and gallons of paintprocessed.
What is most often measured as a unit of pro-duction in the hospital field is a patient-day of care,or a discharge. A patient-day of care is counted asone unit, whether it was provided in the intensivecare unit at Massachusetts General Hospital~ or in a50-bed community hospital in Tusca]ossa, A dis-charge is counted as one unit whether the patient isrestored to good health, has been the victim of aniatrogenic accident or nosocomial insult, or is hori-zontal on the way to the morgue. Those of you whoare statistically oriented and who would prefersome refinement of the data, such as “live dis-charges: should know that no units of productionare published by the American Hospital Associa-tion. The only data remotely relevant are the num-ber of admissions and average census figures. Nodischarge data are available, and certainly no dataon mortality. New York State routinely requestsmortality data from hospitals and nursing homes,but I wonder how many other States request suchbasic information from the institutions they regu-late.
It should also be noted that the raisond’etre of health institutions is to care for people.Yet again, the American Hospital Association pub-lishes absolutely no information on the characteris-tics of the people they treat, as though patientswere somehow incidental to their institutional im-peratives. What is needed as a minimum are the
330

age, sex, and discharge diagnoses of the inpatientpopulation by some measure of severity, for plan-ning and reimbursement purposes, and for numer-ator information. A population count by age, sex,ethnic group and socioeconomic characteristics forthe area as a whole is’ needed for denominator in-formation. The allocation of resources is largelydependent on the needs of “tie population to beserved. Too often, health economists dwell on utili-zation statistics without linking such information tothe general population, or the potential users ofhealth care services. The decennial census, Medi-care surveys and population surveys of the NationalCenter for Health Statistics are all necessary sourcesfor economists and planners. Both Dr. Paul M. Ell-wood and Dr. Paul M. Densen at Harvard havesuggested greater emphasis on denominators orpotential users of the health care system, ratherthan the current strict attention to users.
Thus far, I have talked about service character-istics without any mention of economic data orcosts. Economic or cost information can be dividedinto macroeconomic studies and macroeconomicstudies. From the macroeconomic point of view, weare generally concerned with costs of individualhealth facilities, systems of uniform cost accountingand measures of fiscal solvency or the financialhealth of the institution. Yet even in the most so-phisticated States, uniform cost accounting has notbeenach~ve~, _ _ _..
The three major third-party purchasers—Medicaid, Medicare, and Blue Cross—for the mostpart reimburse on a cost-based system. The empha-sis therefore has been on cost identification and costfinding. It has been in the providers’ interests tocarefully identify and enumerate all costs, and tolearn the rules of the game so as to maximize third-party reimbursement. According to some hospitals,deficits have become a serious problem. Two fig-ures are essential for the calculation of a deficit, therevenue and the cost. There are a number of pro-grams in New York State, and I assume ,in otherStates, which are designed to relieve the deficit, inwhole or in part. Thus, for purposes of deficit cal-culations, revenue accounting has become critical.Yet revenue accounting has been ignored by mostagencies, including the Federal Government. Asmore and more in-depth auditing is performed, wefind the attention to visibility of costs is notmatched by visibility of income. Instead, income isburied, offset, or concealed, while costs may be ov-erstated to maximize so-called deficits.
The exploitation of public funds has not beenconfined to the proprietary sector. The so-diednon-profits, armed with tax exempt status, appearto be essentially benevolent to the general public.Yet while they may not commit outright fraud, asin the case of some proprietary nursing homes,
their accounting practice;, and their passive rolewith respect to exploitation by some practitionersand board members raises questions of accountabili-ty.
A recent report published by the Center forPolicy Research phrased it this way: “we refer toforms of profit-making which are at odds with theunderlying rationale of not-for-profit corporations,not as currently written in existing laws and regula-tions but as widely held and understood as legiti-mate expectations by members of society.”- “Theyinclude rake-off schemes, self-dealing transactions,unconscionable profits generated from conversionof real estate properties to not-for-profit ownershipor management, and allocation of fees, salaries andfringe benefits vastly in excess of those consideredreasonable and customary,”z
Economists and statisticians generally clamorfor more and more data. They are frequently metwith opposition by providers who resist change andseek the preservation of their current organizations,structures, hierarchies and patterns of control.Medical care institutions seek to preserve their au-tomony with their overriding objectives being amaximization of profit, the maintenance of profes-sional automony and institutional control, and ex-pansion by upperclass managerial and professionalrepresentatives. Thus the development of data anddisclosure are natural enemies of the provider.
Exposure of conflicts of interest of hospitalboard members have been widely published in thepopular media. There have been revelations -re-garding large amounts of money held in the non-interest bearing accounts of banker board members,and of attorneys and insurance brokers who serveas board members while receiving all of the hospi-tal’s business. The General Accounting Office con-cluded from one of their studies that some of thesearrangements were beneficial to the hospital. Yethow is the general public to know unless there isdisclosure?
New York State currently” requires that all hos-pitals file a copy of Schedule A, IRS-990, a formwhich requires disclosure on the part of non-profithospitals of any transactions with board membersfor the purposes of acquiring or maintaining taxexempt status. This form is received only fromnon-profit hospitals except those who claim reli-’gious exemption. A bill has been introduced by theGovernor of New York State which requires thatthe information requested be extended to hospitalsunder religious auspices, government hospitals, andproprietary hospitals. Not surprisingly, this bill isopposed by the Hospital Association of New YorkState.
In order to assure that the health facility is notsubject to exploitation by those professionals whoare privileged to use the resources of the institution,
331
there should be disclosure of the payments to cer-tain physiaans. For example, hospital-based physi-cians have received some notoriety since the incep-tion of the Medicare program, and the opportuni-ties or temptations afforded by Part B. Percentagesof bfing arrangements have become commonplace,and concessionaire arrangements on a commissionbasis have not appeared to be in conflict with thephysicians’s professional etilcs.
Senator Talmadge has introduced legislationwhich would prohibh this type of arrangement, not-ing in a recent speech in Washington, D. C., thatone pathologist in a 100-bed hospital earned over$400,000 annually. Had there been disclosure ofthese types of arrangements during the past tenyears, it would not have taken a decade to evenpropose legislative remedies.
New York State, for the past two years, hasrequested data on key departments, e.g., laboratory,diagnostic and therapeutic radiology, and anesthe-sia, requesting the amounts paid to physicians orcorporations when such payments are in excess often percent of the gross cost of that department.The report also requests the number of individualsin each corporate entity so that an average annualamount per physician may be dtiated.
Other types of economic data which are of in-terest to State and local planning bodies are thesources of income to health institutions by type ofpayer. For example, what percentage of income isderived from Medicaid, Medicare, Blue Cross,commercial insurance, self-pay? To what extentdoes the hospital rely on gifts or endowments, andgovernment grants? What is the nature and extentof debt financing? This type of information is re-quired for economic feasibfity studies, particularlyin the Certificate of Need review which is requiredunder the National Health Planning and ResourcesDevelopment Act of 19’74.
One of the purposes of macroeconomic studiesis the measurement of the efficiency of an organiza-tion. In the production of any service, there existsan optimal relationship between the inputs to theproduction process and the outputs of the process.For management purposes, there is required ameasure of the costs or inputs consumed by thevarious cost centers and a measure of the outputsor revenue produced by each cost center. Hospitalsspend millions of dollars on electronic data process-ing and are generally inundated with computer prin-touts. However, few such facilities collect informat-ion which will enable them to make key manage-ment decisions or to motivate efficiency”in the deliv-ery of health care. While some institutions mayknow the bottom line, they cannot determinewhether they are operating at an. efficient level, norcan they evaluate the financial consequences of de-cisions involving the quality of care.
332,
Getting away from macroeconomic studies, andwithout dwelling on the details of a thirty-pagefinancial report used in our State, let us turn tomacroeconomic information. Aside from financialresources, of equal importance are human re-sources, or the vital issue of health manpower.Health is a labor-intensive industry. In most hospi-tals in our State, payroll accounts for seventy per-cent of cost. Hospitals have been able to identify280 different job titles, excluding physicians. In thephysician category, there are approved examiningboards in twenty-two speciahies for allopathic physi-cians and fourteen for osteopathic physicians, Thetwenty-two specialties do not include the many sub-specialty areas of competence. For instance, theAmerican Medical Association lists sixty-four differ-ent specialties as determined by the existence of arecognized specialty board, the existence of ap-proved residency programs, or the existence of arecognized specialty society which identifies thefield of medicine not included in the first two cri-teria. Overrun as we are by specialization, moststates and areas do not have any inventory of typesof practicing manpower to assure that we have the“right number of the right kind in the right place,”Ideally, there should be a plan for manpower re-sources based on health services needed to achievespecified goals. Manpower requirements, however,are influenced by the manner in which health serv-ices are delivered, the use of allied health manpow-er, geographic distribution and the quality and costof health care. Forecasting health manpower shouldbe as simple a task as forecasting changes in thebusiness cycle. And we know what a great recordeconomists have in the area of cyclical forecasting,Yet trying to forecast what we need and planningto fulfill that need, is complicated by the fact thatwe don’t know what we’ve got. Since our basicmanpower problem is not one of shortage, but ofgeographic and specialty maldistribution, h is im- <portant that we determine on an area’ basis “who isdoing what to whom and where.”
Macroeconomic analysis of health expenditureshave been performed by the Social Security Admin-istration of the Department of Health, Education,and Welfare since 1960. They are the source forthe oft-quoted statistics on the growing percentageof GNP which is spent on personal health care ex-penditures. This longitudinal analysis has been es-sential and invaluable in permitting us to evaluatetrends in health expenditures, the role of third-party payers, comparisons of the public and privatesector, and the components of rising health costs,Yet on a Statewide or areawide basis, data on per-sonal health care expenditures are virtually non-existent. New York State has been compiling suchfigures since 1969. South Carolina has publishedcomparable State statistics. I know of only a few

other S&tes which have attempted to parallel thedata developed by the Social Security Administra-tion. This kind of data on an areawide basis wouldbe invaluable to Health Systems Agencies. Whatcould be more useful to planners than knowing thesize of the health economy in that area when mak-ing recommendations on expansions or new serv-ices by estimating the impact of new plans on theexisting health economy? In the jargon, it’s calledmarginal iosts.
Other needs of Health Systems Agencies willno doubt focus on a favorite game of local planningbodies, namely bed counts. While planning forhealth care needs is probably considered an em-bryonic art form, there nevertheless has emerged anumber of sophisticated and semi-sophisticatedformulas for assessing bed needs. I cannot butagree with Dr. Paul M. Ellwood, who in a recentInterstudy Report on Assessing the Need for Hos-
pital Bedss had this to say: “I’m afraid these mathe-matical security blankets may turn out to be healthplanning’s equivalent to the Viet Nam body count;namely, numbers that give a sense of success andan appearance of precision when the battle is ac-tually being lost. The majority of the bed need cri-teria that planning agencies intend to use simplykeep one step ahead of the demand created by agrowing health care market fueled by the inflation-ary pull of advances in technology and the push ofexpanding third party coverage.” What Ellwood issaying, if I may translate, is that formulas reflectexisting use rates which have been influenced bydemand-pull inflation and galloping medical tech-nology. If the supply of beds is supposed to controlthe demand, but the supply of beds is determinedby use rates, what are we controlling? Economistsand planners may have to set priorities based onapproval of “less expensive alternatives” which sub-stitute for inpatient facilities. The current formulasmerely pave the way to failure and escalating costs.
I would be somewhat remiss if I discussed eco-
nomic data without specifically mentioning the im-pact of new technology on health costs. Those whostand to profit from technology, and it is not alwaysthe patient, rigorously defend technological innova-
tion. Some factions of organized medicine arguethat the purpose of advanced medical technology isto save lives, that it is immoral to discuss cost effec-tiveness, and that in economic terms, death is theuhimate economy. Critics on the other hand, askfor a reassessment of the need for new machines,of comparisons of costs with results, of the purpose-lessness of detecting conditions which are hopeless.
Among the critics is one physician who decriesthe massive proliferation of electronic, computer-ized,” automated and nuclear devices. In an unlikelysource, MedicaJ Economics, he asks whether allthese devices help the patient, or are they justshortcuts. Can their costs be justified in terms ofpatient benefits? What more fertile field for cost-benefit analysis in the field of health than an evalu-ation of new technology. And what an opportunityfor a business economist to analyze whether therevenue to be generated by the operations of thenew technological innovation will cover the capitalinvestment and operating costs incurred. Not sur-prisingly, investor-owned hospitals, geared to theprofit motive, are much more cautious than volun-taries about investments in expensive new equip-ment.
Many other kinds of economic data are neededfor short and long-term planning. I don’t, knowabout St. Louis, Missouri, but in Albany, New York,and Washington, D.C., long-range planning meansgetting through the weekend.
Footnotes
1. RoBert Lekachman, Economists at Bay - Why tieExperts Will Never Solve Your ProbJems, McGraw-HiflBook Company.
2. Amitai Etzioni and Pamela Doty, Profit in Not-for-,Profit Institutions, A position paper for Center for
Policy Research.
3. Assessing the Need for Hospital Beds, InterStudy.
4. “Let’s Fall Out of Love with New Technology”, Medical
Economics, February 9, 1976.
.4
333

A SMALL AREA, EPIDEMIOLOGIC APPROACH TO HEALTH CAREDATA
John E. Wennberg, M.D., Assistant Professor, Department of Social and Preventive Medicine,Harvard Medid School, and Member, Center for the Analysis of Health Practices, School ofPubiic Health, Harvard University, Boston, Massachusetts
The demand for statistics describing localhealth delivery systems has never been greater.Agencies such as Professional Standards ReviewOrganizations, Health Systems Agencies, State Cer-tificate of Need Programs, Insurance Commission-ers and Rate Setting Commissions are asked tomake decisions that affect the resources of specificinstitutions and populations. To do this, they needinformation on the performance of the institutionsthat deliver services to a specific community, parti-cularly their. individual and collective impacts onthe population. This information is provided by apopulation-based data system which fully coversmajor aspects of a community’s health resourcesand utilization.
The Cooperative Health Statistic System(CHSS) is expected to play a major role in provid-ing such information to planning and regulatoryagencies. What are the prospects that this responsi-bility can be successfully fulfilled?
My paper today concerns two aspects of thisquestion.
First: On the basis of experience in Vermontand Maine, two States with full population coverageof hospital utilization, I hope to convince you thatti improved analysis of local personal health deliv-ery systems is technically feasible and of vital im-portance to the mission of planners and regulators.Utilization data are *e cornerstone of a successfulstrategy; wifiout utilization data, no analysis can bedeveloped that is fundamentally relevant to plan-ners and regulators. And without a population-based, epidemiologic framework for analysis, othercomponents of the CHSS system—such as manpow-er and fac~lty inventories—are of limited value toplanners and regulators.
Second: The impediments to achieving com-plete population coverage of utilization data areformidable and largely out of the hands of theCHSS; indeed, they are largely out of the hands ofthe Federal government. Whhin the foreseeablefuture and under current strategies for implemen-tation, a population-based framework for analysesof local health caie systems will remain a promiserather than become a reality in most of the UnitedStates. However, an alternative strategy can providea timely intermediate step toward the full imple-mentation of uniform utilization abstract systems inareas where population-based statistics describingutilization are not available. The strategy I suggest334
is based on the use claims data—particularly fromMedicare Part A and B-to obtain for enrolledpopulations indicators of resource inputs and utili-zation at the small area or community level of ag-gregation. I also suggest that the CHSS take an ac-tive role in helping tith the implementation of thisstrategy.
The Importance of Small Area,Population-Based Data to theCHSS Mission
An example of small area, population-basedapproach to data acquisition and analysis is provid-ed by Vermont. This State of less than 500,000people has over 250 local communities, the Ver-mont town. For all Vermont residents, full coverageof important aspects of utilization has been ob-tained, including hospitalizations, nursing homeadmissions, home health agency encounters and,through Medicare Part B claims data, certain as-pects of ambulatory care- Census data, vital records,manpower and facility files and a household surveyare also available. These files have been used syn-ergistically to achieve descriptive and analytic stud-ies of health care delivery in the various communi-ties of the State.
To study the market for hospital services, thecommunities of the State have been aggregated intohospital service areas, based on community levelpatient origin studies. For each hospital servicearea, we have obtained age-adjusted rates of utiliza.tion for hospital and selected other levels of care,Studies of the hospitalized case mix and estimatesof the probability of organ loss through surgeryhave been obtained. We have also estimated impor-tant aspects of the per capita investment of healthresources.1
Before giving you some examples of thesemeasures, I would like to emphasize an importantrationale for the use of small area data covering thepopulation-at-risk. The rationale is that institution-al indicators (which are obtainable without refer-ence to a population) do not adequately predict theexperience of the population who receive the insti-tution’s services: Indicators such as occupancy rate,length of stay, personnel per bed or cost per casedo not adequately predict beds per capita, patientdays per capita, personnel per capita or expendi-

tures per capita.z To understand use of resourcesfor a particular level of care (such as ambulatory orimpatient care), it is necessary to evaluate all thevariables in the following equation:
Number of Cases AverageResource Use = Treated Resources
Population , Population x Used Per Case
As it turns out, the number of cases treated perpopulation rather than the amount of resourcesinvested per treated case is usually the importantvariable in determining differences among neigh-boring communities. in resource use per population.Our studies in Vermont and Maine demonstratestatistically significant, usually large differencesamong local communities in the number of casestreated per capita, whether at the hospital, thenursing home or ambulatory “level of care”. Hospi-talizations and surgeries among Vermont childrenprovide typical examples of ~his phenomenon.
Among the thirteen largest Vermont HospitalService Areas the overall rate of admission to hospi-tals among children between one month and twentyyears of age varies between a low of 742 to a highof 1,387 admissions per 10,000 children.s (Therates are annualized, age-adjusted and based onfive years of data, 1969-1973.)
When one looks at specific types of cases, thevariations are considerably greater. For example,over the five year period, tonsillectomies, admissionfor pneumonia, for gastro-intestinal infection andacute bronchitis show about a five-fold range ofdifference. Only for surgical procedures to correct asmall group of congenital anomolies are the ratesabout the same among areas: inguinal hernia proce-dures, surgery for hydrocephalus and for cleft pal-ate are the only procedures we identified in whichno area is statistically significant in its differencefrom the average rate for all areas. On the otherhand, other congenital conditions, such as umbilicalhernia surgery, show large differences in incidenceamong areas.
The importance of variation in the number ofcases treated per population to resource use is indi-cated in Fi~re One, which “evaluates” all the varia-bles in the hospital bed use equation:
Bed Use Admissions ~ Average Length ofPopulation = Population Stay Per Admission
It is clear that for most pediatric conditions,incidence variation is more important than lengthof stay variation in determining the consumptionrates of the population-at-risk. Only for inguinalhernia (a condition with relatively low coefficient ofvariation in incidence among areas) is the length ofcare of dominating importance in differences inutilization.
Preliminary data from Maine have been ob-tained to evaluate the per capita expenditure equa-tion for common surgical pro-cedures:
Expenditures Number of Cases
- ‘-- ‘;~~~;;;n x
Average CostPer Case
Our results are reproduced in Figure Two. Again,variations in incidence rate of surgery have a largeeffect in terms of variations in per capita expendi-ture rates. And variations in ‘cost per case have asmall effect. This information should be of obviousimportance for agencies with responsibility for con-trolling the cost of medical care: For most of thecommon hospital practices of medicine and surgery,it is the decision to admit to the hospital or use thesurgery rather than the intensity of care after ad-mission that is responsible for most of the variationsin expenditure and use of hospital beds among thepopulations living in the communities of a region.Small area, population-based studies make this ap-parent and are essential for the proper phrasing ofplanning and regulatory questions concerning med-ical need and necessity.
A typical question raised by the data concernswhether more or less is better. For example, fortonsillectomies:
Is it better, in Vermont, to undertake tonsil-lectomies on 63 percent of children and expend$5.69 per capita or to remove 8 percent of tonsilsand expend $0.63 per capita. Both strategies forallocation of this common surgical practice havebeen empirically observed.A
Let me further illustrate the question raising poten-tial of small area data, using observations on varia-tions in service among the over-65 population.These studies are based on a zip coded completesample of Medicare Part B claims processed duringthe first two months of 1972. This data, whichprovide measures of ambulatory as well as inpatientutilization, raises important questions concerningthe performance of the health care system.
The point I want to make concerns the incometransfers between residents of the different geo-graphic areas which follow from Medicare Part Bactuarial policy and variations in reimbursementswhich follow from place of enrollee residence rath-er than enrollee illness. We estimate about a three-fold variation among the hospital service areas inVermont in reimbursements per enrollee. In 1973,enrollees living in the high reimbursement areareceived $162 per capita; those in the low area re-ceived about $58. Enrollees in low reimbursementareas do not receive back their own contribution tothe program; those in the high area receive theirown contribution, the Federal treasury’s share
335

Figure 1. Relationship f admission rate and length of stay with patient days for all and selected pedi-2atric conditions. The R statistic is from the logarithm example of the regression equation.
x
x
ALL PEDIATRIC ADMISSIONS
x
xx
x
x xx x x
3.50 3.75 U*OO U.25 9.50
AVERAGE LENGTH OF STAY R2 = .03
60b0
Sooo
Uoao
3000
U.75
x
xx
Xxxx x
# a t 6 I
600 800 1000 1200 Iuoo
ADMISSIONS PER 10,000 R2 = .85
.336

500
Uoo
300
,200
100
0
.
x
x
x
x
xxx
xx
x xx
x
1 I I 1
1.00 1.50 2.00 2.s0
AVERAGE LENGTH OF STAY R2= .67
o00.0
Soa
400
300
200
TONSILLECTOMY
100
I
1 x
o
x
x
xxx
x
xx
o. 50 100 150 200 250
ADMISSIONS PER 10,000 “R2 = .95
337

o00-0
%L
?an
5I.u
F<L
338
1au
80
fio
40
20
x
xx
xx
xxx
xx
x
INGUINAL HERNIORRAPHY
1.00 2..00 3.o@ ~.oo S.oo 6.00
AVERAGE LENGTH OF STAY R2= .73
x
x
x
xx
xx
x x
xx
10 1s 20 25 30
ADMISSIONS PER 10,000 R2 = .00
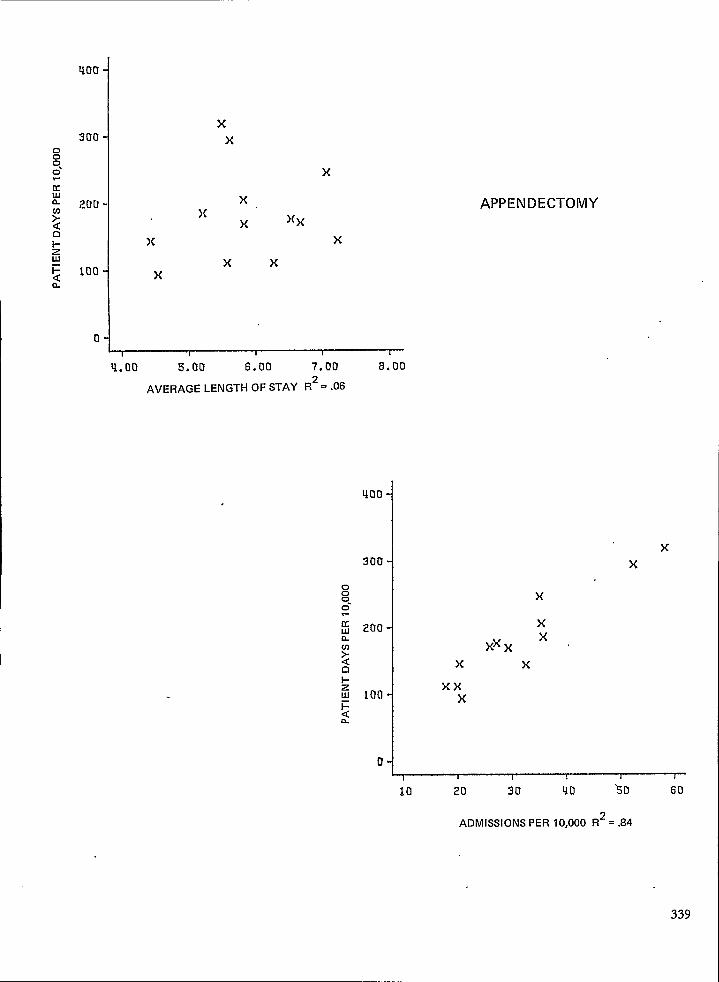
!00
300
20[J
100
0
xx
x
xx
x
xx
xxx
x
q.oo 5.00 6.00 7.00 8.00
AVERAGE LENGTH OF STAY R*= .06
400-
300-
~0.0
APPENDECTOMY
xx
x
xx
xxxx x
xxx
10 20 30
ADMISSIONS PER
Qo ‘5 o 60
0,000 R*= .84
339

600
400
200
0
)(
x
x
x
. xx
x xxx
x
x
x
1 I 1 1 I I
3.00 U. Oil s. 00 6.00 7.00 a.oo
AVERAGE LENGTH OF STAY R2= .35
PNEUMONIA
o00.0
0 20 qo 60 80 100
ADMISSIONS PER 10,000 R2 = .85
.
xx
x x
xx
xxx

300
x
x xxx
xx
x
.x
x
x
1,00 2,00 3.00 U.oo 5.00 6,00
AVERAGE LENGTH OF STAY R2= .27
DYSENTERY, GASTROENTERITIS,
DIARRHEAL DISEASES
x
x
xx x
xxx
xxx
x
x
o 20 Uo 60 00 100
ADMISSIONS PER I0,000 R2= .75 -
341

Uoa
0
x
x
xxx x x
xx
xx
1,1 1 [ t I
2.00 3.00 4.00 5.00 6.00 7.00
AVERAGE LENGTH OF STAY R2= .17
ACUTE BRONCHITIS
o00.0
u: 200YaD1-ZUI~ 100
n I
~xxx
xx
x
x
xx
J *o
o 20 ~o 80 So
ADMISSIONS PER IO,OOO R2=.86
342

Figure 2. Relationship of admission rate and cost per case with cost per capita, adapted from:Wennberg, J. E., Gittelsohn, A.r Shapiro, N.: Health Care Delivery in Maine I II: Evaluating theLevel f Hospital Performance, J, of Maine Med. Assoc., 66 (11 ), 298-306, November, 1975.
9The R statistic is from the logarithm example of the regression equation.
)(
x
x)(
x
APPENDECTOMY
x
x
500 s5a 600 650
CHARGE PER CASE R2 = .18
1.40
1420
0.60
700
x
x
xx
x
x
~10.00 12.50 1s,00 17. s0 20.00 22.50
ADMISSIONS PER 10,000 R2 = .90
343229.121 0-77-23
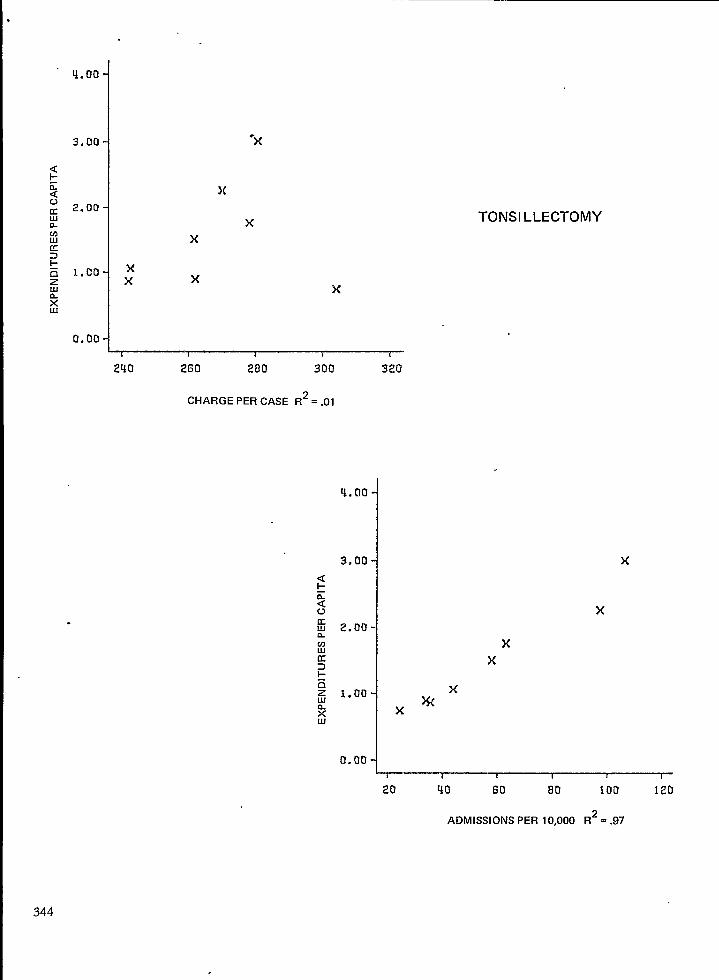
4.00
3,00
2.00
1,00
0.00
“x
)(
TONSILLECTOMY
x
xx x
x
2U0 260 280
CHARGE PER CASE
300 320
R*= .01
<1-ZavKun
-nzLll
2UI
q.no
3.00
2.00
1,00
0.00
xx
xXw
1 I I t 1 1
x
x
20 qo 60 80 $00 120
ADMISSIONS PER 10,000 R*= .97
344
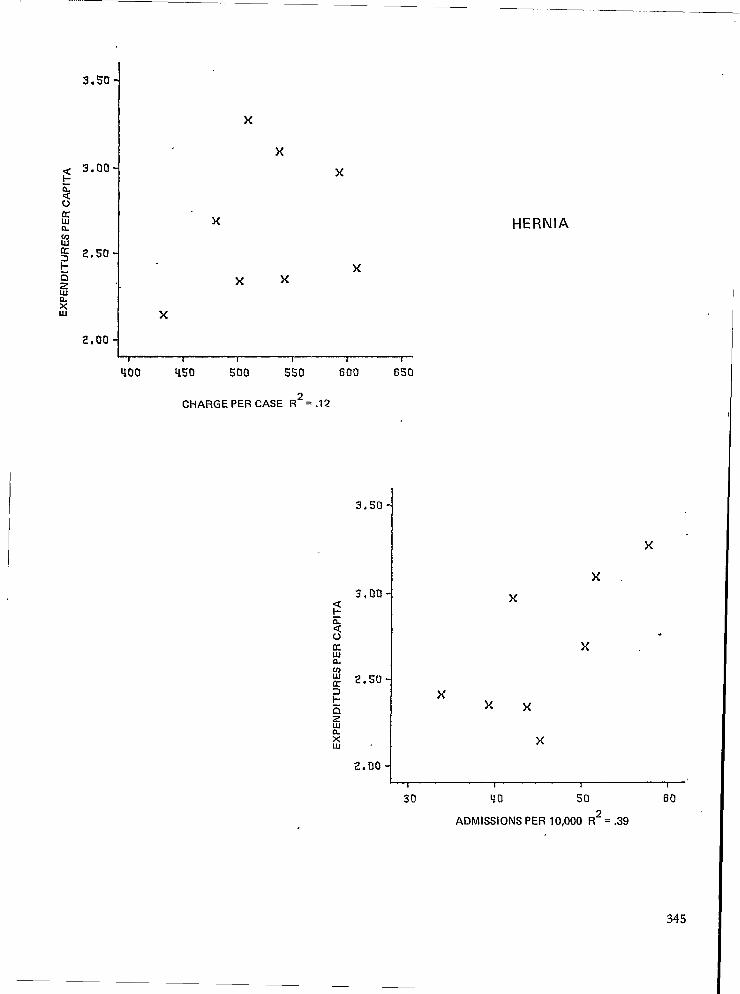
3*5O
3.00
2.s0
2,00
x
xx
x
xx
xx
x.
xxx
x
I 1 1 t 1 I
400 U50 !iOo Sso 600 650
x
2.00‘/ x
~’30 40 50 60
ADMISSIONS PER 10,000 R2 = .39
345
CHARGE PER CASE R2 = .12
3.50
3,00
2.s0
.

.
x
x
HYSTERECTOMY
x xxx
x
1 t 1 I 1 i
825 850 875 900 92s 950
CHARGEPERCASE R2=.38
7.00
6.00I
x
x
x
Uo so 60 70
ADMISSIONS PER IO,OOO R2= ,97
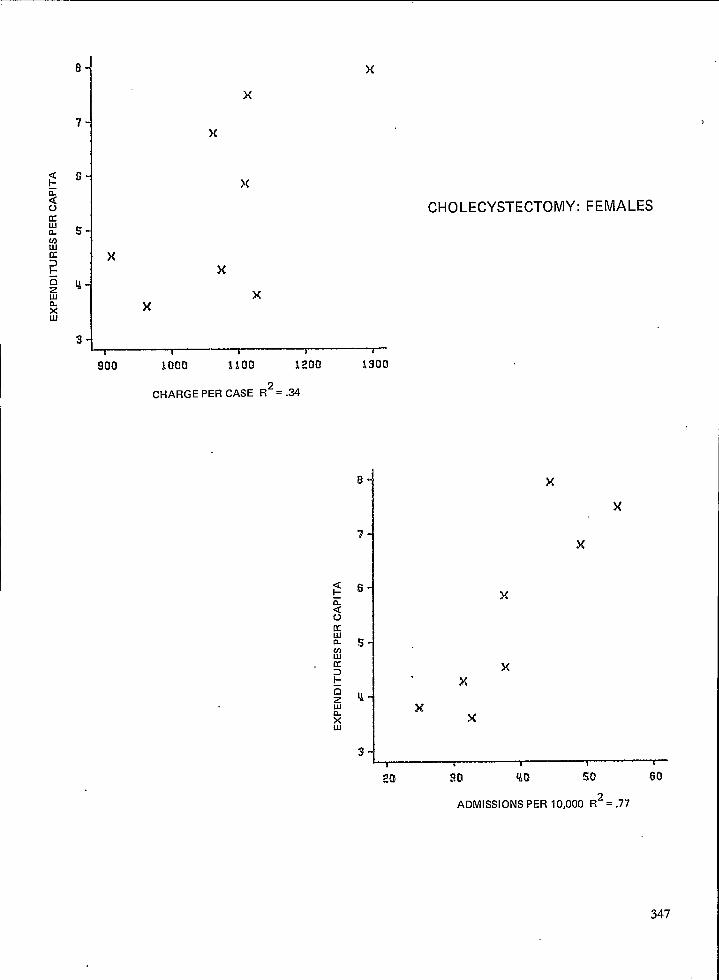
x
x
x
x
CHOLECYSTECTOMY: FEMALES
x
x
x
x
~~300 1000 1100 1200 1300
CHARGE PER CASE R2= .34
20
x
x
x
x
ADMISSIONS PER 10,000 R*= .77
347

(which is half the national average reimbursement),plus additional dollars not “needed’’i notherareas.These transfers among communities appear to re-sult from differences i; local medid ca;e systems.s~ey should Presumably be of interest to localplan’ning and r~gulatory ~gencies.
Utilization data is also essential to the DroDer,1
understandin~ of the distribution of resourcesthroughout the communities of the region. InVermont, using data files on description of physi-aans and other health manDower. facilities and in-,stitutional expenditures, we have allocated theseparameters o~ resource investments back to the lo-cal communities DroDortionate to local resident udl-
,1
ization. This process, which serves to correct formigration across community borders to use care,reveals striking differences among local communityresource inputs which bear, of course, no close rela-tionship to the average per capita rates for theState, ~akenas a whole: - -
In 1969, hospital beds, employment and ex-penditures show about a two-fold range of differ-~nces among areas.1 Physician manpower varies bya factor of 1.5 between the highest and lowest area.However, when considered in terms of physicianspecialty the range of variation is much gr~ater. Forexample, general practitioners who restrict theirwor~~ads TOnonsu~gical cases vary from 0.5 to 4.5per 10,000 population.
Without an estimating procedure along theselines, planning agencies cannot be aware of wherethe health resources of their region are being in-vested. But of greater importance, the associationsbetween health ‘resource fiDuts and utilization and,-expenditures cannot be easily seen. For example,the data demonstrate an association between thenumbers of persons employed per capita in hospitalin 1963 and expenditures for hosDitd and reim-bursements und~r Medicare Part B ‘nearly a decadelater. We also find that greater rates of input ofsurgeons is associated witi- greater rates of surgery;areas with relatively more general practitioners(who restrict their workload ~o nonsurgical cases)have lower rates of use of hospitals and surgery.(Figure 3)
I cannot, within the context of this presenta-tion, explore systematically the issues of why vari-ationsoccur. I mention these examples to’ alert youto the potentials of small area analysis for increas-ing understanding or the dynamics of local and re-gional health care markets,’ particularly by bringinginto sharper focus the effects of suppliers in influ-encing the amount and type of services “demand-ed.” It is my belief that imDroved understandingalong these lines must occur ~efore a mature publ~policy concerning the planning and the re@ationof the health care system can be articulated.
I would, however, like to dl your attention tothe hazards planning operations face when they do348
not use population-based data. Institutional indica-tors such as length of stay, cost per case or averageoccupancy are poor indicators of the actual per cap-ita rates of consumption of health care services,Therefore, agencies fiat base their decisions onindicators describing only institutions are in hazard ‘of augmenting variations among the communitiesof their region by awarding additional resources tothose consuming at high per capita rates while de-nying them to those with low consumption rates.
Let me give you two examples.
A 1975 report of the Vermont ComprehensiveHealth Planning (CHP) Agency identifies excessbeds and estimates the attendent costs in eachVermont hospital. The criteria for excess beds isbased on an imputed optimum occupancy rate of85 percent: the number of excess beds in a hospitalis derived from. differences between its actual andthe optimum occupancy rate. The costs of excessbeds were estimated “using the conventional as-sumption that the cost of an unoccupied bed is two-thirds the cost of an occupied bed.”G
The results of the CHP Agency analysis can beconstructively contrasted to the estimated per capitaexperience of the population-at-risk. Occupancyrate among local hospitals does not correlate verystrongly with per capita utilization, including ex-penditures: it is therefore not surprising that excessbeds per capita and excess bed costs per capita, cal-culated from the CHP estimate, show a low correla-tion with a community’s total inp~t of beds or ex-penditures. (r = .45 and .20, respectively, among21 areas.)
The difficulty with the CHP extrapolation is il-lustrated in Table 1. The table shows the area withthe greatest estimated per capita excess beds (Area1). It gives its estimated expenditures and bed in-puts, also on a per capita basis, This area rankedlowest among all Vermont areas in per capita ex-penditures, utilization and surgery; by contrast, asecond, contiguous area (of similar size) rankedhighest in per capita expenditures, utilization andsurgery, but had a relatively low estimate of “excessbeds and costs.” While it may in fact be useful tofurfier restrict beds in the low-bedded area, thiscannot be justified from an effectiveness point-of-view. But neither, of course, can an increase inservice. Nor can restriction of beds be justified onthe basis of equity: the area incurs less hospitalexpenditures per capita than all other VermontHospital Service Areas.
A comprehensive public policy on unnecessarycare may well be needed but it clearly cannot pro-ceed from evaluations based on occupancy rates ofhospitals.
These two areas provide a second example ofthe hazards of health systems regulation without

Figure 3. Figure 3 shows the2association between manpower per capita and aspects of medical careutilization per capita. The R statistic is from the linear example of the regression equation.
70
60
5!)
Uo
3s
xxx
x
x
x
x
xxx
ASSOCIATION BETWEEN SURGEONS PER CAPITA AND SURGERY
PER CAPITA, j3 VERMONT HOSPITAL SERVICE AREAS, 1969
t 1 4 I—
2.00 3.00 q.oo S.aa s.an
SURGEONS PER 10,000 R2 = .41
ASSOCIATION BETWEEN MEDICAREREIMBURSEMENTS FOR LABORATORYSERVICES (1972) AND HOSPITALEMPLOYMENT PER CAPITA (1963) 13VERMONT HOSPITAL SERVICE AREAS
3.OC
x“x
x
x x x
xxx
x
x
xx
~~u 6 a la 12
HOSP EMPLOYEES PER 1,000 R2 = .55
349

benefit of a proper database. During Phase IIofthe Economic Stabilization Program, both areasapplied for an exception to the imposed 5 percentlimit on annual increases in charges. The hospitalin Area 1 retired its application prior to a publichearing; Area 2 persisted and, based on a favorablecost per case profile (and a persuasive argumentimputing need) the hospital was granted an excep-tion even though its area ranked high in expendi-tures and has a case mix characterized by high ratesof elective surgery and admissions to hospital.
There is no evidence that medical need isgreater in one area than the other.
Obtaining Utilization Data FromThird-Party Claims Data
Let me turn to the second aspect of the ques-tion concerning CHSS data and the mission ofplanning and regulation.
I believe the efforts in Vermont and Mainedemonstrate that an improved analysis of the per-sonal health delivery system as promised by theCHSS is technically feasible and of vital importanceto the mission of the planners and regulators. UWl-zation data is the cornerstone of the analysis. Butwill the data be available? Under the most optimis-tic current schedules for implementation, it is ap-parent that full coverage of population utilizationwill be available to only a small minority of the newgeneration of planning re@atory agencies, part~cu-larly to Health Systems Agencies and to Profession-al Standards Review Organizations.
Why is W]s so? There will be many differentanswers to this question. But surely the most impor-tant issue is the absence of accepted public policyconcerning the ownership and confidentiality ofdata. The fuller implications of the expansion ofthe public health statistics system to include utiliza-tion data have not been adequately examined ordebated, particularly at the State level, where, inev-itably, the legislatures must become involved. Thefollowing questions remain to be addressed: What isthe responsibility for private institutions to maketheir data available to public bodies? What publicbody will control the data? Who may see the dataand at what level of aggregation?
An overriding policy concerning the flow, own-ership and coordination of data activities does not,.exist, nor can it easily be made to exist.
With these fundamental issues unresolved canwe wonder that the CHSS is experiencing diffictityin implementing the utilization component? Takefor example hospital utilization. The strategy toobtain complete coverage of a uniform dischargeabstract for every admission to every hospital in aState involves arrangements with each of the hospi-tals concerning the circumstances under which data
350
on utilization will flow. This takes years of organiza-tional work; the achievement of full populationcoverage is an extraordinary event rather than adefinable, predictable milestone on the road to theorderly implementation of a national data system.
I suggest there is a way around this impasswhich should prove valuable to the more immediateneeds of the planners and regulators and also in-crease understanding of the value of small areadata systems.
The value of claims data for describing varia-tions in utilization or expenditures has been dem-onstrated in Kansas by Lewis~ using Blue Cross/Blue Shield data and by several workers using Ca-nadian insurance claims data.s-lo We have had ex-perience in Vermont with the Medicare Part B dataand have found it to be of great value in describingutilization of ambulatory service as well as pointingout variations in surgical and diagnostic case mix. s
The Medicare data have two advantages thatsuit them for small area analysis, They are availablefor virtually the total population over 65 years ofage. For that population subset, the coverage is thuscomplete. The claims forms are zip coded andtherefore can be used at the local level+ The enroll-ment file is periodically updated and this provides,at the zip level, a moving census. But most impor-tantly, the data is administratively under the controlof the Federal government who is committed to theimplementation of the CHSS. It is available at theState level (1OO percent sample) and at the Federallevel (20 percent sample of Part A); initiatives toimplement the data system can thus be organizednationally or locally or at both levels of govern-ment.
The success or failure of several current Feder-al programs is tied directly to data, Third-partyclaims data, particularly Blue Cross/Blue Shield,Medicaid and Medicare, provide a rich source ofpopulation data. For areas with little prospect forrapidly implementing complete population coveragethrough the uniform hospital discharge abstractapproach, the means of acquiring these data shouldbe vigorously explored by the CHSS by PSRO’S andby the new health planning agencies.
Let me end by suggesting the National Centerfor Health Statistics undertake a three-prongedapproach to the problem of small area data forplanning:
1ne tiH>3 snoultl provlUe techmcal ald to over-come important but solvable problems in pre-paring third-party claims data for analysis and inundertaking secondary analysis on a small areabasis.The CHSS should help the States establishHealth Statistics Centers to provide a focus forcoordination of various sources of data and forundertaking secondary analyses.
1.-n..”” . . . . . . . . . .
2.

The centers should see to the distribution ofdata to principle users..
3. Principally through its Applied StatisticalTraining Center, the National Center forHealth Statistics should establish educationalprograms to train personnel at the State andlocal level in the relatively elementary prin-ciples of epidemiology needed to interpretand to understand population-based data.
References -
1. Wennberg, J., Ghtelsohn, A. Small Area Variations inHealth Care Delivery. Science, 182:1102-1108, 1973.
2. Wennberg, J., Ghtelsohn, A., and Shapiro, N. HealthCare Delivery in Maine III: Evaluating the Level ofHospital Performance. The Journal of the MaineMedical Association, 66(1 1):298-306, 1975.
3. Wennberg, J., Grufferman, S.K. Common Uses ofHospitals by Vermont Children. Unpublished.
4. Cooperative Health Information Center of Vermont,
5.
6.
7.
8.
9.
10.
Inc.” Vermont Surgery Study 1969-1971. Burlington,Cooperative Health Information Center of Vermont,Inc., pp. 153-156, 1974.Wennberg, J. “National Health Planning Goals” inPapers on The National Health Guidelines, Volume 3.Department of Health, Education and Welfare,Health Resources Administration, 1976.Unpublished report, Vermont Comprehensive HealthPlanning Agency, 1975.Lewis, C.E. Variations in the Incidence of Surgery.NEJM, 281:$80-884, 1969.Vayda, E., Anderson, G.D. Comparison of ProvincialSurgical Rates in 1968. The Canadian Journal of Sur-gery, 18:18-26, January 1965.Roos, N. P., Henteleff, P.D. A New Audit ProcedureApplied to an Old Question: Is the Frequency ofTonsillectomy and Adenoidectomy Justified? MedicalCare, in press.An Audit of Hysterectomies in Saskatchewan. By aCommittee appointed to study hysterectomies in Sas-katchewan; Dr. Frank Dyck, Chairman.
Table 1
Piofile of Population Indicatorsof Performance
and Status of Planning or Regu-latory Decisions
In Two Vermont Hospital Serv-ice Areas
Age-adjusted admission
rate of hospitalization
(per 1,000,1973Hospital expenditures
($ per capita)Reimbursements for
Medicare P=t B($ per enrollee)
Bed availability(per 1,000)
Planning Decisions:
Excess beds(per 1,000)
Excess bed costs($ per capita)
Exception to Phase IIprice control
Area 1
135
124
92
4.2
1.4
30
Withdrawn
Area 2
230
195
141
7.2
1.0
20
Granted
351

EVALUATIONTHE
IN THE ABSENCE OF DATA: THE EXPERIENCE OFNEW YORK STATE MEDICAID PROGRAM
Mrs. Beverlee A. Myers, Gnsultant, Washington, D.C.
Introduction
This is the paper that asks the question canevaluation take place in the virtual absence of use-ful data? To the extent that value judgments aremade about programs without any factual base,then evaluation does exist and flourish in the ab-sence of data. In the New York State Medicaidprogram there is probably more “evaluation byscandal” than evaluation by rigorous analysis ofdata.
I am always fascinated by Jack Wennberg’s pre-sentations on the kinds of analysis that are possiblewhen population based data are available, fairlycomprehensive, valid, and timely. I don’t know ‘whomakes what decisions based on Jack’s evaluations,but I am sure he population of Vermont is healthi-er because of them.
My task this morning will be to try to counter-act Jack’s impact on your statistical senses, and toconvince you that data is an irrelevant and uselesscommodity in the management, much less the eval-uation, of a $3 billion program like that of Medi-caid in New York. In fact, I will try to convince youthat data is a very dangerous commodity in a pro-gram like Medicaid. Given the Federal-State natureof the program, the more data a State has, themore likely it is that the Federal government willwant to review and audit the data to look for dis-crepancies in expenditures so they can take backsome of their money. In States like New York thathave no data, they can never find the proof that wehave misspent their funds, or at least it takes thema lot longer.
What I will try to do, then, is (1) describe brief-ly the nature and objectives of the Medicaid pro-gram and its evaluation, including the generalproblems of adequate data for evaluation, (2) dis-cuss approaches to evaluating the mutual effectsbetween the health care system and Medicaid, (3)finally to conclude with some thoughts on what theMedicaid program experience means for the fu-ture.
Objectives of Medicaid andGeneral Data Problems
Medicaid is a program of medical assistance forcertain low income individuals and families - please
352
note that not all poor people are eligible for Medi-caid. Medicaid is financed jointly by Federal andState funds, and frequently local government fundsas well. The program is administered by the States,within general and sometimes overly specific guide-lines from the Federal level. Within those guide-lines, States determine the levels of eligibility forservices, the benefits to be financed, the levels ofreimbursement to providers, and they also, througha variety of mechanisms, bring persons into theprogram thrc!ugh the eligibility process, pay thebills of the providers, determine levels of care need-ed and provided, review utilization of services, as-sure quality of care, and, if there is any time left,they may evaluate the effectiveness of what they do.Total expenditures on Medicaid amount to over$14 billion, with $3.5 billion or 25 percent of thetotal spent in New York State.
Because of the general confusion over whetherMedicaid is a welfare program or a health careprogram, there is also general confusion about itsobjectives. Howard Newman, former Commissionerof the Medical Services Administration, pointed out“Medicaid is most often seen as a welfarebenefit.. . . Some view the program as offering aneconomically feasible means of providing necessaryhealth services to part of the population for whomsuch services would otherwise not be available; oth-ers see it as an opportunity to maintain a secondclass of service, with a price which is set at the Statelevel by complicated political and economic bargain-ing process. Still others see Medicaid as an opportu-nity to influence the shape and structure of thehealth care delivery system of this country., Andfinally, the patient, the individual who receivesmedical services by virtue of his eligibility for theMedicaid program, sees tiis program as a way ofreceiving health care.”
If program evaluation is measuring the extentand degree to which programs meet objectives, onecan understand why there is so little true evaluationof the Medicaid program. However, I believe mostMedicaid administrators would agree that they areheld accountable to assure that (1) those who areeligible, and only those who are eligible, (2) receivetimely services but only when necessary, (3) at alevel of quality consistent with need, and (4) at aprice that is reasonable. (5) All of this to take placein the hot glare of political pressures, economic cri-sis, and lurid scandals,

“ Presumably, then, one would expect Medicaidmanagers to collect and analyze data that would tellthem whether or not they were meeting thoseobjectives, and why.
(1) Eligibility
A considerable amount of data is available asan adjunct to the eligibility process. There is de-tailed demographic data, economic and social data,to say nothing of very personal data, collected onwelfare recipients and on applicants for medical as-sistance. In New York State for example, over 200data elements will be computerized as part of theWelfare Management System. But only about 20 ofthose data elements will immediately find their wayinto the Medicaid system, because that numberwould be sufficient to pay the clients medical bills.
One wo;ld assume that this basic informationabout the Medicaid clients would be sufficient todefine a population at risk, and provide the denom-inator for subsequent bqsic analyses of utilization,expenditures, etc. Such is not the case, however, inNew York or most other States, for a number ofreasons:
1) The majority of Medicaid clients are auto-matically eligible for Medicaid because they are inreceipt of cash assistance or welfare. The basic unitin welfare is the case, not the person, since it is thecase that qualifies for the payment and receives thecheck. In New York the Medicaid card and Medi-caid number is issued to the case, the entire family,not the each individual. It is possible to know fairlyaccurately at a certain time how many cases are eli-gible, but only estimates are available on the num-bers of individuals that involves. ~Is fact of caseidentification also complicates tremendously theufllzation data, which I will discuss later.
2) The caseload, both the welfare and medical-ly needy caseloads, are very volatile. They changefrom month to month, not in total necessarily, butin actual people. One month a family may be eligi-ble for AFDC payments and automatically eligible
for Medicaid, three months later, circumstancesmay have changed so that the family is eligible onlyas medically needy, and three months later still, the
. family may be off the rolls altogether, only to re-turn later in the year. However, there is almost noState that is able to trace families and to analyzethese eligibility trends, and changes in categories.
In addition, most persons who qualify in themedically needy category do so by virtue of theirneed for and use of medid care. They are a popu-lation, generally of “users”. They must always beseparated out in any analysis since they distort thepopulation at risk concept.
3) The population is pot always what it seemsto be. At least in a State like New York, there are
tremendous incentives to the client to distort theinformation provided in order to qualify. How doyou handle, in a population at risk concept, the factthat over one third of the clients are in fact ineligi-ble for Medicaid or that Medicaid cards are sold onthe street at a pretty good price, and so the indi-vidual using the card may well be someone differentfrom the one on whom you have data?
4) And finally, in New York State as well as insome other States, the eligibility process is con-trolled at the local level. This means local variabilityin interpretation and documentation. More impor-tantly, it usually means only aggregate reporting ofthe eligible population to the State level. In NewYork, the State has only estimates of the monthlyeligible population, broken down by category of eli-gibility, with no useful demographic data associatedwith the reports.
Even California, with centralized control of theprogram, suffers from inadequate data on the eligi-ble population. A recent report by a little “Hoover”Commission, pointed out that “.. . none of the fol-lowing questions about the eligible population canbe answered . . .
●
●
●
●
●
the exact size of the population?the demographic characteristics of the popu-lation served? Patterns of Residence? Pat-terns in use of services by specifically definedeligibles?periods of time recipients remain eligiblethe pattern of transfers from one eligibilitycategory to anotheretc.;
(2) Utilization
If the eligibility data are inaccurate and lessthan comprehensive, the utilization data are almostnonexistent. With the possible exception of hospitalutilization data, where the uniform hospital dis-charge data set was adopted Statewide for Medi-caid in New York, no utilization data is reportedfrom the localities to the State. In most counties,the case orientation of the eligibility file precludesany profiles of patient utilization. (A 1 percentsample of case records is supposed to be abstractedmonthly, but NYC with 70 percent of the pro~amis unable to do it, so the State data is meaningless).The number of recipients-or the number of per-sons receiving at least one service in a monti-isreported on a monthly basis, so that a count of themonthly average number of recipients is presuma-bly available. However, even this count is questiona-ble since the date of payment for the service, notthe date of ,delivery of service is utilized for the re-cipient count. This count, then, cannot even beused as the numerator for the questionable eli~ble
353
.
count in the denominator,paid on behalf of a personble, but was eligible in the
since the bills may bewho is no longer eligi-month service was re-
ceived. Then, of course, very few counties are ableto provide an unduplicated count of recipients, sothat the numbers are quite open to challenge.
(3) Quality and Price
Data on the extent and degree to which facili-ties (although not practitioners) meet Federal andState standards are generally available on a State-wide basis from reports of surveys of the facilities.In addition, New York has extensive, and relativelyuniform, reporting of cost data from facilities. I willreturn to the uses of some of these data later.
Bringing all these factors together+ligibles,utilization, quality and price—results in the bottomline of interest to most managers and legislators(expenditures). Data on expenditures is usuallyavailable-largely due to the incentive to collect andreport it as accurately as possible, because that ishow the counties get their Federal and State shareof funds. Total expenditures, and expenditures byobject of payment, are fairly reliable and fairlytimely, which confirms my hypothesis about thedangers of having data-all the clamor about theproblems in Medicaid relate to its expenditures,which is the ordy hard data available.
Evaluating Mutual Effects ofMedicaid and the Health Care“system
In the virtual absence of valid, timely, compa-‘ rable and compatible data, how can there be any
evaluation of the mutual effects between Medicaidand the health care system? How effective has tiehealth care system been in responding to the de:mands placed upon it by the Medicaid program?How do we evaluate what effect Medicaid has hadon the health care system? For the most part suchevaluations are either based on national statisticsexternal to the Medicaid program, per se, on spe-cial studies internal to a particular Medicaid pro-gram, on anecdotal information obtained as a by-product of program development efforts, or somecombination of these. Largely, the evaluations de-scribe what has happened—seldom is there anyexplanation of why it happened. And yet based onthe description, without understanding the reasons,major program decisions are made at the nationaland State levels for program changes. Let me cite afew examples.
Karen Davis has made extensive use of a com-bination of national statistics derived not only fromMedicaid sources, but from the National Center for-.
354
Health Statistics surveys, economic indicators, Statebudget documents and other sources to reach cer-tain conclusions about the Medicaid program na-tionally and in general. (See her testimony “Medi-caid Achievements, Problems and NeededChanges”, Feb. 4, 1976 hearings before the Sub-committee on Health and Environment, of theCommittee on Interstate and Foreign Commerce,U.S. Congress).
She posed several basic evaluative questionsand proceeded to gather what data was available toanswer them. For example, in answer to the ques-tion “Why does Medicaid cost so much?”, Davisanswers with three reasons — increase in the case-load, inflation in medical care prices, and the highcost of nursing home care for an impoverishedaged and disabled population.
In answer to the question, “What gains in ac-cess to medical care or health status has Medicaidachieved?”, Davis answers that the program hasbeen “astonishingly successful” for those covered.Using national morbidity, mortality, and utilizationdata, the statistics show what has happened to ageadjusted death rates, infant mortality rates, andaverage physician m-sits since 1966 when Medicaidbegan — all very positive, demonstrating that thepoor made “striking gains in use of services reJativeto higher income groups.” The data also demon-strate fiat low income persons not on public assist-ance lag substantially behind other poor and middleincome persons in use of services. The data Davisuses clearly demonstrate the continued patterns ofdiscrimination against the minority black popula-tion, whether on Medicaid or not, and the ruralpopulation. Removal of the financial barrier, forthese two groups, has not resulted in a response bythe health care system to improve their lot, (JackWennberg’s data in Vermont appears at times todispute this national data, but considering the pat-tern of Medicaid expenditures in the rural Southand in the Northern urban ghettoes, I think per-haps Vermo~t is not in the same class.)
Of course, as Davis suggests, the two majorresponses of the health care system to Medicaid(and to Medicare in combination) were inflation inprices and growth of the nursing home industry,These are easily and apparently described, less easi-ly evaluated. Caspar Weinberger has been quotedas saying “I have said many times, and firmly be-lieve, that the faulty design of Medicare and Medi-caid is the principal culprit responsible for this su-per inflation in health care costs. Given the guaran-teed government payment of health are costs invirtually any amount submitted by the provider,and with normal market factors absent in the healthcare area, inflation was bound to happen and did.”(June 12, 1975 Ways and Means Committee hear-ing.) The recent statement by the Council on Wage

and Price Stability, (April 26, 1976, Washington,D. C.) seems to bear out this statement, althoughsomewhat more objectively and analytically.
The response of the Federal government tothese inflationary pressures which push up totalexpenditures has been (1) through the proposal fora block grant to States, simply to close the end onFederal expenditures and leave the battle of thebuck to the States, or (2) to propose limits on feeand rate increases, or (3) to increase efforts at utili-zation review through PSRO’S and step up investi-gation of fraud and abuse in the program. In re-gard to the latter efforts, what data is available sug-gests that Medicaid utilization has already started todecline, and that increased UR efforts may in factincrease costs and expenditures. And in the wordsof Karen Davis, “Trying to reduce costs by concen-trating on . . abuses is like trying to stop a freighttrain by throwing rocks at it.”
Similarly, States, dealing only with the descrip-tive expenditure data, are making major decisionsto cut back on Medicaid, but may well end up in-creasing expenditures because of lack of under-standing of the effects of various measures. Forexample, many States are proposing limits on op-tional services, such as drugs, others are imposingcost sharing for basic as well as optional benefits,and some are reducing physician fees for ambulato-ry services. A few States are attempting to freezeinpatient rates, but are faced with the spectre of liti-gation from the powerful hospital and nursinghome lobbies.
I‘ confess that I am not sure whether any ofthese political decisions currently being made onthe Medicaid program would be any different ifthere were evaluative information to give the rea-sons for certain phenomena and directions for ap-propriate change.
As Ernie Saward has noted, in adapting thearchitectural imperative to the health care industry,“function follows funding.” Or in other words, thesystem will do what it is paid to do, and it doesn’ttake sophisticated evaluation to discover that. Ifthere is money to pay for nursing homes, then thenursing home industry will flourish. But why, maywe ask, does it flourish just as well in States thatpay a flat rate with very low ceilings of $20 or less,as in States like New York that pay on a cost basis,and where the average per diem payment for askilled nursing home bed is $40? Why in NewYork, does the per diem rate range from under$20 to over $7’0, when a special study just complet-ed by the Moreland Commission (report #5, 1976)demonstrates that there is “no statistically significantcorrelation between the number of nursing staff perpatient day and the proportion of patients requir-ing intensive nursing care in the same homes?”Thus, the cost differentials cannot be explained bydifferences in the patient mix and patient needs.
Medicaid nationally pays over 75 percent of the pa-tient days in long-term health care facilities. This isa fertile field for evaluation that to date has notbeen tilled adequately. In particular, one couldhope for some evaluation that would identify whatpart of the costs are really medical/health care costs
appropriate for the medical care dollar> and whichcosts should be charged against the income mainte-nance or social services systems and their dollars.
Evaluation of the influence of Medicaid onambulatory health services has received some atten-tion, especially the experience in California with theprepaid health plans (PHP) or HMOS. The evalua-tions have been anecdotal, and internal to a particu-lar Medicaid program, and with no basis for com-parative evaluation of the prepaid system with thefee for service system. The PHP program was stim-ulated by the California Medi-Cal program. In con-trast, in New York we did not consciously stimulatethe Medicaid Mills, they just followed in after thedollar in a clear pattern. Even with the reduction inphysician fees, or perhaps because of it, the Mills inthe urban areas of New York flourished. Attemptsat evaluation (much less control) have been diffi-cult, because of the inadequate data base in NewYork City Medicaid. The November 1975 issue ofthe AJPH, reports a study by staff of the NYChealth department describing some of their evalua-tive efforts in the absence of a client eligibility file,relying instead on provider profiles and statisticalindices of aberrant practices. But again, the evalua-tion is descriptive, and does not provide insight intowhy the phenomenon occurred and whether thismarket-response has been to the benefit or the de-triment of the Medicaid population, in the longrun. If we don’t evaluate appropriately the NewYork Medicaid Mills, and the California PHP’s, howwill we know what the industry’s response to thepoor will be under national health insurance?
Medicaid has influenced the health care system- mosdy in negative directions, I believe. The dis-tortions of the mental health and mental retarda-tion system, have yet to be thoroughly evaluated.The efiect of EPSDT has been minimal and we onlyassume ~he reasons, ig lack of administrative direc-.. ---- —.-—tion and priority. But was it ever a viable programas conceived by Congress? We have lost much valu-able time and information by not evaluating someof these phenomena earlier. Part of the problemwas that welfare professionals did not see Medicaidas a fertile evaluation area, and the health profes-sionals have only recently realized its potential as ahealth care program.
ConclusionI’d like to conclude with a few remarks on what
I think will be happening to evaluation in Medicaid,what I would like to see happening, and why I
355

think it is important for the future to concentrateon certain areas of evaluation.
If evaluation in the past has not been a majorpriority with Medicaid, I fear it will not fare muchbetter in the future if left to its own devices. Thereis little incentive to the States to conduct the kind ofevaluation that is being discussed in this Conference.
I predict that the “major evaluative tool in theMedicaid program will increasingly be the audit.Because of the Federal-State-local nature of theprogram, in recent years the management, programaudij has been looked upon and developed as amajor management tool. Increasingly, however,audits are asking not management-process ques-tions but evaluation questions. Unfortunately, theauditors and their supervisors are not equipped toask the right questions and are not familiar with thework that has already been done or the types ofevaluation to~ls that are available. For example, arecent team from the GAO came to New York withthe intent of evacuating the impact on Medicaid re-cipients of cutbacks in Medicaid. Their nationalsample - included Hawaii, New Mexico, Missouri,and New York. Within New York, they had selecteda sample of two rural counties and one small urbanarea, and were going to interview 150 clients and60 physicians, to determine if Medicaid dlents haddiffictity finding a physician. One of the questionsto the recipients was “When did you last see a doc-tor?” One of the questions to the doctors was “Doyou determine the number of Medicaid recipientsyou see by a percent of your’ practice, a percent ofyour billings?’ The audit team had not researchedany of ‘tie literature on household survey metho-dology, on access of the poor to health care gener-ally, or on how physicians organize their practices.And yet, the results of this study may influence na-tional legislation.
Auditors at the State level are also getting in-volved in program evaluation without the back-ground to understand the issues. For example, aState auditor sent me a memo with the startlingfinding the Medicaid recipients were using emer-gency rooms of hospitals when they had only minorillnesses. He thought I should be doing somethingabout that, because emergency rooms are morecostly than private physiaans visits.
The point I am trying to make is that the au-diting function will become be major, if not theonly, evaluative method in Medicaid - particularly ifthe new Talmadge bill and its call for a FederalInspector General is implemented. Already, thereare at least 100 times more auditors and investiga-tors working on the Medicaid program than thereare persons engaged in true evaluation. Either wemust train the aud~ors to understand and ask theright questions, or we must try to counteract thisaccounting orientation to the program.
356
Probably the first approach will be the mostfruitful, since in my opinion, the most importantarea for Medicaid evaluation will be the administra-tive process, and a combination of managementauditors and program evaluators could be synergis-tic. There are a variety of questions that Medicaidcould help us answer in preparation for nationalhealth insurance. For instance:
(1) New York has generally taken the approachof controlling the supply of health services e,g., cer-tification of need, rate regulation, as its strategy forcost control. California has tended to control de-mand in its Medicaid program. e.g. copayments,prepaid health plans, prior authorizations, EachState has chosen its strategy based on what criteria?With what effect? Is a one sided control effective, oris it necessary to control both supply and demand?
(2) public/private relations in administrationneed to be evaluated, e.g. the recent debacle withthe HAS contract in North Carolina Medicaidshould be evaluated, not on the basis of the criteriain the recent RFP, but from the standpoint of com-paring it with administration in other States.
(3) the intergovernmental process, and the in-centives in cost sharing among intergovernmentallevels need evaluation, e.g. EPSDT policy was enun-ciated, it was given priority and ev[n a penalty, butwas never implemented in reality. Why? Does thisfailure predict failure for a Mondale national childhealth pro~am?
(4j th; intragovernmental process is also im-portant: to what extent is the l~gislative, executive,judicial system making the courts the final adminis-trator and interpreter of policy? How is this avoid-ed, since for the most part the courts do not wantthe administrative role ‘and are ill equipped to as-sume it?
(5) evaluation of the administrative appealsprocess is important. How can the clients rights tofair hearings be controlled without infringing ontheir rights, but without having to pay for a lengthyhospital stay &cause the client refuses to go to anursing home? How does the due process mandatebalance between patient rights and property rightsin closing down substandard facilities?
And finally, we must evaluate the administra-tive costs of the Medicaid program, and what weare buying for the administrative process. In Cali-fornia, it costs almost $100 million-a year to deter-mine eligibility for the 500,000 medically needypopulation - almost $200 per person found eligible.(HaIf the states in the Nation spend less than $200per eligible child for services under Medicaid,) NY’sdata is less precise, but I assume would be compara-ble. The exorbitant costs of administering complexincome - tested eligibility would seem to suggestavoidance of such criteria under National HealthInsurance.
.

These are some of the areas that, in my opin- not running out. Evaluation is taking place in the
ion, deserve evaluation in the context of any gov- absence of data, and decisions are being made onernmental or private health care financing system. tils basis.It has not yet been done, and I hope that time is
PRINCIPAL CHANGES IN U.S. STANDARD CERTIFICATES—1978REVISION
Mr. George A. Gav, Public Healfi AnaJvst, Division of Vital Statistics, National Center forHealti S;tistics, Rockville, Maryland ‘
All of you should have received copies of thenew standard certificates when you came into themeeting room.
You should have also received a copy of a let-ter from Bob Webster, who was chairman of theStandard Certificate Technical Constitant Panel~CP), to Dr. Harold Mar@ies, former ActingDirector of the National Center for Health Statistics(NCHS). This letter contains the recommendationsof the TCP relative to the “content and format ofthe new revision of the standard certificates. SinceNCHS made no substantive changes in the certifi-cates from what was recommended by the TCP, mypresentation will follow Bob’s letter very closely.
I plan to cover the changes relatively quicklyand give a very brief explanation of the reason forthe change. If my explanation is not clear or fails toadequately answer any questions you may haveabout the change, please make a note of it and raisethe question during the discussion period.
It was strongly recommended that the size ofthe documents (7 1/2” x 8 1/2”) and the type style’used not be changed from the 1968 revision andthis has been done.
In addition, the TCP considered the subject ofmulticopy forms for several of the certificates. Itwas decided not to recommend these as the stand-ard. However, NCHS was asked to review the sub-ject further and to develop and make availablestandards for multicopy formats. NCHS has plansto develop and distribute standard multicopy for-mats of the death and marriage certificates.
The following changes were made on the Cer-tificate of Live Birth:
1.
2.
3.
4.
The certificate was reformatted by moving thecertification statement and registrar informationabove the parentage information to make itpossible to issue short form certifications byphotographic means.The items relating to the certifier have beenmodified so that information about the actualattendant can be obtained.The mother’s mailing address has been added.It was felt this item has utility for query andnotification programs and will also aid in ob-taining better quality data in the “Usual Resi-dence of Mother” items.The item “Inside City Limits” for place of birthhas been dropped. I; was felt that-this item haslittle utility. However, the “Inside City Limits”
358
5.
6.
7.
8.
9-
10.
11.
item for place of residence was retained since itis a useful item for Census tract coding andproperly assigning events within a county.The requirement for the signature of the par-ent or other informant was added. Requiringthe signature rather than just the name shouldresult in better quality data. A certificationstatement is included in this item indicating theinformant certifies the personal information onthe certificate is true to the best of their know-ledge and belief,Within the items on race of mother and father,the term “Negro” has been deleted and re-placed with the term “Black.” This latter termappears to be the more acceptable and widelyused at present, This change was made on allthe certificates.The education items were reformatted slightlyin an effort to clarify. There was no intent tochange the content of the items, however. Thischange was made on all the certificates contain-ing the education item.The pregnancy history items were reformattedand some changes made. An effort is beingmade to get the total number of previous preg-nancies, including those that ended in inducedabortions. The requirement for the exact dayof pregnancy termination has been deleted -month and year was felt to be sufficient.The item “Legitimate - Yes or No” has beenreplaced by an item “Is Mother Married - Yesor No.” Since the marital status of the motheris the determining factor for legitimacy of thechild under the laws of almost all States, theinformation obtained should be compatible withthat collected in the past. Asking the questionabout the mother rather than about the childshould prove less offensive and thereby resultin higher quality data and result in more Statesretaining or adding the item to their certificate,
The items asking for complications related toand not related to pregnancy have been modi-fied to clarify them. It was felt that the pre-vious wording was confusing and vague andthat the changes will provide better data,The item “Birth Injuries” has been droppedbecause it has been so poorly reported as tomake it unreliable as a statistical or medicaltool. A new item—Apgar Score at 1 minuteand 5 minutes—has been added to the certifi-cate. Studies have shown this item to have ap-

12.
I
13<
placability in the overall study of the health ofthe newborn child and the information shouldbe obtainable.The heading of the confidential portion of thecertificate has been changed from “ConfidentialInformation for Medical and Health Use Only”to “Information for Medical and Health UseOnly.” There has been concern expressedabout the term “Confidential” since its meaningmight be interpreted differently by differentpeople. This difference in interpretation mightresult in incomplete or improperly reportedinformation in this portion of the certificate.The change in heading adequately indicateswhat the data are to be used for and does notdetract from the fact it should not be includedas a part of certified copies.The TCP also considered adding an item to thebirth and death certificates to collect data onethnic origin. The major purpose of this itemwould be to collect data on the Spanish-originpopulation in this country. The TCP recom-mended against adding the item to the stand-ard certificates but did recommend that the fivesouthwestern States with substantial Spanishminorities (California, Colorado, New Mexico,Arizona, and Texas) use the Census Bureau listof Spanish surnames - this list will be used inconjunction with the 1980 Census - to developbirth and death statistics for the Spanish-originpopulation in their State. After the recommen-dations were received from the TCP, NCHScame under considerable pressure to reconsi-der the decision and add an item to the U.S.Standard Certificates of Live Birth and Death.The situation ~vas reevaluated, NCHS did notadd the item to the certificates, but did developthe following plans to collect data on the Span-ish-ori$n population:
1.
2.
3(
4,
Recommend that the five southwesternStates use the Census Bureau list of sur-names as suggested by the TCP.Work with the five southwestern States andother States having significant Spanish-ori-gin populations in an effort to develop asuitable item for use on birth and death cer-tificates.Contact all States and apprise them of theneed for his data and request they givestrong consideration to the addition of anitem to their certificates to collect such data.Collect data about this population in theU.S. on the NCHS natality and mortalityfollowback surveys.
The following changes were made on the Certifi-cate of Death:
1.
2.
3.
4.
5.
6.
7.
8.
The certificate was reformatted’ to place thecause of death section at the bottom of the cer-tificate. There was considerable discussion re-garding whether this section should or shouldnot be included in certified copies routinely. Byplacing the section at the bottom, those Stateswishing to exclude it from certified copies coulddo SO.
An item was added to the certificate asking “IfHospital or Institution Indicate DOA, OP/Emergency Room, Inpatient.” It was felt theinformation would be beneficial in developingmortality statistics for hospitals. It should alsomake hospitals more willing to show the hospi-tal as the place of death if they can also indicateit was a DOA.The item “Was Decedent ever in” U.S. ArmedForces?” has been returned to the certificate.This item was deleted from the U.S. StandardCertificate of Death in 1968. There have beenmany requests from veterans groups all overthe country to have the item returned to thecertificate and it was decided to put it back on.The item “Inside City Limits” as relates to placeof death has been deleted. It was felt that ithad little utility. However, the “Inside Chy Lim-its” item for place of residence was retainedsince it is a useful item for Census tract codingand properly assigning events with a county.The section for the physician’s certification hasbeen modified. The present recommendationof the Model State Vital Statistics Act TCP isthat physicians other than the attending physi-cian would be allowed to sign the medical cer-tificate under certain circumstances. Thechanges made would accommodate this recom-mendation.The item in the accidental death section relat-ing to the manner of death has been modifiedby adding “Pending Investigation” to the list ofpossibilities which previously included “Acci-dent, Suicide, Homicide, Undetermined.” Thisaddition should lead to better reporting in thecause of death portion of the certificate. It washighly recommended by the medical examinerson the TCP.Several changes were made in terminology re-lating to the funeral director and the funeralhome. The information desired from the var-ious items is not changed, however.The following items have been deleted fromthe certificate. It was felt that each of these
359229-121 0-11-24

served no useful legal or statistical purpose,and their deletion would not affect reporting.The items are: 1- Were autopsy findings con-sidered in determining cause of death; 2- Thedates “From” and “To” relating to when thephysician attended the decedent; 3- The datethe physician last saw the decedent alive; 4-Whether the physician viewed the body afterdeath; and 5- ~e date of burial.
9. An item was added to the certificate requestingwhetier the case was referred to the MedicalExaminer or Coroner. Since a physician may, atthe request of. the Medical Examiner/Coroner,certify a death which appears to be a MedicalExaminer/Coroner case, it was felt to be impor-tant to at least know the case had been re-viewed by the Medid Examiner/Coroner.
The following changes were made on the Certifi-cate of Marriage:
1.
2.
3.
4.
5.
6.
The heading of the form is changed to read“U.S. Standard License and Cerficate of Mar-riage.” The intent is to combine into one formboth the license and certificate -thereby reduc-ing the workload and number of forms re-quired by the local official responsible for mar-riage registration.The item “Age” for both of the Parties “to bemarried has been added. This would be in ad-dition to “Date of Birth” for both parties whichremains on the certificate. The addition of agewill provide an extra means for verifyingwhether the parties meet the age requirementsfor marriage. The county clerks on the TCPfelt this addition would be most beneficial.Because of the change whereby the license isincluded with the certificate, certification state-ments by the applicants and the person issuingthe license have been added. This also necessi-tated adding the date the ficense was subscribedand sworn to, the signature of the issuing offi-cer, and the title of the issuing officer. Since thedate the license was subscribed and sworn towas added, the dates when each party signedwere deleted as no longer being necessary.An item requesting the city where marriage wasperformed has been added. This will more pre-cisely locate the actual place of marriage.The item “State” where marriage was per-formed has been deleted. Since the marriagecan only be legally performed in the Statewhere the license is issued, it was felt unnecess-ary to ask for this information again.The “Inside City Limits” items, which related tothe residence of the bride and groom, havebeen deleted. It was felt they served no usefulpurpose.
7.
8.
9.
10.
The date the certificate is signed by the personperforming the ceremony has been deleted.The date the marriage ceremony is performedis asked and this is the important date.The title of the person performing the mar-riage ceremony has been added, This itemwould provide information helpful in determin-ing whether the person is authorized to con-duct marriage ceremonies under the laws of aparticular State.The question asking whether the person per-forming the ceremony is a religious or civilofficial has been changed. The question now askswhether the ceremony was religious or civil,This is the information that is really desired,and it is felt that this is a better way of askingthe question.The heading of the confidential portion of thecertificate h~s been changed from- “ConfidentialInformation” to “Information for StatisticalPurposes only.” The reason for removing theterm “Confidential” is the same as for thechange in the birth certificate.
The following changes were made on the Certifi-cate of Divorce:
1.
2-
3-
4.
5.
The heading of the certificate has beenchanged from “U.S. Standard Certificate ofAbsolute Divorce or Annulment” to “U.S.Standard Certificate of Divorce, Dissolution ofMarriage or Annulment.” The addition of dis-solution of marriage reflects a change in termi-nology in several States. States should use theterms appropriate to their State when they de-velop their own certificate.
The item “Local File Number” which appears atthe top of the certificate has been changed to“Court Identification (Court File Number),”The Court File Number is the Local File Num-ber. Therefore, the change in the item betterreflects what is to be shown.
The “Inside City Limits” items relating to theresidence of the husband and wife have beendeleted.
The item “Living Chddren - Total Number” hasbeen changed to “Number of Children everBorn of this Marriage.” The change is an at.tempt to obtain data to study the impact of hav.ing children on the stability of a marriage.
The item “Liting Chtidren under 18 Years ofAge” has been changed to “Children Under 18in this Family.” me attempt is to ascertain thenumber of children directly affected by the di-vorce- It is felt the change in wording will
360

6.
7.
8.
i
produce better, more accurate data on the sub-ject.The term “Plaintiff has been replaced by theterm “Petitioner” throughout the certificate.This reflects the changing attitudes and laws inthe country whereby divorce as an adversaryproceeding is decreasing.The items “Decree Granted To” and “LegalGrounds for Decree” have been deleted. Theitems have little, if any, statistical value and itwas felt it served no useful purpose retainingthem on the certificate.A; in the birth and marriage certificates, theheading of the confidential portion of the cer-tificate has been changed from “ConfidentialInformation” to “Information for StatisticalPurposes Only.”
The following &anEes were made on the Certifi-cate of Fetal heath: “
The following general recommendations aboutthe reporting”o~ fetal deaths are made:(a) That spontaneous fetal deaths and inducedterminations of pregnancy (induced abortions)both be reported and that they be reported onse~arate forms.(bj
(c)
That reports of both spontaneous fetaldeath and induced termination of pregnan-cy be considered legally required statisticalreports rather than legal documents to beretained permanently by the State HealthDepartments. The documents serve no le-gal purposes and there is no reason why aState should have to maintain this file afterthe statistical work with the records is com-pleted.It is recommended that only spontaneousfetal deaths of 20 weeks gestation or morebe reported. Good reporting of fetal deathsof under 20 weeks gestation has been verydifficult. Since most State laws presentlyrequire only reporting of fetal deaths of 20weeks or more gestation, our efforts shouldbe focused at getting better reporting ofthese events and not require those below 20weeks.
(d) It is recommended that all induced termi-nations of pregnancy, regardless of gesta-tion, be repbrt~d. Since tie vast major~ty ofthese events occur before 20 weeks gesta-tion, it is essential to have this group re-ported.
(e) There is no need for a “Confidential Sec-tion” on either of the forms since they willboth be designated “Confidential.”
2. The following changes have been made in theU.S. Standard Certificate of Fetal Death which
now will be recommended for the collection ofdata on spontaneous fetal deaths at 20 weeksand over:(a)
(b)
(c)
The heading should be changed to “U.S.Standard Report of Fetal Death.” This isconsistent with the suggestion that thesedocuments be statistical reports rather thancertificates to be filed permanently.A number ?f items were deleted since theywere unnecessary on a statistical reportingform. These include: name of the fetus;inside city limits item relating to place ofdelivery; place of birth of both mother andfather; were autopsy findings considered indetermining cause of death; signature ofperson certifying cause of fetal death; datecertification was signed; whether the at-tendant was an M.D., D. O., Midwife, orother; the mailing address of the certifier;signature of other authorized official if thedelivery not attended by a physician;whether the fetus was buried, cremated orremoved; name of the cemetery or crema-tory; location of cemetery or crematory;date of burial, cremation, or removal; nameand address of the funeral home; signatureof the funeral director, signature of theregistrar; date received by local registrar;birth injuries’ to fetus.An item has been added requesting physi-cian’s estimate of gestation. While the pri-mary means of determining length of gesta-tion will remain the length of time betweenthe date last normal menses began and thedate of delivery, this new item will providedata in those “cases where the date last nor-mal menses began is not available or thegestation determined by this method is ob-viously in error.
(d) The items requesting information” about the -
(e)
(9
p;evious pregnancies of the mother havebeen changed to agree with the way it isbeing asked on the birth certificate.The item “Legitimate - Yes or No” has beenreplaced by an item “Is Mother Married -Yes or No.” This is the same way it will beasked on the birth certificate.The items relating to complications havebeen modified to. clarify them and makethem agree with the birth certificate ,changes.
(g) No signatures are required on the form,but it does ask for the name and title of thephysician or other attendant and the nameof the person completing the report.
3. The “U.S. Standard Report of Induced Termi-nation of Pregnancy” is a new recommendedform to be used for the collection of data about
361

TYPEOB f[lNT
r 1 rPEfly(;ENT U.S. STANDARD
1
LOCAL FILE NUMeER CERTIFICATE OF LIVE BIRTHlNST#;TIONS
6!RTN NUMOER
CHILD-NAME FIRSTHANDBOOK
MIDDLE LAST SEx DATE OF LGRTN (M.., U.Y, Vr.1 IIDUR
1. 2. 30.~OUNTY OF 0,.1:
MHOSPITAL-NAME (N ..f i. h.tnN.!, ,1.. .ImCf .od ..mbtr) CITY, TOWN OR LOCATION OF UIRTN
.4b. 4C.
I c,, IN” Ih,! lh, N,,ed Info,m,llw COM,,”IW ,hi, chl!d 1,,,., w Ih, h,, of my knnwlti~ ondhlhl. DATE SIGNED (hf.,, U.V, v.) NAME ANO TITLE OF ATIENDANT AT BNETH IF OW{En TNANcEnrlF IEn rryp, ..pd.1)
I CEITTIFIE~ -NAME ANO TITLE (1’yP. .rPN”O—.
MAILINO ADDlfESS (31N,I or R,P,I1, No,, CN, o, To”,”, s1.1., 7(,/
50,D&TE nECEIVED OY nEGIS rflAR IAf.”(h, U“V, V,orl
68. sG,to.IuwI b Gh.
MO1llEn MAIDEN NAME*
FlflST MlO[,LE LAST AGE (At 11.n, STATE OF BINTH Irln.rl. U,SA,, n.nIv,.”.lrNof Ihla b!r:hl
la.I RESIDENCE-ST4TE COUNTY CITY, TOWN OR LOCATION
I ~
SrnEET&ND NUMBEfi OF RESIDENCE
81. 8b. 8C.M0THEfl,6 MAILING AODnESS-N ,.m. u .bo”,, ,nN, ZIP cod. ..19
FATHER-NAME FIIEST MIoDLE LAST AGE (Al lime 6TATE OF nrnTn (N .. I I. u.s.A., ..m, ,0..qI
::of lhN bb(h)
IOb. Ioc.
!: I cslllfv Ihol Iha p~rwn.1 Inlorm.llo. provmed on Ihk c.nNkN. Isco,f~l to lh. b.n 01 my knon!tiw .nd bellol, RELATION TO cNILD
;&
:: Ilb.
INFoRMATIoN FOR MEOICAL ANO HEALTH USE ONLYfti~-mnltn I.,g.whsaq BtICk W. FAEE{ER1,0. Whll% Bl=k LNFTTHWEIGHT
Am9,N9. Inill.n, *ICI Am.ck,. lrdlm, .,..1TtNS nlflTN-SlmN, twin, !Ib!,l, IF NOT SINGLE iNRTH-Oor. lSMOTHERMAnRIEDl
●1., [Sp,cffr)f~~.rv,)
Iblt, usoti. thl!d, *lC. (SPCCVYI fSn*N(V Y., .r not
12. 13. 14. 151. 15b. I 6.I
PREGNANcY HISTORYEDUCATION-MOTHER EOUCATION-FATHER
I (CWICN * =tlonl(S,,.l[Y ..1, IIl,h..f ,md. compl,f,d) (SW,NY only hl,h,,l ,IwL, .ompl,f,d)
Elrin,Ol,~mOr,COnIJWy ~Il:f%?+l
ENm.n1w{~2;aond*ty I C4111eg,
t ILIVE BIRTHS
(1.4015+1OTNEll TERMIN4TIDNS t
DEATH UNDERI(D. ..1 lnclud. lhf, Chlld) W,o”lo”c””. ..{ Induc.d)
::: YEAR OF 18. 1 ~.I
c“,” S,.,* 611. ha, Now 11.!q I 176, NON dead lld.:,~: ~ I 17#. AN., 20 (OAIE LAS? NORMAL MENSES MoNTH OF PREGNANCY PRE.Numw, c.td,.,h
PnENATAL VISITSTOIA numb,, , :;;AR 6C0nC
! .“,,,,,,,, ,6, ,h~ I I W“h, UEGAN lM.nlh. m,, Y,.N NATAL cAnE BEGAN Fi,,I, (N .“”,, 00 01.1.) 6 min.
,hlld I IMc.fai, ,!,, (X,,.lry)
N.mbN_ I NutieI_ Numbu_ I Numtir_ -20. 21B. 21b, 229.
I
122b.COMPLICATIONS OF PnEGNANCY (Or*”lb, ., wtlt, .,...,,7
MULTIPLE SlnTHSE..,” S,.t, F1!* N;w ❑ ~ Now ❑ Now ❑ i Now ❑ ~~.FL”*W f- mot,(,) %------ ----.-- 4-------------
OAIC OF LUT LIVE OtRW DATE OF LAST OTHERlERLNN. CONCURRENT ILLNESSES OR CONDITIONS AFFEcTINo THE PREGNANCY (D,$c,ib, ., wrll. ...0.,-7,.v.. m. w-) AI ION ,“ I..-W h 4.,..bml
ILIVE ●lnllNN fhr..m. .-j
17<. 17f. 24.
I*E14L OCATNNI
COWLICATIONS OF LASOR ANOIOR DELIVERY (HM .? WIIM ‘bow,? CONGENITAL MALFOiEMATIONS OR ANNAIIES OF CHILO (tititi, w-tit. ,’11.M9

.
r 1V14VSlClAN, MEES1~L EXAM I18EISOR wnOtsEnt
U.S. SIANDAtSD r 1,.,,cfiL‘,LC N1lMnEn CERTIFICATE OF DEATH
TYPE
STAIC FILK N“w”c”
01! I“INIoECEDEMT-NAME rlnsr MIO!ILC l.nsr SE x Dhl E OF DEAIII ,M... U.,,.vr.)
?ER~;~EFL1 1.
NSST{~~Il;NS
RACE-{ es., Wt\Ol=k,Am, AGE-}y:,;kIMwIndl.n. *lc,l tSucUsJ I ‘No’:(_i~~%:W :. ‘3 ~
DAIE OF ONETll IN”.. LI.,, Y.. I COUNTY OF OEATN
SEEMo%
IFAFIUSOON 4 5*. Sk.
CIIV. 10WN On LE)cANON OF UEATII llnsl,llAL SNI ull Ntl INsIIIUINIFI N*w ,N~. <III,.,. ,1,* .1,,,1 .,,,1 ,,.mb,,) Ir tIOsr. ON tfssr, tmnCSI. ooh,OP/Em.I. Rm,. ln#,mthnt ,VV,NVI
n. lC. ld.sfATs OF nlnltlfft..lf. trn..s. CITIZEN OF WHAT WLNdlRV MAnlNED. FLEVEn MAnn lED. SUNVIV(NO SPOUSE ,1(”1(,. ,IW .,.!d<” IUW., WAS DECCOENT EVEn IN U.S.
M me r.1”.1,,) . WI CKIWED.ENVOflCED WC-,1{”) ARMED FOnCES?IF DTAIII
OcculBnc D ,ts 1. 8. 10. 11.~2,?.lf, r.s or N.)
8NS71,U110N.
8CE HANOQOOKSDCIAL SECURITV FAUMEJEIS sJsuAl OCCUpATION (ok ht.d .r-orh #0w4.N.. R... I of KIND OF BUSINESS OFI INDUSIFIY
nE04nDlN0.Mblns 11[.. ●V** N celldl
COM?L.E11ON OF la, Isa.nsslos?lcc I,SMS
t4b.
FEESIDENCE-SIAIE COONIV CITY. TDWN DN LDCAIION SIFCEET AND NUMBEn INSIDE CITY LIMITStSW<U, V,, m N.]
Isb. 15C. 15d. Ise.
MIDOLC LAST
11.lNr OIIMAN1- NAME F7,W i“ r.fil] ctlv OR 10WN SIAIE ZIP
18b.
uUNIAL. C14EMA11ENS,HE MILVAL, OINEN (s,-rlf,) C1*VCIII l“WN slal E
19s, 19b. EC.CUNEFIAL SEnVICE LIcENSEE Eh P.,1.m fi<lln, A, 8UCFI SCAMEor FACILITY AILEJnEss OF FACILIIV,S,,”. r”rr,
201. E 20b. 2at.
),3
~ls. 10 On Ew,l .1 m“ k-l+. d,,,h ~.t,d m lb 1kr,9.d,l. d FNC, mold., w lh, 21s O. on hsl,.1 ..ti..tkm 8ndt.ntitll~tibn, h mV ~hb. d..#h m.t,ti at tk #w,C*U*I* II*IMF. ,1,1, W* plot, d !kl, l,, Ilm.oll”l,) ,Imd,
- !
!
p’!,”.,”” ●“# st,k) b ‘~~ :;;;;;;;::,,,,,,OAIE WONEO Isle . 1*,. v,.)
:i ‘ ,,b
N(LUFFOF DEATN
i
Noun OF OE&TMx.
:g ~z, ‘.~: . Ylc.
M838 fiONUUNCEU UEAEC(SI.., 0,,. Vr.)
. . 2?C,NAME OF ArTENEYtNO PNVCICIAN IF OIIICII THAN cEIIIIFIEIF tr,w #o,r.1.#t
M
#g mtLmDUNcfSI OEASI ,N,,w#
8 21d.
::3
22d. ON [email protected]&SSEAFEOAOLNEESSOF CUSTIFI En IPHV81CIAN. MEDIcAL EXAMINEn OR COllONEn) ,rvw .,r,kl,
M
>,
O&TE nECEIVED EV nEOIS1llAR (M.,. n.,. Y, )
cONDltlON,IF ANV
WIOCH OAVCRISE 10
lEN~n ONL Y WE CAUSf ●ER LINE 608 (,). lb!. AND IChl , I“N,V* Inll’aml .“”1 *& tiath
tMMCDIATf ?AR1CAUSS .1 I*) I
81 AIIN0 ?lIE DUE To. DR AS A C0N5EEsuENCE OF:UNDEIILVINO
lmi.rw~ tit-n on”! .nd dcsth
CAUSE LASTI1,
OUE to, on AS A cOtSsEQUENCE OF: I“I,,v91 tit-” w“, ,tid,.,htI
0T14EN 61GNIFICAN1 CONOITlONS-C.&NkS cantektlns Ie dell, LUJInot v.1.!.d m cm” @Nn h tAllT I I.1 AUIDPSV ,Ip,,lt, Y,. WAS CASE ncFEnncO TO MEDICAL“ N.] EXAMINEn On COnONEFS
~rw.lfv r., .rN.l26.
ACC., SUICIDE NoM.. UNDET,, OAT’ OF INJUISV (Me.. h,. Y,.I NOUR OF 8wunvOEI PENDINO !hvE6r. t9,rrlI,I
0ESCFN8E HOVLIVJUI’IV OCCUUnED
211. 26b. 28C. M 28d,
lN>liRV AT WUIIK t~;;y V.. PLACE OF lNJUnV-At IIMM. l.,m, ,t,”l. lmIwv, ol!k blldlq, S.OCATIDN S* RECT on R.?.ss. N.. Clvv on low “ Slalcmle.S“clf,t
26?. 211. 26Y.

r 1IMEDICAL EXAMINER OR CORONEnt
U.S. STANDARD r 1

r 1 U.S. STANDARD r
TYPELOCAL FILE NUMBER CERTIFICATE OF DEATH STATE FILE NUM”EFI
Orr ~fi!NT DECEDENT-NAME F1nST M, OC.LE LAST SEX OF,TE OF DEATH NfO., ~,. Y.
PERMANENTINKF17fl
lNSTRS.U~TIONS
HANDBOOK
JIFOF&Tll
Occumnro INlNSTITUTI ON.
SEE HANOLIOOXREGAn08NG
COMPACTION OFRCS1OENCK ITEMs
1.
fvr~ re~=l--–--—l’” 3.
RACE-lra..~11C.8 !sCb.A-1iC1” AGE-L,,, Bl,thdw DATE OF BIRTH [M.. n.,. Y,. I COUNTY OF OEATHf“al,”. etc.) 6-CIIY) 140U”S M,NS.
4. 5a. I w, !---luL-!__.16. la.
CITY, TOWN On LOCATION OF DEATH HOSPITAL OR OTHEU lNSTITUTlON-Nmne (:/””f !“ elth,r, ,(,v ,fm,f and ““rob,,, IF HOSP. OR INST. Ima,, DOA,OP/E,n,,. Rm.. Inw!k”l Wbu<N,)
7b. 7C. Td.
STATE OF 81UTN (lIm,t 1“ lIS.A“,m, *,””,v,. CITIZEN OF WHAT COUNTRY MARINEO, NEVER MARnlED, SUilVIV INO SPOUSE ,1/ “1(,. ,1,,, m. U,” “am,) WAS OECEDENT EVSR IN US.W 10OWE0, DI VOrrCEb {s,,.<11,> ARMED FOflCES?
8. 9. 10. 11.~2n*eN,v., 0, N.)
SOCIAL BECUfllTY NUMLIEn USU&L OCCUPATION [O(W kl”d .1 ,“eti don, d.rln, mo,t III KIND OF EUSINESS On INDUSTRY,“”,hln, tire. mtv” N rrllwdl
13.
I
~48. I 14b.NESIOENCE STATE COUNTY CITY, r~N OR LOCATION S1llEET ANO NUMBER INSIOECITYLIMIT9
,SIW.-(A Y., O, NOI
Isa. ]15b. 15,. 1511.
rATNFU-NAME
15#.
61RST MIOLILE LAST MOTNER MAIDEN NAME F,RST MIDDLE LnST
. . .-I 11.
INFORMANT-NAME (tin, o,”,,”,, CITVOR TOWN STATE ‘LtP
lEb,BUnlAL, CREMATION, FIEMOVAL. OTHER ,81,,<I,Y, LOCATION CITV OR TOWN STATE
!9!___ 19C.
1UN1 NAL SEIIVICE LIL!CNSEE Or Pus.. Aellng As Such NAME or FACILITY ADDRESS OF FACILITY
20C.1,! ah”IIQ,I .1 .,” kw!mti. ,I”,h wcu,,ml ., ,h, l!nm. d,,. .ti v!- M61J”, ,. ,h, llllufl OF EIEATN
2Q%:
211, f.lan.tulrl 21b. 21C.
,~:t
MNAME OF ATTEND INO PHYSICIAN IF OTHER TNAN CERTIFIER (n,, 0. prt.N
858 21d. ~82 NAME AND ADDRESS OF CERTIFiEfl rnp. .r mt.tj:=
a [email protected] OATE RECEIVED BY flEGISTHAn lM.,. 0.,, Y..)
COND1TIONSlr ANV
Wlllcll OAVCntsr TO
IMMEDIATECAUSE
STATING THEUNDERLYINGCAUSE LAST
22b,
[ENTER ONLY ONE CAUSE PEIT L INE FOR (.1. lb), ANO (c) 1 1“S.,”,1 18.Iw”.” 0“”, #nd d,., h
PART1 I*1
1,
IDUE TO. OR AS 6 CONSEQUENCE OF,
r
Inletv,l btw. ..wt andd-uI
((blI
DUE TO, OR AS A CDNSENENCE OF: l*l*IV*! tit-n 0“”, ,ti Ih,th1
1,1I
P~~T OTHER SIGNIFICANT CDNDITlONS-CC.”dlIIOIII cantrlhllq t. d,,,h b., no, ml,l,d ,. .wm .t~. III PART I (.) AUTOPSY (sn,,lN Y<, WAS CASE REFERRED TO MEDICAL., No) EXAMINER OR CORONER
24.mw.lf, Y*.., No)
ACCIDENT lSP.CI!Y Y,. OFNo)35.
DATE OF INJURY (AfL...DOY, 3,,,) HOUR OF INJURY OESCnlBE NW INJURY OCCURIIED
261. 1*. 2Bc. M 2W.
INJURY AT WOmK (~Ncj~ Y.. PLACE OF INJURY-AI k.nw, farm, ,I,mt, 1-10,”. oIIIM b.lldiw, LDcATION STREET OR R.F.O. NO. CITV OR TOWN S’rnrsale. fsx.i f,)
< 2ti. 26f. 2Eq,
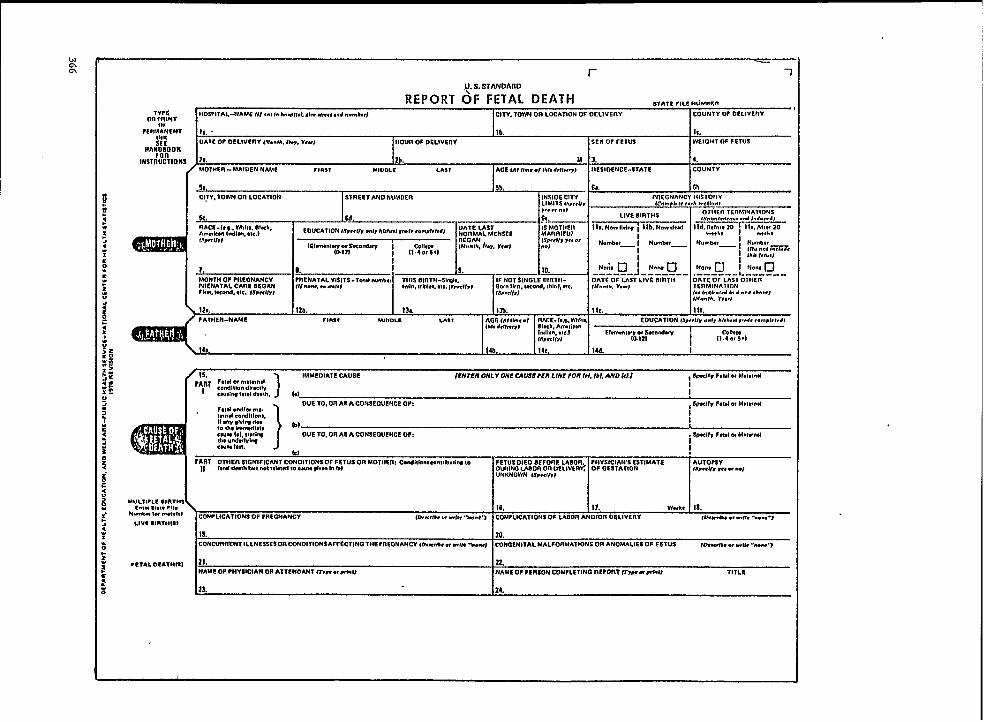
_—
r 1
+ S. STANDARD
REPORT OF FETAL DEATHlYPE
STATC rlLc NUM.Sn
on ;flINrtlOS?lTAL-NAME IN . . . f. h.w,,.,. ,,m m,,.., ..wI,,* c17v. Tw on LWA710N OF OclIvcnv COUNTY OF Of LIVEnY
PEnMANCNr Is .INK
lb. lC.
SCF. OAT<OF O~LIVEnV ,,G.mth.0.,, v,”,-—
HOUR OF DELtVEnV
Hhy~:ooKSEX OF rETLtS wE!allroF FETUS
lNSTllUCTIONS 2*. 4.
MOTHER -MIAIDEN N4ME r1n31 MIUOLE
51,
!:;; :-”:’ is’ ;7: :3::
P
~-i%
AS.,,.,.., <,., ..4 I.d.,, d,
EOUCATION(s,,, ((, ..1, huh,,! ,“d. ,.m,tit,d}
MONTH OF WEONANCV ~cNAT8L vtsIT9-7.td we., THIS LNnTM-slnOlc.PNENATAL CAnE OEOAtl
1PNOT S\NOLE nlnltt-Iu “..*, * .1.1,1
DATE OF LAST LIVE 80ET148-1”, Gbl.1, ●le, (Swcu,l
;;ly ;;L;<1$ii4y; ‘- -LI.tn IIfn, wc.mt, thltd, .lc.
Fh,t, ruti. *le. fs,wlmt,,U.., I,. v,”,
1s,8,1/,)IERMINA11ON(.* 1.61,.,,41. ● .,, .b”kTt
120. IZb. 13L.
l.$to.th. r,.?)
lsb. tie. Ill.
FATNER-NAM6 rlmsT MILIOLC LAST AGE (AI Nm,.t rrmE- !.,1. %11%lb!, #,(kvl nfxk, Ann,;,,.
EOUCATION (sP,.11, ..1, hI*h,.I ,.ti, ,.m,I.t.41
Itilan. ●ICI Etm..t~~y2yv ~is,.< 1(,)
118,I
Ilc:ti?$l
14b. 14C. 14d. I
1s,
)IMMEDIATESAUSEp*~*F*1* w m.uwnd
IENTER ML V ONl CAUSE?Efl LINE FORI*I. Ibl. -D tell , SWCGVF,I,I w M.t,,n81
ieondllb” dl,xlly
I
<WIIIG I.tel d,.!h. 1.) I
1
OUE 10, On AS A CONSEGLIENCE OP:F*191.IuNal m,.
, ~xll” F,ul m M,,,,.11
IN”* COMIIOO”*.N any ,til~ ,1”
I
@fI
1. 4h* imfnNSl*t*CIUW I*I. 11*18* DUE TO. OR 6S A CONSEOUENC8 OF:m, “Ild.twlw
i ~xlfr $,tti m M.IWMI
cum 1**.let
I
?\RT OTHER SIGNIFICANT CONDITIONS OF FETUS OR MOTHER CendNb.s~n,,bu,lrc 1.Ntd dwth bIIt not ..l.ud m C*W slvm t. III
FETuS D16D 8EF0nE LABOIE, FHY$!CIAWS CSTIMATS AUTO?SVOwlm Worl m OeLlmnc Of GE5TATIGN ISm<ll, ,*, e “.)UNKNOWN ls,.,l&)
MULT,.LS 91RTHSc.,” 8,.,. PII. 16.
NmMl 10I n..-!,)11. W“k, 18.
COMPLICATIONS OF ?REGN&NCVLlvc 81RTMIS)
GJ.Mr*. * ..El* “m.a”r COM?LICATIONS OF LAOOfl ANOlOn 06 LIVETIY ,Wti, .,.,,,, ,.”..U “,
19. 20.CONCUIEfiEMT ILLNESSE$ OIECON DITION9 AFFECTINGTHC ?nEONANCY ,~m,tb, w U,W .tiw, COngenital MALsORMAltONS 00 ANOMALIES OF FETVS Nmw, “ .,1:, ....-.7
*er&r. O* ATlrrc) .21. 22.NAMe OF PHYSICIAN OR ATTENOANT w“ “XO NAME OF ?EIESON COM?Lf TINO IEE?GRT II,” “wit lITLI!

TYPEU.S. STANDARD
OR ~:lNT r 1 CERTIFICATE OF DIVORCE, r 1
PERy.4:ENT COUUT IDENT1F1=TION(court It!, numb”) DISSOLUTION OF MARRIAGE OR ANNULMENT STATE FILE NUMDCR
FORlHSTRelJJTIONS
IIUSDANLT-N4ME Flnsr MIDDLE m?
...HANOBOOK _1
USUAL flEslOENcE.5TflEET ADoncss CITV, TOWN OFI LDcATION
2a. ~b.
COUNTY STATE LTIRTHPLACE (s,,,, O, for,l,” ..”.,”) DATE OF BIRTH (Me. u.,. Y..,
Id. 3. 4.
51. Sb._—— —. . ___ . .USUAL RES1OENCS.-STITEET ADO ISESS cITv. 70wN on LOCATION
b. Ob.
COUNTY STATE BIRTHPLACE (S,at, o, tom{,” ,L.u. I.Y, OATS OF SIRTH ISIO. U>. L’,.)
6c. 16d. I 7. 8.PLACE OF THIS MAITITIAGE..CITV COUNTY STATE {1/ ..11. u # A.. “am, e.u.,,y) DATE OF TISISMAniSIAGE DATE COUPLE SEPARATSO
(M.,. &y, r,.!
91.
(M.., n.,. r..J
9b. 9C. 9d. 10,NUMOER ~ CHILDREN EVER OOnN ALIVG OF THIS MAnfllAOE ClilLOflEN uNOEn 16 IN THIS .AMILY l$,,,ltij Petitioner-HusOANO, WIFE. Born, OTHEn ,SP.C,I,,fs”,<ff,,
llb. 12.
ATTORNEY FOIF PETITIoNER-NAME (T,BC c., IYdnN ADDRESS STBEE1 OR R.F, D. No. C(TV OR TOWN Srnyl? ZIP
1 c.rtitr that the mef,iw. MO”th Ow Y,w TYPE OF OSCFIEE-DIVOnCE. DISSOLUTION On ANNULMENT DATE OF ENTRY (No., h,, Vr.j01,h,,ti”, “,m,d V“*”* ,S”,.,ry,
,4,, w,, d,,ml”od OK,.
14b. 14C.
COUNTY OF DECflEE ‘TITLE OF COURT
14d. ye.
SIGNATURE OF CERTIFYING OFFICIAL TITLE OF OFFICIAL
\ 141.P 14g,
INFORMATION FOR STATISTICAL PURPOSES OtlLY
f14cE-Hu58AN0 NUMLIER DF THIS MARRIAGE IF PREVIOUSLY MAI’NTIED )IOW MANY ENUED OY EDUCATIDN lSP<el/Y ..1, Al,ht,l ,.d. <omPkl,dl
SF.,<1(, 1,.g . LVTII,,, Rlwk, .Tp,ell-y 1.=1,,!,HOrd, ,!., ) DEATH? ! DIVOnCE. DISSOLUTION ●
Am,rkI” Indbn. ,,F.1 ~08 ANNULMENT7E1-n!.\~.y2prdW I Co!rm,
I 11.4 ., S+)
I11
RACE-WIFE NLIMUEfl OF THIS MAFNEIAGE IF Previously MARRIEO How MANY ENDED BY EOUCATION (Y,,,v, ..1, Al,h,,, ,,.d, ,ompk,,,,
SP,<VJ 1, o,, M,,. Block. SP,CIFY {FI”I. ncoti. .Ie,) DEATH? I DIvORCE. OISSDLUTlON*“* Idlul. .1.,) 10R ANNULMENT?
Sl~0.1.\fi2~K0tiW II
Co!lw,11.4W6+I
It
II

.——,-—.
TYPEOm PRINT r -1 U.S. STANDAFLZZ r 1
PEUR;~NEN1INK
i.ucer45c NUMOER LICENSE AND CERTIFICATE OF MARRIAGE ,,.,,,,,,””.0..
FonlNsTnlrrrTloNs
GROOM-NAME rinsl MIOOLE IAST AGE
HANDBOOK 1. 2.USUAL nESIDENCE-CltEEET AND NUMBER cITY, TOWN OR LGCATION
38,. ~~.
COUNTV STATE OlnTHP LACE (8(,1,,,, fowl,. ,.u.hyl DATE OF BNZTH (Mo,. lb”, Y,.>
3C. u. 4. 5.FATNEn-NAME’ FNnTIEPLACE :&::)/omkn MOTNEn-MAIDEN NAME ENnTHPLACE $fi;:,(omtim
11. lb.SISIE)S-NAME FIRST MIDDLE LAST MAIDEN NAME Nfd!lf,m”t) AGE
al, 9b. s.USUAL RESIOENCE-STREET AND NUMIZEn CITY, TOWN on LOCATION
tIon. ,’ lM!, .
COUNTY STATE BNITHPLACE (st,N o, (owl,. c.a”mwv) DATE OF BNITM (NO.. &y. V,,)
10C. 10d. Il. . 12.
FATHER-NAME !31flTl{ PLACE (:o:l:,:~k” MOTIIER-MAIOEN NAME ONETNPLACE (Slat, or (OMU.CO”nlry)
13b. 141. 14b.
WE NEFIEIV CEIIIIFV THAT THE lNfOflMATION PROL’IOEO IS COiiZECTTOTNE EEST Of OUn KNOWLEOGE ANo BELIEF ANII THAT WE ARE FREE TO WRRV UNOERTHf LAWS OF TNIS~ATC,
5 =-nE BnlOE.S SIUNATUllE
:
,6.*:
R TINS LICENSE AUIHOtNZES THE MARRIAGE IN THIS SrATE OF TNE PARTIES NAMEO ABOVE IV ANY ?ERSOM OULY AUrNOtCIZEO: TO tEtZFOEIMAMAFNNAGE CEREMONY UHOER TUE LAWS OF THE STATE OF
SUBSC;:SI:G TO ANEES:? TO BEFO~&ME ON SIGNATURE OF lCZUINOOFFICEn TITLE OF IsSUINO OFFICEIF
llb. F“ 17C,
UC..* Ow Ynl WHEnE MARRIEO-CITYI cmtllv Ih,t the tiw
COUNTY
Mmd *VW”, w,,11s. In.,,lal a“: lFtb, !8C.
P6flSON ?EnFOnFAING CEnEMONY lITLE TYPE OF CEnEMONY(R,u,t.a”e or ,1.11,●#*cur)
18d. (SUO,IUW) F-——— l~t. 181.WITNESS TO CENFMONV
“WITNESS TO CCNEMONY
191, ,X(,,,4,.W, > 19b. f.w,..fMmI ➤LOCAL OFFICIAL MAKINO FIEIURN TO STATE HEALTH DEPARTMENT DATE RECEIVED BY LOCAL OFFICIAL (M., l).,. V,,)
lb. f%l,..hlrcl P Zob.
INFOIIMAI!ON FOil SIATISIICA1 PURPOSES ONLY
nACE-GllGOM NUM8ER OF THIS MAFEntAGE IF PREVIOUSLY MAnnlED. LAS1 MARnlAOE ENDEO EDUCATION ls,,.v% .4, ht,h,,, ,4, ~.n.,,,,,,,
Swlr, I* m. WI!*, B1-h
1-1
NUMBER OF TINS MARRIAGE IF ?REVIOUSLY hEARnlED, LAST MARFEIAOE ENLSEO EDUCATION (s,,<l& .“1, hlcb,,: M. r.-,ktidl
Swdf, {,*, VAIII*. El%k ~Pcvz ifti$~ I.md. tlc.1 BV DEATH. DIVOITCE.I
tik,m Indkn.ate,l 01 S50LUTlDN OR~DATE (Me.. =,, Y,.) EhnU”tWI~z~nd~
I : \lYL%tlANNULMEN1 f~,.ctil
iI~
25. 28. 2r~ 12,,, 29.

r 1U.S. STANDARD
REPORT OF INDUCED TERMINATION OF PREGNANCY ,Tn7=r,L.Hu.agnTYPE
on ~;NAT FACILITY-NAME of.., h.aw,td or,,tik. ,lnd4mu) CITY. TOWN OR LO-TION OF PREGNANCY TERMINATION COUNTY OF PIsEONANCY TEnMlN4T10U
?ER~;:ENT
SEE1 FFANF}{OOK
18. . lb. le.
PATIENT 10ENT1FICATION AGE OF PATIENTIMSTRUCIIOMS “
MAnR1E07 ,Ch,cbl OATE OF PREGNANCY TERMINATION(MO.,*. M,. Y,.,,
i
Zt.
❑ YES ❑ NO
2b. 2C, 3.
, RESIDENCE-STATE COUNTY CITY. TOWN oFI LOCATION INSIDE CITY LIM1lS ,ch8cb,
, 48. (b. 3-%
~. ❑ YES ❑ NO
1 RACE VCh.ch,EDUCATION I$P,.N. ..1, hbh,,f M, c.mp!.l,dj PREVIOUS PnE6NANcIEs ,C.mpI.f. ..<h WCfh..,
❑ till, n w-k f10M,”!S~m02;M0 ”d,~ ~ll?:’$;+l LIVE BIRTHS OTtSEfl PREGNANcIES
❑ Anm,ic,” Id.”II NM Ihlm I Now d,ti
, 1Swnl.mO.8 1tiuc,d
g f-J OIMr. *11,I
Numhr_ I 1Numb._ , N“&, —
1; s. 8.!
❑ ! 7b. :*W= 7c. N.ano ❑ Ila. Non, I 7d. Norm O
.,K“;% 88. PROCEDURE THAT WPE OF TERMINATION PflOCEOURES
TERMINATED PREGNANCY8b. ADDITIONAL PROCEDURES USED 8. COMPLICATIONS OF PREGNANCY
FOR THIS TERMINATION. 1P ANY TERMINATION
(CHKCX oNLY ONEI (CIIKCK ALL THAT AF?LYI (CHKCX ALL 7JIA’T AP?E.VI
D""--------------- `"~'0Nc"`E~A``----------------n D NiINE
cl-----------------s”’”’’”’’~A’E --------------~-cl“a H,~RR”AGE
❑.0
----------- 4NTfl A-" TEn, NE SAL, NE, NST, LU,, `N ------------•1
INFECTIW
•1--------- INTISA-UTERINE Pn05TAGuN01N fNs71LuTloN ---------
c1 ❑ ’UIEfllNE PEllFORATION
c1-------- -------- --””~ERo70My ----------------- . ❑ •1
CERVICAL ucEfIATIoN
❑ ----------------- “’S’’”EC’”””’------.-----------CI •1nETAINED PROOEJCTS
❑ l----------’”E’’’”’’’’”---------- ❑ •1
OTHER (s”.11,8
cl-------------------UNKNOT -------------------
•1
OATE LAST NORMAL MENSES BEGAN (Mo.Ih, b. r,-) PHYSICIAN’S ESTIMAT~ NAME OF ATTENDINO ?HYSICIAN m- WSIH.UOF GESTATION
10. 11. Wti, 12.
NAME OF PERSON COMPLETINO REPORT ~m e,,rl.N

induced abortions. Since there is no previousform to compare this revision with, I will brieflyrun through each item contained on the form.(a)
(b)
(c)
(d)
(e)
(f)
(g)
\
m)
1Name-of facility - This item will providedata about the types of facilities which areperforming abortions. It will also enablethe State to query for missing informationand to do followback surveys.City and county of pregnancy termination -provides information about where abor-tions are actually being performed.Patient. identification - This information isessential if a State plans to do any follow-back studies. These studies would probablyfocus on complications which might occurafter the patient has been discharged fromthe facility. No recommendation was maderegarding what the identification should be- each State witi have to make this decision.The possibilities discussed were the actualname of the patient or the patient numberassigned by the facility.Age of patient - This item is needed tostudy the impact of abortion on differentage groups of the population.Marital status of patient - This item will aidin determining the impact of abortion onthe illegitimacy rate.Date of pregnancy termination - Needed todetermine when the event occurs and isalso used to determine the length of gesta-tion (used with date last normal mensesbegan).Residence of patient - Provides data to al-low for the analysis of abortions by the resi-dence of the patient.
Race of patient - This information is need-ed to study the impact of abortion on suchthings as birth rate and illegitimacy rate fordifferent racial groups.
(i) Education of patient - ‘This is a socioecon-omic indicator and is needed to study abor-tion by socioeconomic status of the patient.
(j) Previous pregnancies of patient - This in-formation will provide some insight into theuse of abortion to limit family size. Sincethis item also asks for the number of pre-vious induced abortions, it will providesome data regarding the use of abortion asa contraceptive method.
(k) Type of ~regnancy termination procedures
(1)
- fiis in~or~ation; when viewed-along withthe complications item, will provide someinformation about the risks associated withthe different procedures. When viewedwith length of. gestation, it will indicatewhich procedures are more often used andappear to be more effective for the variousgestational ages.Complications of pregnancy termination -This should provide some gross data re-garding the risk of abortion.
(m) ‘Date ~st normal menses began - Used tocalculate the length of gestation.
(n) Physician’s estimate of gestation - ‘This willprovide a check on the length of gestationas calculated from date of last normaI men-ses. It will also provide something to usewhen the date of last normal menses isunavailable or is inaccurate.
(o) No signature are required on this reportform. However, it does ask for the name ofthe attending physician and the name andtitle of the person completing the report.
As you can tell, there really are not a lot of majorchanges in the certificates from the 1968 revfsion.However, we feel strongly that the certificates havebeen improved and that the changes that weremade wilI improve the quality and usefulness of thedocuments as a legal and a statistical tool,
370

NCHS PLANS FOR THE IMPLEMENTATION OF THE 1978REVISION OF THE U.S. STANDARD CERTIFICATES
Mr. Tohn E. Patterson, Director, Division of Vital Statistics. National Center for Health., ..Statistics, Rockville, M&yIand -
I have been asked to discuss the National Cen-ter for Health Statistics’ plans for the implementa-tion of the 1978 Revision of the U.S. Standard Cer-tificates, but I would first like to take a few minutesto review how we got where we are today.
These certificates and statistical reportingforms were not developed over night. They beganwith the appointment in February 1972 of a Tech-nical Consultant Panel for the Revision of theStandard Certificates, which was chaired by RobertG. Webster, formerly Chief Deputy Director of theCalifornia Department of Public Health. Therewere also five Subcommittees working under theauspices of this TCP:
Subcommittee Chairperson
Birth Certificate Marian MartinDeath Certificate Vito LogrilloFetal Death Certificate Robert G. WebsterMarriage and Divorce
~rtificates Leo OzierStructural Format Robert L. Liljegren
A little over half of the members of the parentTCP and the Subcommittee were either active orretired State officials. Most of the remaining mem-bers were representatives of groups involved in thecompletion of the various vitaI records or wereusqrs of the data derived from these records. Inorder to consider the views of a much wider group,however, the TCP developed detailed question-naires for each of the certificates, requesting veryspecific as well as very general comments andsuggestions for the 1978 revision. About 2,600 ofthese questionnaires were sent to a wide variety ofpersons and organizations having an interest in vitalrecords or data derived from the records at theNational, State, and local levels. The responses tothese questionnaires were all carefully consideredby the TCP. I think the entire revision process rep-resented a truly cooperative effort in every sense ofthe word.
The TCP completed its work and submitted itsfinal recommendations to NCHS in December oflast year after logging in about 3,200 manhours ofdeliberation in formal meetings. And this figuredoes not include any of the time spent by themembers of the parent TCP and its Subcommitteesdoing their homework prior to the meetings. Fur-thermore, it does not include any of the time devot-
ed to this project by NCHS staff members. TheTCP has wo}ked very hard dealing with some diffi-cult problems, and they have presented us with aproduct that we are pleased to recommend foradoption by the States. I believe we are all verymuch indebted to the members of the parent TCPand its Subcommittees, and I think a special wordof thanks is in order for Bob Webster and the Sub-committee Chairpersons. In spite of many prob-lems, they managed to coordinate their activitiesand complete their work on schedule.
Now where do we stand today? I am pleased toreport that the Office of Management and Budgetcleared these forms last week, so we can now pro-ceed with our plans for their implementation onJanuary 1, 1978. However, the Office of Manage-ment and Budget, as well as the Department ofHealth, Education, and Welfare, has expressed astrong concern about the need for data on birthsand deaths for the Spanish-origin population in theUnited States. We are going to be required to sub-mit an annuat report to the Office of Managementand Budget on the progress that is being made inthis area.
I would, therefore, like to review our plans forpromoting the improved reporting of birth anddeath data for the Spanish heritage population:
1.
2.
3.
In accordance with the report of the TCP, wewill recommend that the five southwesternStates identify persons of Spanish origin onthe birth and death. certificates by means ofthe revised list of surnames to be used by theBureau of the Census in 1980.
We have also asked each of the five southwest-ern States to work with us in developing aspecific item which can be used to identify theSpanish-origin population on their birth anddeath certificates. If such an item can be suc-cessfully developed, it will make it possible forus to compare the data derived from the spe-cific Spanish-origin question with data ob-tained through the Spanish surname ap-proach.
We have also contacted States with largeSpanish-origin populations in other parts ofthe country, requesting that they work with usin developing a suitable question for use ontheir birth and death certificates. Thus far, 10such States have indicated their willingness to
371

work witi us on this projedt. These 10 Statestogether with the 5 Southwestern States ac-count for about 85% of the total Spanish-ori-gin population in the country.
4. We will be following up on this matter withthe States we have already contacted as soonas possible after this Conference. We wilIalso be writing all States, indicating the needfor national data on this minority group andrecommending that they seriously consideradding an appropriate item to their birthand death certificates.
As I mentioned earlier, we hope that the revisedstandard certificates will be implemented by A Stateson January 1, 1978, when they will become, in effect,the minimum basic data set for the Vital StatisticsComponent of the Cooperative Health Statistics Sys-tem.
We will make every effort to have Printed coP-ies of these certificates andfor each of the data items in
1
a written-justificationthe hands of the State
vital statistics officials no later than January 1, 1977.We should also have copies of the ~egatives of thecertificates available at about the same time.
By July 1, 1977, we should have completed ourwork on the instructional handbooks for each ofthe certificates, as well as a “Standardized State Vi-tal Statistics Data Preparation Manual for Birthsand Deaths,” and a revised filmstrip for personscompleting the birth certificates. We will not be ableto begin work on a medical certification filmstripfor the death certificate, however, until early 1978when the 9th revision of the International Classifi-cation of Diseases is sufficiency developed for thatpurpose.
Finally, let me say we are looking forward toworking with you in the implementation of the newcertificates. Please let us know as soon as possible ifyou expect to need any assistance. We want to doeverything we can to maximize the adoption of thenew revision and we would like to make the wholeexperience run as smoothIy as poss~bIe for you, Ifyou have any suggestions for facilitating the pro-cess, please let us hear about them.
.
372

A REPORT OF THE TECHNICAL CONSULTANT PANEL ON THEMODEL STATE VITAL STATISTICS ACT
Mr. Donald T. Davids, Chief, Records and Statistics Section, Colorado State Department ofHealth, Den;er, Colorado
Since the censuses of the mid-1800’s, Federal,State and community officials have been working onvarious ways to improve and standardize vital statis-tics data across the country. Out of this effort,standard certificates of birth and death were devel-oped and recommended for use by the registrationareas in 1900, and as the years progressed, stand-ard certificates of fetal death, marriage, divorce,and now induced termination of pregnancy, havebeen added.
In addition to the standard certificates, a ModelVital Statistics Act was first promulgated in 190’7,and in 1920 a Uniform Vital Statistics Act was ap-proved by the National Conference of Commission-ers on Uniform State Law. (It should be noted,however, that this Uniform Act dld not meet gener-al approval and was withdrawn by the Conferencein 1929. Not until 1942 was another revision of theact finally given formal approval. ~ls 1942 Act isthe latest revision which carries the approval of theConference)
The current Model State Vital Statistics Act (ascontrasted to the Uniform Act) was approved andrecommended for introduction in the various Statesin 1959. This Act was developed under the auspicesof the Public Health Conference on Records andStatistics, and before publication by the U.S. PublicHealth Service, it was formally approved by boththe Association of State & Territorial Health Offi-cers and the American Association for Vital Re-cords and Public Healfi Statistics.
As the years passed and especially since theearly 1940’s, in addition to uniform statistical data,another very important need for uniformity in vitalstatistics procedures became apparent. This con-cerns the use of records of births, deaths, marriagesand divorces for legal purposes for obtaining rightsand benefits to which individuals may be entitled.With the high mobility experienced by many fami-lies, it has become common for parents to have chd-dren ,born in different States, and with increasingfrequenc~ the variation in registration practicesamong the States leads to confusion on the part ofthe persons attempting to obtain certified copies ofbirth and death reco~ds, make necessary correctionson birth and death records, or establish new birthcertificates after adoption and legitimation.
Consequently, in order to provide individualswith reliable certified copiesand to improve admin-istrative practices, it is apparent more uniformity in
> .
day-to-day procedures not covered specifically bystatute is desirable.
Under the sponsorship of the Public HealthConference on Records and Statistics, a TechnicalConsultant Panel was appointed .to develop a set ofmodel regulations based on the 1959 Model StateVital Statistics Act. This has been done, and theseModel Regulations were approved in provisionalform, pending revision of the Model Act, by theNational Center for Health Statistics and distribut-ed to Ae registration areas in August of i9’73.
While drafting the Model Regulations, thePanel noticed that several parts of the Model Act of1959 did not seem pertinent to today’s society inlight of the extensive changes in technolo~ andsocial practices and philosophy during the pasttwenty years. Recognizing the need for detailedstudy of the Model Act, the Model RegulationsTechnical Consultant Panel was reformed into theModel Law Technical Consultant Panel in 1972.Some examples of the changes during the last twen-ty years that directly affect vital statistics policiesand procedures include the almost incomprehen-sible expansion of computer technology-to theextent several registration offices are now issuing orhave the capability to issue certified “copies” or ab-stracts from computer files. Microcopy techniquesalso are constantly being refined so that these tech-niques are worthy of consideration to an extentprobably not envisioned in the 1950’s.
Social attitudes concerning birth, death “andabortion also have changed substantially. At a timewhen we felt birth registration was essentially 100percent complete, small groups of people began toturn away from traditional social and legal customs,and births began to occur outside of hospitals andwithout medical attendance, resulting in nonregis-trat.ion. Many babies born out of wedlock are nowbeing kept by their mohers or fathers, so identifi-cation of paternity on birth certificates of illegiti-mate children is a significant matter.
For married mothers to retain their maidennames and to give. the children their own surnameor hyphenated surnames is customary in some coun-tries and is seen to a growing extent in this country,and there are instances of children being given onename with no family surname. How far shos.ddState law go to dictate or control these practicesthat probably are quite harmless and really have nofraudulent intent?
373

Fetal death registration, always a problem, be-came more complex with legalization of inducedabortions or repeal of abortion laws. Burial societieswhich try to minimize the cost of burial are chang-ing some of the traditional practices of mortuaryestablishments.
All these kinds of matters have prompted anew look at model legislation, and during the pastfour years, the Panel has reviewed each word of the1959 Act. At this time it appears the Panel hascome to agreement on many of the issues raised,and the current revised draft of the Model StateVital Statistics Act is the result of the Panel’s workto date.
One of the major problems facing the Panelhas been that of trying to anticipate and incorpor-ate in the Act the needs of fifty-eight registrationareas and yet keep the language sufficiently preciseto meet legal challenge. I’m sure we have not al-ways kept the optimum balance, probably fallingmore frequently into too broad language becausewe believe certain concepts to be very important,and those concepts must be entered into State laws,even though we may not have been able to writethose concepts as precisely as they should be wri-tten. However, thorough and rigorous editing whichstill must be done will substantially improve theprecision of language.
The panel sees the Model Act only as a modelfor each registration area to follow in reviewing andrewriting its own statutes. Indeed we recommendstrongly that it be followed and ideally that it beenacted verbatim. But we realize that each State hasits own complex of laws, attitudes and beliefs whichinterrelate with the practice of vital statistic-marriage laws, divorce laws, statuto~ definitions oflegitimacy and the rights and responsibilities ofnatural fathers, laws requiring county officials otherthan local registrars to keep copies of vital rec-ords—and some registration areas are primarilyrural with large sparsely populated areas while oth-ers are totally urban. Thus it is not possible to writean act which can meet the total needs of each regis-tration area, but hopefully this Act will provide asound base fo: registration officiaIs to interplaywith other statutes and to develop a set of goodpractices which can lead to more uniformity acrossthe country.
Probably the most significant change in thisrevision is that no provision is made for the localregistrar concept as we have known it for manyyears: The Panel feels that, with the present systemof data communication and the licensing and pro-fessional status placed on hospital staffs, physiciansand funeral directors and the need for certifiedcopies of birth and death records, there is not suffi-cient need in many areas for the traditional localregistrar role of registering vital events. Theyshould be registered directly with the State Office of374
Vital Statistics. On the other hand, because of thefrequent and often immediate need for. certifiedcopies, local offices where these needs can be met intimely fashion probably can be justified in the morepopulous communities. Thus the Revision doesprovide that the State Registrar may establish otheroffices throughout the State to more efficiently ad-minister the system of vital statistics, Ideally thisprobably would be a branch office concept with thebranch office having access to the total State file andthus more completely fulfilling the needs of the res-idents of that community and avoiding the problemof validity of local registrar-certified copies.
Another change in traditional vital statisticspolicy is that of authorizing the hospital administra-tor to sign birth certificates if the attending physi-cian does not sign within seventy-two hours, andauthorizing an associate physician, chief medicalofficer of the hospital, or pathologist to sign deathcertificates with the approval of or in the absence ofthe attending physician. These are basically proce-dural changes in an effort to get more prompt reg-istration of births and deaths. However, in the matterof deaths, since some 20 percent of the non-medicalexaminer or coroner deaths are autopsied, authoriz-ing the patholo~-st to complete the medical certifica-tion should provide improvement in cause-of-deathreporting.
These two areas of change are probably themost significant ones in this revision, but there areother changes in particular to which we call yourattention and on which we request your comments.These are summarized on Appendix 1.
Future plans of the Panel are to have one moremeeting to consider the comments and recommen-dations we receive at this meeting and to prepare afinal draft of the Act, which we will recommend tothe National Center for Health Statistics, which, inturn, will solicit endorsement from pertinent orga-nizations and agencies and then will publish the Actand recommend its adoption in the various registra-tion areas. Also, it is our desire to rewrite the Mo-del Regulations to complement this revision of theact. Hopefully this can be accomplished during thetwo years before the next Public Health Conferenceon Records and Statistics.
Technical Consultant Panel MembersHazel V. Aune, NCHS, RetiredIrvin G. Franzen, KansasMartha H, Patillo, Georgia, RetiredRonald Saf, Attorney, IowaDonald J. Davids, Chairman, Colorado
NCHS ConsultantsLoren E. ChancellorMary Lou DundonGeorge A. GayJohn E. PattersonKatherine W. Quillian
.

Appendix 1
SUMMARY OF THE MOST SIGNIFICANT CHANGES IN THECURRENT DRAFT REVISION OF THE MODEL STATE VITALSTATISTICS ACT COMPARED WITH THE 1959 REVISION
Section in Present Revision
1.
5. ‘
6.
7.
13.
15& 1617.
20.
22.
23.
2’7.
Definitions(c) Vital records(h) Induced termination of pregnancyDuties of State Registrar(b) Additional offices (Note that Sections 6-8 of 1959 Act concerning Local Registrars are not
included in this revision)(d) Providing copies and data to local health agenciesContent of Certificates and Reports(c) Electronic and photographic filing and registrationBirth Registration(b) Hospital administrator to sign in lieu of physician after 72 hours(d) Birth occurring in or above international waters or foreign country(e) Naming of children when parents not married(f) A child born to a married woman as a result of artificial insemination is legitimateDeath Registration .(a) Death in or above international waters or foreign country(c) Signature by other than attending physician(d) Medical examiner (coroner) cases(g) Presumptive deathFetal death and induced abortion - Statistical reportsAuthorization for final disposition(a) Signed by physician or medical examiner (coroner)(b) Parents authorize disposition of dead fetusAmendment(e) Surgical sex changeDisclosure of information(d) Public recordsCopy of data
(d) (e) providing copies or data to Federal and State agenciesPenalties - More detailed and more severe
375229-121 0-77 -25

CHANGES IN THE MODEL STATE VITAL STATISTICS ACT -ROLE OF THE AMERICAN ASSOCIATION FOR VITAL RECORDSAND PUBLIC HEALTH STATISTICS
Mr. Vito M. Lo~illo, President, American Association for Vital Records and Public HealthStatistics,Alban~, New York
The principal changes in the Model Act as de-scribed by Mr. Davids brings us up to date with the
issues cutiently being faced by State registrationand health statistics offices. These changes addressmany of the problems and concerns that have sur-faced since the last revision. These include issuesrelated to the reporting of spontaneous and in-duced terminations of pregnancy, the centralizationof State vital statistics records systems, the expand-ed use of computers in the registration process, andthe continuing concern for the confidentiality ofvital records in State ofices.
Members of the American Association of -VitalRecords and Public HeaIth Statistics (AAVRPHS)are, of course, directly affected by and involved inthese and other issues which arise daily in vital rec-ords registration and health statistics operations,In tis regard, it is significant to note that the de-velopment of the Model Act, as well as the Stand-ard Certificates, was made .tith considerable directparticipation by, and discussion with, the Associa-tion membership. I believe tils is reflected in thefinal products resulting from these efforts as hasbeen described by the panel this morning.
The Model Act to date has served reasonablywell in meeting the need to bring a degree of con-sistency and uniformity to a widely dispersed set ofindependent reporting systems in order to establisha basis for a national system. To the degree towhich the Model Act has met this need in the vitalstatistics area, this concept will be used to developappropriate model legislation for the general classi-fication of health statistics as was discussed in anearlier session. The Model Act, in serving as amodel for this broader generalization, can be saidto represent a viable approach- to standardization.This is an absolute prerequisite for the develop-ment of a national health statistics system which ishoused in the somewhat congested legislative envi-ronment of the fifty States and territories.
Each of the main issues I have alluded to areincorporated in the current revision of the ModelAct. The role of the Association in its implementa-tion is, perhaps, self-evident. However, I would liketo very briefly comment on this aspect.
A number of States have incorporated many ofthe provisions now contained in the present Madel
376
Act and others do so to the degree these meet theparticular needs of their State, The prospect ofseeking and adopting new legislation to incorporatethe proposed new provisions is, perhaps, less thanintiting for many of us. However, there are severalconsiderations which should be made before damn-ing the process.
First and perhaps foremost is the recognitionthat in today’s mobile society the individual needfor personal records, in this case vital records, moreand more frequently cross State boundaries. Forexample, the birth records of a family, parents andchildren, could be located in as many States asthere are family members. The problems associatedwith the variety of formats used for copies of rec-ords in terms of acceptance by other agencies,Federal and State, and the growing numbers of thefraudulent uses of these records are well document-ed. The need for uniformity not only in the formatand content of the records but in the processing aswell is highlighted by the recent developments inthe vital statistics component of the CooperativeHealth Statistics System (CHSS). This is essential toprovide for and maintain a responsive national vitalstatistics system. The examples go on, as all of uscould, on the practicalities of the situation.
There are, of course, drawbacks as well. Justifi-cation for legislative change is almost always diffi-cult. Meeting the particular needs of fifty States andterritories is, without qualification, difficult; andmany times the benefits for an individual State areobscure at best.
I do not feel there is a need to prepare a ]aun-dry list of the pros and cons since these have beendiscussed many times in the past. The Associationhas endorsed the concept of the Model Act and Ifeel can continue to do so with the proposed revi-sions. Where the Association can be supportive toany State in its efforts for implementation, I amsure it will be. The proposed revision representsconsiderable effort on the part of members of theAssociation, deals with concerns and issues perti-nent to the membership, and overall offers a degreeof uniformity, commonality and consistency to ourcollective activities. In this regard, the Associationshould be responsive in a positive and supportiverole.
,

UTILIZATION STATISTICS IN LOCAL AREAS
.
Ms. Sandra Hapenney, Program Manager, Health Planning Development, Alamo AreaCouncil of Governments, San Antonio, Texas; and Carmault B. Jackson, Jr., M.D., GiinicalProfessor of Medicine, Departments of Medicine and Family Practice, University of TexasHealth Science Center, Sa~ Antonio, Texas
The effective use of utilization statistics in localareas has received recent attention. Health ServiceAreas are now mandated and Health Systems Agen-cies (HSA’S) are charged with health planning. Tofunction adequately under P.L. 93-641, each localHealth Systems Agency will need good data supportwith localized information as well as the capacity fordata analysis. The National Health Planning andResources Development Act of 1974 which replacesCHP (Comprehensive Health Planning), RMP (Re-gional Medical Programs), and the Hill-Burton Actreauires that such agencies gather necessary inior-m;tioning:
A.
B.
c.
D.
E.
in a timely effective manner for determin-
The status (and its determinants) as to thehealth of the residents of the area;The status of the health care delivery sys-tem in the area and the use of the systemby the residents of the area, including pat-terns of health expenditure and healthfinancingThe effect the area’s health care deliverysystem has on the health of the residents ofthe area;The-’number, type and location of the area’shealth services, manpower and facilities;The patterns of utilization of the area’shealt~ resources; and,
F. The environmental and occupational expo-sure factors affecting immediate and long-term health conditions.
With these requirements, Health SystemsAgencies must have a centralized and organizedapproach to data and information management inorder to perform.
The obvious first task of each of these groupswill be area health planning. In this presentation,we will focus on data analysis and data supportneeded, We recognize the importance of projectreview functions but the initial planning describedshould provide an excellent data base for discharg-ing this later responsibility. Wise local planners willutilize data from all available sources.
Existing legislation requires that Health Sys-tems Agencies cooperate with national, State, andlocal levels for data use and analysis. The “Cooper-ative Health Statistics System” will be a main sourcefor coordination of. much of the information. Inour opinion, at this time the best source of national
data is the National Center for Health Statistics’(NCHS). Vital and Health Statistics Series, whichprovides excellent comparisons and is usually theonly source for calctiating local estimates. We findthe Ambulatory Health Care Services Survey’s, utili-zation data is good but its usefulness at the locallevel is limited since it is not presently broken downby health services’ areas.
On the State level the new State health plan-ning agencies are generating improved inpatientutilization data which includes: information on typeof services, number of beds, patient admissions, dis-charges, medicare and medicaid admissions, infor-mation on procedures and services, and extensivemanpower information. This data too is limited inthat it does not give demographic information onpatients, cause of hospitalization, or method of pa-tient financing. The State agencies are not yet pro-viding minimum data sets on ambulatory services.Probably the most reliable State data comes fromthe State health departments who have for many ‘years collected local mortality and reportable mor-bidity data.
At the next level we find county or municipalhealth departments often collect and analyze addi-tional data other than that required by the StateAgency. An example in our area is detailed immu-nization information by census tract and ethnicity.This can be helpful in looking at a segment of thepopulation within a health service area but it is notuniformly available since there are usually manylocal health departments within each HSA collect-ing and processing data in different ways with dif-ferent systems for often differing purposes.
Before we begin discussing available utilizationdata, its use and the need for further data in healthplanning, we will assume that local demographicand environmental data is already secured.
The first statutory requirement for the emerg-ing HSA’S is the establishment of a Health SystemsPlan. This plan is to address both short and long-range goals - probably with an initial upper limit offive years. (Goals are statements of achievementwhich express the community’s aspiration over agiven period for the highest level of health attaina-ble and for the highest level of performance by thehealth system.) The health planning agency for ourregion recently completed such a goals plan.
377

For this effort, the data we mentioned as cur-rently available at different levels was sufficient toaccomplish the task mainly because a great deal ofspecificity is not required for goals planning. Localmortalitv and re~ortable morbiditv ~rovided ade-quate i;formatio; for initially esta~l&hing goals inhealth status. Local estimates of other morbiditycalculated from NCHS Vital Health Statistics gave
v
added guidance in this area.As an example of the manner in which goal
setting was begun refer to the mortality data availa-ble in Table I. This was provided to the Heart Dis-ease Task Force of the Health Planning Committee.In this committee’s goals development the informa-tion actually used consisted of the crude and ageadjusted death rate for all heart diseases togetherwith the local estimates made from the NationalHealth Interview Survey. @efer to Table II.)
Other work groups reported that the local re-portable morbidity data was limited but nonethelessuseful to the Health Planning Committee (for ex-amDle: venereal disease). Chart I indicates thetre;ds in gonorrhea and syphilis which providedthe committee with sufficient information to setgoals in this area.
Additional information for setting goals can begleaned data from occupancy rates for inpatientfacilides throu~h a ve~ simplified annual inventory.Although this ;nvolves” over-three hundred agenciesin our ;rea wi have found it to be rather ;eliable(an exam~le inventory sheet is attached.) This in-formation; was used i; conjunction with “data sup-plied by our State Agencies.
In another examDle. the hosDital utilizationdata collected over the’past five yea;s was subjectedto a multiple regression analysis for determinationof future bed need. As a result of knowledge of theprojected bed need, the present bed cap;city foracute short-term general hospital beds,” and plansfor future development of such beds, the commit-tee was able to establish a moratorium on the con-struction of short-term general hos~ital beds for the
v .
near future. This same committee recognizes thateven carefullv derived formulae utilizin~ accuratedata may no; contain all future variable; and sub-jects this moratorium to annual review. Table IIIillustrates clearly the information which providedthe basis for the” policy and subsequent goals.
In the future planning by HSA’S, especially theAnnual Implementation -Plans (objectives planningfor one year) and the fulfillment of legislativerequirements will require more specific knowledgeof local morbidity, availability of services, level of.- /care and cost to the patient. For the establishmentof objectives, development of standards and criteriawill be necessary. (Criteria give a measurable termand standards set a level of measurement.)
As a result of experience within the AlamoArea Council of Governments we have come to the378
opinion that desperately needed at the local level isthe following information on both inpatient andoutpatient care:
1. causes of morbidity2. demographic patient characteristics3. method and amount of financing4. patient services available
In our planning efforts the lack of this dataproved to be insurmountable in setting objectives,For instance, one of the Task Forces, Maternal andChild Health, was not able to establish objectivesbecause they did not know the levels of care pre-sently being offered in various areas of the Region.Even though this group felt they could state fromsubjective knowledge that specific services wereneeded, they could not quantify the amount norindicate the geographic location for the develop-ment of such services.
The following are examples of some goals andthe data needed to accomplish the objectives set bythem:
Example 1) Goal:
To reduce overall cancer care cost by develop-ing a spectrum of facilities and services to providealternatives to hospitalization in acute care facilities.
In order to set objectives for such a goal thefollowing data would be needed for criteria:
1. present cost to the patient2. Level of morbidity3. present services offered
Objectives would then be established setting astandard lor additional services based upon level ofmorbidity and present services offered and by thendetermining a possible reduction in cost to the pa-tient in the light of knowledge of present cost.Sophisticated analysis techniques for forecastingand determining cost benefit will be necessary forthis step.
Example 2) Goal:
To establish nursing diabetic clinics to assistphysicians in the followup of patients by givingtreatment, dietary and personal hygiene with parti-cular emphasis on food hygiene instructions, and byperiodic nursing evaluation as requested by thephysician.
Information needed for criteria would include:
1. Level of morbidity2. number of physicians who would utilize such
services for their patients3. demographic information on diabetic patients
(not only geographic but ethnic and socioe-
.

Gonorrhea
/+
/
/
+/+
/-t
~+i973
YEAR
Chart 1
+
00-n
000
-..;
L
Syphilis
~+ ! +...
I 97! 1972 1973
YEAR
Compiled by: Alamo Area Council of Governments, Comprehensive Health Planning, March, 1976.
379

conomic information is necessary since dia-betes appears to have a higher incidencerate in certain ethnic groupings and is relat-ed to diet which is often dependent uponeconomic situation).
With tils information ,an objective could thenbe established quantitatively by indicating the num-ber and location of clinics to be established.Analysis for forecasting would require taking intoaccount the related demographic and socioeconom-ic variablesin the population ascited earlier.
In conclusion, the use of utilization statisticsin
local areas is of growing and vital importance tosuccessful health planning. At present, some gooduseful data is available but the quantity is limited.The collection and analysis of data in local areasneeds greater emphasis, especially in the area ofambulatory health care. We realize that an effort inthis area is fireatening for various reasons tomany individuals and agencies; however, onlythrough increased cooperation among all indivi-duals concerned will local health planning be help-ful and beneficial to the recipient of health careand to those of us who work at provision,
380

Table I
AGE SPECIFIC DEATHS DUE TO CARDIOVASCULAR DISEASES
IN THE AACOG REGION
1970 <24 25-39 40-54 55-64 65-74 75+
Act. Rheum. f. & Chron. Rheum. H.D. I-.L-J4I9I4II3I7Hypertensive H.D. I 4 3 I 8 14
Hypertensive H- nm~Renal ~- 1 I 2 3 2 17
Other Acute & . ... . . .Chron. isch. H.DAngina pectorisChron. D. of El...”---- -..., “-. ~..-.. ,Acute Myocardial Infarction 16 184 243 3ii 464
All other forms of H.D. 5 5 27 24 43 84Total 7 22 280 378 695 1,261
.. —-- -----— —. ,Subacute forms.of isch. H.D. 1 2 4
-. 2 51 100 220 627
S & Asypt. H.D.nAr. I.mvA % WTrnP imc,, ff 1 1 3 13 14
1971Act. Rheum. f. & Chron. Rheum. H.D. 1 4 8 8 8 12
Hv~ertem~;~~~~ n % x 6 24.... . . - ----- I I I I I I--
,nsive M. and Renal n. 1 1 5 16Hyperte ------ ------- ------ –. ! , IOther kute & Subacute forms of isch. H.D i 2 5“
–i... ”....“.,... L..-
-—--- -——--. . -.~hvnm ;cch U n 5 53 145 37 621
1 2l,ff 9 1 1 3 3 17
Angina pectoris & Asympt. H.D.Chron. D. of Endocard. & Myoc. insL.. 1 I 1 I 1 I
Acute Myocardial Infarction i i 179 26; 374 530
Allother formss of H.D 3 4 8 26 42 78
Totfl 6 22 253 458 477 1,305
1972 IAct. Rheum. f. & Chron. Rheum. H.D. I I 1 11 8 8 7.- —--. -. -- ------- .-,,--- -msive H.D. 1 4 8 8 19
Hypertensive H. and Renal D. 2 2 21
Other Acute & Subacute forms of isch. H.D. 2 4
nnpt. H.D.Chron. D. of Endocard. & Myoc. insuff. 2 1 2 ‘6 1 10 .
Acute Myocardis3 Infarction 1 15 293 291 392 548All other forms of H.D. 6 11 “ 23 35 4’4 73
Total 10 30 380 439 669 1,335
1973 .Act. Rheum. f. & Chron. Rhe~T~ U n I 9 I 1 19 9 I 4 11
Hypertemc;u- ~ n
Hyperte.,...~..
.. .... AA. -. . --
. . . . . . - ----- 2 ~. 4 24=~c:I’” H. and Renal D. 1 3 9
Sllh.~l,te fnrms of isch. H.D. 2 6
,...F.. ----- I I I I 1 1
d. & Mvnc. insnff. 2 3 4 3 4
Other Acute & L-------- --------- ------ .-.–. 1 ! , r
Chron. isch. H.D. 3 49 91 I 248 693
Angina pectoris & AsT”+ U n I I I I I
Chron. D. of Endocarc. _ -._, _.. ______ ,Acute Myocardial Infarction 1 13 205 279 461 619
Ml other forms of H.D. 6 I I I
Total 11 2: , ‘z;: , *:: , /:: , ,,*::I -. I --
I-.
Iri m.-, ! “0” ““O .“””
Compiled by: Alamo Area Council of Governments, Comprehensive Health Planning, Mwch 1976.
381

Table II
ESTIMATED NUMBER OF PERSONS WITH LIMITATIONOF ACTIVITY BY CHRONIC CONDITIONS FOR 1974
IN THE AACOG REGION
Estimated
Chronic Condition Number ofPersons
Heart conditions . . . . . . . . . . . . . . . . . . . . . . . . . . . . . . . . . . . . . . . . . . . . . . . . . . . . . . . . . . . . .Arthritis and Rheumatism (all ages) . . . . . . . . . . . . . . . . . . . . . . . . . . . . . . . . . . . . . . . . . . . . . . .Impairments (except paralysis and absence) of lower extremities and hips . . . . . . . . . . . . . . . . .Impairments (except paralysis) of back and spine . . . . . . . . . . . . . . . . . . . . . . . . . . . . . . . . . . . .Musculoskeletal disorders other than impairments of lower extremities, hips, back and
spine and upper extremities md shedders . . . . . . . . . . . . . . . . . . . . . . . . . . . . . . . . . . . . . . .Asthma, withorwithouthay fever... . . . . . . . . . . . . . . . . . . . . . . . . . . . . . . . . . . . . . . . . . . . .
Mental and nervous conditions . . . . . . . . . . . . . . . . . . . . . . . . . . . . . . . . . . . . . . . . . . . . . . . . . .Hypertension without heart involvement . . . . . . . . . . . . . . . . . . . . . . . . . . . . . . . . . . . . . . . . . . .Condition not specified - old age (65 and over) . . . . . . . . . . . . . . . . . . . . . . . . . . . . . . . . . . . . . .Diabetes. . . . . . . . . . . . . . . . . . . . . . . . . . . . . . . . . . . . . . . . . . . . . . . . . . . . . . . . . . . . . . . . . . . .Cerebrovascubr disease . . . . . . . . . . . . . . . . . . . . . . . . . . . . . . . . . . . . . . . . . . . . . . . . . . . . . . . .Visual impairments . . . . . . . . . . . . . . . . . . . . . . . . . . . . . . . . . . . . . . . . . . . . . . . . . . . . . . . . . . .Paralysis, complete or partial . . . . . . . . . . . . . . . . . . . . . . . . . . . . . . . . . . . . . . . . . . . . . . . . . . . .Conditions of the circdatory system other than hemorrhoids, varicose veins, hypertension
without heart tivolvements, cerebrovascular disease, and heart conditions . . . . . . . . . . . . . . .Hearing impairments . . . . . . . . . . . . . . . . . . . . . . . . . . . . . . . . . . . . . . . . . . . . . . . . . . . . . . . . . .Conditions of the digestive system other than hernia and peptic deer. . . . . . . . . . . . . . . . . ... . .Impairments (except paralysis and absence) of upper extremities and shoulders . . . . . . . . . . . . .Conditions of the respiratory system other than chronic sinusitis,hay fever, with or
without asthma, emphysema and chronic bronchitis . . . . . . . . . . . . . . . . . . . . . . . . . . . . . . . .Mali~ant neoplasms . . . . . . . . . . . . . . . . . . . . . . . . . . . . . . . . . . . . . . . . . . . . . . . . . . . . . . . . . .Peptic titer . . . . . . . . . . . . . . . . . . . . . . . . . . . . . . . . . . . . . . . . . . . . . . . . . . . . . . . . . . . . . . . . .Varicose veins. . . . . . . . . . . . . . . . . . . . . . .. . . . . . . . . . . . . . . . . . . . . . . . . . . . . . . . . . . . . . . . . .Benign and unspecified neoplasms . . . . . . . . . . . . . . . . . . . . . . . . . . . . . . . . . . . . . . . . . . . . . . . .
18,90815,7878,2448,124
7,0375,177
5,1394,0183,8663,3283,2843,2032,773
2,6972,4252,1972,077
1,8701,5171,435
1,082804
NOTE: Diseases clms~led according to the Eighth Revision of the
International Classification of Diseases, Adapted 1965.
A major activity refers to ability to work, keep house, or engage in school or preschool activities.
SOURCES: Vital and Health Statistics Data from the National Health Survey Series 10- Number 96, Novem-ber 1974.
COMPILED BY: AIarno Area Council of Governments, Comprehensive Health planning,March 1976.
382

Table Ill
ALAMO AREA COUNCIL OF GOVERNMENTSCOMPREHENSIVE HEALTH PLANNING
SAN ANTONlO (BEXAR COUNTY) SHORT TERM GENERALHOSPITALS
1974 Utilization Data
San Antonio Hospitals
Baptist MemorialNortheast BaptistSoutheast BaptistBexar CountyRobert B. Green
Lutheran
MethodistMetropolitanNix MemorialPark NorthSt. BenedictS,A, CommunityAlamo GeneralSanta RosaGeneral & Children
TOTALS
Capacity Number Admissionsof Beds as of or Patient Days Occupancy Rate3
Dec. 31, 19741 Discharges Percent
672 30,588 218,697 89.2190 (163)2 5,658 35,387 51.0 (59.5)4189 ( 96)2 4,217 27,135 39.3 (77.4)4425 14,066 114,952 74.1
62 5,248 16,648 73.6
225 (162 June 30) 5,58522,934 Jan-June 78.6 Jan - June19,006 July-~c. 45.7 July - Dec
407 17,554 119,182 80.2273 (221)2 4,325 28,050 28.2 (34.8)4200 (186)2 8,531 57,966 79.4 (85.3)4100 1,810 22,499 61.6
28 341 4,159 40.7300 (196)2 6,483 49,129 44.9 (68.7)4
45 1,186 7,627 46.4
I 28,895 I 201,789 “ I 76.3
1,841 (3551)2 ] 134,487 I 945,160 I 68.0
‘ Capacity Beds: Total beds avaiIabIe for staffing for in- End of Year Bed Capacity 3,841patients. This is the average daily bed capacity. Does not in- Average Daily Bed Capacity 3,810s
elude ne!vborn, recovery, emergency, etc. beds. Average Daily Census 2,590
‘Bids set up and in use as of Dec. 31, 1974. Average Daily Empty Beds 1,22053 Based on bed capacity. Average Length of Stay per Patient 7.0~ B&cd on number of beds in use. Average Occupancy Rate - All Hospitals 68.0
s Average daily bed capacity of Lutheran 194.
383

ATTACHMENT (This is an example inventory sheet for a localhealth agency.)
NAME:
ADDRESS:
PHONE:
ADMINISTRATE R:
CONTACT PERSON:
DESCRIPTION OFSERVICES:
HOURS:
FEES:
ELIGIBILITYREQUIREMENTS :
Community Guidance Center of Bexar County
2135 Babcock RoadSan Antonio, Texas 78229
Services also provided at:Robert B. Green Hospital527 North Leona - Room W204San Antonio, Texas 78207
Babcock Clinic: 696-7070Hospital Clinic: 223-6361, Ext. 420
Alberto C. Serrano, M.D., Executive Director
Receptionist for information
The Community Guidance Center is an outpatient psychiatric clinic for children,adolescents, and their families. It also provides mental health consultation to schoolsand other community agencies; participates in teaching and training of all levels ofmental health professionals and para-professionals; provides diagnosis and treatmentof emotional, behavioral and learning problems of youth including family stresssituations; directs the child and adolescent program and training for the “Ambula-tory Psychiatric Services” at Robert B. Green Clinic.
Hospital Clinic: 8:30 a.m. to 5:00 p.m., Monday - FridayBabcock Clinic: 8:30 a.m. to 5:00 p.m., SaturdayEvening hours by arrangement
Standard for direct patient services: sliding scale according to income when afinancial burden. Contract charges to agencies.
For diagnosis and treatment services: any Bexar County resident under 18 yearsof age for mental health consultation: any nonprofit agent y in Bexar County.
384
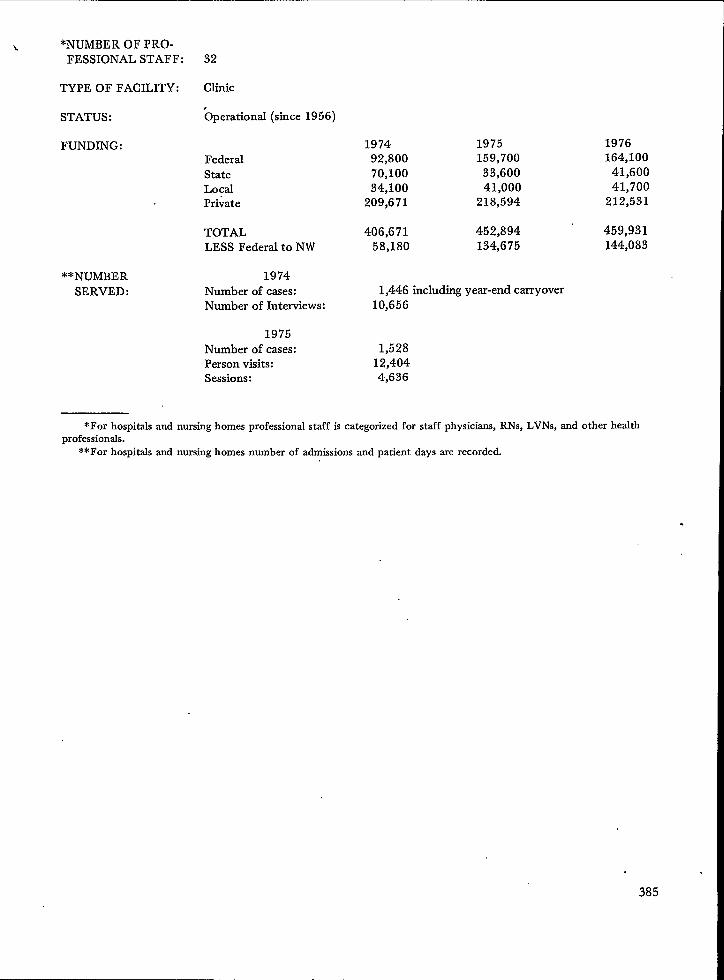
**NUMBER
SERVED:
\ *NuMBER OF PRO.
FESSIONAL STAFF: 32
TYPE OF FACILITY: Clinic
STATUS : ~perational (since 1956)
FUNDING:FederalStateLocalPrivate
TOTALLESS Federal to NW
1974Number of cases:Number of Interviews:
1975Number of cases:Person visits:Sessions:
1974 1975 197692,800 159,700 164,100
70,100 33,600 41,60034,100 41,000 41,700
209,671 218,594 212,531
406,671 452,894 459,93158,180 134,675 144,083
1,446 including year-end carryover10,656
1,52812,4044,636
*For hospitalsand nursinghomes professional staff is categorized for staff physicians, RNs, LVNS, and other healthprofessionals.
**For hospitals and nursing homes number of admissions and patient days me recorded.
.
385

THE DEVELOPMENT OF UNIFORM BASIC DATA SETS TODESCRIBE THE USE OF HEALTH RESOURCES
Mrs. Jane H. Murnaghan, Assistantprofessor, Departmentof Health Care Organization,Johns Hopkins Um”versity, Baltimore, Maryland
In this presentation, I would like to reviewbriefly the history of the so-called “uniform basicdata sets” and bring you up to date on recent devel-opments.
The concept of the basic data set first emergedat the Airlie House Conference on ~Hospital Dis-charge Data in 1969, where a diversified group ofproviders and users of hospital inpatient data metin an attempt to improve the collection of hospitalstatisticsin the United States. It was readily appar-ent that there was a core set of facts collected bymost data systems and required by the majority ofusers—professional staff, utilization” review com-mittees, researchers, hospital administrators, exter-nal regulatory bodies, third-party payers, planningagencies, and all the many others involved in mak-ing decisions about hospital inpatient care. TheConference focused its attention, therefore, ondefining the boundaries of this core or minimumset of data and establishing uniform definitions andclassifications for it. There were prolonged and in-teresting discussions at this and subsequent confer-ences about how many masters a basic data setshould seek to serve, how much or little detailshould be included, how the content area should bedefined and classified, and what the relationship ofthe data set should be to medid and administrativerecords, on the one hand, and health data systems,on the other. But in essence the concept is a rela-tively simple one of adopting standard terms andclassifications for those elements of data universallyneeded to describe, plan, provide, and evaluatehealth care. The point of standardization is to makeit possible to aggregate data about individuals andtheir use of services; to make comparisons betweenindividuals, population groups, providers, institu-tions, and methods of treatment; and to identifytrends that are occurring. A basic data set is not aninformation system, nor does it substitute for themore extensive medid and administrative recordsnecessary to care for the patient. It is instead a setof specifications which, if incorporated in medicalrecords and ongoing data systems, will make itpossible for providers of care or institutions oragencies not only to monitor their own patients andactivities, but also to compare themselves to others.These specifications are also a mechanism for coor-dinating the requirements of external agencies andreducing the burden of paper work on providers ofcare; if the majority of users can agree on theterms and classifications of a basic data set, it then
386
become possible to set up data brokers or resourcecenters like the Federal-State-Local CooperativeHealth Statistics System to simplify collection anddistribution.
Development of the UniformHospital Discharge Data Set
The recommendations of the Airlie HouseConference were forwarded to the United StatesNational Committee on Vital and Health Statistics,-which refined the specifications in cooperation withthe major public, private, and professional groupsinvolved, considered the results of field tests, andgave its official stamp of approval to the UniformHospital Discharge Data Set with which most ofyou are already familiar. It has the endorsementof organizations like the AHA, it is widely adheredto by current data abstracting systems, and it hasbeen approved by the Social Security Administra-tion, the Bureau of Quality Assurance, and theCooperative Health Statistics System. The biggestobstacle now to rapid development of informationsystems to provide these data for all areas of thecountry is a jurisdictional tug-of-war within HEW.The contents of the data set have been reviewedrecently by a task force of the U.S: National Com-mittee and minor changes proposed, but for allpractical purposes, there is no disagreement on thisscore. The problem is whether major users like SSAand the PSRO’S can coordinate their data collectionso that single systems can be set up to serve all theneeds of a geographic area like a State, or whetherthey and others will mandate separate forms andpatterns for the flow of data.
Ambulatory Care Data Set
In 1972, a second conference was held in Chi-cago to tackle the somewhat more difficuItproblem ofuniform specifications for ambulatory health caredata. The same process was followed of surveyingwidely the needs for data, establishing guidelines,defining a basic core useful in most ambulatory caresettings, and forwarding recommendations to theUnited States National Committee on Vital andHealth Statistics.In 1974 the Committee completedits review and revision, and we now have a secondofficially mandated data set. It is not yet as widely

used as the hospital data set, but this is largely be-cause our network of information systems for am-bulatory care is far less well developed. It has, how-ever, been incorporated in the new national surveyof office-based practice of medicine, the NationalAmbulatory Medical Care Survey, which is begin-ning to provide us, for the first time, with a com-prehensive picture of the vast and varied world ofmedical care outside the hospital walls.
Long-Term Care Data Set
Finally our group at the Johns Hopkins Schoolof Public Health, under the auspices of the Nation-al Center for Health Statistics, turned its attentionat the Tucson Conference in May 1975 to long-term health care. This has been by far the mostchallenging of the three areas dealing with patient-oriented data on the use of health services becauselong-term care is ~ broad and ill-defined field, be-cause it includes many social welfare functions aswell as those traditionally associated with medicalcare, and because standard tools like the Interna-tional Classification of Diseases are not sufficient tocharacterize the problems and needs of the long-term patient or client.
The report of the Tucson Conference has justbeen published, and again its recommendations willgo to the United States National Committee on Vi-tal and Health Statistics for refinement, testing, andofficial endorsement.
Some ‘General Comments onthe Three Data Sets
The basic elements of the three related datasets covering the use of the health care resourcesare summarized in the attached table; and a list ofreferences is appended for those interested in moreinformation about them. Together, they constituteone of the basic building blocks of the CooperativeHealth Statistics System. Other major componentsare the specifications for manpower and facilitydata to describe the available resources, census datato describe the basic characteristics of the popula-tion at risk, and vital statistics. Probably there willalso be specifications to cover the sources and flowof funds, and guidelines to help the new planningagencies describe the health status of their residentsand measure the impact of health services, as re-quired in the new planning legislation.
It would be impossible to do justice here to allthe ideas and compromises that have gone into thedesign of these data sets, the associated problems of
definition and classification, and he many applica-tions in planning, monitoring, and evaluating pa-tient care. Instead let me make a few general re-marks about the three data sets.
1. All three are designed for multiple audi-ences and multiple purposes. Some may argue thatthis is asking too much, but the general consensusof the many people involved in their design wasthat what we need is not more special-purpose sys-tems for categorical programs, but some mechanismfor looking at all parts of our complex health caresystem in relation to the whole.
2. A conscious effort was made in the design ofthe basic data sets to be parsimonious and practical.Many using these data sets will want to add addi-tional items; for instance, the well-known PAS hos-pital discharge system includes a number of itemsdescribing in more detail the treatment received bythe patient, while the PSRO regulations will requireadditional entries summarizing the certification andreview process. But in general, providers of serviceare already over-burdened with paper work, andwe still have a long way to go before we have anetwork of information systems covering the entire.country that can collect the bare essentials on healthservices, and before we have all learned how to usethese basic facts effectively. And there are many ofus who would argue that the true informationalcontent of most data systems is inversely related totheir volume of data.
3. All three data sets are patient or client-ori-ented, in the sense that the dependent variable orframe of reference is the individual, not the institu-tion or other care setting. For a full picture of thehealth services situation in a given geographic area,it becomes necessary to link these data sets to themanpower and facility data sets.
The advantage of the patient-oriented perspec-tive is that it encourages us to look behind the fa-cade of existing institutions and categorical pro-grams, and the current fiscal policies that influenceand sometimes distort the allocation of resources,and to consider instead the more basic and perhapsless transitory requirements for information thatderive from the needs of people instead of institu-tions.
The ambulatory care data set carries the pa-tient-oriented perspective one step forward by in-
cluding (as the first item under “individual attrib-utes” in the table) an item on reasons for the en-counter in the patient’s own words. The proposedlong-term care data set attempts to achieve some-what the same objective by including informationon the events or reasons for use of services otherthan diagnoses and by proposing some as-yet-un-tried measure of the patient’s -own perceptions andreactions to his disability. For the “reason” data inthe ambulatory care data set, the Na~ond Center
387

for Health Statistics (NCHS) has now developed aspecial classification system and w: are beginning tobuild up a picture of tie burden of illness from thelay point of view. On the one hand, we can com-pare this information with morbidity data from theHealth Interview Survey to characterize what hasoften been referred to-as the “tip of the iceberg” ofillness that comes to the attention of the medicalcare system. On the other, we can begin to betterunderstand how patient “problems”, often ill-de-fined, are translated by professionals into medicalterminology and dealt with accordingly.
4. There are several generic problems to beresolved before the information systems we set upcan fully exploit the potential of these data sets.One is unique identification of the individual, andthe associated issue of confidentiality. Especially inlong-term care, we are at a distinct disadvantagebecause of the difficulty of following individuals asthey move back and forth between physicians of-fices, nursing homes, hospitals, home care agenciesand other institutional and communitv services.Another problem area is geocoding. ZIP’ codes arewidely used because thev are convenient. However.for marketing-type studies and other functions o~planning agencies,. they are not sufficiently detailedand in many parts of the country they complicatethe process of drawing upon census data to developthe necessarv denominators.
5. The ‘table comparing the three data setsmakes it abundantly clear that there is much over-lap, as one would expect, considering how blurredthe lines are between these different modalities ofcare. The Tucson Conference considered this prob-lem at some length. For the short run, it stressedthe importance of coordinating the definitions andclassification systems used in the three data sets.Looking to &e future, it considered whether itmight not be possible to develop a single strategy
for describing the use of all health services. Accord-ing to this plan, a standard encounter form basedon the ambulatory care data set would be used toreport discrete events or contacts between patientsor clients and providers of care; a periodic assess-men t profile based on the long-term care data setwould be used to report at established intervals thestatus of individuals receiving continuing care; anda discharge abstract based on the hospital data setwould be used to summarize a completed episodeof care, whether short or long, inpatient or ambula-tory.
6. Finally, I would like to call your attention toa paradoxical situation reflected in these three datasets. For the most labor-intensive and expensivecomponent of the health care system, the short-stayhospital, our committees of experts were able to set-tle on 14 basic data elements (plus several optionalitems like total charges not shown in the attachedtable). For the relatively brief ambulatory encoun-ter, there are 16 items. For long-term care, wherethe health care manpower and qther resources arespread most thinly-despite our best efforts at theTucson Conference last May—there remain a totalof 24 different data categories, some of them, likephysical, mental, and social functioning, are quitecomplex and exceedingly difficult to measure inways suitable for statistical aggregation. In otherwords, we are asking for more routine informationfrom that sector of the health services system leastable to provide it and respond to it. It means that itwill not be easy to expand the flow of data to coverthe long-term care sector. It also reflects, I believe,some imbalance of resources in our health care sys-tem. In our current preoccupation with the acute-care hospital, we may be underestimating the com-plexity of the everyday caring and coping as well ascuring functions performed by ambulatory carephysicians and long-term care institutions.
388

COMPARISON OF THE THREE UNIFORM BASIC DATA SETSON PATIENT OR CLIENT CHARACTERISTICS
AND USE OF SERVICES
Hospital Discharge Data Set Ambtiatory Care Encounter Data Set Proposed Long-Term Care Data Set
Demographic Data.
Unique ID number Name and unique ID number Name and/orunique ID number
ZIP Code of residence Address and ZIP code Address and ZIP code or census tracta. Latest noninstitutional
domicile
b. Current domicile (if different)
Living arrangementsa. Type of domicileb. Availability of able and willing
personal “caregiver”
Date of birth Date of birth Date of birth
Sex Sex Sex
— — Current mmital status
Race — Race/ethnicity
— —
Individual Attributes
—
Principal and other diagnosesoccasioning or affecting cur-rent stay
—
—
—
—
—
—
Reason for encounter (principalproblems, complaints, symptoms inpatient’s own words)
Principal and other diagnoses and/orproblems occasioning current en-counter or requiring treatment
Findings
—
—
—
—
—
Events/reasonsfor use of servicesother than diagnoses (as determinedby responsible agency)
Principal and other diagnosesoccasioning current use of servicesor influencing current status
Physical impairments
Physical functioning/disability
Mental functioning/disability
Social functioning/disability
Performance of independent livingactivities
Distress/mood/pain/self-perception
Service axialAdti”nistmtive Elements
Hospital unique ID number Place of encounter by type (office, Principal facility/agency/providerclinic or center, OPD, ER, other) ID and/or unique number
Last principal provider ID (within12 months)
Attending physician unique Provider name, professional address,ID number and unique ID number
389
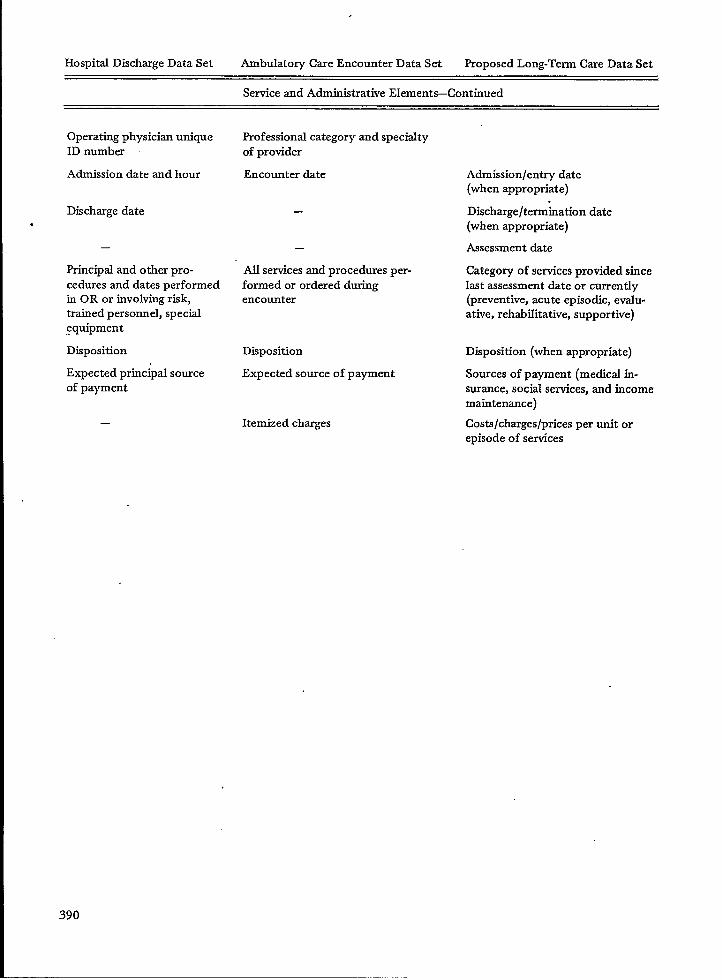
Hospital Discharge Data Set Ambulatory Care Encounter Data Set Proposed Long-Term Care Data Set
Service and Administrative Elements–Continued
Operatkg physician uniqueID number
Admission date and hour
Discharge date.
—
Principal and other pro-cedures and dates performedin OR or involving risk,trained personnel, special,equipment
Disposition
Expected principal sourceof payment
—
Professional category and specialtyof provider
Encounter date
—
—
AII services and procedures per-formed or ordered duringencounter
Disposition
Expected source of payment
Itemized charges
Admission/entry date(when appropriate)
.Discharge/termination date(when appropriate)
Assessment date
Category of services provided sincelast assessment date or currently(preventive, acute episodic, evalu-ative, rehabilitative, supportive)
Disposition (when appropriate)
Sources of payment (medical in-surance, social services, and incomemaintenance)
Costs/charges/prices per unit orepisode of services
390
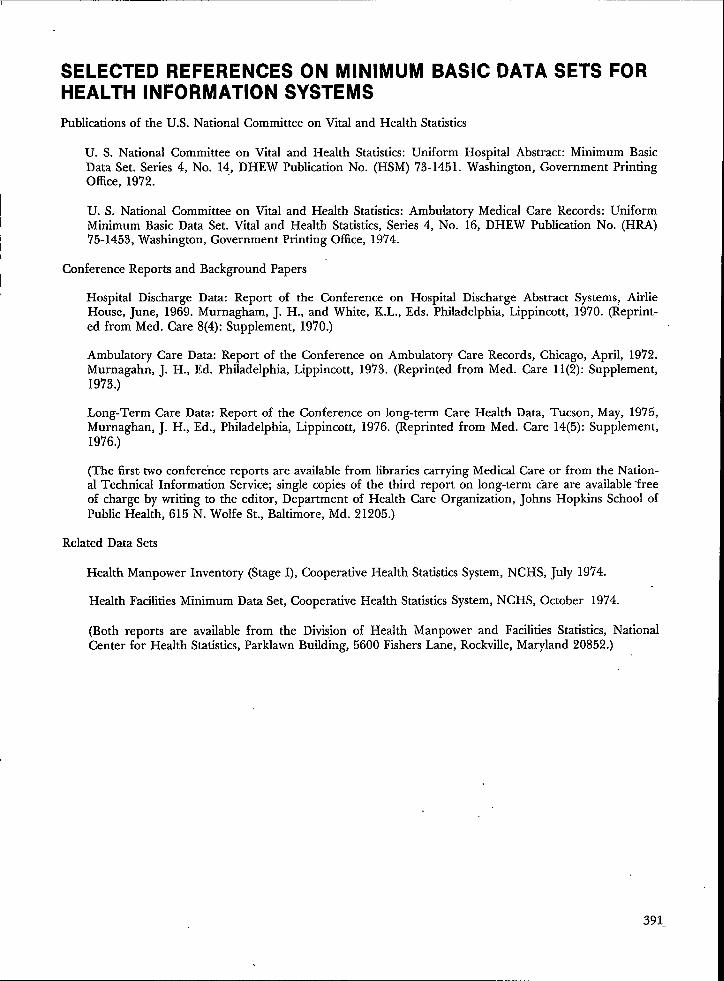
SELECTED REFERENCES ON MINIMUM BASIC DATA SETS FORHEALTH INFORMATION SYSTEMS
Publications of the U.S. National Committee on Vhal and Health Statistics
U. S. National Committee on Vital and Health Statistics: Uniform Hospital Abstract: Minimum BasicData Set. Series 4, No. 14, DHEW Publication No. (HSM) 73-1451. Washington, Government PrintingOffice, 1972.
U. S. National Committee on Vital and Health Statistics: Ambulatory Medical Care Records: UniformMinimum Basic Data Set. Vital and Health Statistics, Series 4, No. 16, DHEW Publication No. (HRA)‘75-1453, Washington, Government Printing Office, 1974.
Conference Reports and Background Papers
Hospital Discharge Data: Report of the Conference on Hospital Discharge Abstract Systems, AirlieHo~se, June, 19{9. Murnagh~m, J. H., and White, K.L., Eds. Philadelphia,-Lippincott, 1970. (Reprint-ed from Med. Care 8(4): Supplement, 1970.)
Ambulatory Care Data: Report of the Conference on Ambulatory Care Records, Chicago, April, 1972.Murnagahn, J. H., Ed. Philadelphia, Lippincott, 19’73. (Reprinted from Med. Care 11(2): Supplement,1973.)
Long-Term Care Data: Report of the Conference on long-term Care Health Data, Tucson, May, 1975,Murnaghan, J. H., Ed., Philadelphia, Lippincott, 1976. (Reprinted from Med. Care 14(5): Supplement,1976.)
(The first two conference reports are available from libraries carrying Medical Care or from the Nation-al Technical Information Service; single copies of the third report on long-term care are available ‘freeof charge by writing to the editor, Department of Health Care Organization, Johns Hopkins School ofPublic Health, 615 N. Wolfe St., Baltimore, Md. 21205.)
Related Data Sets
Health Manpower Inventory (Stage I), Cooperative Health Statistics System, NCHS, July 1974.
Health Facilities Minimum Data Set, Cooperative Health Statistics System, NCHS, October 1974.
(Both reports are available from the Division of Health Manpower and Facilities Statistics, NationalCenter for Health Statistics, Parklawn Building, 5600 Fishers Lane, Rockville, Maryland 20852.)
391

STATE AMBULATORY STATISTICS*
Richard G. Cornell, Ph.D., Chairman, Department of Biostatistics, School of Public Health,University of Michigan, Ann Arbor, Michigan
Introduction
The Michigan Ambulatory Medical Care Sur-vey (MAMCS) was inaugurated in 1973. This sur-vey is an augmentation of the National AmbulatoryMedicd Care Survey (NAMCS) which makes thesample size for Michigan adequate for separate pre-sentation of Michigan data. Its purpose is to obtaininformation on the medical care provided by office-based physicians separately for Michigan, to showhow Statedata can be obtained inexpensively andreliably through the supplementation of a nationalsurvey, and to compare the State and national re-sults in order to ascertain if separate State surveysprovide enough additional information on ambula-tory care to warrant their continuation.
The design and analysis of the MAMCS hasbeen carried out within the Department of Biosta-tistics of the University of Michigan School of Pub-lic Health. The MAMCS is a part of the MichiganCooperative Health Information System of the Na-tional Center for Health Statistics. Theodore R.Ervin, Deputy Director, and Rha B. Zemach, Ph.D.,Chief, Statistics Development, Michigan Depart-ment of Public Health, have been instrumental inconceiving the MAMCS and in encouraging its de-velopment. The close cooperation of personnel ofthe National Center for Health Statistics (NCHS)who are working on the NAMCS has also been in-strumental to the MAMCS. James E. Delozier,Chief, Ambulatory Care Statistics Branch and E.Earl Bryant, Chief, Statistical Methods Staff, wereespecially helpful in the initial planning of theMAMCS and statisticians Dwight B. Brock, Ph.D.,and Ins Shimizu, Ph.D., have provided considerableassistance in drawing the MAMCS samples. Thefield work for the MAMCS, and for the NAMCS, iscarried out by the National Opinion Research Cen-ter (NORC). Paul B. Sheatsley, the Director of itsSurvey Research Service, assisted in planning forthe MAMCS in ad@ition to directing the field workand initial data processing.
*This work was supported by a subcontract with the
Michigan Department of Publk Health pursuant to Grant
No. HSO0982-02 between the Michigan Department ofPublic Health (MDPH) and the National Center forHealth Services Research and Development, Department
of Health, Education, and Welfare (DHEW), and Contract
No. HRA-106-74-35’ between the MDPH and the National
Center for Health Statistics, DHEW.
DescriptionAmbulatorySurvey
of the MichiganMedical Care
The data for the Michigan Ambulatory MedicalCare Survey (MAMCS) consists of data that wouldhave been gathered in Michigan as part of the Na-tional Ambulatory Medical Care Survey (NAMCS)even without a separate State survey plus data onother physician’s patient visits added to both theNAMCS and the MAMCS to make the MAMCSlarge enough for separate data presentation. Thebackground of the NAMCS is described in [1].Survey materials, field work procedures and codemanuals developed and tested by the NCHS andNORC for use in the NAMCS have contributed tothe MAMCS portion of the NAMCS as well, at nocost to the State. This preparation for the MAMCShas been thorough, yet less costly than a State sur-vey developed separately from the NAMCS wouldhave been. Moreover, the State incurred a cost forfield work only for the Michigan supplement to theNAMCS and not for data on Michigan physi-cians which would have been in the NAMCS any-way. This alone represented a 29 percent savings inthe cost of field work for the 1973 sample,
The sampling plan for the MAMCS consists ofthe selection of primary sampling units (PSU’S) by acombined National-State procedure. This is fol-lowed by the selection of physicians within PSU’Sinsuch a way that the overall probability of selection isthe same for each physician. This means that theprocedure is self-weighting with respect to physi-cians, which simplifies the analysis, The sample de-sign for the MAMCS is described more fully in thenext section. Additional detail and a discussion ofmethods of estimation and the assessment of sam-pling variability is given in [2].
The data gathering and processing proceduresare the same for both the NAMCS and theMAMCS. The combined Michigan sample for bothsurveys has been selected by the NCHS from lists ofmembers of the American Medical Association andthe American Osteopathic Association. The samplewas then sent to the NORC for field work, Theinduction and data gathering procedures followedby the NORC have been the same for all physiciansin the NAMCS, including those in the Michigan
392

augmentation of the NAMCS. This is another ad-vantage for a State survey which is a supplementa-tion of a national survey, namely, that the resultantdata for the State is directly comparable to that forthe Nation as a whole.
The basic sampling units for tie continuingNAMCS are physician-patient encounters or visitsin the offices of physicians who are classified by theAmerican Medical Association (AMA) or the Ameri-can Osteopathic Association (AOA) under “ofFice-based, patient care.” Not included are visits madeby telephone, those made outside of the physician’soffice, such as in the patient’s home, those made inhospital and institutional settings, and those madewith physicians not classified by the AMA or AOAas described above.
The sample physicians were randomly assigneda seven-day period during which they made a list ofall patient visits to their offices. Data was obtainedon systematic samples from these lists. Speciallytrained interviewers visited the sample physiciansand their staffs prior to their designated weeks inorder to provide survey materials and instruction inthe methods and definitions to be used.
In the NAMCS, and its MAMCS component aswell, the patients perceived need, expressed as thepatient’s reason for seeking medical care, is record-ed as well as the physician’s perception of the seri-ousness of the problem and the physician’s diagno-sis, treatment, and disposition decisions. Otheritems of information recorded for each patient visitare the date and duration of the visi~ the patient’sbirthdate, sex and color; and whether the patienthas been seen before for the same problem by thesame physician.
A summary of 1973 data from the NAMCS isgiven in [3] and from the MAMCS in [4]. Somedata from these two reports are compared later inthis report. Data analysis is underway for the 1974MA~CS. The 1973 survey covers the period fromMay 19’73 through April 19’74 while the 1974 sur-vey covers the remainder of 1974. These data willbe combined to obtain summaries not only for theState of Michigan as a whole but also for the De-troit Standard Metropolitan Statistical Area (SMSA).Data collection for the MAMCS continued through1975. Incorporation of data from 1975 with thatfrom 1973 and 1974 will enable time trends to beinvestigated and more detailed comparisons withnational data to be made than those presented inthis report which are based on the 1973 data alone.These more detailed comparisons will play a vitalrole in the evaluation of the need for the continua-tion of the MAMCS and for other similar State sur-veys.
A total of 263 physician contacts were soughtduring the 1973 MAMCS which led to the collec-tion of information on patient visits during a one-week period for 130 physicians. Of the remaining
135 physicians, 64 were out-of-scope during theweek selected and 71 ,did not participate fully.Thus, for the 201 physicians in scope, the comple-tion rate was 65 percent.
The actual number of patient visits for the1973 MAMCS was 11,145 but forms were complet-ed for only 4,110 visits. For some physicians, formswere filled out on all patient visits during a one-week period, for others on a fraction of the visits.If forms for a physician were filled out on half ofhis patient visits, the frequencies of his visits weredoubled in the calculation of tabular entries. Thusin the tables presented later in this report, the per-centages are estimates which are based on a knowntotal of 11,145 visits.
The sample size for the MA.MCS for 1973 wasminimal. However, relative standard errors of tenpercent or less have been achieved for the mostpart on estimates based on ten percent or more ofthe total number of patient visits despite a lowerthan expected rate of physician participation. Thusthe precision for tabulations over limited numbersof categories is adequate. Data for additional yearswill be incorporated into the analysis in order toobtain better precision for finer categories andsmall percentages.
Sample Design
The sampling plan for both the NAMCS andthe MAMCS consists of first selecting a probabilitysample of primary units (PSU’S) which are eitherstandard metropolitan statistical areas (SMSA’S) orcounties, and then drawing a systematic sample ofphysicians from the sample PSU’S. In both surveysthe PSU’S are selected with a modified probability-proportional-to-size procedure with the 1970 popu-lation used as a measure of size. Then physiciansare selected with probability inversely proportionalto the probability of selection of the corresponding’PSU, so that each physician has the same overallprobab~lty of selection. This probability was f =0.03072 for each Michigan physician in the 1973MAMCS and was larger than for physicians in oth-er States because of the augmentation of theNAMCS by the MAMCS. It was calculated by tak-ing the target sample size of 250 and dividing bythe number of physicians in office-based practice,which was 8137. Similarly, the probability of selec-tion for each PSU in Michigan” was higher in theMAMCS than it would have been if only theNAMCS were carried out with the exception of theDetroit SMSA which enters both samples with cer-tainty, that is, probability 1. In general, let p,i de-note the probability that the ith PSU in Michiganwould be” in the national sample, that is, would beincluded in the NAMCS without the MAMCS aug-mentation. Then the probability that the ith PSU
393

will be in the MAMCS, whether as a result of thenational or the subsequent State selection, is kpi for‘some k > 1 or is 1. The proportiontilty constant kis specified to make efficient use of the nationalsample and to obtain a total State sample size of themagnitude desired.
From the AMA and the AOA lists it was seenthat slightly over half the physicians in office-basedprivate practice in Michigan are in the DetroitSMSA and a majority of the others are in PSU’Swith large urban centers. Therefore, two strata ofPSU’S were formed. The first, labeled Stratum 1,contained the larger PSU’S, each of which was givena probability of 1 of being included in the MAMCS.This is. called the self-representation stratum. Thesampling fraction for physicians within - each ofthese self-representation PSU’S is f. In the 1973MAMCS, all PSU’S with more than c/f physicianswere included in Stratum 1 with c set equal to 8.The rationale for the c/f figure is that these PSU’Swould have been represented with certainty if a sys-tematic sample of physicians with sampling fractionf and cluster size c had been taken. This is thesampling method that would have been used if thesurvey had been designed just for Michigan withoutsupplementation of the NAMCS. The division ofthe State into these two strata is not only appropri-ate for Michigan, but also for the many other Stateswith large urban concentrations of population. ForStates for which a self-representation stratum is notappropriate, all the probabilities of selection wouldbe calctiated like those for Stratum 2 in Michigan.For the 1973. Michigan survey, Stratum 1 containedthe Detroit, Flint, Lansing, Grand Rapids, andWashtenaw SMSA’S.
For Stratum 2, there are two opportunities forselection” for -each PSU. The probability of beingchosen during the national selection procedure is piand is known for each PSU. In order to achieve anoverall probability of selection of Kpi, the probabili-ty ~ of selection during the State selection for anyPSU not selected during the national selection mustbe
qi = (k–l) pi/(~-pi). (1)
For the ifi PSU in Stratum 2, the sampling fractionfor physicians if that PSU is selected for the sampleis
fi = flkpi (2)
in order to have the overall probability of selectionfor physicians the same and equal to f, as in Stra-tum 1. Moreover, the number of PSU’S selected forthe sample from Stratum 2 during the State selec-tion is
t = R/ (k.-l)
394
where R = ~pi/(l-fi ) and where the summation ig
over all psu’s in
Stratum 2. Use of these formulas requires that kpibe > f. In order for this to hold for Michigan,some small neighboring counties were combined inthe formation of PSU’S. The derivations and detailsof the implementation of these formulas are givenin [2].
For 1973 it was found that taking t = 3 led todculated sample sizes for the MAMCS which near-ly duplicated th?se which would have been takenanyway for the NAMCS. Therefore, three addition-al PSU’S were drawn for the MAMCS without re-placement with probabilities proportional to pi/( l-
pi) in accord with equation (l). Monroe, Shiawasseefand Kalamazoo counties were selected, giving a to-tal of 11 PSU’S. The total sample size for thesePSU’S was 263.
After selection of these PSU’S, within each PSUall eligible physicians were arranged by four broadspecialty groups: general and family practice, medi-d specialties, surgical specialties, and “other” spe-cialties. Within each specialty group the file wasarranged by specific individual specialty, Then,within each PSU, a systematic random sample ofphysicians was selected.
The final selection of patient visits within theannual practices of sample physicians was done intwo steps. First, the total physicim sample was di-vided into 52 random subsamples of approximatelyequal size, and each subsample was randomly as-signed to one of the 52 weeks in the survey year.Second, a systematic randon sample of visits wasselected by the physicians during the assigned week,The sampling rate varied for this final step from a100 percent sample for very small practices to a 20percent sample for very large practices as deter-mined in a presurvey interview.
Highlights of the 1973 Surveys
A few of the results of the 1973 MAMCS from[4] are given in this section and compared with cor-responding results of the NAMCS as given in [3].Data on additional categories within the classifica-tions mentioned here and for cross-classificationsare presented in-both [4] and [3].
An estimated 28.9 million visits were made tooffice-based “patient care” physicians in Michiganduring May 1973-April 1974, resulting in an aver-age of 3.2 visits per person per year. The Michiganvisitation average is approximately the same as thenational average of 3.1 visits per person per yearfor the coterminous United States for which the es-timated total for the year is 644.9 million visits.

In Michigan, 52.6 percent of all visits weremade to general and family practitioners, 18.5 per-cent to medical specialists and 25.8 percent to surgi-cal specialists. Nationally, the corresponding per-centages were 40.4, 26.3- and 28.5, respectively.Visits by white patients accounted for 91.4 percent
‘of the total in Michigan and 89.3 in the UnitedStates. Visits by females comprised 61.5 and 60.7percent of the total in Michigan and United States,respectively.
Four classes of diagnosis accounted for approx-imately half of all visits: special conditions andexaminations without sickness, 20.3 percent; diseas-es of the respiratory system, 15.6 percent; diseasesof the circulatory system, 9.6 percent; accidents,poisoning and violence, 7.2 percent. The corre-sponding national percentages were 1‘7.1, 15.1, 9.2and 7.4, respectively. The distribution in Michiganclosely parallels the national distribution by diag-nostic class,
Among individual diagnoses (3 digit ICDAcode) the five most frequent in Michigan were med-ical and special examinations, 7.1 percent; medicaland surgical aftercare, 5.8 percent; acute upperrespiratory infection and prenatal care, each 5.0percent; and essential benign hypertension, 4.3percent. These diagnoses accounted for about twen-ty-five percent of all visits in Michigan. The samefive diagnoses were most common nationally andthe respective percentages of 6.1, 5.0, 3.3, 5.0 and3.5 were similar to those for Michigan.
Reasons for seeking care were described as a“followup” or “progress visit;’ without being ex-pressed in terms of a symptom or problem, for 14.2percent of all Michigan visits and 11.7 percent of allnational visits. Among the visits for nonsympto-matic reasons in Michigan, pregnancy examinationaccounted for 5.7 percent, physical examination for3.9 percent, gynecological examination for 2.7 per-cent and visit “for medication for 2.3 percent. Thenational percentages were 4.0 for the first two and2.0 for the last two. For patients with symptomaticreasons in Michigan, pain and other problems ofthe lower extremities and colds each accounted for3.5 percent; abdominal pain, 3.3 percent; backpain, 2.9 percent; cough and sore throat, each 2.8percent; and pain and other problems of the upperextremities, 2.5 pereent. The corresponding nation-al percentages were 4.0, 2.1, 2.5, 2.9, 2.8, 3.2 and2.9, respectively. Thus the Michigan and nationaldistributions of patient visits with respect to themost common reasons for seeking care are similar.
For about half of the patients, the physicianconsidered the problem not to be serious (48.6 per-cent for Michigan, 50.5 nationally). About 33 per-cent were slightly serious, and 18.6 percent wereeither serious or very serious. in Michigan.Nationally these two percentages19.2. For Michigan, 62.5 percent
were 30.4 andof the patients
were told to return at a specified tim’e, 20.8 percentwere told to return if needed and 11.7 percent hadno followup planned. Again, the corresponding na-tional percentages (61 .2, 21.4 and 12.7, respective-ly) were very similar.
For Michigan, the duration of visit in minuteswas recorded for 94.6 percent of the visits. Ofthese, the percentages recorded as lasting under 6minutes, 6-10 minutes, 11-15 minutes and 16 min-utes or more were 26.3, 34.4, 23.5 and 15.8, respec-tively, as compared to 17.0, 32.3, 25.7 and 25.0 na-tionally. In Michigan 86.8 of the patients had beenseen by the physician before, 60.5 for the sameproblem. Nationally these percentages were 84.4and 61.5.
Michigan physicians ordered or provided treat-ments, tests, or medication for 96.9 percent of theirpatients. Drug therapy was ordered or provided for51.6 percent, laboratory tests or procedures for27.3 percent, and injections and immunizations for26.1 percent. Office surgery was performed during7.6 percent of the visits and X-rays were ordered orprovided in 7.0 percent. The corresponding nation-al percentages were 94.7, 49.4, 19.6, 18.6, 8.9 and7.1, respectively. These data include multiple treat-ment or service at an office visit.
From this brief summary it is evident that simi-lar results ‘were obtained for Michigan as for theNation from the MAMCS and the NAMCS for1973. In fact, if this were not generally so, the va-lidity of the smaller State survey would be ques-tioned. This does not necessarily mean that there isnot a need for a separate State survey. This deci-sion awaits more detailed comparisons of State andnational results over a longer time period, carefulconsideration of decisions to be based on the dataat the State level and analyses of differences be-tween major subdivisions of the State which wouldnot be predictable from national statistics.
Physician Utilization Patterns
In addition to summaries of data on patientvisits to office-based physicians such as those pre-sented in the last section, it is of interest in anyState ambulatory care survey to compare the pro-portion of visits by patients from various demo-graphic subdivisions of the population with corre-sponding population proportions to gain informa-tion on physician utilization patterns.
Detqiled information from the 1973 MAMCSon the color, sex and age distributions of the pa-tients who made these visits is given in-Tables 1, 3and 5. It can be seem from Table 1 that 61.5 per-cent of the visits were made by females. However,the percent of the population which was female in1975 was 50.9 [5, ‘index of physician
Table 4.3]. The correspondingutilization for females, which is
395

calculated as the ratio of the percent of the visits tophysicians in office-based practice by females to thepercent of the total population of Michigan com-posed of females, is 61.5/50.9 = 1.21. Tables 2, 4and 6 give physician utilization indices by age, colorand sex. All indices, whether for ane or two-wayclassifications, are calculated from percentages ofthe total number of patient visits and the total po-pulation. Color specific indices are based on 1970instead of 19’73population percentages.
The physician utilization indices in Tables 2, 4and 6 are higher for females thzn for males, espe-cially in the 15-24 and 25-44 age categories. Theyare also higher for whites than for nonwhites be-cause of greater ufization of office-based physi-cians for whites under 25 years of age. Utilization isgreatest for those over 64 for both white and non-whites and for both males and females.
TABLE 1.PERCENT DISTRIBUTION
OF PATlENT VISITS TOOFFICE-BASED PHYSICIANS
BY PATlENT SEX AND COLOR:MICHIGAN,
MAY 1973-APRIL 1974
SexColor Both sexes Male Female
I ,
All patients 100.0 38.5 61.5White 91.4 34.9 56.5
All other 8.6 3.6 5.0
References
1.
2.
3.
4.
National Center for Health Statistics: National Ambula-tory Medical Care Survey: Background and Methodolo-gy, United States. Vital and Health Statistics. Series 2,Number 61. DHEW Publication Number (HRA) 74-1335. Health Resources Administration. Washington.U.S. Government Printing Office, March 1974.Cornell, R.G. and Tomberlin, T.J.: The Sampling Planfor the Michigan Ambulatory Medical Care Survey.Michigan Department of Public Health. November1974.National Center for Health Statistics: The NationalAmbulatory Medical Care Survey: 1973 Summary, Un-ited States, May 1973-April 1974. Data fro-m the Na-tional Health Survey. Series 13, Number 21. DHEWPublication Number (HRA) 76-1772. Health ResourcesAdministration. Washington. U.S. Government PrintingOffice, October 1975.Cornell, R.G., Ozgoren, F.H. and Rutherford, J.A.:The 1973 Michigan Ambulatory Medical Care Survey-Michigan Department of Public Health. May 1976.
TABLE 2.INDEX OF PHYSICIAN
UTILIZATION BY PATlENTSEX AND COLOR: MICHIGAN,
MAY 1973-APRIL 1974
! SexColor Both sexes Male I Female
All patients 1.00 0.79 I 1.21White 1.04 0.81 1.26
AU others I 0.75 II 0.63 I 0.82
TABLE 3. PERCENT DISTRIBUTION OF PATlENT VISITS TOOFFICE-BASED PHYSICIANS BY PATlENT AGE AND SEX:
MICHIGAN, MAY 1973-APRIL 1974
Age in years
Sex AII ages Under 15 15-24 25-44 45-64 65 and over
All patients 100.0 19.9 18.0 26.2 22.7 13.2Male 38.5 9.9 5.6 8.7 9.1 5.2
Female 61.5 10.0 12.4 17.5 13.6 800
396

TABLE 4. INDEX OF PHYSICIAN UTILIZATION BYAGE AND SEX: MICHIGAN, MAY 1973-APRIL
PATlENT1974
II Age in vearsL “
Sex All ages Under 15 15-24 25-44 45-64 65 and over
All patients 1.00 0.65 1.01 1.11 1.15 1.55Mde 0.79 0.64 0.65 0.75 0.94 1.43 ‘Female 1.21 0.67 1.36 1.46 1.34 1.67
TABLE 5. PERCENT DISTRIBUTION OF PATlENT VISITS TOOFFICE-BASED PHYSICIANS BY PATlENT AGE AND COLOR:
MICHIGAN, MAY 1973-APRIL 1974
Age in yearsColor All ages Under 15 15-24 25-44 45-64 65 and over
All patients 100.0 19.9 18.0 26.2 22.7 13.2White 91.4 19.3 16.7 22.5 20.4 12.5All otiers 8.6 O*7* 1.3 3.6 2.4 o.6*
*Relative standarderror greater than 20 percent.
TABLE 6. INDEX OF PHYSICIAN UTILIZATION BY PATlENTAGE AND COLOR; MICHIGAN, MAY 1973-APRIL 1974
Age in yearsColor All ages Under 15 15-24 25-44 45-64 65 and over
All patients 1.00 0.65 1.01 1.11 1.15 1.55White 1.04 0.73 1.08 1.08 1.14 1.62.All others 0.73 0.17* 0.58 1.32 1.19 1.98*
*Relative standard error greater than 20 percent.
397

NURSING HOME STATISTICS: THE DEVELOPMENT AND FUTUREDIRECTION OF THE NATIONAL SURVEY SYSTEM OF THENATIONAL CENTER FOR HEALTH STATISTICS
Mrs. Joan F. Van Nostrand, Chief, Long-Term Care Statistics Branch, Division of HealthResources Utilization Statistics, National Center for Health Statistics, Rockville, Maryland
Introduction
Since its inception in 1960, the National Centerfor Health Statistics (NCHS) has been responsiblefor collecting, analyzing and disseminating data onthe health of the Nation and the utilization of itshealth resources. These data are general purpose,national statisticsfor planning, legislation, adminis-tration, program evaluation and research purposes.The emphasis by the NCHS on general purpose,national statistics is in contrast to those Federal,State, local and private agencies that collect andproduce statistics on categorical segments of thepopulation and limited sectors of the health caredelivery system.
In addition to producing statistics on vitalevents, health status and the characteristics ofhealth,resources, the NCHS has developed a groupof health information systems which provide statis-tics on the utilization of health resources. One ofthese is the National Nursing Home Survey System(NNHSS). This discussion will trace the develop-ment of the NNHSS and describe its future interms of short, mid and long-range directions. Ahistorical perspective of the growth of nursinghomes in the United States is an appropriate intro-ducbn to the subject.
Historical Perspective
The growth of nursing homes in the UnitedStates parallels the enactment of major pieces ofhealth legislation. Prior to 1930, there- were fewnursing homes. Instead, institutional health carewas provided mainly in hospitals. In 1935, Congresspassed the Social Security Act which, among otherthings, provided funds to the needy aged for healthcare. The availability of these funds for nursinghome care was, of course, the initial impetus to thegrowth of the industry.
Another rapid period of growth occurred inthe kite 1960’s after Congress passed Titles XVIIIand XIX “to the Social Security Act—Medicare andMedicaid. Among other benefits, the legislationprovided funds for nursing home care for the aged(Medicare) and for the medically indigent (Medi-caid).
398
This legislation led to increased demand fornursing ho~e care which, in turn, led to the rapidgrowth of the industry. This is reflected in the in-crease in the number of beds. In 1939, according toa survey by the Bureau of the Census, there were25,000 nursing home beds.1 In 1964, there were ahalf a million beds. By 1973-74, there were nearly1.2 million beds.z Thus, in the 35-year span be-tween 1939 and 197’4, the number of beds in-creased by 48 times, or an average of 137 percent ayear.
In addition to the effects of the Social SecurityAct, there are several other factors which contribut-ed to the growth of nursing homes:
1.
2.
3.
4.
5.
The growth of the elderly population both interms of sheer numbers and of its proportion tothe U.S. population. Between 1930 and 1975,persons 65 years and over increased from 6.7million to 22.4 million. They also comprised alarger and larger proportion of the U.S. popula-tion — from 5.4 percent in 1930 to 10.5 percentin 19’75. Projections indicate that by 1980, theproportion will be 11 percent; and by the year2020, it will be 14.6 percent. In 55 years, in theyear 2030, the elderly will comprise 17.0 percentof the populationsChange in illness patterns due to medical ad-vances.Demand for less intensive care than that provid-ed in hospitals.Change in family size and living arrangements.There is a growing trend away from the largeextended family with persons available to prov-ide long-term care for relatives to the smallernuclear family with both husband and wifeworking.Increases in the amount spent on health careand in the proportion financed by the Federalgovernment. In the past 25 years, the UnitedStates has spent an increasingly larger percen-tage of the Gross National Product (GNP) onhealth care. In FY 1950, 4.6 percent of the GNPwas spent on health care. In FY 1975, this roseto 8.3 percent which amounted to $118.5 billion.In the 20-year period from FY 1940 to FY 1960,the proportion of health expenditures spent onnursing home care rose slightly from 0.7 percentto 1.9 percent. In FY 1970, it increased to 5.5

percent; and in FY 1975, it was 7.6 percent ofthe total health expenditures. Along with thisincrease came a shift in the major source offunding. In 1935, when the Social Security Actwas passed, 20 percent of nursing home costswere paid by public funds. In FY 1975, in con-trast, public funds paid for 58 percent of theCosts.d
This brief history of nursing home growthunderscores the facts that nursing homes are a rap-idly growing sector of the health care delivery sys-tem and that the Federal role in their operationand financing is increasing.
Development of the NationalSurvey System
In conjunction with the growth of the industrycame a growing need for data about nursing homesand their residents. The NCHS met this need byconducting three ad hoc surveys in 1963, 1964 and1969. These surveys collected data about the char-acteristics of the “nursing homes, their residents,and staff by personally interviewing the administra-tor and selected staff members. Witi the advent ofMedicare and Medicaid and the resultant increasein utilization and costs in the late 1960s, came theincreasing concern of providing quality nursinghome care at a reasonable cost. To address Wlsconcern, those who set standards for, plan, provideand evaluate nursing home care needed compre-hensive national stat~tics on a continuing basis: Inorder to analyze trends, they needed da~a from acontinuing statistical system that applied the sameprocedures and definitions each time data were col-lected.
To meet these needs, the NCHS began in 1972to develop the National Nursing Home Surveys Sys-tem (NNHSS). To permit comparison to data fromits ad hoc survevs of the 1960s, the Questionnaires, A
and procedures used in the previous surveys werethe nucleus of the NNHSS. In developing and re-fining the questionnaires for the Survey System, theNCHS consulted with a group of 50 experts in thevarious fields that comprise the diverse area oflong-term care. This advisory group, with a mem-bership from both inside and outside the Federalgovernment, examined the survey system in termsof its content, collection procedures, analytical plansand ability to fulfill diverse data needs.
As its name implies, the NNHSS is a continu-ing series of national sample surveys of nursinghomes, their residents and staff. The surveys, vol-’untary in nature, are conducted every 2-3 yearswith the interval depending on whether extensive
pretesting is required due to the addition of ques-tions in neti subject areas or to major changes inmethodology and procedures.
“1:
2.
3.
4.
5.
In
The major purposes of the NNHSS are: ‘To collect data on characteristics of the nursinghome, its services, residents and staff.To collect data on the cost incurred by the facili-ty for providing care by major components suchas labor, fixed, operating, and miscellaneouscosts.To collect data on. Medicare and Medicaid certi-fication (such as number of certified beds, theirutilization, residents receiving program benefits,their health and their charges) so that all datacan be presented and analyzed according to cer-tification status.To provide indicators which can be used to mea-.sure a home’s capability to provide quality care.To. interrelate these data to reveal the relation-ships that exist between utilization, services of-fered, staffing patterns, the health status of theresidents, services received, charges for care andthe cost of providing care.
developing this survey system, a maior emphasiswas the ~oll~ction and ~n~ysis of cos~ data.- Suchdata were generally not available for all nursinghomes in the Nation. An extensive literature searchconducted in 1972 on previous cost studies of nurs-ing homes documents the deficiencies of the availa-ble data.s Generally, most cost studies had limitedusefulness because they were based on one-timestudies, included only a particular subgroup of fa-cilities, or represented only limited geographicalareas. Few studies examined the relationship of costto facility and resident characteristics — a topic ofincreasing interest in the area of nursing homecare.
At its inception, the data collection system in-cluded those nursing homes which provided somelevel of nursing care, regardless of whether or notthey were participating in the Medicare or Medicaidprograms. Homes in the universe included thosewhich were operated under proprietary, nonprofitand government auspices. The universe includedhomes which were “free-standing” establishmentsand those which were units of a larger institution(usually a hospital or retirement center).
In collecting data on facility, cost, staff and resi-dent characteristics, the survey system utilized fourquestionnaires, each with a different respondent.The data collection procedures are a combinationof personal interviews and self-enumerated ques-tionnaires. The following list presenis the dataitems included in each questionnaire in the 1973-74survey.
399229-121 0-77-26

Figure l—DATA ITEMS COLLECTED IN THE 1973-74 NATIONALNURSING HOME SURVEY BY QUESTIONNAIRE
Facility Questionnm”reBeds: Total, Certified by Medicare or MedicaidOwnershipAdmission PoliciesAdmissions, Discharges, Days of CareMedical, Nursing and Therapeutic Services OfferedServices Provided to NonresidentsWaiting ListSkill of Charge Nurse for each ShiftResidents, Employees, Attending Physicians
Expense QuestionnaireTotal ExpensesPayroll Expenses
Nursing StaffAll Other Staff
Fixed Expenses (equipment, rent, licenses, interest, depreciation, taxes, insurance, amortization)Operating Expenses
Food and DrugOther (supplies, equipment, laundry, utilities, maintenance)
,,
Miscellaneous Expenses
Resident QuestionnaireDemographic Characteristics (age, sex, ethnic background, marital status)Admission Data (date of admission, residence prior to admission, primary reason for admission)Health Status (chronic conditions; impairments in sight, speech and hearing; primary diagnoses, special
aids)Functional Status (hygiene activities, dressing, bathing, eating, mobility, continence)Behavior ProblemsServices Received (Physician visits; medical, nursing and therapeutic services)MedicationsSocial Activities (recreation and leisure activities, visitors, overnight leave)Charges for Care (basic and total charges)Sources of Payment (primary source and all sources)
Staff Questionnaire
OccupationDemographic Characteristics (age, see, ethnic background)Previous Work ExperienceHours WorkedSalary and Other BenefitsServices PerformedEducation and Specialized TrainingAttitudes Toward Providing Heal’th Care to the Aged
400

The facility questionnaire includes questions on ba-sic characteristics (numbers of beds, ownership,admission policy), certification, services provided,ufllzation measures, skill of charge nurse. Theexpense questionnaire includes questions on thefacility’s costs by subdivisions of major componentsof labor, fixed, operating and miscellaneous expen-ses. The resident questionnaire includes questionsabout the resident’s demographic characteirstics,health and functional status, services received, socialactivities, charge for care and source of payment.The staff questionnaire includes questions on demo-graphic characteristics, - training, previous experi-ence, salary and duties performed.
The following table presents a summary of thedata collection procedures for each questionnaire.
Questionnaire
Facility
Expense
Resident
Staff
Respondent
Administrator
Facility’saccountant
Member of nursingstaff familiar withcare provided tothe resident/resi-dent’s medicalrecords (10 sampledresidents per facility
Sampled staff mem-ber (14 per facility)
Interviewsituation
Personalinterview
Self-enumeratedquestionnaire
Personalinterview
Self-enumerated
I questionnaire
I The initial survey in the NNHSS was conduct-,ed from August 1973-April 1974. The sample in-cluded a nationally representative group of about2,100 nursing homes providing some level of care.Within these homes a sample of 25,000 staff and20,000 current residents were chosen. When thehomes which were out of business, out of scope, andrefusals are excluded, the average samples included14 staff members and 10 current residents per facil-ity. Response rates differed for each type of ques-tionnaire. It was higher for questionnaires adminis-tered in a personal interview, such as the 97 per-cent response rate to the Facility Questionnaire andthe 98 percent response for the Resident Question-naire. Rates were somewhat lower for those ques-tionnaires which were self enumerated; the rate forthe Expense Questionnaire was 88 percent and forthe Staff Questionnaire 82 percent.
Several reports presenting data from the 1973-74 survey have been released. The first presentedprovisional data on facility and staff characteristics
at the National level.6 The second was a package ofdetailed tables presenting final estimates on facility,staff and resident characteristics. The third is a ba-sic analysis of operating and financial characteris-tics.T Reports on utilization, on demographic andsocial characteristics of residents, and on residenthealth status are completed and awaiting publica-tion. Reports on resident charges, medical servicesreceived, and facility and staff characteristics are inprogress as is an indepth analysis of costs as relatedto various facility and resident characteristics.
Future Direction .
In forecasting the future of the NNHSS, bothin terms of short and long range directions, thereare several influences which will have major impact:
●
●
●
Development of the second survey of theNNHSS in terms of additions and revisions tomeet emerging data needs.Development of related data sets by the Office ofLong-Term Care (formerly the Office of NursingHome Affairs) and the Professional StandardsReview Organization.Development of the long-term care componentin th~ Cooperative H~alth Statistics System(CHSS).
Plans for the second survey in the NNHSS in-dicate the future for nursing home statistics interms of short-range direction. The second surveyis scheduled for the spring of 1977. Although it willutilize the questionnaires and procedures developedin the initial survey, it has been ex~anded to meetthe emerging data’ “needs for statis~cs on all long-term care institutions, for State estimates and forstatistics for National Health Insurance. To meetthe need for greater coverage of long-term care in-stitutions, the scope of the survey system is beingexpanded to include long-term care hospitals (i.e.,tuberculosis, chronic disease and geriatric hospitals)and those nursing facilities which pi-ovide personalor domiciliary care, To meet the need for State esti-mates, the size of the sample will be increased toprovide States estimates for. the 15-20 States havingthe largest proportions of facilities and residents.These Sta~es account for 67-78 percent of all nurs-ing homes and residents in the Nation. The interestin National Health Insurance and in determiningthe utilization and cost of various benefit packageshas generated a need for data on discharged resi-dents, especially for completed length of stay(LOS). Available estimates on LOS are based ondata about current residents and are actually ameasure of stay from admission to the date of thesurvey. Hence, such estimates do not give a totalpicture of the completed episode of care as would
401
LOS data collected on discharged residents. Dataare also needed on disposition at discharge (alive vs.dead), living arrangements after discharge, healthand functional status, cost of care and paymentsources. These data will be used to analvz; differ-.ences between discharged and current residentsand estimate the utilization of nursing home care
“
under various National Health Insurance benefitpackages. This will be the first time that data ondischarged residents will be published by theNCHS.
As was noted previously, the second survey inthe NNHSS is scheduled for spring of 1977. Be-cause collection of data on discharged residents is acompletely new area in terms of questionnaire de-sign and methodological procedures, both a pilotstudy and a pretest were required. The pilot studywas conducted in the fall of 1975, the question-naires and procedures were redesigned, and thepretest was completed in June 1976. .
In terms of mid-range direction of theNNHSS, the NCHS has also begun research tomeasure longitudinal changes in health status ofresidents and in the health services provided tothem. This research on longitudinal changes cons-ists of collecting data on demographic characteris-tics, health status and services received by a sampleof residents in an initial interview and returningseveral months later to collect data about the sameresidents (regardless of whether they were dis-charged) to determine the changes that took placeduring the interval. This type of longitudinal studywill produce valuable information and insights intothe progression of chronic disease and disablingconditions as well as the manner in which care ismodified due to changes in health status. Thesedata can be linked to changes in payment sourcesand charges for care. Preliminary ‘work has begunon devising questionnaires and collection proce-dures for such a longitudinal study. Due to thecomplexity of the study and its need for fairly largeamounts of dollar and manpower resources, it willprobably be several years before it will be complete-ly tested and can be launched on a national scale.
The development and promulgation of specialpurpose data sets by the Office of Long Term Care(OLTC) and the Professional Standards ReviewOrganization (PSRO) will have a long-range impacton the future of the NNHSS. The data set current-ly under development by the OLTC concen~~at?s.on patient assessment as opposed to institutionalstandards. Its development is an outgrowth of find-ings from their 1974 LTC Facility ImprovementCampaign, which focused on skilled nursing facili-ties. A major finding was that the survey and certi-fication process focuses on the institutional frame-work rather than on the patient. One direct way ofimproving patient care is to obtain and refine a
402
mechani;m by which an individual patient’s out-comes can be measured systematically at regularlyscheduled intervals by a patient assessment instru-ment or, in their terms, a patient appraisal and careevaluation or PACE.
Dr. Paul Densen of the Harvard Center forCommunity Health and Medical Care is developingthe PACE by incorporating selected items from ex-isting patient assessment instruments according tospecific criteria. In the fall of 1976, the OLTCplans to introduce PACE on a demonstration basisin about 200 Medicare and Medicaid certified facili-ties which volunteer for the demonstration, By util-izing the PACE, the OLTC plans to test and refinethe process by which patient care outcomes can bemeasured systematically. Eventually, it is hoped thatPACE will be used in the Medicare and Medicaidcertification process in contrast to the current em-phasis on institutional standards.
Since 77 percent of all nursing homes are cur-rently certified for Medicare or Medicaid, the pro-jected use of the PACE in the certification processwill produce detailed data on health status for amajority of nursing home residents. Certainly, theitems, definitions and data collection procedures of “PACE will directly influence other nursing homedata collection systems in use. Similarly, the long-term care data set which will be developed for useby the PSROS, will also have a direct impact on theNNHSS. Since PSROS are the topic of another dis-cussion in this session, this discussion will not gointo the subject in any detail beyond describing thestatus of the LTC component. Although no “offi-cial” data set exists, 10 demonstration projects of 2.year duration will be selected by the end of thissummer. These projects will develop and test LTCdata sets. While these demonstrations are in pro-gress, a national advisory group will be convenedto address the development of the PSRO long-termcare data set.
The influence which will have the greatestlong-range impact on the future direction of theNNHSS is the Cooperative Health Statistics System(CHSS). Much has been written concerning thepurpose and development of the CHSS8 and it hasbeen a major topic of discussion at this Conference,Because the general CHSS concept of the minimumbasic data set (MBDS) and its development has beendescribed in detail in this session, this discussionwill focus on the specific MBDS of the long-termcare component. Development of this MBDS beganin May 1975, wifh a 5-day working con ference,gThe purpose of this Conference was to determinethe general subject areas applicable to all LTC set-tings and clients which should be included in aMBDS. The 24 subject areas, which are presentedbelow, are divided into 3 general groups: 1) demo-graphic elements, 2) individual attributes, and 3)service and administrative elements,

SUBJECT AREAS FOR THELTC MINIMUM BASIC DATASET
Demographic Elements
1. Person identificationnumber)
(name and/or unique
2. Residence (address and zip code or censustract)
a. Latest noninstitutional domicileb. Current domicile (if different)
3. Living arrangementsa. Type of domicileb. Availability of able and willing personal “care-
giver”
4. Date of birth5. Sex6. Current marital status‘7. Race/ethnicity (according to vital statistics or
census definitions)
Individual Attributes
8. Events/reasons for use of services other thandiagnoses (as determined by responsible agencyor institution)
a. Principal event/reason occasioning current useof services
b. Other events/reasons influencing current useof services ,
9. Diagnoses (ICD, as determined by responsiblephysician)
a. Principal diagnosis occasioning current use ofservices
b. Other diagnoses influencing current status10. Physical impairments11. Physical functioning/disability12. Mental functioning/disability13. Social functioning/disability14, Performance of independent living activities
including Activities of Daily Living (ADL) itemsand other instrumental ADL items
15. Distress/mood/pain/self-perception
Service and Administrative Elements
16, Principal facility/agency/provider identificationand/or unique number
17’. Last principal provider identification (withinlast 12 months)
18. Admission or entry date (when appropriate)19. Discharge or termination date (when appropri-
ate)20. Assessment date .
21. Categories of service (provided since last assess-ment date or currently being provided)
a. Preventiveb. Acute episodicc. Evaluatived. Restorative/rehabilitativee. Su~Dortive
22.23.
24.
ed
Dis~;sition (when appropriate)Sources of payment (medical insurance, socialservices, income maintenance)Cost/charges/prices per unit or episode of serv-ices
The MBDS includes not only those items relat-to demographic and medical status but also
those related-to ‘psychological and social status. Forexample, in the demographic elements, the data setincludes not only the basic descriptors of age, sexand marital status but also living arrangements andavailability of personal “caregiver.” In the area ofindividual attributes, the MBDS includes not onlyICD diagnoses and measures of physical, mentaland functional status, but also nondiagnostic eventsor reasons for use of service and measures of dis-tress, mood, pain and self percepdon. So that dataon the client can be linked, where applicable, todata from the hospital and health facilities’ compo-nents, the service and administrative elements con-tain items on previous and other current providersof service.
The Conference recommended that a technicalconsultant panel of the U.S. National Committee onVital and Health Statistics be created to translatethese subject areas into the actual questions whichwill comprise the minimum basic data set. The pa-nel is also charged with specifying definitions andrecommending methods and frequency of datacollection. The panel, which has just recently beenselected, is chaired by Dr. Ethel Shanas of the Uni-versity of Chicago. It is tentatively scheduled to meetthis fall. It is projected that the minimum basic dataset will be completed in 1978 and that 20 States willhave operational long-term care components by1981. Once the MBDS is completed, it will be incor-porated into the NNHSS. It is expected that theNNHSS will be conducted by the NCHS only inthose States which do not have an operational LTCcomponent, and only until all States have opera-tional LTC components. At that time, the NCHSwill not collect LTC data directly but will producenational statistics by aggregating the data collectedby the States. In summary, it is clear that the long-range future of national nursing home statistics liesin the development and promulgation of the basic ,data set for the LTC component of the CHSS.
403
1.
2.
3.
4.
.
5.
U.S. Bureau of the Census: Hospital and Other Institu-tional Facilities and Services, 1939, Vital Statistics—
Special Report, Vol. 13, Nos. 1-57. U.S. Department ofCommerce, U.S. Government Printing Office, 1942.Unpublished data from the 1973 Master Facility Inven-tory conducted by the National Center for Health Sta-tistics.U.S. Bureau of the Census: Demographic Aspects ofAging and the Older Population in the United States.Current Population Reports-Special Studies, Series P-23, No. 59. U.S. Department of Commerce. U.S. Gov-ernment Printing Office.. 1976. “Social Security Administration: Nationaf Health Ex-penditures, Fiscal Year 1975, Social Security BuJletin,Vol. 39, No. 2, Februaq 1976. U.S. Department ofHealth, Education and Welfare. U.S. GovernmentPrinting Office, 1976.Hollis, G. and Fedell, J., Nursing Home Cost Data: AReview of Previous Studies, American Statistical Asso-
6.
7.
8.
9.
ciation-1 972 Pro~eedings of the Business and Eco-
nomic Statistics Secti’on, 1972.National Center for Health Statistics: Nursing Homes:An Overview of National Characteristics for 1973-74.Monthly Vital Statistics Report, Vol 23, No, 6, stspplc-ment. DHEW Publication No. (HRA)75- 1120, Depart-ment of Health, Education and Welfare, U.S. Govern-ment Printing Office. September 5, 1974.National Center for Health Statistics: Selected Operat-ing and Financial Characteristics of Nursing Homes:U.S., 1973-74, Vital and Health Statistics. DHEW Publi-cation No. (HRA)76- 1773. Series 13, No. 22, Depart-ment of Health, Education and Welfare, U.S. Govern-ment Printing Office. 1975.Health Resources Administration: The CooperativeHealth Statistics System, Health Services Reports, Vol.89, No. 1, January-February, 1974. Department ofHealth, Education and Welfare, pp. 13-15,Long-Term Care Data: Report of the Conference ofLong-Term Care Health Data, Tucson, May 1975,Medical Care 14(5) Supplement, 1976, Philadelphia,Lippincott, 1976.
404

MEDICARE STATISTICS
Mr. Carl E. Josephson, Assistant Director for Program Statistics, Division of HealthInsurance Studies, Office of Research and Statistics, Social Security Administration,Baltimore, Maryland
(Note: Mr. Josephson requested that in lieu of his remarks made at the Public HealthConference on Records and Statistics, the following article be reprinted from the July 1976issue of the Social Security Bulletin.)
TEN YEARS OF MEDICARE: IMPACT ON THE COVEREDPOPULATION
Ms. Marian Gornick, Division of Health Insurance Studies, Office of Research andStatistics, Sociai Security Administration, Baltimore, Maryland
This article provides a 10-year review of Medi-care program data concentrating on the experienceof the beneficiaries-now more than 22 million el-derly and 2 million disabled persons—and focuseson the impact of Medicare as insurance. Data arederived primarily from the Medicare statistical sys-tem and from special studies. Review of the data onhospital utilization shows that the number of daysof short-stay hospital care per 1,000 enrolled wasthe same in 1973 as it was in 1967, the first fullyear of Medicare operation. Study of the use ofmedical benefits reveals that the proportion of en-rollees using physician:’ and related services, as wellas the average number of services received, hasbeen at a relatively constant level throughout thepast decade.
Conclusions are that implementation of Medi-care did not result in a period of unbounded utili-zation of covered services. Major concerns arisefrom the rapid and persistent increase each year inthe price or unit costs of medid care during Medi-care’s first degade. Thus, although Medicare hassucceeded in accomplishing its primary goal of pay-ing the major portion of large hospital and medicalbills, the out-of-pocket dosts that enrollees face fortheir total health care needs are still likely to be aconsiderable burden to many beneficiaries.
July 1, 19’76, marks the tenth anniversary ofthe Medicare program. Enacted into law in 1965 dstitle XVIII of the Social Security Act—Health In-surance for the Aged—the new program went intoeffect on July 1, 1966, and began to provide basichealth insurance coverage for persons aged 65 andover—the age group with the highest incidence ofillness and disability, the lowest income, and theleast adequate private health insurance coverage.
Medicare’s two coordinated benefit packages—part A or hospital insurance (HI) (although it aIsocovers posthospital extended care in skilled nursingfacilities and home health visits) and part B or sup-
plementary medical insurance (SMI)—were de-signed to pay the major portion of large hospitaland medical bills. Not covered under Medicarewere several health care services that the aged gen-erally require such as drugs, routine eye and dentalcare, and preventive services. Nor was long-termcare covered. The primary intent of the programwas to enable elderly persons to enter the main-stream of. health care, obtaining essential serviceswithout depleting their financial resources.
Hospital insurance covers 90 days of inpatienthospital care, 100 posthospital days of care in askilled nursing facility (SNF), and 100 posthospitalhome health visits in a benefit period—which beginswith the first day of hospitalization and ends whenthe beneficiary has not been an inpatient in a hospi-tal or SNF for 60 continuous days. An additional 60hospital days are provided as a lifetime reserve thatmay be used if the individual exhausts the 90 daysin a benefit period. To coordinate with these bene-fits, SMI covers a variety of medical and surgicalservices and supplies furnished by a physician orothers in connection with physicians’ services. Thatprogram also covers home health visits whether ornot the beneficiary was hospitalized.
The beneficiaries are” required to share in thecosts. Under HI the patient is required to pay aninpatient hospital deductible that approximates thecost of 1 day of hospital care. coinsurance is re-quired for the 61st-90th day of inpatient hospitalcare, for the 2 lst-100th day of SNF care, and forall lifetime reserve days. Under SMI the beneficiarymust satisfy, a deductible amount each year, andafter the deductible the progam pays 80 percent ofallowed charges and the patient 20 percent.
To finance the program, two separate trustfunds were established to pay the benefits and ad-ministrative expenses. HI is’ financed primarilythrough a tax on current earnings in employmentcovered under the Social Security Act; SMI through
405

premiums paid by persons enrolled in the program(or on their behalf) and by the Federal governmentfrom general revenues.
In 1972, amendments to the Act broadenedMedicare to include” two additional high-riskgroups. Effective Jtdy 1, 1973, the full range ofMedicare benefits was extended to disabled personsunder age 65 who had been entitled to receive cashsocial security benefits for at least 2 years and topersons with end-stage renal disease (ESRD), thisgroups representing the innovative coverage of in-dividuals with a catastrophic illness.
In its relatively short history, Medicare has hada significant impact on the Nation. Together withits companion program, Medicaid,l it has affectedthe total health care system. Increasing costs andconcerns with quality have resulted in a determina-tion to improve economy, efficiency, and appropri-ateness of care. These goals have given impetus tothe development of professional standards revieworganizations, the support of innovative deliverysystems such as .healtb maintenance organizations(HMO’s), and experiments in reimbursement me-chanisms. Medicare’s experience of a large-scalehealth insurance program, moreover, has influenc-ed moit of the proposals for national health insur-ance.
This article concentrates on the experience ofthe aged and reviews 10 years of program data,derived primarily from claims payment informa-tion. In. this way, it examines the impact of Medi-care as insurance. Medicare’s impact on the healthcare system is not considered directly, but someaspects of the data are relevant to all these issues.Whenever possible, the data presented here coverthe period 1966-75. In many instances, however,the data do not cover the entire decade becausethey are not available or are based on a specialstudy covering a shorter time period or because theprocessing of claims for later years is not yet com-plete. The Technical Note (pages 42-44) gives afuller description of the sources of the data andprovides references.
ELIGIBILITY UNDER MEDICARE
Aged Persons CoveredWhen Medicare began in 1966, it covered only
“aged” persons, defined as those aged 65 and over.The vast majority of these persons were automati-
cally entitled to hospital insurance as social securityor railroad retirement cash beneficiaries. A specialtransitional p~ovision of the law added most of theremaining aged individuals-about 2 million per-sons. Thus at startup, comparatively few aged per-sons (an estimated 150,000) were excluded, withaliens and Federal civil service employees and an-nuitants the principal exclusions.z
Beginning in 1968, at least 3 calendar quartersin covered employment were required for eligibilityof those attaining age 65; additional quarters wererequired each year thereafter. By 1975, fully in-sured status-that is, having the required numberof quarters of coverage for retired-worker bene-fits-was necessary for those aging into the Medi-care program. As a result, an estimated 1 millionpersons aged 65 and over, of whom about one-fourth are Federal civil service annuitants, are cur-.rently not entitled to Medicare benefits,
HI enrollment.—On July 1, 1966, 19.1 millionpersons aged 65 and over were enrolled for HI,Each year thereafter, 1.4- 1.6 million personsreached age 65 and became eligible, while 1.1- 1.2million had their enrollment terminated by death,The net effect was a yearly increase of 200,000-400,000. By July 1, 1975, the enrolled aged popula-tion rttil.lbered 22.5 million (table 1).
In 1966 the median age of the HI populationwas 72.8; 37 percent were aged 75 and over. Wom-en enrollees substantially outnumbered men, mak-ing up 57.4 percent of the enrollment. During thefirst decade, the age composition of the elderly cov-ered population shifted upward. By 1975 the medi-an age had risen to 73.1, with 40,3 percent of theenrolled population aged 75 and over. The numberof women enrollees increased faster than the num-ber of men, and in 1975 women made up 59.2 per-cent of the HI aged population. The trend towarda higher average age among the aged enrolled forhospital insurance has implications for future utili-zation and costs since Me$icare experience showsthat the need for benefits tend to increase with age,
Persons other than white accounted for 7.6percent of the HI aged enrollment in 1966 and- 8.3percent in 1975. The requirement of fully insuredstatus for HI entitlement appears to account for thefact that a smaller proportion of the total aged ,population of races other than white are entitled toHI than the proportion of the total aged white
Iunder ~at progrm+nacted in 1965 as title XIX of the
Social Security Act, Medical Assistance—the States mayhelp with their medical care costs (1) persons receiving as-
sistance payments (currently aid to families with depend-
ent children and general assistance), (2) persons receivingsupplemental security income payments, and (3) medicallyneedy persons of all ages.
406
ZFedera] employees and annuitants have health insur-
ance protection under the Federal Employees’ HealthBenefits Program and were therefore not included under
Medicare. They are, however, covered if they have had
the necessary covered employment under the Social Secu.rity Act or if they elect to participate in HI or SM I andpay the premium.

TABLE I.—NUMBER AND PERCENTAGE DISTRIBUTION OF HIENROLLEES BY AGE, SEX, RACE, AND CENSUS REGION:PERSONS AGED 65 AND OVER, JULY 1, 1966, AND JULY 1, 1975
Age, sex, race, and census region
Total . . . . . . . . . . . . . . . . . . . . . . . . . . .
Age65-74 . . . . . . . . . . . . . . . . . . . . . . . . . . . . .
75 andover . . . . . . . . . . . . . . . . . . . . . . . . .
Sex
Men . . . . . . . . . . . . . . . . . . . . . . . . . . . . . . .
Women . . . . . . . . . . . . . . . . . . . . . . . . . . . .
Race
White . . . . . . . . . . . . . . . . . . . . . . . . . . . . .
All other , . . . . . . . . . . . . . . . . . . . . . . . . . .
Unknown . . . . . . . . . . . . . . . . . . . . . . . . . .
CensusregionlNortheast . . . . . . . . . . . . . . . . . . . . . . . . . .
North Central . . . . . . . . . . . . . . . . . . . . . . .south . . . . . . . . . . . . . . . . . . . . . . . . . . . . .West . . . . . . . . . . . . . . . . . . . . . . . . . . . . . .
Medicare enrollees aged 65 and over
Number (inthousands)
1966
19,082
11,990
7,092
8,133
10,949
17,042
1,444596
5,021
5,5485,4022,813
1975
22,472
13,426
9,046 .
9,168
13,304
19,9961,870
606
5,511
6,0976,9053,530
Percentincrease
17.7
12.0
27.6
12.7
21.5
17.329.5
1.7
9.8
9.927.825.5
Percent of total
1966
100.0
62.837.2
42.6
57.4
89.37.6
3.1
26.3
29.128.314.7
1975
100.0
59.740.3
40.859.2
89.08.3
2.7 .
24.5
27.130.715.7
1Regions do not add to total because they do not include enrollees who reside in locations outside the regions and enrolleeswhose addresses ae unknown.
population. Arecent studys shows that among the
population aged 65 and over at the end of 1973,80percent of the blacks, compared with92 percent ofthe whites, were receiving social security cash bene-fits. This difference is attributed to a greater likeli-hood that elderly white persons will achieve insuredstatus. The study also shows that comparativelymore blacks benefits from thesegments of the so-cial security program designed to protect youngerpopulations—the disabled, widowed mothers, andchildren. These findings correspond to the dataprovided next, whithshow that relatively more per-sons other than white who are under age 65 areentitled.to HI benefits.
Overall, the Medicare aged population in-creased 17,7 percent during this period while thetotal population of the United States went up only9.0 percent—an indication of the increasing pro-
3Gayle B. Thompson, “Biack; and Social SecurityBenefit Trends, 1960-73J’ Social Security BuJletin, April19754
portion of the agedin thegeneral population. Therate of growth in the HI aged enrollment was high-est in the South (2’7.8 percent), which now has thegreatest number of aged enrollees. Although theWest has the fewest, the rate of growth of Medicareenrollees (25.5 percent) in that region was veryhigh (table 1). Total population increases in there-gions measured 3.5percent in the Northeast, 5.2inthe North Central States, 13.1 in the South, and16.0 in the West.
SMIenrolIment.—Enrollmentin the supplementarymedical insurance program is voluntary and re-quires a monthly premium paid by the individualor. State. Of all aged persons enrolled in HI in theUnited States, 97.4 percent were enrolled in SMIasof July 1, 1975. Among aged persons other thanwhite who were enrolled under HI, however, 6.2percent were without SMI coverage.
The SMI premium is paid under the “buy-in”provision of the Social Security Act for aged per-
407.
—

sons receiving medid assistance. As of December1, 1975, buy-in agreements for 46 States, the Dis-trict of Columbia, Guam, and the Virgin Islandscovered 2.8 million persons, representing 13 per-cent of all aged SMI enrollees. A higher-than-aver-age proportion of the buy-ins are for persons inolder age groups; in 1972, 53 percent were aged75or older. Of all SMI enrollees who are not white,about one-third are covered under buy-in contracts.
Voluntary HI and SMI enrollees not entitled toH1.—The 1972 social security amendments allowtie aged who are not eligible for HI benefits toenroll in the program by voluntarily paying amonthly premium. The premium is high since it isbased on the full cost of hospital care for a highrisk group. It was $33 per month the first 12months ~uly 1973-June 1974) and had risen to $45per month by 1976. Only 15,000 people were en-rolled under th]s provision in 1974.
Aged persons who do not qualify for HI bene-fits have always had the option of enrolling in SMI.As of July 1, 19’75, aged persons not enrolled in HIbut enrolled in SMI numbered 318,000. Of these,28,000 were Federal civil service annuitants.
Disabled Enrollees
Medicare coverage for certain persons underage 65 who are receiving social security or railroadretirement cash benefits because of disability orend-stage renal disease (otherwise referred to as“chronic renal disease”) began on July 1, 1973.Except persons entitled solely because of ESRD,entitlement begins only after the disabled personhas received cash benefits for 24 consecutivemonths. Persons with ESRD are entitled to Medi-care protection 3 months after renal dialysis begins,whether or not they are receiving cash benefits, ifthey are insured or are dependents of insured per-sons.
As the program began 1.7 million’ disabledpersons were enrolled under HI (table 2). By July1, 1975, the number had risen to 2.2 million, anincrease of 25 percent in 24 months. This rapidgrowth parallels that observed in recent years in mecash benefit program for the disabled under theSocial Security Act.k
AThe rise jn dlsabifity beneficiary rolls has been attrib-uted partly to the rise in unemployment in recent years.
See Mordechai E. Lando, “The Effect of Unemployment
on Application for Disability Insurance,” 1974 Proceedingsof the Business and Econ omit Statistics Section—American
Statistical Association, 1975. See also John C. Hambor,
Unemployment and Disability: An Econometric Analysis
with Time Series Data” (Staff Paper No. 20), Office of Re-
search and Statistics, Social Security Administration, 1975.
408
The four categories of disabled persons whomay qualify for M<dicare protection are shown intable 2. Disabled workers are, by far, the largestgroup, accounting for almost 80 percent of the to-tal. Adults disabled since childhood (and entitled tochild’s benefits as dependents of retired- or disa-bled-worker beneficiaries or deceased insured work-ers) account for about 15 percent of the total. Disa-bled widows and widowers of beneficiaries and per-sons entitled solely because of ESRD, despite theirhigher rates of growth in the 24-month period, arerelatively small proportions of the total,
The four categories vary greatly in demograph-ic characteristics. In 1975, about 64 percent of thedisabled were men—a reflection of their higherparticipation in the labor force. The widow-widow-er category is composed almost entirely of women.The median age in the disabled group as a wholewas 55.5 in 1975; persons with ESRD formed a re-.latively young group, with 43.8 the median age.,With persons having ESRD excluded, 15.1 percentwere persons other than white; among those enti-tled because of ESRD, 24.8 percent were personsother than white. Both these proportions are consid-erably higher than the. proportions of persons
,other than white in the aged Medicare population(8.3 percent) and in the general U.S. populationunder age 65 (13.5 percent).
Although persons entitled to Medicare solelybecause of ESRD are a very small proportion of thedisabled group, their number is growing rapidly.During the first 24 months the number of enrolleesentitled to HI benefits solely for that reason rosefrom 6,371 to 12,702.s Not all persons with ESRDare eligible. During the first year of the programmore than 1,000 persons with ESRD had claimsrejected by Medicare because they failed to meetinsured status requirements.
Of the disabled persons enrolled under HIduring 1973-75, approximately 90 percent wereenrolled under SMI. Buy-in agreements, as of July1, 1974, covered 280,435 disabled persons—repre-senting 16.1 percent of those enrolled in SMI. Asof July 1, 1975, the highest refusal rate (1O percent)was among the disabled workers, known to includemany veterans who presumably refuse SMI cover-age because of the availability of free medical careunder the Veterans Administration program, Sixpercent of the disabled widows declined SMI cover-age and 8 percent of those disabled in childhood,Among those entitled to Medicare benefits becauseof ESRD, 5 percent declined to enroll under SMI,
sEnro]]ment counts of persons with ESRD are for
persons entitled to Medicare solely because they sufferfrom ESRD. The enrolled aged and other disabled groups
include some persons with ESRD whose entitlement doesnot depend upon their having the illness.
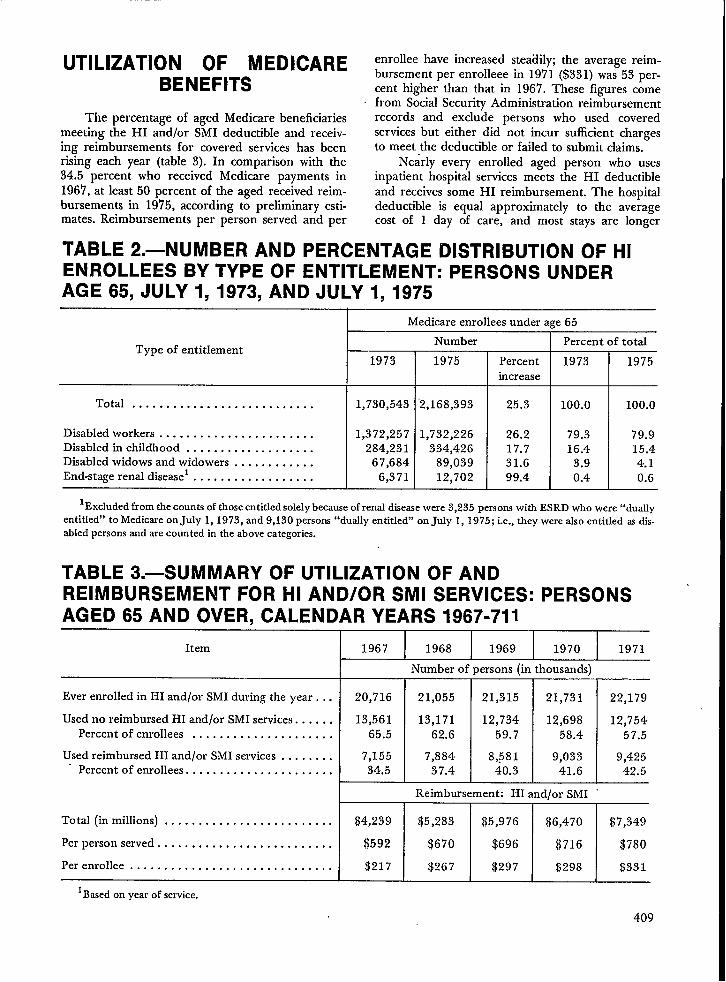
UTILIZATION OF MEDICAREBENEFITS
The percentage of aged Medicare beneficiariesmeeting the HI and/or SMI deductible and receiv-ing reimbursements for covered services has beenrising each year (table 3). In comparison with the34.5 percent who received Medicare payments in196’7, at least 50 percent of the aged received reim-bursements in 1975, according to preliminary esti-mates. Reimbursements per person served and per
enrollee have increased steadily; the average reim-bursement per enrolleee in 1971 ($331) was 53 per-cent higher than that in 1967. These figures comefrom Social Security Administration reimbursementrecords and exclude persons who used coveredservices but either did not incur sufficient chargesto meet the deductible or failed to submit claims.
Nearly every enrolled aged person who usesinpatient hospital services meets the HI deductibleand receives some HI reimbursement. The hospitaldeductible is equal approximately to the averagecost of 1 day of care, and most stays are longer
TABLE 2.—NUMBER AND PERCENTAGE DISTRIBUTION OF HIENROLLEES BY TYPE OF ENTITLEMENT: PERSONS UNDERAGE 65, JULY 1, 1973, AND JULY 1, 1975
Type of entitlement
Total . . . . . . . . . . . . . . . . . . . . . . . . . . .
Disabled workers . . . . . . . . . . . . . . . . . . . . . . .Disabled in childhood . . . . . . . . . . . . . . . . . . .Disabled widows and widowers . . . . . . . . . . . .End-stage renal diseasel ...,... . . . . . . . . . . .
Medicare enrollees under a~e 65
Number Percent of total
1973 1975 Percent 1973 1975increase
1,730,543
1,372,257284,231
67,6846,371
‘2,168,393
1,732,226334,426
89,03912,702
25.3
26.217.731.699.4
100.0 I 100.0
-L79.3 79.916.4 15.4
3.9 4.10.4 0.6
lExc]uded from the~ount~of thoseentitledsolelybecauseof renaldiseasewere 3,235 Personswith ESRD who ‘ere “dud]yentitled” to Medicae on July 1, 1973, and 9,130 persons“dually entitled” on July 1, 1975; i.e., they werealso entitled asdis-abled personsand arecounted in the above categories.
TABLE 3.—SUMMARY OF UTILIZATION OF ANDREIMBURSEMENT FOR HI AND/OR SMI SERVICES: PERSONSAGED 65 AND OVER, CALENDAR YEARS 1967-711
Item
Ever enrolled in HI and/or SMI during the year . . .
Used no reimbursed HI and/or SMI services. . . . . .Percent of enrollees . . . . . . . . . . . . . . . . . . . . .
Used reimbursed HI and/or SMI services . . . . . . . .Percent of enrollees . . . . . . . . . . . . . . . . . . . . . .
Total (inmillions) . . . . . . . . . . . . . . . . . . . . . . . . .
Perperson served, . . . . . . . . . . . . . . . . . . . . . . . . .
Per enrollee . . . . . . . . . . . . . . . . . . . . . . . . . . . . . .
1Basedon year of service.
1967 I 1968 I 1969 I 1970 I 1971
20,716
13,56165.5
7,15534.5
I
Number of persons (in thousands)
21,055 21,315 21,731 22,179
13,171 12,734 12,698 12,75462.6 59.7 58.4 57.5
7,884 8,581 9,033 9,42537.4 40.3 41.6 42.5
Reimbursement: HI and/or SMI ‘I I I
$4,239 $5,283 $5,976 $6,470 $7,349
$592 $670 $696 $716 $780
$217 $267 $297 $298 $331
409

than 1 day. On the odier hand, under SMI personsusing covered services do not always meet the de-ductible ($50 from 1967-72 and $60 thereafter).Medicare records show that the percentage of en-rollees who met the SMI deductible was 37.5 in1968, 40.5 in 1969, 42.2 in 1970, and 43.3 in 1971.As the following data tabulated from interviewswith the aged in the Current Medicare Survey(CMS) indicate, a much higher proportion of theenrollees reported actually using covered SMI serv-jces in each of those years.
Year
1968...1969...1970...1971...1972...1973...1974...
SMI covered se~ces
Percent ofenrollees us-ing covered
services
79.078.679.1
78.079.281.980.9
Average num-ber of covered
SMI servicesper person
served
16.017.416.815.414.715.516.0
Lverage
:harge
per;ervice
;10.2110.5711.7112.27
13.5513.57i5.50
According to the above figures, the percentageof enrollees u<ing covered ser~ices and &e averagenumber of services per person served showed noconsistent increase. Average charges, however, in-creased sharply. Thus it appears that the higher -proportion of persons meeting the SMI deductiblein each succeeding year results primarily from ris-ing charges ratier than from increased utilization.
The proportion of beneficiaries who receiveMedicare benefits varies considerably with the typeof service. As would be expected, the proportionusing reimbursed physicians’ services was higherthan that for any other type of service (table 4). In1967, that rate was 358.5 per 1,000; it increasedeach year, reaching 440.6 in 1971, The rate forpersons who received reimbursement for inpatienthospital services (approximately half the rate forthose with physicians: services) also rose over theyears—from 184.7 per 1,000 in 1967 to 211.5 in1971. This increase-unlike the growth in the ratesfor physicians’ and other medical services—reflectsan actual rise in the number per 1,000 who usedinpatient hospital care.
The greatest increase in rate of use occurred inhospital outpatient services. This increased use byelderly persons parallels the trend observed in thetotal delivery system of increased use of hospitaloutpatient services for primary care.G
During the program’s first decade, the numberof persons who received SNF and home healthservices was lower and showed more erratic changesthan the other types of services—with the rates firstrising, then falling. These services were incorporat-ed into Mediare as appropriate alternatives tomore costly short-stay inpatient hospital care. Thecriterion for SNF coverage under Medicare was themedical necessity for the patient to receive posthos-
GAmerican Hospital Association data for memberhospitals show that outpatient visits increased from 125.8million visits in 1965 to 250.5 million visits in 1974. See-Hospital Statistics, 1975edition, American Hospital Asso-ciation.
TABLE 4.—UTILIZATION OF REIMBURSED SERVICES, BY TYPEOF SERVICE: PERSONS AGED 65 AND OVER, CALENDARYEARS 1967=71 1
Year
1967.............1968.............1969.............1970.............1971.............
lBased on year of se]
I Persons served I
Inpatient
hospital
services
184.7
197.1
204.8209.4211.5
HI
S~ed
nursing
facility
services
18.2
20.319.714.211.5
Home
health
services
HI
6.5
8.39.58.38.0
:r 1,000 enrolled
Physicians’
and other
medicalservices
358.5
385.6416.5433.0440.6
SMI
Outpatient Home
hospital health
services servicesSM12 SMI
58.4 6.6
72.6 7.284,9 7.594.9 .5.3
108.7 4.1
2Pnor to Aprit 1968, diagnostic outpatient hospital services were covered under HI. These services are excluded from table.
410

pital skilled-nursing, convalescent, and rehabilitativeservices for restoration to maximum functional ca-pacity. This provision proved difficult to apply inthe earlier years, and the decline in rates for per-sons served under Medicare after 1968 is attributedto a more stringent application of the “medical ne-cessity” criterion.T
Use by Persons ContinuouslyEnrolled, 1966-74
Each year until about 197’5, well over half theaged enrollees did not receive any reimbursed serv-ices. To determine whether or not a substantialproportion of these persons were individuals whofailed to receive benefits year after year, the use ofSMI benefits by persons continuously enrolled inMedicare from Julyl, 1966, to December 31, 1974,was analyzed.
Data were generated from the records of the1’7.7 million aged persons enrolled in SMI on theday that Medicare operations began. Their medianage was then about 73. Nearly 9.5 million of these
7The level-of-care requirements for SNF services un-der Medicare were amended in section 247 of the Social
I Security Amendments of 1972. The amendments broad-ened the criterion that a patient must need continuingskilled-nursing services by including posthospital patients
Iwho require skilled-nursing or other rehabilitative serviceson a daily basis. Under the broadened criteria, it is expect-ed that certain persons will be covered by Medicare forSNF services wh~ would formerly have had such servicescovered by Medicaid or private payments.
persons were still enrolled as of December 31,1974. In their 8 1/2 years of continuous enrollment,they had nine opportunities to meet the SMI de-ductible. The deductible status of these survivorswas tabulated to determine how many times theyused sufficient services to meet the deductible (table5). Almost 84 percent met the deductible at leastonce, and nearly one-fourth met the deductible sixtimes or more. On the other hand, 16.3 percent ofthese aged persons never met the SMI deductible,and an additional 14.2 percent met it only once outof nine possible times.
Use of Benefits in Last Year ofLife
The use of Medicare benefits is especially nota-ble in the” last year of life. Data for persons whodied each year in the period 1967-69 show that themajority of decedents received Medicare benefitsand that reimbursements made on -their behalfwere relatively much greater than for persons aliveat the end of the year. Overall, of the 21 millionever enrolled in HI and/or SMI during 1967, about5 percent died that year; 22 percent of all reim-bursements were made on their behalf.
Table 6 shows the number of persons who re-ceived reimbursed physicians’ and hospital servicesand the average amount reimbursed for personsper 1,000 alive at the end of the year and for per-sons per 1,000 who died during the year. For bothgroups, the number per 1,000 who received inpa-tient hospital benefits was about four times as high
TABLE 5.—NUMBER OF TIMES DEDUCTIBLE MET BY PERSONSAGED 65 AND OVER ENROLLED IN SMI CONTINUOUSLY,JULY 1, 1966-DECEMBER 31, 1974
Number of times SMIdeductible met
Total, continuously enrolled
o . . . . . . . . . . . . . . . . . . . . . . . . . . . . .1 . . . . . . . . . . . . . . . . . . . . . . . . . . . . .2 . . . . . . . . . . . . . . . . . . . . . . . . . . . . .3 . . . . . . . . . . . . . . . . . . . . . . . . . . . . .4 . . . . . . . . . . . . . . . . . . . . . . . . . . . . .5 . . . . . . . . . . . . . . . . . . . . . . . . . . . . .6 . . . . . . . . . . . . . . . . . . . . . . . . . . . . .7 . . . . . . . . . . . . . . . . . . . . . . . . . . . . .8 . . . . . . . . . . . . . . . . . . . . . . . . . . . . .9 . . . . . . . . . . . . . . . . . . . . . . . . . . . . .
Persons meeting deductible specified number of times
Number
(in thousands)
9,493
1,545
1,350
1,3001,124
986
840
721642600385
Percentage
distribution
100.0
16.3
14.2
13.7111.8
10.48.87.66.86.3
4.1
Cumulative
percentage
—
16.3
30.5
44.2
56.0
66.4
75.2
82.889.695.9
100.0
411229-121 0.77 -27

TABLE 6.—UTILIZATION AND REIMBURSEMENT FOR PERSONSWHO WERE ALIVE AT THE END OF THE YEAR AND WHO DIEDDURING THE YEAR: PERSONS AGED 65 AND OVER,CALENDAR YEARS 1967-AND 19691
Popdation
Inpatient hospital services
m
Physicians’ and other medicalservices
m
1967
Persons alive at end of 1967 . . . . . . . 149.0 $683 295.0 $181Persons who died during 1967 . . . . . . 620.8 $978 625.8 $283
1969
Persons alive at end of 1969 . . . . . . .Persons who died during 1969 . . . . . . ~
1Based on year of service.
for decedents as for survivors; for physicians’ serv-ices, it was nearly twice as high. The figures indi-cate that, of those who died, approximately 400 outof 1,000 did not receive inpatient hospital care inthe year of their death, and 325-3’75 did not usesufficient physicians’ services to meet the deductibleand receive benefits. Note that the decedents, un-like the survivors, could have had something lessthan a full year in which to meet the deductible,depending on how early in the year they died.
Patterns and Trends
Use of short-stay hospital services.—The initialimpact of Medicare was greater utilization of short-stay hospitals by the aged. The number of dis-charges per 1,000 enrolled, the average length ofstay, and the average number of days of care per1,000 were higher the year that Medicare beganthan they were in the preceding year. Estimates ofthe increase in the hospital discharge rate from theyear before the program started to the program’sfirst year ranged from 4.6 percent to 7.4 percentsSimilarly, the estimated increase in mean length ofstay was 4.1-7.8 percent; the number of days of
‘care per 1,000 rose an estimated 8.9-16.0 percent.Program data for inpatient short-stay hospital
care for discharges during the period 1967-73 show
sFor sources of these estimates, see Julian Pettengill,“Trends in Hospital Use by the Aged: SOQ-d SecurityBulletin, July 1972.
412
376.4 $190673.1 $304
that average length of stay has declined significant-ly. In contrast, the rate of hospitalization has beenrising, offsetting the effect of the decrease in aver-age length of stay.
Short-stay hospital utilization by the aged in1967-73 is summarized in table 7. The dischargerate rose from 259 per 1,000 enrollees in 1967 to284 per 1,000 in 1968 but leveled off during 1969-71. Then it began to climb again, reaching 302 per1,000 enrollees in 1973. In contrast, 2 full dayswere cut from the average hospital stay during thisperiod, with the mean length of stay falling from13.8 days to 11.8 days.
The annual rate of days of care fluctuated upand down according to whether the rise in the ad-mission rate or the decline in length of stay exertedthe predominant force, with the figure for 1973(3,556 days per 1,000 enrollees) very nearly equalto that for 1967 (3,575 days per 1,000).
Total hospital charges for Medicare beneficiar-ies rose precipitously during this period, increasingfrom $3-4 billion to $8.0 billion. The averagecharge per day was $49 in 1967 and $104 in 1973.The charge for a hospital stay averaged $675 in1967 and $1,228 in 1973, These amounts are fortotal charges, not the Medicare reimbursedamounts, which are based on hospital costs, Prelimi-nary data for 1974 and 1975 indicate a continuingtrend of increasing discharge rates, declining lengthof stay, and increasing hospital charges per day andper stay.

TABLE 7.—SHORT-STAY HOSPITAL DISCHARGES UNDERMEDICARE: PERSONS AGED 65 AND OVER, CALENDAR YEARS1967-731
Year
1967..,1968..1969..1970..1971.,1972.,1973..
Total(in millions)
Rate per1,000
enrollees
Number of discharges
‘7
Days of careRate per Mean length
1,000 of stay
enrollees(days)
Total(in millions)
5.165.625.915.975.986.366.52
259284295293288301302
69.777.377.877.574.576.876.7
1Based on year of discharge.
Considerable geographic differences have beenobserved in the use of short-stay hospital inpatientservices. Regional patterns that persist are clearlyidentifiable for the rate of hospital admissions, thelength of the hospital stay, days of care utilized, andcharges.
Table 8 shows hospital utilization and chargesin the four U.S. census regions. The discharge rateis strikingly different from region to region. TheSouth hadmore discharges per 1,000 enrollees eachyear than any other area, and the Northeast hadthe fewest. The hospitalization rate was 24 percentgreater inthe South in 1973 than in. the Northeast.
In contrast, the Northeast ranks highest inlength of stay, followed by the North Central re-gion, the South, and the West. Length of stay forthe aged under Medicare in the Northeast has aver-aged 5 days longer than in the West. Regional dif-ferences in length of stay are not explained by vari-ations in patient characteristics such as diagnosis,age, whether surgery was performed, or whetherthere were multiple diagnoses.
These regional rankings in the discharge rateand in length of stay were the same in 1973 as in1967 and have been consistent in the years between.Just as the discharge rate for all areas increasedover time, so it did in each region. Similarly, lengthof stay decreased in each region.
In the North Central region the relatively highrate of discharges and long length of stay resultedin the highest rate of days of care per 1,000 enroll-ees during the period 1967-73. The rate in theNorth Central region in 1973 was 36 percent great-er than in the West, the region with the lowest ratefor days of care.
z3,575 13.8
3,910 13.83,990 13.53,807 13.0
3,592 12.53,636 12.13,556 11.8
HOS
Totalf.,m millions)
$3,4124,38.95,2695,9076,5207,3908,003
ital charges
Perdischarge
$675781892989
1,0911,1631,228
Perday
$495766768796
104
Charges per day were highest in the West,however. Mean charges per enrollee, which reflectthe combined effect of the discharge rate, length ofstay and charges per day, are also shown in table 8.For 1973, the mean charge of $450 per enrollee inthe Northeast was the highest-4 1 percent greaterthan the mean in the South.
Regi’onal differences also occur in the rate ofdischarges with surgery, as the following figures for1967 and 19’72 reveal. The rate of surgery eachyear was highest in the West and North Centralregions, 1967-72. Surgical rates rose in all regionsbetween 1967 and 1972, but the increases weregreatest in the Northeast and in the South, the re-gions with the lowest rate in both years.
Number of discharges with
Census region: surgery per 1,000 enrollees
1967 1972
All areas . . . . . 82.6 93.1
Northeast . . . . . . . . 78.6 91.4North Central. . . . . . 87.5 97.2
south . . . . . . . . . . . . 78.8 91.1
West . . . . . . . . . . . . 92.0 99.9
Use of skilled nursing facility services.—Noticesof admissions to skilled nursing facilities are report-ed to the Social Security Administration. Table 9summarizes admission of the aged to such facilitiesfor fiscal years 1968-74. The number and rate ofreported admissions reached a peak in 1969 andthen declined. As a percent’ of hospital admissions,the number of SNF admissions varied from 8.6
413
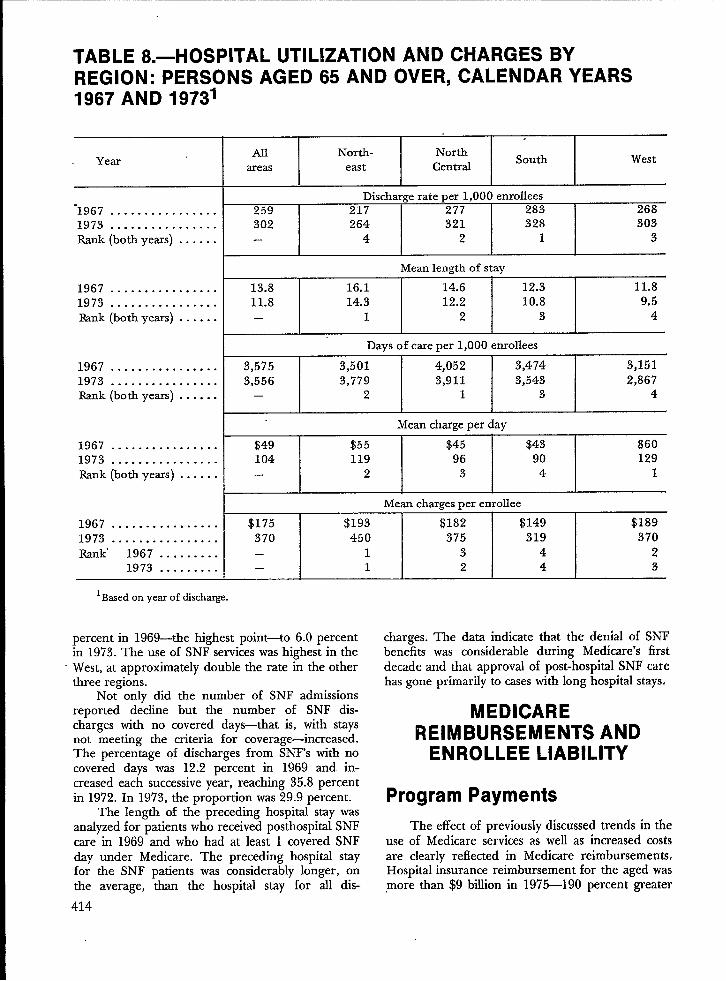
TABLE 8.—HOSPITAL UTILIZATION AND CHARGES BYREGION: PERSONS AGED 65 AND OVER, CALENDAR YEARS1967 AND 19731
YearAll North- North
areas CentralSouth West
east
Discharge rate per 1,000 enrollees‘1967 . . . . . . . . . . . . . . . . 259 217 277 283 2681973 . . . . . . . . . . . . . . . . 302 264 321 328 303Rank (bothyeus) . . . . . . – 4 2 1 3
Meanlengthof stay
1967 . . . . . . . . . . . . . . . . 13.8 16.1 14.6 12.3 11’t?1973 . . . . . . . . . . . . . . . . 11.8 14.3 12.2 10.8 9.5Rank (bothyears) . . . . . . – 1 2 3 4
Days of care per 1,000 enrollees
1967 . . . . . . . . . . . . . . . . 3,575 3,501 4,052 3,474 3,1511973 . . . . . . . . . . . . . . . . 3,556 3,779 3,911 3,543 2,867Rank (both years) . . . . . . – 2 1 3 4
Mean charge per day
1967 . . . . . . . . . . . . . . . . $49 $55 $45 $43 $601973 . . . . . . . . . . . . . . . . 104 119 96 90 129Rank (bothyears) . . . . . . – 2 3 4 1
Mean charges per enrollee
1967 . . . . . . . . . . . . . . . . $175 $193 $182 $149 $1891973 . . . . . . . . . . . . . . . . 370 450 375 319 370Rank. 1967 . . . . . . . . . – 1 3 4 2
1973 . . . . . . . . . – 1 2 4 3
lBasedonyearof discharge.
percent in 1969—the highest point—to 6.0 percentin 1973.The use of SNF services was highest in theWest, at approximately double the rate in the otherthree regions.
Not only dld the number of SNF admissionsreported decline but the number of SNF dis-charges with no covered days-that is, with staysnot meeting the criteria for coverage—increased.The percentage of discharges from SNF’S with nocovered days was 12.2 percent in 1969 and in-creased each successive year, reaching 35.8 percentin 1972. In 1973, the proportion was 29.9 percent.
The length of the preceding hospital stay wasanalyzed for patients who received posthospital SNFcare in 1969 and who had at least 1 covered SNFday under Medicare. The preceding hospital stayfor the SNF patients was considerably longer, onthe average, than the hospital stay for all dis-
414
charges. The data indicate that the denial of SNFbenefits was considerable during Medicare’s firstdecade and that approval of post-hospital SNF carehas gone primarily to cases with long hospital stays.
MEDICAREREIMBURSEMENTS AND
ENROLLEE LIABILITY
Program Payments
~e effect of previously discussed trends in theuse of Medicare services as well as increased costsare clearly reflected in Medicare reimbursements.Hospital insurance reimbursement for the aged was,more than $9 billion in 1975—190 percent greater

than it was in 1967 (table 10). During the same per-iod, enrollment increased only 18 percent. Skillednursing facility reimbursements as a proportion oftotal HI reimbursements were highest in 1968 (8.8percent) and declined steadily until 1972. In 1975,only 2.4 percent of total reimbursement was forsuch services. The proportion of reimbursementsfor home health care was consistentl~ small—about1 percent of total reimbursements each year. Withthe decline in SNF benefits, 96 percent of all HIreimbursements from 1971 to 1975 were for inpa-tient hospital care.
The “benefit period” concept, which limits thenumber of continuous days of hospital care that arecovered, is reflected in the division of reimburse-ments for inpatient hospital care.bursements were for short-stay
TABLE 9.—SKILLED
Most of the reim-hospitd services.
Reimbursements for hospitals other than short-stayhave remained below 2 percent since 1969.
Hospital insurance reimbursements for the dis-abled totaled nearly $1 billion in 1975. The distri-bution of benefits show some small variations fromthat for the aged. The proportion of reimburse-ments for SNF care was about 1 percent; reim-bursements for inpatient care in hospitals otherthan short-stay made up about 4 percent of the to-tal, probably reflecting more use of long term re-storative services for the disabled.
Total SMI reimbursement for the aged reached$3.6 billion in 19’75, 230 percent greater than in1967 (table 11); SMI enrollment increased only 23percent during the same period. Before 1970, morethan 90 percent or more of total SMI reimburse-ment was for physicians’ care. The proportion has
NURSING FACILITY ADMISSIONS BYREGION: PERSONS AGED 65 AND OVER, FISCAL YEARS1968-74’
Year
1968 . . . . . . . . . . . . . . . .1969 . . . . . . . . . . . . . . . .1970 . . . . . . . . . . . . . . . .1971 . . . . . . . . . . . . . . . .1972 . . . . . . . . . . . . . . . .1973, . . . . . . . . . . . . . . .1974 . . . . . . . . . . . . . . . .
1968 . . . . . . . . . . . . . . . .1969 . . . . . . . . . . . . . . . .1970 . . . . . . . . . . . . . . . .1971 . . . . . . . . . . . . . . . .1972 . . . . . . . . . . . . . . . .1973 . . . . . . . . . . . . . . . .1974 . . . . . . . . . . . . . . . .
1968 . . . . . . . . . . . . . . . .1969 . . . . . . . . . . . . . . . .1970 . . . . . . . . . . . . . . . .1971 . . . . . . . . . . . . . . . .1972. . . . . . . . . . . . . . . .1973 . . . . . . . . . . . . . . . .1974 . . . . . . . . . . . . . . . .
Al North- Northsouth
areas east Central
442.5521.9477.0422.1400.3408.0425.6
22.726.323.820.719.319.119.5
Number ofadmissions (inthousands)
106.3 105.0 106.0125.1 120.3 127.8114.7 112.4 110.1104.0 96.2 93.8105.2 88.1 81.9110.4 88.6 79.7117.4 92.7 81.6
SNFadmission rate per l,OOOpopuIation
20.8 18.6 19.024.1 21.0 22.222.1 19.6 18.819.8 16.6 15.519.9 15.0 13.220.7 15:0 12.421.7 15.5 12.4
SNFadmissions as apercent ofhospital admissions
West
125.0148.4139.0127.4124.6128.2133.1
43.049.645.740.838.939.039.4
7.78.67.86.86.26.06.1
8.29.58.67.77.47.57.6
6.06.66.25.24.64.54.6
5.86.55.54.63.83.53.5
14.215.714.513.412.412.212.2
1Basedon year of admission.
415

TABLE 10.—AMOUNT OF HI REIMBURSEMENT’ ANDPERCENTAGE DISTRIBUTION BY TYPE OF SERVICE: PERSONSAGED 65 AND OVER AND DISABLED UNDER AGE 65,CALENDAR YEARS 1967-75
Year*
19673.............1968 .............1969 .............1970 .............1971 .............1972 .............1973 .............1974 .............1975 ..............
19735.............1974 .............
1975 .............
Totrdamount
(inmillions)
Percentage distribution
HospitalsAll
Skilled HomeShort- All nursing
servicesheaIth
stay other facilities agencies
$3,9593,9474,4854,8445,368 .5,9076,4857,5859,175
100.0100.0100.0100.0100.0100.0100.0100.0100.0
Agedbeneficiaries
90.988.189.792.894.495.094.894.794.9
2.22.01.71.51.51.6
1.41.41.3
6.18.87.54.73.32.62.82.82.4
0.61.01.11,00.80.80.91,11.4
Disabled beneficiaries4
$171 100.0 95.3 3.4 0.9 0.4
681 100.0 93.8 4.4 1,0 0.8
952 100.0 93.8 4.3 0.9 1.0
1Reimbursementsrepresentpayments for covered servicesbased on an interim rate. They areadjustedat the end of eachprovider’s operatingyemontie bmisofautited costreports. Paymentsexclude deductibles,coinsurmce, andchwges fornon.coveredservices.
2Basedon yearin which intermediacyapprovedbills for payment.31ncludesreimbursementof$824,267,000 forfirst6months ofMedicare,July-December 1966.41ncludesreimbursementfor enrollees”with ESRD.5July-December1973.
been declining in recent years, falling to 83.5 per-centby 1975. In contrast, reimbursement forhospi-tal outpatient services increased from 2.0 percent in1967 t08.7 percent in19’75.
SMI reimbursements for disabled beneficiaries,including those entitled because of ESRD, totaled$0.5 billion in 19’75. Reimbursement for hospitaloutpatient services was notably greater for the disa-bled than for the aged. Medicare tabtiations showthat more than half thereimbursement for hospitaloutpatient services was on behalf of patients entitledto Medicare because of ESRD. Similarly, reimburse-ment in the “all other” category reflects a substan-tial proportion for ESRD services furnished by lim-ited-care facilities that provide dialysis services.
416
Beneficiary Liability
Gst-sharing under HI.—When Medicare be-gan in 1966, the deductible was set at $40, ~lnsur-ance for the 61st to the 90th day was $10 per day.During the next decade the average cost of a day ofcare in a hospital increased markedly. The deducti-ble—which by law approximates 1 day of care in ahospital—also increased sharply, reflecting the gen-eral hospital price escalations during this period. ByJanuary 1, 1976, the deductible reached $104.Coinsurance for the 61st-90th day increased pro-portionately to $26 and for the 60 lifetime reserveddays to $52 (table 12).
The effects of the cost-sharing provisions forshort-stay hospital care are shown in table 13. Total

TABLE 11.—AMOUNT OF SMI REIMBURSEMENT’ PERCENTAGE DISTRIBUTIONBY TYPE OF SERVICE: PERSONS AGED 65 AND OVER AND DISABLED UNDER AGE 65,CALENDAR YEARS 1967-75
Year2
19674......1968 ......1969 ......1970 ......1971 ......1972 ......1973 ......1974 ......1975 ......
19736......1974 ......1975 ......
Total
amount
(inmillions)
$1,1421,3421,7831,7511,9562,2271,9092,9333,605
$9257505
Percentage distribution
AllHospital
IndependentHome
Physicians outpatient healthAllother3
services laboratoriesservices agencies
100.0100.0100.0100.0100.0100.0100.0100.0100.0
92.9
90.990.589.889.488.786.386.183.5
Agedbeneficiaries
2.03.33.84.85.46.17.67.48.7
0.50.50.50.50.60.70.80.81.0
1.4
1.6
1.7
1.3
0.8
0.70.91.21.6
2.03.33.53.53.83.74.34.34.9
Disabled beneficiaries
100.0 72.2 21.8 0.2 1.5 4.0100.0 58.9 34.4 0.4 1.1 5.0100.0 51.3 29.1 0.5 1.0 17.9
lkimbursemnts represent payments to or on behalf of beneficiary-generally 80percent ofdlOwed charges, once the beneficiary hassatisfied thedeductible inthecumentyear.2 Based on year recorded in-8SA administrative records.3~nc1ude5 reimbursement for ancillw SM1 sewice5 provided by hospit~s, SN Fs, HHA’s, services furnished by limited-care facilities for ES~ Patients, ~d suPPlier ‘ewices.
41ncludes reimbursement of $62,576,000 for the first 6 months of Medicare, July-December 1966.‘Included reimbursement for persons with ESRD.6July-December 1973.
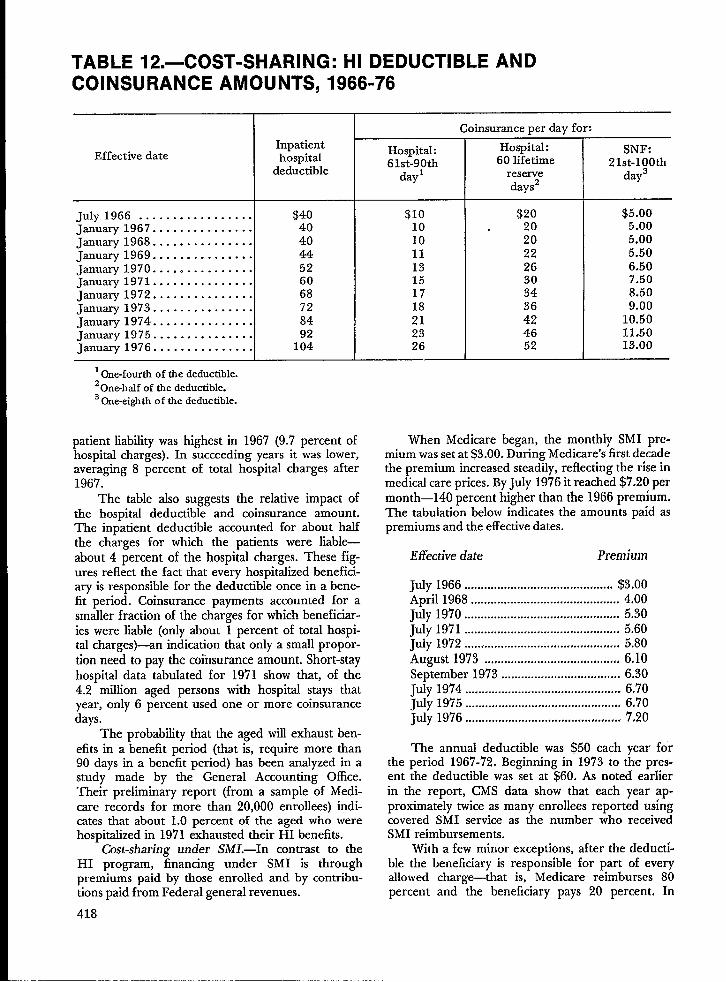
TABLE 12.—COST-SHARING: HI DEDUCTIBLE ANDCOINSURANCE AMOUNTS, 1966-76
InpatientEffective date hospital
deductible
July 1966 . . . . . . . . . . . . . . . . . $40january 1967 . . . . . . . . . . . . . . . 40january 1968 . . . . . . . . . . . . . . . 40january 1969 . . . . . . . . . . . . . . . 44January 1970 . . ..o . . . . . . . . . . 52January 1971 . . . . . . . . . . . . . . . 60january 1972 . . . . . . . . . . . . . . . 68January 1973 . . . . . . . . . . . . . . . 72January 1974 . . . . . . . . . . . . . . . 84January 1975 . . . . . . . . . . . . . . . 92January 1976 . . . . . . . . . . . . . . . 104
10ne-fourth of the deductible.20ne-half of the deductible.3 ~e-ei@ti of the deductible.
patient liability was highest in 1967 (9.7 percent ofhospital charges). In succeeding years it wallower,averaging 8 percent of total hospital charges after196’7.
The table also suggests the relative impact ofthe hospital deductible and coinsurance amount.The inpatient deductible accounted for about halfthe charges for which the patients were liable—about 4 percent of the hospital charges. These fig-ures reflect the fact that every hospitalized benefici-aryis responsible for the deductible once in abene-fit period. Coinsurance payments accounted for asmaller fraction of the charges for which beneficial-ies were liable (only about 1 percent of total hospi-talcharges)—an indication that only a small propor-tion need to pay the coinsurance amount. Short-stayhospital data tabulated for 1971 show that, of the4.2 million aged persons with hospital stays thatyear, only 6 percent used one or more coinsurancedays.
The probability that the aged will exhaust ben-efits in a benefit period (that is, require more than90 days ina benefit period) has been analyzed inastudy made by the General Accounting Office.‘heir preliminary report (from a sample of Medi-care records for more than 20,000 enrollees) indi-cates that about 1.0 percent of the aged who werehospitalized in 1971 exhausted their HI benefits.
Cost-sharing under SM1.—In contrast to theHI program, financing under SMI is throughpremiums paid by those enrolled and by contribu-tions paid from Federal general revenues.
418
Hospital:61st-90th
dayl
$1010101113151718212326
Coinsurance per day for:
Hospital:60 lifetime
reservedays2
$20. 20
202226303436424652
SNF:21st-100th
day3
$5.005.005.005.506.507.508.509.00
10.5011.5013.00
When Medicare began, the monthly SMI pre-mium was set at $3.00. D;ring Medicare’s’first de;adethe premium increased steadily, reflecting the rise inmedical care prices. By July 1976 it reached $7,20 permonth—140 percent higher than the 1966 prem~um,The tabulation below indicates the amounts paid aspremiums and the effective dates,
Effective date Premium
Ju1y 1966 ............................................. $3.00April 1968 ............................................. 4400July 1970 ............................................... 5.30July 1971 ............................................... 5.60July 1972 ...............................,. ., .......##..’ 5.80August 1973 .................................’ ....’.. 6,10September 1973 .................................... 6.30July 1974 ............................................... 6,70July 1975 ............................................... 6.70July 1976 ............................................... 7.20
The annual deductible was $50 each year forthe period 1967-72. Beginning in 1973 to the pres-ent the deductible was set at $60. As noted earlierin the report, CMS data show that each year ap-proximately twice as many enrollees reported usingcovered SMI service as the number who receivedSMI reimbursements.
Wllh a few minor exceptions, after the deducti-ble the beneficiary is responsible for part of everyallowed charge—that is, Medicare reimburses 80percent and the beneficiary pays 20 percent. In

TABLE 13.—TOTAL HOSPITAL CHARGES, MEDICARE INTERIM REIMBURSEMENTS,AND CHARGES FOR WHICH PATlENT IS LIABLE FOR SHORT-STAY HOSPITALINPATIENT CARE: PERSONS AGED 65 YEARS AND OVER, CALENDAR YEARS 1967-72
Yearl
1967 .......1968 .......1969 .......1970 .......
$. 1971 .......
> 1972 .......
1967 .......1968 .......1969 .......1970 .......1971 .......1972 .......
Total
hospital
charges
$3,411,8914,388,8485,268,6275,906,5846,5~9,824
100.0100.0100.0100.0100.0100.0
(Amounts in thousands)
Medicare
reimbursement
(interim)’
$2,671,1833,493,3414,123,6004,496,0804,950,553
78.379.678.376.175.9
Total
$332,638360,902415,760470,459481,631
9.78.2‘7.98.07.4
Inpatient
deductible
$163,515180,415206,299245,976283,651
Patient liabtiity I ICoinsurance
Blood Noncovered
deductible charges4
$21,796 $9,919 $137,408
46,879 12,153 121,455
54,563 13,468 141,429
49,111 14,046 161,326
46,692 14,008 137,280
a
Percent of total charges
4.8
4.1
3.9
4.2
4.4
0.6
1.1
1.00.8
0.7
0.30.30.30.20.2
4.02.82.72.72.1
1Based on year in which discharge occurred.2Reimbursements represent payments forcovered services based onan interim rate. They preadjusted at the end of each provider's operating year onthebmis ofaudited cost
reports. Payments exclude deductibles, coinsurmce, andchmges fornoncovered sewices.3 For 61 St-9Oth day in a benefit period and “lifetime” reserve days.41ncludes Chmges for noncovered days, private room accommodations, private duty nursing, convenience items, etc.
~ Note: Medicare reimbursement and charges for which the patients are liable do not add to 100.0 percent of hospital charges. Not shown are the additional payments made by Medl-+ care based on audited cost reports or charges not reimbursed which are in excess of costs.Q

actuality, the beneficiary is often responsible formore than 20 percent of physicians’ charges be-cause of the “reasonable charge” determination.The law requires that physicians’ and related serv-ice charges be subjected to a “reasonable or allowedcharge” determination by the carriers. In determin-ing the allowed charge, carriers take into accountthe customary charge of the physician for the spe-cific service provided and the prevailing charge inthe locality for similar services provided by physi-cians with the same specialty status.g
Payment under SMI may be made directly to aphysician (or supplier) or to the beneficiary. Underthe first method, payments are “assigned” to thephysician if he and the beneficiary accept this ar-rangement. When a physician accepts assignmenthe agrees that his total charges will not be morethan the allowed charges determined by the carrier.In such cases, the patient is liable only for the 20-percent coinsurance portion of allowed charges. Inunassigned claims, the patient is liable for a coin-surance payment plus the difference between thephysicians’ charges and the allowed charges. It isapparent that assignment is advantageous to thebeneficiary: His ability is Iiiited to 20 percent ofallowed charges after the deductible is met and heis spared the administrative requirement of submit-ting claims, which to some beneficiaries may be adifficuh task.
The proportion of claims 10 for which the phy-sician (or supplier) accepts assignment has been fall-ing steadily since 1970. The net assignment rate 11was 61.5 percent in 1969 and fell to 51.8 percent by1975. Net assignment rates for all enrollees (agedand disabled) for 1968-75 are shown below.
Total claimsNet
Yearreceive d on
Form SSA-1490assignment
(in millions)rate
1968 . . . . . . . . . 32.1 59.01969 . . . . . . . . . 37.5 61.51970 . . . . . . . . . 42.1 60.8
gpayme,nt~under SMI were subject to the President’seconomic stabdization program from August 1971 to April1974. More recently, the 1972 amendments provide forthe application of an economic index to Medicare reim-bursement. For fiscal years beginning July 1, 1973, andthereafter, the prevailing charge levels recognized may notbe increased in the aggregate over the previous fiscalyear’s prevailing charge levels, except as justified by eco-nomic indexes reflecting changes in the costs of the prac-tice of physicians and in their earning levels.
10The claim is a request for payment that may Cover
several services.
1me net assignment rate is the number of assignedcfaims expressed as a percentage of claims received, omit-ting cfaims from hospital-based physicians and grouppractice prepayment plans, which are considered assignedby definition.
420
Year
1971 . . . . . . . . .1972 . . . . . . . . .1973 . . . . . . . . .1974 . . . . . . . . .1975 . . . . . . . . .
Total claimsreceived on
Form SSA-1490(in millions
46.651.057.068.380.0
Netassignment
rate
58.554.952.751.951.8
It has been speculated that increases over theyears in the perc~ntage of claims reduced and thepercentage of charges reduced are significant fac-tors in explaining the decrease in the assignmentrate. Data from carrier reports on the amount ofreductio< on assigned and unassigned claims areavailable beginning with 1971 and are presented intable 14.
The percentage of claims and the percentageof charges reduced have been increasing for bothassigned and unassigned claims. A higher percen-tage of unassigned claims were reduced each yearthan of assigned claims. The percentage of chargesthat were reduced each year is, however, similar forboth types of claims.
The amount reduced per approved claim, alsoshown in table 14, is related to the size of the claim,The average unassigned claim in 1975 had $82 incovered charges; the corresponding figure was $69for assigned claims. Consequendy, although thepercentage of the charges reduced for assigned andunassigned claims was virtually equal that year (17.8percent and 17.7 percent, respectively), the actualdollar amounts reduced per claim were $12.35 and$14.51, respectively.
It is interesting to gauge the impact of Medi-care SMI payments by comparing them with aver-age enrollee outlays for covered SMI, services (table15). The figures shown are only rough estimatesfor the purposes of this comparison since Medicarereimbursements shown in table 15 are based on theyear in which the claim was appro?ed rather thanthe year in which the charges were incurred. (Dataon reimbursements for the year in which thecharges were incurred are not sufficiently completefor analytic purposes until 24 months after theclose of the year.) Nonetheless, enrollee outlays inpremiums, deductibles, coinsurance amounts, andthe amounts for which enrollees are potentially lia-ble because of reductions in charges are considera-ble in comparison with SMI reimbursements. Dataindicate that total enrollee outlay is approximately130 percent of SMI reimbursements.

TABLE 14.—REASONABLE CHARGE DETERMINATION ON SMICLAIMS ASSIGNED AND UNASSIGNED: PERSONS AGED 65AND OVER AND DISABLED UNDER AGE 65, CALENDAR YEARS1971“75
Year
11971 . . . . . . . . . . .1972 . . . . . . . . . . .
I 1973 . . . . . . . . . . .1974 . . . . . . . . . . .1975 . . . . . . . . . . .
1971 . . . . . . . . . . .1972 . . . . . . . . . . .1973 . . . . . . . . . . .1974 . . . . . . . . . . .1975 . . . . . . . . . . .
NumberofCovered
claims chargesapproved
(in thousands)(inmillions)
+ a:=:m
25,91926,79828,37633,29539,218
AssignedSMIclaims 1
$1,570.91,629.71,751.42,194.12,716.0
44.5 11.1 $6.7147.5 10.9 6.6655.6 11.9 7.3364.5 14.3 9.4270.8 17.8 12.35
UnassignedSMI claimsl
17,95521,28624,69130,49236,182
$1,348.01,607.81,886.02,400.52,973.2 1
57.659.566.472.777.4 1
12.5 $9.3712.0 9.0712.6 9.6614.7 11.5517.7 14.51
1Basedon claimsreceivedon forms SSA-1490.
TABLE 15.—AMOUNT OF MEDICARE SMI REIMBURSEMENTAND ESTIMATED ENROLLEE PAYMENTS: PERSONS AGED 65AND OVER AND DISABLED UNDER AGE 65, CALENDAR YEARS1971-74
Medicare SMI Estimated average payments by enrollees forreimbursement SMI covered services
Total AnnualAmountin
Yearz (inPer
Total SMIDeductible Coinsurance excessof
thousands)enrollee amount3 amount
premiumcharge
screens4
1971 . . . . . . . . . $1,995,126 $100 $136 $65.40 $37.50 $25 $ 8.44
1972 . . . . . . . . . 2,182,288 108 142 68.40 37.50 27 9.58
1973 . . . . . . . . . 2,391,402 106 154 71.90 45.00 27 10.571974 . . . . . . . . . 3,123,218 135 ‘ 172 78.00 45.00 34 15.20
1Reimbursementsrepresentpayments to or on behalf of beneficiary-generally 80 percent of allowed charges,once thebeneficiq has satisfied the deductible in the current year.
2Based on year in which earner approved bill for payment.3E5timates based on Cument Medicine SuweY data, which show that about 50 percent of enrollees met deductible ~d ti d
tbe average amount expended by the remainder was about one-hal’f the deductible amount.4Unassignedclaims only.
421
I MEDICARE’S ROLE INPERSONAL HEALTH CARESPENDING FOR THE AGED
Total Per Capita Expenditures
The decade 1965-75 was a period marked byhigh inflation, with medical care prices rising fasterthan the average for all goods and services. TheSocial Security Administration’s series of reports onnational health expenditures show that per capitapersonal health care spending after Medicare andMedicaid went into effect increased at a rate consi-derably greater than in the years before. Duringthe period 1960-65 the per capita personal healthcare bill increased about 7 percent annually. In-creases in the decade after Medicare and Medicaidbegan were appreciably higher than 7 percent andwere dramatically high for the aged—20.2 percentin fiscal year 1967 and 20.9 percent in fiscal year1968 (table 16). Annual rates of increase for theaged leveled off after the first 2 years of Medicare,and, as the figures for later years indicate, increasesfor the aged were more in line with those for thepopulation under age 65. For the aged, personalhealth care spending in fiscal year 197’5 was esti-mated at $1,360 per person—about three times thefigure of $445 for fiscal year 1966, the year justpreceding Medicare’s beginnings.
I Expenditures by Type ofService
Much of the rise in the personal health care billin the past decade can be attributed to the costs ofinstitutional services, which consume the majorshare of health care spending for the aged. In fiscalyear 1966, hospital services made up 39.9 percentof the total per capita health care bdl and nursing-home care represented 15.4 percent of the total(table 17).
In the period after Medicare and. Medicaidbegan, hospital and nursing-home care consumedan increasing proportion of per capita health careexpenditures, reaching an estimated 44.3 percentand 25.2 percent, respectively, in fiscal year 1975.For hospital care in 1975, expenditures were nearlythree and a half times the amount spent in 1966;for nursing-home care they were five times higher.Expenditures for no other type of service for theaged rose at such high rates, as indicated by thefigures that follow for the ratio of the per capitaamount spent in fiscal year 1975 to the figure forfiscal year 1966.
0
Type Ratio ofexpenditure 197$ to 1966
Total ................................................ 3.1
Hospital care .......................................... 3.4Physicians’ services ................................. 2.4Dentists’ services ..................................... 1.8Other professional services .................... 1.7Drugs and drug sundries ....................... 1,9Eyeglasses and appliances .................... 1.5Nursing-home care ................................ 5.0Other health services ............................. 1.9
Sources of Funds—Public andPrivate
As intended, the 1965 Federal health legisla-tion had the effect of shifting a large portion of theaged’s health care bill from the private to the publicsector. Table 18 shows the division between privateand public funds, by type of service, for fiscal years1966, 1967, and 1975. In the 12-month period justpreceding the start of Medicare and Medicaid, 70percent of personal health care spending for theaged came from private sources and 30 percentcame from the public sector. In the following 12months, private spending for the aged declined to43.6 percent and public spending rose to .56.4 per-cent. In 1975, public spending for the aged was es-timated at 65.6 percent of the total. The figures intable 18 indicate that increased public spendingbetween 1967 and 1975 was greatest for physicians’and other professional services.
Public Sources of Financing forthe Aged
Medicare.—Of the total public spending for theaged for personal health care in 1967-75, Medicareaccounted for approximately 2 out of 3 dollars. Inthe first year of the program. Medicare funded anestimated 31.6 percent of the total expenditure,After the first year the estimated share was higher,ranging from 38.4 percent to 43.9 percent. Table19 gives the estimated percentage of the total billthat came from Medicare, by type of service, 1967-75.
As expected, the proportions funded by Medi-care were highest for hospital and physicians’ serv-ices. The figures also show that Medicare’s impacton total SNF expenditure for the aged decreasedsharply after 1968, reaching a low of 3.0 percent in1974. Since the figures in table 19 represent outlaysfrom Medicare trust funds, it should be recalled
1-422

that the SMI trust fund is financed partly by enroll- ans Administration—account for 1 out of 3 publicee premiums. dollars expended for the aged. Figure 1 illustrates
Medicaid and other public programs.—Medi- the relative importance in 1975 of Medicare incaid and other public programs-primarily, State comparison with Medicaid and other public pro-and local hospital programs and those of the Veter- grams for hospitals, physicians,and SNF services.
TABLE 16.—ESTIMATED PER CAPITA PERSONAL HEALTHCARE EXPENDITURES: PERSONS UNDER AGE 65 AND AGED
~ 65 AND OVER, FISCAL YEARS 1966-75
Percent increase over the Drevious yearPer capita expenditure
Underage65
65 ~andover
$445535647735828926
1,0341,0811,1811,360
65andover
—
20.220.913.612.711.711.84.59.3
15.2
Underage65
Year All
ages
Allages
1966 . . . . . . . . . . . . . .1967 . . . . . . . . . . . . . .1968 . . . . . . . . . . . . . .1969 . . . . . . . . . . . . . .1970 . . . . . . . . . . . . . .1971 . . . . . . . . . . . . . .1972 . . . . . . . . . . . . . .1973 . . . . . . . . . . . . . .197419751””””””””””””””. . . . . . . . . . . . . .
1Preliminaryestimates.
$182205229257290321353387420476
$155172185206233255278309333375
—
11.07.6
11.413.1
9.49.0
11.27.8
12.6
—
12.611.712.212.810.710.0
9.68.5
13.3
TABLE 17.—ESTIMATED PER CAPITA PERSONAL HEALTHCARE EXPENDITURES BY TYPE OF EXPENDITURE: PERSONSAGED 65 AND OVER, FISCAL YEARS 1966, 1967,1975
.1)
Percent
1966 7 19
Amount
1!
Amount
$535
224109
1413681785
6
Amount
$445
178901312621568
7
Type of expenditure PercentPercent
100.0 $1,360 100.0
44.316.0
1.81.58.71.7
25.2.9
423
Total . . . . . . . . . . . . . . . . . . . .
Hospital care . . . . . . . . . . . . . . . . . . .Physicians’ services . . . . . . . . . . . . . .Dentists’ services . . . . . . . . . . . . . . . .Other professional services. . . . . . . . .Drug and drug sundries . . . . . . . . . . .Eyeglasses and appliances. . . . . . . . . .Nursing home care . . . . . . . . . . ..-. . .Other health services.......,.. . . . .
1Preliminaryestimates.
100.0
42.020.4
2.62.4
12.63.3
15.91.1
603218
2420
11823
34213
39.920.1
2.92.6
14.03.5
15.41.6

~ TABLE 18.—PERCENTAGE DISTRIBUTION OF ESTIMATED PERSONAL HEALTH CAREEXPENDITURES BY SOURCE OF FUNDS AND TYPE OF EXPENDITURE: PERSONS AGED 65—
AND OVER, FISCAL YEARS 1966,1967, 1975
Type of expenditure
Total . . . . . . . . . . . . . . . . . . . . . . . . . . . . .
Hospital care . . . . . . . . . . . . . . . . . . . . . . . . . . . .Physicians’ services. . . . . . . . . . . . . . . . . . . . . . . .Dentists’ services . . . . . . . . . . . . . . . . . . . . . . . . .Other professional services. . . . . . . . . . . . . . . . . .Drugs and drug sundries . . . . . . . . . . . . . . . . . . . .Eyeglasses and appliances. . . . . . . . . . . . . . . . . . .Nursing home cadre. . . . . . . . . . . . . . . . . . . . . . . .Other health services . . . . . . . . . . . . . . . . . . . . . .
lPreliminary estimates.
.—Total
100.0
100.0100.0100.0100.0100.0100.0100.0100.0
1966
Private
70.2
51.394.095,096.792.398.658.311.9
Public
29.8
48.76.05.03.37.71.4
41.788.1
Total
100.0
100.0100.0100.0100.0100.0100.O100.0100.0
1967
Private
43.6
8.763.295.081.991.099.449.214.9
Public
56.4
91.336.3
5,018.1
9.0.6
50.885;1
Total
100.0
100.0100.0100.0100.0100.0100.0100.0100.0
19751
Private
34.4
10:240.992.949.886.998.446.7
8.1
Public
65,6
89.859.1 ‘
7.150.213.1
1.653.391.9

Figure 1. Per capita personal health care expenditures for the aged, by source of fundsand type of expenditures, f iscal years 1966 and 1975
$603
$600 -
500 –
400 –
300 –
200 ‘-
100 -
0 .
1966 1975
$218
1966 1975
m ‘rivateMedicare
m Other public
$342
1966 1975
$197
1966 1975
Hospitals Physicians SNFS All other

.-
TABLE 19.—ESTIMATED PERCENTAGE OF PERSONAL HEALTHCARE EXPENDITURES FUNDED BY MEDICARE1 BY TYPE OFEXPENDITURE: PERSONS AGED 65 AND OVER, FISCAL YEARS1967-75
Year
1967 .......................1968 .......................1969 .......................1970 .......................1971 .......................
1972 .......................1973 .......................1974 .......................19752.......................
Allservices
31.641.543.941.139.338.6
39.138.442.0
Hospitalcare
57.562.966.563.963.663.3
67.866.972.2
Physicians’services
31.456.460.057.254.652.750.948.154.1
Otherprofessional
services
8.821.830.230.924.021.421.224.238.0
Nursinghomecare
6.115.814.1
9.25.03.43.13.03.1
!Paidfromtmst funds }vhichinclude premiumpayments forSMI.
has risen steadily since that period, The data are
‘Preliminary estimates.
For hos~ital services in 1975, Medicare funded72percent of the bill and Medicaid and other pub-lic programs were responsible for 18 percent. Forphysicians’ services, Medicare’s share was 54 per-cent and the share for Medictid and other publicprograms was 5 percent. For SNF services, howev-er, the share from Medicaid and other public pro-grams was far greater tian that from Medicare (50percent and 3 percent, respectively).
Figure 1 also suggests the reason for the oftenobserved paradox: that the aged pay more now fortheir health care than they dld before Medicare andMedicaid went into effect. The dramatic increase intotal health care spending between 1966 and 1975has resulted in greater expenditure by the privatesector in terms of dollars, despite its declining shareof total expenditures. me figure makes it clear, forexample, that the 41 percent paid privately forphysicians’ services in 1975 amounted to a higherbill than the 94 percent paid privately in 1966.
Private Health Insurance
Private health insurance fills in some of thegaps in health care protection for the aged. TheSocial Security Administration studies of privatehealth insurance expendhures show that privateinsurance coverage for the aged in the first fullfiscal year of Medicare dropped sharply, but thenumber and percentage buying health insurance
426
also significant in that a relatively small proportionof the aged have private health insurance for serv-ices not covered by Medicare such as prescribeddrugs. More than half, however, have private cover-age for hospital care and for physicians’ services--that is, for the types of services covered by Medi.care. These private policies act primarily as supple-ments to Medicare and generally cover some por-tion of the deductibles and coinsurance requiredunder Medicare. Not unexpectedly, data from theCurrent Medicare Survey show that the incidenceof private insurance to pick up the cost-sharingexpense rises with income. The following tabulationgives the percentage of the aged population withprivate health insurance, as of December 31, 1974.
Percent ofType of coverage aged population
Hospital care ..............................#,,,,, .,,, 57.9Physicians’ services:
Surgical services ................................ 54,0Inhospital visits ................................. 40.3X-ray andlaboratory examinations .31.7OfKceand home visits .,....................35.5
Dentdcare .............................................. 1,9Prescription drugs ................................ 16,9Private-duty nursing ............................ 16.8Visiting-nursing services ...................... 21.0Nursing-home care .............................. 15.8

TABLE 20.—ESTIMATED PER CAPITA PERSONAL HEALTHCARE EXPENDITURES BY DIRECT PAYMENTS AND THIRDPARTY PAYMENTS: PERSONS AGED 65 AND OVER, FISCALYEARS 1966-75
Year
1966 ....1967 ....1968 ....1969 ....1970 ....1971 ....1972 ....1973 ....1974 ....19751....
1966 ....1967 ....1968 ....1969 ....1970 ....1971 ...01972 ....1973 ....1974 ....19751....——
Third party payments
DirectTotal
Private Philanthropypayments Total health Government and
insurance industry
I
$445.25535.03646.65735.19828.31925.98
1,033.511,081.351,181.461,360.16
100.0100.0100.0100.0100.0100.0100.0100.0100.0100.0
$236.72198.01177.90206.02270.20316.78367.40357.16396.90389.88
53.237.027.528.032.634.335.633.033.228.7
Per capita amount
$208.52337.03468.75529.17558.11609:20666.11724.19789.56970.28
$70.7131.3834.4239.4245.5449.67
53.3358.8166.3573.44
Percentage distribution
46.863.072.572.067.465.864.567.066.871.3
15.95.95.35.45.55.45.25.45.65.4
$132.89301.59430.45485.75508.50555.15608.30660.69718.20891.63
29.856.466.666.161.460.058.961.160.865.6
$4.924.053.874.004.064.384.494.705.015.22
1.1.8.6.5.5.5.4.4.4.4
lPreliminary estimates.
included to limit the program’s ~ability and makeconsumers cost-conscious-that is, to act as a re-straint to unnecessary utilization. Yet Medicaid paysthe deductible and coinsurance payments for 13percent of the aged—those in the lowest incomegroup-and private health insurance, which riseswith income, pays them (or some portion of them)for another 50 percent. Thus, the data indicatethat, at most, about 30 percent of the aged pay thefull cost-sharing amounts out of pocket. And thosein between the poorest and the best-off are mostlikely to have to meet the full cost-sharing burdenout-of-pocket.
Under Medicare, cost-sharing provisions were In spite of the relatively high percentage of theelderly with private health insurance, paymentsmade’by these”insurers during this decade-met onlya small portion of the total expenditure for theaged. Table 20 shows the portions paid by third-party payers including government and private in-surers and the portions paid directly. Private insur-ance payments were in the range of 5-6 percent ofthetotal bill in 1967-75.
Direct PaymentsPayments for services that came directly out of
the aged person’s pocket (such as drugs, routine
427

dental and eye care, other preventive services, nurs-ing-home care, and coinsurance payments, deducti-bles, and unassigned physicians’ charges in excessof the carriers’ “reasonable charge” determinations)came to 29 percent of the total bti or $390 per per-son in fiscal year 1975, in contrast to 53 percent or$237 per person in fiscal year 1966 (see figure 2).
In inflationary times one gauge of the effect onthe aged of such increases in direct payments forhealth care is the comparison with the retired-worker cash benefit in the social security program.The average monthly benefit check for retiredworkers was $83.92 in December 1965 and $188.20in December 1974. Direct payments for health carein fiscal year 1966 averaged 24 percent of the aver-age retired worker’s social security check; directpayments in fiscal year 1975 averaged 17 percent ofthat benefit.
The beneficiaries pay premiums for health in-surance, in addition to direct payments. Premiumsfor private health insuranc~an estimated 6-8 per-cent of the average social security benefit in fiscalyear 1966-together with direct payments wotidhave come to an. estimated 30-32 percent of theaverage social security cash benefit. Premiums forSMI and private health insurance, estimated tohave been 5-7 percent of the average social securitybenefit in 1975, would, if added to direct payments,come to an estimated 22-24 percent of the averagesocial security benefit-a smaller proportion thanthat estimated for 1966 but still a not inconsidera-ble portion.
The social security program was intended,however, to replace only a portion of preretirementearnings. Beneficiaries generally derive additionalincome from savings and other assets,earnings, andother retirement plans. Yet according to the 1968Social Security Survey of the Aged,lz for 51 percentof beneficiary couples and 65 percent of single ben-eficiaries, social security benefits constituted morethan half of their total income. For these persons inpartidar, the coverage by Medicare of the majorportion of large medical care bfls allows them toconserve their limited assets, which they wodd oth-erwise be forced to expend for essential health care.However, direct payments along with premiums forSMI and perhaps private health insurance are verylikely to continue to put a considerable strain ontheir income.
lzsee Lenore E. Bixby et al., Demographic and Eco-nomic Characteristics of the Aged: 1968 Social SecuritySurvey (ORS ResearchReport No. 45), Officeof Researchand Statistics,SocialSecurityAdministration,1975.428
TECHNICAL NOTE
With the implementation of Medicare, a statisti-cal system was designed to obtain systematic andcontinuous information about the enrolled popula-tion, the providers of services, the use of healthcare services, and the cost incurred, The primaryobjective in the design of the statisticalsystem wasto provide data to measure and evaluate the pro-gram. Additionally, it was perceived that Medicarewould create an opportunity for obtaining national
‘statistics of an unprecedented breadth and scoperelating to the health care of individuals. Conse-quently, the design of the statisticalsystem includedfurther objectives of generating data for research inthe field of health care services, for identifyingunmet needs and program gaps, and for measuringthe impact of a large-scale health insurance pro-gram.
The benefit payment system is the basis forobtaining inforrnation for the statisticalsystem. Theenrollment process provides information about thecharacteristics of the Medicare population. Theapplications by which hospitals, skilled nursing facil-ities, home health agencies, and independent labo-ratories indicate their desire to participate in Medi-care are the basis for data on the characteristics ofthe providers. Claims provide user data, includingthe patient’s condition, the kinds of services used,and amounts of charges and reimbursements. Toexpand the scope of information and to determineutilization trends, a monthly interview survey ofbeneficiaries, the Current Medicare Survey (CMS)provides current estimates of covered and noncov-ered health care services.
The statistical system provides data for pub-lished reports on a continuing basis, including an-nual series of tabulations and special analytic re-ports. The Division of Health Insurance Studies of .the Office of Research and Statistics also conductsresearch related to fhe total health care system.Among the continuing studies are those on nationalhealth expenditures and private health insurancecoverage.
Information in this review is drawn primarilyfrom Office of Research and Statistics publicationsas well as from several as yet unpublished tabula-tions generated from the Medicare statistical sys-tem- In addition, reports from the Bureau ofHeaIth Insurance, summarizing SMI carrier “rea-sonable charge” determinations, were used in thediscussion on assignment and reduction rates.
The following reports and articles from theDivision of Health Insurance Studies are cited asreferences and provide a more detailed and com-plete account of certain areas covered in this re-view. If the article is part of a continuing series onthe subject, the latest one is cited here.

Figure 2, Per capita personal health care expenditures for the aged, by source of funds, fiscal years 1966-75
1,400 L
1,200
1,000
800
600
400
200
0
= Medicare
- Other Government~Td Private 1nsurance
Public
Private
—
1966 1967 1968 1969 1970 1971 1972 1973 1974 1975(Pre-Medicare)

ENROLLMENT ANDELIGIBILITY
Helen C. Chase, “Use of Me&cd Services by Disa-bility Beneficiaries, Jtiy-December 1971: CurrentMedicare Survey Report (CMS-29), Office of Re-search and Statistics, December 30, 1974.
Office of Research and Statistics, Medicare: HeaJthInsurance for the Aged, 1966, Section 2: Enroll-ment, 1969 and annual updates for 1967-73.
Martin Rtither, “Medicare, Number of Persons In-~~:, July 1, 1973; Social Bulletin, June
USE OF SERVICES
George S. Chtiis, “Utilization of Short-Stay Hospi-tals Under Medicare, 1968-7 1,“ He4th InsuranceStatistics (HI-70), Office of Research and Statistics,June 24, 1975.
Charles R. Fisher, “Health Insurance for the Aged:Hospital and Skilled Nursing Facility Admissions,Fiscal Year 1973,” Health Insurance Statistics (HI-64), Office of Research and Statistics, December 23,1974.
Robert M. Gibson and Mildred Corbin, “InpatientHospital Utilization, 1969/’ Current Medicare Sur-vey Repoit (CMS-25), April 2, 1973.
Marian Gornick, “Medicare Patients: Regional Dif-ferences in Length of Hospital Stays, 1969-71,” Se-a-d Security Bulletin, Jtiy 1975.
Marian Gornick, “Persons Meeting the SMI Deduc-tible, 1966-71 ,“ Health Insurance Statistics (HI-57),Office of Research and Statistics, April 15, 1974.
Lillian Guralnick, “Short-Stay Hospital DischargeDiagnoses for Medicare Patients, 1967;’ HealthInsurance Statistics (HI-66), Office of Research andStatistics, March 14, 1975.
Office of Research and Statistics, Medicare: HeaJthInsurance for the Aged, 1967, Section 1: Summary,1971, annual updates for 1968 and 1969; and thepreliminary updates for 1970 and 1971.
Office of Research and Statistics, Medicare: HealthInsurance for the Aged, 1967, Section 4.1: Short-Stay Hospital Utilization, 1975 and preliminaryupdates for 1968-71.
Office of Research and Statistics, Medicare: HealthInsurance for the Aged, 1971: Length of Stay by
430
Diagnosis and Surgical Procedures (Washington:U.S. Government Printing Office, 1972).
Julian Pettengill, “Trends in Hospital Use by theAged: Social Security Bulletin, July 1972.
Paula A. Piro and Theodore Lutins, “Utilizationand Reimbursement under Medicare for Personswho Died in 1967 and 1968,” Healfi Insurance Sta-tistics (HI-51), Office of Research and Statistics,October 17, 1973.
REIMBURSEMENTS ANDCOST-SHARING
Evelyn Peel and Jack Scharff, “Impact of Cost-Sharing in Use of Ambulatory Services under Medi-care; Current Medicare Survey Report (CMS-27),Office of Research and Statistics, October 10, 1973.
Penelope L. Pine, “Supplementary Medical Insur-ance: 1967-71 Trends,” Current Medicare SurveyReport (CMS-26), Office of Research and Statistics,August 15, 1973.
Charles B. Waldhauser, “Assignment Rates for SMIClaims, Calendar Year 1973: Health InsuranceStatistics (HI-63), Office of Research and Statistics,December 5, 1974.
MEDICARE AND TOTALHEALTH CARE SPENDING FORAGED
Barbara S. Cooper, Nancy L. Worthington, andMary F. McGee, Compendium of National HealthExpenditures Data, Office of Research and Statis-tics, January 1976.
Marjorie Smith Mueller and Robert M, Gibson,“Age Differences in Health Care Spending, FiscalYear 1975: Social Security Bulletin, June 1976.
Marjorie Smith Mueller and Robert M. Gibson,“National Health Expenditures, Fiscal Year 1975~SociA Security Bulletin, February 1976.
Marjorie Smith Mueller and Paula A. pit-o, “PrivateHealth Insurance in 1974: A Review of Coverage,Enrollment, and Financial Experience: Social Secu-n“ty Bulletin, March 1976.
Dorothy P. Rice and Barbara S. Cooper, “MedicalCare Outlays for Aged and Non-aged Persons,1966-68: SociA Security Bulletin, September 1969

TECHNICAL ASSISTANCE IN DEVELOPING DATA SYSTEMS (ORHOW TO FIND A THOUSAND THINGS THAT WON’T WORK]
Mr. Theodore R. Ervin, Deputy Director, Michigan Department of Public Health.. .Michigan
INTRODUCTION
A friend of mine in another governmentalagency, who was responsible for letting many tech-nical assistance contracts over the last 30 years, wasbeing questioned by an auditor about the high fail-ure rate. Finally, exasperated, he said, “What if Ihave had a thousand contracts go bad? Nothing’swasted. I’ve just found a thousand things that won’twork.” When we think together about technical as-sistance in developing data systems, I suggest wekeep our expectations modest and our time framelong, because we can be sure that we will have somemisses along with some btils eyes.
There are, however, some ideas we can keep inmind which may help improve the availability, qual-ity, and impact of such assistance, and also mini-mize failures. In the next few minutes, I’ll discusssome of these notions, trying to suggest what we’might try to do to gain some ground. From a Statehealth agency administrative viewpoint, I identifysources for technical assistance as 1) managementconsulting firms, 2) universities, such as Schools ofPublic Health, 3) central governmental pools, suchas conglomerate data processing centers, 4) theFederal government, and 5) the agency staff. Inconsidering these sources of technical assistance,there are a number of questions we might keep inmind, such as: Perspective: Does personnel fromthis source understand the need?; Competency: Isassistance from this source technically qualified todo the job-what types of help are available—re-search or bench statisticians? systems analysts?programmers? Availability: Is technical assistancereadily available from this source; particularly, doesit fit the needs of the Cooperative System, given thecurrent stage of development? Cost: What is thecost of technical assistance from this source?
Management Consulting Firms
To begin with, let’s look at management con-sulting firms. Considering a number of studiesmade in Michigan, some have contributed to man-agement; most have fulfilled minimum contract
. requirements; a few have ballooned a new contractat the end; almost none have substantially ad-dressed statistical issues. As a case in point, a fewyears ago, we put together a. package made up ofFederal funds from the Cooperative Health Statis-
tics System; Federal funds from
Lansing,
Title XIX; andState funds to design a system for handling healthfacilities data. The documentation is elaborate onconsolidation of input forms and automatic issuanceof licenses, but little is said about the design of sta-tistics for planning and evaluation. However, wewere persistent, and currently are able to by-prod-uct the needed data from this. management system.Rule of thumb for statistical operations should be totry to capitalize on such studies so the managementprocess spins off the statistical data.
In the State health agencies, the primary tasksand the firms employed lean toward managementrecord systems and data processing, with little statis-tical competence, so there must be an explicit effort toadd this emphasis. Success is most likely if we canprovide some financial support.
Of course, technical assistance from manage-ment firms can be expensive. As the Vice-presidentof a major industry in Michigan recently said,“Most often, when you get these firms in, you tellthem the problem, tell them the solutions, and thenthey feed it back to you with a little pizzaz for ahundred thousand or so.” Perhaps we can rational-ize that the organized pizzaz is worth the price.
In any event, those of us interested in theCooperative System need to be alert to the opportu-nity to capture statistics with what may be a relative-ly small incremental investment.
There may be particular potentials in thosecomponents of the Cooperative System where thereare substantial, mandated governmental responsibil-ities—for example, long term care. Under the provi-sions of Title XIX, each State is carrying out evalu-ation of a significant proportion of patients in nurs-ing homes. How many States have well-organized,monitored activities? Is this a chance for the Coop-erative System to step in as a catalyst, stimulatingimproved management while at the same time es-tablishing benchmark data on long term care?
While I do not suggest that consulting firms beconsidered the first resort by any means, when theyare used perhaps the most crucial thing is to knowexactly what we want, and to insist on getting it. Ifwe don’t know the question, then any old answerwill do.
UniversitiesTurn now to universities. For a long time, I
have believed that in order to exercise our steward-
431

ship for public pro~ams, those in governmentalagencies need some of the sophisticated health sta-tistics and other competencies resident in universi-ty settings, and those in universities should haveaccess to the health agenaes as field laboratories.
There are some steps we can take to build bet-ter bridges. We can begin by making a more ngor-ous attempt to arrive at paired definitions of statisti-cal problems in the Cooperative System and parallelresearch interests and competencies in universities.One example of the workabtity of this approach isthe paper Dr. Cornell, of the School of PublicHealth, University of Michigan, delivered earlier inthis Conference on the Michigan experience to datein the ambtiatory medical care survey. In this in-stance, we went to the school early in the designstage. Cotid we build a project which would takeadvantage of data on Michigan physicians alreadyin the national sample? The resdt was a modestsubcontract with the university, which has carriedout quality technical work.
Another example is a project in the develop-ment and testing of the ambulatory care data set ina number of family practice residency settings. Inthis instance, we went to the College of HumanMedicine, Michigan State University, which has in-terests in primary care and community medicine.The resea~ch and development on deriving usefulambulatory care statistics from record systems fitwell with the interests of a young sociologist. Theresult, again, is economical technical development.In both of these instances, those involved also aregaining insights related to the overall objectives andactivities of the Cooperative System, so we are de-veloping some long run technical advisers. Symbolicof the type of “cooperation” we hope to stimulate,the administration in both of these universitiesagreed that they would forego applying indirectcost rates to these projects. If you have ever en-countered rigid university policies on indirect, you’llunderstand why we consider this concession asnearly spectacular.
Many of us in State and local health agencieshave for a number of years complained that thebiostatisticians being turned out by Schools of Pub-lic Health seem to have a micro-research focus, andare not conversant with health services statistics.Rather than just complain, isn’t it time that wemade a more conscious effort to buy-in with somefunding for advanced statistical field studies, espe-aally analytical work in the setting of the Coopera-tive System.
We also need to work toward the day whenuniversity staff will get as much credit for outreachin applied activities as they do for teaching and re-search.
We must avoid if we can the type of relation-ship which can be disheartening to the agency staff,
432
that is, entering into a joint project only to find thatthe agency’s specific question is overlooked or ad-dressed only in a marginal manner, while the re-searcher follows the threads of one more simulationmodel and his graduate students write more termpapers.
Central Governmental Pools
In many State settings, especially in the last tenor fifteen years, we have experienced the growth ofcentral governmental technical pools featuring bothhardware and software, and advertised as the smallagency answer to big technology. For the most part,such conglomerates are built on the basis of effi-ciency criteria-more economical use of peripher-als, more power, improved access to a stable of EDPtalents, running the gamut from systems designersto forms specialists-usually excluding statisticians,Some of these gains can be documented, and maybe particularly appropriate in handling regulatoryor payment systems. However, one missing element,difficult to measure and easy to discount, is the val-ue of committed staff. Paul Gray, who heads upQuantitative Business Analysis for the University ofCalifornia, recently summarized this viewpoint intrying to use a central programming group.* Graysays:
“Once a programmer is assigned, the user mustfirst spend his time trying to educate the pro-grammer to understand the problem to becoded. This is critical; the programmer, has tolearn the user’s technolo~, which takes time,Furthermore, whereas the user has a sense ofurgency about the project, the programmerdoes not. After all, this is just one more job tobe done. When the programmer finishes it,there will be another. (If work is slack or theprogrammer is marginal, the incentive is not tofinish it because that may mean a pink slip,)”
Gray continues: “What is to be done? What canbe done? The answer is simple. Hire your ownprogrammers to work directly for you.” Theresult, he says, are technicians who have loyaltyto the group with which they work and interestin the problems because they work in a prob-lem oriented, not a programming-oriented en-vironment.
However, in many State settings, Gray’s solu-tion may not be practical today. In order to get sta-tistics on an economically feasible basis, it is oftenessential that we at least produce masterfiles fromthe management data, and collaborate with techni-d staffs in whatever data centers are assigned to
*Interfaces, Vol. 6, N. 2, Feb. 1976, pp. 15-16,

serve us. Once such files are created, it is possible todevelop more flexible options for producing reportsand carrying out analytical work.
In Michigan, our Cooperative System would beimpossible without terminal access to a universitycomputer network, including software built in uni-versity settings, and university technical assistance sowe can maintain some core staff competency.
In relatively large States, I remain convincedthat we would be better off to develop integratedtechnical teams-establishing linked communica-tions from program staff to statisticians, statisticiansto systems designers; designers to programmers;and programmers to the computer. But if the for-tunes of overall State organization of data centerspreclude this option, then networking and technicalassistance from specialized EDP centers concernedwith statistical development appears to be a worka-ble alternative.
Federal Government
Let’s turn now to the type of technical assist-ance we can rely on from the Federal government,particularly the National Center for Health Statis-tics (NCHS). You may have read about Michigan’sproblem with PBB (polybrominated biphenyls) afire retardant being accidentally mixed with cattlefeed - a situation which has led to one calamity af-ter another. A few months ago, in a meeting withsome farmers and local health officials on this prob-lem, we realized that we had been guilty of a pri-mary failure in communications; a failure to listen.Our written information and our actions for largepart had been tidy, scientific, and above reproach,but we had responded to the problem on ourterms, rather than shaping our advice and counselto respond to the specific questions, the specificneeds, and specific perceptions of those most inti-mately affected. We had overlooked the old com-munications rule which says that reality is in the eyeof the beholder.
It has seemed to many of us that Federal tech-nical assistance in the Cooperative System may suf-fer somewhat from tils problem. For example, inthe health occupations systems in the States, manyof us have not found time to do much useful ana-lytical work on data already collected, and yet fromthe National level comes the repeated dictum thatregardless of burgeoning local resistance, and re-gardless of quality control problems, we must col-lect all of the data items on nearly all of the profes-sions each year.
We are anxious to work with our Federal tech-nical associates in the NCHS and elsewhere,. but be-lieve that the beginning point ought to be what ispractical for the States to do; what can be done tocement foundations in place; carefully balancing
the enthusiasm to collect data against our capabilityfor quality control; our competency in analysis; andour demonstration of constructive use of what isbeing collected. Without such use at the local andState levels, we cannot sustain a Cooperative Sys-tem. The remarks earlier in this Conference by TedWoolsey, former director of NCHS, urging moreimaginative analytical use of what we already haverepresent sound and sage advice.
Another example of Federal technical directionwhich may be inconsistent with what States can ac-tually do relates to the notion of creating enclaveswhere selected data can be protected for only statis-tical purposes. If we are piggybacking on manage-ment systems for the data, the State manager doesnot have the legal authority to wear two hats. Whenhomes for the aged are licensed under rules whichforbid the delivery of certain types of treatment ona routine basis, the regulatory chief may not evenbe able to tolerate asking questions about such ther-apy as part of the survey, because by doing so heintimates that he may have granted licensure illegal-ly. This requires a technical sorting out of issueswhich may have to be treated as separate studies,rather than as an integral part of Cooperative Sys-tem components.
Everything we have seen. happen so far sup-ports the resolve a small group of us had when wefiled the only minority report in the committee toEvaluate the National Center for Health Statistics.At that time, we urged that for the long run, theCooperative System should seek a stable cost shar-ing basis, rather than separate contracts. We ap-plaud the move in this direction made by NCHS’this year, in giving some ten States the opportunityto respond to RFP’s for one coordinated contract,rather than separate contracts for each component.
When we convert the contract mode to a costsharing structure, we will develop a system wheretechnical assistance from the Federal governmentand technical expertise and experience in the Stateswill have an equal foothold, and where we hopeful-ly can build with more success from the bottom up,as well as from the top down, recognizing thattraffic must flow both ways. Meanwhile, perhaps theadmonition to listen a little harder to each other isone we might try to take to heart as we turn thenext corner.
Agency Staff
Finally, let’s think about what we can do toimprove and extend technical assistance from agen-cy staffs at the State and local levels. When welooked at NCHS and other Federal health agenciesin that evaluation a few years ago, we were struckby the fact that there was more statistical expertiseoutside NCHS in the Federal programs than there
433

was within the Center. That same thing can be saidin multiples when we look at the State and locallevels. We are developing technical staff in theStates which can be the nucleus for self-help if weare able to get some seed money and organize our-selves to focus on functions, rather than worryabout whether we are in a planning agency, anoperational agency, a university, or a private institu-tion. The time has passed when we should expect thecitizens who support us to put up with parochialthinking and actions concerned more with organiza-tional boundary lines than with the product. Thetime has passed when we should be classing varioustypes of technical expertise as “good” or “poor” whenwhat we really need to do is recognize that there aredifferences, and from these differences, we can buildstrengths.
The States should develop statistical publica-tions with the quality of the NCHS publications onvital and health statistics, but including greater pro-grammatic emphasis and analysis. The packagingand broader dissemination of our product on aregular basis is in itself an important extender ofavailable technical know-how. We need to experi-ment with some standard formats for such publica-tions. We also need to relate the Cooperative Sys-tem components to other data bases, including theHealth Program Reporting System of the Associa-tion of State and Territorial Health Officials.
The States should develop, on a State or re-gional basis, workshops for producers and users ofhealth statistics based upon some of the courses inthe Applied Statistics Training Institute (ASTI) ofNCHS. This can be considered as a technical assist-ance outreach to our associates on an economicalbasis.
The States need to conscientiously work to util-ize resource where it is already in place, rather thandeveloping duplicate or competing operations. As
well as tapping university talents, our Michiganexperience convinces us that we will be technicalspendthrifts if we do not try to capitalize on themany operating centers, whether those such as theNational Opinion Research Gnter (NORC) in Chi-cago, or the Commission on Professional and Hos-pital Activities (CPHA) in Ann Arbor, or the manyvoluntary and professional agencies.
Last in this list of examples, the Federal gov-ernment and the States should seriously considerdeveloping a basis for interstate sharing of technicaladvice. Recently, the Management Committee ofthe Association of State and Territorial HealthOfficials proposed to the PHS Office of RegionalOperations that an experiment be carried out to setup some regional funding to cover travel costs ofState technical specialists who could be of assistanceto neighboring areas. Among many examples citedwas the potential for highly helpful interchangeamong the ten or so States which may have the firstcoordinated Cooperative System contracts fromNCHS.
Conclusion
In this. discussion, we have reviewed from aState health agency administrative viewpoint someaspects of the availability, competency, perspective,and cost of technical assistance in developing datasystems from management consulting firms, centralState pools, universities, the Federal government,and State and local agencies. We are generally im-pressed with the magnitude of the assistance availa-ble, but think that those of us concerned with theCooperative System need to sharpen our definitionsor requirements so we can avoid finding a thousandmore things that won’t work, and even make someprogress.
434

TRAINING NEEDS OF DATA USERS
Robert E. Mvtin~er. Dr. P.H.. Professor of Public Health, School of Public Health, Uni-, <, .versity of Ha waii, Honolulu, Hawaii
It ~vas impressive to me that the three topicsscheduled for this plenary session~eveloping in-formation systems, training users to work in thoses~stems, and actually applying data—come last in athree-day or~ of methodological, organizational,and data generation considerations. I say this not ina critical sense, for to the contrary I believe it entirelyappropriate that these applications topics becomethe capstone for the majority of preceding presen-tations, for without serious attention to system de-velopment, human development, and through thesethe central issue of data applications, most of theforegoing technologic matter goes for naught.
I have tried to approach tils topic not so muchfrom the perspective of an academician, but fromthe more appropriate perspective of those whohave dealt directly with the informational dilemmasof formal health planning bodies, and of those whocurrently seek improved means of depicting withclarity the health problems and needs of people. Iplan to deal sequentially with three matters. First, Iwill share with you some of my beliefs and feelingsabout current shortcomings in data application inhealth planning and develop a statement of emerg-ing needs. I do so even though I have calculatedthat fully twenty-five percent of the papers alreadypresented deal in some manner or another with theuse of data in health planning and must assumethat their authors have been equally critical. Then,I should like to take a brief look at current trainingin this field and conclude with proposals for im-proved forms of both basic and refresher trainingto better meet data use needs.
1. Data Applications Needs inHealth Planning
A. The history to Date
It is sad commentary to note that the history ofcontemporary health planning can generally be saidto date to 1965 with the enactment of P.L. 89-749which created a novel network of Federally sup-ported State and area-wide health planning bodies.To be sure, there were precursing categorical plan-ning efforts related to facilities, programs and con-cerns. However, none of these pretended to beglobally sufficient to deal with all the ramificationsof that elusive commodity called health. Ensuingyears have displayed a history of achievementwhich, while containing a few significant achieve-
ments, has left much to be desired. To summarizeperhaps too briefly, P.L. 89-749 agencies generallylacked power to effect change and constrained theirefforts to review and comment activities mainly.There was never developed any significant informa-tional base for decision-making, and with the gener-al lack of clear understandings of problems, plan-ning for the sake of planning, with unclear goals,became the order of the day. The result was a clearlack of real plans.
There was demonstrated, during this period ofembryonic planning effort, an extraordinarily lowlevel of data utilization by planning agencies intheir pursuit of the rational planning process.When utilized, data employed by planning agencieshas been generally viewed with suspicion by con-sumers and board members as being somehow bi-ased and not really reflective of the “real world.”Astonishingly, planners of the 89-749 era haveproven generally unaware of the data base whichexisted to support their efforts, while at the sametime being plagued with an absolute scarcity ofneeded data because linkages and access to neededfiles had not been developed. Furthermore, thesimple collection of numbers alone where this oc-cured, experience has now proven, is of little valueand the essential ingredient of data interpretationhas been missing. These deficits were supportedwith the Act providing little or no emphasis orfunding for the data acquisition, retrieval and anal-ysis functions. Consequently, superficial plans weredeveloped, with concentration on process as op-posed to products, and over-simplification of com-plex problems resulting in inconsistent or poorlyrationalized project reviews.
Stemming from these experiences one canimpute a clear need for better definition of specifichealth issues, and the identification of the informa-tion which describes these issues, and the communi-cation of this information to those who need it, sothat plans might be addressed to the health servicesdelivery system as a whole.
What has been lacking is not so much how toperform statistical manipulations, but rather whatto measure and for what purpose, how to interpretand communicate the results of measurements andanalysis into understandable, comprehensible andbelievable portraits of the human condition,” andhow to utilize these insights appropriately in weigh-ing and selecting alternative interventions. This,then, is the heritage which earlier health planningefforts make available to the contemporary scene.
435

B. Today’s Responsibilities and Needs
With the enactment of new health planninglegislation (P.L. 93-641) early in 1975, a new andcomplex set of data and informationaf requirementshave been placed on the newly created network ofhealth systems agencies and State health planningand resource development agencies and these havebeen exha~tively reviewed by prior speakers. Tosummarize, these newer mandates require, amongother things, the representation on the staff ofhealth systems agencies of expertise in “the gather-ing and analysis of data.” Agencies are required toassemble and analyze (from existing sources) dataconcerning the status and (if you don’t mind) deter-minants of the health of specific populations, thestatus of health care delivery systems, the effect ofdelivery systems on the health of populations, thenumbers and types and locations of health re-sources, the patterns of health service utilizationand analyses of environmental and occupationalexposure factors affecting health conditions. Thesefunctions are, in addition to those of State HealthPlanning and Resource Development Agencies,required to coordinate with the Cooperative HealthStatisticsSystem.
It is clear that the assembly, analysi.s,.andinterpreta-tion of existing data emerge as a crlucally importantservice function which is directly supportive of theplan development and implementation responsib~l-ties of such agencies. It is equally clear that there islittle history of accomplishment in these areas, andrelatively few persons are presently trained to assistwith the accomplishment of these ends. To ade-quately staff the more than 200 health systemsagencies and the 54 State agencies across the Na-tion, not only is a “new breed” of information scien-tist needed, but greater appreciation for, and un-derstanding of, quantitative contributions to theplanning process seems essential.
To this point, I have emphasized mainly the statisti-cal side of the picture. It should also be stated thatquantitative analysis is only one of the approachesto planning and improvement of health care.Qualitative and judgmental insights are appropriateand valid. Political understandings are a part of theequation, as are resource capabdity and distribu-tional considerations. The expressed and unex-pressed feelings, -wants and needs of individualpeople in communities are emotion-laden compo-nents in the artful planning process.
We tend, however, to approach health planning inunnecessarily and self-clefeating narrow categoricalways. To some skilled in the processes of publicdecision-making, political analysis is “the” way. To
others more concerned with consumer involvement,the process of drawing out the felt needs of peopleis viewed as the proper way. To many skilled in thetechnological and clinical fields, planning decisionsare felt best to be the result of applying dispassion-ate professional knowledge of what’s best for thepeople. And to others who are comfortable withnumbers, equations and indices, the unbiased ap-proach through the analysis of cold, hard facts isthe only truly accurate approach to planning. Eachdisparages the others approach, calling all but hisown irrelevant and incompetent. The paradox isthat each is correct, but alone, each is wrong, Themultiple approaches to health planning are all appropriate and useful components of an intricateamalgam, of steps, procedures, processes andanalysis, no one being more or less important thananother, but all being required in the pursuit ofimproved planning.
Given the foregoing, it should now be possible toderive some specific skill and knowledge require-ments which relate to the foregoing set of data useresponsibilities, as deserving targets for training forboth incumbent planners and statisticians, and fornew entrants. From the most cursory analysisof therequired and Klghly desirable functions, it seemsclear that more traditional analysts, statisticiansandplanners may be lacking in many of the substantialskills now required. To be specific, there is a logicalstructure of processes which lead to various infor-mation-related outcomes to which those skilled in“the gathering and analysis”“of data need to contri-bute. The first process is that of collection or acqui-sition, which results in the outcome called data.Data are primarily numbers—presumably numbersthat have been collected or acquired with an ex-pressed need in mind—but nevertheless, simplynumbers. Data may, on the other hand, be impres-sions and feelings and intuitions-each of whichmight be numerically represented. Through therigorous application of methods of simple and ele-gant statisticalanalysis, these numbers can be trans-formed into an outcome called information (i.e.rates, ratios, means, indexes, etc.). This is the levelto which various combinations of the most readilyavailable professional workers usually take matters,with the customary reports and papers displayingthe newly acquired insights. Information, however,in turn needs to be subjected to that further pro-cess known as interpretation. Interpretation, at itssimplest, is the merging of statistical informationwith qualitative information, values, priorities, con-cerns, issues, morals, ethics and legalities in orderto output knowledge or intelligence about problemsand conditions.
Even the attainment of this step is insufficient, how-ever, for to be truly effective and useful for all the
436

actors and participants in the health planning busi-ness, the newly acquired intelligence needs to beunderstood or comprehended by decision-makers.Here concern is mainly with the conversion ofknowledge to action, and the keynote is communi-cation.
This hierarchal process of collection, analysis,
interpretation and communication broadly definesthe array of skills required of individuals to ade-quately plan, implement, manage and utilize mod-ern health information systems. Within each ofthese broad categories more specific skills can bedelineated which will variously be required of thosemanaging and those ufllzing health planning infor-mation systems.
In order to adequately implement and monitorthe collection or acquisition phase, some must havethe ability to determine (and aid others in deter-mining) data priorities that pertain to a given pro-gram. This will only be possible if they can discernwhich data items are needed for a particular situa-tion and how that data can best be used. Once thedata items are determined, someone must know themost cost effective and expedient way to obtainthem. If the data are present on existing files, thebest procedure must be known for accessing thosefiles to obtain that which is pertinent while safe-guarding the confidentiality of the files. If the data,are not available from existing files the procedureswhich would be best to obtain the data must beknown and someone must be able to carry out thecollection scheme proposed.
Having the ability to determine which dataitems are pertinent to a particular problem pre-sumes a knowledge of what the problems beingdealt with are, of which data elements actuallymeasure them and what statistical methods are bestfor their analysis. Thus in addition to a backgroundin research methods, individuals are required whoare well, versed not ordy in experimental design,parametric and nonparametric statistics but also ina deep understanding of health problems andhealth care systems. This quantitative expertiseshould include not only the fundamental conceptsof probability and univariate analyses but also mul-tivariate analytic techniques such as factor analysis,multiple regression and cluster analysis. In this ageof computer and computer oriented data bases theindividual should also have a working knowledge ofelectronic data processing.
The collection and analysis processes dependprimarily on technical skills whereas the interpreta-tion process relies on abilities to promote investiga-tive inquiry, hypothesize “cause and effect” relation-ships and to interpret restits. These investigativeand interpretive skills need to be applied in an epi-demiologic approach for the determination of rela-tionships between social phenomena, diseases andtraumatic events as they impact on a poptiation
and on the health care delivery system. In this proc-ess a healthy cynicism on the part of investigatorsand planners regarding the existing state of affairs(e.g., the health care delivery system and modishapproaches used to resolve health problems) mustbe instilled to the end that the “obvious” or contem-porary is always subject to challenge and hypotheti-cal indictment.
Implicit in most approaches to the collection,analysis and interpretation of data is the notion thatstatistical results speak for themselves, but this israrely the case. The investigator must use varioustools to aid in communicating analytic results topolicy-makers, administrators and planners ofhealth programs. Important skills are the ability todisplay information and to write reports of resultsthat can be understood at different levels of exper-tise, and to work hand-in-glove with consumers anddecision-makers dike to assist them in defininghealth problems and recommending solutions ismandatory. Nancy Milio has” emphasized this im-perative in her appeal that “the knowledge thatconsumers need is not so esoteric that it cannot becondensed, with some concerted effort, and putinto forms that are’ clear and that communicate theissues in understandable terms.”1
Coupled importantly with all of these skills is .the ability to handie research problems competentlyand to create and manage complex information sys-tems. This suggests needed capacities to set priori-ties for various activities on an ever-changing basisand abilities to cope with the uncertainty, frustra-tion and anxiety which are ever present in such sys-tems. The point of this paper, of course, is that wedo not presently have the foregoing capabilitiesgenerally rampant in the health planning field.
I am reminded at this point of a notez whichappeared in the March 1976 number of BIO-METRICS which recalled Bradford Hill’s principle”that “without pretending to expert knowledge, theclinician must think statistically and the statisticianmust think clinically.” Another voice put it this way:“statisticians qualified in medicine, or, if not soqualified, at least well soaked in it.” It may well bethat Disreali’s accusation that “there are lies,damned lies and statistics”, can be successfully dis-puted through the thorough soaking of statisticiansso that they know thoroughly the topic being quan-tified, its aims, its modes, its limitations and the eth-ical constraints.
It is most customary, when reading positiondescriptions or manpower literature, to classify bio-
lNancy Milio. “Dimensions of Consumer Participationand National Health Legislation”, American J, of PublicHealth 64:4, April 1974, p. 363.
21. Jwancz, “Letter to the Editor”, Biometrics 32:1,March 1976, p. 200.
437

statisticians orwho “performquested data,”
public health statisticians as thoserequested analyses,” “develop re-and prepare statistical reports for
planners and health administrators. It is-preciselythis reactive role in the performance of the healthplanning information function which will limit theeffectiveness of the planning effort. If statisticiansand analystsawait the summons of the planner, andexpect the concerned but unsophisticated laitywhich comprise planning boards and councils tospecify desired analytical end products, their fullpurpose and value will never be achieved. Theproblem is that planners often don’t know the ques-tions to ask, and board and council members reallydon’t know%ow to ask their questions. And yet, thecommon complaint is heard as “if we only hadsome facts” . . .we could get on with our plans. Itwould seem appropriate that those concerned withinformational services be somewhat of a planner,board member, concerned citizen, critic and com-mentator on the current medical care system, andpoliticians as well as a technically competent analyst.It is the analyst who must shoulder some of theburden of knowing or deciding what questions toask, what problems to explore, what conditions areawry, what the probable needs of people might be.If the statistician were to become proactive in thisregard, his contributions to the planners and theinsights which he might unexpectedly present tothe citizenry would go far toward enhancing theeffectiveness of the planning process. No longer canthe statisticianstay shyly in his office, at his terminalor in his computing center, awaiting he call to ac-tion. He must be in forefront, conceptualizing side-by-side with others the problems to be explored,the solutions to be tested. It must be his set of val-ues, along widI those of others, which dictate thatsomething is amiss and to decide that appropriatemeasurements and assessments are to be made. Itmust be his concern for the well-being of mankindwhich joins similar concerns of others in the pursuitof better understandings and better solutions.
Specifically to tie functional requirements ofpresent day health planning, it would appear thatsingle-disciplined individuals will not be sufficient tothe task at hand. Indeed, what seems called for isAe addition of a technologically competent statisti-cal person who is “thoroughly soaked” in the plan-ning process to which his information contributes,in the health care system to which his analyses andinterpretations are directed, and in the politicalprocesses of decision-making for which his productshave utility. What we seem now ~ be defining is aneed for some kind of “new breed” informationscientist-a statistical-epidemiologist-economist-sys-tern analyst-planner-interpreter-communicator—whose contributions are understood and utilized bytie statistical”and planner alike. Likewise, planners
438
probably need a little “soaking” in the statisticalandinterpretive realms as well.
Il. Current Training
There are several disciplines available todaywhich, if aggregated, could accomplish these tasks.There are probably some individuals who containall these requisite skills, but coverage is spotty andthey are rare commodities indeed. Many havefound it possible to gain some of the skills neededthrough additional training via special seminars andcourses, such as those provided by the Applied Sta-tisticsTraining Institute, or simply through experi-ence. Persons available in the past to meet the sta-tistical and informational needs of planning bodieshave come from. many and varied backgrounds in-cluding sociology, business administration, econom-ics, geography, electronic data processing, statistics,and some in health planning.
In order for the new set of health planningagenaes to meet their awesome informational andanalytical responsibilities, and to adequately planand evaluate programs, I have tried to documentthe point that not only must planners better under-stand quantitative methods, but that there must beother individuals trained not only to collect andanalyze health data, but to aid directly in its inter-pretation and communication as well.
Unfortunately, few if any of the schools ofpublic health and related professional schools havedeveloped programs of sufficient breadth anddepth to supply the needed manpower in thisunique field. Schools of public health produce class-ical biostatisticians and epidemiologists at the rateof about 600 per year. Likewise, professional healthplanners are being developed at an estimated rateof about 200 per year. Persons skilled in the educa-tive fields of community organization and generalcommunication are being developed at the rate ofabout 175 per year. None of these alone presentlyenjoys sufficient understanding of each others’ fieldto adequately meet the need for data analysis andinterpretation which will so strongly be felt by thenew network of health planning bodies. There is aclear need for the articulation of professional areasand the development of hybrid professional work-ers who embody major competencies in biostatistics,epidemiology, health service organization, healthplanning, and community organization.
Helpfully, most schools of public health andrelated professional schools presently have nearlyall of the academic and related support needed todevelop persons with the foregoing skills and com-petencies. Their programs in biostatistics offercourses dealing with the design, collection, analysisand summarization of biomedical and health infor-

mation, and provide students with basic analyticaltools for a rigorous assessment of personal andcommunity health problems. The programs in epi-demiology provide for study of disease or behavior-al phenomena and represent the diagnostic ap-proach to setting program priorities, designing spe-cific program objectives, and evaluating results.Health education programs place emphasis oncommunity-based activities which provide oppor-tunities for groups of people to be involved in theplanning and implementation of actions which af-fect individual and community health. Such pro-grams prepare people for involvement in an inter-
~active social process, in which interpersonal rela-. tionships, participatory planning, and the imple-
mentation of democratic values are key elements.Finally, the academic programs in health adminis-tration, planning, and medical care organizationemphasize health systems, policy planning and im-plementation. Their context includes the analysisand planning of traditional medical and healthservice activities, and extends beyond to a concernfor health as an integral part of the general com-munity development process. An emerging pro-gram emphasis relates to means of dealing with thepolitical process of policy determination, the identi-fication and assessment of specific health problems,the delineation of appropriate action or programresponse to problems, the identification of goals,objectives and means, and the monitoring and eval-uation of results of planned actions.
It would appear that all of the componentpieces of desirable academic development are inplace, but it would be rare that any given studentmakes significant contact with each of the foregoing“fiefdoms” for the purpose of an integrated andwell-rounded preparation. These concerns lead meto my final point, that of proposing newer academic
apprOaCheS tO health planning analysis which wouldbe tailored exclusively to meet the pressing infor-mational needs of health systems agencies, Statehealth planning and development agencies, profes-sional standards review organizations, local andState health departments and the myriad of Federalagencies.
Ill. Toward Meeting theTraining Needs
The foregoing demands for improved informationare real and they will not go away. The complexityof the tasks which face health planners seems over-whelming and their need for improved informationis intense. ~here is truth in a prophecy which Janet
Strausss recently made which holds that “there willbe a continuing vast and unmet need for adequatedata on which to base both planning and deliveryof health services. The need for social indicators ofhealth will increase; research will be done in thisarea, but its results will be slow to filter down towhere the action is, within our time span.”Academic institutions and the planning field shouldbe unwilling to ignore these imperatives, but rathershould move boldly to better prepare for suchpressing responsibilities. To this end, I should liketo propose that newer programs of graduate pro-fessional training, and continuing education deriva-tives from them, be constructed, one major trackterminating in the preparation of a new breed ofhealth planning professional—the Health PlanningAnalyst. Our schools of public health and othergraduate health professions programs already haveestablished the necessary centers of academic excel-lence from which may be drawn essentially all of theacademic content needed. The trick is to arrangefor up-graded biostatisticians, and to more quantita-tively orient planners, as well as to develop an en-tirely new professional through the careful articula-tion of existing disciplines to the end that strengthsin statistical methodology, epidemiologic investiga-tion, health system design and planning and com-munication in the rough and tumble real world ofpractical politics are embodied in unique indivi-duals.
At this juncture, I should like to turn to what Iwould consider the simplest of the tasks which Ihave outlined, namely that of mounting the need-ed continuing education experiences which willbroaden the insights of incumbent planners andstatisticians alike. If my earlier analysis is correct,planners need greater working appreciation of thevalues of objective measures as complements tosubjective information. They need improved skillsin interpretive methods and in means of communi-cating quantitative data. It would be well that theyunderstand how data becomes information, howinformation becomes intelligence and what the rela-tionship is between quantitative tools and process.They might profit from escalated appreciations ofepidemiological relationships—of cause and effectin a multivariate world.
Likewise, incumbent statisticians and informa-tion specialists need better understandings of theplanner’s role and the planning process, of politicsand the realities of public decision-making. Theycould be more useful given appreciations of the
sJanet A. Strauss, “Future Trends in Health CareDelivery: A Forecast”, in The Report of the Corn missionon Education for Health Adm jnjstratjon, VO]. 1. Hea]th
Administration Press, Ann Arbor, 1975.
439

public policy process and of the relationship be-tween it and quantitative inputs. They should bebrought aboard with respect to the health care sys-tem and its imperfections so as to develop a“heahhy cynicism” about the status quo. The addi-tion of skills in communication and interpretationwould be useful, as would broader understandingsof available data sources, their classifications andutilities. Enhanced abilities in econometric analysiswould expand their utility in the planning processas well.
The foregoing are obviously not intended to beglobal prescriptions, but they do suggest some ofthe apparent and important areas in which incum-bent workers in the health planning effort mightwell be exposed. We have several mechanisms, forachieving these outcomes. First, the Applied Statis-tics Training Institute (ASTI) could consider a sub-stantial broadening of current offerings to embracemany of the topics suggested above. The new net-work of Centers for Health Planning have as one oftheir priority operations the provision of technicalassistance and continuing education for the staffs ofhealth planning agencies. Either conjointly withASTI, or separately, or in league with existing pro-fessional schools and colleges, the centers couldprovide the administrative channel through whichneeded and immediate continuing education couldbe arranged. However, through whichever means,this short-term training can be arranged, there is acurrent target audience of several thousand profes-sional workers extant in existing and developinghealth planning agencies and steps to deal with themin the context suggested above should, in my opinion,take the highest priority, for none of their mandatedperformances is so critical as the informational func-tion, and in no arena of practice are they so direly inneed of improvement.
Having now suggested some means and ap-proaches to the needs of existing manpower, Ishould like to devote the balance of this discussionto the creation of that “new breed” of worker towhich I earlier alluded: the health planning analyst.This development will necessitate the establishmentof newer graduate training programs, which mighthave as their outcome objectives the following: “
1. Knowledge of sources of health data at the local,State and national levels;
2. Ability to desi~ and implement methods for
3.
4.
5.
accessing requi;ed data at minimum cost;Gmpetency in the application of statisticalmethods;Understandings of the major structural andfunctional issues in the health care system inboth normative and contemporary terms;Skill in working with health planners, atizengroups and pub%c decision-ma~ers, to aid themin defining health issues and problems;
440
6. Ability to communicate quantitative impressionsto others so that meaning and insight are force-fully conveyed;
7. Understanding of planning processes and theroles of quantitative analysis, subjective analysis,politics and value herein;
8. A value system related to the life-giving and life-taking industry for which health planning isdedicated which has clear parameters of what isethical, what is moral and what is just.
On the basis of the foregoing, it is possible tospeculate about more specific building blocks in thiseducational imperative. Subsumed under the fourvery general areas which have been emphasizedpreviously, it would certainly be appropriate toexpect skill and knowledge development in at leastthe following topics.
From the classical field of Biostatistics wouldcome uni- and multivariate analysis, survey meth-ods, graphic display techniques, computer applica-tions, data sources and limitations, sampling meth-ods, survey research methods and design and dataprocessing.
Epidemiology offers epidemiologic] methods,inference, multi-causal relationships, problem defi-nition and analysis, and research methods.
The area of Planning and Management cancontribute data systems design and management,politics and the public decision process, social andenvironmental perspectives to health problems andneeds, planning systems and processes, medical caresystems in their organizational and economic as-pects, contract and grant development and manage-ment, and structure and function of existing healthcare delivery systems,
Finally, the field of health education offers in-sight into communications theory and methods,group process, program evaluation and trainingmethods.
Put the foregoing together in an ordered andsequential curriculum and to me it spells HealthPlanning Analyst. It also spells a set of identifiededucational modules which have the further capa-bility of being presented in tightly constrained for-mats for the purpose of continuing the educationof those already engaged in the informational as-pects of health planning. The construction of suchbridges among traditionally separated academic dis-ciplines has one further utility: a result may be thatthe “pure” student of planning and administrationgains added exposure to quantitative appi-oaches,students of education absorb more management,epidemiology and statistics, and the classical statis-
tics and epidemiolo~ student may be introduced tobroader social and administrative concerns than iscustomary. Whether these come to pass is, ofcourse, problematic, but in the process of mergingjust these four academic areas, some primarily

quantitatively-oriented individuals will have theopportunity to “thoroughly soak” in a number ofstrategically related fields of study and to emergenot as a highly specialized technologist of a primaryarea of practice, but with well rounded competen-cies in important aspects of all of them. I ampleased, however, to announce that at least in theUniversity of Hawaii’s School of Public Health weare going to undertake just such a development. Tooffer a model for similar developments elsewhere(and to build a target for detractors) I would like tooutline our plan.
As we contemplated the scope of training sug-gested above, it was doubtful that such a curricu-lum could be completed in less tian two years offull-time study. In the idiom of academic semesters,we have projected a typical four-semester programas follows:
First semester will include courses in medicalcare systems, introductory .biostatistics, principles ofepidemiology, group methods and minor field in-volvement. The second semester will introduce in-formation systems, computer applications, advancedstatistical methods and communication processes.The third semester’s work will deal with samplingtechniques, econometric methods, multivariate anal-ysis, and politcal aspects of planriing. The finalsemester focuses on citizen participation; econom-ics, policy development, and program evaluation.Other elective study areas fit into each of the foursemesters, so that work in such areas as ecology andenvironment, management, law, geography, andthe like is included.
Our design holds that pursuit of these educa-tional objectives must include a continual inter-change between formal classroom experience andfield study. Formal classroom training is an efficientmethod of transmitting a large body of precise in-formation in a short period of time. This is espe-cially true with respect to technical issues and meth-odologies. However, other competencies such asthose that relate to a knowledge of local data files,the ability to work with local agencies in defininghealth problems, grasping the dynamics of com-munities and of social processes, and the ability tocommunicate analytic results for planning and poli-cy-making can mainly be achieved through experi-ence which is linked with academic work.
Therefore, the program will include concur-rent course work and field study, the course workproviding technical skills as well as a framework forcarrying out the field study program, and the fieldtraining providing opportunities for the applicationof methods learned and the evaluation of theireffectiveness.
For example, analytic methods can be taught inthe classroom but not until the student has usedthese in a real world problem will he gain a full
appreciation for the methods or be able to demon-strate his competency in using these methods. Thusin this area a balance of about 50:50 might be ap-propriate as the division between course work andfield work. Other educational objectives might re-quire 90 percent of the student’s effort to be madein actual field working situations with others beingmainly constrained to the campus environment.Formal course work will be directed so that it pro-vides the students with competencies in the follow-ing areas:
1.2.3.4.5.6.7.8.
9.10.11,12.13.14,15,16.
17.
Public health epidemiologyStatistical methodsSurvey techniquesExisting data systems and their operationOperation of the health care delivery systemSocial and environmental perspectivesPolitics and the public decision processInformation system construction and manage-mentPlanning processesResearch methodsHealth care resourcesHealth programs, their function and utilityProgram evaluationThe world of economicsTrainingContract and grant development and manage-mentCommunication
The curriculum design is such that the firstsemester’s field work would involve about 20 per-cent of the student’s time in acquainting himselfwith a host agency, its data base(s) and statisticalactivities. From the experience gained the studentwill be expected to identify or be assigned oneproblem area toward which he will concentrate hisefforts. This could involve constructing a detailedproblem statement, an identification of the datawith which he will be working, methods for acquir-ing that data and procedures for analysis. He mightalso be required to propose how his research willprovide the agency with relevant information andhow that agency can most optimally utilize his re-sults.
The second semester’s field engagement willrelate to further development of hls problemthrough literature review and obtaining the re-quired data. By devoting between 20 to 30 percentof his effort during this period, the student shouldbe in a position to begin the analyses so that a con-centrated full-time effort during the ensuing sum-mer months can be devoted to the analysis andwriting a final report. Included in that report willnot only be the results of that investigation but alsoproposals on how, when and to whom to presentthe results to aid in the communication process
441

whether it be policy-makers, administrators, plan-ners or the recipients of health care.
The final two semester’s field activity will thenbe devoted to documenting how the results of thestudy were utilized, and promoting its utilizationthrough work with decision-makers. As new stu-dents start the program each year, the continuingstudents integrate them into the program and helpthem establish their programs. This annual overlapof entering and continuing students is ‘seen as animportant means of providing continuity to thefield agencies as well as giving advanced students anopportunity to develop some basic teaching skills.
To summarize, I have cast down the gauntletin calling for rather immediate academic and ad-ministrative attention to a set of emerging and vitaltraining needs in the utilization of data in the
442
health planning effort. It remains to be seen wheth-er the requisite merging of traditionally unrelatedprofessions, and of commonly unrelated areas ofstudy, can be achieved for the purpose of wideningthe competencies of incumbent planners and stat-isticians and for the development of a needed andnot widely available “new breed” of worker in thehealth planning enterprise. Some effort and moneywill be required to do so. ASTI, the health plan-ning centers and others will need to recognize theneed to do so. The professional schools will need tofind ways of bridging historic disciplinary bounda-ries to the end that coordinated educational inputsinto a multidisciplinary program of graduate edu-cation can be achieved. We believe the effort isworthwhile and intend to pursue it. I hope otherswill join with us in this challenge.

IRESEARCH NEEDS FOR DATA APPLICATIONS IN HEALTHPLANNING
~ JfY H. Glasser, ph.D., Associate Professor of Biostatistics, $chool of Public Health, Univer.slty of Texas Health Science Center at Houston, Houston, Texas
As the last paper of this meeting, it seemed
appropriate to attempt to synthesize the issues ofhealth care as they directly affect the practical andjourneyman tasks of data applications in healthplanning. This paper was written prior to the meet-ing but informally revised as I listened to the pres-entations and the discussion from the audience. I
I have not attributed ideas by name to those whomade them, but I would like to strengthen any sus-picion that where the audience may find an insight,
Iit was articulated by at least one other person at this
:1
~meeting.
The presentation is divided into three sections:I
1)
2)
3)
The context of this Conference and to dataapplications research, related to the largeissues of health care;To specify the quantitative issues in dataapplications research as they affect healthplanning activities, and to support this list-ing by way of illustration; andTo put forth a tentative set of recommenda-tions concerning further studies of dataapplications related to local and area-wideh~~lth planning.
1.Research into what?
The sixteenth meeting of this Conference isindicative of a tradition shared by advanced in-dustrial society: the collection of information on thewell and real-being of its people with an implicitview of benevolent concern. The spirit and purposeof P.L. 93-641 was itself born of wider concernabout directions of health care in the United States.
This is a technical meeting and the theme of healthplanning, of large and diverse data sets on healthand health care systems, the cooperation and syn-thesis of local, State, and Federal systems are nota-ble trends indicative of the general developments inhealth care in the United States, in fact as well asconcept.
These developments imply a rational and measuredapproach, and one in which research into methodsof data application can flourish, but the inevitableproblems arise when we probe the surface of thisseemingly well-ordered development. Almost likeleaning on a large ballon and standing back to ob-
serve the impression of our impact, it suddenlyseems paradoxical. While it is readily manipulated ithas an enormous residual elasticity and ability toregain its form. Reviewing P.L. 93-641 for the pur-pose of this paper, several observations and as-sumptions heighten this sensation of expectationand perplexity:
1)
2)
3)
4)
The quantitative mandate implied in thelegislation cannot be met in any time soon(everybody seems to be saying that).It has been asserted that P.L. 93-641 in ef-fect creates a new layer of governance inhealth care. Robbins (1976) describes this as
a power-shift to a cartel-like health sYstem.Health Systems Agencies shall contend andbe contended with in the milieu of publicpolicy, some ignored and others encouragedfollowing the individual penchants of Stateand local government.Health planning is not currently quantita-tively oriented, it is a political process, mostoften supported only with a meager database. This paper assumes that social andpolicy questions predominate and are there-by fundamentally related to any data re-search needs assessment.Data systems for health planning such as theCooperative Health Statistics System ofNCHS shall grow. These systems will pro-vide a methodologically sound and compara-tive base for planning and evaluation, butthe development of these systems is notnecessarily assured and will require alengthy period to mature.
All of this takes place in a general flux ofhealth care development with the appearance ofDr. Doolittle’s push me - pull me—a friendly crea-ture but an animal with two heads, one on eachend. On the one hand it is proposed that we shoulddeescalate the Federal role in health. For example,the Administration proposes block grant funds toeach State encompassing Medicaid and selectedprograms of the Alcohol, Drug Abuse, and MentalHealth Administration, CDC, HSA, HRA, andOHD. On the other hand we continue to speak ofbeing “on the verge” of a National Health Insur-ante Plan; in effect to consolidate the Federal rolein health. The concepts of health care, and some of
443ZZ9.IZ1 0-77-29

the “issues” themselves seem downright contradicto-ry when we array words like “access” against “over-utilization,” or consider their implications with re-spect to costs of care in extensio-ns of coverage orcontainment of utilization.
It seems obvious to conclude that health plan-ning will continue in an atmosphere of ambi~ity -that data applications on the national level will con-tend in the general market place of ideas, social~olicv. and on the local level will be modulated bv~ocal’ situations, and idiosyncratic and special cir’-cum~tances. These data research needs are differ-ent. It implies a significant transition in the applica-tion of data. We are not only building a better data. .collection system to provide reliable descriptive sta-tistics for the purpose of general information aboutour Nation’s health (which is itself no small task).We are speaking about information and data forthe purpose of industrial and personal regulationon small area bases. This regulation im~lies multi-ple courts of appeal in professional and ;nstitutionaIgroups, among the political structure, perceivedpublic preference, and in the courts of law, them-selves.
The legislation does provide a set of NationalHealth Priorities (Sec. 1502). Despite what mayseem a tiresome repetition, the legislation givestongue to the array of activities that health plannersshall respond to:
NATIONAL HEALTH PRIORITIES
“SEC. 1502. The Congress finds that the follow-ing deserve priority consideration in the formulationof national health planning goals and in the develop-ment and operation of Federal, State, and area healthplanning and resources development programs:
“(l) The provision of primary care services formedically underserved populations, especiallythose which are located in rural or economicallydepressed areas.
“(2) The development of multi-institutionalsystems for coordination or consolidation of in-stitutional health services (including obstetric,pediatric, emergency medical, intensive and cor-onary care, and radiation therapy services).
“(3) The development of medical group prac-tices (especially those whose services are appro-priately coordinated or integrated with institu-tional health services), health maintenance orga-nizations, and other organized systems for theprovision of health care.
“(4) The training and increased utilization ofphysician assistants, especially nurse clinicians.
“(5) the development of multi-institutionalarrangements for the sharing of support servicesnecessary to all health service institutions.
444
“(6) The promotion of activities to achieveneeded improvements in the quality of healthservices, including needs identified by the reviewactivities of Professional Standards Review Orga-nizations under part B of title XI of the SocialSecurity Act.
“(7) The development by health service institu-tions of the capacity to provide various levels ofcare (including intensive care, acute general care,and extended care) on a geographically integrat-ed basis.
“(8) The promotion of activities for the prev-ention of disease, including studies of nutritionaland environmental factors affecting health andthe provision of preventive health care services,
“(9) The adoption of uniform cost accounting,simplified reimbursement, and utilization re-porting systems and improved management pro-cedures for health service institutions,
“(10) The development of effective methods ofeducating the general public concerning properpersonal (including preventive) health care andmethods for effective use of available health serv-ices.
FUNCTIONS OF HEALTH SYSTEMSAGENCIES
SEC. 1513.(a) For the purpose of—“(1) improving the health of residents of a health
service area,“(2) increasing the accessibility (including overcom-
ing geographic, architectural, and transportationbarriers), acceptability, continuity, and quality of thehealth services provided them,
“(3) restraining increases in the cost of providingthem health services, and
“(4) preventing unnecessary duplication of healthresources, each health systems ‘agency shalI have itsprimary responsibility the provision of effectivehealth planning for its health service area and thepromotion of the development within the area ofhealth services, manpower, and facilities which meetidentified needs, reduce documented inefficiencies,and implement the health plans of the agency, Tomeet its primary responsibility, a health systems agen-cy shall carry out the functions described in subsec-tions (b) through (g) of this section.
“(b) In providing health planning and resources de-velopment for its health service area, a health systemsagency shall perform the following functions:
“(l) The agency shall assemble and analyze dataconcerning—
“(A) the status (and its determinants) of thehealth of the residents of its health service area.
“(B) the status of the health care delivery systemin the area and the use of that system by the resi-dents of the area,
“(C) the effect the area’s health care delivery sys-tem has on the health of the residents of the area,
“(D) the number, type, and location of the area’shealth resources, including health services, man-power, and facilities,
“(E) the patterns of utilization of the area’s healthresources, and
“(F) the environmental and occupational expo-sure factors affecting immediate and long-termhealth conditions.
In carrying out this paragraph, the agency shall to themaximum extent practicable use existing data (in-cluding data developed under Federal health pro-grams) and coordinate its activities with the coopera-tive system provided for under section 306(e).
The provisions place a direct burden on theplanner to have a working concept of that which wecall community health and health care system. Itcalls for policy decisions which are complex and in-tertwined and therefore requires some kind of per-sonal integrative approach. I have tried to set forthseveral basic premises to illustrate this contention
r and to describe the transitions that we are attempt-ing to quantify.
1. Transitions in community composition-describ-ing the populations at risk
First we are constantly faced by sociodemo-graphic sh;fts that have obvious implications forhealth care. Some can be anticipated: a growth inthe number of older aged citizens and its implica-tions for geriatric care. Other trends are neitherpredictable, nor once manifest, stabile phenome-non: a dramatic decline in fertility. The UnitedStates fertility rate has fallen from 85 live births per1,000 women age 15-44 to 65 per 1,000 in the per-iod 1971-1975. A decrease in fertility of almost 25percent has occurred in 4 years! (U.S. Dept. HEW,Monthly Vital Statistics, 19’76.)
2. The growing realization of the complexity ofhealth care behavior
a) Health care is inefficient t by its very nature.Needs are generated by definition of individuals ascitizens, and in other instances by providers. Bothpeople and providers can change the decision rulesabout health care needs. For example, most peoplewho feel sick do not seek help from the medicalcare system (three out of four according to surveysin the united States and Britian).
b) Utilization is a complex mix of factors withinitial visits consumer controlled and subsequentvisits provider con trolled. Of all the volume of careprovided, half is generated by people seeking care.
This is generally the initial ambulatory contact. The
other half is provider initiated. Yet schemes exist toprovide barriers and gatekeepers to introduce thirdparty control without considering fundamentalbehavioral characteristics of people or providers.Some mechanisms are contradic~ons to “principlesof good medical care.
All of the above is modulated by an array ofsocial-cultural factors, population mixtures, regionalvariation, health insurance, sickness benefits, intrin-sic life-style and personal resources, place of work,and environmental factors which require identify-ing and defining specific populations-at-risk relateddirectly to health care system effects.
3. The variety of mechanisms to change or controlthe system are essentially social Cxperi men ts
Intervention into the system is hardly everbased on firm knowledge. Goldilocks was muchmore fortunate in finding her “just right” porridgein three tries. In effect, legislation and programshope to create scenarios for change. Several plotlines follow:
We may have too much manpower and that inthe wrong places. The 311,000 or so physicians inpractice seem to be often coagulating in certainplaces and not in others, as well as in certain spe-cialities. Medical schools have been stimulated togreater productivity. There will be a lot more (withnew graduates expected to rise to 15-16,000 peryear by 1980) and that without considering theForeign Medical Graduate supply question. It isonly recently that the question of distribution bygeography and specialty has come front-stage.These questions concern other significant careprovider- pools. There are over two m-illion workers.in nursing services; over one third are registerednurses. There is the beginning of industrial actionand collective bargainin~ to tie considered amongthis substantial work force—the transition 01 a setof guild systems moving into the industrial age.
We hope to reorganize things to contr;l costs.It is uncertain that the distributional problems de-scribed above will be than’ged, but organizationalchanges such as group practice and prepaid medi-cal care with salaried physicians seems a promisingway to address anothe~ ~roblem: cost of ~are. Wh~,should this be so? Since total days of inpatient car:is lowered (U.S. Dept. of HEW, Social Security Bul-letin, May 1976) in prepaid health care systems,and furthermore, since hospitalization accounts for40 percent of the entire estimated national healthbill, significant cost savings may be realized. Yetprepaid group practice, despite its total majority ofyears, has currently only six and one-half millionenrollees in the United States as of one year ago(Wetherille et al, 1975). While we may wish to shiftthe organization of care, only a small start has beenmade.
445
—

The planner is faced with the dilemma of apotential change, and the question is whether im-plementation plans should be based on “more ofthe normal” or on markedly different changes inthe health care system - and if so, when?
All of this is occurring in an expanding uni-verse of cost (10-12% per annum) and a generalconcern for technical efficiency and effectiveness.Questions have been raised about the utility of theconcept of preventive medicine, specifically earlydetection and screening programs, and one maywell ask “is nothing sacred anymore?” In the largersocietal context, we question whether we will enjoythe future promise of biomedical research (as theNational Institutes of Health programs describe) orthe horrors of medical nemesis and iatrogenesis associal critics such as Illich (1975) invoke.
Though little has been mentioned about access,quality, or Federal, State and local initiatives inhealth care, I hope I have demonstrated the imper-ative that exists to construct some logical networksof health care interactions before we can properlyaddress the data measurement problems.
Il. Quantitative Issues1. Influencing ongoing data systems- The pri-
mary data mandate for HSA’S is to use existing datasources or carry out secondary data analyses. Whatto do with the current big data collectors? Theseproblems are in part dealt with in the CooperativeHealth Statistics System, but my assumption is thatthis program will require several years of develop-ment. These “other” large data collection systemsexist for rather diverse purposes, and this hetero-geneity of characteristics and sponsorship will re-quire some kind of organized dialogue particularlyas it will affect local availability.
These systems include:a) Data on hospital and ambulatory care for
billing or cost reeimbursement (Medicare, Medicaid,and the Blues). In 1974 approximately 70 percentof persons under 65 have some form of hospitalinsurance (NCHS, 1976)- That represents a hugedata reserve both in coverage and size of data hold-ings. By its very nature it also represents hospitali-zation in a selected population and this too must berecognized.
b) Data from special reporting systems.These systems are also defined by self-selectingmembership or participation. They include:
i) care delivered by institutional enti-ties such as a constellation of hospitals;
ii) topical or categorical health eventsas in the case of abortion reporting systems;
iii) legal requisites, such as licensingrequirements which may be augmented by profes-sional association surveys; and
446
iv) discrete components, or specialpurpose studies such as ambulatory practice sur-veys, PSRO data collection, or NeighborhoodHealth Center activity reporting.
While use of data from these systems at bestseems like attempts to predict outcomes based onscattered early returns, the techniques to manageand assess these systems are well known,
What is not clear is the “research” into thenegotiation and strategy that must exist to providea quid pro quo between secondary user and thevariety of primary proprietors of the data systemsin question. Again, the concern is for Iocal data usewhere it is assumed that a comparable national sys-tem related to the expressed local impact studieswill be a long time in evolving into truly nationalprograms.
2. Clarifying the Issues of Privacy, Confiden-tiality, and Freedom of Information. This is abroad spectrum of problems which can be arguedpro and con on both sides of any issue.
a) Legal: Individual rights are one aspect andthese relate to protection of individuals. This in-cludes the traditional rights of protection againstinvasion of privacy, but in many ways this includesfair disclosure to the person himself—the rights ofpeople to their records, to the need to explain themeaning of these records. However, we can arguethat citizens have a right to linkage where sharedand comprehensive services imply the need to ex-change information for continuity of health care,
b) Technical: There exists a need to rein-force the technical procedures that must be em-ployed to protect the individual from unwarranteddisclosure, whether accidental or intentiflnal, Thisincludes building safeguard systems where data is ,only partially linked, or noise is introduced, Thiscan assume some random error which is tolerablein terms of estimation procedures, but precludesthe unique identification of individuals, These arequestions of data security procedures and are notdependent on the issue of legal rights, save that anindividual should have such assurance in fact aswell as word.
These two” points, rights and technical safe-guards, may sound like topics mentioned in a man-datory fashion; more theoretical than real, Yet,hearings are currently being held by the PrivacyProtection Study Commission which is now consid.ering the “feasibility and desirability of extendingthe principles...of the Privacy Act of 1974 tohealth care institutions and providers.”
In the hearings, the Commission will concen-trate on the development and use of medical rec-ords by health care providers and institutions,(e.g., physicians, general hospitals, nursing homes,psychiatric facilities, ambulatory care facilities) and

closely allied users of medical records (e.g., utiliza-tion review programs, PSRO’S, biomedical andhealth services researchers).
The Society for Epidemiological Research hascalled “the implications of this to epidemiologicalresearch staggering.” Similar concerns are now mat-ters for national debate in many Western Europeannations, particularly those nations with well devel-oped national numbering systems and extensivelinked data files on individual citizens.
3. Prioritizing Data System Development. Atthe risk of sounding like an echo of a primarycampaign, let us assume that the HSA’S and alliedgovernment programs can not do everything. Whatthen does come first, the health status indicator orthe utilization data? Because one seems more readi-ly available on a local level, should that be the crite-rion of choice, or is it better to emphasize datacomponents that may require long term develop-ment, but eventually have a greater utility to plan-ning and evaluation?
The issue of prioritizing is a real one. TheOffice of Management and Budget (OMB) has seta goal of a 10 percent reduction in the number ofongoing data systems that Federal agencies current-ly have in effect. The plan is currently being imple-mented (data systems mandated by Federal law areexempt). After this literal “data decimation” theindividual agency’s total is to remain constant at anygiven time. While no one should carp at a PSROfor data systems, it does again point to a paradoxbetween the need to know more, but the desirabilityof collecting less. While I am familiar with mini-mum data sets, I do not know of any data prioritiesor data priority setting methods in the health plan-ning field. Local planning bodies will need thisguidance.
4. An Adequate Description of the HealthCare Phenomenon. This section considers quantita-tive characteristics as they relate directly to HSAdata priorities (my priorities, not necessarily P.L.93-641) and to data applications research.
a,) Distribution of events and the relation-ship to populations at risk. A fundamental axiom ofepidemiology is that disease is not distributed ran-domly in population—that risk factors analysis iscrucial to understanding the disease process, Oftenwe are confronted not with the distribution, butmerely the average, and we need to explore whereaverages are, or are not, enough to properly des-cribe a phenomenon or relate it to a referencepopulation. For example:
● is a physician/population ratio adequate ei-ther to understand the situation or to plan
for change? Is the 148 per 100,000 physicianpopulation ratio in the United States an
●
●
adequate standard? (Macy Commission,1976.)or, do we need to pursue these ratios by spe-cialty in order to arrive at an area’s norms?
or, do we need to consider type of practice?For example, among Kaiser pians (e;timatedin 1975) the physician/population ratio is102 per 100,000 as opposed to 160 for theentire United ‘States (a 37% reduction in theratio in this particular prepaid health caresystem as compared to the national average).
In specific categories such as nurses, it is impor-tant to know the number that are currently in orout of the work force. For example, 30 percent ofRNs are out of the labor market according to sev-eral estimates - a considerable pool, but of un-known predilections, training, or career plans.
Previously I posited the close connection be-tween planning and regulation. Distributions arecrucial when applied to regulatory functions.Examples are catastrophic insurance, coveragethresholds or payment deductibles, and rejectionrules for unseemly bills, quajity standards, or eligi-bility for medical service. These distributions areusually extremes oriented: the underserved, theoverpaid, scarcity, or abundance determinations.
The rules are sliding values subject to frequentchange, revision (or tinkering). Without knowledgeof the full distribution, it is difficult to evaluate theeffect of proposed changes.
b.) Variability is inevitably encountered instudying almost any aspect of health care andhealth status. Examples are cost of care or custom-ary and usual fees by locality, distribution of hospi-tal days per 1,000 population by region, or levels ofmorbidity and disability within local populations.Even under seemingly uniform conditions variabili-ty is encountered. In the National Health Service inGreat Britain, the average number of consultationsper person with a general practitioner varied from3.2 to 5.0 per person per year among the twelvemajor regions of Britain (HMSO, The GeneralHousehold Survey, 19’74). This amounts to a factorof one and one-half in the range of the averagenumber of visits for primary care.
c.) Levels of aggregation. The considerationof variability points to the need to define thegeographic or population mesh that are appropri-ate to the complexity (or simplicity) of the pheno-menon.
The importance of the micro-approach is illus-trated in Wennberg, et al, (19’73). These authorspoint to the substantial variations encountered inhealth service measures within the 13 hospital serv-ice areas of Vermont, and are reported elsewherein this Conference.
447

A recent article by Cullen et al (1976) in theiVetv England Journal of Medicine, followed 226consecutive critically ill patients in the acute careunit of Massachusetts General Hospital. The oneyear survival rate for these patients was 27 percent,and of, the 62 survivors only 27 were fully re-covered. The total cost (excluding physician fees)for the acute care unit stay was $3,200,000. Thisarresting type of finding illustrates the dilemma ofgauging the data mesh, and its relation to type ofcare and organizational component studies.
d.) Time trends and lon~”tudinal measures.Emphasis needs to be placed on longitudinal trendsor establishing a baseline. Often self-comparison isthe only comparative type of measurement tech-nique available to monitor change. For example, ina lifetable-like approach, Wolfe (1975) presentedtestimony before the House Subcommittee on Un-necessary Surgery, using the probability of having aspecific operation by age 70 as one indicator.Comparing two health care systems, Wolfe estimat-ed that the probability of hysterectomy among pre-paid group practice as .168, while this probabilityunder general prevailing medical care systems is.45. This is almost a threefold difference in women70 and over for this operation. While the basis ofthis calculation can be questioned, it does illustratethe potential use of longitudinal measures.
AS a further example, the manpower’ field
serves as an illustration of the need to appraise timedependence as a planning tool.
i) The aging of manpower cohorts by prac-tice specialty. What will the demographic profile ofan area’s practitioners be when projected forwardin time?
ii) The number of hours worked by person-nel: for example, Sweden anticipates a decline of 25percent in work hours per person over a thirty-yearperiod.
iii) The growth of ancillary health manpow-er associated with key personnel. For example, theancillary worker to physician ratio in the UnitedStates is currently 12:1.
All of these simple statistics have implicationsfor change and management in the system.
e.) Projection vs. Forecasting. This brings usto a juncture of some discontent where I would liketo make a distinction between a cautious and boldapproach to futurology.
i) Projection: extrapolating present trends insome descriptive fashion.
ii) Forecasting: where the future course ofevents is predicated upon underlying or changingpatterns occurring that may be quite different thanpresent trends. (the Oracle of Delphi forecasted,she never projected).
In this sense, formulas of needs and demands,such as in hospital bed planning, require recon-
448
sideration. For example, we can speculate (and thatis what it is) on the market for HMO’s now in effectfor dual option coverage for employees of compa-nies of 25 or more. In Houston, Texasj that covers86 percent of the work force (an almost non-HMO,town).
Furthermore, it appears that the HMO hospi-talization experience as measured by total hospitali-zation runs 50-60 percent less days of inpatient careper 1,000 population than in the current (non-HMO covered) population. We may well considerthe large disparity between projected bed needswhen calculated under current trends and thosearrived at as forecasts, assuming that HMO’s time isabout to dawn in a community.
5. Indices. Although I propose to give this top-ic short shrift, it has been explicit throughout theseseveral days of meetings, in the mandates of P,L.93-641, and implicit in every example in this paper,
The problem is that of surrogates: pickingmeasures that will stand for a class of like pheno-menon. These measures presumably shall have vir-tues of intelligibility, sensitivity, ease of collection,and timeliness, much like the infant death ratewhich in former times could summarize a muchwider class of community health problems, This, infact, provides a ready example that changes dodemonstrably occur in health status: in the periodof 1972-75, the infant death rate has fallen from19.2 to 16.1 infant deaths per 1,000-a fall of 17percent in 4 years!
The intellectual problem is having the insightto formulate the question correctly: what is it weare attempting to measure? And only then, theneed to create the circumstances to answer it.
In this regard we often address ourselves toactivities created around health care (like utiliza-tion) rather than outcomes of care, or we confuseoutcomes of care among groups of users withoutany comparison with these same outcomes as mea-sured among nonusers.
Disability days is an example of an index thatdescribes important aspects of morbidity impactwithin the population. It is the result of a complexof self-expressed and functional impairment due toillness. In terms of evaluation of health care, how-ever, we need to question whether lowered disabili-ty should be an outcome measure of the immediate”impact of health care improvement. Initially, infact, it can be reasoned that improved health careshould raise expressed disability days, as bettermorbidity reporting, case-finding, and communityawareness react to the health system stimuhts.
Hypertension illustrates the type of indices re-search needed. This is an example of a syndromeclosely related to serious sequelae of circulatory andrenal diseases which can be controlled by appropri-

ate treatment. Often attributed to Stamler, the “ruleof halves” demonstrates a causal chain that followsthe path of community care concepts.
Currently, of the 18 million or so estimated, individuals with hypertension (the prevalence of thesyndrome) only one-half have been diagnosed assuch (the detection). Of that one-half that areknown, only one-half have had any treatment (accessto care). Furthermore, of that one-fourth of thehypertensives in the population (1/2 of those detect-ed x 1/2 who have had any treatment) who havebeen treated, only one-half have been treated ade-quately (continuity and compliance of care).
Clearly the resultant 1:8 of adequate control ofhypertension should be improved, and that requiresimprovement along the series of events that mustoccur. I have obviously brushed aside many of thenuances in discussing hypertension, but I trust it is
a persuasive example of the need to consider a setof criteria and performance characteristics by whichwe may select from various classes of indices.
6. Experiments and Evaluation. Nothing is saidon these important topics because analysis of datafrom manipulative or contrived situations to testalternatives within HSA’S is discouraged. It is- re-garded as something apart from planning. Yet,evaluation is clearly an inevitable activity in plan-ning. So, too, are methods of experimental designsince we are constantly seeking a “control” or com-parative base. I do admit the budget for HSA’Sappear to be at subsistence levels and preclude abalanced diet of planning and its concomitant eval-uative supplement.
Ill. Summary of Needed Workon Research in DataApplications
1. Historical summary of data applications: Ipropose this as more than an academic exerciseprecisely because the advances in health measure-ment have arisen closely connected to studies ofcommunity health. In many ways we still appeal tothese simple and useful studies: Graunt in 17thCentury London, Florence Nightingale and Hospi-tal Care, Shattuck and the Sanitary Commission inMassachusetts, Lee—Jones and Principles of Medi-cal Care. The basic methods endure and as yet havenot permeated health planning as it is practiced.
2. Get a National Health Policy or a set ofalternative strategies. Failing that, think of a localone for purposes of attempting to ask the pertinentquestions, and to assay the data base available foranswers, This should recognize that our society hasa love-hate relationship with data (although I am
not suggesting a new field of mental health: datapsychiatry).
3. We require more “fact books” that followsome conceptual flow of health care issues and theirtotal effect on the system: what is known, and howis it known? What are artifacts, how are concepts ofpopulations at risk applied? This relates to the of-ten low level of knowledge of existing data concern-ing health status, health care, and the health serviceindustry. (I sympathize with those who do attemptto keep abreast.) It refers to the lack of a traditionof using data effectively, if at all, in arriving athealth care decisions.
4. Relate data applications to decision analy-sis. A reading of the Health Planning Act bringsforth the ghost of PPB systems. It would be well toarrive at some typology of situations describing lo-cal situations, SES levels, political organizations, andrelate data uses within these contexts in order torelate planning decisions practice more closely toparticular HSA situations.
5. Examine data needs on local levels basedon market surveys of perceived- needs and use fordata. This should be done by types of data used(e.g., hospital, natality ...). by reasons for use, andthe forms in which it is used (thematic presentation,tables, ...).
This should include some assessment of whattypes of information and how the public receivesthis information, and a distinction between dataand information. (Shades of health education andnewspaper clipping - and why not?) It should alsoinclude professional problem areas such as themalpractice issue, unnecessary surgery, or industriallabor relations among health care providers andinstitutions. These issues loom as large as the ques-tions of access and equity in health care.
6. Analytic technique development related to ‘
a) confidentiality and linkage;b) the handling and culling of large data
files, the specific techniques useful tosecondary analysis, and data reductionto identify key factors;
c) employing synthetic estimates or simula-tion routines to apply relevant estimatesfrom other sources to areas where com-parable data does not exist. This estima-tion process is closely related to demo-graphic techniques used in underdevel-oped areas of the world where informa-tion is lacking or incomplete.
.7. Further Indices development—extending theuse of standardized data sets by encouraging somelocal initiative and innovation in constructing ind-ices. With due caution to statistical considerations,there should be latitude to encourage imagination.
449

These indices ought to look at outcomes related tosome substantive or policy question. For example,the Q index despite the lack of exploration of sta-tistical properties, combines relative mortality, out-patient, and inpatient data. Its use shows some in-sight into balancing activity statistics with the out-come measure of mortality. Surrogate measuressuch as the example of hypertension should be ex-plored systematic -dIy.
8. Ultimately, we wish to shift our major em-phasis from system activity statistics to the measure-ment of health outcomes in time. These outcomemeasures should track health as a lo-ngitudinal andcohort related phenomenon. From Graunt’s proto-Iife tables, through cost of illness in a life time, lon-gitudinal and population specific measures focus onthe trajectory of health care status and use overtime. Cross-sectional approaches often only disguiseunderlying changes that we wish to monitor. Thisimplies pragmatic questions of tracking well-definedgroups through time: It can mean linkage of rec-ords.
9. Demonstration efforts such as the Data Anal-ysis Laboratory of NCHS, the technical papers se-ries of BHPRD, are mechanisms for exchange.These shotdd be supported. Data-wise, and process-wise, we are attempting to muddle through, and atleast we are trying to get organized.
Summary
Basically these recommendations attempt toconsider data applications as they affect policy for-mation. They assume a very low level of quantita-tive adroitness exists in the field, and that we aredealing with a truly complex and enduring prob-lem; that there will be continuing large investmentin attempting to define health and well-being, andbringing citizens to that level of health in a mannerthat is acceptable to some consensus formed in oursociety. These definitions of health and the nature
of the consensus will be subject to change. Researchinto data methods implies sensitivity to thesechanges as well as the technical performance anddevelopment of health measurement tools.
References
Cullen, David J., M. D., et al. (1976) “Survival, Hospitaliza-tion, Charges and Followup Results in Critically 111Pa.tients? New England Journal of Medicine, Vol, 294, No,18, April 29, 1976.
Her Majesty’s Stationary Office, The General HousholdSurvey, London, England, 1974.
Illich, Ivan (1975). Medicai Nemesis: The Expropriationof Health. London: The Trinity Press, 1975.
Macy Commission (1976). Physicians for the Future. Balti.more: Josiah Macy, Jr., Foundation, 1976.
U.S. Department of Health, Education, and Welfare(1976). “Births, Marriages, Divorces, Deaths for 1975”Monthly Vital Statistics Report, Vol, 24, No, 12, March1976.
U.S. Department of Health, Education, and Welfare(1976). “Contrasts in HMO and Fee-for-Service Perform-ance Demographic Characteristics of Disability Appli-cants: Relationship to Allowances,” Social Security Bulle-tin, Vol. 39, No. 5, May 1976.
Wennberg, John and Alan Gittelsohn (1973), “Small AreaVariations in Health Care Delivery.” Science, Vol. 182,December 1973. ‘
Wetherille, Rhona, et al. (1975), “Growth Across theNation.” Prism, October 1975.
Wolfe (1975) mimeograph copy with citation. “U.S, Houseof Representatives Subcommittee on Oversight and Inves-tigations on Unnecessary Surgery. Testimony of Sidney M,Wolfe, M.D., July 15, 1975:
450

PROGRAM PARTICIPANTS
LuAnn Aday, Ph.D.Research Associate and Study DirectorCenter for Health Administration StudiesUniversity of ChicagoChicago, Illinois 60637
Mr. Thaine H. Allison, Jr.Economist, Inland Counties CHP Council2039 North “D” Street, Suite 206San Bernardino, California 92405
Ronald M. Andersen, Ph.D.Associate Professor, Center for Health
Administration StudiesUniversity of ChicagoChicago, Illinois 60637
Mr. Robert J. ArmstrongChief, Mortality Statistics BranchDivision of Vital StatisticsNational Center for Health StatisticsRoom 9A-45, Parklawn Bldg.
W. Edward Bacon, Ph.D.Chief, Hospital Care Statistics BranchDiv. of Health Resource Utilization Stat.,National Center for Health Statistics .Room 9-46, Parklawn Bldg.
Mr. Walter P. BaileyDirector, Management Support SystemsDivision of Health and Social Development1800 St. Julian PlaceColumbia, South Carolina 29210
Mrs. Margaret A. BarnesMathematical Statistician and Project Off.Division of Planning Methods and Tech.BHPRD - HRARoom 12-14, Parklawn Bldg.
Gary Buck, Ph.D.Project DirectorPlma Health Systems, Inc.2302 E. Speedway, Room 214Tucson, Arizona 85719
Leon Burmeister, Ph.D.Ass’t Prof., Dept. of Preventive Medicine and
Environ. Health, College of Med.University of IowaIowa City, Iowa 52242
Harry P. Cain, II, Ph.D.Director, Bureau of Health Planning and Resources
DevelopmentHealth Resources AdministrationRoom 12-05, Parklawn Bldg.
Charles Cannell, Ph.D.Program DirectorInstitute for Social ResearchUniversity of MichiganAnn Arbor, Michigan 48106
Mr. Loren E. ChancellorChief, Registration Methods BranchDivision of Vital StatisticsNational Center for Health statisticsRoom 9A-37, Parklawn Bldg.
James P. Cooney, Jr., Ph.D.Chief Executive OfficerR. I. Health Services Research, Inc.56 Pine StreetProvidence, Rhode Island 02903
Richard G. Cornell, Ph.D.Prof. and Chin, Dept. of BiostatisticsSchool of Public HealthUniversity of Michigan Ann Arbor, Michigan 48176
Cyril Crocker, M.D.Professor of OB-GYNHoward University Hospital/Dept.OB/GYN2041 Georgia Avenue, N.W.Washington, D. C. 20060
Mr. Royal A. CrystalAssistant to the DirectorBureau of Quality AssuranceHealth Services AdministrationRoom 16A-55, Parklawn Bldg.
Mr. Donald J. DavidsChief, Records and Statistics SectionState Department of Public Health4210 East 1lth AvenueDenver, Colorado 80220
Paul M. Densen, SC.D.Director, Harvard Center for Community Health
and Medical Care643 Huntington AvenueBoston, Massachusetts 02115
451

G. E. Alan Dever, Ph.D.Dir., Health Services Res-Stat. SectionGeorgia Dept. of Human Resources47 Trinity Avenue, N.W.Atlanta, Georgia 30334
James F. Dickson III, M.D.Deputy Assistant Secretary for HealthDept. Healthj Education, and WelfareRoom 5067, HEW North Bldg.Washington, D.C. 20201
Joseph W. Duncan, Ph.D.Dep. Assoc. Dir. for Statistical PolicyOffice of Management and BudgetNew Executive Office BuildingWashington, D. C. 20503
Jack Elinson, Ph.D.Professor, Sociomedical SciencesColumbia University630 W. 168 StreetNew York; New York 10032
Mr. James M. EnsignPresident, Creighton Omaha Regional Health Care
Corporation2305 S. Tenth StreetOmaha, Nebraska 68108
Mr. Steven B. EpsteinAttorney at Law1900 M Street, N.W.Washington, D.C. 20036
Mr. Theodore R. ErvinDeputy Director -Michigan Department of Public Health3500 N. Logan StreetLansing, Michigan 48909
Pearl D. Fisher, Ph.D.Acting Chief, Applied Statistics Training Institute
Branch, CHSSNational Center for Health StatisticsRoom 8-44, Parklawn Bldg.
Floyd J. Fowler, Jr., Ph.D.Director, Survey Research ProgramUniv. of Massachusetts Joint Center for Urban
Studies of MIT and Harvard Univ.Boston, Massachusetts 02116
Mr. Irvin G. FranzenDirector, Division of Registration and Health
StatisticsKansas State Department of HealthTopeka, Kansas 66620
452
Mr. Todd M. FrazierAssistant Director, Harvard Center for Community
Health and Medical Care643 Huntington AvenueBoston, Massachusetts 02115
Mr. George A. GayPublic Health AnalystRegistration Methods Branch, DVSNational Center for Health StatisticsRoom 9A-37, Parklawn Bldg.
Mr. Carl GerIachProj. Director, Jt. Health Planning Prog.Bay Area CHP Council, Ass. Bay Area Gov.425 Battery StreetSan Francisco, California 94111
Mr. Jacob GetsonDirector, Comp. Health PlanningState Office Building100 Cambridge StreetBoston, Massachusetts 02202
Dennis Gillings, Ph.D.Asst. Prof., Dept. of BiostatisticsSchool of Public HealthUniversity of North CarolinaChapel Hill, North Carolina 27514
Alan Gitielsohn, Ph.D.Professor, Department of BiostatisticsSchool of Hygiene and Public HealthThe Johns Hopkins UniversityBaltimore, Maryland 21205
Jay Glasser, Ph.D.Professor of BiostatisticsUniversity of Texas at HoustonP. O. Box 20186, Astrodome StationHouston, Texas 77025
Mr. Delray GreenMedical Classification SpecialistInternational Statistics ProgramNational Center for Health StatisticsRoom 8A-54, Parklawn Bldg,
Mr. W. David HelmsDirector of Research, Areawide and Local Planning
for Health Action, Inc.1010 James StreetSyracuse, New York 13203
Miss A1ice HetzelDeputy DirectorDivision of Vital StatisticsNational Center for Health StatisticsRoom 9A-55, Parklawn Bldg.

Mr. Robert L. HeuserChief, Natality Statistics BranchDivision of Vital StatisticsNational Center for Health StatisticsRoom 9A29, Parklawn Bldg.
Alan R. Hinman, M.D.Assist;nt Commissioner of HealthTennessee Department of Public Health347 Cordell Hull BuildingNashville, Tennessee 37219
Mr. Peter L. HurleyAssociate Director for OperationsNational Center for Health StatisticsRoom 8-29Parklawn B1dg.
Mr. Deane L. HuxtableState RegistrarJames Madison BuildingP. O. Box 1000Richmond, Virginia 23208
Carmault B. Jackson, M.D.Medical DirectorTexas Medical Foundation1620 Nix Professional BuildingSan Antonio, Texas 78205
Mr. Carl E. JosephsonAsst. Director for Program StatisticsDiv. of Health Insurance Studies, ORSSocial Security AdministrationBaltimore, Maryland 21235
Mrs. Gloria KapantaisDirector, Division of Health Manpower and
Facilities StatisticsNational Center for Health StatisticsRoom 9-57, Parklawn Bldg.
Joel Kleinman, Ph.D.Service FellowDivision of AnalysisNational Center for Health StatisticsRoom 8A-41, Parklawn Bldg.
Samuel P. Korper, Ph.D.Assistant Dean, School of Medicine, andDirector, Office of Regional ActivitiesYale University School of MedicineNew Haven, Connecticut 06510
Mr. Philip LatessaDirector of Research and EvaluationIowa Hospital Association1906 Ingersoll AvenueDes Moines, Iowa, 50309
Mr. Robert L. LiljegrenPrincipal StatisticianState Department of Health4210 East 1lth AvenueDenver, Colorado 80220
Mr. Robert E. LindeManager, Division of Information ServicesAmerican Hospital Association840 N. Lake Shore DriveChicago, Illinois 60611
Mr. Vito M. LogrilloDirector of Health StatisticsNew York State Department of HealthEmpire State Plaza, Tower Bldg.Albany, New York 12237
Mr. Chris D, MartinDir., State Center for Health StatisticsRoom C2-242Cordell Hull BuildingNashville, Tennessee 37219
Miss Marian MartinState RegistrarState Division of HealthP. O. BOX 231Portland, Oregon 97207
Mrs. Jane H. MurnaghanAssistant Professor, School of Hygiene and Public
HealthThe Johns Hopkins UniversityBaltimore, Maryland 21205
Mrs. Beverlee A. MyersConsultantApt. 3082801 Adams Mill RoadWashington, D.C. 20009
Robert E. Mytinger, Dr.P.H.Professor of Public HealthSchool of Public HealthUniversity of HawaiiHonolulu, Hawaii 96822
Raymond D. Nashold, Ph.D.Director, Bureau of Health StatisticsDept. of Health and Social ServicesP. O., Box 309Madison, Wisconsin 53701
David Nitzberg, SC.D.Vice President, TechnicalSystemedics, Inc.3 New England Executive Park
J
Burlington, Massachusetts 01803 453

Mr. William A. O’NeilAssoc. Director, Systems and ResearchHospital Utilization Project400 Penn Center Blvd.Pittsburgh, Pennsylvania 15235
Mr. Kenneth O. PaisleyDirector, Health Plan Dev. ServicesState Department of HealthP. O. Box 1540Trenton, New Jersey 08625
James J. Palmersheim, Ph.D.Director, Coop. Health Information SystemIllinois Department of Public Health535 W. Jefferson StreetSpringfield, Illinois 62761
Mr. John E. PattersonDirectorDivision of Vital StatisticsNational Center for Health StatisticsRoom 9A-55, Parklawn Bldg.
Edward B. Perrin, Ph.D.Acting Director, Health Care Study Ctr.Battelle Human Affairs Research Gnters4000 N. E. 41st StreetSeattle, Washington 98105
Mr. Paul PietzshIowa Health Systems Agency221 Securities Building418 7th StreetDes Moines, Iowa 50309
Mrs. Nora PioreAssociate Director and Professor Health
Administration ~conomics)Ctr. for Comm. Health Sys., Columbia UnivNew York, New York 10032
Philip N. Reeves, D.B.A.Associate ProfessorDept. Health Care AdministrationThe George Washington UniversityWashington, D.C. 20052
Mrs. Dorothy P. RiceDirectorNational Center for Health StatisticsRoom 8-05Parklawn Bldg.
James M. Robey, Ph.D.Assoc. Director for Program DevelopmentNational Center for Health StatisticsRoom 8-11Parklawn Bldg.
Colin C. Rorrie, Ph.D.Deputy Director, Bur. of Health Planning and
Resource DevelopmentHealth Resources AdministrationRoom 11-11, Parklawn Bldg.
N. Phillip Ross, Ph.D.Acting Chief, Program Appraisal BranchBureau of Quality AssuranceHealth Services AdministrationRoom 13A-56, Parklawn Bldg.
Ms. Aleda V. RothDirector, Statistics DepartmentAmerican Nurses Association2420 Pershing RoadKansas City, Missouri 64108
Mr. Charles J. RothwellHead, Public Health Statistics BranchDivision of Health ServicesNorth Carolina Dept. of Human ResourcesRaleigh, North Carolina 27602
Donald Schneider, Ph.D.Director, Health Systems Management Eng.School of ManagementRensselaer Polytechnic InstituteTroy, New York 12181
Melvin S. Schwartz, M.D.Asst. Commissioner for BiostatisticsThe City of New York Dept. of Health125 Worth StreetNew York New York 10013
Mr. George E. SchwarzSenior Planner, New York-Pennsylvania Health
Planning Council. Inc.19 Chena;go StreetBinghamton, ~~ew York 13901
Ms. Mildred B. ShapiroAssociate Director, New York State Health Planning
CommissionEmpire State Plaza, Tower BuildingAlbany, New York 12237
Mr. Walt R. SimmonsStatistical Consultant1525 Belle Haven RoadAlexandria, Virginia22307
Mr. Jack C. Smith Chief,
Stat. Serv. Br., FPEDBureau of EpidemiologyCenter for Disease ControlAtlanta, Georgia 30333
454

Mr. William M. SpillaneChief, ADP Research BranchDivision of Operations, NCHSP. O. BOX 12214Res. Triangle Park, No. Carolina 27709
Mr. Edwin G. StephensonSenior Vice-President, Commission on Professional
and Hospital Activities1968 Green RoadAnn Arbor, Michigan 48105
Mr. Jonathan B. StevensAssistant Director, Coop. Health Info. Center of
Vermont, Inc.100 Dorset StreetSouth Burlington, Vermont 05401
W. Grady Stumbo, M.D.President and Clinical Family PhysicianEast Kentucky Health Services Center, Inc. Route 1,
“BOX 102AHindman, Kentucky 41822
Mr. Paul TallantProj. Leader, Health Resource StatisticsColorado Department of Health4210 East 1lth AvenueDenver, Colorado 80220
Mr. Marvin C. TempletonChief, Data Control BranchDivision of Vital Statistics, NCHSP. O. BOX 12214Res. Triangle Park, No. Carolina 27709
Edwin N. Thomas, Ph.D.Professor of Urban Sciences and GeographyCollege of Urban SciencesUniversity of IllinoisChicago, Illinois 60680
Mr. John T. TierneyDeputy DirectorRhode Island Department of Health’75 Davis Street “Providence, Rhode Island 02908
Mr. George D. Tipp, Jr.Marketing Representative-Hospital Serv.McDonnell-Douglas Company3131 S. Dixie DriveDayto,n, Ohio 45439
Mrs. Joan F. Van NostrandChief, Long Term Care Statistics BranchDiv. HeaIth Resources Utilization Statist.National Center for Health StatisticsRoom 9-45, Parldawn Bldg.
Ms. Ann Hamilton WalkerResearch AssociateR. I. Health Services Research, Inc.56 Pine StreetProvidence, Rhode Island 02903
Mr. Robert G. Webster528 Blair AvenuePiedmont, California94611
John E. Wennberg, M.D.P. O. BOX 26Waterbury Center, Vermont05677
Mr. Howard WestPrincipal AssociateMoshman Associates, Inc.6400 Goldsboro RoadWashington, D.C. 20034
Mr. Elijah L. WhiteAssociate Director for Data SystemsNational Center for Health StatisticsRoom 9-15Parklawn Bldg.
Kerr L. White, M.D.Professor of Health Care OrganizationSchool of Hygiene” and Public HealthThe Johns Hopkins UniversityBaltimore, Maryland 21205
Mr. Ronald W. WilsonAtg. Chief, Health Status and Demographic
Analysis, Division of AnalysisNational, Center for Health StatisticsRoom 8A-55, Parklawn Bldg.
Mr. Theodore D. WoolseyHealth Statistics Consultant ,8121 Rayburn RoadBethesda, Maryland20034
Donald E. Yett, Ph.D.Prof. of Economics/Comm. Medicine and Public
Health, Univ. of So. CaliforniaUniversity ParkLos Angeles, California 90007
455

Mr. Harvey E. ZimmermanSenior Research AssociateR. I. Health Services Research,56 Pine Street
Inc.
Providence, Rhode Island 02903
SESSION
Mrs. Margaret A. BarnesMath. Statistician and Project OfficerDivision of Planning Methods and Tech.BHPRD - HRARoom 12-14, Parklawn Bldg.
Mr. Daniel ZwickAssociate Administrator for Planning, Evaluation
and LegislationHealth Resources AdministrationRoom 1OA-56, Parklawn Bldg.
PROGRAM ORGANIZERS
Mr. philliD R. BeattieSpec. Ass;. for Program Dev. and Management,
Div. of OperationsNational Center for Health StatisticsRoom 8-29, Parklawn Building
Mr. Alan R. BoissyPublic Health AnalystBur. Health Plann. and Resources Dev.Room 12-14Parklawn Building
Mr. Clinton BurnhamChief, Survey Plann. & Dev. BranchDiv. Health Interview StatisticsNational Center for HeaIth StatisticsRoom 1223, Parklawn Building
Mr. Joseph L. CavanaughTechnical Assistance CoordinatorCHSS - NCHSRoom 8-44Parklawn Building
Mr. Loren E. ChancellorChief, Registration Methods BranchDivision of Vital StatisticsNational Center for Health StatisticsRoom 9A-37, Parklawn Bldg.
Joan C. Cornoni-Huntley, Ph.D.Special Assistant to Associate Director for R~searchNational Center for Health StatisticsRoom 8-37, Parklawn Building
Mr. Robert R. Fuchsberg -Director, Division of Health Interview StatisticsNational Center for Health StatisticsRoom 9-35, Parklawn Building
456
Mr. Garrie LoseeStatistician, Division of Cooperative Health Statistics
SystemNational Center for Health StatisticsRoom 8-49, Parklawn Bldg.
Miss Sue MeadsHealth Data SpecialistDiv. Coop. Health Statistics SystemNational Center for Health StatisticsParklawn Building
Robert H. Mugge, Ph.D.Assistant to the DirectorNational Center for Health StatisticsRoom 8-05Parklawn Building
Mr. Manoochehr K. NozaryChief, Technical Services Branch, Div. Health
Resources Utilization StatisticsNational Center for Health StatisticsRoom 9-45, Parklawn Building
Mr. John E. PattersonDirectorDivision of Vital StatisticsNational Center for Health StatisticsRoom 9A-55, Parklawn Bldg.
James M. Robey, Ph.D.Assoc- Director for Program DevelopmentNational Center for Health StatisticsRoom 8-11Parklawn Bldg.
Mr. Wilbur SartwellActing Deputy Assoc. DirectorDiv. Coop. Health Statistics SystemRoom 8-49Parklawn Building
Mr. George A. SchnackChief, Research Gordination StaffOffice of Statistical ResearchNational Center for Health StatisticsRoom 8-37, Parklawn Building

Mr. James A. Smith~hief, Conference Management BranchNational Center for Health StatisticsRoom 8-21Parklawn Building
Mr. William M. SpillaneChief, ADP Research BranchDivision of Operations, NCHSP. O. BOX 12214Res. Triangle Park, No. Carolina 27709
Mrs. Helen A. ThornberryDiv. Planning Methods and TechnologyBur. Health Plann. Resources and Dev.Health Resources AdministrationRoom 12-13, Parklawn Building
Mr. P. Douglas WilliamsActing Chief, Data Application and Research
Branch, CHSSNational Center for Health StatisticsRoom 8-51, Parklawn Bldg.
Mr. Ronald W. WilsonAtg. Chief, Health Status and Demographic
Analysis, Division of AnalysisNational Center for Health StatisticsRoom 8A-55, Parklawn Bldg.
Mr. Robert A. WrightStatistician, Medical ExpensesDivision of Health Interview StatisticsNational Cenrer for Health StatisticsRoom 9-33, Parklawn Bldg.
Mailing address for Parklawn Building is:5600 F;shers LaneRockville, Maryland 20852 ‘
STAFF OF THE PHCRS SECRETARIAT
Office of Program DevelopmentConference Management Branch
Mr. James A. Smith, Executive Secretary
Mrs. Barbara I. CostelloMrs. Mary Lou DundonMrs. Thelma G. FowlerMrs. Jean B. PetersenMiss Katherine W. Quillian
IU. S. GOVERNMENT PRINTING OFFICE : 1977 0-229-121
457 I
I