Public Expenditure Review for Health in Kenya
124
Staying ahead of the curve: challenges and opportunities for future spending on health in Kenya Kenya Public Expenditure Review for the Health Sector - FY2014/15-FY2019/20 Laura Di Giorgio Katelyn Jison Yoo Thomas Maina Public Disclosure Authorized Public Disclosure Authorized Public Disclosure Authorized Public Disclosure Authorized
-
Upload
khangminh22 -
Category
Documents
-
view
3 -
download
0
Transcript of Public Expenditure Review for Health in Kenya

Staying ahead of the curve: challenges and opportunities
for future spending on health in Kenya
Kenya Public Expenditure Review for the Health Sector - FY2014/15-FY2019/20
Laura Di GiorgioKatelyn Jison Yoo
Thomas Maina
Pub
lic D
iscl
osur
e A
utho
rized
Pub
lic D
iscl
osur
e A
utho
rized
Pub
lic D
iscl
osur
e A
utho
rized
Pub
lic D
iscl
osur
e A
utho
rized

July 1, 2022Report No: AUS0002841
Staying ahead of the curve: challenges and opportunities for future spending on health in Kenya
Kenya Public Expenditure Review for the Health Sector - FY2014/15-FY2019/20
Laura Di Giorgio, Katelyn Jison Yoo, Thomas Maina World Bank, Health, Nutrition, and Population Global Practice.
This interactive document has been optimised for use on computers and tablets in portrait orientation. To return to the table of contents at anytime please tap or click on the hand symbol (see right) located at the top of each page.
© World Bank, Health, Nutrition, and Population Global Practice.
1818 H Street NW, Washington DC 20433
Internet: www.worldbank.org Telephone: 202 473 1000
Some rights reserved
This work is a product of the staff of The World Bank. The findings, interpretations, and conclusions expressed in this work do not necessarily reflect the views of the Executive Directors of The World Bank or the governments they represent. The World Bank does not guarantee the accuracy of the data included in this work. The boundaries, colors, denominations, and other information shown on any map in this work do not imply any judgment on the part of The World Bank concerning the legal status of any territory or the endorsement or acceptance of such boundaries.
Rights and Permissions
The material in this work is subject to copyright. Because The World Bank encourages dissemination of its knowledge, this work may be reproduced, in whole or in part, for noncommercial purposes as long as full attribution to this work is given.
Attribution—Please cite the work as follows: “World Bank. 2022. Kenya Public Expenditure Review for the Health Sector FY2014/15-FY2019/20. © World Bank.”
All queries on rights and licenses, including subsidiary rights, should be addressed to World Bank Publications, The World Bank Group, 1818 H Street NW, Washington, DC 20433, USA; fax: 202-522-2625; e-mail: [email protected]
Cover image and graphic design- David Lloyd

Abbreviations iii
Acknowledgments v
Executive Summary vi
1.0 Introduction 01
1.1 Objectives of the PER for Health 03
1.2 Data Sources and Limitations 04
2.0 The Healthcare Delivery System in Kenya 09
2.1 Health System Organization and Infrastructure 10
2.2 Demographics and Health Status 16
2.3 The UHC Agenda and Health Financing Strategy 19
3.0 Health Expenditure 25
3.1 International Comparison of Health Spending 26
3.2 Sources of Health Financing 28
3.3 Trends in Public Health Expenditure 30
3.4 Composition of Public Health Expenditures 33
3.4.1 Health Sector Budget Execution/Absorption 33
3.4.2 Health Sector Pending Bills 36
3.5 National Government Health Spending 38
3.5.1 MoH Spending by Recurrent and Development 39
3.5.2 MoH Spending by Economic Categories 39
3.5.3 National Government Health Spending by Functional Classification 40
Contents
Staying ahead of the curve: challenges and opportunities for future spending on health in Kenya
Kenya Public Expenditure Review for the Health Sector - FY2014/15-FY2019/20
i

3.6 County Government Health Spending 42
3.6.1 County Health Spending by Recurrent and Development 42
3.6.2 County Health Spending by Economic 44
3.7 Intergovernmental Fiscal Transfers and Funds Flow 45
3.8 Government’s Budgetary Response and Impact of the COVID-19 Pandemic 54
3.9 Out-of-pocket Spending and Health Insurance Reforms 59
4.0 Performance of the Kenyan Public Health System 64
4.1 Equity Analysis 65
4.2 Efficiency Analysis 72
4.2.1 Translating Health Expenditure into Health Outputs and Health Outcomes 72
4.2.2 Micro-level Inefficiencies in Kenya’s Health System 78
4.2.3 Human Resources for Health 78
5.0 Conclusions and Recommendations 88
Contents
ii Contents

BIA Benefit Incidence Analysis
BOOST The Open Budgets Portal line item fiscal data
CDoH County Departments of Health
CoB Controller of Budget
CRA Commission on Revenue Allocation
CRF County Revenue Fund
CVD Cardiovascular Diseases
DEA Data Envelop Analysis
DFID Department for International Development
DHS Demographic and Health Surveys
DMUs Decision-making Units
DPHK Development Partners for Health Kenya
FBO Faith-Based Organization
FY Fiscal Year
GDP Gross Domestic Product
GHED Global Health Expenditure Database
GoK Government of Kenya
HISP Health Insurance Subsidies for the Poor
HIV Human Immunodeficiency Virus
HMIS Health Management Information System
HRH Human Resources for Health
HSSF Health Sector Services Fund
IFMIS Integrated Financial Management System
IMR Infant Mortality Rate
IPPD Integrated Payroll Processing Database
ITNs Insecticide-Treated Nets
KDHS Kenya Demographic and Health Survey
KEMSA Kenya Medical Supplies Agency
KHHEUS Kenya Household Health Expenditure and Utilization Survey
Abbreviations
Staying ahead of the curve: challenges and opportunities for future spending on health in Kenya
Kenya Public Expenditure Review for the Health Sector - FY2014/15-FY2019/20
iii

KIHBS Kenya Integrated Household Budget Survey
KNBS Kenya National Bureau of Statistics
K Sh Kenya Shillings
MICs Middle-Income Countries
MMR Maternal Mortality Rate
MoH Ministry of Health
MoU Memorandum of Understanding
MTEF Medium-Term Expenditure Framework
NCD Noncommunicable Diseases
NGO Nongovernmental Organization
NHA National Health Accounts
NHIF National Health Insurance Fund
OOP Out-of-Pocket
OSR Own Source Revenue
PBB Program-Based Budgeting
PER Public Expenditure Review
PETS Public Expenditure Tracking Survey
PFM Public Financial Management
PHC Primary Health Care
PHMs Public Health Midwives
SAGA Semi-autonomous Agencies
SDI Service Delivery Indicators
SPA Special Purpose Account
SSA Sub-Saharan Africa
THE Total Health Expenditure
UHC Universal Health Coverage
UMR Under-five Mortality Rate
USAID U.S. Agency for International Development
VCT Voluntary Counselling and Testing
WDI World Development Indicators
WHO World Health Organization
Abbreviations
iv Abbreviations

Acknowledgments
This report was developed under the aegis of the Kenya Public Expenditure Review 2021/22.
The report was produced by a team from the World Bank’s Health, Nutrition, and Population Global Practice. The team was led by Laura Di Giorgio (Senior Economist) and the report was co-authored with Katelyn Jison Yoo (WBG Analyst) and Thomas Maina (World Bank Consultant). The team received valuable comments on the analyses and findings interpretation from Jane Chuma (Senior Economist), Toni Lee Kuguru (Senior Health Specialist), and Kenneth Munge Kabubei (Economist). We are thankful to Carol Bisieri Onsomu (World Bank Consultant) for supporting data gathering and Alex Sienaert (Senior Economist) for coordination support. The team would also like to thank peer reviewers Owen K. Smith (Senior Economist), Michael Kent Ranson (Senior Economist), and Camille Lampart Nuamah for the valuable insights.
The team would like to extend its sincere gratitude to counterparts in the Kenyan government, including staff of the National Treasury, the Ministry of Health, and the Counties Departments of Health and Finance. In particular, the authors would like to thank Samuel Kiiru (Chief Economist) and Alex Riithi (Economist) in the Budget Department at National Treasury and the technical team at the Ministry of Health, including Stephen Macharia (Chief Economist), David Njuguna (Senior Economist), Henry Onyiego (Principal Economist), Terry Watiri (Senior Economist), and Stephen Kaboro (Senior Economist).
Editing support was provided by Carollyne Hutter and graphic design by David Lloyd.
Staying ahead of the curve: challenges and opportunities for future spending on health in Kenya
Kenya Public Expenditure Review for the Health Sector - FY2014/15-FY2019/20
v

Executive Summary

Background and Scope of the Public Expenditure Review
In 2017, the Kenyan government made a strong commitment to achieve universal health coverage (UHC) as one of the Big 4 Agenda by the year 2022 and started designing and implementing priority reforms to accelerate progress. These reforms included the following: increasing the share of (mandatory) pooled resources through a health insurance-based mechanism built on the existing National Health Insurance Fund (NHIF); enhancing the capacity of the NHIF to function as a strategic purchaser of health services; expanding coverage of health services equitably through an emphasis on primary healthcare (PHC); and improving public financial management (PFM) arrangements to enhance effectiveness of public funds in the devolved health sector.
This Public Expenditure Review (PER) describes and analyzes health spending patterns in Kenya during the past six years and vis-à-vis the UHC objectives set by the Government of Kenya (GoK): expanding access to adequate and quality health care for all Kenyans without incurring financial hardship. It looks at both national, through the Ministry of Health (MoH), and county levels spending through the respective departments in Kenya, using multiple data sources and covering the period fiscal year (FY)2014/15 to FY2019/20. To understand the changing health financing structure, this report discusses the changing donor financing landscape and the role of out of pocket (OOP) spending on health. It gives particular attention to changes in health spending between national and county level, equity considerations at county level, and enabling factors that significantly affect spending and service delivery, such as public financial management (PFM) systems. It also looks at the government’s budgetary response to COVID-19 pandemic and its impact on overall spending on health. In addition, it explores in details issues related to equity, efficiency, and effectiveness in spending through the UHC lens.
Key Findings of the Public Expenditure Review on Health
This PER provides very positive evidence about Kenya’s overall health system and health financing performance as well as progress over time. To achieve upper middle-income country aspirations, Kenya will need to remain ahead of the curve by continuing to make progress on UHC—especially in light of the demographic and epidemiological changes—and addressing critical gaps, with a focus on improving inefficiencies. In terms of access to health services, the data for Kenya show that life expectancy has increased much faster than its neighbors, health outcomes have generally improved, and socioeconomic differences disparities in access have reduced. From the health financing side,
Staying ahead of the curve: challenges and opportunities for future spending on health in Kenya
Kenya Public Expenditure Review for the Health Sector - FY2014/15-FY2019/20
vii

budget execution in Kenya has improved significantly in the last few years, the incidence of catastrophic OOP has fallen, the OOP share is generally low, and overall government spending levels are in line with the level of economic development. Consolidating such gains and reaching performance of upper-middle income countries will require a continued commitment to UHC through the equity lens and adjustments to the changing needs of the population.
Over the past decade, Kenya made major improvements on access and utilization of quality care and, as a result, on health outcomes. However, challenges still remain, especially on important health outcomes around birth-related mortality and child malnutrition. Under-five mortality and infant mortality rates were halved between 2003 and 2014; however, neonatal mortality experienced a much slower rate of decline with more than 42 percent of deaths under five years of age occurring in the first month of life. The nutrition status of the population improved since 2003, but more than one in four children under five remain stunted. It is important to note that most health indicators rely on the latest Demographic and Health Surveys (DHS), which reflects health status in 2014. The next round of DHS expected in 2023 will be critical to understand progress from 2014 to date.
Kenya is experiencing demographic and epidemiological transitions that will impact the type and frequency of care demanded. These transitions will require redesigning service delivery models while better managing public spending on health. Even though such communicable diseases as HIV/AIDS, respiratory infections, and tuberculosis remain among the top leading causes of mortality in Kenya, cardiovascular diseases (CVDs) and other noncommunicable diseases (NCDs) are now a major cause of morbidity and mortality. Mental disorders are also increasingly contributing to disability in Kenya. The World Health Organization (WHO) estimates that such NCDs as cancers, diabetes and others account for 27 percent of the total deaths and more than 50 percent of total hospital admissions in Kenya.
Kenya faces a changing health financing landscape with the government taking an increasing role, while contributions from donors and corporations shrink. Over the past 20 years, the government’s contribution to financing health care increased from 27 percent of total health expenditure in 2009/10 to about 52 percent in 2018/19 (latest data available). During the same period, the role of households declined from 30 percent of total health expenditures in FY2009/10 to 24 percent in FY2018/19, while donor financing almost halved from 32 percent to 18 percent. While COVID-19 might lead to a temporary injection of additional donor money in the health sector in light of the greater needs, the steady downward trend in donor financing is expected to continue in the coming years, suggesting the need for the country to start planning for a sustainable donor transition.
viii Executive Summary

The substantial increases in health spending at both national and county level in the recent years coupled with sector reforms put Kenya on the right path toward UHC, given its current level of economic development. Moving forward, Kenya will need to preserve spending on health during periods of tight fiscal situations, such as the current one, and continue increasing spending on health as the economy and available resources grow over the medium term. In absolute terms, total public spending on health more than doubled from K Sh 96 billion in FY2014/15 to K Sh 228 billion in FY2019/20, surpassing for the first-time the 2 percent of gross domestic product (GDP) mark. Kenya’s spending on health as a percent of GDP is higher than its peers in the region, but it is relatively lower than the average for lower middle-income countries and lower than the average for countries to which Kenya aspires. Despite stagnation over the past years, Kenya may be at a tipping point given its increasing ability to mobilize resources for health, coupled with improved capacity to raise government revenue and prioritization of the health sector in the latest fiscal years. However, the expanding public debt and the COVID-19 pandemic are expected to negatively affect the country’s ability to generate revenues in the short term and therefore limit its capacity to increase public spending on health in the coming years, thus slowing down the speed at which the country may progress toward the UHC agenda. During years of austerity, Kenya will need to preserve spending on health, while improving the value for money of existing resources. The “optimal” health spending level will increase as GDP grows.
In terms of trend in the composition of public health expenditure by level of government, the national government seems to have taken up a bigger role in the financing of the health sector over the past fiscal year, as compared to previous years following devolution. From FY 2014/15 to FY2018/19, county governments consistently accounted for 60 percent and above of total government spending on health. With the onset of COVID-19 and the increasing attention by the national government through the MoH toward the UHC agenda, the share of the national government to total health spending increased substantially from 40 percent to about 47 percent of total public spending on health. Over the next few years, it will be even more important to clearly define roles and responsibilities between national government and counties’ governments; the ongoing discussion on the role of conditional grants is expected to further shape this equilibrium.
Capacity across the PFM areas (such as planning, budgeting, allocation, and execution of approved budget at both levels of the government) has improved over time. However, resources remain unspent, despite chronic resource gaps for the UHC agenda. The share of MoH’s health budget that was spent increased from 69 percent in FY2014/15 to about 90 percent in FY2019/20. Budget execution by the county governments increased from 80 percent in FY2014/15 to 88 percent in FY2019/20. Systemic weaknesses in PFM systems largely explain the suboptimal
Staying ahead of the curve: challenges and opportunities for future spending on health in Kenya
Kenya Public Expenditure Review for the Health Sector - FY2014/15-FY2019/20
ix

budget execution rates, not only in the health sector, but generally in the entire public sector. Suboptimal budget executions are generally occasioned by inadequate and delayed funds releases because of lack of liquidity and budgetary provision from the National Treasury, as consequence of which pending bills have accumulated, negatively affecting the implementation of planned activities at both levels of the government.
The changes in the composition of MoH expenditure by health sector program reflect the changing role of the national government in the health sector and the commitment to the UHC agenda with increasing spending on health policy, standards and regulation (from 11 percent in FY2014/15 to 42 percent in FY2019/20 of the total spending from the MOH) and on social protection programs, such as the free maternity program and health insurance subsidies for the poor or elderly. However, spending patterns also point to increased spending on national referral and specialized services, including specialized equipment, and declining spending on preventive and promotive health, the backbone of UHC.
Health spending in Kenya is skewed toward secondary and tertiary curative care, calling for a revision of the resource allocation to prioritize spending in primary health care (PHC) to promote equity and efficiency. The PER shows that GoK prioritizes financing of specialized care rather than PHC, the foundation to achieving UHC. If the government is to make progress toward UHC in a sustainable way, it needs to prioritize investments in PHC moving forward. This is especially the case in light of the increasing burden from NCDs and the high burden from communicable diseases that are preventable, both of which will require investments in prevention and routine services for chronic diseases, many of which can be provided at the PHC level.
At the county level, there is a continuous increase in spending for employee compensation and declining development expenditure, while the share of spending for operations and maintenance remains constant. Further analysis of personnel costs demonstrated that while salary increases among staff at the national level have mostly benefitted the lower paid groups, at the county level the opposite holds true, with large salary increases among few staff holding the highest job positions.
Kenya is to be commended on the progress on financial protection, as the reforms implemented have successfully reduced the incidence of catastrophic health spending. Nevertheless, catastrophic spending continues to drive a large number of people into poverty and the negative effects of the pandemic may further increase the number of people falling poor because of health-related costs. The incidence of catastrophic health spending has declined from about 13 percent in 2013 to 8 percent in 2018. However, before the COVID pandemic struck, more than 1 million Kenyans were still falling into poverty every
x Executive Summary

year due to catastrophic spending. In 2020, the pandemic alone pushed an additional 2 million people into poverty1. Unexpected health expenditures through OOP payments will cause additional suffering among the new poor and the near poor. Another major concern is that a large proportion of the sick population in need of health care does not seek medical care because of the high cost of care and low quality of care at primary care level.
The complex and fragmented funds flow system resulting from the devolution process has introduced PFM and health financing challenges that impact on service delivery, particularly in PHC. Devolution has fundamentally changed the way resources flow through the health system, giving a greater control and discretion for health planning, budgeting, and spending to county governments, but less to the frontline. It introduced the requirement that all funds for services provided at the county level have to be aggregated and flow through the county revenue fund (CRF), including all conditional grants that are earmarked from the national government for the achievement of specific health sector objectives, as well as other revenue generated as service delivery points. This requirement translated into loss of revenue and autonomy in the management of resources by service providers and health facilities. For example, revenue from user fees that health facilities could previously retain is now sent to the CRF, resulting in these facilities losing resources that are critical for covering day-to-day operational costs for service delivery, notwithstanding the fiscal autonomy that incentivizes them to continue providing essential health services.
While the GoK responded well to the COVID-19 pandemic in terms of making available adequate resources in a timely manner, several challenges related to the process and timing of budget revision were identified. These challenges include budget performance information, such as exchequer issues and incurred expenditure that were not considered during the supplementary budget process as well as assenting of the budget by parliament late in the financial year and, therefore, leaving the spending without adequate time to implement activities that were included in the revised budgets.
Recent equity analyses demonstrate that generally Kenya has made significant progress on reducing socioeconomic disparities in access to care and in health outputs and outcomes, yet a considerable socioeconomic gradient remains in some areas. For example, infant mortality decreased much faster among the poorest such that currently, the differences among income quantiles are minimal. However, children in the top wealth quintile and with more educated mothers experienced much lower stunting rates across all years. Public facilities, including hospitals, were found to be accessible and used by everyone independently on income, while public facilities at the primary level were found to be pro poor. However, there are marked pro-rich inequality and inequity in care in
1 World Bank. June 2021. Rising Above the Waves, Kenya Economic Update. https://documents1.worldbank.org/curated/en/782411624966067020/pdf/Kenya-Economic-Update-Rising-Above-the-Waves.pdf
Staying ahead of the curve: challenges and opportunities for future spending on health in Kenya
Kenya Public Expenditure Review for the Health Sector - FY2014/15-FY2019/20
xi

private and nonprofit or faith-based facilities, even after controlling for care needs, and likely in the access to highly specialized public hospitals.
Kenya is on the path toward increasing demand side financing. As an increasing share of funds is channeled through the NHIF (such as through the expansion of subsidies to enroll the most vulnerable population groups in the national health insurance scheme), the share of demand-side financing will grow vis-à-vis the share of supply-side financing. However, significant supply side gaps remain which affect the quality of care, especially at primary health-care facilities.
The PER has identified significant opportunities to increase value for money for the health sector. Increasing efficiency of public spending will be of even greater importance in the coming years, as fiscal space to increase spending on health is likely to be limited. A simple comparison of health spending vis-à-vis service coverage and health outcomes shows that Kenya is not achieving the highest return on investments as compared with regional peers and aspiring countries. Similarly, using institutional deliveries and infant mortality as an example, the PER shows weak correlation between financing, outputs, and outcomes. This situation is confirmed by an in-depth analysis of county-level technical efficiency, which found opportunities to increase results (average efficiency was 85 percent). Sources of inefficiencies were found across various dimensions, such as inefficiencies related to processes for devolved functions, to the suboptimal management of inputs, governance, and transparency challenges (including the need for better and more frequent data), and increasing spending on specialized care and equipment at the expenses of quality primary care. The substantial inefficiencies related to human resources for health (HRH) are noteworthy, in particular one of the highest rates of absenteeism in Africa and inadequate capacity to correctly diagnose and treat patients for common health conditions. Potential savings from absenteeism alone are estimated at $58 million2 in FY 2019/20 and amounts to approximately 5 percent of total health expenditure in the same year. The PER also reports on significant inefficiencies in the allocation and use of medical equipment.
Policy recommendations:
I. To continue on the right path toward UHC, spending on social sectors should be protected within the context of the overall tight fiscal situation and increased over the medium and long term, as the economy and available resources grow. Kenya’s health spending has increased and is currently in line with its levels of economic development. Greater prioritization of the health sector has allowed Kenya to make
2 Please note all dollar amounts are in U.S. dollars, unless noted.
xii Executive Summary
progress on both coverage of health services and financial protection. As the country manages the current tight fiscal situation caused by the pandemic, it is paramount to protect current levels of spending in health and in other social sectors that are critical for health determinants.
II. While protecting spending on social sectors, concerted efforts are needed to tackle the largest sources of inefficiency within the health sector and increase the value for money of public spending. This includes, among others, prioritizing quality PHC services rather than highly specialized health services at the hospital level and reducing inputs related inefficiencies, especially in terms of availability and competencies of human resources for health, medical equipment, and medical supplies.
III. The move from coverage to effective coverage will require improvements in the quality of care and addressing inputs-related inefficiencies. The Kenyan government should create an appropriate framework to incentivize and monitor health workers to be present at health facilities and deliver quality services to patients. Human resource management systems could be strengthened, and additional challenges related to HRH motivation and retention addressed. HRH skills and capabilities could be increased by moving toward competency-based training models, by supporting professional development, and by equipping health facilities with adequate medical supplies and equipment that allow providers to do their job well.
IV. Continue prioritizing investments in disadvantaged geographic areas and population groups to further narrow socio-economic inequalities, alongside efforts to expand UHC. Collecting and monitoring data disaggregated by socio-economic characteristics is the first step to better tackle inequities in access to and use of quality health care and in health outcomes. Further expansion of programs to support vulnerable and disadvantaged population groups, including through the expansion of health insurance subsidies and coverage of essential medicines, will be essential to make further strides on the reduction of inequality and inequity in the country.
V. Implement strategies to continue improving budget execution, absorption of development budget, and disbursement of funds from the exchequer. Budget execution has improved significantly over time. Remaining capacity constraints should be addressed through capacity building on planning, budget preparation, budget management, and execution. Alignment and linking of the project implementation cycle to budgeting process and timely release of funds would contribute to improved budget absorption.
Staying ahead of the curve: challenges and opportunities for future spending on health in Kenya
Kenya Public Expenditure Review for the Health Sector - FY2014/15-FY2019/20
xiii

VI. Improve monitoring and governance systems to accelerate progress toward upper-middle-income countries health targets. This could include further strengthening and institutionalizing the annual sector review both at the national and the county level. Also increase investments in health management and information systems to generate timely and useful information for planning and budgeting, monitoring of performance monitoring, and overall benchmarking.
VII. Consider introducing reforms to accelerate the flow of resources to front line facilities and strengthen the linkages between payment and performance and achievement of results. The national government should work with the county governments to explore potential PFM-related reforms that could be implemented to ensure conditional grants flow directly to health and other frontline facilities, rather than cascading slowly and irregularly through the different layers of the intergovernmental financing framework.
VIII. Have counties work with the national level to explore ways of giving greater autonomy to health facilities starting with Level 5 hospitals to improve effective purchasing of health services. The reform on granting autonomy to health facilities should go hand in hand with reforms to enhance management capacity and accountability of health facilities.
IX. Appropriately manage the long-term gradual shift from supply-side financing to demand-side financing to ensure the health system is ready to provide quality services to its citizens. While nearly all low-income countries rely on line-item budgeting (supply-side financing), nearly all OECD countries rely on systems where the “money follows the patient” (demand-side financing). The transition from supply-side financing to demand-side financing happens in middle-income countries, and requires improving accountability across the system, such as stronger provider autonomy, health information systems, and good systems to measure and track quality of care, among others. Making this transition requires ensuring that supply-side issues have been addressed to ensure that people have access to care. Until then, the country will need to continue moving forward with both supply-side and demand side financing, focusing on ensuring supply readiness to provide quality care. Moreover, as the country increases demand-driven financing, it will be critical to maintain an equity lens and support the most vulnerable population groups.
xiv Executive Summary

Introduction
1.0
The Public Expenditure Review (PER) 2020-2021 was motivated by an unexpected increase in public debt stock and the need to provide the Government of Kenya (GoK) with options for fiscal consolidation, both in terms of cuts in expenditure and increases in revenue, to ensure macroeconomic stability. This was the main focus of the first module, the PER 2020-2021. As part of Module 2, the PER aimed at exploring the analysis of public spending in health, with a focus on efficiency, effectiveness, and equity aspects. It built on previous analyses, including the recent study on “Making Devolution Work for Service Delivery”.
The Universal Health Coverage (UHC) agenda remains a priority for the Kenyan government, both from a human development and an economic point of view. On one side, as countries become richer, the demand for quality health care increases, and so do expenditure for health. Compelling evidence suggests that investments in health are critical to boost accumulation of human capital and strengthen its resilience to shocks, which in turn increases a country’s productivity, economic growth, and overall resilience.
Before the COVID-19 pandemic hit, questions focused on whether Kenya spends public resources effectively and efficiently and how the government can fast track progress toward UHC in a context of fiscal constraints. Improved efficiency and effectiveness can free up important resources that can be redirected toward other priorities in the sector, or it can yield a higher return on investments by achieving more with the same level of investments. This PER assesses the efficiency of the health systems, quantifies potential savings from addressing prioritized inefficiencies, and provides recommendations on how to address them. The PER also investigates how equitable resources are spent and whether people are financially protected against catastrophic expenditure. While efficiency and equity analyses can be used to improve the use of existing resources, achieving UHC in Kenya necessarily requires increasing the amount of public resources for health.
The health and economic shocks from the COVID-19 pandemic have brought profound health, economic, and social changes that have significantly affected the type of questions governments face. The immediate question that governments had to answer in 2020 was how to create the fiscal space to provide an immediate response to the pandemic, including resources to protect people, jobs, and businesses.
This PER provides an analysis of the budgetary response for health to the pandemic. With the health shock turning into one of the deepest economic shocks in history, the government will need to decide how to continue financing the UHC agenda under a scenario of expected lower general revenue. Kenya will face difficult decisions to ensure the following: (1) essential services continue to be delivered to preserve human capital in the country and ensure that gains made over the past years in terms of better health outcomes and financial protection are not reversed; (2) financing is readily available to continue protecting people from
02 Introduction

the impacts of the pandemic; including through mass vaccination programs; and (3) additional resources are injected in the health sector to continue making progress on the UHC agenda, including improving quality of care and expanding subsidies for health insurance. With lower overall public revenue and a downward trend in donor support, maintaining the previous levels of health spending will require increasing the share of funds allocated to the health sector. Additional increases in spending per capita would require further prioritization of the health sector. Under the current scenario, it will be paramount to maximize the efficiency and effectiveness of public spending overall and prioritize how to use public resources to support the population groups with the greatest needs.
1.1 Objectives of the PER for Health
This report analyzes public expenditure for health from FY2014/15 to FY2019/20 to explore in detail issues related to equity, efficiency, and effectiveness of health spending, taking into account the UHC objectives. It also reports on progress to date vis-à-vis the priorities identified in previous PERs (2014 PER covering the period FY2010/11-FY2011/12 and PER 2017 covering FY2012/13-FY2015/16). It discusses the extent to which the reforms undertaken over the past years have contributed to the country’s objectives toward UHC on expanding access to quality health services for all Kenyans without incurring financial hardship. To understand the changing health financing structure, the report looks at changes in donor (on budget and off budget) and private health spending. It gives particular attention to changes in health spending between national and county level, equity considerations at county level, and enabling factors that significantly affect spending and service delivery, such as public financial management systems. It reports on the government’s response to COVID-19 pandemic in terms of budgetary and expenditure changes undertaken to address the emergency and budgetary implications for the future.
Previous PERs of the health sector in Kenya identified seven priorities for improving the efficiency, effectiveness, and equity of health spending (Table 1). In terms of total health spending, the analyses reported insufficient government spending, decreasing donor funding, and overreliance on out-of-pocket (OOP) spending. They also flagged the need to increase budget execution and spending at the county level for health. They also reported sources of inefficiencies that lead to suboptimal outcomes, such as skewed expenditure toward specialized curative services and large share of resources spent for salaries.
Staying ahead of the curve: challenges and opportunities for future spending on health in Kenya
Kenya Public Expenditure Review for the Health Sector - FY2014/15-FY2019/20
03
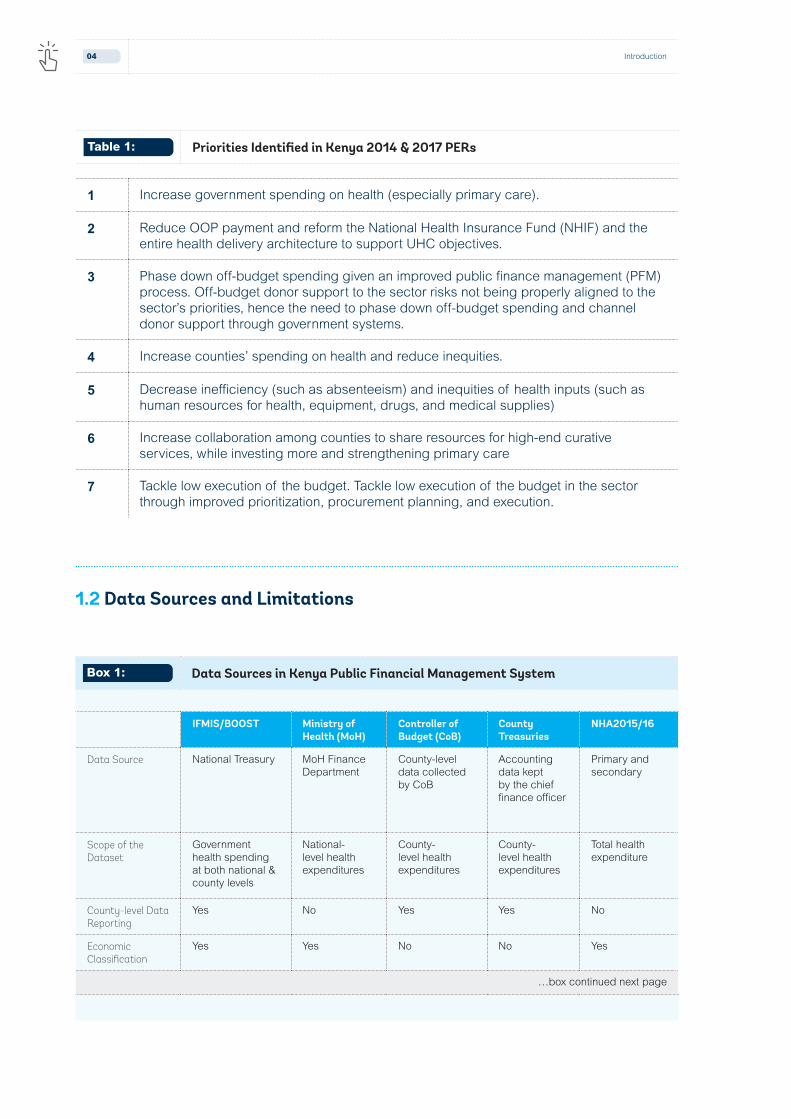
1 Increase government spending on health (especially primary care).
2 Reduce OOP payment and reform the National Health Insurance Fund (NHIF) and the entire health delivery architecture to support UHC objectives.
3 Phase down off-budget spending given an improved public finance management (PFM) process. Off-budget donor support to the sector risks not being properly aligned to the sector’s priorities, hence the need to phase down off-budget spending and channel donor support through government systems.
4 Increase counties’ spending on health and reduce inequities.
5 Decrease inefficiency (such as absenteeism) and inequities of health inputs (such as human resources for health, equipment, drugs, and medical supplies)
6 Increase collaboration among counties to share resources for high-end curative services, while investing more and strengthening primary care
7 Tackle low execution of the budget. Tackle low execution of the budget in the sector through improved prioritization, procurement planning, and execution.
Table 1: Priorities Identified in Kenya 2014 & 2017 PERs
1.2 Data Sources and Limitations
IFMIS/BOOST Ministry of Health (MoH)
Controller of Budget (CoB)
County Treasuries
NHA2015/16
Data Source National Treasury MoH Finance Department
County-level data collected by CoB
Accounting data kept by the chief finance officer
Primary and secondary
Scope of the Dataset
Government health spending at both national & county levels
National-level health expenditures
County-level health expenditures
County-level health expenditures
Total health expenditure
County-level Data Reporting
Yes No Yes Yes No
Economic Classification
Yes Yes No No Yes
…box continued next page
Box 1: Data Sources in Kenya Public Financial Management System
04 Introduction
IFMIS/BOOST Ministry of Health (MoH)
Controller of Budget (CoB)
County Treasuries
NHA2015/16
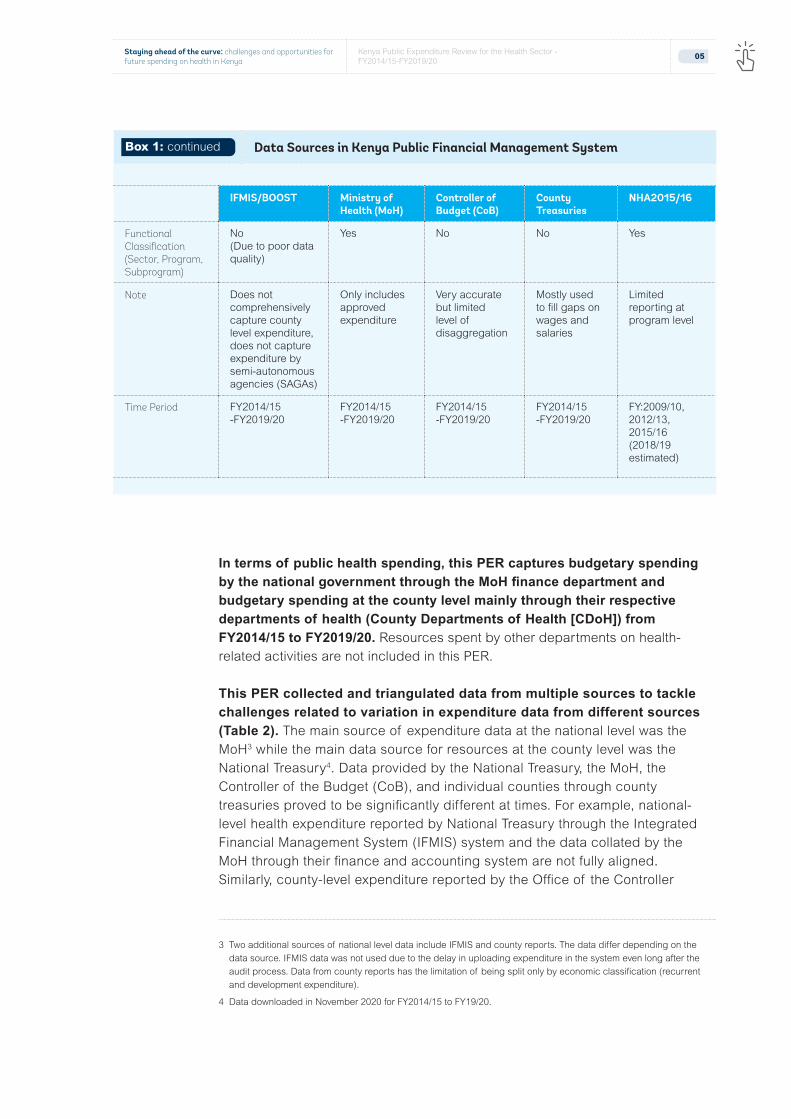
Functional Classification (Sector, Program, Subprogram)
No(Due to poor data quality)
Yes No No Yes
Note Does not comprehensively capture county level expenditure, does not capture expenditure by semi-autonomous agencies (SAGAs)
Only includes approved expenditure
Very accurate but limited level of disaggregation
Mostly used to fill gaps on wages and salaries
Limited reporting at program level
Time Period FY2014/15 -FY2019/20
FY2014/15 -FY2019/20
FY2014/15 -FY2019/20
FY2014/15 -FY2019/20
FY:2009/10, 2012/13, 2015/16 (2018/19 estimated)
In terms of public health spending, this PER captures budgetary spending by the national government through the MoH finance department and budgetary spending at the county level mainly through their respective departments of health (County Departments of Health [CDoH]) from FY2014/15 to FY2019/20. Resources spent by other departments on health-related activities are not included in this PER.
This PER collected and triangulated data from multiple sources to tackle challenges related to variation in expenditure data from different sources (Table 2). The main source of expenditure data at the national level was the MoH3 while the main data source for resources at the county level was the National Treasury4. Data provided by the National Treasury, the MoH, the Controller of the Budget (CoB), and individual counties through county treasuries proved to be significantly different at times. For example, national-level health expenditure reported by National Treasury through the Integrated Financial Management System (IFMIS) system and the data collated by the MoH through their finance and accounting system are not fully aligned. Similarly, county-level expenditure reported by the Office of the Controller
3 Two additional sources of national level data include IFMIS and county reports. The data differ depending on the data source. IFMIS data was not used due to the delay in uploading expenditure in the system even long after the audit process. Data from county reports has the limitation of being split only by economic classification (recurrent and development expenditure).
4 Data downloaded in November 2020 for FY2014/15 to FY19/20.
Box 1: continued Data Sources in Kenya Public Financial Management System
Staying ahead of the curve: challenges and opportunities for future spending on health in Kenya
Kenya Public Expenditure Review for the Health Sector - FY2014/15-FY2019/20
05

of Budget through the Consolidated County Governments Budget Implementation Review Reports and by the National Treasury through the IFMIS system are not fully aligned. Such inconsistencies included the lack of budget and expenditure for personnel in specific fiscal years for some counties in CoB or the lack of development expenditure in the IFMIS/BOOST.
Multiple factors drove such data discrepancies, including failure to upload data on time in the IFMIS, failure or delay to capture budget and expenditure data on locally generated budget revenue, missing salaries, and wages data in counties that manage human resources through a separate department dedicated to management of county human resources issues (such as Turkana, Kilifi, and Baringo) and miscoding of budget and expenditure data for medical commodities. To address inconsistencies in county-level data generated from National Treasury IFMIS, we collected complementary data from the Annual Consolidated County Governments Budget Implementation Review Reports compiled by the CoB.
Efficiency and equity analyses, as well as international comparisons, relied on multiple data sources, leveraging the rich availability of studies conducted in Kenya. The datasets included World Bank’s World Development Indicator (WDI), WHO’s Global Health Expenditure Database (GHED), National Health Account (NHA) surveys, Demographic and Health Survey (DHS), Kenya Household Health Expenditure and Utilization Survey (KHHEUS) 2018, and Service Delivery Indicators (SDI) survey. Table 2 summarizes how each data source was used. For international benchmarking we followed the categorization used in the Kenya Systematic Country Diagnostic and compared Kenya to its neighboring countries (Tanzania, Uganda, Ghana, Ethiopia, and Rwanda), countries in the same income group as per World Bank categorization, that is, lower-middle income and to aspirational peers, that is, countries with economic structure or economic performance that Kenya would like to emulate as it aspires to reach middle-income status. These countries include Vietnam, India, Malaysia, Sri Lanka, Bangladesh, Thailand, and South Africa.
06 Introduction

Type of data Data Source Scope/Comments
Expenditure data
National-level Ministry of Health Figures from the MoH data differed from those from the National Treasury.
County-level National Treasury + Controller of Budget County Treasury data
Data inconsistencies/missing data filled in using CoB reports and county treasury data.
Drugs Expenditure Kenya Medical Supplies Agency (KEMSA)
Data for procured and donated commodities. Donated commodities were valued using unit costs (rather than selling price).
Total Health Expenditure
NHA 2009/2010-2020/21 NHA 2020/21 is the latest available.
Comparison Purposes
GHED, WDI Benchmarking Kenya vis-à-vis peers and aspiring countries.
Health Sector Inputs
Human Resources for Health
Staffing data at national and county level
A novel dataset using the Integrated Personnel and Payroll Database (IPPD) was created to map human resources for health (HRH) data to counties (payroll and staff registries).
Health Facilities Number, ownership of health facilities
Kenya Master Facility List
Survey Data
KHHEUS 2018 Service utilization by socio-economic status,OOP and health insurance enrollment
KHHEUS 2018 Survey was the source of estimated catastrophic and impoverishing out-of-pocket spending, estimated inequality and inequity in health care utilization and their drivers, health insurance enrollment, and health service utilization.
KDHS 2014, IHME, HEFPI
Health outputs and outcomes The 2014 Kenya DHS, Institute for Health Metrics and Evaluation (IHME) Global Burden of Disease Study and Health Equity and Financial Protection Indicators (HEFPI) database provided data for the analysis on health outcomes and outputs over time and across socioeconomic characteristics and geographic area.
Kenya Health Service Delivery Indicator Survey, 2018 Report
Service availability, inputs availability, health worker absenteeism
SDI survey provided information on the availability on inputs at health facilities (including absenteeism) and on health providers’ clinical knowledge.
Table 2: Data Sources used for this PER
Staying ahead of the curve: challenges and opportunities for future spending on health in Kenya
Kenya Public Expenditure Review for the Health Sector - FY2014/15-FY2019/20
07

The PER is organized in five main chapters.
5.0
4.03.02.0
Chapter 1 Introduces the scope of work, data, and limitations of the study. To contextualize the study,
Chapter 3 Also describes the budgetary response of the government to the COVID-19 pandemic. An in-depth analysis of health spending is presented in Chapter 3, which reports on the composition of public health spending by level of government and various levels of disaggregation, as well as on the trends in out-of-pocket spending and donor support.
Chapter 5 Concludes with
recommendations for how to improve
the level, efficiency, and equity of public spending for health
in Kenya.Chapter 4 Discusses the performance
of the Kenyan health system from an efficiency and
equity angle and across various levels of the health
systems and dimensions (such as inputs).
Chapter 2 Provides an overview of the health system organization, the demographic and health status of the Kenyan population, and a summary of the UHC agenda and latest health financing reforms.
1.0
08 Introduction

The Healthcare Delivery System in Kenya
2.0

2.1 Health System Organization and Infrastructure
The Kenyan health system is organized into two main functional levels, national and county level, following devolution in 2013. The 2010 Constitution assigned the national government (MoH) roles of health policy and standards formulation, pre-service training for health workers, management of national referral services, and capacity building and technical assistance to counties. The nine5 semi-autonomous government agencies complement the national government in fulfilling its functions. County governments are responsible for coordinating and managing delivery of primary and secondary health-care services through county facilities, pharmacies, ambulance services, and preventive services at the community level. However, the 2010 Constitution assigned many functions to the county level that include essential medical and medical supplies management funded by development partners. Certain aspects of human resources for health (HRH) management (such as in service training) are still under the control of the national government.
There are overlaps in the performance of several functions by both levels of government; layered on a pluralistic health system. In practice, several functions of the national and county levels overlap, particularly in the domains of health policy, HRH and health products and technologies (HPT). For example, procurement of commodities for such vertical programs as immunization, reproductive health, HIV/AIDS, and tuberculosis is managed at the national level. There is also significant private sector participation in the health system functions through private not-for-profit and private for-profit actors, particularly in the delivery of health services, HPT, and training of HRH. Finally, donors and their implementing agencies play a significant role in the financing and delivery of the so-called vertical health programs, often in parallel to existing government systems.
The Kenya health system is organized around four tiers of hierarchy that are based on the type of health services delivered: community; primary care; county and subcounty referral hospitals; and national referral hospitals. The community tier includes all community-based services as per the MoH community strategy. Primary health care includes services provided by public and private maternity homes, health centers, and dispensaries. County referral services include first level referral hospitals that are managed by counties, with the exception of the national referral hospitals, which are under the national government. All other facilities are managed by county governments.
5 Kenyatta National Hospital (KNH); Moi Teaching and Referral Hospital (MTRH); Kenyatta University Teaching, Research and Referral Hospital (KUTRRH); Kenya Medical Training College (KMTC); Kenya Medical Supplies Authority (KEMSA), Kenya Medical Research Institute (KEMRI), National Health Insurance Fund (NHIF); National AIDS Control Council (NACC), and the National Cancer Institute of Kenya (NCI-K)
10 The Healthcare Delivery System in Kenya

Kenya’s health-care system comprises both the public sector, including the MOH and parastatal organizations, and the private sector, such as nongovernmental organizations (NGOs), private for-profit, and faith-based organizations (FBO) facilities. Health services are provided through a network of more than 12,600 facilities countrywide, with the public sector system accounting for slightly less than 50 percent of these facilities as of 2020. In 2019, more than 93 percent of the facilities consist of Level 2 and 3 facilities, of which 40 percent are private, 8.5 percent are faith-based facilities, 3 percent are NGOs, and the remainder are public. However, all tertiary care facilities are under the public sector. Figure 2 shows the distribution of health facilities by level and ownership type, while Figure 3 shows the distribution of health facilities by level, ownership and across counties.
Level of care County/National Type of services
National Referal Hospitals
Level 6: Teriary care hospitals
National ❱ Tertiary/highly specialized services, including high-level specialist medical care, reference laboratory support, blood transfusion services, and research have defined level of self-autonomy
Secondary Hospitals
Level 5: Secondary care hospitals
Level 4: Primary care hospitals
County ❱ Comprehensive inpatient diagnostic, medical, surgical and rehabilitative care, including reproductive health services
❱ Specialized outpatient services
❱ Hospitals managed by a county
Primary health care
Level 3: Health centers
Level 2: Dispensaries and clinics
County ❱ Disease prevention and health promotion services
❱ Inpatient services for emergency clients awaiting referral, clients for observation, and normal delivery Services
Level 1: Community County ❱ Community-based health services
Primary Health Care
Secondary Hospitals
National Referal
Hospitals
Figure 1:
Kenya Health Sector Organization
Source: Modified from Ministry of Health (2018). Health Sector Policy Guidelinesfor Leadership and Governance.
Staying ahead of the curve: challenges and opportunities for future spending on health in Kenya
Kenya Public Expenditure Review for the Health Sector - FY2014/15-FY2019/20
11

Figure 2: Distribution of Health Facilities by Level and by Ownership Type (2019)
Source: Kenya Master Health Facility List (KMHFL)
Legend: l Faith-based Organizations l Government facilities l Non-Government Organizations l Private Facilities
Figure 3: Distribution of Health Facilities by Level across Counties
Source: Kenya Master Health Facility List (KMHFL)
Legend: l Level 2 l Level 3 l Level 4 l Level 5 l Level 6
0%
10%
20%
30%
40%
50%
60%
70%
80%
90%
100%
Wes
t Po
kot
Tana
Riv
erN
yeri
Mur
anga
Kw
ale
Laik
ipia
Ker
icho
Turk
ana
Mer
uB
arin
goN
andi
Thar
aka
Nit
hiK
ilifi
Embu
Nya
ndar
uaSa
mbu
ruM
acha
kos
Isio
loLa
mu
Mak
ueni
Kaj
iado
Bom
etU
asin
Gis
huK
irin
yaga
Nak
uru
Bus
iaK
itui
Tait
a Ta
veta
Bun
gom
aK
iam
buM
omba
saN
arok
Mar
sabi
tTr
ans
Nzo
iaEl
geyo
Mar
akw
etV
ihig
aG
aris
saK
akam
ega
Nai
robi
Mig
ori
Siay
aH
oma
Bay
Waj
irK
isum
uK
isii
Nya
mir
aM
ande
ra
0%
10%
20%
30%
40%
Level 2 Level 3 Level 4 Level 5 Level 6
50%
60%
70%
80%
90%
100%
42% 40% 43%
3% 3% 2%
24%
47%
8% 9% 13% 14%
48% 43%
62%
8% 9% 13% 14%
100%
0%
12 The Healthcare Delivery System in Kenya

Overall, HRH in Kenya increased in the past decade; however, the availability of skilled HRH and its equitable distribution remains a major bottleneck to improve quality of care. Figure 4 shows a significant increase in the number and spending for HRH at the county level, approximately 70 percent from FY2014/15 to FY2020/21. Most of the counties raised the number of health workers, excluding Nyeri, Nakuru and Nairobi6; however, the increase varied significantly among counties (Figure 5). On the contrary, the number of staff at the national level (MOH) decreased by almost 50 percent from FY2015/16 to FY2019/20 (Figure 4). This trend is expected to continue, as counties build capacity in the various functions and as they take on increasingly more responsibilities. Although Kenya experienced significant increases in HRH, the health worker density remains lower than desired, with 1.6 health workers per 1,000 Kenyans against the WHO recommendation of 2.3 health workers per 1,000 people. The shortages are exacerbated by exceptionally high absenteeism, inappropriate skill-mix, chronic low morale, and inefficiencies in hiring, deployment, performance, and retention. The efficiency chapter in this report discusses HRH inefficiencies.
6 Nairobi is not included in the graph for presentation purposes. It decreased from 14,238 to 12,105 over the same period.
Figure 4: Number and Spending for HRH FY2014/15-FY2020/21, Actuals
Source: IPPD (MOH)viii
Note: Figure 4 shows national level data only from FY2015/16-FY2019/20. Extrapolated annual salary from monthly earnings.
Legend: l County Level l National Level l Total Earning (Kshs)
0.B
2.B
4.B
6.B
8.B
10.B
12.B
14.B
16.B
-
20,000
40,000
60,000
80,000
100,000
120,000
140,000
160,000
180,000
2014/15 2015/16 2016/17 2017/18 2018/19 2019/20 2020/21
Num
ber o
f HR
H
K S
h
Staying ahead of the curve: challenges and opportunities for future spending on health in Kenya
Kenya Public Expenditure Review for the Health Sector - FY2014/15-FY2019/20
13

In addition to Kenya’s shortages in HRH, the primary and secondary-level facilities continue to experience insufficient medical supplies and equipment and drugs, albeit with an increasing spending on health. On average, about half (54 percent) of essential drugs were available in health facilities and about half of the health facilities met the minimum medical equipment requirements, according to the Kenya Health Service Delivery Indicator Survey (SDI) 2018. Primary care facilities lack these essential inputs the most. For example, while almost 80 percent of health facilities have critical equipment at primary hospitals, this was the case in only 46 percent and 67 percent of dispensaries and health centers, respectively. What is more, the availability of critical inputs at primary and secondary level of care decreased significantly from 2012 to 2018: the availability of drugs dropped by a quarter from 67.2 percent to 53.2 percent, while the proportion of health facilities that meet basic equipment requirements declined by about a quarter, from 76.5 percent to 58.5 percent. The efficiency chapter further explores this topic.
Figure 5: Changes in the Number of HRH from FY2014/15 to FY2020/21
Source: IPPD (MOH)viii
Note: Note Figure 4 shows national level data only from FY2015/16-FY2019/20. Extrapolated annual salary from monthly earnings.
Baringo
Bomet
Bungoma
Busia
Elgeyo-Marakwet
Embu
Garissa
Homa-Bay
Isiolo
Kajiado
Kakamega
Kericho
Kiambu
Kilifi
Kirinyaga
Kisii
Kisumu Kitui Kwale
Laikipia
Lamu
Machakos
Makueni
Mandera Marsabit
Meru
Migori
Mombasa
Murang'a
Nakuru
Nandi Narok Nyamira
Nyandarua
Nyeri
Samburu
Siaya
Taita-taveta
Tana-River
Tharaka-Nithi Trans-NzoiaTurkana
Uasin-Gishu
Vihiga
Wajir
West-Pokot
-
1,000
2,000
3,000
4,000
5,000
6,000
7,000
500 1,000 1,500 2,000 2,500 3,000 3,500 4,000 4,500 5,000 5,500
2014/15
2020
/21
14 The Healthcare Delivery System in Kenya

Access and utilization of health care have improved over time, with greater reliance on public facilities for outpatient services and on private facilities for inpatient services (KHHEUS, multiple rounds). The average number of outpatient visits per person per year increased from 1.9 in 2003 to 3.1 in 2013, but then dropped again to 2.5 in 2018. The share of outpatient visits at government facilities increased from 50.5 percent in 2003 to 58.4 percent in 2018, and more visits were provided at health centers and dispensaries (2003: 27 percent versus 2013: 40.1 percent) as compared to hospitals (2003: 24 percent versus 2013: 18 percent), providing some evidence of efficiency gains. The share of inpatient visits at private hospitals increased from 14 percent in 2003 to 29 percent in 2018. The overall drop-in care seeking in 2018, especially at public facilities, was driven by the nationwide doctors and nurses strike that lasted 100 to 150 days total.
Figure 6: Trends in Percent Distribution of Outpatient Visits by Provider Type, Kenya 2018
Source: KHHEUS, 2018ix
Year Govern-ment hospitals
Govt. Health Centre and dispen-sary
Public hospital
Chemist/ Pharmacy/ Shop/
Private Clinic
Faith based hospital
Faith based health centre and dis-pensary
Oth-ers
2003 23.9 26.6 8.9 10.4 17.8 2.8 4.7 4.9
2007 25.7 31.0 6.4 15.2 12.3 3.8 3.1 2.5
2013 18.3 40.1 7.2 13.1 9.8 3.5 5.2 2.8
2018 29.2 27.5 16.4 8.7 8.6 3.9 1.3 4.4
0
10
20
30
40
50
Pere
ntag
e
Staying ahead of the curve: challenges and opportunities for future spending on health in Kenya
Kenya Public Expenditure Review for the Health Sector - FY2014/15-FY2019/20
15

2.2 Demographics and Health Status
Kenya is undergoing a demographic transition that will impact health-care demand, service delivery patterns, and health-care spending. Kenya’s life expectancy increased rapidly over the past twenty years, from about 51 years in 2000 to about 66 years in 2018. The average increase in life expectancy in Sub-Saharan Africa (SSA) over the same period was 10.7 years. The increasing life expectancy coupled with a sharply decreasing fertility rate from 5.1 children per woman in 2000 to 3.5 children per women in 2018 suggests that the share of population ageing will continue to increase over time, narrowing the population pyramid and generating an increase in health-care needs, and demand for health services for the elderly.x
Figure 7: Trends in Percent Distribution of Inpatient Visits by Provider Type, Kenya 2018
Source: KHHEUS, 2018ix
Year Govern-ment hospitals
Public hospitals
Mission hospitals
Govt. health centres
Private health centre
Mission health centre
Nursing/ Materni-ty homes
Other Coun-try
2003 63.1 13.9 9.9 9.3 1.7 1.3 0.8 0.0
2007 58.6 14.1 14.2 5.8 1.2 2.3 2.6 1.2
2013 48.3 20.0 16.5 7.6 2.8 1.3 1.8 0.1
2018 45.6 29.4 11.1 6.1 3.7 1.7 0.8 0.2
0
20
40
60
80
Pere
ntag
e
16 The Healthcare Delivery System in Kenya

Figure 8: Population Pyramid 2015-2050
Source: United Nations, Population Division (2015). Under: https://demographicdividend.org/country_highlights/kenya/ xi
Legend: l Males l Females
The health status of Kenya’s population has improved over the last decade, but challenges remain, especially around birth-related mortality and child malnutrition. Under-five mortality and infant mortality rates were halved between 2003 and 2014, largely due to the increased use of essential health services, such as immunization, vitamin A supplementation, and use of insecticide treated nets.
10 108 86 64 42 20
10-1415-1920-24
40-44
30-3425-29
35-39
45-4950-5455-5960-6465-6970-7475-7980-84
85+
5-90-4
Percent of Population
Age
(yea
rs)
10 108 86 64 42 20
10-1415-1920-24
40-44
30-3425-29
35-39
45-4950-5455-5960-6465-6970-7475-7980-84
85+
5-90-4
Percent of Population
Age
(yea
rs)
Staying ahead of the curve: challenges and opportunities for future spending on health in Kenya
Kenya Public Expenditure Review for the Health Sector - FY2014/15-FY2019/20
17
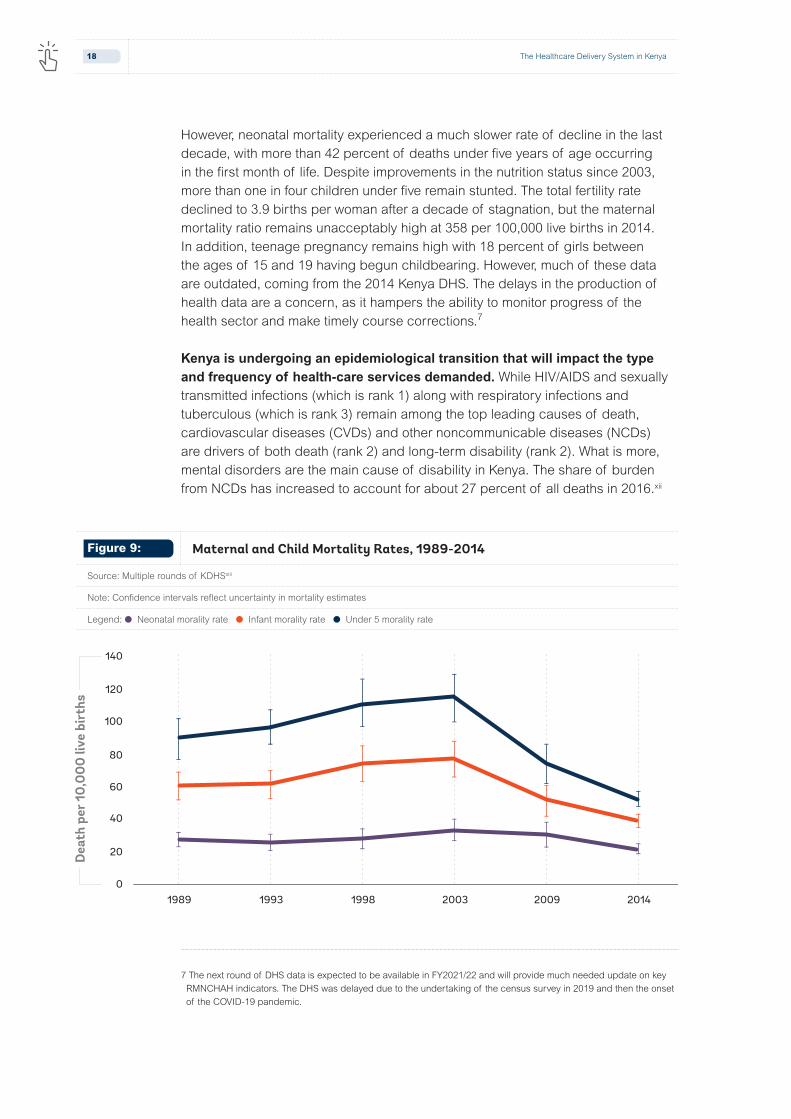
However, neonatal mortality experienced a much slower rate of decline in the last decade, with more than 42 percent of deaths under five years of age occurring in the first month of life. Despite improvements in the nutrition status since 2003, more than one in four children under five remain stunted. The total fertility rate declined to 3.9 births per woman after a decade of stagnation, but the maternal mortality ratio remains unacceptably high at 358 per 100,000 live births in 2014. In addition, teenage pregnancy remains high with 18 percent of girls between the ages of 15 and 19 having begun childbearing. However, much of these data are outdated, coming from the 2014 Kenya DHS. The delays in the production of health data are a concern, as it hampers the ability to monitor progress of the health sector and make timely course corrections.7
Kenya is undergoing an epidemiological transition that will impact the type and frequency of health-care services demanded. While HIV/AIDS and sexually transmitted infections (which is rank 1) along with respiratory infections and tuberculous (which is rank 3) remain among the top leading causes of death, cardiovascular diseases (CVDs) and other noncommunicable diseases (NCDs) are drivers of both death (rank 2) and long-term disability (rank 2). What is more, mental disorders are the main cause of disability in Kenya. The share of burden from NCDs has increased to account for about 27 percent of all deaths in 2016.xii
7 The next round of DHS data is expected to be available in FY2021/22 and will provide much needed update on key RMNCHAH indicators. The DHS was delayed due to the undertaking of the census survey in 2019 and then the onset of the COVID-19 pandemic.
Dea
th p
er 1
0,00
0 liv
e bi
rths
1989 1993 1998 2003 2009 20140
20
40
60
80
100
120
140
Figure 9: Maternal and Child Mortality Rates, 1989-2014
Source: Multiple rounds of KDHSxiii
Note: Confidence intervals reflect uncertainty in mortality estimates
Legend: l Neonatal morality rate l Infant morality rate l Under 5 morality rate
18 The Healthcare Delivery System in Kenya

Table 3: Leading Causes of Deaths and Disability
Source: IHME, GBD compare.xiv
Rank Causes of deaths Causes of disability*
1 HIV/AIDS Mental disorders
2 CVDs Other NCDs
3 Resp. infections & TB Musculoskeletal disorders
4 Neoplasm Sense organ diseases
5 Enteric infections Neurological disorders
6 Maternal and neonatal Skin diseases
7 Digestive disorders Nutritional deficiencies
8 Diabetes and CKD Maternal & neonatal
9 Other infections HIV/AIDS & STIs
10 NTD & malaria NTD & malaria
Climate change represents a significant challenge for the Kenyan health system. Kenya is expected to experience an increase in the intensity of floods, increasing temperature, and rainfall patterns, which are expected to raise the risk of malaria and other vector-borne diseases and may lead to population displacement. Moreover, climate change negatively impacts on agriculture production and food systems, potentially leading to higher food insecurity, which, in turn, may affect malnutrition and stunting outcomes, especially in rural areas and urban slums and in regions of the country mostly affected, such as counties in the north and northeastern region of Kenya.
2.3 The UHC Agenda and Health Financing Strategy
The three main sources of financing health care in Kenya are public, development partners, and private sector, mainly through households. Historically, government, development partners and households through out-of-pocket (OOP) payments have been the main financiers of health care in Kenya, contributing about 90 percent of total health spending, while a small and decreasing percentage is financed by private entities, such as private and
Staying ahead of the curve: challenges and opportunities for future spending on health in Kenya
Kenya Public Expenditure Review for the Health Sector - FY2014/15-FY2019/20
19

parastatal enterprises that provide health benefits to their employees through private insurance and their own health facilities. The Ministry of Health is the main purchaser of health services, while other purchasers include local governments, the NHIF, community-based health insurance schemes, private health insurance, and employers. Current NHIF coverage is approximately 20 percent, meaning that four out of five people in Kenya are not enrolled in any form of health insurance. Enrollment in the NHIF is mandatory for all formal sector employees (public and private) and voluntary for those in the informal sector.
In 2017, the Kenyan government strongly committed to achieve UHC as one of the Big 4 Agenda by the year 2022 and started designing and implementing priority reforms to accelerate progress. These included the following: (i) increasing the share of (mandatory) pooled resources through a health insurance-based mechanism built on the existing NHIF; (ii) enhancing the capacity of the NHIF to function as a strategic purchaser of health services; (iii) expanding coverage of health services equitably through an emphasis on primary healthcare (PHC) and a gatekeeping system; and (iv) improving public financial management (PFM) arrangements to enhance effectiveness of public funds in the devolved health sector. Since then, various activities have been undertaken, including the following: (i) the development of an explicit health benefits package; (ii) a pilot of user fee removal for free hospital care in four counties; (iii) a review of the NHIF and identification of critical actions to become a strategic purchaser; and (iv) the development of a PHC strategic framework 2019-2024, which envisions PHC as the foundation for achieving UHC and the UHC Policy that has recently been finalized. The GoK estimates that the roll out of the UHC program, including all elements that define it8, will cost about K Sh 40 billion by FY2022/23. Of this, the majority of the resources would be devoted to subsidizing health insurance premiums (about K Sh 25 billion, that is, 62 percent of the total budget).
Over the last decade, the national government has implemented several health financing reforms aimed at increasing access to health services, improving financial protection, and expanding health insurance coverage, albeit with mixed results.
❱ Improve funds flow to service delivery units: the Direct Facility Funding (DFF), which Danish International Development Agency (Danida) piloted in the Coast Province in 2005 and later scaled up countrywide under the Health Sector Services Fund (HSSF) with financing from Danida and the World Bank in 2010, was found to significantly improve facilities’ autonomy and service delivery. The HSSF program ended in June 2015. However, Danida has since continued to transfer funds directly to health facilities within a revised PFM arrangement that was introduced after the enactment of the new laws that introduced devolution. Funding from Danida under
8 Insurance subsidies, HISP, free maternity program, conditional grants to Level 5 hospitals and removal of user fees.
20 The Healthcare Delivery System in Kenya

this program is decreasing and is expected to cease by FYFY24/259. The GoK has provided a lump sum to lower-level facilities to compensate for loss of revenue due to abolition of user fees, but the reimbursements are credited to counties’ general revenue accounts, rather than to participating facilities’ bank accounts and are not adjusted for changes in prices and services provided.
❱ Efforts to expand health insurance coverage include the introduction of the Civil Servants’ Health Insurance scheme in 2012, the Health Insurance Subsidies for the Poor (HISP) in 2014, the health insurance for the elderly and people living with severe disability in 2015, and the recently introduced health insurance for children in public schools. Contributions to the civil servants’ scheme—which are administered through the NHIF10—are based on medical allowances previously paid on a monthly basis to civil servants and GoK top-up, which amount to a total of K Sh 4.5 billion per year. The HISP was first piloted with 21,546 households and is to be scaled in the coming years. The HISP households are selected from a list of orphans and vulnerable children on the GoK’s cash transfer program. The government fully subsidizes health insurance premiums for the elderly—70 years and above—and people with disabilities and remits contributions directly to the NHIF. The scheme covered 219,200 members in FY2019/20. The government provides an annual budgetary allocation of K Sh 500 million (about $4.6 million) to purchase health insurance coverage through the NHIF. Beneficiaries are entitled to a package similar to those of formal employees covered by the NHIF. The NHIF is recognized as a key instrument to achieve UHC in Kenya; however, expansion of the NHIF needs to go hand in hand with efforts to improve existing inefficiencies, transparency, and accountability systems.
❱ Reforms to improve financial protection: the GoK removed user fees in PHC in 2013 and established a mechanism to compensate facilities for revenue forgone because of abolition of user fees. An evaluation of the policy highlighted increases in service utilization and adherence to the policy; however, problems with financial flows to health facilities and concerns of access to health products, particularly medicines and diagnostics remained an issue. The same year the GoK introduced free maternity care in public health facilities under which user fees for maternity services were removed in all public health facilities and
9 Danida funding is being phased out over time as per following schedule: FY20/21 K Sh 900,000,000, FY21/22 K Sh 701,250,000, FY22/23 K Sh 467,500,000, and FY23/24 K Sh 233,750,000.
10 Founded in 1966, the National Health Insurance Fund is Kenya’s social health insurer. Membership is compulsory for formal sector workers and voluntary for informal sector workers. It covers about 18 percent of Kenya’s population of whom another 2 percent are covered by private insurance, employer-based, and community-based medical scheme. Coverage growth has remained static over the last five years and is inequitable by income (rich greater than poor) and geographic location (urban greater than rural).
Staying ahead of the curve: challenges and opportunities for future spending on health in Kenya
Kenya Public Expenditure Review for the Health Sector - FY2014/15-FY2019/20
21

facilities were compensated for any lost revenue arising from free delivery at a standardized rate per delivery reported. The free maternity program, which was later renamed Linda Mama, was transferred to the NHIF to be administered as a managed care scheme. Public and private health facilities contracted by the NHIF claim reimbursement for antenatal care, delivery, and post-natal services, up to a predetermined amount. In December 2018, the GoK launched the Afya Care/the UHC pilot in Isiolo, Kisumu, Nyeri, and Machakos. Under the scheme, registered households could access free health services at levels 4 and 5 hospitals in these four counties. The GoK reimbursed counties for the lost revenue resulting from removed user fees through a conditional grant, which was financed with support from the World Bank and the Government of Japan. The pilot ended in March 2020. The pilot evaluation found an initial increase in demand for outpatient service utilization at hospital level by 20 percent. This points to the need to strengthen PHC—including by ensuring that all critical inputs are available, as well as introducing appropriate gatekeeping systems.
❱ Revisions to expand access to essential health services and strengthen strategic purchasing: The NHIF rates more than doubled and increased NHIF revenues. The benefit package was expanded to include outpatient services for all illnesses and to cover pre-existing chronic conditions, although these additional services were included in the package for specialized services. Later in 2018, the GoK constituted a Health Benefits Package Advisory Panel (HBAP), but little progress toward implementing the recommendation HBAP panel has been achieved to date. In 2020, the MoH appointed a Health Financing Reforms’ Expert Panel (HEFREP) to review the performance of NHIF, identify gaps, and propose recommendations that will reposition the NHIF as a strategic purchaser to move the country toward attainment of UHC by 2022. Although NHIF revenue collection has increased dramatically in the past few years (2017-19), it only constitutes 5 to 7 percent of the current health expenditure, which may not be an efficient mobilizer for revenues for health care. Consultations on how to further reform the NHIF and the implementation of recommendations are ongoing, but the process is moving at a slow pace. The next phase of reforms will need to focus on revising payment systems to introduce incentives for providers that are aligned with the UHC goals: expand access to care and medicines, improve the efficiency of spending, and increase quality of care.
❱ Reforms to improve the efficiency and sustainability of the UHC agenda. The MoH’s PHC Strategic Framework, 2019-2024 seeks to form primary health-care networks and strengthen referral systems as foundational service delivery platforms for achieving UHC. Work is ongoing to pilot ways to operationalize the PHC framework.
22 The Healthcare Delivery System in Kenya

2010 Direct cash transfers to primary health-care facilities.
2012 Civil Servants’ Health Insurance scheme.
2013 User fees removal for primary health care.
Free maternity care in public health facilities.
2014 Health Insurance Subsidies for the Poor.
2015 Health insurance for the elderly and people living with severe disability.
NHIF benefit package expansion and contribution rates revised upward.
2016 Linda Mama health insurance scheme.
2018 UHC-Essential Benefit Package drafted.
2019-2021(ongoing)
“UHC pilot”
Strategic review of the NHIF.
Health insurance subsidies for public secondary school students.
PHCN
Framework.
Table 4: Health Financing Reforms toward UHC
The draft Kenya health financing strategy 2016-2030 outlines the envisioned approach for ensuring financial protection while expanding access to care. The strategy envisions increasing domestic resources through a compulsory prepayment pooling mechanism—social health insurance—to provide a basic package of health-care services to every Kenyan. The basic package is expected to be expanded over time as the economy grows and resources become available. In the long run, OOP payments at the point of use for essential services are to be eliminated. In addition, the strategy envisions ring fencing of resources for the health sector at the national and county level and the introduction of strategic purchasing mechanisms for health providers. However, the operationalization of the expansion of prepayment pooling mechanisms remains unclear, given that informal workers make up more than 80 percent of the working population.xxii
Staying ahead of the curve: challenges and opportunities for future spending on health in Kenya
Kenya Public Expenditure Review for the Health Sector - FY2014/15-FY2019/20
23

Kenya has made significant progress toward pandemic preparedness as an integral part of the UHC agenda, but the country needs to make further investments. The recent Ebola crisis in Africa and the ongoing COVID-19 global pandemic have demonstrated the urgent need for resilient health systems that can quickly and effectively respond to public health emergencies. A 2017 Joint External Evaluation of the core capacities in the International Health Regulations identified priority interventions to improve the preparedness of the Kenya health system. Following these recommendations, the MoH developed the National Action Plan for Health Security (NAPHS) and is planning the establishment of a National Public Health Institute to consolidate public health functions, as recommended by the NAPHS. System strengthening investments are also ongoing amidst the ongoing COVID-19 pandemic.
24 The Healthcare Delivery System in Kenya
Health Expenditure
3.0

3.1 International Comparison of Health Spending
Kenya’s government spending on health compares favorably with countries in the region, but is lower than countries in the same income group, both as percentage of total government spending (Figure 10) and as a percentage of gross domestic product (GDP; Figure 11). Kenya’s public spending on health as a share of total government spending was approximately 8 percent in 2018, up from 7.3 percent in 2013. This is higher than such neighboring countries as Mozambique (4.6 percent), Ethiopia (5 percent), Nigeria (5 percent), and Ghana (6.5 percent). In 2018, Kenya’s government health expenditure as a share of GDP (2.2 percent) was also higher than its neighboring countries, such as Ethiopia (0.8 percent), Uganda (1.0 percent), Zambia (1.3 percent), and Tanzania (1.6 percent). However, compared to such aspiring countries as Vietnam, Thailand, and South Africa, Kenya’s public spending on health as a share of total government spending is still staggeringly low. A similar picture arises when looking at government spending on health against a more direct measure of capacity, namely total government revenue (Figure 12).
Bangladesh
Ethiopia
Ghana
India
Sri LankaRwanda
Thailand
Uganda
Vietnam
South Africa
Kenya
2
5
10
20
500 1000 2500 5000 10000
GG
HE−
D a
s %
GG
E
GDP per capita, US$
Figure 10: Government Health Spending (GGHE-D) as a Percent of Total Government Spending (GGE) versus Income Level, 2018
Source: WDI, latest data available, 2018.xxiii
26 Health Expenditure
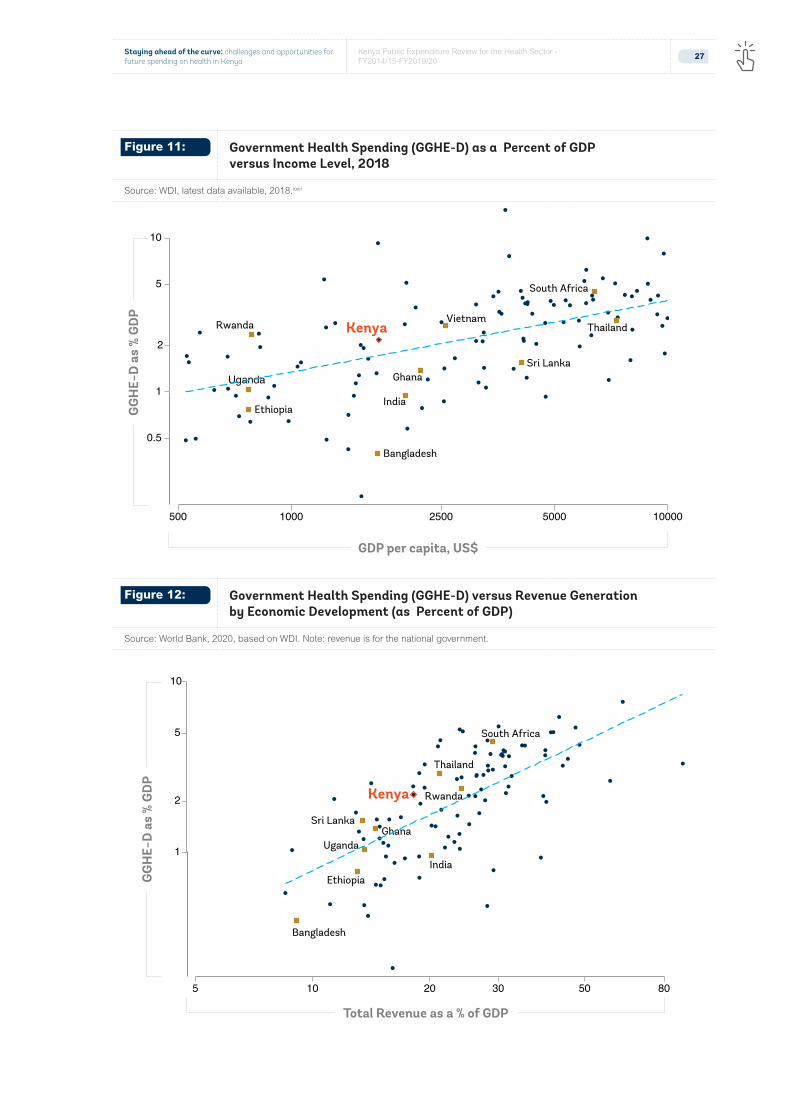
Bangladesh
Ethiopia
Ghana
India
Sri Lanka
Rwanda Thailand
Uganda
Vietnam
South Africa
Kenya
0.5
1
2
5
10
500 1000 2500 5000 10000
GG
HE−
D a
s %
GD
P
GDP per capita, US$
Figure 11: Government Health Spending (GGHE-D) as a Percent of GDP versus Income Level, 2018
Source: WDI, latest data available, 2018.xxiii
Figure 12: Government Health Spending (GGHE-D) versus Revenue Generation by Economic Development (as Percent of GDP)
Source: World Bank, 2020, based on WDI. Note: revenue is for the national government.
Bangladesh
Ethiopia
Ghana
India
Sri Lanka
Rwanda
Thailand
Uganda
South Africa
Kenya
1
2
5
10
5 10 20 30 50 80
GG
HE−
D a
s %
GD
P
Total Revenue as a % of GDP
Staying ahead of the curve: challenges and opportunities for future spending on health in Kenya
Kenya Public Expenditure Review for the Health Sector - FY2014/15-FY2019/20
27

While these international comparisons are useful for assessing levels of public spending for health, it is good to remember that the adequacy of public funds depends on the role played by the private sector, households, and donors as well. The contributions of other actors in the health-care system affect the level of public spending. For example, literature shows that everything else held constant, additional donor aid leads to lower government spending on health (partial fungibility)xxiv. While this PER examines total health spending to account for these interdependencies, this is not considered in this benchmarking analysis.
3.2 Sources of Health Financing
Kenya is facing a changing health financing landscape with the government taking an increasing role, while contributions from donors and corporations are shrinking. Figure 13 shows the contribution of each financing source to total health expenditure (THE) based on data from the several rounds of National Health Accounts (NHA) undertaken in the country. Over the past 20 years, total health expenditures have increased continuously, with varying contributions by each source. The government’s contribution in financing health care increased from 27 percent of total health expenditure in 2009/10 to about 52 percent in 2018/19. During the same period, the role of households declined from 30 percent of total health expenditures in 2009/10 to 24 percent in 2018/19, showing the impact of reforms to increase financial protection of the poor and of households in the informal sector.
Figure 13: Total Health Expenditure by Source of Funding (Percent)
Source: NHA, multiple rounds.
Legend: l Government l Donors l Households l Corporations l Others
11.2%8.5% 11.2%
30.0%32.0%
34.5%
27.0%
10.6%
33.0%
23.4%
33.0%
6.6%
22.1%
20.6%
50.7%
7.1%
22.3%
20.6%
50.0%
5.9%
24.0%
17.8%
52.3%
24.7%
31.0%
0%
10%
20%
30%
40%
2009/10 2012/13 2015/16 2016/17 2017/19 2018/19
50%
60%
70%
80%
90%
100%
28 Health Expenditure

The national government health activities implemented mainly through the MoH are financed via government budgetary allocation that comprises GoK and donor contributions. Donor contributions—both loans and grants—mainly finance the development budget. Donor support, which is mainly off-budget, accounted for about 89 percent of total development spending in FY2009/10, declining from about 75 percent in FY2017/18 before increasing again to 85 percent of total donor spending in FY2018/19. The highest shares of the on-budget spending by development partners were contributed by the Global Fund to Fight AIDS, Tuberculosis and Malaria (GFATM), World Bank, and Global Alliance for Vaccines (Gavi)11 to finance immunization.
Development partners’ financing of health care in Kenya is declining. Although development partners financing for health has oscillated in absolute terms over the last 20 years, their contribution to health financing as a percent of total health expenditure declined from 32 percent in 2009/10 to 18 percent in 2018/19 (Figure 13). This trend is expected to persist in the medium to long term, suggesting Kenya will need to appropriately plan for a transition phase to avoid disruptions in the delivery of key health services. For example, Kenya is rapidly approaching the accelerated transition phase from Gavi, as the gross national income per capita in 2018 was $1,620.12 Moreover, development assistance may be reduced in the coming years in light of the significant negative impact of COVID-19 on the economies or reprogrammed from key health programs to support the response to the pandemic.
A significant proportion of donor funding remains off-budget13, which risks undermining strategic prioritization, efforts to reduce inequity, and future sustainability of health programs. The share of on-budget donor funding relative to total donor funding declined from 26 percent in FY2015/16 to 15 percent in FY2018/19. The share of the donor on-budget contribution relative to total health expenditure has declined from 7 percent in FY2012/13 to about 3 percent in FY2018/19. Aligning donor support to country systems will be key in ensuring sustainability of financing of key priorities of the health sector as part of the move toward UHC.
11 Funds from major donors such as Global Fund to Fight Aids, Tuberculosis and Malaria and Gavi are on-budget. While spending for specific items such as procurements of some health commodities are undertaken outside the government system at first, expenditure data are then furnished to the government as part of their quarterly reports on expenditures and updated in the government systems. For instance, for procurement of vaccines through GAVI, funds are directly transferred to UNICEF (Copenhagen) from where they are directly channeled to UNICEF Kenya to procure the vaccines. UNICEF is then expected to furnish the GoK with expenditure returns. The funding by these donors is reflected in the government budgetary system.
12 Countries are eligible for Gavi’s support, if their average gross national income (GNI) per capita has been less than or equal to $1,630 over the past three years.
13 Public expenditure figures include on-budget donor support. Off-budget donor support is included in the total health expenditure, which mainly comes from the NHA studies.
Staying ahead of the curve: challenges and opportunities for future spending on health in Kenya
Kenya Public Expenditure Review for the Health Sector - FY2014/15-FY2019/20
29

3.3 Trends in Public Health Expenditure
Transition to devolved government in Kenya saw the national government (through the MoH) and county governments share the management and delivery of health-care services. Health is the largest service delivery sector to be devolved under the new governance structure and the constitution of 2010 provides counties with the respective mandates and powers to deliver majority of the health services with the national government maintaining responsibility for the overall governance and policy development, as well as management of national referral hospitals. Once overall resources are shared between the national and county levels, each allocates resources to the health sector via a budgeting process prescribed by the Public Financial Management Act of 2012. Any analysis of the overall public financing of health must take into consideration the role of the national and county governments. In these analyses, MoH represents the national level contribution to financing health care.
Government budgetary spending on health at both levels of government (national [MoH]) and county) has increased in absolute terms since devolution with an average of 60 percent of the health expenditures for the period under review occurring at the county level. Total government health expenditure (MoH
Figure 14: Total and On-budget Donor Financing
Source: NHA
Legend: l Total donor support (K Sh Billion) l On-budget donor as a % of total donor’s funds l On-budget donor as a % of THE
75
80
85
90
95
100
0%
5%
10%
15%
20%
25%
30%
35%
2009/15 2012/13 2015/16 2016/17 2017/18 2018/19
K S
h
On
budg
et e
xpen
ditu
re (%
)
K Sh
82 82 96 96 8691
27% 26%
29%
25%
15%
11%
4%
7% 6% 6%5% 3%
30 Health Expenditure

and county level) has increased from K Sh 98 billion in FY2014/15 to K Sh 227 billion in FY, 2019/20, an increase of about 131 percent. From FY 2014/15 to FY2018/19, county governments consistently accounted for 60 percent and above of total government spending on health. However, in FY 2019/20, the share of counties to total government health expenditure declined to 52 percent because of the major MoH expansion occasioned by the need to spend on COVID-19 mitigation measures to contain the spread of the pandemic and the UHC agenda.
Figure 15: Public Health Expenditure by Level of Government (K Sh Billion, in Nominal Terms) and as Percentage of Total Government Health Expenditure (Percent)
Source: MoH and county data (see Table 2).xxvi
Legend: l MoH (% K Sh) l Counties (%K Sh B)
8198
115
142 152
186
228
0
50
100
150
200
250
2012/13(pre-devolution)
2014/15 2015/16 2016/17 2017/18 2018/19 2019/20
100%, 81 38%, 37
62%, 61 64%, 7360%, 85 64%, 97
60%, 111
53%, 120
36%, 42 40%, 57 40%, 75 47%, 10836%, 55Publ
ic h
ealt
h ex
pend
itur
e (K
Sh
B, %
)
Despite the increase in public health budgetary spending in absolute terms, it has stagnated as a percent of total government spending and as a percent of GDP. Kenya spending on health as a percent of GDP has fluctuated around 2 percent over the period under analysis, although it seems on the rise in FY 2019/20 because of the expansion of health spending occasioned by devolution as well as the national level commitments to achieving UHC. Moreover, between FY 2016/17 and 2018/19, per capita health spending in real terms has stagnated at between K Sh 1,900-2,000, but it increased to about K Sh 2,300 in FY 2019/20. Global evidence shows that progress toward UHC can be achieved when government spending reaches a minimum of 5 percent of GDP and a per capita target of $86 for primary care, suggesting a doubling of resources to the health sector relative to GDP will be needed to make significant strides in UHC.
Staying ahead of the curve: challenges and opportunities for future spending on health in Kenya
Kenya Public Expenditure Review for the Health Sector - FY2014/15-FY2019/20
31

Prioritization of health by the county governments coupled with the declaration of UHC has led to significant increases in government health spending. The share of the county government budget that goes to health has steadily increased over the past few years since devolution, from an average of 13 percent in FY2014/15 to about 30 percent in FY2019/20. This is likely to result from the increasing attention toward achieving UHC under the Big 4 Agenda, as well as the introduction of the eligibility criteria to access donor financing based on which counties had to increase their allocation to the health sector to be eligible to receive performance-based financing. However, the budget allocations for health vary considerably across counties. The county budget allocation to health, in absolute terms, doubled from K Sh 61 billion in FY 2014/15 to about K Sh 120 billion in 2019/20. The MoH allocation to health in absolute terms almost tripled, from K Sh 37 billion to K Sh 108 billion over the same period.
Table 5: Trends in Kenya Public Health Expenditure, FY2009/10-FY2018/19 (K Sh)
Source: World Bank staff calculations based on NT and MoH data. *GDP data taken from Kenya Central Bank. **Population data taken from Kenya population census 2009 & 2019 and extrapolated. ***WDI: value corresponds to the average between two calendar years, except for FY18/19 which reflects value for 2018. No data was available for FY19/20.
Public Expenditure Indicators
FY
15/16
FY
16/17
FY
17/18
FY
18/19
FY
19/20
Public Health Spending (MoH and Counties), Nominal (K Sh, Billion)
115 142 152 186 228
Public Health Spending (MoH and Counties), Real (K Sh, Billion)
74 86 86 99 114
Average Annual Growth Real Health Government Health Expenditures (%)
10% 16% 1% 15% 15%
Per Capita Public Expenditure on Health, Nominal (K Sh)
2,605 3,155 3,300 3,942 4,654
Per Capita Public Expenditure on Health, Real (K Sh)
1,682 1,900 1,870 2,096 2,321
Current Health Spending per Capita (current $)***
71.1 74.2 82.1 88.4 NA
Public Health Expenditure as % of GDP (%)
1.8% 2.0% 1.9% 2.1% 2.3%
GDP Growth* 5.8% 5.4% 5.6% 5.9% 5.4%
Population (million)** 44.03 45.04 46.05 47.06 48.94
32 Health Expenditure

The President unveiling of UHC as one of the key Big 4 Agenda in December 2017 has seen the MoH budget increase from K Sh 55 billion in FY2017/18 to K Sh 108 billion in FY2019/20, an increase of about 52 percent. The health policy subprogram under the Health Policy, Standards and Regulation Program has the key mandate to drive implementation of the UHC agenda. It saw its budget increase from K Sh 7.7 billion in FY2016/17 to K Sh 37.4 billion in FY2019/20, an almost five-time increase (or 400 percent), further demonstrating government commitment to achieving UHC by 2022. However, increased budget allocation to the health policy subprogram has not translated to increased spending due to the lack of budgetary provision. For instance, in FY2017/18, out of a budget of K Sh 12.1 billion, the subprogram only absorbed 57 percent of the allocated budget. Absorption rate did improve to 77 percent in FY2018/19 and 90 percent in FY2019/20.
3.4 Composition of Public Health Expenditures
3.4.1 Health Sector Budget Execution/Absorption
The MoH’s budget execution capacity has improved in recent years with the development budget reporting a much improved absorption rate (Figure 16). The MoH overall budget execution was low at 68 percent in FY2014/15 and FY2015/16, and only half of the budget for development activities was spent for the same period. The MoH absorption rate, however, increased to 80 percent in FY2016/17 and to 90 percent in FY2019/20, especially driven by higher budget execution rate for development.
Figure 16: MoH Budget Execution (Total, Recurrent and Development Expenditure), FY2014/15-FY2019/20
Source: MOH (see Table 2).
Legend: l Recruitment l Development l Total Budget
0%
100%
80%
60%
40%
20%
2014/15 2015/16 2016/17 2017/18 2018/19 2019/20
53%82% 52%86% 75%86% 70%69% 81%92% 84%94%
69% 68%
80%
71%
88% 90%
Staying ahead of the curve: challenges and opportunities for future spending on health in Kenya
Kenya Public Expenditure Review for the Health Sector - FY2014/15-FY2019/20
33
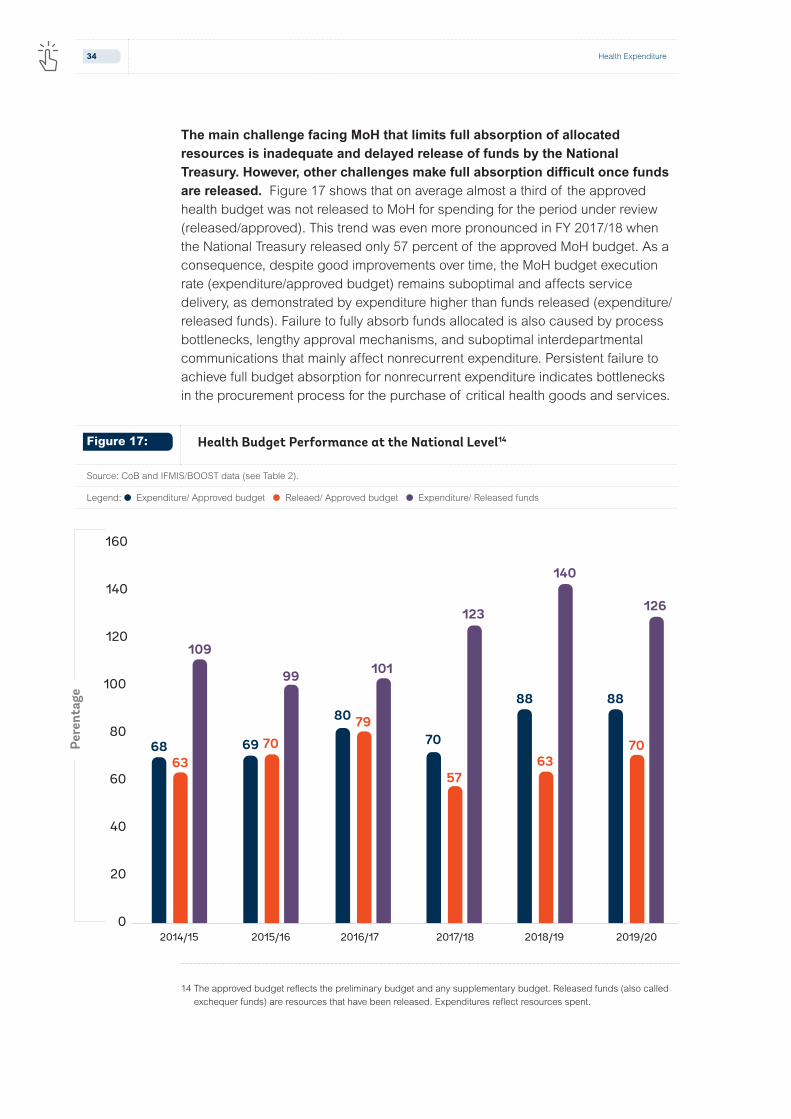
The main challenge facing MoH that limits full absorption of allocated resources is inadequate and delayed release of funds by the National Treasury. However, other challenges make full absorption difficult once funds are released. Figure 17 shows that on average almost a third of the approved health budget was not released to MoH for spending for the period under review (released/approved). This trend was even more pronounced in FY 2017/18 when the National Treasury released only 57 percent of the approved MoH budget. As a consequence, despite good improvements over time, the MoH budget execution rate (expenditure/approved budget) remains suboptimal and affects service delivery, as demonstrated by expenditure higher than funds released (expenditure/released funds). Failure to fully absorb funds allocated is also caused by process bottlenecks, lengthy approval mechanisms, and suboptimal interdepartmental communications that mainly affect nonrecurrent expenditure. Persistent failure to achieve full budget absorption for nonrecurrent expenditure indicates bottlenecks in the procurement process for the purchase of critical health goods and services.
14 The approved budget reflects the preliminary budget and any supplementary budget. Released funds (also called exchequer funds) are resources that have been released. Expenditures reflect resources spent.
Figure 17: Health Budget Performance at the National Level14
Source: CoB and IFMIS/BOOST data (see Table 2).
Legend: l Expenditure/ Approved budget l Releaed/ Approved budget l Expenditure/ Released funds
6863
109101
123
140
126
99
7079
5763
7069
80
70
88 88
0
20
40
60
80
100
120
140
160
Pere
ntag
e
2014/15 2015/16 2016/17 2017/18 2018/19 2019/20
34 Health Expenditure
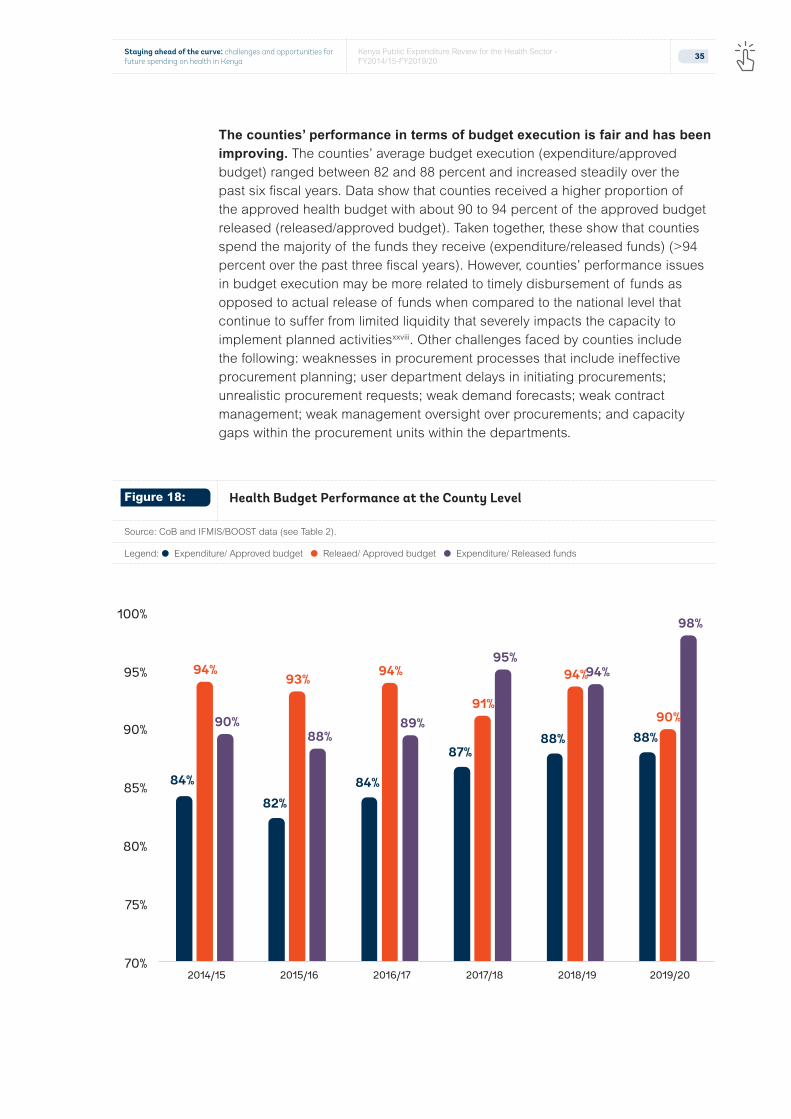
The counties’ performance in terms of budget execution is fair and has been improving. The counties’ average budget execution (expenditure/approved budget) ranged between 82 and 88 percent and increased steadily over the past six fiscal years. Data show that counties received a higher proportion of the approved health budget with about 90 to 94 percent of the approved budget released (released/approved budget). Taken together, these show that counties spend the majority of the funds they receive (expenditure/released funds) (>94 percent over the past three fiscal years). However, counties’ performance issues in budget execution may be more related to timely disbursement of funds as opposed to actual release of funds when compared to the national level that continue to suffer from limited liquidity that severely impacts the capacity to implement planned activitiesxxviii. Other challenges faced by counties include the following: weaknesses in procurement processes that include ineffective procurement planning; user department delays in initiating procurements; unrealistic procurement requests; weak demand forecasts; weak contract management; weak management oversight over procurements; and capacity gaps within the procurement units within the departments.
Figure 18: Health Budget Performance at the County Level
Source: CoB and IFMIS/BOOST data (see Table 2).
Legend: l Expenditure/ Approved budget l Releaed/ Approved budget l Expenditure/ Released funds
84%
82%84%
87%88% 88%
94%93% 94%
91%
94%
90%90%88%
89%
95%94%
98%
70%
75%
80%
85%
90%
95%
100%
2014/15 2015/16 2016/17 2017/18 2018/19 2019/20
Staying ahead of the curve: challenges and opportunities for future spending on health in Kenya
Kenya Public Expenditure Review for the Health Sector - FY2014/15-FY2019/20
35
3.4.2 Health Sector Pending Bills
In the recent past, the health sector has accumulated huge pending bills. This situation has raised concerns as the pending bills adversely affect provision of quality and essential health services. Pending bills arise when an entity fails to settle invoices for goods and services properly procured and delivered or rendered by the end of a financial year. Several factors drive the issue of pending bills in the health sector: inadequate funds to pay for the goods and services procured due to delays; partial release of funds by the national or county treasury; and lack of budgetary provision.
In FY2019/20, the national level health sector, consisting of MoH and the semi-autonomous agencies, had accumulated pending bills worth K Sh 50.2 billion, down from K Sh 95.2 billion in FY 2018/19. A bigger share of the national level pending bill is attributable to MoH headquarters, accounting for about 85 percent and 53 percent of the total pending bill in FY2018/19 and FY2019/20, respectively. A large proportion of the national level pending bill is recurrent in nature, at 99 percent and 97 percent of the total pending bill in FY2018/19 and FY2019/20, respectively. The pending bills have accumulated as a result of lack of liquidity and budgetary provision with the latter accounting for largest share of the total national level spending bill (97 percent) in FY2019/20 (Figure 19). County pending bills as at FY 2019/20 amounted to K Sh 113.9 billion, up from K Sh 34.5 billion in FY2018/19. The national and county governments should ensure effective management of pending bills by aligning procurement plans to cash flow projections and ensuring that their budgets consider pending bills (as a first charge) before funding new programs and interventions.
Failure to meet revenue targets means that counties lack adequate funds at their disposal to finance the approved budget. The mismatch between available resources and the approved budget is one of the main reasons for why counties amend their budgets through the supplementary budgets process during the fiscal year, which creates room for county governments to spend funds for goods and services not originally planned. This includes gaps in the collection of own source revenues (OSR): data from CoB show that in FY2018/19, counties collected K Sh 40.3 billion, which translates to 75 percent of the targeted OSR. In FY 2019/20, the revenue outturn of K Sh 35.8 billion generated by the county governments represents about 65 percent of the annual target of K Sh 54.9 billion.
36 Health Expenditure

Figure 19: Breakdown of National Level Pending Bill (Percent and Absolute Value, K Sh Million), FY2017/18-2019/20
Source: MoH, Health Sector Working Group Reports (FY2017/18-FY2019/20).xxix
Legend: l MoH l SAGAs
Table 6: Table 6: Pending Bills due to Lack of Liquidity, FY2014/15-2019/20 (K Sh Million)
Source: MOH, Health Sector Working Group Reports, County Governments Annual Budget Implementation Review Reports. * Excludes figures from counties that did not submit data on time.
0
10000
20000
30000
40000
50000
60000
Due to lack of exchequer Due to lack of budgetary provision
2017/18 2018/19 2019/20 2017/18 2018/19 2019/20
3715 416
1093
41755 26232
22249
891
8408656 52506
FY 2014/15 2015/16 2016/17 2017/18 2018/19 2019/20
Ministry of Health
Recurrent 900 1,232 130 14 41,704 26,232
Development 7 83 3,701 51 0
Total MOH 900 1,239 213 3,715 41,755 26,232
Counties* (all sectors)
Recurrent 9,214 10,446 11,556 80,356 11,626 87,997
Development 28,609 26,917 24,286 28,055 22,912 25,853
Total Counties 37,823 37,363 35,842 108,411 34,538 113,850
Staying ahead of the curve: challenges and opportunities for future spending on health in Kenya
Kenya Public Expenditure Review for the Health Sector - FY2014/15-FY2019/20
37
Public financial management (PFM) capacity at the county level is improving thanks to technical assistance from donors15, but certain aspects of the financial management system remain suboptimal for effective service delivery. A key aspect is the loss of financial management autonomy by health facilities because of changes in administrative approaches to managing income received by these facilities. The loss of autonomy and increased rigidity imposed by county-level managers have adversely affected service delivery, staff motivation, and managerial performance. Another key aspect is the ability to track expenditures at the county level with available evidence suggesting challenges regarding identifying expenditure at the program, subprogram, and activity level. This situation is the result of suboptimal application of program-based budgeting (PBB), failure to link expenditures to PBB structures, and inadequate utilization of electronic financial management systems.
Aligning county-level financial systems with national level is a critical step toward improving access to quality expenditure data. The county-level chart of accounts remains outdated and is not aligned with the national-level chart of accounts following transition to PBB. Aggregation of expenditure data by program and subprogram is virtually impossible with custom county-level categorization of expenditure, which limits the analysis of public health expenditure at the county level. While important progress is being made to standardize expenditure tracking at program level across counties, more efforts are needed to have quality expenditure data at more granular level.
3.5 National Government Health Spending
3.5.1 MoH Spending by Recurrent and Development
Recurrent expenditure has remained higher than development expenditures at an average of 61 percent during the period under review. Figure 20 shows that recent expenditure increases for MoH have been recurrent when compared with development. The first three years of devolution saw a decline in recurrent spending from 65 percent of total MoH expenditures in FY2014/15 to 53 percent in 2016/17. Recurrent spending, however, expanded between FY2017/18 and FY 2019/20 because of a sharp increase in spending on UHC-related activities and grants to semi-autonomous agencies (SAGAs). The grants to SAGAs primarily cover salaries and wages of their employees with the increase largely attributed to paying reviewed basic salaries, house allowance, COVID-19 allowances for frontline health workers (FY2019/20), and annual salary increments.
15 The World Bank executed Multi-Donor Trust Fund (MDTF) supports the national and county level governments in four main thematic areas: (i) planning, budgeting, monitoring, and reporting, (ii) monitoring and evaluation, (iii) supply chain management with a focus on RMNCAH health products and technologies, (iv) public finance management, and (v) stakeholder coordination. The MDTF is endowed by the U.S. Agency for International Development (USAID), the Department for International Development (DFID) and the Danish International Development Agency (DANIDA). In addition, the USAID provides similar support to counties. UNICEF is also working closely with the National Treasury and counties to improve planning, budgeting, and expenditure tracking.
38 Health Expenditure

3.5.2 MoH Spending by Economic Categories
After implementing the two-tier government system, transfers to SAGAs replaced employees’ compensation as the largest MoH expenditure by economic category. The economic classification of MoH expenditure includes transfer to SAGAs (such as KEMSA, Kenya Medical Research Institute [KEMRI], and Kenya Medical Training College [KMTC]), operation, and maintenance. These expenditures include the purchase of goods and services (such as drugs and medical consumables), subsidies (grants to counties referral hospitals and other facilities), employees’ compensation (salaries and wages), nonfinancial assets (construction, purchase of equipment, and other physical assets) and social benefits (financial transfers to households).
The largest share of the MoH budget is spent on transfers (grants) to SAGAs, at an average of 62 percent for the period under review, followed by operation and maintenance/goods and services (16 percent), compensation to employees (10.7 percent), and subsidies (7.4 percent). The share of funds spent for subsidies increased from 1 percent of the total health spending in FY2014/15 to about 19 percent in FY19/20. To note, the grants to SAGAs are mainly used to pay for salaries and wages and as such, compensation to employees may actually be accounting for the largest share of MoH expenditures. Such grants are usually transferred from the MOH to the SAGAs once the National Treasury makes the funds available.
Figure 20: MoH Recurrent and Development Health Expenditure as Percentage of Total Health Expenditure, FY2014/15-FY2019/20
Source: MOH, Health Sector Working Group Reports (multiple years).
Legend: l Recurrent l Development l Total expenditures
Hea
lth
expe
ndit
ure,
tota
l (M
oH)
Fiscal years
65%60%
53%
62%65% 66%
35%40%
47%
38%35% 34%
0%
20%
40%
60%
80%
0
50
100
150
2014/15 2015/16 2016/17 2017/18 2018/19 2019/20
Rec
urre
nt/d
evel
opm
ent
heal
th
exp
as %
of t
otal
hea
lth
expe
ndit
ure
Staying ahead of the curve: challenges and opportunities for future spending on health in Kenya
Kenya Public Expenditure Review for the Health Sector - FY2014/15-FY2019/20
39

Figure 21: National Health Spending by Economic Category
Source: MOH, Health Sector Working Group Reports (multiple years).
Legend: l Compensation to employees l Use of goods and services l Subsidies l Transfers to Governement Agencies l Social Benefits l Non-finacial Assets
3.5.3 National Government Health Spending by Functional Classification
Classification of MoH expenditure by program highlights an increasing share of spending going to support implementing social protection and UHC activities under the Health Policy, Standard and Regulation Program and financing national referral services and leasing of medical equipment under the National Referral and Specialized Services Programme. An increasing share of MoH expenditures is going to finance the Health Policy, Standards and Regulation Program, increasing from 11 percent of total MoH expenditures in FY2014/15 to 41 percent in FY2019/20. The increasing spending on Health Policy, Standard and Regulation Program demonstrates the government’s commitment to roll out UHC program as well as expand social protection measures that include free maternity program, health insurance subsidy for the poor and elderly, and free primary health-care services provided by Level 2 and 3 facilities. The free maternity program (referred to as Linda Mama) and the health insurance subsidy for the poor and elderly are channeled through NHIF, while the free primary health-care services are channeled to counties through the CRF.
4.2%
1.3%64.7%
15.9%
13.8%
3.8%
1.0%59.8%
22.6%
12.6%
4.8%
59.8%
9.8%
15.7%
12.2%
59.1%
11.1%
18.4%
9.6%
2.0%
0.9% 1.6%
62.4%
19.4%
9.4%
7.5%
1.2%
67.4%
21.2%
8.5%
2014/15 2015/16 2016/17 2017/18 2018/19 2019/200%
20%
40%
60%
80%
100%
40 Health Expenditure

Spending on national referral and specialized services has remained high and averaged 42 percent of total MoH spending for the period under review. The recent classification of Kenyatta University Teaching and Referral Hospital and Othaya Hospital as a national referral hospital has further increased spending by the national referral program in specialized care. While the poor enjoy the benefits of investments in referral and specialized care, high investments in the national referral hospital are coming at the expense of reduced investments in primary health care through the declining spending under the preventive and promotive program, the backbone of any UHC model.
11%12%
15%
26%
35%
11%11%
10%
21%
48%
12%
8%
21%
16%
43%
26%
11%
11%
10%
43%
23%
11%
11%
9%
45%
44%
8%
7%
8%
33%
2014/15 2016/17 2017/18 2018/19 2019/202015/160
80
40
20
60
120
100
K S
h Bi
llion
Figure 22: National Government Health Expenditure by Program, FY2014/15 to FY2019/20
Source: MoH. Health Sector Working Group Reports (multiple years).
Legend: l National referal and specialized services l General administration and support services l Preventative and promotive health l Health research and development l Health policy, standards and regulations
Staying ahead of the curve: challenges and opportunities for future spending on health in Kenya
Kenya Public Expenditure Review for the Health Sector - FY2014/15-FY2019/20
41
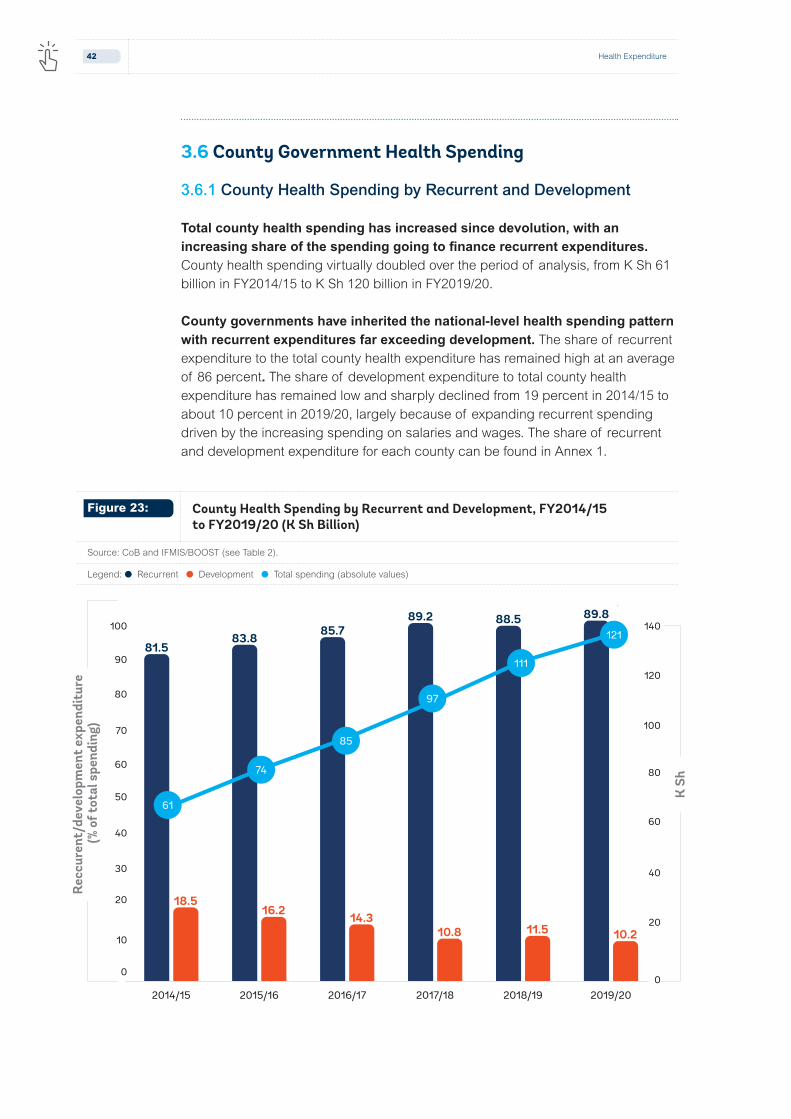
Figure 23: County Health Spending by Recurrent and Development, FY2014/15 to FY2019/20 (K Sh Billion)
Source: CoB and IFMIS/BOOST (see Table 2).
Legend: l Recurrent l Development l Total spending (absolute values)
3.6 County Government Health Spending
3.6.1 County Health Spending by Recurrent and Development
Total county health spending has increased since devolution, with an increasing share of the spending going to finance recurrent expenditures. County health spending virtually doubled over the period of analysis, from K Sh 61 billion in FY2014/15 to K Sh 120 billion in FY2019/20.
County governments have inherited the national-level health spending pattern with recurrent expenditures far exceeding development. The share of recurrent expenditure to the total county health expenditure has remained high at an average of 86 percent. The share of development expenditure to total county health expenditure has remained low and sharply declined from 19 percent in 2014/15 to about 10 percent in 2019/20, largely because of expanding recurrent spending driven by the increasing spending on salaries and wages. The share of recurrent and development expenditure for each county can be found in Annex 1.
Rec
cure
nt/d
evel
opm
ent
expe
ndit
ure
(% o
f tot
al s
pend
ing)
K S
h
81.583.8 85.7
89.2 88.5 89.8
18.516.2 14.3
10.8 11.5 10.2
"""
"("
0
20
40
60
80
100
120
140
0
10
20
30
40
50
60
70
80
90
100
2014/15 2015/16 2016/17 2017/18 2018/19 2019/20
61
74
85
97
111
121
42 Health Expenditure

NEDI counties16 have spent a significant share of their health funds on development activities when compared to non-NEDI counties, but the gap in spending between this group of counties on development is shrinking. The north and northeastern regions of Kenya have historically been underserved with development indicators below the national average. To ensure shared prosperity and reduce poverty across the country, the gaps in these underserved counties need to be addressed. In FY2014/15, NEDI counties spent 34 percent of the health resources on development activities, compared to 16 percent by non-NEDI counties. In FY2019/20, the share of health spending for development was 13 percent in NEDI counties compared to 9 percent by non-NEDI counties. The higher share of funds spent on development may be driven by the equalization fund from the national government partly used to finance construction and upgrading of health, equipping them as well as setting up Medical Training Colleges. It is reasonable to assume that spending on development activities in NEDI counties occurred during the first few years of devolution to fill the infrastructure gaps, while in the following years less investments will be needed. The non-NEDI counties spend more on running the existing facilities, which are assumed to be adequate to serve their respective population.
16 NEDI covers 10 counties: Garissa, Isiolo, Lamu, Mandera, Marsabit, Samburu, Tana River, Turkana, Wajir, and West Pokot. The NEDI is an initiative launched by the GoK with World Bank support in 2018 aiming at increasing investments in the region with a special focus on transformative and integrated infrastructure investments and support to sustainable livelihoods.
Figure 24: Share of Development Expenditure in NEDI and non-NEDI Counties
Source: CoB and IFMIS/BOOST.
Legend: l NEDI l Non NEDI
34%33%
25%
14%17%
13%
16%14% 13%
10% 11%9%
0%
5%
10%
15%
20%
25%
30%
35%
40%
2014/15 2015/16 2016/17 2017/18 2018/19 2019/20
Staying ahead of the curve: challenges and opportunities for future spending on health in Kenya
Kenya Public Expenditure Review for the Health Sector - FY2014/15-FY2019/20
43

3.6.2 County Health Spending by Economic
An increasing share of total county health funds is spent on personnel costs, crowding out spending on other recurrent inputs that are critical in achieving technical and operational efficiency in service delivery. The share of health funding spent on compensation of employees averaged 64 percent of the total county health expenditures and increased from 61 percent in FY2014/15 to 66 percent in FY2019/20. While county health spending on development activities have decreased over time (perhaps driven mainly by lower development investments by NEDI counties), the share for spending on operations and maintenance (O&M) has increased only marginally from 21 percent in FY 2014/15 to 24 percent in 2019/20.
Figure 25: Breakdown of County Health Spending by Economic Category (Percent)
Source: CoB and IFMIS/BOOST (see Table 2).
Legend: l Compensation of employees l Operations and maintenance l Development expenditure
18%
21%
61%
16%
24%
60%
11%
21%
69%
11%
21%
68%
10%
24%
66%
14%
22%
64%
2014/15 2015/16 2016/17 2017/18 2018/19 2019/200%
20%
40%
60%
80%
100%
The lack of data severely limits disaggregation of county-level data to facilitate analyses by economic and functional classifications. This situation constitutes a barrier for expenditure tracking and accountability, especially for monitoring implementation of UHC priorities. Functional classification of county expenditures (including disaggregation by programs and subprograms across sectors of the county government) is currently not possible because of a lack of data. Alignment of county level public financial systems with national level going forward will be a critical step in improving access to quality expenditure data.
44 Health Expenditure

Economic classification is the furthest expenditure disaggregation that can be undertaken at the county level. While the national level chart of accounts was adapted to accommodate program-based budgeting that align spending to programs and subprograms, the same has not been done at the county level. Although the budget is undertaken by programs and subprograms, reporting of the expenditures through IFMIS by the same categories is not possible.
3.7 Intergovernmental Fiscal Transfers and Funds Flow
Devolution has changed the way health care is financed by introducing an intergovernmental fiscal transfer system that has drastically changed the funds flow landscape. Although the intergovernmental fiscal transfer system has empowered county governments in terms of fiscal autonomy in the management of resources, the system has introduced a complex flow of funds mechanism (Figure 26) that has created several operational and administrative related challenges that have led to inefficiency in county health spending.
Figure 26: Post-devolution Funds Flow for Health in Kenya
Source: Mbuthis, Vilcu, et al. (2019)xxxi.
National Revenues
Locally Generated Revenues
User Fees
External Financing NHIF
County Department
of Health
County Revenue
Fund
Health Facilities
National Treasury
Special Purpose Account
In-kind transfers
(direct payment of facility inputs - staff salaries and
drugs)
Annual budget allocation
Donor funded conditional grants
Equitable share and conditional grants
Facility funds remitted to CRF
Financial transfers (e.g., Makueni Care)
Conditional grants (e.g., DANIDA)
Reimbursements under various NHIF schemes
Staying ahead of the curve: challenges and opportunities for future spending on health in Kenya
Kenya Public Expenditure Review for the Health Sector - FY2014/15-FY2019/20
45

Before introducing the devolved system of government, the national government paid directly for basic facility costs, including salaries and drugs, while public facilities relied on user fees and other revenue to cover their operational expenses. In 2013, the GoK abolished all user fees at lower-level public health facilities, as well as user fees for deliveries at all government-owned health facilities under the Free Maternity Scheme (FMS) as part of the GoK efforts to improve access to essential health services. Under the FMS, pregnant women could access free maternal health services. The GoK in return compensated the lower-level facilities for the loss of revenue from user fees and reimbursed all public facilities for providing free delivery services directly to the facilities’ bank accounts under the Health Sector Service Fund (HSSF) and Hospital Management Service Fund (HMSF) mechanisms. Hospitals were, however, allowed to charge subsidized fees for other health services beside deliveries.
The funds flow changes that came into effect with devolution created several complex sub-national fund flow systems for government conditional grants (compensation to Level 2 and 3 facilities and Linda Mama), such that facilities do not receive the reimbursement directly to their bank accounts any longer. Transition to devolution and the 2010 Constitution require that all public funds must be channeled to counties through the respective County Revenue Fund (CRF); the two reimbursement systems were converted into conditional grants in FY 2015/16 and are now routed to counties through the respective CRF. The Linda Mama Program was transferred to the NHIF in 2017 to improve efficiency in management of the program; however, the same funds flow issues apply. In many counties, facilities have no autonomy over these reimbursements (either because they are asked to send the funds back to the CRF or because county treasuries are signatories of the facility accounts, effectively having decision-making authority).
The fund flow system introduced after devolution negatively affected the implementation of the UHC pilot (also called Afya Care), as highlighted by a process evaluation of the same (2020). The President launched the UHC pilot in December 2018 to inform the country about the scale up of the UHC program. The UHC pilot was implemented in the four counties of Isiolo, Kisumu, Machakos, and Nyeri. It had a budget of K Sh 3.1 billion allocated with the focus for each county being the following: delivery of basic and specialized care services (72 percent); health system strengthening activities (15 percent); community health services (12 percent); and public health services (1 percent). To circumnavigate the PFM requirement and ensure funds from the national government were allocated to the activities planned, the pilot leveraged the funds flow arrangement set up for channeling conditional grants from the World Bank and Danida through the Special Purpose Account. The memoranda between the MoH and the four counties envisaged that funds would be disbursed from Treasury to the CRF from where the funds would be moved to the SPA within ten days and subsequently to health facilities within three days. This arrangement did not materialize in practice, likely owing to the lack of incentives and accountability mechanisms. The four counties experienced significant delays in receiving the funds, with all four counties still owed funds by the national government at the end of the pilot. For instance,
46 Health Expenditure

according to the County Governments Annual Budget Implementation Review Report for FY 2018/19, Isiolo county only received half of the UHC funds by the end of FY 2018/19. The remaining funds for FY 2018/19 were received in May 2020. In addition to delays in receiving funds, the pilot suffered from (i) delays in appropriation of funds by the county assembly for the health sector and (ii) reduced county budget allocations for health for FY2019/2020 in Isiolo and Kisumu when compared to previous financial years. These challenges trickled down to the health facility level: only few facilities were allowed to operate their own bank account and even those that could were affected by the unpredictability and delayed allocation of funds to support operating expenditure.
The PFM regulations give authority to county governments to decide if health facilities in the public sector can retain and spend funds that they generate from user fees and from claimed reimbursement from NHIF. Some counties have allowed health facilities to retain self-generated revenue by passing a new legislation, while others have continued to insist on health facilities surrendering user fees collected to the CRF and, therefore, denying facilities the much-needed revenue to finance operational costs. With devolution, many county government hospitals have lost the financial autonomy they used to have prior to devolutionxxxiii, contrary to the expectations of the decentralization process.
Evidence shows that beside financial autonomy with respect to self-generated user fees, higher-level public facilities have surrendered autonomy in the procurement and human resource management functions, as well as in overall planning, management, and decision making because of the creation of centralized procurement and human resource management systems by county governments.xxxiv Post devolution, most functions were centralized at the county level, with the County Public Service Board in charge of the recruitment of all staff and county governments in charge of the procurement of goods and services.
Counties generate little revenue in volume and as a percent of the total county revenues. The largest share of their revenues comes from the national government in the form of the equitable share and conditional grants17. County governments have executive and legislative mandates to budget for and perform devolved functions derived from the 2010 Constitution. To perform their devolved functions, county governments draw resources from such sources as the equitable share, conditional grants, loans and grants, equalization fund, and own-source revenues (OSR). Counties depend mostly on the equitable share and conditional or unconditional grants from the national government, while their own revenue is minimal, mainly resulting from property taxes and service charges. The national government continues to control the more lucrative sources of revenue,
17 The revenue raised nationally is shared equitably among national and county governments. County governments may be given additional allocations from the national government’s share of the revenue in the form of conditional or unconditional grant.
Staying ahead of the curve: challenges and opportunities for future spending on health in Kenya
Kenya Public Expenditure Review for the Health Sector - FY2014/15-FY2019/20
47

such as income taxes, sales taxes, and business taxes. The share of county OSR to total county revenue has remained low at an average of 9 percent between 2014/15 and 2019/20. The limited levels of OSR have led counties to increasingly depend on disbursements from the national government as their main source of revenue. As a percentage of GDP, OSR has remained below 1 percent.
The equitable share (unconditional grants) continues to be the main source of revenue to finance county governments functions (Figure 27). County governments draw revenue from five main sources of revenue streams: the equitable share from the national government; conditional grants from the national government; equalization fund, loans/grants (donors); and OSR. Since devolution, the national government funds have continued to make up the largest share of county government’s total revenues, accounting for an average of about 74 percent for the period under review.
Own-source revenues account for a small proportion of the total revenues at the disposal of counties. Across the counties, OSRs remain low in volume, as well as a percentage of total counties revenues and GDP. As a percentage of total
Figure 27: Share of Central Government Funds in K Sh (Equitable Share and Conditional Grants) and OSR in Total County Revenue (percent); FY2014/15-FY2019/20
Source: CoB and IFMIS data (see Table 2).
Note: Figure 27 shows overall county revenue, conditional grants, and OSR across all sectors (not health sector specific).
Legend: l Equitable share l Conditional grants l Own Source Revenue (OSR) l Loans/grants l Unspent balance l OSR (as % of total county revenue) l Central Government (as % of total county revenue)
Ksh
(B)
Fiscal years
0%
10%
20%
30%
40%
50%
60%
70%
80%
90%
0
50
100
150
200
250
300
350
400
450
500
2014/15 2015/16 2016/17 2017/18 2018/19 2019/20
75.0%
11% 10%7% 8% 9% 8%
78.9%82.6% 82.5%
73.6% 74.4%
48 Health Expenditure

county revenues, they have remained low at an average of about 9 percent for the period under review. The equitable share and the national government conditional grants flow from the national government directly to the CRF.
County governments have been receiving four main conditional grants for health from the national government and two from development partners—Danida and the World Bank—as part of the on-budget donor support to counties (Table 7). The national government supported conditional grants include the free maternal care program (Linda Mama) that reimburses counties facilities for providing free delivery services to pregnant women, compensation for user fee forgone to Level 2 and 3 facilities for revenues foregone following abolishment of user fees, conditional grant for Level 5 county referral hospitals that serve a catchment population that extends beyond the county where they are located, and a medical equipment leasing grant18.
Conditional grants (loans and grants) from external partners that are mainly on-budget have been increasing since devolution and accounted for about 8 percent of total county revenues in FY 2019/20. They include conditional grants from Danida and World Bank under the Transforming Health Systems for Universal Care Project (THS-UCP) for improving reproductive, maternal, newborn, child, and adolescent health (RMNCAH) financed through a World Bank loan, two grants from the Global Financing Facility (GFF), and the Government of Japan Policy and Human Resources Development Fund (PHRD). The THS-UCP introduced a PFM adjustment to address challenges identified with the post-devolution PFM system. These challenges included comingling of health funds with other county revenues, which led to delays in disbursement of funds to the health department, as well as partial release of funds to the county departments of health. The funds flow mechanism is designed under the project to channel donor-funded conditional grants aimed at ring fencing health funds supported by the project. These conditional grants flow from the National Treasury through the special purpose account (SPA) directly to the county department of health (World Bank) or health facilities (Danida). In consultation with the National Treasury and the MoH, the THS-UCP project also includes a provision that encourages counties to move all project funds to the “ring fenced” account (SPA) in a timely manner (within one month) as to avoid downward adjustments to subsequent allocations.
18 The medical equipment grant started in 2015 as a seven-year project that aimed at scaling up health infrastructure to provide specialized medical care (in two hospitals per county and four national referral hospitals) to better handle the increase in noncommunicable diseases and injuries. Six private facilities were contracted to equip these facilities with intensive care units, theaters, machines offering renal dialysis, and imaging services.
Staying ahead of the curve: challenges and opportunities for future spending on health in Kenya
Kenya Public Expenditure Review for the Health Sector - FY2014/15-FY2019/20
49

Table 7: Conditional Grants from the National Treasury to County Treasury
Source: World Bank.
Conditional Grant (supported by)
Conditions for Use of Funds
Allocation Criteria
Eligibility Criteria
Free Maternal Care / Linda Mama (GoK, NHIF)
Delivery services Per delivery Every public and contracted private facility.
Compensation for User Fees Foregone (GoK)
No condition Level 2-3 facilities, lump sum
Only gazette primary healthcare facilities.
Level 5 Hospitals (GoK) No condition Bed occupancy rate Maintain norms and standards in selected (11) Level 5 hospitals – formally provincial general hospitals that used to serve more than one county.
Leasing Medical Equipment (GoK)
Specialized medical equipment
Equal allocations per facility
At least 2 facilities in each county.
THS-UCP (Donor, World Bank)
Improvements in RMNCHN indicators
80% Performance based financing
20% County Revenue Allocation
At least 20% budget allocation to the health sector. PFM transfer condition.
User Fees Foregone (Donor, Danida)
No conditions Fixed amount sent to counties based on the CRA formula. Allocation to all L2 and L3 health facilities is determined by each county based on agreed criteria.
At least 20% to the health sector. Financial and technical report PFM transfer condition.
The amount of funds channeled through national government conditional grants for health has been increasing, with a larger share dedicated to medical equipment for specialized care. Conditional grants have increased in absolute terms from K Sh 13 billion in FY 2015/16 to K Sh 22 billion in FY 2018/19, but later the amount declined slightly to K Sh 19 billion in FY2019/20. Data showed that a larger share of the conditional grants for health is accounted for by the Lease of Medical Equipment/Managed Equipment Service (MES) at about 32 percent of the total conditional grants for health in FY 2019/20. Recent evidence suggests inequities and inefficiencies as the design, cost and distribution of the equipment was not informed by an assessment of county health needs in terms of disease burden and capacity - personnel and supportive infrastructure - to absorb the
50 Health Expenditure

equipmentxxxv. The drop in total value of conditional grants for health in FY2016/17 was due to the process of transitioning the free maternal care program to the NHIF, which led to some disruptions in the system and thus lower reimbursement to facilities. However, increasing funds for the program testify improvements in the program management by the NHIF and use by counties and health facilities.
Government conditional grants are meant to be a fiscal tool used by the national government to ensure that devolved governments provide prioritized health services and comply with essential national policies, standards, and guidelines (hence, “conditional”). However, the national government funded conditional grants are basically “unconditional” in practice. Firstly, most national government conditional grants are activity oriented and place the incentives at the county level, rather than at the facility level. For example, under the Linda Mama Program, facilities report the number of deliveries conducted and receive reimbursement from the NHIF. However, in most cases this revenue is swept back to the CRF, in line with the PFM Act 2012, removing incentives at the facility level to report facility-based deliveries. Secondly, many of the counties have opted not to channel these funds to facilities, but instead treat them as part of their general county revenue, leading to weak linkages with health sector outputs and results and undermining the national government’s ability to steer resources in areas of prioritized investment and achieve improved results. The fund flow system has ended up denying or delaying flow of critical health funds to health facilities.
Considering the various challenges faced in implementing the government conditional grants as currently designed, a decision was made to phase them out and channel the funds as part of the county government equitable share. This decision, which is in the National Treasury Medium Term Draft 2021 Budget Policy Statement dated Jan 25, 2021, indicates the priority economic policies, structural reforms, and the sectoral expenditure programs to be implemented under the Medium-Term Expenditure Framework (MTEF) for FY 2021/22– 23/24. The government proposes to reorganize the current health conditional grants for L2 and L3 facilities as well as for Level L5 facilities into the county government equitable share from FY 2021/2022, thus increasing the same from K Sh 316,500 million in FY2020/21 to K Sh 370,000 million in FY2021/22. The conditional grant for free maternity will remain. The change is expected to address some of the critical issues experienced with the conditional grants, such as delays in funds disbursement from the National Treasury to counties and suboptimal absorption of funds because of the counties’ inability to meet the eligibility criteria and to provide increased autonomy for counties on how to allocate the resources. However, the change may lead to adverse consequence for the health sector, such as the following: (i) reduced donor financing, as donors might be reluctant to invest funds in a non-ring-fenced account; (ii) potentially lower budget for health overall, as counties may decide to not allocate the additional revenue to the health sector; (iii) increased inequitable and inefficient funds allocation within the health sector, if funds currently used to reimburse L2 and L3 facilities are diverted for other purposes; and (iv) potential deviation of funds from the 11 L5 facilities as funds will be reallocated across the 47 counties.
Staying ahead of the curve: challenges and opportunities for future spending on health in Kenya
Kenya Public Expenditure Review for the Health Sector - FY2014/15-FY2019/20
51

The UHC policy 2020-2030 envisaged a phased transition from conditional grants to a UHC Fund, yet the recent announcement to end conditional grants and channel resources as part of the equitable share does not seem to be aligned with the transition plan. According to the UHC 2020-2030 policy, Kenya was expected to move away from conditional grants using a three phases approach: first, pool UHC conditional grants with other ring-fenced health funds at the county level using the SPA; second, transition the conditional grants to a UHC fund at the national level where all funds are to be consolidated to purchase the essential benefit package from L1-L4 facilities; and third, transition from the UHC Fund to the NHIF in the form of a social health insurer that pools resources at the national level and purchases essential services from L1-L6 facilities. The reallocation of funds previously channeled through conditional grants as part of the equitable share may represent a significant barrier in the national government’s ability to incentivize a homogenous, coordinated progress across counties toward the objectives of the UHC agenda unless other mechanisms are put in place.
Figure 28: Level and Changes in Conditional Grants for Health over Time, FY2015/16-2018/19 (Amount Spent)
Source: County Governments Annual Budget Implementation Review Reports (2016/16-2019/20).xxxvi
Legend: l User fees foregone l Free maternal care l Donors l Level 5 l Medical Equipment
Ksh
(B)
0
5
10
15
20
25
2015/16 2016/17 2017/18 2018/19 2019/20
6% 6% 4% 5%9%25% 11% 17% 21%
9%
14%22%
17% 20%26%
36%
29%
20% 22%5%
21%
20%
22% 32%13B
11B
14B
22B
19B
Table 8: Conditional Grants as Percentage of County Public Health Expenditure
Source: County Governments Annual Budget Implementation Review Reports (2016/16-2019/20).xxxvi
Fiscal year Percentage
2015/16 18%
2016/17 13%
2017/18 15%
2018/19 20%
2019/20 8%
52 Health Expenditure

The planning and budget cycle comprises of a series of overlapping processes and tasks from the previous fiscal year, current fiscal year, and following fiscal year in line with the Medium-Term Expenditure Framework (MTEF) adopted by the Kenyan government. The MTEF approach aims at aligning planning and budgeting processes on a three-year rolling plan. The planning and budget cycle is organized into four broad stages: (1) prioritization and determination of the resource envelope; (2) preparation of budget estimates; (3) legislative approval; and (4) budget execution, monitoring, and review. The Constitution of 2010 and the Public Financial Management (PFM) Act of 2012 guide the planning and budgeting process.
❱ Stage 1: The prioritization and determination of resource envelope starts with the issuance of a budget circular on or before August 30 of the current fiscal year and continues until February 28 of the following fiscal year. During this period, ministries and departments are expected to undertake a performance review of the previous fiscal year budget to lay the foundation for preparing the upcoming budget. Sectors are also expected to establish and cost strategic priorities for the upcoming fiscal year.
❱ Stage 2: The preparation of budget estimates commences after the preliminary budget ceilings are issued by the National and County Treasury through the Budget Review and Outlook Paper (BROP) and the County Budget Review and Outlook Paper (CBROP), respectively (September). Based on the preliminary ceilings, ministries and departments are expected to prepare budget proposal that articulate their spending proposals as well as actual resource estimates required to realize the sector commitments, irrespective of the provisional ceilings set by the Treasury.
❱ Stage 3: The legislative approval stage runs from April 30 to June 30. During this phase, the National and County Assembly reviews and approves the budget estimates and passes the necessary legislation that include the Appropriation Bill to allow spending to commence.
❱ Stage 4: Budget execution period runs from July 1 to June 30 of the following calendar year. There is an opportunity for ministries and departments budget to have their budget revised through a supplementary budget process. During the budget execution period, ministries and departments are expected to monitor their spending ensure efficiency in spending as well as high-performance in-service delivery. National and county governments are required to comply with the legal requirements for accounting and reporting on the appropriated funds in the budget execution period.
Box 2: Planning and Budgeting Cycle in Kenya
Staying ahead of the curve: challenges and opportunities for future spending on health in Kenya
Kenya Public Expenditure Review for the Health Sector - FY2014/15-FY2019/20
53

3.8 Government’s Budgetary Response and Impact of the COVID-19 Pandemic
Kenya confirmed its first case of COVID-19 on March 14, 2020. Since then, COVID cases have increased, reaching 173,661 cases with 3,345 deaths reported (June 10, 2021). Kenya has swiftly responded to the pandemic; however, the health system’s resources are limited, thus requiring decisions on how to best use the existing resources.
The coronavirus (COVID-19) pandemic has affected almost all countries in the world in varying degrees with some countries successfully limiting the spread of the pandemic and preventing deaths associated with the disease. The COVID-19 pandemic requires adequate and timely injection of public resources to support a comprehensive mitigation response. In many of the countries severely affected by the COVID-19 pandemic, governments have responded through various measures to avail resources in a timely manner to fund health (and other sectors) related interventions to mitigate the negative impact of the pandemic.
Many countries affected by COVID-19 have employed the budgetary allocation approach as one of the key approaches to raise emergency resources to fund COVID-19 mitigation measures. The budgetary interventions have mainly focused on adjusting the expenditure side of the budget. Invoking the contingency fund to release additional resources, as well as donor financing (grants and loans), is another option that targets the revenue side is the budget framework to raise additional resources to finance COVID-19 interventions.
With the outbreak of the COVID-19 pandemic, Kenya faces both an economic and a health crisis and has responded with a raft of policy interventions including budgetary responses. The GoK sought to raise funds to finance COVID-19 interventions using several approaches that include amending the 2019/20 budget through the supplementary budget process to rationalized budgetary allocations for noncore activities to release resources for COVID-19 pandemic interventions and implementation of development activities, borrowing both locally and internationally.
Kenya amended the 2019/20 budget through the supplementary budget process and earmarked K Sh 40 billion (about 0.4 percent of GDP) for COVID-19-related expenditures that include health-related interventions, such as enhanced surveillance, laboratory services, isolation units, equipment, supplies, and communication. Other expenditures are social protection interventions that include cash transfers and food relief, among others, and funds for expediting payments of existing obligations to maintain cash flow for businesses during the pandemic crisis.
54 Health Expenditure

The National Treasury presented three amendments of the budget for FY2019/20 through the supplementary budget process (supplementary budget I, II and III) for approval by Parliament (see Figure 29 for the changes to the MoH budget against total Ministries, Department and Agencies (MDA) budget occasioned by the budget amendments). Supplementary budget II and III were specifically intended to rationalize budget allocations for noncore activities to release resources to finance interventions to mitigate against the COVID-pandemic and implement development activities. The supplementary budgets II and III were assented to on April 14 and June 30, 2020, respectively. Figure 29 shows the MoH budget as a percentage of total MDAs allocation for FY2017/18 to FY 2020/21 while Table 9 shows the several amendments to the health budget by recurrent and development.
Figure 29: Ministry of Health Budget as Percentage of Total MDA Allocation, 2017/18 to 2020/21 (K Sh Billion)
Source: CoB. Annual national government budget implementation reports (multiple years).xxxviii
Legend: l Total allocation to government MDAs l MoH as a % of total governemnt
1,578 1,698 1,967 1,879 1,978 1,7520
1
2
3
4
5
6
7
0
500
1,000
1,500
2,000
2,500
2017/18 2018/19 2019/20 - Supp I
2019/20 - Supp II
2019/20 - Supp III
2021
4.975.30
5.885.56
6.04
6.51
MoH
bud
get t
o to
tal M
DA a
lloca
tion
(%)
Tota
l allo
cati
on to
gov
ernm
ent
MDA
s
The revised budget (supplementary budget III) for the health sector (119.3 billion) represents an increase of about 40.2 percent from the K Sh 85.1 billion allocated in the FY 2018/19 (revised budget). This allocation comprised K Sh 43.28 billion (36.5 per cent) for development expenditure and K Sh 76.1 billion (63.5 per cent) for recurrent expenditure. The revised budget (supplementary III) in 2019/20 translates to about 6 percent of the total government budget (total
Staying ahead of the curve: challenges and opportunities for future spending on health in Kenya
Kenya Public Expenditure Review for the Health Sector - FY2014/15-FY2019/20
55
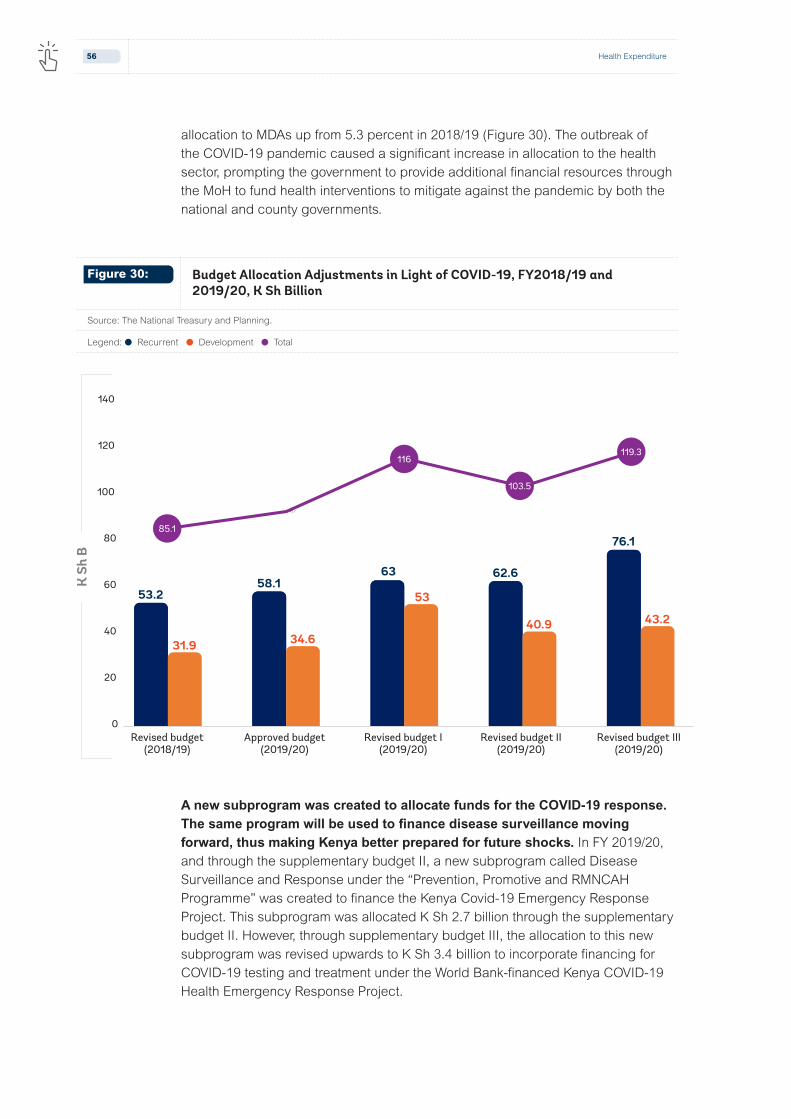
A new subprogram was created to allocate funds for the COVID-19 response. The same program will be used to finance disease surveillance moving forward, thus making Kenya better prepared for future shocks. In FY 2019/20, and through the supplementary budget II, a new subprogram called Disease Surveillance and Response under the “Prevention, Promotive and RMNCAH Programme” was created to finance the Kenya Covid-19 Emergency Response Project. This subprogram was allocated K Sh 2.7 billion through the supplementary budget II. However, through supplementary budget III, the allocation to this new subprogram was revised upwards to K Sh 3.4 billion to incorporate financing for COVID-19 testing and treatment under the World Bank-financed Kenya COVID-19 Health Emergency Response Project.
Figure 30: Budget Allocation Adjustments in Light of COVID-19, FY2018/19 and 2019/20, K Sh Billion
Source: The National Treasury and Planning.
Legend: l Recurrent l Development l Total
K S
h B
53.258.1
63 62.6
76.1
31.9 34.6
53
40.9 43.2
92.7
0
20
40
60
80
100
120
140
Revised budget(2018/19)
Approved budget(2019/20)
Revised budget I(2019/20)
Revised budget II(2019/20)
Revised budget III(2019/20)
85.1
116
103.5
119.3
allocation to MDAs up from 5.3 percent in 2018/19 (Figure 30). The outbreak of the COVID-19 pandemic caused a significant increase in allocation to the health sector, prompting the government to provide additional financial resources through the MoH to fund health interventions to mitigate against the pandemic by both the national and county governments.
56 Health Expenditure
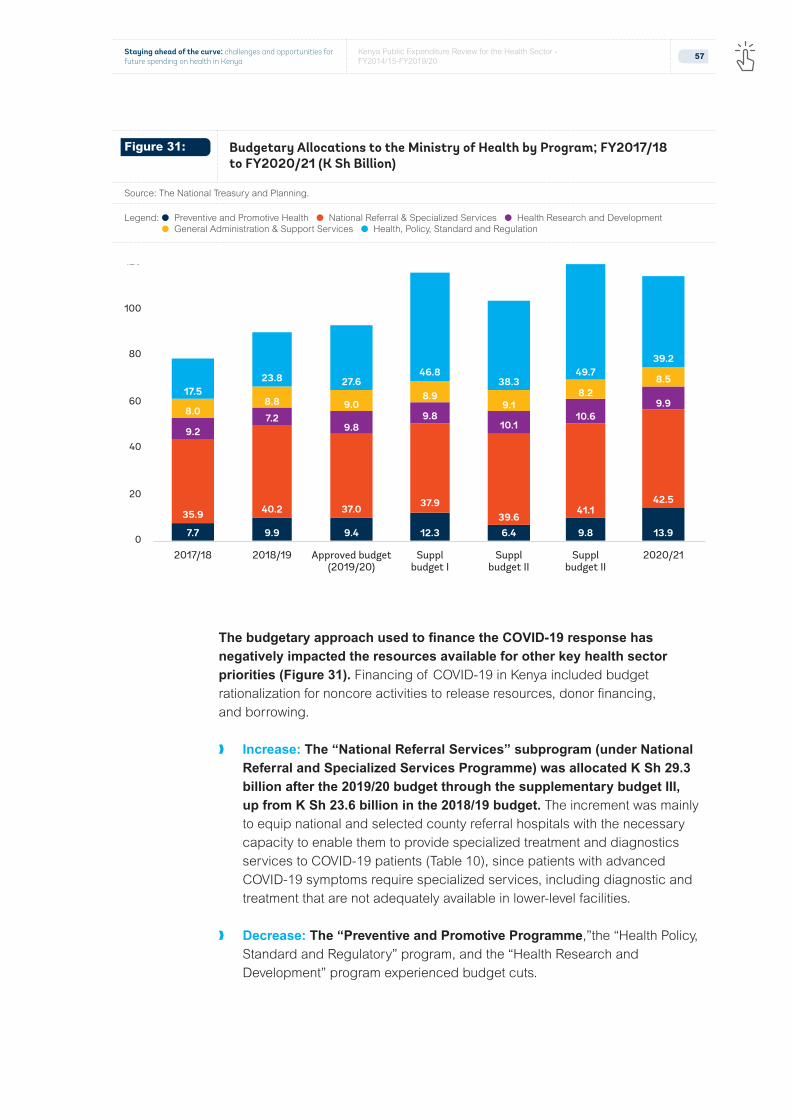
The budgetary approach used to finance the COVID-19 response has negatively impacted the resources available for other key health sector priorities (Figure 31). Financing of COVID-19 in Kenya included budget rationalization for noncore activities to release resources, donor financing, and borrowing.
❱ Increase: The “National Referral Services” subprogram (under National Referral and Specialized Services Programme) was allocated K Sh 29.3 billion after the 2019/20 budget through the supplementary budget III, up from K Sh 23.6 billion in the 2018/19 budget. The increment was mainly to equip national and selected county referral hospitals with the necessary capacity to enable them to provide specialized treatment and diagnostics services to COVID-19 patients (Table 10), since patients with advanced COVID-19 symptoms require specialized services, including diagnostic and treatment that are not adequately available in lower-level facilities.
❱ Decrease: The “Preventive and Promotive Programme,”the “Health Policy, Standard and Regulatory” program, and the “Health Research and Development” program experienced budget cuts.
7.7 9.9 9.4 12.3 6.4 9.8 13.9
35.9 40.2 37.0 37.939.6
41.142.5
9.27.2
9.89.8
10.110.6
9.98.0
8.8 9.08.9
9.18.2
8.517.5
23.8 27.646.8
38.349.7
39.2
0
20
40
60
80
100
120
2017/18 2018/19 2020/21Approved budget(2019/20)
Supplbudget I
Supplbudget II
Supplbudget II
Figure 31: Budgetary Allocations to the Ministry of Health by Program; FY2017/18 to FY2020/21 (K Sh Billion)
Source: The National Treasury and Planning.
Legend: l Preventive and Promotive Health l National Referral & Specialized Services l Health Research and Development l General Administration & Support Services l Health, Policy, Standard and Regulation
Staying ahead of the curve: challenges and opportunities for future spending on health in Kenya
Kenya Public Expenditure Review for the Health Sector - FY2014/15-FY2019/20
57

The pandemic also affected donor support by redirecting existing funds for other health priorities to the COVID response. In the immediate term, a number of development partners responded to the pandemic by mobilizing resources to finance the COVID-19 response at the expenses of other areas, such as HIV/AIDS, tuberculosis, and malaria. For instance, on April 4, 2020, the Global Fund issued a guidance note authorizing recipient countries to apply grants for HIV/AIDS, tuberculosis, and malaria in their fight against the COVID-19 pandemic through reprogramming up to 5 percent of savings under existing grants and utilizing underused funds19.
Additional Resources for Hospitals Recurrent Development
KNH and Mbagathi Hospital 600 m
KNH - Conversion of a daycare center to a COVID-19 ward 140 m
Kenyatta University Teaching, Referral and Research 500m
Jaramogi Oginga Odinga Teaching and Referral 400m
Moi Teaching and Referral Hospital 400m
Coast General Hospital 500m
Kitui Hospital 300m
Mandera General Hospital 300m
Operationalization of 300 beds capacity at KUTRRH 525.5m
Other COVID-19-related Support (Government and Development Partners)
Grant to counties shared between counties using the resource allocation formulation (K Sh 5 billion to finance COVID-19 interventions and K Sh 2.036 billion to finance frontline workers allowances).
7.71 b
Kenya Emergency Response Project (World Bank)20 5.35 b
Danida Grant for Level 2 and 3 to fight the COVID-29 pandemic 350 m
19 Global Fund. 2020. “Guidance Note on Responding to COVID.” https://www.theglobalfund.org/media/9397/core_covid-19_guidancenote_en.pdf?u=637220357960000000
20 The objective of COVID-19 Emergency Response Project funded by the World Bank is to prevent, detect, and respond to the threat posed by COVID-19 and strengthen national systems for public health preparedness. This project has seven components: namely, Medical Supplies and Equipment to improve the availability of supplies and equipment needed to respond to COVD-19 (and other public health emergencies and strengthen the capacity of the MoH to provide timely medical diagnosis for COVID-19); Capacity Building and Training to strengthen response and build capacity of key stakeholders, including health works and communities; Quarantine, Isolation and Treatment Centers to strengthen the health system’s capacity to effectively provide Infection Prevention and Control (IPC) and case management of COVID-19 cases; Medical Waste Disposal to ensure the safe disposal of waste generated by laboratory and medical activities; Community Discussions and Information Outreach to ensure there is a two-way communication between the government and the population; Availability of Safe Blood and Blood Products to strengthen the capacity of the Kenya National Blood Transfusion Service (KNBTS) to provide safe blood and blood products; and Project Implementation and Monitoring to finance costs associated with the project coordination, activities for program implementation and monitoring and to strengthen management capacity.
Table 9: Breakdown of Budget Allocations to Secondary-level Facilities for COVID-19 Response (K Sh)
Source: The National Treasury and Planning. Note: “m” denotes million, “b” denotes billion.
58 Health Expenditure

The preparation of the COVID-19 supplementary budget process has faced challenges related to timing and funds flow to counties.21 The timing of the supplementary budget, especially supplementary III, did not allow adequate time for approval by the Parliament and subsequent budget implementation. Supplementary budget III was presented on June 22, 2020, and approved by Parliament on June 30, 2020. The timing did not provide adequate time to the MoH to plan and implement activities that were drawing funding from the budget revisions and as such, MoH was not able to absorb part of the funds provided through the supplementary budget. While the budget revision was necessary to provide funds to finance interventions to mitigate against COVID-19, such budget performance information as exchequer issues and incurred expenditure were not considered. The Treasury should work with line ministries on budget revisions that appropriately align budget allocations to actual performance.
3.9 Out-of-pocket Spending and Health Insurance Reforms
Despite the government’s efforts to improve financial protection from health-care use, out-of-pocket (OOP) expenditures continue making up a significant proportion of the total health spending and drive about 1 million individuals into poverty each year. Spending for OOP constitutes the most unequal way of financing a health-care system and jeopardizes one of the core objectives of UHC: financial protection. In FY2018/19, OOP (excluding insurance contributions) contributed about 25 percent of total health spending and 71 percent of the private expenditure (Figure 32). A recent study estimated that about 1 million to 1.1 million Kenyans fall into poverty each year because of costs related to health care. Households from disadvantaged socioeconomic backgrounds, with the presence of elderly and with people affected by chronic conditions, were more likely to suffer from impoverishing expenditure. However, evidence from household health budget expenditure surveys show a decreasing trend in the share of the population affected by catastrophic health spending (10 percent threshold), down from 15.5 percent in 2007 to 8 percent in 2018. The main drivers of catastrophic expenditure in Kenya include payments for medicines and payment for outpatient and inpatient services. Although Kenya has removed user fees for public facilities, public hospitals still operate under the cost-sharing policy and all levels of private health-care facilities are still paid for through OOP payments. To further reduce OOP expenditures in Kenya, it is critical to address the role of the private sector, such as through the inclusion of more health facilities under the NHIF arrangement and coverage of pharmaceuticals.
21 CoB. National Government Budget Implementation Review Report, FY2019/20.
Staying ahead of the curve: challenges and opportunities for future spending on health in Kenya
Kenya Public Expenditure Review for the Health Sector - FY2014/15-FY2019/20
59

Efforts to increase financial protection by removing user fees need to be accompanied by equivalent compensation to the health facilities for the revenue lost. The GOK has implemented various reforms to remove user fees and protect Kenyans against financial hardship because of health expenses. In 2013, the GoK removed user fees for primary health care at dispensaries and health centers and put in place a mechanism to compensate health facilities for the revenue lost through a monthly global budget. The same year, it introduced the free maternity care program to remove user fees for all maternity services in all public and faith-based health facilities. Evidence has shown that public health facilities are struggling to cover operating expenses because the reimbursed funds are often swept to CRF as county OSR and, therefore, do not reach health facilities. Moreover, compensation for the removal of user fees is deemed inadequate as the allocation is not being adjusted for the increasing number of health facilities and inflation.
Figure 32: Share of Expenditure for OOP Spending (FY2018/19)
Source: Computed using data from multiple sources.
Figure 33: Incidence in Catastrophic Health Spending, 2003-2018 (Percent)
Source: KHHEUS 2018.
Legend: l 2003 l 2007 l 2013 l 2018
Private insurance 3%
NHIF
OOP
6.7 15.5 12.7 8
26%71%
60 Health Expenditure

Another key step to protect Kenyans against financial hardship from seeking care and treatment is expanding access to essential medicines by making them affordable. The recent facility survey showed that the low availability of medicines plague public primary and secondary health facilities, leading to high levels of OOP spending for drugs. Therefore, the need to purchase drugs out-of-pocket continues to negatively affect households’ access to health-care services.
Health insurance coverage has increased over time, but significant additional government contributions are needed to achieve desirable targets. The largest increase in health insurance coverage happened with the introduction of the civil servant scheme in 2012, which raised insurance coverage from 10 percent in 2007 to about 17.1 percent in 2013. The additional government reforms to expand access to insurance have yielded little impact: the health insurance coverage increased by 2.8 percentage points (equivalent to 9.5 million Kenyans) from 17.1 percent in 2013 to 19.9 percent in 2018. While various types of health insurance schemes exit, the NHIF remains the preferred insurance scheme covering about 89 percent of the insurance market. The large share of people working in the informal sector means that significant government subsidies are needed to expand insurance levels to desired levels. Available data show that most insured Kenyans work in the formal sector (60.6 percent) and that insurance coverage increases with wealth: only 4.5 percent of the Kenyans in the lowest quantile have insurance cover, compared with 42.3 percent in the highest wealth quantile.
Figure 34: Health Insurance Coverage, 2003-2018
Source: KHHEUS 2018.
0.0
5.0
10.0
15.0
20.0
25.0
2003 2007 2013 2018
9.7 10.0 17.1 19.9
Perc
ent
%
Staying ahead of the curve: challenges and opportunities for future spending on health in Kenya
Kenya Public Expenditure Review for the Health Sector - FY2014/15-FY2019/20
61

Both the national and county governments are working to expand health insurance subsidies for the poor and most vulnerable population groups. The MoH already finances the HISP for older persons and persons with severe disabilities. While the COVID-19 emergency has slowed down progress on the UHC agenda for almost a year, the GoK launched in November 2020 the second phase, which envisions a mandatory UHC scheme covering a new Essential Health Benefits Package for K Sh 6,000 per household per year (about $ 60) coupled with an extension of the premium subsidies for an additional 1 million people unable to pay. In addition to efforts led by the national government, some counties (Nairobi, Kajiado, and Busia) have also introduced their own programs to cover the poor and indigent households through the national premium schemes under NHIF.
The negative impact of COVID-19 on the economy might lead to an increase in OOP spending for health. Lower GDP growth in 2020 will reflect into lower government revenue. Therefore, if allocation of government resources remains as per before COVID-19 levels, this means lower government health spending and therefore higher OOP.
Many low-income countries in Sub-Saharan Africa have employed a wide variety of approaches to increase insurance coverage among the informal sector and the poor, with varying but overall low degrees of success22. Countries with high labor informality face the persistent challenges of covering the informal sector, collecting premiums, and identifying the poor, and these challenges are exacerbated when insurance enrollment is voluntary. As with Kenya, many countries have often adopted a mixed approach with compulsory coverage for civil servants or formal employees and subsidies for the very poor groups of the populations; however, limited progress has been achieved. Somewhat higher levels of coverage of the informal sector are found in countries with mandatory health insurance (such as Rwanda and Ghana), but when enforcement capacity is lacking, coverage rates remain relatively low. Most countries have not been successful in effectively providing universal health care and financial protection to their citizens using targeting approaches.
A preferable approach is to cover everyone from the onset with a smaller package of services, with the option to get additional insurance coverage and benefits, and expand the package over time as the fiscal space increases. Evidence shows that targeting leads to fragmentation, inefficiencies, and inequities. Evidence also suggests that it is politically difficult for countries that start with a targeting approach to move toward universality, because the groups benefiting from insurance coverage have no incentives to support the expansion to other sections of the population23. In terms of financing systems, a combination of mandatory
22 Bitran, Ricardo. 2014. Universal Health Coverage and the Challenge of Informal Employment: Lessons from Developing Countries. Health, Nutrition, and Population (HNP) discussion paper. World Bank, Washington, DC. https://openknowledge.worldbank.org/handle/10986/18637?locale-attribute=en
23 Nicholson, David, Robert Yates, Will Warbuton, and Gianluca Fontana. 2015.Delivering Universal Health Coverage: A Guide for Policymakers. Report of the WISH Universal Health Coverage Forum 2015. https://www.imperial.ac.uk/media/imperial-college/institute-of-global-health-innovation/public/Universal-health-coverage.pdf
62 Health Expenditure

schemes and general government revenue is the most suitable long-term strategy to achieve UHC in countries characterized by high levels of informality and poverty24. Mandatory contributions address the issues around adverse selection and low enrollment rates, while general government revenue is necessary to cover the poor and informal sector. Two conditions are necessary for such a system to be feasible and effective: first, the government needs to generate sufficient revenue, and second, revenue from general taxes must be allocated to maximize efficiency and effectiveness, rather than relying on historical budgeting25.
In the medium term, the national government will continue to play a critical role in the expansion of health insurance subsidies. A significant engagement from the national level is also needed to define the minimum standards moving forward in terms of coverage, quality of care (including in the private sector), criteria for receiving subsidies, and expansion over time. As the counties’ ability to raise their own revenue increases over time, so will their potential contribution to subsidize premiums for the most vulnerable population groups in their counties. However, this process is expected to take a long time.
Over the next two decades, if Kenya is to follow global patterns of middle-income countries, it will undergo a transition from supply-side to demand-side financing. The combination of “money follows the patient,” a more robust IT and claims system, and an increased managed autonomy for using claim revenues at the provider level has proved to be a powerful tool for shifting accountability, especially within the public system. In terms of the future trajectory of health spending, channeling more money through the NHIF may be partially offset with less supply-side funding of public health facilities. However, this trend requires careful management, as supply-side financing will continue playing a critical role in Kenya until supply-side issues have been satisfactorily addressed.
24 Nakhimovsky, Sharon, Onaopemipo Abiodun, Adam Koon, and Altea Cico. 2017. Expanding Coverage to Informal Workers: A Study of EPCMD Countries’ Efforts to Date. USAID, Washington, DC. https://www.hfgproject.org/expanding-coverage-informal-workers-study-epcmd-countries-efforts-date/
25 Kutzin, Joseph, Winnie Yip and Cheryl Cashin. 2016. Alternative Financing Strategies for Universal Health Coverage. World Scientific. https://www.worldscientific.com/doi/abs/10.1142/9789813140493_0005
Staying ahead of the curve: challenges and opportunities for future spending on health in Kenya
Kenya Public Expenditure Review for the Health Sector - FY2014/15-FY2019/20
63

Performance of the Kenyan Public Health System
4.0

4.1 Equity Analysis
Kenyans have relatively similar access to health facilities, yet there remain differences in distance to a facility where a doctor is available. In 2015/16, 60 percent of the population lived in a community with a health facility and the average distance from a health facility where a doctor is available was 20 km. Access to a health facility within the community was driven mainly by the location (rural/urban), but differences were not huge. Instead, the poor lived further away from the nearest health facility with a doctor. The same is true for individuals living in rural areas. There is no difference in the proportion of individuals living in a community with a health facility across the poor and nonpoor in both rural and urban communities. Distance from a health facility was also found to be associated with higher child mortality.
Wealthier people have a higher uptake of both curative and preventive services. Recent data show a significant economic gradient in service uptake, for both preventive care and curative care. For example, while on average 78 percent of the sick population seeks care, this is 83 percent among the richest people and 72 percent among the poorest (Figure 35). Similarly, the richest are twice as likely compared to the poorest to seek preventive services (Figure 36). The higher utilization of care by women likely reflects a higher care needs, mainly related to pregnancy.
Figure 35: Uptake of Curative Services ( Percent Sick People Seeking Outpatient or Inpatient Services over the Past 4 Weeks)
Source: World Bank using KHHEUS 2018 data (weighted data).
78%
All
76%
Q2
77%
Q3
79%
Q4
83%
Richest(Q5)
72%
Poorest(Q1)
82%
Urban
76%
Rural
80%
Female
75%
Male
Staying ahead of the curve: challenges and opportunities for future spending on health in Kenya
Kenya Public Expenditure Review for the Health Sector - FY2014/15-FY2019/20
65

A higher share of poor people reported “poor health”, despite “illness” being equally reported, suggesting that poor people have less access to quality care. In 2018, about one Kenyan in five reported being ill, independently on their income level, while in 2015 households in the top wealth quintile reported higher illness than those in the lowest. However, a higher proportion of poor people noted poor health compared to better off people. On the contrary, illness and self-reported poor health do not seem to be impacted by the location (rural/urban).
Figure 36: Uptake of preventive health services during the four weeks prior to the interview
Source: World Bank using KHHEUS 2018 data (weighted data).
Figure 37: Illness versus Poor Self-reported Health Status by Income Quantile and Location (2018)
Source: Own calculations using KHHEUS 2018 (weighted data).
Legend: l Illness l Poor self-reported health
5%
All
4%
Q2
4%
Q3
5%
Q4
6%
Richest(Q5)
3%
Poorest(Q1)
6%
Urban
4%
Rural
6%
Female
3%
Male
19%
12%
19%
14%
19%
12%
19%
11%
20%
10%
19%
11%
20%
13%
20%
12%
All Q2 Q3 Q4 Richest(Q5)
Poorest(Q1)
Urban Rural
66 Performance of the Kenyan Public Health System

Kenya has made exorbitant progress on reducing disparities by income level in certain health outcomes, yet significant geographic disparities remain.26 Both infant mortality (Figure 38) and under-five mortality have declined considerably since the early 2000s, but the decrease has been more pronounced among the poorest, leading to similar mortality rates across socioeconomic characteristics (such as wealth quantile, mother’s education, and rural/urban), although child outcomes disparities remain by geographic area. Data at the regional level point to significant disparities (Table 10); for example, under-five mortality is two times higher in Nyanza as compared to the central region.
26 Refer also to Kenya Poverty and Gender Assessment 2015/16.
0
10
20
30
40
50
60
70
80
90
100
1992 1994 1996 1998 2000 2002 2004 2006 2008 2010 2012 2014 2016
Qua
ntile
Val
ue
Figure 38: Infant Mortality in Kenya by Income Quantile, 1992-2016
Source: World Bank using KHHEUS 2018 data (weighted data).
Legend: l Q5 Richest l Q4 Richer l Q3 Middle l Q2 Poorer l Q1 Poorest
Staying ahead of the curve: challenges and opportunities for future spending on health in Kenya
Kenya Public Expenditure Review for the Health Sector - FY2014/15-FY2019/20
67

A considerable socioeconomic gradient remains in other health outcomes and service utilization indicators, such as stunting rates and skilled deliveries. Stunting rates among children younger than five years old have fallen by 10 percentage points from 2008/09 to 2014. Gains were driven by improvements across wealth quantiles, but children in the top wealth quintile experienced much lower stunting rates across all years. Likewise, children with mothers who have much higher levels of education experienced lower rates of stunting. Moreover, wide differences in stunting rates across counties exist, from less than 10 percent to more than 50 percent of children. Similarly, the proportion of births attended by a skilled professional increased between 2008 and 2014. Gains occurred across both rural and urban areas and wealth quintiles, but large differences remain. For instance, a skilled professional attended to around 30 percent of births in the lowest wealth quintile, compared to more than 90 percent in the wealthiest in 2014. Wide disparities remain between rural and urban areas.
Table 10: Heatmap of Selected Child Outcomes by Region
Source: KDHS 2014
Region Infant Mortality
Under-5 Mortality
Coast 44 57
Northeastern 37 44
Eastern 36 45
Central 38 42
Rift Valley 34 45
Western 40 64
Nyanza 50 82
Nairobi 55 72
Figure 39:
Stunting Rate at the County Level
Source: DHS 2014
68 Performance of the Kenyan Public Health System

County-specific data produced on a regular basis are critical for Kenya to make focused investments toward equitable provision of health care as promoted in the Kenya Health Policy 2012-2030 and United Nations Sustainable Development Goals. While Kenya has recently promoted efforts to collect and report health outcomes data at the county level, these efforts remain insufficient. The 2014 Kenya Demographic and Health Survey (KDHS) was the first DHS to partially report on health indicators by county (especially service coverage indicators) as counties were operationalized in FY2013/14 for the first time. The 2014 KDHS revealed substantial and considerable regional variation in all maternal health indicators across counties. What cannot be measured cannot be managed, hence the need to produce county specific data for robust and continuous monitoring of key health indicators at the county level.
As there are no differences in access to public hospitals by income, every Kenyan benefits from the increasing spending dedicated to national referral and specialized services. Of the public funding that is spent on hospitals care, the benefits that accrue to the poorest quantile of the population are about 33 percent, similarly to the benefits for the richest quantile (Figure 41). However, anecdotal evidence points to the poor having a lack of access to the most specialized facilities (Level 6 hospitals); hence, it will be important to further disaggregate the analysis in the future. Richer people consistently use private hospitals more, suggesting that higher socioeconomic status individuals disproportionately use outpatient services offered at private hospitals.
Figure 40: Proportions of Births Attended by a Skilled Provider, Kenya 2003-2014
Source: Kenya Poverty and Gender Assessment 2015/16.xlvii
Legend: l 2003 l 2008 l 2014
0%
10%
20%
30%
40%
50%
60%
70%
80%
90%
100%
42%
62%
44%
Total Urban Poorest Poorer MiddleRural Richer Richest
35%
50%
37%
72%
82%
75%
17%
31%
20%
33%
50%
31%
38%
63%
42%
55%
81%
53%
75%
93%
81%
Staying ahead of the curve: challenges and opportunities for future spending on health in Kenya
Kenya Public Expenditure Review for the Health Sector - FY2014/15-FY2019/20
69

Figure 41: Care Utilization by Facility Type and Ownership
Source: World Bank using KHHEUS 2018 (weighted data).
Legend: l Government Hospital l Private Hospital l Government HC/Disp l Private Clinic/Centre l Other HC = health center, Disp = dispensaries
Figure 42: Benefit Incidence by Type of Public Health Facilities
Source: World Bank using KHHEUS 2018 (weighted data).
Legend: l Government hospitals l Government dispensaries l Government health centres l Line of equality HC = health center, Disp = dispensaries
32% 31% 33% 33% 33% 32% 31%
19% 15% 26% 13% 12% 15% 20%
29%36%
16%
37% 37% 33%27%
9% 8%10%
6% 7% 8% 10%
12% 32%15%
11% 11% 12% 12%
Total (%) Rural Q4
30%
29%
17%
11%
13%
Richest(Q5)
Urban Poorest(Q1)
Q2 Q3
Culm
ativ
e sh
are
of p
rovi
ded
care
Culmative share of population (poorest to richest)
0
0.1
0.2
0.3
0.4
0.5
0.6
0.7
0.8
0.9
1.0
0 0.2 0.4 0.6 0.8 1.0
70 Performance of the Kenyan Public Health System

A recent benefit incidence analysis confirms that government facilities are either neutrally distributed across quantiles or pro-poor (especially dispensaries). This welcome finding suggests that public spending equally benefits everyone in the country, especially for primary care services, which tend to be pro-poor. However, the study highlights marked pro-rich inequality and inequity in care in private and nonprofit or faith-based facilities, even after controlling for care needs. This is specially the case for preventive and inpatient care utilization, although factors driving socioeconomic inequality differ. While for outpatient and inpatient care the total household income is the main driving factor; for preventive care, it is the level of education.
-0.005 0.000 0.005 0.010 0.015 0.020 0.025 0.030 0.035
Preventive care
Inpatient care
Outpatient care
Figure 43: Benefit Incidence Analysis by Type of Service
Source: Ilinca et al. 2019.
Legend: l Preventive l Outpatient l Inpatient l Line of equality
Figure 44: Inequity Decomposition Analysis
Source: Ilinca et al. 2019.
Legend: l Age-Gender l Health l Total Household OR HH Expenditure l Education l Household l Employment l Region l Residual
Culm
ativ
e sh
are
of p
rovi
ded
care
Culmative share of population (poorest to richest)
0
0.2
0.4
0.6
0.8
1.0
0 0.2 0.4 0.6 0.8 1.0
Staying ahead of the curve: challenges and opportunities for future spending on health in Kenya
Kenya Public Expenditure Review for the Health Sector - FY2014/15-FY2019/20
71

4.2 Efficiency Analysis
4.2.1 Translating Health Expenditure into Health Outputs and Health Outcomes
We examined the impact of resources on service delivery outputs and health outcomes. For benchmarking purposes, they used current health expenditure as a share of GDP as a measure of inputs and resources to the health sector. In addition, they used the World Bank UHC index27 as a proxy of health service coverage, while they used maternal mortality and child mortality as proxies for health outcomes. This methodology, however, has limitations and does not reflect a causal relationship, rather a correlation. Indicators used for this benchmarking exercise are proxies for inputs, outputs, and outcomes in the health sector. The relationship among spending, utilization, and outcomes is clearly an area that merits further research, but this analysis can shed light on the relationship between resources and results.
Kenya is not achieving the expected health results vis-à-vis the amount of resources spent. Simple correlation of current health expenditure as a share of GDP on UHC index (service delivery indicators) and maternal mortality and child mortality outcomes confirm that the relationships are strong. However, at the aggregated level, Kenya government health spending translates into expected levels of health service coverage given its economic status, but the service coverage does not translate into the expected health outcomes.
27 UHC index reflects the coverage of essential health services based on tracer interventions that include reproductive, maternal, newborn and child health, infectious diseases, noncommunicable diseases, and service capacity and access. It is presented on a scale of 0 to 100. Values greater than or equal to 80 are presented as 80 as the index does not provide fine resolution at high values.
72 Performance of the Kenyan Public Health System

For instance, Kenya’s maternal mortality and child mortality rates are relatively higher compared to countries with similar health spending.
Spending can improve health outcomes, but it is equally important to improve the efficiency of the spending and quality of health policy-making and health institutions. A plethora of literature emphasizes that it is critical to increase spending on health to improve health outcomes; however, this theoretical link between public expenditure in health and health outcomes is complex and weakened when the funds are not spent efficiently and effectively. As shown in the scatterplots in Figure 46 and 47, in Kenya, the link between the inputs and outcomes is weaker compared to other neighboring countries with similar GDP, which may be explained by inefficiencies in the sector, along with other factors.
Figure 45: Benchmarking Health Expenditure (Inputs) to UHC Coverage (Output)
Source: WDI.
UH
C Co
vera
ge In
dex
(sca
le 0
−1)
Current health expenditure % GDP
Bangladesh
Ethiopia
Ghana
India
Sri Lanka
Rwanda
Thailand
Uganda
Vietnam
South Africa
Kenya
0.3
0.4
0.6
0.8
2 3 5 7 10 15
Staying ahead of the curve: challenges and opportunities for future spending on health in Kenya
Kenya Public Expenditure Review for the Health Sector - FY2014/15-FY2019/20
73

Figure 46: UHC Service Coverage Index versus Maternal Mortality
Source: WDI.
Figure 47: UHC Service Coverage Index versus Under-5 Mortality
Source: WDI.
Mat
erna
l mor
talit
y (p
er 1
00,0
00)
UHC service coverage index
Bangladesh
Ethiopia
Ghana
India
Rwanda
Uganda
South Africa
Kenya
100
200
300
500
1,000
0.3 0.4 0.5 0.6 0.7 0.8
Und
er−5
mor
talit
y (p
er 1
000)
UHC service coverage index
Bangladesh
Ethiopia Ghana
India
Sri Lanka
Rwanda
Somalia
Thailand
Uganda
Vietnam
South AfricaKenya
7
10
20
30
50
100
200
0.3 0.4 0.5 0.6 0.7 0.8
74 Performance of the Kenyan Public Health System
Taking a similar approach as above, the report’s authors examined the impact of resources on service delivery indicators and health outcomes at the county level. They compared the public health expenditure per capita by county (inputs) to percentage of women delivering in a health facility (outputs) and to infant mortality rate (outcomes) as proxies to measure efficiency (Figure 47). The size of the bubble indicates the level of per capita health expenditure (the bigger the bubble, the higher per capita health spending). This analysis sheds some light on how the translation of inputs to outcomes are broadly occurring at the sub-national level, although it does not control for many factors potentially affecting results beyond expenditure.
There is a weak correlation among inputs (health expenditure per capita), outputs (institutional deliveries), and health outcomes (infant mortality) and wide variations among counties as shown in Figure 47. In an ideal world, one would expect higher spending (bigger bubble) translating into higher percentage of women delivering in health facilities, which would translate into lower infant mortality rates. However, this link does not seem to hold true across all counties in Kenya. For instance, counties with one of the greatest per capita health expenditures, such as Lamu and Garissa, still have a staggeringly low percentage of women delivering at health facilities, which also translates into higher infant mortality rates. However, in counties with higher health spending per capita infant mortality is lower (overall counties with larger bubbles tend to lie on or below the regression line). Such counties as Marsabit, Samburu, Isiolo, Makueni and Elgeyo Marakwet have higher spending per capita compared to Nairobi, Homa Bay, Tukana, and Meru, who have lower spending and higher infant mortality. There is a similar trend for other health outcomes, such as under-five mortality and stunting, which does not necessarily correlate to improved health outcomes with higher spending (results not shown).
Staying ahead of the curve: challenges and opportunities for future spending on health in Kenya
Kenya Public Expenditure Review for the Health Sector - FY2014/15-FY2019/20
75

According to a recent county level technical efficiency study, counties’ public healthcare systems performed generally well. However, the study found a decrease in technical efficiency over time. Using administrative data from FY 2014/15 through FY 2017/18, the study measured the performance of 47 county-level public healthcare systems in Kenya using stochastic frontier analysis. The median technical efficiency of county public healthcare systems was 84 percent (with an interquartile range of 79 percent to 90 percent). Bomet had the highest technical efficiency score at 95 percent in FY 2017/18, but nine counties (one-fifth of all counties) also had technical efficiency scores greater than 90 percent. Overall, Mandera had the highest annual percentage growth in efficiency at about 18 percent per year, but more than half of the counties (27 out of 47 counties) had declining technical efficiency scores over the four-year study period. Figure 49 panels C and D show traditional measures of health-care system performance and capacity (bed occupancy rate and outpatient caseload) against the adjusted measure of technical efficiency. County bed occupancy rates showed very little correlation with technical efficiency (Pearson correlation r = 0.20). There is a high level of correlation between outpatient caseload and the measure of technical efficiency (Pearson correlation r = 0.66).
Figure 48: Value for Money—Health Spending per Capita, Percentage of Deliveries at Health Facility and Infant Mortality Rate
Source: MOH and DHS 2014.
15
25
35
45
55
65
75
15 25 35 45 55 65 75 85 95
Infa
nt m
orta
lity
rate
(pe
r 1,0
00)
Institutional deliveries (%)
Baringo
Bomet
Bungoma
Busia
Elgeyo Marakwet
Embu
Garissa
Homa Bay
Isiolo
Kajiado
Kakamega Kericho
Kiambu Kilifi
Kirinyaga Kisii
Kisumu
Kitui
Kwale
Laikipia
Lamu
Machakos
Makueni Mandera
Marsabit
Meru
Migori
Mombasa
Murang'a
Nairobi
Nakuru
Nandi
Narok Nyamira
Nyandarua
Nyeri
Samburu
Siaya
Taita Taveta
Tana River
Tharaka-Nithi
Trans-Nzoia
Turkana
UasinGishu
Vihiga
Wajir
West Pokot
76 Performance of the Kenyan Public Health System

Figure 49: County-level Technical Efficiency
Source: Moses et al. 2021.li
Legend for C and D: l 2014/15 l 2015/16 l 2016/17 l 2017/18
0.5
0.6
0.7
0.8
0.9
Technicalefficiency
10
0
10
20
Annual percentagechange in technicalefficiency from2014/15 to 2017/18
Bed occupany rate (%) Outpatient visits per healthcare provider per day
0.0 0.2 0.4 0.6 2.5 5.0 7.5
0.5
0.6
0.7
0.8
0.9
A
C
B
D
Tech
nica
l effi
cien
cy
The qualitative part of the study found that a major constraint leading to suboptimal translation of inputs to outputs was inadequate financing to health facilities: resources routinely fail to reach facilities in a predictable and timely way. This situation has many repercussions: poorly maintained equipment and infrastructure; unreliable supply of essential medical supplies; health staff shortages; and low staff motivation. According to a recent PFM study conducted by the World Bank, all surveyed respondents in primary health facilities reported substantial delays in receiving the range of funding available to health centers and dispensaries. A considerable proportion of counties said they were not drawing on one or more sources of funding at all. Many specifically mentioned that this was negatively affecting the provision of primary health-care services. What is more, counties also face difficulties funding all facilities under their jurisdiction because of suboptimal quality; the lack of gazetting makes them ineligible for certain sources of funding.
Staying ahead of the curve: challenges and opportunities for future spending on health in Kenya
Kenya Public Expenditure Review for the Health Sector - FY2014/15-FY2019/20
77

4.2.2 Micro-level Inefficiencies in Kenya’s Health System
4.2.2.1 Health Infrastructure
Kenya made massive investment in health infrastructure, which has improved access to and coverage of health services in the country, albeit with substantial variation across counties. The number of government health facilities increased by 33.6 percent from 4,456 to 5,953 nationally from 2013 to 2018. As the number of health facilities increased, access to health services also improved, especially in previously neglected and remote areas. Today, more than 90 percent of Kenyans live within five kilometers or one-hour travel time to a health facility. In addition, there has been significant procurement of high-end medical equipment—both directly by the county government and through the national government Managed Medical Equipment (MMES) initiative for specialized care. According to the recent devolution study from the World Bank, Kenya also experienced improvement and expansion of existing facilities across all selected counties.
Improvements in health infrastructure have not been followed by improvements in the availability of medical equipment for primary care. Basic equipment is not offered at more than half of health facilities in Kenya. Equipment availability has generally worsened post-devolution, which is alarming given the fact that most of the poor and vulnerable population access care at a public primary health facility. Facilities in more rural counties display worse equipment availability than those in more urban counties. Thus, poorer and rural counties tend to have worse health outputs, compared to wealthier and more urban counties.
There are weak linkages between construction of new facilities, equipment investment, and actual population health needs. Thus, national norms and standards should better inform investment in county health infrastructure. There is a need to improve adherence to infrastructure norms and standards in counties to guide rationalization in the construction of new health facilities and the expansion or improvements of existing ones. If primary care is to be the backbone of UHC, then expanding the number of facilities will only bring the expected benefits, if an equal increase in the availability of critical inputs (including equipment, medicines, and qualified staff) accompanies this expansion.
4.2.3 Human Resources for Health
The GoK has made progress in filling the gap in skilled human resources for health (HRH), yet availability remains a major bottleneck to improving quality of care. Since FY 2014/15, Kenya has increased the total number of technical health staff (national and county levels) by 68 percent, reaching 17,000 staff in total in the health sector, with most of the increases occurring at the county level
78 Performance of the Kenyan Public Health System
following devolution. However, counties report that they continue to be constrained by technical health staff shortages28. When compared to the Kenya normative requirements for HRH, in 2016 Kenya had an average gap of 281 percent. This was reduced to 152 percent by FY2019/20, following recruitment in light of the UHC agenda. This suggests that in a large number of some counties, even a double in the current number of technical staff would not be enough to meet the normative requirement (Figure 50 - next page). When we look at physicians’ density with respect to the resources spent, we see that Kenya lags behind vis a vis aspiring countries (see Figure 51, page 87).
This shortage in HRH can be explained by a number of reasons. Firstly, the increases in health staff have not been sufficient to keep up with the rapid increase in the number of health facilities. Secondly, staffing may be particularly deficient for frontline service delivery, because more staff are employed in higher-level facilities as compared to primary health care facilities, which can result in poorer services and outcomes for the poorer and vulnerable populations in the country. Thirdly, after devolution, a recent study indicated that many counties experienced major disruptions in staff salary payments, political interference with HRH management functions, and confusion over HRH management roles, which led to health worker mass resignations (and strikes) in the public sector, contributing to the already existing staff shortagelix.
Salaries have increased at both national and county level, but at the county level increases have disproportionately benefitted the higher paid job groups. The increase in the number of staff as well as in the number of health staff translated in higher spending for wages and salaries (Figure 52 - see page 88). Over the period under analysis (FY 2014/15 to FY 2020/21), on average salaries and wages increased by 89 percent at the national level and 29 percent at the county level: however, the distribution of such increase differed substantially. While at the national level salaries increased more for the job groups in the middle and below, the increase in HRH remuneration has been disproportionally high for higher paid job grades at the county level. At the county level, the monthly salary per person of higher grade (paid) jobs (lower number and higher alphabets) increased dramatically, while that of lower grade jobs decreased. Job grades 5-P (higher to lower paid jobs), on average increased by more than 218 percent, while the monthly salary per capita for the lower grades from G to A (lower to higher paid) decreased by 43 percent. In particular, the increase was highest for political positions at county levels (job groups 8 and 9). Under devolution, counties took control over their workforces, which gave them authority to change their spending patterns to adjust the number and distribution of health workers.
28 Technical health staff includes clinical officers, nurses, pharmacy technicians, laboratory technicians, public health officers, Human Resource Information Management, Community Oral Health Officers, physiotherapists, nutritionists, orthopedic, trauma, orthopedic technicians, medical social worker, radiographer, occupational therapists, and therapists (MOH 2019).
Staying ahead of the curve: challenges and opportunities for future spending on health in Kenya
Kenya Public Expenditure Review for the Health Sector - FY2014/15-FY2019/20
79

Figure 50: Estimated Gap in HRH Technical Staff by County in FY 2019/20 (Number, Percent)
Legend: n Actual number of HRH staffn Estimated gap in number of HRH staffn Gap (%)
Source: Authors analysis using MOH HRH gap analysis 2016. Note: Authors imputed the FY 2019/20 technical staff needs by applying the rate of staff increase between FY2014/15 and FY2020/21 (7 percent per year) to the technical staff needs estimated in 2016 by MOH.
Nm
ber o
f HR
H s
taff
-22% -8%
-6%
3%
3%
35%
44%
46%
69%
74%
76%
78%
91%106%
120%
121%
125%
132%
133%
134%
135%
145%
147%
147%
158%
158%
165%
169%
169%
214%
219%
219%
226%
236%
257%
272%
274%
278%
278%
316%
328%
332%
346%
350%
384%
578%
579%
-2000
0
2000
4000
6000
8000
10000
12000
14000
16000
Kwale
Nairo
bi Nar
ok Nan
di
Vihiga
Wajir
Mar
sabit
Bun
gom
a
Hom
a-Bay
Gar
issa
Lam
u
Turk
ana
Sam
buru
Isiolo
Tana
-River
Kak
ameg
a
Bar
ingo
Kiam
bu
Mer
u
Nak
uru
Tran
s-Nzo
ia
Nya
mira
Nye
ri
Kisii
Ker
icho
Mac
hako
s
Man
dera
Wes
t-Po
kot
Kilifi
Kajiado
Mak
ueni
Mom
basa
Taita-
Tave
ta
Bus
ia
Bom
et
Kirinya
ga
Kisum
u
Kitui
Mur
ang'a
Thar
aka-
Nithi
Migor
i
Uas
in-G
ishu
Embu
Siay
a
Laikipia
Nya
ndar
ua
Elge
yo-M
arak
wet
80
Perform
ance of the Kenyan P
ublic H
ealth System
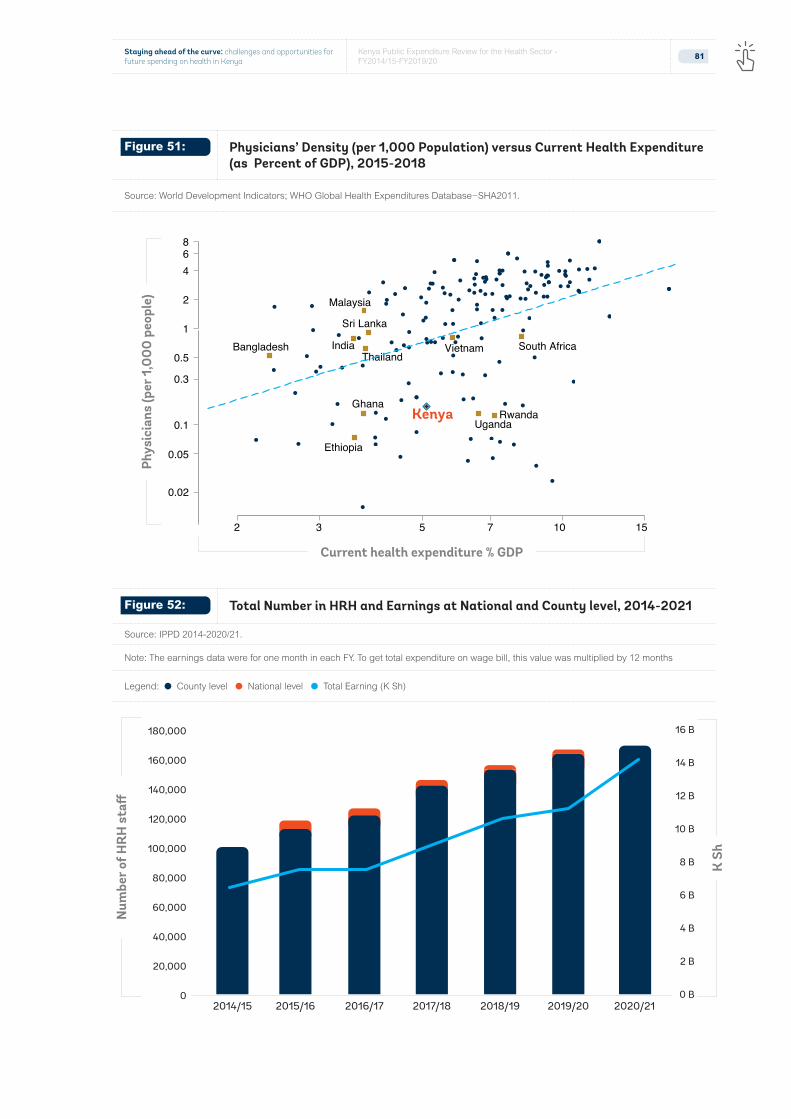
Figure 51: Physicians’ Density (per 1,000 Population) versus Current Health Expenditure (as Percent of GDP), 2015-2018
Source: World Development Indicators; WHO Global Health Expenditures Database−SHA2011.
Figure 52: Total Number in HRH and Earnings at National and County level, 2014-2021
Source: IPPD 2014-2020/21.
Note: The earnings data were for one month in each FY. To get total expenditure on wage bill, this value was multiplied by 12 months
Legend: l County level l National level l Total Earning (K Sh)
Bangladesh
Ethiopia
Ghana
India
Sri Lanka
Malaysia
Rwanda
Thailand
Uganda
Vietnam South Africa
Kenya
0.02
0.05
0.1
0.3
0.5
1
2
468
2 3 5 7 10 15
Phys
icia
ns (p
er 1
,000
peo
ple)
Current health expenditure % GDP
K S
h
Num
ber o
f HR
H s
taff
0 B
2 B
4 B
6 B
8 B
10 B
12 B
14 B
16 B
0
20,000
40,000
60,000
80,000
100,000
120,000
140,000
160,000
180,000
2014/15 2015/16 2016/17 2017/18 2018/19 2019/20 2020/21
Staying ahead of the curve: challenges and opportunities for future spending on health in Kenya
Kenya Public Expenditure Review for the Health Sector - FY2014/15-FY2019/20
81

Salary increases at the national level have benefitted lower cadres of health staff the most (Figure 54). The greatest average increase is for nurses and health assistants with an average increase of approximately 200 percent from FY2014/15 to FY2019/20, while medical specialists’ average salary decreased slightly (12 percent). Another encouraging result is that by job title, salary increased relatively more for the lowest job groups. For example, among technicians the average salary per person increased by 152 percent for job group H and 8 percent for job group P. Similarly, the average salary of health officers increased by more than 100 percent by job category H (112 percent) as compared to job category N (59 percent).
Figure 53: Change in HRH Monthly Salary per Capita by Job Group (%) from FY2014/15 to FY2020/21 at the National Level (left graph) and County Level (right graph)
Source: IPPD. Note: Higher ranking (higher pay) job groups start from the top. Numbers denote political positions.
Job
grou
p (h
ighe
st to
low
est)
Job
grou
p (h
ighe
st to
low
est)
71%
45%
28%
56%
94%
122%
65%
63%
74%
124%
31%
33%
52%
17%
11%
2%
35%
0% 50% 100% 150%
D
E
F
G
H
J
K
L
M
N
P
Q
R
S
T
U
4
-55%
-46%
-32%
-48%
-42%
-44%
-36%
38%
53%
54%
102%
145%
171%
190%
223%
203%184%
109%
580%
356%
78%
190%
66%
-200% 0% 200% 400% 600%
A
C
B
E
D
G
F
J
H
L
K
N
M
Q
P
S
R
9
T
7
8
5
6
82 Performance of the Kenyan Public Health System
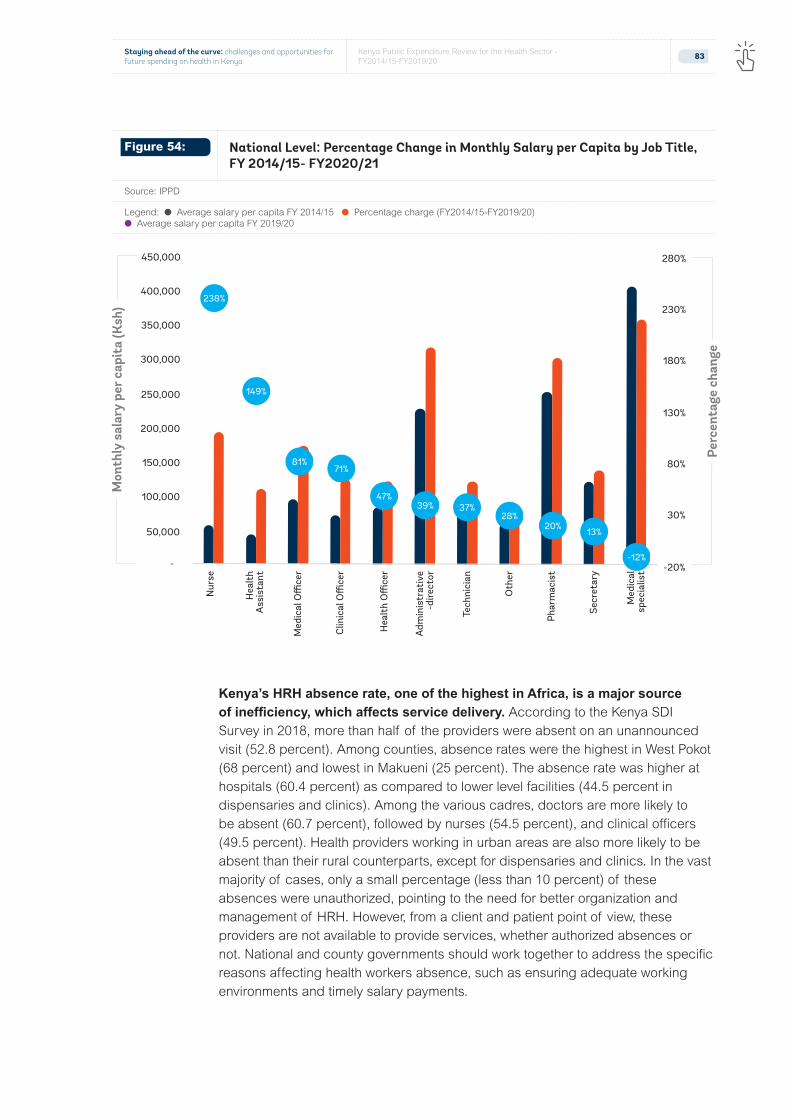
Kenya’s HRH absence rate, one of the highest in Africa, is a major source of inefficiency, which affects service delivery. According to the Kenya SDI Survey in 2018, more than half of the providers were absent on an unannounced visit (52.8 percent). Among counties, absence rates were the highest in West Pokot (68 percent) and lowest in Makueni (25 percent). The absence rate was higher at hospitals (60.4 percent) as compared to lower level facilities (44.5 percent in dispensaries and clinics). Among the various cadres, doctors are more likely to be absent (60.7 percent), followed by nurses (54.5 percent), and clinical officers (49.5 percent). Health providers working in urban areas are also more likely to be absent than their rural counterparts, except for dispensaries and clinics. In the vast majority of cases, only a small percentage (less than 10 percent) of these absences were unauthorized, pointing to the need for better organization and management of HRH. However, from a client and patient point of view, these providers are not available to provide services, whether authorized absences or not. National and county governments should work together to address the specific reasons affecting health workers absence, such as ensuring adequate working environments and timely salary payments.
Figure 54: National Level: Percentage Change in Monthly Salary per Capita by Job Title, FY 2014/15- FY2020/21
Source: IPPD
Legend: l Average salary per capita FY 2014/15 l Percentage charge (FY2014/15-FY2019/20) l Average salary per capita FY 2019/20
Mon
thly
sal
ary
per c
apit
a (K
sh)
-20%
30%
80%
130%
180%
230%
280%
-
50,000
100,000
150,000
200,000
250,000
300,000
350,000
400,000
450,000H
ealt
hA
ssis
tant
Hea
lth
Offi
cer
Tech
nici
an
Oth
er
Secr
etar
y
Phar
mac
ist
Med
ical
spec
ialis
t
Nur
se
Med
ical
Offi
cer
Clin
ical
Offi
cer
Adm
inis
trat
ive
-dire
ctor
Perc
enta
ge c
hang
e
238%
149%
81%
47%39%
28%37%
71%
-12%
13%20%
Staying ahead of the curve: challenges and opportunities for future spending on health in Kenya
Kenya Public Expenditure Review for the Health Sector - FY2014/15-FY2019/20
83

The estimated cost of inefficiency from absenteeism is approximately $58 million for FY2019/20, corresponding to approximately 5 percent of total health expenditure over the same period29. Potential savings vary by county depending on the average absenteeism rate and expenditure for personnel. In Lamu County, these amount to $0.5 million (4 percent of total government health expenditure), while in Nairobi they reach $5.4 million (9 percent of total government health expenditure). Further efforts to reduce inefficiencies from absenteeism are needed by addressing underlying governance issues and reinforcing complementary accountability mechanisms.
29 The potential savings were calculated by multiplying the total earnings for human resources in each county by the average absenteeism rate by county using the data from the SDI survey. No data were available on total earnings by professional cadre. However, the absenteeism rate was similar across professional cadres (doctors: 61 percent, Clinical Officers: 50 percent, and nurses: 55 percent). Data from the SDI survey were representative at the county level.
Table 11: Potential Savings from Absenteeism in FY2019/20 and FY2020/21 by County
Source: The National Treasury and Planning. Note: “m” denotes million, “b” denotes billion.
County Total HRH Earning (K Sh Million)
Average Absence Rate (%)
FY 2019/20
Potential Savings in $ Million
Potential Savings/Total Public Health Exp
Baringo 200 37 0.7 3%
Bomet 137 44 0.6 5%
Bungoma 346 56 1.9 5%
Busia 188 49 0.9 4%
Elgeyo Marakwet 151 45 0.7 5%
Embu 222 50 1.1 4%
Garissa 293 58 1.7 9%
Homa Bay 263 50 1.3 5%
Isiolo 105 45 0.5 4%
Kajiado 219 58 1.3 5%
Kakamega 343 59 2.0 4%
Kericho 158 57 0.9 3%
Kiambu 479 60 2.9 5%
Kilifi 293 60 1.8 6%
Kirinyaga 145 51 0.7 3%
Kisii 357 57 2.0 6%
…table continued next page
Kisumu 305 48 1.5 4%
84 Performance of the Kenyan Public Health System

County Total HRH Earning (K Sh Million)
Average Absence Rate (%)
FY 2019/20
Potential Savings in $ Million
Potential Savings/Total Public Health Exp
Kitui 269 48 1.3 3%
Kwale 228 51 1.2 4%
Laikipia 179 46 0.8 5%
Lamu 89 51 0.5 4%
Machakos 363 51 1.8 5%
Makueni 248 25 0.6 2%
Mandera 191 36 0.7 3%
Marsabit 124 66 0.8 5%
Meru 325 50 1.6 5%
Migori 183 47 0.9 3%
Mombasa 357 44 1.6 5%
Murang’a 228 50 1.1 4%
Nairobi 939 58 5.4 9%
Nakuru 398 50 2.0 4%
Nandi 237 60 1.4 6%
Narok 256 64 1.6 6%
Nyamira 194 46 0.9 5%
Nyandarua 136 45 0.6 4%
Nyeri 255 65 1.6 6%
Samburu 108 45 0.5 4%
Siaya 161 44 0.7 3%
Taita Taveta 133 48 0.6 5%
Tana River 108 50 0.5 5%
Tharaka-Nithi 159 45 0.7 4%
Trans Nzoia 191 61 1.2 6%
Turkana 238 42 1.0 4%
Uasin Gishu 218 59 1.3 6%
Vihiga 137 64 0.9 8%
Wajir 264 64 1.7 7%
West Pokot 189 68 1.3 8%
Total 11,309 52 58.3 5%
Suboptimal levels of providers’ clinical competency hamper the provisions of effective care and represent another significant source of inefficiency in the Kenyan health sector. The SDI
Staying ahead of the curve: challenges and opportunities for future spending on health in Kenya
Kenya Public Expenditure Review for the Health Sector - FY2014/15-FY2019/20
85
survey found that providers’ clinical knowledge to correctly diagnose, treat, and manage common conditions is inadequate. For instance, providers’ diagnostic accuracy of tracer clinical cases30 was lower than two-third and only a fifth of the health providers (19.6 percent) correctly diagnosed all four tracer conditions . According to a recent World Bank study, the potential savings from addressing medical errors in five counties was $2.6 million per year (4).Thus, training (both pre- and in-service) needs to be better focused on capacitating health workers to accurately diagnose and treat the main causes of illness, as well as to have the skills to refer complicated cases to higher-level facilities. There should be a concerted emphasis on adhering to the national guidelines as far as managing critical health conditions is concerned. Without trained and capable staff at health facilities, investments in infrastructure, medicines and equipment will not yield the expected benefits.
In addition to HRH, KEMSA faces many challenges with the procurement of pharmaceutical drugs, including inadequate funds, delays in procurement, and poor quantification capacity. Insufficient funds result in delays in payment to suppliers, which creates a lack of trust between the supplier and purchaser. Poor quantification and delays in procurement have been big challenges in KEMSA. This poor coordination has led to an overestimation and underestimation of drugs, which created large stock-outs and inefficiencies in the procurement process. The devolved government system in Kenya has significantly increased county-level decision-space in deciding and purchasing their own drugs. Although some counties experienced improvements with drug procurement, many counties also experienced shortages, wastages, and stock-outs. These situations suggest additional capacity building may be needed to bring counties to the same level of skills for drugs procurement. In addition, weak governance arrangements, procedures, and control systems have led to corruption allegations on matters related to COVID-19 procurement. Analysis of pharmaceutical drugs and medical supplies through KEMSA over the period of analysis was not possible because of the lack of data.
30 The choice of tracer conditions was guided by the burden of disease among children and adults, and whether the condition is amenable to use with a simulation tool, that is, the condition has a presentation of symptoms that makes it suitable for assessing the provider’s ability to reach a correct diagnosis with the simulation tool. Two of the conditions were childhood conditions (severe dehydration and pneumonia), and two conditions were adult conditions (pulmonary tuberculosis and type I diabetes). Two other conditions were included: post-partum hemorrhage and neonatal asphyxia. The former is the most common cause of maternal death during birth, and neonatal asphyxia is the most common cause of neonatal death during birth. The successful diagnosis and management of these six conditions can avert a large share of child and adult morbidity and mortality.
86 Performance of the Kenyan Public Health System

4.2.3.1 Utilization
The inefficiencies in the health sector result in lower service (outpatient) utilization compared to the inputs invested. Many counties’ outpatient service utilization decreased from 2014/15 to 2018/19 without adjusting for population. Figure 55 shows the change in health spending per capita against the change of outpatient services during the same period. The increase in investment in the health sector does not commensurate with the change in outpatient services. There are also wide county variations. For example, about half of the 4m7 counties report health utilization rates above the national average (2.5 per capita per year), while nine counties report utilization rates of 30 percent or more below the national average.
Baringo
Bomet
Bungoma
Busia
Elgeyo Marakwet
Embu
Garissa Homabay
Isiolo
Kajiado
Kakamega
Kericho
Kiambu
Kilifi
Kirinyaga
Kisii
KisumuKitui
Kwale
Laikipia
Lamu
MachakosMakueni
Mandera
Marsabit
Meru
Migori
Mombasa
Muranga
Nairobi
Nakuru
Nandi
NarokiNyamira
Nyandarua
Nyer
Samburu
SiayaTaita taveta
Tana river
Tharaka Nith
Trans Nzoia
Turkana
Uasin GishuVihiga
Wajir
West Pokot
−10
0
10
20
30
15 30 50 100 200 400 800
% C
hang
e in
num
bers
of o
utpa
tien
t se
rvic
es, 2
014
/15−
2018
/19
% Change in per capita expenditure, 2014−2017
Figure 55: Change in Outpatient versus Change in Per Capita Health Expenditure (2014/15-2018/19)
Source: MoH
Staying ahead of the curve: challenges and opportunities for future spending on health in Kenya
Kenya Public Expenditure Review for the Health Sector - FY2014/15-FY2019/20
87

Conclusions and Recommendations
5.0

Conclusions
This PER highlights the progress and commitment by the national and county governments to achieving UHC, that is, to expand access and quality of essential health services and increase financial protection from catastrophic and impoverishing health spending because of health care needs. Various reforms have been undertaken and significant improvements have been made on expanding access to care, reducing inequalities, and increasing financial protection. This PER identifies areas related to PFM systems, health financing, and overall management and delivery of health care services that deserve government attention, if the country is to make further progress toward UHC and ensure the Kenya Health Policy, 2014-2030 goal of attaining the highest possible health standards in a responsive manner becomes a reality.
Kenya has made tremendous progress in improving the health status of the population, but it needs to accelerate efforts to redesign the health care system—with greater emphasis on high quality primary care—if the country is to achieve sustainability in the medium term. Under-five and infant mortalities have reduced mainly because of improved immunization coverage, vitamin A supplement, and use of insecticide treated bed nets; however, challenges still remain around birth-related mortality and child malnutrition. There has been tremendous progress in the HIV/AIDS response, which resulted in a lower incidence rate. Kenya is, however, going through a demographic and epidemiological transition and is now facing a double-burden of diseases with communicable diseases being the predominant cause of premature mortality and an increasing disability. Such transition to “chronic diseases/treatment” means patients will need care closer to their homes. Digital solutions may be leveraged as part of such efforts (for example, telemedicine).
Kenya has made massive strides in reducing disparities by income level in certain health outcomes, yet significant income and geographic disparities need to be tackled. For example, there remains an income gradient in the uptake of curative and preventive services, with education being the main driver for the difference in preventive services. As the country moves forward, it needs to focus investments in health in the lagging counties and most vulnerable population groups, in an effort to further close the gap. Moreover, having timely data at the subnational level is paramount to channel resources where the needs are greatest and track progress toward the objectives of the UHC agenda. Hence, Kenya should consider conducting surveys more frequently and strengthen the overall availability and quality of health information.
Staying ahead of the curve: challenges and opportunities for future spending on health in Kenya
Kenya Public Expenditure Review for the Health Sector - FY2014/15-FY2019/20
89

While access to care has increased, there are serious concerns and an urgent need to improve the quality of care, especially at the primary level. Overall Kenyans seek health care more often when in need and have increased access to care; however, the data show that such an increase in facilities has not been accompanied by an equivalent increase in the number of critical inputs needed for providing effective care. In fact, the recent SDI survey found a significant decrease in the availability of critical inputs necessary to provide effective care, such as human resources, drugs, and equipment, suggesting that limited resources may be stretched across health facilities, which have increased considerably over the past years. County governments should ensure that new facilities are only opened when resources and adequate planning can ensure their full operationalization, as investments in facilities alone will not bring the expected benefits to citizens. Increasing the quality of primary health care is critical, if Kenya is to achieve better health outcomes in an equitable and financially sustainable way.
Kenya has also made progress in terms of increasing financial protection; however, it needs to continue advancements. The incidence of catastrophic spending is on a downward trend from almost 13 percent in 2013 to 8 percent in 2018. However, every year 1 million people continue to be driven into poverty because of health care spending. The share of health care financed by households through OOP has been increasing over time. This is a concerning trend, as paying at the point of care for services or drugs creates financial barriers and exposes households to catastrophic health spending. A large proportion of the sick population continues to lack health care due to the financial barriers, despite implementation of financial protection policies, such as the Linda Mama, health insurance for the poor and elderly, free primary health care, and government efforts to increase prepayments through the NHIF. The recent announcement by the GoK to further expand insurance subsidies to 1 million citizens and county governments’ efforts to subsidize insurance for the most vulnerable households are all welcome developments. However, enrollment in the NHIF insurance has been slow, hence significant additional public resources will need to be injected to markedly increase the share of the population insured and provide needed subsidies. Moreover, the unavailability of drugs at public health facilities continues to be a driver of OOP. Therefore, efforts to expand health insurance enrollment need to be accompanied with efforts to provide essential drugs at no costs to the poorest.
Kenya performs relatively well compared to its neighboring countries in terms of spending on health. Looking ahead, it will be important to preserve spending on health during periods of tight fiscal situations, such as the current one, and continue increasing spending on health as the economy and available resources grow over the medium term to achieve the level of aspiring upper middle-income countries outside the region. An international benchmarking analysis reveals that government spending for health relative to GDP is relatively lower than the average for lower middle-income countries and somewhat higher than its peers in the
90 Conclusions and Recomendations

eastern African region. Despite stagnation over the past years, Kenya’s increasing ability to mobilize resources for health, its improved capacity to raise government revenue, and its prioritization of the health sector in the latest fiscal year suggest that the country may be on the right track, if progress is maintained moving forward. However, spending on health will need to move hand in hand with its economy and resources availability. The expanding public debt and the COVID-19 epidemic may affect the country’s ability to generate revenues in the next years.
Kenya is facing a changing health financing landscape with the decline of donor financing. Development partners’ assistance makes up a significant share of resources for critical health programs that are traditionally donor funded, mainly HIV/AIDS, tuberculosis, malaria, reproductive health, and immunization. However, the share of donor financing is decreasing significantly, suggesting that the country should start planning for donor transition—that is, to integrate donor-funded vertical programs into the domestic financing system. A significant share of the external resources remains off-budget, with no progress over the past years. Off-budget donor financing is not aligned to the country’s priorities and creates oversight and coordination challenges for the government.
Devolution has fundamentally changed the way resources flow through the health system, giving a greater control and discretion for health planning, budgeting, and spending to county governments. Counties now finance the largest share of health spending and have autonomy on management and use of inputs and funds. Since FY2014/15, counties have financed around 40 percent of the total health sector spending. Data from FY2019/20 show a potential increasing role of the national government as it pursues UHC. In the latest fiscal year, financing from the national government made up almost half of the total financing.
What emerged with devolution is a complex and fragmented set of resource flows to the county health system. All resources meant for counties have to flow through the CRF, including all conditional grants that are earmarked for specific purposes and administered through MoH and the NHIF. Some counties allow health facilities to retain and spend health funds collected through user fees, reimbursements from the NHIF, and conditional grants. Other counties retain all sources of revenue as part of general county revenues for budgeting purposes. By breaking the chain between outputs and payment, the current system defeats the original intention of these payments by the national government and denies health facilities the much-needed resources to meet the operational costs, notwithstanding the fiscal autonomy that incentivizes them to continue providing essential health services. In addition, higher-level facilities have lost some degree of decision-making autonomy on purchasing of critical inputs, such as hiring of human resources through revenue. This centralization within decentralization of decision making and financing at the county level is likely to be one of the
Staying ahead of the curve: challenges and opportunities for future spending on health in Kenya
Kenya Public Expenditure Review for the Health Sector - FY2014/15-FY2019/20
91

drivers for the decline in the availability of critical inputs at the point of care and may also be a driver for the increasing rate of providers dissatisfaction and absenteeism.
PFM capacities have improved, including processes for planning, budgeting, allocation, and execution of approved budgets. However, increased health prioritization and budgetary allocations will not guarantee predictable resources for health, unless resources are released and absorbed on a timely basis. Although the MoH budget execution capacity has improved, a substantial amount of the approved health budget remains unspent because of inadequate and delayed funds releases occasioned by lack of liquidity and budgetary provision. The suboptimal level of expenditure (as well as the pending bills at the end of the fiscal year) is attributable to delays in funds releases by the National Treasury. For instance, county governments did not receive about 10 percent of the revised budget for FY 2019/20. As a result, the equitable share to the counties due in June 2020 was not disbursed in FY 2019/20 and was only made available in FY 2020/21. The delay in release of exchequers negatively affects the implementation of the activities planned by national and county governments and subsequently affects the timely delivery and quality of services.
The funds flow system was tested with the emergence of the COVID-19 pandemic. Kenya made budget amendments through the supplementary budget process to rationalize budget allocations for noncore activities and release resources to respond to the COVID-19 pandemic. However, several challenges related to the process and timing of budget revision were identified. While the budget revision for FY 2019/20 was necessary, the supplementary budget process did not consider some budget performance information, which includes exchequer issues and incurred expenditure. As a result, the CoB noted and reported that the reduction of some budget items below the level of expenditures already incurred. These budget anomalies led to underfunding of some activities under the supplementary budget. Also, the Parliament approved the third supplementary budget at the end of the fiscal year. As a result, the MoH (among others) did not have adequate time to implement activities that were included in the revised budgets.
The PER also highlights significant opportunities to increase value for money for the health sector. Benchmarking analysis shows that maternal mortalities and under-five mortalities remain high relative to service coverage, when compared to other countries, both in the region and outside. Similarly, the PER finds weak correlation between financing, outputs, and outcomes, using institutional deliveries and infant mortality as examples. One of the largest sources of inefficiency remains related to human resources for health, as Kenya presents the highest rate of absenteeism in the region and suboptimal clinical knowledge about common health conditions. Absenteeism alone is expected to translate into an average loss in resources for health of 5 percent. A further analysis of human resources salaries and wages revealed
92 Conclusions and Recomendations
a welcome trend at the national level, with lower-level job groups receiving the highest increases in remuneration over the past six years. On the contrary, at the county level, the analysis showed that increases have disproportionately benefitted the higher paid job groups, especially political positions. In light of the negative impact of the COVID-19 pandemic on the economy, moving forward it will be more important than ever to ensure that existing resources are used efficiently. Additional inefficiencies affecting the sector are related to funding processes for devolved functions, as well as governance and transparency issues in funds management.
The PER shows that across the areas analyzed, the GoK has prioritized the financing of specialized care, rather than primary health care, the backbone of UHC. Conditional grants have increasingly financed medical equipment for specialized services; an increasing share of drugs is spent at national referral hospitals; a high share of visits at the hospital level and the availability of inputs is especially dire at lower-level facilities. If the government is to make progress on UHC in a sustainable way and maximize the return on investments from public spending, it needs to prioritize investments in PHC moving forward. This is especially the case in light of the increasing burden from noncommunicable diseases and the ageing of the population, as these will increase the need for prevention and routine services, many of which can be provided at the PHC level.
Recommendations
The PER makes several recommendations based on the findings from the analyses presented in the report. Multiple of these recommendations were proposed in previous PER for prioritization by the GOK but have not yet been implemented; others are new (marked as such for ease of reference).
I. [NEW] To protect progress toward UHC made over the past years, the share of government spending for health (and other social sectors) should be protected during times of austerity and further support provided to people to shield them from the negative impacts of the pandemic that affect health determinants. In the medium and long term, the country shall continue increasing financing to the health sector to further reduce out-of-pocket expenditures and compensate for decreasing donor financing as the resources in the country increase.
II. [NEW] Manage the long-term gradual shift from supply-side financing to demand-side financing to ensure the health system is ready to provide quality services to its citizens. While nearly all low-income countries rely on line-item budgeting (supply-side financing), nearly all OECD countries rely on systems where the “money follows the patient”
Staying ahead of the curve: challenges and opportunities for future spending on health in Kenya
Kenya Public Expenditure Review for the Health Sector - FY2014/15-FY2019/20
93
(demand-side financing). The transition from demand-side financing to supply-side financing happens in middle-income countries and requires improving accountability across the system, such as stronger provider autonomy, health information systems, and good systems to measure and track quality of care, among others. Making this transition requires ensuring that supply-side issues have been addressed to ensure that people have access to care. Until then, the country will need to continue moving forward with both supply-side and demand-side financing, focusing on ensuring supply readiness to provide quality care. Moreover, as the country increases demand-driven financing, it will be critical to maintain an equity lens and support the most vulnerable population groups through the expansion of subsidies for insurance premiums to include informal sector workers in the NHIF. Such programs, coupled with the adoption of the recommendations of the panel of experts to strengthen the NHIF, will ensure that resources channeled through demand-side financing are efficiently and effectively run.
III. The move from coverage to effective coverage will require improvements in the quality of care and addressing inputs-related inefficiencies. Primary health-care facilities lack qualified human resources, essential medicines, and diagnostics. Provider clinical knowledge, as measured by the ability of providers to accurately diagnose and treat patients (based on clinical vignettes), was found to be suboptimal. The county governments should create an appropriate framework to incentivize and monitor health workers, strengthen human resource management systems, and equip health facilities with adequate medical supplies. Counties should also address the knowledge practice gaps, while ensuring adequate inputs are in place to allow the implementation of clinical guidelines. Finally, ensuring availability of medicines at public facilities will be critical to reducing OOP.
IV. Implement strategies to further improve budget execution, absorption of development budget, and disbursement of funds from the exchequer. Budget execution has increased significantly, yet there remain opportunities to further improve it . This is mainly because of delays and partial releases of funds from the Treasury. The insufficient execution of the health budget, both at the national and county level, leads to the accumulation of pending bills, stock outs, and insufficient supply of critical health services. Delays in budget execution are as a result of capacity constraints that should be addressed through capacity building for planning, budget preparation, budget management, and execution. Alignment and linking of the project implementation cycle to budgeting process and timely release of funds would contribute to improved budget absorption.
94 Conclusions and Recomendations

V. [NEW] Consider introducing reforms to accelerate the flow of resources to frontline facilities and strengthen the linkages between payments and performance and achievement of results. The recent dispute between national and county governments on whether conditional grants should be considered as part of the equitable revenues offers an opportunity to address the inherent challenges that have hindered the efficient and effective flow and use of government conditional grants. Under-executed budgets and delays in funds releases negatively impact service delivery and as such, contribute to further delaying Kenya’s march toward upper-middle income countries’ health outcomes.
VI. [NEW] Counties should work with the national level to explore ways of giving greater autonomy to health facilities, starting with Level 5 hospitals to improve effective purchasing of health services. Several counties are implementing legislation to achieve autonomy for health facilities. The national government should lead the process of granting autonomy to health facilities through a policy process and as part of the wider health financing reforms to ensure a guided and standardized process applies across all the counties. The reform on granting autonomy to health facilities should go hand in hand with reforms to enhance management capacity and accountability of health facilities.
VII. Improving the quality and efficiency of health spending is critical to achieve UHC. There has been little progress in improving health spending efficiency, mainly because of the lack of systemic improvements in health sector governance and low level of investment in health information systems. Focusing on these priority reforms will significantly improve the quality of health spending in Kenya. High-level political commitment is required if the current status is to be subjected to the critical governance reforms, as well as increased investments in health information systems. Key actions needed to improve efficiency in HRH include the following:
a. Implement behavioral and financial incentives to tackle HRH inefficiencies. It is essential to understand the causes of providers absenteeism to find actionable solutions to address this significant source of inefficiency in the Kenyan health care system. Recent evidence points to governance issues as the main cause, including the lack and inadequacy of regulation of dual practices, insufficient supervision visits, and the lack of professional consequences and accountability mechanisms. Performance-based financing based on attendance may be another potential intervention to reduce absenteeism. Moreover, enhancing accountability mechanisms to address rising inequality in salary increases by job groups may be considered. Capping annual salary increases can be an option to reduce the disparity between high-paid and low-paid job groups. Counties may consider enhancing monitoring and evaluation and accountability of the salary, roles, and responsibilities of staff to hinder any idle positions, working closely with the Public Service Commission.
Staying ahead of the curve: challenges and opportunities for future spending on health in Kenya
Kenya Public Expenditure Review for the Health Sector - FY2014/15-FY2019/20
95

b. [NEW] Improve the governance and accountability processes in the health sector by strengthening and institutionalizing the annual sector review both at the national and the county level. The annual sector review will hold the health sector accountable through an annual assessment of the budget performance for the health sector based on annual plans that have clear results, meaningful indicators, and realistic targets. The annual health sector review should be part of the broader medium-term approach to ensure prioritization of the supply-side long-term investments in health. An effective annual health sector review will create demand for better quality data and information systems and help to increase the institutional collaboration that is crucial for measuring spending efficiency.
c. [NEW] Improving the quality of health care requires investments in health management and information systems that can generate timely and quality information for planning and budgeting, monitoring of performance monitoring, and overall benchmarking. Strong performance monitoring and evaluation and benchmarking would strengthen accountability among facilities, county offices, political leaders, the MoH, and facility users, along with creating nonfinancial incentives for both counties, sub-counties, and facilities to improve performance.
96 References and Appendices

References and Appendices
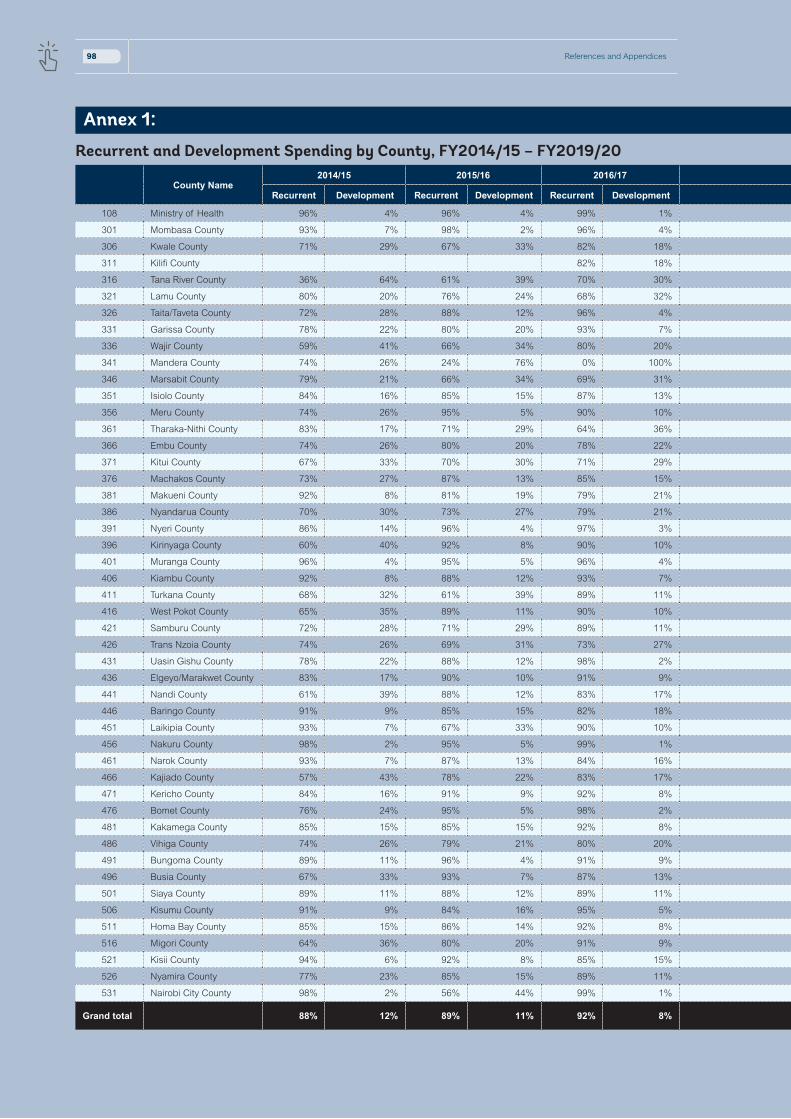
Annex 1:
Recurrent and Development Spending by County, FY2014/15 – FY2019/20
County Name2014/15 2015/16 2016/17 2017/18 2018/19 2019/20
Recurrent Development Recurrent Development Recurrent Development Recurrent Development Recurrent Development Recurrent Development
108 Ministry of Health 96% 4% 96% 4% 99% 1% 98% 2% 99% 1% 99% 1%
301 Mombasa County 93% 7% 98% 2% 96% 4% 97% 3% 99% 1% 97% 3%
306 Kwale County 71% 29% 67% 33% 82% 18% 70% 30% 66% 34% 75% 25%
311 Kilifi County 82% 18% 85% 15% 100% 0% 86% 14%
316 Tana River County 36% 64% 61% 39% 70% 30% 73% 27% 78% 22% 100% 0%
321 Lamu County 80% 20% 76% 24% 68% 32% 90% 10% 96% 4% 86% 14%
326 Taita/Taveta County 72% 28% 88% 12% 96% 4% 77% 23% 72% 28% 69% 31%
331 Garissa County 78% 22% 80% 20% 93% 7% 98% 2% 94% 6% 96% 4%
336 Wajir County 59% 41% 66% 34% 80% 20% 89% 11% 78% 22% 70% 30%
341 Mandera County 74% 26% 24% 76% 0% 100% 0% 100% 6% 94% 7% 93%
346 Marsabit County 79% 21% 66% 34% 69% 31% 87% 13% 74% 26% 87% 13%
351 Isiolo County 84% 16% 85% 15% 87% 13% 84% 16% 90% 10% 94% 6%
356 Meru County 74% 26% 95% 5% 90% 10% 95% 5% 91% 9% 94% 6%
361 Tharaka-Nithi County 83% 17% 71% 29% 64% 36% 0% 100% 86% 14% 88% 12%
366 Embu County 74% 26% 80% 20% 78% 22% 88% 12% 88% 12% 90% 10%
371 Kitui County 67% 33% 70% 30% 71% 29% 86% 14% 83% 17% 91% 9%
376 Machakos County 73% 27% 87% 13% 85% 15% 72% 28% 151% -51% 97% 3%
381 Makueni County 92% 8% 81% 19% 79% 21% 95% 5% 95% 5% 99% 1%
386 Nyandarua County 70% 30% 73% 27% 79% 21% 75% 25% 69% 31% 63% 37%
391 Nyeri County 86% 14% 96% 4% 97% 3% 96% 4% 97% 3% 97% 3%
396 Kirinyaga County 60% 40% 92% 8% 90% 10% 97% 3% 85% 15% 85% 15%
401 Muranga County 96% 4% 95% 5% 96% 4% 97% 3% 72% 28% 100% 0%
406 Kiambu County 92% 8% 88% 12% 93% 7% 93% 7% 96% 4% 95% 5%
411 Turkana County 68% 32% 61% 39% 89% 11% 99% 1% 74% 26% 64% 36%
416 West Pokot County 65% 35% 89% 11% 90% 10% 92% 8% 92% 8% 97% 3%
421 Samburu County 72% 28% 71% 29% 89% 11% 93% 7% 91% 9% 83% 17%
426 Trans Nzoia County 74% 26% 69% 31% 73% 27% 79% 21% 100% 0% 100% 0%
431 Uasin Gishu County 78% 22% 88% 12% 98% 2% 94% 6% 92% 8% 86% 14%
436 Elgeyo/Marakwet County 83% 17% 90% 10% 91% 9% 90% 10% 88% 12% 88% 12%
441 Nandi County 61% 39% 88% 12% 83% 17% 98% 2% 78% 22% 94% 6%
446 Baringo County 91% 9% 85% 15% 82% 18% 83% 17% 87% 13% 95% 5%
451 Laikipia County 93% 7% 67% 33% 90% 10% 82% 18% 66% 34% 92% 8%
456 Nakuru County 98% 2% 95% 5% 99% 1% 92% 8% 94% 6% 86% 14%
461 Narok County 93% 7% 87% 13% 84% 16% 92% 8% 91% 9% 77% 23%
466 Kajiado County 57% 43% 78% 22% 83% 17% 90% 10% 86% 14% 92% 8%
471 Kericho County 84% 16% 91% 9% 92% 8% 92% 8% 84% 16% 82% 18%
476 Bomet County 76% 24% 95% 5% 98% 2% 4% 96% 77% 23% 101% -1%
481 Kakamega County 85% 15% 85% 15% 92% 8% 50% 50% 62% 38% 83% 17%
486 Vihiga County 74% 26% 79% 21% 80% 20% 86% 14% 83% 17% 92% 8%
491 Bungoma County 89% 11% 96% 4% 91% 9% 97% 3% 87% 13% 89% 11%
496 Busia County 67% 33% 93% 7% 87% 13% 86% 14% 96% 4% 98% 2%
501 Siaya County 89% 11% 88% 12% 89% 11% 94% 6% 88% 12% 89% 11%
506 Kisumu County 91% 9% 84% 16% 95% 5% 97% 3% 93% 7% 96% 4%
511 Homa Bay County 85% 15% 86% 14% 92% 8% 82% 18% 90% 10% 84% 16%
516 Migori County 64% 36% 80% 20% 91% 9% 87% 13% 87% 13% 88% 12%
521 Kisii County 94% 6% 92% 8% 85% 15% 78% 22% 89% 11% 14% 86%
526 Nyamira County 77% 23% 85% 15% 89% 11% 82% 18% 100% 0% 91% 9%
531 Nairobi City County 98% 2% 56% 44% 99% 1% 100% 0% 94% 6% 95% 5%
Grand total 88% 12% 89% 11% 92% 8% 93% 7% 92% 8% 94% 6%
98 References and Appendices

Annex 1:
Recurrent and Development Spending by County, FY2014/15 – FY2019/20
County Name2014/15 2015/16 2016/17 2017/18 2018/19 2019/20
Recurrent Development Recurrent Development Recurrent Development Recurrent Development Recurrent Development Recurrent Development
108 Ministry of Health 96% 4% 96% 4% 99% 1% 98% 2% 99% 1% 99% 1%
301 Mombasa County 93% 7% 98% 2% 96% 4% 97% 3% 99% 1% 97% 3%
306 Kwale County 71% 29% 67% 33% 82% 18% 70% 30% 66% 34% 75% 25%
311 Kilifi County 82% 18% 85% 15% 100% 0% 86% 14%
316 Tana River County 36% 64% 61% 39% 70% 30% 73% 27% 78% 22% 100% 0%
321 Lamu County 80% 20% 76% 24% 68% 32% 90% 10% 96% 4% 86% 14%
326 Taita/Taveta County 72% 28% 88% 12% 96% 4% 77% 23% 72% 28% 69% 31%
331 Garissa County 78% 22% 80% 20% 93% 7% 98% 2% 94% 6% 96% 4%
336 Wajir County 59% 41% 66% 34% 80% 20% 89% 11% 78% 22% 70% 30%
341 Mandera County 74% 26% 24% 76% 0% 100% 0% 100% 6% 94% 7% 93%
346 Marsabit County 79% 21% 66% 34% 69% 31% 87% 13% 74% 26% 87% 13%
351 Isiolo County 84% 16% 85% 15% 87% 13% 84% 16% 90% 10% 94% 6%
356 Meru County 74% 26% 95% 5% 90% 10% 95% 5% 91% 9% 94% 6%
361 Tharaka-Nithi County 83% 17% 71% 29% 64% 36% 0% 100% 86% 14% 88% 12%
366 Embu County 74% 26% 80% 20% 78% 22% 88% 12% 88% 12% 90% 10%
371 Kitui County 67% 33% 70% 30% 71% 29% 86% 14% 83% 17% 91% 9%
376 Machakos County 73% 27% 87% 13% 85% 15% 72% 28% 151% -51% 97% 3%
381 Makueni County 92% 8% 81% 19% 79% 21% 95% 5% 95% 5% 99% 1%
386 Nyandarua County 70% 30% 73% 27% 79% 21% 75% 25% 69% 31% 63% 37%
391 Nyeri County 86% 14% 96% 4% 97% 3% 96% 4% 97% 3% 97% 3%
396 Kirinyaga County 60% 40% 92% 8% 90% 10% 97% 3% 85% 15% 85% 15%
401 Muranga County 96% 4% 95% 5% 96% 4% 97% 3% 72% 28% 100% 0%
406 Kiambu County 92% 8% 88% 12% 93% 7% 93% 7% 96% 4% 95% 5%
411 Turkana County 68% 32% 61% 39% 89% 11% 99% 1% 74% 26% 64% 36%
416 West Pokot County 65% 35% 89% 11% 90% 10% 92% 8% 92% 8% 97% 3%
421 Samburu County 72% 28% 71% 29% 89% 11% 93% 7% 91% 9% 83% 17%
426 Trans Nzoia County 74% 26% 69% 31% 73% 27% 79% 21% 100% 0% 100% 0%
431 Uasin Gishu County 78% 22% 88% 12% 98% 2% 94% 6% 92% 8% 86% 14%
436 Elgeyo/Marakwet County 83% 17% 90% 10% 91% 9% 90% 10% 88% 12% 88% 12%
441 Nandi County 61% 39% 88% 12% 83% 17% 98% 2% 78% 22% 94% 6%
446 Baringo County 91% 9% 85% 15% 82% 18% 83% 17% 87% 13% 95% 5%
451 Laikipia County 93% 7% 67% 33% 90% 10% 82% 18% 66% 34% 92% 8%
456 Nakuru County 98% 2% 95% 5% 99% 1% 92% 8% 94% 6% 86% 14%
461 Narok County 93% 7% 87% 13% 84% 16% 92% 8% 91% 9% 77% 23%
466 Kajiado County 57% 43% 78% 22% 83% 17% 90% 10% 86% 14% 92% 8%
471 Kericho County 84% 16% 91% 9% 92% 8% 92% 8% 84% 16% 82% 18%
476 Bomet County 76% 24% 95% 5% 98% 2% 4% 96% 77% 23% 101% -1%
481 Kakamega County 85% 15% 85% 15% 92% 8% 50% 50% 62% 38% 83% 17%
486 Vihiga County 74% 26% 79% 21% 80% 20% 86% 14% 83% 17% 92% 8%
491 Bungoma County 89% 11% 96% 4% 91% 9% 97% 3% 87% 13% 89% 11%
496 Busia County 67% 33% 93% 7% 87% 13% 86% 14% 96% 4% 98% 2%
501 Siaya County 89% 11% 88% 12% 89% 11% 94% 6% 88% 12% 89% 11%
506 Kisumu County 91% 9% 84% 16% 95% 5% 97% 3% 93% 7% 96% 4%
511 Homa Bay County 85% 15% 86% 14% 92% 8% 82% 18% 90% 10% 84% 16%
516 Migori County 64% 36% 80% 20% 91% 9% 87% 13% 87% 13% 88% 12%
521 Kisii County 94% 6% 92% 8% 85% 15% 78% 22% 89% 11% 14% 86%
526 Nyamira County 77% 23% 85% 15% 89% 11% 82% 18% 100% 0% 91% 9%
531 Nairobi City County 98% 2% 56% 44% 99% 1% 100% 0% 94% 6% 95% 5%
Grand total 88% 12% 89% 11% 92% 8% 93% 7% 92% 8% 94% 6%
Staying ahead of the curve: challenges and opportunities for future spending on health in Kenya
Kenya Public Expenditure Review for the Health Sector - FY2014/15-FY2019/20
99

County name 2014/15 2015/16 2016/17 2017/18 2018/19 2019/20
Ministry of Health
45,083,782,238 40,090,727,497 57,194,746,833 52,086,537,513 70,724,784,341 82,479,494,989
Mombasa County
1,698,149,235 2,287,576,565 2,309,596,987 2,771,459,448 2,533,384,727 2,904,974,168
Kwale County 1,362,111,287 1,402,637,610 1,757,325,541 2,469,832,673 3,105,620,378 2,710,634,538
Kilifi County - - 2,303,330,252 2,976,569,247 2,639,568,183 2,769,690,780
Tana River County
96,275,938 748,183,492 958,228,103 1,413,453,461 963,978,706 1,086,051,819
Lamu County 434,658,995 554,453,193 866,291,180 796,433,789 879,881,424 1,149,653,264
Taita/Taveta County
617,529,080 1,061,304,360 507,976,888 169,574,721 242,852,330 359,043,390
Garissa County 1,268,154,444 1,008,816,436 1,028,822,826 1,904,178,138 2,534,726,731 1,971,196,089
Wajir County 1,066,300,179 1,426,747,229 1,352,709,637 1,841,054,858 2,331,520,467 2,516,702,720
Mandera County
1,258,320,292 552,742,488 824,174,741 393,287,233 594,048,124 800,620,166
Marsabit County
772,024,560 931,210,118 1,308,915,722 1,526,702,008 2,005,992,097 1,762,866,755
Isiolo County 616,974,405 675,259,220 810,899,030 1,060,814,021 1,337,519,262 1,334,533,089
Meru County 960,457,784 1,868,390,209 2,879,803,375 3,258,507,540 3,315,038,751 3,311,388,448
Tharaka-Nithi County
779,353,229 153,365,413 148,164,755 128,602,334 1,758,676,133 1,793,233,079
Embu County 687,769,237 1,898,863,872 2,259,301,956 2,140,484,592 2,382,146,912 2,487,636,427
Kitui County 1,851,120,702 1,703,163,733 2,164,078,744 2,519,523,769 3,390,015,345 3,725,026,380
Machakos County
1,781,156,799 2,610,319,260 1,466,874,494 1,046,953,833 (596,617,610) 2,246,773,325
Makueni County
1,418,711,414 1,870,497,154 2,850,838,015 2,358,925,074 3,115,861,518 2,546,518,787
Nyandarua County
1,114,867,531 1,177,506,295 1,160,427,756 1,150,729,036 542,309,312 646,075,607
Nyeri County 1,958,280,705 1,992,854,498 2,283,822,395 2,516,348,286 2,758,038,533 2,724,674,862
Kirinyaga County
227,815,286 1,175,422,783 1,406,229,156 1,758,132,236 2,101,550,688 2,344,748,459
Muranga County
1,150,174,386 661,356,779 633,139,653 912,846,641 234,361,824 307,905,211
Kiambu County 3,287,136,497 3,240,725,258 4,174,123,170 4,214,332,743 5,922,364,768 5,239,679,180
Turkana County 1,372,200,553 46,297,861 634,346,380 421,511,629 812,156,451 991,346,407
West Pokot County
672,683,632 887,229,036 1,207,872,960 1,299,021,885 1,492,880,530 1,586,028,451
Government health spending at national and county levels, FY2014/15 - FY2019/20
100 References and Appendices

County name 2014/15 2015/16 2016/17 2017/18 2018/19 2019/20
Samburu County
555,322,296 732,690,082 673,442,693 818,507,286 935,226,857 1,214,429,205
Trans Nzoia County
1,361,760,168 1,436,946,019 2,201,002,192 1,946,516,554 502,697,284 56,820,598
Uasin Gishu County
917,435,161 1,247,272,240 1,608,350,132 1,743,834,659 2,044,637,845 2,225,549,878
Elgeyo/Marakwet County
1,127,961,827 1,151,170,104 1,437,794,856 1,691,912,824 1,645,176,253 1,495,073,124
Nandi County 1,110,766,285 1,336,668,408 1,287,531,454 1,521,891,025 2,370,984,711 2,364,040,986
Baringo County 1,272,418,301 1,617,445,482 2,182,871,516 2,183,276,875 2,316,832,183 2,193,060,519
Laikipia County 247,600,080 130,232,126 392,459,510 598,174,247 890,622,926 536,412,519
Nakuru County 2,518,234,917 3,370,431,615 3,091,385,539 4,260,891,783 4,719,021,189 4,973,486,199
Narok County 757,196,030 1,136,699,447 1,646,252,834 1,488,218,178 1,989,141,946 2,728,603,696
Kajiado County 563,986,952 1,345,314,408 1,728,184,523 2,076,482,237 2,301,803,428 2,514,324,988
Kericho County 1,379,459,977 1,358,309,989 1,465,047,785 2,086,998,640 2,700,101,695 2,666,467,675
Bomet County 389,947,607 808,345,308 824,922,567 35,983,505 447,118,357 507,173,765
Kakamega County
1,641,509,376 2,440,606,547 449,348,346 768,756,614 935,817,508 1,968,915,370
Vihiga County 873,937,078 752,064,369 996,105,273 1,063,151,780 1,575,339,768 1,163,064,531
Bungoma County
1,619,269,049 1,722,533,896 2,182,570,556 2,571,767,654 3,362,495,867 3,569,670,417
Busia County 1,365,681,210 1,319,343,270 1,700,476,152 1,395,204,962 1,659,878,293 2,153,190,517
Siaya County 1,245,811,207 1,286,277,692 1,641,885,692 1,600,953,118 1,904,139,506 2,263,419,789
Kisumu County 585,757,048 1,096,216,317 2,033,579,146 2,866,260,103 2,839,133,505 3,847,916,135
Homa Bay County
1,255,604,158 1,380,616,073 1,678,764,958 2,312,308,164 2,491,800,437 2,621,471,135
Migori County 491,078,169 909,814,419 1,604,361,565 1,960,934,480 1,910,482,757 3,150,965,609
Kisii County 1,677,881,327 2,465,505,239 718,869,355 707,181,689 698,055,212 835,009,151
Nyamira County 1,339,231,061 1,443,593,668 1,488,363,522 1,752,935,472 1,667,666,902 1,861,363,271
Nairobi City County
3,944,596,716 1,219,625,247 352,701,451 5,485,851,690 1,642,780,916 3,834,984,774
Equalization Fund
- - - - - -
Equalization Fund-Health
- - - 33,886,532 - -
Other (N/A) - - - - 6,936,488,256 31,027,972,469
Staying ahead of the curve: challenges and opportunities for future spending on health in Kenya
Kenya Public Expenditure Review for the Health Sector - FY2014/15-FY2019/20
101

i Ministry of Health. 2015. Kenya Stepwise Survey for Non-Communicable Diseases Risk Factors 2015 Report.
ii World Bank. 2014. Laying the Foundation for A Robust Health Care System in Kenya. Kenya Public Expenditure Review. Volume II.
iii Government of the Republic of Kenya. 2017. Comprehensive Public Expenditure Review. From Evidence to Policy.
iv Kenya Master Health Facility List (KMHFL). 2020. http://kmhfl.health.go.ke/
v Ibid.
vi Miseda MH, SO Were, CA Murianki, MP Mutuku, and SN Mutwiwa. 2017. “The implication of the shortage of health workforce specialist on universal health coverage in Kenya.” Human Resources for Health. 15(1):80
vii Ministry of Health. Integrated Personnel and Payroll Database (IPPD). Multiple years.
ix Kenya Household Health Expenditure and Utilization Survey (KHHEUS). 2018
x United Nations Population Division. World Population Prospects: 2019
xi United Nations, Population Division. 2015. https://demographicdividend.org/country_highlights/kenya/
xii World Health Organization (WHO). 2016. https://www.who.int/nmh/countries/ken_en.pdf?ua=1
xiii Kenya Demographic and Health Survey (KDHS). 2014. https://dhsprogram.com/pubs/pdf/fr308/fr308.pdf
xiv Institute for Health Metrics and Evaluation (IHME). 2021. http://www.healthdata.org/
xv World Health Organization (WHO). 2015. The WHO and UN Framework Convention on Climate Change. Climate and Health Country Profile.
xvi GOK. 2020. Consultative meeting on the roll out of the UHC program
xvii Waweru A, M Nyikuri, B Tsofa, S Kadenge, C Goodman and S Molyneux. 2013. Review of Health Sector Services Fund Implementation and Experience.
xviii Ministry of Health – National Treasury. 2020. http://ntnt.treasury.go.ke/wp-content/uploads/2020/11/Health-Sector-1.pdf
xix Maina, T. and D. Kirigia. 2015. Annual Evaluation of the Abolition of User Fees at Primary Healthcare Facilities in Kenya. Washington, DC: Futures Group, Health Policy Project.
xx Mbau, R., E Kabia, A Honda. et al. 2020. “Examining purchasing reforms towards universal health coverage by the National Hospital Insurance Fund in Kenya”. Int J Equity Health https://doi.org/10.1186/s12939-019-1116-x
xxi Barasa E, Chuma JC, Wambugu J (Eds). 2019. The NHIF We Want: Report of the Health Financing Reforms Expert Panel for the Transformation and Repositioning of the National Hospital Insurance Fund (NHIF) as a Strategic Purchaser of Health Services. Nairobi: Ministry of Health Kenya.
xxii Kenya National Bureau of Statistics. 2019. Economic Survey. https://s3-eu-west-1.amazonaws.com/s3.sourceafrica.net/documents/119074/Kenya-National-Bureau-of-Statistics-Economic.pdf
References
102 References and Appendices

xxiii World Development Indicators (WDI). 2021. https://datacatalog.worldbank.org/dataset/world-development-indicators
xxiv Dieleman and Hanlon. 2014. “Measuring the Displacement and Replacement of Government Health Expenditure”. Health Economics, 23: 129-140.
xxv Worley, William. 2020. ‘Tough times are ahead’: Observers anticipate drop in UK aid budget. https://www.devex.com/news/tough-times-are-ahead-observers-anticipate-drop-in-uk-aid-budget-97090#:~:text=A%20DFID%20spokesperson%20said%3A%20%E2%80%9CThe,help%20the%20world’s%20poorest%20people
xxvi Ministry of Health and Country-level Health Expenditure Data. 2020. IFMIS. https://www.treasury.go.ke/ifmis/
xxvii Mcintyre, Meheus, and Rottingen. 2017. “What Level of Domestic Government Health Expenditure Should We Aspire to for Universal Health Coverage?” Health Economics, Policy and Law (12): 125–137.
xxviii Press conference, Council of Governors. 2020. https://www.cog.go.ke/images/Statements/Press%20Statement%20on%20Disbursements%20of%20Funds%20to%20Counties.pdf
xxix Ministry of Health, Health Sector Working Group Reports (FY2017/18-FY2019/20).
xxx Barasa EW, Manyara AM, Molyneux S, Tsofa B. 2017. “Recentralization within Decentralization: County Hospital Autonomy under Devolution in Kenya”. PLOS ONE 12(8): e0182440. https://doi.org/10.1371/journal.pone.0182440.
xxxi Mbuthia, B., Vîlcu, I., Ravishankar, N., Ondera, J. 2019. Purchasing at the County Level in Kenya. Washington, DC: ThinkWell.
xxxii ibid.
xxxiii Barasa EW, Manyara AM, Molyneux S, Tsofa B. 2017. “Recentralization within Decentralization: County Hospital Autonomy under Devolution In Kenya”. PLoS ONE 12(8): e0182440. https://doi.org/10.1371/journal.pone.0182440
xxxiv Mbuthia, B., Vîlcu, I., Ravishankar, N., Ondera, J. 2019. Purchasing at the County Level in Kenya. Washington, DC: ThinkWell
xxxv Institute of Economic Affairs. 2020. Leasing of Medical Equipment Project in Kenya: Value for Money Assessment. https://media.africaportal.org/documents/Leasing_of_medical_equipment.pdf
xxxvi Ministry of Health. 2020. County Governments Annual Budget Implementation Review Reports.
xxxvii Our World in Data. 2021. https://ourworldindata.org/
xxxviii Ministry of Health. CoB. Annual National Government Budget Implementation Reports.
xxxix The National Treasury and Planning. Budget books. Multiple fiscal years. https://www.treasury.go.ke/budget-books-1/#1620032718947-ad0c1f99-3730 .
xl Salari P, L Di Giorgio, S Ilinca, et al. 2019. “The catastrophic and impoverishing effects of out-of-pocket healthcare payments in Kenya, 2018”. BMJ Global Health. doi:10.1136/bmjgh-2019-001809.
xli Wambiya, E.O.A., P.O. Otieno,, M.K. Mutua, et al. “Patterns and Predictors of Private and Public Health Care Utilization Among Residents of an Informal Settlement In Nairobi, Kenya: A Cross-Sectional Study”. BMC Public Health 21, 850 (2021). https://doi.org/10.1186/s12889-021-10836-
xlii Kenya Household Health Expenditure and Utilization Survey (KHHEUS). 2018. https://www.fsdkenya.org/research-and-publications/kenya-household-health-expenditure-and-utilization-survey-khheus/
Staying ahead of the curve: challenges and opportunities for future spending on health in Kenya
Kenya Public Expenditure Review for the Health Sector - FY2014/15-FY2019/20
103
xliii Karra, Fink, Canning. 2017. International Journal of Epidemiology, 46 (3): 817–826.
xliv Kenya Poverty and Gender Assessment. 2015/16.
xlv Health Equity and Financial Protection Indicators (HEFPI). 2021. https://datacatalog.worldbank.org/dataset/hefpi
xlvii Kenya Gender and Poverty Assessment 2015-201. https://openknowledge.worldbank.org/handle/10986/31285
xlviii Ilinca S, L. Di Giorgio, P. Salari, and J. Chuma. 2019. International Journal for Equity in Health, 18:196. https://doi.org/10.1186/s12939-019-1106-z
xlix Ilinca, S., L Di Giorgio, P. Salari. Et al. “Socio-economic inequality and inequity in use of health care services in Kenya: evidence from the fourth Kenya household health expenditure and utilization survey. Int J Equity Health 18, 196. 2019. https://doi.org/10.1186/s12939-019-1106-z
l Moses MW, J Korir, W Zeng, et al. 2021. “Performance assessment of the county healthcare systems in Kenya: a mixed-methods analysis”. BMJ Global Health. 6:e004707.
li Ibid.
lii World Bank. 2020. “Kenya primary care financing assessment, in review”.
liii Kenya Master Health Facility List. http://kmhfl.health.go.ke/#/facility_filter/results.
liv World Bank. 2020.Devolution study.
lv Ibid.
lvi Government of Kenya. 2019. Service Delivery Indicator (SDI) Report.
lvii Ibid.
lviii Ibid.
lix Tsofa B, C Goodman, L Gilson, and S Molyneux . 2017. “Devolution and its effects on health workforce and commodities management - early implementation experiences in Kilifi County.” Kenya. Int J Equity Health. 16(1):169-.
lx World Bank. 2019. Kenya Health Service Delivery Indicator Survey 2018 Report.
lxi World Bank. 2021.Efficiency of county health systems in Kenya, in review.
lxii Malalo, H. 2020. “Kenya anti-graft agency slams procurement of COVID-19 equipment”. https://www.reuters.com/article/us-kenya-corruption-idUSKCN26F3CC
lxiii Datta BK, M J Husain, and S Asma. 2019. “Assessing the relationship between out-of-pocket spending on blood pressure and diabetes medication and household catastrophic health expenditure: evidence from Pakistan”. Int J Equity Health. 18(1):9. doi: 10.1186/s12939-018-0906-x. PMID: 30646905; PMCID: PMC6334430.
lxiv Tumlinson, Katherine & Gichane, Margaret & Curtis, Siân & LeMasters, Katherine. 2019. “Understanding healthcare provider absenteeism in Kenya: a qualitative analysis”. BMC Health Services Research. 19. 10.1186/s12913-019-4435-0.
104 References and Appendices

ECO-AUDITEnvironmental Benefi ts Statement
The World Bank Group is committed to reducing its environmental footprint. In support of this commitment, we leverage electronic publishing options and print-on-demand technology, which is located in regional hubs worldwide. Together, these initiatives enable print runs to be lowered and shipping distances decreased, resulting in reduced paper consumption, chemical use, greenhouse gas emissions, and waste.
We follow the recommended standards for paper use set by the Green Press Initiative. The majority of our books are printed on Forest Stewardship Council (FSC)–certifi ed paper, with nearly all containing 50–100 percent recycled content. The recycled fi ber in our book paper is either unbleached or bleached using totally chlorine-free (TCF), processed chlorine–free (PCF), or enhanced elemental chlorine–free (EECF) processes.
More information about the Bank’s environmental philosophy can be found at http://www.worldbank.org/corporateresponsibility.

Laura Di GiorgioKatelyn Jison YooThomas Maina
Staying ahead of the curve: challenges and opportunities for future spending on health in Kenya
Kenya Public Expenditure Review for the Health Sector - FY2014/15-FY2019/20