Addressing systematic poverty and inequality in cities - UN ...
Upload
independentCategory
view
1download
0
MPRAMunich Personal RePEc Archive
Addressing Regional Inequality Issues inBangladesh Public Expenditure
Chowdhury Shameem Mahmoud and Syed Naimul Wadood
and Kazi Sabbir Ahmed
Department of Economics, North South University, Dhaka,Bangladesh
13. March 2008
Online at http://mpra.ub.uni-muenchen.de/14568/MPRA Paper No. 14568, posted 12. April 2009 04:43 UTC
Addressing Regional Inequality Issues in Bangladesh Public Expenditure
FINAL REPORT
Submitted to Centre for Policy Dialogue
House 40C, Road 11 Dhanmondi R/A, Dhaka-1209
Submitted by Dr. Chowdhury Shameem Mahmoud1
Dr. Syed Naimul Wadood Mr. Kazi Sabbir Ahmed
March 13, 2008
1 Dr. Chowdhury Shameem Mahmoud and Dr. Syed Naimul Wadood are Assistant Professors and Mr. Kazi
Sabbir Ahmed is Lecturer of Department of Economics at North South University, 12 Banani C/A, Kemal Ataturk Avenue, Dhaka-1213, Bangladesh. Email Correspondence: [email protected] (Dr. Chowdhury Shameem Mahmoud). Phone: +88-02-9885611~20 (Ext. 326).

i
ACKNOWLEDGEMENT
The research team thanks the Centre for Policy Dialogue (CPD) and the United Nations
Development Programme (UNDP) for co-sponsoring this research project titled “Addressing
Regional Inequality Issues in Bangladesh Public Expenditure Allocation” under the “Pro-
Poor Macroeconomic Policy” initiative. The team acknowledges with appreciation technical
guidance and insightful comments from Dr. Gour Gobinda Goswami, Associate Professor
and Chairman and Ms. Mausumi Mahapatro Khan, Lecturer, Department of Economics,
North South University. We also appreciate useful suggestions and data support from
Professor Mustafizur Rahman, Dr. Uttam Kumar Deb, Dr. Khondaker Golam Moazzem and
other members of the Centre for Policy Dialogue research team. We acknowledge with
appreciation comments from the participants at the Seminar on the “Regional Inequality”
issue at the CIRDAP Auditorium, Dhaka on 28th February 2008, where an earlier version of
this paper was presented. Last but not the least we are thankful to Dr. Fahmida Akter Khatun
for her cooperation throughout this study. Usual disclaimer applies.
ii
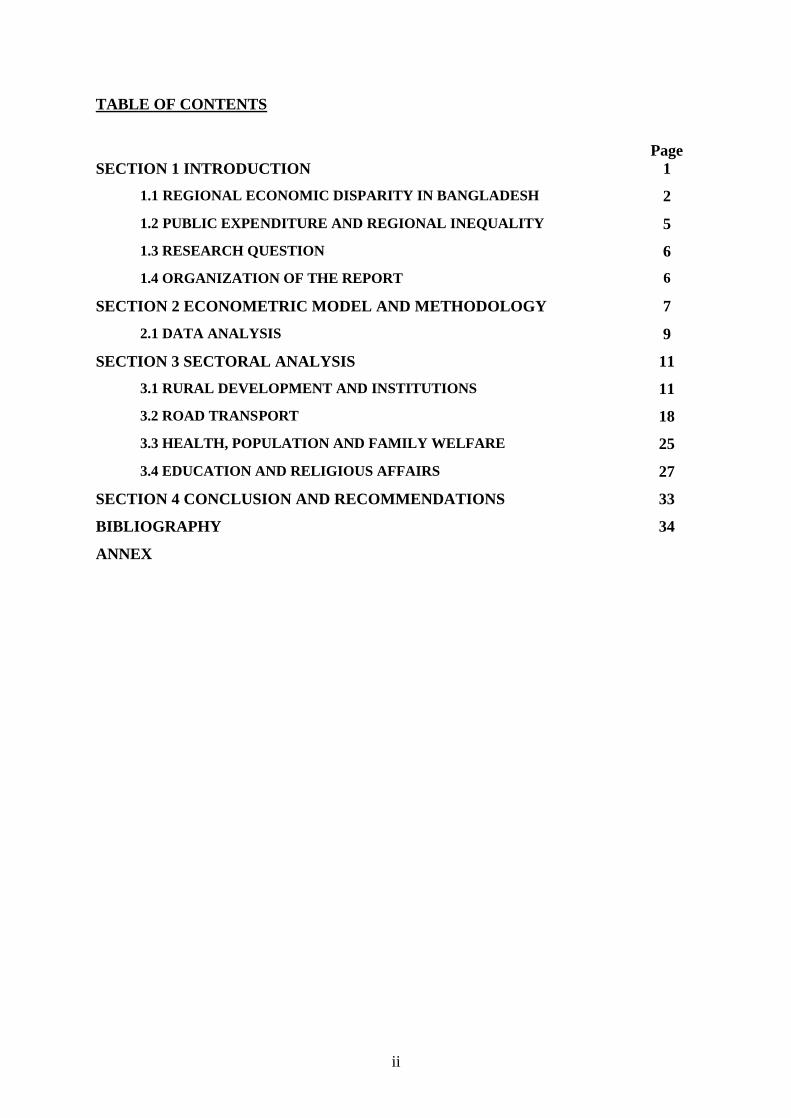
TABLE OF CONTENTS
Page SECTION 1 INTRODUCTION 1
1.1 REGIONAL ECONOMIC DISPARITY IN BANGLADESH 2
1.2 PUBLIC EXPENDITURE AND REGIONAL INEQUALITY 5
1.3 RESEARCH QUESTION 6
1.4 ORGANIZATION OF THE REPORT 6
SECTION 2 ECONOMETRIC MODEL AND METHODOLOGY 7
2.1 DATA ANALYSIS 9
SECTION 3 SECTORAL ANALYSIS 11
3.1 RURAL DEVELOPMENT AND INSTITUTIONS 11
3.2 ROAD TRANSPORT 18
3.3 HEALTH, POPULATION AND FAMILY WELFARE 25
3.4 EDUCATION AND RELIGIOUS AFFAIRS 27
SECTION 4 CONCLUSION AND RECOMMENDATIONS 33
BIBLIOGRAPHY 34
ANNEX
iii
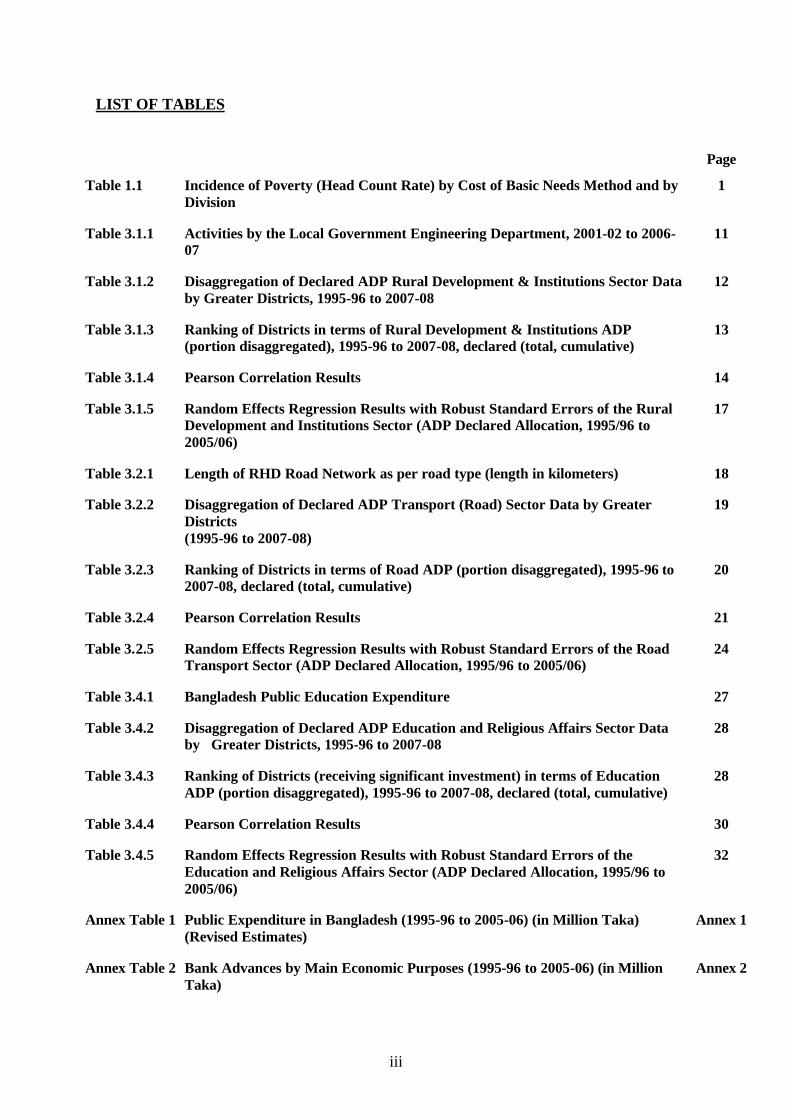
LIST OF TABLES
Page
Table 1.1 Incidence of Poverty (Head Count Rate) by Cost of Basic Needs Method and by Division
1
Table 3.1.1 Activities by the Local Government Engineering Department, 2001-02 to 2006-07
11
Table 3.1.2 Disaggregation of Declared ADP Rural Development & Institutions Sector Data by Greater Districts, 1995-96 to 2007-08
12
Table 3.1.3 Ranking of Districts in terms of Rural Development & Institutions ADP (portion disaggregated), 1995-96 to 2007-08, declared (total, cumulative)
13
Table 3.1.4 Pearson Correlation Results 14
Table 3.1.5 Random Effects Regression Results with Robust Standard Errors of the Rural Development and Institutions Sector (ADP Declared Allocation, 1995/96 to 2005/06)
17
Table 3.2.1 Length of RHD Road Network as per road type (length in kilometers) 18
Table 3.2.2 Disaggregation of Declared ADP Transport (Road) Sector Data by Greater Districts (1995-96 to 2007-08)
19
Table 3.2.3 Ranking of Districts in terms of Road ADP (portion disaggregated), 1995-96 to 2007-08, declared (total, cumulative)
20
Table 3.2.4 Pearson Correlation Results 21
Table 3.2.5 Random Effects Regression Results with Robust Standard Errors of the Road Transport Sector (ADP Declared Allocation, 1995/96 to 2005/06)
24
Table 3.4.1 Bangladesh Public Education Expenditure 27
Table 3.4.2 Disaggregation of Declared ADP Education and Religious Affairs Sector Data by Greater Districts, 1995-96 to 2007-08
28
Table 3.4.3 Ranking of Districts (receiving significant investment) in terms of Education ADP (portion disaggregated), 1995-96 to 2007-08, declared (total, cumulative)
28
Table 3.4.4 Pearson Correlation Results 30
Table 3.4.5 Random Effects Regression Results with Robust Standard Errors of the Education and Religious Affairs Sector (ADP Declared Allocation, 1995/96 to 2005/06)
32
Annex Table 1 Public Expenditure in Bangladesh (1995-96 to 2005-06) (in Million Taka) (Revised Estimates)
Annex 1
Annex Table 2 Bank Advances by Main Economic Purposes (1995-96 to 2005-06) (in Million Taka)
Annex 2
iv
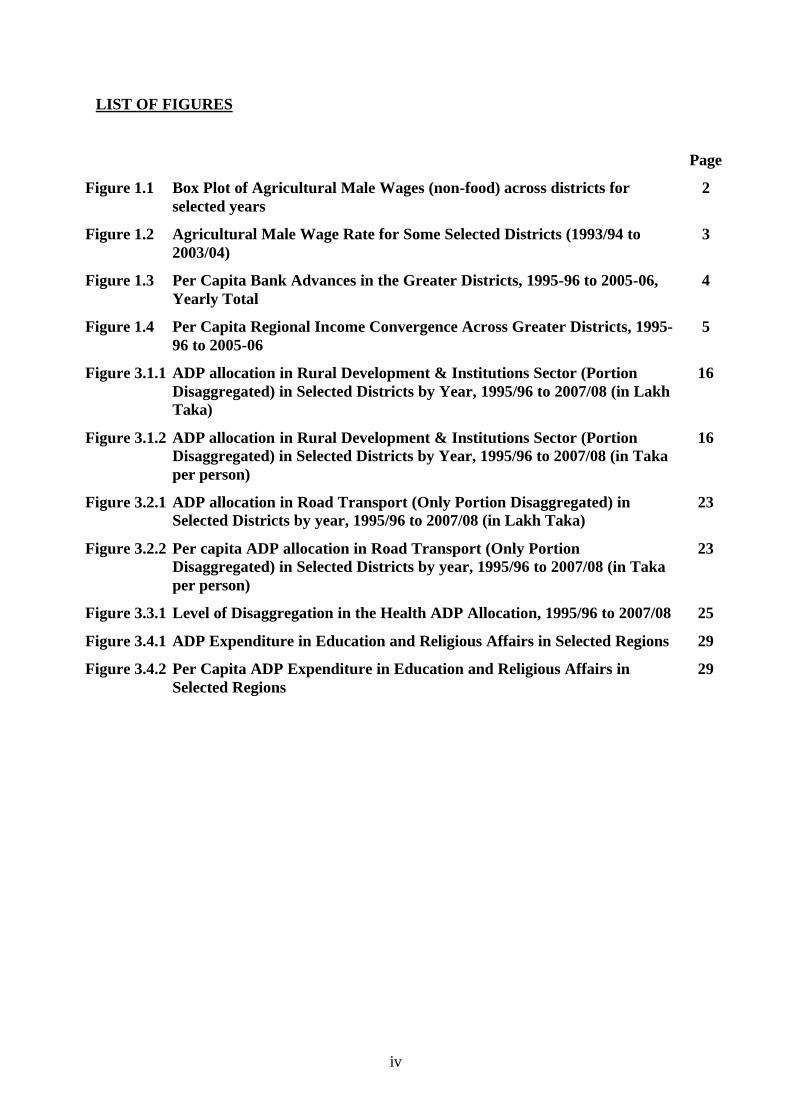
LIST OF FIGURES
Page
Figure 1.1 Box Plot of Agricultural Male Wages (non-food) across districts for selected years
2
Figure 1.2 Agricultural Male Wage Rate for Some Selected Districts (1993/94 to 2003/04)
3
Figure 1.3 Per Capita Bank Advances in the Greater Districts, 1995-96 to 2005-06, Yearly Total
4
Figure 1.4 Per Capita Regional Income Convergence Across Greater Districts, 1995-96 to 2005-06
5
Figure 3.1.1 ADP allocation in Rural Development & Institutions Sector (Portion Disaggregated) in Selected Districts by Year, 1995/96 to 2007/08 (in Lakh Taka)
16
Figure 3.1.2 ADP allocation in Rural Development & Institutions Sector (Portion Disaggregated) in Selected Districts by Year, 1995/96 to 2007/08 (in Taka per person)
16
Figure 3.2.1 ADP allocation in Road Transport (Only Portion Disaggregated) in Selected Districts by year, 1995/96 to 2007/08 (in Lakh Taka)
23
Figure 3.2.2 Per capita ADP allocation in Road Transport (Only Portion Disaggregated) in Selected Districts by year, 1995/96 to 2007/08 (in Taka per person)
23
Figure 3.3.1 Level of Disaggregation in the Health ADP Allocation, 1995/96 to 2007/08 25
Figure 3.4.1 ADP Expenditure in Education and Religious Affairs in Selected Regions 29
Figure 3.4.2 Per Capita ADP Expenditure in Education and Religious Affairs in Selected Regions
29
1
SECTION 1: INTRODUCTION
Traditionally the Bangladesh government’s development efforts have aimed at achieving
‘equitable economic growth.’ With this aim in view, ‘poverty alleviation objectives’--where
social development features prominently, particularly in terms of improvements in health and
education indicators, have always been emphasized in policy strategies. One of the most
important recent policy document “Unlocking the Potential: National Strategy for Accelerated
Poverty Reduction” (PRSP paper), which has been extended till June 2008, embodies such
strategies with great importance. The PRSP paper as well as other government documents
specifically focus on reducing incidences of poverty (also see the Medium Term Budget
Framework 2007-2010 documents in the Ministry of Finance web site).
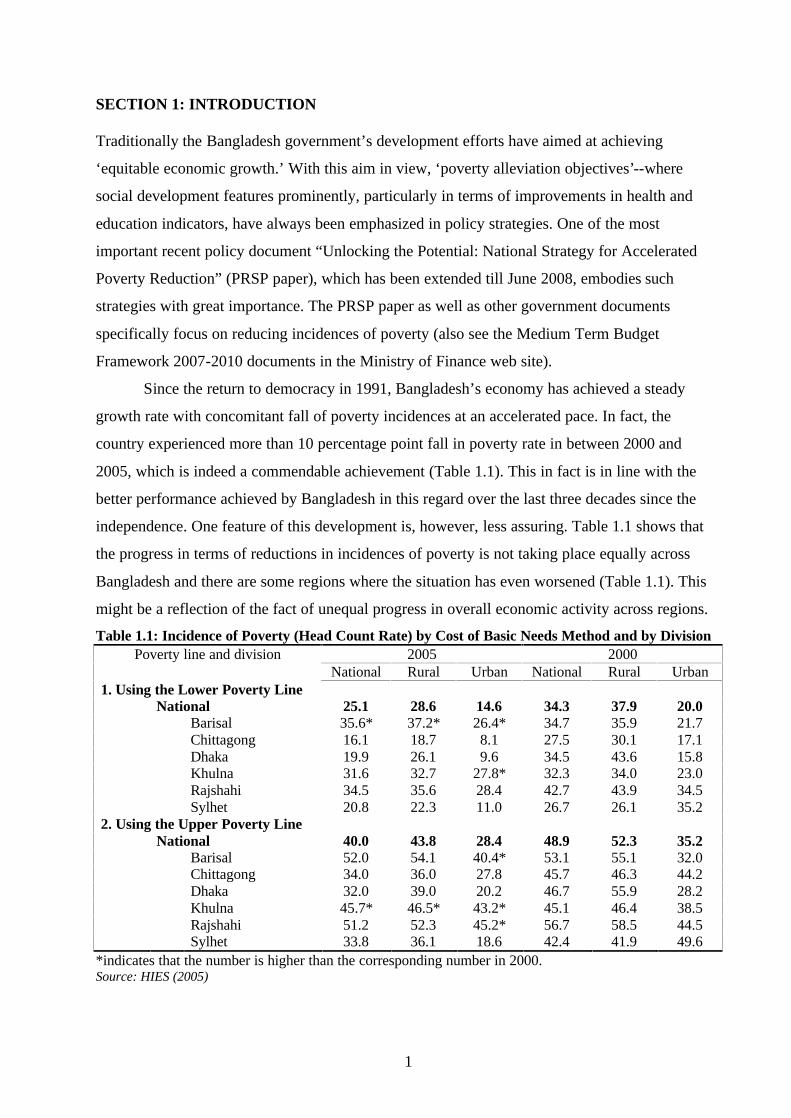
Since the return to democracy in 1991, Bangladesh’s economy has achieved a steady
growth rate with concomitant fall of poverty incidences at an accelerated pace. In fact, the
country experienced more than 10 percentage point fall in poverty rate in between 2000 and
2005, which is indeed a commendable achievement (Table 1.1). This in fact is in line with the
better performance achieved by Bangladesh in this regard over the last three decades since the
independence. One feature of this development is, however, less assuring. Table 1.1 shows that
the progress in terms of reductions in incidences of poverty is not taking place equally across
Bangladesh and there are some regions where the situation has even worsened (Table 1.1). This
might be a reflection of the fact of unequal progress in overall economic activity across regions.
Table 1.1: Incidence of Poverty (Head Count Rate) by Cost of Basic Needs Method and by Division Poverty line and division 2005 2000
National Rural Urban National Rural Urban 1. Using the Lower Poverty Line National 25.1 28.6 14.6 34.3 37.9 20.0 Barisal 35.6* 37.2* 26.4* 34.7 35.9 21.7 Chittagong 16.1 18.7 8.1 27.5 30.1 17.1 Dhaka 19.9 26.1 9.6 34.5 43.6 15.8 Khulna 31.6 32.7 27.8* 32.3 34.0 23.0 Rajshahi 34.5 35.6 28.4 42.7 43.9 34.5 Sylhet 20.8 22.3 11.0 26.7 26.1 35.2 2. Using the Upper Poverty Line National 40.0 43.8 28.4 48.9 52.3 35.2 Barisal 52.0 54.1 40.4* 53.1 55.1 32.0 Chittagong 34.0 36.0 27.8 45.7 46.3 44.2 Dhaka 32.0 39.0 20.2 46.7 55.9 28.2 Khulna 45.7* 46.5* 43.2* 45.1 46.4 38.5 Rajshahi 51.2 52.3 45.2* 56.7 58.5 44.5 Sylhet 33.8 36.1 18.6 42.4 41.9 49.6
*indicates that the number is higher than the corresponding number in 2000. Source: HIES (2005)

2
SECTION 1.1: REGIONAL ECONOMIC DISPARITY IN BANGLADESH
Is this feature of disparate reduction of poverty across regions persistent overtime? How does the
regions compare when viewed with other relevant indicators?
Figure 1.1 has been drawn with the Agricultural male wages (non-food) across 64 districts
in a given year; here wage has been taken as a proxy variable for income for districts. Each Box
Plot reflects the disparity in Agricultural male wages across districts for a specific year.2
Agricultural wage is expected to embody the opportunity cost within a district determined by the
overall economic activity in it. Therefore, higher is the level of agricultural wage greater is the
level of economic activity and income enjoyed by a district.
In the figure 1.1, the jump in median values between the fiscal year (FY) 1994 and 1999
reflects the fact that nominal agricultural wage including the minimum, increased overtime. What
is relevant to our discussion is the fact of disparity captured by the box plots here. In case of
absolute parity a box plot collapses to a single point or level and higher is the differences in
wages, greater would be the deviations of different levels from each other. In the FYs 2000, 2001
and 2004 we observe the median wage to be closer to first quartile than third quartile. If we
compare the changes in agricultural male wages between FY 2004 and FY 2001 then clearly the
nominal wage differences of maximum and third quartile wages with the median wage have
increased over this time period.
Figure 1.1: Box Plot of Agricultural Male Wages (Non-food) Across Districts for Selected Years
2323232323N =
FY2004FY2001FY2000FY1999FY1993
120
100
80
60
40
20
4
Source: FPMU, Ministry of Food and Disaster Management, GOB
2 Available data on Agricultural Male Wage (non-food) collected by Food Policy Monitoring Unit (FPMU), Ministry of Food extends till 2004.
3
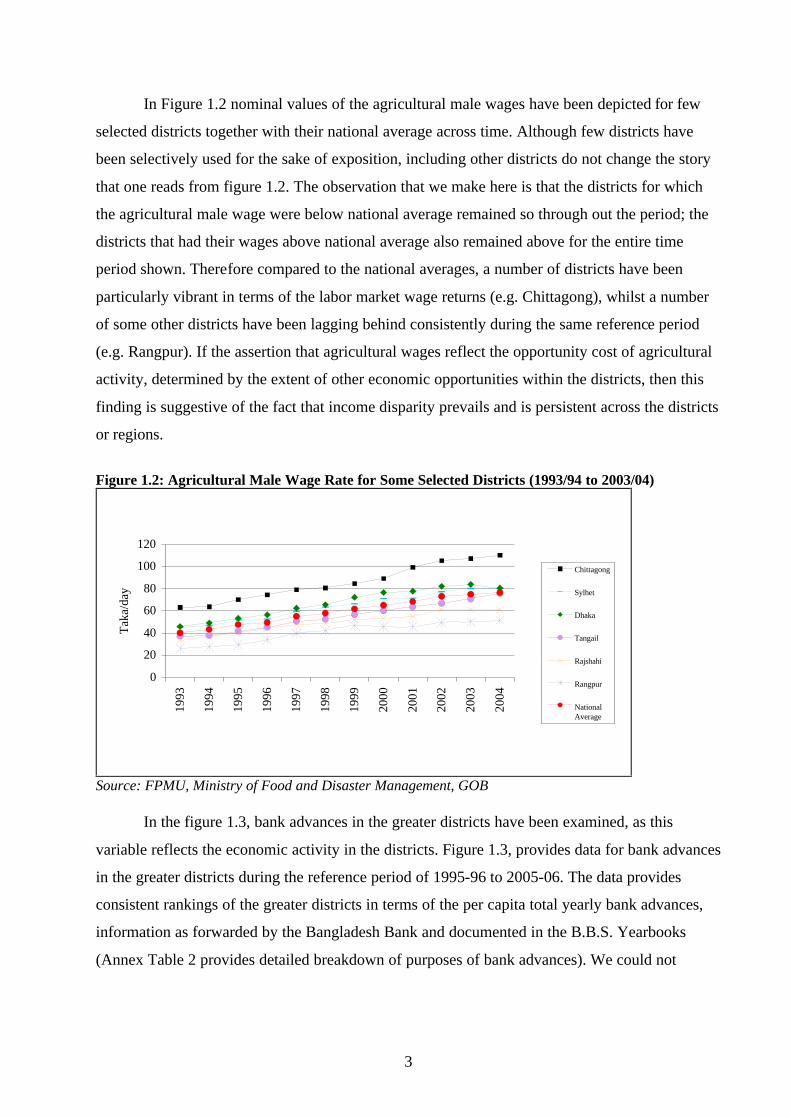
In Figure 1.2 nominal values of the agricultural male wages have been depicted for few
selected districts together with their national average across time. Although few districts have
been selectively used for the sake of exposition, including other districts do not change the story
that one reads from figure 1.2. The observation that we make here is that the districts for which
the agricultural male wage were below national average remained so through out the period; the
districts that had their wages above national average also remained above for the entire time
period shown. Therefore compared to the national averages, a number of districts have been
particularly vibrant in terms of the labor market wage returns (e.g. Chittagong), whilst a number
of some other districts have been lagging behind consistently during the same reference period
(e.g. Rangpur). If the assertion that agricultural wages reflect the opportunity cost of agricultural
activity, determined by the extent of other economic opportunities within the districts, then this
finding is suggestive of the fact that income disparity prevails and is persistent across the districts
or regions.
Figure 1.2: Agricultural Male Wage Rate for Some Selected Districts (1993/94 to 2003/04)
0
20
40
60
80
100
120
1993
1994
1995
1996
1997
1998
1999
2000
2001
2002
2003
2004
Taka
/day
Chittagong
Sylhet
Dhaka
Tangail
Rajshahi
Rangpur
NationalAverage
Source: FPMU, Ministry of Food and Disaster Management, GOB
In the figure 1.3, bank advances in the greater districts have been examined, as this
variable reflects the economic activity in the districts. Figure 1.3, provides data for bank advances
in the greater districts during the reference period of 1995-96 to 2005-06. The data provides
consistent rankings of the greater districts in terms of the per capita total yearly bank advances,
information as forwarded by the Bangladesh Bank and documented in the B.B.S. Yearbooks
(Annex Table 2 provides detailed breakdown of purposes of bank advances). We could not

4
exhibit data for Dhaka, Chittagong and Khulna as they were outlier cases with rapid expansion
trajectories all throughout the reference period.
Figure 1.3: Per Capita Bank Advances in the Greater Districts, 1995-96 to 2005-06, Yearly Total
0
500
1000
1500
2000
2500
3000
3500
1995 1996 1997 1998 1999 2000 2001 2002 2003 2004 2005
Year
Per c
apita
Ban
k Ad
vanc
es, Y
early
Tot
al
(Tk/
pers
on)
DIN
RAN
BOG
RAJ
PAB
KUS
JES
BAR
PAT
TAN
JAM
MYM
FAR
SYL
COM
NOA
Source: Statistical Yearbook of Bangladesh (Various Years), B.B.S. Note: Dhaka, Chittagong and Khulna, not shown.
If one explores this issue of regional inequality further, one would find that, not only that
it exists, but it can even be argued that this would persist for the immediate future, as some
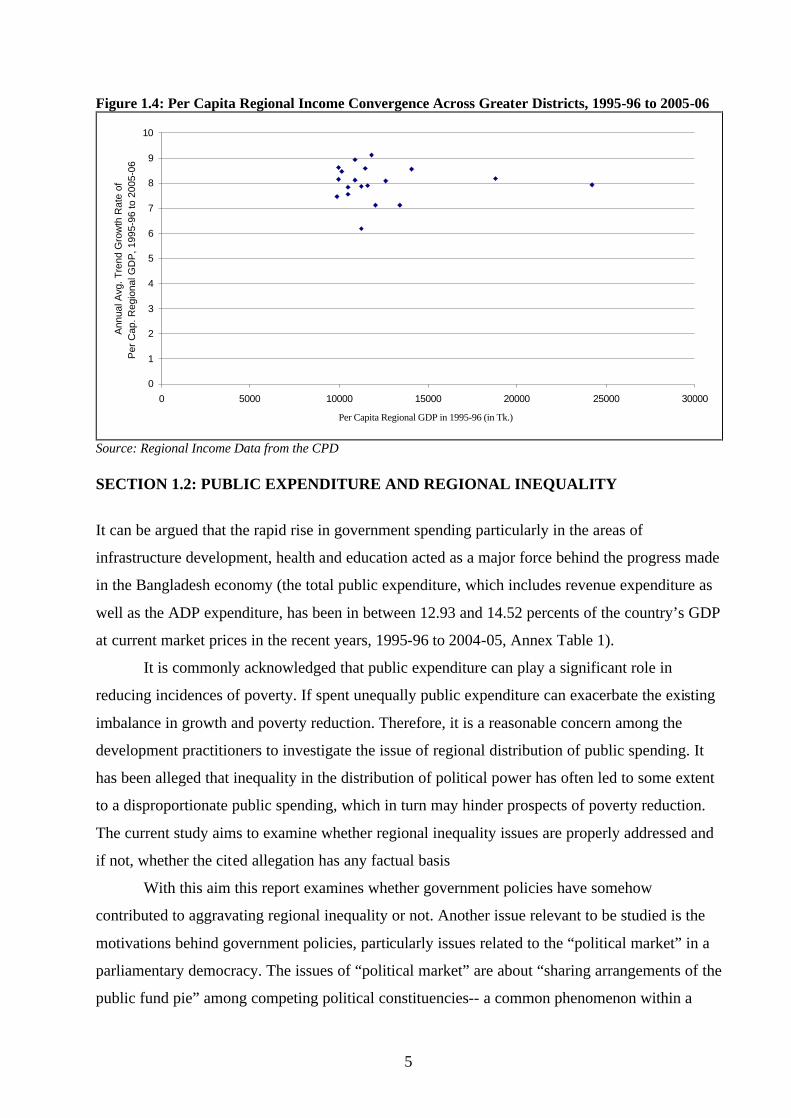
information would indicate. Figure 1.4 plots the per capita regional GDP in 1995-96 as against
the annual trend growth rate of per capita regional GDP of the greater districts during 1995-96 to
2005-06. A distinct downward-sloping line would imply that a higher per capita regional GDP in
a particular greater district is associated with a lower annual trend growth rate of the regional per
capita GDP in that district during the reference period, and similarly a lower per capita regional
GDP is associated with a higher annual trend growth rate of per capita regional GDP. Therefore a
distinct downward-sloping pattern in the scatter plot would have implied that the economically
backward regions would “catch up” with the economically advanced regions, as time progresses.
In Figure 1.4, a scatter plot of 19 greater districts (excluding the Chittagong Hill Tracts) fails to
exhibit any clear-cut pattern rather than a formation of a cluster with a few outlier cases. This
implies that data for the reference period does not provide support for the hypothesis of “regional
convergence” in the country during the same reference period.
5
Figure 1.4: Per Capita Regional Income Convergence Across Greater Districts, 1995-96 to 2005-06
0
1
2
3
4
5
6
7
8
9
10
0 5000 10000 15000 20000 25000 30000
Per Capita Regional GDP in 1995-96 (in Tk.)
Ann
ual A
vg. T
rend
Gro
wth
Rat
e of
P
er C
ap. R
egio
nal G
DP
, 199
5-96
to 2
005-
06
Source: Regional Income Data from the CPD
SECTION 1.2: PUBLIC EXPENDITURE AND REGIONAL INEQUALITY
It can be argued that the rapid rise in government spending particularly in the areas of
infrastructure development, health and education acted as a major force behind the progress made
in the Bangladesh economy (the total public expenditure, which includes revenue expenditure as
well as the ADP expenditure, has been in between 12.93 and 14.52 percents of the country’s GDP
at current market prices in the recent years, 1995-96 to 2004-05, Annex Table 1).
It is commonly acknowledged that public expenditure can play a significant role in
reducing incidences of poverty. If spent unequally public expenditure can exacerbate the existing
imbalance in growth and poverty reduction. Therefore, it is a reasonable concern among the
development practitioners to investigate the issue of regional distribution of public spending. It
has been alleged that inequality in the distribution of political power has often led to some extent
to a disproportionate public spending, which in turn may hinder prospects of poverty reduction.
The current study aims to examine whether regional inequality issues are properly addressed and
if not, whether the cited allegation has any factual basis
With this aim this report examines whether government policies have somehow
contributed to aggravating regional inequality or not. Another issue relevant to be studied is the
motivations behind government policies, particularly issues related to the “political market” in a
parliamentary democracy. The issues of “political market” are about “sharing arrangements of the
public fund pie” among competing political constituencies-- a common phenomenon within a

6
democratic setup (see Atlas et al 1995 and Keefer and Khemani 2005). This study focuses on
these issues.
Accordingly, this report examines the declared public investments made under the Annual
Development Program (ADP), and endeavors to answer the following question: has public
expenditure in Bangladesh successfully addressed the regional income inequality problem and if
not, has it been it influenced by some other considerations which are mainly political by nature?
SECTION 1.3: RESEARCH QUESTIONS
The study examines the published ADP documents. After controlling for all the “year” and
“greater district” effects and observed characteristics, it is hypothesized that economically better-
off regions would have a higher ADP allocation. If this line of argument were supported, this
would imply that the ADP allocations are not properly addressing the regional inequality issue.
An additional line of argument is that the districts with a higher proportion of constituencies
belonging to the political party (or alliances) in power would have a tendency to receive a higher
ADP allocation (because of alleged “bias” created in the system of ADP allocation by the culture
of democratically elected Members of Parliaments (MPs) pursuing in favor of their own
respective constituencies and it is also alleged that the ruling party MPs find it easier to distort the
share of the public fund pie in their favor). Therefore two particular points are of interest,
Hypothesis 1: economically advanced districts receive higher ADP allocations,
Hypothesis 2: districts with higher percentage of constituencies belonging to the party in power
receive higher ADP allocations.
SECTION 1.4: ORGANIZATION OF THE REPORT
The draft report has been organized as follows: Section 2 lays out the econometric modeling,
methodology and data analysis issues; Section 3 analyses a number of important sectors in terms
of pro-poor growth aspects of the economy in the ADP allocation and Section 4 concludes the
study.
7
SECTION 2: ECONOMETRIC MODEL AND METHODOLOGY
The data for this study is a panel data. Since the study requires investigation of the ADP
allocation declarations of the Government of Bangladesh over a substantial period of time, and
distribution of this allocation among the greater districts, it automatically implies that the data
requirement would be of a panel data type, a cross section over a time series, in this particular
case, a series of ADP allocation lists for all the greater districts over a number of years.
Since the ADP data records the ADP allocations over time, we have a problem of dealing
with the “unobserved effects”. The cause of concern with regards to the “unobserved effects” is
that, if this “effect” is uncorrelated with each of the explanatory variables, then it can be treated
as just another unobserved factor affecting the dependent variable in a way that is not
systematically related to the observable explanatory variables, the principle area of interest for
the regression analysis. On the other hand, if the “unobserved effect” is correlated with some of
the explanatory variables, putting this “effect” in the error term would lead to serious flaws in
estimating the regression coefficients. Hence the panel data framework provides ways to deal
with the issue of this “unobserved effect”, and this is considered the biggest advantage of a panel
data over either a cross section or a time series data. The crucial assumption implied in the panel
data framework is that this “unobserved effect” is constant over time (Wooldridge 2000, 2002,
Greene 2000). For example, in the case that the unit of observation is the “greater district”-- this
“unobserved effect” may contain unobserved characteristics of a particular greater district, such
as, a number of idiosyncratic features of this particular region that the researchers can not observe
(for example, higher motivation level of the district stakeholders or higher skill levels, technical
abilities and management structure of the local agencies, or a reputation of a particular greater
district for successful implementation of ADP)-- these can be viewed as very close to constant
over the period in question. In the panel data framework, there are two ways to view the
“unobserved effects”, one is the “random effects”, and the other is the “fixed effects”. The
“random effects” implies a zero correlation between the observed explanatory variables and the
unobserved effect. On the other hand, the “fixed effects” allows for arbitrary correlation between
the unobserved effect and the observed explanatory variables (Wooldridge 2002). Whether a
fixed effects or a random effects specification is appropriate in a particular application, this
mostly depends on results from some econometric tests, such as, the Hausman test and the
Breusch and Pagan test.
8
We can propose the following framework of “unobserved effects” for this analysis. This
framework will take into account effects from one dimension, namely, in this case, the “greater
district”. This may take a form such as:
pcADPit = a 0 + a i + ß1 Xit + ß2 MPit + eit …………………………………………………(1)
--here, pcADPit is the per capita ADP allocation to district i at year t
a0 is the intercept
a i is the “greater district” effect for greater district i
Xit are explanatory variables of the greater district i at year t
MP it is a set of variables designed to examine alleged political inclinations of parties in power,
eit is the error term, and,
ß1 and ß2 are parameters to be estimated, along with fixed or random effects estimates for
“greater districts”. We may have to depend on the abovementioned tests to decide on the issue of
whether the “fixed effects” or “random effects” framework is an appropriate approach here.
According to the motivation behind this examination, both ß1 and ß2 are expected to be of
positive signs. The argument is that, after controlling for all the unobserved effects and the “MP”
variables, it is hypothesized that economically better-off regions would have a higher ADP
allocation. Again the districts with a higher proportion of constituencies belonging to the political
party or alliances in power would have a tendency to receive a higher ADP allocation, controlling
for the income indicator, the observed and the unobserved characteristics.
The “unobserved effects regression” specification provides estimates for “unobserved
effects” itself (either “random” or “fixed”). The latter will provide a particular value for a greater
district, in such a way that the sum of all the values over all the districts is exactly zero. This
implies that this estimate of random effects will be positive for some districts and those will be
negative for some other districts, expressed in the form of a tendency of deviation from the
overall national average (which is exactly placed at zero). A hypothetical district at exactly the
national average would receive the model predicted value amount of allocation. A greater district
with an unobserved effects estimation of positive sign implies that this district would have a
tendency to receive higher allocations compared to the national average; similarly a greater
district with an unobserved effects estimation of negative sign implies that this district would
have a tendency to receive lower allocations compared to the national average (over the relevant
time period) (Wooldridge 2000).
An additional point is that, this study includes the Hausman test to check the
appropriateness of fixed effects estimation in comparison to a random effects specification. A
non-acceptance of the null hypothesis in the Hausman test is considered to be a support for a
9
fixed effects specification (Greene 2000). On the other hand, a Breusch and Pagan test
implemented after the random effects regression would lend support for the random effects
specification if the null hypothesis of variance of unobserved effects being zero were rejected.
SECTION 2.1: DATA ANALYSIS
The source of information for ADP allocation declarations is the yearly publications of Annual
Development Program Reports by the Planning Commission, the Government of the People’s
Republic of Bangladesh. One feature of this data is that in a large number of cases, this data
includes project name, initial estimated cost, expected timeframe of the project, funding sources,
declaration of ADP allocation, etc. The projects are not listed according to the greater districts,
which is this study’s point of interest. Therefore after classifying the projects in terms of greater
districts, from their respective titles-- a large portion of projects could not be disaggregated in
terms of the greater districts (also the level of disaggregation varied over time and across sectors,
see Table 3.1.2, 3.2.2 and 3.4.2).
A cross-section time-series of regional income (for example, “Regional Gross Domestic
Product”) is the most appropriate information to be used in this study. Data is not currently
available regarding recent years’ regional GDP data since the series of information that is
available in the official documents in this regard is up to the year 1999-2000. On the other hand,
the Household Income and Expenditure (HIES) Surveys are of 1995-96, 2000 and 2005 (the three
most recent ones), they were not panel series-- in addition, the HIES information is available up
to the level of divisions, not up to the level of all the greater districts. Since the ADP declarations
are available in the official documents up to as recent as 2007-08, it was felt that we needed as
much updated information about regional income as possible. The Centre for Policy Dialogue
(CPD) has provided us with a data on regional income, which turned out to be particularly useful
in solving the data issue. The regional income data from the CPD was from 1995-96 up till the
year 2005-06.
We decided not to include the Chittagong Hill Tracts (CHT) region in our regression
analysis, since the CHT region has some political and security issues as well as a different
topographical setting compared to all other greater districts--this requires a separate discussion.
One problem of data collection was that it was difficult to gather information on the
greater districts on a yearly basis over the entire years of the data analysis section. Another
problem was that there were statistically significant correlations among a number of variables on
which data were available, so that they could not be included in the final regression for issues
10
with multicollinearity, such as, “road density “, “head count ratio (of poverty)”, “bank advances”,
etc. The estimation results do not alter significantly if these alternative variables are used.
A large amount of district-level information on child education and health related issues
are recorded in the “Progotir Pathey” publications by the UNICEF and the B.B.S. But these were
not incorporated since we concentrated only on the “economic” aspects of the regional inequality
issue, principally because of a lack of consensus among the development practitioners with
regards to the weights to be given to the social and health indicators vis-à-vis the economic ones.
The results of the National Parliament Elections (1991, 1996 and 2001) are available in
the Bangladesh Election Commission website.
11
SECTION 3: SECTORAL ANALYSES
SECTION 3.1: RURAL DEVELOPMENT & INSTITUTIONS (RDI)
The major portion of the Rural Development and Institutions (RDI) sector allocation of the ADP
is allocated to the Local Government Engineering Department (LGED). The LGED has been
involved in constructing rural and urban road infrastructure and networks throughout the country
(see Table 3.1.1 for the tasks implemented by the LGED). Over the last decade, other recipient
agencies of the RDI ADP have been the Bangladesh Rural Development Board (BRDB),
Chittagong Hill Tracts Development Board (CHTDB), Local Government Division (LGD), Rural
Development Academy, Bogra (RDA, Bogra) and others. While the overall objective is rural
development, the recipient departments differ in terms of assignments and objectives.
The transport sector has expanded rapidly over the last decade in government allocations
(PER, 2003). As per documented by the PER, the LGED itself received 0.47, 0.52, 0.64 and 0.78
percent of the respective GDPs of the years 1997-98, 1998-99, 1999-2000 and 2000-01. Around
90 percent of the total funds received by the LGED are allocated for construction, upgrading and
rehabilitation and the remaining fund is allocated for maintenance (op. cit.), this implies that the
major portion is allocated for construction and upgrading, and a small portion is for maintenance.
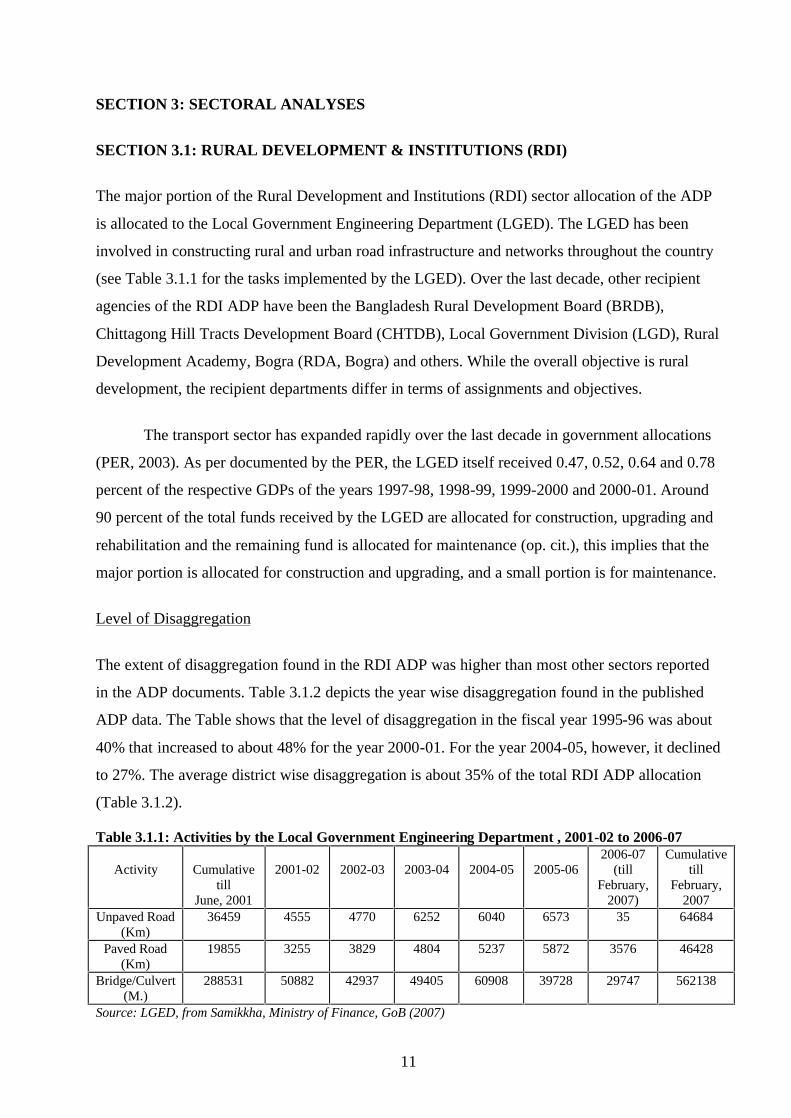
Level of Disaggregation
The extent of disaggregation found in the RDI ADP was higher than most other sectors reported
in the ADP documents. Table 3.1.2 depicts the year wise disaggregation found in the published
ADP data. The Table shows that the level of disaggregation in the fiscal year 1995-96 was about
40% that increased to about 48% for the year 2000-01. For the year 2004-05, however, it declined
to 27%. The average district wise disaggregation is about 35% of the total RDI ADP allocation
(Table 3.1.2).
Table 3.1.1: Activities by the Local Government Engineering Department , 2001-02 to 2006-07
Activity
Cumulative till
June, 2001
2001-02
2002-03
2003-04
2004-05
2005-06
2006-07 (till
February, 2007)
Cumulative till
February, 2007
Unpaved Road (Km)
36459 4555 4770 6252 6040 6573 35 64684
Paved Road (Km)
19855 3255 3829 4804 5237 5872 3576 46428
Bridge/Culvert (M.)
288531 50882 42937 49405 60908 39728 29747 562138
Source: LGED, from Samikkha, Ministry of Finance, GoB (2007)
12
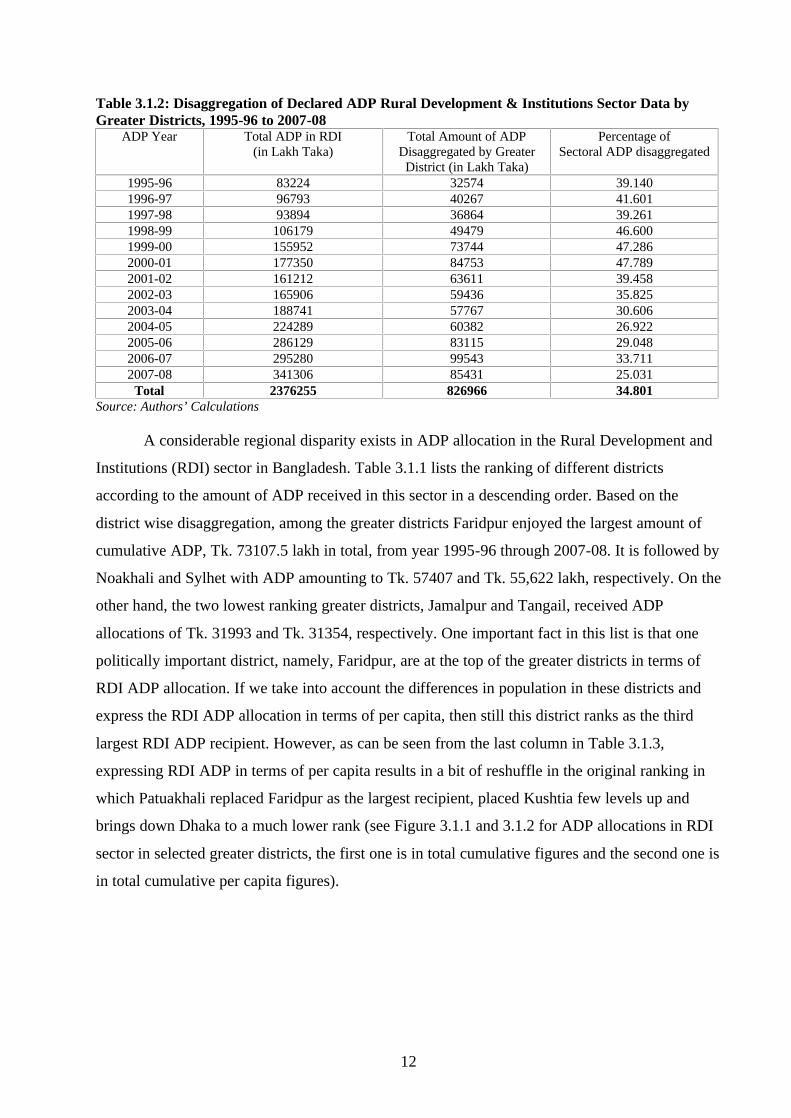
Table 3.1.2: Disaggregation of Declared ADP Rural Development & Institutions Sector Data by Greater Districts, 1995-96 to 2007-08
ADP Year Total ADP in RDI (in Lakh Taka)
Total Amount of ADP Disaggregated by Greater
District (in Lakh Taka)
Percentage of Sectoral ADP disaggregated
1995-96 83224 32574 39.140 1996-97 96793 40267 41.601 1997-98 93894 36864 39.261 1998-99 106179 49479 46.600 1999-00 155952 73744 47.286 2000-01 177350 84753 47.789 2001-02 161212 63611 39.458 2002-03 165906 59436 35.825 2003-04 188741 57767 30.606 2004-05 224289 60382 26.922 2005-06 286129 83115 29.048 2006-07 295280 99543 33.711 2007-08 341306 85431 25.031
Total 2376255 826966 34.801 Source: Authors’ Calculations
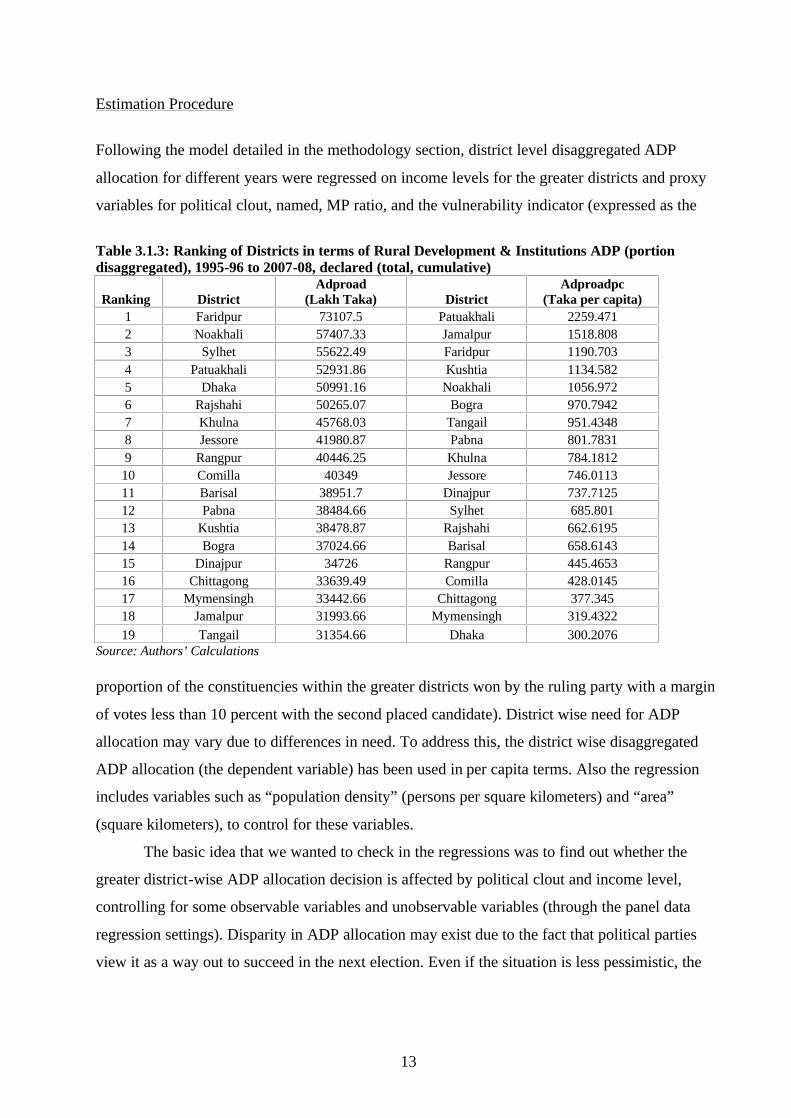
A considerable regional disparity exists in ADP allocation in the Rural Development and
Institutions (RDI) sector in Bangladesh. Table 3.1.1 lists the ranking of different districts
according to the amount of ADP received in this sector in a descending order. Based on the
district wise disaggregation, among the greater districts Faridpur enjoyed the largest amount of
cumulative ADP, Tk. 73107.5 lakh in total, from year 1995-96 through 2007-08. It is followed by
Noakhali and Sylhet with ADP amounting to Tk. 57407 and Tk. 55,622 lakh, respectively. On the
other hand, the two lowest ranking greater districts, Jamalpur and Tangail, received ADP
allocations of Tk. 31993 and Tk. 31354, respectively. One important fact in this list is that one
politically important district, namely, Faridpur, are at the top of the greater districts in terms of
RDI ADP allocation. If we take into account the differences in population in these districts and
express the RDI ADP allocation in terms of per capita, then still this district ranks as the third
largest RDI ADP recipient. However, as can be seen from the last column in Table 3.1.3,
expressing RDI ADP in terms of per capita results in a bit of reshuffle in the original ranking in
which Patuakhali replaced Faridpur as the largest recipient, placed Kushtia few levels up and
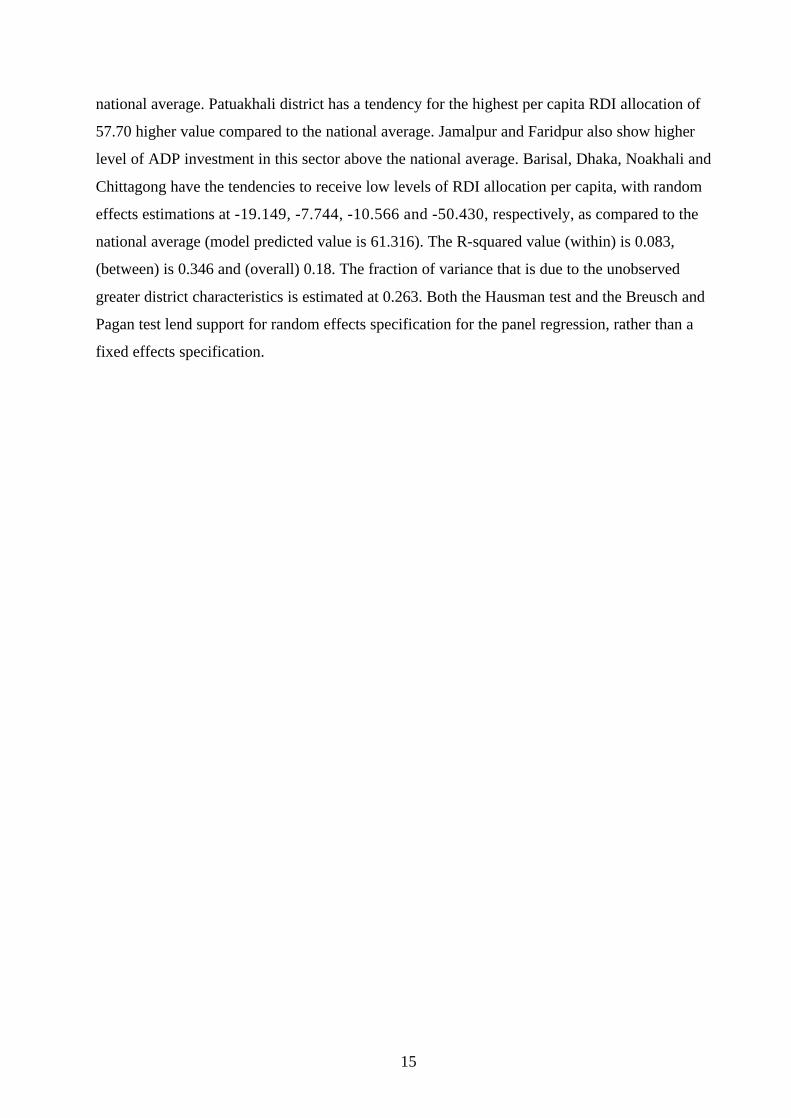
brings down Dhaka to a much lower rank (see Figure 3.1.1 and 3.1.2 for ADP allocations in RDI
sector in selected greater districts, the first one is in total cumulative figures and the second one is
in total cumulative per capita figures).
13
Estimation Procedure
Following the model detailed in the methodology section, district level disaggregated ADP
allocation for different years were regressed on income levels for the greater districts and proxy
variables for political clout, named, MP ratio, and the vulnerability indicator (expressed as the
Table 3.1.3: Ranking of Districts in terms of Rural Development & Institutions ADP (portion disaggregated), 1995-96 to 2007-08, declared (total, cumulative)
Ranking District Adproad
(Lakh Taka) District Adproadpc
(Taka per capita) 1 Faridpur 73107.5 Patuakhali 2259.471 2 Noakhali 57407.33 Jamalpur 1518.808 3 Sylhet 55622.49 Faridpur 1190.703 4 Patuakhali 52931.86 Kushtia 1134.582 5 Dhaka 50991.16 Noakhali 1056.972 6 Rajshahi 50265.07 Bogra 970.7942 7 Khulna 45768.03 Tangail 951.4348 8 Jessore 41980.87 Pabna 801.7831 9 Rangpur 40446.25 Khulna 784.1812 10 Comilla 40349 Jessore 746.0113 11 Barisal 38951.7 Dinajpur 737.7125 12 Pabna 38484.66 Sylhet 685.801 13 Kushtia 38478.87 Rajshahi 662.6195 14 Bogra 37024.66 Barisal 658.6143 15 Dinajpur 34726 Rangpur 445.4653 16 Chittagong 33639.49 Comilla 428.0145 17 Mymensingh 33442.66 Chittagong 377.345 18 Jamalpur 31993.66 Mymensingh 319.4322 19 Tangail 31354.66 Dhaka 300.2076
Source: Authors’ Calculations
proportion of the constituencies within the greater districts won by the ruling party with a margin
of votes less than 10 percent with the second placed candidate). District wise need for ADP
allocation may vary due to differences in need. To address this, the district wise disaggregated
ADP allocation (the dependent variable) has been used in per capita terms. Also the regression
includes variables such as “population density” (persons per square kilometers) and “area”
(square kilometers), to control for these variables.
The basic idea that we wanted to check in the regressions was to find out whether the
greater district-wise ADP allocation decision is affected by political clout and income level,
controlling for some observable variables and unobservable variables (through the panel data
regression settings). Disparity in ADP allocation may exist due to the fact that political parties
view it as a way out to succeed in the next election. Even if the situation is less pessimistic, the
14
disparity may be caused simply by the fact that party in power controls the flow overwhelmingly.
The “MP ratio” and the “vulnerability” indicator have been used to take this feature into account.
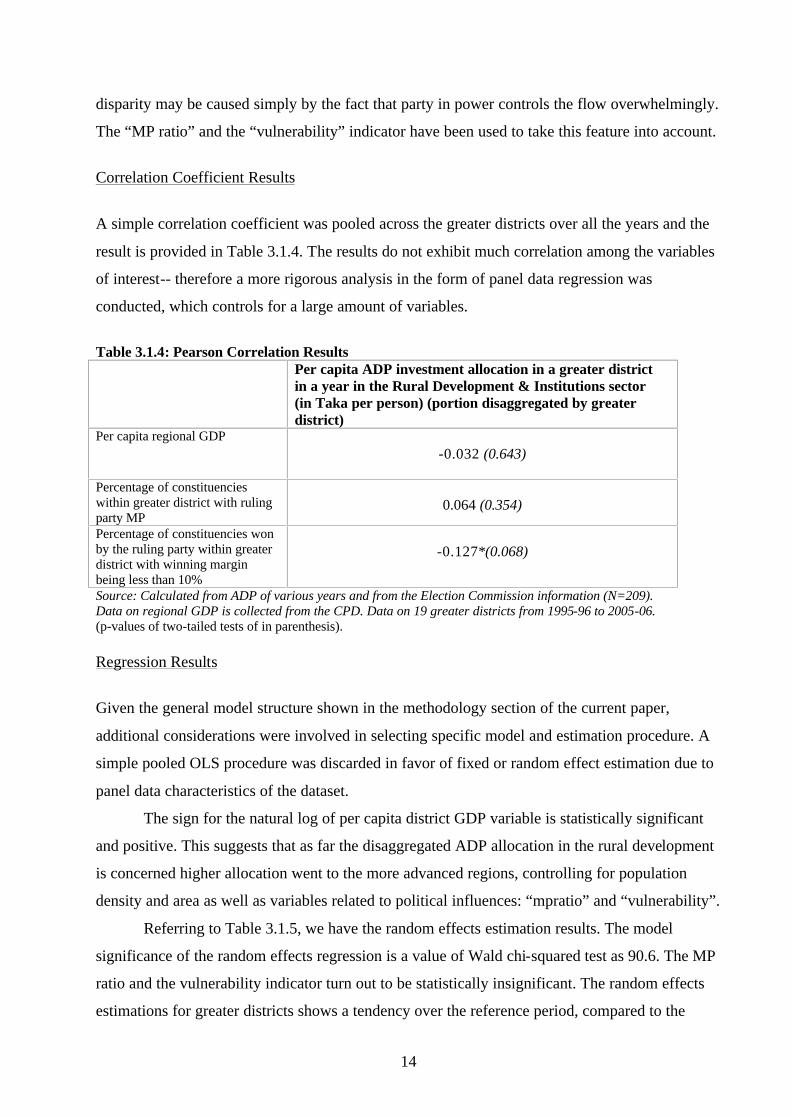
Correlation Coefficient Results
A simple correlation coefficient was pooled across the greater districts over all the years and the
result is provided in Table 3.1.4. The results do not exhibit much correlation among the variables
of interest-- therefore a more rigorous analysis in the form of panel data regression was
conducted, which controls for a large amount of variables.
Table 3.1.4: Pearson Correlation Results Per capita ADP investment allocation in a greater district
in a year in the Rural Development & Institutions sector (in Taka per person) (portion disaggregated by greater district)
Per capita regional GDP -0.032 (0.643)
Percentage of constituencies within greater district with ruling party MP
0.064 (0.354)
Percentage of constituencies won by the ruling party within greater district with winning margin being less than 10%
-0.127*(0.068)
Source: Calculated from ADP of various years and from the Election Commission information (N=209). Data on regional GDP is collected from the CPD. Data on 19 greater districts from 1995-96 to 2005-06. (p-values of two-tailed tests of in parenthesis).
Regression Results
Given the general model structure shown in the methodology section of the current paper,
additional considerations were involved in selecting specific model and estimation procedure. A
simple pooled OLS procedure was discarded in favor of fixed or random effect estimation due to
panel data characteristics of the dataset.
The sign for the natural log of per capita district GDP variable is statistically significant
and positive. This suggests that as far the disaggregated ADP allocation in the rural development
is concerned higher allocation went to the more advanced regions, controlling for population
density and area as well as variables related to political influences: “mpratio” and “vulnerability”.
Referring to Table 3.1.5, we have the random effects estimation results. The model
significance of the random effects regression is a value of Wald chi-squared test as 90.6. The MP
ratio and the vulnerability indicator turn out to be statistically insignificant. The random effects
estimations for greater districts shows a tendency over the reference period, compared to the
15
national average. Patuakhali district has a tendency for the highest per capita RDI allocation of
57.70 higher value compared to the national average. Jamalpur and Faridpur also show higher
level of ADP investment in this sector above the national average. Barisal, Dhaka, Noakhali and
Chittagong have the tendencies to receive low levels of RDI allocation per capita, with random
effects estimations at -19.149, -7.744, -10.566 and -50.430, respectively, as compared to the
national average (model predicted value is 61.316). The R-squared value (within) is 0.083,
(between) is 0.346 and (overall) 0.18. The fraction of variance that is due to the unobserved
greater district characteristics is estimated at 0.263. Both the Hausman test and the Breusch and
Pagan test lend support for random effects specification for the panel regression, rather than a
fixed effects specification.
16
Figure 3.1.1: ADP allocation in Rural Development & Institutions Sector (Portion Disaggregated) in Selected Districts by Year, 1995/96 to 2007/08 (in Lakh Taka)
0
2000
4000
6000
8000
10000
12000
14000
16000
1995
96
1996
97
1997
98
1998
99
1999
00
2000
01
2001
02
2002
03
2003
04
2004
05
2005
06
2006
07
2007
08
Year
Taka
in L
akh
DhakaFaridpurNoakhaliPatuakhaliRajshahiRangpurTangail
Source: Authors’ Calculation
Figure 3.1.2: ADP allocation in Rural Development & Institutions Sector (Portion Disaggregated) in Selected Districts by Year, 1995/96 to 2007/08 (in Taka per person)
0
50
100
150
200
250
300
350
400
450
199596 199697 199798 199899 199900 200001 200102 200203 200304 200405 200506 200607 200708
Year
Taka
per
per
son
DhakaFaridpurNoakhaliPatuakhaliRajshahiRangpurTangail
Source: Authors’ Calculation

17
Table 3.1.5: Random Effects Regression Results with Robust Standard Errors of the Rural Development and Institutions Sector (ADP Declared Allocation, 1995/96 to 2005/06) Dependent variable Per capita ADP investment allocation in a greater district in a year in the RDI sector (in Taka per person) (portion disaggregated by greater district)
Estimated Coefficients (Heteroskedasticity-robust
Standard Error)
p-value
Independent variables
Natural Log of Per capita District GDP (Tk.) 52.310*** (18.424) 0.005
Population Density (Person/Sq. Km.) – 0.051*** (0.014) 0.000
Area (Sq. K.m.) – 0.008** (0.002) 0.001
% of Constituencies within Greater District with Ruling Party MP – 0.126 (0.135) 0.347
Vulnerability Indicator of Constituencies within Greater District 0.001 (0.135) 0.996
Constant – 333.360** (156.628) 0.033
Estimates of Random Effects
Dinajpur district – 12.693
Rangpur district – 1.417
Bogra district – 2.559
Rajshahi district 1.280
Pabna district – 7.835
Kushtia district – 19.915
Jessore district – 19.718
Khulna district – 10.367
Barisal district – 19.149
Patuakhali district 57.699
Tangail district 6.941
Jamalpur district 32.311
Mymensingh district 33.481
Dhaka district – 7.744
Faridpur district 30.850
Sylhet district – 7.383
Comilla district 7.203
Noakhali district – 10.566
Chittagong district – 50.430
Model Predicted Value(at Mean)
Predicted Value 61.316
Hausman test for comparison between fixed effects and random effects Chi-square= 5.91 Pr>chi-sq= 0.206
Breusch and Pagan Test Chi-square= 46.04 Pr>chi-sq= 0.000
Note: Number of Observations= 209; Model Utility: Wald Chi Sqr= 90.600 with Prob.>chi-sq= 0.000; R2 (within)= 0.083, (between)= 0.346, (overall)= 0.180 correlation (u_i, Xb)= assumed zero; sigma(e)= 44.99; sigma(u)= 26.843 and rho (fraction of variance due to u_i)= 0.263 ***significant at 1% level, **significant at 5% level and *significant at 10% level
18
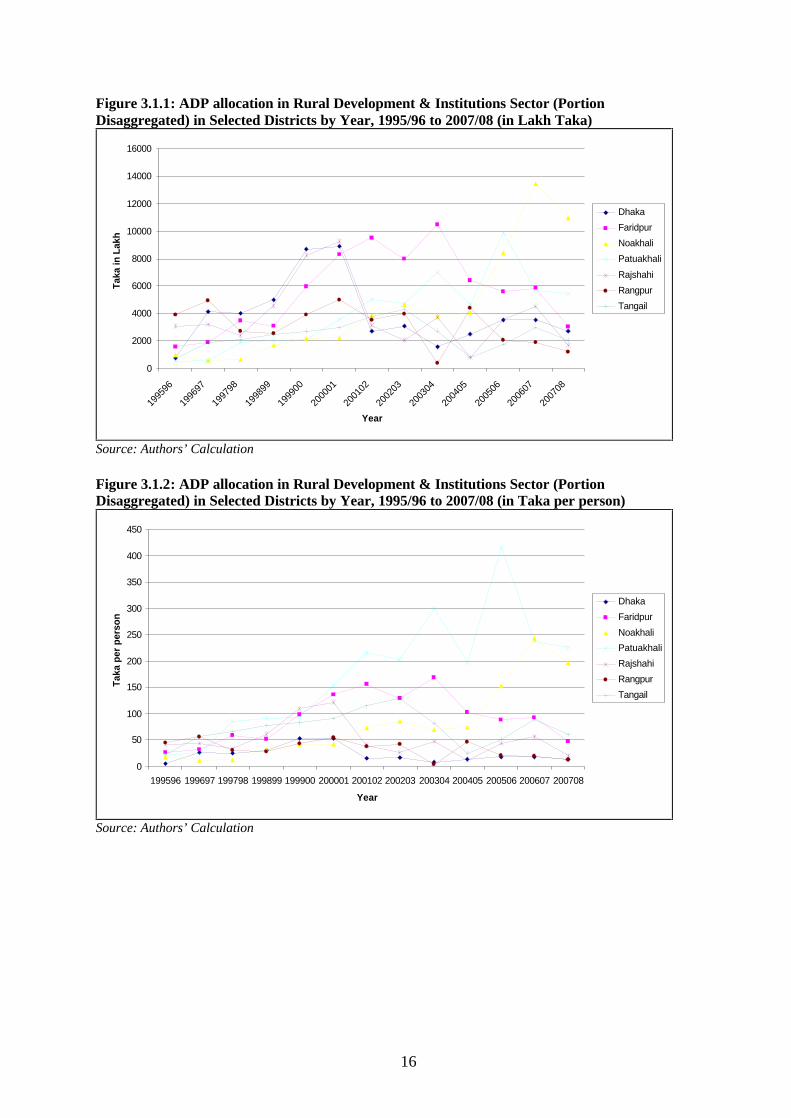
SECTION 3.2: ADP IN ROAD TRANSPORT
Bangladesh currently has an extensive network of road transport. According to the World Bank
website information, the total length of roads in the country is 239,226 kilometers, of which
22,378 kilometers are classified as “main” roads (including 3,723 kilometers of National
Highways roads), an additional 81,670 kilometers are “classified rural roads” and the remaining
135,178 kilometers are “other rural roads”. With regards to road density, there are 2 kilometers of
roads per 1,000 people and 1,662 kilometers of roads per 1,000 square kilometers of land (see
Table 3.2.1 for overall national roads and highways figures).
The importance of the road transport sub-sector has been properly recognized in the
government policy documents (see the PRSP Draft Report, 2005). Traditionally the
Government’s transport strategy has been to support economic development by expanding
linkages in the internal transport system and to promote local market integration, particularly in
the rural areas (PER, 2003, pp. 87). One success story of the road transport sub-sector is that this
extensive rural road network system has contributed significantly to growth and poverty
reduction by diffusing agricultural technology and raising agricultural productivity and enhancing
economic activity (leading to higher wages and employment) and lowering transport costs-- at the
same time, road construction had had a direct employment creation effect as a large number of
rural roads were constructed under the Food-for-Work and other labor-intensive rural
development initiatives. On the other hand, the road transport system has faced challenges in the
form of low level of repair and maintenance as well as poor overall conditions, resulting from
Table 3.2.1: Length of RHD Road Network as per road type (length in kilometers) Survey Year National Regional Feeder Type A Total
1996 2862 1565 15860 20287 1997 3144 1746 15964 20854 1998 3090 1752 15117 20959 1999 3086 1751 15962 20799 2000 3086 1751 15962 20799 2001 3086 1751 15962 20799 2002 3086 1751 15962 20799 2003 3086 1751 15962 20799 2004 3086 1751 15962 20799 2005 3529 4127 13125 20782 2006 3529 4127 13126 20782
Note: (a) Roads constructed and maintained by municipalities, district councils and other local bodies not included. (b) width of different roads by category-- national 7.32 meter, regional 5.49 meter, and feeder type A 3.66 meter, (c) Roads and Highways Department data.
Source: Bangladesh Statistical Yearbook, BBS (Years 2001 and 2006)
19
dependence on labor-intensive road construction technologies rather than more advanced
engineering techniques (op. cit.).
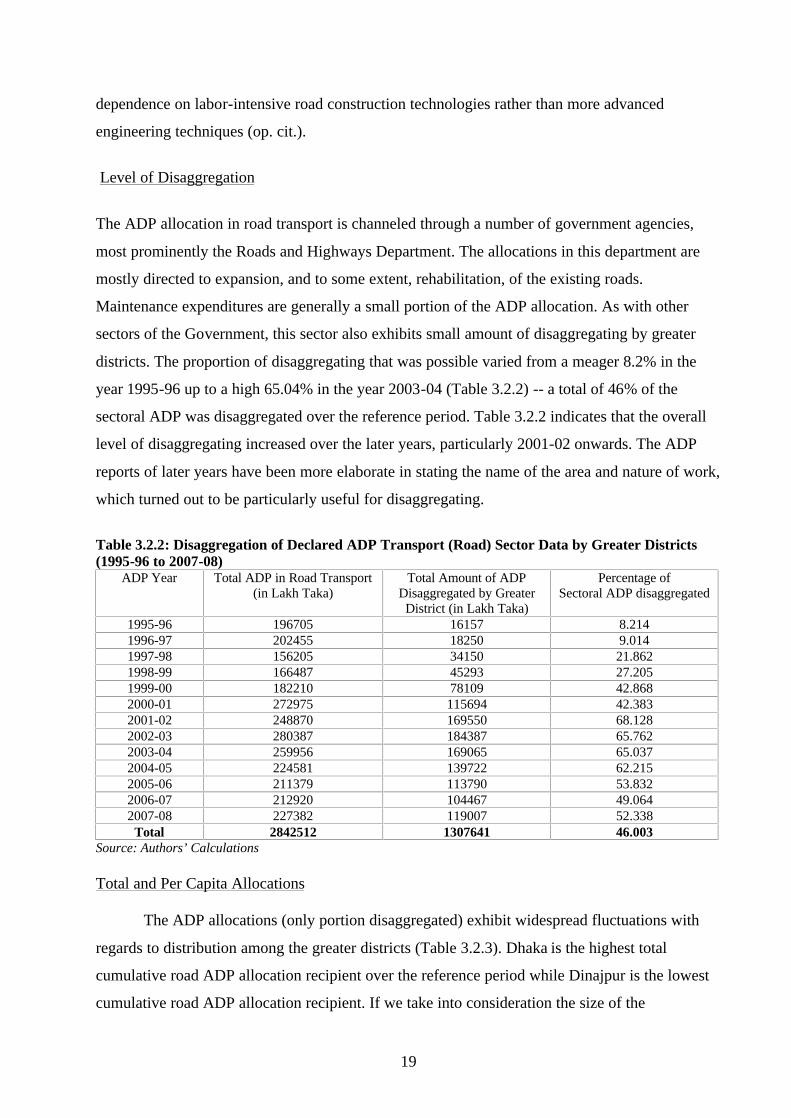
Level of Disaggregation
The ADP allocation in road transport is channeled through a number of government agencies,
most prominently the Roads and Highways Department. The allocations in this department are
mostly directed to expansion, and to some extent, rehabilitation, of the existing roads.
Maintenance expenditures are generally a small portion of the ADP allocation. As with other
sectors of the Government, this sector also exhibits small amount of disaggregating by greater
districts. The proportion of disaggregating that was possible varied from a meager 8.2% in the
year 1995-96 up to a high 65.04% in the year 2003-04 (Table 3.2.2) -- a total of 46% of the
sectoral ADP was disaggregated over the reference period. Table 3.2.2 indicates that the overall
level of disaggregating increased over the later years, particularly 2001-02 onwards. The ADP
reports of later years have been more elaborate in stating the name of the area and nature of work,
which turned out to be particularly useful for disaggregating.
Table 3.2.2: Disaggregation of Declared ADP Transport (Road) Sector Data by Greater Districts (1995-96 to 2007-08)
ADP Year Total ADP in Road Transport (in Lakh Taka)
Total Amount of ADP Disaggregated by Greater
District (in Lakh Taka)
Percentage of Sectoral ADP disaggregated
1995-96 196705 16157 8.214 1996-97 202455 18250 9.014 1997-98 156205 34150 21.862 1998-99 166487 45293 27.205 1999-00 182210 78109 42.868 2000-01 272975 115694 42.383 2001-02 248870 169550 68.128 2002-03 280387 184387 65.762 2003-04 259956 169065 65.037 2004-05 224581 139722 62.215 2005-06 211379 113790 53.832 2006-07 212920 104467 49.064 2007-08 227382 119007 52.338
Total 2842512 1307641 46.003 Source: Authors’ Calculations
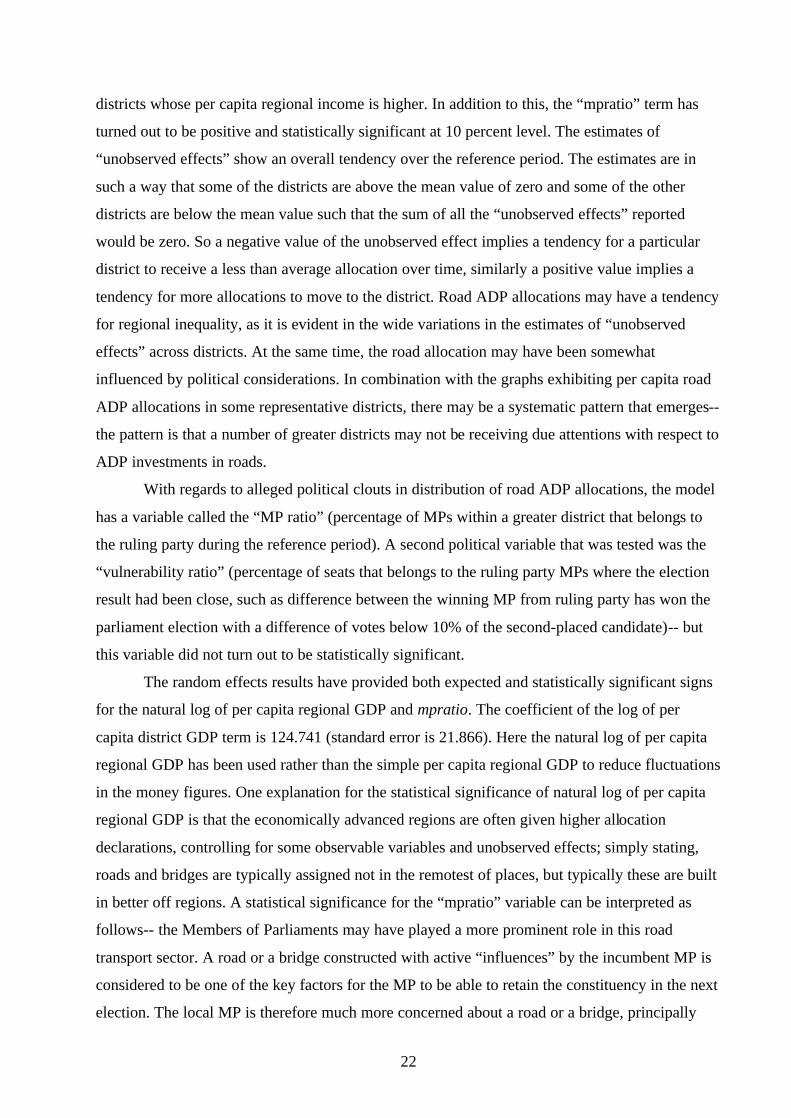
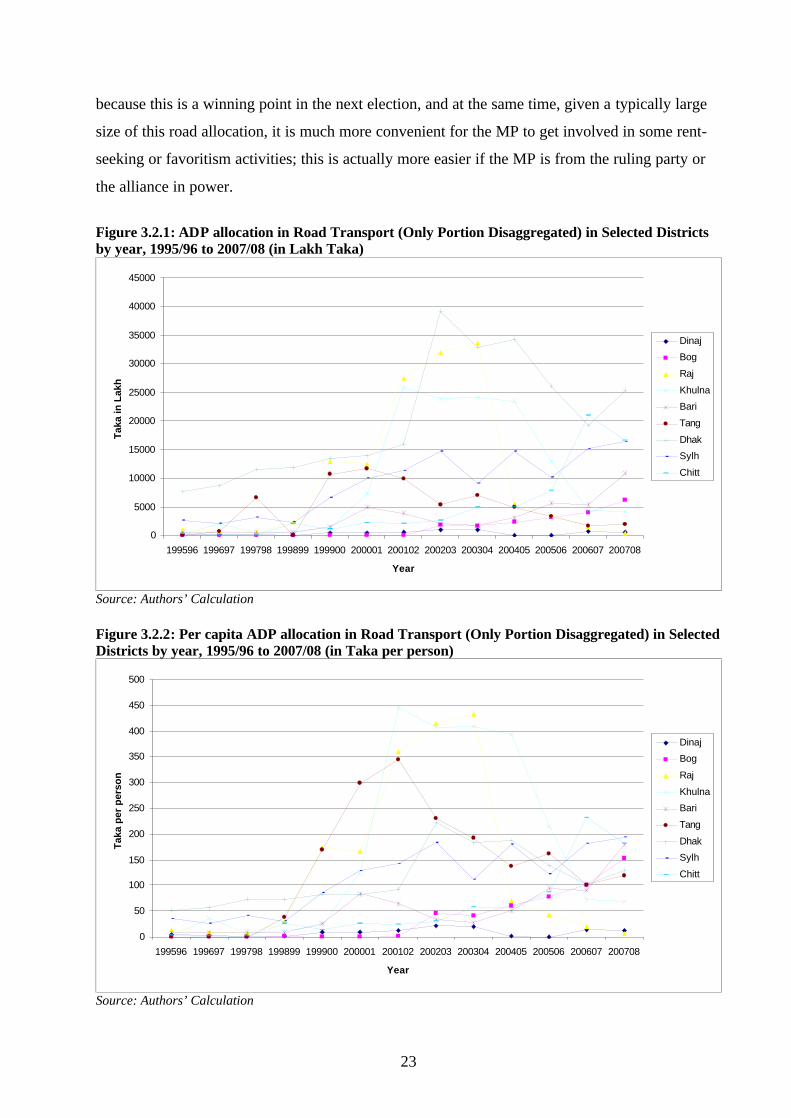
Total and Per Capita Allocations
The ADP allocations (only portion disaggregated) exhibit widespread fluctuations with
regards to distribution among the greater districts (Table 3.2.3). Dhaka is the highest total
cumulative road ADP allocation recipient over the reference period while Dinajpur is the lowest
cumulative road ADP allocation recipient. If we take into consideration the size of the

20
population, Dhaka is replaced by Jamalpur in per capita terms. Dinajpur, Bogra, Jamalpur and
Noakhali are the lowest road transport ADP recipient districts, both in absolute terms as well as
in the per capita terms. The wide fluctuations of road transport ADP declarations to the greater
districts are exhibited in Figure 3.2.1 and Figure 3.2.2, in total cumulative and per capita
cumulative terms respectively. One interesting point is that a politically distinguishable greater
district Bogra received very little amount in ADP road transport allocation disaggregations during
the late 2000s, but has recovered moderately during the early 2000s.
Table 3.2.3: Ranking of Districts in terms of Road ADP (portion disaggregated), 1995-96 to 2007-08, declared (total, cumulative)
Ranking District Adproad
(Lakh Taka) District Adproadpc
(Taka per capita) 1 Dhaka 260149.9 Jamalpur 3020.505 2 Rajshahi 133897 Khulna 2218.742 3 Khulna 130508 Tangail 1790.694 4 Sylhet 117997 Rajshahi 1745.447 5 Comilla 76640 Pabna 1496.261 6 Pabna 72359.5 Dhaka 1473.42 7 Chittagong 65629.5 Kushtia 1462.687 8 Jamalpur 63661.4 Sylhet 1458.023 9 Tangail 59337.4 Patuakhali 1420.718 10 Jessore 50505.67 Jessore 891.0286 11 Kushtia 49889.67 Comilla 820.5142 12 Rangpur 45759 Chittagong 740.8918 13 Barisal 40357 Barisal 679.7902 14 Patuakhali 33257 Faridpur 498.2723 15 Faridpur 30522.9 Rangpur 492.6663 16 Noakhali 19822 Bogra 481.4109 17 Bogra 19131 Noakhali 365.4874 18 Mymensingh 6667.4 Dinajpur 108.0952 19 Dinajpur 5146.5 Mymensingh 62.89637
Source: Authors’ Calculations
Now, referring to Figures 3.2.2 and 3.2.3, we find that, while some districts have received
fluctuating ADP allocations, other districts, most notably, Dhaka, has always been receiving a
substantial and yet stable ADP road allocation designated to it by name. Both per capita ADP
figures and total ADP figures exhibited in the Figures indicate that the ADP allocations in this
highly important sub-sector has allocated resources among different districts in a disproportionate
manner (assuming the character of allocation does not substantially alter in the portion of ADP
that was not disaggregated).
21
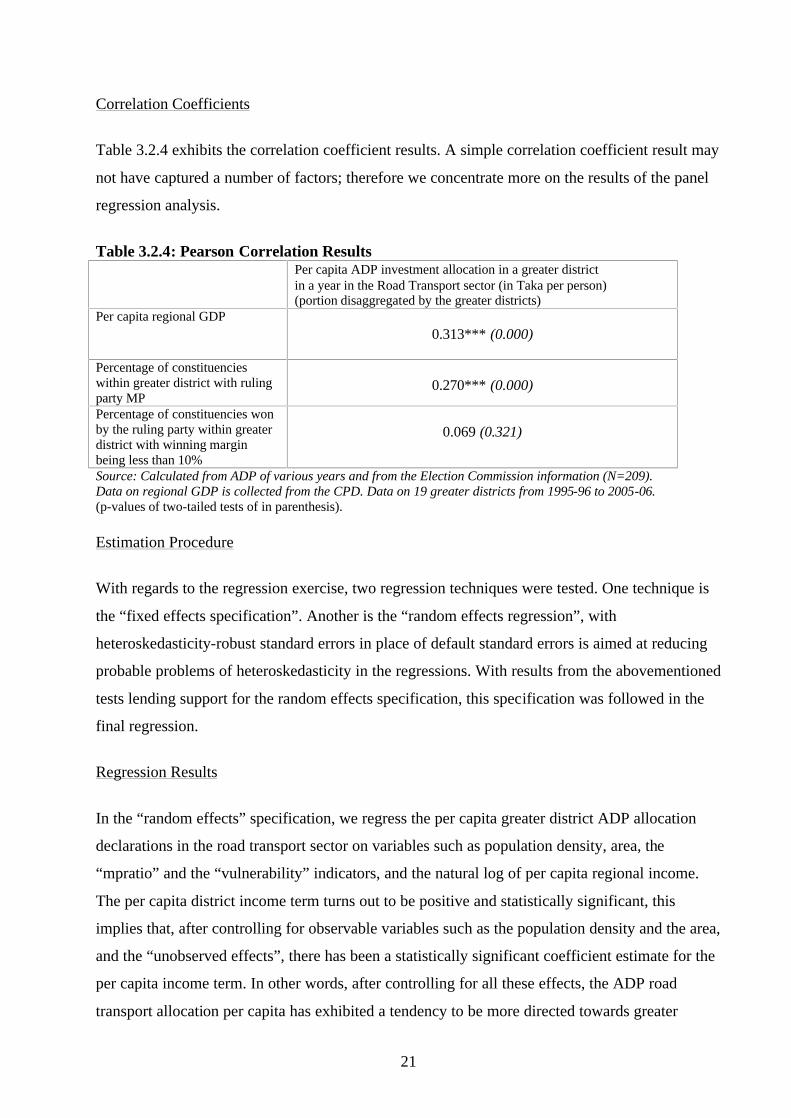
Correlation Coefficients
Table 3.2.4 exhibits the correlation coefficient results. A simple correlation coefficient result may
not have captured a number of factors; therefore we concentrate more on the results of the panel
regression analysis.
Table 3.2.4: Pearson Correlation Results Per capita ADP investment allocation in a greater district
in a year in the Road Transport sector (in Taka per person) (portion disaggregated by the greater districts)
Per capita regional GDP 0.313*** (0.000)
Percentage of constituencies within greater district with ruling party MP
0.270*** (0.000)
Percentage of constituencies won by the ruling party within greater district with winning margin being less than 10%
0.069 (0.321)
Source: Calculated from ADP of various years and from the Election Commission information (N=209). Data on regional GDP is collected from the CPD. Data on 19 greater districts from 1995-96 to 2005-06. (p-values of two-tailed tests of in parenthesis).
Estimation Procedure
With regards to the regression exercise, two regression techniques were tested. One technique is
the “fixed effects specification”. Another is the “random effects regression”, with
heteroskedasticity-robust standard errors in place of default standard errors is aimed at reducing
probable problems of heteroskedasticity in the regressions. With results from the abovementioned
tests lending support for the random effects specification, this specification was followed in the
final regression.
Regression Results
In the “random effects” specification, we regress the per capita greater district ADP allocation
declarations in the road transport sector on variables such as population density, area, the
“mpratio” and the “vulnerability” indicators, and the natural log of per capita regional income.
The per capita district income term turns out to be positive and statistically significant, this
implies that, after controlling for observable variables such as the population density and the area,
and the “unobserved effects”, there has been a statistically significant coefficient estimate for the
per capita income term. In other words, after controlling for all these effects, the ADP road
transport allocation per capita has exhibited a tendency to be more directed towards greater
22
districts whose per capita regional income is higher. In addition to this, the “mpratio” term has
turned out to be positive and statistically significant at 10 percent level. The estimates of
“unobserved effects” show an overall tendency over the reference period. The estimates are in
such a way that some of the districts are above the mean value of zero and some of the other
districts are below the mean value such that the sum of all the “unobserved effects” reported
would be zero. So a negative value of the unobserved effect implies a tendency for a particular
district to receive a less than average allocation over time, similarly a positive value implies a
tendency for more allocations to move to the district. Road ADP allocations may have a tendency
for regional inequality, as it is evident in the wide variations in the estimates of “unobserved
effects” across districts. At the same time, the road allocation may have been somewhat
influenced by political considerations. In combination with the graphs exhibiting per capita road
ADP allocations in some representative districts, there may be a systematic pattern that emerges--
the pattern is that a number of greater districts may not be receiving due attentions with respect to
ADP investments in roads.
With regards to alleged political clouts in distribution of road ADP allocations, the model
has a variable called the “MP ratio” (percentage of MPs within a greater district that belongs to
the ruling party during the reference period). A second political variable that was tested was the
“vulnerability ratio” (percentage of seats that belongs to the ruling party MPs where the election
result had been close, such as difference between the winning MP from ruling party has won the
parliament election with a difference of votes below 10% of the second-placed candidate)-- but
this variable did not turn out to be statistically significant.
The random effects results have provided both expected and statistically significant signs
for the natural log of per capita regional GDP and mpratio. The coefficient of the log of per
capita district GDP term is 124.741 (standard error is 21.866). Here the natural log of per capita
regional GDP has been used rather than the simple per capita regional GDP to reduce fluctuations
in the money figures. One explanation for the statistical significance of natural log of per capita
regional GDP is that the economically advanced regions are often given higher allocation
declarations, controlling for some observable variables and unobserved effects; simply stating,
roads and bridges are typically assigned not in the remotest of places, but typically these are built
in better off regions. A statistical significance for the “mpratio” variable can be interpreted as
follows-- the Members of Parliaments may have played a more prominent role in this road
transport sector. A road or a bridge constructed with active “influences” by the incumbent MP is
considered to be one of the key factors for the MP to be able to retain the constituency in the next
election. The local MP is therefore much more concerned about a road or a bridge, principally
23
because this is a winning point in the next election, and at the same time, given a typically large
size of this road allocation, it is much more convenient for the MP to get involved in some rent-
seeking or favoritism activities; this is actually more easier if the MP is from the ruling party or
the alliance in power.
Figure 3.2.1: ADP allocation in Road Transport (Only Portion Disaggregated) in Selected Districts by year, 1995/96 to 2007/08 (in Lakh Taka)
0
5000
10000
15000
20000
25000
30000
35000
40000
45000
199596 199697 199798 199899 199900 200001 200102 200203 200304 200405 200506 200607 200708
Year
Taka
in L
akh
DinajBog
Raj
KhulnaBari
Tang
DhakSylh
Chitt
Source: Authors’ Calculation
Figure 3.2.2: Per capita ADP allocation in Road Transport (Only Portion Disaggregated) in Selected Districts by year, 1995/96 to 2007/08 (in Taka per person)
0
50
100
150
200
250
300
350
400
450
500
199596 199697 199798 199899 199900 200001 200102 200203 200304 200405 200506 200607 200708
Year
Taka
per
per
son
DinajBog
Raj
KhulnaBari
Tang
DhakSylh
Chitt
Source: Authors’ Calculation

24
Table 3.2.5: Random Effects Regression Results with Robust Standard Errors of the Road Transport Sector (ADP Declared Allocation, 1995/96 to 2005/06) Dependent variable Per capita ADP investment allocation in a greater district in a year in the Road Transport sector (in Taka per person) (portion disaggregated by greater district)
Estimated Coefficients (Heteroskedasticity-robust
Standard Error)
p-value
Independent variables
Natural Log of Per capita District GDP (Tk.) 124.741***(21.866) 0.000
Population Density (Person/Sq. Km.) – 0.006 (0.017) 0.746
Area (Sq. Km.) – 0.002 (0.005) 0.644
% of Constituencies within Greater District with Ruling Party MP 0.317*(0.187) 0.090
Vulnerability Indicator of Constituencies within Greater District 0.011 (0.353) 0.976
Constant – 1136.127***(197.475) 0.000
Estimates of Random Effects
Dinajpur district – 58.517
Rangpur district – 4.238
Bogra district – 46.545
Rajshahi district 72.582
Pabna district 30.186
Kushtia district 40.560
Jessore district – 9.082
Khulna district 72.644
Barisal district – 29.368
Patuakhali district 23.202
Tangail district 79.721
Jamalpur district – 41.998
Mymensingh district – 10.116
Dhaka district – 31.299
Faridpur district – 7.926
Sylhet district 30.239
Comilla district 5.511
Noakhali district – 34.313
Chittagong district – 81.244
Model Predicted Value(at Mean)
Predicted Value 78.036
Hausman test for comparison between fixed effects and random effects Chi-square= 4.82 Pr>chi-sq= 0.306
Breusch and Pagan Test Chi-square= 60.07 Pr>chi-sq= 0.000
Note: Number of Observations= 209; Model Utility: Wald Chi Sqr= 92.92 with Prob.>chi-sq= 0.000; R2 (within)= 0.195, (between)= 0.067, (overall)= 0.144 Correlation (u_i, Xb)= assumed zero; sigma(e)= 79.105; sigma(u)=50.286 and rho (fraction of variance due to u_i)= 0.288 ***significant at 1% level, **significant at 5% level and *significant at 10% level
25
SECTION 3.3: HEALTH, POPULATION AND FAMILY WELFARE
Bangladesh has made substantial progress in the provision of Health care facilities over the years.
Bangladesh Public Expenditure Review (2003) reports that considerable improvement came
through investment in this sector-- infant mortality rate has declined, life expectancy has increase
by 14 years and spread of preventable diseases, such as polio and malaria, has been contained.
Many more challenges remain still; much less progress came in reducing malnutrition of children
and maternal mortality has remained very high.
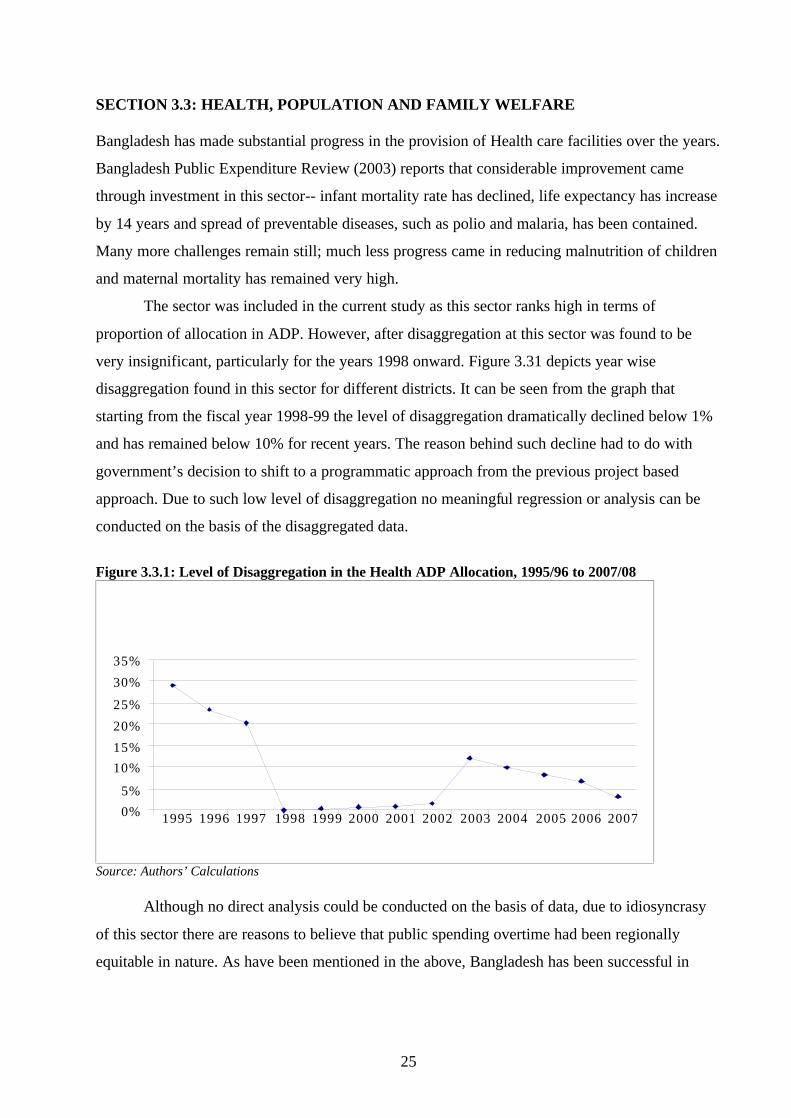
The sector was included in the current study as this sector ranks high in terms of
proportion of allocation in ADP. However, after disaggregation at this sector was found to be
very insignificant, particularly for the years 1998 onward. Figure 3.31 depicts year wise
disaggregation found in this sector for different districts. It can be seen from the graph that
starting from the fiscal year 1998-99 the level of disaggregation dramatically declined below 1%
and has remained below 10% for recent years. The reason behind such decline had to do with
government’s decision to shift to a programmatic approach from the previous project based
approach. Due to such low level of disaggregation no meaningful regression or analysis can be
conducted on the basis of the disaggregated data.
Figure 3.3.1: Level of Disaggregation in the Health ADP Allocation, 1995/96 to 2007/08
0% 5%
10% 15% 20% 25%
30% 35%
1995 1996 1997 1998 1999 2000 2001 2002 2003 2004 2005 2006 2007
Source: Authors’ Calculations Although no direct analysis could be conducted on the basis of data, due to idiosyncrasy
of this sector there are reasons to believe that public spending overtime had been regionally
equitable in nature. As have been mentioned in the above, Bangladesh has been successful in

26
containing many preventable diseases. Success in prevention in such cases would require equity
in spending; as otherwise constant migration would compromise success in any region.
The government has initiated a shift in the Health, Population and Family Welfare sector
from 1998 in which project based approach has been replaced with programmatic approach. The
Health and Population Sector Program (HPSP) aims at making changes which are Bangladesh
wide and therefore requires investment equitably at least at the Thana levels. However, if or not
equitable distribution in spending was achieved in reality can only be found through primary data
collection from the field level studies.
27
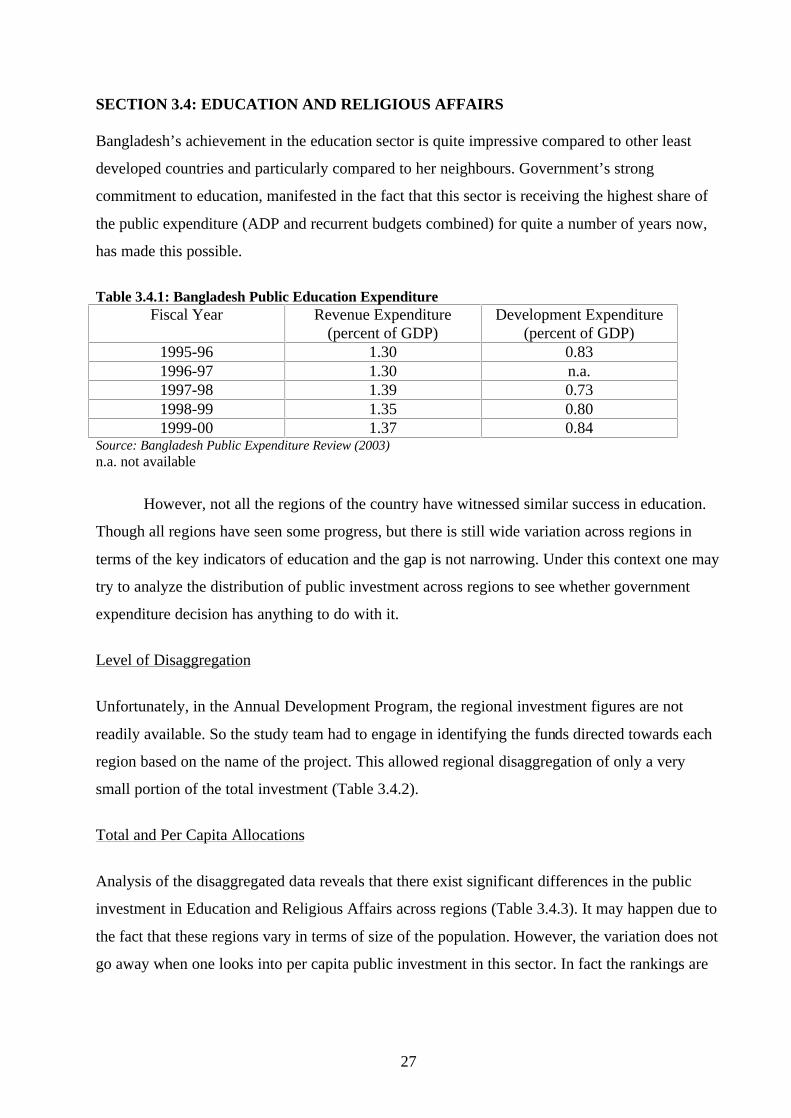
SECTION 3.4: EDUCATION AND RELIGIOUS AFFAIRS
Bangladesh’s achievement in the education sector is quite impressive compared to other least
developed countries and particularly compared to her neighbours. Government’s strong
commitment to education, manifested in the fact that this sector is receiving the highest share of
the public expenditure (ADP and recurrent budgets combined) for quite a number of years now,
has made this possible.
Table 3.4.1: Bangladesh Public Education Expenditure Fiscal Year Revenue Expenditure
(percent of GDP) Development Expenditure
(percent of GDP) 1995-96 1.30 0.83 1996-97 1.30 n.a. 1997-98 1.39 0.73 1998-99 1.35 0.80 1999-00 1.37 0.84
Source: Bangladesh Public Expenditure Review (2003) n.a. not available
However, not all the regions of the country have witnessed similar success in education.
Though all regions have seen some progress, but there is still wide variation across regions in
terms of the key indicators of education and the gap is not narrowing. Under this context one may
try to analyze the distribution of public investment across regions to see whether government
expenditure decision has anything to do with it.
Level of Disaggregation
Unfortunately, in the Annual Development Program, the regional investment figures are not
readily available. So the study team had to engage in identifying the funds directed towards each
region based on the name of the project. This allowed regional disaggregation of only a very
small portion of the total investment (Table 3.4.2).
Total and Per Capita Allocations
Analysis of the disaggregated data reveals that there exist significant differences in the public
investment in Education and Religious Affairs across regions (Table 3.4.3). It may happen due to
the fact that these regions vary in terms of size of the population. However, the variation does not
go away when one looks into per capita public investment in this sector. In fact the rankings are
28
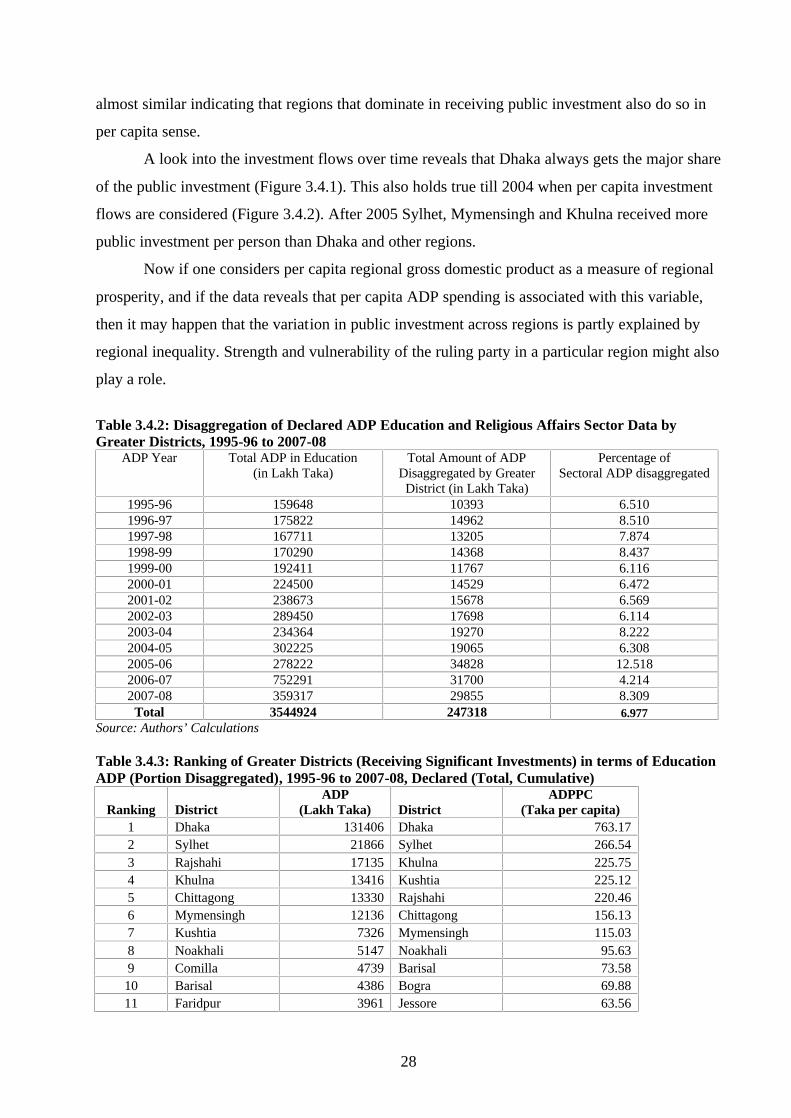
almost similar indicating that regions that dominate in receiving public investment also do so in
per capita sense.
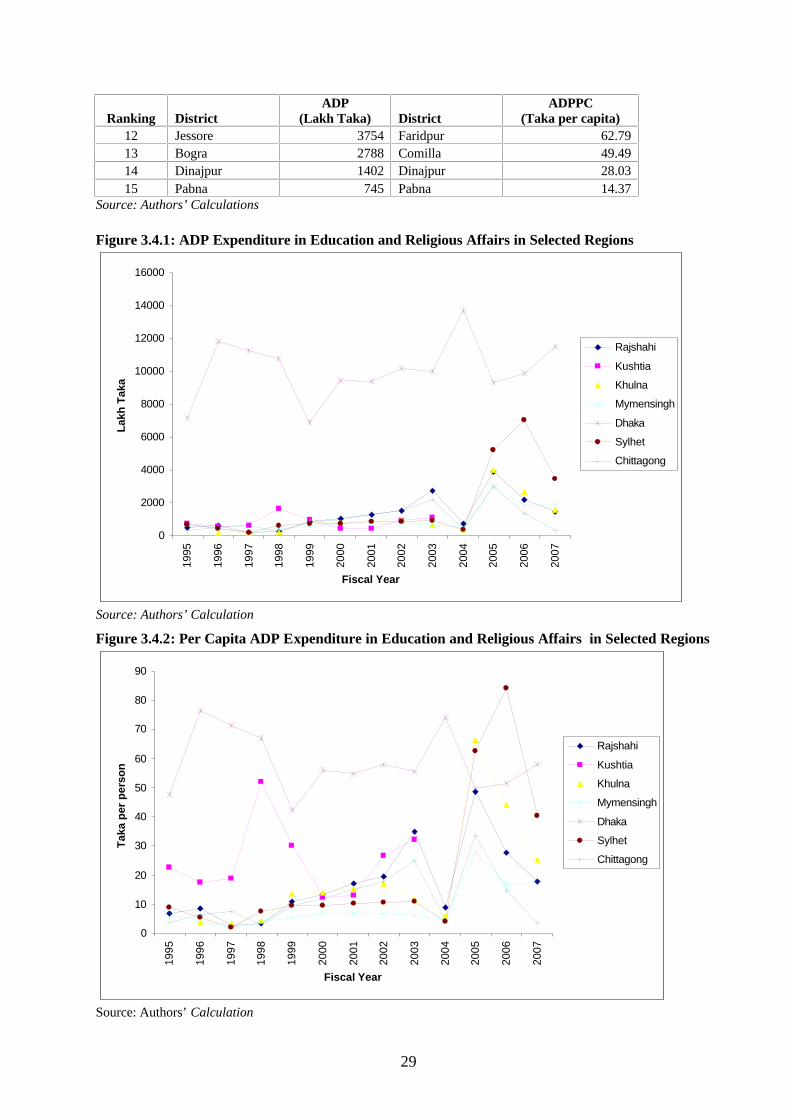
A look into the investment flows over time reveals that Dhaka always gets the major share
of the public investment (Figure 3.4.1). This also holds true till 2004 when per capita investment
flows are considered (Figure 3.4.2). After 2005 Sylhet, Mymensingh and Khulna received more
public investment per person than Dhaka and other regions.
Now if one considers per capita regional gross domestic product as a measure of regional
prosperity, and if the data reveals that per capita ADP spending is associated with this variable,
then it may happen that the variation in public investment across regions is partly explained by
regional inequality. Strength and vulnerability of the ruling party in a particular region might also
play a role.
Table 3.4.2: Disaggregation of Declared ADP Education and Religious Affairs Sector Data by Greater Districts, 1995-96 to 2007-08
ADP Year Total ADP in Education (in Lakh Taka)
Total Amount of ADP Disaggregated by Greater
District (in Lakh Taka)
Percentage of Sectoral ADP disaggregated
1995-96 159648 10393 6.510 1996-97 175822 14962 8.510 1997-98 167711 13205 7.874 1998-99 170290 14368 8.437 1999-00 192411 11767 6.116 2000-01 224500 14529 6.472 2001-02 238673 15678 6.569 2002-03 289450 17698 6.114 2003-04 234364 19270 8.222 2004-05 302225 19065 6.308 2005-06 278222 34828 12.518 2006-07 752291 31700 4.214 2007-08 359317 29855 8.309
Total 3544924 247318 6.977 Source: Authors’ Calculations Table 3.4.3: Ranking of Greater Districts (Receiving Significant Investments) in terms of Education ADP (Portion Disaggregated), 1995-96 to 2007-08, Declared (Total, Cumulative)
Ranking District ADP
(Lakh Taka) District ADPPC
(Taka per capita) 1 Dhaka 131406 Dhaka 763.17 2 Sylhet 21866 Sylhet 266.54 3 Rajshahi 17135 Khulna 225.75 4 Khulna 13416 Kushtia 225.12 5 Chittagong 13330 Rajshahi 220.46 6 Mymensingh 12136 Chittagong 156.13 7 Kushtia 7326 Mymensingh 115.03 8 Noakhali 5147 Noakhali 95.63 9 Comilla 4739 Barisal 73.58 10 Barisal 4386 Bogra 69.88 11 Faridpur 3961 Jessore 63.56
29
Ranking District ADP
(Lakh Taka) District ADPPC
(Taka per capita) 12 Jessore 3754 Faridpur 62.79 13 Bogra 2788 Comilla 49.49 14 Dinajpur 1402 Dinajpur 28.03 15 Pabna 745 Pabna 14.37
Source: Authors’ Calculations
Figure 3.4.1: ADP Expenditure in Education and Religious Affairs in Selected Regions
0
2000
4000
6000
8000
10000
12000
14000
16000
1995
1996
1997
1998
1999
2000
2001
2002
2003
2004
2005
2006
2007
Fiscal Year
Lakh
Tak
a
Rajshahi
Kushtia
Khulna
Mymensingh
Dhaka
Sylhet
Chittagong
Source: Authors’ Calculation Figure 3.4.2: Per Capita ADP Expenditure in Education and Religious Affairs in Selected Regions
0
10
20
30
40
50
60
70
80
90
1995
1996
1997
1998
1999
2000
2001
2002
2003
2004
2005
2006
2007
Fiscal Year
Taka
per
per
son
Rajshahi
Kushtia
Khulna
Mymensingh
Dhaka
Sylhet
Chittagong
Source: Authors’ Calculation
30
Correlation Coefficients
The results (Table 3.4.4) do indicate that the association between per capita ADP spending in this
sector and per capita regional gross domestic product is moderate and positive and it is significant
as well. The association between per capita ADP spending with percentage of constituencies in a
region won by ruling party turns out to be very small and positive but this association is not
significant. Vulnerability of the ruling party measured as percentage of seats won by the ruling
party in a region where the victory margin is less than 10%, does not have any association with
per capita ADP spending.
Table 3.4.4: Pearson Correlation Results Per capita ADP investment allocation in a greater district
in a year in the education and religious affairs sector (portion disaggregated by greater district)
Per capita regional GDP 0.684*** (0.000)
Percentage of constituencies within greater district with ruling party MP
0.112 (0.106)
Percentage of constituencies won by the ruling party within greater district with winning margin being less than 10%
-0.032 (0.647)
Source: Calculated from ADP of various years, and from election commission reports (N=209). Data on ADP allocation from 1995-96 to 2005-06. (p-values of two-tailed test in parenthesis)
Estimation Procedure
As per the methodology, regression of the regional variation in per capita ADP investment on the
per capita regional GDP, population density, area of the greater district, percentage of
constituencies within greater district with ruling party MP, and the “vulnerability indicator”
(percentage of the constituencies within the greater district won by the ruling party but by a
margin of votes less than ten percent) was carried out. Heteroscedasticity-consistent standard
errors were used. Random effects specification was selected instead of fixed effects specification.
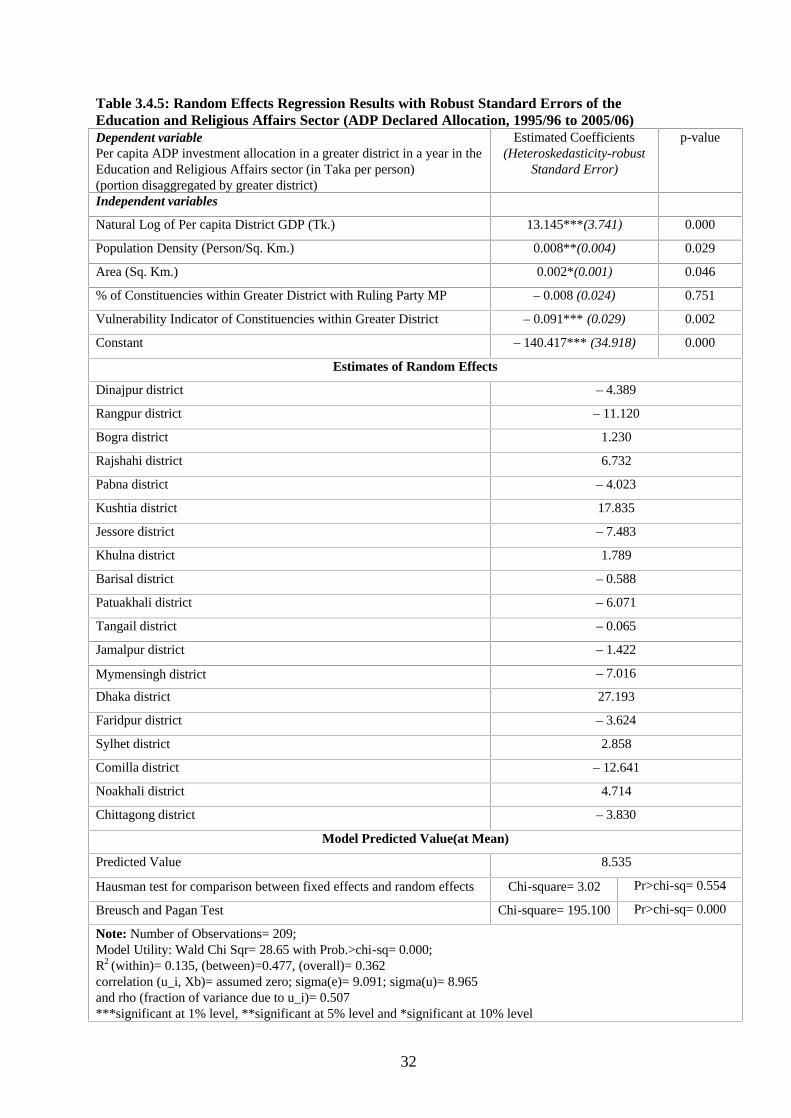
Regression Results
The results indicate that the pool of independent variables do explain the variation in the
dependent variable (Table 3.4.5). The constant term and the coefficients of the vulnerability
indicator of constituencies with the region and natural log of per capita district GDP turn out to
31
be significant at 1% level and the coefficients of population density and area are significant at 5%
level. The sign of the coefficient of per capita GDP is positive which indicate that regions with
higher level of per capita GDP tend to receive more public investment per person. The negative
relationship as seen from the result between the dependent variable and the vulnerability indicator
is not expected and as seen the coefficient is not economically significant. Dhaka and Kushtia are
the two regions that receive significantly more public investment than the average and for
Rangpur it is just the opposite. However, one has to be very cautious in interpreting these results
as the analysis is carried out using a very small percent of the total spending and the estimation
may suffer from omitted variable bias.
32
Table 3.4.5: Random Effects Regression Results with Robust Standard Errors of the Education and Religious Affairs Sector (ADP Declared Allocation, 1995/96 to 2005/06) Dependent variable Per capita ADP investment allocation in a greater district in a year in the Education and Religious Affairs sector (in Taka per person) (portion disaggregated by greater district)
Estimated Coefficients (Heteroskedasticity-robust
Standard Error)
p-value
Independent variables
Natural Log of Per capita District GDP (Tk.) 13.145***(3.741) 0.000
Population Density (Person/Sq. Km.) 0.008**(0.004) 0.029
Area (Sq. Km.) 0.002*(0.001) 0.046
% of Constituencies within Greater District with Ruling Party MP – 0.008 (0.024) 0.751
Vulnerability Indicator of Constituencies within Greater District – 0.091*** (0.029) 0.002
Constant – 140.417*** (34.918) 0.000
Estimates of Random Effects
Dinajpur district – 4.389
Rangpur district – 11.120
Bogra district 1.230
Rajshahi district 6.732
Pabna district – 4.023
Kushtia district 17.835
Jessore district – 7.483
Khulna district 1.789
Barisal district – 0.588
Patuakhali district – 6.071
Tangail district – 0.065
Jamalpur district – 1.422
Mymensingh district – 7.016
Dhaka district 27.193
Faridpur district – 3.624
Sylhet district 2.858
Comilla district – 12.641
Noakhali district 4.714
Chittagong district – 3.830
Model Predicted Value(at Mean)
Predicted Value 8.535
Hausman test for comparison between fixed effects and random effects Chi-square= 3.02 Pr>chi-sq= 0.554
Breusch and Pagan Test Chi-square= 195.100 Pr>chi-sq= 0.000
Note: Number of Observations= 209; Model Utility: Wald Chi Sqr= 28.65 with Prob.>chi-sq= 0.000; R2 (within)= 0.135, (between)=0.477, (overall)= 0.362 correlation (u_i, Xb)= assumed zero; sigma(e)= 9.091; sigma(u)= 8.965 and rho (fraction of variance due to u_i)= 0.507 ***significant at 1% level, **significant at 5% level and *significant at 10% level

33
SECTION 4: CONCLUSION AND RECOMMENDATIONS
The following are the concluding points for this study.
(1) The share of ADP investment figures that can be disaggregated by regions turns out to
be on the lower side and in some instances very low for the sectors considered. Actually, this task
is quite challenging given the nature of the public documents, which are not user friendly. The
citizens of the country requires better access to information regarding public expenditure
allocation to be able to better understand the functioning of the government and its contribution
to their economic well-being.
(2) The study requires further investigation into the issue at hand. It seems that one needs
go to different ministries, go through their year-to-year project documents that were included in
the ADP and then come up with a better data set. But this requires a more extensive data
collection phase, which the present study could not do.
(3) The limited data set does indicate that these investment numbers are substantially high
for Dhaka. However, once adjusted for population, the difference becomes moderate in all the
sectors. This may imply that public expenditure allocation in Bangladesh has some in-built
regional inequality features that, if not addressed properly, may have adverse consequences for
the homogenous development of the country in the long run.

34
BIBLIOGRAPHY (1) Ahmed, Sadiq, “The Political Economy of Development Experience in Bangladesh”, Chapter 5, pp.
93-147, in Ahmed, Sadiq and Wahiduddin Mahmud, eds., “Growth and Poverty: The Development Experience in Bangladesh”. The University Press Limited, Dhaka, 2006
(2) Atlas, Cary M., et. al, “Slicing the Federal Government Net Spending Pie: Who Wins, Who Loses
and Why”. American Economic Review, 85 (3). June 1995 (3) Bangladesh Bureau of Statistics, “----- Yearbook of Agricultural Statistics of Bangladesh”.
Bangladesh Bureau of Statistics, Planning Division, Ministry of Planning, Government of the People’s Republic of Bangladesh. (Various Years)
(4) --------------------------------------, “----- Statistical Yearbook of Bangladesh”. Bangladesh Bureau of
Statistics, Planning Division, Ministry of Planning, Government of the People’s Republic of Bangladesh. (Various Years)
(5) --------------------------------------, “Preliminary Report on Household Income and Expenditure
Survey-2005”. Bangladesh Bureau of Statistics, Planning Division, Ministry of Planning, Government of the People’s Republic of Bangladesh. September 2006
(6) Evers, Barbara and Kaniz Siddique, eds., “Who Gets What: A Gender Analysis of Public
Expenditure in Bangladesh.” The University Press Limited, Dhaka. 2006 (7) Furuoka, Fumitaka, “Panel Data Analysis of ‘Export-led Growth’ hypothesis in ASEAN”. Munich
Personal RePEc Archive. Unpublished. Munich, November 2007 (8) Government of People’s Republic of Bangladesh, “Bangladesh Arthonaitik Samikkha 2007” (in
Bangla). Economic Adivising Cell, Finance Division, Ministry of Finance. June 2007 (9) ----------------------------------------------------------, “Unlocking the Potential National Strategy for
Accelerated Poverty Reduction”. General Economics Division, Planning Commission, Government of People’s Republic of Bangladesh. Draft Version. December 2004
(10) Greene, William H., “Econometric Analysis”. Fourth Edition. Prentice Hall. New Jersey 2000 (11) Gupta, S., H. Davoodi and R. Alonso-Terme, “Does Corruption Affect Income Inequality and
Poverty?” IMF Working Paper 98/76, Washington D.C., International Monetary Fund, 1998 (12) Kapoor, Kapil, Gregory Kisunko and Aminur Rahman, “Bangladesh: Combating Corruption”,
Chapter 11, pp. 267-298, in Hossain, Akhtar, Farida Khan and Tanweer Akram, eds., “Economic Analyses of Contemporary Issues in Bangladesh”. The University Press Limited, Dhaka, 2006
(13) Keefer, Philip and Stuti Khemani, “Democracy, Public Expenditures, and the Poor: Understanding
Political Incentives for Providing Public Services”. The World Bank Research Observer, 20(1), Spring 2005
(14) Loehman, Edna and Robert Emerson, “A Simultaneous Equation Model of Local Government
Expenditure Decisions”. Land Economics, 61 (4), November, 1985 (15) Mahmud, Wahiduddin, “National Budgets and Public Spending Patterns in Bangladesh: A Political
Economy Perspective”. Professor M.N. Huda Memorial Lecture, Paper presented at the Fourteenth Biennial Conference of the Bangladesh Economic Association, held in September 2002, Dhaka and in Bangladesh Journal of Political Economy, 17 (2), pp. 57-92, December 2002
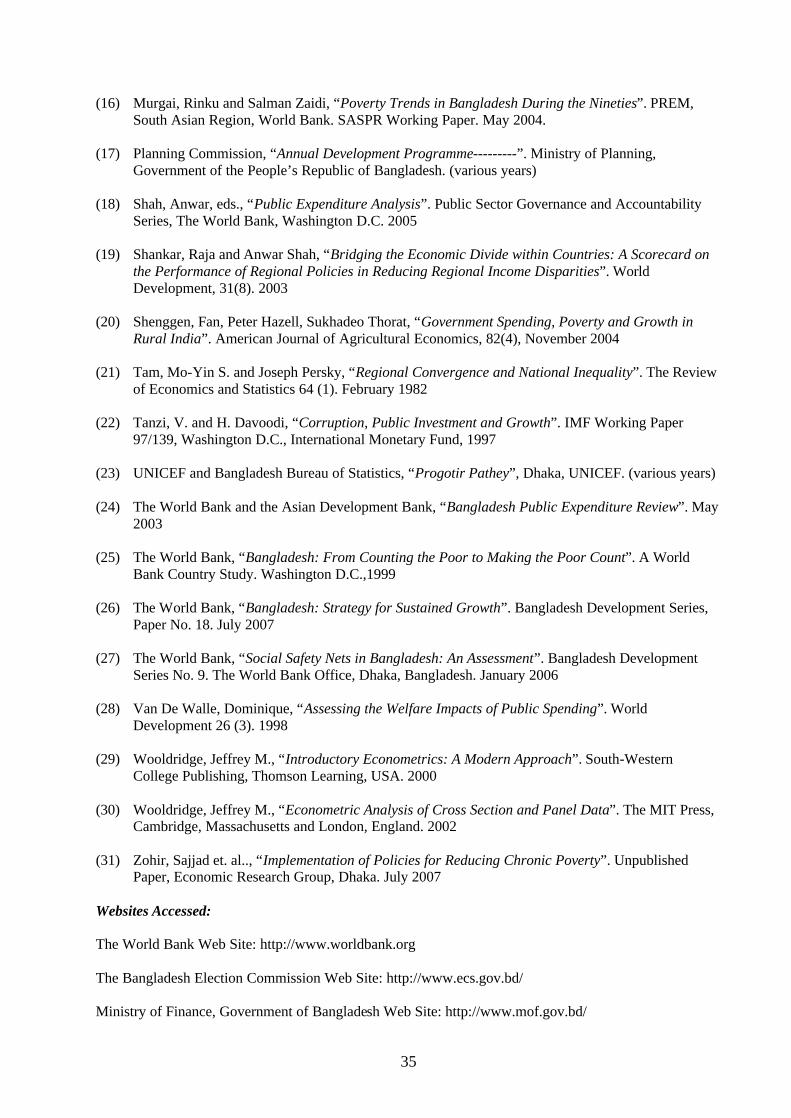
35
(16) Murgai, Rinku and Salman Zaidi, “Poverty Trends in Bangladesh During the Nineties”. PREM, South Asian Region, World Bank. SASPR Working Paper. May 2004.
(17) Planning Commission, “Annual Development Programme---------”. Ministry of Planning,
Government of the People’s Republic of Bangladesh. (various years) (18) Shah, Anwar, eds., “Public Expenditure Analysis”. Public Sector Governance and Accountability
Series, The World Bank, Washington D.C. 2005 (19) Shankar, Raja and Anwar Shah, “Bridging the Economic Divide within Countries: A Scorecard on
the Performance of Regional Policies in Reducing Regional Income Disparities”. World Development, 31(8). 2003
(20) Shenggen, Fan, Peter Hazell, Sukhadeo Thorat, “Government Spending, Poverty and Growth in
Rural India”. American Journal of Agricultural Economics, 82(4), November 2004 (21) Tam, Mo-Yin S. and Joseph Persky, “Regional Convergence and National Inequality”. The Review
of Economics and Statistics 64 (1). February 1982 (22) Tanzi, V. and H. Davoodi, “Corruption, Public Investment and Growth”. IMF Working Paper
97/139, Washington D.C., International Monetary Fund, 1997 (23) UNICEF and Bangladesh Bureau of Statistics, “Progotir Pathey”, Dhaka, UNICEF. (various years) (24) The World Bank and the Asian Development Bank, “Bangladesh Public Expenditure Review”. May
2003 (25) The World Bank, “Bangladesh: From Counting the Poor to Making the Poor Count”. A World
Bank Country Study. Washington D.C.,1999 (26) The World Bank, “Bangladesh: Strategy for Sustained Growth”. Bangladesh Development Series,
Paper No. 18. July 2007 (27) The World Bank, “Social Safety Nets in Bangladesh: An Assessment”. Bangladesh Development
Series No. 9. The World Bank Office, Dhaka, Bangladesh. January 2006 (28) Van De Walle, Dominique, “Assessing the Welfare Impacts of Public Spending”. World
Development 26 (3). 1998 (29) Wooldridge, Jeffrey M., “Introductory Econometrics: A Modern Approach”. South-Western
College Publishing, Thomson Learning, USA. 2000 (30) Wooldridge, Jeffrey M., “Econometric Analysis of Cross Section and Panel Data”. The MIT Press,
Cambridge, Massachusetts and London, England. 2002 (31) Zohir, Sajjad et. al.., “Implementation of Policies for Reducing Chronic Poverty”. Unpublished
Paper, Economic Research Group, Dhaka. July 2007 Websites Accessed: The World Bank Web Site: http://www.worldbank.org The Bangladesh Election Commission Web Site: http://www.ecs.gov.bd/ Ministry of Finance, Government of Bangladesh Web Site: http://www.mof.gov.bd/

36
Annex
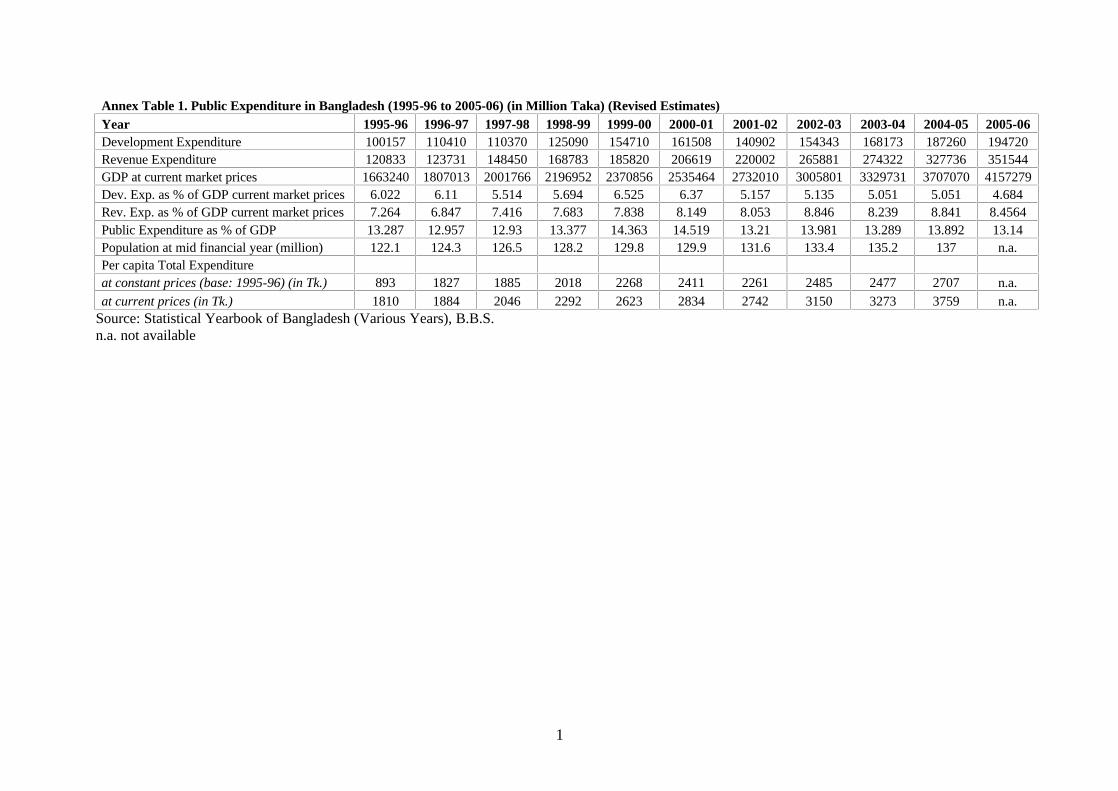
1
Annex Table 1. Public Expenditure in Bangladesh (1995-96 to 2005-06) (in Million Taka) (Revised Estimates) Year 1995-96 1996-97 1997-98 1998-99 1999-00 2000-01 2001-02 2002-03 2003-04 2004-05 2005-06 Development Expenditure 100157 110410 110370 125090 154710 161508 140902 154343 168173 187260 194720 Revenue Expenditure 120833 123731 148450 168783 185820 206619 220002 265881 274322 327736 351544 GDP at current market prices 1663240 1807013 2001766 2196952 2370856 2535464 2732010 3005801 3329731 3707070 4157279 Dev. Exp. as % of GDP current market prices 6.022 6.11 5.514 5.694 6.525 6.37 5.157 5.135 5.051 5.051 4.684 Rev. Exp. as % of GDP current market prices 7.264 6.847 7.416 7.683 7.838 8.149 8.053 8.846 8.239 8.841 8.4564 Public Expenditure as % of GDP 13.287 12.957 12.93 13.377 14.363 14.519 13.21 13.981 13.289 13.892 13.14 Population at mid financial year (million) 122.1 124.3 126.5 128.2 129.8 129.9 131.6 133.4 135.2 137 n.a. Per capita Total Expenditure at constant prices (base: 1995-96) (in Tk.) 893 1827 1885 2018 2268 2411 2261 2485 2477 2707 n.a. at current prices (in Tk.) 1810 1884 2046 2292 2623 2834 2742 3150 3273 3759 n.a.
Source: Statistical Yearbook of Bangladesh (Various Years), B.B.S. n.a. not available

2
Annex Table 2. Bank Advances by Main Economic Purposes (1995-96 to 2005-06) (in Million Taka) Economic Purpose 1995-96 1996-97 1997-98 1998-99 1999-00 2000-01 2001-02 2002-03 2003-04 2004-05 2005-06 Agriculture, Fisheries & Forestry 64337.8 67399.3 69904.6 80378.6 86749.0 93147.7 96458.1 93401.1 98435.7 106746.4 113529.2 Industry (Other than Working Capital Financing) 97126.9 111738.8 141409.4 153524.2 168945.0 182454.0 180887.2 168951.5 183792.6 199521.9 244756.1 Working Capital Financing 39127.6 49486.2 50900.8 58036.9 51985.3 62088.3 98008.6 149718.9 174960.3 220689.1 257989.6 Construction 20491.5 24241.2 26214.0 31841.3 34064.6 39189.5 45725.5 56373.9 64262.8 74562.1 86684.7 Electricity, Gas, Water and Sanitary Services 1021.6 129.9 162.6 106.8 196.8 35.1 131.6 74.9 20.1 56.1 34.8 Transport & Communication 5271.3 6613.6 9457.3 7621.3 8172.8 9896.0 12653.8 12753.0 11646.2 13837.0 19595.2 Storage 4351.5 5243.2 7535.6 8481.4 9091.5 9872.1 9897.1 8691.8 8438.1 7493.0 9193.3 Trade 111141.9 120953.2 130003.5 146930.4 172240.4 203611.3 236070.2 278667.0 320261.0 394935.8 437604.4 Miscellaneous 28790.3 31940.2 41309.4 52914.9 62172.0 87486.1 87891.5 78709.0 89485.7 99180.0 122265.7 Total 371660.4 417645.6 479897.2 539835.8 593617.4 687780.1 767723.6 847341.1 951302.5 1117321.9 1291653.0 Source: Statistical Yearbook of Bangladesh (Various Years), B.B.S.
Copyright © 2022 FDOKUMEN