Pub 058 (1994) Detection of zones of abnormal strains in structures using Gaussian Curvature...
9
Detection of Zones of Abnormal Strains in Structures Using Gaussian Curvature Analysis! Whereas some folds, such as those produced by flexural slip, donot theoretically entail strain with- in the folded surfaces, any surface involving double curvature (such as domes and saddles) cannot form without some stretching or contraction of the bed- ding. Whether straining of the surfaces is required during folding depends on the three-dimensional fold shape and, in particular, on the Gaussian curva- ture at points on the folded surface.Using this as a basis, I present a method for detecting zones of anomalously high strain in oil-field structures from Gaussian curvature analysis(GCA) of natural struc- tures. The new method of GCA is suitable for ana- lyzing surfaces that have been mapped seismically. A Gaussian curvature map of the structure is a prin- cipal outcome of the analysis and can be used to predict the density of strain-related subseismic structures, such as small-scale fracturing. The Goose Egg dome, near Casper, Wyoming, is ana- lyzed and provides an example of GCA. In this structure, a relationship isobserved between frac- ture densities and Gaussian curvature. In recent years considerable effort has been devoted to developing techniques to predict vari- ous characteristics of fracture patterns in subsur- face hydrocarbon reservoirs. The characteristics of interest from the point of view of hydrocarbon migration and extraction includefrequency, size distribution, orientation, and interconnectivity of ©Copyright 1994. The American Association of Petroleum Geologists. All rights reserved. 'Manuscript received September 10, 1993; revised manuscript received June 16, 1994; final acceptance August 19, 1994. 2Laboratory for Strain Analysis, Department of Geology, University of Wales, Cardiff CFl 3YE, United Kingdom. This research was supported by Shell Research B.V., Rijswijk, Netherlands. I am grateful for the advice of Michael Naylor at Shell and Alan J. Ver Ploeg of the Geological Survey of Wyoming. The paper greatly benefited from thorough reviews from Kaspar J. Arbenz, Rick Groshong, Jerry J. Sweeney, and Kevin T. Biddle. fractures, as well as the variation of the properties both within and between stratigraphic units. This study is concerned with estimating the rela- tive frequency of fracturing spatially within individ- ual horizons using structural geometry as the basis of thisprediction. Several earlier studies (Harris et al., 1960; Narr, 1991) suggested a correlation between fracture density and location of the sam- ple sites within a large-scale fold structure. More specifically, Harris et al. (1960) attributed fracture density differences to different curvatures, Le., rates of change of bedding dip or strike around fold structures in Wyoming. Lisle (1988, 1992) presented a model in which fracturing was predicted on the basis of the curva- turepresent at points on a folded surface, although the curvature considered important is the double (or three-dimensional) type possessed by structures such as domes and basins and expressed quantita- tively by means of the Gaussian curvature. Accord- ing to the model, conclusions concerning the state of strain in folded surface can be drawn on the basis of variation of Gaussian curvature across the structure concerned. Woodring et al. (1940) and Narr (1991) considered the influence of double curvature, and the implied variation of fold-hinge plunge,on the degree of fracturingobserved in nat- ural structures. This contribution discussed the methods of Gaussian curvature analysis (GCA) pre- viously suggestedby Lisle (1992) and their practical limitations, and goes on to suggest an improved technique that is applied, by way of example, to foldsin central Wyoming. The idea that an analysis of Gaussian curvature of folded surfaces could yield information on the stretching involved in the folding process (Lisle, 1988)arose from consideration of the simplest pos- sible model of folding; namely, a folding mechanism in which the limbs rotate, but where the bedding surfaces do not suffer straining. The name "isomet- ric folding" has been applied as a general name for this type of folding (Lisle et al., 1990),which
Transcript of Pub 058 (1994) Detection of zones of abnormal strains in structures using Gaussian Curvature...

Detection of Zones of Abnormal Strains in StructuresUsing Gaussian Curvature Analysis!
Whereas some folds, such as those produced byflexural slip, do not theoretically entail strain with-in the folded surfaces, any surface involving doublecurvature (such as domes and saddles) cannot formwithout some stretching or contraction of the bed-ding. Whether straining of the surfaces is requiredduring folding depends on the three-dimensionalfold shape and, in particular, on the Gaussian curva-ture at points on the folded surface. Using this as abasis, I present a method for detecting zones ofanomalously high strain in oil-field structures fromGaussian curvature analysis (GCA) of natural struc-tures. The new method of GCA is suitable for ana-lyzing surfaces that have been mapped seismically.A Gaussian curvature map of the structure is a prin-cipal outcome of the analysis and can be used topredict the density of strain-related subseismicstructures, such as small-scale fracturing. TheGoose Egg dome, near Casper, Wyoming, is ana-lyzed and provides an example of GCA. In thisstructure, a relationship is observed between frac-ture densities and Gaussian curvature.
In recent years considerable effort has beendevoted to developing techniques to predict vari-ous characteristics of fracture patterns in subsur-face hydrocarbon reservoirs. The characteristics ofinterest from the point of view of hydrocarbonmigration and extraction include frequency, sizedistribution, orientation, and interconnectivity of
©Copyright 1994. The American Association of Petroleum Geologists. Allrights reserved.
'Manuscript received September 10, 1993; revised manuscript receivedJune 16, 1994; final acceptance August 19, 1994.
2Laboratory for Strain Analysis, Department of Geology, University ofWales, Cardiff CFl 3YE, United Kingdom.
This research was supported by Shell Research B.V., Rijswijk,Netherlands. I am grateful for the advice of Michael Naylor at Shell and AlanJ. Ver Ploeg of the Geological Survey of Wyoming. The paper greatlybenefited from thorough reviews from Kaspar J. Arbenz, Rick Groshong,Jerry J. Sweeney, and Kevin T. Biddle.
fractures, as well as the variation of the propertiesboth within and between stratigraphic units.
This study is concerned with estimating the rela-tive frequency of fracturing spatially within individ-ual horizons using structural geometry as the basisof this prediction. Several earlier studies (Harris etal., 1960; Narr, 1991) suggested a correlationbetween fracture density and location of the sam-ple sites within a large-scale fold structure. Morespecifically, Harris et al. (1960) attributed fracturedensity differences to different curvatures, Le.,rates of change of bedding dip or strike around foldstructures in Wyoming.
Lisle (1988, 1992) presented a model in whichfracturing was predicted on the basis of the curva-ture present at points on a folded surface, althoughthe curvature considered important is the double(or three-dimensional) type possessed by structuressuch as domes and basins and expressed quantita-tively by means of the Gaussian curvature. Accord-ing to the model, conclusions concerning the stateof strain in folded surface can be drawn on thebasis of variation of Gaussian curvature across thestructure concerned. Woodring et al. (1940) andNarr (1991) considered the influence of doublecurvature, and the implied variation of fold-hingeplunge, on the degree of fracturing observed in nat-ural structures. This contribution discussed themethods of Gaussian curvature analysis (GCA) pre-viously suggested by Lisle (1992) and their practicallimitations, and goes on to suggest an improvedtechnique that is applied, by way of example, tofolds in central Wyoming.
The idea that an analysis of Gaussian curvature offolded surfaces could yield information on thestretching involved in the folding process (Lisle,1988) arose from consideration of the simplest pos-sible model of folding; namely, a folding mechanismin which the limbs rotate, but where the beddingsurfaces do not suffer straining. The name "isomet-ric folding" has been applied as a general name forthis type of folding (Lisle et al., 1990), which

Gaussian curvature,K = k] k2
Figure I-Denning the curvature at a point P on a fold-ed surface. Orthogonal curves labeled k] and k2 are theprincipal curvatures at P and their product equals theGaussian curvature, K.
includes mechanisms such as flexural-slip and flexu-ral-flow folding as more specific examples.
As simple experiments with flexed sheets ofpaper can demonstrate, the range of fold shapesthat can develop from a sheet that does not stretchis limited. In particular, it is not possible to developpericlinal fold shapes, domes, basins, or any otherform that possesses double curvature. This proper-ty of isometric folding is expressed formally byGauss's Theorema Egregium, which states that theisometric bending of a surface does not change thetotal or Gaussian curvature (K) of points on thatsurface. The Gaussian curvature K at a point (Fig-ure 1) is defined as the product of the two princi-pal curvatures, kj, k2, i.e., the extreme values ofcurvature measured along two orthogonal curvesthrough the point (K = k1k2Y.
If we start with a planar sheet before isometricfolding, the Gaussian curvature of all points on thesurface is zero (Le., the principal curvatures kl andk2 are both zero). During folding, the principal cur-vatures at points on the surface will be expected tochange, although according to Gauss's theorem, insuch a way as to give a zero product. This impliesthat the type of fold surface resulting from isomet-ric bending of a flat sheet (so-called developablesurfaces) will be made of points where at least oneof the principal curvatures is zero, that is, they donot possess double curvature (Figure 2).
Lisle (1988) used this characteristic of isometricfolding as the basis of a method for strain analysisof folded surfaces. Assuming an initial planar geom-etry of the surface, the presence of double curva-
Figure 2-Illustration of Gauss's theorem, which statesthat the Gaussian curvature (K) at a point on a surface isnot altered as a result of isometric folding of the surface.The flat unfolded surface has a K value of zero becauseboth principal curvatures are zero; after isometric fold-ing, K is also zero.
ture (K"* 0) in a natural fold implies that the foldingmechanism was not isometric and, therefore,involved some amount of bed stretching or con-traction. Thus, the analysis of bedding plane strainsis based on the measurement of Gaussian curvatureand its distribution on the folded surface.
Although Gauss's theorem can be used as a basisfor detecting bedding plane strains in folded rocks,it provides no opportunity of determining the mag-nitude of those strains. A technique for estimatingstrain magnitudes must await the derivation of ageneral relationship between the two-dimensionalstrains and curvatures of a surface.
The measurement of Gaussian curvature allowstesting of the hypothesis that a given structure, orpart of a structure, developed by isometric folding.Values of K that are significantly nonzero can beused to reject this hypothesis. The occurrence ofzero values of K, on the other hand, does not vali-date the hypothesis of isometric bending; it is sim-ply consistent with it because there are a variety ofother folding mechanisms capable of producing K= 0 surfaces.
From these considerations it is clearly meaning-ful to apply methods of GCA only in situationswhere the conditions are such that the isometricfolding model has a reasonable chance of beingvalid. For instance, it serves little purpose to usethese techniques with structures formed in meta-morphic environments where ductile strains arepenetrative. The methods are likely to be most use-ful when applied to structures where a strong pla-nar anisotropy is being folded, such as well-beddedor well-foliated sequences. The presence of the
Geometry offoldedsurface
PrincipalCurvatures
kl, k,
Strutturecontourpattern
GaussianCurvatureK = kl k,
(0)\9elliptical e.g., dome
~hyperbolic e.g., saddle
{fpttiJ<qdevelopable e.g., cylindrical
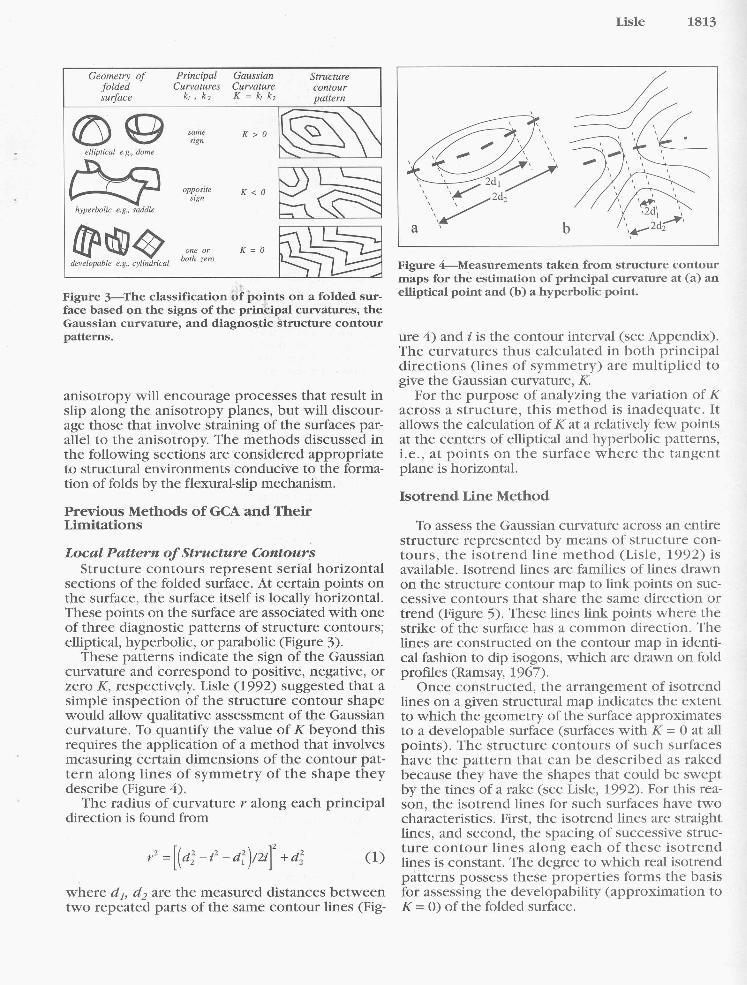
~.Figure 3-The classification of points on a folded sur-face based on the signs of the principal curvatures, theGaussian curvature, and diagnosJic structure contourpatterns.
anisotropy will encourage processes that result inslip along the anisotropy planes, but will discour-age those that involve straining of the surfaces par-allel to the anisotropy. The methods discussed inthe following sections are considered appropriateto structural environments conducive to the forma-tion of folds by the flexural-slip mechanism.
Previous Methods of GCAand TheirLimitations
Local Pattern of Structure Contour~Structure contours represent serial horizontal
sections of the folded surface. At certain points onthe surface, the surface itself is locally horizontal.These points on the surface are associated with oneof three diagnostic patterns of structure contours;elliptical, hyperbolic, or parabolic (Figure 3).
These patterns indicate the sign of the Gaussiancurvature and correspond to positive, negative, orzero K, respectively. Lisle (1992) suggested that asimple inspection of the structure contour shapewould allow qualitative assessment of the Gaussiancurvature. To quantify the value of K beyond thisrequires the application of a method that involvesmeasuring certain dimensions of the contour pat-tern along lines of symmetry of the shape theydescribe (Figure 4).
The radius of curvature r along each principaldirection is found from
where db d2 are the measured distances betweentwo repeated parts of the same contour lines (Fig-
Figure 4--Measurements taken from structure contourmaps for the estimation of principal curvature at (a) anelliptical point and (b) a hyperbolic point.
ure 4) and i is the contour interval (see Appendix).The curvatures thus calculated in both principaldirections (lines of symmetry) are multiplied togive the Gaussian curvature, K.
For the purpose of analyzing the variation of Kacross a structure, this method is inadequate. Itallows the calculation of K at a relatively few pointsat the centers of elliptical and hyperbolic patterns,i.e., at points on the surface where the tangentplane is horizontal.
Isotrend Line Method
To assess the Gaussian curvature across an entirestructure represented by means of structure con-tours, the isotrend line method (Lisle, 1992) isavailable. Isotrend lines are families of lines drawnon the structure contour map to link points on suc-cessive contours that share the same direction ortrend (Figure 5). These lines link points where thestrike of the surface has a common direction. Thelines are constructed on the contour map in identi-cal fashion to dip isogons, which are drawn on foldprofiles (Ramsay, 1967).
Once constructed, the arrangement of isotrendlines on a given structural map indicates the extentto which the geometry of the surface approximatesto a developable surface (surfaces with K = 0 at allpoints). The structure contours of such surfaceshave the pattern that can be described as rakedbecause they have the shapes that could be sweptby the tines of a rake (see Lisle, 1992). For this rea-son, the isotrend lines for such surfaces have twocharacteristics. First, the isotrend lines are straightlines, and second, the spacing of successive struc-ture contour lines along each of these isotrendlines is constant. The degree to which real isotrendpatterns possess these properties forms the basisfor assessing the developability (approximation toK = 0) of the folded surface.

Developablesurface
Figure 5-{a) Developable surface showing points withidentical dip and strike values arranged in straight lineson the surface (left). Isotrend lines constructed from thestructure contour map thus are straight. Along anyisotrend line the distances between successive structurecontours remain constant. (b) Nondevelopable surfaceshowing isotrend lines as curved and/or that the spac-ing of structure contours along them is variable.
This method has proved useful in practice, espe-cially as a first stage in the structural interpretation.The method is simple to apply because it is anentirely graphic technique, but is limited by thefact that it does not allow the Gaussian curvature tobe numerically determined.
A developable surface, a surface consisting ofpoints with K = 0, can be simply unrolled back to aflat plane. Consider, however, a surface with posi-tive K, such as a dome. Attempts to return a paperdome to a plane require first the use of scissors.Flattening the surface results in the appearance of atapering gape, the angular dimension of whichdepends on the curvature of the original dome. Incontrast, ironing out a surface with negative K,such as a saddle, results in the opposite effect: anoverlap of the sheet. Here again, the angular dimen-sion of the sector of overlap depends on the Gaus-sian curvature of the saddle (Figure 6). The surplusor deficit of angle in surfaces that are cut and flat-tened is a measure of the Gaussian curvature of thesurface. This is the essential basis of the presenttechnique.
Figure 6--{a) Grid of known elevations of a folded sur-face. At any grid point the elevations of the neighborsallow the construction of a faceted figure of domal orsaddle shape. (b, c) The local Gaussian curvature, itsmagnitude, and sign are indicated by the misfit angle (8)arising when the three-dimensional figure is returned toa flat plane. Positive curvature is indicated by a gape (b)jnegative curvature by an overlap (c).
Consider a surface whose elevations z areknown only at nodes on an x,y grid (Figure 6a), asmight be the case if the surface has been seismical-ly mapped in three dimensions. The surface can beapproximated by a faceted surface formed of alarge number of flat triangular faces whose apicescorrespond to adjacent grid nodes (Figure 6b). Forsuch an arrangement, the Gaussian curvature at anynode on the surface can be found by summing allthe angles on the triangular faces around a node(Calladine, 1986). The difference between this sumand 2n is called the angular defect 8 and corre-sponds to the angular misfit produced if the surfacearound the node were to be cut and flattened.
The following equation is used to calculate theGaussian curvature from the angular defect:
where A is known as the area associated with thevertex and equals 1/3 of the areas of the trianglesmeeting at the node. It is clear from equation 2 thatthe units of Gaussian curvature are per square meter.
The calculation of K using the angular defectmethod is computationally very simple. Unlike theother methods, described numerical values areobtained. From data consisting of x,y,z coordinatesof points, the surface is treated for computationalpurposes as one consisting of triangular elementsthat meet edge to edge (Figure 6). At each node, theangles at the apices of triangular elements are com-puted using standard vector methods. The value of Kat each such node is found from the sum of theangles defmed by the edge lines passing though the

100m
d 10m
0.01 m100 -1 -2 -3 -4 -5 -6 -7 -8
Gaussian curvature,
Figure 7-Interpretation of Gaussian curvature values.For periclinal structures whose contour patterns pos-sess an aspect ratio R, the Gaussian curvature can beexpressed as the transverse distance (d) from the crestto a point on the limb where the dip is 10°.
node. The values of K found in this manner arearranged on a grid that covers the surface underinvestigation. These local values of K can then becontoured to produce a Gaussian curvature map rep-resenting the variation of K values across a structure.
Because it is not customary to express fold shapein terms of Gaussian curvature, the followingguides are useful for visualizing the significance ofparticular values of K A hemispherical dome withK = 10-p has a radius of curvature of 10p/2. Forexample, a value of K of 10-12/m2 is possessed bypoints on a dome of radius 106 m.
Rarely, however, do the structures concernedhave an ideal domal form. Consider instead a peri-clinal fold with oval structure contours. To a firstapproximation the aspect ratio R of the elliptical orhyperbolic shape outlined by the contours is equalto the square root of the ratio of the radii of princi-pal curvatures. Therefore
A pericline with K = 10-p therefore has a greatestradius of curvature of (10p/2IR). For example, if lOp/2= 1O-8/m2 and R = 10 for a pericline, then the maxi-mum principal radius of curvature is (104)/10 = 1000m. Another way of appreciating the significance ofparticular values of K is to express it as the distance dfrom the crest of a periclinal structure to a point onits flank of dip 10°. Figure 7 shows how this distanceis converted into Gaussian curvature for differentaspect ratios of the structure contour values.
The method of GCA described has been appliedto noncylindrical folds in the Rocky Mountains, 14mi southwest of Casper, Wyoming. The structureexamined is the Goose Egg dome of Natrona County,which was selected because of the existence of aprevious field-based study of fracturing and its rela-tion to structure done in this area by Harris et al.(1960). These authors carried out a detailed surveyof fracture densities and orientations at surface out-crops of Mesozoic sediments exposed around thedome.
The structural data necessary for the present anal-ysis of curvature were taken from the structure con-tour map of the top of the Pennsylvanian (Figure 8).
Figure 8--Structure contour map ofthe GooseEggdome, Casper,Wyoming (after Harris et aI., 1960).Contours refer to the top of thePennsylvanian. Data for the analysisof curvature were taken from thismap by means of a superimposedsquare grid (shown for the south-western part of the map). Small faultis marked ff.
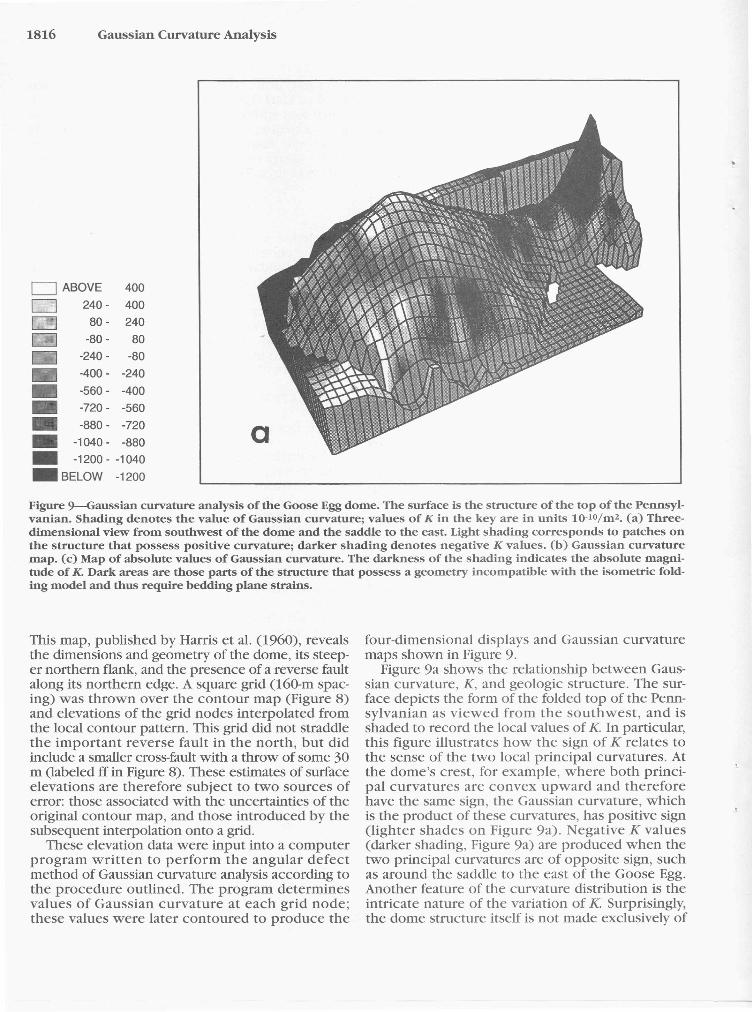
o ABOVE 400o 240- 400o 80- 240o -80- 80o -240- -80
-400 - -240_ -560- -400_ -720 - -560_ -880 - -720_ -1040 - -880_ -1200 - -1040_ BELOW -1200
Figure 9--Gaussian curvature analysis of the GooseEggdome. The surface is the structure of the top of the Pennsyl-vanian. Shading denotes the value of Gaussian curvature; values of K in the key are in units lO-lO/m2•(a) Three-dimensional view from southwest of the dome and the saddle to the east. Light shading corresponds to patches onthe structure that possess positive curvature; darker shading denotes negative K values. (b) Gaussian curvaturemap. (c) Map of absolute values of Gaussian curvature. The darkness of the shading indicates the absolute magni-tude of K. Dark areas are those parts of the structure that possess a geometry incompatible with the isometric fold-ing model and thus require bedding plane strains.
This map, published by Harris et al. (1960), revealsthe dimensions and geometry of the dome, its steep-er northern flank, and the presence of a reverse faultalong its northern edge. A square grid (160-m spac-ing) was thrown over the contour map (Figure 8)and elevations of the grid nodes interpolated fromthe local contour pattern. This grid did not straddlethe important reverse fault in the north, but didinclude a smaller cross-fault with a throw of some 30m (labeled ff in Figure 8). These estimates of surfaceelevations are therefore subject to two sources oferror: those associated with the uncertainties of theoriginal contour map, and those introduced by thesubsequent interpolation onto a grid.
These elevation data were input into a computerprogram written to perform the angular defectmethod of Gaussian curvature analysis according tothe procedure outlined. The program determinesvalues of Gaussian curvature at each grid node;these values were later contoured to produce the
four-dimensional displays and Gaussian curvaturemaps shown in Figure 9.
Figure 9a shows the relationship between Gaus-sian curvature, K, and geologic structure. The sur-face depicts the form of the folded top of the Penn-sylvanian as viewed from the southwest, and isshaded to record the local values of K In particular,this figure illustrates how the sign of K relates tothe sense of the two local principal curvatures. Atthe dome's crest, for example, where both princi-pal curvatures are convex upward and thereforehave the same sign, the Gaussian curvature, whichis the product of these curvatures, has positive sign(lighter shades on Figure 9a). Negative K values(darker shading, Figure 9a) are produced when thetwo principal curvatures are of opposite sign, suchas around the saddle to the east of the Goose Egg.Another feature of the curvature distribution is theintricate nature of the variation of K Surprisingly,the dome structure itself is not made exclusively of

oABOVE 400o 60- 400o -280- 60o -620- -280-960 - -620
•• -1300 - -960_ -1640 - -1300_ -1980 - -1640_ -2320 - -1980_ -2660 - -2320_ -3000 - -2660
_BELOW -3000
_ ABOVE 2500_ 2310- 2500_ 2120 - 2310_ 1930- 2120_ 1740-1930_ 1550-1740
•• 1360 - 1550o 1170 - 1360I I 980 - 1170o 790- 980o 600- 790DBELOW 600
points with positive K, but undulating furrows onthe southern flank produce patches where K islocally negative.
Over most of the area (Figure 9b) K varies withinthe range -1O-7/m2 and +1O-7/m2. The significanceof these values is more readily appreciated by refer-ring to Figure 7.
The greatest absolute values of K ( > 8 x 1O-8/m2)are to be found along the northern limb of thestructure and a patch in the southern portion ofthe dome (Figure 9c). These areas correspond toareas where the structure's main curvature aboutan east-west axis is superimposed on by transverseundulations. The resulting pattern (Figure 9b) con-sists of alternating regions of positive and negativecurvature.
In one part of the northern flank of the dome thepresence of striking nonzero curvature (Figure 9a, b)can be attributed to the presence of a discontinuityin the surface corresponding to a transverse fault(labeled ff in Figure 8). This mapped fault wasignored in the analysis and the surface was treated asbeing continuous. The effect of this fault on the
topology of the surface would be akin to that of atransverse fold pair superimposed obliquely on themain structure. This explains the nonzero curvaturesproduced. This suggests that a Gaussian curvaturemap may be a useful aid to mapping larger faults.
Figure 10 shows the data on fracture densitiesaround the Goose Egg structure published by Har-ris et al. (960). The isofracture contours havebeen drawn from the measurement of the intensityof fracturing at surface outcrops of five sedimenta-ry units of Triassic-Cretaceous age. Because thenature of the lithology also influences the fractureintensity, a lithology correction factor was appliedby Harris et al. (1960) to the data to normalize thedensity values.
Comparison of the Gaussian curvature (Figure9c) and published data on fracture densities (Figure10) (from Harris et al., 1960) provides grounds forguarded optimism for the proposed technique ofstrain analysis. Fracture densities (Figure 10) aregreater on the northern limb and in the southwest-ern part of the Goose Egg, areas where absolutevalues of K are highest.

Goose Egg Dome, Natrona Co., WyomingIsofracture map
••••(1) Gauss's theorem provides a theoretical foun-
dation for a predictive technique for indicatingregions on a folded surface that have sufferedanomalously high strains.
(2) The technique of Gaussian curvature analysiscan be implemented via a number of methods; ofthese, the angular misfit method described here isstraightforward in its application and is suited toanalyzing surfaces known from gridded elevationdata.
(3) The application of Gaussian curvature analy-sis to the Goose Egg structure yields encouragingresults. The parts of the structure with highest frac-ture densities broadly match those areas with high-est absolute values of Gaussian curvature. The rela-tively poor quality of the available structural data inthis example means that the results do not amountto a verification of the Gaussian curvature modelfor fracture prediction.
(4) Faults with significant throw produce pat-terns on a Gaussian curvature map, and, after fur-ther theoretical investigation, may form the basis ofa technique for mapping of individual faults.
APPENDIX: ESTIMATING GAUSSIANCURVATURE FROM ELLIPTICAL ANDHYPERBOLIC STRUCTURE CONTOURPATTERNS
Consider the distances between contours measured along linesof symmetry of an elliptical or a hyperbolic structure contour pat-tern as shown in Figure 4. In a cross section of a small portion ofthe surface along such a line of symmetry, the surface will appear
> 8 fractures / yard
6-8 fractures / yard
3-5 fractures / ard
Figure lO--Isofracturemap of the GooseEggdome (from Harris et al.,1960).
______-_:::::1:~d,al r
1V/'Figure 11--Cross section of a surface drawn parallel toa line of principal curvature to show parameters usedfor the calculation of the radius of curvature (r) fromthe contour interval (i) and spacing of two contours (d]and d2).
as a circular arc with radius of curvature r (Figure 11). Pairs ofpoints (v,w) and (x,y) are points where the surface is intersectedby horizontals v-wand x-y; these horizontals differ in height by i,the contour interval.
Referring to Figure 11, it is clear that

Calladine, C. R., 1986, Gaussian curvature and shell structures, inJ. A. Gregory, ed., The mathematics of surfaces: Oxford,Clarendon Press.
Harris,]. F., G. L.Taylor, andJ. L.Walper, 1960, Relation of defor-mational structures in sedimentary rocks to regional and localstructure: AAPGBulletin, v. 44, p. 1853-1873.
Lisle,R. J., 1988, Constant bed-length folding: Abstracts of AnnualTectonics Studies Group Meeting, Cambridge, p. 32.
Lisle, R. J., 1992, Constant bed-length folding: three-dimensionalgeometrical implications: Journal of Structural Geology, v. 15,p.245-252.
Lisle,R.]., P. Styles, and S.]. Freeth, 1990, Fold interference struc-tures: the influence of layer competence contrast: Tectono-physics, v. 172, p. 197-200.
Narr, W., 1991, Fracture density in the deep subsurface: tech-niques with applications to Point Arguello oil field: AAPGBul-letin, v. 5, p. 1300-1323.
Ramsay,]. G., 1967, Folding and fracturing of rocks: New York,McGraw-Hill,568 p.
Woodring, W. P., R. Stewart, and R.W. Richards, 1940, Geology ofthe Kettleman Hills oil field, California: U.S. Geological SurveyProfessional Paper 195, 170 p.
Richard J. Lisle
Richard]. Lisle is a senior lec-turer in geology at the Universityof Wales, Cardiff, United King-dom. His research is concernedwith the geometric aspects ofstructural geology, and he haspublished two textbooks and 55articles on this topic. He is an edi-tor of the Journal of StructuralGeology.Richard was educated atthe University of Birmingham(B.Sc.) and at Imperial College,London (M.Sc., Ph.D.). He was a lecturer at the univer-sities of Leiden, Utrecht, and Swansea before movingto Cardiff, where he now heads a laboratory for strainanalysis research.