
Psychophysiological Mechanisms of Interindividual Differences in Goal Activation Modes During Action...
10
Psychophysiological Mechanisms of Interindividual Differences in Goal Activation Modes During Action Cascading Moritz Mückschel, Ann-Kathrin Stock and Christian Beste Department of Biopsychology, Institute of Cognitive Neuroscience, Ruhr-University Bochum, Bochum, Germany Address correspondence to C. Beste,Department of Biopsychology, Institute of Cognitive Neuroscience, Ruhr-Universität Bochum, Universitätsstrasse 150, D-44780 Bochum, Germany. Email: [email protected] Our daily life is characterized by multiple response options that need to be cascaded in order to avoid overstrain of restricted response selection resources. While response selection and goal activation in action cascading are likely driven by a process varying from serial to parallel processing, little is known about the under- lying neural mechanisms that may underlie interindividual differ- ences in these modes of response selection. To investigate these mechanisms, we used a stop–change paradigm for the recording of event-related potentials and standardized low resolution brain elec- tromagnetic tomography source localizations in healthy subjects. Systematically varying the stimulus onset asynchrony (the temporal spacing of “stop” and “change” signals), we applied mathematical constraints to classify subjects in more parallel or more serial goal activators during action cascading. On that basis, the electrophysio- logical data show that processes linking stimulus processing and response execution, but not attentional processes, underlie interin- dividual differences in either serial or parallel response selection modes during action cascading. On a systems level, these pro- cesses were mediated via a distributed fronto-parietal network, in- cluding the anterior cingulate cortex (Brodman area 32, BA32) and the temporo-parietal junction (BA40). There was a linear relation between the individual degree of overlap in activated task goals and electrophysiological processes. Keywords: anterior cingulate cortex, P3, response selection, stop–change paradigm, temporo-parietal junction Introduction Our daily life is characterized by multiple response options that seek access to restricted resources. To cope with this, it is important to cascade different actions on response options. From a computational neuroscientific perspective, response selection processes are frequently conceptualized as functions of fronto-striatal networks (Redgrave et al. 1999; Bar-Gad et al. 2003; Plenz 2003; Humphries et al. 2006; Schroll et al. 2012), which have been underlined by studies in basal ganglia disorders (e.g., Beste et al. 2009; Cameron et al. 2010; Willemssen et al. 2011; Beste et al. 2012; Ravizza et al. 2012). Other concepts suggest that complex multicomponent behav- ior is mediated via a “multiple demand system” (MD system), encompassing areas in the frontal and parietal cortex (Duncan 2010). Classical cognitive models (aka central bottle- neck models) assume that response selection cannot concur- rently operate on more than one response option (Pashler 1994; review: Meyer and Kieras 1997). However, a number of results from experimental psychology suggest that the selec- tion of actions and goal activation in situations requiring action cascading does not necessarily rely on a central bottle- neck that implies a serial processing of the different responses (e.g., Sommer et al. 2001; Oberauer and Kliegl 2004; Verbrug- gen et al. 2008; for review: Wiu and Liu 2008; Miller et al. 2009). Rather, the processing of different responses and the activation of task goals may be performed in a “strategic nature” (e.g. Meyer and Kieras 1997). This is also proposed in the concept of “threaded cognition” (Salvucci and Taatgen 2008), an integrated theory of “multitasking”. According to this account, 2 or more tasks can be performed at once, as long as a complex multicomponent goal can be represented as different threads of processing that are coordinated by a processing resource and are executed by other resources (e.g. motor or perceptual resources; Salvucci and Taatgen 2008). Along these lines, the activation of intended outcomes in situations where action cascading is necessary is driven by some form of nondeterministic processing that can be implemented in either a serial or a parallel fashion (Verbrug- gen et al. 2008). Even though there is a lot of experimental psychological evidence showing that response selection mechanisms vary along a continuum from more serial to more parallel processing (e.g. Miller et al. 2009), the physiological mechanisms that differ between subjects displaying a more serial or a more parallel mode of response selection are not known. To investigate this question, we quantified the degree to which 2 consecutive actions are selected on a continuum ranging from serial to parallel processing in a stop–change paradigm (Verbruggen et al. 2008). This paradigm is a hybrid of a stop-signal paradigm and a psychological refractory period (PRP) paradigm (Verbruggen et al. 2008). Subjects are required to stop an ongoing response and then shift to an alternative response. This shift is signaled either at the same time as the stop process, or with a short delay. Verbruggen et al. (2008) varied the delay (stimulus-onset asynchrony, SOA) between the stop and change stimuli and estimated (on the basis of reaction time data) in how far the stop and the change processes overlap. The degree of overlap was esti- mated by calculating the slope of the SOA-reaction times (RTs) function, that is, the function that describes how the RT on the change stimulus varies depending on the delay between stop and change stimuli. A steeper slope of this func- tion reflects more overlapping of the stop and change pro- cesses (c.f. Verbruggen et al. 2008; refer Materials and methods section for details). Here, we used this mathematical constraint to classify subjects as a “serial mode group” and a “parallel mode group” of action cascading. On the basis of this classification, we constrained analysis of electrophysio- logical (EEG) data and source localization using standardized low resolution brain electromagnetic tomography (sLORETA). It has been suggested that central executive and working memory processes play a pivotal role in tasks imposing © The Author 2013. Published by Oxford University Press. All rights reserved. For Permissions, please e-mail: [email protected] Cerebral Cortex August 2014;24:2120–2129 doi:10.1093/cercor/bht066 Advance Access publication March 14, 2013 at SLUB Dresden on October 7, 2014 http://cercor.oxfordjournals.org/ Downloaded from
-
Upload
independent -
Category
Documents
-
view
4 -
download
0
Transcript of Psychophysiological Mechanisms of Interindividual Differences in Goal Activation Modes During Action...

Psychophysiological Mechanisms of Interindividual Differences in Goal Activation ModesDuring Action Cascading
Moritz Mückschel, Ann-Kathrin Stock and Christian Beste
Department of Biopsychology, Institute of Cognitive Neuroscience, Ruhr-University Bochum, Bochum, Germany
Address correspondence to C. Beste, Department of Biopsychology, Institute of Cognitive Neuroscience, Ruhr-Universität Bochum,Universitätsstrasse 150, D-44780 Bochum, Germany. Email: [email protected]
Our daily life is characterized by multiple response options thatneed to be cascaded in order to avoid overstrain of restrictedresponse selection resources. While response selection and goalactivation in action cascading are likely driven by a process varyingfrom serial to parallel processing, little is known about the under-lying neural mechanisms that may underlie interindividual differ-ences in these modes of response selection. To investigate thesemechanisms, we used a stop–change paradigm for the recording ofevent-related potentials and standardized low resolution brain elec-tromagnetic tomography source localizations in healthy subjects.Systematically varying the stimulus onset asynchrony (the temporalspacing of “stop” and “change” signals), we applied mathematicalconstraints to classify subjects in more parallel or more serial goalactivators during action cascading. On that basis, the electrophysio-logical data show that processes linking stimulus processing andresponse execution, but not attentional processes, underlie interin-dividual differences in either serial or parallel response selectionmodes during action cascading. On a systems level, these pro-cesses were mediated via a distributed fronto-parietal network, in-cluding the anterior cingulate cortex (Brodman area 32, BA32) andthe temporo-parietal junction (BA40). There was a linear relationbetween the individual degree of overlap in activated task goalsand electrophysiological processes.
Keywords: anterior cingulate cortex, P3, response selection, stop–changeparadigm, temporo-parietal junction
Introduction
Our daily life is characterized by multiple response optionsthat seek access to restricted resources. To cope with this, it isimportant to cascade different actions on response options.From a computational neuroscientific perspective, responseselection processes are frequently conceptualized as functionsof fronto-striatal networks (Redgrave et al. 1999; Bar-Gadet al. 2003; Plenz 2003; Humphries et al. 2006; Schroll et al.2012), which have been underlined by studies in basalganglia disorders (e.g., Beste et al. 2009; Cameron et al. 2010;Willemssen et al. 2011; Beste et al. 2012; Ravizza et al. 2012).Other concepts suggest that complex multicomponent behav-ior is mediated via a “multiple demand system” (MD system),encompassing areas in the frontal and parietal cortex(Duncan 2010). Classical cognitive models (aka central bottle-neck models) assume that response selection cannot concur-rently operate on more than one response option (Pashler1994; review: Meyer and Kieras 1997). However, a number ofresults from experimental psychology suggest that the selec-tion of actions and goal activation in situations requiringaction cascading does not necessarily rely on a central bottle-neck that implies a serial processing of the different responses
(e.g., Sommer et al. 2001; Oberauer and Kliegl 2004; Verbrug-gen et al. 2008; for review: Wiu and Liu 2008; Miller et al.2009). Rather, the processing of different responses and theactivation of task goals may be performed in a “strategicnature” (e.g. Meyer and Kieras 1997). This is also proposed inthe concept of “threaded cognition” (Salvucci and Taatgen2008), an integrated theory of “multitasking”. According tothis account, 2 or more tasks can be performed at once, aslong as a complex multicomponent goal can be representedas different threads of processing that are coordinated by aprocessing resource and are executed by other resources (e.g.motor or perceptual resources; Salvucci and Taatgen 2008).
Along these lines, the activation of intended outcomes insituations where action cascading is necessary is driven bysome form of nondeterministic processing that can beimplemented in either a serial or a parallel fashion (Verbrug-gen et al. 2008). Even though there is a lot of experimentalpsychological evidence showing that response selectionmechanisms vary along a continuum from more serial to moreparallel processing (e.g. Miller et al. 2009), the physiologicalmechanisms that differ between subjects displaying a moreserial or a more parallel mode of response selection are notknown.
To investigate this question, we quantified the degree towhich 2 consecutive actions are selected on a continuumranging from serial to parallel processing in a stop–changeparadigm (Verbruggen et al. 2008). This paradigm is a hybridof a stop-signal paradigm and a psychological refractoryperiod (PRP) paradigm (Verbruggen et al. 2008). Subjects arerequired to stop an ongoing response and then shift to analternative response. This shift is signaled either at the sametime as the stop process, or with a short delay. Verbruggenet al. (2008) varied the delay (stimulus-onset asynchrony,SOA) between the stop and change stimuli and estimated (onthe basis of reaction time data) in how far the stop and thechange processes overlap. The degree of overlap was esti-mated by calculating the slope of the SOA-reaction times(RTs) function, that is, the function that describes how the RTon the change stimulus varies depending on the delaybetween stop and change stimuli. A steeper slope of this func-tion reflects more overlapping of the stop and change pro-cesses (c.f. Verbruggen et al. 2008; refer Materials andmethods section for details). Here, we used this mathematicalconstraint to classify subjects as a “serial mode group” and a“parallel mode group” of action cascading. On the basis ofthis classification, we constrained analysis of electrophysio-logical (EEG) data and source localization using standardizedlow resolution brain electromagnetic tomography (sLORETA).
It has been suggested that central executive and workingmemory processes play a pivotal role in tasks imposing
© The Author 2013. Published by Oxford University Press. All rights reserved.For Permissions, please e-mail: [email protected]
Cerebral Cortex August 2014;24:2120–2129doi:10.1093/cercor/bht066Advance Access publication March 14, 2013
at SLU
B D
resden on October 7, 2014
http://cercor.oxfordjournals.org/D
ownloaded from
multiple demands, as they map a stimulus on the appropriateresponse (e.g., Huestegge and Koch 2010; Oberauer andBialkova 2011; Schroll et al. 2012) and/or activate differentgoals involved in action cascading (e.g. Verbruggen et al.2008). A component of the event-related potential (ERP) thatis assumed to reflect working memory processes (review:Polich 2007) and, in choice reaction tasks, an intermediateprocess between stimulus evaluation and responding (Falken-stein et al. 1994a, 1994b; Verleger et al. 2005) is the parietalP3. Confirming these hypotheses, several studies provide evi-dence that the P3 is modulated by experimental variations indual-task situations (i.e. PRP paradigms; e.g., Brisson andJolicoeur 2007; Sigman and Dehaene 2008). Yet, some resultsalso point toward the relevance of attentional processes indual- or multitasking situations (Brisson and Jolicoeur 2007).We therefore examine the possible effects of more serial andmore parallel goal activation during action cascading in sub-jects from attentional processes (P1 and N1 ERP) to later pro-cesses reflected by the P3. We assume that especially the P3ERP component yield differences between processing groups,as classified by the SOA-RT function. Since fronto-striatal net-works, including the anterior cingulate cortex (ACC), play animportant role in response selection (Bar-Gad et al. 2003;Plenz 2003; Botvinick et al. 2004; Humphries et al. 2006),variations at the ERP level, due to the group classification onthe basis of the SOA-RT function, may emerge due to themodulation of ACC activity. However, besides the ACC, theinferior parietal cortex that has been shown to be involved inthe chaining of actions (e.g. Chersi et al. 2011) is part of theMD system, which mediates multicomponent behavior(Duncan 2010). Based on these considerations, we expectthat differences in the P3 ERP between groups (more serialvs. more parallel mode of response selection) are related todifferential modulations in frontal and parietal areas, as to berevealed via sLORETA.
Materials and Methods
ParticipantsIn total, 24 subjects (N = 24) between 20 and 30 years of age (15females) participated in the study. All subjects had normal orcorrected-to-normal vision, had normal hearing level, no history ofneurological and psychiatric diseases, were right-handed, and re-ceived course credits or financial compensation for their participation.The study was approved by the ethics committee of the medicalfaculty of the Ruhr-Universität Bochum. All subjects gave written in-formed consent before the study protocol was conducted. The studyaccords to the Declaration of Helsinky.
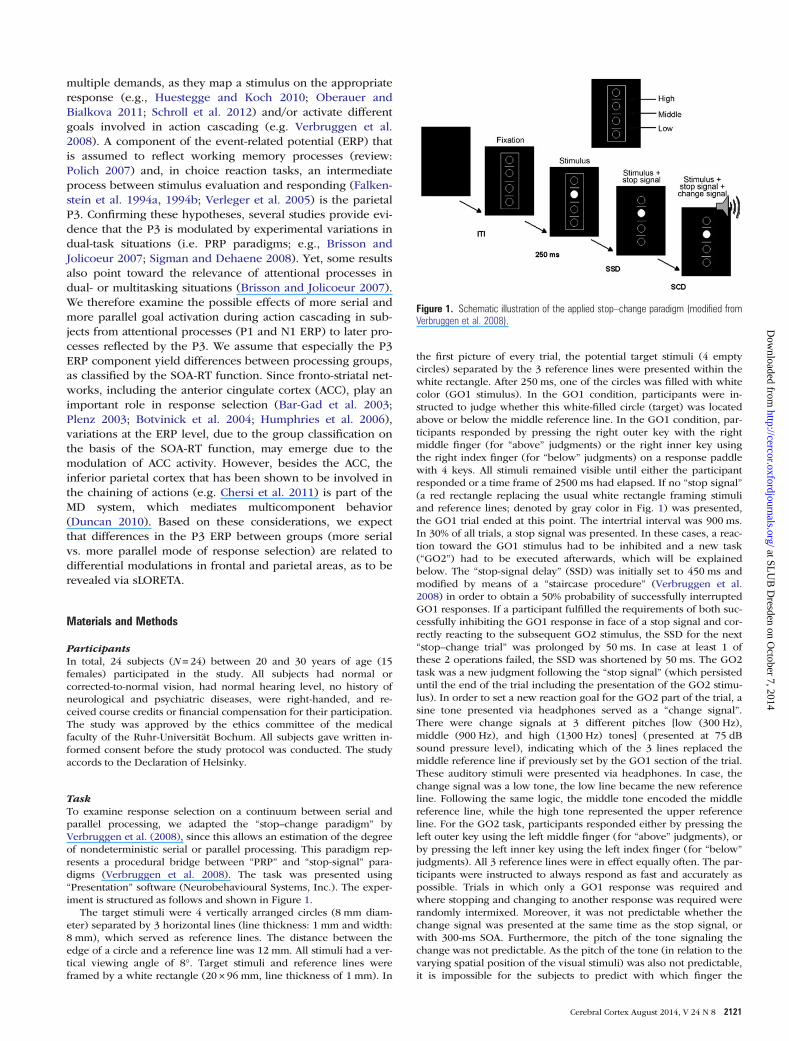
TaskTo examine response selection on a continuum between serial andparallel processing, we adapted the “stop–change paradigm” byVerbruggen et al. (2008), since this allows an estimation of the degreeof nondeterministic serial or parallel processing. This paradigm rep-resents a procedural bridge between “PRP” and “stop-signal” para-digms (Verbruggen et al. 2008). The task was presented using“Presentation” software (Neurobehavioural Systems, Inc.). The exper-iment is structured as follows and shown in Figure 1.
The target stimuli were 4 vertically arranged circles (8 mm diam-eter) separated by 3 horizontal lines (line thickness: 1 mm and width:8 mm), which served as reference lines. The distance between theedge of a circle and a reference line was 12 mm. All stimuli had a ver-tical viewing angle of 8°. Target stimuli and reference lines wereframed by a white rectangle (20 × 96 mm, line thickness of 1 mm). In
the first picture of every trial, the potential target stimuli (4 emptycircles) separated by the 3 reference lines were presented within thewhite rectangle. After 250 ms, one of the circles was filled with whitecolor (GO1 stimulus). In the GO1 condition, participants were in-structed to judge whether this white-filled circle (target) was locatedabove or below the middle reference line. In the GO1 condition, par-ticipants responded by pressing the right outer key with the rightmiddle finger (for “above” judgments) or the right inner key usingthe right index finger (for “below” judgments) on a response paddlewith 4 keys. All stimuli remained visible until either the participantresponded or a time frame of 2500 ms had elapsed. If no “stop signal”(a red rectangle replacing the usual white rectangle framing stimuliand reference lines; denoted by gray color in Fig. 1) was presented,the GO1 trial ended at this point. The intertrial interval was 900 ms.In 30% of all trials, a stop signal was presented. In these cases, a reac-tion toward the GO1 stimulus had to be inhibited and a new task(“GO2”) had to be executed afterwards, which will be explainedbelow. The “stop-signal delay” (SSD) was initially set to 450 ms andmodified by means of a “staircase procedure” (Verbruggen et al.2008) in order to obtain a 50% probability of successfully interruptedGO1 responses. If a participant fulfilled the requirements of both suc-cessfully inhibiting the GO1 response in face of a stop signal and cor-rectly reacting to the subsequent GO2 stimulus, the SSD for the next“stop–change trial” was prolonged by 50 ms. In case at least 1 ofthese 2 operations failed, the SSD was shortened by 50 ms. The GO2task was a new judgment following the “stop signal” (which persisteduntil the end of the trial including the presentation of the GO2 stimu-lus). In order to set a new reaction goal for the GO2 part of the trial, asine tone presented via headphones served as a “change signal”.There were change signals at 3 different pitches [low (300 Hz),middle (900 Hz), and high (1300 Hz) tones] (presented at 75 dBsound pressure level), indicating which of the 3 lines replaced themiddle reference line if previously set by the GO1 section of the trial.These auditory stimuli were presented via headphones. In case, thechange signal was a low tone, the low line became the new referenceline. Following the same logic, the middle tone encoded the middlereference line, while the high tone represented the upper referenceline. For the GO2 task, participants responded either by pressing theleft outer key using the left middle finger (for “above” judgments), orby pressing the left inner key using the left index finger (for “below”
judgments). All 3 reference lines were in effect equally often. The par-ticipants were instructed to always respond as fast and accurately aspossible. Trials in which only a GO1 response was required andwhere stopping and changing to another response was required wererandomly intermixed. Moreover, it was not predictable whether thechange signal was presented at the same time as the stop signal, orwith 300-ms SOA. Furthermore, the pitch of the tone signaling thechange was not predictable. As the pitch of the tone (in relation to thevarying spatial position of the visual stimuli) was also not predictable,it is impossible for the subjects to predict with which finger the
Figure 1. Schematic illustration of the applied stop–change paradigm (modified fromVerbruggen et al. 2008).
Cerebral Cortex August 2014, V 24 N 8 2121
at SLU
B D
resden on October 7, 2014
http://cercor.oxfordjournals.org/D
ownloaded from

alternative response on the change stimuli should be given. All thisprevents that preparatory effects in the motor system bias the results.The experiment consisted of a total of 864 trials that were presentedwithin approximately 25 min.
Modulating the Continuum of Serial and Parallel Processingin Action CascadingIn line with Verbruggen et al. (2008), we introduced different lengthsof “stop–change delays” (SCDs) in order to modulate response selec-tion processes on a serial–parallel continuum in the stop–changeparadigm mentioned above. One SCD had a SOA of 0 ms (i.e., onsetof the stop signal and change signal occurred simultaneously), theother SCD had a SOA of 300 ms (i.e., onset of the change signal oc-curred 300 ms after the onset of the stop signal). Stochastic variationof trial types (GO1, and STOP +GO2 with SCD 0 and 300) results in amixture of trials in which the GO1 response is sometimes not inhib-ited before the change signal is presented, while in other occasionsthe GO1 response is inhibited (Verbruggen et al. 2008). Using thisSOA manipulation, it is possible to calculate the slope of RTs acrossSOAs describes how the RT on the change stimulus varies dependingon the delay between stop and change stimuli. We calculated theslope value using the equation:
slope ¼ GO2RTSOA300 � GO2RTSOA 0
DSOA
In this context, RTs refer to the change signal response (i.e., GO2response). The rationale behind this is as follows (c.f. Verbruggenet al. 2008): The local slope of the SCD function at a given delay (SCD0 and 300) reflects the probability that the first process (STOPprocess) has not finished and overlaps with the following process(GO2; Schwarz and Ischebeck 2001; Verbruggen et al. 2008). If theSTOP process has not finished, it was shown that the slope approxi-mates −1. If it has finished, it was shown that the slope is close to 0(Verbruggen et al. 2008). Obtaining a mean slope value in between 0and −1 hence suggests that the initiation of some (but not all) of theGO2 responses sometimes occurred before the termination of theinhibitory process of stopping the GO1 response. Hence, the steeperthe mean slope, the more likely it is that the stop process had notfinished at the time the GO2 response was initiated. In other words,in case of more serial processing, the slope of the SOA-RT function isflatter (closer to 0) than in the case of a more parallel processingmode (closer to −1). In the SOA-300 condition, all subjects are forcedto serially perform both the stop and change processes, simplybecause the temporal gap between the stop and the change stimuliimposes a cascaded task order. Therefore, RTs should be highlysimilar between more serial and more parallel processing groups inthis condition. However, things lie differently in the SOA-0 condition.Here, the simultaneous presentation of the stop and change signalsyields the possibility of 2 different processing modes: A more serialand a more parallel processing mode. Virtually, all response selection(bottleneck) models allow parallel and serial processing (Miller et al.2009). Because response selection depends on a restricted resource,the processing mode may differentially affect RT in the SOA-0 con-dition. As long as subjects vary in the RTs of the SOA-0 condition, theserial/parallel categorization can be made. Calculating the individualslope for each subject across the experimental trials yielded a valuedenoting the degree to which this subject is inclined toward either amore serial or a more parallel processing mode. In the current study,we used this parameter to split (median split) the cohort into 2 sub-groups, denoting either a more serial or a more parallel processingmode. However, according to Verbruggen et al. (2008), it is not poss-ible to distinguish between nondeterministic serial processes and par-allel processing based on the RT slope value (c.f. Verbruggen et al.2008 for a detailed discussion on this issue). We only use the terms“more serial” or “more parallel” just for the sake of simplicity.
It may be argued that it is problematic to artificially split the conti-nuum from more serial to more parallel processing into 2 groups.Therefore, we also ran a second approach where we do not split thecontinuum into 2 groups, but use the slope value as a continuous re-gressor in correlation analyses.
EEG Recording and AnalysisEEG was recorded from 65 Ag–AgCl electrodes using a QuickAmpamplifier (Brain Products, Inc.) at standard scalp positions against areference electrode located at FCz. The sampling rate was 1000 Hz,which was down-sampled offline to 256 Hz. All electrode impedanceswere kept <5 kΩ. Data processing involved a manual inspection ofthe data to remove technical artifacts. After manual inspection, aband-pass filter ranging from 0.5 to 20 Hz (48 db/oct) was applied.After filtering, the raw data were inspected a second time. To correctfor periodically recurring artifacts (pulse artifacts, horizontal and ver-tical eye movements), an independent component analysis (Infomaxalgorithm) was applied to the unepoched data set. Afterwards, theEEG data were segmented according to the 4 different conditions.Segmentation was applied with respect to the occurrence of the stopsignal (i.e., stimulus-locked). Visual ERPs (due to the stop signal) andauditory ERPs (due to the change signal) were evaluated. Automatedartifact rejection procedures were applied after epoching: Rejectioncriteria included a maximum voltage step of >60 μV/ms, a maximalvalue difference of 150 μV in a 250-ms interval, or activity <0.1 μV.Then, the data were current source density (CSD)-transformed (Perrinet al. 1989) in order to eliminate the reference potential from the data.A second advantage of the CSD transformation is that it serves as aspatial filter (Nunez and Pilgreen 1991), which makes it possible toidentify electrodes that best reflect activity related to cognitive pro-cesses. After CSD transformation, the baseline correction was per-formed. For the baseline correction we choose a time window from−900 till −700 ms and not a baseline prior to the presentation of thestop stimulus, since we wanted to have a “real” prestimulus baselinethat was well before the presentation of the GO1 stimulus. Based onthis stimulus-locking procedure, the P1, N1, and P3 ERPs were quan-tified [For inhibitory control processes, the (Nogo)-N2 occurring witha latency of 200–300 ms after the inhibitory signal (e.g. Falkensteinet al. 1999; van Boxtel et al. 2001) has frequently been analyzed. Inthe current paradigm, a Nogo-N2 like component is evident in theSOA-300 condition (Fig. 4). However, in the SOA-0 condition, thiscomponent is not detectable due to the simultaneously occurringchange processes. As the (Nogo)-N2 is therefore not quantifiable inall conditions, the (Nogo)-N2 is not included in the analysis.], basedon the scalp topography; that is, electrodes used for data quantifi-cation were selected in a data-driven manner. Electrodes were firstchosen on the basis of visual inspection of the scalp topography. Asthe scalp topography showed a bilateral pattern of activation for thedifferent ERP components. Because of this bilateral pattern electrodesat both sides of the scalp were quantified, even though there is noreason to assume lateralizations in the effects. According to this, thevisual P1 and N1 were measured at electrodes PO7 and PO8 (P1: 0–140 ms and N1: 150–250 ms), the auditory N1 at C5 and C6 (0–500ms), and the P3 at Cz and Pz (200–600 ms). To verify the choice ofthese electrodes, the following validation procedure was run: Foreach ERP component, a search interval was defined (noted above), inwhich the component is expected to be maximal. After this, we ex-tracted the mean amplitude within each of these search intervals ateach of the 65 electrode positions. This was done after CSD trans-formation of the data, because the CSD transformation has the effectof a spatial filter that accentuates scalp topography (Nunez andPilgreen 1991), as can also be seen in comparison with ERPs andmaps presenting the data on average reference (refer also Supplemen-tary Material). Subsequently, we compared each electrode against anaverage of all other electrodes using Bonferroni-correction for mul-tiple comparisons (critical threshold, P = 0.0007). Only electrodes thatshowed significantly larger mean amplitudes (i.e., negative for N1potentials and positive for the P1 and P3 potentials) than the remain-ing electrodes were chosen. This procedure revealed the same electro-des as previously chosen on the basis of visual inspection of the scalptopography plots. The ERP components were quantified relative tothe prestimulus baseline. All components were quantified in peak am-plitude and latency on the single-subject level. In case of the P3, thepeak-to-peak amplitude was used, since the negativity before the P3was differently large for the different groups (refer Fig. 4). (Dataanalysis was repeated using the mean amplitude at the above men-tioned and validated electrode positions. The effects obtained wereidentical to the reported data analysis on the peak amplitudes.)
2122 Psychophysiology of Action Cascading • Mückschel et al.
at SLU
B D
resden on October 7, 2014
http://cercor.oxfordjournals.org/D
ownloaded from

Source LocalizationSource localization was carried out on ERPs showing differencesbetween the serial and parallel processing groups. Source localizationwas conducted using sLORETA (Pascual-Marqui 2002). sLORETAgives a single linear solution to the inverse problem based on extra-cranial measurements without a localization bias (Pascual-Marqui2002; Marco-Pallarés et al. 2005; Sekihara et al. 2005). sLORETA hasbeen validated in simultaneous EEG/functional magnetic resonanceimaging studies (Vitacco et al. 2002). For sLORETA, the intracerebralvolume is partitioned in 6239 voxels at 5-mm spatial resolution, andthe standardized current density at each voxel is calculated in a realis-tic head model (Fuchs et al. 2002) using the MNI152 template(Mazziotta et al. 2001). In the present study, the voxel-based sLORETAimages were compared between groups using the sLORETA-built-invoxel-wise randomization tests with 2000 permutations, based on stat-istical nonparametric mapping. Voxels with significant differences(P < 0.05, corrected for multiple comparisons) between groupswere located in the MNI brain, and Brodman areas (BAs) as well ascoordinates in the MNI brain were determined using the sLORETAsoftware (www.unizh.ch/keyinst/NewLORETA/sLORETA/sLORETA.htm).The comparison of sLORETA images between groups was based on theoriginal ERPs in the time domain on the basis of scalp voltages.sLORETA was applied on P3 ERP data, since only the P3 revealed differ-ences between processing groups and a linear correlation between indi-vidual slope values (refer Results section).
StatisticsBehavioral data were analyzed using mixed and univariate analyses ofvariance (ANOVAs). In the mixed ANOVAs, the factor “SOA length”was the within-subject factor with 2 factor levels (i.e., SOA-0 andSOA-300). As the between-subject factor, the groups calculated on thebasis of the median split (i.e., “serial progressing group” and “parallelprocessing group”) were included in the ANOVAs as a 2-level factor.For the neurophysiological data, an additional within-subject factor(“electrode”) with 2 factor levels was introduced where necessary, re-sulting in 2 within-subject factors (SOA length and electrode) and thebetween-subject factor. For the visual P1 and N1, the factor levelswere electrodes PO7 and PO8, for the auditory N1 the factor levelswere electrodes C5 and C6, and for the P3 the factor levels were elec-trodes Cz and Pz. The ERP components were quantified relative tothe prestimulus baseline. When appropriate, the degrees of freedomwere adjusted using Greenhouse-Geisser correction. All post hoc testswere Bonferroni-corrected. Kolmogorov–Smirnov tests revealed thatall relevant variables were normally distributed (all z < 0.5; P > 0.4;1-tailed). As a measure of variability, the standard error of the mean(SEM) is given.
Results
Behavioral DataThe mixed ANOVA revealed a significant main effect of “trial(GO1 trials without stop–change signals and GO2 trials onSCD 0 and 300)” (F1,22 = 95.70; P < 0.001; η² = 0.81). Post hocpair-wise comparisons showed that RTs for all 3 trial con-ditions differed significantly from each other (P < 0.001). Onaverage, subjects showed the shortest RTs in the GO1 trial(486.02 ± 73.00 ms) and the longest RTs for SOA-0(1017.83 ± 270.37 ms). The mean duration of RTs for SOA-300(906.61 ± 246.06 ms) ranged between those of the GO1 andSOA-0 trial. Calculating the slope of the RT-SOA function (c.f.Verbruggen et al. 2008) revealed a mean slope of −0.55(0.07). The more parallel processing group (as defined by amedian split) revealed a slope of −0.93 ± 0.26, while the moreserial processing group revealed a slope of −0.17 ± 0.25.Necessarily, the 2 groups differed from each other(F1,22 = 53.09; P < 0.001; η² = 0.71). Within the serial
processing group, RTs for SOA-0 were (980 ± 57 ms) and dif-fered from RTs in the SOA-300 condition (929 ± 71 ms)(t11 = 2.30; P < 0.05). Within the parallel processing group,RTs for SOA-0 (1163 ± 88 ms) and SOA-300 (883 ± 72 ms) alsodiffered from each other (t11 = 12.53; P < 0.001), with the SOAeffect being stronger than in the serial processing group(P < 0.05). There was no effect of the factor “group” on RTs inGO1 trials (F1,22 = 0.02; P = 0.90; η² = 0.001). The mean stop-signal reaction time (SSRT) was 241.2 ms (16.1). The mediansplitted groups did not differ with respect to their SSRT(P > 0.2). There was also no correlation between the slope ofthe RT-SOA function and SSRT (r = 0.2; R2 = 0.4; P > 0.3). Themean SSD was 203.3 ms (8). To account for a possible speed–accuracy trade-off between the groups, error rates on the GO2stimulus were examined. There was no interaction betweenSOA length and group (P > 0.4). Moreover, there was no maineffect group, or main effect SOA length (all F < 0.5; P > 0.5).This shows that group differences do not reflect aspeed-accuracy trade-off.
Electrophysiological DataStimulus-locked ERPs for SOA-0 and SOA-300 are shown inFigures 2 and 3. The ERP traces and topographies depicted inthese figures represent the group data.
P1Due to the scalp topography of the visual P1 ERPs, electrodesPO7 (left hemisphere) and PO8 (right hemisphere) werechosen for analysis (Fig. 2A), since these electrodes werelocated in the center of the scalp positivities. The mixedANOVA revealed a significant main effect of the factor SOAlength (F1,22 = 31.91; P < 0.001; η² = 0.59), showing that the P1amplitude was larger for SOA-0 (23.82 µV/m2 ± 16.62) thanfor SOA-300 (17.38 µV/m2 ± 14.62). In contrast, only a non-significant trend was found for the factor “electrodes”(F1,22 = 4.00; P = 0.06; η² = 0.15). The main effect of group andall interactions, including the group factor, did not show sig-nificant effects (all Fs < 1.55 and Ps > 0.23), showing thatserial or parallel processing did not affect P1-related pro-cesses. There were also no effects of latency of the P1 peak(all F < 1 and P > 0.2).
Visual N1Similar to the P1, the visual N1 was most pronounced at PO7and PO8 (Fig. 2A). There was a significant main effect of elec-trode (F1,22 = 16.71; P < 0.001; η² = 0.43), indicating that follow-ing stimulus presentation, the amplitude of N1 was significantlymore negative at electrode PO8 (−61.73 µV/m2 ± 32.17) than atPO7 (−44.79 µV/m2 ± 21.27). Even though there was no signifi-cant main effect of group (F1,22 = 0.47; P = 0.50; η² = 0.02)showing that serial and parallel processing did not affectN1-related processes, the mixed ANOVA revealed a significantinteraction between electrodes and group (F1,22 = 5.55;P = 0.03; η² = 0.20). The difference in the N1 amplitudebetween the parallel and serial groups was larger for PO8than for PO7, with PO8 showing a larger amplitude differencein the serial group (−70.09 µV/m2 ± 36.44) than in theparallel group (−53.37 µV/m2 ± 6.13). For PO7, this differencewas smaller, but still the parallel group showed a loweramplitude (−46.19 µV/m2 ± 21.80) than the serial group(−43.39 µV/m2 ± 21.31) (P < 0.01). All other main effects and
Cerebral Cortex August 2014, V 24 N 8 2123
at SLU
B D
resden on October 7, 2014
http://cercor.oxfordjournals.org/D
ownloaded from

interactions failed to reach significance (all Fs < 3.79 andPs > 0.32). For N1 as well, there were no effects of latency(all F < 1 and P > 0.2).
Auditory N1The topography of the auditory N1 was centered around theC5 and C6 electrodes, as shown by the scalp topographies(Fig. 2B). Accordingly, electrodes C5 and C6 were chosen forfurther analysis. There was a significant main effect of SOAlength on the auditory N1 amplitude (F1,22 = 6.07; P = 0.02;η² = 0.22). The amplitude was more negative in the SOA-0(−28.52 µV/m2 ± 13.47) than in the SOA-300 (23.90 µV/m2 ± 12.65) trials. Even though the main effect of electrodesfailed to reach significance (F1,22 = 0.17; P = 0.69; η² = 0.01),the interaction electrodes × SOA was significant (F1,22 = 16.58;P = 0.001; η² = 0.43). This indicates that the different SOA dur-ations had differential influences on the amplitudes on elec-trodes C5 and C6. At SOA-0, the difference in N1 amplitudesbetween electrode C6 (−29.88 µV/m2 ± 13.65) and C5(−27.16 µV/m2 ± 13.29) was smaller than for SOA-300 (whereC5 =−26.13 µV/m2 ± 13.85 and C6 =−21.68 µV/m2 ± 11.45).Post hoc t-tests revealed that this difference between C5 andC6 amplitudes was significant only for the SOA-0 condition(SOA-0: P = 0.05 and SOA-0: P = 0.29).
At electrode C6, the difference between the N1 ampli-tudes for SOA-0 (−29.88 µV/m2 ± 13.65) and SOA-300
(−21.68 µV/m2 ± 11.45) was significantly larger (P = 0.05)than at electrode C5. At electrode C5, the amplitudes in thedifferent SOA conditions (SOA-0 =−27.16 µV/m2 ± 13.29 andSOA-300 =−26.13 µV/m2 ± 13.85) did not differ from eachother (P = 0.29). The main effect of groups and all interactionswas not significant (all Fs < 2.59 and all Ps > 0.12), againshowing that the N1-related processes were not affected byserial and parallel processing modes.
P3The P3 is given in Figure 3A for electrodes Cz and Pz for theSOA-0 and SOA-300 conditions. As can be seen in Figure 3B,the serial and parallel processing groups seem to differ in theamplitude of the P3 in both the SOA-0 and SOA-300 con-ditions. The ERP traces and topographies depicted in thesefigures represent the group data. The statistical analysisreveals the following:
The latency of the P3 for the SOA-0 condition was 261 ms(30) at electrode Cz and 384 ms (35) at electrode Pz(P < 0.001). For the SOA-300 condition, the latency of the P3was 458 ms (31) at electrode Cz and 515 ms (29) at electrodePz (P < 0.001). The amplitude of the P3 at electrode Cz dif-fered significantly between SOA-0 (39.97 µV/m2 ± 19.16) andSOA-300 (29.84 µV/m2 ± 12.05) (F1,22 = 28.04; P < 0.001;η² = 0.56), but there was no effect for electrode Pz(F1,22 = 1.04; P > 0.3). Although the main effect for group did
Figure 2. (A) ERPs locked to the occurrence of the stop signal (time point 0; first vertical dashed line) for the SOA-0 (black) and SOA-300 conditions (red). Electrodes PO7 andPO8 are shown. A clear visual P1 and visual N1 complex is seen at both electrodes, with the topographic maps revealing a clear P1 and N1 scalp topography. The scalptopographies depict the topography of the ERP at its peak. The second vertical dashed line denotes the time point of the auditory change stimulus in the SOA-300 condition. (B)ERPs locked to the occurrence of the stop signal (time point 0; first vertical dashed line) for the SOA-0 (black) and SOA-300 conditions (red). Electrodes C5 and C6 are shown. Aclear auditory N1 complex is seen at both electrodes, with the topographic maps revealing N1-related negativities around electrodes C5 and C6. The scalp topographies depictthe topography of the ERP at its peak.
2124 Psychophysiology of Action Cascading • Mückschel et al.
at SLU
B D
resden on October 7, 2014
http://cercor.oxfordjournals.org/D
ownloaded from

not reach significance (F1,22 = 3.57; P = 0.07; η² = 0.14), themixed ANOVA revealed a significant interaction for SOAlength × group (F1,22 = 6.63; P = 0.02; η² = 0.23) for electrodeCz, but not for Pz (F1,22 = 1.14; P > 0.29). For electrode Cz, theP3 amplitudes in the SOA-0 condition seem to differ morebetween the serial (31.98 µV/m2 ± 15.38) and parallel groups(47.97 µV/m2 ± 19.79) than they did for SOA-300 (whereserial = 26.77 µV/m2 ± 13.29 and parallel = 32.92 µV/m2 ± 10.32;refer Fig. 3B). This is supported by post hoc tests: A post hoct-test revealed that the SOA-0 difference reached significance(t22 = 4.21; P = 0.01), while the P3 amplitudes in the SOA-300condition did not differ between groups (P > 0.3). Yet, as can beseen in Figure 3B and for the SOA-300 condition, the potentialsof the serial and parallel processing groups already seem todiffer within a time frame of 200–400 ms after the stop signal(P3-like component). After quantification of the mean ampli-tude of this P3-like component for each subject within this timeframe from 200 till 400 ms after the stop signal in the SOA-300condition, the statistical analyses show that this difference wasnot statistically reliable (P > 0.5). The differences in P3 ampli-tudes between the groups were followed up in sLORETA ana-lyses. The results are given in Figure 4.
Comparing the serial and parallel processing groups for theSOA-0 condition (i.e., contrasting the serial and parallelgroups for the peak of the P3 in the SOA-0 condition) byusing the built-in independent samples test revealed signifi-cant activation differences in the ACC (BA32) (refer Fig. 4A).The parallel processing group showed more activation of ACC
areas (BA32) than the serial processing group. The ERP time-domain analysis revealed no differences between the serialand parallel processing groups in the SOA-300 condition. Inaddition, the sLORETA analysis using permutation tests toprevent false-positive activations was not able to find differ-ences between the groups in particular brain areas. In thisway, the pattern of the sLORETA analysis reflects the inter-action in the P3 between “processing group” and “SOA con-dition” in the time-domain analysis on the ERPs. However,the difference in P3 amplitude between the SOA-0 andSOA-300 conditions was substantial as stated above. There-fore, sLORETA was calculated on this amplitude differenceusing the built-in dependent samples test. The results showthat differences between the SOA-0 and SOA-300 conditionsin the parallel processing group are due to activation differ-ences in the temporo-parietal junction (TPJ) (BA40) (referFig. 5B), with this area being more activated in the SOA-0than in the SOA-300 condition. Activation differences in theTPJ were also confirmed by an additional analysis in whichwe compared the SOA-0 and SOA-300 conditions across thewhole cohort (refer Fig. 4C).
Correlation AnalysesAs stated in the Materials and methods section, it may be pro-blematic to split the continuum into 2 artificial serial and par-allel processing groups. We therefore run a second approach,where we do not split the continuum into 2 subgroups, but
Figure 3. (A) ERPs locked to the occurrence of the stop signal (time point 0, first vertical dashed line) for the SOA-0 (black) and SOA-300 conditions (red). Electrodes Cz and Pzare shown. A clear P3 complex is seen at both electrode sites, with the topographic maps revealing P3-related positivities around electrode Cz. The scalp topographies depictthe topography of the ERP at its peak. The second vertical dashed line denotes the time point of the auditory change stimulus in the SOA-300 condition. (B) ERPs at electrodeCz for the SOA-0 and SOA-300 conditions, separated for the more serial and more parallel processing subgroups.
Cerebral Cortex August 2014, V 24 N 8 2125
at SLU
B D
resden on October 7, 2014
http://cercor.oxfordjournals.org/D
ownloaded from

Figure 5. Scatterplots denoting the correlation between the slope of the SOA-RT2 function and the slope of the SOA-P3b peak latency (A) and amplitude (B) function in thewhole cohort.
Figure 4. Results of the sLORETA analysis. (A) Contrast comparing the more serial and more parallel processing groups in the SOA-0 condition. (B) Contrast comparing theSOA-0 and SOA-300 conditions within the more parallel processing group. (C) Contrast comparing the SOA-0 and SOA-300 condition in the whole cohort. All pictures showgroup data. The sources depict the time point of the peak of the P3 within the interval 200–600 ms after stop-signal presentation. The color bar denotes the critical t-values(corrected for multiples comparisons using SnPM).
2126 Psychophysiology of Action Cascading • Mückschel et al.
at SLU
B D
resden on October 7, 2014
http://cercor.oxfordjournals.org/D
ownloaded from

use the slope value as a continuous variable in correlation ana-lyses. Due to the significant results for the P3 component, weused the latency of the amplitudes to calculate a slope value aspreviously done for the behavioral data. The results of the cor-relational analyses underline the pattern observed in theANOVAs. The slope of the P3 peak latencies across SCD con-ditions at electrode Pz was significantly correlated with theslope of RTs across SCD conditions (r = 0.62, R2 = 0.38;P = 0.001), as is shown by Figure 5A. The slope of the P3 peakamplitudes across SCD conditions at electrode Cz was also cor-related with the slope of RTs across SCD conditions (r = 0.42,R2 = 0.16; P = 0.01) (refer Fig. 5B). For the other ERP par-ameters (visual N1 and P1, auditory N1), there was no signifi-cant correlation (r < 0.2; P > 0.5), again underlining thespecificity of the P3 results. The P3 amplitude at electrode Czin the SOA-0 condition was highly positively correlated withthe P3 amplitude in the SOA-300 condition. This positive corre-lation indicating that a higher P3 in the SCD 0 condition isrelated to a higher P3 amplitude in the SCD 300 condition wasevident in the whole cohort (r = 0.873; R2 = 0.75; P < 0.001), aswell as in the parallel (r = 0.943; R2 = 0.88; P < 0.001) and serialprocessing subcohorts (r = 0.859; R2 = 0.72; P < 0.001).
An analysis using the SSRT and the amplitude and latencyof the P3 in the SOA-0 and SOA-300 conditions did not showany reliable correlations between these parameters (all r < 0.2;P > 0.6), suggesting that the relation found is specific to thechange processes and not to the stop process.
However, as can be seen in Figure 5, there is one outlier inthe distribution, which may also distort the median split pro-cedure applied above. Yet, when repeating the above-mentioned ANOVAs using the median splitted groups, theeffects observed for the P3 ERP component across the moreserial and more parallel processing groups remained the same.It therefore seems rather safe to say that the results obtainedare unbiased with respect to this outlier. For the other ERPcomponents (i.e., auditory and visual N1/P1), the effects werealso unchanged. Overall, the correlation analysis showed sys-tematic relations between the behavioral parameters and theP3, but not the other neurophysiological parameters. Theresults of the correlation analyses therefore underline theresults pattern obtained in the ANOVAs, without artificiallysplitting a continuum into dichotomic groups.
Discussion
In the current study, we examined EEG mechanisms under-lying a more serial, or a more parallel, mode of goal activationin action cascading using a stop–change paradigm, whichallows a quantification of the degree of serial and parallel pro-cessing (Verbruggen et al. 2008). The stop–change paradigmis a hybrid of a classical stop paradigm and a PRP paradigm(Verbruggen et al. 2008). The behavioral data obtained arewell in line with previous findings by Verbruggen et al.(2008) that revealed a mean slope of −0.61 in RTs (−0.55(0.07) were obtained in our study). Overall, the behavioraldata show that subjects act either on a nondeterministic serialresponse selection mode or a limited-capacity parallelresponse selection mode where most of the available re-sources are used for the stopping process (Verbruggen et al.2008). A slope value of 0 would imply that the “stop” processhad finished before the GO2 response was initiated. Obtain-ing a mean slope value of −0.55 thus suggests that the
initiation of some (but not all) of the GO2 responses some-times occurred before the termination of the inhibitoryprocess of stopping the GO1 response. The data are unbiasedwith respect to a speed-accuracy trade-off.
The EEG data revealed differences in the P1, the auditoryN1, and P3 ERP components between the 2 SOA con-ditions. All ERP components were stronger in the SOA-0than in the SOA-300 condition. This finding is likely toreflect an overall intensification of cognitive effort. Yet, it isalso possible that this reflects a multisensory enhancementeffect. Although topographies between the ERP com-ponents are different, phase resetting (Shah et al. 2004;Lakatos et al. 2007; Kayser et al. 2008) may influence earlysensory processing between modalities and could explainthe main effect of “SOA.” The auditory N1 was modulatedby the length of the SOA at electrode C6, which is well inline with studies on multisensory integration also showinga SOA dependency of ERPs (e.g. Giard and Peronnet 1999;Foxe et al. 2000; Fort et al. 2002; Molholm et al. 2002,2004; Murray et al. 2005). However, at this level of multi-sensory integration, there was no difference between themore serial and more parallel processing groups, whichshows that, at least for the level of attentional processing,multisensory integration does not affect action cascadingprocesses. Yet, it cannot be ruled out that multisensoryintegration mechanisms play a role for later stages onresponse selection (i.e., the P3). The results on the P3 atelectrode Cz show that amplitudes differed significantlybetween the SOA-0 and SOA-300 conditions in the parallelgroup, there was only a trend in the serial group. In theparallel group, the amplitude of the P3 was lower in theSOA-300 than in the SOA-0 condition. In line with thisinterpretation, several studies using the PRP task haveshown that experimental variations modulate especially thelatency of the P3 component, which may reflect processingat a strategic central bottleneck (e.g. Brisson and Jolicoeur2007; Sigman and Dehaene 2008). Matching the suggestionthat the P3 reflects processes of a “strategic bottleneck” (e.g. Meyer and Kieras 1997), we found a substantial positivecorrelation between the slope of the RT on the GO2 stimu-lus and the slope of the P3 peak latency differences at elec-trode Pz. This suggests that the degree of nondeterministicparallel processing is directly reflected by EEG parameters,namely the latency of the P3. The slope of the SOA-RTfunction reflects the degree to which task goals are acti-vated in a serial or in a more parallel fashion (Verbruggenet al. 2008). Therefore, the P3 latency effects reflect a directEEG correlate of the degree of overlap in goal activationprocesses described above. The sLORETA analyses revealedthat the difference in amplitudes in the critical SOA-0 con-dition between groups was due to a higher activation of theACC (BA32) extending in the posterior cingulate cortex inthe more parallel processing group. Within the parallel pro-cessing group, the sLORETA results further suggest thatbrain areas in the inferior parietal lobe (TPJ, BA40) extend-ing in the posterior sulcus and supramarginal gyrus weremore activated in the SOA-0 than in the SOA-300 condition.This picture was also evident, when examining differencesbetween the conditions across the whole cohort. The TPJhas previously been reported to be related to modulationsin the P3 component (e.g. Verleger et al. 1994). From abroader perspective, the TPJ has frequently been suggested
Cerebral Cortex August 2014, V 24 N 8 2127
at SLU
B D
resden on October 7, 2014
http://cercor.oxfordjournals.org/D
ownloaded from

to play in role in the chaining of actions during responseselection (e.g., Astafiev et al. 2006; Karch et al. 2010; Chersiet al. 2011). Especially, BA40 has been shown to play acritical role in dual-task performance, as it sustains execu-tive control (Collette et al. 2005). Our sLORETA resultssuggest that the TPJ is especially important in situations inwhich stopping and change processes are triggered at once(i.e., SOA-0 condition) and hence in a situation where thechaining of actions is particular demanding. However, sincethe task used different stimuli to signal stop and changeprocesses, it is possible that the involvement in the TPJ atleast partly reflect multisensory integration processesrelated to the stop and change signal processing, since theTPJ has been shown to be involved in multisensory proces-sing (Matsuhashi et al. 2004; Ionta et al. 2011). It willdeserve further experiments to examine whether and howaction cascading processes differ when to be cascadedactions are signaled within a single modality.
However, the concomitant ACC activation in the parallelprocessing group fits into the concept of a MD system(Duncan 2010). The MD system extends over a specific set ofregions in the frontal and parietal cortex, encompassingdorsal anterior cingulate areas as well as areas in and aroundthe intraparietal sulcus (Duncan and Owen 2000; Duncan2010). The MD system is suggested to play an important rolein complex multicomponent behavior (Duncan 2010). The taskused for this study meets these requirements as subjects had tochain different actions. It is possible that, in subjects tendingtoward more parallel processing, the increased ACC activity inthe SOA-0 condition reflects increased demands on action se-lection processes that have frequently been suggested tomediate by this area (e.g. Botvinick et al. 2004). Other resultssuggest that areas in the medial prefrontal cortex may be in-volved in the selection of tactics (Matsuzaka et al. 2012). It istherefore conceivable that the increased ACC activation in moreparallel operating subjects may trigger the increased activationof the TPJ in order to chain the actions necessary to performthe tasks in parallel. This interpretation is in line with findings,suggesting that P3-related processes reflect a link betweenstimulus processing and the response (Verleger 1988; Falken-stein et al. 1994a, 1994b; Verleger et al. 2005; Polich 2007). Inthis context, the P3 has been related to the “decision” pro-cesses between stimulus evaluation and responding (Falken-stein et al. 1994a, 1994b; Verleger et al. 2005), which is relatedto the allocation of processing resources (Polich 2007). Yet,this interpretation does not foreclose that multisensory inte-gration processes contribute to mechanisms reflected in differ-ential TPJ activation in the groups.
The above discussion focuses on the role of the ACC andparietal cortex in the MD system. Yet, these areas are also in-volved in interference detection, response inhibition, and ex-ecutive control. As we found no correlation between the P3ERP parameters and SSRT as an indicator of inhibitory controlin this paradigm, it is likely that the modulation observed at aneurophysiological level are more related to the cascading ofactions in the sense of the MD-system conception and lessrelated to the process of inhibitory control.
Summing-up our findings, it can be said that, out of all in-vestigated ERP components, the P3 was the only componentallowing for a clear dissociation of the parallel and seriallyprocessing groups. In contrast to this, the earlierattention-associated components (visual P1 and N1, auditory
N1) did not display such marked differences between the 2groups. This pattern of results is also corroborated by theregression analyses. The results pattern suggests that pro-cesses, which led to the serial/parallel differentiation ofresponse selection, are unlikely to be in effect at earlier stagesof attentional modality-specific stimulus processing. Rather,the differentiation seems to evolve during the later stage ofmultimodal stimulus analysis and –evaluation and integrationand is mediated by structures constituting the MD system (i.e.,ACC and TPJ) (Duncan 2010). The results suggest that interin-dividual differences in the processing mode used to copewith situations in which action cascading is necessary aremediated via a distributed fronto-parietal network modulatingresponse control, but not attentional processes.
Supplementary MaterialSupplementary material can be found at: http://www.cercor.oxfordjournals.org/.
Funding
This work was supported by a grant from the DeutscheForschungsgemeinschaft BE 4045/10-1 to C.B.
NotesWe thank all volunteers for their participation. We thankM. Falkenstein and the unknown reviewers for their helpful criticismson the manuscript. Conflict of Interest: None declared.
ReferencesAstafiev SV, Shulman GL, Corbetta M. 2006. Visuospatial reorienting
signals in the human temporo-parietal junction are independent ofresponse selection. Eur J Neurosci. 23:591–596.
Bar-Gad I, Morris G, Bergman H. 2003. Information processing, di-mensionality reduction and reinforcement learning in the basalganglia. Prog Neurobiol. 71:439–473.
Beste C, Dziobek I, Hielscher H, Willemssen R, Falkenstein M. 2009.Effects of stimulus-response compatibility on inhibitory processesin Parkinson’s disease. Eur J Neurosci. 29:855–860.
Beste C, Ness V, Lukas C, Hoffmann R, Stüwe S, Falkenstein M, Saft C.2012. Mechanisms mediating parallel action monitoring infronto-striatal circuits. Neuroimage. 62:137–146.
Botvinick MM, Cohen JD, Carter CS. 2004. Conflict monitoring andanterior cingulate cortex: an update. Trends Cogn Sci. 8:539–546.
Brisson B, Jolicoeur P. 2007. Cross-modal multitasking processingdeficits prior to the central bottleneck revealed by event-relatedpotentials. Neuropsychologia. 45:3038–3053.
Cameron IG, Watanabe M, Pari G, Munoz DP. 2010. Executive impair-ment in Parkinson’s disease: response automaticity and taskswitching. Neuropsychologia. 48:1948–1957.
Chersi F, Ferrari PF, Fogassi L. 2011. Neuronal chains for actions inthe parietal lobe: a computational model. PLoS One. 6:e27652.
Collette F, Olivier L, Van der Linden M, Laureys S, Delfiore G, LuxenA, Salmon E. 2005. Involvement of both prefrontal and inferiorparietal cortex in dual-task performance. Brain Res Cogn BrainRes. 24:237–251.
Duncan J. 2010. The multiple-demand (MD) system of the primatebrain: mental programs for intelligent behaviour. Trends Cogn Sci.14:172–179.
Duncan J, Owen AM. 2000. Common regions of the human frontallobe recruited by diverse cognitive demands. Trends Neurosci.23:475–483.
Falkenstein M, Hohnsbein J, Hoormann J. 1994a. Effects of choicecomplexity on different subcomponents of the late positive
2128 Psychophysiology of Action Cascading • Mückschel et al.
at SLU
B D
resden on October 7, 2014
http://cercor.oxfordjournals.org/D
ownloaded from

complex of the event-related potential. Electroencephalogr ClinNeurophysiol. 92:148–160.
Falkenstein M, Hohnsbein J, Hoormann J. 1994b. Time pressure effecton late components of the event-related potential (ERP). J Psycho-physiol. 8:22–30.
Falkenstein M, Hoormann J, Hohnsbein J. 1999. ERP components inGo/Nogo tasks and their relation to inhibition. Acta Psychol(Amst). 101:267–291.
Fort A, Delpuech C, Pernier J, Giard MH. 2002. Early auditory-visualinteractions in human cortex during nonredundant target identifi-cation. Brain Res Cogn Brain Res. 14:20–30.
Foxe JJ, Morocz IA, Murray MM, Higgins BA, Javitt DC, Schroeder CE.2000. Multisensory auditory-somatosensory interactions in earlycortical processing revealed by high-density electrical mapping.Brain Res Cogn Brain Res. 10:77–83.
Fuchs M, Kastner J, Wagner M, Hawes S, Ebersole JS. 2002. A standar-dized boundary element method volume conductor model. ClinNeurophysiol. 113:702–712.
Giard MH, Peronnet F. 1999. Auditory-visual integration during multi-modal object recognition in humans: a behavioral and electro-physiological study. J Cogn Neurosci. 11:473–490.
Huestegge L, Koch I. 2010. Crossmodal action selection: evidencefrom dual-task compatibility. Mem Cognit. 38:493–501.
Humphries MD, Stewart RD, Gurney KN. 2006. A physiological plaus-ible model of action selection and oscillatory activity in the basalganglia. J Neurosci. 26:12921–12942.
Ionta S, Heydrich L, Lenggenhager B, Mouthon M, Fornari E, ChapuisD, Gassert R, Blanke O. 2011. Multisensory mechanism intemporo-parietal cortex support self-location and first-person per-spective. Neuron. 70:363–374.
Karch S, Feuerecker R, Leicht G, Meindl T, Hantschk I, Kirsch V, ErtlM, Lutz J, Pogarell O, Mulert C. 2010. Separating distinct aspectsof the voluntary selection between response alternatives: N2- andP3-related BOLD responses. Neuroimage. 51:356–364.
Kayser C, Petkov CI, Logothetis NK. 2008. Visual modulation ofneurons in auditory cortex. Cereb Cortex. 18:1560–1574.
Lakatos P, Chen C-M, O’Connell MN, Mills A, Schroeder CE. 2007.Neuronal oscillations and multisensory interaction in primaryauditory cortex. Neuron. 53:279–292.
Marco-Pallarés J, Grau C, Ruffini G. 2005. Combined ICA-LORETAanalysis of mismatch negativity. Neuroimage. 25:471–477.
Matsuhashi M, Ikeda A, Ohara S, Matsumoto R, Yamamoto J, TakayamaM, Satow T, Begum T, Usui K, Nagamine T et al. 2004. Multisensoryconvergence at human temporo-parietal junction—epicortical re-cording of evoked responses. Clin Neurophysiol. 115:1145–1160.
Matsuzaka Y, Akiyama T, Tanji J, Mushiake H. 2012. Neuronal activity inthe primate dorsomedial prefrontal cortex contributes to strategic se-lection of response tactics. Proc Natl Acad Sci USA. 109:4633–4638.
Mazziotta J, Toga A, Evans A, Fox P, Lancaster J, Zilles K, Woods R,Paus T, Simpson G, Pike B et al. 2001. A probabilistic atlas andreference system for the human brain: International Consortiumfor Brain Mapping (ICBM). Philos Trans R Soc Lond B Biol Sci.356:1293–1322.
Meyer DE, Kieras DE. 1997. A computational theory of executive cog-nitive processes and multiple-task performance: Part 1. Basicmechanisms. Psychol Rev. 104:3–65.
Miller J, Ulrich R, Rolke B. 2009. On the optimality of serial and paral-lel processing in the psychological refractory period paradigm:effects of the distribution of stimulus onset asynchronies. CognPsychol. 58:273–310.
Molholm S, Ritter W, Javitt DC, Foxe JJ. 2004. Multisensoryvisual-auditory object recognition in humans: a high-density elec-trical mapping study. Cereb Cortex. 14:452–465.
Molholm S, Ritter W, Murray MM, Javitt DC, Schroeder CE, Foxe JJ.2002. Multisensory auditory-visual interactions during earlysensory processing in humans: a high-density electrical mappingstudy. Brain Res Cogn Brain Res. 14:115–128.
Murray MM, Molholm S, Michel CM, Heslenfeld DJ, Ritter W, JavittDC, Schroeder CE, Foxe JJ. 2005. Grabbing your ear: rapidauditory-somatosensory multisensory interactions in low-levelsensory cortices are not constrained by stimulus alignment. CerebCortex. 15:963–974.
Nunez PL, Pilgreen KL. 1991. The spline-Laplacian in clinical neuro-physiology: a method to improve EEG spatial resolution. J ClinNeurophysiol. 8:397–413.
Oberauer K, Bialkova S. 2011. Serial and parallel processes inworking memory after practice. J Exp Psychol Hum PerceptPerform. 37:606–614.
Oberauer K, Kliegl R. 2004. Simultaneous cognitive operations inworking memory after dual-task practice. J Exp Psychol HumPercep Perform. 30:689–707.
Pascual-Marqui RD. 2002. Standardized low-resolution brain electro-magnetic tomography (sLORETA): technical details. Methods FindExp Clin Pharmacol. 24:5–12.
Pashler H. 1994. Dual-task interference in simple tasks: data andtheory. Psychol Bull. 116:220–244.
Perrin F, Pernier J, Bertrand O, Echallier JF. 1989. Spherical splinesfor scalp potential and current density mapping. Eletroencepha-logr Clin Neurophysiol. 72:184–187.
Plenz D. 2003. When inhibition goes incognito: feedback interactionbetween spiny projection neurons in striatal function. TrendsNeurosci. 26:436–443.
Polich J. 2007. Updating P300: an integrative theory of P3a and P3b.Clin Neurophysiol. 118:2128–2148.
Ravizza SM, Goudreau J, Delgado MR, Ruiz S. 2012. Executive func-tion in Parkinson’s disease: contributions of the dorsal frontostria-tal pathways to action and motivation. Cogn Affect BehavNeurosci. 12:193–206.
Redgrave P, Prescott TJ, Gurney K. 1999. The basal ganglia: a ver-tebrate solution to the selection problem? Neuroscience. 89:1009–1023.
Salvucci DD, Taatgen NA. 2008. Threaded cognition: an integratedtheory of concurrent multitasking. Psychol Rev. 115:101–130.
Schroll H, Vitay J, Hamker FH. 2012. Working memory and responseselection: a computational account of interactions amongcortico-basalganglio-thalamic loops. Neural Netw. 26:59–74.
Schwarz W, Ischebeck A. 2001. On the interpretation of responsetime vs onset asynchrony functions: application to dual-task andprecue-utilization paradigms. J Math Psychol. 45:452–479.
Sekihara K, Sahani M, Nagarajan SS. 2005. Localization bias andspatial resolution of adaptive and non-adaptive spatial filters forMEG source reconstruction. Neuroimage. 25:1056–1067.
Shah AS, Bressler SL, Knuth KH, Ding M, Mehta AD, Ulbert I, Schroe-der CE. 2004. Neural dynamics and the fundamental mechanismsof event-related potentials. Cereb Cortex. 14:476–483.
Sigman M, Dehaene S. 2008. Brain mechanisms of serial and parallelprocessing during dual-task performance. J Neurosci. 28:7585–7598.
Sommer W, Leuthold H, Schubert T. 2001. Multiple bottlenecks ininformation processing? An electrophyiso-logical examination.Psychon Bull Rev. 8:81–88.
van Boxtel GJ, van der Molen MW, Jennings JR, Brunia CH. 2001.A psychophysiological analysis of inhibitory control in the stop-change paradigm. Biol Psychol. 58:229–262.
Verbruggen F, Schneider DW, Logan GD. 2008. How to stop andchange a response: the role of goal activation in multitasking.J Exp Psychol Hum Percept Perform. 34:1212–1228.
Verleger R. 1988. The true P3 is hard to see: some comments onKok’s (1986) paper on degraded stimuli. Biol Psychol. 27:45–50.
Verleger R, Heide W, Butt C, Kömpf D. 1994. Reduction of P3b inpatients with temporo-parietal lesions. Brain Res Cogn Brain Res.2:103–116.
Verleger R, Jaskowski P, Wascher E. 2005. Evidence for an integrativerole of P3b in linking reaction to perception. J Psychophysiol.19:165–181.
Vitacco D, Brandeis D, Pascual-Marqui R, Martin E. 2002. Correspon-dence of event related potential tomography and functional mag-netic resonance imaging during language processing. Hum BrainMapp. 17:4–12.
Willemssen R, Falkenstein M, Schwarz M, Müller T, Beste C. 2011.Effects of aging, Parkinson’s disease, and dopaminergic medicationon response selection and control. Neurobiol Aging. 32:327–335.
Wiu C, Liu Y. 2008. Queing network modeling of the psychologicalrefractory period (PRP). Psychol Rev. 115:913–954.
Cerebral Cortex August 2014, V 24 N 8 2129
at SLU
B D
resden on October 7, 2014
http://cercor.oxfordjournals.org/D
ownloaded from